Embed Size (px)
Citation preview


3
All India Coordinated Research Project on Agrometeorology
All India Coordinated Research Project on Agrometeorology
ICAR-Central Research Institute for Dryland AgricultureSaidabad, Hyderabad – 500 059
Annual Report - 2014-15

4
All India Coordinated Research Project on Agrometeorology
Citation: Rao VUM., Bapuji Rao B., Sarath Chandran M.A., Vijaya Kumar P and Subba Rao AVM. (2015). All India Coordinated Research Project on Agrometeorology, Annual Report (2014-15). Central Research Institute for Dryland Agriculture, Hyderabad. p
Coordinating Cell
ScientificDr. V. U. M. Rao, Project Coordinator (Agrometeorology) Dr. P. Vijaya Kumar, Principal Scientist (Agrometeorology) Dr. B. Bapuji Rao, Principal Scientist (Agrometeorology) Shri A. V. M. Subba Rao, Senior Scientist (Agrometeorology) Shri Sarath Chandran M. A, Scientist (Agrometeorology)
Technical Shri I. R. Khandgonda, Senior Technical Officer (Agrometeorology)
Secretarial D. Harini
Supporting Shri A. Mallesh Yadav, SSS
Prepared & Edited by V. U. M. Rao., B. Bapuji Rao., M. A. Sarath Chandran., P. Vijaya Kumar., A. V. M. Subba Rao
Printed at:Balaji Scan Pvt.Ltd., 11-4-659, Bhavya’s Faroqui Splendid Towers, 1st Floor, 202, Opp. Krishna Children Hospital, Beside Singareni Bhavan, Lakadikapul, Hyderabad-500004. Tel: 23303424/25, 9848032644

5
All India Coordinated Research Project on Agrometeorology
Contents
PrefaceAcknowledgement
1. Introduction : 1
2. Weather during 2014-15 : 5
3. Agroclimatic Characterization : 11
4. Crop-Weather Relationships : 24
5. Crop Growth Modelling : 60
6. Effect of Weather on Pests and Diseases : 73
7. Research Accomplishment of Coordinating Unit : 798. Summary : 90
9. Research Publications : 94
10. Staff Position at Cooperating Centres : 115
11. Budget Details : 116

6
All India Coordinated Research Project on Agrometeorology

7
All India Coordinated Research Project on Agrometeorology
Cooperating Centres1. Dr. Anil Karunakar, Akola (since 01.02.2008)
2. Dr. S. N. Malleswari, Anantapur (since 19.11.2014)
3. Dr. H. R. Patel, Anand (01.04.2007 to 30.06.2015), Dr. Manoj M. Lunagaria (since 01.07.2015)
4. Dr. H. S. Shivaramu, Bangalore (since 29.11.2014)
5. Dr. S. Pasupalak, Bhubaneswar (since 01.11.1995)
6. Dr. H. Venkatesh, Bijapur (since 27.07.1996)
7. Dr. V. G. Chavan, Dapoli (10.07.2014 to 06.07.2015), Dr. D. N. Jagtap (since 07.07.2015)
8. Dr. Anil Kumar Singh, Faizabad (since 18.11.2015)
9. Dr. Diwan Singh, Hisar (since 02.01.1984)
10. Dr. Manish Bhan, Jabalpur (since 28.04.2011)
11. Dr. Bondita Goswami, Jorhat (since 26.08.2013)
12. Dr. A. P. Dubey, Kanpur (since 01.07.2007)
13. Dr. A. Solaimalai, Kovilpatti (since 01.04.2010)
14. Dr. Prabhjyot K. Sidhu, Ludhiana (since 01.08.2004)
15. Dr. Saon Banerjee, Mohanpur (14.09.2007 to 09.07.2015), Dr. Asis Mukherjee (since 10.07.2015)
16. Dr. Rajendra Prasad, Palampur (since 23.03.1998)
17. Dr. Aasaman Khobragade, Parbhani (since 24.08.2014)
18. Dr. J. L. Chaudhary, Raipur (since 03.07.2013)
19. Dr. Meenakshi Gupta, Chatha (since 17.03.2015)
20. Dr. Ramesh Kumar, Ranchi (01.01.2007 to 09.07.2015), Dr. Pragyan Kumari (since 10.07.2015)
21. Dr. R. G. Upadhyay, Ranichauri (since 2012)
22. Dr. I. B. Pandey, Samastipur (21.09.2012 to 11.08.2015) Dr. Abdu Sattar (since 12.08.2015)
23. Dr. J. D. Jadhav, Solapur (since 19.01.2010)
24. Dr. B. Ajith Kumar Pillai, Thrissur (since 02.04.2013)
25. Dr. N. S. Solanki, Udaipur (since 01.08.2000)

8
All India Coordinated Research Project on Agrometeorology

9
All India Coordinated Research Project on Agrometeorology
PrefaceWeather continues to play a dominant role in agricultural production despite many technological advances made. This is particularly clear this year as unseasonal, erratic and often flash floods has lashed many parts of the country. SW monsoon season of 2015 witnessed mid-season droughts on some parts of the country, while parts of West Bengal, Rajasthan and Gujarat faced flood. Agrometeorological research and extension services assumes great significance in this era of climate change and ever-increasing extreme weather events.
In this background, the All India Coordinated Research Project on Agrometeorology (AICRPAM) is playing a significant role in identifying regions vulnerable to climate change, development of adaptation strategies and dissemination of micro-level agromet advisories. Along with this, AICRPAM is doing a commendable job in the manning of 100 Automatic Weather Stations in KVKs spread across the country to develop and disseminate the agromet advisories at block level. It is also undertaking research on impacts of temperature and change in rainfall patterns on crops through modeling, designing contingency crop plans for different rainfall situations, development of weather insurance products and decision support systems for crop management and forewarning of pests and diseases through its network centers located in different agroclimatic zones of the country.
The efforts of the cooperating centres of AICRPAM in pursuing the assigned research programs are commendable. Associated information to develop user friendly products and integrated approaches to assess meteorological hazards and extreme event impacts on agriculture and evaluation of potential risks that are useful for insurance organizations are highly desirable. There is a need for strong linkages between AICRPDA, AICRPAM and NICRA to improve the production and minimize the climate risks in dryland agriculture for sustainable production. The Annual Progress Report of 2014-15 contain results of research carried out during kharif 2014 and rabi 2014-15 across 25 centers in the country. I take this opportunity to congratulate the efforts made by the Agrometeorologists of all the centers and the Project Coordinator, Dr. VUM Rao and his staff at the Coordinating Unit in compilation of this valuable report. I believe that the results presented in the report will be useful for several ministries for policy implementation for minimizing the effect of weather aberrations.
(Ch. Srinivasa Rao) Director

10
All India Coordinated Research Project on Agrometeorology

11
All India Coordinated Research Project on Agrometeorology
AcknowledgementI wish to express my sincere gratitude to Indian Council of Agricultural Research for its continuous and generous help and support during the period under study. The encouragement and guidance from Hon’ble Director General and Secretary, DARE, Dr. S. Ayyappan; Deputy Director General (NRM), Dr. A.K. Sikka is gratefully acknowledged. The help and guidance received from Dr. Ch. Srinivasa Rao, Director, CRIDA in the effective functioning of the project and in preparation of this annual report is acknowledged with sincere thanks.
The untiring efforts made by the Agrometeorologists of all 25 cooperating centres in conducting the experiments as per technical program and in bringing out meaningful results made it possible to compile a comprehensive report. Help rendered by my colleagues Drs. M.A. Sarath Chandran, B. Bapuji Rao, P. Vijaya Kumar and A.V.M. Subba Rao in compiling the results of the reports is highly appreciated. My sincere appreciation to Shri IR Khandgonda in preparing necessary diagrams of the manuscript. The continuous support received from Shri A. Mallesh Yadav and Ms. Harini is acknowledged.
(V.U.M. Rao) Project Coordinator (Ag. Met.)

12
All India Coordinated Research Project on Agrometeorology

1
All India Coordinated Research Project on Agrometeorology
The All India Coordinated Research Project on Agrometeorology (AICRPAM) was initiated by Indian Council of Agricultural Research (ICAR) in May 1983 with the establishment of Coordinating Cell at the Central Research Institute for Dryland Agriculture, Hyderabad and 12 Cooperating Centres at various State Agricultural Universities. After a detailed review and evaluation of the progress made by the project and realizing the importance of agrometeorological research support for enhancing food production, ICAR had extended the Cooperating Centres to the remaining 13 Agricultural Universities of the country w.e.f. April 1995. The network of 25 Agrometeorological Cooperating Centres are Akola, Anantapur, Anand, Bangalore, Bhubaneswar, Bijapur, Dapoli, Faizabad, Hisar, Jabalpur, Jorhat, Kanpur, Kovilpatti, Ludhiana, Mohanpur, Palampur, Parbhani, Raipur, Rakh Dhiansar (Chatha/Jammu), Ranchi, Ranichauri, Samastipur, Solapur, Thrissur and Udaipur. The Quinquennial Review Team has reviewed the research progress of the project in 1992, 1998-99, 2006 and recently in 2011.
1.1 Objectives To study the agricultural climate in relation to crop planning and assessment of
crop production potentials in different agroclimatic regions
To establish crop-weather relationships for all the major rainfed and irrigated crops in different agroclimatic regions
To evaluate the different techniques of modification of crop micro-climate for improving the water use efficiency and productivity of the crops
To study the influence of weather on the incidence and spread of pests and diseases of field crops
1.2 Technical Program for 2014-16The Technical Program for the years 2014-16 for different centres of the project and a common core program decided for all the centres with emphasis on location-specific research needs are given below.
1) Agroclimatic Characterization (All centres)Development of database (Block, Tehsil or Mandal level) on climate and crop statistics (district level)
Agroclimatic Analysis
Rainfall probability analysis
Dry and wet spells
Effective rainfall, water balance studies (FAO-CROPWAT) and harvestable rainwater for every week
1. Introduction

2
All India Coordinated Research Project on Agrometeorology
Characterization of onset of monsoon for crop planning Climatic and agricultural drought analysis Length of growing season and its variability Preparation of crop-weather calendars Consolidation of agroclimatic analysis in the form of Technical Reports and
Agroclimatic Atlases Preparation of crop-wise manuals for weather-based decisions in crop
management Documentation of extreme weather events and their impacts on agriculture,
including on livestock, poultry and fish (During the reporting year)2) Crop-Weather Relationships (All Centres)
Centre Kharif Crop(s) Rabi Crop(s)Akola Soybean ChickpeaAnand Groundnut WheatAnantapur Groundnut Chickpea (Nandyal)Bangalore Pigeoan pea MangoBijapur Pigeoan pea SoybeanBhubaneswar Rice ----Chatha/Jammu Maize Wheat Dapoli Rice MangoFaizabad Rice Chickpea, MustardHisar Cluster bean/Horticulture Mustard, WheatJabalpur Soybean ChickpeaJorhat Rice PotatoKanpur Rice WheatKovilpatti -- Greengram, MaizeLudhiana Rice WheatMohanpur Rice PotatoPalampur Tea Wheat Parbhani Cotton, Soybean ----Raipur Rice WheatRanchi Rice WheatRanichauri Finger millet WheatSamastipur Rice Wheat, Winter MaizeSolapur Pearlmillet SorghumThrissur Coconut, Rice Pepper
Udaipur Maize Wheat

3
All India Coordinated Research Project on Agrometeorology
3) Crop Growth ModellingCrop Lead Centres Associated Centre
Wheat Ludhiana Palampur, Anand, Jabalpur, Chatha/Jammu, Samastipur, Ranchi, Hisar, Kanpur, Ranichauri
Rice CRIDA Mohanpur, Samastipur, Dapoli, Faizabad, Thrissur, Bhubaneswar, Jorhat, Ranchi, Kanpur, Jabalpur, Raipur
Groundnut Anand Anantapur, Bangalore
4) Weather Effects on Pests and DiseasesCentre Crop(s) Pests/diseases
Anand Mustard AphidsAnantapur Groundnut Leaf minerAkola Soybean Spodoptera/SemilooperBangalore Groundnut
RedgramLate leaf spotHeliothis
Bijapur GrapesPomegranate
Powdery mildew, Downy mildew Anthracnose, Bacterial Leaf Blight
Bhubaneswar Rice Sheath Blight, BlastChatha/Jammu Wheat Yellow rustFaizabad Chickpea Pod borerJabalpur Chickpea HeliothisKovilpatti Cotton
BlackgramAphids, Leaf hopperPowdery mildew
Ludhiana Cotton Sucking pestsMohanpur Mustard
PotatoAphids Late blight
Palampur Mustard Wheat
AphidsYellow rust
Parbhani Cotton Mealy bug, sucking pestsRanchi Rice BLB, Brown spotRanichauri Apple
AmaranthusApple scabLeaf webber
Solapur Sunflower Leaf eating caterpillar (Heliothis)Raipur Rice
ChickpeaStemborer, Leaf blast/Brown spotHeliothis
Kanpur RiceWheat
Blight, Stem borerBlight
Thrissur Rice Stemborer, Leaf roller

4
All India Coordinated Research Project on Agrometeorology
Centre Crop(s) Pests/diseasesUdaipur Mustard Aphids
Hisar MustardWheat
AphidYellow rust
5) Agromet Advisory Services (All Centres)Monitoring of crop and weather situation, twice in a week and its updation on
the website
Development of contingency plans for aberrant weather situation
Monitoring of extreme weather events and their impacts on farming systems on near real-time basis
Value-addition to agromet information
Economic impact assessment
____________

5
All India Coordinated Research Project on Agrometeorology2. Weather Conditions During The Year 2014
A brief account on rainfall with its onset, withdrawal and distribution during monsoon and post monsoon seasons of the year 2014 for the country as a whole as well as at 25 centres of AICRPAM is presented hereunder:
Onset of Southwest Monsoon (June–September):The southwest (SW) monsoon set over Kerala on 6thJune, 5 days later than its normal date of 1st June. Same day, monsoon also advanced into most parts of south Arabian Sea, some parts of Tamil Nadu, most parts of southwest Bay of Bengal and some parts of west central Bay of Bengal. Thereafter, though not rapid, it consistently advanced and by 18th June, it covered central Arabian Sea, some parts of north Arabian Sea, south Gujarat, entire Konkan & Goa, some parts of south peninsula, Odisha, Jharkhand and Bihar, entire northeastern states and most parts of Gangetic West Bengal. The Arabian Sea branch of the monsoon current was aided by the formation of a Cyclonic Storm (Nanauk) over the Arabian Sea. The eastward propagation of Madden Julian Oscillation (MJO) over maritime continent led to the development of convection over north Bay of Bengal and the subsequent formation of season’s first low pressure area over coastal areas of Bangladesh and neighbour hood on 19th June. This aided the advance of Bay of Bengal branch of the SW monsoon over northeastern states. Subsequently it further advanced into most parts of south peninsula, east and adjoining parts of central India by 20th June.
During the last week of June, the weakening of monsoon activity caused the re-appearance of the heat wave conditions over eastern parts of peninsular India. After a hiatus of 10 days, monsoon started reviving. Subsequently, a favorable interaction of the SW monsoon current with the mid-latitude westerlies aided the advance of SW monsoon into the western Himalayan region and adjoining plains of northwest India. It advanced into entire Uttarakhand, Himachal Pradesh and Jammu & Kashmir, some more parts of Uttar Pradesh and some parts of Haryana (including Chandigarh) and Punjab on 1st July.
During the first week of July, the presence of anticyclone over the peninsular region resulted in subdued rainfall activity over parts of north, central and peninsular region. But the formation of a low pressure area over north Bay of Bengal and adjoining coastal areas of Bangladesh and Gangetic West Bengal (during 1st–7th July) and a cyclonic circulation over West Uttar Pradesh and neighbourhood (during 3rd - 6th July) caused further advance of the monsoon into some more parts of Uttar Pradesh, remaining parts of Haryana (including Delhi) and Punjab and some parts of north Rajasthan on 3rd July and subsequently into most parts of Vidarbha, remaining parts of East Madhya Pradesh and Uttar Pradesh, some parts of West Madhya Pradesh and some more parts of northeast Rajasthan on 7th July. Subsequent to the formation and west northwestward movement of a low pressure area (during 11th- 16th July), an off shore

6
All India Coordinated Research Project on Agrometeorology
trough at mean sea level extending from Gujarat coast to Kerala coast (10th-16th July) and the cyclonic circulation extending between 3.1 & 5.8 kms above sea level (ASL) over northeast Arabian Sea during (14th-16th July) the second week, the monsoon activity revived gradually over central India and west coast thereby causing further advance of SW monsoon over remaining parts of central India and most parts of northwest India on 16th and remaining parts of north Arabian Sea, Saurashtra & Kutch, Gujarat Region and West Rajasthan and thus the entire country on 17th July, 2014.
Rainfall Distribution During Monsoon SeasonThe seasonal (June to September) rainfall received over 36 met sub-divisions for broad geographical regions during the 2014 SW monsoon season are given in the table 2.1 along with respective long period average (LPA) values and deviations from normal.
Table 2.1: IMD Sub-divisional rainfall during monsoon season (June–September)–2014
S. No. Centre Actual Normal Excess or deficit (mm)
Deviation (%)
1 Andaman & Nicobar Islands 1618.6 1682.5 -64 -42 Arunachal Pradesh 1747.6 1768.0 -20 -13 Assam & Meghalaya 1635.1 1792.8 -158 -94 Naga., Mani., Mizo. & Tripura 1118.8 1496.9 -378 -255 Sub-Himalayan W. B & Sikkim 1864.5 2006.2 -142 -76 Gangetic West Bengal 1001.1 1167.9 -167 -147 Orissa 1256.9 1149.9 107 98 Jharkhand 930.1 1091.9 -162 -159 Bihar 849.3 1027.6 -178 -1710 East Uttar Pradesh 518.1 897.6 -380 -4211 West Uttar Pradesh 340.3 769.4 -429 -5612 Uttarakhand 897.6 1229.1 -332 -2713 Haryana, Chandigarh & Delhi 203.2 466.3 -263 -5614 Punjab 243.9 491.9 -248 -5015 Himachal Pradesh 521.8 825.3 -304 -3716 Jammu & Kashmir 651.1 534.6 117 2217 West Rajasthan 262.8 263.2 0 018 East Rajasthan 618.6 615.8 3 019 West Madhya Pradesh 771.5 876.1 -105 -1220 East Madhya Pradesh 746.6 1051.2 -305 -2921 Gujarat Region 777.0 901 -124 -1422 Saurashtra, Kutch & Diu 454.7 473.5 -19 -4

7
All India Coordinated Research Project on Agrometeorology
23 Konkan & Goa 2752.8 2914.3 -162 -624 Madhya Maharashtra 675.0 729.3 -54 -725 Marathwada 398.8 682.9 -284 -4226 Vidarbha 817.6 954.6 -137 -1427 Chhattisgarh 1104.3 1147.3 -43 -428 Coastal Andhra Pradesh 448.7 581.1 -132 -2329 Telangana 498.5 755.2 -257 -3430 Rayalaseema 308.6 398.3 -90 -2331 Tamil Nadu & Pondicherry 315.2 317.2 -2 -132 Coastal Karnataka 3122.7 3083.8 39 133 North Interior Karnataka 483.3 506 -23 -434 South Interior Karnataka 795.2 660 135 2035 Kerala 2163.0 2039.6 123 636 Lakshadweep 955.3 998.5 -43 -4
The seasonal rainfall from 1st June to 30th September 2014 was normal in 23 sub-divisions (67% of the total area of the country) and deficient in 12 sub-divisions (30% of the total area of the country). Only one subdivision (South Interior Karnataka) constituting 3% of the total area of the country received excess rainfall. Out of the 12 deficient sub-divisions, six sub-divisions were from north India, two from central India, one from northeast India and three from south Peninsula.
On a monthly basis, the distribution of rainfall, in June, except for five sub-divisions (Sub-Himalayan West Bengal, Assam & Meghalaya, Rayalaseema, Tamil Nadu and Andaman & Nicobar Islands), which received normal rainfall, all the other sub-divisions (31 out of 36) received deficient (20 sub-divisions) or scanty (11 sub-divisions) rainfall. In July, majority of the sub-divisions from central India and west peninsula received excess (Three sub-divisions) or normal rainfall (17 sub-divisions). The excess rainfall sub-divisions are Konkan & Goa, South Interior Karnataka and Odisha. Out of the 16 remaining sub-divisions, 15 sub-divisions received deficient rainfall, majority of which are from northwest and northeast India, region close to Himalayas and interior & southeast Peninsula. However, one subdivision (Lakshadweep) received scanty rainfall.
In August, majority of the sub-divisions from Peninsula, east and northeast India received normal/excess rainfall. On the other hand, majority of the sub-divisions from northwest India and neighboring central India received deficient/scanty rainfall. During August, eight sub-divisions received excess rainfall, 13 sub-divisions received normal rainfall, 12 sub-divisions received deficient and 3 sub-divisions received scanty rainfall. The excess sub-divisions were Lakshadweep, Kerala, Tamil Nadu and Pondicherry, South Interior and North Interior Karnataka, Coastal Karnataka, Madhya

8
All India Coordinated Research Project on Agrometeorology
Maharashtra, and Arunachal Pradesh. The three scantly rainfall sub-divisions were neighboring sub-divisions from north India (Punjab, Haryana, Chandigarh & Delhi and West Uttar Pradesh).
In September, the rainfall activity over many parts of the country showed significant increase and nine sub-divisions from northwest, west coast, northeast and east central India received excess rainfall. On the other hand, 13 sub-divisions mainly from north India along the plains of Himalayan region and north peninsula received deficient rainfall. The remaining 14 sub-divisions received normal rainfall.
From the monthly distribution, it can be seen that all the sub-divisions have received deficient/scantly monthly rainfall during at least one of the four months. Similarly, in every month, at least 13 out of the 36 sub-divisions have received deficient/scantly rainfall with highest number of sub-divisions (31) received deficient/scanty rainfall during June. Four sub-divisions (i.e. Himachal Pradesh, West Uttar Pradesh, East Uttar Pradesh and Telangana) were deficient/scantly during all the four months of the season.
Withdrawal of Southwest MonsoonThe weather over the western parts of Rajasthan remained mainly dry from 17th Sept. A change in the lower tropospheric circulation pattern over the region from cyclonic to anti cyclonic during 16th - 17th Sept. also made conditions favorable for the withdrawal of SW monsoon from the region. Subsequently, withdrawal of monsoon from northwestern parts of the country commenced on 23rd Sept. It withdrew from some parts of West Rajasthan and Kutch on 23rd Sept. and from some parts of Punjab, Haryana and Gujarat region, some more parts of Kutch area and remaining parts of West Rajasthan on 26th. On 28th Sept, it further withdrew from remaining parts of Punjab, Haryana, Chandigarh & Delhi and East Rajasthan; some parts of Jammu & Kashmir, Himachal Pradesh, East Uttar Pradesh, Madhya Pradesh and Saurashtra; most parts of West Uttar Pradesh and some more parts of Gujarat Region, Kutch and north Arabian Sea. As on 30th September, the withdrawal line passed through Jammu, Una, Bareilly, Kanpur, Nowgong, Ujjain, Vadodara, Porbandar, Lat. 22 °N/ Long. 65 °E and Lat. 22 °N / Long. 60 °E.
Incessant rainfall associated with the monsoon low pressure systems and active monsoon conditions in the presence of strong cross equatorial flow, often caused flood situations over various areas during different parts of the season. During the first half of the season, incessant heavy rains and floods over Odisha, Chhattisgarh, Madhya Pradesh, Uttar Pradesh and Assam & Meghalaya were observed in associated with the formation and the movement of monsoon low pressure systems over north Bay of Bengal. During the second half, the floods and associated huge casualty and damage occurred over Jammu & Kashmir during 1st week of Sept., which resulted from the interaction between a monsoon low and a trough in the westerlies. Uttar Pradesh and

9
All India Coordinated Research Project on Agrometeorology
Bihar experienced flood like situation due to heavy rainfall in the catchment areas of Nepal and release of water in Barrages. The formation of low pressure systems caused flooding in Odisha and Rajasthan whereas, the eastern end of monsoon trough passing through northeastern states and trough in mid-latitude westerlies led to extremely heavy rains and thus floods in Assam & Meghalaya and Arunachal Pradesh during the second half of season. Apart from these, some other sub-divisions/states which experienced flood situations are Jharkhand, Gujarat, Konkan & Goa, Andhra Pradesh, Karnataka and Kerala.
Post-Monsoon (October-December) 2014In the sub division wise Post-Monsoon (October–December) season rainfall, it is noticed that rainfall was excess in two sub-divisions, viz. East Uttar Pradesh and East Madhya Pradesh, normal rainfall in 10 sub-divisions, viz. Uttarakhand, Chhattisgarh, Konkan & Goa, North Interior Karnataka, South Interior Karnataka, Coastal Karnataka, Kerala, Tamil Nadu & Pondicherry, Lakshadweep and Andaman & Nicobar Islands and 13 sub-divisions viz., Jammu & Kashmir, Himachal Pradesh, Haryana, Chandigarh & Delhi, Punjab, West Uttar Pradesh, West Madhya Pradesh, Bihar, Jharkhand, Odisha, Madhya Maharashtra, Rayalaseema, Telangana and Coastal Andhra Pradesh received deficit rainfall and scanty/no rain in 11 sub-divisions.
During the year, two out of 25 centers of the AICRPAM, viz., Bijapur and Udaipur received excess rainfall and remaining 17 centers received normal rainfall and remaining 6 centers received either deficit or scanty rainfall (Table 2.2).

10
All India Coordinated Research Project on Agrometeorology
Table 2.2: Annual rainfall received at AICRPAM centers during 2014
S.No. Center Actual Normal Departure (%)
1 Akola 661.3 813.0 -192 Anand 998.4 853.0 173 Anantapur 375.2 432.0 -134 Bangalore 994.5 917.0 85 Bhubaneswar 1521.4 1548.0 -26 Bijapur 736.8 594.0 247 Chatha/Jammu 1152.7 1124.0 38 Dapoli 3370.2 3529.0 -49 Faizabad 638.0 1001.0 -3610 Hisar 427.3 456.0 -611 Jabalpur 1040.8 1395.0 -2512 Jorhat 1676.9 2148.0 -2213 Kanpur 662.9 8834.0 -9214 Kovilpatti 666.8 723.0 -815 Ludhiana 610.4 733.0 -1716 Mohanpur 1436.6 1607.0 -1117 Palampur 1902.2 2320.0 -1818 Parbhani 569.7 963.0 -4119 Raipur 1253.2 1399.0 -1020 Ranchi 854.7 1270.0 -3321 Ranichauri 1367.8 1270.0 822 Samastipur 1166.3 1235.0 -623 Solapur 609.1 721.0 -1624 Thrissur 2631.1 2782.0 -525 Udaipur 738.8 601.0 23

11
All India Coordinated Research Project on Agrometeorology3. Agroclimatic Characterization
Agroclimatological analysis is used to study climatic characteristics and crop performance of a particular region and also to know the climatic variability/climate change and its impact on agriculture. Agroclimatic information is necessary in enhancing crop productivity through better agricultural planning including land use planning, water resources availability, crop suitability, pests and disease management and also in weather based agro advisories. In order to achieve maximum and sustainable crop production from available farm resources, it is essential to have proper knowledge of the agroclimatic resources of the location/region. Therefore, a thorough understanding of the climatic conditions would help in determining the suitable agricultural management practices for taking advantage of the favourable weather conditions and avoiding or minimizing risks due to adverse weather conditions. Thus, historic data on climatic variables have to be analyzed using appropriate statistical tools enabling the development of location specific technologies/adaptive strategies. The analysis carried out by different centers on the agroclimatic characterization is reported hereunder:
AkolaLong term changes in rainfall pattern and its distribution was analysed by estimating seasonality index (SI). SI measures the spread and steadiness of the rainfall during the wet season. Theoretically, the SI can vary from zero (if all the months have equal rainfall) to 1.83 (if the entire rainfall occurs in one month). District-wise monthly rainfall data from 1901-2013 of 11 districts of Vidarbha region was used for the study. Table 3.1 shows the different class limits of SI and representative rainfall regimes and the results of the trend analysis of rainfall is given in table 3.2
Table 3.1: Seasonality Index classes and the associated rainfall regimes
Rainfall regime Seasonality Index (SI)Very equable ≤ 0.19Equable but with a definite wetter season 0.20 -0.39Rather seasonal with a short drier season 0.40 – 0.59Seasonal 0.60 – 0.79Markedly seasonal with a long drier season 0.80 – 0.99Most rain in 3 months or less 1.00 -1.19Extreme, almost all rain in 1- 2 months ≥ 1.20

12
All India Coordinated Research Project on Agrometeorology
Tabl
e 3.
2: T
rend
s in
dis
trib
utio
n of
rain
fall
for d
iffer
ent d
istr
icts
of V
idar
bha
Dis
tric
tJa
nFe
bM
arA
prM
ayJu
nJl
yA
ugSe
pO
ctN
ovD
ecA
nnW
inPr
e-M
onM
onPo
st-
Mon
Ako
la-0
.04
-0.0
8*0.
05-0
.04*
-0.0
10.
10-0
.11
0.75
***
-0.1
00.
26**
-0.0
5-0
.08*
0.67
-0.1
1*0.
140.
640.
14
Am
rava
ti-0
.06
-0.1
10.
04-0
.03*
-0.0
6*-0
.10
-0.1
70.
81**
-0.2
70.
09-0
.07
-0.0
4*0.
02-0
.17*
*-0
.06*
0.28
-0.0
3
Buld
hana
-0.0
9**
-0.0
8**
0.03
-0.0
7***
-0.0
8**
-0.1
9-0
.14
0.66
***
-0.3
10.
17-0
.08
-0.0
9**
-0.2
7-0
.17*
**-0
.12*
**0.
050.
00
Was
him
-0.0
2-0
.09*
*0.
02-0
.05*
-0.0
90.
180.
030.
53-0
.23
0.24
-0.0
9-0
.05
0.39
-0.1
1**
-0.1
1*0.
510.
11
Yava
tmal
0.01
-0.1
4***
-0.0
2-0
.11*
**-0
.05
0.04
-0.1
80.
53*
-0.5
1*0.
24*
-0.0
4-0
.03
-0.2
5-0
.13*
**-0
.17*
*-0
.12
0.17
War
dha
0.04
-0.1
1*-0
.03
-0.0
4-0
.04
-0.3
0-0
.38
0.44
*-0
.43
0.11
-0.0
2-0
.01
-0.7
1-0
.07
-0.0
5-0
.67
0.08
Nag
pur
0.06
-0.1
3-0
.01
-0.0
7-0
.06
-0.2
80.
000.
10-0
.35
0.05
0.01
-0.0
1*-0
.70
-0.0
7-0
.14
-0.5
30.
04
Bhan
dara
0.06
-0.1
6-0
.03
-0.0
90.
01-0
.32
-0.7
5*-0
.56
-0.3
40.
040.
030.
00-2
.05*
**-0
.10
-0.1
0-1
.98*
**0.
07
Cha
ndr.
0.04
-0.1
6-0
.03
-0.0
60.
00-0
.03
-0.5
30.
50*
-0.4
40.
16-0
.04
0.01
*-0
.59
-0.1
3-0
.09
-0.5
00.
12
Gon
dia
0.06
-0.1
50.
02-0
.03
-0.0
2-0
.10
0.02
0.00
-0.0
6-0
.07
-0.0
5-0
.01
-0.4
0-0
.09
-0.0
3-0
.15
-0.1
3
Gad
chi-
roli
0.04
-0.1
4-0
.02
-0.0
5-0
.03
0.37
-0.1
10.
92**
-0.3
20.
14-0
.05
0.00
0.76
-0.1
0-0
.09
0.87
0.09
(*Si
g(0.
1), *
*Sig
(0.0
5), *
**Si
g(0.
01)
+ In
crea
sing
tren
d, -D
ecre
asin
g tr
end)

13
All India Coordinated Research Project on Agrometeorology
Significant decreasing trends in monthly rainfall were observed during February (Yavatmal, Washim, Buldhana districts) and April (Yavatmal and Buldhana districts). On the other hand, significant increasing trend was observed during August (Akola, Amaravati and Buldhana districts). On seasonal basis, Yavatmal, Washim, Buldhana and Amaravati districts showed significant decreasing trend during winter and pre-monsoon seasons. During monsoon season, only Bhandara district showed significant decreasing trend.
SI was computed for four different time periods, viz., 1901-1930, 1931-1960, 1961-1990 and 1991-2013 and the results are given in table 3.3.
Table 3.3: Change in the SI values in 113 years and during the period 1 9 0 1 - 3 0 , 1931-60, 1961-90 and 1991-2013
District SI trend(1901-2013)
Seasonality Index value 1901-2013
1901-1930
1931-1960
1961-1990
1991-2013
Change (1901-1930 to 1991-2013)
Akola 1.305 1.057 1.060 1.039 1.071 1.061 0.002Amravati 2.010** 1.076 1.053 1.055 1.109 1.092 0.039Buldhana 2.650*** 1.044 1.028 1.027 1.061 1.069 0.041Washim 1.737* 1.068 1.050 1.060 1.098 1.061 0.011Yavatmal 0.759 1.064 1.056 1.066 1.061 1.077 0.020Wardha -0.211 1.068 1.064 1.082 1.049 1.077 0.013Nagpur 0.372 1.074 1.078 1.062 1.062 1.102 0.024Bhandara -0.891 1.119 1.124 1.117 1.118 1.118 -0.005Chandrapur -0.201 1.106 1.097 1.113 1.103 1.110 0.013Gondia 0.429 1.133 1.115 1.128 1.142 1.151 0.037Gadchiroli 0.270 1.125 1.110 1.133 1.121 1.138 0.027Mean -- 1.085 1.076 1.080 1.090 1.096 0.020
(*Sig(0.1), **Sig(0.05), ***Sig(0.01) + Increasing trend, -Decreasing trend)
Across the Vidarbha districts, the SI value ranged between 1.044 to 1.133 (avg. 1.085) during 1901-2013, 1.028 to 1.115 (avg.1.076) during 1901-1930, 1.027 to 1.133 (avg.1.080) during 1931-1960, 1.049 to 1.142 (avg.1.090) during 1961-1990 and 1.061 to 1.151 (avg.1.096) during 1991-2013 period, indicating most of the rain occurred in three months period or less. Observed shift towards greater SI values from 1.076 (1901-30) to 1.080 (1931-60) to 1.090 (1961-1990) to 1.096 (1991-2013) indicates shifting of rainfall distribution to lesser seasonal period. The change in SI value between 1901-1930 period and latest by 1991-2013 period indicated positive shift of SI in most of the districts except Bhandara district. However, Mann Kendall test statistic showed significant increasing trend of SI value (1901-2013) only in Amravati, Buldhana and Washim districts. By and large, increasing trend of SI values needs consideration in agriculture and water sectors for better planning in the region.

14
All India Coordinated Research Project on Agrometeorology
AnandTrend analysis was undertaken (Mann Kendall test) for identifying significant changes in maximum temperature (Tmax), minimum temperature (Tmin) and rainfall on annual, monsoon, post - monsoon, summer and winter season for four locations, viz., Anand & Vadodara (representing middle Gujarat), Rajkot & Junagadh (representing Saurashtra). The results are given in table 3.4.
Table 3.4 : Trend analysis of weather parameters
Station Season Parameters 1961-1990 1991-2013
Slope Significance Slope Significance
Anand Annual Tmax 0.034 * 0.007 NS
Tmin 0.035 ** 0.039 **
Post monsoon Tmax 0.050 * 0.013 NS
Summer Tmax 0.013 NS 0.050 *
Tmin 0.021 NS 0.056 **
Vadodara Annual Tmin 0.038 ** 0.056 NS
Monsoon Tmin 0.026 ** 0.127 *
Summer Tmin 0.028 NS 0.107 *
Winter Tmin 0.049 * 0.038 NS
Rajkot Annual Rainfall -2.286 NS 31.800 **
Monsoon Tmin 0.033 ** 0.014 NS
Rainfall -2.993 NS 35.142 **
Junagadh Annual Tmin 0.025 * 0.065 NS
Monsoon Tmin 0.019 * 0.018 NS
Post monsoon Tmin 0.024 NS 0.092 *
Summer Tmin 0.025 NS 0.066 **
Winter Tmin 0.009 NS 0.114 **
Rainfall 0.000 NS 0.000 *
(*Significant at 95% level, **Significant at 99% level)
Significant positive trend in maximum temperature on annual basis and during post- monsoon season (1961-90) was observed at Anand. During summer, both Tmax and Tmin showed significant positive trend during 1991-2013. At Vadodara, Tmin showed significant positive trend on annual basis as well as monsoon and winter seasons during 1960-90, whereas similar trend was noticed in Tmin during 1991-2013 during monsoon season and winter. Annual and monsoon rainfall showed significant positive trends at

15
All India Coordinated Research Project on Agrometeorology
Rajkot during 1991-2013, whereas Tmin showed similar trend during 1961-90 period in monsoon season. At Junagadh, Tmin showed significant positive trend on annual basis and monsoon months during 1961-90. Similar trend was observed in Tmin during post-monsoon, summer and winter season and in winter rainfall during 1991-2013.
BangaloreUsing 43 years weekly rainfall data (1972-2014), the probability of week being wet [P (W)] or dry [P (D)] was worked out. A week that gets rainfall of 10 mm or more is considered as wet week. Using the initial probabilities, the conditional probabilities of wet week followed by wet week P(W/W), wet week followed by dry week P(W/D), dry week followed by wet week P(D/W) and dry week followed by dry week P(D/D) are worked out.
Fig. 3.1: Initial and conditional probabilities for wet/dry weeks at UAS, Bangalore.Probability of wet week followed by wet week (more than 0.5) during 18th to 24th week of the pre monsoon season indicates that there exists higher chances of getting adequate amount of moisture to the crop growth during this period in most of the years. This indicates that a short duration crop can be grown. As 28th to 45th week has continuous higher probability of wet week followed by wet week, indicating that main crop of the year can be grown so that there exists adequate supply of moisture to the crop growth during this period in most of the years. Therefore, this period is identified as the crop growing period, i.e., the crop sown during 28th to 31st week would not suffer from any moisture stress. The drop in conditional probability of P (W/W) below 70 per cent during 32nd, 35th to 37th week would provide congenial conditions to take up inter-cultivation and other operations. The crop sown during 29-31st week, may reach the maximum growth or grand growth period during 38th to 44th week, and during this stage crop requires highest amount of water, which is available during the period (Fig. 3.1).
KovilpattiLength of growing period (LGP) and rainy days were calculated for high rainfall zone of Tamil Nadu and the results are presented in table 3.5.

16
All India Coordinated Research Project on Agrometeorology
Table 3.5: LGP and rainy days analysis for high rainfall zone of Tamil Nadu
S. No. Place
Rainfall (mm) Annual rainy days
Growing period (weeks)Annual Winter Summer SWM NEM
1. Anaikidangu 1367.5 36.42 260.27 498.91 571.97 64.31 342. Balamore 1710.7 42.51 266.66 822.72 578.88 104.62 323. Boothapondi 1088.4 36.8 219.81 380.45 451.37 62.72 354. Chitrar 2012.7 146.71 475.04 847.58 543.38 95.07 365. Eraniel 1189.6 37.2 271.2 419.4 461.8 61.2 336. Kalikesam 1768.8 53.19 336.48 799.11 580.05 86.28 357. Kaliyal 1330.2 37.2 250.0 546.2 496.8 68.5 338. Kallar 1949.0 53.26 344.81 834.01 716.93 97.67 359. Kannikmar 1242.1 36.27 250.91 415.54 539.39 71.88 3310. Keeripari 1810.8 56.39 325.71 787.18 641.52 94.62 3411. Kulachal 921.1 13.1 181.5 354.4 372.1 52.3 2912. Kulasekaram 1031.1 33.73 208.17 394.53 394.65 69.38 3213. Kutriar 1808.2 44.94 294.94 846.35 622.01 89.7 3414. Kuzhithurai 1149.5 14.9 249.0 473.6 412 66.3 3315. Manalodai 1760.9 54.55 360.53 730.56 615.32 86.86 3416. Marudham-
parai2987.1 82.7 591.3 1280.6 1032.6 98.1 35
17. Mecode 1419.9 36.85 298.24 557.67 527.16 73.03 3418. Mukkadal 1146.3 31.61 249.63 414.84 450.22 70.34 3419. Mulagu-
mode1410.3 36.8 288.0 559.5 525.9 67.8 33
20. Mylar 2529.4 61.84 482.94 1121.06 863.59 101.69 3621. Nagerkovil 1050.5 25.44 237.7 324.82 462.42 59.79 3422. Parliyar 1825.5 54.77 353.13 751.71 665.98 89.59 3523. Puthandam 1427.0 40.0 320.6 539.48 526.95 77.55 3424 Sivalogam 1560.0 44.5 326.5 614.6 574.4 82.2 3525 Surulodu 1641.4 38.36 359.74 627.66 615.67 85.93 3426 Thirparappu 1522.2 40.2 333.6 600.6 547.8 61.0 3527 Thucklay 1303 41.7 277.0 460.5 523.9 68.4 34
Average 1554.2 45.6 311.6 629.8 567.2 78.0 33.9
The average annual rainfall of the zone is 1554 mm, which is received in 78 rainy days. The mean LGP of this region is 34 weeks. Lower annual rainfall of 921 mm was recorded at Kulachal whereas, higher annual rainfall of 2987 mm was received at Marudhamparai
17
All India Coordinated Research Project on Agrometeorology
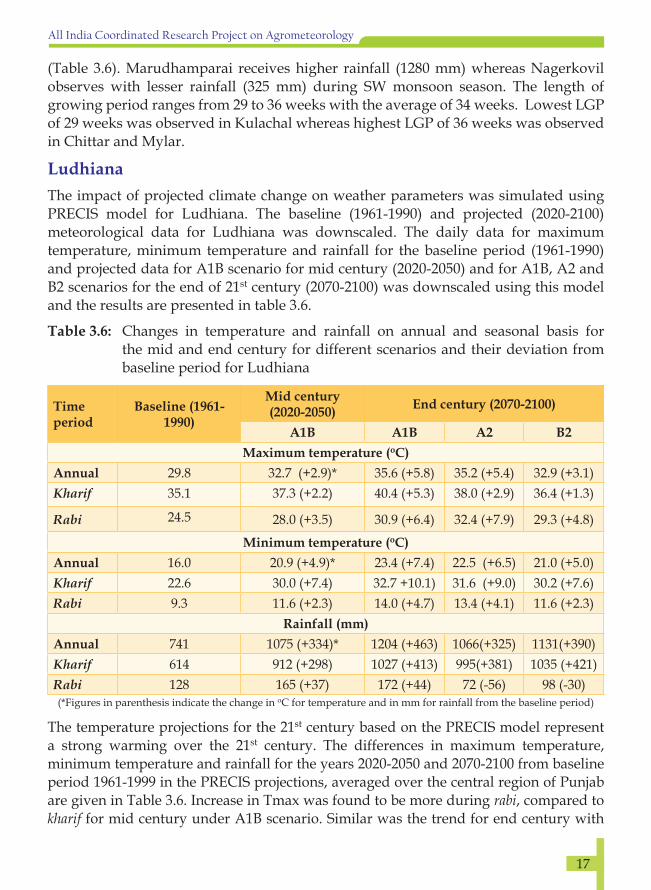
(Table 3.6). Marudhamparai receives higher rainfall (1280 mm) whereas Nagerkovil observes with lesser rainfall (325 mm) during SW monsoon season. The length of growing period ranges from 29 to 36 weeks with the average of 34 weeks. Lowest LGP of 29 weeks was observed in Kulachal whereas highest LGP of 36 weeks was observed in Chittar and Mylar.
LudhianaThe impact of projected climate change on weather parameters was simulated using PRECIS model for Ludhiana. The baseline (1961-1990) and projected (2020-2100) meteorological data for Ludhiana was downscaled. The daily data for maximum temperature, minimum temperature and rainfall for the baseline period (1961-1990) and projected data for A1B scenario for mid century (2020-2050) and for A1B, A2 and B2 scenarios for the end of 21st century (2070-2100) was downscaled using this model and the results are presented in table 3.6.
Table 3.6: Changes in temperature and rainfall on annual and seasonal basis for the mid and end century for different scenarios and their deviation from baseline period for Ludhiana
Time period
Baseline (1961-1990)
Mid century (2020-2050) End century (2070-2100)
A1B A1B A2 B2Maximum temperature (oC)
Annual 29.8 32.7 (+2.9)* 35.6 (+5.8) 35.2 (+5.4) 32.9 (+3.1)Kharif 35.1 37.3 (+2.2) 40.4 (+5.3) 38.0 (+2.9) 36.4 (+1.3)
Rabi 24.5 28.0 (+3.5) 30.9 (+6.4) 32.4 (+7.9) 29.3 (+4.8)
Minimum temperature (oC)Annual 16.0 20.9 (+4.9)* 23.4 (+7.4) 22.5 (+6.5) 21.0 (+5.0)Kharif 22.6 30.0 (+7.4) 32.7 +10.1) 31.6 (+9.0) 30.2 (+7.6)Rabi 9.3 11.6 (+2.3) 14.0 (+4.7) 13.4 (+4.1) 11.6 (+2.3)
Rainfall (mm)Annual 741 1075 (+334)* 1204 (+463) 1066(+325) 1131(+390)Kharif 614 912 (+298) 1027 (+413) 995(+381) 1035 (+421)Rabi 128 165 (+37) 172 (+44) 72 (-56) 98 (-30)(*Figures in parenthesis indicate the change in oC for temperature and in mm for rainfall from the baseline period)
The temperature projections for the 21st century based on the PRECIS model represent a strong warming over the 21st century. The differences in maximum temperature, minimum temperature and rainfall for the years 2020-2050 and 2070-2100 from baseline period 1961-1999 in the PRECIS projections, averaged over the central region of Punjab are given in Table 3.6. Increase in Tmax was found to be more during rabi, compared to kharif for mid century under A1B scenario. Similar was the trend for end century with

18
All India Coordinated Research Project on Agrometeorology
A1B, A2 and B2 scenarios. The reverse was observed in the case of Tmin, where kharif showed more increase compared to rabi. Rainfall also showed similar trends of Tmin, where kharif showed more increase in rainfall during mid and end century. Interestingly, rainfall under end century showed decreasing trend under A2 and B2 scenarios.
MohanpurEffect of El Nino on annual and monsoon rainfall and crop yields was assessed. Weather (1970-2014) and yield data (Jute and rice) of Nadia district was used for the study. It has been observed that during years 1998 and 1994, strong El Niño conditions coincided with low monsoon-rainfall. During 1995 and 2010 which are moderate EL Nino-years the annual rainfall was less than normal (Fig. 3.2 (a) & (b)).
A B
Fig. 3.2(a) : Impact of El Nino on (A) annual rainfall and (B) SW monsoon rainfall
Effect of El Nino on rice and jute production was studied out for Nadia district and the results are presented in figure (3.2a&b). No significant trend has been observed due to El Nino effect.
Fig. 3.2 (b) : Impact of El Nino on (A) jute production and (B) rice production in Nadia district, West Bengal.
Thus it can be concluded that moderate and strong El Nino years affect the rainfall situation in southern West Bengal, but as the amount of seasonal rainfall of the region is very high (more than 1000 mm), no significant effect on yield has been noticed in jute and rice.

19
All India Coordinated Research Project on Agrometeorology
PalampurTrends in extreme weather events in Palampur were analysed. The events considered were hail, dew days and snowfall days. The results are presented in Fig. 3.3 (A,B,C).
A B
C
Fig. 3.3: Increasing trend in (A) hail events (B) snow days and (C) dew days at Palampur
Number of hail events (since 1990) and dew days (since 1985) are on rise as evident from fig. 3.3 (a) at Palampur i.e., in mid hills region of Himachal Pradesh. It is also noticed that the dew days are increasing at the rate of 3 days per year at this station.
RaipurImpact of El Nino on annual rainfall, SW monsoon rainfall and total crop production in the Chhattisgarh state was studied. Crop statistics and weather data for the period 1971-2012 were used for the analysis. The years were classified under weak, moderate and strong El Nino classes based on the criteria given by NOAA Oceanic Nino Index (ONI) and the details are given in table 3.7.

20
All India Coordinated Research Project on Agrometeorology
Table 3.7: Classification of years based on El Nino intensity
El Nino intensity YearsWeak 1951,1963,1968,1969, 1976, 1977, 2004, 2006Moderate 1986,1987,1994, 2002Strong 1957,1965.1972,1982,1991,1997, 2009
Fig. 3.4: Per cent change in (A) SWM rainfall (B) annual rainfall during El Nino years and normal years in Chhattisgarh
Change in either south-western rainfall and or annual rainfall during El Niño years (Fig. 3.4 (A) and (B) remained almost same. For all the districts during El Niño years, there is decrease in rainfall and deviation is on negative side. However, in two districts Mahasamund and Kanker a positive deviation of rainfall is noticed.
Table 3.8: Effect of different intensities of El Niño (strong, moderate, weak) on area, production and productivity of major food grain crops in Chhattisgarh state
Strong El Niño years
Year Area (‘000 ha)
% changecompared to average area
Production (‘000 tons)
% changecompared to average
production
Yield (Kg/ha)
% changecompared to average yield
1972 3606 -23 2552 -42 708 -23
1982 3704 -21 2703 -38 730 -20
1991 5271 13 5101 17 968 6
1997 4435 -5 3656 -16 824 -10

21
All India Coordinated Research Project on Agrometeorology
2009 4860 4 4900 12 1008 10
Average 4375 -6 3782 -13 848 -8
Moderate El Niño years
Year Area (‘000 ha)
% changecompared to average area
Production (‘000 tons)
% changecompared to average
production
Yield (Kg/ha)
% changecompared to average yield
1986 5203 11 3895 -11 749 -18
1987 5247 12 4020 -8 766 -16
1994 4199 -10 5380 23 1281 40
2002 5030 8 3275 -25 651 -29
Average 4920 5 4142 -5 862 -6
Weak El Niño years
Year Area (‘000 ha)
% changecompared to average area
Production (‘000 tons)
% changecompared to average
production
Yield (Kg/ha)
% changecompared to average yield
1976 3495 -25 2177 -50 623 -32
1977 5116 10 3927 -10 768 -16
2004 5129 10 5023 15 979 7
2006 5056 8 5805 33 1148 25
Average 4699 1 4233 -3 880 -4
All El Niño years
Year Area (‘000 ha)
% changecompared to average area
Production (‘000 tons)
% changecompared to average
production
Yield (Kg/ha)
% changecompared to average yield
1972 3606 -23 2552 -42 708 -23
1982 3704 -21 2703 -38 730 -20
1991 5271 13 5101 17 968 6
1997 4435 -5 3656 -16 824 -10
2009 4860 4 4900 12 1008 10
1986 5203 11 3895 -11 749 -18
1987 5247 12 4020 -8 766 -16
1994 4199 -10 5380 23 1281 40
2002 5030 8 3275 -25 651 -29
1976 3495 -25 2177 -50 623 -32
1977 5116 10 3927 -10 768 -16
2004 5129 10 5023 15 979 7
2006 5056 8 5805 33 1148 25
Average 4642 -1 4032 -8 862 -6

22
All India Coordinated Research Project on Agrometeorology
It can be observed that during the 5 strong El Niño years as recorded in the history, combined production of pulses and cereals declined by about 13 per cent on an average while average yield has declined by about 8 per cent.The effect was also noticed on crop acreage as it decreased by 6 per cent. The most severe effect in this category is noticed in 1972 when a decline of about 42 per cent in production and 23 per cent in yield was observed. It can be inferred from the analysis that there can be a decline in acreage under cereals and pulses about 1 per cent in El Niño years and production loss in cereals and pulses group has been about 8 per cent while productivity loss has been about 6 per cent. Year to year variation in food grains production has also been given in Table 3.8 with respective intensities of El Niño.
RanchiMeteorological droughts of various intensities viz., mild, moderate and severe over 56 years (1956-2011) at Palamau district was analyzed using Weather Cock v.15 software.
Table 3.9: Meteorological droughts at RanchiType of Drought No. of Years Per centage
Mild 16 29Moderate 15 27
Severe 1 2No drought 24 43
Fig. 3.5: Number of drought years and drought intensity over the decades
The analysis indicated that Palamau region experienced 32 drought years out of which 16 were mild, 15 moderate and one severe accounting for 29%, 27% and 2%, respectively (Table 3.9). Increase in number of drought years and drought intensity over the decades is depicted through fig. 3.5. Frequency of mild drought was more during 1961-1990. However, the subsequent decades 1991-2000 and 2001-2010 registered higher intensity of moderate droughts. There were 8 mild droughts during the decade 1981-90

23
All India Coordinated Research Project on Agrometeorology
whereas the decade 1990-2000 had 5 moderate droughts. The recent decade, 2001-2010, experienced maximum number of drought years (9) of which seven were moderate.
The occurrence of agricultural drought was also estimated using Weather Cock v.15 software. Percentage of years experiencing agricultural drought was 50% at Palamau which were most frequently observed in early (23-26 standard meteorological week (SMW)) as well as late (37-40 SMW) stages of kharif crops at the seedling and reproductive stages of rice crop, respectively. In recent decade (2001-10) there were eight agricultural drought years affecting rice production in this region (table 3.10). Two consecutive years of drought in 2009 and 2010 restricted the rice crop coverage in this area by covering only 16 and 7.7 per cent of target area under rice cultivation, respectively. At the same time, maize and pulses crops achieved the target area by covering 83 and 75 per cent during 2009 and 87 and 52 per cent during 2010, respectively. Less variation in crop coverage under maize and pulses crops during drought years indicates greater perspective of these crops in future for food security.
Table 3.10: Agricultural drought during kharif season at Palamau region, Jharkhand
Year Week Year Week Year Week Year Week1956 24 - 27 1980 37 - 41 1991 25 - 28 2001 36 - 391957 30 - 34 1981 39 - 42 1992 22 - 27 2002 38 - 41
36 - 42 1982 24 - 29 30 - 33 2003 22 - 251958 22 - 27 38 - 42 37 - 42 2004 22 - 251965 22 - 26 1983 31 - 34 1995 22 - 28 2005 37 - 421966 35 - 42 1984 37 - 41 1996 36 - 42 2008 39 - 421976 22 - 25 1988 33 - 36 1997 36 - 40 2009 30 - 331979 22 - 25 2000 39 - 42 2010 22 - 25
2011 33 - 36

24
All India Coordinated Research Project on Agrometeorology4. Crop Weather Relationships
Many physiological processes in the crop plants are governed by the micro environment in which they grow. All crop growth models (dynamic/mechanistic/deterministic) are inadvertently use relations between crop growth and weather elements. A better understanding of these relationships enable scientists to estimate location specific or regional crop yields advance. The information also helps in the development of genotypes/production systems and in the designing of management strategies both during growing season and post-harvest. The results of the research carried out under crop-weather relationships program at different centers are discussed hereunder:
Kharif 2014RiceFaizabadCultivars Sarjoo 52, Narendra Sona and Swarna were grown under three growing environments (sown on 5, 20 July and 4 August, 2014) to study the crop weather relationships in rice. Heat use and radiation use efficiencies were assured.
Heat Use Efficiency
Data pertaining to heat use efficiency (HUE) of rice at various phenophases as influenced by dates of transplanting and genotypes are given in Table 4.1. Results revealed that July 5th transplanting recorded higher HUE at all the phenophases followed by July 20th and lowest in Aug 4th transplanting. Among the genotypes, Sarjoo-52 showed relatively higher HUE over Narendra Sona at all the stages.
Table 4.1: HUE (g/m2/ 0days) of rice at different phenophases as affected by various treatments
TreatmentsPhenophases
Tillering Vegetative PI 50% flowering
Milk Dough Maturity
Growing Environment July 5 0.47 0.48 0.45 0.66 055 0.54 0.55July 20 0.36 0.36 0.41 0.66 0.53 0.57 0.52Aug 4 0.32 0.33 0.40 0.62 0.55 0.54 0.50Varieties:Sarjoo-52 0.46 0.46 0.46 0.72 0.55 0.56 0.54Narendra Sona 0.40 0.30 0.43 0.66 0.53 0.53 0.53Swarna 0.45 0.41 0.43 0.63 0.51 0.50 0.57

25
All India Coordinated Research Project on Agrometeorology
Table 4.2: Radiation Use Efficiency (g/MJ) of rice as affected by various treatments
Days After TransplantTreatments 15 30 45 60 75 90 AH
Growing EnvironmentJuly5 1.6 2.1 2.7 2.1 2.4 2.6 2.4July 20 1.2 1.2 2.1 2.6 2.2 2.3 2.2Aug. 4 1.8 1.2 2.5 2.2 2.7 2.6 2.1Varieties:Sarjoo-52 1.5 1.7 2.0 2.4 2.4 2.6 2.2Narendra Sona
1.3 1.2 2.4 2.7 2.9 2.2 2.5
Swarna 1.8 1.4 2.6 2.3 2.3 2.6 2.7
Higher cumulative APAR were recorded under July 5th transplanting followed by July 20th at all the stages. However, lowest APAR were recorded under Aug 4th transplanting. It ranged from 406 MJ/m2 to 664 MJ/m2 from transplanting to maturity in varying transplanting treatments. Among the genotypes, Sarjoo-52 gave higher value of cumulative APAR and RUE over Narendra Sona. Highest radiation use efficiency (RUE) was recorded by crop sown on July 5. Among varieties, Swarna showed higher RUE (Table 4.2).
KanpurTo study crop weather relations in paddy, 4 varieties, viz; NDR-359 (V1), CSR-27 (V2), Sarjoo-52 (V3) and Swarna (V4) were exposed to three growing environments (sown on 13, 23 July and 2 August 2014-D1, D2 and D3, respectively). Dry matter accumulation as influenced by growing degree days (GDD) was studied and HUE in different environments are presented in table 4.3.
Table 4.3: Dry matter accumulation and HUE as influenced by different transplanting date of paddy cultivars during kharif 2014 at Kanpur
Treatment Dry matter (kg/ha) GDD (°days) HUE (g/m2/0 day)D1V1 11983 2800.6 0.43D1V2 10742 2619.7 0.41D1V3 11174 2750.6 0.41D1V4 11078 3024.1 0.37D2V1 11474 2668.6 0.43D2V2 10259 2467.1 0.42D2V3 10647 2601.1 0.41D2V4 10275 2892.8 0.36

26
All India Coordinated Research Project on Agrometeorology
D3V1 10035 2516.4 0.40D3V2 9214 2372.5 0.39D3V3 9531 2485 0.38D3V4 5939 2664.2 0.22
Mean for date of transplantingD1 11244.3 2798.8 0.40D2 10663.8 2657.4 0.40D3 8679.8 2509.5 0.35
Mean for VarietyV1 11164.0 2661.9 0.42V2 10071.7 2486.4 0.40V3 10450.7 2612.2 0.40V4 9097.3 2860.4 0.31
Dry matter was found higher in crop sown on 13 July. A progressive decrease in total dry matter per hectare was observed with subsequent sowing. Reason could be exploitation of weather and soil moisture at important growth stages by early sown crop and higher leaf area index which might have provided more photosynthetic area. First sown crop also recorded higher GDD (2798.8 0days) and HUE (0.40 g/m2/0day). Among the varieties, NDR-359 recorded highest 0.42 g/m2/0day followed by CSR-27 which achieved 0.40 g/m2/0day.
LudhianaEffect of microclimate modification on rice yield and yield contributing attributes were studied (Table 4.4). Cultivar PR-118 was transplanted on 2nd July, 2014. Split plot design was followed with five levels of shade [no shade, 50% shade during 0-30 days after transplanting (DAT), 50% shade during 30-60 DAT, 60-90 DAT, 90 DAT-harvest].
Table 4.4: Effect of shade on yield and yield attributes in rice at Ludhiana
Treatments Actual value
under no shade
Per cent change as compared to no shade
Shade (0-30) DAT
Shade (30-60) DAT
Shade (60-90) DAT
Shade (90-harvest)
DATNo. of effective tillers/m2
Nitrogen levels
N0-100% normal application
313.0 -20.1 23.4 26.2 -15.9

27
All India Coordinated Research Project on Agrometeorology
N1- 100% normal application+3% urea spray during stress
492.8 -17.4 -22.3 -21.5 -12.0
Panicle wt. /m2
N0-100% normal application
4375.6 -4.2 -9.9 -8.2 -8.9
N1- 100% normal application+3% urea spray during stress
6719.9 -3.6 -10.6 -9.7 -5.1
1000- grain wt.
N0-100% normal application
17.4 -2.9 -11.5 -5.7 -6.8
N1- 100% normal application+3% urea spray during stress
18.2 -3.3 -6.6 -4.3 -5.5
Grain yield (q/h)
N0-100% normal application
60.3 -4.3 -7.9 -2.7 -6.6
N1- 100% normal application+3% urea spray during stress
60.9 -4.1 -4.8 -2.5 -5.7
Biomass yield (q/h)
N0-100% normal application
183.4 -2.3 -3.5 -1.9 -2.6
N1- 100% normal application+3% urea spray during stress
192.6 -2.2 -1.4 -0.9 -2.5
Harvest index (%)
N0-100% normal application
32.9 -2.2 -5.1 -0.9 -4.5
N1- 100% normal application+3% urea spray during stress
31.6 -1.9 -3.6 -1.6 -3.3
Compared to the crop grown without shade, yield was found to be decreasing in all other treatments. Maximum reduction in yield was observed when shade imposed during 30-60 DAT when nitrogen was 100% normally applied. Harvest index, biomass, 1000 grain weight and panicle weight/m2 also showed similar response.
RaipurCultivars Swarna (with two levels of fertilization, viz., 100:60:40 and 60:40:40 kg N:P2O5:K2O/ha) was grown under three growing environments (sown on 15, 25 June

28
All India Coordinated Research Project on Agrometeorology
and 5 July) and its effect on heat and radiation use efficiencies were assessed. HUE of different rice varieties as affected by growing environments has been presented in table 4.5(a). It can be observed that highest HUE is observed for Mahamaya and MTU-1010, Swarna being at par in both the fertilizer doses. Lowest value is noticed in for Karma Mahsuri. Highest HUE is found in crop sown on 5 July, followed by 25 June, however the difference is negligible.
Table 4.5 (a): Heat use efficiency (g/m2/oday) of rice varieties as influenced by different growing environments
Varieties 15 June sown 25 June sown 5 July sown MeanSwarna 100:60:40 0.35 0.41 0.38 0.38Swarna 60:40:40 0.35 0.39 0.40 0.38Mahamaya 0.38 0.44 0.43 0.42MTU1010 0.32 0.41 0.41 0.38Karma Mahsuri 0.32 0.37 0.38 0.36Mean 0.35 0.41 0.41
RUE value was highest in Mahamaya followed by MTU-1010 (Table 4.5(b)). Under second date of sowing ( 25 June), RUE value is significantly high.
Table 4.5 (b): Radiation use efficiency (g/m2/MJ) of rice varieties as influenced by different sowing dates.
Varieties D1 D2 D3 MeanSwarna 100:60:40 0.96 1.09 0.97 1.01Swarna 60:40:40 0.96 1.04 1.03 1.01Mahamaya 1.08 1.21 1.13 1.14MTU1010 0.89 1.17 1.10 1.05Karma Mahsuri 0.87 1.00 0.96 0.94Mean 0.97 1.13 1.05
RanchiCultivars Sahbhagi, Naveen and Swarna were exposed to three growing environments (sown on 8, 18 and 28 June, 2014) to explore the crop weather relationships. Different energy conversion efficiencies viz., heat, water and RUE in rice were studied in these varieties by exposing them to varied environmental conditions. The comparison made among different varieties and sowing dates revealed that the crop sown on 18th June registered higher efficiency values than the crop planted later (Table 4.6). The rice variety Naveen was found to be comparatively more efficient in resource capturing. Rice cv. Swarna was the poorest among the varieties tested in harnessing the natural resources as revealed by its low HUE, RUE and water use efficiency (WUE).

29
All India Coordinated Research Project on Agrometeorology
Table 4.6: Heat, Water and Radiation Use Efficiency of rice varieties under sowing dates.
Treatments Heat use efficiency(kgha-1/ 0C day)
Water use efficiency (kgha-1/cm)
Radiation use efficiency (g/MJ)
Yield(q/ha)
Sowing date08 June 1.5 61.2 1.3 34.5418 June 1.7 60.9 1.5 36.7228 June 1.6 54.1 1.3 32.87VarietySahbhagi 1.6 50.3 1.4 33.94Naveen 1.8 65.6 1.5 38.48Swarna 1.4 60.2 1.1 31.70
SamastipurCultivars RAU-3055, Rajendra Bhagwati, Saroj and Swarna were grown under four growing environments (sown on 31 may, 15, 30 June and 16 July, 2014). Effect of growing environments on phenology, thermal requirement and grain yield were studied and the results are presented in table 4.7.
Table 4.7: Effect of sowing dates on growth, yield attributes and grain yield of rice varieties
Treatment Tillers/hill Panicle length (cm)
Grains Panicle
Grain yield(q/ha)
HUE (kg/ha oC)
Sowing dates31 May 14 7.9 23.3 106.5 39.5 1.315 June 14 8.9 22.6 110.9 42.1 1.430 June 14 8.6 21.7 102.8 35.6 1.216 July 14 6.7 20.2 96.4 26.7 0.8CD (P=0.05) NS 1.9 13.6 1.8 -RAU 3055 8.6 23.4 106.3 35.1 1.2Rajendra Bhagawati 9.1 22.7 112.5 37.1 1.3Saroj 8.2 22.5 96.3 33.2 1.2Swarna 9.4 22.1 113.7 38.3 1.2CD (P=0.05) NS NS NS 1.8 _
The thermal period and heat unit requirement of rice varieties varied significantly among the sowing dates. Except dough stage, the thermal period required for different phenophases i.e. boot stage, 50 per cent ear head emergence, milk stage and maturity reduced significantly when seeding was delayed beyond 31st May. The crop sown

30
All India Coordinated Research Project on Agrometeorology
earlier on 31st May accumulated maximum heat unit for these phenophases while the lowest heat unit accumulation for these phenophases was associated with 16th July sown crop.
Number of tillers/hill, panicle length and grains/panicle varied significantly among the sowing dates. The crop sown on 15th June recorded higher number of tillers/hill and number of grains/panicle while higher panicle length was associated with 31st May sown crop. Lower value of these yield indices were recorded under 16th July sown crop.
Grain yield showed significant variation among the sowing dates. The crop sown on 15 June recorded maximum grain yield (42.1q/ha) which was significantly higher than earlier as well as later sown crop (Table 4.7). The reduction in grain yield was of the order of 6.2% in earlier sown crop (31 May) and 15.4 and 36.7% in later sown crop on 30 June and 16 July respectively. Among the varieties, Swarna recorded higher grain yield (38.3q/ha) which was found at par with Rajendra Bhagawati and these varieties produced significantly higher grain yield than RAU 3055 and Saroj. Lowest grain yield (33.2q/ha) was recorded under Saroj. Thus it can be inferred that 15th June is the optimum for raising paddy nurseries in north-Bihar agro-ecological conditions as it recorded highest HUE. Heat-use efficiency decreased with subsequently delay in seeding time. Among the varieties, highest HUE was associated with Rajendra Bhagawati followed by Swarana.
MaizeUdaipurHybrids viz.,HQPM-1, Pratap Makka-3, Pratap-5, Pratap QPM, PEHM-2 and BIO-9637 were exposed to three growing environments [sown on 15 June, 30 June and 15 July] to study the crop weather relationship. Effect of growing environment and varieties on yield of maize was studied and the results of pooled analysis (kharif 2009 to 2014) is presented in table 4.8.
Table 4.8: Effect of sowing environment on grain yield of maize varieties during 2004-2014
Treatment Grain yield (q/ha)2009 2010 2011 2012 2013 2014 Mean
Sowing environment15th June 34.85 39.82 48.20 41.04 41.19 53.19 43.0530th June 30.08 33.41 35.81 55.08 50.87 48.94 42.3715th July 26.23 23.92 29.35 37.47 43.55 40.11 33.44SEm ± 1.516 0.147 1.340 1.11 1.31 1.26 -CD (P = 0.05) 4.201 0.462 4.223 3.49 4.53 4.35 -

31
All India Coordinated Research Project on Agrometeorology
Varieties
HQPM-1 32.15 33.70 37.94 39.45 46.68 47.05 39.49
PEHM-2 30.52 32.73 38.47 45.75 43.56 - 38.60
Pratap Makka-3* - - 48.95 48.95
Pratap Makka-5 - - - - 37.28 49.04 43.16
Pratap QPM-1 - - - - 46.70 48.26 47.48
BIO-9637 - - - - 51.78 43.76 47.77
SEm ± 1.516 0.194 0.841 1.16 1.58 1.39 -
CD (P = 0.05) NS 0.565 NS 3.4 4.52 NS -
The results indicated that early sown crop gave higher grain yield by availing longer crop growing period as compared to successive delayed in sowings. Among different hybrids, Pratap Makka-3 and BIO-9637 and recorded highest mean yield and PEHM-2 recorded the lowest.
Pearl milletSolapurCrop-weather relationship studies with cultivars Shanti (V1), Mahyco hybrid (V2) and ICTP-8203 (V3) were conducted during kharif 2010 to 2014 and the results of pooled data analysis are presented herewith. Consumptive use of soil moisture (CUM) and moisture use efficiency (MUE) were computed and the results are presented in table 4.9(a). The data on CUM and MUE indicated that the crop sown in second fortnight (FN) of June (S1) recorded highest value of CUM (303-332 mm) and MUE value (5.37-6.11 Kg ha-1 mm). The lowest values of CUM (272-288 mm) and MUE value, (3.24-3.94 Kg ha-1 mm) were recorded from second fortnight of August (S3) sown crop. Among the genotype, shanti recorded highest value of CUM and MUE than Mahyco and ICTP-8203.
Table 4.9(a): CUM and MUE as influenced by sowing time in kharif pearl millet (2010-14).
Treatment GY(kg ha-1)
CUM(mm)
MUE(kg ha-1mm)
Treatment GY(kg ha-1)
CUM (mm)
MUE(kg ha-1 mm)
S1V1 1765.7 303 5.43 S2V3 1783.7 308 5.21
S1V2 1820.6 312 5.37 S3V1 699.4 272 3.24
S1V3 1999.3 332 6.11 S3V2 863.8 281 3.75
S2V1 1430.9 285 4.31 S3V3 911.1 288 3.94
S2V2 1501.1 292 4.75
(S1: 2nd FN of June; S2: 2nd FN of July; S3: 2nd FN of August)

32
All India Coordinated Research Project on Agrometeorology
RUE was also worked out and the results are presented in table 4.9(b).
Table 4.9 (b): Radiation use efficiency (g MJ–1) as influenced by sowing dates in kharif pearl millet (2010-14).
Sowing Phenological stageTime Emer. PI Flag leaf 50 % flowering Soft dough Hard
DoughPhy.
maturity
S1V1 0.13 0.25 1.48 1.93 1.8 1.44 1.65
S1V2 0.16 0.29 1.29 1.68 1.59 1.25 1.44
S1V3 0.16 0.47 1.18 1.48 1.22 1.14 1.07
S2V1 0.13 0.23 0.85 1.6 1.49 0.87 1.34
S2V2 0.16 0.28 1.43 1.72 1.73 1.45 1.58
S2V3 0.35 0.35 0.9 1.56 1.42 0.92 1.32
S3V1 0.11 0.24 0.87 0.96 1.11 0.89 1.01
S3V2 0.09 0.17 0.77 0.81 0.84 0.79 0.74
S3V3 0.09 0.11 0.65 0.74 0.59 0.67 0.49
The maximum values of leaf area index (LAI) and RUE was recorded highest at 50 per cent flowering stage in almost all the sowing dates and genotypes. This indicated that the rate of conversion of light i.e. photosynthetically active radiation (PAR) was considerably high at 50 per cent flowering stage, thereafter the conversion rate declined due to senescence of leaves. Among the sowing dates, maximum RUE values were higher in early sown crop than late sown crop. Further, it can be noticed that Shanti showed higher values of RUE than variety Mahyco and ICTP-8203 is converting of light into dry matter across the dates of sowings.
Pigeoan peaBangaloreThree varieties of pigeon pea (viz. TTB-7, BRG-1 and BRG-2) were sown on three different dates viz., 05.06.2014, 01.07.2014 and 09.08.2014 with three different spacing (60 cm x 22.5 cm, 90 cm x 22.5 cm and 120 cm x 22.5 cm). The accumulated meteorological parameters in each stage were worked out. During this year poor crop growth was observed in crop sown on 9th August compared to others. The highest grain yield was observed in the first date of sowing (1275.2 kg ha-1) followed by second and third date sown crop 990.2 kg ha-1 and 270.8 kg ha-1 respectively (Table 4.10). This is attributed to prolonged water deficit situation i.e. poor rainfall distribution. This might have led to the development of moisture stress during pod formation stage, which is genreally considered as a moisture sensitive stage. Among spacing, maximum grain yield of 1905.6 kg ha-1 and1236.7 kg ha-1were observed with 60 cm x 22.5 cm of first date sown

33
All India Coordinated Research Project on Agrometeorology
crop and 90 cm x 22.5 cm of the second date sown croprespectively.
Table 4.10: Effect of date of sowing, varieties and spacing on yield (kg/ha) of pigeon pea
Varieties (D1) 05.06.2014 (D2) 01.07.2014 (D3) 09.08.2014S 1 S2 S3 Mean S1 S2 S3 Mean S1 S2 S3 Mean
TTB-7 (V- 1)
398.3 1028.3 405.0 610.6 331.7 931.7 475.0 579.4 91.5 265.8 999.1 452.1
BRG-1 (V-2)
2576.7 1008.3 240.0 1275.0 2211.7 998.3 883.3 1364.4 286.5 35.1 63.5 128.4
BRG-2 (V-3)
2741.7 1638.3 1440.0 1940.0 1166.7 1393.3 520.0 1026.7 276.8 120.2 299.2 232.0
Mean 1905.6 1225.0 695.0 1275.2 1236.7 1107.8 626.1 990.2 218.3 140.3 453.9 270.8Particulars Spacing Variety Date S*V S*D V*D SVD CV=29 %
SEm ± 344.5 344.5 344.5 298.4 198.9 298.4 172.3CD ( 0.05 P) 1001.5 1001.5 1001.5 867.3 578.2 867.3 500.8
(Spacing S1: 60 cm x 22.5 cm, S2: 90 cm x 22.5 cm, S3: 120 cm x 22.5 cm)
BijapurCultivars TS-3R, Maruti (ICP-8863) and BSMR-736 were cultivated under three growing environments (Sown on 7th, 19th July and 1st August, 2014) to study the crop weather relationships. The data on all genotypes were pooled and analyzed using scatter plots between pigeon pea yield and important parameters which showed highly significant association. To explore further, a yield strata was created with the following criteria:
• High yield stratum: Yield more than 25% of average• Moderate yield stratum: Yield of -25% to +25% of average
• Low yield stratum: Yield less than 25% of average
Table 4.11: Variation in individual parameter of different stages among various yield strataItem Yield /
variationGermi-nation
Seedling Vegetative Flowering Pod formation and grain filling
Physiological Maturity
BSS BSS MinT TR RH1 TR RH2 MinT RH2 RF MaxT TRMean for high yield stratum
1283 3.2 2.3 21.5 8.9 89.9 10.2 57.0 20.1 52.1 96.8 29.7 14.8
Mean for moderate yield stratum
787 3.1 4.3 21.5 9.7 88.3 11.5 49.6 16.8 44.6 36.5 29.8 16.0
Mean for low yield stratum
422 5.8 5.0 20.2 11.7 84.9 13.6 42.4 16.0 35.0 11.6 32.5 16.2
Moderate – High yield stratum
-496 -0.1 2.0 0.0 0.8 -1.6 1.2 -7.5 -3.3 -7.5 -60.2 0.0 1.2
Low – Moderate yield stratum
-365 2.7 0.7 -1.3 1.9 -3.4 2.1 -7.2 -0.8 -9.6 -24.9 2.7 0.1
Low – High yield stratum
-861 2.7 2.6 -1.2 2.8 -5.0 3.4 -14.7 -4.1 -17.1 -85.1 2.8 1.3
The variation of these parameters in moderate yield stratum from high yield stratum

34
All India Coordinated Research Project on Agrometeorology
(moderate–high), in low yield stratum from moderate yield stratum (low–moderate) and in low yield stratum from high yield stratum were calculated (low–high), and presented in the three rows of the table (4.11)
The mean of high yield stratum is 1283 kg/ha. The mean yield of moderate yield stratum is less than this by 496 kg/ha and that of low yield stratum is 861 kg/ha. Similarly the mean yield of low yield stratum is less than moderate yield stratum by 365 kg/ha. Such calculations were performed for all the variables. It is observed from the Table, for some variables values are nearly same for moderate and high yield strata or for low and moderate yield strata, as overlapping of parameters was noticed in the graphical presentations. More sunshine by two hours per day during seedling stage and lower minimum temperature by 3.4 oC in pod formation and grain filling stage were found favorable for higher yield stratum compared to moderate stratum (Table 4.11).
SoybeanAkola The effect of rainfall at critical stages of crop growth were studied across four different sowing environments. With later sowings (27-28-29-30 SMW) soybean crop recieived lower amount of rainfall during critical reproductive stages–pod formation to seed development which significantly lowered seed yield. The crop also received low rainfall during vegetative stage (Fig. 4.2).
Fig. 4.2: Rainfall at critical stages and seed yield of soybean at Akola during 2014
Water use indices for different varieties and sowing times were estimated (Table 4.12).

35
All India Coordinated Research Project on Agrometeorology
Table 4.12: Water use indices as influenced by treatmentsTreatment Seed yield (kg ha-1) Eta (mm) Etp (mm) WRSI (%) WP (kg ha-mm-1)
Sowing timeD
1- 27 SMW 839 336.7 362.3 0.93 2.49
D2- 28 SMW 763 318.9 349.6 0.91 2.39
D3- 29 SMW 650 296.5 344.8 0.86 2.19
D4- 30 SMW 530 259.1 327.5 0.79 2.05
B. VarietyV
1- JS-335 700 303.2 346.0 0.88 2.31
V2- JS-9305 653 300.1 337.3 0.89 2.18
V3- TAMS-98-21 734 305.1 354.9 0.86 2.41
Actual (Eta) and potential (Etp) crop water use decreased with later sowings. Water requirement satisfaction index (WRSI), an indicator of crop performance based on the availability of water to the crop during a growing season, was more in earlier sowings indicating lesser degree of yield reduction due to water deficit. Water productivity (WP), a ratio of yield to actual crop water use, was maximum under earliest sowing (D1- 27 SMW) and decreased with later sowings. Among the varieties, TAMS-98-21 showed higher Eta and Etp followed by JS-335 and JS-9305. WP was higher with TAMS-98-21 followed by JS-335 and JS-9305.
ParbhaniSix soybean cultivars (MAUS-158, 47, 81, 71, JS 93-05 and JS-335) were sown under four sowing windows (7, 14, 21 and 28 July, 2014) to study the crop weather relationships. The correlations between weather variables prevailed during different growth stages of different cultivars under different growing environments were computed and the results are presented in Table 4.13 .
Table 4.13: Correlation coefficients between seed yield and weather variables prevailed in different phenophases of soybean.
Param-eters
P1 P2 P3 P4 P5 P6 P7 P8 P9
Rainfall -0.112 0.579* 0.356 -0.722** -0.481 -0.100 0.842** 0.551* -0.611*T.max 0.640** -0.776** -0.807** 0.474 0.051 0.787** -0.306 -0.778** -0.499T.min 0.838** 0.696** -0.469 -0.119 0.627** 0.586* 0.356 0.792** -0.062BSS 0.136 -0.866** -0.323 0.687** 0.650** 0.697** -0.776** -0.610* -0.620*
(* = Significant at 5 % ** = Significant at 1%)
P1-Sowing to seedling, P2-Seedling to branching, P3-Branching to flowering, P4 Flowering to pod formation, P5-Pod formation to grain formation, P6-Seed formation to pod development, P7-Pod development to pod containing full grain size; P8-Pod containing full grain size to dough stage; P9-Dough stage to maturity.

36
All India Coordinated Research Project on Agrometeorology
The analysis indicated that during flowering stage to pod formation stage (P5), minimum temperature and bright sunshine showed significant positive association where as rainfall showed negative association. In case of grain formation stage (P6) maximum temperature, minimum temperature and BSS showed significant positive association. During grain development stage (P8) rainfall, minimum temperature showed highly significant positive association whereas as maximum temperature and bright sunshine hours showed negative association.
SunflowerSolapurCultivars Bhanu (V1), MSFH-17 (V2), Pule Raviraj (V3) were grown under three growing environnements [Sown during 2nd FN of June (S1), 2nd FN of July (S2) and 2nd FN of August (S3)]. The CUM and MUE estimated indicate that the crop sown in second fortnight of June (S1) recorded highest value of CUM (342 mm) and MUE valueof 5.48 Kg ha-1 mm. The lowest values of CUM (290 mm) and MUE (2.06 Kg ha-1 mm) were recorded in second fortnight of August (S3) sown crop. Among the genotypes, Phule Raviraj recorded highest CUM and MUE than other varieties (Table-4.14).
Table 4.14: CUM and MUE as influenced by different treatments in Kharif sunflower(2010-14)
Treatment GY(kg ha-1)
CUM(mm)
MUE(kg ha-1 mm)
Treatment GY(kg ha-1)
CUM (mm)
MUE(kg ha-1 mm)
S1V1T1 2205 312 4.2 S2V2T2 1890 319 3.89
S1V1T2 1731 306 3.36 S2V3T1 2545 322 5.45
S1V2T1 2550 323 4.64 S2V3T2 2233 337 4.67
S1V2T2 2458 310 4.83 S3V1T1 1089 293 3.26
S1V3T1 2764 342 5.48 S3V1T2 454 290 2.06
S1V3T2 2648 337 4.68 S3V2T1 1295 324 3.63
S2V1T1 2029 325 4.10 S3V2T2 673 295 2.77
S2V1T2 1852 297 3.29 S3V3T1 1660 306 4.53
S2V2T1 2107 323 5.02 S3V3T2 962 295 3.45
The maximum values of LAI and RUE were recorded at 50 per cent flowering stage in all sowing dates and genotypes. This indicates that the rate of conversion of light i.e. photo synthetically active radiation (PAR) was considerably high at 50 per cent flowering stage, thereafter the conversion rate was less due to leaf senescence. Among the sowing dates, RUE values were higher in early sown crop than late sown crop. Further, it is seen that Phule Raviraj showed high values of RUE than other varieties in all the dates of sowing (Table 4.15).

37
All India Coordinated Research Project on Agrometeorology
Table 4.15: Radiation use efficiency (g MJ –1) as influenced by sowing dates in sunflower (Kharif 2010-14)
Sowing Growth Stage
Date 4 Leaf Button 50% flow. Soft Dough Hard Dough Phy. MaturityS1V1 0.12 0.59 1.68 1.42 1.34 0.38S1V2 0.13 0.63 1.79 1.47 1.38 0.56S1V3 0.14 0.69 1.86 1.55 1.40 0.61S2V1 0.11 0.52 1.31 0.94 0.93 0.39S2V2 0.09 0.55 1.30 0.96 0.85 0.49S2V3 0.12 0.61 1.70 1.01 0.81 0.55S3V1 0.05 0.48 1.08 0.81 0.72 0.48S3V2 0.09 0.51 1.08 0.84 0.71 0.51S3V3 0.11 0.55 1.61 0.88 0.80 0.55
CottonParbhaniCultivars Ajit-155, Rasi-2 and Mallika were raised under four growing environments to explore the crop weather relationships. The correlations between cotton yield and weather that prevailed during crop growing season are presented in table 4.16.
Table 4.16: Correlation co-efficient exhibited by weather parameters prevailed in different phenophases with cotton yield (2014-15).
Parameters P1 P2 P3 P4 P5 P6 P7 P8 P9
Rainfall 0.582* -0.579* 0.657** -0.369 0.118 0.419 -0.542* 0.501 -0.403
T.max 0.598* 0.474 -0.575* 0.446 0.420 -0.471 0.356 -0.092 0.473
T.min 0.616* 0.582* -0.649** 0.563* -0.582* 0.257 -0.427 0.558* -0.350
BSS hrs/day 0.581* -0.338 0.550* 0.491 0.071 -0.529* 0.641** -0.537* 0.355
(* = Significant at 5% level, ** = Significant at 1% level)
(P1 = Sowing to emergence, P2 = Emergence to seedling, P3 = Seedling to square formation, P4 = Square formation to flowering, P5 = Flowering to boll setting, P6 = Boll setting to boll bursting, P7 = Boll bursting to 1st picking, P8 = 1st picking to 2nd picking, P9 = 2nd picking to 3rd picking)
The most critical growth stages influencing cotton yield are square formation to flowering (P4), flowering to boll setting (P5) and boll setting to boll bursting (P6). The data revealed that during early stage i.e., seedling to square formation stage (P3) the weather parameters viz; rainfall and bright sunshine hours showed significant positive relationship with cotton yield while maximum and minimum temperature showed

38
All India Coordinated Research Project on Agrometeorology
negative relationship with cotton yield. During square formation to flowering stage (P4), only minimum temperature showed positive association. At flowering to boll setting also, minimum temperature showed negative association. At boll setting to boll bursting stage, BSS showed significant negative relationship and during final growth stage i.e., boll bursting to picking stage of crop, minimum temperature, BSS showed positive significant correlation with cotton yield.
GroundnutAnandThree cultivars (M-335, GG-20 and GG-5) were raised under three growing environments (sown on 18th July, 2nd August and 17th August) for exploring the crop weather relationships.
The relationship between water use efficiency and pod yield of groundnut was also worked out (Fig. 4.3). Under rainfed farming, WUE of groundnut was about 61%.
Fig. 4.3: Relationship between water use efficiency and pod yield of groundnut at Anand
Crop sown on 2 Aug recorded highest WUE (3 kg/ha/mm), whereas late sown (D3) had lowest (1kg/ha/mm). Amongst different cultivars, they had almost similar WUE (3 kg/ha/mm). Under rainfed farming of groundnut, WUE totally depends on rainfall distribution.
The favourable range of various weather parameters under different phenophases were found out based on correlation studies using pooled data of 2009-2012 and the results are presented in table 4.17.

39
All India Coordinated Research Project on Agrometeorology
Table 4.17: Favourable weather range for higher production (2009-2012)
Weather Parameter Pod Ini Seed Sett Pod MatLower limit
Upper limit
Lower limit
Upper limit
Lower limit
Upper limit
EP(mm) 2 4 3 4 3 4
BSS (hr) 2 4 3 3 3 6
RF (mm) 50 166 35 205 54 273
Tmax(0C) 31 32 31 33 31 32
RH1(%) 92 97 95 98 94 98
RH2(%) 71 81 77 84 67 80
RHmean (%) 83 89 86 91 80 89
VP1(mm of HG) 24 26 25 26 23 25
VP2(mm of HG) 24 26 25 26 23 26
VPmean(mm of HG) 24 26 25 26 23 25
AnantapurVemana, K6 and Anantha (K1271) cultivars were grown under rainfed and irrigated conditions in three growing environments [sown on 10 (D1), 30 July (D2) and 9 August (D3) 2014] to study the crop weather relationships. The crop sown during 2nd fortnight of July has recorded highest yield (607 kg/ha) for rainfed crop, while crop sown on first fortnight of August recorded highest yield for irrigated crop (767 kg/ha) (Table 4.18). The yield of Vemana (588 kg/ha), K6 (632 kg/ha) and Anantha (629 kg/ha) varieties sown in different dates of sowing was also on par. The crop sown during 1st fortnight of July accumulated 2021 growing degree days, 2nd fortnight of July sown crop accumulated 1888 GDD and 1st fortnight of August sown crop accumulated 1937 GDD.
Table 4.18: Effect of irrigation, growing environments and cultivars on pod yield and accumulated GDD of groundnut at Anantapur.
TreatmentPod yield (kg/ha)
D1 D2 D3 MeanRainfed 471 607 446 508Irrigated 665 744 767 725Mean AGDD (°days) 2021 1888 1937
Vemana K6 Anantha MeanRainfed 493 522 510 508Irrigated 683 745 749 725

40
All India Coordinated Research Project on Agrometeorology
BangaloreGroundnut cultivars C-2, JL-24 and TMV-2 were grown under two growing environments (sown on 10th July and 9th August, 2014). Effect of different growing environments and varieties on groundnut pod and haulm yield was studied and the results are presented in table 4.19.
Table 4.19: Interaction effect of different dates of sowing and varieties on groundnut pod and haulm yield (kg/ha)
Growing Environments Pod Yield(kg/ha) Haulm Yield(kg/ha)
Date of sowing/ variety
D1 10.07.2014
D2 09.08.2014 Mean D1
10.07.2014D2
09.08.2014 Mean
V1-TMV-2 1456.4 400.8 928.6 600.0 2133.3 1366.7V2-JL-24 1203.2 570.8 887.0 1416.7 2600.0 2008.3
V3-C-2 1815.5 663.3 1239.4 1591.7 2108.3 1850.0
Mean 1491.7 545.0 1018.3 1202.8 2280.6 1741.7
Particulars SEm± CD (0.05 P) CV (%) SEm± CD (0.05 P) CV (%)
Variety 56.1 169.0
15.6
160.6 484.1
26.1Date of sowing 45.8 138.0 131.1 395.2
V*D 79.3 239.0 227.1 NS
The groundnut sown on 10th July has given the higher mean pod yield of 1491.7 kg/ha compared to that crop sown on 09.08.2014 which recorded low yield of 545kg/ha. Among varieties C-2 has given higher yield of 1239 kg/ha followed by TMV-2 and JL-24 were recorded 929 kg/ha and 887 kg/ha respectively. The low yield of groundnut in second sown crop was mainly due to prolonged drought spell at growth stage and water stress in the pod development and maturity stage. Crop water balance was worked out using FAO model (Fig. 4.4 (a) & (b))
Fig. 4.4 (a): Crop water balance for groundnut sown on 10-7-2014 in Bangalore

41
All India Coordinated Research Project on Agrometeorology
Fig. 4.4 (b): Crop water balance for groundnut sown on 9-8-2014 in Bangalore
The actual water required for the crop sown on 10thJuly is about 323.25 mm and water available was only 317.54 mm. For the late sown crop i.e. although the water requirement was 309.55 mm but the available water was only 292.72 mm. There was inadequate soil moisture during pod development and maturity that has led to a decline in pod yield (Table 4.19). Hence the 2nd date sown groundnut yields were drastically reduced.
Rabi 2014-15WheatHisarWheat cultivar WH-1105 was exposed to four growing environments (sown on 5, 20 Nov and 5, 20 Dec 2014) and four irrigation regimes (I1: irrigation at CRI, I2: CRI+heading, I3: CRI+jointing+milk, I4: CRI+jointing+anthesis+dough) to study the influence of growing environments and water use on RUE at various phenological stages of crop. The RUE under different growing environments and irrigation level at various phenophases were computed with dry matter accumulation and intercepted PAR and illustrated in table 4.20.
Table 4.20: Effect of different treatments on radiation use efficiency (g/MJ) during different growth stages in wheat
Growing Environments
CRI TL JT BT HD AN ML DS P.M.
D1 0.08 0.13 0.34 0.64 0.79 0.91 1.13 1.18 1.10
D2 0.08 0.14 0.35 0.70 0.76 0.91 1.10 1.09 1.01
D3 0.12 0.18 0.39 0.63 0.75 0.83 0.96 1.00 0.99
D4 0.17 0.17 0.33 0.57 0.62 0.66 0.84 0.94 0.95
Mean 0.11 0.16 0.35 0.63 0.73 0.83 1.00 1.05 1.01
S.D. (±) 0.04 0.03 0.03 0.05 0.08 0.12 0.13 0.11 0.06

42
All India Coordinated Research Project on Agrometeorology
C.V. (%) 36.0 18.0 0.07 0.08 0.10 0.14 0.13 0.10 0.06
Irrigation levels
I1 0.08 0.10 0.32 0.65 0.82 1.01 1.28 1.25 1.34
I2 0.08 0.14 0.36 0.70 0.83 0.94 1.20 1.17 1.20
I3 0.12 0.19 0.38 0.65 0.80 0.89 1.09 1.08 1.06
I4 0.15 0.21 0.34 0.59 0.70 0.75 0.93 0.94 1.01
Mean 0.11 0.16 0.35 0.65 0.78 0.90 1.12 1.11 1.15
S.D.(±) 0.04 0.05 0.03 0.05 0.06 0.11 0.15 0.13 0.15
C.V. (%) 34.0 30.0 7.0 7.0 7.0 12.0 13.0 12.0 13.0
Under different growing environments, the early sown crop showed more efficient in radiation use at reproductive stages as compared to delayed sowing and vice versa at vegetative stage. In case of irrigation levels, RUE was found to be low under poorly irrigated crop at early stages, while at later stages, reverse condition prevailed due to differences in intercepted PAR.
JammuCultivars HD-2967, Raj-3077 and RSP-561 were grown under four sowing environments (sown on 29 Oct, 12, 26 Nov and 10 Dec 2014) to study its effect on water use efficiency. The results of the study are given in table 4.21.
Table 4.21: ET and WUE of winter wheat under the different crop growing environments
Treatment Grain Yield (kg ha-1) ET (mm) WUE (kg ha-1 mm-1) Crop growing environments
29-10-2014 2120 139.92 15.1012-11-2014 2240 195.74 11.4426-11-2014 1994 149.82 13.3210-12-2014 1642 154.21 10.64
VarietiesHD-2967 1915 159.41 12.04Raj-3077 2228 160.61 14.07RSP-561 1848 159.88 11.77
The results indicated that ET of wheat increased with delay in sowing. ET at second, third and fourth date of sowing increased by about 55.8, 9.9 and 14.3 mm as compared to early sown crop, respectively. However, ET in 3rd crop growing and 4th crop growing environments didn’t increase substanstially comapared to recorded in 2nd crop growing, because of heavy rains during the months of Feb., March and April, which caused water logged conditions in the field. The increase in water use efficiency was associated with an increase in grain yield of wheat crop. WUE was highest (15.1 kgha-

43
All India Coordinated Research Project on Agrometeorology
1mm-1) in 1st crop growing environment and lowest in crop sown on 10 Dec.. As far as variety is concerned, Raj 3077 showed high WUE followed by HD 2967. The least WUE was observed in RSP-561.
LudhianaThe wheat data collected during rabi 2009-10 to rabi 2012-13 for four cultivars namely PBW-550, DBW-17, PBW-343 and PBW 621 were analyzed for the major growth stages to find the range of meteorological parameters favourable for high wheat yield. The results of the analysis are presented in table 4.22.
Table 4.22: Range of meteorological parameters favourable for high wheat yield (rabi 2009-10 to 2012-13).
Crop stage Durtaion (Days)
Temperature (oC) Relative humidity (%) Sunshine hours (Hr)
Rainfall (mm)Maximum Minimum Maximum Minimum
CRI stage 25-35 21-29 6-13 90-98 36-54 4.5-7.5 4.0-19.0Tillering stage
30-35 20-29 7-16 90-97 36-57 4.0-7.2 4.0-24.0
Booting stage
10-17 18-28 6-9 92-97 50-60 4.5-6.5 15.0-115.0
Anthesis stage
7-15 19-22 7-10 93-96 50-60 4.5-6.5 40.0-142.0
Milking stage
15-30 20-24 7-9 94-96 47-60 4.7-6.5 40-142.0
Hard dough stage
7-15 20-25 8-12 90-95 45-55 5.0-7.0 40.0-142.0
Physiologi-cal maturity stage
5-10 22-24 8-10 85-95 45-55 5.5-7.0 4.0-16.0
PalampurOptimum temperatures for highest wheat productivity were characterized using five seasons experimental data (2010-11 to 2014-15). The exercise was carried out for both rainfed and irrigated crop and the results are presented in table 4.23.
Table 4.23: Optimum temperature for highest productivity during past five years during vegetative and reproductive phases in wheat.
Year Temperature Irrigated condition Rain fed condition
Vegetative Reproductive Vegetative Reproductive
2010-11 Maximum 19.1 22.8 18.6 23.1
Minimum 6.0 11.0 5.6 11.3

44
All India Coordinated Research Project on Agrometeorology
2011-12 Maximum 19.6 26.2 18.7 25.6
Minimum 7.6 13.6 7.0 13.1
2012-13 Maximum 17.4 24.8 17.6 24.3
Minimum 5.5 12.3 6.0 12.0
2013-14 Maximum 16.9 21.0 16.3 21.5
Minimum 4.8 9.6 4.7 10.0
2014-15 Maximum 17.1 21.9 16.8 25.4
Minimum 4.8 11.4 4.7 14.2
Under rainfed conditions, the maximum temperature during vegetative phase did not exceed 18.7 °C and minimum above 7 °C but during reproductive phase maximum temperature exceeded the earlier established optimum limit of maximum (23.4) and minimum (10.9) temperature by 2.2 and 3.3 oC. The higher phasic temperatures as mentioned above coincided with year with lowest productivity during rabi 2011-12.
KanpurSeven cultivars (CG-1006, HI-1544, Ratan, Kanchan, CG-1013, GW-273, HD-2967) were exposed to three growing environments (sown on 25 Nov, 10 and 25 Dec, 2014). Heat and radiation use efficiencies were worked out. HUE of different varieties is shown in Table 4.24 (a). It can be observed that Kanchan variety is having the highest HUE among the 7 wheat varieties tested and it is followed by GW-273 variety. However, the highest HUE is observed under 10 December sowing, however crop sown on 25 Nov and 10 Dec were at par.
Table 4.24 (a): Heat use efficiency (g/m2/oday) of wheat varieties as influenced by different growing environments.
Varieties D1-25 Nov. D2-10 Dec. D3-25 Dec. MEAN
CG 1006 0.31 0.36 0.33 0.33
HI1544 (zonal check) 0.39 0.41 0.35 0.38
Ratan (State check) 0.36 0.38 0.34 0.36
Kanchan 0.42 0.47 0.40 0.43
CG1013 0.40 0.38 0.36 0.38
GW273 0.45 0.40 0.38 0.41
HD2967 (National check) 0.30 0.27 0.27 0.28
Mean 0.37 0.38 0.35
RUE of seven varieties were worked out for the purpose of selecting the best three for further experimentation. As shown in Table 4.24 (b), interestingly the national check

45
All India Coordinated Research Project on Agrometeorology
HD-2967 variety, exhibited poor RUE. Highest value of RUE is found with Kanchan variety followed by GW-273.
Table 4.24 (b): Radiation use efficiency (g/m2/Mj) of wheat varieties as influenced by different growing environments.
Varieties D1 (25 Nov.) D2 (10 Dec.) D3 (25 Dec.) MEAN
CG 1006 0.76 0.93 0.89 0.86
HI1544 0.97 1.07 0.95 1.00
Ratan 0.89 0.99 0.92 0.93
Kanchan 1.05 1.20 1.07 1.10
CG1013 0.98 0.99 0.98 0.98
GW273 1.12 1.03 1.02 1.06
HD2967 0.80 0.73 0.77 0.77
Mean 0.94 0.99 0.94
RanchiCultivars HUW-468, K-9107 and Birsa Genhu-3 were sown under three dates of sowing (20 Nov, 5 and 20 Dec) to study the crop weather relationship. Heat and radiation use efficiencies were studied and the results are presented in table 4.25.
Table 4.25: HUE and RUE of wheat cultivars under different growing environments at Ranchi.
Sowing Date Variety HUE (kg/ha°days) RUE (kg/ha/MJ) Yield (kg/ha)
20th NovHUW 468 3.2 2.3 4603
K9107 2.5 1.8 3980BG 3 3.0 2.4 4991
5th DecHUW 468 2.9 2.2 4378
K9107 2.2 1.7 3573BG 3 2.7 1.8 4240
20th DecHUW 468 2.7 2.1 4069
K9107 2.1 1.8 3479BG 3 2.3 1.8 3565
The results indicated that early sown crop registered higher heat and radiation use efficiencies compared to the late sown crop. Among varieties, HUW-468 achieved highest HUE (3.2 kg/ha odays) whereas BG 3 recorded highest RUE (2.4 kg/ha/MJ). The higher heat and radiation use efficiencies in case of early sowing and HU-468 were also reflected in their higher yields.

46
All India Coordinated Research Project on Agrometeorology
Comparison between mean temperature and average yield of K 9107 (rabi 2007-08 to 2013-14) with that of rabi 2014-15 crop performance (table 4.26) showed that normal (20th Nov), mod. normal (5th Dec) and late (20th Dec) sown wheat crops experienced optimum range of maximum temperature, but all were exposed to higher minimum temperature as compared to their optimum minimum temperature ranges during each reproductive stage i.e. from anthesis to maturity stage and yielded less than 4 t/ha. Minimum temperature was 2.4 to 6.5 0C higher over optimum range during reproductive stage and maximum differences were found during anthesis to milking stage (4.3 to 6.5 0C) for all the three sowing dates crops resulted into decrease in yield of K 9107 by 11-13%.
Table 4.26: Long term analysis of temperature vs. yield with current year (Var. K 9107)
StagesTmax (oC) Optimum range (oC) (Yield >4t/ha)
20th Nov 5th Dec 20th DecVegetative 21.7 21.9 22.3 22.5 - 24.5
Boot-Anthesis 25.9 28.8 27.3 21 - 27.5Anthesis-Milk 27.4 26.8 29.4 23.5 - 29.5Milk-maturity 29.0 31.2 32.3 30 - 32.5
Tmin (oC)Vegetative 5.9 7.0 8.3 7- 8
Boot-Anthesis 11.9 14.8 15.8 7.5 - 11.5Anthesis-Milk 14.3 16.5 15.6 7 - 10.0Milk-maturity 15.9 17.8 19.2 11.5 - 13.5
Yield (t/ha) 5.4 4.7 3.8
SamastipurCultivars RW-3711, HD-2824 and HD-2733 were grown under five growing environments (sown on 15, 25 Nov, 5, 15 and 25 Dec 2014) to study the crop weather relationships. Effect of growing environment on grain yield and HUE was explored and the results are presented in table 4.27.
Table 4.27: Effect of seeding dates on growth, yield attributes and grain yield of wheat varieties.
Treatment Grain yield (q/ha) HUE (kg/ha oC)
Sowing dates
15.11 14 32.7 1.6
25.11.14 35.7 2.0
5.12 14 33.5 1.9

47
All India Coordinated Research Project on Agrometeorology
15.12 14 24.5 1.4
25.12.14 18.4 1.2
CD (P=0.05) 1.4 --
Varieties
RW3711 27.0 1.5
HD2824 28.5 1.6
HD2733 31.4 1.7
CD (P=0.05) 1.1 --
Crop sown on 25th November sown crop recorded significantly higher grain yield (35.7 q/ha) than earlier as well as later sown crop. The reduction in grain yield was recorded to the tune of 8.4 % in earlier sown crop on 15th November and 6.2, 31.4 and 48.5 % in later sown crop on 5, 15 and 25 December sown crop, respectively.
Grain yield also varied significantly among the varieties. Wheat variety, HD 2733 produced significantly higher grain yield (31.4 q/ha) than HD 2824 and 3711. Similarly, HD 2824 also significantly surpassed over RW 3711.
Crop sown on 25th November recorded maximum HUE than earlier as well as late sown crops. Hence, 25th November was found optimum seeding time for wheat under agro ecology conditions of North Bihar. Among the varieties, HD 2733 recoded highest HUE followed by HD 2824. Hence, this varietyis more suitable for this region.
UdaipurCultivars HI-1544 (V1), MP-1203 (V2), Raj-4037 (V3), Raj-4238 (V4) and HD-2967(V5) were grown under four growing environments [sown on 5 Nov (D1), 20 Nov (D2), 5 Dec (D3) and 20 Dec (D4) 2014]. Effect of mean temperature during critical growth stages of the crop on yield was assessed and the results are presented in fig. 4.5 a,b,c.

48
All India Coordinated Research Project on Agrometeorology
Fig. 4.5a: Effect of mean temperature during reproductive period on grain yield of wheat var Raj-4037 (mean of 8 years from 2007-08 to 2014-15)
Fig. 4.5b: Effect of mean temperature during reproductive period on grain yield of wheat var HI1544 (mean of5 years from 2010-11 to 2014-15)
Fig. 4.5c: Effect of mean temperature during reproductive period on grain yield of wheat var MP-1203 (mean of 5 years2010-11 to 2014-15)
Higher mean temperature of (16.4 to 17.9 ºC) during tillering to heading was observed under 5th December and 20th December sown crop in all varieties. Early sowing exposed the crop to mean temperature around 15 oC during this stage. However, large

49
All India Coordinated Research Project on Agrometeorology
variations in mean temperature during heading to milking stage and milking to dough stage was recorded in different sowings. It was also noted that the early sown crop (5th November and 20th November) experienced lower mean temperature as compared to delayed sowing i.e. 5th December and 20th December in all varieties. Similarly, first two dates of sowing also experienced lower mean temperature during milking to dough stage as compared to later sowing dates.
On the basis of pooled data for 4 years from 2011-12 to 2014-15, it was observed that the mean temperature of 15.2 to 18.2 0C and 19.6 to 20.5 0C during heading to milking stage and during milking to dough stage, respectively found conducive for getting higher grain yield of wheat variety Raj-4037. Data further revealed that later sown wheat (5th and 20th December) experienced higher mean temperature during milking to maturity and heading to maturity stage in all varieties as compared to early sown crop (5th and 20th November). Hence, period between heading to dough stage is more sensitive to higher mean temperature which resulted into reduction in grain yield when sowing were delayed in all varieties.
Raj-4037 gave higher grain yield when the mean temperature ranged from 18.1 to 19.6 °C during reproductive phase. Similarly variety HI-1544 and MP-1203 also performed better in terms of grain yield when the mean temperature during reproductive phase is ranged from 17.5 to 20.1°C and 18.9 to 20.8 °C, respectively.
ChickpeaAkolaHeat use efficiency, with respect to seed yield and biomass production (seed+straw) under different dates of sowing was estimated. Crop sown on 41 and 42 SMW showed maximum HUE in terms of seed (0.30 kg ha-1 °C day-1) In terms of biomass yield it was maximum (0.83 kg ha-1 °C day-1) under 42nd SMW (16 October) sowing followed by 41 and 40 SMW sowings. October 1st sowing (40 SMW) recorded minimum HUE in terms of seed yield (0.24 kg ha-1 °C day-1). Amongst the varieties, HUE with respect to seed yield (0.30 kg ha-1 °C day-1) was higher in JAKI-9218(V1) and for biomass production it was maximum with Vijay (0.80 kg ha-1 °C day-1). Chaffa 816 (V2) recorded the minimum HUE in terms of seed yield (0.26 kg ha-1 °C day-1) (table 4.28).
Table 4.28: Heat use efficiency of chickpea varieties in terms of seed and biomass production (kg ha-1 °C day-1) under different dates of sowing.
VarietiesSowing date
D1- 40 MW (02.10.14)
D2 - 41 MW (09.10.14)
D3 - 42 MW(16.10.14)
Mean
V1 - JAKI-9218 0.26 0.32 0.33 0.300.65 0.72 0.86 0.74

50
All India Coordinated Research Project on Agrometeorology
V2 – CHAFFA 816 0.22 0.26 0.29 0.260.71 0.74 0.75 0.73
V3 – VIJAY 0.23 0.31 0.29 0.280.73 0.79 0.87 0.80
Mean 0.24 0.30 0.300.69 0.75 0.83
FaizabadChickpea cultivars Radhey, Pusa-362 and Uday were grown under three growing environments (sown on 25 Oct, 4, 14 Nov 2014) to explore the crop weather relationship. Heat and radiation use efficiencies were worked out. RUE increased progressively till 90 days after sowing and thereafter gradually declined under different treatments. Chickpea sown on Oct 25th recorded highest RUE at all the stages followed by Nov 4th sown and lowest RUE was recorded in crop sown on Nov 14th.
Variation on RUE was noted for different varieties as given in table 4.29. Highest RUE was recorded for Radhey followed by Pusa 362 at all the stages of crop growth, while the lowest RUE was recorded in Uday.
Table 4.29: Radiation use efficiency (g/MJ) of chickpea as affected by various treatments
Days after sowing
Treatment 30 45 60 75 90 105 120 135Sowing datesOct. 25 1.2 1.17 1.26 1.27 1.64 1.55 1.48 1.33Nov. 4 0.95 1.15 1.17 1.25 1.52 1.47 1.37 1.25Nov. 14 0.90 1.10 1.11 1.21 1.47 1.35 1.35 1.21VarietiesRadhey 0.99 1.13 1.23 1.27 1.57 1.38 1.26 1.27Pusa 362 0.97 1.11 1.17 1.25 1.51 1.35 1.24 1.23Uday 0.95 1.07 1.14 1.21 1.43 1.32 1.25 1.21
JabalpurCultivars JGK-1, -3 (Kabuli type), JG-315, -11, -322, and -74 (Desi type) and JGG-1 (Gulabi type) were grown under three growing environments (sown on 14, 22 Nov and 10 Dec 2014) to study the effect of weather parameters on yield. Correlations were worked out between chickpea grain yield and weather parameters at different phenological stages using Pearson’s correlation coefficient with SPSS software and the results are presented in table 4.30.

51
All India Coordinated Research Project on Agrometeorology
Table 4.30: Pearson’s correlation coefficient between seed yield and weather parameters at different phenological stages in chickpea.
Phenolog-ical stages
Tmax Tmin Tmean GDD HTU PTU SSH RHm RHe Winds Eva RF RD
Branching .823** .770** .808** 0.193 .453* 0.174 .770** -.784** -.807** -.742** .804** -.811** -.811**
Flowering .711** -0.16 .573** 0.289 .516* 0.205 .740** -.587** -.750** -.772** .680** -.766** -.711**
Podding .754** 0.263 .698** .705** .698** .685** .650** -.757** -.755** -.605** .603** -0.362 -0.366
Maturity .754** 0.263 .698** .705** .698** .685** .650** -.757** -.755** -.605** .603** -0.362 -0.366
(**Correlation is significant at the 0.01 level {2-tailed})(*Correlation is significant at the 0.05 level {2-tailed})
Evaporation, sunshine hours, maximum temperature and mean temperature had a positive correlation with seed yield among all phenological stages in chickpea. On the other hand, wind speed, morning and evening relative humidities had negative correlation with grain yield at all the stages. Heavy and continuous rainfall during branching and flowering stages is not good for getting high seed yield. Intermittent rainfall with cloud free period would be congenial for better chickpea yield at Jabalpur.
SolapurCultivars Vijay (V1) and Dig Vijay (V2) were grown under four crop growing environments [sown on 38 SMW (S1), 40 (S2) , 42 (S3) and 44 (S4)] to study the crop weather relationship. Consumptive Use of Moisture (CUM) and Moisture Use Efficiency (MUE), as influenced by different growing environments were studied and the results are presented in table 4.31.
Table 4.31: CUM and MUE as influenced in chickpea (2010-11 to 2014-15)
Treatment CUM (mm) MUE (kg ha-1 mm) Treatment CUM(mm) MUE (kg ha-1 mm)
S1V1 282.6 5.82 S3V1 268.3 3.39
S1V2 288.4 6.94 S3V2 271.5 4.02
S2V1 274.3 4.46 S4V1 251.2 2.98
S2V2 277.1 4.68 S4V2 259.3 3.12
The average CUM (288.4 mm) was recorded higher by the S1 sown crop (MW 38) and MUE (6.94 kg ha-1 mm) was recorded higher by the S1 sown crop (MW 38). Among the varieties, Dig Vijay recorded highest average value of CUM and MUE. This might be due to more days required for Dig Vijay variety for growth and development.
The relationship of MUE, maximum and minimum temperature with pod yield in chickpea was also assessed (Fig. 4.6)

52
All India Coordinated Research Project on Agrometeorology
A B
C DFig. 4.6: Relationship of grain yield with (A) MUE (B) CUM (C) Tmax and (D) Tmin in Chickpea at Solapur
The CUM during total growth period of chickpea showed a polynomial relationship with grain yield. The CUM of 275 mm was found to be optimum for getting higher grain yield and thereafter there was decrease in yield. The correlation between MUE and chickpea yield showed a linear relationship. Tmax during total growth period of chick pea showed a polynomial relationship with grain yield. The yield decreased when Tmax increased above 31.8 °C. Tmin during total growth period of chickpea also showed a polynomial relationship with grain yield. A Tmin of 17.5 °C was found to be optimum for getting higher grain yield and thereafter there was a decline in chickpea yields.
MustardFaizabadThermal use efficiency (TUE) of three cultivars (Varuna, NDRS-2001 and NDR-8501) grown under three growing environments (sown on 30th Oct, 14, 29th Nov, 2014) were computed. The maximum TUE requirement from sowing to maturity was recorded (0.67) at growing in crop sown on 30th Oct. while minimum TUE from sowing to maturity (0.56) was observed in 29th Nov sown crop. Varieties showed marked influence on the TUEat all the phenophases. TUEranged from 0.53 to 0.67, across the varieties. Maximum seasonal TUE(0.67) were recorded in NDR-8501 while minimum seasonal TUEwas noticed in Varuna variety (0.53) from (table 4.32).

53
All India Coordinated Research Project on Agrometeorology
Table 4.32: Thermal use efficiency (g/m2/odays) of mustard as affected by growing environment and varieties.
TreatmentsThermal use efficiency (g/m-2/odays)
30 DAS 45 DAS 60 DAS 75 DAS 90 DAS 105 DAS At harvest Growing Environment30 Oct. 0.13 0.18 0.22 0.43 0.55 0.63 0.6714 Nov. 0.11 0.16 0.20 0.37 0.50 0.54 0.6029 Nov. 0.11 0.15 0.19 0.36 0.47 0.59 0.56VarietiesVaruna 0.12 0.16 0.21 0.40 0.52 0.56 0.62NDRS-2001-1 0.10 0.14 0.18 0.34 0.44 0.48 0.53NDR- 8501 0.13 0.18 0.22 0.43 0.56 0.60 0.67
HisarBrassica spp. cultivars Laxmi, RH-0749, Kranti, RH-406 and RH-30 were grown under three growing conditions (sown on 25th Oct, 5th & 15th Nov, 2014) to study the crop weather relationships. RUE (Table 4.33) and energy balance were worked out for different growth stages of the crop.
Table 4.33: Radiation use efficiency of Brassica cultivars at various phenophases under different growing environments during rabi 2014-15.
Date of sowing
Emergence 5th leafstage First flower
50% flower
Pod initiation
Seed development
PM
25 Oct 2.82 1.94 2.04 2.37 2.39 2.26 2.205 Nov 1.33 1.62 1.19 2.09 1.97 1.85 1.9815Nov 0.61 0.86 0.74 1.18 3.89 2.49 1.84Mean 1.59 1.47 1.32 1.88 2.75 2.20 2.01SD (±) 1.13 0.56 0.66 0.62 1.01 0.33 0.18CV (%) 0.71 0.38 0.50 0.33 0.37 0.15 0.09Laxmi 1.46 1.41 1.24 1.93 2.49 2.27 2.04RH0749 1.74 1.61 1.61 2.28 2.88 2.65 2.47Kranti 1.37 1.32 0.97 1.59 2.24 1.77 1.67RH0406 1.41 1.41 1.21 1.79 2.35 2.09 2.02RH30 1.40 1.37 1.27 1.68 2.38 1.98 1.90Mean 1.48 1.43 1.26 1.85 2.47 2.15 2.02SD (±) 0.15 0.11 0.23 0.27 0.25 0.33 0.29CV (%) 0.10 0.08 0.18 0.15 0.10 0.15 0.14
The proportion of intercepted PAR differed because of differential crop cover owing to variation in LAI and varying levels of biomass production in different treatments, implying that RUE also differed. Among varieties, RH 0749 recorded highest RUE

54
All India Coordinated Research Project on Agrometeorology
followed by Laxmi at all stages of crop growth. The highest RUE in the earlier sown crop was due to the maximum PAR absorption and dry matter production, both of which decreased subsequently with the delayed sowing.
A B C
Fig. 4.7: Energy balance components at (A) max LAI stage, (B) flowering and (C) pod formation stage in different mustard varieties during rabi 2014-15 at Hisar.
Diurnal observations of energy balance at maximum LAI stage, flowering and pod formation stage over mustard varieties viz., Kranti, RH-30, RH-406, RH 0749 and Laxmi were recorded in crops sown on 25th Oct together with observations over the bare field (Fig. 4.7). In general, around 25 to 85 per cent of Rn was used in cropped field as LE at different phenophases. Values of LE varied with the crop growth stages. The maximum values of LE were recorded at maximum leaf area index stage as compared to flowering and pod formation stage mainly due to variation in accumulation of biomass as well as LAI. Among the varieties, RH 0749 used higher fraction of LE in Rn as compared to other varieties.

55
All India Coordinated Research Project on Agrometeorology
PalampurThreshold temperatures during vegetative, reproductive and physiological maturity of gobi sarson to achieve various yield targets were worked out and the results are presented in table 4.34 .
Table 4.34: Optimum temperature for different phenophases in mustard
Temperature Vegetative phase Reproductive phase Maturity
Yield (>2 t/ha)
Maximum (oC) 20.3-24.4(22.4)
18.7-18.8(18.8)
28.1-29.3(28.7)
Minimum (oC) 7.3-9.3(8.3)
6.0-6.1(6.0)
14.2-15.0(14.6)
Yield (1– 2 t/ha)
Maximum (oC) 17.0 – 24.4(19.6)
15.8 – 21.2(18.2)
22.0 – 29.7(25.5)
Minimum (oC) 5.3 – 12.1(7.3)
5.3 – 10.8(7.8)
8.9 – 16.6(13.5)
Maximum (oC)2014-15
8.5-24.5(18.5)
10.5-24.0(17.5)
17.7-30.0(23.6)
Minimum (oC)2014-15
0.0-14.0(6.4)
3.5-13.4(7.8)
6.0-20.5(12.5)
Yield (<1 t/ha)
Maximum (oC) 18.9-20.9(19.9)
15.0-20.9(19.3)
22.8-24.8(23.6)
Minimum (oC) 7.0-8.1(7.4)
4.8-8.8(7.6)
10.9-12.5(11.6)
The maximum and minimum temperatures were within the limit of the temperature identified as optimum for 1-2 t/ha yield. The lower temperature during the vegetative phase seems to be the constraint for growth and development and consequently leads to lower productivity in the mid hills of Himachal Pradesh. Maximum temperature in the range of 20.3-24.4 °C and minimum temperature 7.3-9.3 °C at vegetative phase seems to be optimum for higher productivity in gobi sarson.
Green gramKovilpattiCultivar CO-6 was grown under three growing environments (sown on 24th Sept, 8th and 21st Oct) to study the crop weather relationships. Growing degree days required

56
All India Coordinated Research Project on Agrometeorology
and accumulated HTU were estimated during the crop growth. Among different sowing windows, pre monsoon sown crop (39th SMW) recorded higher AGDD. The higher GDD was registered in the pod development and vegetative phase of the crop (Fig. 4.8). The crop required 1387 AGDD for producing 850 kg of seed yield in green gram.
Fig. 4.8: Thermal requirment of greengram cv CO-6 for attaing different phenophases.
Rabi SorghumSolapurCultivars M-35-1, Mauli and Yeshoda were exposed to four growing environments [sown on 36 (S1), 38 (S2) , 40 (S3) and 42 SMW (S4)] to explore the crop weather relationship. Influence of different growing environments on CUM and MUE was studied and the results are presented in table 4.35. The analysis was done using pooled data of rabi 2010-11 to 2014-15.
Table 4.35: CUM and MUE as influenced by sowing time in rabi sorghum (2010-11 to 2014-15)
Sowing CUM (mm) MUE (kg ha-1 mm )
Time M 35-1 MAULI VASUDHA Mean M35-1 MAULI VASUDHA Mean
S1 363 334 374 357 3.22 2.97 1.98 2.72
S2 342 316 351 336 3.49 2.84 2.12 2.82
S3 318 296 327 314 3.94 3.11 2.36 3.14
S4 286 274 292 284 2.42 2.41 2.79 2.54
Mean 327 305 336 323 3.27 2.83 2.31 2.80

57
All India Coordinated Research Project on Agrometeorology
The mean CUM and MUE recorded was 336 mm and 2.80 kg ha-1mm respectively. The highest CUM was recorded by crop sown on 36 SMW (357 mm); however the highest MUE was recorded by 40 SMW sown crop (3.14 kg ha-1mm). This indicated that crop sown on 40 SMW utilized moisture more efficiently than other dates of sowing. Among the variety, Vasudha recorded maximum mean CUM 374 mm and highest MUE was recorded by M-35-1 variety i.e. 3.94 kg ha-1mm-1.
Step-wise multiple regression of various weather parameters with yield of rabi sorghum (2010-11 to 2014-15) was attempted and the results are presented in table 4.36. The relations proposed are based on seasonal average values. However, stage specific parameters are needed for better performance.
Table 4.36: Stepwise multiple regression of different weather parameters with yield of rabi Sorghum (2010-11 to 2014-15).
Sr. No. Weather parameter Regression coefficient R2
1 Intercept -27672.4 0.722 Maximum Temperature (Tmax) 717.93 Minimum Temperature (Tmin) -838.34 Relative Humidity (RH-1) 263.9
Tmax = Max. Temperature,Tmin= Min. Temperature, RH-1=Relative Humidity
The performance of the multiple regression yield prediction model was tested and is given in table 4.37
Yield= -27672.4 + (717.9×Tmax) + (-838.3×Tmin)+ (263.9×RH-1)
Table 4.37: Observed and predicted yield by using linear regression equation
Treatment Actual Yield Predicted Yield
Deviation/ Residuals
Standardized residual
Main treatment – Sowing time
S1 = MW 36 (Sept.03-09) 917.6 903.5 14.1 0.8
S2 = MW 38 (Sept.17-23) 1084.1 1154.6 -70.5 -0.9
S3 = MW 40 (Oct. 01-07) 1250.2 1225.7 24.6 1.0
S4 = MW 42 (Oct.15-21) 725.8 793.3 -67.5 -0.8
Sub treatment – variety
V1 = Maldandi 1153.6 1154.2 -0.6 -0.7
V2 = Mauli 931.9 878.3 53.6 1.1
V3 = Yashoda 897.6 890.3 7.3 -0.4(Standard Residual > 3 is outlayer)

58
All India Coordinated Research Project on Agrometeorology
Potato JorhatCultivars Kufri Jyoti, Kufri Pokhraj and Kufri Himawali were grown under three growing environments (sown on 22nd Nov, 6th and 23rd Dec, 2014). Tuber yield of potato was correlated with mean phasic meteorological parameters (Table 4.38). It could be noticed from the table that, the minimum temperature had relatively higher correlation with yield in all the crop stages .
Table 4.38: Correlation coefficient between tuber yield and mean meteorological parameters
Growth stages Tmax Tmin ET Mean RH Mean VP BSS EVPStolon formation 0.326 0.819 0.217 0.001 0.123 0.028 0.124tuber formation 0.428 0.846 0.534 0.017 0.011 0.053 0.121Tuber development 0.261 0.821 0.789 0.125 0.076 0.213 0.213Maturity 0.321 0.730 0.321 0.032 0.153 0.396 0.012
MohanpurThe surface energy balance component over potato field was determined using aerodynamic resistance method. Potato cultivars Jyoti, Chandramukhi and Surya were cultivated under three growing environments (sown on 17th Nov, 1 and 15th Dec, 2014). Data on temperature, humidity and wind speed at two different heights were collected at seven days interval covering different crop growth stages on diurnal basis. Simultaneously, soil heat flux, plant height and LAI were also measured. The diurnal and seasonal variations of constants related to momentum and flux transfer were studied along with sensible, soil and latent heat fluxes.
Fig. 4.10: Variation of energy balance components over potato field at Mohanpur

59
All India Coordinated Research Project on Agrometeorology
It has been observed that sensible heat flux varied between 1.87 W m-2 to 7.7 W m-2
on daily basis (Fig. 4.10). On the other hand, the variation of soil heat flux was not so large throughout the growing season. The latent energy was lower during initial crop growth stage and first leaf drying stage. During these two stages, irrigation was not given and the moisture condition of the field was reflacted in LE values. At 50% leaf senescence stage, the net radiation was higher (350 W m-2), hence relatively higher LE was observed at this stage although the field condition was dry. The estimation of latent energy flux thus help in scheduling irrigation to a crop like potato.

60
All India Coordinated Research Project on Agrometeorology
Crop growth models are being used widely to understand crop responses to environmental/nutrient/water stress. Yield estimation at site specific regional scales is also being attempted by several researchers. The applicability of exogenous crop growth models for Indian conditions has been studied at various locations and the results of those studies are reported hereunder:
Kharif 2014AkolaSoybeanCROPGRO-Soybean simulation model (DSSAT v 4.5) was evaluated with 3 years experimental data from 2011-2013 at Akola for three different varieties viz. JS-335, JS-9305 and TAMS 98-21 raised under four different environments. Input data for different soil physical constraints and chemical parameters for different properties were standardized.
Soil Physical constants:
Depth (cm) LL (cm3 cm-3) DUL (cm3 cm-3) SATW (cm3 cm-3) Bulk density (Mg cm-3)
5 0.232 0.391 0.498 1.34
10 0.244 0.397 0.504 1.35
15 0.244 0.397 0.504 1.35
30 0.247 0.408 0.514 1.37
60 0.247 0.408 0.514 1.37
90 0.226 0.368 0.440 1.36
Soil Chemical analysis:
Soil depth (cm) pH E.C. (dS m-1) Organic carbon (%)Available nutrients (kg ha-1)
N P2O5 K2O0-15 8.0 0.31 0.68 214.0 21.8 354.9
15-30 8.0 0.28 0.55 205.0 20.7 348.0
The genetic coefficients for Soybean varieties viz.JS-335, JS 9305 and TAMS 98-21 were estimated using the GLUE coefficient estimator embedded in the DSSAT v 4.5 model and calibrated to predict phenology, LAI, seed yield and straw yield accurately.
• The model predicted the seed yield reliably in JS-335 and TAMS-9821. Straw yield was overestimated to a greater degree in JS-335 and to a lesser degree in JS-9305 and TAMS 98-21.
5. Crop Growth Modelling

61
All India Coordinated Research Project on Agrometeorology
• Sensitivity analysis was carried out with CROPGRO-Soybean simulation model by environmental modification by upscaling and downscaling maximum temperature (± 1 to 5 °C), minimum temperature (± 1 to 5 °C) and concentration of carbon dioxide (+100, +200 and +300 ppm).
• The enhanced maximum and minimum temperatures gradually reduced the yield by 5.2 to 65.9% under 27 SMW sowing (D1). The magnitude of yield reduction was to a greater degree with delayed sowing (30 SMW) which recorded a reduction in yield from 8.4 to 86.3% with up scaling of temperatures from 1 °C to 5 °C. Reduced maximum and minimum temperatures gradually increased the yield from 4.3 to 7.8% across different sowings. The magnitude of yield reduction was to a lesser degree as compared to the increased temperature effects. CO2 concentration raised from 100 ppm to 300 ppm, over the base value (330 ppm) increased seed yield by 16.5 to 38.6% per cent under 27 SMW sowing. Similarly increase of yield from 12.8 to 30.4% was observed under 30 SMW sowing.
• Elevated CO2 concentration by 100 ppm coupled with elevated maximum temperature level by 1, 2 and 3 °C decreased the yield level from 3.2 to 28.4% under 1 °C, by 14.3 to 38.9% under 2 °C and from 22.6 to 50.8% under 3 °C.
AnandGroundnut Three years experimental data on phenology, yield and yield attributing characters for three groundnut cultivars viz. M-335, GG-20 and GG-5 were collected and PNUTGRO DSSAT model was calibrated and validated at Anand. Days to anthesis was under estimated by the model for cv. GG-20, while pod yield was over estimated for all the cultivars. Index of agreement varied from 0.55, 0.55 and 0.42 for cv. M-335, GG-20 and GG-5 respectively for pod yields. Further calibration of the model is required by collecting and incorporating more field information into the model.
CV. M-335 CV. GG-20
CV. GG-5
Fig. 5.1: Observed Vs simulated pod yield of groundnut cultivars at Anand

62
All India Coordinated Research Project on Agrometeorology
FaizabadRiceCrop data of rice variety Sarjoo-52 were collected for four years (2009-12) from Kumarganj under three environments. Soil profile data and weather data files were prepared. Gencalc module was used in DSSAT model and calibrated the genetic coefficients. DSSAT Rice model was calibrated for the phenology and yield. The genetic coefficients that were generated and the summarized results are tabulated below.
Genotype P1 P2R P5 P2O G1 G2 G3 G4Sarjoo-52 750 160 460 12.0 48.0 0.200 1.00 1.00
RMSE D-Index ObservationAnthesis 4.8 0.56 12Yield 1129.8 0.46 12maturity 5.0 0.52 12
Model has underpredicted days taken to anthesis. The RMSE and D-index values showed poor agreement with observed, may due to large variation in data collected under three varied environments. Further, refinement of model is needed by incorporating more inputs.
JorhatRiceData on sali rice variety Mahsuri were collected for five years (2010 to 2014) from the experimental fields of Jorhat center under three environments. Soil profile data and weather data files were prepared and incorporated for the respective years. Gencalc module was used in DSSAT model to generate genetic coefficients for the variety Mahsuri. DSSAT Rice model was calibrated for the phenology (anthesis and maturity) and yield. The genetic coefficients generated and the summarized results are tabulated below.
P1 P20 P2R P5 G1 G2 G3 G4763.1 314.9 150.7 10.6 35.4 .025 1 1
Variable Name Observed Simulated RMSE D-stat Anthesis day 122 122 3.416 0.918 Maturity Yield (Kg/ha) 3463 2830 1508.4 0.572 Maturity day 162 147 20.86 0.501
From the above tables it can be concluded that, there is a reasonably accurate in predicting the anthesis dates, but the maturity date and grain yields were under predicted. Thus calibration of the model needs further improvement by generating more information on soil and crop parameters.

63
All India Coordinated Research Project on Agrometeorology
LudhianaFuture climate change scenarios generated by PRECIS model were incorporated in the InfoCrop model. The scenario data consists of baseline weather data (1961-90), A1B scenario for middle (2020-2050) and future (2070-2100), A2 scenario for future (2070-2100) and B2 (2070-2100) future scenarios were used to simulate impacts on rice and maize crops.The results of the study are presented in tables.
RiceThe grain yield of rice is projected to decrease under A1B scenario for the period 2020-2050 from the baseline by 3.6 to 19.8% under maximum temperature change scenario, by 2.7 to 5.5% under minimum temperature change scenarios and by 8.0 to 26.0% under both maximum and minimum temperature change scenarios. However, for Nawanshahar rice yields for the period 2020-50 are projected to increase under maximum and minimum temperature and their interaction change scenarios.
For the period 2070-2100, grain yield of rice in Punjab under maximum temperature change scenarios is projected to decrease from baseline under A1B scenario at all locations except Nawanshahar; under A2 scenario at only Bathinda; and under B2 scenario at all locations except Nawanshahar. Under the minimum temperature change scenarios and the maximum X minimum temperature interaction change scenarios the grain yield of rice for the period 2070-2100 is projected to decrease from baseline at all the locations in Punjab state under A1B, A2 and B2 scenarios of climate change.
Table 5.1: Impact on grain yield of rice at different locations in Punjab under projected climate change scenarios using InfoCrop model.
Station2020-50 2070-2100
A1B A1B A2 B2Maximum Temperature changeLudhiana -3.6 to 2.3 -3.6 to-2.0 0.4 to 2.4 -0.7 to 0.2Amritsar -19.8 to -13.4 -8.3 to- 0.8 8.2 to 11.0 -0.5 to 0.0Bathinda -13.1 to -11.7 -15.3 to- 10.1 -6.9 to- 3.7 -0.5 to 0.0Nawanshahar 9.7 to 11.3 9.3 to 9.4 3.1 to 7.0 8.0 to 8.4Minimum Temperature changeLudhiana -5.0 to -4.7 -5.0 to -4.7 -4.1 to- 1.9 -2.9 to -2.3Amritsar -4.2 to-3.7 -4.0 to-3.7 -3.6 to -1.9 -1.6 to 1.4Bathinda -5.5 to- 4.8 -4.8 to -4.6 -5.9 to -1.2 0.8 to 1.0Nawanshahar -2.7 to- 2.4 -3.3 to- 2.4 -2.4 to- 1.5 -3.2 to -1.1Maximum X Minimum Temperature Interaction changeLudhiana -12.3 to- 8.0 -2.0 to 0.3 -15.7 to -12.2 -0.5 to 0.0

64
All India Coordinated Research Project on Agrometeorology
Amritsar -21.6 to-17.4 -3.4 to-2.6 -26.8 to- 23.6 -9.4 to 1.4Bathinda -26.0 to -23.7 -13.1 to 0.8 -39.1 to -25.4 -24.3 to 0.1Nawanshahar -12.0 to 7.8 -1.8 to 0.5 9.5 to 10.8 -3.8 to 0.5
MaizeGrain yield of maize is projected to decrease under A1B scenario for the period 2020-2050 from the baseline by 4.5 to 24.5% under maximum temperature change scenario, by 0.8 to 11.1% under minimum temperature change scenario and by 4.1 to 19.1% under both maximum and minimum temperature change scenarios. However, for Nawanshahar, maize yield for the period 2020-50 are projected to increase under maximum temperature change and maximum and minimum temperature interaction change scenarios.
For the period 2070-2100, grain yield of maize in Punjab under maximum temperature change scenarios is projected to decrease from baseline under A1B scenario at all locations; under A2 scenario at all locations except Nawanshahar; and under B2 scenarios at all locations except Amritsar and Nawanshahar. Under minimum temperature change scenarios and maximum X minimum temperature interaction change scenarios, grain yield of maize for the period 2070-2100 is projected to decrease from baseline in Punjab state at all the locations under A1B, A2 and B2 scenarios of climate change.
Table 5.2: Impact on grain yield of maize at different locations in Punjab under projected climate change scenarios using InfoCrop model
Station2020-50 2070-2100
A1B A1B A2 B2
Maximum Temperature change
Ludhiana -8.3 to -8.2 -8.3 to -6.5 -1.6 to 1.2 -8.1 to- 0.7
Amritsar -5.6 to- 4.5 -5.3 to- 1.0 -4.5 to- 4.0 0.0 to 3.7
Bathinda -24.5 to- 20.6 -14.5 to -14.0 -11.4 to -3.9 -5.2 to 0.0
Nawanshahar 9.5 to 15.9 -10.8 to 9.1 7.3 to 13.6 -0.6 to- 0.3
Minimum Temperature change
Ludhiana -11.1 to- 11.0 -11.1 to- 11.0 -11.2 to- 5.9 -4.4 to -3.8
Amritsar -8.1 to -7.9 -8.1 to- 8.0 -8.2 to- 8.1 -0.5 to 3.4
Bathinda -7.0 to- 1.9 -7.0 to- 1.9 -7.3 to- 1.8 -22.1 to- 0.7
Nawanshahar -8.4 to- 0.8 -1.8 to -0.8 -3.2 to -0.8 -1.9 to -1.1
Maximum X Minimum Temperature Interaction change

65
All India Coordinated Research Project on Agrometeorology
Ludhiana -8.3 to- 5.0 -4.2 to- 4.1 -8.1 to- 5.1 -8.6 to -7.3
Amritsar -5.6 to- 4.1 -3.6 to 0.9 -12.6 to -6.1 -6.1 to- 0.5
Bathinda -19.1 to- 14.5 -5.7 to- 0.5 -15.1 to -14.3 -7.0 to- 3.3Nawanshahar 0.3 to 7.5 -0.5 to 1.2 6.7 to 6.8 -1.6 to 1.4
MohanpurRiceDSSAT model was used to simulate the elevated temperature conditions and their impacts on the yield of wet season rice at Mohanpur. Three years (2010- 2012) experimental data of popular rice cultivar cv. IET 4786 (locally known as Shatabdi) transplanted in six different environments were collected on phenological characteristics, thermal time requirements for different phenophases, yield and yield attributes. This data set (along with soil, weather and crop management data) were used to develop the genetic coefficient of cv. IET 4786 and then DSSAT model was validated for Kalyani region of Nadia district. Two elevated thermal situation were considered as follows:
i) Increase of 1˚C temperature (both maximum and minimum temperature)
ii) Increase of 2˚C temperature (both maximum and minimum temperature)
The results showed that the R2 value between observed yield DSSAT predicted is 0.89, which is significant at 5% level. The RMSE value is also considerably low; which indicates that DSSAT could predict the yield of cv. IET 4786 reasonably well. However, the simulated maturity period is not well matched with the observed maturity period (Table 5.3).
Increase of 1°C temperature (both maximum and minimum temperature) resulted 5.69% yield decrease compared to the average yield of 2010-2012; while 2 °C temperature reduced the yield by 12.54% (Table 5.4). During the end of juvenile to grain filling stages of crop, the elevated temperature causes a decrease of LAI (Fig. 5.2). The maturity period is also reduced. This may be one of a reason for the yield reduction of the cultivar.
Table 5.3: Simulated and observed yield and maturity period of wet-season rice for different sowing dates
Treatments(DOT)
Yield (Kg ha-1) Maturity period (days)
Observed Simulated Observed Simulated
31.05.2010 4223 4301 98 97
22.06.2010 3908 4107 94 97
24.05.2011 4084 4156 101 101
23.06.2011 3943 4014 98 100

66
All India Coordinated Research Project on Agrometeorology
17.05.2012 4730 4372 102 99
01.06.2012 4209 4195 99 97
R2 Value 0.89* 0.57
RMSE 174.2 2.1*Significant at 5 % level
Table 5.4: Yield (in kg ha-1) variations under elevated thermal condition for different dates of transplanting
Treatments Observed Temperature
Observed Temperature +1oC
Observed Temperature +2oC
31.05.2010 4301 4084 386522.06.2010 4107 4053 346601.07.2010 4231 4001 366215.07.2010 4087 3896 361924.05.2011 4156 3869 377723.06.2011 4014 3855 366201.07.2011 4084 3614 364015.07.2011 4030 3893 362417.05.2012 4372 3990 345301.06.2012 4195 3890 364101.07.2012 4174 3955 347315.07.2012 3989 3811 3622Average 4145 3909.25 3625.33% change from NT -5.69 -12.54
Fig. 5.2: Changes in LAI at different crop growth stages under normal temperature and elevated thermal conditions

67
All India Coordinated Research Project on Agrometeorology
RaipurRiceCrop data viz phenology and grain yield of rice cv. MTU-1010 was collected from the field experiment. Profile soil data and weather data for the years 2007-2014 was collected and incorporated in to the model. DSSAT rice model was calibrated and genetic coefficients were evolved using Gencalc and iteration methods and presented in table 5.5. Further, observed versus simulated grain yield and phenology for MTU-1010 were presented in the table 5.6. There is good agreement between observed and simulated phenology but the model did not perform well in predicting maturity as well as yield.
Table 5.5: Genetic coefficients calculated cv. MTU-1010
P1 P2R P5 P2O G1 G2 G3 G4700.6 169.7 452.4 12.0 69.0 0.0260 1.00 1.00
Table 5.6: Observed versus simulated grain yield and phenology cv. MTU-1010
Phenophase and yield
Mean RMSE D-index Total number of obs.
Observed Simulated Ratio
Anthesis day 89 87 0.98 2.121 0.8 24
Maturity yield (kg ha-1)
3958 4122 1.06 585.4 0.69 24
Maturity day 117 119 1.01 2.141 0.76 24
RanchiRice CERES–rice model was calibrated with experimental data for three rice cultivars (Sahbhagi, Naveen and Swarna) planted on three different dates (8th June, 18th June and 28th June). Statistical comparison between observed and simulated data (Table 5.7) showed that model under estimated days taken to anthesis for Sahbhagi (-1%) and Swarna (-4.09%) with D-index values below 0.6. Performance of model for days to anthesis was good for Naveen with a D-index value of 0.77. Days to maturity was found under estimated by the model for Sahbhagi only (- 1.47%). Grain yield was estimated reasonably well by model for all the cultivars and D -index were always greater than 0.6. Naveen variety was satisfactorily calibrated with D-Index values above 0.7. But, for remaining varieties model needs further fine tuning for more accurate prediction.

68
All India Coordinated Research Project on Agrometeorology
Table 5.7: Statistical estimates for the comparison of observed and simulated parameters
Variable Name/Variety
Mean Std.Dev. R2 Mean Diff.
Mean Abs.Diff.
RMSE D-Index
Obs Sim Obs SimSAHBHAGIAnthesis (DAS) 100 99 1.24 0.47 0.03 0 1 1.29 0.49 Yield kg/ha 3394 3475 124.1 39.71 0.55 81 112 127.12 0.64Maturity (DAS) 136 134 3.55 2.86 0.72 -2 2 2.51 0.84NAVEENAnthesis (DAS) 104 104 3.85 1.41 0.95 0 2 2.51 0.77 Yield kg/ha 3850 3845 182.6 79.11 0.99 -5 96 103.73 0.84Maturity (DAS) 142 142 2.82 2.05 0.64 0 2 1.73 0.86SWARNAAnthesis (DAS) 122 117 0.94 1.24 0.89 -4 4 4.35 0.32 Yield kg/ha 3171 3154 182.0 204.08 0.20 -17 189 203.05 0.66Maturity (DAS) 158 158 1.7 4.11 0.63 0 3 2.94 0.71
ThrissurRiceThe experimental data of two rice varieties viz. Jyothi and Kanchana was collected and experimental files were prepared. Soil and weather data files were incorporated to the CERES-Rice model. Genetic coefficients were developed and presented in the table 5.8. Good agreement as reflected in D-index was obtained for Jyothi but model requires fine tuning in case of variety Kanchana (Table 5.9).
Table 5.8: Genetic coefficients developed for rice from the two year experiments (2013 and 2014)
Variety P1 P2R P5 P20 G1 G2 G3 G4
Jyothi 512.7 32.2 465.3 9.9 48.6 0.0270 1 1
Kanchana 460.7 155 458.5 12.3 51.5 0.0230 1 1
Table 5.9: Model performance during the years 2013 and 2014
Variety Jyothi KanchanaPhenology and Yield RMSE D-index RMSE D-indexAnthesis day 0.82 0.9 0.1 0.99Maturity day 1.15 0.82 0.8 0.7Yield kg ha-1 251.7 0.8 330.4 0.7

69
All India Coordinated Research Project on Agrometeorology
RabiLudhianaWheatFuture climate change scenarios generated by PRECIS model were incorporated in the InfoCrop model . The scenario data consists of baseline weather data (1961-90), A1B scenario for middle (2020-2050) and future (2070-2100), A2 scenario for future (2070-2100) and B2 for (2070-2100) future scenarios were used to simulate impacts on wheat crop. The results of the study are presented in table 5.10. The perusal of the results revealed that:
• The grain yield of wheat is projected to decrease under A1B scenario for the period 2020-2050 from the baseline by 7.8 to 11.8% under maximum temperature change scenario, by 1.8 to 8.4 % under minimum temperature change scenario and by 12.1 to 17.6% under both maximum and minimum temperature change scenarios.
For the period 2070-2100, the grain yield of wheat under maximum temperature change scenarios is projected to decrease from baseline by 5.8 to 10.4% under A1B scenario; by 1.6 to 8.7% under A2 scenario and by 0.1 to 1.0 under B2 scenarios. Under the minimum temperature change scenarios, the grain yield of wheat for the period 2070-2100 is projected to decrease from baseline by 1.8 to 8.4% under A1B scenario; by 1.4 to 7.5% under A2 scenario; and by 0.5 to 4.1 % under B2 scenarios. The grain yield of wheat for the period 2070-2100 under maximum and minimum temperature interaction change scenarios is projected to decrease from baseline by 0.5 to 7.2% under A1B scenario; by 13.6 to 22.8% under A2 scenario; and by 0.6 to 13.3% under B2 scenario.Table 5.10: Impact on grain yield of wheat at different locations in Punjab under
projected climate change scenarios using InfoCrop model
Station2020-50 2070-2100
A1B A1B A2 B2
Maximum temperature change
Ludhiana -9.3 to -7.8 -7.8 to -5.8 -2.1 to -1.6 -1.0 to -0.1
Amritsar -10.6 to -9.1 -9.0 to -6.3 -8.7 to -5.9 -1.3 to 0.0
Bathinda -10.7 to -8.8 -9.0 to -8.7 -4.4 to -1.9 -0.4 to 0.0
Nawanshahar -11.8 to -8.9 -10.4 to -6.5 -5.7 to -3.4 -0.3 to 1.2
Minimum temperature change
Ludhiana -2.0 to -1.8 -2.0 to -1.8 -2.5 to -1.4 -1.4 to -0.5

70
All India Coordinated Research Project on Agrometeorology
Amritsar -8.4 to -7.4 -8.4 to -7.4 -7.5 to -5.8 -4.1 to -4.0
Bathinda -4.6 to -4.5 -4.6 to -4.5 -5.6 to -3.7 -2.0 to -0.7
Nawanshahar -6.7 to -3.1 -3.2 to -3.1 -3.3 to -3.1 -2.0 to -0.7
Maximum X Minimum temperature Interaction change
Ludhiana -13.6 to -12.1 -3.0 to -0.5 -16.3to -13.6 -7.9 to -2.4
Amritsar -16.2 to -14.4 -6.2 to -2.7 -19.1 to -16.0 -12.6 to -4.1
Bathinda -15.2 to -14.5 -6.5 to -0.7 -21.0 to -19.2 -13.1 to -1.8
Nawanshahar -17.6 to -14.7 -7.2 to 0.3 -22.8 to -20.3 -13.3 to -0.6
RanchiWheatPerformance of three wheat cultivars (HUW 468, K9107and Birsa Gehu 3) simulated using CERES-wheat model were compared with five years experimental data (Rabi 2009-10 to 2013-14) sown under three dates of sowing and results are presented in the table. The model over estimated days taken to anthesis for all the three varieties viz. HUW 468, K9107 and Birsa Gehu 3. Days to maturity was under estimated by model with error ranging from -1 to -4% and with D-index value of above 0.79. The model simulated the grain yields satisfactorily with D-index values above 0.7 for all cultivars (Table 5.11).
Table 5.11: Simulated and observed values of wheat crop simulated by DSSAT model
Variable NameMean Std. Dev. Mean
Diff. Mean
Abs. Diff. RMSE d-Stat.Obs Sim Obs Sim
HUW 468Anthesis (DAS) 80 85 5.41 2.89 4 5 6.39 0.57Yield kg/ha 5027 4761 660.01 556.93 -266 494 577.41 0.75Maturity (DAS) 120 119 6.39 5.33 0 3 3.64 0.89K9107Anthesis (DAS) 84 89 5.36 3.39 5 5 6.21 0.64Yield kg/ha 4365 4343 569.14 471.05 -22 345 438.51 0.80Maturity (DAS) 123 118 7.04 5.47 -6 6 6.48 0.79BIRSA GENHU 3Anthesis (DAS) 81 88 5.63 3.39 7 7 8.60 0.53Yield kg/ha 5034 5823 746.85 681.19 789 789 856.78 0.72Maturity (DAS) 120 117 6.47 5.40 -3 4 4.28 0.87

71
All India Coordinated Research Project on Agrometeorology
RaipurWheatGenetic coefficients were standardized for wheat cv. Kanchan for DSSAT CERES – wheat model through calibration process using observed phenology and yield data from experiments conducted at Raipur by iteration technique.
Fig. 5.3: Calibration of CERES wheat model
The model was calibrated with two years data (2011-12 and 2012-13) and validated with 2013-14 data. The model predicted very well in case of days to maturity and grain yield. But, model could not predict well the days to anthesis (Fig. 5.3). However, when the model was validated with 2013-14 data, model could predict anthesis date with 54 % accuracy and maturity date with 96% accuracy (Fig. 5.4). It is inferred from the above that, further refinement of genetic coefficients is required to improve model’s performance in case of days to anthesis and grain yield.

72
All India Coordinated Research Project on Agrometeorology
Genetic Coefficients used for validation:
Variety P1 P2R P5 P20 G1 G2 G3 G4Kanchan 399.0 150.0 329.0 11.7 61.0 0.0027 1.0 1.0
Fig. 5.4: Validation of CERES wheat model with 2013-14 experimental data

73
All India Coordinated Research Project on Agrometeorology6. Effect of Weather on Pests and Diseases
Issue of forewarning on the incidence of various key pests and diseases in field/orchard crops has considerable economic importance in view of the cost involved in their management through chemical measures. Thus, development of forewarning models for various pests and diseases with sufficient accuracy and lead time is vital. The research efforts made at various centers to develop models for various pests and diseases are presented hereunder:
ChickpeaJabalpurWeather-insect-pest relationship between Helicoverpa armigera (Gram pod borer) and weather parameters in chickpea species planted at different sown dates was attempted. Larval population was collected at metre row length five times per plot. No pesticide was applied in the experiment. The previous crop was rice and the cropping system was rice-chickpea.
During rabi 2014-15 season, overall population of gram pod borer was fewer as compared to 2013-14. The population dynamics were collected from 49th SMW on plot two times in a week (Tuesday and Friday) in every plot. Data was averaged week wise and the numbers of larval population on chickpea plants along with weather parameters are presented in the given table 6.1. In the field, no incidence of gram pod borer till 9th week of 2015. After then, population started increasing in numbers with the increase in meteorological week numbers with maximum population attained at the time of harvesting among all the species planted.
Association between weather parameters and larval population in kabuli, desi, and gulabi species were correlated and presented in table 6.1.Table 6.1: Pearson’s correlation coefficient between Helicoverpa population and
weather parametersChickpea species
Larval population (Numbers/5m row length)
Tmax Tmim SSH Rainfall RHm RHEve Winds peed VapM VapE Eva Rainy days
Kabuli .715** .610** .257 -.200 -.858** -.434 .077 .560* .077 .751** -.244Gulabi .715** .610** .257 -.200 -.858** -.434 .077 .560* .077 .751** -.244Deshi .716** .613** .281 -.202 -.863** -.434 .055 .567* .096 .750** -.242
(* Correlation is significant at the 0.05 level (2-tailed). **. Correlation is significant at the 0.01 level {2-tailed})
Both maximum and minimum temperatures have a positive correlation with larval population among all species planted. Similar was the result with sunshine hours. However, rainy days, rainfall, morning and evening relative humidity had negative correlation with larval population. Both temperatures, morning relative humidity and evaporation had a significant relationship (P ≥0.01) at p=0.01 level indicating relationship with these parameters influencing larval population.
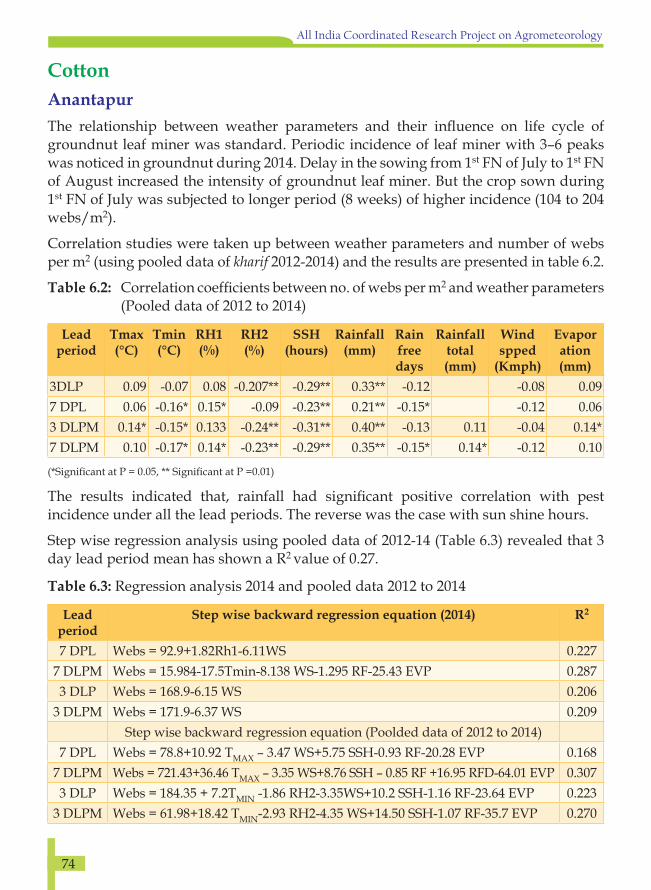
74
All India Coordinated Research Project on Agrometeorology
CottonAnantapurThe relationship between weather parameters and their influence on life cycle of groundnut leaf miner was standard. Periodic incidence of leaf miner with 3–6 peaks was noticed in groundnut during 2014. Delay in the sowing from 1st FN of July to 1st FN of August increased the intensity of groundnut leaf miner. But the crop sown during 1st FN of July was subjected to longer period (8 weeks) of higher incidence (104 to 204 webs/m2).
Correlation studies were taken up between weather parameters and number of webs per m2 (using pooled data of kharif 2012-2014) and the results are presented in table 6.2.
Table 6.2: Correlation coefficients between no. of webs per m2 and weather parameters (Pooled data of 2012 to 2014)
Lead period
Tmax (°C)
Tmin (°C)
RH1 (%)
RH2 (%)
SSH (hours)
Rainfall (mm)
Rain free days
Rainfall total (mm)
Wind spped
(Kmph)
Evaporation (mm)
3DLP 0.09 -0.07 0.08 -0.207** -0.29** 0.33** -0.12 -0.08 0.097 DPL 0.06 -0.16* 0.15* -0.09 -0.23** 0.21** -0.15* -0.12 0.063 DLPM 0.14* -0.15* 0.133 -0.24** -0.31** 0.40** -0.13 0.11 -0.04 0.14*7 DLPM 0.10 -0.17* 0.14* -0.23** -0.29** 0.35** -0.15* 0.14* -0.12 0.10
(*Significant at P = 0.05, ** Significant at P =0.01)
The results indicated that, rainfall had significant positive correlation with pest incidence under all the lead periods. The reverse was the case with sun shine hours.
Step wise regression analysis using pooled data of 2012-14 (Table 6.3) revealed that 3 day lead period mean has shown a R2 value of 0.27.
Table 6.3: Regression analysis 2014 and pooled data 2012 to 2014
Lead period
Step wise backward regression equation (2014) R2
7 DPL Webs = 92.9+1.82Rh1-6.11WS 0.2277 DLPM Webs = 15.984-17.5Tmin-8.138 WS-1.295 RF-25.43 EVP 0.2873 DLP Webs = 168.9-6.15 WS 0.206
3 DLPM Webs = 171.9-6.37 WS 0.209Step wise backward regression equation (Poolded data of 2012 to 2014)
7 DPL Webs = 78.8+10.92 TMAX – 3.47 WS+5.75 SSH-0.93 RF-20.28 EVP 0.1687 DLPM Webs = 721.43+36.46 TMAX – 3.35 WS+8.76 SSH – 0.85 RF +16.95 RFD-64.01 EVP 0.3073 DLP Webs = 184.35 + 7.2TMIN -1.86 RH2-3.35WS+10.2 SSH-1.16 RF-23.64 EVP 0.223
3 DLPM Webs = 61.98+18.42 TMIN-2.93 RH2-4.35 WS+14.50 SSH-1.07 RF-35.7 EVP 0.270

75
All India Coordinated Research Project on Agrometeorology
KovilpattiA field experiment was carried out to study the influence of weather variables on aphid damage in cotton (C.V. KC-3). The crop was sown on 25th Sept, 2014 and was maintained without any plant protection measures. The aphid damage was recorded by counting number of plants infested per plot to total number of plants in the same plot. It was found that minimum temperature alone has influenced the aphid damage. The pest damage was noticed during 42nd SMW. Later the incidence increased with time due a decline in minimum temperature (Fig. 6.1).
Fig. 6.1: Temporal variation in weather aphids damage and leaf hopper in cotton in relation to weather parameters
MustardAnandThe mean aphid index (0-5 scale) in mustard under different dates of sowing is presented in Fig. 6.2. The peak aphid intensity was observed at 4th SMW in all dates of sowing. Overall the aphid index was found higher under D4 followed by D3, D2 and D1 sowing.

76
All India Coordinated Research Project on Agrometeorology
Fig. 6.2: Mean aphid index (0-5 scale) of mustard under different dates of sowing at Anand
The aphid outbreak in mustard observed during 50% flowering phase. If favourable weather range (Tmax: 28 – 33 °C, Tmin: 9 – 15 °C and Tmean: 19 – 24 °C) prevailed during 50% flowering for 3 – 5 days and aphid outbreak was observed in the succeding week. For escaping high aphid infestation, 10th to 20th October sowing was found most suitable. After 20th October sowing, favourable weather prevailed for aphid infestation and closely coincided with 50% flowering which reduced the seed yield (table 6.4).
Favourable weather range for aphid infestation during flowering period
Sr. No. Weather parameter Range
1 T max 28 – 33 ° C
2 T min 9 – 15 ° C
3 T mean 19 – 24 ° C
4 T range 16 – 21 ° C
5 RH1 78 – 98 %
6 RH2 22 – 47 %
7 RHmean 50 – 67 %
Table 6.4: Correlation coefficient between peak aphid intensity and temperatureTemperature Tmax Tmin Tmean
Peak aphid intensity -0.566** -0.579** -0.566**

77
All India Coordinated Research Project on Agrometeorology
Pigeoan peaBangaloreEffect of different growing environments and different varieties on infestation of pod borer and fusarium wilt of Pigeoan pea was studied. Per cent pod borer damage and wilt damage noticed in the crop is given in table 6.5.
Table 6.5: Effect of date of sowing, varieties and spacing on per cent pod borer damage of redgram
VarietiesPod borer damage (%)
D-1 (5.6.204) D-2 (1.7.2014) D-3 (9.8.2014)S 1 S2 S3 Mean S 1 S2 S3 Mean S 1 S2 S3 mean
TTB-7 13.4 12.1 46.8 24.1 53.8 42.5 50.8 49.0 19.0 61.1 54.1 44.7BRG-1 4.6 17.5 12.8 11.6 7.5 37.7 26.9 24.0 17.9 18.8 35.0 23.9BRG-2 16.4 29.7 19.6 21.9 42.6 33.3 50.3 42.1 31.8 31.9 28.6 30.8Mean 11.5 19.7 26.4 19.2 34.6 37.8 42.7 38.4 22.9 37.2 39.2 33.1
It was noticed that the incidence of pod borer was highest crop sown in second date (38.4%) and third sown crop (33.1%) compare to first sown crop (19.2%) and the result is shown in table-6.5.
The incidence of fusarium wilt disease at different dates of sowing, varieties and spacing of redgram is presented in table 6.6. It was observed that the incidence of wilt was highest in second sown crop (19.6%) and first sown crop (14.9%) as compared to third sown crop (9.9%).
Table 6.6: Effect of date of sowing, varieties and spacing on per cent Fusarium Wilt disease in redgram (per cent/plant)
Varieties D1 (5.6.204) D2 (1.7.2014) D3 (9.8.2014)S 1 S2 S3 Mean S 1 S2 S3 Mean S 1 S2 S3 Mean
TTB-7 12.5 25.9 15.7 18.0 12.7 13.2 11.2 12.4 1.3 3.2 10.3 4.9BRG-1 10.9 17.4 14.6 14.3 9.2 15.4 37.5 20.7 2.1 17.6 10.3 10.0BRG-2 11.1 11.4 14.3 12.3 12.8 15.8 48.8 25.8 2.9 22.2 19.1 14.7Mean 11.5 18.3 14.9 14.9 11.6 14.8 32.5 19.6 2.1 14.3 13.2 9.9
Rice
RaipurThe insect population collected through light trap was used to study the pest weather relationship in rice crop during kharif 2014. Weekly mean rainfall, maximum and minimum temperature were plotted against number of different insects trapped and the results are presented in fig. 6.3.

78
All India Coordinated Research Project on Agrometeorology
Fig. 6.3: Relationship between weekly Tmax, Tmin, rainfall and insects traped during kharif 2014 in rice at Raipur
(GLH-Green Leaf Hopper; YSB-Yellow Stem Borer; BPH-Brown Plant Hopper)
Dry spells and associated increase in maximum tempertaure generally favoured outbreak of yellow stem borer attack in rice.
ThrissurLeaf roller and leaf blight are the most important pest and disease of rice in Kerala during kharif season. Correlation studies between weather parameters one or two weeks prior to infestation and insect catch was studied and the results are presented in table 6.7.
Table 6.7: Correlation coefficients of leaf blight and leaf roller with weather elements
ParametersLeaf blight Leaf roller
1 weekBefore attack
2 weeks before attack
1 weekbefore attack
2 weeks before attack
Minimum temperature -0.162 0.205 0.13 0.116Maximum temperature -0.295 -.461* -.395** -.463**
RH1(morning) -.387* -0.268 -0.299* -0.27RH2(evening) -0.292 -0.208 -0.278 -0.203
Sunshine hours 0.216 -0.116 -0.072 -0.166Rainfall -0.199 -0.088 -0.04 -0.028
From the table, it is clear that maximum temperature two weeks prior to appearance of symptoms showed significant positive correlation for leaf blight. For leaf roller, Tmax of both weeks showed significant positive correlation. Morning RH of one week prior to appearance of symptoms is the only other weather parameter which showed significant positive correlation for both leaf blight and leaf roller.

79
All India Coordinated Research Project on Agrometeorology
I. Minimum temperature trends over India and productivity of kharif paddyAgricultural productivity in a country is dependent on number of biophysical and socio-economic factors. Among the biophysical factors, weather has a predominant role. Apart from rainfall, the role played by temperature on agricultural production on a regional basis is gaining. We have analyzed the changes in minimum temperature considering the agricultural seasons practiced in most parts of the country at a micro level i.e., district. In India, kharif (June-October) and rabi (October-March) the changes in minimum temperature over 1971 to 2009 at district level in 599 districts of India to assess its implications on future paddy yields in different agro-climatic regions of the country.
Data and MethodologyMonthly surface minimum temperature data for 0.5° grid size of Climate Research Unit (CRU), University of East Anglia, UK for the period 1971-2009 we used. Average temperature for each district was computed from grids falling within that district. Influential area of a grid was computed using Thiessen polygon method in a GIS environment. Area of different polygons falling in a district was derived in GIS environment. Monthly minimum temperature of a district was computed by using weighted average temperature, with weights proportional to area of polygons falling in a district. Minimum temperature data at district level were segregated into means for annual, Kharif (June to October), Rabi (October to March) periods. To detect warming in recent times, data were segregated into three time periods viz., 1980-89, 1990-99 and 2000-2009 and then means of annual, kharif and rabi seasons were worked out. Relative change in temperature (°C) in the most recent period compared to the previous two periods was worked as the difference in temperatures between two periods. Mann-Kendall’s test was used to detect any trend in the temperatures for each district. The significance in the trend is detected by two tailed test at probability levels of 0.1, 0.05 and 0.01. A district with significant increasing trend in minimum temperature was classified as slightly warm, moderately warm and strongly warm based on significance at probability levels of 0.1, 0.05 and 0.01, respectively and placed in respective clusters. Temperature values of different districts in each cluster were aggregated to arrive at the mean value of that cluster or region. Further, significance of the deviations in means of different sub periods from the long-term average was examined using Student’s t test. The magnitude of changes in minimum temperatures for different time periods were determined from the slope value of a simple least square regression line with time as the independent variable.
We used historical paddy statistics to assess the association between kharif paddy yields and minimum temperature variations over India. Data on district-wise kharif
7. Research Accomplishments of Co-ordinating Unit

80
All India Coordinated Research Project on Agrometeorology
paddy yields for the period 1971-2009 were sourced from Center for Monitoring Indian Economy. Since continuous yield data was not available for all districts, 355 districts for which a minimum of 12 years continuous data was available were considered. Time series yield data may feature strong trends that mask seasonal fluctuations likely to be associated with year on year variations in climate. We used a fourth-degree polynomial to de-trend the district level paddy yields. Paddy is planted from May to August and harvested between October to December and the planting time differs from region to region. The information on the region specific growing season was obtained from Rice Knowledge Management Portal. The growing season minimum temperatures were worked out for different districts by averaging the monthly temperatures. Correlations were worked out between the changes in district-wise seasonal minimum temperatures and the de-trended kharif paddy yields. Further, correlations were determined between monthly minimum temperatures and paddy yields to detect the most sensitive period to a change in minimum temperature in the crop’s life cycle.
Our study showed that annual minimum temperatures are increasing over most parts of India @ 0.24°C 10 yr-1. Large area (52.7% in kharif, 54.9% in rabi) showed strong and significant warming trend. Minimum temperatures during the kharif season showed strong warming trend in southern states, Gujarat, Himachal Pradesh, Indo-Gangetic Plains (IGP), northeastern region, and most parts of the Jammu & Kashmir. Minimum temperatures during rabi season showed strong warming over IGP, West Bengal, Northeastern states, Chhattisgarh, Rajasthan, Gujarat and eastern parts of Madhya Pradesh The magnitude of rise in seasonal mean temperatures is more during rabi (0.28°C 10 yr-1) compared to kharif (0.19°C 10 yr-1).
a) kharif b) annual c) Rabi Fig. 1 a to c: Trends in minimum temperature over India (1971-2009) on (a) annual and during (b)
kharif (c) rabi seasons.

81
All India Coordinated Research Project on Agrometeorology
Fig. 2- Correlation between district-level seasonal minimum temperatures and kharif paddy yields.
Association between minimum temperature and kharif paddy yieldsKharif paddy yields in 268 districts across the country (57.2% of paddy growing area) were influenced by a rise in minimum temperature. The average rate of decline in paddy yields has been estimated to be 859 kg ha-1 in strongly warm region and 411 kg ha-1 in the weakly warm regions per 1 oC rise in minimum temperature. Large geographical area during rabi showed a statistically significant strong warming trend and the warming was more severe during the recent decade (2000-2009). It gives a signal that minimum temperature during rabi may rise faster than on annual basis in near future. Warming during rabi season has serious implications for production of rabi crops like wheat, mustard and chickpea in the Indo-Gangetic plains. Influence of warming on district level paddy yields clearly exhibited the sensitivity of paddy yields to temperature rise across the country.
II. Sensitivity of wheat yields to temperature in IndiaWheat is the most important food crop of India during the post-rainy i.e., rabi (November–March) season grown over 30 million ha (58% of the net cropped area during rabi) with a production of 94 million tons and contributing about 43% to the country’s granary. With 91.3% of its area under assured irrigation in more than 200 districts that are largely (93.5%) confined to states like Uttar Pradesh, Madhya Pradesh, Punjab, Haryana, Rajasthan, Bihar, Maharashtra & Gujarat and wheat productivity had a quantum jump from 770 kg ha−1in 1950–1951 to 3140 kg ha in 2011–2012. We have examined the spatial variability and trends in temperature (maximum temperature (Tx), minimum temperature (Tn) and diurnal temperature range (Tr)) over major wheat growing districts in India. The correlation between wheat yield and temperature at the district level was analyzed.

82
All India Coordinated Research Project on Agrometeorology
An attempt was also made to detect the optimum and critical ranges in temperature variables during the sensitive crop growth stages which may ultimately help the planners and breeders to evolve suitable strategies. The response of wheat to the magnitude and duration of temperature extremes were also analyzed.
Data and methodologyMonthly surface temperature data of the Climate Research Unit (CRU), University of East Anglia, UK were sourced for 0.5 °C grid sizes for the period 1970-2012. Daily temperature data were sourced from NDC, IMD which is available at 1° resolution. Area weighted temperature for each wheat growing district was computed considering the number of grids falling in that district. Influential area of a grid was computed using the Thiessen polygon method in a GIS environment. Area of different polygons falling in a district was derived in GIS environment. Tx, Tn and Tr of a district was computed by using a weighted average of temperature, with weights proportional to area of polygons falling in a district. Later these data at district level were segregated into means for individual months for the period November to March, and as a seasonal mean for November to March. To detect warming in the wheat growing areas in the three temperature variables, Mann-Kendall’s test, was used to detect any trend in the temperatures for each wheat growing district. The significance in the trend was detected by two tailed test at different probability levels (0.1, 0.05 and 0.01). Each district was classified as slightly warm, moderately warm and strongly warm based on the level of significance i.e., 0.1, 0.05 and 0.01, respectively, and placed in respective clusters. Values of temperature variables of different districts in each cluster were aggregated to arrive at the mean value of that cluster or region. Data on district-wise wheat yields for the period 1980-2011 were sourced from Center for Monitoring Indian Economy.
The information on the region specific growing season for wheat was obtained from http://farmer.gov.in/cropstaticswheat.html. Across the regions, wheat season starts from November 1st fortnight (normal sown) to December 1st fortnight (late sown). Growing season ends by March 2nd fortnight (normal sown) to April 1st fortnight (late sown). We considered November to March as the average growing season (sowing to maturity) for wheat for our analysis domain. Then, the growing season temperatures were worked out for different districts by averaging the monthly temperatures for the period 1980-2011 matching with crop yields’ datum. Pearson’s correlations were calculated for the detrended yield and temperature variables. Districts were segregated into respective clusters based on the level of significance (0.05%, one-tailed) test for correlation. Further, correlations were done between monthly temperatures and wheat yields to detect the most sensitive period to a change in temperature variables in the crop’s life cycle. Later we performed multiple linear regressions with ‘first differences in yield’ as the response variable, and the ‘first differences of temperature variables’ as predictor variables to determine the relative change in yield with a change in temperature variables in those clusters which are statistically significant.

83
All India Coordinated Research Project on Agrometeorology
Temperature changes in wheat growing regionsOur study reveals in large wheat growing areas in India, nighttime warming is occurring at a faster rate than daytime warming. Over large wheat growing areas of India, a rise in minimum temperature (Tn) is occurring at a faster rate (@ 0.32 oC 10yr-1) than maximum temperature (Tx) (@ 0.28 °C 10yr-1). During February, coinciding with post-anthesis period of wheat, about 79.4 % area showed significant warming in Tn (@0.37 oC 10yr-1) for 1970-2012 period. Indian wheat yields were observed to be prone to continual heat stress and especially to short-term temperature extremes. Wheat yields appear to be becoming more sensitive to Tn, especially during post-anthesis period. Mean wheat yields for the period 1980-2011 declined by 7% (204 kg ha-1) for a 1 oC rise in Tn. Exposure to continual Tn exceeding 12 oC for 6 days and terminal heat stress with Tx exceeding 34 oC for 7 days during post-anthesis period are the other thermal constraints in achieving high productivity. Improved understanding from this study on the role of Tn during post-anthesis period using historical yield-temperature relationships may reduce the uncertainties in anthropogenic climate change projections further. There is a need to consider inclusion of early maturing, high yielding and heat tolerant wheat lines in the breeding program for Indian conditions. We believe that hermally sensitive areas evolved from this investigations may guide the researchers to identify such wheat lines for their adaptability in to future climates.
Fig. : Correlation between district wheat yields and (a) Seasonal (November-March) Tx;(b) February Tx; (c) Seasonal Tn; (d) February Tn; (e) Seasonal Tr; (f) February Tr (Un-shaded areas without district
boundaries are not considered) (Shaded areas indicate either positive or negative association and un-shaded with district boundaries indicate non-significant association)

84
All India Coordinated Research Project on Agrometeorology
Tabl
e : W
heat
gro
win
g ar
ea (%
) tha
t exh
ibite
d ne
gativ
e as
soci
atio
n w
ith T
n an
d T x o
f var
ying
deg
rees
Nat
ure
of a
ssoc
iatio
nT n (
°C) e
xcee
ding
T x (°C
) exc
eedi
ng
67
89
1011
1213
1415
1630
3132
3334
3536
Sign
ifica
ntly
neg
ativ
e2.
83.
37.
19
8.2
14.2
15.6
13.6
12.8
13.1
9.8
7.1
85.
75
8.1
5.5
4.3
Neg
ativ
e bu
t non
-sig
-ni
fican
t30
.228
.542
.648
.952
.444
.848
.545
.645
.646
.850
46.4
41.9
4447
.447
.735
.127
Neg
ativ
e (S
igni
fican
t +
Non
-sig
nific
ant)
3331
.849
.757
.960
.659
64.1
59.2
58.4
59.9
59.8
53.5
49.9
49.7
52.4
55.8
40.6
31.3
Tabl
e: W
heat
gro
win
g ar
ea (%
) tha
t exh
ibite
d ne
gativ
e as
soci
atio
n w
ith co
ntin
ual e
xpos
ure
to T
n > 1
2 °C
and
Tx >
34
°C
Nat
ure
of a
ssoc
iatio
nN
umbe
r of d
ays
T n > 1
2 °C
Num
ber o
f day
s T x
> 34
°C
23
45
67
81
23
45
67
89
10
Sign
ifica
ntly
neg
ativ
e8.
510
.59.
89.
711
.88.
66.
75.
95.
55.
13.
75.
45.
48.
92.
31.
90.
4
Neg
ativ
e bu
t non
-sig
nif-
ican
t50
.845
.146
.140
.144
.938
.442
.143
.439
.630
.429
.628
.926
.829
.317
.611
.61.
7
Neg
ativ
e (S
igni
fican
t +
Non
-sig
nific
ant)
15.3
55.6
55.9
49.8
56.7
4748
.849
.345
.135
.533
.334
.332
.237
.219
.913
.52.
1

85
All India Coordinated Research Project on Agrometeorology
III. Weather indices for wheat and groundnut crops Weather indices viz. triggers and exit for wheat and groundnut based on data collected at some research centres as well as major wheat and groundnut growing districts were worked out by analyzing their long-term yield data in relation to phenophase-wise weather conditions. These indices are useful in for designing district level weather insurance products for wheat and groundnut.
WheatTemperature thresholds at KanpurCritical phenological stages for heat stress, the impact of heat stress during these stages and temperature thresholds for obtaining above average, average and below average yield of wheat at Kanpur centre was worked out. Eleven years experimental data for three cultivars (HD-2285, K-8804 and K-9107) under three sowing dates at the Kanpur Centre located in the Indo-Gangetic Plains of Uttar Pradesh were used. In order to understand the relationship between yield and phenological stage-wise temperature, both simple linear regression models and second degree polynomial models were used. Among the eight phenological stages, the milk stage was identified as most sensitive for high maximum and minimum temperatures to adversely affect yield (Table 1). The rate of yield reduction with unit increase in maximum and minimum temperatures (°C) was found to be highest in K-8804 and lowest in HD-2285. The optimum ranges of maximum temperature during anthesis, milk, dough and maturity stages are 19.7-21.9, 24.2-26.5, 26.1-28.8 and 29.5-30.8 °C, respectively and those for minimum temperature are 4.3-6.2, 8.3-9.7, 11.5-12.4 and 13.0-15.1 °C, respectively. The thresholds of temperature during critical stages and quantification of heat stress on yield will be of use in devising weather-index-based crop insurance products in wheat.
Table 1. Temperatures (°C) during different phenological stages of three wheat cultivars for obtaining three different categories of yield
Yield category Emergence CRI Tillering Jointing Anthesis Milk Dough Maturity Yield(kg/ha)
HD-2285 Maximum temperature (°C)Above average 30.1 32.0 - - 19.7 24.2 26.1 30.8 5143Average 23.8 22.0 - - 25.1 28.8 31.3 34.4 4522Below average 17.6 11.9 - - 30.5 33.4 35.6 38.3 3901
HD-2285 Minimum temperature (°C)Above average - - - 4.4 4.3 9.7 11.5 13.0 5143Average - - - 8.0 10.2 13.1 15.2 17.4 4522Below average - - - 11.7 14.7 17.2 19.0 21.5 3901
K-8804 Maximum temperature (°C)Above average 29.0 27.9 18.5 16.2 21.5 25.6 27.9 30.3 4820Average 23.8 22.2 21.4 22.6 25.9 29.5 32.4 35.4 4124Below average 18.6 16.5 25.8 28.4 30.3 33.3 36.9 40.5 3428

86
All India Coordinated Research Project on Agrometeorology
Yield category Emergence CRI Tillering Jointing Anthesis Milk Dough Maturity Yield(kg/ha)
K-8804 Minimum temperature (°C)Above average - - 5.2 4.3 6.1 8.3 11.9 13.8 4820Average - - 8.2 9.1 10.7 14.5 16.4 18.4 4124Below average - - 10.3 12.0 15.4 17.4 19.3 23.1 3428
K-9107 Maximum temperature (°C)Above average 27.5 28.4 - 14.8 21.9 26.5 28.8 29.5 4313Average 24.8 22.2 - 23.2 26.3 30.2 33.1 36.0 3759Below average 18.1 16.1 - 31.7 30.7 34.0 37.5 42.4 3204
K-9107 Minimum temperature (°C)Above average 14.0 12.1 - 2.0 6.2 9.0 12.4 15.1 4313Average 8.1 6.9 - 8.3 11.1 14.8 16.6 18.2 3759Below average 2.2 1.7 - 14.6 16.0 17.8 20.7 23.8 3204
Weather indices for wheat in Haryana and Uttar PradeshWeather indices in wheat were developed for three districts i.e. Hisar, Karnal and Sirsa of Haryana and five districts of Uttar Pradesh viz. Faizabad, Jhansi, Kanpur, Lucknow and Varanasi (Table 2). Maximum or minimum temperature required for above average, average and below average yields were named as trigger 1, trigger 2 and exit, respectively. In Haryana, for trigger 1 maximum temperature at same critical stage (Anthesis to Dough stage) varied from 26.0 to 27.0 °C and minimum temperature varied from 9.8 to 11.3 °C, across districts Sirsa and Hisar. However, for exit both maximum and minimum temperatures varied from 27.9 to 30.1 °C and 11.3 to 14.3 °C, respectively across these districts. In Uttar Pradesh, in four out of the five districts, milk to dough stage was identified as the critical stage for temperature and for trigger 1 and exit, maximum temperature varied from 25.3 to 26.4 °C and 27.1 to 28.2 °C, respectively across the four districts. However, variation in minimum temperature for trigger 1 and exit across the districts was higher and it is 8.4 to 11.1 °C for trigger 1 and 11.1 to 13.9 °C for exit.

87
All India Coordinated Research Project on Agrometeorology
Table 2. Weather indices for major wheat growing districts of Haryana and Uttar Pradesh State
District
Critical stage
MXT (°C) MNT (°C)
Trigger 1 Trigger 2 Exit Trigger 1 Trigger 2 ExitHaryana Hisar Anthesis to dough 27.0 27.5 30.1 9.8 10.5 11.3
Karnal Ear emergence to anthesis 20.7 21.9 22.4 6.8 8.9 9.8Sirsa Anthesis to dough 26.0 27.2 27.9 11.3 11.5 14.3
Uttar Pradesh
Faizabad Milk to dough 25.8 26.5 27.1 8.4 10.4 11.1Jhansi Anthesis to milk 23.4 25.0 26.0 7.1 7.4 8.9Kanpur Milk to dough 25.3 25.4 27.6 9.6 11.1 12.4Lucknow Milk to dough 25.5 26.3 28.2 9.1 11.1 12.5Varanasi Milk to dough 26.4 26.5 27.5 11.1 12.1 13.9
Groundnut Weather indices for research stationsWeather indices required for designing weather insurance products for groundnut were developed by analyzing long-term yield and weather conditions at three locations viz., Bangalore, Anand and Ludhiana.
At Bangalore, higher rainfall during pod initiation to pod filling in DH 3-30 and Robut 33-1 and during pod initiation to pod formation in TMV-2, JL-24 and K-134 was identified to be favourable for achieving higher pod yield in respective varieties (Table 3). Rainfall less than 119, 109, 156, 138 and 122 mm during this critical stage resulted in lesser than optimum yield in these varieties. At Anand, rainfall during first seed to harvest was found to be critical for obtaining higher yield and rainfall lesser than 319, 469 and 174 mm during first seed to harvest stage of varieties Robut 33-1, GG-2 and Gaug-10, respectively resulted in below optimum yield. At Ludhiana, in M-13 variety, 334 mm rainfall during complete emergence to 50% flowering was found to be critical for higher pod yield and any decrease in rainfall during this stage resulted in below optimum pod yield.
Table 3. Rainfall during critical phenological stages of different groundnut varieties for obtaining three different categories of yield at Bangalore, Anand and Ludhiana
Centre Variety Critical stage Rainfall (mm) Trigger 1 Trigger 2 Exit
Bangalore
DH 3-30 Pod initiation to pod filling 118.7 82.4 65.8Robut 33-1 Pod initiation to pod filling 108.7 71.0 10.7TMV-2 Pod initiation to pod formation 155.7 85.0 40.3JL-24 Pod initiation to pod formation 138.4 111.6 36.3K-134 Pod initiation to pod formation 122.3 102.4 50.8
AnandRobut 33-1 First seed to harvest 318.8 254.9 43.7GG-2 First seed to harvest 469 341.8 28.9Gaug-10 First seed to harvest 174.3 86.9 6.9
Ludhiana M-13 Complete emergence to 50% flowering 333.6 165.4 58.1

88
All India Coordinated Research Project on Agrometeorology
Another index named water requirement satisfaction index (WRSI) derived from FAO water balance model was used for identifying its limits for obtaining above average, average and below average yield in different varieties at Bangalore, Anand and Ludhiana. The relation between water requirement satisfaction index (WRSI) and yield in respect of different varieties at three locations revealed that the WRSI required for optimum pod yield ranged from 64.7 to 93.3 per cent across different crop varieties and centres (Fig 1). Yield is showing an highly significant positive relationship with WRSI and yield increases by 32 kg/ha for one per cent increase in WRSI. Decline in pod yield with respect to the number of dry spells of different durations(another index) was also studied in different varieties at all the three centres (Table 4). At Bangalore (cv. DH 3-30) and Anand (cv. Robut 33-1) two dry spells of more than 15 and 20 days, respectively caused nearly 70 per cent reduction in pod yield compared to no dry spell. At Ludhiana, M-13 variety can tolerate one spell of 15 dry days but yield was reduced by 90% with four such dry spells.
Table 4. Thresholds of dry spells affecting yield of groundnut varieties DH 3-30 at Bangalore, Robut 33-1 at Anand and M-13 at Ludhiana
Centre Variety Dry spells Yield reduction (%)Duration Number
Bangalore DH 3-30 ≥ 15 days0 -1 382 67
Anand Robut 33-1 ≥ 20 days0 -1 372 69
Ludhiana M-13 ≥ 15 days1 -2 464 89
Fig. 1 Relation between WRSI and yield of different cultivars

89
All India Coordinated Research Project on Agrometeorology
Weather indices for groundnut growing districtsRainfall indices in groundnut were formulated for three districts viz. Bangalore (rural), Dharwad and Bijapur of Karnataka and eight districts viz. Junagadh, Jamnagar, Rajkot, Amreli, Bhavnagar, Kutch, Sabarkanta and Banaskanta of Gujarat (Table 5). In Karnataka, critical stage for rainfall differed from district to district and as a result rainfall and rainy days for trigger 1, trigger 2 and exit differed among districts. In Gujarat, first peg to first pod was identified as the critical stage for rainfall in Rajkot, Amreli and Bhavnagar districts and rainfall in this common critical stage varied from 145 to 240, 40 to 64 and 13 to 29 mm, respectively for trigger 1, trigger 2 and exit across the three districts. At Banaskanta and Sabarkanta, 50% flowering to first peg was the critical stage and rainfall varied from 114 to 231, 78 to 110 and 1 to 17 mm for trigger 1, trigger 2 and exit, respectively at these two districts.
Table 5. Rainfall and rainy days based indices for groundnut in major groundnut growing districts of Karnataka and Gujarat
State / District Critical stageRainfall (mm)
Trigger 1 Trigger 2 ExitKarnataka Bangalore (rural) 50% Flowering to pod initiation 152 (7) 125(6) 60 (4)Dharwad 50% Flowering to pod filling 268 (10) 171(9) 109 (7)Bijapur Pod initiation to pod filling 199 (9) 75(5) 64 (4)Gujarat Junagadh First seed to harvest 338 (18) 188 (12) 83 (9)Jamnagar 50% Flowering to first pod 552 (13) 182 (9) 24 (2)Rajkot First peg to first pod 240 (7) 45 (4) 13 (2)Amreli First peg to first pod 175 (7) 40 (4) 29 (1)Bhavnagar First peg to first pod 145 (10) 64 (5) 21 (3)Kutch First pod to first seed 245 (7) 35 (2) 8 (1)Sabarkanta 50% Flowering to first peg 231 (6) 110 (5) 1 (0)Banaskanta 50% Flowering to first peg 114 (5) 78 (4) 17 (1)
(Values in parenthesis are rainy days)

90
All India Coordinated Research Project on Agrometeorology8. Summary
Agroclimatic characterization• Trend analysis of SI was carried out for four time periods (1901-1930, 1931-1960,
1961-1990 and 1991-2013) for districts of Vidarbha region using monthly rainfall data. Observed shift towards greater SI values indicateed confinement of rainfall distribution to lesser seasonal period. Mann Kendall test statistic showed significant increasing trend of SI value (1901-2013) only in Amravati, Buldhana and Washim districts.
• Significant positive trend in maximum temperature on annual basis and during post- monsoon season (1960-90) was observed at Anand. During summer, both Tmax and Tmin showed significant positive trend during 1991-2013. At Vadodara, Tmin showed significant positive trend on annual basis as well as monsoon and winter seasons during 1960-90.
• Rainfall probability analysis using 43 years’ weekly rainfall data by Bangalore centere has revealed that the crop sown during 28th to 31st week would not suffer from any moisture stress.
• LGP was estimated for 27 locations in high rainfall zone of Tamil Nadu by Kovilpatti center. Lowest LGP of 29 weeks was observed in Kulachal whereas highest LGP of 36 weeks was observed in Chittar and Mylar.
• Impact of projected climate change on weather parameters in central Punjab was studied by downscaling baseline (1961-1990) and projected (2020-2100) meteorological data given by PRECIS model. Increase in Tmax was found to be more during rabi, compared to kharif for mid century under A1B scenarios. Rainfall and Tmin showed more increase during rabi in mid and end century.
• Number of hail events (since 1990) and dew days (since 1985) were found to be increasing in Palampur, Himachal Pradesh. The dew days are increasing at the rate of 3 days per year.
• The analysis of impact of El Nino on total crop production in Chhattisgarh was analyzed using crop statistics and weather data for the period 1971-2012. Five strong El Nino years were recorded during which there was a decline of average combined cereals and pulses production by 13% and the crop acreage by 6%.
Crop weather relationshipKharif 2014Rice• Among three cultivars, Swarna recorded highest RUE (2.7 g/MJ) at Faizabad. On an
average, the crops sown on 5th July recorded highest RUE (2.4 g/MJ).• Cultivar NDR-52 recorded the highest HUE (0.42 g/m2/0day) followed by CSR-27
(0.40 g/m2/0day) at Kanpur.

91
All India Coordinated Research Project on Agrometeorology
• Impact of different levels of shade on yield and yield attributes of rice was studied at Ludhiana, which revealed that maximum reduction in yield (0.8 t/ha) was observed when shade imposed during 30-60 DAT when nitrogen was 100% normally applied. Harvest index, biomass, 1000 grain weight and panicle weight/m2 also showed similar response.
• At Raipur, cultivar Mahamaya recorded highest HUE (0.42 g/m2/oday) and RUE (1.14 (g/m2/MJ) which was exposed to three growing environments.
• Cultivar Naveen recorded highest HUE (1.8 kgha-1/0 day), WUE (65.6 kgha-1/cm) and RUE (1.5 g/MJ) compared to Sahbhagi and Swarna when grown under three growing environments at Ranchi.
Maize• Crop sown on first fortnight of June gave higher grain yield by availing longer crop
growing period as compared to successive delayed sowings at Udaipur. Among different hybrids, Pratap Makka-3 (4.9 t/ha) and BIO-9637 (4.7 t/ha) recorded highest mean yield and PEHM-2 (3.8 t/ha) recorded the lowest.
Pearl millet• Crop sown in second fortnight of June recorded highest consumptive use of moisture
(303-332 mm) and moisture use efficiency (5.37-6.11 Kg ha-1 mm-1) at Solapur. Among cultivars, Shanti recorded highest CUM & MUE compared to Mahyco and ICTP-8203.
Pigeoan pea• An increased duration of bright sunshine by two hours per day during seedling
stage and lower minimum temperature by 3.4 oC during pod formation and grain filling stage were found favorable for obtaining higher yield at Bijapur.
Soybean• Water productivity (WP) was found to be maximum under early sown (27 MW)
crop and decreased with later sowings at Akola. Among the varieties, TAMS-98-21 recorded highest WP (2.41 kg ha-1mm-1).
Sunflower• Crop sown in second fortnight of June (S1) recorded highest value of CUM (342
mm) and MUE value of 5.48 kg ha-1mm-1). Phule Raviraj recorded highest CUM and MUE compared to other cultivars.
Groundnut• Crop sown on first fortnight of August recorded highest (3 kg/ha/mm) WUE,
whereas late sown (second fortnight of August) had lowest (1kg/ha/mm) at Anand.• The crop sown during 2nd fortnight of July has recorded highest yield (607 kg/ha)
at Anantapur. The yield of Vemana (588 kg/ha), K–6 (632 kg/ha) and Anantha (629 kg/ha) sown in different dates of sowing was on par.

92
All India Coordinated Research Project on Agrometeorology
Rabi 2014-15Wheat• WUE was highest (15.1 kg hamm-1) in 1st crop growing environment (sown on
29th Oct, 2014) and lowest in crop sown on 10th Dec. Among cultivars, Raj 3077 showed high water use efficiency followed by HD 2967.
• During reproductive phase, maximum temperature exceeded the earlier established optimum limit (for achieving highest yield) of maximum (23.4) and minimum (10.9) temperature by 2.2 and 3.3 oC, which resulted in low productivity at Palampur.
• Radiation use efficiency of seven varieties were worked out at Kanpur. National check HD-2967 exhibited poor RUE (0.77 g/m2/MJ). Highest value of RUE was recorded with Kanchan (1.10 g/m2/MJ) followed by GW-273.
Chickpea• Crop sown on 41 and 42 SMW showed maximum HUE in terms of pod yield (0.30
kg ha-1 °C day-1) at Akola. Among different cultivars, HUE with respect to seed yield (0.30 kg ha-1 °C day-1) was higher in JAKI-9218 and for biomass production it was maximum with Vijay (0.80 kg ha-1 °C day-1).
• The CUM of 275 mm was found to be optimum for getting higher grain yield and thereafter there was decrease in yield. The yield decreased when Tmax increased above 31.8 oC. A Tmin of 17.5 oC was found to be optimum for getting higher grain yield
Mustard• Diurnal observations of energy balance at maximum LAI stage, flowering and pod
formation stage over five mustard cultivars was studied. Among the varieties RH 0749 used higher fraction of LE in Rn as compared to other varieties.
• Maximum temperature in the range of 20.3-24.4 oC and minimum temperature 7.3-9.3 oC at vegetative phase seems to be optimum for higher productivity in gobi sarson at Palampur.
Crop growth modeling• CROPGRO-Soybean simulation model (DSSAT v 4.5) was evaluated with 3 years
experimental data from 2011-2013 at Akola for three different varieties viz. JS-335, JS-9305, TAMS 98-21 raised under four different environments. Elevated CO2 concentration by 100 ppm coupled with elevated maximum temperature level by 1, 2 and 3 °C decreased the yield level from 3.2 to 28.4% under 1°C, by 14.3 to 38.9% under 2 °C and from 22.6 to 50.8% under 3 °C.
• PNUTGRO DSSAT model was calibrated and validated at Anand using three years experimental data. Days to anthesis was under estimated by the model for cv. GG-20, while pod yield was over estimated for all the cultivars. Further calibration of the model is required by collecting and incorporating more field information into the model.

93
All India Coordinated Research Project on Agrometeorology
• DSSAT Rice model was calibrated for the phenology and yield. The genetic coefficients were generated for Faizabad location.
• DSSAT Rice model was calibrated for the phenology (anthesis and maturity) and yield at Jorhat. The genetic coefficients generated for cultivar Mahsuri.
• Future climate change scenarios generated by PRECIS model were incorporated in the InfoCrop model by Ludhiana center. SRES scenarios were used to simulate impact of climate change on rice, maize and wheat. The grain yield of rice is projected to decrease under A1B scenario for the period 2020-2050 from the baseline by 3.6 to 19.8% under maximum temperature change scenario, by 2.7 to 5.5% under minimum temperature change scenarios and by 8.0 to 26.0% under both maximum and minimum temperature change scenarios. The grain yield of maize is projected to decrease under A1B scenario for the period 2020-2050 from the baseline by 4.5 to 24.5% under maximum temperature change scenario, by 0.8 to 11.1% under minimum temperature change scenario and by 4.1 to 19.1% under both maximum and minimum temperature change scenarios. The grain yield of wheat is projected to decrease under A1B scenario for the period 2020-2050 from the baseline by 7.8 to 11.8% under maximum temperature change scenario, by 1.8 to 8.4 % under minimum temperature change scenario and by 12.1 to 17.6% under both maximum and minimum temperature change scenarios.
• CERES–rice model was calibrated with experimental data for three rice cultivars (Sahbhagi, Naveen and Swarna) at Ranchi. Grain yield was estimated reasonably well by model for all the cultivars and D -index were always greater than 0.6.
Effect of weather on pests and diseasesRice• Maximum temperature two weeks prior to appearance of symptoms showed
significant positive correlation for leaf blight at Thrissur. Morning RH of one week prior to appearance of symptoms is the only other weather parameter which showed significant positive correlation for both leaf blight and leaf roller.
Mustard• A favourable weather range (Tmax: 28–33 °C, Tmin: 9–15 °C and Tmean: 19–24
°C) prevailed during 50% flowering for 3–5 days has caused aphid outbreak in the succeeding week in Mustard at Anand. For avoiding high aphid infestation 10th to 20th October sowing was found most suitable.
Pigeoan pea• Incidence of pod borer was highest crop sown in July first fortnight (38.4%) and
August first fortnight sown crop (33.1%) compared to crop sown on first fortnight of June (19.2%) at Bangalore.
94
All India Coordinated Research Project on Agrometeorology9. Research Publications: 2014-15
Co-ordinating UnitPapers in Peer Reviewed Journals Amrender Kumar., Chattopadhyay, C., Singh, K. N., Vennila, S and Rao, V. U.
M. (2014). Trend analysis of climatic variables in Pigeoan pea growing regions in India. Mausam, 65(2): 161-170.
Bapuji Rao, B., Santhibhushan Chowdary, P., Sandeep, V. M., Rao, V. U. M and Venkateswarlu, B. (2014). Rising minimum temperature trends over India in recent decades: Implications for agricultural production. Global Planet. Change,177: 1-8.
Bapuji Rao, B., Santhibhushan Chowdary, P., Sandeep, V. M., Pramod, V. P and Rao, V. U. M. (2014). Spatial analysis of the sensitivity of wheat yields to temperature in India. Agr. Forest Meteorol., 200:192-202.
Raju, B. M. K., Rama Rao, C. A., Rao, V. U. M., Srinivasa Rao, M and Maheswari, M. (2014). Effect of climate on productivity of Pigeoan pea and cotton in Andhra Pradesh – A panel data regression. Indian J. Dryland Agric. Res. Dev., 29(1): 6-10.
Vijaya Kumar, P., Rao, V.U.M., Bhavani, O., Dubey, A. P., Singh, C. B and Venkateswarlu, B. (2014). Sensitive growth stages and temperature thresholds in wheat (Triticum aestivum L.) for index-based crop insurance in the Indo-Gangetic plains of India. J. Agr. Sic., 1-13. DOI: 10.1017/S0021859615000209.
Vijaya Kumar, P., Rao, V. U. M., Bhavani, O., Dubey, A. P and Singh, C. B. (2014). Effect of temperature and photothermal quotient on the yield components of wheat (Triticum aestivum L.) in Indo-Gangetic plains of India. Exp. Agri., 1-22. DOI: 10.1017/S0014479714000532.
Technical & Research Bulletins Edited / Co-edited Ajith Kumar, B., Karthika, V. P and Rao, V. U. M. (2014). Crop weather
relationships in Cauliflower (Brassica oleracea var. botrytis L.) in the central zone of Kerala. AICRPAM, KAU, Thrissur.
Ajith Kumar, B., Karthika, V. P and Rao, V. U. M. (2014). Agro meteorological Instruments. AICRPAM, KAU, Thrissur.
Diwan Singh., Mahender Singh., Raj Singh., Surender Singh and Rao, V. U. M. (2014). Climatic variability and its periodicity at Hisar. AICRPAM, CCSHAU, Hisar.
Diwan Singh., Mehenaj, T. A., Mahender Singh., Surender Singh., Raj Singh andRao, V.U.M. (2015). El Nino and SW monsoon dynamics vis-à-vis agricultural productivity in Haryana. AICRPAM, CCSHAU, Hisar.
Pasupalak, S., Rao, V. U. M., Panigrahi, G and Mukut, M. (2014). Solar Radiation

95
All India Coordinated Research Project on Agrometeorology
Environment at Bhubaneswar. AICRPAM, OUAT, Bhubaneswar.
Patel, H. R., Lunagaria, M. M., Pandey, V., Sharma, P. K., Bapuji Rao, B and Rao, V. U. M. (2014). El Nino episodes and agricultural productivity in Gujarat. AICRPAM, AAU, Anand.
Rajendra Prasad., Rao, V. U. M and Bapuji Rao, B. (2014). El Nino-Its impact on Rainfall and Crop Productivity: A case study for Himachal Pradesh. AICRPAM, CSKHPKV, Palampur.
Rao, V. U. M., Bapuji Rao, B., Sikka, A. K., Subba Rao, A. V. M., Rajbir Singh and Maheswari, M. (2014). Hailstorm threat to Indian agriculture: A Historial Perspective and Future Strategies. AICRPAM, CRIDA, Hyderabad.
Srinivas Rao, Ch., Prasad, Y. G., Ravindra Chary, G., Rama Rao, C. A., Rao, K. V., Ramana, D. B. V., Subba Rao, A. V. M., Rajbir Singh., Rao, V. U. M., Maheswari, M and Sikka, A. K. (2014). Compensatory production plan for rabi 2014. AICRPAM, CRIDA, Hyderabad.
Venkatesh, H., Sajjanar, G. M., Hiremath, J. R., Rajput, S., Bapuji Rao, B and Rao, V.U.M. (2014). Agrometeorology of rabi sorghum of north Karnataka. AICRPAM, UAS, Dharwad.
Venkatesh, H., Patil, B. N., Rao, V. U. M., Rajani, B. R., Rajput, S., Naikodi, M., Hiremath, J. R and Vijaya Kumar, P. (2015). ElNino: Its influence on rainfall on crop production in North Interior Karnataka. AICRPAM, UAS, Dharwad.
Popular Articles Authored / Co-authored in Press and MagazinesBapuji Rao, B., Rao, V.U.M and Subba Rao, A.V.M. (2014). El-Nino-Andhra
Telangana rashtrala vyvasayarangaani prabhavitham chaiyanundha? Raythunestham, May, 41-44.

96
All India Coordinated Research Project on Agrometeorology
AICRPAM Centres Publications:AkolaPapers in Peer Reviewed Journals Maruthi Sankar, G. R., Sharma, K. L., Gabhane, V. V., Nagdeve, M. B., Osman,
M., Pushpanjali., Gopinath, K. A., ReshmaShinde., Ganvir, M. M., Karunakar, A. P., Anitha Chorey., Mishra, P. K., Venkateswarlu, B., Singh, A. K., Suma Chandrika, M and Sammi Reddy, K. (2014). Effects of Long-Term Fertilizer Application and Rainfall Distribution on Cotton Productivity, Profitability, and Soil Fertility in a Semi-arid Vertisol. Comm. Soil Sci. Plant Anal.,45(3): 362-380.
Ganvir, M. M., Nagdeve, M. B., Gabhane, V. V., Karunakar, A. P and Usha Satpute. (2014). Influence of different row proportion of Pigeoan pea on productivity and economics in soybean+ Pigeoan pea intercropping system. Soybean Res., (Special Issue):163-167.
Papers Presented in National and International Symposia/SeminarsAnil Karunakar., Nagdeve, M. B., Ganvir, M. M., Damre, P. R and Chavan,
V.K. (2015). Recent trends in extreme rainfall events in Vidarbha. In: National Seminar on “Dryland Agriculture in Vidarbha: Priorities and Development Issues”, March 3-4, PDKV, Akola.
Anil Karunakar., Nagdeve, M. B., Satpute, G. U., Turkhede, A. B and Patode, R. S. (2015). Analysis of standardized precipitation index in Vidarbha zones. In: National Seminar on “Dryland Agriculture in Vidarbha: Priorities and Development Issues”, March 3-4, PDKV, Akola.
Bathkal, B. G., Nagdeve, M. B and Karunakar, A.P. (2015). Introspecting dryland farming mission project in Akola district. In: National Seminar on “Dryland Agriculture in Vidarbha: Priorities and Development Issues”, March 3-4, PDKV, Akola.
Ganvir, M. M., Nagdeve, M. B., Karunakar, A. P., Gabhane, V. V., Patode, R. S and Sakhare, S. B. (2014). Productivity and sustainability of Pearlmillet based intercropping system under dryland condition. In: International Symposium on “New-Dimensions in Agrometeorology for Sustainable Agriculture”, October 16-18, GBPUA&T, Pantnagar.
Ganvir, M. M., Nagdeve, M. B., Karunakar, A. P., Gabhane, V. V., Patode, R. S., Sakhare, S. B and Vandana Mohod. (2015). Productivity and Sustainability of Cotton Based Intercropping System in different row proportions under Dryland Condition in Maharashtra. In: Second International Conference on “Bio-Resource and Stress Management”, January 7-10, PJTSAU & ANGRAU, Hyderabad.
Ganvir, M. M., Nagdeve, M. B., Karunakar, A. P., Gabhane, V. V., Patode, R .S., Sakhare, S. B., Vandana Mohod., Nagdeote, V. G and Damre, P. R. (2015).

97
All India Coordinated Research Project on Agrometeorology
Sustainability of cotton based intercropping system under dryland condition in Vidarbha region of Maharashtra. In: National Seminar on “Dryland Agriculture in Vidarbha: Priorities and Development Issues”, March 3-4, PDKV, Akola.
Jadhao, D. K., Goud, V. V., Anil Karunakar., Wadaskar, R. M andPatil, A. N. (2015).Crop-weather relationship of chickpea at different sowing date under irrigated condition. In: National Seminar on “Dryland Agriculture in Vidarbha: Priorities and Development Issues”, March 3-4, PDKV, Akola.
Turkhede, A. B., Nagdeve, M. B., Gabhane, V. V., Anil Karunakar., Ganvir, M. M and Damre, P. R. (2015). Productivity of soybean + Pigeoan pea intercropping system under dryland condition. In: National Seminar on “Dryland Agriculture in Vidarbha: Priorities and Development Issues”, March 3-4, PDKV, Akola.
Turkhede, A. B., Nagdeve, M. B., Gabhane, V. V., Ganvir, M. M., Karunakar, A. P., Mali, R. S and Nandapure, S. P. (2015). Response of cotton productivity to land configuration and nutrient module under dryland condition. In: National Seminar on “Dryland Agriculture in Vidarbha: Priorities and Development Issues”, March 3-4, PDKV, Akola.
AnandPapers in Peer Reviewed Journals Choudhary, D., Patel, H. R and Pandey, V. (2014). Calibration and validation of
InfoCrop model v. 1.0 for yield and yield attributing characters of rabi maize in middle Gujarat region. Ann. Biol., 30(4):658-660.
Choudhary, D., Patel, H. R and Pandey, V. (2014). Calibration and validation of InfoCrop model v.1.0 for yield and yield attributing characters of kharif maize in middle Gujarat region. Trends Biosci., 7(13):1528-1530.
Choudhary, D., Patel, H. R and Pandey, V. (2015). Evaluation of adaptation strategies under A2 climate change scenario using InfoCrop model for kharif maize in middle Gujarat region. J. Agrometeorol., 17(1):98-101.
Lunagaria, M. M., Patel, H. R andPandey, V. (2015). Evaluation and calibration of noninvasive leaf chlorophyll meters in wheat. J. Agrometeorol.,17(1):51-54.
Mishra, S. K., Shekh, A. M., Pandey, V., Yadav, S. B and Patel, H. R. (2015). Sensitivity analysis of four wheat cultivars to varying photoperiod and temperature at different phonological stages using WOFOST model. J. Agrometeorol., 17(1):74-79.
Popular Articles Authored/Co-authored in Press and Magazines.Patel H.R., Lunagria M.M., Karande B.I., Yadav S.B., Shah A.V. and Pandey
V. (2014). Badalati abohavanaa sanrdbhmaa Gujaratni bhavi krushi tasir. Krishigovidya, February, 5-9.

98
All India Coordinated Research Project on Agrometeorology
Patel H.R., Lunagria M.M., Karande B.I., Yadav S.B., Shah A.V. and Pandey V. (2014). Badalati abohavanaa sanrdbhmaa Gujaratni bhavi krushi tasir. Gujarat Samachar Krishi Vishva Ltd, March, 3.
Patel H.R., Lunagria M.M. and Pandey V. (2014). Elnino prabhavit gujaratano varasad ane krishi utpaadan. Krishigovidya, August,5-6.
Patel H.R., Lunagria M.M. and Pandey V. (2014). Elnino prabhavit gujaratano varasad ane krishi utpaadan. Krishijivan August,11-12.
Technical & Research Bulletins Edited/Co-edited.
Patel H.R., Sharma P.K., Chaudhari N.J. and Pandey V. (2014). “Farmers perceptions on climate change in middle Gujarat”. AICRPAM, AAU, Anand.
Patel, H. R., Lunagaria, M. M., Pandey, V., Sharma, P. K., Bapuji Rao, B and Rao, V. U. M. (2014). El Nino episodes and agricultural productivity in Gujarat. AICRPAM, AAU, Anand.
Papers Presented in National and International Symposia/Seminars.Chaudhary, N. J., Suthar, B. M., Patel, H. R., Pandey, V and Rao, V. U. M. (2014).
Radiation and water use efficiency of wheat under various environmental conditions in middle Gujarat Agro-climatic region. In: International Symposium on “New Dimensions in Agrometeorology for Sustainable Agriculture”, 16-18 October, GBPUAT, Pantnagar.
Patel, H. R., Chaudhary, N. J., Suthar, B. M., Pandey, V., Bapuji Rao, B and Rao, V. U. M. (2014). Relationship between mustard yield and aphid infestation under varied environmental condition of middle Gujarat. In: International Symposium on “New Dimensions in Agrometeorology for Sustainable Agriculture”, October 16-18, GBPUA&T, Pantnagar.
Suthar, B. M., Chaudhary, N. J., Patel, H. R., Pandey, V and Rao, V. U. M. (2014). Rainfall variability and its impact on groundnut yield under rainfed condition of middle Gujarat. In: International Symposium on “New Dimensions in Agrometeorology for Sustainable Agriculture”, October 16-18, GBPUA&T, Pantnagar.
AnantapurRadio TalksContingency crop plannining for Anantapurdistrictdue to scanty rainfall on 4th
August, 2014 by Dr. S.M Malleshwari.
Management practices for Bt cotton on 28th August, 2014 by Dr. S. M Malleshwari.

99
All India Coordinated Research Project on Agrometeorology
BangalorePapers in Peer Reviewed JournalsPadmasri, H. S., Soumya, D. V., Rajegowda, M. B., Nagesh, L and Sridhar, D.
(2014). Coconut yield as influenced by seasonal rainfall in Karnataka, Mysore J.Agril. Sci., 48(2): 230-234.
Rajegowda, M. B., Soumya, D. V., Padmasri, H. S., Janardhana Gowda, N. A and Nagesh, L. (2014). Ragi, groundnut yield forecasting in Karnataka- Statistical Model, J. Agrometeorol., 16(2): 203-206.
Books / Book Chapters / Training Program Lecture NotesRajegowda, M. B., Janardhana Gowda, N. A., Padmasri, H. S and Ravindra Babu,
B. T. (2014). “Weather Based Agromet Advisory for Finger Millet (Ragi) crop in Karnataka”. 1st Eds. 1-50pp. Published by University of Agricultural Sciences, GKVK, Bengalore using the funds provided under NICRA, ICAR, India.
Popular Articles Authored /Co-authored in Press and MagazinesRajegowda, M. B., Nagesha, L., Shridhar, D., Janardhana Gowda, N. A and
Soumya, D. V.(2014). Krushi Havamana Munsoochane haagu salahaa varadhi praamukhyathegalu, Krishi Kayaka, 4(3): 6-7.
Rajegowda, M. B., Nagesha, L., Soumya, D. V., Shridhar, D and Janardhana Gowda, N. A.(2014). Maleyaashritha susthira Krishige Agathyavaada havaamaana maahithi, Krishi Kayaka, 4(2): 17-18.
Shridhar, D., Nagesha, L., Soumya, D. V and Rajegowda, M. B.(2014). Krishiyalla Havaamaana vignaanada praamukhyathe haagu adara vyaapthi, Krishi Kayaka, 5(1): 4-5.
Folders“Havaamaana vaipareethyakke paryaaya bele yojane”, 2014, Dr. Janardhana
Gowda, Dr. M. B. Rajegowda, D.Sridhar, L.Nagesh and Soumya, D. V. “Havaamana aadhaaritha bele maahithi” 2014, Dr. Janardhana gowda, Dr. M. B.
Rajegowda, D.Sridhar, L.Nagesh andSoumya, D.V.
T.V. Programmes AttendedEffect of delay monsoon and contingent plan to farmers of Karnataka- TV
Programme on Chandana at 6.30 PM. By Dr. N. A. Janardhana Gowda on 21.07.2014
Delayed monsoon Dr. N. A. Janardhana Gowda25.06.2014Male Bele proramme on Samaya TV- Farmers interaction between 6.0 pm to 7.0

100
All India Coordinated Research Project on Agrometeorology
pm. Dr. N. A. Janardhana Gowda28.07.2014
Radio Talks given through AIRLand preparation and paddy cultivation practices for Kharif season. Dr. N. A.
Janardhana Gowda25.04.2014 Ragi varieties and cultivation practices for late kharif season. Dr. N. A. Janardhana
Gowda06.08.2014
Varieties of Pulses, oil seeds and production technology for late kharif and rabi season. Dr. N. A. Janardhana Gowda15.09.2014
BijapurPapers in Peer Reviewed JournalsVenkatesh H., Chattannavar, S.N., Rajput, R. B and Hiremath, J.R. (2015). Weather
in relation to Grey Mildew disease in Cotton at Dharwad, Karnataka,Environment & Ecology,33(4A):1667-1671.
Popular Articles Authored /Co-authored in Press and MagazinesAlagundagi, S. C., Venkatesh, H., Surakod, V. S., Shirahatti, M. S., Hundekar, S.
T and Kulkarni, S. N. (2014). “§gÀ ªÀÄvÀÄÛ £ÉgÉ ¤ªÀðºÀuÁ PÀæªÀÄUÀ¼ÀÄ”(Drought and Flood Management Practices) in Kannada language released during inaugural function of “Krishi Mela - 2014” held on 27.09.2014.
Venkatesh, H. (2014). “D°PÀ®Äè ªÀÄ¼É ªÀÄvÀÄÛ GvÀÛgÀ PÀ£ÁðlPÀzÀ gÉÊvÀgÀ
vÉÆAzÀgÉUÀ¼ÀÄ”(Hail storm and farmers problems in north Karnataka), Krishi Munnade, 27, pp 4-6.
Venkatesh, H and Rajput, R. B. (2014). “¸À¸Àå ¸ÀAgÀPÀëuÉAiÀÄ°è ºÀªÁªÀiÁ£ÀzÀ
eÁÕ£À«gÀ¨ÉÃPÀÄ” (Knowledge of weather is necessary for plant protection), Popular article. Krishi Munnade, 28(1), pp 10-11.
Venkatesh, H. (2015). Why look at the sky when you have weather forecast on your palm? UAS Dharwad in the forefront of service to the farmers through farmer-friendly weather forecasts and near real-time dissemination- A Success Story. Released at the “Krishi Mela - 2014” on 28.09.2014 in the August presence of H.E. Governor of Karnataka, Shri Vajubhai Vaalal.
Technical & Research Bulletins Edited / Co-edited Venkatesh, H., Sajjanar, G. M., Hiremath, J. R., Rajput, R, B., Bapuji Rao, B
andRao, V.U.M. (2014). Agrometeorology of rabi sorghum of north Karnataka. AICRPAM, UAS, Dharwad.
Chatha/Jammu

101
All India Coordinated Research Project on Agrometeorology
Papers Presented in National and International Symposia / Seminars Sharma,C., Meenakshi, G and Khushu, M.K. (2014). Phenological variation and
its relation with yield in wheat cultivars under normal & late sown conditions. In: National Symposium on “Natural Resource Management for Sustainable Hill Farming System for Livelihood Security”, July 23-24,SKUAST,Jammu.
DapoliPapers Presented in National and International Symposia / SeminarsChavan, V. G., Thorat, T. N., Mohite, N. C., Chavan, S. A and Rajemahadik,
V. A.(2014). Crop weather association of hybrid rice var. sahyadri–2 during kharif season. In: National seminar on “Technologies for sustainable production through climate resilient Agriculture”,August 8-9,JNKVV, Jabalpur.
Chavan, V. G., Thorat, T. N., Thorat, S. T., Mahadkar, U. V., Rajemahadik, V. A., Chavan, S. A and Mohite, N. C. (2014). Impact of weather variables on yield of hybrid rice under different growing environments in Konkan region of Maharashtra. In: International symposium on “New Dimensions in Agrometeorology for sustainable Agriculture, October 16-18, GBPUA&T, Pantnagar.
Fadavale, U. S., Rajemahadik, V. A., Shetye, V. N., Chavan, V. G and Mahadkar, U. V. (2015). Effect of sowing time and methods of establishment on growth and yield of niger (Guizotia abyssinica Cass.) under Konkan condition of Maharashtra. In: International conference on “Natural Resource Management for Food Security and Rural Livelihood”, February 10-13,New Delhi.
Popular Articles Authored /Co-authored in Press and MagazinesChavanand, V. G andMahadkar, U. V. (2014). Agromet advisory on crop
management in cloudy weather condition, Agro-one newspaper on Sunday, 1st April.
Chavanand, V. G and Mahadkar, U. V. (2014). Agromet advisory on crop and livestock management, Agro-one newspaper on Sunday, 9th October.
Chavanand, V. G and Mahadkar, U. V. (2015). Agromet advisory on crop and livestock Management, Agro-one newspaper on Sunday, 11th January.
Chavanand, V. G and Mahadkar, U. V. (2015). Agromet advisory on crop livestock management, Agro-one newspaper on Sunday, 21st February.
Award
Awarded by Mumbai Varuttapatra Lekhak Sangh, Mumbai with “RATNAGIRI BHUSHAN” for Education during the year 2014-15.

102
All India Coordinated Research Project on Agrometeorology
FaizabadPapers in Peer Reviewed JournalsKumar, A., Singh, A. K., Kumar, A., Maurya, P and Tripathi, C. K. (2015). Effect
of sowing dates and varieties on growth, yield attributing character and yield on chickpea of eastern Uttar Pradesh. Int. J. Ag. Sc., 6(1): 44-52.
Singh, P. K and Singh, A. K. (2014). Effect of sowing dates and irrigation schedules on yield and quality of Indian mustard (Brassica juncea). J. Soil Water Conserv., 13(3): 270-73.
Papers Presented in National and International Symposia / SeminarsKumar, A., Singh, A.K., Kumar, A., Tripathi, P., Mishra, A.N and Mishra,
S.R. (2014). Identification of congenial climatic condition for optimum yield of chickpea under prevailing weather condition in eastern Uttar Pradesh. In:International symposium on “New Dimensions in Agrometeorology for sustainable Agriculture”, October 16-18, GBPUA&T, Pantnagar.
Kumar, A., Tripathi, P., Singh, K.K., Yadav, S.B., Kumar, A., Singh, A.K., Mishra, S.R and Singh, P.K. (2014). Potential production constraints of rice in eastern Uttar Pradesh under rice wheat cropping system.In: International symposium on “New Dimensions in Agrometeorology for sustainable Agriculture”, October 16-18, GBPUA&T, Pantnagar.
Kumar, N., Singh, A.K., Mishra, S.R., Singh, A., Pandey, J and Singh, G. (2014). Performance and evaluation of chickpea crop through crop simulation model DSSAT. In: International symposium on “New Dimensions in Agrometeorology for sustainable Agriculture”, October 16-18, GBPUA&T, Pantnagar.
Mishra, A., Singh, A.K., Tripathi, P., Kumar, A., Mishra, A.N and Mishra, S.R. (2014). Identification of congenial climatic condition of optimum yield of chickpea under prevailing weather condition in eastern U.P. In: International symposium on “New Dimensions in Agrometeorology for sustainable Agriculture”, October 16-18, GBPUA&T, Pantnagar.
Singh, A., Mishra. S. R., Singh. A.K., Krishna Deo and Kumar, N. (2014).Micro climatic study of Pigeoan pea (Cajanas cajan L) millap genotype under variable weather conditions. In: International symposium on “New Dimensions in Agrometeorology for sustainable Agriculture”, October 16-18, GBPUA&T, Pantnagar.
Singh, A. K and Mishra, S. R. (2014). Response of chickpea cultivation at varying soil temperature & soil moisture under different weather condition. In: International symposium on “New Dimensions in Agrometeorology for sustainable Agriculture”, October 16-18, GBPUA&T, Pantnagar.

103
All India Coordinated Research Project on Agrometeorology
Singh, G., Singh, A.K., Tripathi, P and Patil, S.R. (2014). Study of perception of climate awareness constraints and impact of weather forecast in Bahraich district (U.P.). In: International symposium on “New Dimensions in Agrometeorology for sustainable Agriculture”, October 16-18, GBPUA&T, Pantnagar.
Singh, S.P and Mishra, S.R. (2014). Performance and evaluation of DSSAT model of rice genotypes under different weather conditions. In: International symposium on “New Dimensions in Agrometeorology for sustainable Agriculture”, October 16-18, GBPUA&T, Pantnagar.
Technical & Research Bulletins Edited / Co-edited Tripathi, P., Singh, A. K and Rao, V. U. M. (2014). “Compendium of perception of
farmers of eastern Utter Pradesh (U.P) on climate change”. AICRPAM, NDUA&T, Faizabad.
Books / Book Chapters / Training Program Lecture NotesVijaya Kumar, P., Rao, V. U. M., Tripati, P and Venkateswarlu, B. (2014). The
effect of rice transplanting date on rice-wheat cropping system performance in the middle IGP of India – A simulation study using APSIM. In: “”. (Eds. ). pp. 75-85.(Central Research Institute for Dry land Agriculture, Hyderabad)
Radio TalksDr. A.K. Singh delivered T.V. talk at Doordarshan Kendra Lucknow on 27,
August 2014.
Dr. P. Tripathi delivered 2 Radio talks at Akashvani Faizabad and Gorakhpur and three T.V. talks at Lucknow and Gorakhpur Doordarsan during reporting year.
Dr. P. Tripathi delivered T.V. talk at DoordarshanKendra Lucknow/ Gorakhpur.
HisarPapers Presented in National and International Symposia / SeminarsMohan Singh and Diwan Singh. (2014). Climatic variability over eastern Thar
desert. In: National Seminaron “Reorientation of Agricultural Research to Ensure National Food Security”,January 6-7, CCSHAU, Hisar.
Surender Singh., Parvinder Kumar and Diwan Singh. (2014). Farmer’s perception on regional climate change and variability: A case study form Sirsa district of Haryana. In: National Seminar on “Reorientation of Agricultural Research to Ensure National Food Security”, January 6-7, CCSHAU, Hisar.

104
All India Coordinated Research Project on Agrometeorology
Technical & Research Bulletins Edited / Co-editedDiwan Singh., Singh, M., Singh, R., Singh, S andRao, V. U. M.(2014). “Climatic
variabilty and its periodicity at Hisar (Haryana)”.AICRPAM, CCSHAU, Hisar.
Diwan Singh., Mehnaj, T.A.,Singh, M., Singh, S., Singh, R andRao, V. U. M.(2015). “El Nino and SW Monsoon Dynamics vis-à-vis Agricultural Productivity in Haryana, India”.AICRPAM, CCSHAU, Hisar.
Radio Talks
‘Barsat Ki Kami me kharif ki faislon ki dekhbhal’- Radio talk on 10 August 2014.
KanpurRadio / TV TalksT.V. talks on the topic of weather based management on kharif, rabi and zaid
crops were delivered by Dr. A. P. Dubey in Akash vani, Local and National news channels by weekly or weekly.
Popular Articles Authored/Co-Authored in Press and Magazines
Mk0 vfu#) nqcs] ekSle ds vuqlkj ekg twu es dh tkus okyh d`f’k lL; fdz;k, a¼ebZ 2014½ A d`f’k fparu] izlkj f”k{kk ,oa izf”k{k.k C;wjksa] d`f’k foHkkx 9] fo”ofo|ky; ekxZ] y[kuÅA
Mk0 vfu#) nqc]s ekSle ds vuqlkj ekg twykbZ es dh tkus okyh d`f’k lL; fdz;k, a¼twu 2014½ A d`f’k fparu] izlkj f”k{kk ,oa izf”k{k.k C;wjksa] d`f’k foHkkx 9] fo”ofo|ky; ekxZ] y[kuÅA iz0 la0& 2&5A
Mk0 vfu#) nqcs] ekSle ds vuqlkj ekg vxLr es dh tkus okyh d`f’k lL; fdz;k, a¼twykbZ 2014½A d`f’k fparu] izlkj f”k{kk ,oa izf”k{k.k C;wjksa] d`f’k foHkkx 9] fo”ofo|ky; ekxZ] y[kuÅA iz0 la0& 2&5A
Mk0 vfu#) nqcs] ekSle ds vuqlkj ekg flrEcj es dh tkus okyh d`f’k lL; fdz;k,a¼vxLr 2014½A d`f’k fparu] izlkj f”k{kk ,oa izf”k{k.k C;wjksa] d`f’k foHkkx 9] fo”ofo|ky; ekxZ] y[kuÅA iz0 la0& 2&5A
Mk0 vfu:) nqcs] ekSle ds vuqlkj ekg vDVwcj es dh tkus okyh d`f’k lL; fdz;k,a¼flrEcj 2014½A d`f’k fparu] izlkj f”k{kk ,oa izf”k{k.k C;wjksa] d`f’k foHkkx 9] fo”ofo|ky; ekxZ] y[kuÅA iz0 la0& 2&5A

105
All India Coordinated Research Project on Agrometeorology
KovilpattiTechnical & Research Bulletins Edited / Co-edited Solaimalai, A., Subbulakshmi, S., Jawahar, D andRao, V.U.M. (2014). “Long term
rainfall analysis for Virudhunagar district of Tamil Nadu”. AICRPAM, ARS, Kovilpatti.
LudhianaPapers in Peer Reviewed JournalsGill, K. K., Ritu Babuta., Navneet Kaur., Prabhjyot Kaur and Sandhu, S. S. (2014).
Thermal requirement of wheat crop in different agroclimatic regions of Punjab under climate change scenarios. Mausam, 65(3):417-424
Jalota, S. K., Vashisht, B. B., Harsimran Kaur., Samanpreet Kaur andPrabhjyotKaur.(2014). Location specific climate change scenario and its impact on rice and wheat in central Indian Punjab. Agr. Syst., 131: 77-86.
Jupinder Kaur., Gosal, S. K and Prabhjyot Kaur. (2014). Effects of climate change on plant associated microbial communities and enzyme activities. Afr. J.Microbiol. Res., 8 (33): 3087-3093.
Prabhjyot Kaur., Ashu Bala., Sandhu, S. S and Gill, K. K. (2015). Yield gap in rice and wheat productivity in different agroclimatic zones of Punjab. J. Agrometeorol, 17(1): 127-130.
Papers Presented in National and International Symposia / SeminarsChahal, B., Gill, K. K and Prabhjyot Kaur. (2015). Development of weather
based weekly thumb rules for potential productivity of mustard crop in Punjab. In: National Symposium on “Weather and Climate Extremes”, February 15-18, Chandigarh.
Harleen Kaur and Prabhjyot Kaur. (2014). Effect of elevated temperature regimes on phenological development and heat unit requirements of rice (Oryza sativa L.) cultivars. In: International Symposium on “New-Dimensions in Agrometeorology for Sustainable Agriculture”, October 16-18, GBPUA&T, Pantnagar.
Harleen Kaur and Prabhjyot Kaur. (2015). Changes in the incidence of extreme of temperature events in Punjab – A case study. In: National Symposium on “Weather and Climate extremes”, February 15-18, Chandigarh.
Navneet Kaur., PrabhjyotKaur and Harpreet Singh. (2015). Climate change: Causes and impacts. Proceedings of the In: National Seminar on “Geospatial Technology in Natural Resource Management”, March 17-18, Punjab Remote Sensing Center, Ludhiana.

106
All India Coordinated Research Project on Agrometeorology
Navneet Kaur., Prabhjyot Kaur and Harpreet Singh. (2015). Projected climate change under diverse scenarios in different agroclimatic areas of Indian Punjab. In:National Symposium on “Weather and Climate extremes”, 15-18 February, Chandigarh.
PrabhjyotKaur., Sandhu, S. S., Gill, K. K and Harpreet Singh. (2015). Annual, seasonal and monthly climate variability analysis in Punjab. In: National Symposium on “Weather and Climate Extremes”, 15-18 February,Chandigarh.
Books / Book chapters / Training Program Lecture Notes PrabhjyotKaur. (2014). “Climate Change in Punjab”. 1stEds. () pp.
MohanpurPapers in Peer Reviewed Journals Banerjee, S., Mukherjee, A., Das, S and Saikia, B. (2014). Adaptation strategies to
combat climate change effect on rice and mustard in eastern India. Mitigation. Adapt. Strateg. Glob. Chang., DOI: 10.1007/s11027-014-9595-y.
Saikia, B and Banerjee, S. (2014). Radiation balance and radiation pattern study over Brasicca campestris var yellow sarson in Gangetic West Bengal. J. Agrometeorol.,16(2): 178-182.
Papers Presented in National and International Symposia / SeminarsBairagya, M. D., Jha Chakraborty, A., Banerjee, S., Mukherjee, A and Sarkar,
S. (2014). Impact of energy and water resources on yield of summer rice under varying transplanting dates in coastal West Bengal. In: International Symposium on “New Dimensions in Agrometeorology for Sustainable Agriculture”,October 16-18, GBPUA&T, Pantnagar.
Mukherjee, A., Banerjee, S., Bandyopadhyay, Pintoo and Mahata, D. (2014). Forecasting of jute yield in southern alluvial districts of West Bengal. In: International Symposium on “New Dimensions in Agrometeorology for Sustainable Agriculture”,October 16-18, GBPUA&T, Pantnagar.
Samanta, S., Mukherjee, A., Banerjee, S and Patra. P. K. (2014). Effect of date of planting on yield, yield attributing character and water use efficiency of different potato cultivar. In: International Symposium on “New Dimensions in Agrometeorology for Sustainable Agriculture”, October 16-18, GBPUA&T, Pantnagar.

107
All India Coordinated Research Project on Agrometeorology
PalampurPapers in Peer Reviewed JournalsRakesh Kumar., Saurabh Sharma., Ramesh, K., Vijaylata Pathania and Rajendra
Prasad. (2014). Irradiance stress and plant spacing effect on growth, biomass and quality of wild marigold (Tagetes minuta L.) – an industrial crop in western Himalaya. J. Essent. Oil Res., 348-358.
Vijaya Kumar, P., Rao, V. U. M., Bhavani, O., Rajendra Prasad., Singh, R. K and Venkateswarlu, B. (2015). Climatic change and variability in mid-Himalayan region of India. Mausam, 66: 167-180.
Papers Presented in National and International Symposia / SeminarsVedna Kumari., Chaudhary, H. K., Rajendra Prasad., Kumar, A., Jambhulkar, S
and Sharma, S. (2014). Identification and evaluation of Alternaria blight tolerant and early mutants in Ethiopian mustard (Brassica carinata A. Braun). In: National Symposium on “Crop Improvement for Inclusive Sustainable Development”, November 7-9, Ludhiana.
Technical & Research Bulletins Edited / Co-editedRajendra Prasad., Rao, V.U.M. and Bapuji Rao, B. (2014). “El Niño-Its Impact
on Rainfall and Crop Productivity: A Case Study for Himachal Pradesh”. AICRPAM, CSKHPKV, Palampur.
RaipurPapers in Peer Reviewed JournalsChaudhary, J. L., Sharma, G. K and Thakur, D.S. (2013). Analysis of weather
parameters of Bastar plateau agro-climatic zone for strategic crop planning, J.of Agril. Issu.,18(1&2):70-76.
Chaudhary, J. L, Neha Sinha., Chandrawanshi, S.K., Manikandan, N and Singh, R. (2014). Need of water harvesting on the basis of rainfall probabilities analysis in different districts of Chhattisgarh. Int. J. of Ecol. Environ.and Cons.,20(4): 1553-57.
Kaushik, D. K., Chandrawanshi, S. K., Patel, S. R., Lakpale, R and Chaudhary, J. L. (2014). Effect of sowing date and types of varieties on yield attributes of Soybean in the Chhattisgarh plains zone. Eco. Env. & Cons.,20(Suppl.):237-240.
Praveen, K. V., Bhelawe, S., Chaudhary, J. L and Patel, S.R.(2014). Estimating productivity of rice (Oryza sativa) in Chhattisgarh plain zone for the future climate conditions using DSSAT v. 4.5 rice model, Int. J. Agricult. Stat. Sci.,10(1): 217-220.

108
All India Coordinated Research Project on Agrometeorology
Rajesh Khavse., Singh, R., Manikandan, N., Naidu, D and Chaudhary, J. L. (2014). Influence of temperature on rapeseed-mustard yield at selected locations in Chhattisgarh state. Curr. World Env., 9(3): 1034-1036.
Rajesh Khavse., Singh, R., Manikandan, N., Chandrawanshi, S. K and Chaudhary, J. L. (2014). Crop water requirement and irrigation water requirement of mustard crop at selected locations of Chhattisgarh State, India Eco. Env. & Cons,20(Suppl.):209-211.
Sanjay Bhelawe., Chaudhary, J. L., Nain, A. S., Singh, R., Khavse, R and Chandrawanshi, S. K. (). Rainfall variability in Chhattisgarh state using GIS. Curr.World Envir.,9(2):519-524.
Sanjay Bhelawe., Nain, A. S., Singh, R and Chaudhary, J. L. (2014). Agro-ecological zoning of Chhattisgarh, Eco. Env. & Cons.20(4):1829-1836.
Sharma, G. K and Chaudhary, J. L. (2014). Study on analyzing time trends in temperature of Bastar plateau agro-climatic zone of Chhattisgarh, Mausam, 65(1):29-36.
Thakur, D.S., Sharma, G. K., Naik, R. K., Khalkho, D., Chaudhary, J. L and Patil, S. K.(2014). Evaluation of rice establishment methods with nutrient and weed management options under rainfed farming situations of Bastar Plateau.J.Soil Water Conserv.,13(1):36-41.
Papers Presented in National and International Symposia / SeminarsSanjay Bhelawe., Singh, R., Nain, A. S and Chaudhary, J. L.(2014). Determination
of length of growing periods for Chhattisgarh state. In: International Symposium on “New Dimensions in Agrometeorology for Sustainable Agriculture”,October 16-18, GBPUA&T, Pantnagar.
Chaudhary, J. L., Manikandan, N., Rajesh Khavse., Chandrawanshi, S. K and Sanjay Bhelawe. (2014). Analysis of key weather variables for strategic crop planning under rainfed rice based cropping system in Chhattisgarh state. In: International Symposium on “New Dimensions in Agrometeorology for Sustainable Agriculture”, October 16-18, GBPUA&T, Pantnagar.
Praveen, K. V., Patel, S. R., Chaudhary, J. L and Rao, A.V.M.S.(2014). Simulation modelling of environmental growth parameters for rice genotypes in different planting dates using DSSAT 4.5 V for Chhattisgarh plains zone of India. In: International Symposium on “New Dimensions in Agrometeorology for Sustainable Agriculture”, October 16-18, GBPUA&T, Pantnagar.
Chandrawanshi, S. K., Chaudhary, J. L., Rajesh Khavse and Manikandan, N.(2014). Change in frequency of drought occurrence in different districts of Chhattisgarh state using SPI concept during 1961-1990 and 1991-2013. In: International Symposium on “New Dimensions in Agrometeorology for Sustainable Agriculture”, October 16-18, GBPUA&T, Pantnagar.

109
All India Coordinated Research Project on Agrometeorology
Chaudhary, J. L., Manikandan, N., Patel, S. R., Khavse, R and Bhelawe, S.(2015). Extreme weather events in Chhattisgarh state affecting crop production -Mitigation and adaptation strategies. In: National Symposium on “Weather and Climate Extremes”,15-18 February
Rajesh Khavse., Sanjay Bhelawe., Manikandan, N., Patel, S. R and Chaudhary, J. L.(2015). Analysis of rainfall in rainshadow districts of Chhattisgarh state for strategic crop planning under rainfed rice based cropping system.In: National Seminar on “Weather and Climate Risks under Changing Climate: Mangement and Mitigation”, 12-13 March, JNKV, Tikamgarh.
Patel, S. R and Chaudhary, J. L.(2015). Contingent planning for drought management. In: National Seminar on “ Weather and Climate Risks in Agriculture under Changing Climate: Mangement and Mitigation”, 12-13 March, JNKV, Tikamgarh.
RanchiPapers in Peer Reviewed JournalsKumari Pragyan; Ojha Ranjan Kumar; Abhivyakti; Wadood, A and Rajesh, R.P.
(2014): Microclimatic alteration through protective cultivation and its effect on tomato yield .J. Agrometeorol.,16(2): 172-177
RanichauriPapers in Peer Reviewed JournalsUpadhyay, R.G., Rajeev Ranjan and Negi, P. S. (2015). Climatic trend and
variability analysis at Ranichauri (Uttarakhand). J. Agrometeorol., (Accepted).
Upadhyay, R.G and Rajeev Ranjan. (2014). Effect of growth hormones on morphological parameters, yield and quality of soybean (Glycine max L.) during changing scenario of climate under mid hill conditions of Uttarakhand. Int. J. Tropic. Agr.,33(2): 1899-1904
Upadhyay, R.G., Rajeev Ranjan and Negi, P. S. (2014). Influence of sowing dates and varieties on productivity of wheat under mid Himalayan region of Uttarakhand. Int. J. Tropic. Agr., 33(2): 1905-1909.
Upadhyay, R.G and Negi, P.S. (2014). Effect of temperature variations on growth, dry matter and yield of wheat (Triticum aestivum L) under mid Himalayan region of Uttarakhand. Int. J. of Environ. Cons., 2(2):131-135.
Books / Book chapters / Training Program Lecture NotesUpadhyay, R. G., Arvind Shukla., Laxmi Rawat and Rajeev Ranjan. (2014).
Uttarakhand Ke Parvatiye Chetron Mein Sabjion Ke Rogon Awam Kiton Ka

110
All India Coordinated Research Project on Agrometeorology
Samekit Nasijeev Prabandhan- 2015. Published by Directorate of Research, VCSG UUHF, Ranichauri Campus-249 199, Tehri Garhwal (Uttarakhand).
Samastipur
Papers Presented in National and International Symposia / SeminarsPandey, B., Irshad Alam., Kumar, M and Sattar, A. (2014). Effect crop of growing
environment on heat-use efficiency and yield of prominent wheat (Triticum aestivum) genotypes under north Bihar condition. In: National Seminar on “Agricultural Diversification for Sustainable Livelihood and Environmental Secutity”, November 18-20, PAU, Ludhiana.
Sattar, A., Manish Kumar, Khan, S. A and Pandey, I. B. (2014). Calibration and validation of DSSAT 4.5 model for wheat in northwest alluvial plain zone of Bihar. In: International Symposium on “NewDimensions in Agrometeorology for Sustainable Agriculture”,October 16-18, GBPUAT, Pantnagar.
Solapur
Papers in Peer Reviewed JournalsAkashe, V. B., Jadhav, J. D., Bawdekar, V. R., Shinde, S. K and Amrutsagar, V.
M. (2014). J. Agrometeorology.16(2):230-232
Dhadage, S. M., Satpute, N. R., Katmale, D. K., Patil, S. V., Chari, R., Rao, C. S., Jadhav, J. D and Kadam, J. R. (2014). Effect of different sources and levels of potassium on yield quality and nutrient uptake by lilium grown under polyhouse condition. Asian J. of Agric.Sci., 10(2):034-040.
Dorkar, D. P., Kambale, P. S., Maniyar, V. G and Jadhav, J. D. (2014). Soybean (Glycine max L.) crop coefficient (Kc) for Marathwada region of Maharashtra. J. Agrometeorol.,15(2): 251-252.
Katmale, D.K., Dhadage, S.M., Satpute, N.R., Patil, S.V., Chari, R., Rao, C.S., Jadhav, J.D and Kadam, J.R. (2014). Evaluation of of pigeon pea (Cajanus cajan L.) based intercropping system under semi-arid vertisol in scarcity zone of Maharashtra. J. Indian Soc.of Dryland Agric., 29(1):027-034.
Patil, S. R., Jadhav, M. G and Jadhav, J. D. (2014). Growing degree days (GDD), heliothermal units (HTU) as influenced by sowing periods and varieties in soybean. Int. J. Plant Sci.,9(2): 312-318.
Patil, S. R., Jadhav, M. G and Jadhav, J. D. (2014). Impact of sowing windows and varieties on canopy temperature (CT), stress degree days (SDD) in soybean. Int. J. Plant Sci., 9(2):342-348.

111
All India Coordinated Research Project on Agrometeorology
Satpute, N.R., Waghmare, J.M., Jadhav, J.D and Jadhav, M.B. (2014). Effect of different sources and levels of potassium on yield quality and nutrient uptake by lilium grown under polyhouse condition.Asian J. of Agric.Sci., 10(02):534-540.
Papers Presented in National and International Symposia / SeminarsManiyar, V. G., Kambale, P. S and Jadhav, J. D.(2014). AET Measurement in
soybean and estimation of PET by various methods. In: International Symposium on “New Dimensions in Agrometeorology for Sustainable Agriculture”, October 16-18, GBPUAT, Pantnagar.
Amrutsagar, V. M., Jadhav, J.D., Pawar, P.B., Bavadekar, V.Rand Patil, S.R. (2014). Probabilities and variability of rainfall for drought prone areas. In: International Symposium on “New Dimensions in Agrometeorology for Sustainable Agriculture”, October 16-18, GBPUAT, Pantnagar.
Jadhav, J.D., Pawar, P.B., Amrutsagar, V. M., Bavadekar, V.R and Patil, S.R. (2014). Cropping pattern suggested for western Maharashtra on the basis of changes in rainfall trends. In: International Symposium on “New Dimensions in Agrometeorology for Sustainable Agriculture”, October 16-18, GBPUAT, Pantnagar.
Thorve, S.B., Jadhav, J.D., Amrutsagar, V. M., Bhanavase, D.B and Upadhye, S.K. (2014). Agro-met advisories a boon for sustainability a success story in scarcity zone of Maharashtra. In: International Symposium on “New Dimensions in Agrometeorology for Sustainable Agriculture”, October 16-18, GBPUAT, Pantnagar.
Pawar, P.B., Jadhav, J.D., Amrutsagar, V.M and Patil, S.R. (2014). Weekly rainfall variability and probability analysis for Solapur in respect of crop planning. In: International Symposium on “New Dimensions in Agrometeorology for Sustainable Agriculture”, October 16-18, GBPUAT, Pantnagar.
Research BulletienRajguri, A. B., Kadam, S. M., Jadhav, J. D and Takte, A. S. (2014). “Suryaful
Badaltya Hawamanas Paryay” in Marathi released in AICRPAM_NICRA Annual Workshop at Madurai 28-30th April 2014 MPKV /Res.Pub.No./136/2014.
Popular Articles Authored/Co-Authored in Press and MagazinesAkashe, V. B., Patil S. R., Jadhav, J. D., Pawar, P. B and Kadam, J. R. (2014).
“Erandivaril mahatwachya kidinche ekatmik vyavasthapan”, Baliraja, pp.036-039
Jadhav, J.D., Pawar, P.B and Amrutsagar, V.M. (2014). “Apatkalin paristhititil pik niyojan”, Agrowon – Sakal, pp. 011.
Jadhav, J.D., Pawar, P.B and Amrutsagar, V.M. (2014). “Kay mhanta September

112
All India Coordinated Research Project on Agrometeorology
madhye kharif ani March madhye rabi, Adhunik Kisan”, pp. 027-030.
Jadhav, J.D., Pawar, P.B and Amrutsagar, V.M. (2015). “Tapman Wadhiche sankat”, Daily Lokmat, pp. 03.
Thorve, S. B., Upadhye, S. K., Jadhav, J. D and Amrutsagar, V. M. (2014). “Gahu Pikachi Lagwad”, Adhunik Kisan, pp. 03
Radio Talks / TV Interview Every week Agro advisory Broad casted + 2 own programme
Regular weather forecasting on early morning and on every Wednesday at 07:30 pm in Gaonkari mandal on AIR Solapur regarding Agro-Advisory Service.
Thrissur Papers Presented in National and International Symposia / Seminars Sushna, K and Ajithkumar, B. (2015). Forecasting of rice pest and disease
using weather variables. In: 3rd Agricultural Graduates Students Conference on”Impact of Climate Risks on Agricultural & Horticultural productivity”, May 13-14, TNAU, Coimbatore.
Aswany, K. S., Sushna, K., Smitha, K and Ajithkumar, B. (2015). Rainfall variability in India.In: 3rd Agricultural Graduates Students Conference on “Impact of Climate Risks on Agricultural & Horticultural productivity”, May 13-14, TNAU, Coimbatore.
Smitha, K and Ajithkumar, B. (2015).Prediction of pest and disease in cowpea using weather variables. In: 3rd Agricultural Graduates Students Conference on “Impact of Climate Risks on Agricultural & Horticultural productivity”, May 13-14, TNAU, Coimbatore.
Lincy Davis, P., Ajithkumar, B., Kesava Rao, A. V. R and Ajithkumar, B. (2015). Crop weather relationship in bitter guard. In: 3rd Agricultural Graduates Students Conference on “Impact of Climate Risks on Agricultural & Horticultural productivity”, May 13-14, TNAU, Coimbatore.
Technical & Research Bulletins Edited / Co-edited Ajithkumar, B., Karthika, V. P and Rao, V. U. M. (2014). Crop weather
relationships in cauliflower (Brassica oleracea var. botrytis L.) in the central zone of Kerala. AICRPAM, KAU, Thrissur.
Ajithkumar, B., Karthika, V. P and Rao, V. U. M. (2014). Agro meteorological Instruments. AICRPAM, KAU, Thrissur.

113
All India Coordinated Research Project on Agrometeorology
Udaipur
Papers in Peer Reviewed Journals Sarita Muhal and Solanki, N. S. (2015). Effect of seeding dates and salicylic acid
foliar spray on growth, yield, phenology and agro meteorological indices of Brassica species. J. Oilseed Brassica,6(1):1-44.
Narendra Jat., Arvind Verma and Solanki, N. S. (2015). Effect of integrated nutrient management on phenology, growth and dry matter partitioning of wheat (Triticum aestivum L.) under southern Rajasthan condition. Environ. and Ecology, 33(4A):1758-1762.
Papers Presented in National and International Symposia / Seminars Solanki, N. S., Mundra, S. L., Dashora, L. N and Kaushik, M. K. (2014).
Prediction of phenology and productivity of wheat (Triticum aestivum L.) under changing climate scenario. In: National symposium on “Ag. Diversification for for Sustainable Livelihood and Environment Security”, November 18-20, PAU, Ludhiana.
Mundra, S. L., Kaushik, M. K., Solanki, N. S and Dashora, L. N. (2014). Effect of weed management treatment on performance of groundnut and residual effect on succeeding crops. In: National symposium on “Ag. Diversification for for Sustainable Livelihood and Environment Security”, November 18-20, PAU, Ludhiana.
Dashora, L. N., Giriraj Gupta.,. Solanki, N. S., Mundra, S. L and Kaushik, M. K. (2014). Response of sorghum (Sorghum bicolor) genotype to different fertility level in south Rajasthan. In: National symposium on “Ag. Diversification for for Sustainable Livelihood and Environment Security”, November 18-20, PAU, Ludhiana.
Kaushik, M. K., Mundra, S. L., Solanki, N. S and Dashora, L. N. (2014). Weed contril in summer groundnut and its residual effect on follow up maize (Zea mays) crop. In: National symposium on “Ag. Diversification for for Sustainable Livelihood and Environment Security”, November 18-20, PAU, Ludhiana.
Solanki, N. S., Mundra, S. L., Ameta, O. P and Dashora, L. N. (2014). Effect of different weather condition on mustard aphids (Lipaphis erysimi) and painted bug. In: International conference “Changing Scenario of Pest Problems in Agrihorti Ecosystem and their Management”,November 27-29, MPUAT, Udaipur.
Dashora, L. N., Mundra, S. L and Solanki, N. S. (2014). Bio-efficacy of weed control treatment in maize. In: International conference “Changing Scenario of Pest Problems in Agrihorti Ecosystem and their Management”, November 27-29, MPUAT, Udaipur.

114
All India Coordinated Research Project on Agrometeorology
Shailandra Singh., Bhagwat Singh., Dubey, R. K and Solanki, N. S. (2014). Growth and yield of maize as influenced by integrated weed management practies in ghataprabha command area. In: International conference “Changing Scenario of Pest Problems in Agrihorti Ecosystem and their Management”, November 27-29, MPUAT, Udaipur.
Mundra, S. L., Dashora, L. N and Solanki, N. S. (2014). Effect of Tembotrione 42% sc on phytototoxicity in maize and its residual effect on wheat. In: International conference “Changing Scenario of Pest Problems in Agrihorti Ecosystem and their Management”, November 27-29, MPUAT, Udaipur.
Pamphlets
MkW- lEir yky ewanMk ,oa MkW- ,u- ,l- lksyadh 2014- Qlyks esa x/kad dk egRo o mi;ksx] fo”o d`fok lapkj] vDVwEcj&2014 ii 19o 57-
MkW- lEir yky ewanMk] MkW-,l- ds- bUVksfn;k] MkW- ,u- ,l- lksyadh] MkW- /keZiky flag ,oa lksurkjk dfyVk 2015- ykHkdkjh fVdkm [ksrh ds e=a] fo”o d`fok lapkj] ebZ&2015-
Dadheech, R.C., Solanki, N.S., Sumeria, H.K and Twari, R.C. (2015). Water saving management technologies. Readers Shelf,11(8): May- 2015. PN. 37-40.

115
All India Coordinated Research Project on Agrometeorology
Staff position at cooperating centers during 2014
Centre
Positions Sanctioned and Filled (F) / Vacant (V)
Agrometeo-rologist
Junior Agronomist
Senior Technical Assistant
Meteorological Observer
Field Assistant
Junior Clerk
Akola F – – F F –Anand F F V F F F Anantapur V F F F F FBangalore F V F F F FBhubanesh-war F – – V F –
Bijapur F – – F V –Chatha/Jammu F – – F F –
Dapoli F – – F F –Faizabad F F F F F F Hisar V F V F F F Jabalpur V F F V V V Jorhat F – – V V –Kanpur F – – F F –Kovilpatti F F F F F F Ludhiana F F F F F F Mohanpur F F F F F FPalampur F – – V V –Parbhani F – – F V –Raipur F – – F V –Ranchi F F F F F F Ranichauri F V V V V VSamastipur F – – V F –Solapur F V F F V F
Thrissur F – – V V –
Udaipur F – – V V –Total posts sanctioned 25 12 12 25 25 12
Total posts filled 22 9 9 16 15 10
F= Filled, V= Vacant,

116
All India Coordinated Research Project on Agrometeorology
All India Coordinated Research Project on Agrometeorology Centre-wise and Head-wise RE allocation (Plan) for the year 2014-15
(in Rupees)
Sl. No
Name of the center
Pay & allow. TA RC NEH
TSP (100 %)Total ICAR
ShareWorks/Contin-gency
Equip IT
1 Akola 1600000 20000 100000 0 0 0 1720000
2 Anand 2180000 30000 120000 0 0 0 2330000
3 Ananta-pur
1650000 30000 120000 0 0 0 1800000
4 Banga-lore
3600000 35000 120000 0 0 0 3755000
5 Bhubane-swar
1400000 30000 120000 1550000 400000 150000 3650000
6 Bijapur 1620000 20000 120000 0 0 0 1760000
7 Chatha 1200000 30000 120000 0 0 0 1350000
8 Dapoli 1900000 25000 100000 0 0 0 2025000
9 Faizabad 2700000 50000 120000 0 0 0 2870000
10 Hisar 2000000 30000 100000 0 0 0 2130000
11 Jabalpur 1500000 30000 100000 700000 350000 100000 2780000
12 Jorhat 1800000 30000 100000 1500000 1300000 200000 200000 5130000
13 Kanpur 2000000 25000 100000 0 0 0 2125000
14 Kovil-patti
2600000 35000 100000 0 0 0 2735000
15 Ludhiana 3235000 30000 120000 0 0 0 3385000
16 Mohan-pur
2400000 30000 100000 0 0 0 2530000
17 Palam-pur
1800000 20000 100000 400000 375000 100000 2795000
18 Parbhani 1500000 25000 100000 0 0 0 1625000
19 Raipur 1800000 30000 120000 1500000 400000 100000 3950000
20 Ranchi 3200000 30000 100000 700000 0 50000 4080000
21 Ran-ichauri
200000 20000 100000 0 0 0 320000

117
All India Coordinated Research Project on Agrometeorology
22 Sa-mastipur
1370000 30000 100000 0 0 0 1500000
23 Solapur 2080000 40000 120000 750000 125000 3115000
24 Thrissur 1265000 25000 180000 0 0 0 1470000
25 Udaipur 2400000 20000 100000 100000 375000 75000 3070000
Total 490,00,000 7,20,000 27,80,000 15,00,000 70,00,000 21,00,000 9,00,000 640,00,000