Embed Size (px)
Citation preview

All Along the Watchtower: Linear Defenses and the
Introduction of Serfdom in Russia
Preliminary, please do not cite
Andrea Matranga∗
Timur Nathkov†
August 29, 2018
Abstract
Why did Russia enserf its previously free peasants, just as Western Europe was un-
dergoing the opposite transition? Domar argued that Russia’s low population density
would have resulted in a high equilibrium wage, and therefore created the incentives
for the nobility to restrict labor mobility, so as to appropriate the agricultural surplus.
However, while this explains the cross-sectional pattern, it cannot explain why serfdom
was not reintroduced in the west after the Black Death. In this paper I propose a new
theory, that argues that serfdom was necessary to ensure that the defense cordon against
the Tatar slave raids from the south could be effectively manned. In support of my the-
ory I demonstrate a geographic association between serfdom and the sequence of linear
defenses employed. I also deploy spatial methods to calculate the optimal invasion routes
for Tatars, as well as the optimal defense lines to block the raids. I find that modern
patterns of development are significantly correlated with calculated defense lines towards
the South, where nomadic raids made the cordon defense necessary, but not towards the
West, where invaders had extensive logistical tails and could be effectively parried by
blocking only the major roads.
∗Chapman University†Higher School of Economics
1
1 Introduction
Until approximately 1550, the Russian lands were overwhelmingly farmed by free tenant
labor (Klyuchevsky, 1911). The Russian peasant did owe rent to his landlord, but he
was free to move at any time, and as a result his rent was determined largely by market
forces. These freedoms were gradually removed over the course of the following century,
so that by 1650 the peasant was bonded to his landowner, and essentially at his complete
mercy (Khodarkovsky, 2002). This tragic loss of freedom is all the more puzzling given
that most of Europe was experiencing the opposite trend, abolishing the worst strictures
of feudal societies, and letting the peasants relocate at will.
The traditional explanation for the enserfment of the Russian peasant was provided
by (Domar, 1970), who argued that since land was abundant in Russia, free agricultural
labor would have resulted in very high equilibrium wages. Landowners therefore had very
strong incentives to collude and keep the labor force enserfed. In the West on the other
hand, population density was much higher, so that wages were in any case reasonably
close to the subsistence limit. Under these conditions, it made no sense to spend a lot
of time and effort controlling peasants and restricting their movement, and it was easier
and cheaper to simply pay them the fair market wage.
The problem with this theory (as Domar himself pointed out), was that it would
predict a return to serfdom in Western Europe after the Black Death essentially halved
its population, while instead the process of serf enfranchisement continued, indeed in
many cases accelerated. Domar therefore proposed that the effect of population density
on the conditions of the farming population was fundamentally ambiguous: on the one
hand, a lower population density increases the equilibrium wage that agricultural labor
would receive if it were free, but on the other it also increased the incentives of the landed
class to dramatically restrict their freedom.
I propose a new theory for the introduction of serfdom in the Russian lands, which
generates unambiguous predictions on which types of societies should adopt serfdom, and
which should allow free movement of agricultural labor. Central to my theory is the fact
that the decision of laborers to locate in different areas can impose important defense
externalities on their fellow citizens. In the Russian case, the primary threat came from
Tatar raiders to the South, who would regularly scour the countryside in cavalry raids
up to 80,000 men strong (Khodarkovsky, 2002). Their primary objective was capturing
2
slaves, which were then mainly sold onwards to the Ottoman empire. Since the raiders
had superior mobility and no logistical tail, it was impossible to block these raids by
building fortresses on the main lines of communication – the raiders could simply bypass
such point defenses. An efficient way to defend against such raids was by adopting
a cordon defense (Clausewitz and Howerd P., 2007), which in the Russian case meant
building – and manning – a continuous series of ramparts and palisades stretching over
1000 km.
The fundamental theory advanced by this paper is that while this system could po-
tentially secure an enormous area, it was unfortunately incompatible with the free move-
ment of labor. Crucial to the security of this system was its spatial continuity: the
Tatars would certainly find any gaps and exploit them, putting in jeopardy the entire
population of the state. Inevitably, parts of the defense line would need to cross areas
that were less fertile than others, where the marginal productivity at any given popu-
lation density would necessarily be lower. If peasants decided to leave for more fertile
areas – which paid higher wages – the allocative efficiency of the economy would increase,
but a dangerous gap would have been opened in the defenses. For the labor of those
peasant was necessary to ensure that the local land owners/soldiers had the means to
afford horses and arms, as well as report for duty on the wall for months at a time. A
theoretical alternative would have been to let peasants reallocate as they pleased, and
then tax them (or the landowners), so as to pay salaries to a dedicated military class.
Indeed this was the system towards which nearly every Czar from Peter I onwards tried
to laboriously maneuver Russia. But in the 16th century, no European country had the
state capacity to efficiently tax a country as agrarian and dispersed as Russia.
To support my theory, I first analyze the Russian defense system, and show how the
military and productive spheres interacted within the region. Then I draw on records of
serfdom from the 19th century to show that the regions with the highest prevalence of
serfdom were those that had to support fortification lines. Specifically, areas that were
part of the active defense line in the 16th century – when the army was organized along
strictly feudal lines – maintained the highest percentage of private serfdom, while areas
that were part of the 17th century defense lines – when the army was undergoing a series
of centralizing reforms – maintained a very high percentage of state serfs (a more liberal
land tenure regime).
3

The possibility exists that the correlation between serfdom and the defense lines may
be due to some other underlying variable, which has a causal effect on both. For example,
certain areas might be more fertile, making both their defense important, and the use
of serfs profitable. To avoid possible endogeneity concerns, I construct a novel measure
for the suitability for fortifications, which combines the direction of the main nomadic
threat, their most frequent target, and the network of rivers which determined both
the best axis of attack, and the cheapest fortification construction costs. I then show
that areas that were more suitable for fortifications still have more night lights today.
This is because the defense line was punctuated by fortified towns, which then persisted,
becoming the cities of today. This finding highlights the extent to which the Czar was
willing to compromise the economic efficiency – in this case, the placement of towns –
to achieve defense goals, and that this particular compromise was only enacted on the
southern front, the direction of the nomadic threat.
This research improves on the existing literature along several axis. First of all, I
introduce a new theory for the introduction of serfdom, that differs from the existing the-
ories by assuming that – aside from distributional considerations between social classes
– rulers had strong preferences over the actual geographic location of their agricultural
labor force, and that these preferences were related to the need to efficiently defend the
borders. Essentially, I argue that whenever the free movement of labor would result in a
geographic distribution of the population which severely complicates the defense of the
state, rulers will have a powerful incentive to limit the mobility of the population, poten-
tially by enacting serfdom. Another way of viewing this is by saying that in deciding to
move away from low-wage (but strategically important) districts, workers are neglecting
the negative security externality that they are imposing on the rest of the population.
In this interpretation, accepting a ruler which imposes serfdom is a crude coordination
device in the face of an enemy more fearsome than indentured work.
I also show how this theory can help understand the differential impact of the intro-
duction of gunpowder on serfdom between Eastern and Western Europe. In the West,
medieval warfare was based on extended cavalry raids (DeVries, 2003). While soldiers
lived as settled landowners during peacetime, for the purpose of warfare they became
effectively pro tempore nomads, scouring the land untrammeled by supply lines or fixed
bases of operations. While the European topography did not require continuous lines of
4

fortifications, defending effectively against such a threat still required some soldiers (and
their support population) to live in some areas where it was not economically efficient to
do so. When artillery was introduced, cavalry armies were robbed of their operational
mobility advantage, and in particular became dependent on roads. Thus, strong fortifi-
cations along the main trade routes were sufficient to create impermeable frontiers, even
though the space in between was technically passable. As a result, Western European
states concentrated resources in improving their urban centers, and could afford to let
the rural population allocate according to productive efficiency. Along Russia’s southern
border however, the lack of natural obstacles and the proximity of the steppe meant that
cavalry remained competitive long after the introduction of gunpowder, and the Russian
state had to control the disposition of peasants to insure the lines of defense could be
manned and supplied.
From a methodological standpoint, this paper is the first to calculate both the axes of
attack, and the optimal fortification lines to defend against a specific, directional threat,
rather than using generic measures of vulnerability such as ruggedness (as used by Nunn
and Puga (2012). This method can be adapted and expanded to modern military threats
in a variety of setting, both historical and contemporary. For example, many conflicts
in Africa is centered around the use of ”technicals” (commercially available 4x4 trucks
with a heavy weapon bolted on the back). These vehicles are mostly employed for raids
and armed reconnaissance, essentially fulfilling light cavalry missions.
2 Literature Review
Domar (1970) is arguably the seminal paper for the discussion of Russian serfdom within
economics. As discussed in the introduction, Domar argues that the fundamental driver
of transitions in and out of serfdom are changed to the population density, either due
to fertility/mortality, or due to the acquisition and loss of new lands. Domar’s model
was essentially a formalization of Klyuchevsky’s 19th century work. A number of recent
works have sought to test the Domar model empirically. Duleep (2012) showed that
the rigidity of India’s caste system covaries across both space and time with the local
land/labor ratio. Fenske (2014) found a similar relationship held amongst ethnic groups
in Nigeria.
During the ’70s and ’80s, Marxist historians such as Robert Brenner contested the
5

assumption that demographics were behind the end of serfdom, instead arguing for the
primacy of micro-class relations: the interaction between the political capacities of peas-
ants and landowners in different regions. This thesis was itself attacked by Postan and
Hatcher (1978), who instead argued for the primacy -with due caveats- of the interaction
of Malthusian and economic factors. Specifically they argued that the drop in popula-
tion caused by the Black Death increased the bargaining power of the labor force, which
succeeded in securing more rights. A recent addition to this literature is Peters (2016),
which argues that serfdom was maintained where rulers had few alternatives for raising
funds, and provides evidence of this using a dataset of serfdom prevalence in Europe.
Dari-Mattiacci (2013) proposed that serfdom was less likely for task where effort was
harder to observe, and showed that both in Africa and in Ancient Rome, slaves with
hard to observer occupations were more likely to be manumitted.
Kaufmann and Pape (1999) argued that the abolition of slavery was first and foremost
a moral action, which followed decades of patient and persistent persuasion by a cadre
of often religiously motivated campaigners, who slowly but surely forged a sufficiently
wide alliance of interests to finally abolish the odious institution. However, while the
history of anti-slavery campaigning is clearly crucial for understanding the who and how
of abolition, it cannot explain why such campaigners racked success upon success for
almost 500 years with very little backsliding to speak of. Haskell (1985) also argued
that the abolition of slavery was first and foremost a moral shift, but argues that this
shift was caused by the diffusion of a capitalist morality. Indirectly he therefore ties the
spread of free labor to the progressive opening of the global trade routes during the age
of discover.
Acemoglu and Wolitzky (2011) provide a generalized model of forced labor, which
they frame as a principal agent model in which coercion allows the landowner to impose
contracts which agents would not accept of their own volition, but which still must be
compatible with keeping the serf alive. This formulation allows the authors to develop
a number of empirical predictions such as that more productive producers should use
more coercion with their workers, which can result in lower welfare for them, despite
simultaneously receiving high compensation as well.
Importantly, all of these models consider only the sphere of production as relevant
for determining whether labor will be free or not. In contrast, I note that the decision
6

to enserf peasants also has important implications for the defense of the realm, and that
serfdom might be adopted even when economically efficient, if it is crucial for keeping
enemies out.
Parallel to the research effort on the causes of coerced labor, a growing literature has
analyzed its long run effects. Dennison (2011) analyzed archival sources to reconstruct
the demography, economy and sociology of a specific feudal estate in Russia. Markevich
and Zhuravskaya (2017) looked at how agricultural, trade, and industry all gained con-
siderably after the abolition of serfdom. Buggle and Nafziger (2015) examined the long
shadow cast by serfdom on even recent economic outcomes, and their empirical analysis
found suggested that the main transmission mechanisms were low provision of public
goods, lower urbanization, and delayed industrialization.
3 Historical Background
Figure 1: Timeline of relevant Sovereigns, Labour Arrangements, Fortified Lines, Conflicts, andMilitary organization.
From the 9th century onwards, the East Slavic tribes had been tied in a loose con-
federation of principalities known as Kievan Rus (Klyuchevsky, 1911). At its height in
the 11th century, Rus stretched from the Baltic to the Black Sea, and from the Vistula
7

to the Volga. Its main source of wealth was its control of the river trade routes through
which furs and other forest products flowed south from Scandinavia to the Byzantine
empire. The capital was in Kiev, which controlled trade along the Dniepr river, and
other important centers were Novgorod in the northwest, and Vladimir in the Northeast.
As invaders from the East continued to put pressure on Constantinople, the trade net-
work began to brake down, and Rus fell into decline. Peripheral principalities fought for
greater independence from the center, and the confederation descended into a series of
armed conflicts of varying intensity.
It was against this backdrop that the Mongol invaders burst onto the scene. In
1237 a Mongol army under Batu Khan invaded Kievan Rus (Saunders, 2001). They first
thoroughly ransacked the Vladimir Suzdal region, and cowed Novogorod into submission.
Then, in 1240 they sacked Kiev, brought under their control the entire region. This led to
two and a half centuries of the so-called Tatar Yoke, where all the Russian principalities
were forced to pay heavy tribute to the Mongols, and occasionally participate in their
military campaigns.
It is important to understand that the Mongols did not occupy Russia in the same
sense that the Germans occupied France. By and large, the areas under their control
were left to be governed by their traditional power structure, with no permanent military
presence. So the problem faced by the Russians was not how to kick the Mongols out,
but rather how to avoid retribution if they ever decided to stop paying tribute.
Amid this general background, Moscow slowly but steadily rose in importance. The
statelet arose in 1283, from the division of the lands of Alexander Nevsky between his
sons (Khodarkovsky, 2002). Daniel, being the youngest, received the least desirable prin-
cipality. By vigorously courting favor with the Mongols, shrewd political maneuvering,
and occasional open conflict, the tiny principality was able to secure its safety from both
Tatar raids and neighboring Russian principalities, eventually obtaining the right from
the Mongols to collect the tributes owed from the other principalities, before forward-
ing them to the Khans to the South. This right allowed Moscow to grow richer and
more important, so that over the next two centuries it was able to annex its main rivals:
Novgorod, Vladimir and Tver.
Having secured their position of supremacy over the other Northern Russian princi-
palities, the next logical step for the Moscow Princes was to shake off their submission
8
to the Mongols. After an initially promising, but ultimately doomed attempt by Dmitry
Donskoy in 1380, the turning point came in 1480, when the forces of the Golden Horde,
angered by Ivan III’s repeated refusal to pay tribute, marched on Muscovy with 100,000
troops, their Khan Ahmat at their head (Khodarkovsky, 2002). They had secured an al-
liance from the Polish king Casimir IV, who was to attack Muscovy simultaneously from
the west. Ivan’s reaction was two-fold. First, he convinced the Crimean Khanate, which
by that point had broken off from the Golden Horde, to raid southern Poland-Lithuania,
tying down the Polish army and preventing them from launching their western attack.
Second, he divided his forces all along the Oka river, reinforcing the garrisons at Kolomna
and Serpuchkov.
Ahmat’s scouts reported that the Oka was strongly held, so the horde tried to bypass
the defenders by detouring to the west, in hopes of crossing the lightly defended Ugra
river. However, Ivan had already sent forces commanded by his son and brother to
Kaluga, the fortress at the confluence of the Ugra and Oka rivers. From this strategic
position, they could easily cover the fords Ahmat was planning to use, and his advanced
guard had to abandon their attempts to force a crossing in the face of stiff musketry fire,
and wait for reinforcements. Over the next several days, both armies took positions on
the opposite riverbanks. Neither side was sufficiently confident to attempt an opposed
river crossing, so the expected battle turned into a waiting game. Ahmat had a far
larger army, but Ivan had musketry and artillery units in good defensive positions, which
minimized their exposure to the Horde’s archers. In early November, both sides lost their
nerve almost simultaneously. Ivan was worried that the river would freeze and enable
Ahmat to cross easily, and therefore retreated towards more defensible ground. Ahmat
was finding it hard to feed his army, and suspected the retrograde movement was a trap.
In the end both armies essentially ran away from each other, with neither side giving
chase. On their way back to the Caspian steppe, the horde plundered a few Lithuanian
towns as retaliation for Casimir’s failure to provide the required support.
This tactical draw, which later became known as the Great Standoff on the Ugra,
was in fact a resounding strategic victory for Muscovy. Ivan III had now been refusing
payment to the Golden Horde for a decade, and the Khan had been unable to punish him
for it. Not only had he failed to reach Moscow, but he was even incapable of undermining
its economic base by ravaging its countryside (Dennis, 1985). This defensive campaign
9

Figure 2: The standoff on the Ugra River of 1480, as depicted in a 16th century manuscript. Notethat while the two armies appear to be equipped very similarly, only the Russian (on the left) haveartillery and arquebuses.
10

taught Ivan and all future Moscow rulers three important lessons. First, it showed that
defeating the nomads did not require a pitched battle. Given the short campaign season,
making an invading army waste time was almost as good as defeating it (in modern
warfare this is called a ”mission kill”). Second, it was crucial that the defending armies
present a continuous line of defense along all possible avenues of approach. This would
prevent the nomads from exploiting their superior mobility to outflank single fortresses.
Third, the defense line had to be sited so as to cover not only the main population
centers, but also the farmland from which the towns – and the fortification line itself –
drew their support. These three principles would guide Russian defensive policy agains
nomadic raids until all steppe areas were eventually annexed, some three centuries later.
By the time of the Great Stand on the Ugra, the Golden Horde was already declining
due to internal strife. The inconclusive campaign accelerated this trend, and by 1502
their capital of Sarai had been sacked by the Crimeans, who then became the dominant
nomadic force in Ukraine and modern southern Russia (Khodarkovsky, 2002). Freed
from their common enemy, the alliance with Muscovy promptly broke down, and the
Crimeans started a series of raids that lasted until their eventual annexation in 1783. It
was completely unrealistic for the Crimeans to hope to submit Moscow as the Mongols
had done. However, they could plunder their lands and sack their cities, which was the
next best thing.
The Crimean peninsula was an ideal base of operation for Tatar slave raids. While it
may looks small next to Russia and the Ukraine, at 27,000 sqkm it is slightly larger than
Sicily. It has a mild climate, which ensured an abundance of winter pasture for up to
several hundred thousand horses. The steppe areas of Southern Ukraine the north were
even more extensive, and while they were largely impracticable in winter, they could
support millions of horses from spring to fall. Crimea was separated from the mainland
by an isthmus only 8km wide, which gave almost the same defensive advantages of
being on an island, while allowing the movement of men and their horses (both for
the normal transhumance, and for raiding expeditions) without need for a navy. The
coastline had several deepwater ports, which provided excellent markets for the export of
slaves to the Ottoman empire (much of it mediated by Genoese merchants). Finally, its
position between the Dniepr and Don gave it ready access to the watershed in between
the two rivers, which allowed them to move north without having to cross any significant
11

geographic obstacles (Klyuchevsky, 1911).
The raids could range from simple family groups sending a few dozen riders to pick
off farmers who had strayed to far from their settlements, all the way up to well co-
ordinated operations consisting of up to 100,000 riders advancing in multiple columns.
For these larger raids, a common strategic plan would see three or four columns of 20-
30,000 advancing along parallel lines. Whichever column encountered the main Russian
force would establish and maintain contact, essentially trying to waste the defenders
time. Meanwhile the other two or three columns would strike deep into the enemy farm-
land, fanning out in groups of several hundred to capture as many slaves as possible
(Klyuchevsky, 1911). Then the columns, swelled in size by their captives, and weighed
down by their loot, would start the difficult trek home, usually under constant attack by
Muscovite forces which tried to free the captives. The Crimean Tatars launched large
scale raids in 1535, 1539, 1542, 1544, 1552, 1553, 1555, 1556, 1560, 1563-65, 1568-74,
1576 and 1580, or 21 years out of a 45 year period.
These raids followed a series of trails, or Shlyas, the most famous of which was the
Muravsky Trail. These routes followed for the most part the watersheds between the big
rivers, though they would occasionally cross them at convenient fords if it avoided a long
detour, or a strongly defended area. Each route should not be understood a single road,
but rather as a braid of roughly parallel, but intersecting trails, amongst which traders,
troops, and animals selected the most appropriate one based on which ford was open,
which streams were flooding, and which plains had good pasture.
The main objective of the raids was the taking of slaves, that were partly used locally,
but mainly and sold on to the Ottoman Empire through the intermediation of Genoese
traders in Kaffa (today Theodosia). Slaves were a versatile, easily marketable resource,
not least because Moscow had enacted a specific tax to pay for the ransom of captives
who’s families were unable to pay the price. Estimates of the total number of captives
taken vary widely, with one source claiming that 3,000,000 slaves were taken from all
Slavic lands from the 14th to the 17th century, while another account is for 150,000-
200,000 between 1600 and 1650 alone (Davies, 2004). Whatever the precise number,
these flows were enormous when compared to the total population for Russia in 1600
which was around 13 million, the vast majority of which was either incapable of surviving
a trek of 1000 km, or else lived too far North to be under any threat from raiding parties.
12

For able bodied men and women along the southern steppe frontier, raids parties must
have been an ever present and terrifying danger.
The initial Mongol campaigns and the nearly continuous slave raids had depopulated
a very vast area around the Crimea. Within 500km of the Black Sea, virtually all
settlements had either been torched or abandoned. This vast area,,comprising some of
the best black earth farmland in Russia, was known at the time simply as the ”Wild
Fields” and was used only for summer pasture by the Nomads, or traversed by small
groups of enterprising hunters and trappers.
To defend against this extreme level of threat, the Russians tried to refine and sys-
tematize the lessons learned on the bank of the Ugra. The river fortresses were improved,
and their garrisons expanded. While this afforded a measure of security, the Princes of
Moscow (and later the Russian Czars) faced a fundamental logistical asymmetry working
against them. While they could continue to parry the blows as best they could, there was
simply no way for them to strike back at the Crimeans directly. Perekop was 1000 km
from the Oka river, or at least 50 days of marching for infantry. As the country thawed
from South to North, the nomads could just about reach Moscow by starting early in
the campaign season, but the Muscovites had to necessarily wait longer before starting
out.
Further, reaching Perekop required passing through the Wild Fields, where no food
could be bought or requisitioned, given that they were nearly sterilized of any farming
communities. Again, the nomads could drive herds of sheep or horses along with them
to sustain them during their approach march, through what was essentially an immense
pasture, but the cereal-based agriculture of the Moscow state provided no such quantities
of livestock. Without the ability to strike back against the Nomadic economic infras-
tructure, it was only a matter of time before a plague, war, or revolt would sufficiently
weaken the defenses on the Oka, and then the Crimeans could again invade Muscovy and
cripple it, perhaps forever.
Since mounting an expedition against Perekop directly was out of question, the ob-
vious solution was gradual expansion. Moscow would go on to establish further defense
lines to the South, consolidate them over a few decades, and repeat the process. Over
a few centuries, this would bring them within striking range of Perekop, and allow the
annexation of Crimea. Meanwhile, it would expand the area controlled by Moscow, and
13

make financing the defenses easier. While this strategy was viable, it faced the complica-
tion that the Oka was the only river cutting the entire theater of operation from East to
West. The other major rivers of southern European Russia all flow from North to South,
and while some of their tributaries do flow in the right direction, inevitably a gap 40 or
50 km wide separates their headwaters. Further, most of these tributaries have smaller
catchment basins than the Oka, and are correspondingly shallower, narrower, and slower.
To overcome this difficulty, the Czars essentially built their own versions of the Chi-
nese Great wall, though on a smaller scale (Klyuchevsky, 1911). The first such work
was approximately 300 km long, and was built 30 to 50 km south of the existing Oka
riverbank lines. Where it could, it followed any small watercourse that happened to
flow in the right direction, but otherwise it used a mixture of earthen ramparts, areas
intentionally left forested or newly planted, palisades, and abatis (a continuous line of
felled trees in the direction of the enemy, with their crowns forming an interlocking mass
of branches). Along the line, a series of forts of various sizes were built to house the
garrisons and control strategic passages. The construction was completed in 1566, and
on this same pattern further fortifications were built further to the south, and farther to
the east.
Over this same period, the life of Russian peasants underwent a fundamental trans-
formation. Serfdom and slavery were relatively common in the Oka-Volga triangle before
the 12th century, but the local landowners gradually implemented a policy of attract-
ing farmers to their largely unsettled land by promising them hereditary use of land at
moderate fees, as well as wide personal freedoms and self-government (Khodarkovsky,
2002). Many of the immigrants were former serfs from Germany or the Ukraine. These
privileges had initially been restricted to the newcomers, but overtime they were largely
extended to the native population as well. After all, just like the newcomers, they too
could run away and obtain better conditions somewhere else.
Overall, this transition towards freer agricultural labor could be said to have had
essentially no losers, except perhaps the landowners in the areas from which these migra-
tory streams originated. The newcomer received underpriced lands, and greater personal
freedom. The landowner received low, but positive rents from lands that had previously
remained uncultivated. And the native population received greater economic and per-
sonal freedoms, due to their raised awareness of what they could gain by emigrating.
14

Quite simply, the size of the pie had grown larger, so everybody could enjoy a larger
slice.
This trend reversed in the second half of the 15th Century, when the Czars enacted a
series of policies which chipped away at the acquired freedoms of the peasants. During the
first stages of this process, the new regulation mostly restricted the ability of the peasants
to abandon the lands they rented before they had paid all debts to their landlords, as
well as any other outstanding service obligations. Ivan III law reform of 1497 restricted
the peasant’s freedom to change landlord to the two weeks before and after Saint Yuri’s
day, or November 29th, when the agricultural year was over and all dues were accounted
for. From then on, the major steps all occurred at roughly 50 year intervals. The 1550
law code reform of Ivan IV confirmed this limitation, and also stated that peasants were
required to pay an extra fee to their landlord to be allowed to move. In 1581 the Czar
declared a temporary ban on peasants changing landlords (the ”Forbidden Years”), which
was then made permanent in 1597 by his successor Boris Godunov. However, the statute
of limitation on runaway serfs was five years, and Russia at this stage was a large country
with a permissive rule of law along its frontiers, so enterprising serfs could still go on
the lam for half a decade and acquire freedom. This loophole was eventually closed by
Czar Alexis I in his 1649 law code reform, which eliminated the status of limitation on
runaway slaves, and further punished anybody who knowingly harbored them.
3.1 Gunpowder and the Introduction of Serfdom in Russia
The Russian system of anti-tatar defenses based on uninterrupted lines was entirely de-
pendent on the vast superiority of Russia in terms of firearms. Both artillery and muskets
infantry were distributed along the line, and both were under direct supervision of the
Czar (the cavalry forces were instead typically minor gentry commanded by noblemen).
These weapons were extremely powerful in prepared positions. Inside a fortification, the
soldiers were almost entirely safe from arrows. The static positions could be supplied
with far more ammunition than could be carried on campaign. And the lines were invari-
ably protected by natural or artificial obstacles, which made surprise attacks impossible,
and force any assault to spend a lot of time at the optimal range for engagement from
the line.
Despite these benefits, a cordon defense is in itself extremely risky. Defending the
15
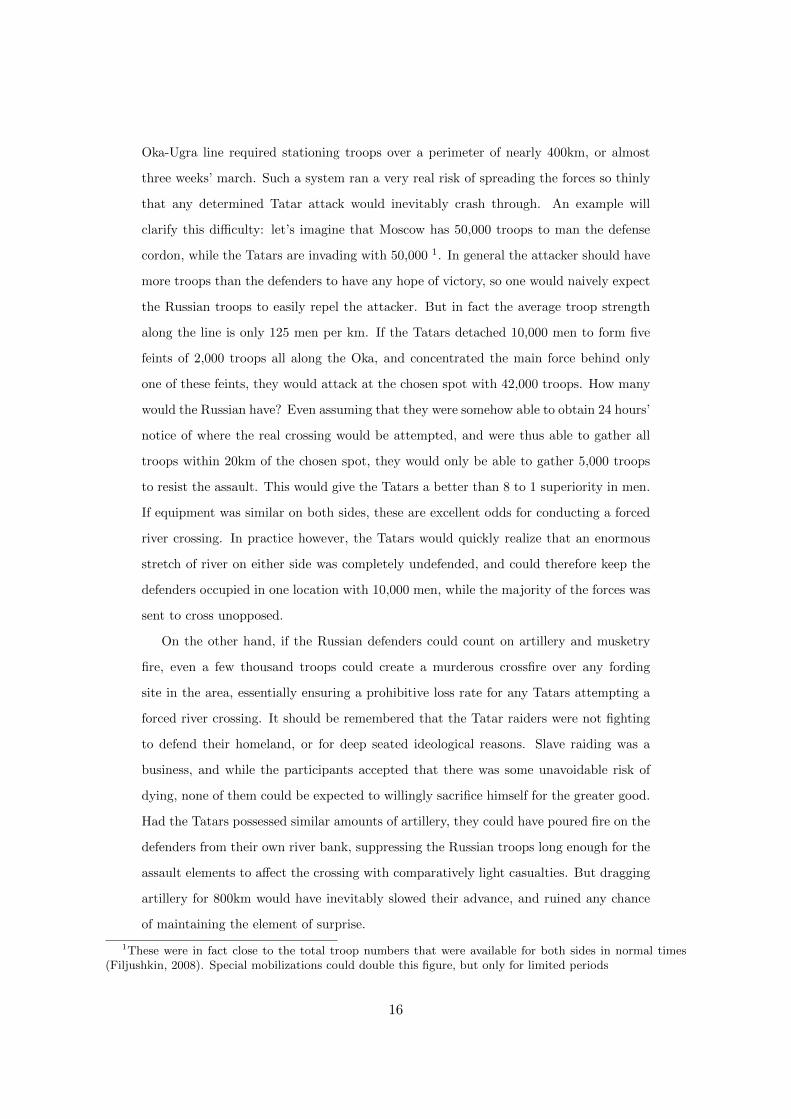
Oka-Ugra line required stationing troops over a perimeter of nearly 400km, or almost
three weeks’ march. Such a system ran a very real risk of spreading the forces so thinly
that any determined Tatar attack would inevitably crash through. An example will
clarify this difficulty: let’s imagine that Moscow has 50,000 troops to man the defense
cordon, while the Tatars are invading with 50,000 1. In general the attacker should have
more troops than the defenders to have any hope of victory, so one would naively expect
the Russian troops to easily repel the attacker. But in fact the average troop strength
along the line is only 125 men per km. If the Tatars detached 10,000 men to form five
feints of 2,000 troops all along the Oka, and concentrated the main force behind only
one of these feints, they would attack at the chosen spot with 42,000 troops. How many
would the Russian have? Even assuming that they were somehow able to obtain 24 hours’
notice of where the real crossing would be attempted, and were thus able to gather all
troops within 20km of the chosen spot, they would only be able to gather 5,000 troops
to resist the assault. This would give the Tatars a better than 8 to 1 superiority in men.
If equipment was similar on both sides, these are excellent odds for conducting a forced
river crossing. In practice however, the Tatars would quickly realize that an enormous
stretch of river on either side was completely undefended, and could therefore keep the
defenders occupied in one location with 10,000 men, while the majority of the forces was
sent to cross unopposed.
On the other hand, if the Russian defenders could count on artillery and musketry
fire, even a few thousand troops could create a murderous crossfire over any fording
site in the area, essentially ensuring a prohibitive loss rate for any Tatars attempting a
forced river crossing. It should be remembered that the Tatar raiders were not fighting
to defend their homeland, or for deep seated ideological reasons. Slave raiding was a
business, and while the participants accepted that there was some unavoidable risk of
dying, none of them could be expected to willingly sacrifice himself for the greater good.
Had the Tatars possessed similar amounts of artillery, they could have poured fire on the
defenders from their own river bank, suppressing the Russian troops long enough for the
assault elements to affect the crossing with comparatively light casualties. But dragging
artillery for 800km would have inevitably slowed their advance, and ruined any chance
of maintaining the element of surprise.
1These were in fact close to the total troop numbers that were available for both sides in normal times(Filjushkin, 2008). Special mobilizations could double this figure, but only for limited periods
16

Therefore it was only when firearms became relatively common in the late 15th cen-
tury that a cordon defense became possible. However, this system still required a very
large number of soldiers to report for duty on time each year, in a precisely arrangement,
and ready to fight to the death against an enemy with complete manpower superiority.
How could such a force be sourced? Today, the problem would be solved by imposing a
proportional (or indeed progressive) income tax on all citizens, and by using part of the
revenue to pay for the salaries and equipment of a dedicated professional army, which
could then be ordered to take positions along the chosen lines of defense. The needs
of the soldiers would be provided by a dedicated logistical service, that would buy food
from farms close to the line and also pay for its transportation where it was needed.
However, this modern option would have been entirely impracticable in 15th or even
18th century Russia. First of all, the economy of the country was overwhelmingly based
on subsistence agriculture, and it is exceptionally difficult to raise revenues from produce
that for the most part never reaches even the local town market. Secondly, even if
sufficient revenues could on average be raised, it would have been almost impossible for
the central government to guarantee payment of the soldiers in the face of the occasional
famine. Thirdly, no European power of the time had yet developed the logistic efficiency
to supply tens of thousands of troops dispersed over hundreds of kilometers. And fourthly
even if the troops could have been stationed and supplied where needed, they would have
been unlikely to put up a spirited defense.
A feudal system provided the obvious answer to these problems. Having decided
which soldiers should have been stationed in which section of the fortifications, it was
a comparatively simple affair to assign them lands in the general vicinity of their duty
station. The only ”tax” required of these soldiers was their reporting for duty when
requested, something that was easy to unambiguously observe (Klyuchevsky, 1911). Ex-
cept in extreme cases, the soldier was responsible for smoothing his own income stream
in the face of bad harvests, and in any case most of his equipment was durable. He
was required to bring enough food to support him throughout the season from his own
farm, obviating the need for logistical complexity. And finally, since both his land and
his family would normally be quite close to his duty station, he could be expected to be
naturally inclined to put up a spirited defense.
In short, the feudal system provided the Moscow government with a system that was
17

fairly profligate in land use (it would ordinarily provide less than one soldier per square
kilometer), but incredibly economical in terms of both coin and administrative capacity.
The only thing needed to ensure the success of the scheme was that the soldiers be able
to derive the income needed for their support, without the need to actually be present
for most of the campaign season. Unfortunately, this meant that the cordon defense
system, as implement by Muscovy first and Russia later, was in compatible with the free
movement of labor.
The path of the fortification line was decided mainly in order to minimize the total
length needed to block all avenues of attack, and so as to exploit the natural obstacle
present. It was only natural that certain section of it would be more productive than
others, either due to differences in soil fertility itself, or because of differences in the
access to market for agricultural surplus. Naturally those soldier-landowners located in
more desirable lands would be willing to offer higher wages than those with comparatively
worse land holdings. In a situation in which labor was scarce, the unlucky landowners
with undesirable plots would not be able to find anyone willing to work their lands at
the wages they offered. It would thus be impossible for them to report for duty on the
lines of fortification, dangerously weakening a section of the frontier.
The obvious solution to this problem was for Moscow to make it impossible for peas-
ants to move from one place to another, thus ensuring that all along the defense line
landowners could in fact derive enough income to take their stations.
3.2 Geography of serfdom and defense lines
In this preliminary analysis, I will show that serfdom is closely correlated with the defense
lines from a geographic standpoint. To this end I use the tracks of the defense lines
from (Nossov, 2006), and the data on Serfdom from Markevich and Zhuravskaya (2017).
There were four main lines of defense used by Russia in their defense against Crimea.
The first was the Bereg (russian for ”shore”) line, built directly on the Oka river –
which is unique in cutting the theater of operations from east to west. The next line –
the Zasechnaya Cherta, or Tula line– was built approximately 100km south of the Oka,
using whatever water courses happened to be convenient, but also cutting across open
ground for considerable stretches. It was completed in 1566. The third line was built
almost 500km south of the Tula Line, and was called the Belogorod line. It was 800km
18

long, and completed around 1650. Thirty years later Russia erected the 500km long
Izium Line, closing a triangle of land between the Seversky Donets and the Oskol rivers,
with the third side formed by the Belgorod line Itself. This last line was now within
150km of the black sea, and provided the final springboard needed for definitively boxing
in the Crimean raids. The peninsula itself however would not fall until the close of the
18th century.
It is important to understand that defending these lines was not a matter of simply
posting men on them uniformly and waiting for the Tatars to do their worst. Early
warning of raid size and axis of advance was essential, and to this end an extensive
network of patrol routes and guard posts was stationed up to 600 km south of the defense
line proper, as detailed in Figure 3 (adapted from Margolin (1948)). The operational
complexity of the defense plan is far greater than anything in use in Western Europe at the
time, which goes some way towards explaining the need for centralized administration in
Russia. To ensure this complex and dispersed war machine could feed itself, it was crucial
that the agricultural labor force could be relied upon to remain where it was needed.
Since Moscow lacked the state capacity to raise sufficient inducements to motivate them
to do so, its only alternative was to force them.
Figure 4 overlays the defense line on a map showing the fraction of the rural popu-
lation which in 1859 was composed of private serfs, i.e. peasants which were considered
the private property of the landowner. This was the most repressive form of serfdom
widely practiced in Russia, and as shown by the map is associated mainly with the Oka
and Tula lines, which were the main line of defense during the 15th, 16th and early 17th
centuries, when most of the garrison was composed of pomeshchik, soldiers who were
given lands to support themselves, and were in return required to provide service during
approximately half of the campaign season.
Figure 5 shows the equivalent pattern for State Serfs, a category that was created
by Peter the Great. Though their precise rights varied through time, state serfs in
general paid taxes to the state directly, and were in principle free to change residence
and occupation. Their land plots were on average around twice as large as those of
private serfs, and their standard of living was correspondingly higher. As is clear in the
figure, state serfs were concentrated along the Belgorod and Izium defense lines, which
were the active frontier when the army became more centralized.
19
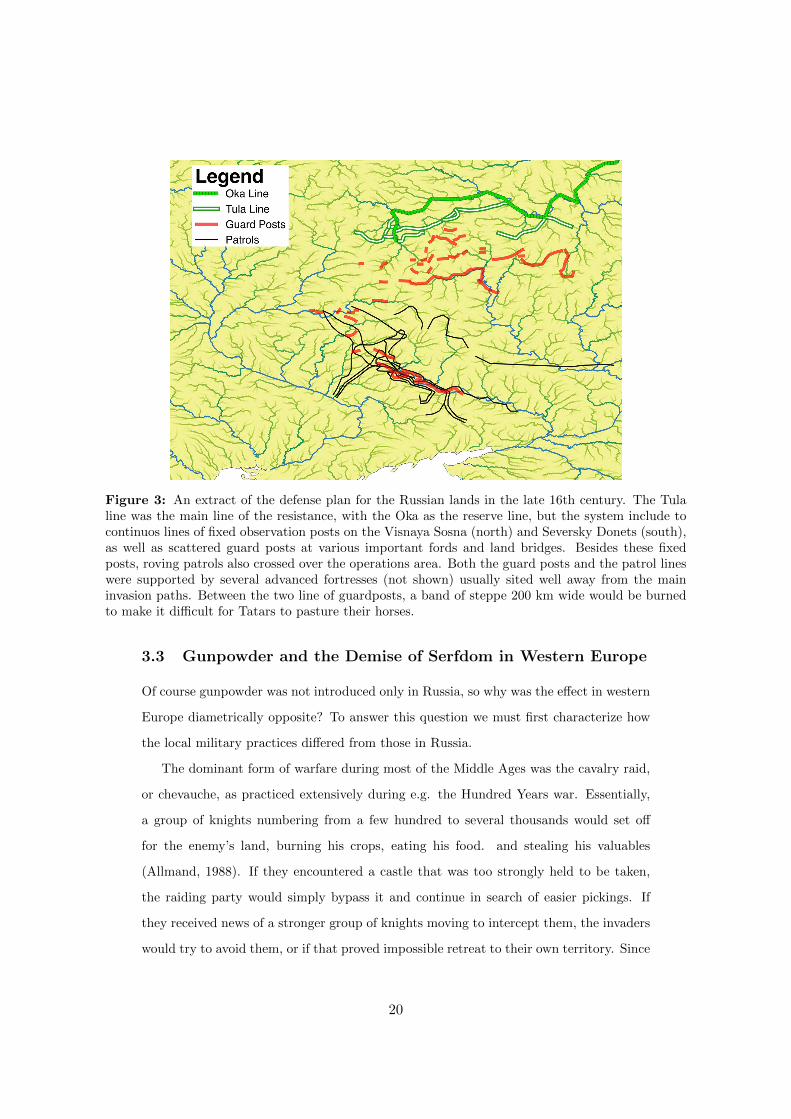
Figure 3: An extract of the defense plan for the Russian lands in the late 16th century. The Tulaline was the main line of the resistance, with the Oka as the reserve line, but the system include tocontinuos lines of fixed observation posts on the Visnaya Sosna (north) and Seversky Donets (south),as well as scattered guard posts at various important fords and land bridges. Besides these fixedposts, roving patrols also crossed over the operations area. Both the guard posts and the patrol lineswere supported by several advanced fortresses (not shown) usually sited well away from the maininvasion paths. Between the two line of guardposts, a band of steppe 200 km wide would be burnedto make it difficult for Tatars to pasture their horses.
3.3 Gunpowder and the Demise of Serfdom in Western Europe
Of course gunpowder was not introduced only in Russia, so why was the effect in western
Europe diametrically opposite? To answer this question we must first characterize how
the local military practices differed from those in Russia.
The dominant form of warfare during most of the Middle Ages was the cavalry raid,
or chevauche, as practiced extensively during e.g. the Hundred Years war. Essentially,
a group of knights numbering from a few hundred to several thousands would set off
for the enemy’s land, burning his crops, eating his food. and stealing his valuables
(Allmand, 1988). If they encountered a castle that was too strongly held to be taken,
the raiding party would simply bypass it and continue in search of easier pickings. If
they received news of a stronger group of knights moving to intercept them, the invaders
would try to avoid them, or if that proved impossible retreat to their own territory. Since
20

Figure 4: The defense lines overlaid over the prevalence for private serfs. Despite the inevitablediffusion during the intervening years, private serf ownership remains concentrated along the defenseline which was active during the 16th century, when the Russian army was still overwhelmingly feudal.
neither commander would willingly concede battle under unfavorable circumstances, it
was only a very skilled defender which would succeed in cutting a raiding party off from
all possible lines of retreat, or otherwise luring him into an ambush. Battles were the
exception, rather than the rule, and most warfare aimed at destroying - or preserving -
the economic basis that made keeping forces in the field possible.
Overall, this type of warfare is broadly similar to the type of raids endured by Muscovy
21

Figure 5: The defense lines overlaid over the prevalence of State serf in 1859. State serf ownershipremains concentrated along the defense lines which were active during the 17th,and 18th century,when the Russian army (and state) were being centralized over time
after the 1480s. knights, which led a settled existence during peacetime, would essentially
become ”honorary nomads”: for the duration of the campaign, adopting on the whole
rather similar strategies and logistic approach. The main difference lay in the armament:
while the steppe nomads relied on horse archers as their key force, the western European
middle ages were dominated by lancer cavalry. This difference can be easily explained
by the different geography in which these force operated. On the flat grasslands of the
22

East, a horse archer could see and hit targets at extreme ranges, and the open terrain
meant that he could always escape if superior forces threatened a close quarter battle
(Saunders, 2001). On the rolling, forested terrain common in Western Europe, cavalry
could not survive unless it was able to sustain close combat.
Another key difference lay in the number of troops involved in both attack and de-
fense. The open steppe allowed enormous numbers of horses to be raised, and also made
it easy for raiders to be concentrated from vast areas. In Europe, most of the land was
either tilled or left as forest cover, and of the remaining pastures, the vast majority was
used for food or draft animals, leaving comparatively small amounts available for war
horses. The lack of open pastures also made it difficult for mounted armies to travel long
distances, restricting the area from which a cavalry raid could be assembled.
Despite these differences, the underlying problem faced by those trying to defend
was similar. Even though it was technically possible to construct point fortifications
able to resist for some length of time against even overwhelming odds, such strongpoints
were easily bypassed by the enemy, who could go on to plunder less hardened targets.
The problem was obviously more felt in border areas, where specific land entities called
Marches were created. Since military technology on both sides was essentially symmetric,
it would have been suicidal for either side to distribute their forces piecemeal along an
exposed border, no matter how well fortified. These frontier areas thus took the shape
of a series of castles in depth, generally about one day’s march from each other. The
areas directly invaded could take shelter within their fortifications, while the knight in
the castles not directly invested could mass their forces and come to the relief of their
besieged comrades. Taken together, the various fortifications of the March would shield
a less fortified, and more productive interior.
While the architectural means of defense differed (a band of isolated forts, rather than
a continuously fortified line), the basic problem remained that all avenues towards the
interior needed to be blocked by castles and their garrisons. This meant that some areas
needed to be defended, regardless of how unattractive they might be to potential settlers.
It is possible that the need of retaining a farming population in these undesirable areas
may have provided one of the motives for imposing serfdom on the farmers in these areas,
and that the custom spread.
Let us now consider how gunpowder changed this situation. The traditional viewpoint
23

is that the introduction of firearms brought about the demise of cavalry by enabling
the lowly infantryman to dispatch the armored knight (Roberts, 1956). A more recent
interpretation noted that artillery and muskets led to a new style of fortification, and new
siege techniques, which fundamentally changed the dynamics of warfare (Van Creveld,
1991). Both of these intuitions can help us adapt the approach delineated for Russia to
the case of Western Europe.
The first element is that gunpowder did indeed reduce the effectiveness of cavalry:
besides the greater penetration of armor by firearms, the need of modern armies cum-
bersome artillery and ammunition trains everywhere severely restricted the operational
mobility of armies. This robbed cavalry of its chief advantage, the ability to accept or
decline battle at will. Cavalry raids now became much riskier, since it was much more
difficult to evade and return home if superior forces were encountered (unless the raiding
party was willing to abandon its artillery, which was not economically viable in the long
run).
The second aspect is that the new style of artillery forts were not only time-consuming
to capture, but also impossible to ignore or bypass. In the medieval period, it was
perfectly possible for a raiding parry to sustain itself for months or even years, entirely
by foraging from the countryside. After all, almost all necessary supplies were durable
(horses, armor, swords), available from farms (food, shelter, tools, firewood), or could be
manufactured or repaired while on campaign from commonly available materials (arrows,
lances, saddles, horseshoes).
Gunpowder altered this equilibrium, by introducing a substance that was both in-
dispensable for continuing a campaign, relatively heavy/bulky, and which could not be
easily sourced in the required quantities from anything but a military installation. An
army on campaign could typically only carry enough gunpowder for one major engage-
ment, after which it would be essentially helpless until it either resupplied by cumbersome
and vulnerable convoy, or it retreated to its base of operations. Neither of this options
was compatible with the type of fluid, freewheeling campaign which was so common dur-
ing the middle ages. If resupply convoys were necessary, it would be reckless to bypass
any enemy fortification, from which the garrison could later sally forth to intercept the
much needed ammunition resupplies. Similarly, if the army had to return to its jump-off
point after each major engagement (or string of skirmishes), the depth of the possible
24
penetration would necessarily be limited.
Essentially, military operations from that point onwards would have to more or less
satisfy ”convexity”. Deep penetrations of any kind would be extremely dangerous, and
all operations would have to follow established lines of communications such as roads
or rivers. Under these conditions, it was completely unnecessary to ensure that remote
areas were as well defended as the main roads, and since the latter locations were very
desirable for trade and manufacturing purposes, they were already very well populated
and needed no coercion to attract more still. For countries in this condition, it was better
to set the peasants free and let them flock to where they were most useful.
3.4 Raiding Today
The fundamental mechanism for my theory relies on a discrepancy between the economic
and strategic significance of areas under the control of a given polity, combined with the
impossibility of mobilizing resources produce in one region, for the defense of another.
Since the introduction of gunpowder in the early modern period, this discrepancy has
been steadily narrowing, under the pressure from both the increasing reliance on wheeled
transportation for warfare, which requires the good roads which are only present in
economically advanced regions, and the increasing portability of weapons systems and
their supporting logistical units. For example during WWII, millions of American workers
were able to participate in the European and Pacific struggles without ever leaving their
hometowns. While ferrying tens of thousands tanks and airplanes across the Atlantic
was no small feat, it was several orders of magnitude simpler than transporting the tens
of millions of workers that participated in their construction, had they been needed to
participate as infantry.
As a result of these converging trends, nearly all states now rely on taxation to raise
funding for specialized soldiers, which are then deployed wherever they are most needed.
Such a system has no use for the type of organization employed by feudal states. However,
non-state actors often face similar constraints in mobilizing resources from one area for
use in another. For example, if a guerrilla relies on friendly or intimidated farmers for
shelter and food in a given area of the country, it might be impossible for them to mount
sustained operations in a different region. Under these circumstances it is possible that
such a faction would want to restrict labor outmigration from the area they control,
25

which could lead to arrangements that are similar in effect, if not in name, to those
described by this paper.
Raiding tactics have also made a comeback, particularly in the series of ongoing
conflicts in the Middle East (Ignatius David, 2015). In Iraq, ISIS has graduated from
executing primarily terrorist attacks, to waging a campaign consisting of a series of
limited-scale military attacks conducted by company or battalion-sized formations (150
to 600 fighters). A typical attack on a state-controlled village defended by an army out-
post might see one or two suicide-VBIED (Vehicle Borne Improvised Explosive Devices,
typically pickup trucks with improvised armor packed with explosives) driven against
the base and detonated so as to disable the perimeter defenses. Infantry would then ex-
ploit the confusion to inflict maximum casualties against government troops within and
around the base, and potentially also on civilians unsympathetic to their cause. If this
attack had been conducted by a conventional army (perhaps using a well-timed airstrike
instead of a VBIED), they would follow up on such success by moving in a second and
third echelon to mop up remaining defenders, and consolidate control of the village. To
have any hope of withstanding the inevitable counterattack, they would need to prepare
field fortifications, and they would also need open lines of communication towards their
existing strongholds, to ensure that reinforcements and supplies could get through.
ISIS forces would instead deviate from this playbook by quickly withdrawing and
dispersing the attacking force, which would typically have suffered only minor casualties.
Such attacks would be repeated at random intervals, until the government forces would
recognize that their position was untenable and vacate the village. Civilians hostile to
ISIS would at this point have no choice but leave their homes and become refugees, paving
the ground for ISIS to enter the village at their leisure, and take control with minimal
casualties or use of combat resources. Crucial to such tactics is the mobility provided
by 4x4 pickup trucks, both for use as VBIED platforms, and to deliver – and just as
importantly, withdraw– the infantry forces used in the followup attack. Like the cavalry
mounts of Tatar slave raiders and medieval armies, they allow ISIS operational and
strategic mobility independent of the road network, which is crucial to avoid detection
and maintain the element of surprise. As in those earlier conflicts, ISIS raids make use
of land that has little economic value - the desert - to attack population centers, which
in the Middle East are strung mainly along watercourses.
26

How far can this analogy be carried? From the point of view of the Iraqi state, a
return to a feudal society is unlikely. In Medieval Europe and Early Modern Russia,
the strategically crucial land was economically unattractive, but far from sterile. It was
perfectly possible for a family farming even suboptimal farmland could in fact support
themselves, and provide the required surplus to their lord, so restricting their mobility
was necessary mainly to prevent them from accessing better alternatives in cities or more
fertile lands. In the Iraqi context, the strategically crucial land is mostly desert, and
could not support meaningful population centers regardless of the level of enforcement.
In any case the Iraqi state relies mainly on conventional military forces under centralized
control, which do not depend primarily on locally available resources. A more limited
goal for restricting population mobility might be to avoid the exodus of anti-ISIS civilians
from frontline towns, which is typically one of the goals of ISIS raids, and usually a
precondition for their eventual occupation. But since the raids generally result in the
Iraqi army units being recalled, or abandoning their positions, it is unclear how such a
ban on civilian movements could be enforced.
The Kurdish forces in the north of the country have responded to the threat of ISIS
with a strategy which parallels the Russian Lines, at least in its military aspects. As
Figure 6 shows, a long line of lights appeared at some point between 2012 and 2016,
encircling the ISIS held city of Mosul. These lights do not correspond to any preexisting
road, and visual inspection (Figure 7) confirms the presence of a continuous defensive
line at least 260km in length. Composed of a first standoff berm to keep ISIS VBIEDs at
a distance, and a second line of fighting positions to deliver fire on enemy troops trying
to negotiate the first barrier.
From the point of view of the ISIS, the situation is more complex. On the one hand,
they rely on the local civilian population for both material needs, and to provide human
shield against the superior firepower of the Iraqi state and their wester allies. They would
therefore have stronger incentives to control the geographic distribution of the population
under their control. On the other hand their main enemies are conventional armed forces,
with their reliance on roads to conduct offensive operations. This largely eliminates the
discrepancy between the actual, and their preferred distribution of civilian in areas they
control. Nonetheless, the exodus of refugees from the frontline areas has hurt them a lot
more than it has hurt the Iraqi state, by depriving them of forced contributions, human
27

Figure 6: The graph shows the changes in night night light data between 2012 and 2016. The thinblue line partially encircling Mosul is a continuous defensive system which appeared in late 2016, andserves an analogous function to the walls built by the Russians against the tatars. It is approximately260km long. (NASA Night Light Imagery, processed by author).
shields, and a pool of potential recruits with no alternative employment opportunities
to speak of. As a result ISIS has reportedly resorted to a policy of shooting on site
civilians that try to leave the areas under their control without authorization by ISIS
commanders. While there is no data to asses whether this has already had economic
effects above and beyond the general destruction caused by living in a war zone, the long
run incentives of such an arrangement appear clear.
4 Model Sketch
4.1 Domar Model
The Domar Model assumes that:
1. The state is trying to maximize the amount of revenues it can extract
28

Figure 7: Close up imagery of the defense line directly north of Mosul (imagery from Planet.com).Interestingly, at least in this district, farmers seem to have left the area south of the wall (the ISISside) uncultivated.
2. There is a fixed cost in taxing individuals, so that in practice it is cheaper to extract
said revenue from the landed gentry, than from individual peasants. Therefore, only
landowners can be taxed.
3. The marginal product of labor is decreasing.
4. There exists a fixed cost to keeping an individual peasant enserfed.
5. Under free labor movement, each peasant earns his marginal product of labor.
Under serfdom, each peasant will be paid his subsistence wage.
The clear result of this combination of assumptions is that when labor is scarce, the
marginal product of each peasant is high, and as a result landownerd prefer to enserf
the peasant, and pocket the difference between his marginal product and the sum of his
subsistence wage and the cost of keeping him enserfed. On the other hand, if labor is
abundant, the marginal product of labor is close to the subsistence wage, and it is better
for landowner to allow him to be free and simply pay him his low wages.
29

5 Model
5.1 Assumptions
Russia is composed of two regions, Road (r) and Back Country (b). In each region,
output is produced by combining Land (K) and Labor (L), using an equal weighted
Cobb-Douglas production function:
Yx =√KxLx (1)
The endowment of land is equal in the two regions so Kb = Kr = 1, as is the initial
distribution of Labor Lb = Lr = 1. However, the Road region is better connected to
market, and therefore obtains a better price for its goods, pr = δpb with δ > 1.
Tatars have at their disposal a raiding force of fixed force T , with which they attempt
to raid the Russian lands. If they succeed they receive a positive payoff, if they fail they
receive a negative payoff, and if they don’t attack at all they receive 0.
Russia can defend itself using its military strength in each region, which is endoge-
nously determined based on both locally raised forces Ab, Ar (for Army in Road and
Back Country respectively), which are equal to the local population, as well as centrally
allocated artillery G (for Guns). To simplify notation, I assume that α is the fraction
of the total population A = 2 which resides in the Back Country, while β, is the faction
of the (exogenous) total amount of Guns available which is allocated by the state to
defending the Back Country. These factors are themselves aggregated using an equal
weighting Cobb-Douglas function, so that:
Db =√
(α)(βG) =√αβG (2)
Dr =√
(1− α)(1− β)G (3)
The Tatars can choose where to attack, and have perfect information on the level
of defensive forces present in each region. Given the vast distances of Russia’s steppe
border, any forces the Russians might have in the other region are completely irrelevant.
Therefore, in practice the Tatars only need to match the defensive potential of the worst
defended region. We will allow for one region being easier to defend than the other,
30
through controlling a parameter γ, which when equal to one implies symmetric defense
potential.
D = min {γDb, Dr} (4)
Where D is the final defensive potential of Russia as a whole.
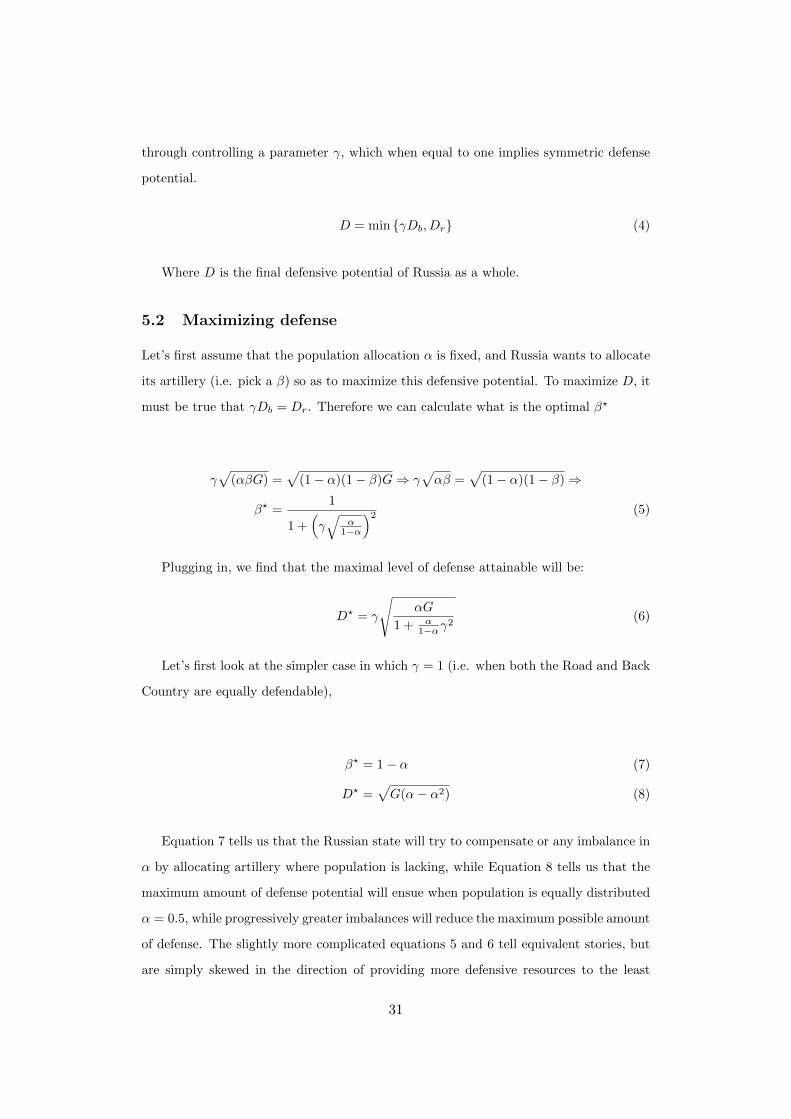
5.2 Maximizing defense
Let’s first assume that the population allocation α is fixed, and Russia wants to allocate
its artillery (i.e. pick a β) so as to maximize this defensive potential. To maximize D, it
must be true that γDb = Dr. Therefore we can calculate what is the optimal β?
γ√
(αβG) =√
(1− α)(1− β)G⇒ γ√αβ =
√(1− α)(1− β)⇒
β? =1
1 +(γ√
α1−α
)2 (5)
Plugging in, we find that the maximal level of defense attainable will be:
D? = γ
√αG
1 + α1−αγ
2(6)
Let’s first look at the simpler case in which γ = 1 (i.e. when both the Road and Back
Country are equally defendable),
β? = 1− α (7)
D? =√G(α− α2) (8)
Equation 7 tells us that the Russian state will try to compensate or any imbalance in
α by allocating artillery where population is lacking, while Equation 8 tells us that the
maximum amount of defense potential will ensue when population is equally distributed
α = 0.5, while progressively greater imbalances will reduce the maximum possible amount
of defense. The slightly more complicated equations 5 and 6 tell equivalent stories, but
are simply skewed in the direction of providing more defensive resources to the least
31

Figure 8: The figure shows how the maximum possible effective defense level changes as α (thepopulation distribution) changes. The figure assumes that Russia is allocating its artillery optimally.As γ, (the defense multiplier of the Back Country) increases, the optimal α is more skewed towardshaving more population in the Road region.
defensible region.
The results of the model are thus entirely intuitive. The easier it is to defend the
Back Country compared to the Road, the more the Czar will wish that the available
population is available at the Road for defensive purposes. The further the population
distribution is from the optimal, the more the Czar will allocate his artillery to the
relatively unpopulated region, in order to compensate.
5.3 Production and Migration
We now analyze how changes in the price differential between regions translate to differ-
ences in population. If the labor force is free (f) to move as it wants, then:
MPLbf = MPLrf ⇒ Lr =0.5√δLb =
δ2
1 + δ2L (9)
Therefore, if the population was initially equally distributed, the net migration to-
wards Road would be.
∆L = Lr − L1
2=
t√δ − 1
2 + 2 t√δL (10)
32
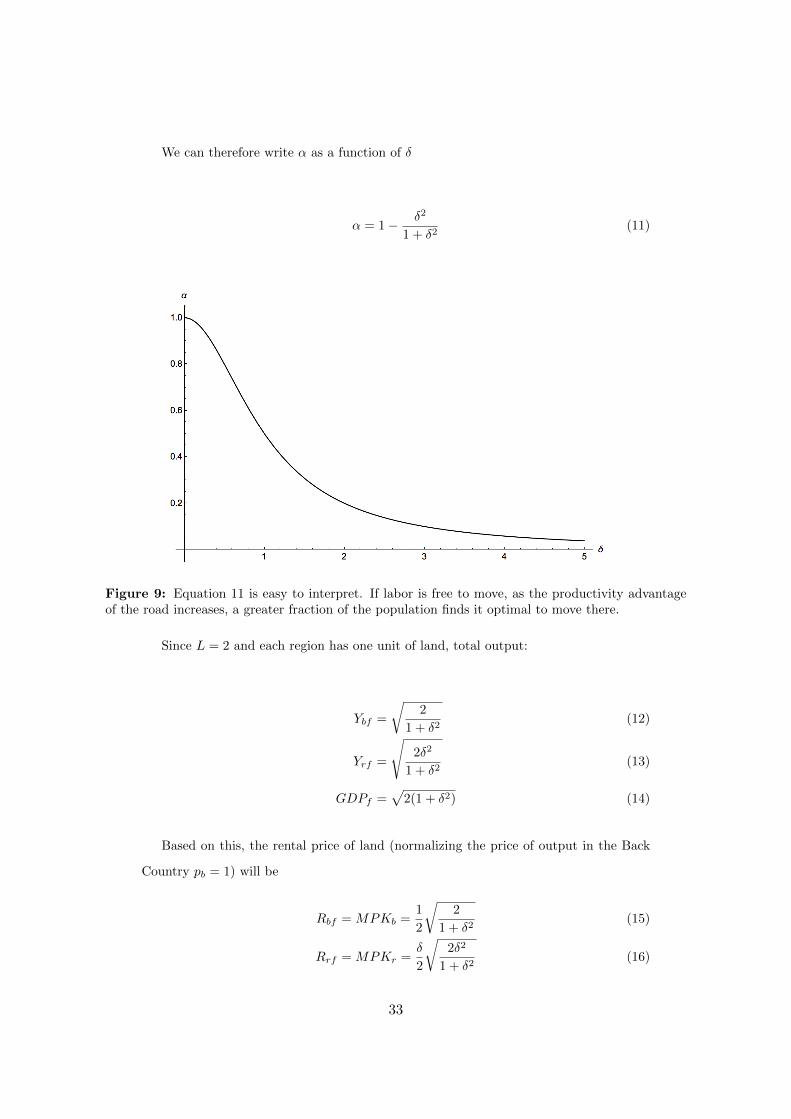
We can therefore write α as a function of δ
α = 1− δ2
1 + δ2(11)
Figure 9: Equation 11 is easy to interpret. If labor is free to move, as the productivity advantageof the road increases, a greater fraction of the population finds it optimal to move there.
Since L = 2 and each region has one unit of land, total output:
Ybf =
√2
1 + δ2(12)
Yrf =
√2δ2
1 + δ2(13)
GDPf =√
2(1 + δ2) (14)
Based on this, the rental price of land (normalizing the price of output in the Back
Country pb = 1) will be
Rbf = MPKb =1
2
√2
1 + δ2(15)
Rrf = MPKr =δ
2
√2δ2
1 + δ2(16)
33
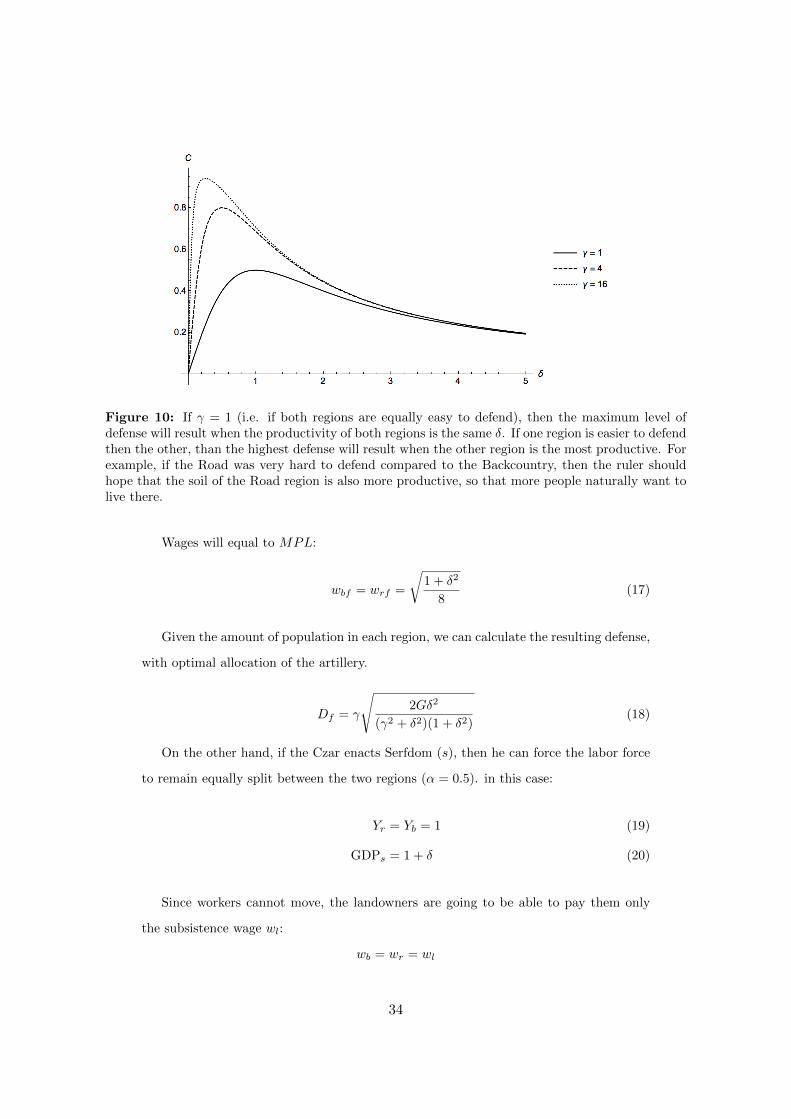
Figure 10: If γ = 1 (i.e. if both regions are equally easy to defend), then the maximum level ofdefense will result when the productivity of both regions is the same δ. If one region is easier to defendthen the other, than the highest defense will result when the other region is the most productive. Forexample, if the Road was very hard to defend compared to the Backcountry, then the ruler shouldhope that the soil of the Road region is also more productive, so that more people naturally want tolive there.
Wages will equal to MPL:
wbf = wrf =
√1 + δ2
8(17)
Given the amount of population in each region, we can calculate the resulting defense,
with optimal allocation of the artillery.
Df = γ
√2Gδ2
(γ2 + δ2)(1 + δ2)(18)
On the other hand, if the Czar enacts Serfdom (s), then he can force the labor force
to remain equally split between the two regions (α = 0.5). in this case:
Yr = Yb = 1 (19)
GDPs = 1 + δ (20)
Since workers cannot move, the landowners are going to be able to pay them only
the subsistence wage wl:
wb = wr = wl
34

The surplus for the owners will now be:
Πbs = pbYb − wbLb (21)
= 1− wl (22)
Πrs = prYr − wrLr (23)
= δ − wl (24)
Again, given that we know the defense function, and the population of each region is
known, we can calculate the actual resulting defense level.
Ds = γ
√G
1 + γ2(25)
5.4 Model Results
From the preceding assumptions and intermediate results, we can derive the following
statements (see Figure 11 for economic analysis):
1. Serfdom is expensive for GDP:
GDPf −GDPs =√
2(1− δ2)− (1 + δ) (26)
When δ = 1 serfdom is costless, but for any other value, enacting serfdom reduces
aggregate GDP.
2. If Serfdom is enacted, landowners in both regions will benefit, but the highest
percentage benefit will go to the Backcountry Landowners. From the point of view
of the Road Landowners, serfdom allows them to pay their existing workers less,
but makes it impossible to attract as much labor as they could profitably use.
3. Serfdom is bad for workers. Of course, introducing serfdom results in them making
only the subsistence wage, rather than the much higher market wage for their
services.
4. Militarily, freedom can weaken the defensive posture of the state. As Figure 12
shows, the maximum defense potential occurs for a specific value of the population
distribution α. The ideal α depends on the defense differential parameter γ, while
35

the realized α will depend on the productivity differential δ. If the ideal and
realized α differ significantly, it is possible that serfdom can significantly improve
the security of the state.
Figure 11: As long as δ > 1, under Serfdom: 1)GDP will be lower. 2) Land Rents will be higher inboth the Road and Backcountry regions, but the percentage difference will be greater in the latter.3) Wages will be lower in both regions.
Figure 12: Defense potential is highest when the population is equally divided between regions(α = 0.5), and the amount of artillery available G is large. For example, with G = 8, Russia wouldbe able to beat back the Tatar attack if the population was equally divided (C > 1.2, the level ofTatar attack assumed in this picture.) , but not if there was an imbalance of e.g. 0.8
36

5.5 Accounting for the differential adoption of Serfdom
Figure 13 summarizes the story of Serfdom in Western Eurasia. The assumption is that
the Road region has an output price three times as large as the Back Country δ = 3, and
that the population is initially equally distributed between regions. If the Czar allowed
labor to allocate freely, this would result in α = 0.9. This severe population imbalance
complicates defense, particularly if the enemy’s attack is not particularly impeded by the
lack of roads in the Back Country (that is, if γ is low). On the other hand, γ is high,
then enemies rely greatly on roads for advancing, so that defending the Back Country is
easy even if very few people actually live there.
In the present model, the choice between serfdom and freedom is chiefly a choice over
population distributions. If γ is below a certain value (thick dotted line in the Figure
13), then it is crucial that a sufficiently large population resides in the more economically
disadvantaged regions (Backcountry), and Serfdom will result in the highest security for
the nation. If γ is above the threshold, then free movement of labor will instead be
preferable.
In the late Middle Ages, warfare all over Europe was still largely conducted as a
series of reciprocal cavalry raids. Groups of knights from a few hundred to a few thou-
sand strong would set out into enemy territory, pillaging villages and weakly defended
manors. Since these raids relied entirely on the countryside for resupply, roads were not
particularly necessary. If the enemy placed a castle in order to deny use of a road, it was
a simple and routine matter for the raiders to detour across country for however long was
needed to avoid the position. This was true in France, Spain, or Lombardy (F1 in the
Figure), and it was just as true in Russia (R1), where the open steppe provided virtually
limitless attacking options for cavalry, at least until the large forests of the upper Volga
basin were encountered. Thus in both Western and Eastern Europe, Serfdom provided
the best defense against they typical military threats. Why the difference in outcomes
then?
Because of its proximity to the steppe, Russia was exposed to raids of a size no
Western European country had to contend with, and in the initial stages was completely
unable to defend itself, under either serfdom or free labor (in the figure, this is shown
by their being in the green area). Instead, they had to pay a large tribute to the
37

Mongols/Tatars each year, or suffer terrible consequences 2. Under these circumstances,
it was better for Russia to keep their labor force free, which would at least maximize
national income and make their tribute payments easier to achieve. While Western
European nations faced the same combination of γ and G, their distance from the steppe
meant that they did not have to face a nomadic threat, but only invasion from their
essentially symmetric neighbors. In this relatively benign threat environment, it was
perfectly feasible for them to defend themselves as best they could, which in their case
meant controlling their population distribution through serfdom.
How does the introduction of gunpowder weapons change things? There are two
main effects: G will increase, and γ may increase. First of all, the production of artillery
and gunpowder was almost universally under state control. Therefore G, the forces
controlled centrally, will by definition expand as each state adopts gunpowder. In the
West, any military advantage will be largely offset by the fact that each state’s enemies
are also adopting gunpowder. In Russia, on the other hand, the Tatar raiders resisted
adopting gunpowder weapons, since the distances were too vast to cover during the
limited campaign season with artillery in tow. Therefore, artillery will give Russia a
decisive advantage in defending their borders, and this is what allowed them to overthrow
the Tatar Yoke. But the second effect depends on what their man enemies do. In Western
Europe, all of the potential enemies adopted artillery, which in practice meant that major
military campaigns had to follow, and maintain continuos control over roads. If they
didn’t, even a battlefield victory could turn to disaster when the army proved impossible
to resupply with ammunition from the logistical base.
In the context of the model, this means that γ increases a lot (Back Country areas can
be defended effectively by small forces), which puts Western Europe at F2, well within
the parameter space where free labor is optimal. In Russia on the other hand, the Tatars
did not adopt artillery, which meant that they could still attack virtually anywhere along
the frontier. Therefore the effective γ faced by Russia alongs it’s southern frontier did
not increase, and the country ended up at point R2. This explains why gunpowder was
associated with the rise of serfdom in Russia, but with its end in the West.
c
2As (Klyuchevsky, 1911) vol I, page 267 states: ”[...]the Mongolian yoke had long ago relieved the princesand their retinues from the obligation of guarding the far south-eastern regions, the regions which once hadserved the southern princes as a training ground for their warriors. Indeed, even after the great battle ofKulikovo had taken place, it continued to be tribute rather than troops that had to be dispatched thither
38

Figure 13: The parameter space of G and γ divided into areas where Serfdom and Freedom areoptimal (divided by the dashed line). The green area at the bottom and left denotes parametercombinations where a Tatar raid would be able to defeat even a state adopting the locally optimalstrategy (assuming it is within raiding range of the Steppe). Initially both Russia and Western Europeoccupy the point R1, F1, though Russia is within raiding range and Western Europe is not
6 Empirics
6.1 Concept
The most direct way to test my proposed theory would be by using variation in the
introduction of serfdom in areas that were or were not part of the defense line. Unfor-
tunately, the laws introducing serfdom were passed at the national level, and while they
were probably variations in enforcement and eligibility at the local level, these have not
been preserved sufficiently to permit econometric analysis with contemporaneous data.
The first reliable data on serfdom available comes from the 1861 Census (Markevich and
Zhuravskaya, 2017). I therefore test whether the number of private serfs was higher in
the areas through which the first two defensive lines passed. These were the lines built
39

while the Russian army was still essentially feudal, with troops drawn from the local
population of landed soldiers.
A more indirect route would involve using panel population data to check whether
areas along the defense lines were becoming depopulated before serfdom was enacted, and
whether this trend reversed after the serfdom was enacted. Again the earliest census data
for Russia sadly begins approximately a century after the implementation of serfdom,
frustrating the possibility of conducting a diff-in-diff analysis.
I also use a somewhat indirect test. The idea is that if Moscow was willing to sacrifice
economic efficiency of the altar of national defense in deciding how to allocate its rural
farming population, we should see a similar pattern in its policy towards its urban centers.
Specifically, we should see cities emerge not where they were most useful for economic
reasons, but rather where they were best sited to aid the defense of the country.
Indeed the vast majority of the major population centers between Moscow and the
Crimea were originally founded as fortresses against Tatar raids. As Muscovy and later
Russia expanded southward, the military function of these settlement subsided, but
they persisted as urban centers for their surrounding areas. If my theory is correct, we
would expect modern day economic activity in the area to be clustered around the most
favorable locations for defense, rather than the best locations for trade or agriculture.
The easiest way to test this hypothesis would be by using the actual historical location
of the various defensive lines built by Moscow to defend its lands. However, this approach
would run into serious endogeneity problems, since it could well be that the defense
lines were sited so as to defend land that was particularly valuable from an economic
standpoint. To avoid this risk, I have designed an algorithm (detailed below) that uses
reasonable assumptions to construct a series of optimal defensive lines taking into account
only the ease of defense, and completely ignoring trade or agricultural concerns.
6.2 Data
I first collected the geographic data I needed, namely the flow accumulation raster for
the area in question from the Hydrosheds project Lehner, B., Verdin, K., Jarvis (2008),
and the potential yield for barley (the most commonly cultivated grain in the area at
the time), and for pasture grasses (which is a proxy for the ease with which the tatar
raiders could pasture their horses). Both agricultural suitabilities are from the FAO
40
GAEZ project version 3.0.
My next step was to collect historical data on the most commonly employed invasion
routes, and the precise location of the fortification lines. These came from Nossov (2006).
I also used the data for the prevalence of serfdom in 1861 from Markevich and Zhu-
ravskaya (2017).
My final step was to download the city light data from NOAA. I use city lights
data because it allows me to abstract from the possibility of undereporting of economic
activity in the official statistics, and particularly for the possibility of differential bias
between the modern day countries involved (Russia, Ukraine, Belorussia, Lithuania).
I also construct rasters for latitude and the distance from Moscow.
6.3 Variable construction
6.3.1 Invasion routes
The first step is to construct the optimal invasion paths. A naive view would be that
raiders would always take the shortest path, much like a trader would, but of course
if this was the case, the Russians could have defended by concentrating their army
along that one path. To avoid this simple countermeasures, raiders actually played the
mixed strategy equilibrium of attacking along different paths in different years, usually
by conducting several simultaneous feints along paths not being used to mask their true
intentions. However, given the short length of the campaign season in Russia, the raiders
still had to keep a somewhat direct route towards Moscow, or risk being caught by winter
before having reached their objectives.
To find out the optimal invasion routes, I used the following procedure:
1. First I calculated a cost raster, approximating the cost for a nomadic raiding party.
To do this, I took the flow accumulation value 3 for each cell.
2. Due to the way river networks naturally branch, this raster as extremely high right
skewness (most cells have very low values, while the terminal part of large rivers
have extremely high values). To correct this problem, I took the square root of
the flow accumulation, which is approximately proportional to the width of the
3The flow accumulation value is the size of the basin drained through a particular cell, and is proportionalto the amount of water that would flow through a particular cell, if all cells received the same amount ofrainfall, and there were now evaporation or subsurface water flow.
41

resulting river (beyond a few feet, the difficulty of crossing a river does not depend
on its width).
3. I then calculated the lowest cost path between Perekop and Moscow, using the cost
map resulting from step 2
4. Starting from the cost map calculated in step 2, I added a penalty of 200 to all
cells that were within 15 km of the optimal path calculated at step 3.
5. I then iterated over steps 3 and 4, using the updated cost map to calculate a n-best
path, and adding a new penalty to cells within 15 km of the result.
Steps 3-5 were repeated 4 time, thus obtaining the four fastest paths between Moscow
and Perekop. As shown by Figure 14 there is excellent agreement between the first three
paths and the three main historical invasion routes used by nomads.
6.3.2 Defense Lines
The next step was to calculate the optimal defense lines. The objective of any linear
barrier is to block all possible avenues of approach to a given objective. In the case of a
country like Russia with a limited campaign season and very large distances, this can be
refined to ”blocking all possible avenues of approach that take less time than is available
to an attacker”. To find the cheapest possible barriers I used the following algorithm.
1. Find all possible paths between Moscow and Perekop that take less than some
specified maximum (the invasion envelope).
2. Calculate the construction cost as
max(500−Movement cost, 0)
3. Find the cheapest path (according to the construction cost map) between the west-
ern boundary of the invasion envelope, and its western boundaty.
4. Add a penalty of 200 to the construction cost of all cells that are within 50km of
the optimal fortification line.
5. Iterate over steps 2-3, so as to generate the N best fortification lines to defend
against nomadic raids.
42

Figure 14: Pink thick lines: historical invasion routes. Red lines: calculated invasion routes.
The accuracy of this algorithm is less than in the case of the paths (see Figure 15, but
it still does a reasonably good job of identifying convenient ways of using rivers to block
the advance of nomadic raids.
43
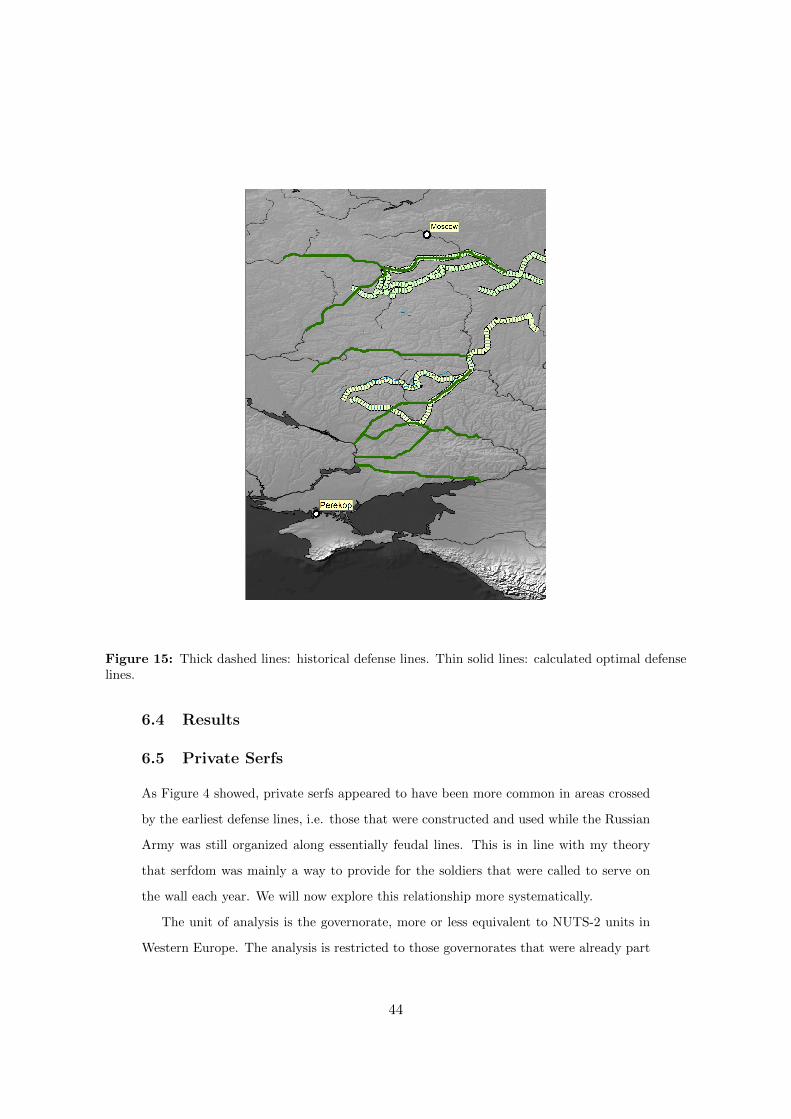
Figure 15: Thick dashed lines: historical defense lines. Thin solid lines: calculated optimal defenselines.
6.4 Results
6.5 Private Serfs
As Figure 4 showed, private serfs appeared to have been more common in areas crossed
by the earliest defense lines, i.e. those that were constructed and used while the Russian
Army was still organized along essentially feudal lines. This is in line with my theory
that serfdom was mainly a way to provide for the soldiers that were called to serve on
the wall each year. We will now explore this relationship more systematically.
The unit of analysis is the governorate, more or less equivalent to NUTS-2 units in
Western Europe. The analysis is restricted to those governorates that were already part
44

of the Russian Empire during Tsar Alexei’s rule. As Figure ?? shows, the proportion of
private is maximal at the Tula line, and decreases markedly with distance.
Figure 16: The proportion of the total population composed of private serfs, plotted against thedistance from the Tula line of fortifications.
The same empirical finding is evident from Table 1. While the small number of gov-
ernorates limits the number of controls which can be included, the results nonetheless
show a statistically significant association between distance from the Tula line, and the
coefficients actually grow after adding controls for the fraction of the governorate pro-
tected by the line, the land productivity for pasture, productivity for barley (both taken
from the FAO GAEZ 3.0 dataset), latitude, and latitude squared.
45

(1) (2) (3) (4) (5) (6)Private Serfs Private Serfs Private Serfs Private Serfs Private Serfs Private Serfs
Dist. from Tula Line -0.0640∗∗∗ -0.0639∗∗∗ -0.0565∗∗∗ -0.0589∗∗ -0.116∗∗∗ -0.136∗∗
(-4.15) (-4.39) (-3.86) (-2.66) (-4.12) (-2.92)
Fraction Protected by Line 0.117∗ 0.0570 0.114 -0.0413 -0.0600(1.77) (0.78) (1.13) (-0.41) (-0.55)
Pasture Productivity 0.000573(1.62)
Barley Productivity 0.0000389 0.000127 0.000210(0.35) (1.31) (1.13)
Latitude 0.0712∗∗ -0.362(2.65) (-0.44)
Latitude2 0.00404(0.53)
Observations 20 20 20 16 16 16
t statistics in parentheses∗ p < 0.1, ∗∗ p < 0.05, ∗∗∗ p < 0.01
Table 1: Correlation table for the adoption cross-section dataset.
6.5.1 Long Run Persistence of Urban Patterns
We now look at whether the optimal locations of defensive lines predicts the location of
economic activity today, as evidenced by night lights. The unit of analysis is the district
(rayon), equivalent approximately to a US county.
Table 2 summarizes the dataset of rayons in the Perekop-Moscow invasion area.
(1)
count mean sd min max
LnLights 344 1.189099 1.331214 -2.168142 5.018408Dist. OptFort 344 .7236854 .7661776 0 3.892349Dist. OptPath 344 .3607458 .3879302 0 1.970094Grass Yield 336 497.1918 93.24023 326.6667 712.6667Barley Yield 336 2475.748 153.1957 2092.645 2798.56Dist. Moscow 344 147.2518 50.50512 28.00458 241.2706Latitude 344 50.33925 2.835091 44.4891 54.9868River Size 342 97.54745 126.2327 4 974.8318River Size2 342 25403.6 110180 16 950297
Table 2: Summary statistics
Table 3 shows the relevant table of correlations.
46

(1)
LnLights Dist. OptFort Dist. OptPath Grass Yield Barley Yield Dist. Moscow Latitude River Size
LnLights 1Dist. OptFort -0.0842 1Dist. OptPath 0.0674 0.178∗∗∗ 1Grass Yield -0.205∗∗∗ -0.0988∗ 0.161∗∗∗ 1Barley Yield 0.0895 -0.143∗∗∗ -0.0833 0.550∗∗∗ 1Dist. Moscow 0.212∗∗∗ 0.379∗∗∗ -0.0305 -0.815∗∗∗ -0.485∗∗∗ 1Latitude -0.192∗∗∗ -0.454∗∗∗ 0.0193 0.763∗∗∗ 0.472∗∗∗ -0.972∗∗∗ 1River Size -0.00584 -0.0583 -0.0294 -0.0600 -0.141∗∗ 0.0244 0.0284 1∗ p < 0.10, ∗∗ p < 0.05, ∗∗∗ p < 0.01
Table 3: Correlation table for the adoption cross-section dataset.
6.5.2 Main Results
The main specification is
LnLightsi = β0 + β1DistOptForti + β2DistOptPathi + γControls + εi
where LnLightsi is the level of night lights measured in rayon i, DistOptFort is the
distance from the closest optimally calculated fortification line, DIstOptPath is the dis-
tance from the optimally calculated invasion path, and Controls denotes of vector of
control variables. The basic results are highlighted in figure 17, which shows how being
closer to a calculated fortification line is associated with having more night lights, with
a clearer effect once controls are included. Being closer to an optimal invasion route has
virtually no effect without controls, and has actually a negative effect once controls are
included.
The regression results are shown in Table 4. The distance from the optimal fortifica-
tion lines is a weak predictor of night lights when used without controls, but increases
in both magnitude and significance as more controls are added. When all controls are
added, a one standard deviation increase in the distance from a fortification line results
in a decrease in the number of night lights of approximately 0.2 standard deviations.
47

Figure 17: The effect on log night lights of being close to an optimal fortification line (top row)and an optimal invasion route (bottom row). The left column shows partial plots with linear fit,controlling for the yield for pasture grasses, barley, distance from Moscow, latitude, size of localrivers and the square of the size of local rivers. The right column shows unconditional scatterplotswith linear fit.
(1) (2) (3) (4) (5) (6) (7) (8) (9)LnLights LnLights LnLights LnLights LnLights LnLights LnLights LnLights LnLights
Dist. OptFort -0.098∗ -0.119∗∗ -0.096∗ -0.144∗∗ -0.130∗∗ -0.234∗∗∗ -0.213∗∗∗ -0.179∗∗∗
(0.069) (0.031) (0.077) (0.022) (0.026) (0.000) (0.000) (0.003)
Dist. OptPath 0.084 0.090 0.128∗∗ 0.177∗∗∗ 0.170∗∗∗ 0.173∗∗∗ 0.167∗∗∗ 0.146∗∗∗
(0.173) (0.152) (0.021) (0.001) (0.002) (0.002) (0.002) (0.007)
Barley Yield 0.084 0.316∗∗∗ 0.322∗∗∗ 0.329∗∗∗ 0.333∗∗∗ 0.339∗∗∗
(0.128) (0.000) (0.000) (0.000) (0.000) (0.000)
Grass Yield -0.238∗∗∗ -0.417∗∗∗ -0.193∗∗ -0.199∗∗ -0.190∗∗ -0.269∗∗∗
(0.000) (0.000) (0.037) (0.031) (0.039) (0.003)
Dist. Moscow 0.122 0.123 0.212 0.326(0.651) (0.661) (0.450) (0.242)
Latitude -0.181 -0.176 -0.118 0.121(0.495) (0.526) (0.672) (0.643)
River Size 0.023 0.303∗∗ 0.388∗∗∗
(0.731) (0.033) (0.006)
River Size2 -0.303∗∗ -0.400∗∗∗
(0.039) (0.006)
Observations 344 344 336 336 336 336 334 334 334R2 0.010 0.016 0.021 0.069 0.135 0.158 0.160 0.171 0.152
Standardized beta coefficients; p-values in parentheses∗ p < 0.10, ∗∗ p < 0.05, ∗∗∗ p < 0.01
Table 4: Regression results within the Perekop to Moscow area of operations. All columns showbeta coefficients.
48

6.6 Placebo test: the Smolensk road
The above discussion leaves the possibility that a third unobserved factor may be corre-
lated with both my measure of fortification optimality and the prevalence of night lights
today, and that this statistical relationship might be spuriously driving my result. For
example, the fortification optimality method I employ will tend to pass through places
where the headwaters of two rivers systems are in close proximity, since this minimizes
the gap requiring heavy engineering work. However, such areas will also be favored by
river traders wanting to portage goods between the two river systems i.e. wanting to
establish a portage. It is therefore conceivable that the results shown above are due
simply to modern cities being located on the portages between the basins of the Don and
the Dniepr.
To avoid this threat to identification, I construct a placebo test by repeating the
analysis just performed, but for attacks on Moscow coming from Vilnius rather than
Perekop. This was the axis of attack favored by virtually all Western invaders of Russia,
including the Poles, Swedes, French and Germans. The key choke point was the gap
between the Dvina, which flows North into the Baltic, and the Dnepr, which flows south
into the black sea. The resulting land bridge was guarded by the fortress cities of Vitebsk
on the Dvina, and Orsha and Smolensk on the Dnepr.
While the potential for trade was even greater than between the Dnepr and Don
(the route provided the most economical transportation between the Baltic Sea and the
Ottoman Empire), I find that the effect of fortification suitability on night lights in this
area is almost exactly zero, as shown both by the scatterplots in Figure 18, and the
regressions of Table 5. This effectively eliminates the trade explanation, while being
easy to explain in terms of defense: attacks from the west were invariably undertaken
by armies of settled, farming nations, which relied on cumbersome logistical tails, and
were thus restricted to using the few available roads. Such attacks were therefore best
parried by building fortresses along these roads. It was only against the Tatar raids that
a cordon defense was indispensable, and it is therefore only to the south of Moscow that
fortification suitability has an effect on present day city lights.
49

Figure 18: The effect on log night lights of being close to an optimal fortification line (top row)and an optimal invasion route (bottom row), within the Vilnius to Moscow operations theater. Theleft column shows partial plots with linear fit, controlling for the yield for pasture grasses, barley,distance from Moscow, latitude, size of local rivers and the square of the size of local rivers. Theright column shows unconditional scatterplots with linear fit.
(1) (2) (3) (4) (5) (6) (7) (8) (9)LnLights LnLights LnLights LnLights LnLights LnLights LnLights LnLights LnLights
Dist. OptFort -0.008 -0.032 -0.039 -0.067 -0.060 -0.130∗ -0.090 -0.084(0.909) (0.666) (0.599) (0.347) (0.409) (0.098) (0.237) (0.271)
Dist. OptPath 0.077 0.138 0.018 -0.071 0.316∗∗ 0.093 0.044 -0.014(0.325) (0.135) (0.815) (0.466) (0.043) (0.578) (0.799) (0.929)
Barley Yield -0.120 0.150 0.201∗ 0.156 0.168 0.182∗
(0.166) (0.151) (0.059) (0.143) (0.112) (0.084)
Grass Yield -0.359∗∗∗ -0.434∗∗∗ -0.214 -0.456∗∗∗ -0.480∗∗∗ -0.477∗∗∗
(0.000) (0.000) (0.108) (0.003) (0.002) (0.002)
Dist. Moscow 0.164 0.224∗∗ 0.215∗∗ 0.170∗
(0.124) (0.029) (0.031) (0.062)
Latitude 0.571∗∗∗ 0.339∗∗ 0.303∗ 0.261(0.000) (0.048) (0.083) (0.112)
River Size 0.229∗∗∗ -0.077 -0.076(0.002) (0.771) (0.772)
River Size2 0.327 0.343(0.225) (0.197)
Observations 179 179 178 178 178 178 178 178 178R2 0.000 0.005 0.016 0.128 0.140 0.197 0.231 0.239 0.234
Standardized beta coefficients; p-values in parentheses∗ p < 0.10, ∗∗ p < 0.05, ∗∗∗ p < 0.01
Table 5: Regression results within the Vilnius to Moscow area of operations. All columns show betacoefficients.
50

7 Conclusions
This paper has improved on the existing literature in three main ways.
First, it proposed a new explanation for the introduction of serfdom in Russia, by
arguing that the restriction to the freedom of movement was fundamentally caused by
an imbalance between the distribution of population that would result from the free
movement of labor, and that whcih was necessary to ensure that the state could be
defended. While I make no claim that this was the only reason for enacting serfdom in
the world, or even within Russia, the theory opens a significant new axis of interpretation
on one of the most historically important social constructs.
Secondly, I adapt this approach to explain why serfdom in most of Western Europe
was abandoned. I argue that while the supporting economy of medieval Europe was
of course very different from that of the tatars, the overall strategy for warfare was in
fact similar, focused largely on wide-ranging raids deep inside enemy controlled territory.
When gunpowder made it necessary for armies to be resupplied regularly, warfare became
more positional, and strengthening cities on the main lines of communication became the
most efficient way of defending a state. It therefore became unnecessary to maintain a
widely dispersed feudal cavalry force to block all possible approaches.
Thirdly, the paper uses geo spatial methods to calculate high resolution measures of
both the optimal attack route between two points, and more importantly the optimal
defense lines to block those attacks. Currently, the standard tools used to measure
exposure to military threats are ruggedness (Nunn and Puga, 2012), and geographic
distance from particular points. The approach used in this paper can provide high
frequency variation in contexts where the existing methods would lack empirical power
(flat areas, or those with only one threat origin, correlated with other variables.
References
Acemoglu, D. and Wolitzky, A. (2011). The Economics of Labor Coercion. Econometrica,
79(2):555–600.
Allmand, C. T. (1988). The hundred years war : England and France at war, c. 1300-c.
1450. Cambridge University Press.
51

Buggle, J. C. and Nafziger, S. (2015). Long-Run Consequences of Labor Coercion: Evi-
dence from Russian Serfdom *.
Clausewitz, C. V. and Howerd P., M. . P. (2007). On War. Princeton University Press,
Princeton, NJ.
Dari-Mattiacci, G. (2013). Slavery and Information. The Journal of Economic History,
73(01):79–116.
Davies, B. L. (2004). State power and community in early modern Russia : the case of
Kozlov, 1635-1649. Palgrave Macmillan.
Dennis, G. T. (1985). Three Byzantine military treatises. Dumbarton Oaks, Research
Library and Collection.
Dennison, T. K. T. K. (2011). The institutional framework of Russian serfdom.
DeVries, K. (2003). Joan of Arc : a military leader. Sutton.
Domar, E. D. (1970). The Causes of Slavery or Serfdom: A Hypothesis.
Duleep, H. O. (2012). The Labor/Land Ratio and India’s Caste System.
Fenske, J. (2014). Ecology, trade and states in pre-colonial africa. Journal of the European
Economic Association, 12(3):612–640.
Filjushkin, A. (2008). Ivan the Terrible : a military history. Frontline Books,
Filjushkin2008.
Ignatius David (2015). How ISIS Spread in the Middle East - And How to Stop IT. The
Atlantic.
Kaufmann, C. D. and Pape, R. A. (1999). Explaining Costly International Moral Ac-
tion: Britain’s Sixty-year Campaign Against the Atlantic Slave Trade. International
Organization, 53(04):631–668.
Khodarkovsky, M. (2002). Russia’s steppe frontier : the making of a colonial empire,
1500-1800. Indiana University Press.
Klyuchevsky, V. (1911). A history of Russia,. J.M. Dent & Sons Ltd.;E.P. Dutton &
Co., London; New York.
52

Lehner, B., Verdin, K., Jarvis, A. (2008). New global hydrography derived from space-
borne elevation data. :. Eos, Transactions, 89(10):93–94.
Margolin, S. L. (1948). Vooruzhenie streletskogo voiska (Weapons of the Strel’tsy forces).
Trudy Gosudarstvennogo Istoricheskago Muzei, (Works of the State Historical Mu-
seum),.
Markevich, A. and Zhuravskaya, E. (2017). The Economic Effects of the Abolition of
Serfdom: Evidence from the Russian Empire. Working Papers.
Nossov, K. K. (2006). Russian fortresses 1480-1682. Osprey.
Nunn, N. and Puga, D. (2012). Ruggedness: The blessing of bad geography in Africa.
Review of Economics and Statistics.
Peters, M. (2016). War Financing and the Re-imposition of Serfdom after the Black
Death.
Postan, M. and Hatcher, J. (1978). AGRARIAN CLASS STRUCTURE AND ECO-
NOMIC DEVELOPMENT IN PRE-INDUSTRIAL EUROPE: POPULATION AND
CLASS RELATIONS IN FEUDAL SOCIETY. Past and Present, 78(1):24–37.
Roberts, M. (1956). The military revolution, 1560-1660 an inaugural lecture delivered
before the Queen’s University of Belfast. M. Boyd, [Belfast].
Saunders, J. J. (2001). The history of the Mongol conquests. University of Pennsylvania
Press.
Van Creveld, M. (1991). The transformation of war.
53