Embed Size (px)
Citation preview
ALIMAK GROUP AB Year-end report January – December 2015
World leader in vertical access solutions with a market presence in more than 60 countries
ALIMAK YEAR-END REPORT JANUARY – DECEMBER 2015 2
CONTINUED PROFITABLE GROWTH IN 2015 • Good growth in particular in the construction sector. • Oil & Gas still under heavy pressure. • Growth in sales and operating margin in line with financial targets.
Fourth quarter
• Order intake declined by 5 percent to SEK 425.6 (446.8) million. In local currencies, the decrease was 9 percent.
• Revenues increased by 13 percent to SEK 587.5 (518.0) million. In local currencies, the increase was 8 percent.
• Operating profit (EBIT) was SEK 104.4 (109.0) million. In local currencies, EBIT was 107.4 (109.0) million.
• Operating margin (EBIT percentage) before items affecting comparability was 17.8 (21.0) percent. In local currencies, the operating margin was 19.1 (21.0) percent.
• Cash flow from operating activities was SEK 118.4 (132.7) million
• Earnings per share SEK 1.66 (0.33)1
Full Year
• Order intake increased by 18 percent to SEK 2,109.1 (1,789.7) million. In local currencies, the increase was 8 percent.
• Revenues increased by 17 percent to SEK 2,036.3 (1,742.5) million. In local currencies, revenues increased by 7 percent.
• Operating profit (EBIT) before items affecting comparability increased to SEK 350.3 (316.9) million. In local currencies, EBIT increased to 343.9 (316.9) million.
• Operating margin (EBIT percentage) before items affecting comparability was 17.2 (18.2) percent. In local currencies, operating margin was 18.4 (18.2) percent.
• Cash flow from operating activities was SEK 239.8 (309.5) million
• Earnings per share was SEK 3.12 (1.07)1. • The Board of Directors proposes a dividend
of SEK 2.00 (0) per share for the 2015 financial year.
KEY FIGURES, GROUP2015 2014 ∆% 2015 2014 ∆%
Order intake, MSEK 425,6 446,8 -5% 2 109,1 1 789,7 18%
Revenues, MSEK 587,5 518,0 13% 2 036,3 1 742,5 17%
Operating profit (EBIT), before items affecting comparability, MSEK 104,4 109,0 -4% 350,3 316,9 11%
Operating profit (EBIT) in local currencies, MSEK 107,4 109,0 -1% 343,9 316,9 9%
Operating margin (EBIT), before items affecting comparability, % 17,8% 21,0% 17,2% 18,2%
Operating margin (EBIT) in local currencies, % 19,1% 21,0% 18,4% 18,2%
Operating profit (EBIT), MSEK 104,4 85,4 22% 296,2 287,7 3%
Operating margin (EBIT), % 17,8% 16,5% 14,5% 16,5%
Profit for the period, MSEK 72,0 14,5 398% 135,0 46,5 190%
Earnings per share, undiluted/diluted, SEK ¹ 1,66 0,33 3,12 1,07
Earnings per share, undiluted/diluted, SEK 1,66 14,47 3,12 46,50
Cash flow from operations, MSEK 118,4 132,7 239,8 309,5
¹ Calculated to existing number of shares, 43 326 289
Q4 Jan-Dec
ALIMAK YEAR-END REPORT JANUARY – DECEMBER 2015 3
COMMENTS FROM THE CEO
WE ARE REACHING MORE CUSTOMERS AROUND THE WORLDIn summing up our first financial year as a listed company, we can say that we are continuing to grow with good profitability in line with our financial targets. Revenues during 2015 increased by 17 percent to just over SEK 2 billion, with an operating margin of 17.2 percent adjusted for items affecting comparability. We continued to move our positions forward in the important fourth quarter. With an expanded range of products and services and distributors in new markets, we are reaching more customers than ever around the world. Revenue during the quarter increased by 13 percent overall and by 8 percent in local currencies, despite weaker demand in some market segments. The Construction Equipment business area showed a positive trend in sales during the quarter in both mature and emerging markets, with the particular exceptions of China and Brazil. There is still a large market in China, but we have chosen to be selective in taking business in the construction sector. In the longer term, we see great potential for growth in the Chinese market. Construction Equipment showed an impressive improvement in margin in 2015 compared with the previous year. The improvement has been achieved through a high proportion of sales of premium hoists in mature markets, while we have had good success with sales with our range of hoists for the mid-market segment in the Middle East, parts of Asia and other growth markets. We greatly expanded our sales channels during the year and now have more than 60 distributors around the world that can offer our solutions. Order intake for the Industrial Equipment business area was affected by lower demand in upstream oil and gas and in the mining industry during the quarter. There has been an overall increase in uncertainty in the market, which has impacted the whole industrial sector, and both revenues and profit margin declined during the year. We have redirected our sales and production resources to utilize the opportunities that exist in growing industrial segments. We achieved good sales results in 2015 in the energy sector in the United States, an area in which we see continued potential. We also see good market potential in sectors such as ports and the cement and chemical industries. As we have done in the Construction Equipment business area, we are
strengthening our sales organization and increasing our market channels and improving efficiency in production, as well as adding to our range of products and addressing new markets. The After Sales business area was affected to some extent during the quarter by increased uncertainty in the industrial sector in general and oil and gas in particular. Revenues and margins in After Sales on the whole are stable, but with some pressure on prices and reduced demand for refurbishment and upgrading of industrial elevators. We are increasing our sales efforts to create a basis for continued growth, despite partially weak market conditions in the industrial sector. We see great potential for after-market services in growing market segments, including the construction sector. We are also taking actions to reduce cost and to improve margins in After Sales. Order intake in the Rental business area was weak during the quarter, due in part to timing between various major construction projects. The Australian market continued to show a high level of activity, and Europe developed well, with the exception of France. Both revenues and profitability improved substantially in 2015 in comparison with the previous year, driven by a higher utilization rate and greater efficiency through Lean and other improvement projects run during the year. Alimak's positive trend in sales and profit in 2015 shows that our strategic initiatives are generating results. The weak demand in oil and gas and the mining industry and low growth in China will, however, impact our growth in 2016. With the activities already planned or under way in production and sales, as well as continued efficiencies, we anticipate that Alimak will be able to continue to achieve a good EBIT-margin during the financial year in line with our financial target. Tormod Gunleiksrud President and CEO
ALIMAK YEAR-END REPORT JANUARY – DECEMBER 2015 4
ALIMAK YEAR-END REPORT
Alimak is a world-leading supplier of elevators, platforms and after-market services for the industrial and construction sectors. The Group has manufacturing operations in Sweden and China and a sales and servicing network in more than 60 countries supplying and maintaining vertical access solutions. At present there are close to 22,000 elevators and platforms installed around the world. Alimak was established in Skellefteå in 1948 and has 1,100 employees around the world. In 2015, the Group had turnover of SEK 2.0 billion with an operating profit (adjusted for items affecting comparability) of SEK 350 million, and is listed on Nasdaq Stockholm. Alimak is organized into four business areas: Construction Equipment: Hoists and platforms for construction and refurbishment projects Industrial Equipment: Elevators for industrial use in end markets such as oil and gas, ports, shipyards, energy and cement. Rental: Rental services of the company's products After Sales: After-market services such as servicing, training, spare parts and refurbishment Chairman of the Board: Anders Thelin President and CEO: Tormod Gunleiksrud FINANCIAL TARGETS Growth in revenues The Group's target in the medium term (3 to 4 years) is an annual growth rate of 10 percent. EBIT margin The Group's target in the medium term (3 to 4 years) is to have an EBIT margin of 17 percent. Leverage (net debt/EBITDA) The company will maintain an effective capital structure with a net debt of around twice EBITDA. The capital structure will be flexible and allow for strategic initiatives. Dividend policy The company has a target of paying a dividend of approximately 50 percent of its net profit for the current period to its shareholders. Decisions on dividend payment will take account of the company's financial position, cash flow, acquisition opportunities, strategic considerations and future prospects. MARKET The global construction market continued to develop well during the fourth and last quarter of the year, although there were large regional differences. Demand for vertical access solutions in mature markets was good. The Chinese construction market was weak during the quarter and did not show any signs of improvement. At the same time, demand in other growth markets in Asia, including Vietnam, Burma, Korea and Indonesia, has been good. Turkey and several countries in the Middle East have developed positively. Demand in the African market, which has been weak for a number of years, rose during the year. Development in the global industrial market showed wide variation between different market segments and geographic regions. The oil and gas segment continues to be under heavy pressure from low commodity prices, resulting in lower utilization of capacity on existing rigs and platforms and substantially lower new investments. There is still some demand in refineries and other processing facilities. As a consequence of development in the industrial segment, projects and investments in many cases have
been deferred, equipment has been cold stacked and customers have sharply reduced their workforces with the aim of reducing costs. The mining industry has also been affected by lower commodity prices. Ports and the cement and power industries, on the other hand, have developed more favorably. The mature US market showed good growth throughout the year, while the European market was stable, albeit at a lower level. Despite lower growth figures throughout the year, the Chinese market is an interesting market with selective opportunities in several industrial segments. The rest of South-East Asia is pointing to good growth opportunities. Parts of the industrial segment developed weakly during the fourth quarter. Demand for services, principally in oil and gas, was adversely impacted by great uncertainty and low commodity prices. Interest in upgrading and refurbishment has diminished as a result of customers' need to reduce their costs. At the same time, a pent-up demand is being created for the maintenance, refurbishment and efficiency improvement measures that are critical to enabling the facilities to retain productivity when the market does stabilize. Demand for after-market services in the construction market segment developed well. The rental market is generally following the trend in the construction market. The market in Australia continued to grow during the fourth quarter. The United Kingdom continued to develop well, particularly in the metropolitan regions. In the rest of Europe, development was good or stable in all countries except for France, which showed some downturn.
ALIMAK YEAR-END REPORT JANUARY – DECEMBER 2015 5
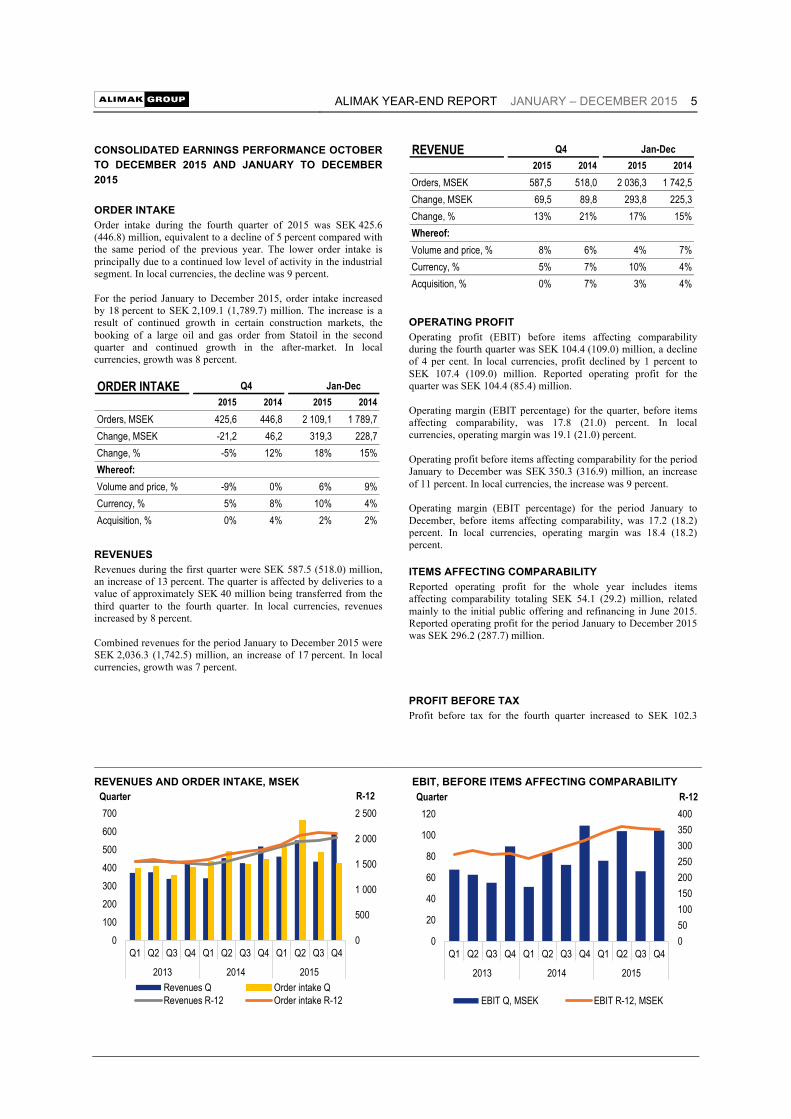
CONSOLIDATED EARNINGS PERFORMANCE OCTOBER TO DECEMBER 2015 AND JANUARY TO DECEMBER 2015 ORDER INTAKE Order intake during the fourth quarter of 2015 was SEK 425.6 (446.8) million, equivalent to a decline of 5 percent compared with the same period of the previous year. The lower order intake is principally due to a continued low level of activity in the industrial segment. In local currencies, the decline was 9 percent. For the period January to December 2015, order intake increased by 18 percent to SEK 2,109.1 (1,789.7) million. The increase is a result of continued growth in certain construction markets, the booking of a large oil and gas order from Statoil in the second quarter and continued growth in the after-market. In local currencies, growth was 8 percent.
REVENUES Revenues during the first quarter were SEK 587.5 (518.0) million, an increase of 13 percent. The quarter is affected by deliveries to a value of approximately SEK 40 million being transferred from the third quarter to the fourth quarter. In local currencies, revenues increased by 8 percent. Combined revenues for the period January to December 2015 were SEK 2,036.3 (1,742.5) million, an increase of 17 percent. In local currencies, growth was 7 percent.
OPERATING PROFIT Operating profit (EBIT) before items affecting comparability during the fourth quarter was SEK 104.4 (109.0) million, a decline of 4 per cent. In local currencies, profit declined by 1 percent to SEK 107.4 (109.0) million. Reported operating profit for the quarter was SEK 104.4 (85.4) million. Operating margin (EBIT percentage) for the quarter, before items affecting comparability, was 17.8 (21.0) percent. In local currencies, operating margin was 19.1 (21.0) percent. Operating profit before items affecting comparability for the period January to December was SEK 350.3 (316.9) million, an increase of 11 percent. In local currencies, the increase was 9 percent. Operating margin (EBIT percentage) for the period January to December, before items affecting comparability, was 17.2 (18.2) percent. In local currencies, operating margin was 18.4 (18.2) percent. ITEMS AFFECTING COMPARABILITY Reported operating profit for the whole year includes items affecting comparability totaling SEK 54.1 (29.2) million, related mainly to the initial public offering and refinancing in June 2015. Reported operating profit for the period January to December 2015 was SEK 296.2 (287.7) million. PROFIT BEFORE TAX Profit before tax for the fourth quarter increased to SEK 102.3
ORDER INTAKE2015 2014 2015 2014
Orders, MSEK 425,6 446,8 2 109,1 1 789,7Change, MSEK -21,2 46,2 319,3 228,7Change, % -5% 12% 18% 15%Whereof:Volume and price, % -9% 0% 6% 9%Currency, % 5% 8% 10% 4%Acquisition, % 0% 4% 2% 2%
Q4 Jan-Dec
REVENUE2015 2014 2015 2014
Orders, MSEK 587,5 518,0 2 036,3 1 742,5Change, MSEK 69,5 89,8 293,8 225,3Change, % 13% 21% 17% 15%Whereof:Volume and price, % 8% 6% 4% 7%Currency, % 5% 7% 10% 4%Acquisition, % 0% 7% 3% 4%
Q4 Jan-Dec
REVENUES AND ORDER INTAKE, MSEK EBIT, BEFORE ITEMS AFFECTING COMPARABILITY
0
500
1 000
1 500
2 000
2 500
0100200300400500600700
Q1 Q2 Q3 Q4 Q1 Q2 Q3 Q4 Q1 Q2 Q3 Q4
2013 2014 2015
R-12Quarter
Revenues Q Order intake QRevenues R-12 Order intake R-12
050100150200250300350400
0
20
40
60
80
100
120
Q1 Q2 Q3 Q4 Q1 Q2 Q3 Q4 Q1 Q2 Q3 Q4
2013 2014 2015
R-12Quarter
EBIT Q, MSEK EBIT R-12, MSEK
ALIMAK YEAR-END REPORT JANUARY – DECEMBER 2015 6
(28.7) million, impacted by both operational and financial improvements. For the period January to December 2015, profit before tax was SEK 198.3 (91.7) million. Profit was positively impacted by the refinancing of the company during the year. TAX Tax expenses for the fourth quarter of 2015 totaled SEK -30.2 (-14.2) million, and for January to December 2015 were SEK -63.3 (-45.2) million. Reported tax expense varies depending on the geographic distribution of the company's profits and how any deficits can be utilized. The 2015 tax expense of more than 30 percent is expected to drop toward 25 percent over the next few years due to the current review of the Group's global transfer price policy. INVESTMENTS Investments during the fourth quarter totaled SEK 10.7 (24.3) million, of which 5.7 (13.2) was related to rental equipment. Investments in 2015 were adapted to the prevailing trend in the market and the need for manufacturing capacity. The investments during the period January to December 2015 totaled SEK 28.8 (62.6) million, of which 12.3 (17.6) million pertained to rental equipment. FINANCIAL POSITION Net financial items were positively affected in the fourth quarter by exchange gains, the impact of the refinancing of the company and the now terminated intra-group loan structure. The intra-group loan structure had an impact on net financial items of SEK -31.7 million during the period January to December 2015. Net debt was SEK 371.1 (556.0) million at 31 December 2015. The equity ratio was 61.0 (26.6) percent. Among other factors, the changes are due to effects of the stock market listing, including conversion of a shareholder's loan from debt to equity and refinancing of the company in June. Cash flow from operating activities declined in the fourth quarter to SEK 118.4 (132.7) million and in the period January to December 2015 was SEK 239.8 (309.5) million. The decline is principally attributable to a strong second half of 2014, which contained positive impacts from the start-up of manufacturing in China, deliveries of the new mid-market products and the acquisition of Heis-Tek, all of which had a positive effect on cash flow in the previous year. Future cash flows will continue to be used to repay loans, but also to provide financial flexibility for acquisitions and for dividends. PLEDGED ASSETS AND CONTINGENT LIABILITIES Pledged assets and contingent liabilities totaled SEK102.3 (2,451.2) and 98.8 (212.7) million, respectively. The change in pledged assets comes from release of pledges in connection with the refinancing of the company in June 2015. EMPLOYEES The number of employees at 31 December 2015 was 1,091 (1,079) of whom 953 (941) men and 138 (138) women.
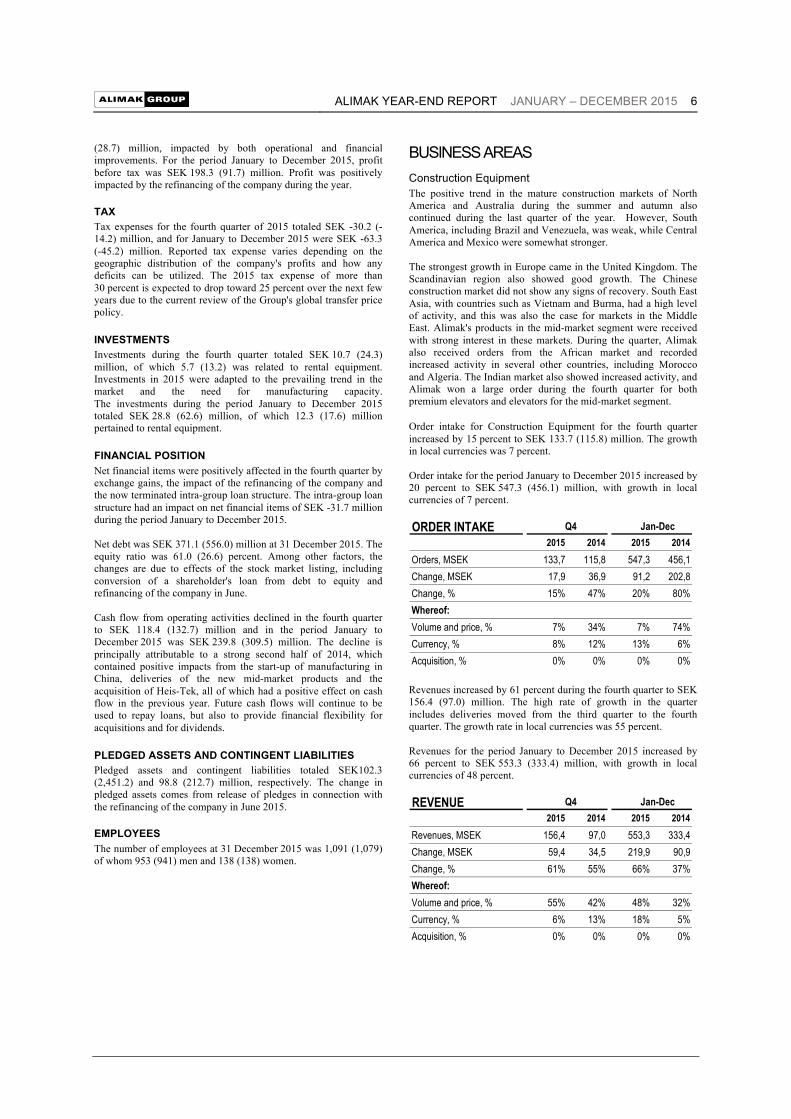
BUSINESS AREAS Construction Equipment The positive trend in the mature construction markets of North America and Australia during the summer and autumn also continued during the last quarter of the year. However, South America, including Brazil and Venezuela, was weak, while Central America and Mexico were somewhat stronger. The strongest growth in Europe came in the United Kingdom. The Scandinavian region also showed good growth. The Chinese construction market did not show any signs of recovery. South East Asia, with countries such as Vietnam and Burma, had a high level of activity, and this was also the case for markets in the Middle East. Alimak's products in the mid-market segment were received with strong interest in these markets. During the quarter, Alimak also received orders from the African market and recorded increased activity in several other countries, including Morocco and Algeria. The Indian market also showed increased activity, and Alimak won a large order during the fourth quarter for both premium elevators and elevators for the mid-market segment. Order intake for Construction Equipment for the fourth quarter increased by 15 percent to SEK 133.7 (115.8) million. The growth in local currencies was 7 percent. Order intake for the period January to December 2015 increased by 20 percent to SEK 547.3 (456.1) million, with growth in local currencies of 7 percent.
Revenues increased by 61 percent during the fourth quarter to SEK 156.4 (97.0) million. The high rate of growth in the quarter includes deliveries moved from the third quarter to the fourth quarter. The growth rate in local currencies was 55 percent. Revenues for the period January to December 2015 increased by 66 percent to SEK 553.3 (333.4) million, with growth in local currencies of 48 percent.
ORDER INTAKE2015 2014 2015 2014
Orders, MSEK 133,7 115,8 547,3 456,1Change, MSEK 17,9 36,9 91,2 202,8Change, % 15% 47% 20% 80%Whereof:Volume and price, % 7% 34% 7% 74%Currency, % 8% 12% 13% 6%Acquisition, % 0% 0% 0% 0%
Q4 Jan-Dec
REVENUE2015 2014 2015 2014
Revenues, MSEK 156,4 97,0 553,3 333,4Change, MSEK 59,4 34,5 219,9 90,9Change, % 61% 55% 66% 37%Whereof:Volume and price, % 55% 42% 48% 32%Currency, % 6% 13% 18% 5%Acquisition, % 0% 0% 0% 0%
Q4 Jan-Dec

ALIMAK YEAR-END REPORT JANUARY – DECEMBER 2015 7
Operating profit (EBIT, before items affecting comparability) increased to SEK 19.6 (2.3) million during the fourth quarter. In local currencies, operating profit was SEK 22.4 (2.3) million. The improvement is due to increased volumes, better sales mix and improved cost-effectiveness. Operating profit (EBIT, before items affecting comparability) for the period January to December 2015 increased to SEK 58.8 (-4.2) million. In local currencies, operating profit was SEK 62.7 (-4.2) million. Industrial Equipment The prevailing uncertainty over prices of energy and raw materials continued to press on the oil and gas segment and adjacent industrial segments during the fourth quarter. Falling oil prices mean that oil rigs stand idle and the need for servicing declines. However, the company noted increased activity among customers operating in downstream oil and gas. There is also increased activity in petrochemicals and LNG (Liquefied Natural Gas) in a number of markets. The trend for other industrial sectors is more favorable and in line with the third quarter, although there are wide differences between the geographic regions. In North America, Alimak is now addressing the power, chemical and food industries. The global ports market was stable. Order intake during the fourth quarter of 2015 declined by 31 percent to SEK 83.7 (121.7) million, under the impact of a weak market. The growth in local currencies was -34 per cent. Order intake for the period January-December 2015 increased by 14 percent to SEK 530.9 (465.1) million, principally due to the Statoil order for Johan Sverdrup booked in the second quarter. The growth in local currencies for the period was 9 percent.
Revenues during the fourth quarter declined by 5 percent to SEK 168.4 (177.2) million, and was supported by the Sverdrup project, which is running according to plan. In local currencies, revenues declined by 10 percent. Revenues during the period January to December 2015 declined by 11 percent to SEK 485.5 (545.3) million. In local currencies, the decline as 16 percent.
Operating profit (EBIT, before items affecting comparability) declined to SEK 15.6 (42.2) million, mainly under the impact of lower revenues, product mix and a maintained cost structure. In local currencies, operating profit was SEK 15.5 (42.2) million. Operating profit (EBIT, before items affecting comparability) for the period January to December 2015 declined to SEK 42.0 (103.4) million, again due to lower revenues and mix. In local currencies, operating profit was SEK 42.5 (103.4) million. Rental The Australian rental market, which together with Europe is Alimak's principal market for this business, showed continued strong growth. This, combined with the efficiency improvement measures that were taken in this operation and are expected to continue to have an impact in 2016, contributed to a good trend for the business area. The smaller-scale operation in the United States developed well, and the European market, including the Netherlands, also developed positively, albeit at a slower pace. The French market, however, was weak. Order intake during the fourth quarter of 2015 declined by 19 percent to SEK 49.5 (61.0) million, due to timing with a smaller number of major projects started during the quarter compared with the previous year. The sales pipeline, however, continues to be strong in addressed countries. In local currencies, order intake declined by 16 percent. Sales of used equipment declined somewhat in the quarter. Order intake for the period January-December 2015 increased by 10 percent to SEK 328.8 (299.7) million, with an increase in local currencies of 4 percent.
Revenues during the fourth quarter increased by 14 percent to SEK 85.5 (75.1) million, principally due to a good order book and continued good order intake in 2015. The growth in local currencies was 12 per cent. Revenues for the period January-December 2015 increased by 11
ORDER INTAKE2015 2014 2015 2014
Orders, MSEK 83,7 121,7 530,9 465,1Change, MSEK -38,0 -17,3 65,8 -47,6Change, % -31% -12% 14% -9%Whereof:Volume and price, % -34% -19% 8% -12%Currency, % 2% 3% 5% 2%Acquisition, % 0% 3% 1% 1%
Q4 Jan-Dec
REVENUE2015 2014 2015 2014
Revenues, MSEK 168,4 177,2 485,5 545,3Change, MSEK -8,8 10,8 -59,8 48,9Change, % -5% 7% -11% 10%Whereof:Volume and price, % -10% -8% -21% 2%Currency, % 5% 4% 5% 2%Acquisition, % 0% 11% 5% 5%
Q4 Jan-Dec
ORDER INTAKE2015 2014 2015 2014
Orders, MSEK 49,5 61,0 328,8 299,7Change, MSEK -11,5 4,7 29,1 22,9Change, % -19% 8% 10% 8%Whereof:Volume and price, % -16% 1% 4% 5%Currency, % -3% 8% 6% 3%Acquisition, % 0% 0% 0% 0%
Q4 Jan-Dec

ALIMAK YEAR-END REPORT JANUARY – DECEMBER 2015 8
percent to SEK 308.4 (278.5) million, with growth in local currencies of 5 percent.
Operating profit (EBIT, before items affecting comparability) increased during the fourth quarter to SEK 12.4 (4.5) million, due to better operating margins, a favorable mix of rental projects and sales of used equipment. In local currencies, operating profit was SEK 12.0 (4.5) million. Operating profit (EBIT, before items affecting comparability) for the period January to December 2015 increased to SEK 26.9 (10.8) million. In local currencies, operating profit was SEK 26.7 (10.8) million. After Sales The market for after-market services shows some impact from the weak trend in the industrial sector. Demand in oil and gas in particular was weak, principally in relation to services targeting platforms, while the situation was somewhat better at refineries. The oil and gas segment is continuing to focus on cost reduction, while lower capacity utilization at customers has led to a reduced need for maintenance and, in some cases, to longer servicing cycles and greater use of own staff. For other industrial segments that Alimak addresses, for example the food and chemical industries, LNG, ports and shipyards, where the Group has increased its focus, the trend was somewhat more favorable and Alimak gained several new orders. Higher penetration of the construction sector, combined with other sales and cost measures, will create a basis for growth in the business area. Order intake for the fourth quarter increased by 7 percent to SEK 158.7 (148.3) million. In local currencies, order intake was unchanged. Order intake for the period January-December 2015 increased by 23 percent to SEK 702.0 (568.9) million and by 11 percent in local currencies.
Revenues for the fourth quarter increased by 5 percent to SEK 177.3 (168.6) million. In local currencies, the growth was -1 percent, principally due to somewhat fewer refurbishment projects for industrial elevators compared with the corresponding period last year and the fact that offshore customers are re-examining the extent, timing and frequency of servicing visits. Revenues for the period January to December 2015 increased by 18 percent to SEK 689.0 (585.2) million, with growth in local currencies of 5 percent.
Operating profit (EBIT, before items affecting comparability) declined during the fourth quarter to SEK 56.8 (59.9) million. In local currencies, operating profit was SEK 57.6 (59.9) million. Operating profit (EBIT, before items affecting comparability) for the period January to December 2015 increased to SEK 222.6 (206.9) million. In local currencies, operating profit was SEK 211.8 (206.9) million. In addition to sales measures, cost and productivity measures are being taken that will create a basis for both growth and good profitability in the business area.
REVENUE2015 2014 2015 2014
Revenues, MSEK 85,5 75,1 308,4 278,5Change, MSEK 10,3 10,3 29,9 -6,6Change, % 14% 16% 11% -2%Whereof:Volume and price, % 12% 10% 5% -6%Currency, % 2% 6% 5% 3%Acquisition, % 0% 0% 0% 0%
Q4 Jan-Dec
ORDER INTAKE2015 2014 2015 2014
Orders, MSEK 158,7 148,3 702,0 568,9Change, MSEK 10,4 21,9 133,1 50,6Change, % 7% 17% 23% 10%Whereof:Volume and price, % 0% -1% 5% 2%Currency, % 7% 10% 13% 5%Acquisition, % 0% 9% 6% 4%
Q4 Jan-Dec
REVENUE2015 2014 2015 2014
Revenues, MSEK 177,3 168,6 689,0 585,2Change, MSEK 8,7 34,1 103,8 92,1Change, % 5% 25% 18% 19%Whereof:Volume and price, % -1% 6% 1% 8%Currency, % 6% 9% 12% 5%Acquisition, % 0% 10% 4% 6%
Q4 Jan-Dec
ALIMAK YEAR-END REPORT JANUARY – DECEMBER 2015 9
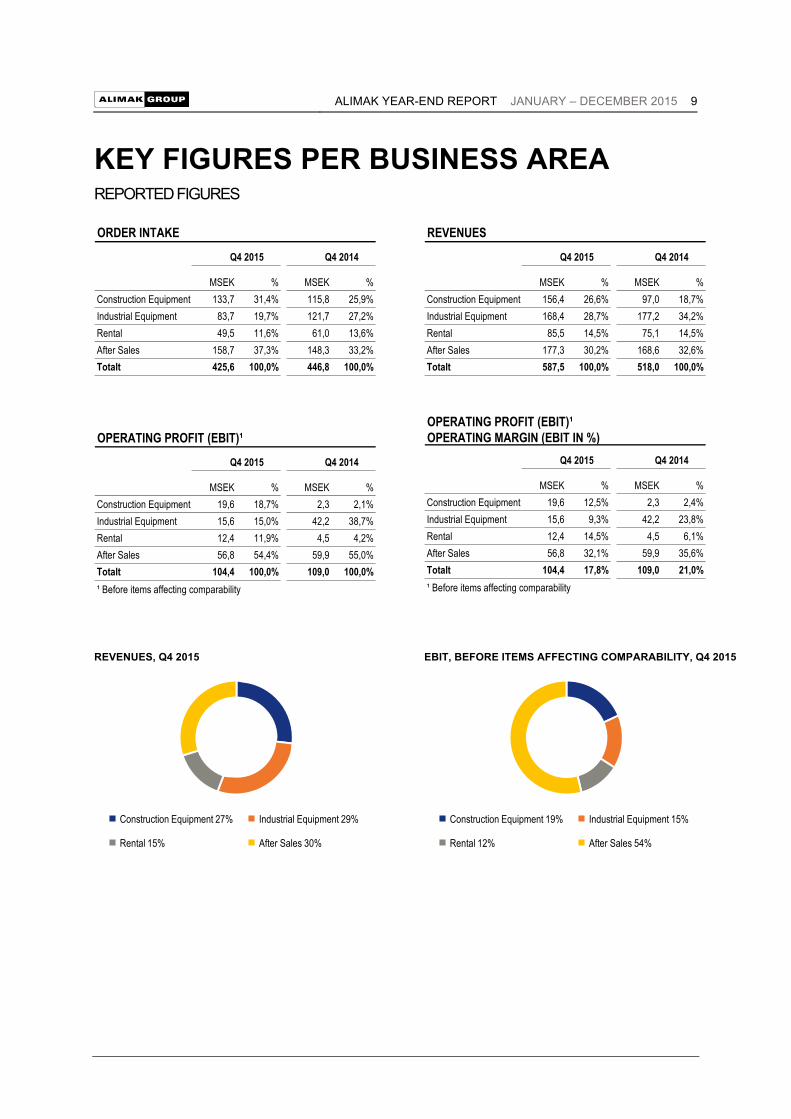
KEY FIGURES PER BUSINESS AREA REPORTED FIGURES
REVENUES, Q4 2015 EBIT, BEFORE ITEMS AFFECTING COMPARABILITY, Q4 2015
MSEK % MSEK %Construction Equipment 133,7 31,4% 115,8 25,9%Industrial Equipment 83,7 19,7% 121,7 27,2%Rental 49,5 11,6% 61,0 13,6%After Sales 158,7 37,3% 148,3 33,2%Totalt 425,6 100,0% 446,8 100,0%
ORDER INTAKE
Q4 2015 Q4 2014
MSEK % MSEK %Construction Equipment 156,4 26,6% 97,0 18,7%Industrial Equipment 168,4 28,7% 177,2 34,2%Rental 85,5 14,5% 75,1 14,5%After Sales 177,3 30,2% 168,6 32,6%Totalt 587,5 100,0% 518,0 100,0%
Q4 2015 Q4 2014
REVENUES
MSEK % MSEK %Construction Equipment 19,6 18,7% 2,3 2,1%Industrial Equipment 15,6 15,0% 42,2 38,7%Rental 12,4 11,9% 4,5 4,2%After Sales 56,8 54,4% 59,9 55,0%Totalt 104,4 100,0% 109,0 100,0%¹ Before items affecting comparability
OPERATING PROFIT (EBIT)¹
Q4 2015 Q4 2014
OPERATING PROFIT (EBIT)¹OPERATING MARGIN (EBIT IN %)
MSEK % MSEK %Construction Equipment 19,6 12,5% 2,3 2,4%Industrial Equipment 15,6 9,3% 42,2 23,8%Rental 12,4 14,5% 4,5 6,1%After Sales 56,8 32,1% 59,9 35,6%Totalt 104,4 17,8% 109,0 21,0%¹ Before items affecting comparability
Q4 2015 Q4 2014
Construction Equipment 27% Industrial Equipment 29%
Rental 15% After Sales 30%
Construction Equipment 19% Industrial Equipment 15%
Rental 12% After Sales 54%
ALIMAK YEAR-END REPORT JANUARY – DECEMBER 2015 10
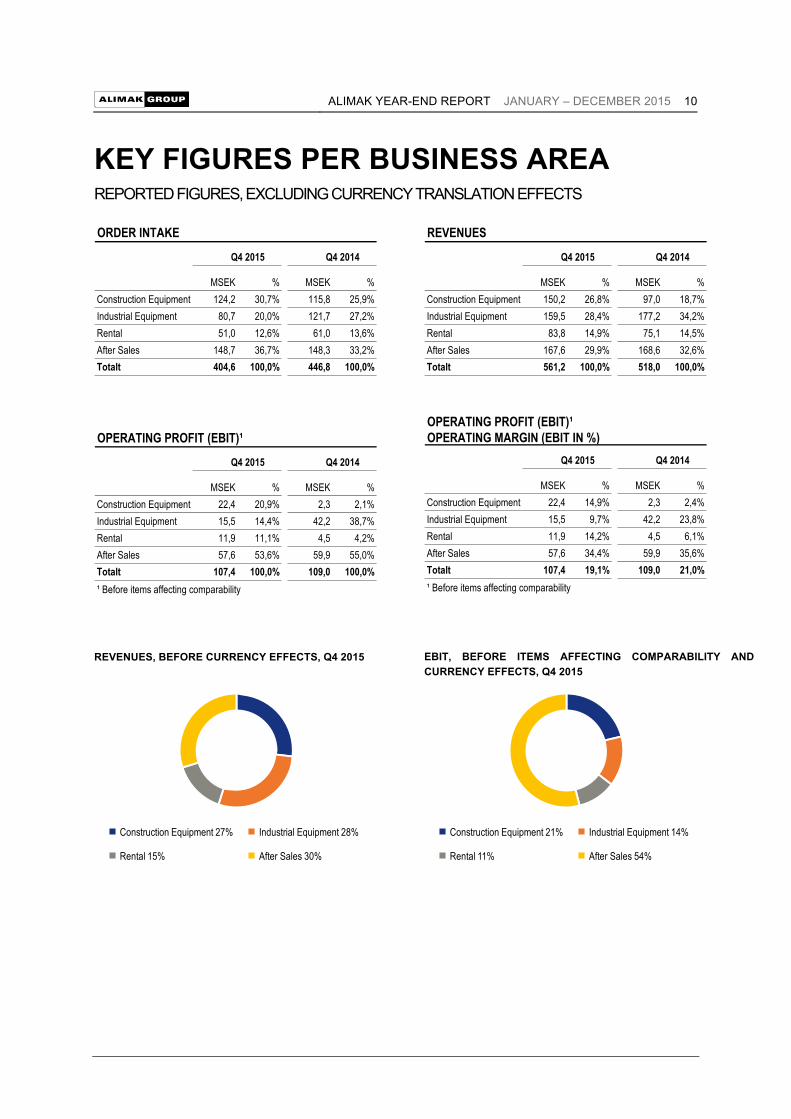
KEY FIGURES PER BUSINESS AREA REPORTED FIGURES, EXCLUDING CURRENCY TRANSLATION EFFECTS
REVENUES, BEFORE CURRENCY EFFECTS, Q4 2015 EBIT, BEFORE ITEMS AFFECTING COMPARABILITY AND CURRENCY EFFECTS, Q4 2015
MSEK % MSEK %Construction Equipment 124,2 30,7% 115,8 25,9%Industrial Equipment 80,7 20,0% 121,7 27,2%Rental 51,0 12,6% 61,0 13,6%After Sales 148,7 36,7% 148,3 33,2%Totalt 404,6 100,0% 446,8 100,0%
ORDER INTAKE
Q4 2015 Q4 2014
MSEK % MSEK %Construction Equipment 150,2 26,8% 97,0 18,7%Industrial Equipment 159,5 28,4% 177,2 34,2%Rental 83,8 14,9% 75,1 14,5%After Sales 167,6 29,9% 168,6 32,6%Totalt 561,2 100,0% 518,0 100,0%
REVENUES
Q4 2015 Q4 2014
MSEK % MSEK %Construction Equipment 22,4 20,9% 2,3 2,1%Industrial Equipment 15,5 14,4% 42,2 38,7%Rental 11,9 11,1% 4,5 4,2%After Sales 57,6 53,6% 59,9 55,0%Totalt 107,4 100,0% 109,0 100,0%¹ Before items affecting comparability
OPERATING PROFIT (EBIT)¹
Q4 2015 Q4 2014
OPERATING PROFIT (EBIT)¹OPERATING MARGIN (EBIT IN %)
MSEK % MSEK %Construction Equipment 22,4 14,9% 2,3 2,4%Industrial Equipment 15,5 9,7% 42,2 23,8%Rental 11,9 14,2% 4,5 6,1%After Sales 57,6 34,4% 59,9 35,6%Totalt 107,4 19,1% 109,0 21,0%¹ Before items affecting comparability
Q4 2015 Q4 2014
Construction Equipment 27% Industrial Equipment 28%
Rental 15% After Sales 30%
Construction Equipment 21% Industrial Equipment 14%
Rental 11% After Sales 54%
ALIMAK YEAR-END REPORT JANUARY – DECEMBER 2015 11
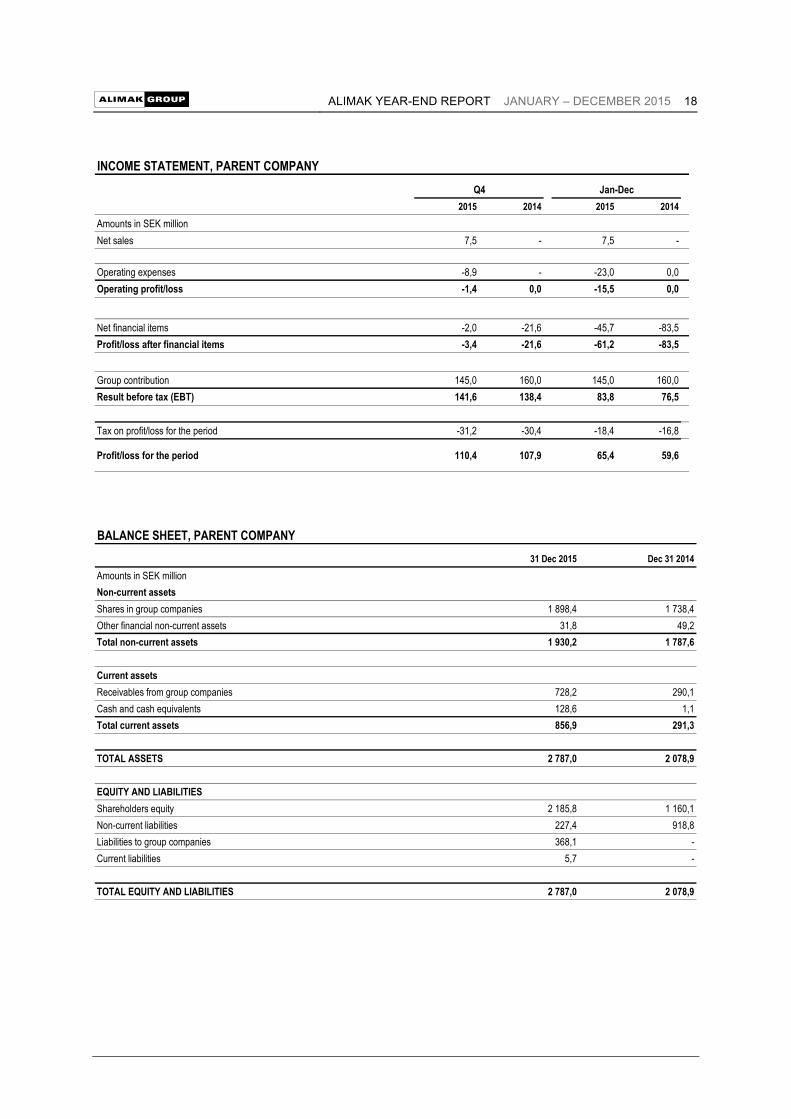
PARENT COMPANY Net sales for the fourth quarter 2015 amounted to SEK 7.5 (-) million and profit for the period was SEK 110.4 (107.9) million. For the period January to December 2015 net sales amounted to SEK 7.5 (-) million and profit for the period was SEK 65.4 (59.6) million. EVENTS AFTER THE END OF THE PERIOD No significant events have occurred since 31 December 2015. RISKS For a description of risks and uncertainties please refer to Alimak Group AB's 2014 annual report. No material re-assessments have been made since publication of the 2014 Annual Report. CALENDAR ● Alimak Group's annual report for the 2015 financial year will be published on 19 April 2016. ● Alimak Group's interim report for the period January to March 2016 will be published on 28 April 2016. ● The Annual General Meeting of Alimak Group for the 2015 financial year will be held on 11 May 2016. ● Alimak Group's financial calendar is available at www.alimakgroup.com ALIMAK GROUP ANNUAL GENERAL MEETING The Annual General Meeting of Alimak Group will be held at 4 pm on Wednesday 11 May 2016 at Citykonferensen, Ingenjörshuset Malmskillnadsgatan 46, Stockholm. Notice of the Annual General Meeting will be published no later than 6 April 2016. DIVIDEND The Board of Directors proposes a dividend of SEK 2.00 (0) per share. The proposed dividend totals SEK 86.7 million, which represents 64 percent of the profit after tax for the financial year.
DECLARATION The CEO declares that the interim report presents a true and fair view of the operations, financial position and results of the Parent Company and Group, and describes the significant risks and uncertainties facing the Parent Company and the companies forming
part of the Group. Stockholm, 25 February, 2016
Tormod Gunleiksrud President and CEO
Alimak Group AB corporate identity number 556714-1857
This interim report has not been reviewed by the company's auditors.
For further information, contact: Tormod Gunleiksrud, President and CEO, telephone: +46 (0)8–402 14 42 Stefan Rinaldo, CFO, telephone: +46 (0)8–402 14 47 Sofia Wretman, Head of Communications and IR, telephone: +46 (0)8–402 14 41
ALIMAK YEAR-END REPORT JANUARY – DECEMBER 2015 12
FINANCIALS
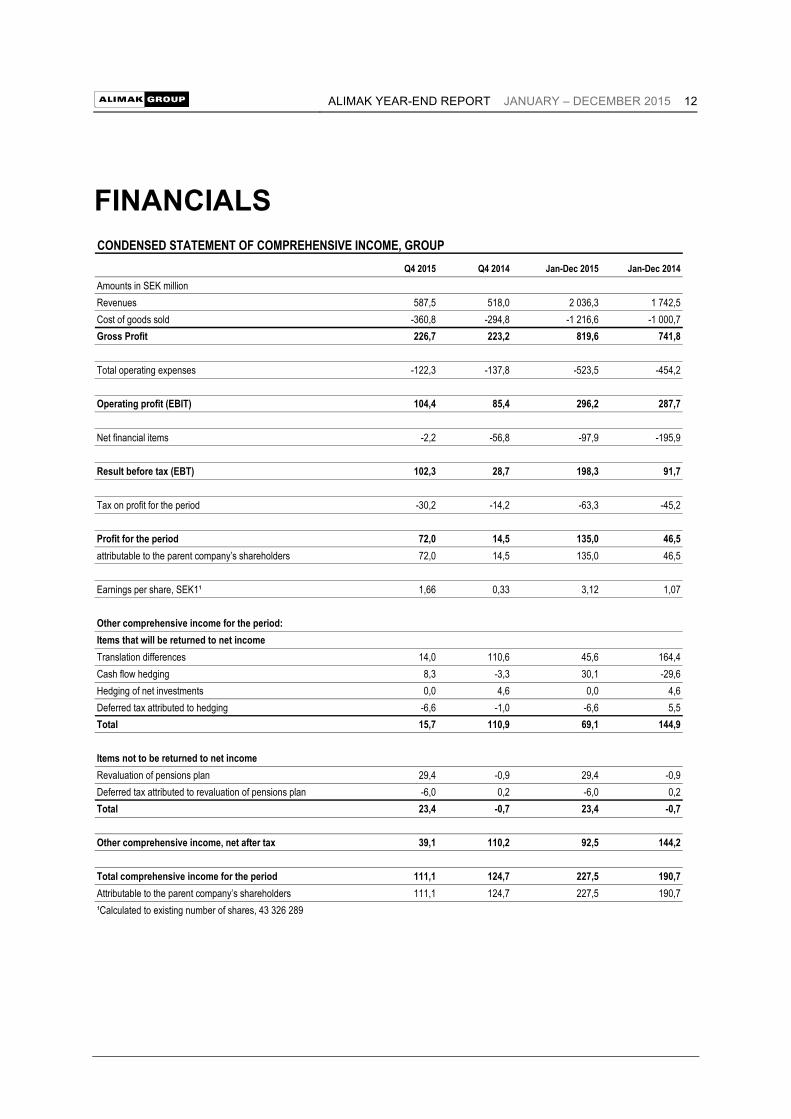
Q4 2015 Q4 2014 Jan-Dec 2015 Jan-Dec 2014Amounts in SEK millionRevenues 587,5 518,0 2 036,3 1 742,5Cost of goods sold -360,8 -294,8 -1 216,6 -1 000,7Gross Profit 226,7 223,2 819,6 741,8
Total operating expenses -122,3 -137,8 -523,5 -454,2
Operating profit (EBIT) 104,4 85,4 296,2 287,7
Net financial items -2,2 -56,8 -97,9 -195,9
Result before tax (EBT) 102,3 28,7 198,3 91,7
Tax on profit for the period -30,2 -14,2 -63,3 -45,2
Profit for the period 72,0 14,5 135,0 46,5attributable to the parent company’s shareholders 72,0 14,5 135,0 46,5
Earnings per share, SEK1¹ 1,66 0,33 3,12 1,07
Other comprehensive income for the period:Items that will be returned to net incomeTranslation differences 14,0 110,6 45,6 164,4Cash flow hedging 8,3 -3,3 30,1 -29,6Hedging of net investments 0,0 4,6 0,0 4,6Deferred tax attributed to hedging -6,6 -1,0 -6,6 5,5Total 15,7 110,9 69,1 144,9
Items not to be returned to net incomeRevaluation of pensions plan 29,4 -0,9 29,4 -0,9Deferred tax attributed to revaluation of pensions plan -6,0 0,2 -6,0 0,2Total 23,4 -0,7 23,4 -0,7
Other comprehensive income, net after tax 39,1 110,2 92,5 144,2
Total comprehensive income for the period 111,1 124,7 227,5 190,7Attributable to the parent company’s shareholders 111,1 124,7 227,5 190,7¹Calculated to existing number of shares, 43 326 289
CONDENSED STATEMENT OF COMPREHENSIVE INCOME, GROUP

ALIMAK YEAR-END REPORT JANUARY – DECEMBER 2015 13
CONDENSED STATEMENT OF FINANCIAL POSITION, GROUP31 Dec 2015 31 Dec 2014
Amounts in SEK millionASSETSIntangible fixed assets 1 729,7 1 703,7Tangible fixed assets 268,1 276,6Other non-current financial assets 79,5 104,2Total non-current assets 2 077,3 2 084,4
Inventories 343,9 313,0Trade receivables 365,8 337,8Other receivables 127,5 134,0Cash and cash equivalents 450,0 384,7Total current assets 1 287,2 1 169,6TOTAL ASSETS 3 364,5 3 254,0
EQUITY AND LIABILITIESShareholders equity 2 052,1 864,2
Non-current liabilitiesInterest bearing debts 743,3 692,2Liabilities to parent company 0,0 918,8Other long term liabilities 125,9 149,8Total non-current liabilities 869,1 1 760,8
Current liabilitiesInterest bearing debts 77,8 248,5Accounts payable 195,9 192,9Other current liabilities 169,5 187,6Total current liabilities 443,3 628,9TOTAL EQUITY AND LIABILITIES 3 364,5 3 254,0
ALIMAK YEAR-END REPORT JANUARY – DECEMBER 2015 14
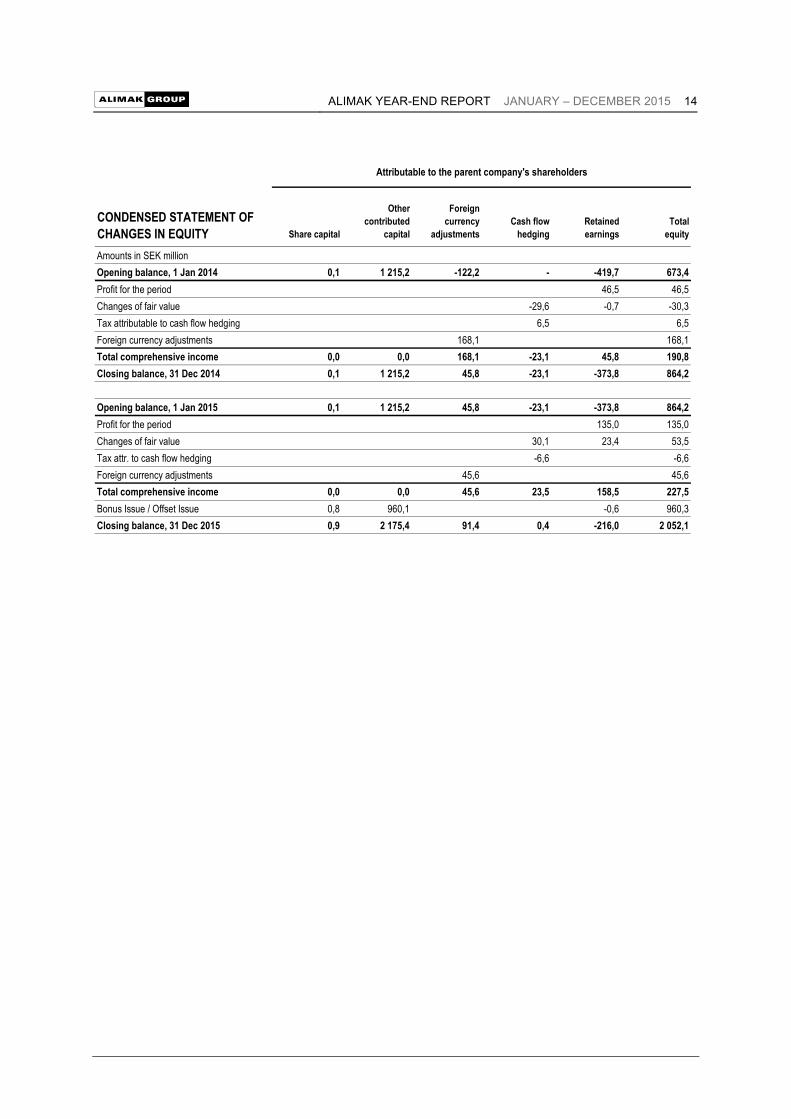
CONDENSED STATEMENT OF CHANGES IN EQUITY Share capital
Other contributed
capital
Foreign currency
adjustmentsCash flow
hedgingRetained earnings
Total equity
Amounts in SEK millionOpening balance, 1 Jan 2014 0,1 1 215,2 -122,2 - -419,7 673,4Profit for the period 46,5 46,5Changes of fair value -29,6 -0,7 -30,3Tax attributable to cash flow hedging 6,5 6,5Foreign currency adjustments 168,1 168,1Total comprehensive income 0,0 0,0 168,1 -23,1 45,8 190,8Closing balance, 31 Dec 2014 0,1 1 215,2 45,8 -23,1 -373,8 864,2
Opening balance, 1 Jan 2015 0,1 1 215,2 45,8 -23,1 -373,8 864,2Profit for the period 135,0 135,0Changes of fair value 30,1 23,4 53,5Tax attr. to cash flow hedging -6,6 -6,6Foreign currency adjustments 45,6 45,6Total comprehensive income 0,0 0,0 45,6 23,5 158,5 227,5Bonus Issue / Offset Issue 0,8 960,1 -0,6 960,3Closing balance, 31 Dec 2015 0,9 2 175,4 91,4 0,4 -216,0 2 052,1
Attributable to the parent company's shareholders
ALIMAK YEAR-END REPORT JANUARY – DECEMBER 2015 15
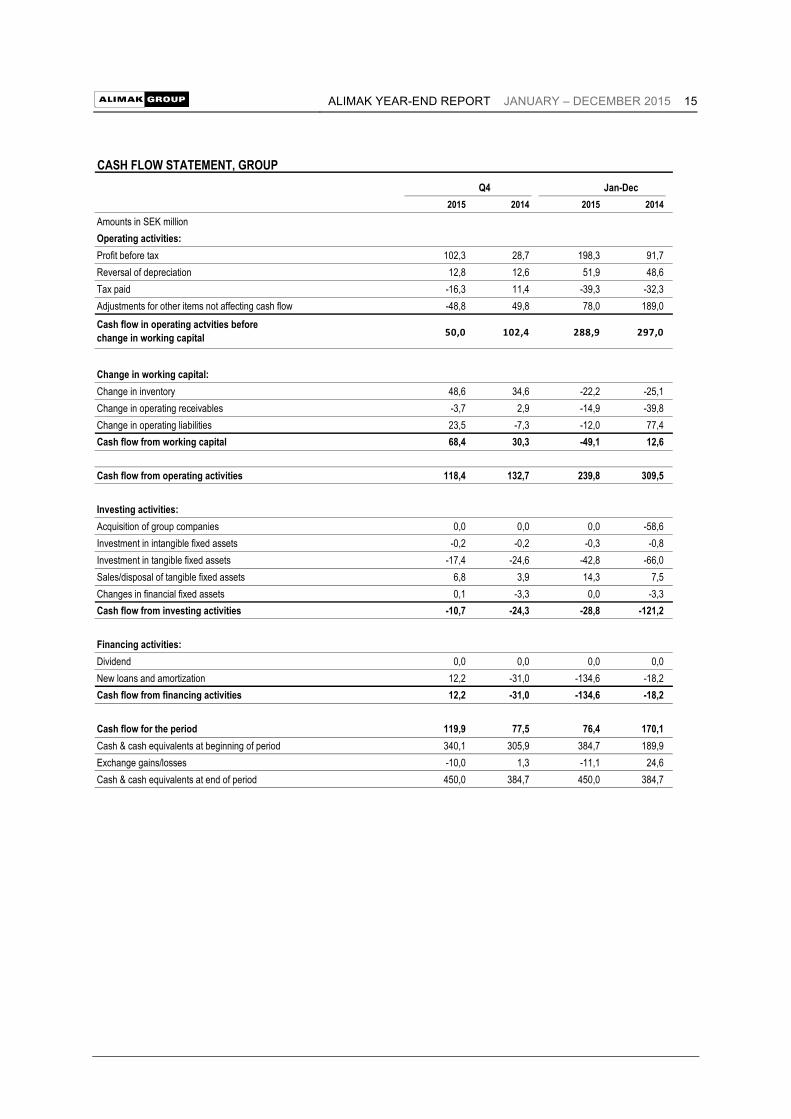
CASH FLOW STATEMENT, GROUP
2015 2014 2015 2014Amounts in SEK millionOperating activities:Profit before tax 102,3 28,7 198,3 91,7Reversal of depreciation 12,8 12,6 51,9 48,6Tax paid -16,3 11,4 -39,3 -32,3Adjustments for other items not affecting cash flow -48,8 49,8 78,0 189,0
50,0 102,4 288,9 297,0
Change in working capital:Change in inventory 48,6 34,6 -22,2 -25,1Change in operating receivables -3,7 2,9 -14,9 -39,8Change in operating liabilities 23,5 -7,3 -12,0 77,4Cash flow from working capital 68,4 30,3 -49,1 12,6
Cash flow from operating activities 118,4 132,7 239,8 309,5
Investing activities:Acquisition of group companies 0,0 0,0 0,0 -58,6Investment in intangible fixed assets -0,2 -0,2 -0,3 -0,8Investment in tangible fixed assets -17,4 -24,6 -42,8 -66,0Sales/disposal of tangible fixed assets 6,8 3,9 14,3 7,5Changes in financial fixed assets 0,1 -3,3 0,0 -3,3Cash flow from investing activities -10,7 -24,3 -28,8 -121,2
Financing activities:Dividend 0,0 0,0 0,0 0,0New loans and amortization 12,2 -31,0 -134,6 -18,2Cash flow from financing activities 12,2 -31,0 -134,6 -18,2
Cash flow for the period 119,9 77,5 76,4 170,1Cash & cash equivalents at beginning of period 340,1 305,9 384,7 189,9Exchange gains/losses -10,0 1,3 -11,1 24,6Cash & cash equivalents at end of period 450,0 384,7 450,0 384,7
Q4 Jan-Dec
Cash flow in operating actvities beforechange in working capital

ALIMAK YEAR-END REPORT JANUARY – DECEMBER 2015 16
KEY FIGURES2015 2014
Q4 Q3 Q2 Q1 Q4 Q3 Q2 Q1 Jan-Dec Jan-Dec
Order intake, MSEK 425,6 484,6 663,0 535,8 446,8 417,6 489,4 435,9 2 109,1 1 789,7Revenues, MSEK 587,5 434,4 552,1 462,3 518,0 427,1 454,1 343,3 2 036,3 1 742,5
Operating profit (EBIT) before items affectingcomparability, MSEK 104,4 66,0 103,8 76,0 109,0 72,1 84,4 51,3 350,3 316,9
Operating margin (EBIT) before items affectingcomparability, % 17,8% 15,2% 18,8% 16,4% 21,0% 16,9% 18,6% 14,9% 17,2% 18,2%
Operating profit (EBIT), MSEK 104,4 66,0 53,7 72,0 85,4 67,5 84,0 50,7 296,2 287,7Operating margin (EBIT), % 17,8% 15,2% 9,7% 15,6% 16,5% 15,8% 18,5% 14,8% 14,5% 16,5%Profit for the period, MSEK 72,0 36,2 22,0 4,7 14,5 4,7 19,5 7,8 135,0 46,5Total comprehensive income, MSEK 111,1 48,6 17,7 50,0 124,7 22,3 31,3 12,3 227,5 190,7
Cash flow from operating activities, MSEK 118,4 66,6 41,9 12,9 132,7 138,7 -29,4 67,5 240,5 309,5
Total cash flow, MSEK 119,9 -50,2 27,7 -21,0 77,5 133,7 -68,7 27,8 76,8 170,2
Undiluted/diluted number of shares, thousand's 43 326 43 326 43 326 1 000 1 000 1 000 1 000 1 000 43 326 1 000
Average amount of undiluted/diluted number of shares, thousand's 43 326 43 326 20 523 1 000 1 000 1 000 1 000 1 000 27 204 1 000
Undiluted/diluted earnings per share, SEK 1,66 0,84 0,51 4,73 14,47 4,68 19,54 7,81 3,12 46,50Undiluted/diluted earnings per share, SEK¹ 1,66 0,84 0,51 0,11 0,33 0,11 0,45 0,18 3,12 1,07Total cash flow per share, SEK¹ 2,77 -1,16 0,64 -0,48 1,79 3,08 -1,58 0,64 1,77 3,93Undiluted/diluted equity per share, SEK¹ 47,36 44,79 43,67 21,10 19,95 17,07 16,55 15,83 47,36 19,95
Total assets, MSEK 3 364,5 3 318,1 3 384,4 3 372,9 3 254,0 3 115,5 2 913,8 2 767,5 3 364,5 3 254,0Cash and cash equivalents end of period, MSEK 450,0 340,1 394,6 376,5 384,7 227,2 153,1 214,4 450,0 384,7Equity, MSEK 2 052,1 1 940,8 1 892,3 914,2 864,2 739,4 717,1 685,8 2 052,1 864,2Capital employed, MSEK 2 423,2 2 431,5 2 424,5 2 432,1 2 339,0 2 298,3 2 354,6 2 166,4 2 423,2 2 339,0Net debt, MSEK 371,1 490,7 532,3 576,9 556,0 661,8 761,5 625,2 371,1 556,0
Equity ratio, % 61,0% 58,5% 55,9% 27,1% 26,6% 23,7% 24,6% 24,8% 61,0% 26,6%Return on equity, % 9,3% 5,8% 3,5% 5,4% 6,0% 7,9% 8,3% 9,5% 9,3% 6,0%
Return on capital employed goodwill excluded, % 44,2% 39,1% 39,1% 46,5% 44,5% 41,5% 39,0% 40,3% 44,2% 44,5%
Return on capital employed, % 12,4% 11,7% 11,7% 13,4% 12,6% 12,5% 11,8% 11,5% 12,4% 12,6%Interest coverage ratio, times 7,1 3,3 3,4 1,1 1,4 1,2 1,7 1,4 2,5 1,4Net debt/EBITDA ratio 1,1 1,5 1,6 1,6 1,7 2,0 2,4 2,1 1,1 1,7Average number of employees 1 077 1 048 1 088 1 083 1 061 1 107 1 007 934 1 077 1 061¹Calculated to existing number of shares, 43326289,0
2015 2014

ALIMAK YEAR-END REPORT JANUARY – DECEMBER 2015 17
HISTORICAL QUARTERLY DATA 2013 - 2015
Amounts in SEK million Q4 Q3 Q2 Q1 Q4 Q3 Q2 Q1 Q4 Q3 Q2 Q1Order IntakeConstruction Equipment 134 134 119 161 116 108 151 81 79 61 71 42Industrial Equipment 84 84 277 87 122 90 105 148 139 124 110 139Rental 50 108 92 80 61 77 86 75 56 60 83 78After Sales 159 159 175 209 148 143 147 131 127 112 142 138Total 426 485 663 536 447 418 489 435 401 357 406 397
RevenuesConstruction Equipment 156 91 179 127 97 73 114 48 62 50 61 69Industrial Equipment 168 102 116 99 177 123 134 112 166 93 117 120Rental 86 74 78 71 75 77 68 58 65 72 73 75After Sales 177 167 179 165 169 154 138 125 135 125 125 109Total 588 434 552 462 518 427 454 343 428 340 376 373
Operating Profit (EBIT), reportedConstruction Equipment 20 4 5 9 -3 -5 9 -11 -9 -8 -5 0Industrial Equipment 16 7 -1 5 37 17 25 17 43 11 20 26Rental 12 6 0 3 -4 5 0 1 1 7 5 7After Sales 57 49 49 55 55 51 50 44 47 45 43 35Total 104 66 54 72 85 68 84 51 82 55 63 68
Operating profit (EBIT), before items affecting comparabilityConstruction Equipment 20 4 24 12 2 -5 9 -11 -6 -8 -5 0Industrial Equipment 16 7 13 6 42 19 25 17 43 11 20 26Rental 12 6 6 3 5 5 0 1 3 7 5 7After Sales 57 49 61 55 60 53 50 44 50 45 43 35Total 104 66 104 76 109 72 84 51 90 55 63 68
2014 20132015
ALIMAK YEAR-END REPORT JANUARY – DECEMBER 2015 18
INCOME STATEMENT, PARENT COMPANY
2015 2014 2015 2014Amounts in SEK millionNet sales 7,5 - 7,5 -
Operating expenses -8,9 - -23,0 0,0Operating profit/loss -1,4 0,0 -15,5 0,0
Net financial items -2,0 -21,6 -45,7 -83,5Profit/loss after financial items -3,4 -21,6 -61,2 -83,5
Group contribution 145,0 160,0 145,0 160,0Result before tax (EBT) 141,6 138,4 83,8 76,5
Tax on profit/loss for the period -31,2 -30,4 -18,4 -16,8
Profit/loss for the period 110,4 107,9 65,4 59,6
Q4 Jan-Dec
BALANCE SHEET, PARENT COMPANY31 Dec 2015 Dec 31 2014
Amounts in SEK millionNon-current assetsShares in group companies 1 898,4 1 738,4Other financial non-current assets 31,8 49,2Total non-current assets 1 930,2 1 787,6
Current assetsReceivables from group companies 728,2 290,1Cash and cash equivalents 128,6 1,1Total current assets 856,9 291,3
TOTAL ASSETS 2 787,0 2 078,9
EQUITY AND LIABILITIESShareholders equity 2 185,8 1 160,1Non-current liabilities 227,4 918,8Liabilities to group companies 368,1 -Current liabilities 5,7 -
TOTAL EQUITY AND LIABILITIES 2 787,0 2 078,9
ALIMAK YEAR-END REPORT JANUARY – DECEMBER 2015 19
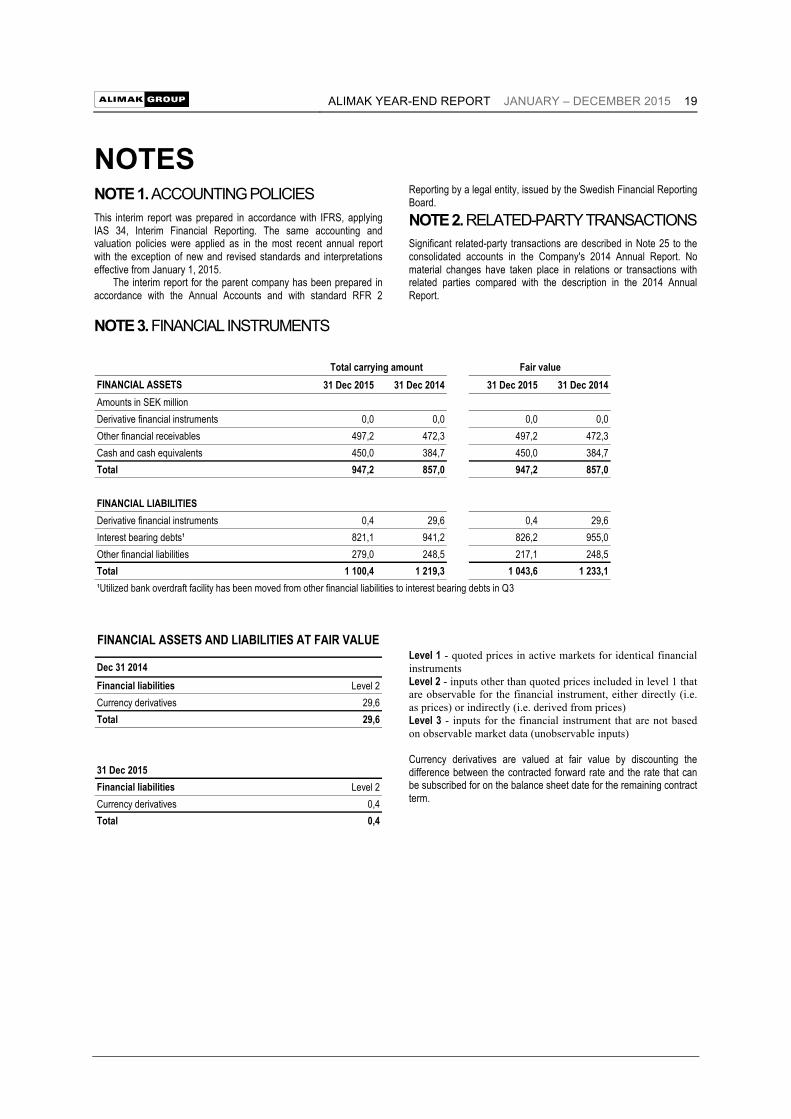
NOTES NOTE 1. ACCOUNTING POLICIES This interim report was prepared in accordance with IFRS, applying IAS 34, Interim Financial Reporting. The same accounting and valuation policies were applied as in the most recent annual report with the exception of new and revised standards and interpretations effective from January 1, 2015. The interim report for the parent company has been prepared in accordance with the Annual Accounts and with standard RFR 2
Reporting by a legal entity, issued by the Swedish Financial Reporting Board. NOTE 2. RELATED-PARTY TRANSACTIONS Significant related-party transactions are described in Note 25 to the consolidated accounts in the Company's 2014 Annual Report. No material changes have taken place in relations or transactions with related parties compared with the description in the 2014 Annual Report.
NOTE 3. FINANCIAL INSTRUMENTS
Level 1 - quoted prices in active markets for identical financial instruments Level 2 - inputs other than quoted prices included in level 1 that are observable for the financial instrument, either directly (i.e. as prices) or indirectly (i.e. derived from prices) Level 3 - inputs for the financial instrument that are not based on observable market data (unobservable inputs) Currency derivatives are valued at fair value by discounting the difference between the contracted forward rate and the rate that can be subscribed for on the balance sheet date for the remaining contract term.
FINANCIAL ASSETS 31 Dec 2015 31 Dec 2014 31 Dec 2015 31 Dec 2014Amounts in SEK millionDerivative financial instruments 0,0 0,0 0,0 0,0Other financial receivables 497,2 472,3 497,2 472,3Cash and cash equivalents 450,0 384,7 450,0 384,7Total 947,2 857,0 947,2 857,0
FINANCIAL LIABILITIESDerivative financial instruments 0,4 29,6 0,4 29,6Interest bearing debts¹ 821,1 941,2 826,2 955,0Other financial liabilities 279,0 248,5 217,1 248,5Total 1 100,4 1 219,3 1 043,6 1 233,1¹Utilized bank overdraft facility has been moved from other financial liabilities to interest bearing debts in Q3
Total carrying amount Fair value
Dec 31 2014Financial liabilities Level 2Currency derivatives 29,6Total 29,6
31 Dec 2015Financial liabilities Level 2Currency derivatives 0,4Total 0,4
FINANCIAL ASSETS AND LIABILITIES AT FAIR VALUE
ALIMAK YEAR-END REPORT JANUARY – DECEMBER 2015 20
DEFINITIONS Order intake All orders for which contracts have been signed during the accounting period and which have been confirmed. Canceled orders affect order intake if booked and canceled in the same year. Operating profit (EBIT) Profit before financial items and tax. Net debt The net amount of interest bearing liabilities (shareholders' loans excluded) and assets as well as cash and cash equivalents. Operating margin (EBIT), % Operating profit (EBIT) as a percentage of revenues during the period Net debt/EBITDA ratio Average net debt in relation to operating profit before depreciation and amortization (EBITDA), rolling twelve month value. Undiluted average number of shares Weighted average number of shares outstanding during the period.
Net debt/equity ratio Net debt in relation to shareholders' equity. Diluted average number of shares Weighted average number of shares outstanding during the period as well as potential additional shares. Return on equity Profit after tax for the period, rolling twelve month value, as a percentage of the average shareholders' equity excluding shares without controlling interests. Undiluted/diluted earnings per share After tax result in relation to the undiluted and diluted average number of shares.
Return on capital employed Operating profit (EBIT), rolling twelve month value, as a percentage of the average capital employed. Capital employed means net debt plus shareholders' equity plus shareholders' loans. Undiluted/diluted equity per share Shareholders' equity in relation to the outstanding undiluted number of shares at the end of the period. Interest coverage ratio Profit after financial items plus financial expenses in relation to financial expenses. Equity ratio Shareholders' equity as a percentage of total assets.
ALIMAK GROUP IN BRIEF
Alimak is a world-leading supplier of elevators, platforms and after-market serves for the industrial and construction sectors. The Group has manufacturing operations in Sweden and China and a sales and servicing network in more than 60 countries supplying and maintaining vertical access solutions. At present there are close to 22,000 elevators and platforms installed around the world. Alimak was established in Skellefteå in 1948 and has 1,100 employees around the world. The Group is listed on Nasdaq Stockholm. Read more at: www.alimakgroup.com


![57213385 Chimeneas Alimak[1]](https://img.dokumen.tips/doc/110x75/55cf972d550346d033901bc8/57213385-chimeneas-alimak1.jpg)