Embed Size (px)
Citation preview
SOFTWARE ARTICLE Open Access
AlignMiner: a Web-based tool for detection ofdivergent regions in multiple sequencealignments of conserved sequencesDarío Guerrero1, Rocío Bautista1, David P Villalobos2, Francisco R Cantón2, M Gonzalo Claros1,2*
Abstract
Background: Multiple sequence alignments are used to study gene or protein function, phylogenetic relations,genome evolution hypotheses and even gene polymorphisms. Virtually without exception, all available tools focuson conserved segments or residues. Small divergent regions, however, are biologically important for specificquantitative polymerase chain reaction, genotyping, molecular markers and preparation of specific antibodies, andyet have received little attention. As a consequence, they must be selected empirically by the researcher.AlignMiner has been developed to fill this gap in bioinformatic analyses.
Results: AlignMiner is a Web-based application for detection of conserved and divergent regions in alignments ofconserved sequences, focusing particularly on divergence. It accepts alignments (protein or nucleic acid) obtainedusing any of a variety of algorithms, which does not appear to have a significant impact on the final results.AlignMiner uses different scoring methods for assessing conserved/divergent regions, Entropy being the methodthat provides the highest number of regions with the greatest length, and Weighted being the most restrictive.Conserved/divergent regions can be generated either with respect to the consensus sequence or to one mastersequence. The resulting data are presented in a graphical interface developed in AJAX, which provides remarkableuser interaction capabilities. Users do not need to wait until execution is complete and can.even inspect theirresults on a different computer. Data can be downloaded onto a user disk, in standard formats. In silico andexperimental proof-of-concept cases have shown that AlignMiner can be successfully used to designing specificpolymerase chain reaction primers as well as potential epitopes for antibodies. Primer design is assisted by amodule that deploys several oligonucleotide parameters for designing primers “on the fly”.
Conclusions: AlignMiner can be used to reliably detect divergent regions via several scoring methods that providedifferent levels of selectivity. Its predictions have been verified by experimental means. Hence, it is expected that itsusage will save researchers’ time and ensure an objective selection of the best-possible divergent region whenclosely related sequences are analysed. AlignMiner is freely available at http://www.scbi.uma.es/alignminer.
BackgroundSince the early days of bioinformatics, the elucidation ofsimilarities between sequences has been an attainablegoal to bioinformaticians and other scientists. In fact,multiple sequence alignments (MSAs) stand at a cross-road between computation and biology and, as a result,long-standing programs for DNA or protein MSAs arenowadays widely used, offering high quality MSAs. Inrecent years, by means of similarities between sequences
and due to the rapid accumulation of gene and genomesequences, it has been possible to predict the functionand role of a number of genes, discern protein structureand function [1], perform new phylogenetic tree recon-struction, conduct genome evolution studies [2], anddesign primers. Several scores for quantification of resi-due conservation and even detection of non-strictly-con-served residues have been developed that depend on thecomposition of the surrounding residue sequence [3],and new sequence aligners are able to integrate highlyheterogeneous information and a very large number ofsequences. Without exception, the sequence similarity of
* Correspondence: [email protected] Andaluza de Bioinformática (Universidad de Málaga), SeveroOchoa, 34, 29590 Málaga, Spain
Guerrero et al. Algorithms for Molecular Biology 2010, 5:24http://www.almob.org/content/5/1/24
© 2010 Guerrero et al; licensee BioMed Central Ltd. This is an Open Access article distributed under the terms of the CreativeCommons Attribution License (http://creativecommons.org/licenses/by/2.0), which permits unrestricted use, distribution, andreproduction in any medium, provided the original work is properly cited.
MSAs is optimised [4]. Some databases such as Ensembland PhIGs can provide information on conservedregions across different species.In contrast, meanwhile, detection of divergent regions
in alignments has not received the necessary attention,with the inevitable consequence of a lack of appropriatetools to address this subject. Divergent regions are infact as biologically interesting as similar regions, sincethey are useful in the following aspects: (i) high-throughput expression profiling using quantitative PCR(qPCR), which is considered to distinguish between clo-sely-related genes [5]; (ii) confirmation of expressionresults obtained by microarray technology, as well asquantification of low-abundance transcripts; (iii) taxon-omy and varietal differentiation is based on small differ-ences between organisms: it enables appropriatecategorisation. Since the genetic material of individualsfrom the same species is very similar, it is necessary todetect specific differences to distinguish between them[6]; (iv) SNP (single nucleotide polymorphism) and dis-eases: most differences between healthy and unhealthyorganisms are based on single-nucleotide differences [7];(v) identification of pathological and autopsy specimensin forensic medicine is based on minimal sequence dif-ferences among samples [8]; (vi) primer design for PCR-based molecular markers relies on differences amongDNA sequences [9]; (vii) one way of preparing highly-specific monoclonal antibodies is by immunisation withhighly-divergent peptides, instead of with the whole pro-tein [10].Analysis of gene and genomic variation has been revo-
lutionised by the advent of next-generation sequencingtechnology, revealing a considerable degree of genomicpolymorphism. This has led to studies focusing on SNPdiscovery and genotyping [7,11-18], as well as the designof properly conserved primer candidates from MSAs[19,20], for comparative studies of genes and genomes[21]. Most of these tools are operating system-depen-dent and only a few are Web-based, in which case theyhave a relatively static interface. However, there isneither adequate software for, nor study on, MSAs fordetection of polymorphic regions and discrepancies(beyond single nucleotide dissimilarities) that wouldprovide a numerical score related to divergence signifi-cance. In short, researchers find themselves empiricallydetecting which sequence fragment, among a series ofparalogs and/or orthologs, can be used to design specificprimers for PCR, or which specific probes or specificlinear epitopes can be synthesised in order to obtainantibodies. Together, these factors have been the mainmotivation for development of AlignMiner: this softwarewas intended to cover the gap in bioinformatic functionby evaluating divergence, rather than similarity, in align-ments that involve closely-related sequences. For any
type of DNA/protein alignment, through its Web inter-face AlignMiner is able to identify putative SNPs, diver-gent regions, and conserved segments. The results canbe inspected graphically via an innovative, interactivegraphical interface developed in AJAX, or saved in anyof several formats.
ImplementationArchitectureAlignMiner is a free Web-based application that hasbeen developed in three layers, each making use ofobject-oriented methodologies. The first layer containsthe algorithm core. It is written entirely in Perl and usesBioperl [22] libraries for MSA loading and manipulation.Hence, it can run in any operating system provided thatPerl 5.8, BioPerl 1.5.2, and the Perl modules Log::Log4-perl, JSON and Math:FFT are installed. BioPerl has beenchosen because it provides a rich set of functions andan abstraction layer that handles nearly all MSA formatscurrently available. The second layer links the algorithmwith the interface using the necessary CGIs written inPerl. The third (top) is a front-end layer based on AJAX[23] techniques to offer an interactive, quick andfriendly interface. Intermediate data and final results aresaved using JSON [24], a data format that competeswith XML for highly human-readable syntax, and forefficiency in the storage and parsing phases. Firefox orSafari Web browsers are recommended, since InternetExplorer does not support some of the advanced fea-tures of AJAX. AlignMiner has been tested for correctoperation in a few flavours of Linux and various MacOS X machines, to verify full compatibility.Owing to its layered architecture, AlignMiner can
function in four execution modes: (i) as a command linefor advanced users to retain all Unix capabilities of inte-gration, within any automation process or pipeline; (ii)as a REST Web service, also for advanced users, whichenables its integration in workflows; (iii) as a singleworkstation where jobs are executed on the same com-puter that has the Web interface – this setting is notrecommended since it is prone to saturation when mul-tiple jobs are sent simultaneously; (iv) as an advancedWeb application (this is the preferred mode), where jobsare transferred to a queue system which schedules theexecution depending on the resource availability – thisminimises the risk of saturation while maintaining inter-activity. Data management remains hidden to users.
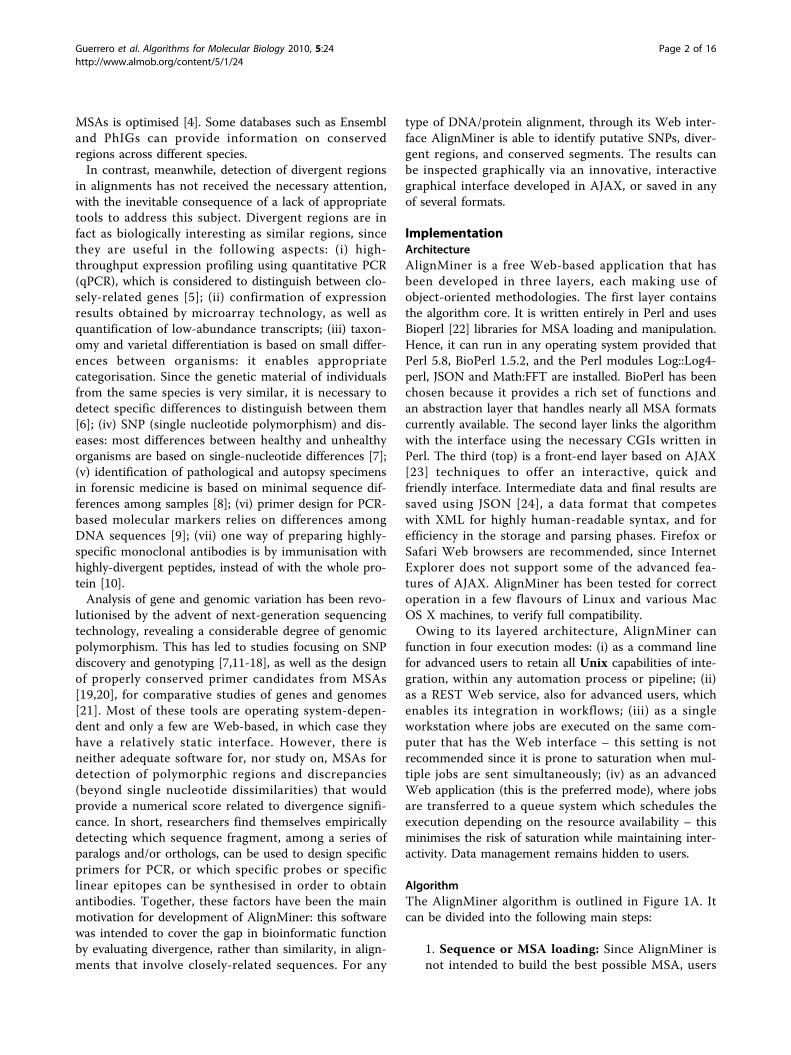
AlgorithmThe AlignMiner algorithm is outlined in Figure 1A. Itcan be divided into the following main steps:
1. Sequence or MSA loading: Since AlignMiner isnot intended to build the best possible MSA, users
Guerrero et al. Algorithms for Molecular Biology 2010, 5:24http://www.almob.org/content/5/1/24
Page 2 of 16
are expected to load already-built MSAs obtainedusing external programs such as M-Coffee [25,26] orMultAlin [27] (for a review of MSA tools, see [4]).However, AlignMiner is also able to align a set ofsequences in FASTA, MSF, CLIJSTALW and otherformats using the fast, accurate and memory-effi-cient Kalign2 [28]. The alignment file is loaded intothe Bioperl SeqIO abstraction object, which enablesAlignMiner to read nearly all MSA formats. The for-mat is not inferred from the file extension but bysearching the file contents for format-specific pat-terns. Users are alerted if there are faulty, corruptedor unknown file formats.2. Format unification: For efficient data manage-ment, all MSA formats are encapsulated into a com-mon JSON representation and saved to disk to makethem accessible to other AlignMiner modules.3. Data pre-processing: The alignment is examinedto extract basic characteristics that are used in inter-nal decisions, such as the number of sequences,MSA length, type of aligned sequences (DNA/pro-tein), and MSA format, and an identifier is assignedto each sequence. These characteristics are also dis-played in the ‘Job List’ tab in order to provide someinformation regarding the MSA content. Finally,
AlignMiner automatically analyses the MSA todetermine the region where the algorithm is goingto be applicable: there is usually a high proportionof gaps at each MSA end that would lead to mis-leading results for frequencies (see below), due tothe small number of sequences and the low align-ment reliability at these positions [1]. The MSAends are then sliced until at least two contiguouspositions do not include any gap. Slicing limits canalso be set manually if desired.4. Consensus call: A consensus sequence is assessedfrom the whole MSA using BioPerl capabilities toserve as the weighting reference for calculations.When a user defines one sequence within the MSAas the master sequence, scoring calculations (seebelow) will now be referred to it instead of to theconsensus.5. Frequency table: Since the scores implemented inAlignMiner require knowledge of the number ofnucleotides or amino acids present at each positionof the MSA, these frequencies are stored in tempor-ary tables as a simple caching mechanism to speed upthe algorithm performance, in order to spend nearlythe same time with a few aligned sequences as with alarge number of aligned sequences (see below).
start
MSA loading
Data pre-processing
End
Format unification
Consensus call
Frequency table generation
Scoring method 1 Scoring method n...
Scoring method
Cutoffs
Trimming
FFT
Cutoffs
Trimming
Regions
Score
mad (median)
mad = 0 mad (mean)
cutoff = median ± deviation
deviation = mad * 1.4826
YES
NO
A B C
Figure 1 The AlignMiner algorithm. (A) Flow diagram of the main components of the algorithm, as explained in the text; the bold boxes aredetalied in B. (B) The details of how a divergent region is obtained using a given scoring method. The “score calculation” renders a singlenumeric value for each MSA column. “FFT” is a fast Fourier transform for smoothing the curve of raw scores. The original (left branch) andFourier-transformed (right branch) curves are trimmed with their respective “cutoffs” in order to obtain putative SNPs and conserved/divergentregions, respectively. The bold dashed boxes are detailed in C. (C) Details of the determination of the final cutoffs used for trimming scores andproviding the validated conserved/divergent regions.
Guerrero et al. Algorithms for Molecular Biology 2010, 5:24http://www.almob.org/content/5/1/24
Page 3 of 16
6. Scoring: Several scoring methods (see next sec-tion for details) are included in AlignMiner in orderto enhance different aspects of each MSA. This isthe slowest portion of the algorithm since each scor-ing method has to read and process the completeMSA (further optimisation, including parallelisation,will be addressed to this step in the near future).Each scoring method provides a single value foreach alignment column that enables the evaluationof conservation (positive value) or divergence (nega-tive value) at every column of the MSA (Figure 1B).Concerning gaps, there is neither consensus inter-pretation nor an adequate model for handling gapsin alignments. Therefore, in this work, the presenceof a gap in a column is considered as the lowestconservative substitution. By default, it is expectedthat sequence divergence is spread over thesequence (as was previously with the case with pro-tein MSAs), such that scores produce clear maxi-mum and minimum peaks reflecting conserved anddivergent positions, respectively. In order to extractthe significant peaks, a robust and consistent mea-sure is calculated based on the median value of thescore and two cutoffs (Figure 1C). Cutoffs rely on1.4826 times the median absolute deviation (MAD =median[abs(X – median[X])]) such that they define amargin equivalent to one standard deviation fromthe median. When sequences in the MSA are closelyrelated (note that DNA sequences are to be closelyrelated), the median is 0, and the MAD is also 0 orvery close to 0. In such a case, a reliable cutoff wasestablished using a MAD-like measure based on themean (instead of the median) to avoid the overpopu-lation of zero-valued positions, such as MAD_mean= mean[abs(X - mean[X])]. This cutoff will onlyreveal divergent regions of the MSA.7. Regions: Nucleotides whose score is below thelow cutoff boundary are reported as a putative SNPprovided that each variation appears in at least twosequences (as a consequence, alignments of less thanfour sequences would lack the capacity for SNP pre-diction). It should be taken into account that neithersynonymy nor the potential effects on protein struc-ture are checked for these putative SNPs, sinceAlignMiner is not designed to predict the signifi-cance of SNPs. Obviously, such a calculation is notperformed with protein MSAs. Raw scores aresmoothed by a fast Fourier transform ("FFT” in Fig-ure 1B) such that contiguous sharp peaks becomewide ranges in order to assess changes in regions,rather than nucleotides. The algorithm reports thosepositions of the raw and FFT-transformed valuesthat have a score higher (conserved) or lower (diver-gent) than the corresponding cutoffs for conserved/
divergent regions. In the case of DNA alignments,divergent regions must additionally include at leasttwo putative SNPs. The arithmetic mean of thescore of every nucleotide/amino acid encompassedby that region gives the characteristic score for theregion.
Scoring methodsAll scoring methods described below are included in thecommon base algorithm depicted in Figure 1, since theyare all based on the information contained in each col-umn of MSAs. The only differences between the scoringmethods are in the weight table and formula for each.All scores are calculated specifically for each type ofsequence (DNA/protein) and for the particular MSAbeing processed, so it is up to users to decide which onebest applies in their situation. Common parameters forall scoring methods are:
• g(i, b) ® Count of nucleotide instances b at posi-tion i of the MSA.• C(i) ® Nucleotide at position i in the consensus ormaster sequence.• M(b1, b2) ® Weighting for nucleotide b2 when itscorresponding C(i) is b1.• D(i) ® Number of different nucleotides found atposition i of the MSA.• B ® Set of nucleotides found in the MSA.• nseq ® Number of sequences in the MSA.
It should be taken into account that each of the fol-lowing scoring methods will provide a different scorerange. However, all of them are intended to producepositive values for conserved regions and negative valuesfor divergent regions, and are not zero-centred in anycase.Weighted The Weighted score is applicable to anysequence type. For each position iof the alignment, it iscalculated as:
Weighted i
b i M C i bb B
nseq( )
( ( , )* ( ( ), ))
= !"
(1)
A weight matrix [29,30] is used for promoting identi-ties over similarities, and penalising (giving a negativevalue) to the differences depending on the degree ofdivergence. Accordingly, the result is not zero-centredunless aligned sequences were quite different. It is notexpected that changing the weight matrix would pro-duce significant differences. Matrices for DNA align-ments are taken from WU-Blast (Warren R. Gish,unpublished): “Identity” is given for sequences with onlythe four usual nucleotides (ACTG), and “Simple” forsequences including undefined nucleotides (RYMWSK).
Guerrero et al. Algorithms for Molecular Biology 2010, 5:24http://www.almob.org/content/5/1/24
Page 4 of 16

Protein alignments are weighted using “Blosum62”[31,32].DNAW DNAW applies only to DNA sequences contain-ing A, C, T and G, since it is a simplification of theWeighted score when weights are 1 for identity and 0for difference. Hence, for each position i of the align-ment,
DNAW iC i i nseq
nseq( )
* ( ( ), )= #2(2)
As a result, and like Weighted, a lower value isobtained when the difference found between sequencesis higher. Again, it is not zero-centred.Entropy A parameter frequently used for quantifyingthe composition of an individual column i is its entropyH(i), since it is an ideal representation of disorder atevery MSA position and can be very usefully employedto assess differences in a MSA. H(i) is defined as follows(using frequencies instead of probabilities):
H ib i
nseqb i
nseqb B
( )( , )
* log( , )= #
$
%&
'
()
*
+,,
-
.//!
" 2 (3)
However, for consistency with the rest of the scoringresults (where divergent regions are represented withlower values than conserved ones), Entropy scoring issign-switched, such that Entropy = –H(i).Variability Variability represents another way to evalu-ate changes in an alignment position without taking intoaccount whether variations are conservative or not. Therationale is that any position change is valid for markinga difference between sequences. Negative values indicategreater variability. It is defined by the equation:
Variability i D i nseqC i i
( ) ( )*( ( ), )
= # (4)
Primer design moduleOne of the most useful applications derived from retrie-val of divergent regions is the design of PCR primers“on the fly”. A window containing the divergent regionplus five nucleotides on each side defines a primer bydefault. Parameters for the displayed nucleotide windoware calculated as in [33], that is: length, GC content,melting temperature, absence of repeats and absence ofsecondary structures. An optimal primer sequenceshould contain: (i) two to three G’s or C’s for 3’-end sta-bility; (ii) a GC content of between 40% and 60%; (iii) amelting temperature above 52°C; and (iv) the absence ofsecondary structure formation, that is, the maximumfree energy must be above -4 kcal/mol for dimer forma-tion or -3 kcal/mol for hairpin formation. Every
parameter is printed over a colour that suggests thevalue compliance: green indicates that the primer is inagreement with the above requirements, and orange, redor blue that the sequence should be optimised. Userscan move the window size in order to obtain optimalparameters so that the optimal primers are expected tohave “green” properties (Additional file 1 Figure S1).The primers so designed can be tested in silica bymeans of the “PCR amplification” Web tool [34] atBioPHP [35] against every sequence of the alignment. Itshould be noted that primers designed with AlignMinerare intended to identify a specific sequence; therefore,degenerate primer design is disabled.UsageThe AlignMiner Web interface was designed for maxi-mum simplicity and convenience of use. Users must logon with their e-mail to obtain a confidential spacewithin the public environment (no registration isneeded). Their data are stored there for at least fourweeks, although old jobs may be deleted by the adminis-trator for space limitation reasons; in fact, users arerecommended to locally save their analysis. A new jobstarts when a file containing one MSA (most popularformats are accepted such as Clustal, NEXUS, MSF,PHYLIP, FASTA...), or a set of sequences to be alignedwith Kalign2, is uploaded and a name is optionallygiven. A small amount of basic information (sequencecount, length, file type, etc) about every job is shown tothe user in order to verify that it has been correctly pre-processed. Users can then decide to mark a specificsequence as master. In such a case, the algorithm isdirected to look for the most divergent/conservedregions with respect to the master instead of the con-sensus sequence. This option enables identification ofoverall divergences (by default) or regions that serve toclearly differentiate the master sequence from the othersequences. Finally, users can either decide themselveswhich portion of the alignment will be analysed, orallow AlignMiner to decide.At this moment, the job is already shown in the Job
List with a “waiting” status. Once the “Run” button ispushed, the batch system takes control, and the status(pending, queued, running or completed) is displayed inreal time. Afterwards, users can decide to (1) wait untilthe most recent job is finished, (2) browse previously-completed jobs, (3) launch new jobs, or (4) close theWeb browser and return later (even on a different com-puter) to perform any of the first three operations. Jobdeletion is always enabled.By clicking on each job, users can select a scoring
method for analysis of their MSA. Changing the scoringmethod is always comparatively fast, since calculationshave already been performed. Results are shown in adynamic display that enables clicking, scrolling,
Guerrero et al. Algorithms for Molecular Biology 2010, 5:24http://www.almob.org/content/5/1/24
Page 5 of 16
dragging, zooming, and even “snapshooting” a portion ofthe graphical plot. The plot can be saved on the user’scomputer in PNG format; a record of snapshots is addi-tionally maintained on the screen. Results are alsorepresented in a tabular form linked to the graphicalplot: each table row is linked to its corresponding regionin the plot, and vice-versa. Tables can be ordered byposition or score values, and exported to GFF (generalfeatures format) for external processing.AlignMiner can also be used as a Web service. The
REST protocol has been used due to is wide interoper-ability and because it only needs an HTTP stack (eitheron the client or the server) that almost every platformand device has today. The Web service of AlignMinercan be invoked to send, list, delete, or download jobs.Job results can be downloaded as a whole, or file by file.URL, http verb and optional fields are indicated inAdditional file 2 Table S1. The api_login_key fieldis compulsory for any REST invocation of AlignMinersince it serves to allocate the corresponding disk space.An example of submitting a new job using the curl cli-ent is:curl -X POST
-F http://[email protected]
-F alignment_file_field=@/tmp/tests/sequences.fna
-F job_name_field=MyAMtest-F master_field=NONE-F align_start_field = 0-F align_end_field = 0
http://www.scbi.uma.es/ingebiol/com-mands/am/jobs/0/stage/1.jsonObtaining a job status by means of a browser is per-
formed by:http://www.scbi.uma.es/ingebiol/com-
mands/am/jobs/[email protected]
Polymerase chain reactionEach PCR was performed on a T1 Thermocycler (Bio-metra). The PCR reaction mixture for a 100 !l volumecontained 75.5 !l of distilled water, 10 !l 10 ! PCR buf-fer, 2 !l dNTP mix (12.5 mM each), 2 !l of each primer(20 !M), 0.5 !l Taq polymerase (5 U/!l), and 5 !l oftemplate DNA. The PCR commenced with 5 min ofdenaturation at 94°C and continued through 35 cyclesconsisting of the following steps: 94°C for 1 min, 4°Cover the lowest melting temperature (Tm) of the corre-sponding primer pair for 1 min, and 72°C for 2 min.Cycles were followed by a final extension step at 72°Cfor 8 min. When the template was cDNA or plasmidDNA, the 5 !l of template contained 20 ng of DNA,whereas it contained 1 !g when template was genomic
DNA. The amplification products were analysed using1.5% (w/v) agarose gel electrophoresis.
Results and DiscussionThe vast amount of data involved in MSAs makes itimpossible to manually identify the significantly diver-gent regions. In order to assess the speed, success rateand experimental usefulness of AlignMiner with differ-ent real and hypothetical MSAs, two algorithms forMSA were used: one is M-Coffee [25] which generateshigh-quality MSAs by combining several alternativealignment methods into one single MSA, and the otheris MultAlin [27] which is based on a hierarchical clus-tering algorithm using progressive pairwise alignments.
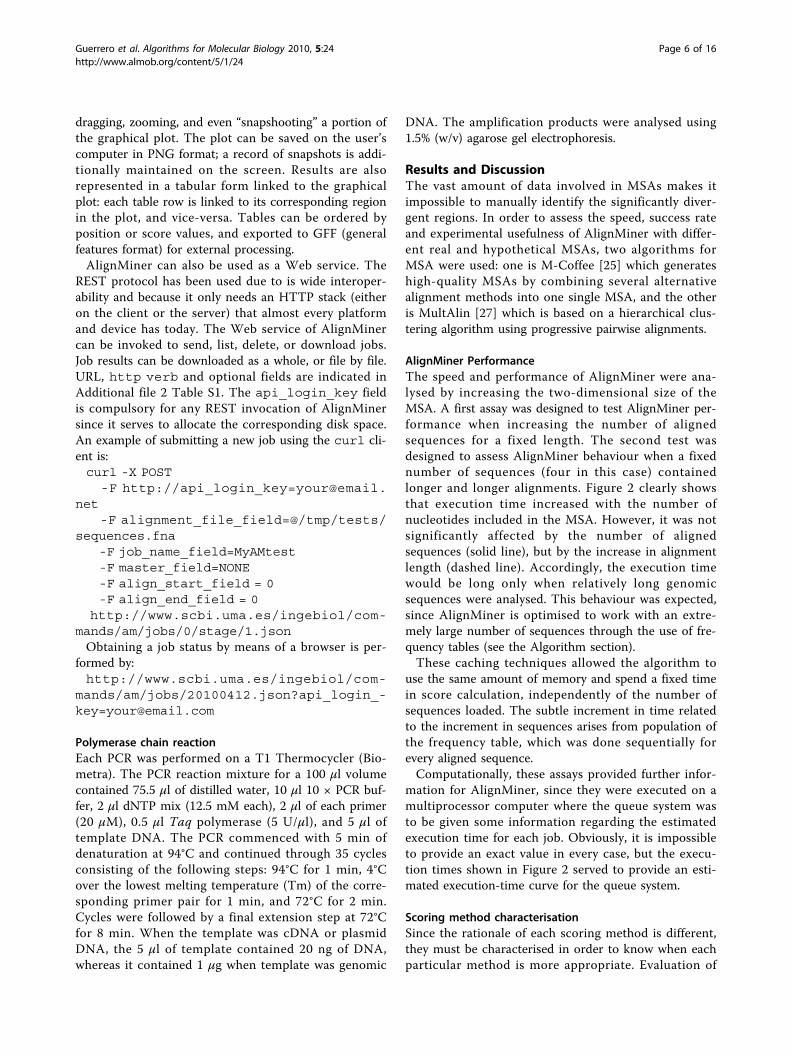
AlignMiner PerformanceThe speed and performance of AlignMiner were ana-lysed by increasing the two-dimensional size of theMSA. A first assay was designed to test AlignMiner per-formance when increasing the number of alignedsequences for a fixed length. The second test wasdesigned to assess AlignMiner behaviour when a fixednumber of sequences (four in this case) containedlonger and longer alignments. Figure 2 clearly showsthat execution time increased with the number ofnucleotides included in the MSA. However, it was notsignificantly affected by the number of alignedsequences (solid line), but by the increase in alignmentlength (dashed line). Accordingly, the execution timewould be long only when relatively long genomicsequences were analysed. This behaviour was expected,since AlignMiner is optimised to work with an extre-mely large number of sequences through the use of fre-quency tables (see the Algorithm section).These caching techniques allowed the algorithm to
use the same amount of memory and spend a fixed timein score calculation, independently of the number ofsequences loaded. The subtle increment in time relatedto the increment in sequences arises from population ofthe frequency table, which was done sequentially forevery aligned sequence.Computationally, these assays provided further infor-
mation for AlignMiner, since they were executed on amultiprocessor computer where the queue system wasto be given some information regarding the estimatedexecution time for each job. Obviously, it is impossibleto provide an exact value in every case, but the execu-tion times shown in Figure 2 served to provide an esti-mated execution-time curve for the queue system.
Scoring method characterisationSince the rationale of each scoring method is different,they must be characterised in order to know when eachparticular method is more appropriate. Evaluation of
Guerrero et al. Algorithms for Molecular Biology 2010, 5:24http://www.almob.org/content/5/1/24
Page 6 of 16
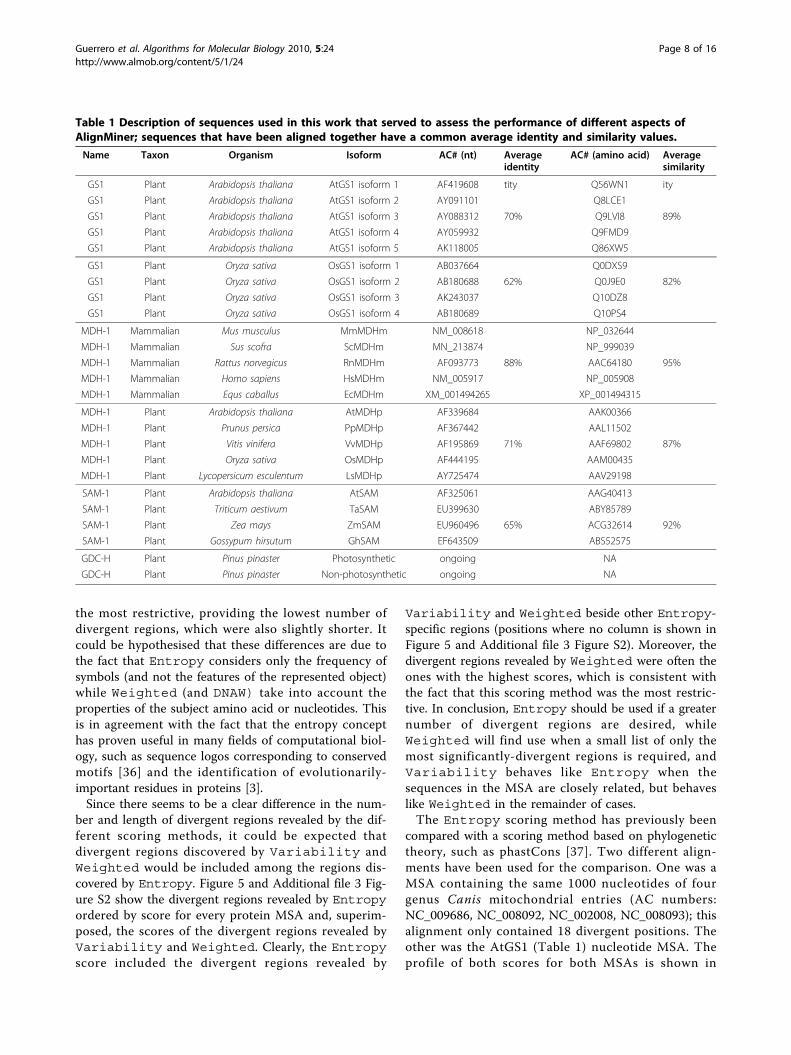
scores was performed with the 23 full-length sequences(nucleotide and amino acid) of genes described in Table1. They include genes having at least four different para-logs in one organism, and others with several orthologsin at least four organisms. All of the sequences werecompliant with the maximum MSA size that preventsoverflow of the M-Coffee size limits. As example of clo-sely-related paralogous genes, the five cytosolic gluta-mine synthetase isoforms of Arabidopsis thaliana(AtGS1) and the four cytosolic glutamine synthetase iso-forms of Oryza sativa (OsGS1) were included. As anexample of orthologous genes, the five genes of mam-malian malate dehydrogenase 1 (MDHm), five plantgenes of the mitochondrial NAD-dependent malatedehydrogenase (MDHp), and four plant genes of S-ade-nosylmethionine synthetase (SAM) were included.Sequences were aligned with both MultAlin [27] andM-Coffee [26] using default parameters. Average nucleo-tide identity was over 62% and the amino acid similaritywas over 82%. No clear correlation was found amongidentity/similarity and orthologs/paralogs in theseMSAs, and so further testing would not be biased. Theterminal portions of the MSAs were automaticallyremoved by AlignMiner in order to analyse only theportions where all sequences were aligned, and so
discard the highly “noisy” ends. Hence, uninformativehyper-variable segments were not included in the analy-sis. However, it should be noted that these hyper-vari-able regions in nucleotide MSAs could be consideredfor designing specific probes for Northern and Southernblots.At first, the proportion of divergent regions was com-
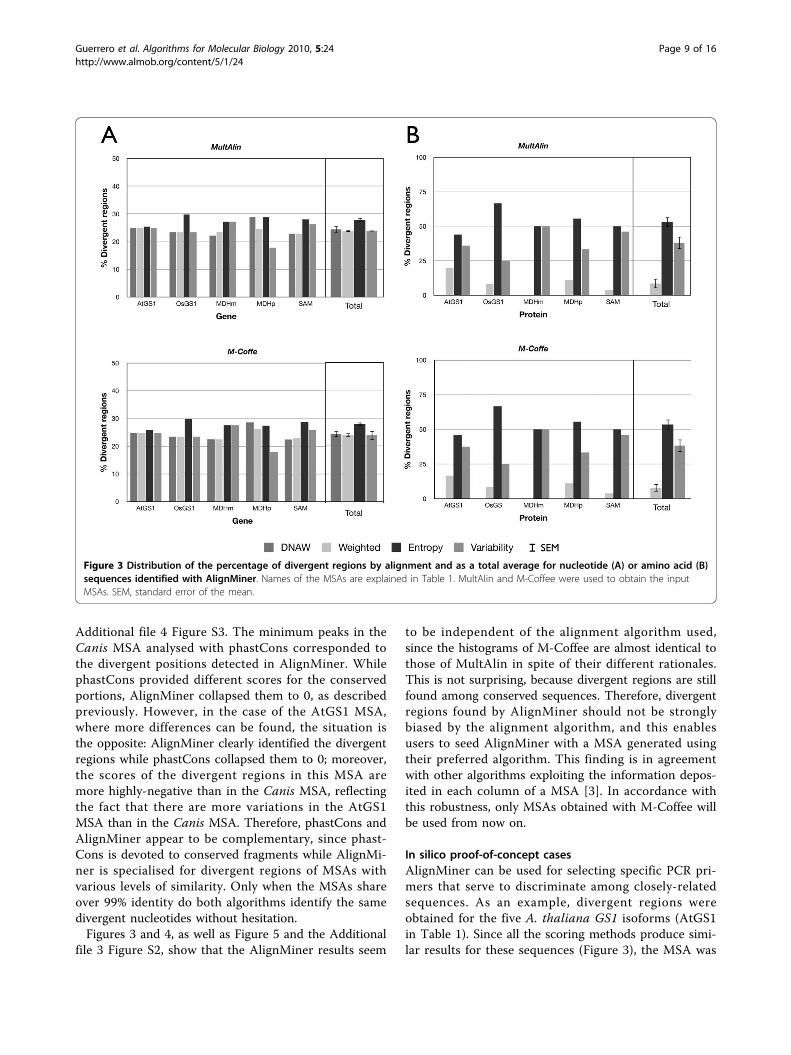
pared between MSAs (Figure 3). A percentage was usedin order to obtain comparable results, since MSAs ofless similar sequences (OsGS1 [paralogs] and SAM[orthologs]) provided more highly-divergent regionsthan MSAs containing closely-related sequences. Innucleotide MSAs (Figure 3A), Entropy provided thehighest number of divergent regions in the five MSAs,while the DNAW, Weighted and Variability meth-ods exhibited variable behaviour. Averaging all theresults for a single value with its SEM (standard error ofthe mean) confirmed the previous result, i.e. the numberof divergent regions using Entropy was clearly higherthan when using the other methods, among which thepercentage was lower and statistically-similar. For aminoacid MSAs (Figure 3B), the percentages were more vari-able among the scoring methods, but Entropy againprovided the highest value, while Weighted gave thelowest value in all instances (clearly, it was the mostrestrictive in both nucleotide and amino acid MSAs).On the other hand, Figure 3B also shows that, when thesequences aligned are very similar (AtGS1, SAM, andMDMm), Entropy and Variability behave simi-larly with regard to the divergent region percentage,whilst Variability clearly provides a lower numberof divergent regions than Entropy. Therefore,Entropy was the method that identified the greatestnumber of divergent regions for any kind of MSA, whileWeighted was revealed to be the most restrictive.Scoring methods should also be characterised by the
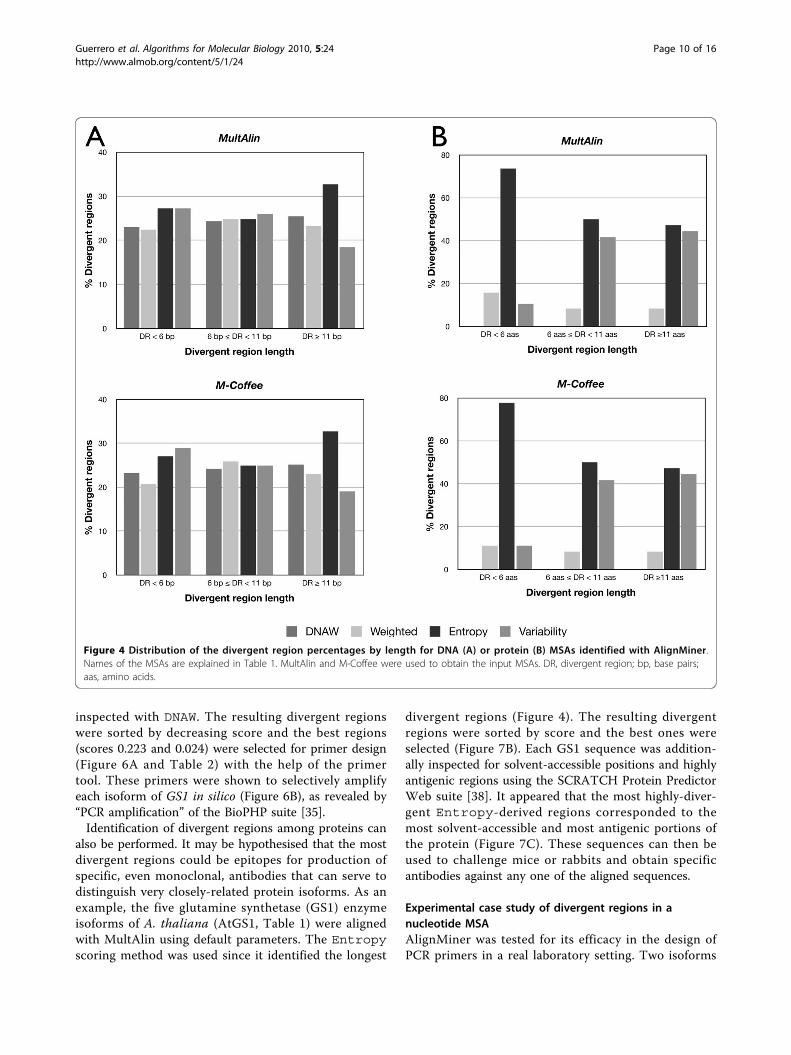
region length they determine. Divergent regions wereclassified by their length in three intervals: less than sixpositions, between six and 11 positions, or more than11 positions. In nucleotide MSAs (Figure 4A), it becameapparent that Entropy also rendered the longest diver-gent regions, while all the methods were roughly equiva-lent for regions below 11 nucleotides. In protein MSAs(Figure 4B), Variability and Entropy behave simi-larly with respect to identification of divergent regionslonger than either six or 11 amino acids, althoughEntropy in both cases identified a slightly larger num-ber of divergent regions than Variability.Weighted again provided a low number of long diver-gent regions. However, Entropy provided by far thehighest number of divergent regions below six aminoacids in length. In conclusion, Entropy seemed to pro-vide not only the highest number of divergent regions,but also the longest ones; in contrast, Weighted was
Figure 2 Execution time versus number of nucleotides in theMSA, excluding delays due to the queue system. The upperpanel represents the time taken when MSA length increases for agiven number of sequences. The lower panel (solid line) representsthe time taken when MSA length is kept constant while thenumber of sequences is increased. The number of nucleotides ineach case is a simple multiplication of MSA length by the numberof sequences.
Guerrero et al. Algorithms for Molecular Biology 2010, 5:24http://www.almob.org/content/5/1/24
Page 7 of 16
the most restrictive, providing the lowest number ofdivergent regions, which were also slightly shorter. Itcould be hypothesised that these differences are due tothe fact that Entropy considers only the frequency ofsymbols (and not the features of the represented object)while Weighted (and DNAW) take into account theproperties of the subject amino acid or nucleotides. Thisis in agreement with the fact that the entropy concepthas proven useful in many fields of computational biol-ogy, such as sequence logos corresponding to conservedmotifs [36] and the identification of evolutionarily-important residues in proteins [3].Since there seems to be a clear difference in the num-
ber and length of divergent regions revealed by the dif-ferent scoring methods, it could be expected thatdivergent regions discovered by Variability andWeighted would be included among the regions dis-covered by Entropy. Figure 5 and Additional file 3 Fig-ure S2 show the divergent regions revealed by Entropyordered by score for every protein MSA and, superim-posed, the scores of the divergent regions revealed byVariability and Weighted. Clearly, the Entropyscore included the divergent regions revealed by
Variability and Weighted beside other Entropy-specific regions (positions where no column is shown inFigure 5 and Additional file 3 Figure S2). Moreover, thedivergent regions revealed by Weighted were often theones with the highest scores, which is consistent withthe fact that this scoring method was the most restric-tive. In conclusion, Entropy should be used if a greaternumber of divergent regions are desired, whileWeighted will find use when a small list of only themost significantly-divergent regions is required, andVariability behaves like Entropy when thesequences in the MSA are closely related, but behaveslike Weighted in the remainder of cases.The Entropy scoring method has previously been
compared with a scoring method based on phylogenetictheory, such as phastCons [37]. Two different align-ments have been used for the comparison. One was aMSA containing the same 1000 nucleotides of fourgenus Canis mitochondrial entries (AC numbers:NC_009686, NC_008092, NC_002008, NC_008093); thisalignment only contained 18 divergent positions. Theother was the AtGS1 (Table 1) nucleotide MSA. Theprofile of both scores for both MSAs is shown in
Table 1 Description of sequences used in this work that served to assess the performance of different aspects ofAlignMiner; sequences that have been aligned together have a common average identity and similarity values.Name Taxon Organism Isoform AC# (nt) Average
identityAC# (amino acid) Average
similarity
GS1 Plant Arabidopsis thaliana AtGS1 isoform 1 AF419608 tity Q56WN1 ity
GS1 Plant Arabidopsis thaliana AtGS1 isoform 2 AY091101 Q8LCE1
GS1 Plant Arabidopsis thaliana AtGS1 isoform 3 AY088312 70% Q9LVI8 89%
GS1 Plant Arabidopsis thaliana AtGS1 isoform 4 AY059932 Q9FMD9
GS1 Plant Arabidopsis thaliana AtGS1 isoform 5 AK118005 Q86XW5
GS1 Plant Oryza sativa OsGS1 isoform 1 AB037664 Q0DXS9
GS1 Plant Oryza sativa OsGS1 isoform 2 AB180688 62% Q0J9E0 82%
GS1 Plant Oryza sativa OsGS1 isoform 3 AK243037 Q10DZ8
GS1 Plant Oryza sativa OsGS1 isoform 4 AB180689 Q10PS4
MDH-1 Mammalian Mus musculus MmMDHm NM_008618 NP_032644
MDH-1 Mammalian Sus scofra ScMDHm MN_213874 NP_999039
MDH-1 Mammalian Rattus norvegicus RnMDHm AF093773 88% AAC64180 95%
MDH-1 Mammalian Homo sapiens HsMDHm NM_005917 NP_005908
MDH-1 Mammalian Equs caballus EcMDHm XM_001494265 XP_001494315
MDH-1 Plant Arabidopsis thaliana AtMDHp AF339684 AAK00366
MDH-1 Plant Prunus persica PpMDHp AF367442 AAL11502
MDH-1 Plant Vitis vinifera VvMDHp AF195869 71% AAF69802 87%
MDH-1 Plant Oryza sativa OsMDHp AF444195 AAM00435
MDH-1 Plant Lycopersicum esculentum LsMDHp AY725474 AAV29198
SAM-1 Plant Arabidopsis thaliana AtSAM AF325061 AAG40413
SAM-1 Plant Triticum aestivum TaSAM EU399630 ABY85789
SAM-1 Plant Zea mays ZmSAM EU960496 65% ACG32614 92%
SAM-1 Plant Gossypum hirsutum GhSAM EF643509 ABS52575
GDC-H Plant Pinus pinaster Photosynthetic ongoing NA
GDC-H Plant Pinus pinaster Non-photosynthetic ongoing NA
Guerrero et al. Algorithms for Molecular Biology 2010, 5:24http://www.almob.org/content/5/1/24
Page 8 of 16
Additional file 4 Figure S3. The minimum peaks in theCanis MSA analysed with phastCons corresponded tothe divergent positions detected in AlignMiner. WhilephastCons provided different scores for the conservedportions, AlignMiner collapsed them to 0, as describedpreviously. However, in the case of the AtGS1 MSA,where more differences can be found, the situation isthe opposite: AlignMiner clearly identified the divergentregions while phastCons collapsed them to 0; moreover,the scores of the divergent regions in this MSA aremore highly-negative than in the Canis MSA, reflectingthe fact that there are more variations in the AtGS1MSA than in the Canis MSA. Therefore, phastCons andAlignMiner appear to be complementary, since phast-Cons is devoted to conserved fragments while AlignMi-ner is specialised for divergent regions of MSAs withvarious levels of similarity. Only when the MSAs shareover 99% identity do both algorithms identify the samedivergent nucleotides without hesitation.Figures 3 and 4, as well as Figure 5 and the Additional
file 3 Figure S2, show that the AlignMiner results seem
to be independent of the alignment algorithm used,since the histograms of M-Coffee are almost identical tothose of MultAlin in spite of their different rationales.This is not surprising, because divergent regions are stillfound among conserved sequences. Therefore, divergentregions found by AlignMiner should not be stronglybiased by the alignment algorithm, and this enablesusers to seed AlignMiner with a MSA generated usingtheir preferred algorithm. This finding is in agreementwith other algorithms exploiting the information depos-ited in each column of a MSA [3]. In accordance withthis robustness, only MSAs obtained with M-Coffee willbe used from now on.
In silico proof-of-concept casesAlignMiner can be used for selecting specific PCR pri-mers that serve to discriminate among closely-relatedsequences. As an example, divergent regions wereobtained for the five A. thaliana GS1 isoforms (AtGS1in Table 1). Since all the scoring methods produce simi-lar results for these sequences (Figure 3), the MSA was
Figure 3 Distribution of the percentage of divergent regions by alignment and as a total average for nucleotide (A) or amino acid (B)sequences identified with AlignMiner. Names of the MSAs are explained in Table 1. MultAlin and M-Coffee were used to obtain the inputMSAs. SEM, standard error of the mean.
Guerrero et al. Algorithms for Molecular Biology 2010, 5:24http://www.almob.org/content/5/1/24
Page 9 of 16
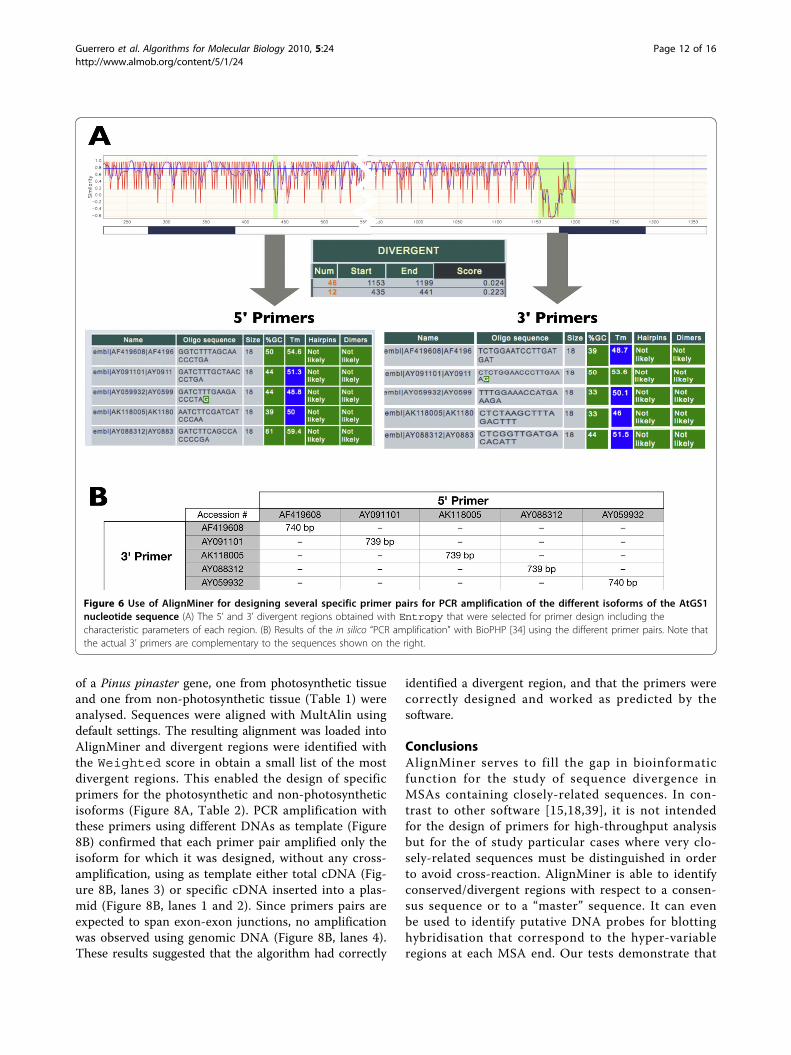
inspected with DNAW. The resulting divergent regionswere sorted by decreasing score and the best regions(scores 0.223 and 0.024) were selected for primer design(Figure 6A and Table 2) with the help of the primertool. These primers were shown to selectively amplifyeach isoform of GS1 in silico (Figure 6B), as revealed by“PCR amplification” of the BioPHP suite [35].Identification of divergent regions among proteins can
also be performed. It may be hypothesised that the mostdivergent regions could be epitopes for production ofspecific, even monoclonal, antibodies that can serve todistinguish very closely-related protein isoforms. As anexample, the five glutamine synthetase (GS1) enzymeisoforms of A. thaliana (AtGS1, Table 1) were alignedwith MultAlin using default parameters. The Entropyscoring method was used since it identified the longest
divergent regions (Figure 4). The resulting divergentregions were sorted by score and the best ones wereselected (Figure 7B). Each GS1 sequence was addition-ally inspected for solvent-accessible positions and highlyantigenic regions using the SCRATCH Protein PredictorWeb suite [38]. It appeared that the most highly-diver-gent Entropy-derived regions corresponded to themost solvent-accessible and most antigenic portions ofthe protein (Figure 7C). These sequences can then beused to challenge mice or rabbits and obtain specificantibodies against any one of the aligned sequences.
Experimental case study of divergent regions in anucleotide MSAAlignMiner was tested for its efficacy in the design ofPCR primers in a real laboratory setting. Two isoforms
Figure 4 Distribution of the divergent region percentages by length for DNA (A) or protein (B) MSAs identified with AlignMiner.Names of the MSAs are explained in Table 1. MultAlin and M-Coffee were used to obtain the input MSAs. DR, divergent region; bp, base pairs;aas, amino acids.
Guerrero et al. Algorithms for Molecular Biology 2010, 5:24http://www.almob.org/content/5/1/24
Page 10 of 16

Figure 5 Distribution of score values of the divergent regions using the three scoring methods (Entropy, Variability orWeighting) in the five protein MSAs, obtained with M-Coffee.
Guerrero et al. Algorithms for Molecular Biology 2010, 5:24http://www.almob.org/content/5/1/24
Page 11 of 16
of a Pinus pinaster gene, one from photosynthetic tissueand one from non-photosynthetic tissue (Table 1) wereanalysed. Sequences were aligned with MultAlin usingdefault settings. The resulting alignment was loaded intoAlignMiner and divergent regions were identified withthe Weighted score in obtain a small list of the mostdivergent regions. This enabled the design of specificprimers for the photosynthetic and non-photosyntheticisoforms (Figure 8A, Table 2). PCR amplification withthese primers using different DNAs as template (Figure8B) confirmed that each primer pair amplified only theisoform for which it was designed, without any cross-amplification, using as template either total cDNA (Fig-ure 8B, lanes 3) or specific cDNA inserted into a plas-mid (Figure 8B, lanes 1 and 2). Since primers pairs areexpected to span exon-exon junctions, no amplificationwas observed using genomic DNA (Figure 8B, lanes 4).These results suggested that the algorithm had correctly
identified a divergent region, and that the primers werecorrectly designed and worked as predicted by thesoftware.
ConclusionsAlignMiner serves to fill the gap in bioinformaticfunction for the study of sequence divergence inMSAs containing closely-related sequences. In con-trast to other software [15,18,39], it is not intendedfor the design of primers for high-throughput analysisbut for the of study particular cases where very clo-sely-related sequences must be distinguished in orderto avoid cross-reaction. AlignMiner is able to identifyconserved/divergent regions with respect to a consen-sus sequence or to a “master” sequence. It can evenbe used to identify putative DNA probes for blottinghybridisation that correspond to the hyper-variableregions at each MSA end. Our tests demonstrate that
Figure 6 Use of AlignMiner for designing several specific primer pairs for PCR amplification of the different isoforms of the AtGS1nucleotide sequence (A) The 5’ and 3’ divergent regions obtained with Entropy that were selected for primer design including thecharacteristic parameters of each region. (B) Results of the in silico “PCR amplification” with BioPHP [34] using the different primer pairs. Note thatthe actual 3’ primers are complementary to the sequences shown on the right.
Guerrero et al. Algorithms for Molecular Biology 2010, 5:24http://www.almob.org/content/5/1/24
Page 12 of 16

Table 2 Details of primers designed with AlignMiner to identify specifically by PCR the five A. thaliana GS1 genes aswell as the two primer pairs that identify the photosynthetic and non-photosynthetic isoforms of P. pinaster; notethat the 3’ (reverse) primer is complementary to the sequence appearing in Figures 6 and 8.
Isoform Primer Length %GC Tm (°C) Amplicon size (bp)
GS1.1 5’-GGTCTTTAGCAACCCTGA-3’ 18 50 54.6 740
5’-ATCATCAAGGATTCCAGA-3’ 18 39 48.7
GS1.2 5’-GATCTTTGCTAACCCTGA-3’ 18 44 51.3 739
5’-CTTTCAAGGGTTCCAGAG-3’ 18 50 53.6
GS1.3 5’-AATCTTCGATCATCCCAA-3’ 18 39 50 739
5’-AAAGTCTAAAGCTTAGAG-3’ 18 33 46
GS1.4 5’-GATCTTCAGCCACCCCGA-3’ 18 61 59.4 739
5’-AATGTGTCATCAACCGAG-3’ 18 44 51.5
GS1.5 5’-GATCTTTGAAGACCCTAG-3’ 18 44 48.8 740
5’-TCTTTCATGGTTTCCAAA-3’ 18 33 50.1
Photosyntetic isoform 5’-AGTGCGCATTAAGGACCCATCA-3’ 22 50 61 177
5’-ACACACTGGCTTCCACAATAGG-3’ 22 50 59.4
Non-photosynthetic isoform 5’-ACAGATGATCTAGGACATGC-3’ 20 45 52 169
5’-CACTTATTTGCACTTGAAGG-3’ 20 40 52.6
Figure 7 Correlation between the most divergent amino acid sequences and antigenicity of the AtGS1 protein MSA. (A) Similarity plotobtained using the Entropy method; the most divergent regions being are highlighted. (B) Aligned sequences for the two divergent regionstogether (underlined in black) and their score in relation to other divergent regions. (C) Localisation of each divergent region in the alignmentwhere: (i) nucleotides in bold are the predicted epitopes for B-cells; (ii) an “e” denotes predicted solvent accessibility for this position; and (iii)red-boxed amino acids correspond to the sequence of the matching divergent region. It is clearly seen that divergent sequences overlap withthe predicted epitopes and the solvent-accessible amino acids.
Guerrero et al. Algorithms for Molecular Biology 2010, 5:24http://www.almob.org/content/5/1/24
Page 13 of 16

Figure 8 Analysis of two Pinus pinaster gene isoforms. The specific primer pair for the photosynthetic isoform is identified by a “P”and for the non-photosynthetic isoform by an “N” (A) Predicted sequence and properties of the two primer pairs designed for specificidentification of each isoform. (B) PCR analysis using the previously-predicted primers. Table 2 includes the expected amplicon size using theseprimer pairs. The template in the different lanes is: cDNA for the photosynthetic isoform (lanes 1), cDNA for the non-photosynthetic isoform(lanes 2), cDNA synthesised from total mRNA extracted from Pinus pinaster (lanes 3), Pinus pinaster genomic DNA (lanes 4), and negative controls(lines 5), which do not contain any DNA. Lanes M are molecular weight markers (vector pFL61 digested with Hpa II). Arrows indicate the specificamplification bands. DNA sizes are given in base pairs.
Guerrero et al. Algorithms for Molecular Biology 2010, 5:24http://www.almob.org/content/5/1/24
Page 14 of 16
the predictions of AlignMiner are not markedlyaffected by the mode of MSA generation. This ismainly attributable to the fact that the MSAs com-prised highly similar sequences, and most differencesamong MSA algorithms involve divergent regions [40].In this study, the degree of similarity amongsequences did not appear to qualitatively affect theresults. While Entropy provided the highest numberof divergent regions of the longest size, Weightedprovided only a small set of the most divergentregions. Additionally, AlignMiner was found to becomplementary to the phastCons algorithm [37], sincethe former reinforces the differences and the latter,the similarities. Wet and dry laboratory experimentsshowed that AlignMiner can be used to provide speci-fic primers for PCR amplification of one gene amonga gene family of orthologs and paralogs, as well as toselect protein epitopes for antibody production. More-over, use of this software confirmed that divergentregions in protein alignments can be viewed as puta-tive specific antigenic sequences.The calculations in AlignMiner have been optimised
in order to reduce execution times. In contrastto other more static Web-based applications[15-17,19,39], the AlignMiner interface is highly inter-active, using emergent Web technologies without thirdparty solutions in order to resemble a stand-aloneapplication. This renders the interactivity highly depen-dent on the computer capabilities and browser imple-mentation. Its implementation as a Web tool enablesusers to inspect their results on different computers,even those with different operating systems. The dataflexibility means that it can handle most MSA formats,with each MSA obtained from orthologous and/orparalogous sequences, and can be saved in standardformats (PNG for images and GFF for data). We hopethat AlignMiner will save researchers time whendesigning PCR primers, probes, and linear epitopes.We are also open to suggestions from the scientificcommunity towards further development of AlignMi-ner. Institutions wishing to host mirrors of AlignMinerare encouraged to contact the authors.
Availability and requirementsProject name AlignMiner. No license or account isneeded.Operating systems Platform-independentProgramming languages Perl for the algorithm; Ajax
and HTML for the Web interface.Other requirements A Web browser supporting Java-
Script and Ajax (preferably Mozilla Firefox or Safari) isrequired to use the public Web server. For installingAlignMiner, BioPerl, JSON, Log::Log4perl and Math:FFTPerl modules are required.
Additional material
Additional file 1: Figure S1. Examples of primer design using theprimer tool of AlignMiner. In a good-quality set of oligonucleotides (left),all properties have a green background. When several primer propertiesare not in agreement with the characteristics stated in the text (right),they are marked in red (very bad), orange (adequate only) or blue(melting point is too low). In such a case, the sequence window must bemoved around the divergent region (extending or narrowing it) in orderto find a “green” primer; otherwise other divergent/conserved regionsshould be considered.
Additional file 2: Table S1. Details of the REST elements available, andthe relevant instructions for invoking AlignMiner as a Web service.
Additional file 3: Figure S2. Distribution of score values of thedivergent regions using the three scoring methods (Entropy,Variability or Weighting) in the five protein MSAs obtained withMultAlin.
Additional file 4: Figure S3. Scoring comparison provided byphastCons and AlignMiner with the MSAs of AtGS1 (left) and a highly-conserved fragment of 1000 nucleotides (right) from four different Canismitochondrial DNAs.
List of abbreviationsMSAs: multiple sequence alignments; PCR: polymerase chain reaction; dNTP:deoxynucleotide triphosphate; SEM: standard error of the mean; FFT: fastFourier transform; DR: divergent region; bp: base pairs; aas: amino acids;AtGS1: cytosolic glutamine synthetase isoforms of Arabidopsis thaliana;OsGS1: cytosolic glutamine synthetase of Oryza sativa; MDHm: mammalianmalate dehydrogenase 1; MDHp: plant mitochondrial NAD-dependentmalate dehydrogenase; SAM: plant S-adenosylmethionine synthetase.
AcknowledgementsThe authors wish to acknowledge F. Lopes Pinto, H. Svensson and P.Lindblad for sharing with us the WebTag code. This study was supported bythe Spanish MICINN grants AGL2009-12139-C02-02 and BIO2009-07490,European Union grant PLE2009-0016, and Junta de Andalucía funding to theresearch group BIO-114.
Author details1Plataforma Andaluza de Bioinformática (Universidad de Málaga), SeveroOchoa, 34, 29590 Málaga, Spain. 2Departamento de Biología Molecular yBioquímica (Universidad de Málaga), Campus de Teatinos, 29071 Málaga,Spain.
Authors’ contributionsDG designed the interface and implemented the software. RB conductedthe in silico testing. DPV conducted the experimental testing. FRC supervisedthe in silica and experimental testing, and helped in the manuscript writing.MGC conceived the study and wrote the manuscript. All authors read andapproved the final manuscript.
Competing interestsThe authors declare that they have no competing interests.
Received: 14 January 2010 Accepted: 2 June 2010Published: 2 June 2010
References1. Capra JA, Singh M: Predicting functionally important residues from
sequence conservation. Bioinformatics 2007, 23(15):1875-1882.2. Kim KM, Sung S, Caetano-Anollés G, Han JY, Kim H: An approach of
orthology detection from homologous sequences under minimumevolution. Nucleic Acids Res 2008, 36(17):e110.
3. Merkl R, Zwick M: H2r: Identification of evolutionary important residuesby means of an entropy based analysis of multiple sequencealignments. BMC Bioinformatics 2008, 9:151.
Guerrero et al. Algorithms for Molecular Biology 2010, 5:24http://www.almob.org/content/5/1/24
Page 15 of 16
4. Kemena K, Notredame C: Upcoming challenges for multiple sequencealignment methods in the high-throughput era. Bioinformatics 2009,25(19):2455-2465.
5. Czechowski T, Bari RP, Stitt M, Scheible W, Udvardi MK: Real-time RT-PCRprofiling of over 1400 Arabidospis transcription factors: unprecedentedsensity reveals novel root- and shoot-specific genes. Plant J 2004,38:366-379.
6. Claros MG, Crespillo R, Aguilar ML, Cánovas FM: DNA Fingerprinting andclassification of geographically related genotypes of olive-tree (Oleaeuropaea L.). Euphytica 2000, 116:131-142.
7. Savage D, Batley J, Erwin T, Logan E, Love CG, Lim GAC, Mongin E,Barker G, Spangenberg GC, Edwards D: SNPServer: a real-time SNPdiscovery tool. Nucleic Acids Res 2005, , 33 Web Server: W493-5.
8. Ferri G, Alù M, Corradini B, Licata M, Beduschi G: Species IdentificationThrough DNA “Barcodes”. Genet Test Mol Biomarkers 2009, 13:421-426.
9. Bautista R, Crespillo R, Canovas FM, Claros MG: Identification of olive-treecultivars with SCAR markers. Euphytica 2003, 129:33-41.
10. Geysen HM, Rodda SJ, Mason TJ: The delineation of peptides able tomimic assembled epitopes. Ciba Found Symp 1986, 119:130-149.
11. Zhang J, Wheeler DA, Yakub I, Wei S, Sood R, Rowe W, Liu PP, Gibbs RA,Buetow KH: SNPdetector: a software tool for sensitive and accurate SNPdetection. PLoS Comput Biol 2005, 1(5):e53.
12. D RP, Del-Favero J: novoSNP3: variant detection and sequenceannotation in resequencing projects. Methods Mol Biol 2007, 396:331-344.
13. Matukumalli LK, Grefenstette JJ, Hyten DL, Choi IY, Cregan PB, VanTassell CP: SNP-PHAGE-High throughput SNP discovery pipeline. BMCBioinformatics 2006, 7:468.
14. Manske HM, Kwiatkowski DP: SNP-o-matic. Bioinformatics 2009,25(18):2434-2435.
15. Chang HW, Chuang LY, Cheng YH, Hung YC, Wen CH, Gu DL, Yang CH:Prim-SNPing: a primer designer for cost-effective SNP genotyping.Biotechniques 2009, 46(6):421-431.
16. Tang J, Leunissen JA, Voorrips RE, van der Linden CG, Vosman B:HaploSNPer: a web-based allele and SNP detection tool. BMC Genetics2008, 9:23.
17. Panitz F, Stengaard H, Hornshoj H, Gorodkin J, Hedegaard J, Cirera S,Thomsen B, Madsen LB, Hoj A, Vingborg RK, Zahn B, Wang X,Wernersson R, Jorgensen CB, Scheibye-Knudsen K, Arvin T, Lumholdt S,Sawera M, Green T, Nielsen BJ, Havgaard JH, Brunak S, Fredholm M,Bendixen C: SNP mining porcine ESTs with MAVIANT, a novel tool forSNP evaluation and annotation. Bioinformatics 2007, 23(13):i387-i391.
18. Wegrzyn JL, Lee JM, Liechty J, Neale DB: PineSAP - sequence alignmentand SNP identification pipeline. Bioinformatics 2009, 25(19):2609-2610.
19. Kim N, Lee G: QPRIMER: a quick web-based application for designingconserved PCR primers from multigenome alignments. Bioinformatics2007, 23(17):2331-2333.
20. Gadberry MD, Malcomber ST, Doust AN, Kellogg EA: Primaclade–a flexibletool to find conserved PCR primers across multiple species.Bioinformatics 2005, 21(7):1263-1264.
21. Rascol VL, Levasseur A, Chabrol O, Grusea S, Gouret P, Danchin EGJ,Pontarotti P: CASSIOPE: An expert system for conserved regionssearches. BMC Bioinformatics 2009, , 10: 284.
22. Stajich J, Block D, Boulez K, Brenner S, Chervitz S, Dagdigian C, Fuellen G,Gilbert J, Korf I, Lapp H, Lehvasläiho H, Matsalla C, Mungall C, Osborne B,Pocock M, Schattner P, Senger M, Stein L, Stupka E, Wilkinson M, Birney E:The Bioperl toolkit: Perl modules for the life sciences. Genome Res 2002,12(10):1611-8.
23. Garret J: Ajax: A New Approach to Web Applications. Adaptive Path 2005.24. Java Script Object Notation. 1999 [http://www.json.org].25. Wallace IM, O’Sullivan O, Higgins DG, Notredame C: M-Coffee: combining
multiple sequence alignment methods with T-Coffee. Nucleic Acids Res2006, 34(6):1692-1699.
26. Moretti S, Armougom F, Wallace IM, Higgins DG, Jongeneel CV,Notredame C: The M-Coffee web server: a meta-method for computingmultiple sequence alignments by combining alternative alignmentmethods. Nucleic Acids Res 2007, 35:W645-8 [http://www.tcoffee.org].
27. Corpet F: Multiple sequence alignment with hierarchical clustering.Nucleic Acids Res 1988, 16(22):10881-90.
28. Lassmann T, Frings O, Sonnhammer ELL: Kalign2: high-performancemultiple alignment of protein and nucleotide sequences allowingexternal features. Nucleic Acids Res 2009, 37(3):858-65.
29. Pearson WR, Lipman DJ: Improved tools for biological sequencecomparison. Proc Natl Acad Sci USA 1988, 85:2444-48.
30. Needleman SB, Wunsch CD: A general method applicable to the searchfor similarities in the amino acid sequence of two proteins. J Mol Biol1970, 48:443-453.
31. Sean R: Where did the BLOSUM62 alignment score matrix come from?Nature Biotechnology 2004, 22:1035-1036.
32. Blosum62 matrix. [http://www.ncbi.nlm.nih.gov/Class/FieldGuide/BLOSUM62].
33. Pinto FL, Svensson H, Lindblad P: Webtag: a new web tool providingtags/anchors for RT-PCR experiments with prokaryotes. BMC Biotecnology2007, 7:73 [http://www.biomedcentral.com/1472-6750/7/73/].
34. PCR amplification at BioPHP. 2009 [http://biophp.org/minitools/pcr_amplification/demo.php].
35. Bikandi J, San Millán R, Rementeria A, Garaizar J: In silico analysis ofcomplete bacterial genomes: PCR, AFLP-PCR, and endonucleaserestriction. Bioinformatics 2004, 20(5):798-799.
36. Schneider TD, Stephens RM: Sequence logos: a new way to displayconsensus sequences. Nucleic Acids Res 1990, 18(20):6097-6100.
37. Siepel A, Bejerano G, Pedersen JS, Hinrichs AS, Hou M, Rosenbloom K,Clawson H, Spieth J, Hillier LW, Richards S, Weinstock GM, Wilson RK,Gibbs RA, Kent WJ, Miller W, Haussler D: Evolutionarily conservedelements in vertebrate, insect, worm, and yeast genomes. Genome Res2005, 15(8):1034-50.
38. SCRATCH Protein Predictor. 2009 [http://scratch.proteomics.ics.uci.edu/].39. Arvidsson S, Kwasniewski M, Riano-Pachón DM, Mueller-Roeber B:
QuantPrime – a flexible tool for reliable high-throughput primer designfor quantitative PCR. BMC Bioinformatics 2008, 9:465.
40. Lassmann T, Sonnhammer E: Automatic extraction of reliable regionsfrom multiple sequence alignments. BMC Bioinformatics 2007, 8(Suppl 5):S9.
doi:10.1186/1748-7188-5-24Cite this article as: Guerrero et al.: AlignMiner: a Web-based tool fordetection of divergent regions in multiple sequence alignments ofconserved sequences. Algorithms for Molecular Biology 2010 5:24.
Submit your next manuscript to BioMed Centraland take full advantage of:
• Convenient online submission
• Thorough peer review
• No space constraints or color figure charges
• Immediate publication on acceptance
• Inclusion in PubMed, CAS, Scopus and Google Scholar
• Research which is freely available for redistribution
Submit your manuscript at www.biomedcentral.com/submit
Guerrero et al. Algorithms for Molecular Biology 2010, 5:24http://www.almob.org/content/5/1/24
Page 16 of 16