Embed Size (px)
Citation preview


Classification of Significant Water Resources in the Upper Middle and Lower Vaal WMAs Sta tus Quo Report
Status Quo Report V13 September 2011
i
Classification of Significant Water Resources (River, Wetlands, Groundwater and Lakes) in the Upper, Middle and Lower Vaal
Water Management Areas (WMA) 8,9,10
Inception Report
September 2011
(FINAL)
Copyright reserved
No part of this publication may be reproduced in any manner
without full acknowledgement of the source
REFERENCE
This report is to be referred to in bibliographies as:
Department of Water Affairs, South Africa, September 2011. Classification of Significant Water Resources (River, Wetlands, Groundwater and Lakes) in the Upper, Middle and Lower Vaal Water Management Areas (WMA) 8, 9, 10: Status Quo Report
Prepared by:
WRP Consulting Engineers (Pty) Ltd in association with DMM Development Consultants
CC, Rivers for Africa eFlows Consulting (Pty) Ltd, Conningarth Economists, Koekemoer
Aquatic Services and Zitholele Consulting (Pty) Ltd.
Report No. RDM/WMA8,9,10/00/CON/CLA/0211
STATUS QUO REPORT:
Report number: RDM/WMA8,9,10/00/CON/CLA/0211

Classification of Significant Water Resources in the Upper Middle and Lower Vaal WMAs Sta tus Quo Report
Status Quo Report V13 September 2011
ii
DOCUMENT INDEX
Reports as part of this project (report status as in July 2011):
Index number RDM Report number Report title
1.1 RDM/WMA8,9,10/00/CON/CLA/0111 Classification of Significant Water Resources (River, Wetlands, Groundwater and Lakes) in the Upper, Middle and Lower Vaal Water Management Areas (WMA) 8,9,10, Inception Report
1.2 RDM/WMA8,9,10/00/CON/CLA/0211 Classification of Significant Water Resources (River, Wetlands, Groundwater and Lakes) in the Upper, Middle and Lower Vaal Water Management Areas (WMA) 8,9,10, Status Quo Report
Bold indicates this report.
Classification of Significant Water Resources in the Upper Middle and Lower Vaal WMAs Sta tus Quo Report
Status Quo Report V13 September 2011
iii
Title: Status Quo Report
Authors: R Cloete, G Huggins, S Koekemoer, D Louw, W Mullins, K Sami, P Scherman, S Swart, P van Rooyen
Study Name: Classification of Significant Water Resources (River, Wetlands,
Groundwater and Lakes) in the Upper, Middle and Lower Vaal Water Management Areas (WMA) 8,9,10
DWA Report No: RDM/WMA8,9,10/00/CON/CLA/0211
Status of Report: FINAL
First Issue: July 2011
Second Issue: August 2011
Final Issue: September 2011
Consultants: WRP Consulting Engineers (Pty) Ltd in association with DMM Development Consultants CC, Rivers for Africa eFlows Consulting (Pty) Ltd, Conningarth Economists, Koekemoer Aquatic Services and Zitholele Consulting (Pty) Ltd.
Approved for the Consultants by:
…………………………………………………
P van Rooyen Study Leader
DEPARTMENT OF WATER AFFAIRS
Directorate: Water Resource Classification
Approved for DWA by:
…………………………………………………
TB Nyamande Project Manager
…………………………………………………
S Naidoo
Director: Water Resource Classification
Classification of Significant Water Resources in the Upper Middle and Lower Vaal WMAs Sta tus Quo Report
Status Quo Report V13 September 2011
iv
MANAGEMENT AND STEERING COMMITTEES
Project Management Committee
Shane Naidoo Department of Water Affairs Director: Water Resource Classification Tovhowani Nyamande Department of Water Affairs Project Manager Lawrence Mulangaphuma Department of Water Affairs Project Co-ordinator
Project Team
Pieter van Rooyen WRP Consulting Engineers (Study Leader) Susan Swart WRP Consulting Engineers Andre Joubert Zitholele Consulting Delana Louw Rivers for Africa eFlow William Mullins Conningarth Economists Riekie Cloete Conningarth Economists Darius Mnguni DMM Development Consultants Shael Koekemoer Koekemoer Aquatic Services Patsy Scherman Scherman Colloty & Associates Piet Kotze Clean Stream James MacKenzie MacKenzie Ecological and Development Services Rob Palmer Nepid Consultants Mark Rountree Fluvius Greg Hugggins Nomad Consulting
Members of Project Steering Committee (Refer to Appendix H for list of members)
ACKNOWLEDGEMENTS
Apart from the authors, the following team members contributed to generating the results and populating the
database which is used as the basis of the ecological input into the report:
Dr Piet Kotze Clean Stream Biological Services James MacKenzie MacKenzie Ecological and Development Services Dr Rob Palmer Nepid Consultants
Classification of Significant Water Resources in the Upper Middle and Lower Vaal WMAs Sta tus Quo Report
Status Quo Report V13 September 2011
v
Classification of Significant Water Resources (River, Wetlands, Groundwater and Lakes) in the Upper, Middle and Lower Vaal
Water Management Areas (WMA) 8,9,10
Sta tus Quo Report
Executive Summary
1. BACKGROUND
This study entitled “Classification of Significant Water Resources (River, Wetlands, Groundwater and Lakes)
in the Upper, Middle and Lower Vaal Water Management Areas (WMA) 8,9,10” was commissioned by the
Chief Directorate Resource Directed Measures (RDM) of the Department of Water Affairs (DWA) in October
2010. The ultimate purpose of the study is the implementation of the Water Resource Classification System
(WRCS) in the above-mentioned three Vaal WMAs according to the 7 step process proposed by the WRCS
(DWAF, 2007) as described in Figure D-1 of Appendix D.
The delineated Integrated Units of Analysis (IUAs) are described in this document. Information on the water
resource infrastructure, water requirements, ecosystem characteristics, available socio-economic data and
communities are described and summarised for each of the IUAs. The main objective of this document is to
describe the status quo of the water resources within each of the IUAs in terms of the following aspects:
• Water resource infrastructure and availability;
• Ecological status;
• Socio-economic conditions (including framework for impact assessment); and
• Goods and services (communities and their well-being).
2. STUDY AREA
The core of the study area consists of the Upper, Middle and Lower Vaal River Water Management Areas
(WMAs), however, due to the numerous inter-basin transfers that link this core area with other WMAs, the
Ecological Reserve (ER) assessments had to be undertaken in the context of the Integrated Vaal River

Classification of Significant Water Resources in the Upper Middle and Lower Vaal WMAs Sta tus Quo Report
Status Quo Report V13 September 2011
vi
System (IVRS) which also includes portions of the Komati, Usutu, Thukela, Senqu River (located in Lesotho)
and Upper Orange (Riet-Modder River) catchments. The study area, therefore, comprises of the water
resource and bulk supply systems of the entire Integrated Vaal River System as shown in Figure 1.1. A
detailed description of the operation of the IVRS is provided in Appendix E. It is important to note that the
Riet-Modder catchment, which forms part of the Orange River WMA, is not included in the study area.
3. SELECTION OF BIOPHYSICAL NODES
The key biophysical nodes are the Ecological Water Requirement (EWR) sites and the selection process of
these sites is documented in the recent Reserve studies (DWAF, 2008e; DWAF 2009a and b). Large
sections of the catchment are still unaccounted for and additional biophysical nodes (referred to as desktop
biophysical nodes) had to be selected. Various tools and information such as the Desktop EcoClassification
results generated during the recent Reserve studies and the National Freshwater Ecosystem Priority Areas
(NFEPA) was used to identify additional nodes. All attempts were made to select nodes that fairly represent
the different conditions and operational procedures in the catchment. A total of 115 biophysical nodes were
selected in the three Water Management Areas.
4. DELINEATION OF INTEGRATED UNITS OF ANALYSIS
The identification and selection of the Integrated Units of Analysis (IUAs) were based on the following
considerations:
• The resolution of the hydrological analysis and available water resource network configurations
currently being modelled.
• Location of significant water resource infrastructure.
• Distinctive functions of the catchments in context of the larger system.
• Available budget for refinement of the existing network and undertaking scenario analysis of each
IUA.
• The biophysical nodes and the Present Ecological State (PES) and Recommended Ecological
Category (REC) for each node were also considered.
A properly calibrated higher resolution network water resource model is not available for use in the
classification process of the Vaal River System. Furthermore, it has been recognised that the characteristics
of individual small tributaries can significantly differ from the larger rivers and may warrant a different
management class. It was therefore proposed in the Inception Report that a practical qualitative evaluation
Classification of Significant Water Resources in the Upper Middle and Lower Vaal WMAs Sta tus Quo Report
Status Quo Report V13 September 2011
vii
method be applied where necessary, which only considers the ecological aspects as well as likely
implications on goods and services in a qualitative manner. The identification of the tributary catchments
formed part of the IUA delineation (Task 3a).
As already described in the approach to select biophysical nodes, the results (if available) of the current PES
and Environmental Importance-Environmental Sensitivity (EI-ES) would also have contributed largely to the
delineation of the IUA as the proportions of the different Ecological Categories for all the river reaches could
play a vital role in the delineation.
The identified Integrated Units of Analysis (IUAs) for the three Vaal Water Management Areas are shown in
Figures A-1, A-2 and A-3 of Appendix A.
5. WATER RESOURCES ASSESSMENT
Due to the highly developed nature of the IVRS and the various inter-basin transfers that exist in the system,
operating rules were developed that regulate when and how much water is transferred. The management
and implementation of these operating rules (which include the dilution of the TDS concentration
downstream of Vaal Barrage) are undertaken by the application of the Water Resource Planning Model
(WRPM). The WRPM will subsequently be used as the Decision Support System (DSS) for this study. The
WRPM system schematics are included in Appendix C.
The WRPM configuration of the IVRS includes the hydrological database resulting from the Vaal River
System Analysis Update (VRSAU) Study (DWAF, 1999). The VRSAU hydrology covers the period October
1920 to September 1995 (i.e. a period of 75 years). It is important to note that the hydrological analyses of
the VRSAU study were not necessarily undertaken at quaternary catchment level as the focus was on the
most representative modelling of relevant sub-catchments. The methodology adopted for the disaggregation
of lumped hydrology is described in Section 2.1.4.
The resolution of the WRPM configuration does not allow for the explicit modelling of the additional
biophysical nodes described in Section 2.2. Although natural hydrology could be derived for these nodes, it
will not be possible to simulate present day conditions at these sites. An alternative strategy will be followed
for the assessment of current development conditions. Land use information to be obtained from the
Validation and Verification studies will be used for this purpose.
The WRPM database includes growing water requirements up to the year 2030. Since the Integrated Vaal
River System (IVRS) is analysed on an annual basis, the water requirement projections of the major bulk
water suppliers (Rand Water, Midvaal Water Company and Sedibeng Water), the strategic water user
Eskom, as well as large industries such as Sasol and Mittal Steel (previously known as Iscor), are also
updated annually. The most recent water requirement projections of the above-mentioned users (revised as
part of the 2011/2012 Annual Operating Analysis) will be used for the scenario analyses to be undertaken as
part of this study and are summarised in Table F-1 of Appendix F.

Classification of Significant Water Resources in the Upper Middle and Lower Vaal WMAs Sta tus Quo Report
Status Quo Report V13 September 2011
viii
6. PROCESS TO DETERMINE THE ECOLOGICAL STATUS QUO: ECOCLASSIFICATION
EcoClassification includes a range of analysis relevant to EWR sites and nodes. Relevant to this report is
the identification of the Present Ecological State (PES) and the reasons for the PES which in essence
provides the ecological status quo of the catchment. Additional analysis was undertaken to assess the
Ecological, Socio-Cultural and Environmental Importance. This information, as well as considering the PES
and the reasons for the PES, provides guidance to derive the Recommended Ecological Category which is
set either to maintain or improve the PES.
The EWR sites were assessed during the recent and historic Reserve studies and the EcoClassification
Level 4 method was used. This report focuses on the desktop biophysical nodes and the Desktop
EcoClassification approach (Kleynhans and Louw, 2007) that was used. A current ongoing DWA/WRC PES
and Ecological Importance-Ecological Sensitivity also provided some useful information specifically regarding
the sub-quaternary (SQ) reaches of extensive river coverage of the area. All the information generated
during the assessment is available in Excel spreadsheets.
7. SOCIO-ECONOMIC ASSESSMENT
The economic modelling systems used are the Water Impact Model (WIM) as well as the Production Industry
Model (PIM), based on the SAFRIM model, to make it more WMA friendly. All three of the models are
underpinned by a Social Accounting Matrix (SAM) to determine the different economic impacts on the
applicable IUAs. Details of the procedure to be followed and the applied Scoring System for the classification
of the rivers are discussed in Section 2.4 and is summarised below.
The purpose of the Scoring System is to develop an objective evaluation system to reflect changes in water
volumes on the classification of the river system, be it positive or negative. The elements used are:
Ecological Condition, Economic Impact and Social Impact.
Approach to the Scoring System
• The eventual choice of the different eco-system values will be based on a matrix that allows attaining
the maximum value for both users, in and out of stream.
• The matrix to be developed listing all the values and then involve a group of knowledgeable people
from in and out of stream to populate the matrix.
• The original concept was developed in a pilot project in the Olifants-Doorn River. For this study the
concept is adapted for a highly industrialised Basin.
• The methodology proposed, is the Delphi approach where a number of specialists populate "Matrix
1" with approximate values.
• In "Matrix 2" weights are allocated to the different items which are then multiplied with the first matrix
to get "Matrix 3" with answers.
Classification of Significant Water Resources in the Upper Middle and Lower Vaal WMAs Sta tus Quo Report
Status Quo Report V13 September 2011
ix
Water reallocation situational analysis
The evaluation of the results of the three different sets of analysis, namely ecological, goods and services
and socio – economic is to establish the baseline per individual section of the main stem or tributary. If during
the analysis it appears that the ecological situation of certain river zones have deteriorated to a point where
corrective action is necessary, it might involve an increase in water in the specific river section. There is a
possibility that a negative economic impact or a cost increase might occur, should it involve a water
availability curtailment due to another activity.
In this regard the following assumptions have been developed and applied in the calculation of the possible
socio – economic costs:
• Main Stem: If in any zone problems arise the water will be augmented.
• Tributary: If any tributary a shortage of water is experienced it will be reallocated from the irrigation
sector.
If in a section of the main stem of the river more water is necessary to maintain or improve the status of the
ecology of a specific the river section, the water will be supplied from the present available sources. However
the possibility exists that this could influence the implementation date of the next augmentation scheme to
supply the Vaal River system. The implementation date of the next dam in the Lesotho Highlands scheme,
Polihali, is fixed and the project team has accepted that if a scheme must be brought forward it will be the
proposed Tugela scheme.
The proposed approach to the estimation of the costs of bringing the project forward will rest on the principle
of “time is money”. The estimated cost of the Tugela scheme is available based on 2009 pricing, for
implementation at a certain date in future, if that date is brought forward it will result in the money being
spent earlier and the impact on the consumer in increased rates will be payable earlier.
This cost will be calculated, if necessary, should the analysis by the hydrology team indicate an earlier
implementation date. This will assist the decision makers in arriving at a rational decision. The calculation
per zone will be done by multiplying the necessary volume of water with the cost of augmentation per unit,
expressed in 2011 prices.
Tributary - Economic Impact
The assumption governing the situation in a tributary rests on the supposition that the augmentation option
will not be available and if more water is necessary for the ecology it will be provided from present sources, if
there is a shortage it will be reallocated from the irrigation sector. The water reallocation volumes will be
determined by the hydrology team. The macro – economic impact of the reallocation impact will be
calculated to assist the decision makers in arriving at a rational decision.
Water Quality
Undesirable levels of water quality not only impact negatively on irrigation crop yields and quality, but also
have an adverse impact on industrial water use. For example, should there be a deterioration of the water
Classification of Significant Water Resources in the Upper Middle and Lower Vaal WMAs Sta tus Quo Report
Status Quo Report V13 September 2011
x
quality within the Grootdraai Dam Sub-system more water has to be provided to Eskom through the
VRESAP pipeline to ensure effective utilisation of the cooling systems of their power stations which receive
water from this sub-system. Furthermore, extra costs might be necessitated by bulk water suppliers such as
Rand Water that provides water to urban centres for domestic and industrial use. The costs associated with
bringing the quality of the water to acceptable levels will be sourced from previous studies, where the specific
option is not available the cost to the user will be used as the ball park figure.
The costs of these processes will be sourced from previous studies and indicated where necessary.
8. PROCESS TO DETERMINE THE GOODS & SERVICES STATUS QUO
Information on the Goods and Services (G&S) of the Vaal River is available and has been used as a basis
for this purpose. It should be noted that the objective in describing and valuing the use of aquatic
ecosystems is to determine the way in which aquatic ecosystems are currently being used in each socio-
economic zone, and to estimate the value generated by that use. This provides the baseline against which
the socio-economic and ecological implications of different catchment configuration scenarios can be
compared.
The most important Goods and Services associated with the overall system and likely to be impacted by
changes in operational and management scenarios are the following:
• Recreational fishing
• Subsistence fishing
• Other recreational aspects associated with the rivers
• Riparian vegetation usage
• Waste water dilutions
• Floodplain agricultural usage of subsistence purposes.
Furthermore, each quaternary catchment of the Vaal has been examined in detail via the analysis of Socio-
Cultural Importance. The Socio-Cultural Importance (SCI) was determined from:
• A site visit that covered points along the river, and
• extrapolation to sites not visited by reference to available literature as well as to exiting mapping.
9. STATUS OF WATER RESOURCES
The Vaal River System is the most important bulk water supply system in the country supplying water to 60%
of the country’s economy and 45% of its population. In addition to supplying water to other sub-systems
(such as the Crocodile West through Rand Water) the system also receives water from the Usutu, Thukela
and Senqu sub-systems. The Vaal River System is a very complex system consisting of many large dams,
Classification of Significant Water Resources in the Upper Middle and Lower Vaal WMAs Sta tus Quo Report
Status Quo Report V13 September 2011
xi
pumping stations, pipelines and tunnels transferring water over long distances. The inter-basin transfer and
system operating rules (which includes the dilution rule downstream of Vaal Barrage) have impacted on the
natural flow regime of the system. This has resulted in elevated flows being observed in many of the
tributaries as well as the main stem of the Vaal River. Water quality issues have also been identified.
10. ECOLOGICAL STATUS
Two of the major impacts dominating the Vaal Catchment are water quality impacts and changes in the flow
regime. Changes in the flow regime range from too little flow but the most severe impacts are from too much
flow and changes in seasonality which mainly relate to transfers, releases, irrigation return flows, mining and
urban runoff.
Areas of highest water quality impact across the Vaal River catchments are as follows:
• Rietspruit (C1Riet-Amers): The quality is a D category, largely due to extensive agricultural activities
with highly elevated nutrients and salts.
• The condition of the lower Klip River (north-west flowing Klip River) catchment is poor, with sites
ranging from a D to a D/E category. The main land use is still agriculture, although there are
discharges around certain urban areas (e.g. Vrede) which reduce the water quality category.
• Rietspruit and Klip rivers (Gauteng) - Note that the water quality state of this portion of the Upper
Vaal catchment is severely impacted and improvements in present state cannot occur without
addressing water quality related problems, e.g. through implementation of the Integrated Water
Quality Management Plan set up for the Vaal (DWAF, 2009).
• Lower Suikerbosrand and Blesbokspruit – The quality of the Suikerbosrand River is driven by the
poor quality of the Blesbokspruit River. Impacts include mine water decants, diffuse runoff, urban
runoff and point source discharges.
• Waterval catchment - Land use in the upper part of the catchment includes agricultural activities;
Sasol petrochemical industry; Secunda town; coal mining in the Bethal to Secunda area (C11 and
C12 tertiary catchments); and gold mining in the upper Waterval catchment. Impacts include
elevated salts and nutrients, particularly phosphate. Some irrigation takes place in the lower part of
the catchment, with issues related to elevated salts and nutrients, particularly phosphate. Water
quality is poor across the area (D category) due to impacts of Sasol and Secunda and pivot
irrigation.
• EWR 5 downstream of the Vaal Barrage – The salinity and nutrient impacts from the Klip, Riet,
Suikerbosrand and Waterval rivers are combined in the Vaal Barrage and released downstream to
this site on the Vaal River.
• The impact of Grootvlei Mine results in water quality deterioration to a D on the Molspruit tributary of
the Vaal River.
• Mooi River (Upper Vaal catchment) - The main impact in the area is the uranium-laden effluent from
the Wonderfonteinspruit. Impacts across the area are due to agricultural activities, urban runoff and
the discharge of mining effluent.

Classification of Significant Water Resources in the Upper Middle and Lower Vaal WMAs Sta tus Quo Report
Status Quo Report V13 September 2011
xii
• Middle Vaal River: EWR 12 at Vermaasdrift – Elevated nutrients and salts contribute to the poor
water quality state.
• Tributaries of the Middle Vaal - Water quality is poor across this area, i.e. a D/E on the
Koekemoerspruit to an E category elsewhere. Impacts are largely due to agriculture and urban /
mining impacts. The Schoonspruit also runs through the urban areas of Klerksdorp and Kanana as
well as the gold mining impacted areas (AngloGold Ashanti Vaal River Operations and Harmony).
• Vaal River (EWR 13) downstream of the Schoonspruit, Koekemoerspruit, Renoster and
Vierfonteinspruit confluences in the Middle Vaal catchment.
• Lower Sand catchment - Water quality in the area is worst where mining impacts around Welkom
and Virginia dominate. Here water quality is assumed to be a D category.
• Harts River (EWR 17 at Lloyds weir) – High salt and toxic concentrations due to agriculture and
diamond mining impacts.
• Riet River – Impacts are high salts and high nutrient levels.
Due to the economic importance of this area and the important role the Vaal System plays in conveying and
supplying the water resource to this economic hub, it is understandable that most of the system is in a C EC
or poorer condition.
The biophysical nodes that scored a high Environmental Importance are listed in Table 1 below.
Table 1: Summary of the desktop biophysical nodes and EWR sites with a High Environmental Importance
IUA VC node SQ reach PES FLOW RELATED
NON FLOW RELATED EIS EI REC
UV-A 8VF5 C11A-01460 B/C Yes MODERATE HIGH B UV-A EWR 1 C11J-01838 B/C Yes Yes HIGH HIGH B/C UV-B UV Uklip C13C-02550 B Yes HIGH HIGH B UV-B C13C C13D-02416 B/C Yes HIGH HIGH B UV-B C1KLIP-
UNSPE1 C13D-02284 B/C Yes Yes MODERATE HIGH B
UV-B C13E C13E-02228 B/C Yes Yes MODERATE HIGH B UV-C1 EWR 7 C81A-02790 A/B Yes HIGH HIGH A/B UV-C1 8WF1 C81A-02790 B Yes MODERATE HIGH B UV-C1 UV25 C81L-02594 B Yes MODERATE HIGH B UV-C2 GG C81G-02882 B Yes MODERATE HIGH B UV-D VC16 C83G-02364 B/C Yes MODERATE HIGH B UV-D VC17 C23H-02395 B/C Yes MODERATE HIGH B UV-H C21A C12A-01567 B/C Yes Yes MODERATE HIGH B UV-H EWR 9 C21C-01675 C Yes Yes HIGH HIGH B/C UV M EWR 4 C22F-01737 C Yes Yes HIGH HIGH B/C UV M EWR 5 C22L-01792 C/D Yes Yes HIGH HIGH C LV A4 VC59 C91D-02838 A/B Yes MODERATE HIGH A/B LV B VC60 C91D-02838 A/B Yes MODERATE HIGH A/B

Classification of Significant Water Resources in the Upper Middle and Lower Vaal WMAs Sta tus Quo Report
Status Quo Report V13 September 2011
xiii
As can be seen from Table 1, most of the High EI nodes lie in the Upper Vaal, none in the Middle Vaal and
two ephemeral small river reaches within the Lower Vaal. Apart from EWR 4, 5, and 9, all these sites are in
a reasonable to good PES and the majority of those in a B/C EC (that should improve to a B EC) will require
non-flow related intervention to achieve the required improvements.
In summary, the following can be noted:
• Some of the biggest water quality problems in South Africa occur within the study area.
• Many areas in the Vaal System (especially the Upper Vaal) are dominated by more flow than the
natural flow regime (elevated flows).
• Although this river system is so heavily utilised (generally in a C category or worse condition) some
features warrant protection and improvements are required where at all possible.
• The Vaal River is one of the few large rivers in South Africa; this fact on its own makes the Vaal
River important.
• Protection of the Vredefort Dome. The Vaal River is a key feature within the Vredefort Dome
especially around the town of Parys. Water quality issues are a serious concern – especially from
the human use perspective and all the recreational activities.
• The presence of the Red Data listed Barbus kimberleynsis (yellow fish) and various riparian
vegetation species.
• Endangered bird species are found within the study area, especially in upper reaches of Vaal and
Wilge river catchments which are dominated by oxbows and wetland features.
• Seekoeivlei RAMSAR wetland in the Klip River.
• Blesbokspruit RAMSAR wetland in the Blesbokspruit.
• Barbers- and Leeu Pans RAMSAR Convention accredited wetland in the Harts River catchment.
• Wolwespruit Provincial (North West Province) Nature Reserve which includes the Vaal River.
All of the above-mentioned features result in an extremely complicated set of challenges to be dealt with in
the Vaal Catchment. The scope for considering a varied set of scenarios to deal with in the Classification
System and the possibilities of trade-offs are limited.

Classification of Significant Water Resources in the Upper Middle and Lower Vaal WMAs Sta tus Quo Report
Status Quo Report V13 September 2011
xiv
11. SOCIO-ECONOMIC STATUS
Tables 2, 3 and 4 summarise the socio-economic impacts for the different IUAs as determined by the
modelling processes.
As shown in Table 2, the economic indicators such as Gross Domestic Product (GDP), employment and
household income percentage magnitudes of the Upper Vaal River IUAs generally compare well. A large
concentration of the main economic activities is found in the UV-E: Waterval River area due to the mining,
power generation and petro-chemical industries contributing 25.2% GDP, 26.3% employment opportunities
and 22.5% of the household income.
Table 2: Results for Upper Vaal WMA (2010)
IUA Reference
Description of resources
Total GDP Total Employment Total Households
R Mil % No. % R Mil %
UV-A Vaal River Upstream of Grootdraai Dam 38 217 9.9% 45 004 3.5% 14 744 6.7%
UV-B Klip River (Free State) 1 529 0.4% 5 113 0.4% 721 0.3%
UVC1-UVC3 Wilge Rivier 1 476 0.4% 9 253 0.7% 849 0.4%
UV-D Liebenbergsvlei River 1 829 0.5% 14 582 1.1% 1 073 0.5%
UV-E Waterval River 97 244 25.2% 337 424 26.3% 49 744 22.5%
UV-F Krop and Klip flowing into Vaal Dam 2 334 0.6% 10 395 0.8% 1 496 0.7%
UV-G Vaal River reach upstream of Vaal Dam and Downstream of Grootdraai Dam
62 900 16.3% 169 766 13.2% 37 141 16.8%
UV-H and UV-I: C21D-C21G
Suikerbosrand River upstream of confluence with Blesbokspruit
51 705 13.4% 225 936 17.6% 33 616 15.2%
Partly UV-I: C22A-C22E; C22H & C22J
Klip Rivier (GT) 53 849 13.9% 239 066 18.7% 37 794 17.1%
UV-L Mooi River up to confluence with Vaal River
12 606 3.3% 55 900 4.4% 7 111 3.2%
UV-M incl. UV-J, UV-K Vaal Dam to Middle Vaal 62 818 16.3% 169 158 13.2% 37 109 16.8%
Total 386 507 100% 1 281 597 100.0% 221 398 100.0%
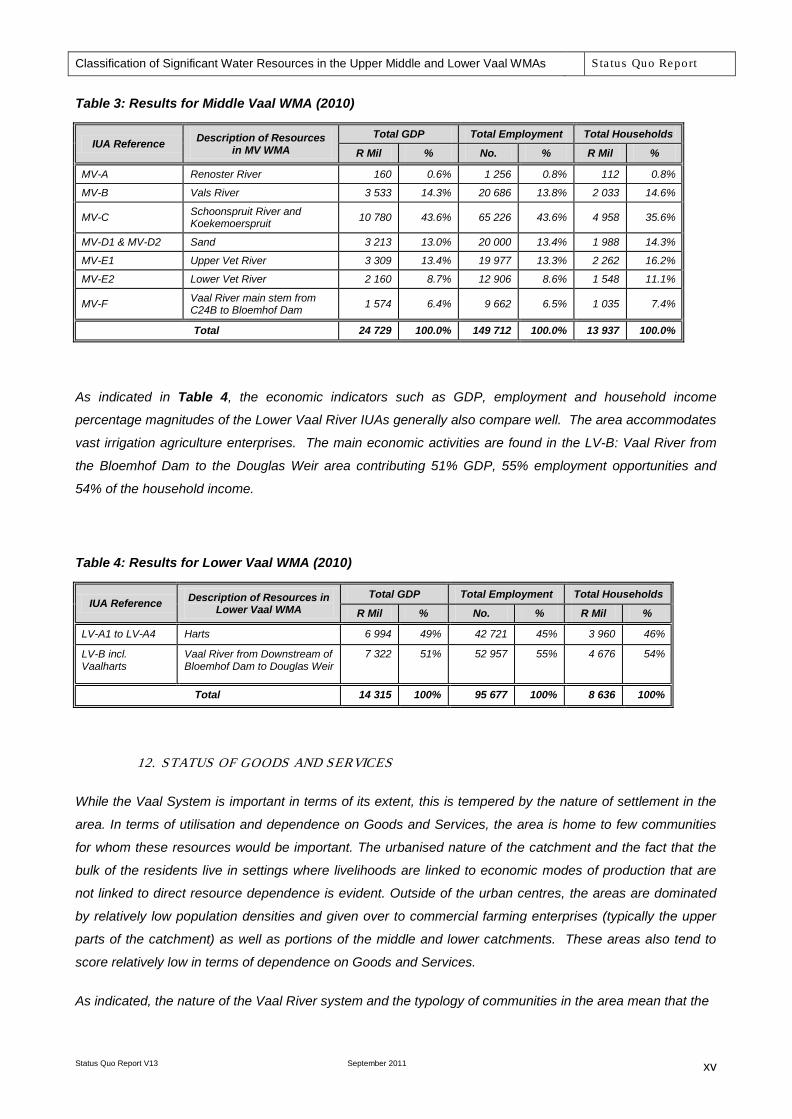
The economic indicators such as GDP, employment and household income percentage magnitudes of the
Middle Vaal River IUAs generally compare well (refer to Table 3). A large concentration of the main
economic activities is found in the MV-C: Schoonspruit and Koekemoerspruit area with industries
contributing 43.6% GDP, 43.6% employment opportunities and 35% of the household income.
Classification of Significant Water Resources in the Upper Middle and Lower Vaal WMAs Sta tus Quo Report
Status Quo Report V13 September 2011
xv
Table 3: Results for Middle Vaal WMA (2010)
IUA Reference Description of Resources in MV WMA
Total GDP Total Employment Total Households
R Mil % No. % R Mil %
MV-A Renoster River 160 0.6% 1 256 0.8% 112 0.8%
MV-B Vals River 3 533 14.3% 20 686 13.8% 2 033 14.6%
MV-C Schoonspruit River and Koekemoerspruit 10 780 43.6% 65 226 43.6% 4 958 35.6%
MV-D1 & MV-D2 Sand 3 213 13.0% 20 000 13.4% 1 988 14.3%
MV-E1 Upper Vet River 3 309 13.4% 19 977 13.3% 2 262 16.2%
MV-E2 Lower Vet River 2 160 8.7% 12 906 8.6% 1 548 11.1%
MV-F Vaal River main stem from C24B to Bloemhof Dam 1 574 6.4% 9 662 6.5% 1 035 7.4%
Total 24 729 100.0% 149 712 100.0% 13 937 100.0%
As indicated in Table 4, the economic indicators such as GDP, employment and household income
percentage magnitudes of the Lower Vaal River IUAs generally also compare well. The area accommodates
vast irrigation agriculture enterprises. The main economic activities are found in the LV-B: Vaal River from
the Bloemhof Dam to the Douglas Weir area contributing 51% GDP, 55% employment opportunities and
54% of the household income.
Table 4: Results for Lower Vaal WMA (2010)
IUA Reference Description of Resources in Lower Vaal WMA
Total GDP Total Employment Total Households
R Mil % No. % R Mil %
LV-A1 to LV-A4 Harts 6 994 49% 42 721 45% 3 960 46%
LV-B incl. Vaalharts
Vaal River from Downstream of Bloemhof Dam to Douglas Weir
7 322 51% 52 957 55% 4 676 54%
Total 14 315 100% 95 677 100% 8 636 100%
12. STATUS OF GOODS AND SERVICES
While the Vaal System is important in terms of its extent, this is tempered by the nature of settlement in the
area. In terms of utilisation and dependence on Goods and Services, the area is home to few communities
for whom these resources would be important. The urbanised nature of the catchment and the fact that the
bulk of the residents live in settings where livelihoods are linked to economic modes of production that are
not linked to direct resource dependence is evident. Outside of the urban centres, the areas are dominated
by relatively low population densities and given over to commercial farming enterprises (typically the upper
parts of the catchment) as well as portions of the middle and lower catchments. These areas also tend to
score relatively low in terms of dependence on Goods and Services.
As indicated, the nature of the Vaal River system and the typology of communities in the area mean that the
Classification of Significant Water Resources in the Upper Middle and Lower Vaal WMAs Sta tus Quo Report
Status Quo Report V13 September 2011
xvi
direct dependence on Goods and Services for livelihoods is restricted. There are however some forms of
utilisation of goods and services that are important. These are:
• Recreational fishing (specifically fly fishing targeting yellow fish);
• Subsistence fishing;
• Other recreational aspects associated with the rivers such as white water rafting, house boats,
swimming;
• Riparian vegetation usage;
• Waste water dilutions; and
• Floodplain agricultural usage of subsistence purposes.
Of these it is probably the recreational aspects associated with the river system and in particular fishing that
is most important. Particular areas of importance include most of the Vaal river main stem and in particular
areas around the Vredefort Dome. There are scattered areas in which the utilisation of riparian and other
associated livelihood resources may be of some restricted importance, particularly to farm workers.
However, these are highly unlikely to react to implementation of possible management and operational
scenarios.
Another recreational activity that is important is bird watching which is associated with the various RAMSAR
convention wetlands in the study area. These are Seekoeivlei, Barbers Pan, Leeu Pan and the
Blesbokspruit wetland.

Classification of Significant Water Resources in the Upper Middle and Lower Vaal WMAs Sta tus Quo Report
Status Quo Report V13 September 2011
xvii
Classification of Significant Water Resources (River, Wetlands, Groundwater and Lakes) in the Upper, Middle and Lower Vaal
Water Management Areas (WMA) 8,9,10
Status Quo Report
TABLE OF CONTENTS
1 INTRODUCTION ....................................................................................................... 1
1.1 PURPOSE OF THE STUDY ..................................................................................... 1
1.2 STUDY AREA .......................................................................................................... 2
1.3 PURPOSE AND LAYOUT OF THE REPORT .......................................................... 3
2 METHODOLOGY ADOPTED FOR STATUS QUO ASSESSMENT ......................... 5
2.1 WATER RESOURCES ASSESSMENT ................................................................... 5
2.1.1 Decision support system (DSS) for Integrated Vaal River System .......................................... 5
2.1.2 System components ................................................................................................................. 5
2.1.3 Hydrological database.............................................................................................................. 6
2.1.4 Hydrology for biophysical nodes .............................................................................................. 6
2.1.5 Catchment development and water use .................................................................................. 8
2.2 SELECTION OF BIOPHYSICAL NODES ................................................................ 9
2.3 ECOCLASSIFICATION ......................................................................................... 11
2.4 SOCIO-ECONOMIC ASSESSMENT ..................................................................... 15
2.4.1 Preparation modelling for the WIM ........................................................................................ 16
2.4.2 The Water Impact Model (WIM) ............................................................................................. 18
2.4.3 Approach for Production Inputs: Production Industry Model (PIM)........................................ 21
2.4.4 Scoring System ...................................................................................................................... 22

Classification of Significant Water Resources in the Upper Middle and Lower Vaal WMAs Sta tus Quo Report
Status Quo Report V13 September 2011
xviii
2.5 GOODS AND SERVICES ASSESSMENT ............................................................. 26
2.5.1 Methods used to Assess Goods and Services ...................................................................... 26
2.5.2 Delineation of the Units of Analysis and Description of the Status Quo ................................ 31
2.5.3 Present Status of the Goods and Services in the Catchment ................................................ 31
2.5.4 Description of the Present-day Community Wellbeing within each IUA ................................ 33
2.6 WATER REALLOCATION SITUATIONAL ANALYSIS ......................................... 33
2.6.1 Main stem – Augmentation .................................................................................................... 33
2.6.2 Tributary – Economic Impact ................................................................................................. 34
2.6.3 Water Quality ......................................................................................................................... 34
3 INTEGRATED UNITS OF ANALYSIS (IUAS) ........................................................ 35
3.1 APPROACH IN IDENTIFICATION OF IUAS ......................................................... 35
3.2 UPPER VAAL IUAS............................................................................................... 36
3.3 MIDDLE VAAL IUAS ............................................................................................. 37
3.4 LOWER VAAL IUAS.............................................................................................. 38
4 STATUS QUO OF UPPER VAAL WMA ................................................................. 39
4.1 GENERAL ............................................................................................................. 39
4.2 UV-A: VAAL RIVER UPSTREAM OF GROOTDRAAI ........................................... 39
4.2.1 Water Resources Assessment ............................................................................................... 39
4.2.2 Ecological Assessment .......................................................................................................... 40
4.2.3 Socio-economic Assessment ................................................................................................. 41
4.2.4 Goods and Services Assessment .......................................................................................... 42
4.2.5 Proposed Action ..................................................................................................................... 43
4.3 UV-B: KLIP RIVER (FREE STATE) ....................................................................... 43
4.3.1 Water Resources Assessment ............................................................................................... 43
4.3.2 Ecological Assessment .......................................................................................................... 43
4.3.3 Socio-economic Assessment ................................................................................................. 44
4.3.4 Goods and Services Assessment .......................................................................................... 45

Classification of Significant Water Resources in the Upper Middle and Lower Vaal WMAs Sta tus Quo Report
Status Quo Report V13 September 2011
xix
4.3.5 Proposed Action ..................................................................................................................... 45
4.4 UV-C1: UPPER WILGE RIVER ............................................................................. 45
4.4.1 Water Resources Assessment ............................................................................................... 45
4.4.2 Ecological Assessment .......................................................................................................... 46
4.4.3 Socio-economic Assessment ................................................................................................. 47
4.4.4 Goods and Services Assessment .......................................................................................... 48
4.4.5 Proposed Action ..................................................................................................................... 48
4.5 UV-C2: WILGE RIVER AND TRIBUTARIES ......................................................... 49
4.5.1 Water Resources Assessment ............................................................................................... 49
4.5.2 Ecological Assessment .......................................................................................................... 49
4.5.3 Socio-economic Assessment ................................................................................................. 50
4.5.4 Goods and Services Assessment .......................................................................................... 50
4.5.5 Proposed Action ..................................................................................................................... 51
4.6 UV-C3: LOWER WILGE RIVER ............................................................................ 51
4.6.1 Water Resources Assessment ............................................................................................... 51
4.6.2 Ecological Assessment .......................................................................................................... 51
4.6.3 Socio-economic Assessment ................................................................................................. 51
4.6.4 Goods and Services Assessment .......................................................................................... 51
4.6.5 Proposed Action ..................................................................................................................... 52
4.7 UV-D: LIEBENBERGSVLEI RIVER ....................................................................... 52
4.7.1 Water Resources Assessment ............................................................................................... 52
4.7.2 Ecological Assessment .......................................................................................................... 52
4.7.3 Socio-economic Assessment ................................................................................................. 53
4.7.4 Goods and Services Assessment .......................................................................................... 54
4.7.5 Corrective Action .................................................................................................................... 54
4.8 UV-E: WATERVAL RIVER .................................................................................... 54
4.8.1 Water Resources Assessment ............................................................................................... 54
4.8.2 Ecological Assessment .......................................................................................................... 54
Classification of Significant Water Resources in the Upper Middle and Lower Vaal WMAs Sta tus Quo Report
Status Quo Report V13 September 2011
xx
4.8.3 Socio-economic Assessment ................................................................................................. 55
4.8.4 Goods and Services Assessment .......................................................................................... 55
4.8.5 Corrective Action .................................................................................................................... 56
4.9 UV-F: KROM AND KLIP RIVERS .......................................................................... 56
4.9.1 Water Resources Assessment ............................................................................................... 56
4.9.2 Ecological Assessment .......................................................................................................... 56
4.9.3 Socio-economic Assessment ................................................................................................. 57
4.9.4 Goods and Services Assessment .......................................................................................... 57
4.9.5 Corrective Action .................................................................................................................... 58
4.10 UV-G: VAAL RIVER REACH UPSTREAM OF VAAL DAM ................................... 58
4.10.1 Water Resources Assessment ............................................................................................... 58
4.10.2 Ecological Assessment .......................................................................................................... 58
4.10.3 Socio-economic Assessment ................................................................................................. 59
4.10.4 Goods and Services Assessment .......................................................................................... 59
4.10.5 Corrective Action .................................................................................................................... 60
4.11 UV-H: SUIKERBOSRAND RIVER UPSTREAM OF BLESBOKSPRUIT CONFLUENCE ...................................................................................................... 60
4.11.1 Water Resources Assessment ............................................................................................... 60
4.11.2 Ecological Assessment .......................................................................................................... 60
4.11.3 Socio-economic Assessment ................................................................................................. 61
4.11.4 Goods and Services Assessment .......................................................................................... 61
4.11.5 Corrective Action .................................................................................................................... 61
4.12 UV-I: BLESBOKSPRUIT, RIET AND KLIP RIVER (GAUTENG) ........................... 62
4.12.1 Water Resources Assessment ............................................................................................... 62
4.12.2 Ecological Assessment .......................................................................................................... 62
4.12.3 Socio-economic Assessment ................................................................................................. 64
4.12.4 Goods and Services Assessment .......................................................................................... 64
4.12.5 Corrective Action .................................................................................................................... 65
4.13 UV-J: TAAIBOSSPRUIT ........................................................................................ 65
Classification of Significant Water Resources in the Upper Middle and Lower Vaal WMAs Sta tus Quo Report
Status Quo Report V13 September 2011
xxi
4.13.1 Water Resources Assessment ............................................................................................... 65
4.13.2 Ecological Assessment .......................................................................................................... 65
4.13.3 Socio-economic Assessment ................................................................................................. 65
4.13.4 Goods and Services Assessment .......................................................................................... 66
4.13.5 Corrective Action .................................................................................................................... 66
4.14 UV-K: KROMELMBOOGSPRUIT .......................................................................... 66
4.14.1 Water Resources Assessment ............................................................................................... 66
4.14.2 Ecological Assessment .......................................................................................................... 66
4.14.3 Socio-economic Assessment ................................................................................................. 67
4.14.4 Goods and Services Assessment .......................................................................................... 67
4.14.5 Corrective Action .................................................................................................................... 67
4.15 UV-L: MOOI RIVER UP TO CONFLUENCE WITH VAAL ..................................... 67
4.15.1 Water Resources Assessment ............................................................................................... 67
4.15.2 Ecological Assessment .......................................................................................................... 68
4.15.3 Socio-economic Assessment ................................................................................................. 69
4.15.4 Goods and Services Assessment .......................................................................................... 69
4.15.5 Corrective Action .................................................................................................................... 70
4.16 UV-M: VAAL RIVER REACH FROM VAAL DAM TO C23L .................................. 70
4.16.1 Water Resources Assessment ............................................................................................... 70
4.16.2 Ecological Assessment .......................................................................................................... 71
4.16.3 Socio-economic Assessment ................................................................................................. 71
4.16.4 Goods and Services Assessment .......................................................................................... 72
4.16.5 Correction Action .................................................................................................................... 72
4.17 UV-N: GROUNDWATER (ABSTRACTION FROM ZUURBEKOM WELLS) .......... 72
5 STATUS QUO OF MIDDLE VAAL WMA ............................................................... 75
5.1 GENERAL ............................................................................................................. 75
5.2 MV-A: RENOSTER RIVER .................................................................................... 75
5.2.1 Water Resources Assessment ............................................................................................... 75

Classification of Significant Water Resources in the Upper Middle and Lower Vaal WMAs Sta tus Quo Report
Status Quo Report V13 September 2011
xxii
5.2.2 Ecological Assessment .......................................................................................................... 75
5.2.3 Socio-economic Assessment ................................................................................................. 76
5.2.4 Goods and Services Assessment .......................................................................................... 76
5.2.5 Corrective Action .................................................................................................................... 77
5.3 MV-B: VALS RIVER .............................................................................................. 77
5.3.1 Water Resources Assessment ............................................................................................... 77
5.3.2 Ecological Assessment .......................................................................................................... 77
5.3.3 Socio-economic Assessment ................................................................................................. 78
5.3.4 Goods and Services Assessment .......................................................................................... 78
5.3.5 Corrective Action .................................................................................................................... 79
5.4 MV-C: SCHOONSPRUIT AND KOEKEMOERSPRUIT ......................................... 79
5.4.1 Water Resources Assessment ............................................................................................... 79
5.4.2 Ecological Assessment .......................................................................................................... 79
5.4.3 Socio-economic Assessment ................................................................................................. 80
5.4.4 Goods and Services Assessment .......................................................................................... 80
5.4.5 Corrective Action .................................................................................................................... 81
5.5 MV-D1: UPPER SAND RIVER ............................................................................... 81
5.5.1 Water Resources Assessment ............................................................................................... 81
5.5.2 Ecological Assessment .......................................................................................................... 82
5.5.3 Socio-economic Assessment ................................................................................................. 82
5.5.4 Goods and Services Assessment .......................................................................................... 82
5.5.5 Corrective Action .................................................................................................................... 83
5.6 MV-D2: LOWER SAND RIVER .............................................................................. 83
5.6.1 Water Resources Assessment ............................................................................................... 83
5.6.2 Ecological Assessment .......................................................................................................... 83
5.6.3 Socio-economic Assessment ................................................................................................. 84
5.6.4 Goods and Services Assessment .......................................................................................... 84
5.6.5 Corrective Action .................................................................................................................... 84
5.7 MV-E1: UPPER VET RIVER .................................................................................. 85

Classification of Significant Water Resources in the Upper Middle and Lower Vaal WMAs Sta tus Quo Report
Status Quo Report V13 September 2011
xxiii
5.7.1 Water Resources Assessment ............................................................................................... 85
5.7.2 Ecological Assessment .......................................................................................................... 85
5.7.3 Socio-economic Assessment ................................................................................................. 85
5.7.4 Goods and Services Assessment .......................................................................................... 86
5.7.5 Corrective Action .................................................................................................................... 86
5.8 MV-E2: LOWER VET RIVER ................................................................................. 87
5.8.1 Water Resources Assessment ............................................................................................... 87
5.8.2 Ecological Assessment .......................................................................................................... 87
5.8.3 Socio-economic Assessment ................................................................................................. 87
5.8.4 Goods and Services Assessment .......................................................................................... 88
5.8.5 Corrective Action .................................................................................................................... 88
5.9 MV-F: VAAL RIVER FROM C24B TO BLOEMHOF DAM ..................................... 89
5.9.1 Water Resources Assessment ............................................................................................... 89
5.9.2 Ecological Assessment .......................................................................................................... 89
5.9.3 Socio-economic Assessment ................................................................................................. 89
5.9.4 Goods and Services Assessment .......................................................................................... 90
5.9.5 Corrective Action .................................................................................................................... 90
5.10 MV-G: GROUNDWATER IN SCHOONSPRUIT ..................................................... 90
6 STATUS QUO OF LOWER VAAL WMA ................................................................ 93
6.1 GENERAL ............................................................................................................. 93
6.2 LV-A1: UPPER HARTS RIVER ............................................................................. 93
6.2.1 Water Resources Assessment ............................................................................................... 93
6.2.2 Ecological Assessment .......................................................................................................... 93
6.2.3 Socio-economic Assessment ................................................................................................. 94
6.2.4 Goods and Services Assessment .......................................................................................... 94
6.2.5 Corrective Action .................................................................................................................... 95
6.3 LV-A2: MIDDLE HARTS RIVER ............................................................................ 95
6.3.1 Water Resources Assessment ............................................................................................... 95

Classification of Significant Water Resources in the Upper Middle and Lower Vaal WMAs Sta tus Quo Report
Status Quo Report V13 September 2011
xxiv
6.3.2 Ecological Assessment .......................................................................................................... 95
6.3.3 Socio-economic Assessment ................................................................................................. 95
6.3.4 Goods and Services Assessment .......................................................................................... 95
6.3.5 Corrective Action .................................................................................................................... 96
6.4 LV-A3: DRY HARTS RIVER .................................................................................. 96
6.4.1 Water Resources Assessment ............................................................................................... 96
6.4.2 Ecological Assessment .......................................................................................................... 96
6.4.3 Socio-economic Assessment ................................................................................................. 97
6.4.4 Goods and Services Assessment .......................................................................................... 97
6.4.5 Corrective Action .................................................................................................................... 97
6.5 LV-A4: LOWER HARTS RIVER ............................................................................ 97
6.5.1 Water Resources Assessment ............................................................................................... 97
6.5.2 Ecological Assessment .......................................................................................................... 98
6.5.3 Socio-economic Assessment ................................................................................................. 98
6.5.4 Goods and Services Assessment .......................................................................................... 98
6.5.5 Corrective Action .................................................................................................................... 99
6.6 LV-B: VAAL RIVER REACH DOWNSTREAM OF BLOEMHOF TO DOUGLAS ... 99
6.6.1 Water Resources Assessment ............................................................................................... 99
6.6.2 Ecological Assessment ........................................................................................................ 100
6.6.3 Socio-economic Assessment ............................................................................................... 100
6.6.4 Goods and Services Assessment ........................................................................................ 101
6.6.5 Corrective Action .................................................................................................................. 101
6.7 LV-C: GROUNDWATER IN LICHTENBURG AREA ............................................ 101
7 SUMMARY AND CONCLUSIONS ........................................................................ 103
7.1 STATUS OF WATER RESOURCES ................................................................... 103
7.2 ECOLOGICAL STATUS ...................................................................................... 103
7.3 SOCIO-ECONOMIC STATUS .............................................................................. 106

Classification of Significant Water Resources in the Upper Middle and Lower Vaal WMAs Sta tus Quo Report
Status Quo Report V13 September 2011
xxv
7.4 STATUS OF GOODS AND SERVICES ............................................................... 108
8 REFERENCES ...................................................................................................... 109
LIST OF APPENDICES
Appendix A: Maps of Water Management Areas
Appendix B: Catchment Maps of the Integrated Units of Analysis
Appendix C: WRPM Schematic Diagrams
Appendix D: WRCS Guidelines: Seven Step Diagram
Appendix E: Water Resource Infrastructure of IVRS
Appendix F: Summary of Water Requirement Projections
Appendix G: Summary of Information Relative to Biophysical Nodes
Appendix H: Members of Project Steering Committee
Appendix I: Comments and Responses

Classification of Significant Water Resources in the Upper Middle and Lower Vaal WMAs Sta tus Quo Report
Status Quo Report V13 September 2011
xxvi
LIST OF TABLES
Table 2.1: Example of the metrics used in the fact sheet 14
Table 2.2: Structure of Production Costs 17
Table 2.3: Secondary inputs for WIM 17
Table 2.4: Structure of Production Costs 18
Table 2.5: Allocated weights 24
Table 2.6: Weight allocation and associated monetary value 24
Table 2.7: Example of the results calculation 25
Table 3.1: Summary of IUAs in Upper Vaal WMA 36
Table 3.2: Summary of IUAs in Middle Vaal WMA 37
Table 3.3: Summary of IUAs in Lower Vaal WMA 38
Table 4.1: PES, EIS and REC for UV-A 40
Table 4.2: Economic Impacts on Vaal River upstream of Grootdraai (2010) 42
Table 4.3: PES, EIS and REC for UV-B 43
Table 4.4: Economic Impacts on Klip River (Free State) (2010) 44
Table 4.5: PES, EIS and REC for UV-C1 46
Table 4.6: Economic Impacts on Wilge River UV-C1 to UV-C3 (2010) 48
Table 4.7: PES, EIS and REC for UV-C2 49
Table 4.8: PES, EIS and REC for UV-C3 51
Table 4.9: PES, EIS and REC for UV-D 52
Table 4.10: Economic Impacts on Liebenbergsvlei River (2010) 53
Table 4.11: PES, EIS and REC for UV-E 55
Table 4.12: Economic Impacts on Waterval River (2010) 55
Table 4.13: PES, EIS and REC for UV-F 56
Table 4.14: Economic Impacts on Krom and Klip flowing into Vaal Dam Rivers (2010) 57
Table 4.15: PES, EIS and REC for UV-G 58
Table 4.16: Economic Impacts on Vaal River reach upstream of Vaal Dam and downstream of Groot Draai
Dam (2010) 59
Table 4.17: PES, EIS and REC for UV-H 60
Table 4.18: Economic Impacts on Suikerbosrand River upstream of Blesbokspruit Confluence (2010) 61
Table 4.19: PES, EIS and REC for UV-I 62
Classification of Significant Water Resources in the Upper Middle and Lower Vaal WMAs Sta tus Quo Report
Status Quo Report V13 September 2011
xxvii
Table 4.20: Economic Impacts on Blesbokspruit and Klip River (Gauteng) 64
Table 4.21: PES, EIS and REC for UV-J 65
Table 4.22: PES, EIS and REC for UV-K 66
Table 4.23: PES, EIS and REC for UV-L 68
Table 4.24: Economic Impacts on Mooi River up to Confluence with Vaal River (2010) 69
Table 4.25: PES, EIS and REC for UV-L 71
Table 4.26: Economic Impacts on Vaal River from Downstream of Vaal Dam to Outlet of C23L (2010) 71
Table 5.1: PES, EIS and REC for MV-A 75
Table 5.2: Economic Impacts on Renoster River (2010) 76
Table 5.3: PES, EIS and REC for MV-B 77
Table 5.4: Economic Impacts on Vals River (2010) 78
Table 5.5: PES, EIS and REC for MV-C 79
Table 5.6: Economic Impacts on Schoonspruit and Koekemoerspruit (2010) 80
Table 5.7: PES, EIS and REC for MV-D1 82
Table 5.8: Economic Impacts on Sand River (2010) 82
Table 5.9: PES, EIS and REC for MV-D2 83
Table 5.10: PES, EIS and REC for MV-E1 85
Table 5.11: Economic Impacts on the Upper Vet River (2010) 86
Table 5.12: PES, EIS and REC for MV-E2 87
Table 5.13: Economic Impacts on Lower Vet River below the Erfenis Dam (2010) 88
Table 5.14: PES, EIS and REC for MV-F 89
Table 5.15: Economic Impacts on Vaal River C24B to Bloemhof Dam (2010) 90
Table 6.1: PES, EIS and REC for LV-A1 93
Table 6.2: Economic Impacts on the Hartswater River 94
Table 6.3: PES, EIS and REC for LV-A2 95
Table 6.4: PES, EIS and REC for LV-A3 96
Table 6.5: PES, EIS and REC for LV-A4 98
Table 6.6: PES, EIS and REC for LV-B 100
Table 6.7: Economic Impacts on Vaal River Downstream of Bloemhof to Douglas (2010) 100
Table 7.1: Summary of the desktop biophysical nodes and EWR sites with a High EI 104
Classification of Significant Water Resources in the Upper Middle and Lower Vaal WMAs Sta tus Quo Report
Status Quo Report V13 September 2011
xxviii
Table 7.2: The Upper Vaal WMA (2010) 106
Table 7.3: The Middle Vaal WMA (2010) 107
Table 7.4: The Lower Vaal WMA (2010) 107
LIST OF FIGURES
Figure 1.1: Location Map of the Vaal River System and linked sub-systems ............................................. 4
Figure 2.1: Irrigation Budget Structure ......................................................................................................16
Figure 2.2: Multipliers and Turnover .........................................................................................................19
Figure 2.3: Schematic representation of the WIM .....................................................................................21
Figure 2.4: Schematic representation of the PIM ......................................................................................22
Figure 4.1: Location of Zuurbekom dolomitic aquifer ................................................................................73
Figure 4.2: Google Earth image of Zuurbekom area ................................................................................74
Figure 5.1: Location of Schoonspruit dolomitic compartment ...................................................................91
Figure 6.1: Extent of the Lichtenburg compartment ................................................................................102
Classification of Significant Water Resources in the Upper Middle and Lower Vaal WMAs Sta tus Quo Report
Status Quo Report V13 September 2011
xxix
ABBREVIATIONS
Acronym Meaning AOA Annual Operating Analysis BBM Building Block Methodology COMBUD Computer Based Budgets CMA Catchment Management Agency CMS Catchment Management Strategy CV Coefficient of Variability DC Demand Centre D: NWRP Directorate: National Water Resource Planning D: WRPS Directorate: Water Resource Planning Systems D: RDM Directorate: Resource Directed Measures DRM Desktop Reserve Model DSC Dead Storage Capacity DWA Department of Water Affairs EC Ecological Category EGSA Ecosystem Goods, Services and Attributes EI Environmental Importance EIS Ecological Importance and Sensitivity ER Ecological Reserve ESBC Ecological Sustainability Base Configuration ESKOM Electricity Supply Commission EWR Ecological Water Requirements FSL Full Supply Level GDP Gross Domestic Product GFSC Gross Full Supply Capacity GGP Gross Geographic Product HFSR Habitat Flow Stressor Response HFY Historic Firm Yield ISP Internal Strategic Perspective IUA Integrated Unit of Analysis IVRS Integrated Vaal River System IWQMP Integrated Water Quality Management Plan IWRM Integrated Water Resource Management LIM Limnophilic Fish Species LHDA Lesotho Highlands Development Authority LHWP Lesotho Highlands Water Project LSR Large Semi-rheophilic Fish Species LV Lower Vaal MAE Mean Annual Evaporation MAP Mean Annual Precipitation MAR Mean Annual Runoff mbgl Metres below ground level MC Management Class MD Municipal District MOL Minimum Operating Level MVI Marginal Vegetation Macroinvertebrate MV Middle Vaal NFEPA National Freshwater Ecological Priority Areas NFSC Net Full Supply Capacity NWA National Water Act
Classification of Significant Water Resources in the Upper Middle and Lower Vaal WMAs Sta tus Quo Report
Status Quo Report V13 September 2011
xxx
Acronym Meaning NWRS National Water Resources Strategy PES Present Ecological State PIM Production Industry Model REC Recommended Ecological Category RU Resource Unit RWQO Resource Water Quality Objectives SAFRIM South African Inter-industry Model SAM Social Accounting Matrix SCI Socio-Cultural Importance SD Standard Deviation SQ Sub-Quaternary TDS Total Dissolved Solids UV Upper Vaal VRESAP Vaal River Eastern Sub-system Augmentation Project VRESS Vaal River Eastern Sub-system VRSAU Vaal River System Analysis Update WDM Water Demand Management WC Water Conservation WIM Water Impact Model WMA Water Management Area WRC Water Research Commission WRCS Water Resource Classification System WRPM Water Resource Planning Model WRSAS Water Resource Situation Assessment Study WRSM2000 Water Resources Simulation Model 2000 WRYM Water Resource Yield Model WUA Water User Association

Classification of Significant Water Resources in the Upper Middle and Lower Vaal WMAs Sta tus Quo Report
Status Quo Report V13 September 2011
1
Classification of Significant Water Resources (River, Wetlands, Groundwater and Lakes) in the Upper, Middle and Lower Vaal
Water Management Areas (WMA) 8, 9, 10
Status Quo Report
1 INTRODUCTION
1.1 PURPOSE OF THE STUDY
This report describes the status quo assessments carried out by the appointed Professional Service Provider
(PSP) for undertaking the Classification of Significant Water Resources (River, Wetlands, Groundwater and
Lakes) in the Upper, Middle and Lower Vaal Water Management Areas (WMA) 8,9,10 Study. The study was
commissioned by the Chief Directorate: Resource Directed Measures of the Department of Water Affairs (DWA)
in October 2010 and the main objective of the study is to determine the Management Class (MC) of the
significant water resources in the three Vaal WMAs over a period of 24 months.
The Water Resources Classification System (WRCS), which is required by the National Water Act (Act 36 of
1998), provides a set of guidelines and procedures for determining different classes of water resources. The
WRCS prescribes a consultative process to classify water resources (Classification Process) to help facilitate a
balance between the protection and use of the nation’s water resources. The outcome of the Classification
Process will be the approval of the Management Class (MC) by the Minister or her delegated authority for every
significant water resource (river, estuary, wetland and aquifer) which will be binding on all authorities or
institutions when exercising any power, or performing any duty under the National Water Act (NWA). The MC
outlines those attributes that the Department and society require of different water resources. The 7 step
process proposed by the WRCS (DWAF, 2007) is described in Figure D-1 of Appendix D. The determination of
the status quo, which is the subject of this document, was addressed in Steps 1, 2 and 3a.
As the project area includes the most important economic region of the country, data are collected and analysed
in terms of the three Vaal Water Management Areas as well as the tributaries and main stem areas in the
project area. The description of the study area is given in Section 1.2, which includes a synopsis of the water
quality situation.
Classification of Significant Water Resources in the Upper Middle and Lower Vaal WMAs Sta tus Quo Report
Status Quo Report V13 September 2011
2
1.2 STUDY AREA
The study area comprises of the water resource of the Vaal River System which includes the catchments of the
Upper, Middle and the Lower Vaal Water Management Areas (see Figures A-1 to A-3 of Appendix A). Other
sub-systems that are linked to the Vaal River System are shown in Figure 1.1 on Page 4. The supporting sub-
systems will form part of the water resource system analysis (either directly or indirectly) to ensure the
Management Class is determined in an integrated manner. A detailed description of the Integrated Vaal River
System (IVRS) is provided in Appendix E. It is important to note that the Riet-Modder catchment, which forms
part of the Orange River WMA, is not included in the study area.
The Vaal River is one of the most highly utilised rivers in the country and this has resulted in a moderate to
severe degradation of the ecological state in most sections of the main river and its tributaries. Isolated
important areas do occur however centered around, for example, reserves, wetlands and less disturbed areas.
The Vaal River is one of South Africa's largest rivers, and due to the scarceness of such river types in SA, this
makes it important in its own right, irrespective of its state. Protection of these resources in some acceptable
form, even as a heavily utilised river, is important. It must also be noted that Barbus kimberleyensis, the
largemouth yellow fish, occurs in the Vaal River. This fish is Red Data listed (IUCN 2010) and is also a very
popular fly fishing target. South Africa, as a signatory of the Convention of Biodiversity (CBD, 1992), is obliged
to determine strategies to maintain and protect its biodiversity. Furthermore, the Vaal River forms a centre part
of one of South Africa's few World Heritage sites, the Vredefort Dome (UNESCO 2005). Pollution of the Vaal
River and unstructured development might affect the status of the World Heritage site which could result in
severe socio-economic problems (job losses amongst others).
Water quality problems, decreased flows (lower Vaal River) and increased flows (higher than natural especially
in the dry season resulting in an aseasonal flow regime) are the major problems threatening the health of the
Vaal System.
Water quality status in the Upper Vaal catchment is impacted on by discharges from gold mines, seepages from
tailings dams, discharges from industry directly to the river, urban runoff and discharges from the large number
of sewage treatment plants located in the urban areas. The return flows from sewage treatment plants have
resulted in the flows in many of the river systems exceeding the natural flows. Coal mining is located in the
Waterval and Grootdraai Dam catchments in the upper reaches of the Vaal River, and along the banks of the
Vaal Barrage below Vaal Dam (ORASECOM, 2007; cited in Scherman, 2010).
Although the Middle Vaal is less urbanized, discharges from mining operations and sewage treatment facilities
have a notable influence on the water balance. The predominant land use in the Lower Vaal is agriculture, with
extensive irrigation schemes located on the Vaal River and along the Harts River (ORASECOM, 2007; cited in
Scherman 2010). The following points summarize water quality status of the Vaal River (Scherman, 2010):
• The usage of water in the Vaal River is impacted by high levels of salinity and related macro-ions
particularly downstream of Vaal Dam.
• Eutrophication due to high nutrient levels is a key issue in the Vaal River, resulting in algal blooms and
growth of water hyacinth. The algae resulting from eutrophication has led to odour and colour problems
Classification of Significant Water Resources in the Upper Middle and Lower Vaal WMAs Sta tus Quo Report
Status Quo Report V13 September 2011
3
in the intake water to water treatment plants which are not geared for dealing with eutrophic waters.
• Microbiological pollution is an emerging concern.
• While sections of the upper part of the Vaal catchment have water of a good quality, the areas of
concern include the Vaal Barrage and Lower Vaal River downstream of Harts River confluence.
• Discharges from coal and gold mining, industrial discharges and decant from mines post closure, cause
water quality problems in the Vaal system.
• Along the main stem of the Vaal organics has been raised as an issue by the water boards, with
monitoring programmes identifying increases in Dissolved Organic Carbon (DOC) in raw intake water to
the water treatment plants.
• Although broad, this overview is congruent with that of the Vaal Integrated Water Quality Management
Plan produced in 2009 (DWAF, 2009e), the Reserve studies recently undertaken and the findings of the
Planning Level Review of Water Quality in South Africa currently being completed (Jay, DWA, pers.
comm., July 2011).
1.3 PURPOSE AND LAYOUT OF THE REPORT
The purpose of the Status Quo Report is to define the current status of the water resources in the study area in
terms of the water resource systems, the ecological characteristics, the socio-economic conditions and the
community well-being. Section 2 of the report describes the multi-disciplinary methodologies adopted for the
status quo assessments. Section 3 provides information on the delineated Integrated Units of Analysis (IUAs).
The findings of the status quo assessments for the Upper, Middle and Lower Vaal WMAs are described in
Sections 4, 5 and 6 respectively for each IUA. The status quo results are summarised in Section 7, while the
references are listed in Section 8.
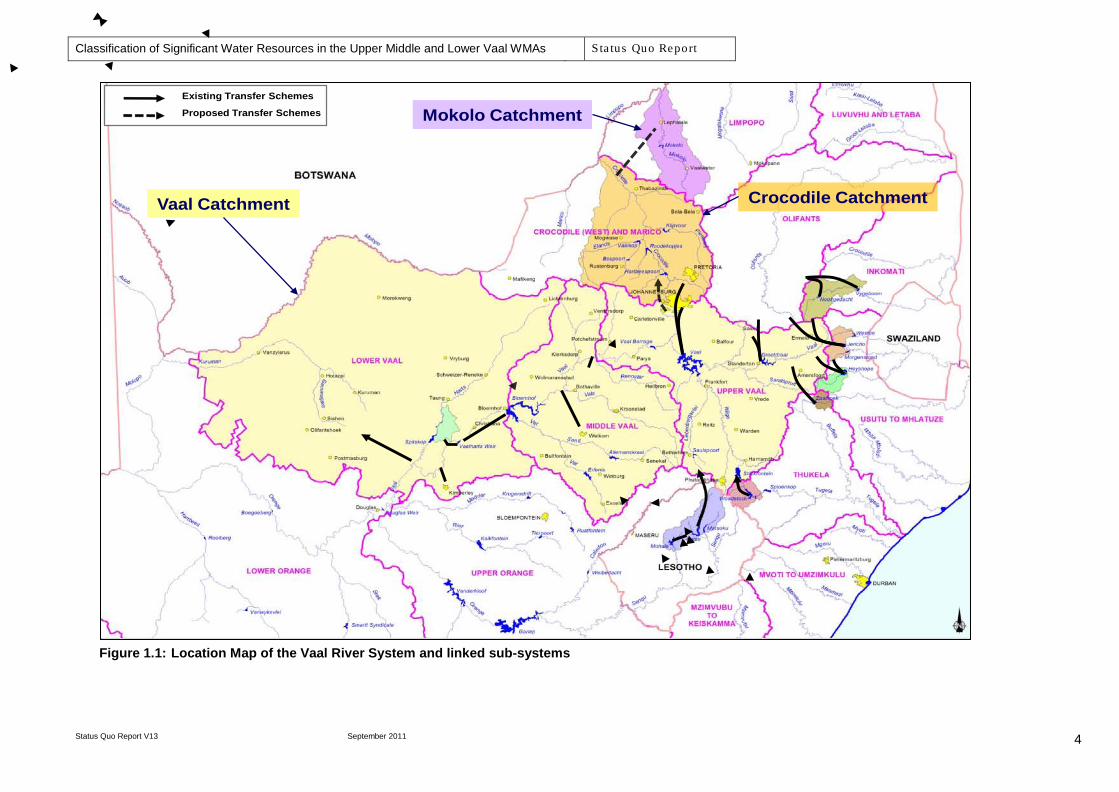
Classification of Significant Water Resources in the Upper Middle and Lower Vaal WMAs Sta tus Quo Report
Status Quo Report V13 September 2011
4
Figure 1.1: Location Map of the Vaal River System and linked sub-systems
Existing Transfer Schemes
Proposed Transfer Schemes Mokolo Catchment
Crocodile CatchmentVaal Catchment

Classification of Significant Water Resources in the Upper Middle and Lower Vaal WMAs Sta tus Quo Report
Status Quo Report V13 September 2011
5
2 METHODOLOGY ADOPTED FOR STATUS QUO ASSESSMENT
2.1 WATER RESOURCES ASSESSMENT
2.1.1 Decision support system (DSS) for Integrated Vaal River System
Due to the highly developed nature of the Integrated Vaal River System (IVRS) and the various inter-basin
transfers that exist in the system, operating rules were developed that regulate when and how much water is
transferred. Salinity (Total Dissolved Solids (TDS)) is an important driver of the operation of the Vaal River
System affecting the flow in the river reach downstream of Vaal Dam. In the past the application of an operating
rule has been implemented to dilute the saline water (discharged from the mines, returned by the numerous
waste water treatment works and washed off from the highly developed urbanized catchments) through
releases from Vaal Dam. The management and implementation of the operating rules of the inter-basin
transfers and the dilution rule are undertaken by the application of the Water Resource Planning Model
(WRPM). The WRPM will subsequently be used as the Decision Support System (DSS) for this study. The
WRPM schematic representation of the IVRS is included in Appendix C (Figures C-1 to C-13).
2.1.2 System components
As mentioned in Section 1.2 the Vaal River is one of the most highly utilised rivers in the country. The Vaal
River System is also a very complex system consisting of many large dams, pumping stations, pipelines and
tunnels transferring water over long distances. The WRPM configuration of the IVRS includes the modelling of
the following system components:
• 205 incremental catchments each with its own natural hydrology time series record (*.INC file) and
representative catchment rainfall time series record (*.RAN file);
• 40 major storage dams;
• 179 minor dams (also referred to as dummy dams with each dummy dam representing a group of small
dams within a specified incremental catchment);
• 14 major transfer links;
• 358 Demand Centres (DC) representing the water requirements of urban, industrial and irrigation users.
Sasol and Eskom are considered as strategic water users and they require that water be supplied to
them at a very high assurance level (a 99.5% exceedance probability level or 0.5% risk of failure is
associated with these users). Sasol’s Secunda and Sasolburg complexes receive water from the Vaal
River System. The IVRS also supplies water to thirteen Eskom Power Stations (PSs) which include the
new Kusile PS which is currently being constructed. Bulk water suppliers Rand Water, Midvaal Water
Company and Sedibeng Water supply water to numerous towns, industries and mines. Irrigation water
Classification of Significant Water Resources in the Upper Middle and Lower Vaal WMAs Sta tus Quo Report
Status Quo Report V13 September 2011
6
users were grouped together based on their location and source of water supply. Approximately 126
irrigation areas are being modelled as DCs within the IVRS.
2.1.3 Hydrological database
The WRPM configuration of the IVRS includes the hydrological database resulting from the Vaal River System
Analysis Update (VRSAU) Study (DWA, 1999). The hydrology for sub-catchments within the Komati, Usutu,
Thukela and Senqu river basins was also updated as part of the VRSAU study. The VRSAU hydrology covers
the period October 1920 to September 1995 (i.e. a period of 75 years). It is important to note that the
hydrological analyses of the VRSAU study were not necessarily undertaken at quaternary catchment level as
the focus was on the most representative modelling of relevant sub-catchments. The strategy adopted for the
Annual Operating Analysis (AOA) of the IVRS is to continuously update and enhance the WRPM configuration
and database as new information becomes available. Updated hydrology of the Thukela and Schoonspruit
River catchments were subsequently included in the WRPM database. The updated hydrology of the Upper
Waterval catchment resulting from the most recent BKS study undertaken for the DWA (DWAF, 2005a) was
included in the WRPM database as part of the Comprehensive Reserve Determination Study (DWA, 2010d).
2.1.4 Hydrology for biophysical nodes
As mentioned in Section 2.1.2 the hydrological analyses of the VRSAU study were not necessarily undertaken
at quaternary catchment level as the focus was on the most representative modelling of specific sub-catchments
of interest. Various catchment development components (e.g. small dams, diffuse and controlled water use)
within these larger sub-catchments were also grouped together to simplify the WRPM configuration.
As part of the Comprehensive Reserve Determination Study (DWA, 2010d) it was necessary to derive natural
runoff time series data for each quaternary catchment located in the Vaal River catchment upstream of Douglas
Weir. Natural runoff information was also required for each of the selected Ecological Water Requirement
(EWR) sites. It was, therefore, firstly necessary to disaggregate all the lumped catchment runoff data to obtain
incremental quaternary catchment information. Secondly relevant incremental quaternary catchment
information had to be combined to provide a natural Mean Annual Runoff (MAR) and natural runoff time series
that are representative of each selected EWR site. To this end, it was necessary to establish an acceptable
disaggregation methodology utilising the available sources of quaternary catchment information as benchmarks.
The WR90 (Water Resources 1990) study was the first national study initiated by the Water Research
Commission (WRC) which provided comprehensive hydrological information at quaternary catchment level for
the entire country. Since the WR90 study (WRC, 1990) only included information up to the year 1989, the need
for updating this database was identified and culminated in the commissioning of the WR2005 study. The final
results of the WR2005 Study were not available at the time when assessments were done for the Reserve
Study and it was decided to use the WR90 database as source of information at quaternary catchment level.
Classification of Significant Water Resources in the Upper Middle and Lower Vaal WMAs Sta tus Quo Report
Status Quo Report V13 September 2011
7
The following methodology was adopted for the disaggregation process:
• The quaternary catchments which are situated within the lumped catchment were identified;
• The total natural WR90 MAR was calculated for the lumped catchment by adding up all the incremental
natural WR90 MARs of the relevant quaternary catchments;
• The incremental natural WR90 MARs of the relevant quaternary catchments were then expressed as a
ratio of the calculated total natural WR90 MAR;
• The calculated WR90 MAR ratios were applied to the lumped catchment’s natural MAR resulting from
the VRSAU study to obtain incremental natural VRSAU MARs for each of the relevant quaternary
catchments;
• The VRSAU study’s natural runoff time series for the lumped catchment was subsequently scaled by
applying the calculated WR90 MAR ratios to obtain an incremental natural runoff time series for each of
the relevant quaternary catchments.
The following approach was adopted for the determination of a natural VRSAU MAR and a total natural runoff
time series at each of the selected EWR sites:
• The catchment area of the EWR site was determined;
• The quaternary catchments upstream of the EWR site were identified;
• The incremental natural VRSAU MARs and incremental natural VRSAU runoff time series of the
relevant quaternary catchments were then added to obtain information that is representative of the EWR
site;
• In the event where the location of the EWR site was not at the outlet of a quaternary catchment, the
portion of the quaternary catchment area located upstream of the EWR site was determined and the
incremental natural VRSAU runoff time series of the quaternary catchment was scaled according to the
catchment area ratio.
In addition to the key biophysical nodes (comprising of the EWR sites selected as part of the Reserve Study),
the ecological team identified biophysical nodes within the project area where no or limited ecological data
existed (refer to Section 2.2 below). Since hydrological data were required for these additional nodes, the
methodology described above was applied for the determination of the natural MAR and corresponding time
series data for each of the biophysical nodes.
The gross catchment areas and natural MARs of all the biophysical nodes (including the EWR sites selected as
part of the Reserve Study) are summarised in Table G-1 of Appendix G.
Classification of Significant Water Resources in the Upper Middle and Lower Vaal WMAs Sta tus Quo Report
Status Quo Report V13 September 2011
8
2.1.5 Catchment development and water use
The system configuration of the IVRS, as defined in the data files of the WRPM model, are presented as
schematic diagrams in Appendix C. The land use information currently included in the WRPM configuration is
mostly based on data obtained as part of the VRSAU Study. As mentioned in Section 2.1.4 the various
catchment development components (e.g. small dams, diffuse and controlled water use) were also grouped
together to represent activities occurring within the larger sub-catchments modelled as part of the simplified
WRPM configuration. Refinements were, however, made to the system configuration to enable modelling of the
selected EWR sites for the purposes of the Comprehensive Reserve Determination Study (DWA, 2010d). It is
important to note that various assumptions had to be made in view of these refinements which may impact on
the accuracy of simulation results. The locations of the selected EWR sites are shown on the schematic
diagrams presented in Appendix C.
The resolution of the WRPM configuration does not allow for the explicit modelling of the additional biophysical
nodes described in Section 2.2. Although natural hydrology could be derived for these nodes, it will not be
possible to simulate present day conditions at these sites. An alternative strategy will be followed for the
assessment of current development conditions. Land use information to be obtained from the Validation and
Verification studies will be used for this purpose.
The WRPM database includes growing water requirements up to the year 2030. Since the Integrated Vaal River
System (IVRS) is analysed on an annual basis, the water requirement projections of the major bulk water
suppliers (Rand Water, Midvaal Water Company and Sedibeng Water), the strategic water user Eskom, as well
as large industrial users such as Sasol and Mittal Steel (previously known as Iscor), are also updated annually.
The most recent water requirement projections of the above-mentioned users (revised as part of the 2011/2012
Annual Operating Analysis) will be used for the scenario analyses to be undertaken as part of this study and are
summarised in Table F-1 of Appendix F.
The following is a brief description of the sources of information adopted for the water requirement components
included in Table F-1:
• Rand Water Supply Area: The adopted water requirement scenario for the Rand Water (RW) supply
area was compiled based on the Phase 2 Reconciliation Strategy High Population Demand Projection
without Water Conservation and Water Demand Management (WC/WDM) initiatives as revised in
October 2010.
• Eskom: Eskom provided three alternative water requirement scenarios for each existing and planned
power station in April 2011. The Base Demand scenario was recommended for planning purposes.
• Sasol Secunda: The April 2011 projections provided by Sasol were adopted.
• Sasol Sasolburg: The May 2011 projections provided by Sasol were adopted.
Classification of Significant Water Resources in the Upper Middle and Lower Vaal WMAs Sta tus Quo Report
Status Quo Report V13 September 2011
9
• Mittal Steel: A revised water requirement projection was obtained from Mittal Steel on 20 July 2010 and
was adopted for analysis.
• Sedibeng Water: Updated information was received in June 2011 from Sedibeng.
• Midvaal Water Company (WC): The April 2011 projection provided by Midvaal WC was adopted.
• Other users: Water requirements for most towns were based on the NWRS projections and in cases
where data were available the All Town Reconciliation Strategy Study scenarios were adopted.
• Irrigation: The irrigation water requirements of the Vaal River System that were adopted for the
2011/2012 Annual Operating Analysis were applied. These estimates and the portion deemed to be
unlawful originated from the Vaal River System: Large Bulk Water Supply Reconciliation Strategy Study
(DWAF, 2008a).
Table F-2 included in Appendix F provides detailed information on individual water users and the information is
presented within the context of the various sub-systems of the IVRS. The detailed water requirement
information can be referenced as part of the status quo assessments of the identified Integrated Units of
Analysis (refer to Sections 4, 5 and 6).
2.2 SELECTION OF BIOPHYSICAL NODES
The key biophysical nodes are the Ecological Water Requirement (EWR) sites and the selection process of
these sites is documented in the recent Reserve studies (DWAF, 2008e; DWAF 2009a and b). The location of
the EWR sites however were focussed on the main stem and key tributaries, i.e. the areas where there are
water resource issues and where operational management of the system can be implemented. However, this
leaves large sections of the catchment unaccounted for.
The process described in the Classification guideline (which refers to the Desktop EcoClassification and the
identification of hotspots (Louw & Huggins, 2007) was used as an initial step to identify additional nodes within
the project area where no or limited ecological data existed. Biophysical nodes were selected at the outlet of
any area with a High or Very High Environmental Importance (EI). During the Desktop EcoClassification
process of the Reserve studies for the Upper (DWAF, 2008f), Middle (DWAF, 2009c) and Lower (DWAF, 2009d) Vaal WMAs, the Ecological Importance (EI) was evaluated by means of using a matrix to determine the
rating, and as interpretation can be subjective, this was not necessarily consistent. To ensure consistency
during the evaluation of these nodes the Desktop EcoClassification results produced during the Reserve studies
for the Upper, Middle and Lower Vaal WMAs were summarised in Excel format and formulas were used to
consistently recalculate the EI for all quaternary catchments.
Furthermore, the very recent National Freshwater Ecological Priority Areas (NFEPA) (CSIR, 2010) identified in
the project area were incorporated and a node was placed in every NFEPA area.
Classification of Significant Water Resources in the Upper Middle and Lower Vaal WMAs Sta tus Quo Report
Status Quo Report V13 September 2011
10
After the above-mentioned information was mapped, the following became obvious:
• The Desktop EcoClassification approach was relevant for the main rivers in the quaternary catchments.
Many of the biophysical nodes selected were not on the main rivers and the PES and Ecological
Importance and Sensitivity (EIS) allocated to the quaternary catchment was not relevant for sub-
quaternary (SQ) reaches.
• The use of the Environmental Importance evaluations can lead to a selection of only the ecological
important areas, thereby leaving large sections of the catchment unaccounted for. Another approach
could be to use the Water Resource Use Importance evaluation but the scale of this assessment is
even larger than quaternary catchment level and information on sub-quaternary level was not available.
• NFEPA: No specific information is yet available on the reasoning for the selection of NFEPAs in the
study area. DWA therefore indicated that the NFEPAs should be considered and used only where
appropriate (Naidoo, personal commmunication). Initial attempts to verify the NFEPAs using DWA
methodologies showed that many of the NFEPAs result in a low or moderate EIS. All NFEPAs would,
therefore, have to be verified according to Department of Water Affairs (DWA) approaches to determine
whether these additional nodes are warranted.
Therefore, prior to the final selection of biophysical nodes, the following was undertaken:
• Nodes were included in areas not covered by the original nodes to ensure a realistic spread of the
nodes. This follows the principles set out in the guideline (Brown et al 2006) where nodes where
required at the end of every tributary and at end of any change in operation of the system. This
approach can however not be followed as exactly recommended due to the cost associated with this.
Also, results of developments since 2006 (such as the current study on PES and EI-ES) will also impact
on the 2006 recommended approach and allow one to streamline the approach.
• NFEPAs that did not coincide with any of the existing selected nodes based on the Desktop
EcoClassification, or selected to represent unaccounted catchment areas, were verified (see
Section 2.1.4 for method description). Reasoning obtained from the verification process is provided in
all accompanying data.
The outcome of this process was the selection of 115 biophysical nodes in the project area which include the
EWR sites.
A very important lesson learnt during this process was that due cognisance to a fair (nodes representative of all
Ecological Categories and ensuring that High importance areas were included) selection of biophysical nodes
cannot be made without the results of the current ongoing PES and Ecological Importance (EI) – Ecological
Sensitivity (ES) DWA/WRC study being undertaken for the whole country. During this study, SQ reaches will be
identified and the PES and EI-ES identified for each SQ reach. To give an idea of the number of SQ reaches –
the Vaal catchment has 9 secondary catchments and one of those (C1) has 270 SQ reaches, i.e. a requirement
of 270 assessments. This would ensure excellent coverage of the catchment. Within the PES and EI-ES study,
the Vaal assessment has not been initiated and is last on the priority list. This information was therefore not

Classification of Significant Water Resources in the Upper Middle and Lower Vaal WMAs Sta tus Quo Report
Status Quo Report V13 September 2011
11
available.
All the biophysical nodes, as initially selected, were plotted on the maps including SQ reaches. SQ reaches are
delineated on the basis of hydrological changes, i.e. at tributary confluences and was provided by DWA, RQS
(these are the same reaches that would be utilised for the Vaal assessment of the PES and EI ES study when it
is initiated). Each of the SQ reaches represents a Resource Unit, i.e. the length of river for which a status
assessment and EWR assessment will be valid for.
The naming of the biophysical nodes did not follow a consistent process. The reason for this was that many
nodes are actual sites that already exist in various databases and it would be preferably for purposes of cross-
referencing not to change the names. Any new node that does not exist in any other database was called VC
(Vaal Classification) and a number. It must also be noted that some nodes are named after a quaternary
catchment, e.g. C13B. This node represents a point in that catchment which is not representative of the
quaternary catchment area but of the sub-quaternary reach area within which the actual node is placed.
Information on the physical characteristics and locality of the nodes is provided in Table G-1 of Appendix G.
2.3 ECOCLASSIFICATION
This report focuses on the biophysical nodes (other than EWR sites) and the approach used. The results are
provided in an Excel spreadsheet per Integrated Unit of Analysis (IUA). Every IUA spreadsheet contains the
following worksheets:
• Fact sheet (Table 2.1): Basic information regarding impacts on the nodes within the IUA. There is a
separate fact sheet for each node identified by the name of the node.
• PES: The PES results of all the nodes within the IUA.
• EIS: The EIS results of all the nodes within the IUA.
• REC: Essentially a summary of all the previous information generated in the spreadsheet and providing
the REC.
• Goods and Services: Summarised for each node.
It must be noted that EcoClassification includes steps other than just the determination of the status quo (PES)
and that the Ecological and Environmental Importance and Recommended Ecological Category have also
already been determined and the results provided in this report.
The Desktop EcoClassification approach (Kleynhans and Louw, 2007) was used for all the biophysical nodes
which are nodes other than the EWR sites. To distinguish, these biophysical nodes will be referred to as the
desktop biophysical nodes. During the recent Reserve studies on the three Vaal Water Management Areas
(WMA) (DWA, 2010a-c), the EcoClassification, Level 4 (Kleynhans and Louw, 2007) method was applied for
all EWR sites. Additional to this, EWR studies at detailed level were also undertaken on the Schoonspruit
(DWAF, 2006) and Waterval (DWAF, 2005b) Rivers.
For all the nodes, apart from those nodes selected ONLY because they were identified as a NFEPA, the
following process was followed:
Classification of Significant Water Resources in the Upper Middle and Lower Vaal WMAs Sta tus Quo Report
Status Quo Report V13 September 2011
12
• A fact sheet (see Table 2.1 on page 14) was completed which identified the impacts that are present in
the area. This information is used to inform the assessment of the Present Ecological State. This
information was mostly derived from Google Earth, as well as available information collected from
personal and professional experience. The fact sheet is available as a worksheet in an Excel
spreadsheet compiled for every IUA. There is a separate fact sheet for each node identified by the
name of the node.
• Google Earth image extracts were made and inserted in the fact sheet. A description of each image is
provided on the fact sheet. Representative images were selected of specific impacts (such as mines) or
of areas that represent a certain portion of the SQ reach. Street view photos were also downloaded
from Google Earth as well as photos taken during surveys and included in the fact sheet.
• The PES was determined using the basic EcoQuat model (Kleynhans and Louw, 2007) which requires
the following minimum tools:
Drivers
- bed modification,
: Quick Habitat Integrity: The metrics used are
- flow modification,
- inundation,
- riparian bank condition, and
- water quality modification.
Each metric is rated between 0 – 5 with 5 indicating a severe change from natural.
Responses
- fish,
: The response of the instream and riparian biota to the habitat changes are
derived for
- aquatic invertebrate and
- riparian vegetation rating.
These ratings are based on a 0 – 5 scale with 0 implying an A Ecological Category and 5 a F
Ecological Category.
• The model calculates the Instream Ecological Category and the EcoStatus. A confidence
between 1 – 5 (5 = very high confidence) is also supplied.
• The PES was assessed on one Excel worksheet for each node. The methods are well
documented in Kleynhans and Louw (2007) and the model is imbedded in the Excel
spreadsheet which will be made available as part of the final deliverable.
• A desktop water quality assessment was therefore conducted by using all available information,
e.g. the IWQMP and Vaal Reserve documents, and assessing the extent of land uses which
would impact on water quality using Google Earth and knowledge of the catchment from the
specialist team. The approach is therefore desktop and confidence ranges from low to high,
pending information available. The 0-5 rating relate to the A-F Ecological Categories.
• The EIS was calculated using a refined (from Kleynhans and Louw, 2007) EIS model which was
developed during 2010 by Dr Kleynhans. This refined model is better suited to address seasonal and

Classification of Significant Water Resources in the Upper Middle and Lower Vaal WMAs Sta tus Quo Report
Status Quo Report V13 September 2011
13
ephemeral systems and the following metrics (rated from 0 to 4 with 4 indicating Very High importance)
are addressed:
Instream biota: Rare & endangered
Instream biota: Unique
Instream biota: Intolerant to no flow
Instream biota: Intolerant physico-chemical changes
Instream biota: Species/taxon richness
Instream habitat: Diversity of types and features
Instream habitat: Refugia and critical
Instream habitat: Sensitivity to flow changes
Instream habitat: Migration route
Riparian/wetland biota: Rare and endangered
Riparian/wetland biota: Unique
Riparian/wetland biota: Intolerant
Riparian/wetland biota: Species/taxon richness
Riparian/wetland habitat: Diversity of types and features
Riparian/wetland habitat: Refugia and critical
Riparian/wetland habitat: Sensitivity to flow changes
Riparian/wetland habitat: Migration corridor
National parks, wilderness areas, reserves, heritage sites, natural areas
Three additional columns were added to the EIS model. The first column indicated whether the node lies
in a NFEPA (y or n). The second column indicates whether this assessment confirmed the NFEPA and a
comment is provided in the last column. Note that although many of the NFEPA areas were not
confirmed, they were still retained as a viable node if the NFEPA area represented a specific part of the
catchment or physical surveys were undertaken in these areas and important information was available.
• REC worksheet is provided which includes the following:
- Column C & D
-
: PES score and Ecological Category copied from the PES sheet.
Column E
-
: PES metric that score a three or higher. This is summarised from the PES sheet
Column F
-
: Copy of the impacts from the fact sheet relevant for this SQ only
Column G & H
-
: Indicates whether the key (dominating) impacts are flow or non-flow
related. This is important as it informs the setting of objectives and whether improvement, if
required, is possible with adjustments of flow.
Column I and J: Copy of the IES score and EIS evaluation.
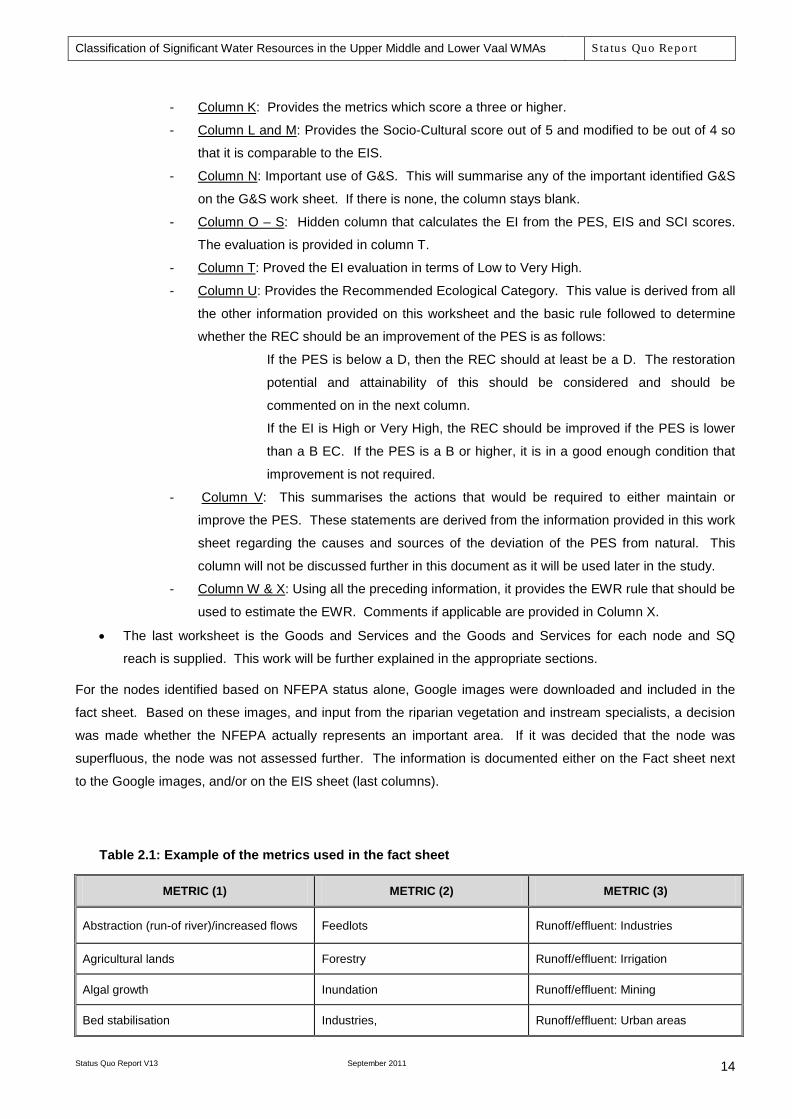
Classification of Significant Water Resources in the Upper Middle and Lower Vaal WMAs Sta tus Quo Report
Status Quo Report V13 September 2011
14
- Column K
-
: Provides the metrics which score a three or higher.
Column L and M
-
: Provides the Socio-Cultural score out of 5 and modified to be out of 4 so
that it is comparable to the EIS.
Column N
-
: Important use of G&S. This will summarise any of the important identified G&S
on the G&S work sheet. If there is none, the column stays blank.
Column O – S
-
: Hidden column that calculates the EI from the PES, EIS and SCI scores.
The evaluation is provided in column T.
Column T
-
: Proved the EI evaluation in terms of Low to Very High.
Column U
If the PES is below a D, then the REC should at least be a D. The restoration
potential and attainability of this should be considered and should be
commented on in the next column.
: Provides the Recommended Ecological Category. This value is derived from all
the other information provided on this worksheet and the basic rule followed to determine
whether the REC should be an improvement of the PES is as follows:
If the EI is High or Very High, the REC should be improved if the PES is lower
than a B EC. If the PES is a B or higher, it is in a good enough condition that
improvement is not required.
- Column V
-
: This summarises the actions that would be required to either maintain or
improve the PES. These statements are derived from the information provided in this work
sheet regarding the causes and sources of the deviation of the PES from natural. This
column will not be discussed further in this document as it will be used later in the study.
Column W & X
• The last worksheet is the Goods and Services and the Goods and Services for each node and SQ
reach is supplied. This work will be further explained in the appropriate sections.
: Using all the preceding information, it provides the EWR rule that should be
used to estimate the EWR. Comments if applicable are provided in Column X.
For the nodes identified based on NFEPA status alone, Google images were downloaded and included in the
fact sheet. Based on these images, and input from the riparian vegetation and instream specialists, a decision
was made whether the NFEPA actually represents an important area. If it was decided that the node was
superfluous, the node was not assessed further. The information is documented either on the Fact sheet next
to the Google images, and/or on the EIS sheet (last columns).
Table 2.1: Example of the metrics used in the fact sheet
METRIC (1) METRIC (2) METRIC (3)
Abstraction (run-of river)/increased flows Feedlots Runoff/effluent: Industries
Agricultural lands Forestry Runoff/effluent: Irrigation
Algal growth Inundation Runoff/effluent: Mining
Bed stabilisation Industries, Runoff/effluent: Urban areas
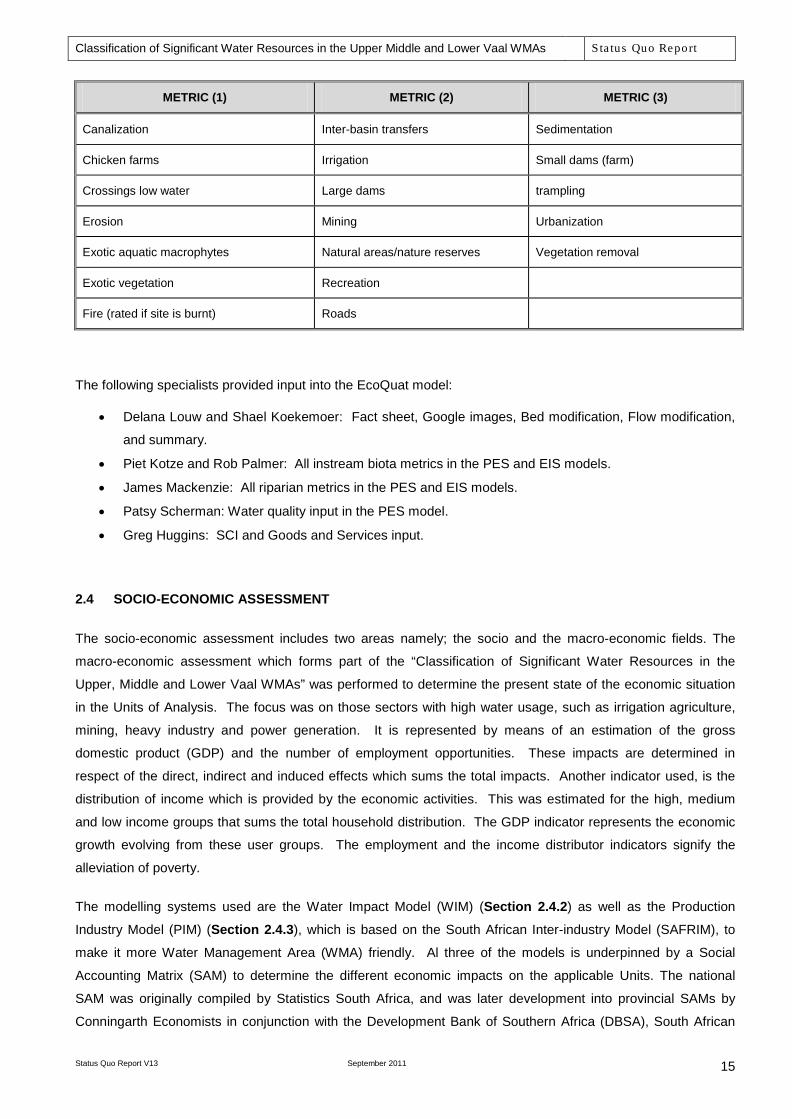
Classification of Significant Water Resources in the Upper Middle and Lower Vaal WMAs Sta tus Quo Report
Status Quo Report V13 September 2011
15
METRIC (1) METRIC (2) METRIC (3)
Canalization Inter-basin transfers Sedimentation
Chicken farms Irrigation Small dams (farm)
Crossings low water Large dams trampling
Erosion Mining Urbanization
Exotic aquatic macrophytes Natural areas/nature reserves Vegetation removal
Exotic vegetation Recreation
Fire (rated if site is burnt) Roads
The following specialists provided input into the EcoQuat model:
• Delana Louw and Shael Koekemoer: Fact sheet, Google images, Bed modification, Flow modification,
and summary.
• Piet Kotze and Rob Palmer: All instream biota metrics in the PES and EIS models.
• James Mackenzie: All riparian metrics in the PES and EIS models.
• Patsy Scherman: Water quality input in the PES model.
• Greg Huggins: SCI and Goods and Services input.
2.4 SOCIO-ECONOMIC ASSESSMENT
The socio-economic assessment includes two areas namely; the socio and the macro-economic fields. The
macro-economic assessment which forms part of the “Classification of Significant Water Resources in the
Upper, Middle and Lower Vaal WMAs” was performed to determine the present state of the economic situation
in the Units of Analysis. The focus was on those sectors with high water usage, such as irrigation agriculture,
mining, heavy industry and power generation. It is represented by means of an estimation of the gross
domestic product (GDP) and the number of employment opportunities. These impacts are determined in
respect of the direct, indirect and induced effects which sums the total impacts. Another indicator used, is the
distribution of income which is provided by the economic activities. This was estimated for the high, medium
and low income groups that sums the total household distribution. The GDP indicator represents the economic
growth evolving from these user groups. The employment and the income distributor indicators signify the
alleviation of poverty.
The modelling systems used are the Water Impact Model (WIM) (Section 2.4.2) as well as the Production
Industry Model (PIM) (Section 2.4.3), which is based on the South African Inter-industry Model (SAFRIM), to
make it more Water Management Area (WMA) friendly. Al three of the models is underpinned by a Social
Accounting Matrix (SAM) to determine the different economic impacts on the applicable Units. The national
SAM was originally compiled by Statistics South Africa, and was later development into provincial SAMs by
Conningarth Economists in conjunction with the Development Bank of Southern Africa (DBSA), South African
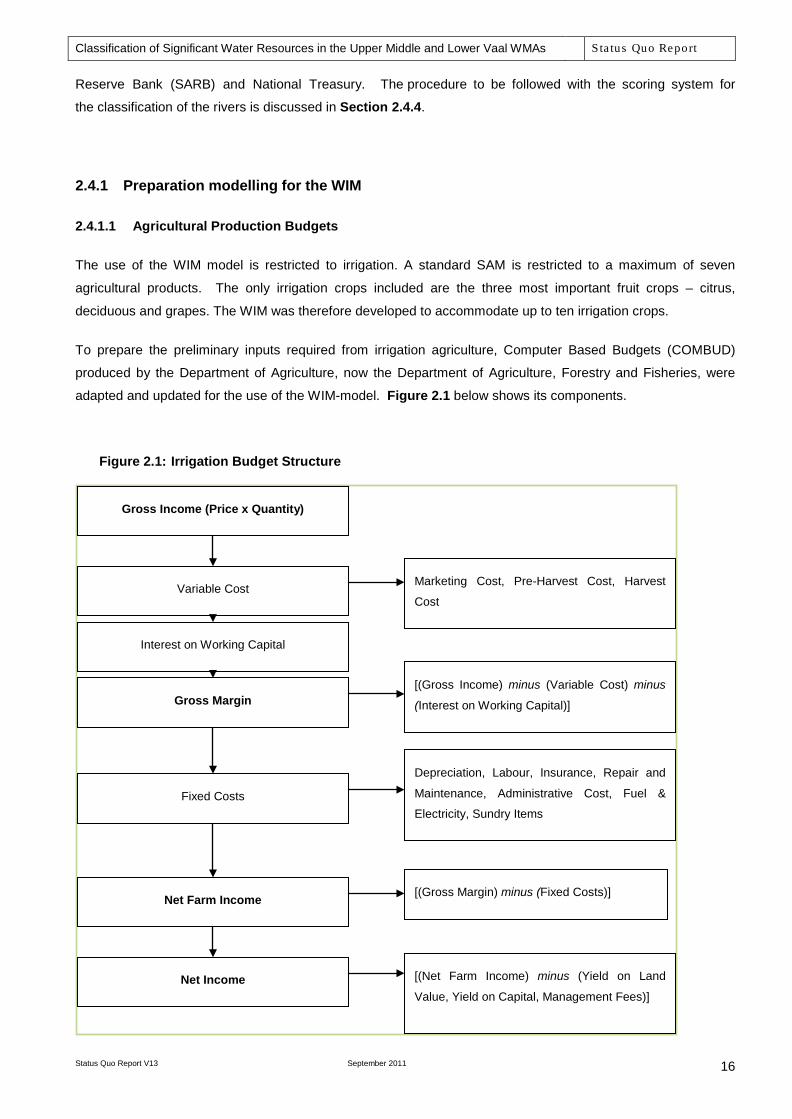
Classification of Significant Water Resources in the Upper Middle and Lower Vaal WMAs Sta tus Quo Report
Status Quo Report V13 September 2011
16
Reserve Bank (SARB) and National Treasury. The procedure to be followed with the scoring system for
the classification of the rivers is discussed in Section 2.4.4.
2.4.1 Preparation modelling for the WIM
2.4.1.1 Agricultural Production Budgets
The use of the WIM model is restricted to irrigation. A standard SAM is restricted to a maximum of seven
agricultural products. The only irrigation crops included are the three most important fruit crops – citrus,
deciduous and grapes. The WIM was therefore developed to accommodate up to ten irrigation crops.
To prepare the preliminary inputs required from irrigation agriculture, Computer Based Budgets (COMBUD)
produced by the Department of Agriculture, now the Department of Agriculture, Forestry and Fisheries, were
adapted and updated for the use of the WIM-model. Figure 2.1 below shows its components.
Figure 2.1: Irrigation Budget Structure
Interest on Working Capital
Marketing Cost, Pre-Harvest Cost, Harvest
Cost
Gross Margin
Depreciation, Labour, Insurance, Repair and
Maintenance, Administrative Cost, Fuel &
Electricity, Sundry Items
Net Farm Income
Net Income
Gross Income (Price x Quantity)
Variable Cost
[(Gross Income) minus (Variable Cost) minus
(Interest on Working Capital)]
Fixed Costs
[(Gross Margin) minus (Fixed Costs)]
[(Net Farm Income) minus (Yield on Land
Value, Yield on Capital, Management Fees)]

Classification of Significant Water Resources in the Upper Middle and Lower Vaal WMAs Sta tus Quo Report
Status Quo Report V13 September 2011
17
In addition to the use of the macro-economic impacts determination, these costs in the budget are allocated to
structures in such a way that it is assigned to the different sectors of the economy as reflected in Table 2.2 below. These are applied to determine the direct, indirect and induced effects.
Table 2.2: Structure of Production Costs
Total costs (Intermediate inputs and labour requirements)
Agriculture
Mining
Manufacturing (Fuel, Fertilizer, Pharmaceuticals and Other)
Electricity
Water
Construction
Trade and accommodation
Transport and communication
Financial and business services
Community services
Salaries and wages: (Skilled, Semi-Skilled and Unskilled)
2.4.1.2 Secondary Inputs for WIM-model
The inputs identified as secondary inputs (refer to list in Table 2.3) were also prepared for the WIM.
Table 2.3: Secondary inputs for WIM
Items Sources
Number of hectares Schoeman and Partners, Loxton and Venn study
Water usage per hectare [m3] Water Resource Yield Model (WRYM)
Tons per hectare Determine by crop budget
Labour requirements per hectare [Numbers] Department of Agriculture
Annual capital requirements per hectare [Rands] Adjusted by Mechanisation Guide, PK Le Roux 2011 and Conningarth Research
The number of hectare water volumes used in the WIM was sourced from measurements made by Schoeman
and Partners in the Upper Vaal and for the Middle and Lower Vaal the Loxton and Venn study were used. It
was provided by quaternary catchment level and allocated to the specific Units of Analysis (UA) provided by the
project team members responsible for the classification of the eco-systems. For purposes of the model design
and relevance for the analyses, the groups of crops listed in Table 2.4 were used that totalled the irrigation
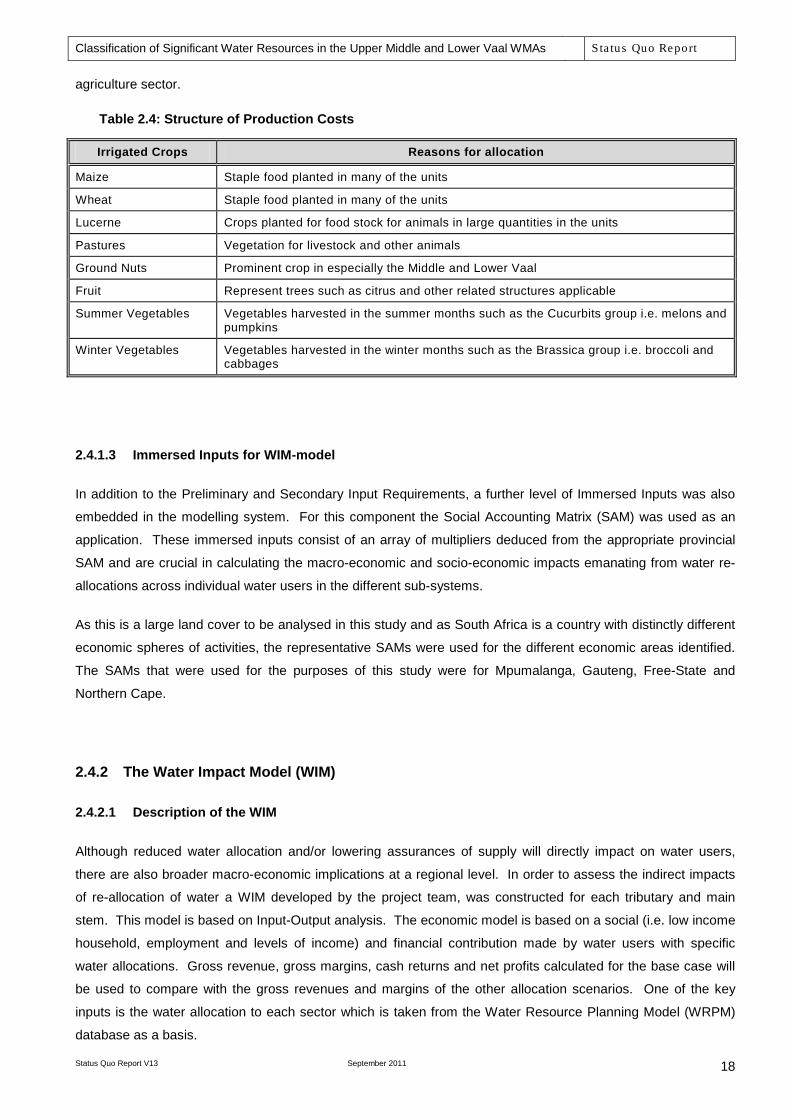
Classification of Significant Water Resources in the Upper Middle and Lower Vaal WMAs Sta tus Quo Report
Status Quo Report V13 September 2011
18
agriculture sector.
Table 2.4: Structure of Production Costs
Irrigated Crops Reasons for allocation
Maize Staple food planted in many of the units
Wheat Staple food planted in many of the units
Lucerne Crops planted for food stock for animals in large quantities in the units
Pastures Vegetation for livestock and other animals
Ground Nuts Prominent crop in especially the Middle and Lower Vaal
Fruit Represent trees such as citrus and other related structures applicable
Summer Vegetables Vegetables harvested in the summer months such as the Cucurbits group i.e. melons and pumpkins
Winter Vegetables Vegetables harvested in the winter months such as the Brassica group i.e. broccoli and cabbages
2.4.1.3 Immersed Inputs for WIM-model
In addition to the Preliminary and Secondary Input Requirements, a further level of Immersed Inputs was also
embedded in the modelling system. For this component the Social Accounting Matrix (SAM) was used as an
application. These immersed inputs consist of an array of multipliers deduced from the appropriate provincial
SAM and are crucial in calculating the macro-economic and socio-economic impacts emanating from water re-
allocations across individual water users in the different sub-systems.
As this is a large land cover to be analysed in this study and as South Africa is a country with distinctly different
economic spheres of activities, the representative SAMs were used for the different economic areas identified.
The SAMs that were used for the purposes of this study were for Mpumalanga, Gauteng, Free-State and
Northern Cape.
2.4.2 The Water Impact Model (WIM)
2.4.2.1 Description of the WIM
Although reduced water allocation and/or lowering assurances of supply will directly impact on water users,
there are also broader macro-economic implications at a regional level. In order to assess the indirect impacts
of re-allocation of water a WIM developed by the project team, was constructed for each tributary and main
stem. This model is based on Input-Output analysis. The economic model is based on a social (i.e. low income
household, employment and levels of income) and financial contribution made by water users with specific
water allocations. Gross revenue, gross margins, cash returns and net profits calculated for the base case will
be used to compare with the gross revenues and margins of the other allocation scenarios. One of the key
inputs is the water allocation to each sector which is taken from the Water Resource Planning Model (WRPM)
database as a basis.
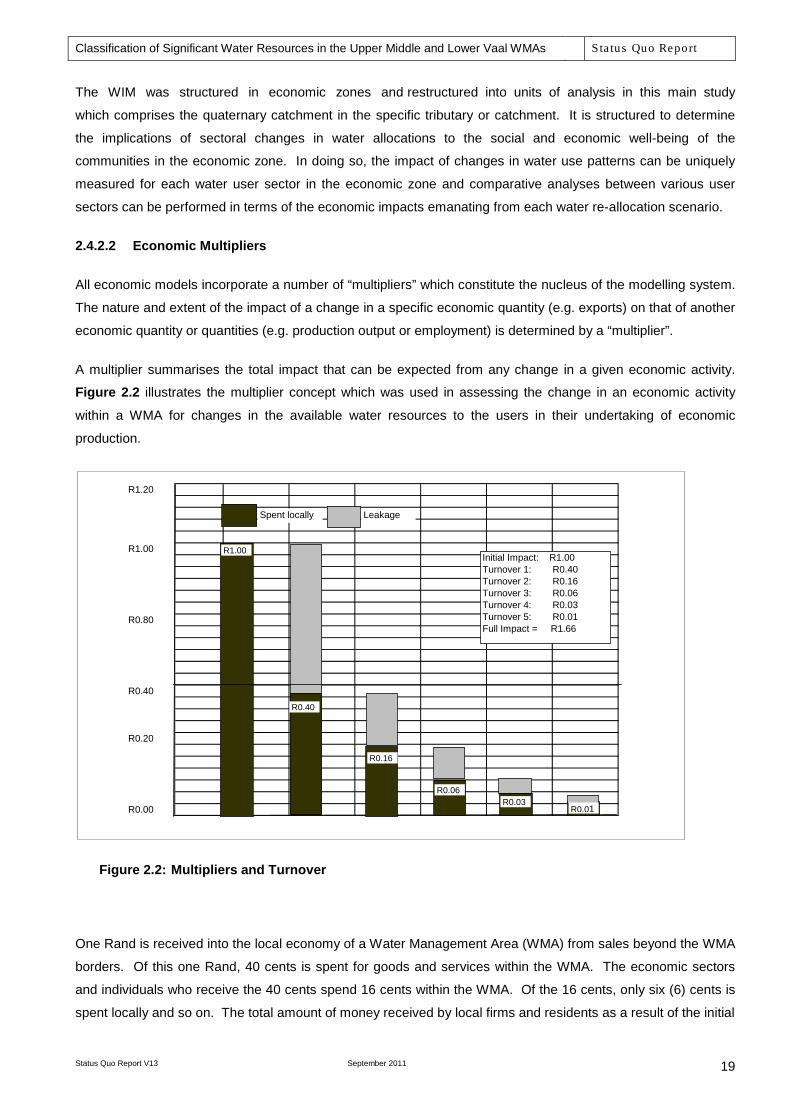
Classification of Significant Water Resources in the Upper Middle and Lower Vaal WMAs Sta tus Quo Report
Status Quo Report V13 September 2011
19
The WIM was structured in economic zones and restructured into units of analysis in this main study
which comprises the quaternary catchment in the specific tributary or catchment. It is structured to determine
the implications of sectoral changes in water allocations to the social and economic well-being of the
communities in the economic zone. In doing so, the impact of changes in water use patterns can be uniquely
measured for each water user sector in the economic zone and comparative analyses between various user
sectors can be performed in terms of the economic impacts emanating from each water re-allocation scenario.
2.4.2.2 Economic Multipliers
All economic models incorporate a number of “multipliers” which constitute the nucleus of the modelling system.
The nature and extent of the impact of a change in a specific economic quantity (e.g. exports) on that of another
economic quantity or quantities (e.g. production output or employment) is determined by a “multiplier”.
A multiplier summarises the total impact that can be expected from any change in a given economic activity.
Figure 2.2 illustrates the multiplier concept which was used in assessing the change in an economic activity
within a WMA for changes in the available water resources to the users in their undertaking of economic
production.
Figure 2.2: Multipliers and Turnover
One Rand is received into the local economy of a Water Management Area (WMA) from sales beyond the WMA
borders. Of this one Rand, 40 cents is spent for goods and services within the WMA. The economic sectors
and individuals who receive the 40 cents spend 16 cents within the WMA. Of the 16 cents, only six (6) cents is
spent locally and so on. The total amount of money received by local firms and residents as a result of the initial
R1.20
R1.00
R0.80
R0.40
R0.20
R0.00
LeakageSpent locally
R0.01R0.03
R0.06
R0.16
R0.40
R1.00Initial Impact: R1.00Turnover 1: R0.40Turnover 2: R0.16Turnover 3: R0.06Turnover 4: R0.03Turnover 5: R0.01Full Impact = R1.66

Classification of Significant Water Resources in the Upper Middle and Lower Vaal WMAs Sta tus Quo Report
Status Quo Report V13 September 2011
20
one Rand in added exported earnings is R1.66. Therefore the multiplier is R1.66.
The change in economic activity resulting from the change in one factor of production, such as water resources,
is measured by different multipliers. Four multipliers are commonly used to assess the impacts of an initial
increase in production resulting from an increase in sales, usually called final demand in a multiplier analysis.
The four multipliers are: (1) Output, (2) Employment; (3) Income; and (4) Value Added Multipliers.
2.4.2.3 Calculation of Multipliers
Sectoral multipliers are calculated using information contained in the applicable Provincial Social Accounting
Matrix (SAM), the National RSA SAM and data obtained from the Reserve Bank of South Africa and Statistics
South Africa. These inverse matrices capture all of the direct and indirect relationships among the inputs and
outputs of the various entities included in the applicable provincial SAM.
Direct GDP, labour and capital multipliers for each sector are calculated using the following formula:
GDP multiplier =
Production
Value Added
Labour multiplier =
Production
Employment
Capital multiplier =
Production
Capital stock
These Multipliers were incorporated into the Water Impact Model and used to calculate the macro-economic
impacts.
When using a SAM for the applicable unit of analysis, the above multipliers can be calculated. The multipliers
that were used in this study to determine the economic impacts are as follows:
• Economic growth (i.e. the impact on GDP). • Employment creation (i.e. the impact on labour requirements). • Income distribution (i.e. the impact on low-income, poor households and the total income
households).
A breakdown of the different effects of the agricultural sector multipliers used in this study is as follows:
• Direct Impacts•
: Refer to effects occurring directly in the agriculture sector. Indirect Impacts
•
: Refer to those effects occurring in the different economic sectors that link backward to agriculture due to the supply of intermediate inputs, i.e. fertilisers, seeds, etc. Induced Impacts
•
: Refer to the chain reaction triggered by the salaries and profits (less retained earnings) that are ploughed back into the economy in the form of private consumption expenditure. Total Impacts: Refer to the direct, indirect and induced summed effects.
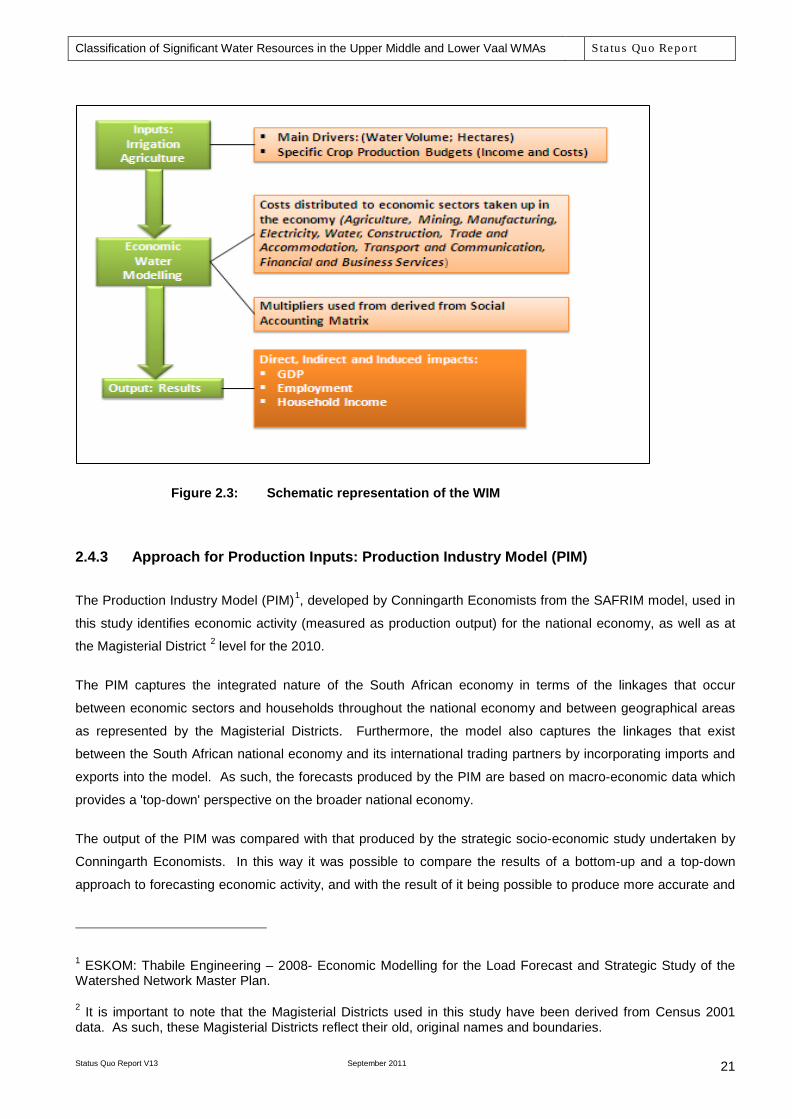
Classification of Significant Water Resources in the Upper Middle and Lower Vaal WMAs Sta tus Quo Report
Status Quo Report V13 September 2011
21
Figure 2.3: Schematic representation of the WIM
2.4.3 Approach for Production Inputs: Production Industry Model (PIM)
The Production Industry Model (PIM)1, developed by Conningarth Economists from the SAFRIM model, used in
this study identifies economic activity (measured as production output) for the national economy, as well as at
the Magisterial District 2
The PIM captures the integrated nature of the South African economy in terms of the linkages that occur
between economic sectors and households throughout the national economy and between geographical areas
as represented by the Magisterial Districts. Furthermore, the model also captures the linkages that exist
between the South African national economy and its international trading partners by incorporating imports and
exports into the model. As such, the forecasts produced by the PIM are based on macro-economic data which
provides a 'top-down' perspective on the broader national economy.
level for the 2010.
The output of the PIM was compared with that produced by the strategic socio-economic study undertaken by
Conningarth Economists. In this way it was possible to compare the results of a bottom-up and a top-down
approach to forecasting economic activity, and with the result of it being possible to produce more accurate and
1 ESKOM: Thabile Engineering – 2008- Economic Modelling for the Load Forecast and Strategic Study of the Watershed Network Master Plan.
2 It is important to note that the Magisterial Districts used in this study have been derived from Census 2001 data. As such, these Magisterial Districts reflect their old, original names and boundaries.
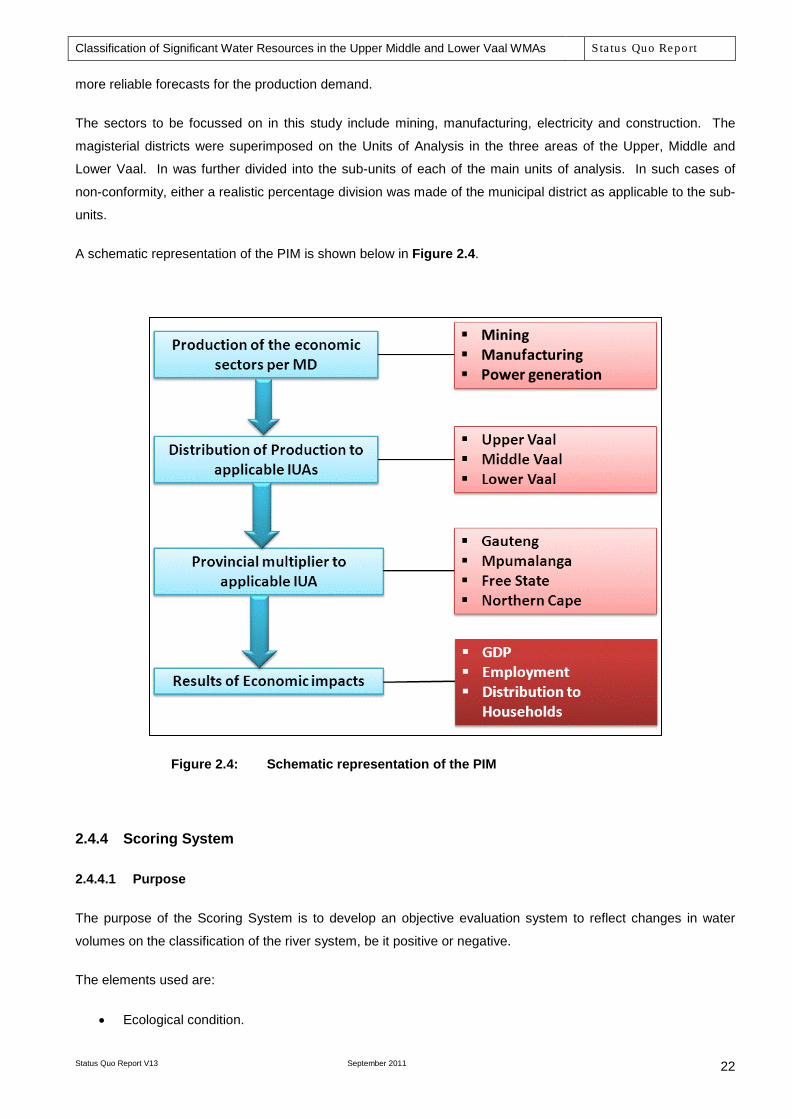
Classification of Significant Water Resources in the Upper Middle and Lower Vaal WMAs Sta tus Quo Report
Status Quo Report V13 September 2011
22
more reliable forecasts for the production demand.
The sectors to be focussed on in this study include mining, manufacturing, electricity and construction. The
magisterial districts were superimposed on the Units of Analysis in the three areas of the Upper, Middle and
Lower Vaal. In was further divided into the sub-units of each of the main units of analysis. In such cases of
non-conformity, either a realistic percentage division was made of the municipal district as applicable to the sub-
units.
A schematic representation of the PIM is shown below in Figure 2.4.
Figure 2.4: Schematic representation of the PIM
2.4.4 Scoring System
2.4.4.1 Purpose
The purpose of the Scoring System is to develop an objective evaluation system to reflect changes in water
volumes on the classification of the river system, be it positive or negative.
The elements used are:
• Ecological condition.

Classification of Significant Water Resources in the Upper Middle and Lower Vaal WMAs Sta tus Quo Report
Status Quo Report V13 September 2011
23
• Economic Impact.
• Social Impact.
2.4.4.2 Approach to the Scoring System
• The eventual choice of the different eco-system values will be based on a matrix that allows attaining
the maximum value for both users, inside and outside the river including the in stream ecological
condition.
• The matrix to be developed will list all the values and then involve a group of knowledgeable people
from both groups inside and outside the river to populate the matrix. All aspects that may have an effect
on a change of a class that is analysed by each field studied in this project will be part of the evaluation
criteria.
• The original concept was developed in a pilot project in the Olifants-Doorn River. For this study the
concept is adapted for a highly industrialised Basin.
• The methodology proposed, is the Delphi approach where a number of specialists populate "Matrix 1"
with approximate monetary values for the different environmental functions the water fulfils while in the
river. As it is not always possible to quantify these values in monetary numbers an indirect approach will
be followed. The monetary value of the water expressed in terms of the irrigation value at the EWR
point will be used as proxy to estimate the value of the in river value of the water.
• In "Matrix 2" weights are allocated to the different items which represent the relative importance of the
specific in river service provided by the water as assessed by the participants, which are then multiplied
with the first matrix to get "Matrix 3" with answers.
The following is a short practical explanation of the above methodology. In the following table a description of
the application of one of the main stem or tributary zones is given. Table 2.5 presents the weights allocated for
the different sections of a certain zone that will be converted to monetary values (note that the weights will differ
from zone to zone).
Matrix 1 x
Matrix 2 =
Matrix 3 Values
Weights
Answers
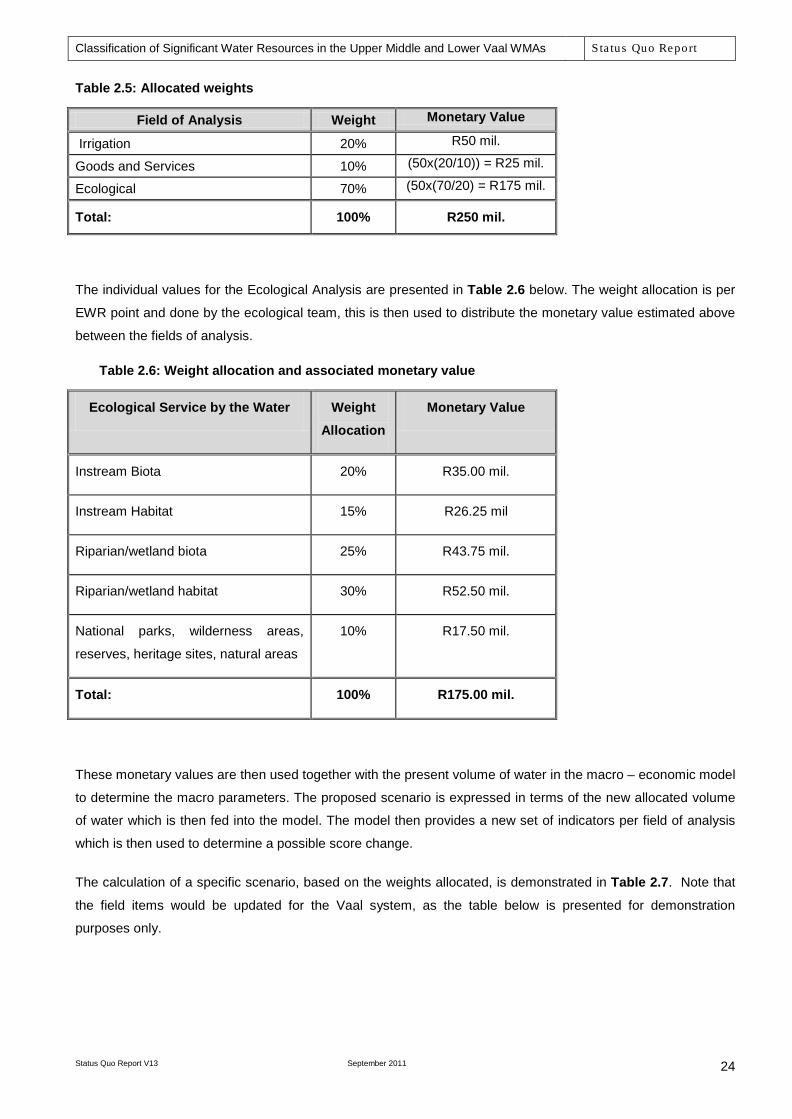
Classification of Significant Water Resources in the Upper Middle and Lower Vaal WMAs Sta tus Quo Report
Status Quo Report V13 September 2011
24
Table 2.5: Allocated weights
Field of Analysis Weight Monetary Value
Irrigation 20% R50 mil.
Goods and Services 10% (50x(20/10)) = R25 mil.
Ecological 70% (50x(70/20) = R175 mil.
Total: 100% R250 mil.
The individual values for the Ecological Analysis are presented in Table 2.6 below. The weight allocation is per
EWR point and done by the ecological team, this is then used to distribute the monetary value estimated above
between the fields of analysis.
Table 2.6: Weight allocation and associated monetary value
Ecological Service by the Water Weight Allocation
Monetary Value
Instream Biota 20% R35.00 mil.
Instream Habitat 15% R26.25 mil
Riparian/wetland biota 25% R43.75 mil.
Riparian/wetland habitat 30% R52.50 mil.
National parks, wilderness areas,
reserves, heritage sites, natural areas
10% R17.50 mil.
Total: 100% R175.00 mil.
These monetary values are then used together with the present volume of water in the macro – economic model
to determine the macro parameters. The proposed scenario is expressed in terms of the new allocated volume
of water which is then fed into the model. The model then provides a new set of indicators per field of analysis
which is then used to determine a possible score change.
The calculation of a specific scenario, based on the weights allocated, is demonstrated in Table 2.7. Note that
the field items would be updated for the Vaal system, as the table below is presented for demonstration
purposes only.
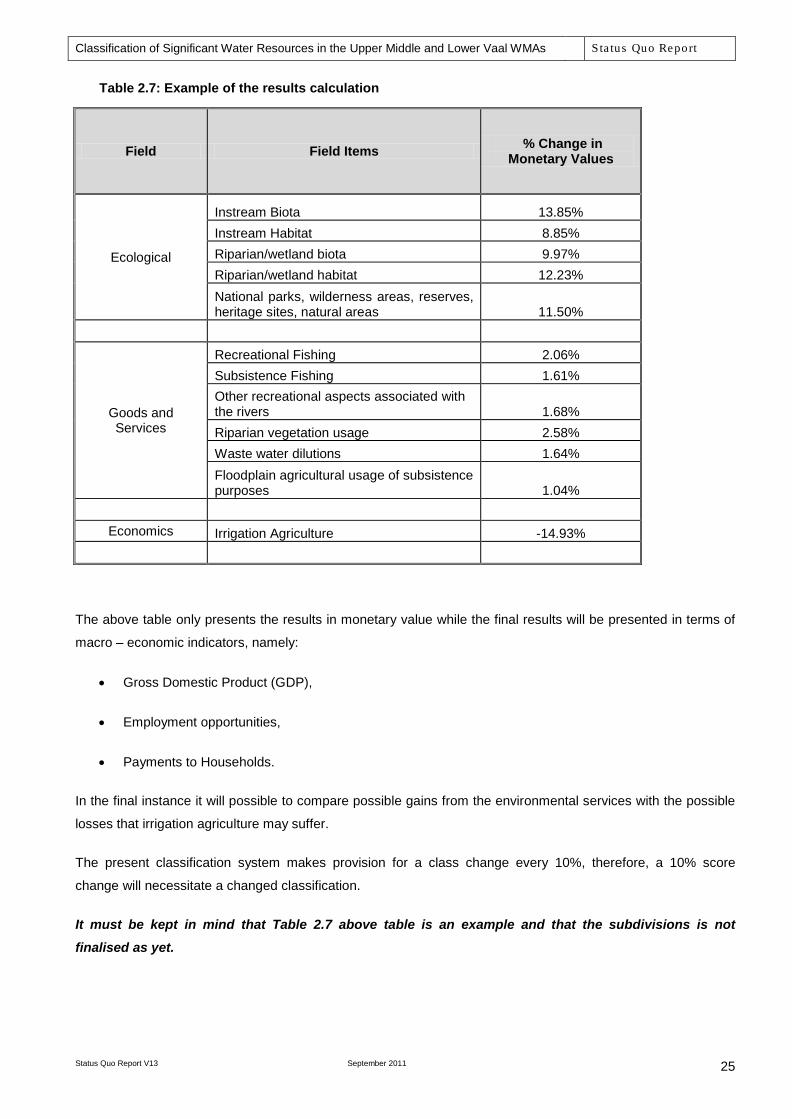
Classification of Significant Water Resources in the Upper Middle and Lower Vaal WMAs Sta tus Quo Report
Status Quo Report V13 September 2011
25
Table 2.7: Example of the results calculation
Field Field Items % Change in Monetary Values
Ecological
Instream Biota 13.85% Instream Habitat 8.85% Riparian/wetland biota 9.97% Riparian/wetland habitat 12.23% National parks, wilderness areas, reserves, heritage sites, natural areas 11.50%
Goods and Services
Recreational Fishing 2.06% Subsistence Fishing 1.61% Other recreational aspects associated with the rivers 1.68% Riparian vegetation usage 2.58% Waste water dilutions 1.64% Floodplain agricultural usage of subsistence purposes 1.04%
Economics Irrigation Agriculture -14.93%
The above table only presents the results in monetary value while the final results will be presented in terms of
macro – economic indicators, namely:
• Gross Domestic Product (GDP),
• Employment opportunities,
• Payments to Households.
In the final instance it will possible to compare possible gains from the environmental services with the possible
losses that irrigation agriculture may suffer.
The present classification system makes provision for a class change every 10%, therefore, a 10% score
change will necessitate a changed classification.
It must be kept in mind that Table 2.7 above table is an example and that the subdivisions is not finalised as yet.

Classification of Significant Water Resources in the Upper Middle and Lower Vaal WMAs Sta tus Quo Report
Status Quo Report V13 September 2011
26
2.4.4.3 Evaluation Criteria
The following criteria are to be considered:
• Detailed criteria per zone.
• Economic impacts.
• Water quality.
• Environment.
• Goods and services.
• Carbon sequestration.
• Flood attenuation.
• Waste treatment.
2.4.4.4 Result Interpretation
The interpretation of the results is based on the following:
• That each EZ has already been allocated an environmental classification (REC) – A-D and a Management class 1-3.
• The current scores to be converted to the allocated class.
Any change in water allocation to be converted by the model and interpreted in terms of a possible change in
class.
2.5 GOODS AND SERVICES ASSESSMENT
2.5.1 Methods used to Assess Goods and Services
Information on the Goods and Services (G&S) of the Vaal River is available and has been used as a basis for
this purpose. It should be noted that the objective in describing and valuing the use of aquatic ecosystems is to
determine the way in which aquatic ecosystems are currently being used in each socio-economic zone, and to
estimate the value generated by that use. This provides the baseline against which the socio-economic and
ecological implications of different catchment configuration scenarios can be compared.
By way of summary the most salient socio-economic characteristics for each of the three Water Management
Areas (WMAs) is presented.
The Upper Vaal WMA is economically one of the most important in the country and nearly 22% of the GDP of
South Africa originates from the Upper Vaal WMA. Only the adjacent Crocodile (West) and Marico WMA, with
about 24%, contributes more to the Gross Domestic Product (GDP). The contribution of the different sectors to
the Gross Geographic Product (GGP) in the Upper Vaal WMA reflects a diversified economy with a strong

Classification of Significant Water Resources in the Upper Middle and Lower Vaal WMAs Sta tus Quo Report
Status Quo Report V13 September 2011
27
industrial and financial base. Despite the large areas under cultivation, agriculture only contributes about 2%
of the GGP. Agriculture, however, has important linkages to other sectors and provides livelihood to a large
proportion of the rural population. The average income for the Upper Vaal WMA is in line with the national
average of around R18 000 per capita per year. This is however highly skewed and the urban poor make up a
large percentage of the WMA.
The demography of the WMA will be influenced by economic opportunities and potential. Projections are
therefore for continued strong growth in urban population in the sub-area downstream of Vaal Dam where most
of the economic activity is centred. A decline in population is projected for the Wilge sub-area due to the
movement of people out of Phuthaditjaba and the former QwaQwa area. Overall the area is growing at a rate in
excess of the national average. The potential for future growth in this WMA remains strong. Growth will largely
be attracted to the already strong urban and industrial areas in the Johannesburg- Vereeniging-Vanderbijlpark
complex. New mining developments will mainly replace worked out mines with a long term decline expected in
this sector. There is however potential for further development of coal mining on the Eastern Highveld and in the
Vereeniging area downstream of Vaal Dam.
Mining is critical to the WMA and products of the mining industry in the Upper Vaal WMA include coal, precious
metals (gold, uranium, etc.), base metals, semi-precious stones and industrial minerals. The major impact of the
mines on the water resource is the water pumped from the mines to dewater the underground workings mainly
of the gold mines. The salinity loads associated with these mine discharges together with the sewage return
flows contribute significantly to the salinity problems that are experienced in the Vaal Barrage and downstream
river system. The mine dewatering and the diffuse salinity contributions from the highly developed urban and
industrial areas in the Vaal Barrage catchment has resulted in the need for the currently applied blending and/or
dilution operating rules applied downstream of Vaal Dam.
Major industries in this WMA include Sasol I (Sasolburg), Iscor, Sappi, AECI and Sasol Synthetic Fuels (SSF)
(Secunda). Sasol 1 is located in the Free State province near Sasolburg and abstracts water from the Vaal
Barrage. The production of petro-chemicals is the main activity. Iscor is located near Vanderbijlpark and is
supplied with water from the Vaal Barrage. The production of iron and steel products is the main activity. SSF
are located in Mpumalanga Province near the Secunda urban area. Water for SSF is supplied by pipeline from
Grootdraai Dam. The production of petro-chemicals products is the main activity. Other important industries
such as Sappi and AECI receive water from the urban centres where they are located. All these industries are
economically important and provide significant employment. There are three operational coal fired power
stations located in the WMA. The power stations are the Lethabo, Tutuka and Majuba Power Stations.
Irrigated farmlands are an important feature of the WMA. About 75% of the irrigation is upstream of major
storage dams and are supplied from run-of-river or farm dams. These areas will be supplied at a lower
assurance of supply than the irrigation areas located in the Mooi sub-catchment (Mooi Government Water
Scheme, Klipdrift and Vyfhoek Schemes) and Barrage to Mooi sub-catchment (Rietpoort and Koppieskraal
Irrigation Boards) which are supported by major dams and conveyance infrastructure.
Land use in the south and east is dominated by cultivated dry land agriculture with the main crops being maize
and wheat. Beef and sheep farming is range extensive. The use of water for recreational purposes is important
Classification of Significant Water Resources in the Upper Middle and Lower Vaal WMAs Sta tus Quo Report
Status Quo Report V13 September 2011
28
in the WMA. The dams in the WMA, particularly the Vaal Dam are important recreational zones.
While the Vaal system is important in terms of its extent this is tempered by the nature of settlement in the area.
In terms utilisation of and dependence on goods and services the area is home to few communities for whom
these resources would be important. The urbanised nature of the catchment and the fact that the bulk of the
residents live in settlements where livelihoods are linked to economic modes of production that are not linked to
direct resource dependence is evident. Further the areas dominated by relatively low population densities and
given over to commercial farming enterprises (typically the upper parts of the catchment) as well as portions of
the middle catchment also tend to score relatively low in terms of dependence on goods and services. An
obvious exception is recreational use. The dams as well as the settlement below the Vaal Barrage have
important values associated with river linked recreational services. An additional benefit that of the service
delivered by riverine systems in terms of pollutant dilution is also important in some areas. The single other
marked exception to this rule in the WMA is that part of the Wilge River in the former homeland area of
QwaQwa. Even here the altered nature of the environment and degree of residential development means that
the bulk of people, arguably constituting a displaced working class, do not make as much use of goods and
service delivered by the riverine system.
The Middle Vaal WMA is located downstream of the confluence of the Vaal and the Rietspruit Rivers and
upstream of Bloemhof Dam. It extends to the Schoonspruit River in the north and the Vet River in the south, and
covers a total catchment area of 52 563 km2. The Middle Vaal WMA incorporates portions of the Free State and
North-West Provinces and is, therefore, important to the regional economies of these provinces. Major rivers in
the Middle Vaal Water Management Area include the Schoonspruit, Renoster, Vals, Vet and Vaal rivers.
Settlement patterns within the Middle Vaal WMA are dispersed and extensive dryland agricultural practices take
place throughout this WMA. Major towns and urban areas in the Middle Vaal WMA include Klerksdorp,
Kroonstad, Welkom and Virginia.
Primary sector activities such as mining and agriculture accounted for approximately 55% of the areas total
GDP in 1997 (DWAF, 2002). Of this total, mining activities accounted for approximately 46%. Major mines in the
area include Anglogold’s Great Noligwa, Kopanang, Tau Lekoa and Moab Khotsong mines and Harmony’s
Tshepong and Virginia mines. According to Van Vuuren (2008), few of the gold mines within the Middle Vaal
WMA have a secure future beyond 2010, although the resource base could potentially support mining up to
2030. Mine dewatering and the discharge into the river systems have a negative impact on water quality within
this WMA.
The Lower Vaal WMA is located downstream of Bloemhof Dam and upstream of Douglas Weir. It extends to the
headwaters of the Harts, Molopo and Kuruman River in the north and the Vaal River Downstream of Bloemhof
in the south. It covers a catchment area of 51,543 km2 and lies in the North West and Northern Cape Provinces,
with the south-eastern corner in the Free State, and borders on Botswana in the north, as well as on the
Crocodile (West) and Marico, Middle Vaal, Upper Orange and Lower Orange water management areas.
Primary agriculture is the major economic activity in the Lower Vaal WMA. Water is supplied from the Vaal River
main stem via the Vaal-Harts Weir to the Taung and Vaalharts Irrigation schemes under which 6 000ha and 32
000ha of irrigated land are cultivated, respectively. Commonly produced crops include a mix of high and low

Classification of Significant Water Resources in the Upper Middle and Lower Vaal WMAs Sta tus Quo Report
Status Quo Report V13 September 2011
29
value crops such as maize, wheat, lucerne, table grapes, citrus and peaches. DWAF (2002) note that
approximately 80% of the water released from the Upper Vaal WMA is used for irrigation purposes and that only
irrigation return flows and flood flows reach the confluence with the Orange River. In terms of provincial context,
the Middle and Lower Vaal WMAs also have an important role to play in the provincial economies. The Middle
Vaal WMA extends from the Gauteng, North West and Free State Provinces whereas the Lower Vaal WMA
extends over the North West and Northern Cape Provinces.
It is important to point out that while EGSAs will be identified and described in qualitative terms, a baseline value
can often only be described for some of these, as the information required, is not available without investing in a
costly survey. This is particularly so for the Vaal System that is densely populated and consists of a complex
array of highly disparate social groupings but almost certainly relatively few communities or population
groupings that are dependent on EGSA for their livelihoods. As such it is, therefore, more practical to measure
changes in EGSA values relative to a reference point rather than computing a baseline value. For the purposes
of this exercise the baseline value is described as a value of 1. The most important goods and services
associated with the overall system and likely to be impacted by changes in operational and management
scenarios are the following:
• Recreational fishing;
• Subsistence fishing;
• Other recreational aspects associated with the rivers;
• Riparian vegetation usage;
• Waste water dilutions; and
• Floodplain agricultural usage of subsistence purposes.
These have been identified from an analysis of the Reserve Determination reports available. The reports
covering the Upper, Middle and Lower Vaal rivers included analysis of goods and services. The reports were
supported with primary fieldwork to critical areas. In addition a second analysis based on the typology of
settlements in the area and their likely associated dependence on Goods and Services for livelihoods was
undertaken for this report. This was sourced from information available from Statistics South Africa and cross
referenced with an examination of aerial photography, largely that provided by Google Earth. This allowed for an
analysis of land use types associated with the settlement typology.
Furthermore, each quaternary catchment of the Vaal has been examined in detail via the analysis of Socio-
Cultural Importance. The Socio-Cultural Importance (SCI) was determined from:
• a site visit that covered points long the river;
• extrapolation to sites not visited by reference to available literature as well as to exiting mapping.
Given the size of the budget and the geographical scope of the work most of the information used to influence
the score was derived from direct observation and consideration of the literature available. A limited number of
direct interviews were held with people who are resident proximate to the river. A key component of the SCI
Classification of Significant Water Resources in the Upper Middle and Lower Vaal WMAs Sta tus Quo Report
Status Quo Report V13 September 2011
30
model is the category “Resource Dependence”. This refers to the Goods and Services delivered by the river
system and people’s dependence on these components. This is usually a critical element of the SCI score and
is designed to cater for river resource dependence by those who rely directly on such aspects for their survival.
The categories “Recreational Use” and “Ritual Use” were also examined. The SCI model was compared to the
evaluation of likely areas of importance with regard to Goods and Services. For the purposes of this report the
analysis of Goods and Services at a quaternary level was aligned with the Integrated Unit of Analysis (IUA)
approach adopted. Results are set out in Sections 4, 5 and 6.
In addition recreational usage and in particular recreational fishing, that is not associated with settlement type
and direct livelihood dependence was also identified as a key aspect of goods and services utilisation.
In the Upper Vaal the value of recreation associated with the dams is high. The Vaal Dam is a highly developed
recreational area. Estimates are that the number of visitors attracted to the Vaal Dam area exceeds 300 000
per year. In addition the dam offers a high value residential opportunity. Equally important are the areas
adjacent to the Vaal Barrage. This is also home to a number of properties that rely on the dam for their high
value. Downstream of the Vaal Barrage and culminating in the town of Parys are residential, leisure and
sporting developments that depend on the Vaal River and the operational parameters of the dam and barrage
for their high value. Fishing is important as are boating and canoeing.
In the Middle and Lower Vaal WMA’s recreational angling is an important ecosystem service supplied by the
Vaal River System. Yellow fish (Labeobarbus spp.) is one of South Africa’s most important angling and sport
fishing species (De Villiers, 2007a; 2007b) and is an indigenous South African fish species, widely distributed
throughout the Orange-Vaal River system.
The two most common species of Yellow fish are the Orange-Vaal Small-mouth (Labeobarbus aeneus) and the
Orange-Vaal Large-mouth (Labeobarbus kimberleyensis). According to Brand et al. (2009) Yellowfish are
attractive, reach a large size, and are considered to be an excellent game fish. Their study on the economic and
social use value of Yellow fish in the Vaal River found that Yellow fish were a targeted angling species for
approximately 5,000 anglers. They estimated the total value of the Yellow fish dependent fishing industry in the
Vaal River at R133 million per annum. This total value comprised the equipment sector (estimated expenditure
of anglers on fishing and associated equipment) with R14.6 million, the travel sector (estimated expenditure of
anglers on travel to and from fishing areas along the Vaal River) with R41.4 million, the accommodation sector
(estimated expenditure of anglers on angling related accommodation) with R75.5 million.
The results of the study on the total economic value of Yellow fish in the Vaal River by Brand et al. (2009)
showed that much of the total expenditure by anglers are on accommodation, equipment and travel. Little of the
total cost is spent on memberships and other activities. The study also suggested that a link between the social
and economic benefits of Yellow fish conservation in terms of improved livelihoods and local economies from
Yellow fish angling and related activities exists.
It should be noted that only the Goods and Services that are deemed likely to be impacted by mooted
operational scenarios will be costed and analysed. Analysis of goods and services not deemed to be at risk
would be pointless.
Classification of Significant Water Resources in the Upper Middle and Lower Vaal WMAs Sta tus Quo Report
Status Quo Report V13 September 2011
31
2.5.2 Delineation of the Units of Analysis and Description of the Status Quo
The zone (delineation) that was applied in the Vaal River System in the Reserve Determination study consisted
of the following components:
• Vaal River main stem representing all water users receiving water from the Vaal River and supporting
systems.
• Vaal River Eastern Sub-system (Grootdraai Dam and linked water resources).
• Tributary river catchments including: Sand–Vet, Vals, Mooi, Schoonspruit, Renoster and Harts river
catchments.
Two approaches could be considered with respect to a delineation and analysis of the socio-economic units that
make up the three WMAs. The first was to divide society into relatively homogenous communities through
delineating socio-economic zones and describing community wellbeing within each zone. The objective of the
catchment socio-economic zones would then be to estimate and report on the implications of different
catchment configuration scenarios on social wellbeing, economic prosperity and ecosystem health at an
appropriate spatial scale. The second was, in accordance with the concept of Integrated Units of Analysis
(IUA’s) to divide the WMAs into zones that reflect the IUAs as developed by the overall team approach.
From the perspective of ensuring greater harmonization of approach and making analysis more consistent this
second approach has been followed with respect to the goods and services. Results are discussed in
Sections 4, 5 and 6 below. The first approach has been restricted to analysis at the level of recreational use
with respect to Step 1(g).
2.5.3 Present Status of the Goods and Services in the Catchment
Data as captured in the reports for the Comprehensive Reserve Determination Studies undertaken for the
Upper, Middle and Lower Vaal River systems has been used as a basis for this section. The profiles presented
in these reports have been summarised and updated where relevant. In terms of updating the reporting the
most important step was to generate more detailed an integrated assessment of the current population of all
three areas. This was deemed necessary as much of the data included in the comprehensive reports relied on
population analysis undertaken in 2006/2007. The population data was also re-analysed to generate an
overview of the populations most likely to be inside the overall catchment area and be dependent on the goods
and services. This analysis becomes important for some of the subsequent steps in the analysis. Analysis was
undertaken using the following three primary tools:
• The 2001 census as adjusted.
• Geographic Information System (GIS) overlays of quaternary catchments and the census “sub place
name” data. “Sub place name” data fields are the most detailed subsets of data released by Statistic

Classification of Significant Water Resources in the Upper Middle and Lower Vaal WMAs Sta tus Quo Report
Status Quo Report V13 September 2011
32
South Africa. This allows for the population for each quaternary to be calculated and a profile of the
population for each unit to be analysed. Data was analysed to select areas in which populations likely to
be dependent on riverine goods and services were possibly or probably present.
• Cross check of the GIS data sets with available mapping to determine likely livelihood styles and
profiles.
Although the 2001 census remains the most recent national population data set it is now out-dated. In order to
compensate for this data is adjusted using derived population growth rates. These rates were used to update
the data. It should be noted that local drivers, usually economic, cannot always be built into these extrapolated
calculation. The overall population for the catchment areas (end 2010) was deemed to be around 11 750 000.
This is about 23% of the overall population of the country. Of these the vast majority (87%) are resident in urban
centres and either resides in formal or informal settlement.
The Vaal River System, because of its extent, plays an important role in maintaining important Ecosystems
goods and services to both on-site as well as other users. An ecosystem service is a product that emerges from
processes or features within largely natural environments, which enhances human wellbeing and is directly
used by people. Natural capital and associated ecosystem services are now becoming scarce and the
Millennium Ecosystems Assessment (MEA) partitions ecosystems services into four broad categories:
• Provisioning services are the most familiar category of benefit, often referred to as ecosystem ‘goods’,
such as foods, fuels, fibres, biochemicals, medicine, and genetic material, that are in many cases:
directly consumed; subject to reasonably well-defined property rights (even in the case of genetic or
biochemical material where patent rights protect novel products drawn from ecosystems); and are
priced in the market.
• Cultural services are the less familiar services such as religious, spiritual, inspirational and aesthetic
well-being derived from ecosystems, recreation, and traditional and scientific knowledge that are: mainly
passive or non-use values of ecological resources (non-consumptive uses); that have poorly-developed
markets (with the exception of ecotourism); and poorly-defined property rights (most cultural services
are regulated by traditional customs, rights and obligations); but are still used directly by people and are
therefore open to valuation.
• Regulating services are services, such as water purification, air quality regulation, climate regulation,
disease regulation, or natural hazard regulation, that affect the impact of shocks and stresses to socio-
ecological systems and are: public goods (globally in the case of disease or climate regulation) meaning
that they “offer non-exclusive and non-rival benefits to particular communities” (Perrings, 2006); and
arethus frequently undervalued in economic markets; many of these are indirectly used being
intermediate in the provision of cultural or provisioning services.
• Supporting services are an additional set of ecosystem services referred to in the MEA, such as nutrient
and water cycling, soil formation and primary production, that capture the basic ecosystem functions
and processes that underpin all other services and thus: are embedded in those other services
(indirectly used); and are not evaluated separately (Mander et al., 2007).
Classification of Significant Water Resources in the Upper Middle and Lower Vaal WMAs Sta tus Quo Report
Status Quo Report V13 September 2011
33
2.5.4 Description of the Present-day Community Wellbeing within each IUA
This is described in Sections 4, 5 and 6.
2.6 WATER REALLOCATION SITUATIONAL ANALYSIS
The evaluation of the results of the three different sets of analysis, namely ecological, goods and services and
socio – economic is to establish the baseline per individual section of the main stem or tributary. During the
analysis it might appear that the ecological situation of certain river zones has deteriorated to a point where
corrective action is necessary, e.g. actions involving an increase in water in the specific river section. The
possibility arises that a negative economic impact or a cost increase might result, particularly if corrective action
involves curtailing water availability to another activity.
In this regard the following assumptions have been developed and applied in the calculation of the possible
socio – economic costs3
• Main Stem: If in any zone problems arise the water will be augmented.
:
• Tributary: If in any tributary a shortage of water is experienced, it will be reallocated from the irrigation
sector.
In the next two sections the implications of the two assumptions are explained in more detail.
2.6.1 Main stem – Augmentation
If in a section of the main stem of the river more water is necessary to maintain or improve the status of the
ecology and water quality of a specific river section, the water will be supplied from the present available
sources. However the possibility exists that this could influence the implementation date of the next
augmentation scheme to supply the Vaal River system. The implementation date of the next dam in the Lesotho
Highlands scheme, Polihali, is fixed and the project team has accepted that if a scheme must be brought
forward, it will be the proposed Thukela scheme (refer to the Vaal River WRDP: Comparative Study Between
LHWP Phase II and Thukela Water Project (DWAF, 2008g) for details).
The proposed approach to the estimation of the costs of bringing the augmentation project forward will rest on
the principle of “time is money”. The estimated cost of the Thukela scheme is available in 2009 prices, for
implementation at a certain date in future. If that date is brought forward it means money will be spent earlier
and the impact on the consumer in increased rates will be payable earlier.
This cost will be calculated if the water resource analysis’ results indicate that an earlier implementation date is
3 RDM/WMA8C000/01/CON/0210: Resource Directed Measures: Comprehensive Reserve determination study of the Integrated Vaal River System. Upper Vaal Water Management Area Technical Component: Socio Economic Consequences of Various Operational Scenarios.
Classification of Significant Water Resources in the Upper Middle and Lower Vaal WMAs Sta tus Quo Report
Status Quo Report V13 September 2011
34
required. The calculation per zone will be done by multiplying the necessary volume of water with the cost
of augmentation per unit, expressed in 2011 prices.
2.6.2 Tributary – Economic Impact
The assumption governing tributaries is that the augmentation option will not be available and if more water is
required to maintain the ecological state it will be provided from present sources. If there is a shortage, water
will be reallocated from the irrigation sector. The water reallocation volumes will be determined by the water
resources team. The macro – economic impact of the reallocation of water will be calculated to assist the
decision making process.
2.6.3 Water Quality
Undesirable levels of water quality not only impact negatively on irrigation crop yields and quality, but also have
an adverse impact on industrial water use and ecological state. For example, should there be a deterioration of
the water quality within the Grootdraai Dam Sub-system more water has to be provided to Eskom through the
VRESAP pipeline to ensure effective utilisation of the cooling systems of their power stations which receive
water from this sub-system. Furthermore, extra costs might be necessitated by bulk water suppliers such as
Rand Water which provides water to urban centres for domestic and industrial use. The costs associated with
providing water of acceptable levels will be sourced from previous studies and presented where necessary.
Where specific options have not previously been assessed, the cost to the user will be used as an estimate.

Classification of Significant Water Resources in the Upper Middle and Lower Vaal WMAs Sta tus Quo Report
Status Quo Report V13 September 2011
35
3 INTEGRATED UNITS OF ANALYSIS (IUAS)
3.1 APPROACH IN IDENTIFICATION OF IUAS
The identification and selection of the Integrated Units of Analysis (IUAs) were based on the following
considerations:
• The resolution of the hydrological analysis and available water resource network configurations currently
being modelled.
• Location of significant water resource infrastructure.
• Distinctive functions of the catchments in context of the larger system.
• Available budget for refinement of the existing network and undertaking scenario analysis of each IUA.
• The biophysical nodes and the Present Ecological State (PES) and Recommended Ecological Category
(REC) for each node were also considered.
In an ideal situation it would have been preferred to have a properly calibrated higher resolution network water
resource model available for use in the classification process. Such models have been developed for other
systems in the country as part of Water Availability Assessment Studies where the focus was to develop
installed modelling systems to support the licensing of water use. Such detailed work requires significant
human resources and were not included in the scope of work to be undertaken for this study.
It has been recognised that the characteristics of individual small tributaries can significantly differ from the
larger rivers and may warrant a different management class. The constraint is however that if the same
intensity of investigation has to be applied for all tributaries (that is to satisfy scientific sound practice) much
more time and money would be required to undertake the classification of the water resources. It was therefore
proposed in the Inception Report that a practical qualitative evaluation method be applied which will only
consider the ecological aspects as well as likely implications on goods and services in a qualitative manner. The
identification of the tributary catchments formed part of the delineation of the IUAs (Task 3a).
As already described in the approach to select biophysical nodes, the results (if available) of the current PES
and Environmental Importance-Environmental Sensitivity (EI-ES) would also have contributed largely to the
delineation of the IUA as the proportions of the different Ecological Categories for all the river reaches could
play a vital role in the delineation.
The identified Integrated Units of Analysis (IUAs) for the three Vaal Water Management Areas are shown in
Figures A-1, A-2 and A-3 of Appendix A and are discussed in the subsequent sections.

Classification of Significant Water Resources in the Upper Middle and Lower Vaal WMAs Sta tus Quo Report
Status Quo Report V13 September 2011
36
3.2 UPPER VAAL IUAS
Figure A-1 presents the sixteen identified Integrated Units of Analysis (IUA) of which three IUAs (consisting of
quaternaries C83K, C83L, C23A, C23B and C22G) as well as a portion of a fourth IUA (comprising of
quaternary catchments C22H and C22J) cannot be explicitly analysed due to modelling network constraints.
The remaining thirteen IUAs form the sub-catchments according to which analysis will be carried out. The
above-mentioned three IUAs, as well as the tributary rivers within each of the remaining thirteen IUA, will be
evaluated in a qualitative manner only.
The significant resources of the IUAs are summarised in Table 3.1.
Table 3.1: Summary of IUAs in Upper Vaal WMA
IUA Reference Description of resources Major impoundments Quaternary catchments
UV-A Vaal River Upstream of Grootdraai Dam Grootdraai Dam C11A – C11L
UV-B Klip River (Free State) - C13A – C13H
UV-C1 Upper Wilge River and tributaries (Meul and
Cornelius)
- C81A, C81B, C81L, C81M,
C82A, C82B
UV-C2 Wilge River and tributaries (Nuwejaarspruit
and Namahadi - Elands)
Sterkfontein Dam C81C – C81K, C82C &
C82D
UV-C3 Lower Wilge River C82E – C82H
UV-D Liebenbergsvlei River Saulspoort Dam C83A – C83J
UV-E Waterval River - C12D – C12G
UV-F Krom (C83K) and Klip (C83L) flowing into
Vaal Dam
- C83K & C83L
UV-G Vaal River reach upstream of Vaal Dam and
Downstream of Grootdraai Dam
- C11M – C12L & C83M
UV-H Suikerbosrand River upstream of confluence
with Blesbokspruit
Balfour Dam C21A - C21C
UV-I Blesbokspruit, Riet and Klip River (Gauteng) - C21D – C21G, C22A –
C22E, C22H & C22J
UV-J Taaibosspruit - C22G
UV-K Kromelmboogspruit - C23A & C23B
UV-L Mooi River up to confluence with Vaal River Klerkskraal, Boskop,
Lakeside and Klipdrift
dams-
C23D – C23L(42%)
UV-M Vaal River from downstream of Vaal Dam to Vaal Dam C22F, C22K, C23C,
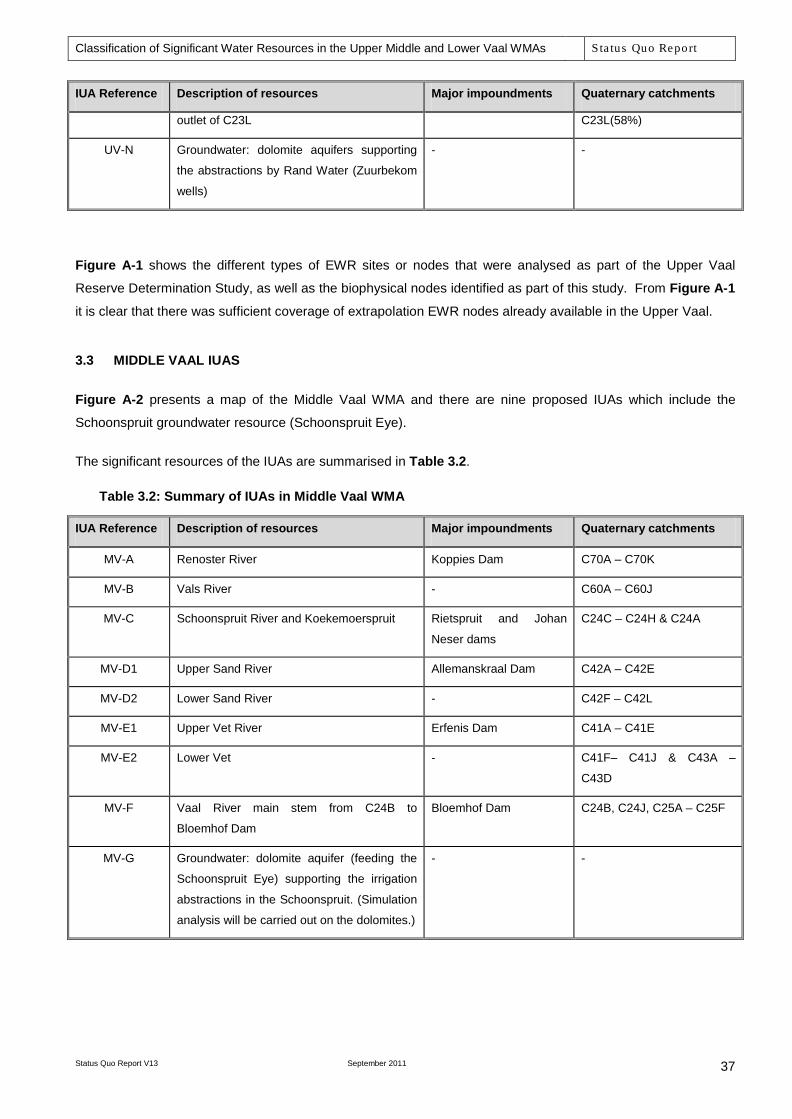
Classification of Significant Water Resources in the Upper Middle and Lower Vaal WMAs Sta tus Quo Report
Status Quo Report V13 September 2011
37
IUA Reference Description of resources Major impoundments Quaternary catchments
outlet of C23L C23L(58%)
UV-N Groundwater: dolomite aquifers supporting
the abstractions by Rand Water (Zuurbekom
wells)
- -
Figure A-1 shows the different types of EWR sites or nodes that were analysed as part of the Upper Vaal
Reserve Determination Study, as well as the biophysical nodes identified as part of this study. From Figure A-1
it is clear that there was sufficient coverage of extrapolation EWR nodes already available in the Upper Vaal.
3.3 MIDDLE VAAL IUAS
Figure A-2 presents a map of the Middle Vaal WMA and there are nine proposed IUAs which include the
Schoonspruit groundwater resource (Schoonspruit Eye).
The significant resources of the IUAs are summarised in Table 3.2.
Table 3.2: Summary of IUAs in Middle Vaal WMA
IUA Reference Description of resources Major impoundments Quaternary catchments
MV-A Renoster River Koppies Dam C70A – C70K
MV-B Vals River - C60A – C60J
MV-C Schoonspruit River and Koekemoerspruit Rietspruit and Johan
Neser dams
C24C – C24H & C24A
MV-D1 Upper Sand River Allemanskraal Dam C42A – C42E
MV-D2 Lower Sand River - C42F – C42L
MV-E1 Upper Vet River Erfenis Dam C41A – C41E
MV-E2 Lower Vet - C41F– C41J & C43A –
C43D
MV-F Vaal River main stem from C24B to
Bloemhof Dam
Bloemhof Dam C24B, C24J, C25A – C25F
MV-G Groundwater: dolomite aquifer (feeding the
Schoonspruit Eye) supporting the irrigation
abstractions in the Schoonspruit. (Simulation
analysis will be carried out on the dolomites.)
- -

Classification of Significant Water Resources in the Upper Middle and Lower Vaal WMAs Sta tus Quo Report
Status Quo Report V13 September 2011
38
3.4 LOWER VAAL IUAS
Figure A-3 presents a map of the Lower Vaal WMA and there are five selected IUAs. The Molopo River
Catchment was not part of the Vaal River Comprehensive Reserve Determination Study. The Molopo and its
tributary rivers are ephemeral and therefore cannot be evaluated with ease by following the standard reserve
determination methods. The Molopo catchment will, therefore, not been assessed in the same quantitative way
as all the other identified IUAs. Some work regarding ecological water requirements has recently been carried
out in this area through the ORASECOM study. Information from the latter study will be evaluated in terms of its
usefulness regarding the qualitative assessment of the catchment.
The significant resources of the five IUAs are summarised in Table 3.3.
Table 3.3: Summary of IUAs in Lower Vaal WMA
IUA Reference Description of resources Major impoundments Quaternary catchments
LV-A1 Upper Harts River Barberspan C31A – C31D
LV-A2 Middle Harts River Wentzel Dam C31E
LV-A3 Dry Harts River - C32A – C32D
LV-A4 Lower Harts River Taung and Spitskop
dams
C31F, C33A – C33C
LV-B Vaal River from downstream of Bloemhof
Dam to Douglas Weir
Vaalharts Weir C91A– C91E, C92A – C92C
LV-C Groundwater: dolomite aquifer in the
Lichtenburg area (simulation analysis will be
carried out on the dolomites).
- -

Classification of Significant Water Resources in the Upper Middle and Lower Vaal WMAs Sta tus Quo Report
Status Quo Report V13 September 2011
39
4 STATUS QUO OF UPPER VAAL WMA
4.1 GENERAL
The Upper Vaal WMA includes the economic hub of the country. The strategic water user Eskom, as well as
Sasol, are supplied from the water resources located within this WMA. Bulk water supplier Rand Water
abstracts water from Vaal Dam and supplies water to a large number of municipalities located in the Upper Vaal
and Crocodile West Marico WMAs. Most of the inter-basin transfers into the Vaal River system take place
within this WMA. The water quality of tributaries within the Vaal Barrage incremental catchment as well as the
main stem of the Vaal downstream of the Vaal Barrage is influenced by mine dewatering/decanting and urban
effluent discharges.
Results from the Vaal River Reconciliation Strategy study (DWAF, 2008a) indicated that there is a significant
amount of unlawful irrigation water use (net use of approximately 180 million m3/a) in the Upper Vaal. The DWA
is in the process of putting legal measures in place for the eradication of the unlawful water use. Detailed
information on the water requirements and return flows of individual user groups (as included in the WRPM
configuration) is listed in Table F-2 of Appendix F. The information in Table F-2 is provided within the context
of the sub-systems identified as part of the VRSAU study.
Information on the water reconciliation status of small towns upstream of the biophysical nodes was obtained
from the All Towns Reconciliation Strategy Study (DWA, 2011). This information was integrated with the
biophysical node catchments (refer to summarised results presented in Table G-2 of Appendix G) and will be
used as a qualitative indication of the water supply situation in the relevant urban areas.
4.2 UV-A: VAAL RIVER UPSTREAM OF GROOTDRAAI
4.2.1 Water Resources Assessment
The Grootdraai Dam catchment (as shown in Figure C-1 of Appendix C) forms part of the Vaal River Eastern
Sub-system. Tutuka Power Station (PS) is supplied with water from Grootdraai Dam and water from the dam is
also supplied (through the Vlakfontein Canal) to the Sasol Secunda Complex as well as the Eskom Power
Stations located in the Upper Olifants River Catchment. Grootdraai Dam is supported by transfers from the
Heyshope and Zaaihoek Sub-systems as described below.
Little Vaal River (C11C)
Water is transferred from Heyshope Dam into the Little Vaal River (i.e. into the lower part of quaternary C11C)
downstream of the selected EWR site referred to as RE-EWR1. The normal operating rule is to transfer water
to the Vaal River system if Grootdraai Dam’s storage decreases below 90%. The maximum transfer rate is
4.28 m3/s. There may be limited flexibility in the transfer rate (lower than the maximum) if one or two of the
three pump sets are used.
Skulpspruit River (C11E)
The transfer from Zaaihoek Dam discharges water into the Perdewaterspruit, which is a tributary of the

Classification of Significant Water Resources in the Upper Middle and Lower Vaal WMAs Sta tus Quo Report
Status Quo Report V13 September 2011
40
Skulpspruit (C11E). The water is released in the river system upstream of Amersfoort Dam, which is a small
storage dam providing water to the town. The transfer from Zaaihoek Dam is mainly for the purpose of
supplying water to Majuba Power Station and the release to Grootdraai Dam (into Perdewaterspruit) is only the
excess yield that is available in Zaaihoek Dam after Majuba’s water requirement has been supplied. The water
transferred into Grootdraai Dam has decreased over time due to the increasing usage from Majuba Power
Station, and as the different power generation units were commissioned. The maximum capacity of the supply
infrastructure from Zaaihoek Dam is 2.79 m3/s.
Rietspruit River (C11F)
Msukaligwa Local Municipality (former Ermelo TLC) is situated within this catchment. There are two dams,
Willem Brummer and Douglas dams, in this river system supplying water to Msukaligwa (based on information
received from Trevor Coleman). There are also coal mining activities in the catchment upstream of these dams.
These dams are small storage structures and it is unlikely that they have any release capabilities. The town of
Msukaligwa uses all the available water from these dams and in dry periods the dams are frequently depleted.
Msukaligwa also receives water from the Rietspruit-Davel pipeline (i.e. the pipeline from Jericho Dam providing
water to the Usutu-Vaal Eskom Power Stations).
4.2.2 Ecological Assessment
A summary table of the status quo assessment for each node and SQ reach is provided in Table 4.1. The
results are also provided in Figure B-1 of Appendix B.
Table 4.1: PES, EIS and REC for UV-A
VC node SQ reach PES FLOW RELATED NON FLOW RELATED EIS EI REC ACTIONS REQUIRED
8VF5 C11A-01460 B/C
Mostly non-flow related activities related to agricultural encroachment of grassland floodplains and trampling of wetlands, also wattle present in lower reaches.
MODERATE HIGH B
Non flow related: Improvement of agricultural practices. Removal of alien vegetation.
C1VAAL-KVAAL
C11B-01770 C
Mostly non-flow related activities related to agricultural encroachment of grassland floodplains and trampling of wetlands, also wattle present in lower reaches.
MODERATE MODERATE C Present flow will maintain PES/ REC.
RE EWR 1 KLEINVAAL
C11C-01846 C
Grazing and trampling pressure MODERATE MODERATE C
Present flow will maintain PES/ REC. Increased grazing and trampling could impact on the PES – especially on the high instream EC of an A/B.
UV9 C11E-01985 C Abstraction for
agriculture.
Mostly non-flow related activities related to agricultural encroachment of grassland floodplains and trampling of wetlands, also
LOW LOW C Present flow will maintain PES/ REC.

Classification of Significant Water Resources in the Upper Middle and Lower Vaal WMAs Sta tus Quo Report
Status Quo Report V13 September 2011
41
VC node SQ reach PES FLOW RELATED NON FLOW RELATED EIS EI REC ACTIONS REQUIRED
wattle in lower reaches.
C1RIET-AMERS
C11E-01895 C Agricultural activities. LOW MODERATE C
No actions required as the assumption is that flow is available. Current problems are mostly related to water quality and farming activities.
C1KVAA-UNSPE
C11C-01846 C/D
Increased flows from inter-basin transfer
MODERATE LOW C/D
Major problems are associated with the transfer. Any INCREASE in flow or more frequent transfers will further degrade the system.
EWR 1 C11J-01838 B/C
Mainly due to inter-basin transfers (Heyshope and Zaaihoek dams).
Mining and agricultural activities in area has caused water quality deterioration and erosion.
HIGH HIGH B/C
EI is HIGH and the PES warrants improvement. An improvement in the PES would mean that fish and macroinvertebrates must improve from a C to a B EC. No improvement in riparian vegetation is needed as the current EC is an A/B. An improvement in the biotic component EC is dependent on water quality changes and not flow related issues. To improve the EC therefore, the water quality problems must be identified to determine how it can be addressed.
UV17 C11G-01799 C/D Abstraction. Agricultural activities LOW LOW C/D Present flow will maintain
PES/ REC. C1BLES-UNSPE
C11J-01821 C/D Agricultural activities MODERATE LOW C/D Present flow will maintain
PES/ REC.
VC4 C11L-01945 B/C Agricultural activities MODERATE MODERATE B/C Present flow will maintain
the PES/REC.
VC5 C11K-01824 C Agricultural activities MODERATE MODERATE C Present flow will maintain
the PES/REC.
The PES varies from a C/D (3 desktop nodes) to a B/C (2 nodes and one EWR site). Most of the impacts
associated in this reach are due to agricultural activities with abstraction or flow modification only being an issue
in some of the reaches. The water quality state across UV-A is generally a C category, with the worst state
being in the Rietspruit River. Here the quality drops to a D category, largely due to extensive agricultural
activities with highly elevated nutrients and salts.
The only node with a high IE is 8VF5 (in the Vaal River) and the recommendation is made at this node to
improve the B/C PES to a B REC. To achieve this, non-flow related improvements such as improved
agricultural practices and removal of alien vegetation will be required. It must be noted that the instream EC at
RE-EWR1 is an A/B. This is linked to the fact that the hydrology is only minimally impacted and the low
EcoStatus is linked to the riparian EC of a D.
4.2.3 Socio-economic Assessment
This area is part of the integrated system of water supply to most of the Eskom Power Stations and the Sasol
Secunda Complex and is, therefore, strategically critical to the county’s economy. The area includes the urban
centres of Bethal, Ermelo, Amersfoort and Morgenzon. The main contributor to GDP in the area is power
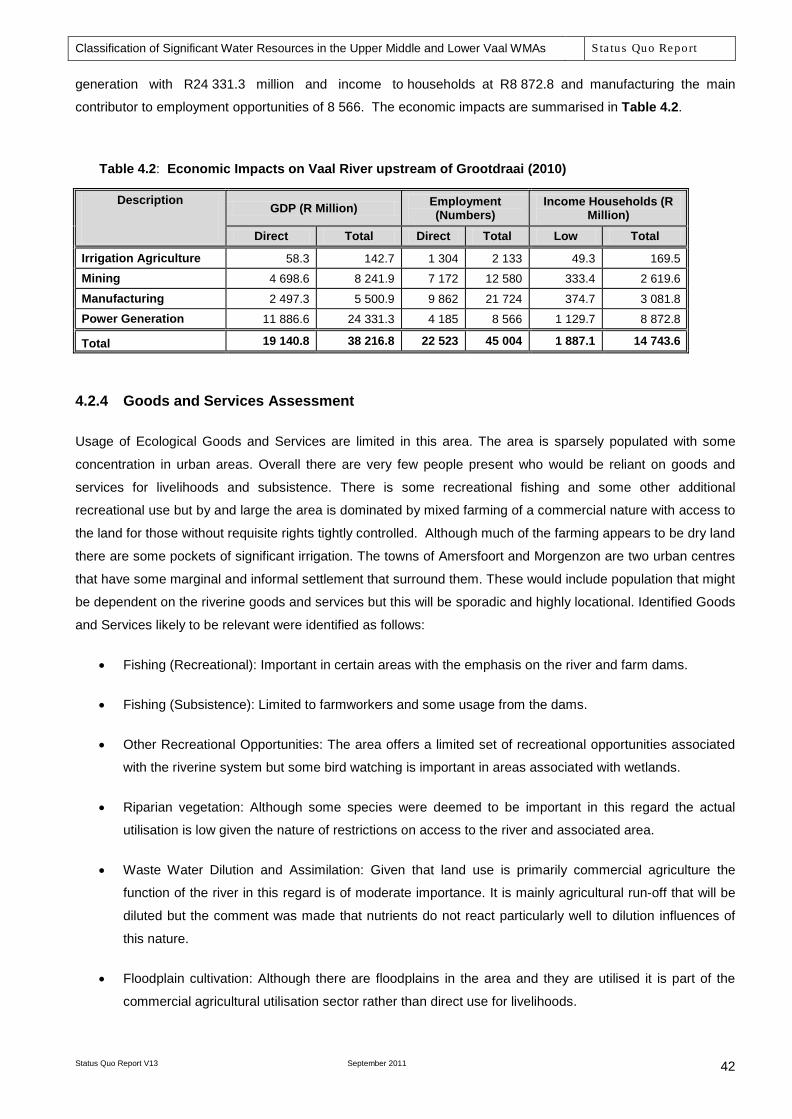
Classification of Significant Water Resources in the Upper Middle and Lower Vaal WMAs Sta tus Quo Report
Status Quo Report V13 September 2011
42
generation with R24 331.3 million and income to households at R8 872.8 and manufacturing the main
contributor to employment opportunities of 8 566. The economic impacts are summarised in Table 4.2.
Table 4.2: Economic Impacts on Vaal River upstream of Grootdraai (2010)
Description
GDP (R Million) Employment
(Numbers) Income Households (R
Million)
Direct Total Direct Total Low Total
Irrigation Agriculture 58.3 142.7 1 304 2 133 49.3 169.5 Mining 4 698.6 8 241.9 7 172 12 580 333.4 2 619.6
Manufacturing 2 497.3 5 500.9 9 862 21 724 374.7 3 081.8 Power Generation 11 886.6 24 331.3 4 185 8 566 1 129.7 8 872.8
Total 19 140.8 38 216.8 22 523 45 004 1 887.1 14 743.6
4.2.4 Goods and Services Assessment
Usage of Ecological Goods and Services are limited in this area. The area is sparsely populated with some
concentration in urban areas. Overall there are very few people present who would be reliant on goods and
services for livelihoods and subsistence. There is some recreational fishing and some other additional
recreational use but by and large the area is dominated by mixed farming of a commercial nature with access to
the land for those without requisite rights tightly controlled. Although much of the farming appears to be dry land
there are some pockets of significant irrigation. The towns of Amersfoort and Morgenzon are two urban centres
that have some marginal and informal settlement that surround them. These would include population that might
be dependent on the riverine goods and services but this will be sporadic and highly locational. Identified Goods
and Services likely to be relevant were identified as follows:
• Fishing (Recreational): Important in certain areas with the emphasis on the river and farm dams.
• Fishing (Subsistence): Limited to farmworkers and some usage from the dams.
• Other Recreational Opportunities: The area offers a limited set of recreational opportunities associated
with the riverine system but some bird watching is important in areas associated with wetlands.
• Riparian vegetation: Although some species were deemed to be important in this regard the actual
utilisation is low given the nature of restrictions on access to the river and associated area.
• Waste Water Dilution and Assimilation: Given that land use is primarily commercial agriculture the
function of the river in this regard is of moderate importance. It is mainly agricultural run-off that will be
diluted but the comment was made that nutrients do not react particularly well to dilution influences of
this nature.
• Floodplain cultivation: Although there are floodplains in the area and they are utilised it is part of the
commercial agricultural utilisation sector rather than direct use for livelihoods.

Classification of Significant Water Resources in the Upper Middle and Lower Vaal WMAs Sta tus Quo Report
Status Quo Report V13 September 2011
43
4.2.5 Proposed Action
If the proposed action involves corrective action, which could lead to the need for extra volumes of water, it will
be supplied by increased transfers and additional augmentation. The economic impact of the classification
scenarios will, therefore, be assessed based on the costs of the additional transfers.
4.3 UV-B: KLIP RIVER (FREE STATE)
4.3.1 Water Resources Assessment
Sandspruit River (C13A and C13B)
The Sandspruit, which is a tributary of the Klip River, should be mostly natural without any regulating storage
and only minor water abstractions.
Klip River (including and upstream of C13H)
The Klip River is largely natural and there is no large regulating storage in the catchment. The yield balance of
the river system is positive. This catchment is contributing a large portion of the incremental runoff to Vaal Dam
and is an important tributary of the Vaal River, in terms of providing natural variable flow downstream of
Grootdraai Dam. There is a possibility (has been investigated in past studies) of constructing a dam on the Klip
River. The most feasible option was found to be a dam in quaternary catchment C13F (just downstream of the
tributary from quaternary C13E) from where water will be transferred (pumped) to Grootdraai Dam.
4.3.2 Ecological Assessment
A summary table of the status quo assessment for each node and SQ reach is provided in Table 4.3. The
results are also provided in Figure B-2 of Appendix B.
Table 4.3: PES, EIS and REC for UV-B
VC node SQ code PES FLOW RELATED NON FLOW RELATED EIS EI REC ACTIONS REQUIRED
UV Uklip C13C-02550 B
Mostly non-flow related activities related to agriculture.
HIGH HIGH B
Removal of exotic vegetation, preventing a general increase in these species which impact on the EIS.
C13C C13D-02416 B/C
Mostly non-flow related activities related to agriculture and some urbanization.
HIGH HIGH B Remove alien vegetation along channel. Agricultural activities in wetland should not be allowed.
C1KLIP-UNSPE1
C13D-02284 B/C Abstraction for
agriculture.
Mostly non-flow related activities related to agriculture, some abstraction.
MODERATE HIGH B See above and improvement of flow. Whole wetland should be managed as a unit at a B EC.
C13A C13B-02175 C Abstraction for
agriculture.
Agricultural activities and some abstraction. Alien vegetation.
MODERATE MODERATE C Assuming that flow is present in the system to maintain the PES/REC.
EWR 6 C13D-02226 B/C
Severely reduced base flows and moderate floods due to weirs and farm dams (many illegal).
Agriculture, cattle grazing, and alien vegetation.
MODERATE MOERATE B/C Present flow will maintain PES/REC.

Classification of Significant Water Resources in the Upper Middle and Lower Vaal WMAs Sta tus Quo Report
Status Quo Report V13 September 2011
44
VC node SQ code PES FLOW RELATED NON FLOW RELATED EIS EI REC ACTIONS REQUIRED
C1SAND-UNSPE
C13B-02135 C Abstraction for
agriculture.
Agricultural activities and some abstraction. Alien vegetation.
MODERATE MODERATE C Assuming that flow is present in the system to maintain the PES/REC.
C13E C13E-02228 B/C Abstraction for
agriculture.
Agricultural activities and some abstraction. Alien vegetation.
MODERATE HIGH B Increased flow and addressing agricultural activities.
C1KLIP-UNSPE2
C13H-02118 C/D Abstraction for
agriculture. Alien vegetation. MODERATE MODERATE C/D
To improve this section, increased flows will be required and the illegal dams will have to be addressed. To maintain the PES/REC there should be sufficient flow. It must be noted that EWR 6 results should probably be extrapolated to this point as it has a higher requirement.
C13G C13H-02156 C Abstraction for
agriculture. MODERATE MODERATE C Assume that flow is present in the system to maintain the PES/REC.
C13H C13H-02077 C/D Abstraction for
agriculture. Alien vegetation. MODERATE MODERATE C/D Assume that flow is present in the system to maintain the PES/REC.
The PES varies from a C/D (2 nodes) to a B (1 node). Most of the impacts associated in this reach are due to
flow modification related to agricultural abstraction and a number of illegal dams in the catchment. This IUA
includes the Seekoei Vlei Wetland which is a RAMSAR site and of which a section is protected in the Seekoei
Vlei Nature Reserve. As such, the SQ reaches of the upstream river and the reaches including the wetland are
of High importance. This situation leads to the REC being an improvement of the PES where the PES is lower
than a B. Most of the improvements would require non-flow related measures such as removal of alien
vegetation as well as the prevention of agriculture in the wetland. Further downstream in the wetland, a
decrease in flow also becomes an issue. The other node which also has a high importance is C13E
(Kommandospruit). Improvement in flow and improvement in agricultural practices will be required to achieve
the improvement to the REC. In terms of water quality, the Sand River sites are in a better condition than the
Klip River sites, with the average water quality category being a B/C and main land use being agricultural. The
condition in the Klip River catchment is much poorer, with sites ranging from a C to a C/D category. The main
land use is still agricultural, although there are discharges around certain urban areas (e.g. Vrede) which reduce
the water quality category.
4.3.3 Socio-economic Assessment
Table 4.4: Economic Impacts on Klip River (Free State) (2010)
GDP (R Million) Employment (Numbers) Income Households (R
Million)
Direct Total Direct Total Low Total
Irrigation Agriculture 16.8 58.6 340 706 7.0 37.4 Mining 329.1 577.3 502 881 23.4 183.5
Manufacturing 405.3 892.9 1 601 3 526 60.8 500.2
Power Generation N/A N/A N/A N/A N/A N/A
Total 751.3 1 528.8 2 443 5 113 91.2 721.1
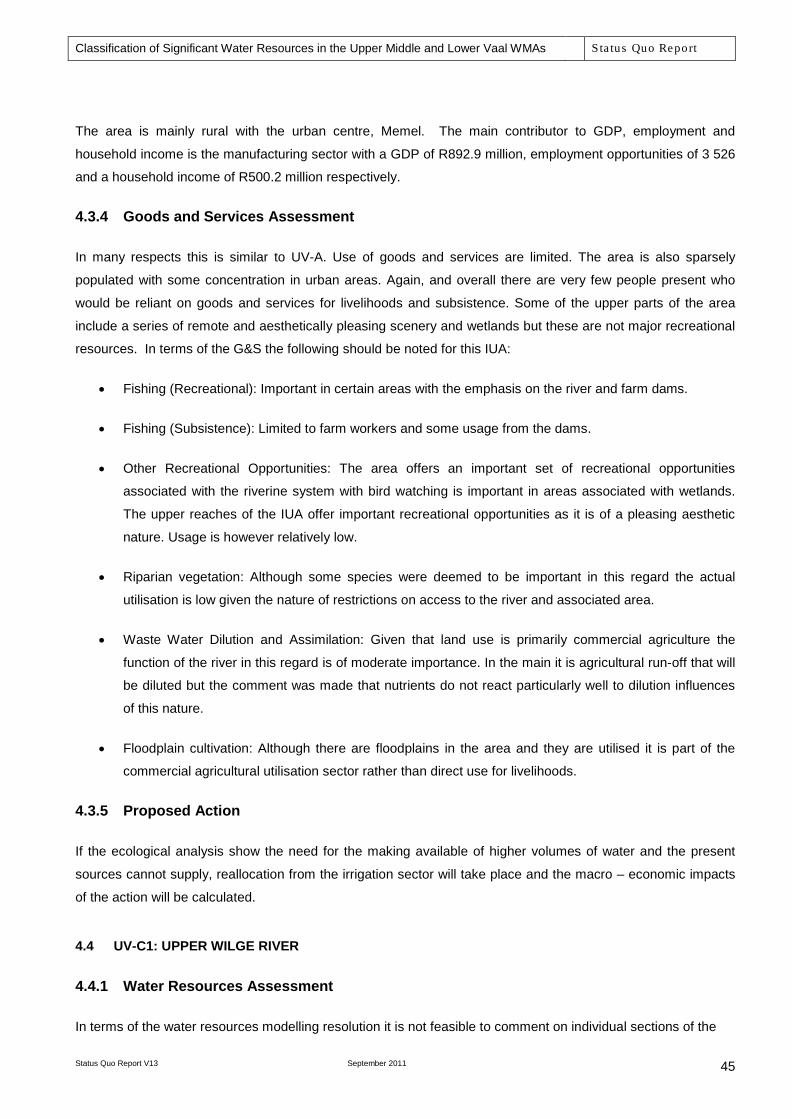
Classification of Significant Water Resources in the Upper Middle and Lower Vaal WMAs Sta tus Quo Report
Status Quo Report V13 September 2011
45
The area is mainly rural with the urban centre, Memel. The main contributor to GDP, employment and
household income is the manufacturing sector with a GDP of R892.9 million, employment opportunities of 3 526
and a household income of R500.2 million respectively.
4.3.4 Goods and Services Assessment
In many respects this is similar to UV-A. Use of goods and services are limited. The area is also sparsely
populated with some concentration in urban areas. Again, and overall there are very few people present who
would be reliant on goods and services for livelihoods and subsistence. Some of the upper parts of the area
include a series of remote and aesthetically pleasing scenery and wetlands but these are not major recreational
resources. In terms of the G&S the following should be noted for this IUA:
• Fishing (Recreational): Important in certain areas with the emphasis on the river and farm dams.
• Fishing (Subsistence): Limited to farm workers and some usage from the dams.
• Other Recreational Opportunities: The area offers an important set of recreational opportunities
associated with the riverine system with bird watching is important in areas associated with wetlands.
The upper reaches of the IUA offer important recreational opportunities as it is of a pleasing aesthetic
nature. Usage is however relatively low.
• Riparian vegetation: Although some species were deemed to be important in this regard the actual
utilisation is low given the nature of restrictions on access to the river and associated area.
• Waste Water Dilution and Assimilation: Given that land use is primarily commercial agriculture the
function of the river in this regard is of moderate importance. In the main it is agricultural run-off that will
be diluted but the comment was made that nutrients do not react particularly well to dilution influences
of this nature.
• Floodplain cultivation: Although there are floodplains in the area and they are utilised it is part of the
commercial agricultural utilisation sector rather than direct use for livelihoods.
4.3.5 Proposed Action
If the ecological analysis show the need for the making available of higher volumes of water and the present
sources cannot supply, reallocation from the irrigation sector will take place and the macro – economic impacts
of the action will be calculated.
4.4 UV-C1: UPPER WILGE RIVER
4.4.1 Water Resources Assessment
In terms of the water resources modelling resolution it is not feasible to comment on individual sections of the
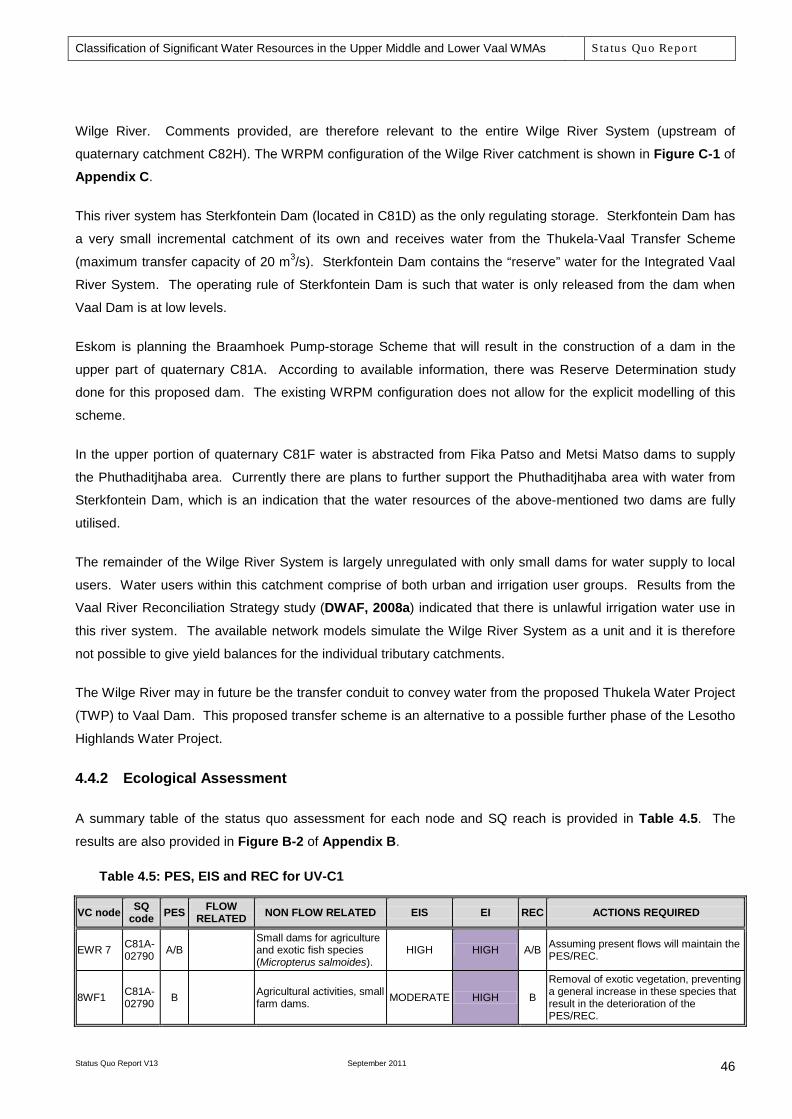
Classification of Significant Water Resources in the Upper Middle and Lower Vaal WMAs Sta tus Quo Report
Status Quo Report V13 September 2011
46
Wilge River. Comments provided, are therefore relevant to the entire Wilge River System (upstream of
quaternary catchment C82H). The WRPM configuration of the Wilge River catchment is shown in Figure C-1 of
Appendix C.
This river system has Sterkfontein Dam (located in C81D) as the only regulating storage. Sterkfontein Dam has
a very small incremental catchment of its own and receives water from the Thukela-Vaal Transfer Scheme
(maximum transfer capacity of 20 m3/s). Sterkfontein Dam contains the “reserve” water for the Integrated Vaal
River System. The operating rule of Sterkfontein Dam is such that water is only released from the dam when
Vaal Dam is at low levels.
Eskom is planning the Braamhoek Pump-storage Scheme that will result in the construction of a dam in the
upper part of quaternary C81A. According to available information, there was Reserve Determination study
done for this proposed dam. The existing WRPM configuration does not allow for the explicit modelling of this
scheme.
In the upper portion of quaternary C81F water is abstracted from Fika Patso and Metsi Matso dams to supply
the Phuthaditjhaba area. Currently there are plans to further support the Phuthaditjhaba area with water from
Sterkfontein Dam, which is an indication that the water resources of the above-mentioned two dams are fully
utilised.
The remainder of the Wilge River System is largely unregulated with only small dams for water supply to local
users. Water users within this catchment comprise of both urban and irrigation user groups. Results from the
Vaal River Reconciliation Strategy study (DWAF, 2008a) indicated that there is unlawful irrigation water use in
this river system. The available network models simulate the Wilge River System as a unit and it is therefore
not possible to give yield balances for the individual tributary catchments.
The Wilge River may in future be the transfer conduit to convey water from the proposed Thukela Water Project
(TWP) to Vaal Dam. This proposed transfer scheme is an alternative to a possible further phase of the Lesotho
Highlands Water Project.
4.4.2 Ecological Assessment
A summary table of the status quo assessment for each node and SQ reach is provided in Table 4.5. The
results are also provided in Figure B-2 of Appendix B.
Table 4.5: PES, EIS and REC for UV-C1
VC node SQ code PES FLOW
RELATED NON FLOW RELATED EIS EI REC ACTIONS REQUIRED
EWR 7 C81A-02790 A/B
Small dams for agriculture and exotic fish species (Micropterus salmoides).
HIGH HIGH A/B Assuming present flows will maintain the PES/REC.
8WF1 C81A-02790 B Agricultural activities, small
farm dams. MODERATE HIGH B
Removal of exotic vegetation, preventing a general increase in these species that result in the deterioration of the PES/REC.

Classification of Significant Water Resources in the Upper Middle and Lower Vaal WMAs Sta tus Quo Report
Status Quo Report V13 September 2011
47
VC node SQ code PES FLOW
RELATED NON FLOW RELATED EIS EI REC ACTIONS REQUIRED
8WF3 C81B-02864 C Agricultural activities. MODERATE LOW C
Removal of exotic vegetation, preventing a general increase in these species that result in the deterioration of the PES/REC.
UV25 C81L-02594 B
Agricultural activities, small farm dams and abstraction, alien vegetation.
MODERATE HIGH B
Removal of exotic vegetation, preventing a general increase in these species that result in the deterioration of the PES/REC.
UV28 C81M-02609 C Abstraction
Agricultural activities, small farm dams, alien vegetation.
MODERATE MODERATE C Assuming maintaining present flows will maintain the PES - removal of aliens will prevent the degradation of the PES/REC.
UV Cor C82A-02542 C Abstraction Barrier effect of instream
dams. MODERATE MODERATE C Assuming present flows will maintain the PES/REC.
C82B C82B-02540 C Abstraction MODERATE LOW C Assuming present flows will maintain the
PES/REC.
The PES is in a B and C state apart from EWR 7 (in the Upper Wilge wetlands) which is in an A/B PES. Most of
the impacts associated in this reach are due to agricultural activities with abstraction or flow modification being
an issue in the Cornelis River and the lower Meul River. The nodes with a High EI are:
• 8WF1 (in the Wilge River) which is a result of the high PES (B) and as such, do not require any
improvements to achieve a higher EC. Alien vegetation should however be removed to prevent further
infestation and a potential lowering in the EC.
• UV25 (in the upper Meul River) which is a result of the high PES (B) and as such, do not require any
improvements to achieve a higher EC. Alien vegetation should however be removed to prevent further
infestation and a potential lowering in the EC.
• EWR 7 (Wilge wetlands). The presence of alien fish species is impossible to eradicate, but some
control over the grazing and agricultural practices within the wetland should be installed.
The water quality state is a B to B/C category across the catchment, with agricultural activities dominating.
4.4.3 Socio-economic Assessment
As it is impractical to do the socio-economic assessment of the individual integrated units of analyses UV-C1 to
UV-C3 separately, it has been included in the Socio-Economic Assessment of the combined UV-C1 to UV-C3:
Wilge River.
The area is to a large extent rural and includes the urban centres of Witsieshoek, Harrismith and Kestell. The
main contributor to GDP, employment and household income is the manufacturing sector with a GDP of
R1 198.7 million, employment opportunities of 4 734 and a household income of R671.5 million respectively.
Irrigation agriculture offers the highest direct employment opportunities in the area.
Classification of Significant Water Resources in the Upper Middle and Lower Vaal WMAs Sta tus Quo Report
Status Quo Report V13 September 2011
48
Table 4.6: Economic Impacts on Wilge River UV-C1 to UV-C3 (2010)
GDP (R Million)
Employment (Numbers)
Income Households (R Million)
Direct Total Direct Total Low Total
Irrigation Agriculture 79.6 277.1 2 799 4 519 34.6 177.9
Mining - - - - - -
Manufacturing 544.2 1 198.7 2 149 4 734 81.7 671.5
Power Generation N/A N/A N/A N/A N/A N/A
Total 623.8 1 475.8 4 948 9 253 116.2 849.4
4.4.4 Goods and Services Assessment
The area is sparsely populated with some concentration in urban areas, notably Harrismith and Warden.
However, overall there are very few people present who would be reliant on goods and services for livelihoods
and subsistence. There is some recreational fishing and some other additional recreational use of the riverine
resources but by and large the area is dominated by mixed farming of a commercial nature. Some of the upper
parts of the area include a series of remote and aesthetically pleasing scenery and wetlands but these are not
major recreational resources. In summary, the following should be noted:
• Fishing (Recreational): Important in certain areas with the emphasis on the river and farm dams.
• Fishing (Subsistence): Limited to farm workers and some usage from the dams
• Other Recreational Opportunities: The area offers an important set of recreational opportunities
associated with the riverine system with bird watching is important in areas associated with wetlands.
The upper reaches of the IUA offer important recreational opportunities as it is of a pleasing aesthetic
nature. Usage is however relatively low
• Riparian vegetation: Although some species were deemed to be important in this regard the actual
utilisation is low given the nature of restrictions on access to the river and associated area.
• Waste Water Dilution and Assimilation: Given that land use is primarily commercial agriculture the
function of the river in this regard is of moderate importance. It is mainly agricultural runoff that will be
diluted but the comment was made that nutrients do not react particularly well to dilution influences of
this nature.
• Floodplain cultivation: Although there are floodplains in the area and they are utilised it is part of the
commercial agricultural utilisation sector rather than direct use for livelihoods.
4.4.5 Proposed Action
If the ecological analysis show the need for the making available of higher volumes of water and the present
sources cannot supply, reallocation from the irrigation sector will take place and the macro – economic impacts
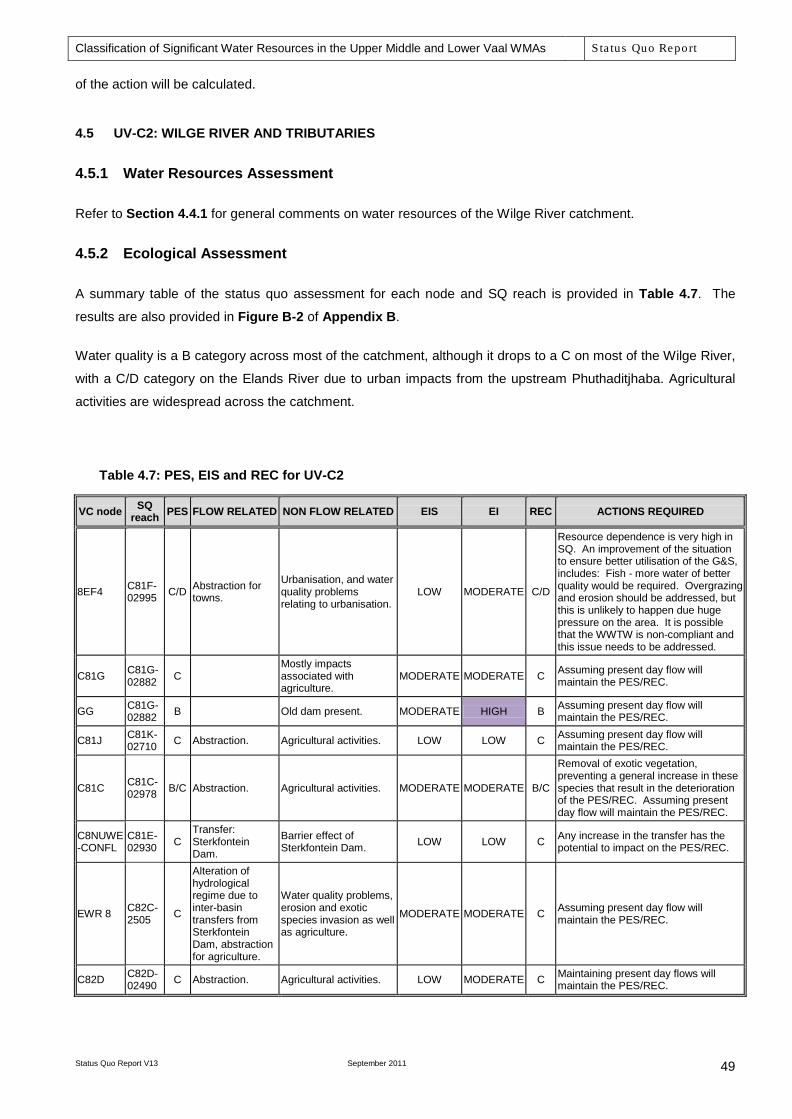
Classification of Significant Water Resources in the Upper Middle and Lower Vaal WMAs Sta tus Quo Report
Status Quo Report V13 September 2011
49
of the action will be calculated.
4.5 UV-C2: WILGE RIVER AND TRIBUTARIES
4.5.1 Water Resources Assessment
Refer to Section 4.4.1 for general comments on water resources of the Wilge River catchment.
4.5.2 Ecological Assessment
A summary table of the status quo assessment for each node and SQ reach is provided in Table 4.7. The
results are also provided in Figure B-2 of Appendix B.
Water quality is a B category across most of the catchment, although it drops to a C on most of the Wilge River,
with a C/D category on the Elands River due to urban impacts from the upstream Phuthaditjhaba. Agricultural
activities are widespread across the catchment.
Table 4.7: PES, EIS and REC for UV-C2
VC node SQ reach PES FLOW RELATED NON FLOW RELATED EIS EI REC ACTIONS REQUIRED
8EF4 C81F-02995 C/D Abstraction for
towns.
Urbanisation, and water quality problems relating to urbanisation.
LOW MODERATE C/D
Resource dependence is very high in SQ. An improvement of the situation to ensure better utilisation of the G&S, includes: Fish - more water of better quality would be required. Overgrazing and erosion should be addressed, but this is unlikely to happen due huge pressure on the area. It is possible that the WWTW is non-compliant and this issue needs to be addressed.
C81G C81G-02882 C
Mostly impacts associated with agriculture.
MODERATE MODERATE C Assuming present day flow will maintain the PES/REC.
GG C81G-02882 B Old dam present. MODERATE HIGH B Assuming present day flow will
maintain the PES/REC.
C81J C81K-02710 C Abstraction. Agricultural activities. LOW LOW C Assuming present day flow will
maintain the PES/REC.
C81C C81C-02978 B/C Abstraction. Agricultural activities. MODERATE MODERATE B/C
Removal of exotic vegetation, preventing a general increase in these species that result in the deterioration of the PES/REC. Assuming present day flow will maintain the PES/REC.
C8NUWE-CONFL
C81E-02930 C
Transfer: Sterkfontein Dam.
Barrier effect of Sterkfontein Dam. LOW LOW C Any increase in the transfer has the
potential to impact on the PES/REC.
EWR 8 C82C-2505 C
Alteration of hydrological regime due to inter-basin transfers from Sterkfontein Dam, abstraction for agriculture.
Water quality problems, erosion and exotic species invasion as well as agriculture.
MODERATE MODERATE C Assuming present day flow will maintain the PES/REC.
C82D C82D-02490 C Abstraction. Agricultural activities. LOW MODERATE C Maintaining present day flows will
maintain the PES/REC.

Classification of Significant Water Resources in the Upper Middle and Lower Vaal WMAs Sta tus Quo Report
Status Quo Report V13 September 2011
50
The PES ranges from a C/D to a B state. The impacts in this reach are varied with abstraction and agriculture
dominating in most areas. C8Nuwe-confl is dominated by the transfer from Sterkfontein Dam. Rivers in the
vicinity of Harrysmith and downstream of Phuthaditjhaba have water quality problems. The node with a High EI
is GG which is a new node to represent only the Golden Gate section of C81C-02882. As the PES is already in
a B, no action is required to maintain/achieve the REC. The only impact in this reach is an old dam which of
which the wall has been breached. It seems as it this dam has created an artificial wetland in the backup zone.
4.5.3 Socio-economic Assessment
See the Socio-Economic Assessment in Section 4.4.3 above.
4.5.4 Goods and Services Assessment
From the perspective of the Upper Vaal WMA this is an important area with respect to reliance on resources as
a part of livelihoods. Goods and services are particularly important in the upper part of the catchment as this is
made up of the areas that were the former homeland of Qwa-Qwa around the town of Phuthaditjhaba. This
includes some of the most marginal areas of the country. People were largely forcibly settled into the area as
displaced farmworkers and continue to be a marginal community displaced from the economic centres of the
country. The importance of the goods and services to provide part of livelihoods, even within the now dense
closer settlement of the area should not be overlooked. Golden Gate is also part of this IUA and provides an
important recreational resource of which the river is an important component. The remainder of the IUA is
similar to the previous area and dominated by commercial and mixed farming. Some recreational fishing is
important. The following should be noted for this IUA:
• Fishing (Recreational): Important in certain areas with the emphasis on the river and farm dams and the
Golden Gate area.
• Fishing (Subsistence): Important with respect to resident of the Phuthaditjhaba. Also some more limited
use by farmworkers and some usage from the dams.
• Other Recreational Opportunities: The area offers an important set of recreational opportunities
associated with the riverine system with bird watching is important in areas associated with wetlands
and with the Golden Gate area. The upper reaches of the IUA offer important recreational opportunities
as it is of a pleasing aesthetic nature. Usage is more pronounced than the other IUAs considered so far.
• Riparian vegetation: This is an important component of the livelihoods strategies of people in the
Phuthaditjhaba area. Resources are however highly utilised and sustainability of utilisation is
questionable.
• Waste Water Dilution and Assimilation: Waste water dilution from Phuthaditjhaba is important. Also
given that land use is primarily commercial agriculture the function of the river in this regard is of
importance.
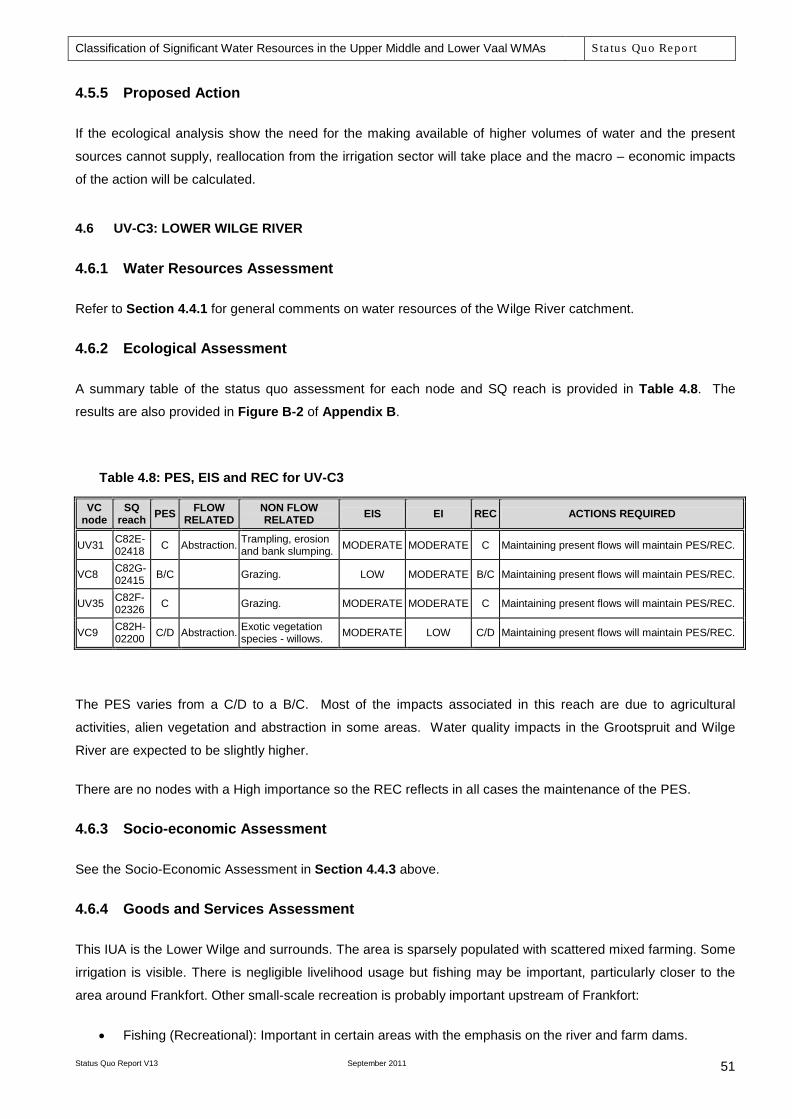
Classification of Significant Water Resources in the Upper Middle and Lower Vaal WMAs Sta tus Quo Report
Status Quo Report V13 September 2011
51
4.5.5 Proposed Action
If the ecological analysis show the need for the making available of higher volumes of water and the present
sources cannot supply, reallocation from the irrigation sector will take place and the macro – economic impacts
of the action will be calculated.
4.6 UV-C3: LOWER WILGE RIVER
4.6.1 Water Resources Assessment
Refer to Section 4.4.1 for general comments on water resources of the Wilge River catchment.
4.6.2 Ecological Assessment
A summary table of the status quo assessment for each node and SQ reach is provided in Table 4.8. The
results are also provided in Figure B-2 of Appendix B.
Table 4.8: PES, EIS and REC for UV-C3
VC node
SQ reach PES FLOW
RELATED NON FLOW RELATED EIS EI REC ACTIONS REQUIRED
UV31 C82E-02418 C Abstraction. Trampling, erosion
and bank slumping. MODERATE MODERATE C Maintaining present flows will maintain PES/REC.
VC8 C82G-02415 B/C Grazing. LOW MODERATE B/C Maintaining present flows will maintain PES/REC.
UV35 C82F-02326 C Grazing. MODERATE MODERATE C Maintaining present flows will maintain PES/REC.
VC9 C82H-02200 C/D Abstraction. Exotic vegetation
species - willows. MODERATE LOW C/D Maintaining present flows will maintain PES/REC.
The PES varies from a C/D to a B/C. Most of the impacts associated in this reach are due to agricultural
activities, alien vegetation and abstraction in some areas. Water quality impacts in the Grootspruit and Wilge
River are expected to be slightly higher.
There are no nodes with a High importance so the REC reflects in all cases the maintenance of the PES.
4.6.3 Socio-economic Assessment
See the Socio-Economic Assessment in Section 4.4.3 above.
4.6.4 Goods and Services Assessment
This IUA is the Lower Wilge and surrounds. The area is sparsely populated with scattered mixed farming. Some
irrigation is visible. There is negligible livelihood usage but fishing may be important, particularly closer to the
area around Frankfort. Other small-scale recreation is probably important upstream of Frankfort:
• Fishing (Recreational): Important in certain areas with the emphasis on the river and farm dams.

Classification of Significant Water Resources in the Upper Middle and Lower Vaal WMAs Sta tus Quo Report
Status Quo Report V13 September 2011
52
• Fishing (Subsistence): Limited to farm workers with some usage from the dams.
• Other Recreational Opportunities: The area offers a relatively limited set of recreational opportunities.
• Riparian vegetation: Although some species were deemed to be important in this regard the actual
utilisation is low given the nature of restrictions on access to the river and associated area.
• Waste Water Dilution and Assimilation: Given that land use is primarily commercial agriculture the
function of the river in this regard is of moderate importance. It is mainly agricultural run-off that will be
diluted but the comment was made that nutrients do not react particularly well to dilution influences of
this nature.
• Floodplain cultivation: Although there are floodplains in the area and they are utilised it is part of the
commercial agricultural utilisation sector rather than direct use for livelihoods.
4.6.5 Proposed Action
If the ecological analysis show the need for the making available of higher volumes of water and the present
sources cannot supply, reallocation from the irrigation sector will take place and the macro – economic impacts
of the action will be calculated.
4.7 UV-D: LIEBENBERGSVLEI RIVER
4.7.1 Water Resources Assessment
The flow in the Liebenbergsvlei River (including and upstream of C83H) is dominated by the transfer from the
Lesotho Highlands Water Project (LHWP). The LHWP water is discharged into the river system upstream of
Saulspoort Dam (located in quaternary catchment C83A). Saulspoort Dam supplies water to the town of
Bethlehem as well as to irrigation farmers. There are significant irrigation abstractions along the
Liebenbergsvlei River, of which a significant portion is considered to be unlawful (refer to Table F-2 of
Appendix F for details). The WRPM configuration of this IUA is shown in Figure C-1 of Appendix C.
4.7.2 Ecological Assessment
A summary table of the status quo assessment for each node and SQ reach is provided in Table 4.9. The
results are also provided in Figure B-2 of Appendix B.
Table 4.9: PES, EIS and REC for UV-D
VC node
SQ code PES FLOW
RELATED NON FLOW RELATED EIS EI REC ACTIONS REQUIRED
VC15 C83A-02863 C Erosion and incision. MODERATE LOW C Maintain present flow to maintain PES/REC.
C83D C83E-02588 C Agriculture and
irrigation. MODERATE MODERATE C Maintain present flow to maintain PES/REC.
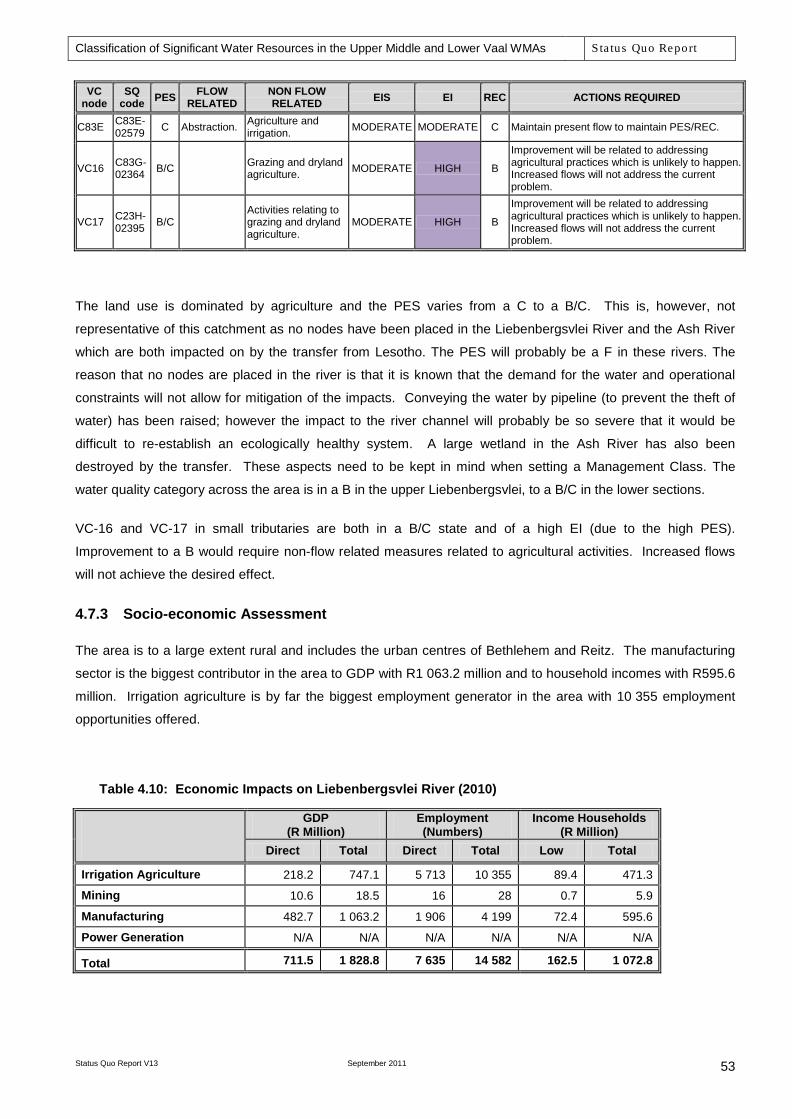
Classification of Significant Water Resources in the Upper Middle and Lower Vaal WMAs Sta tus Quo Report
Status Quo Report V13 September 2011
53
VC node
SQ code PES FLOW
RELATED NON FLOW RELATED EIS EI REC ACTIONS REQUIRED
C83E C83E-02579 C Abstraction. Agriculture and
irrigation. MODERATE MODERATE C Maintain present flow to maintain PES/REC.
VC16 C83G-02364 B/C
Grazing and dryland agriculture. MODERATE HIGH B
Improvement will be related to addressing agricultural practices which is unlikely to happen. Increased flows will not address the current problem.
VC17 C23H-02395 B/C
Activities relating to grazing and dryland agriculture.
MODERATE HIGH B
Improvement will be related to addressing agricultural practices which is unlikely to happen. Increased flows will not address the current problem.
The land use is dominated by agriculture and the PES varies from a C to a B/C. This is, however, not
representative of this catchment as no nodes have been placed in the Liebenbergsvlei River and the Ash River
which are both impacted on by the transfer from Lesotho. The PES will probably be a F in these rivers. The
reason that no nodes are placed in the river is that it is known that the demand for the water and operational
constraints will not allow for mitigation of the impacts. Conveying the water by pipeline (to prevent the theft of
water) has been raised; however the impact to the river channel will probably be so severe that it would be
difficult to re-establish an ecologically healthy system. A large wetland in the Ash River has also been
destroyed by the transfer. These aspects need to be kept in mind when setting a Management Class. The
water quality category across the area is in a B in the upper Liebenbergsvlei, to a B/C in the lower sections.
VC-16 and VC-17 in small tributaries are both in a B/C state and of a high EI (due to the high PES).
Improvement to a B would require non-flow related measures related to agricultural activities. Increased flows
will not achieve the desired effect.
4.7.3 Socio-economic Assessment
The area is to a large extent rural and includes the urban centres of Bethlehem and Reitz. The manufacturing
sector is the biggest contributor in the area to GDP with R1 063.2 million and to household incomes with R595.6
million. Irrigation agriculture is by far the biggest employment generator in the area with 10 355 employment
opportunities offered.
Table 4.10: Economic Impacts on Liebenbergsvlei River (2010)
GDP (R Million)
Employment (Numbers)
Income Households (R Million)
Direct Total Direct Total Low Total
Irrigation Agriculture 218.2 747.1 5 713 10 355 89.4 471.3
Mining 10.6 18.5 16 28 0.7 5.9
Manufacturing 482.7 1 063.2 1 906 4 199 72.4 595.6
Power Generation N/A N/A N/A N/A N/A N/A
Total 711.5 1 828.8 7 635 14 582 162.5 1 072.8
Classification of Significant Water Resources in the Upper Middle and Lower Vaal WMAs Sta tus Quo Report
Status Quo Report V13 September 2011
54
4.7.4 Goods and Services Assessment
The area is sparsely populated with scattered mixed farming enterprises the dominant land form. Some
irrigation is visible. There is negligible livelihood usage but fishing may be important. Some of the higher flows
from the transfer may promote other recreational aspects such as canoeing. Livelihood usage is almost zero.
• Fishing (Recreational): Important in certain areas with the emphasis on the river and farm dams.
• Fishing (Subsistence): Limited to farm workers and some usage from the dams.
• Other Recreational Opportunities: The area offers a relatively limited set of recreational opportunities
bar that downstream of the transfer where some white water canoeing appears to be of importance.
• Riparian vegetation: Although some species were deemed to be important in this regard the actual
utilisation is low given the nature of restrictions on access to the river and associated area.
• Waste Water Dilution and Assimilation: Given that land use is primarily commercial agriculture the
function of the river in this regard is of moderate importance. It is mainly agricultural run off that will be
diluted but the comment was made that nutrients do not react particularly well to dilution influences of
this nature.
• Floodplain cultivation: Although there are floodplains in the area and they are utilised it is part of the
commercial agricultural utilisation sector rather than direct use for livelihoods.
4.7.5 Corrective Action
This tributary carries the water from the Lesotho Highlands Scheme from the point of release above Bethlehem
and no corrective action involving volumes of water is foreseen in the tributary.
4.8 UV-E: WATERVAL RIVER
4.8.1 Water Resources Assessment
The Waterval River receives discharges from the Sasol Secunda Complex as well as treated urban wastewater.
From the salinity balance done by Chris Herold as part of the Vaal River System Analysis Update (VRSAU)
study, there is also evidence of mine water seepage and runoff from the paved urbanised areas contributing to
the flow in the river. There are irrigators situated downstream of the above-mentioned discharges. The WRPM
configuration of the Waterval catchment (refer to Figure C-1 of Appendix C) was refined for the purposes of the
Comprehensive Reserve Determination Study (DWA, 2010d) to allow for the explicit modelling of the two EWR
sites resulting from the most recent Reserve study undertaken by BKS. Results from the Validation and
Verification Study indicated that unlawful irrigation water use occurs in this catchment.
4.8.2 Ecological Assessment
A summary table of the status quo assessment for each node and SQ reach is provided in Table 4.11. The
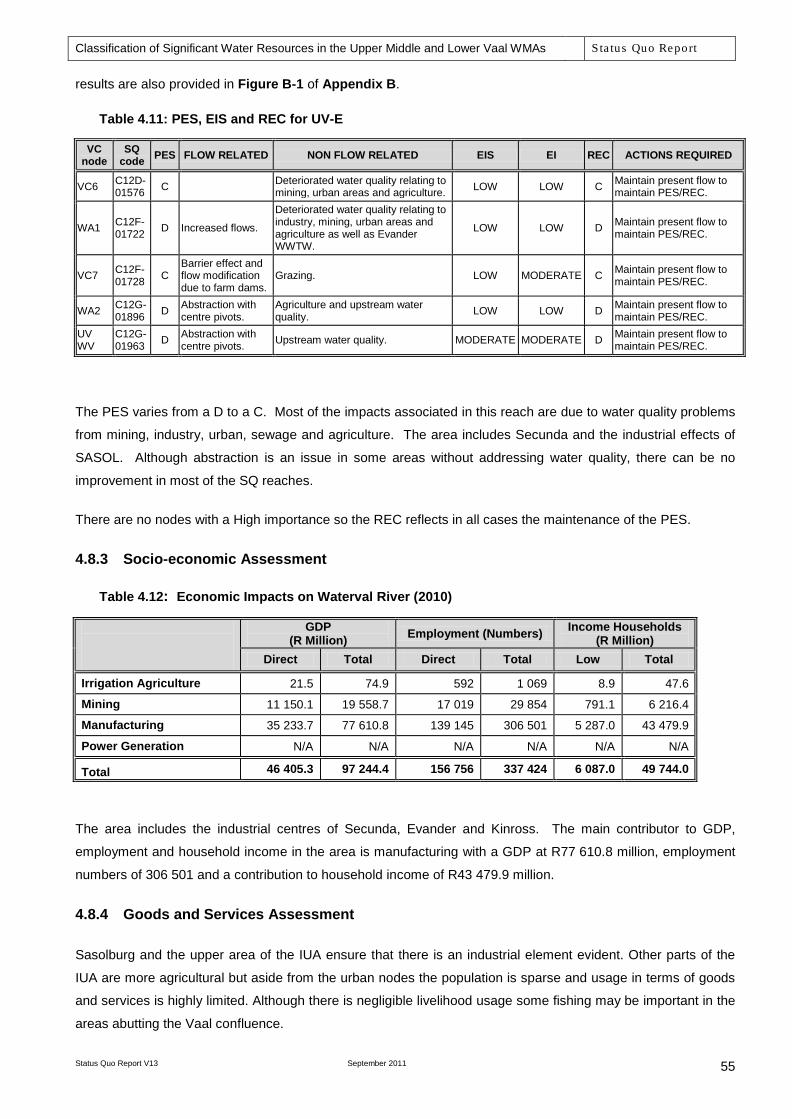
Classification of Significant Water Resources in the Upper Middle and Lower Vaal WMAs Sta tus Quo Report
Status Quo Report V13 September 2011
55
results are also provided in Figure B-1 of Appendix B.
Table 4.11: PES, EIS and REC for UV-E
VC node
SQ code PES FLOW RELATED NON FLOW RELATED EIS EI REC ACTIONS REQUIRED
VC6 C12D-01576 C Deteriorated water quality relating to
mining, urban areas and agriculture. LOW LOW C Maintain present flow to maintain PES/REC.
WA1 C12F-01722 D Increased flows.
Deteriorated water quality relating to industry, mining, urban areas and agriculture as well as Evander WWTW.
LOW LOW D Maintain present flow to maintain PES/REC.
VC7 C12F-01728 C
Barrier effect and flow modification due to farm dams.
Grazing. LOW MODERATE C Maintain present flow to maintain PES/REC.
WA2 C12G-01896 D Abstraction with
centre pivots. Agriculture and upstream water quality. LOW LOW D Maintain present flow to
maintain PES/REC. UV WV
C12G-01963 D Abstraction with
centre pivots. Upstream water quality. MODERATE MODERATE D Maintain present flow to maintain PES/REC.
The PES varies from a D to a C. Most of the impacts associated in this reach are due to water quality problems
from mining, industry, urban, sewage and agriculture. The area includes Secunda and the industrial effects of
SASOL. Although abstraction is an issue in some areas without addressing water quality, there can be no
improvement in most of the SQ reaches.
There are no nodes with a High importance so the REC reflects in all cases the maintenance of the PES.
4.8.3 Socio-economic Assessment
Table 4.12: Economic Impacts on Waterval River (2010)
GDP (R Million) Employment (Numbers) Income Households
(R Million) Direct Total Direct Total Low Total
Irrigation Agriculture 21.5 74.9 592 1 069 8.9 47.6
Mining 11 150.1 19 558.7 17 019 29 854 791.1 6 216.4
Manufacturing 35 233.7 77 610.8 139 145 306 501 5 287.0 43 479.9
Power Generation N/A N/A N/A N/A N/A N/A
Total 46 405.3 97 244.4 156 756 337 424 6 087.0 49 744.0
The area includes the industrial centres of Secunda, Evander and Kinross. The main contributor to GDP,
employment and household income in the area is manufacturing with a GDP at R77 610.8 million, employment
numbers of 306 501 and a contribution to household income of R43 479.9 million.
4.8.4 Goods and Services Assessment
Sasolburg and the upper area of the IUA ensure that there is an industrial element evident. Other parts of the
IUA are more agricultural but aside from the urban nodes the population is sparse and usage in terms of goods
and services is highly limited. Although there is negligible livelihood usage some fishing may be important in the
areas abutting the Vaal confluence.
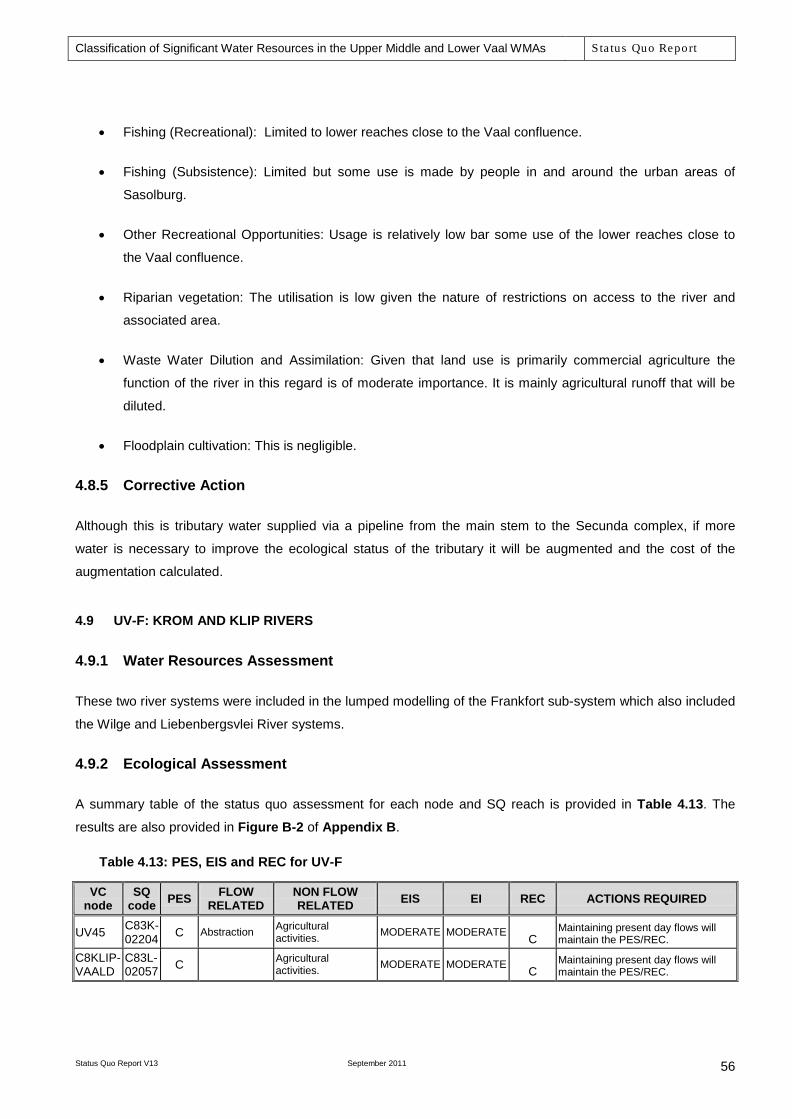
Classification of Significant Water Resources in the Upper Middle and Lower Vaal WMAs Sta tus Quo Report
Status Quo Report V13 September 2011
56
• Fishing (Recreational): Limited to lower reaches close to the Vaal confluence.
• Fishing (Subsistence): Limited but some use is made by people in and around the urban areas of
Sasolburg.
• Other Recreational Opportunities: Usage is relatively low bar some use of the lower reaches close to
the Vaal confluence.
• Riparian vegetation: The utilisation is low given the nature of restrictions on access to the river and
associated area.
• Waste Water Dilution and Assimilation: Given that land use is primarily commercial agriculture the
function of the river in this regard is of moderate importance. It is mainly agricultural runoff that will be
diluted.
• Floodplain cultivation: This is negligible.
4.8.5 Corrective Action
Although this is tributary water supplied via a pipeline from the main stem to the Secunda complex, if more
water is necessary to improve the ecological status of the tributary it will be augmented and the cost of the
augmentation calculated.
4.9 UV-F: KROM AND KLIP RIVERS
4.9.1 Water Resources Assessment
These two river systems were included in the lumped modelling of the Frankfort sub-system which also included
the Wilge and Liebenbergsvlei River systems.
4.9.2 Ecological Assessment
A summary table of the status quo assessment for each node and SQ reach is provided in Table 4.13. The
results are also provided in Figure B-2 of Appendix B.
Table 4.13: PES, EIS and REC for UV-F
VC node
SQ code PES FLOW
RELATED NON FLOW RELATED EIS EI REC ACTIONS REQUIRED
UV45 C83K-02204 C Abstraction Agricultural
activities. MODERATE MODERATE C Maintaining present day flows will maintain the PES/REC.
C8KLIP-VAALD
C83L-02057 C Agricultural
activities. MODERATE MODERATE C Maintaining present day flows will maintain the PES/REC.
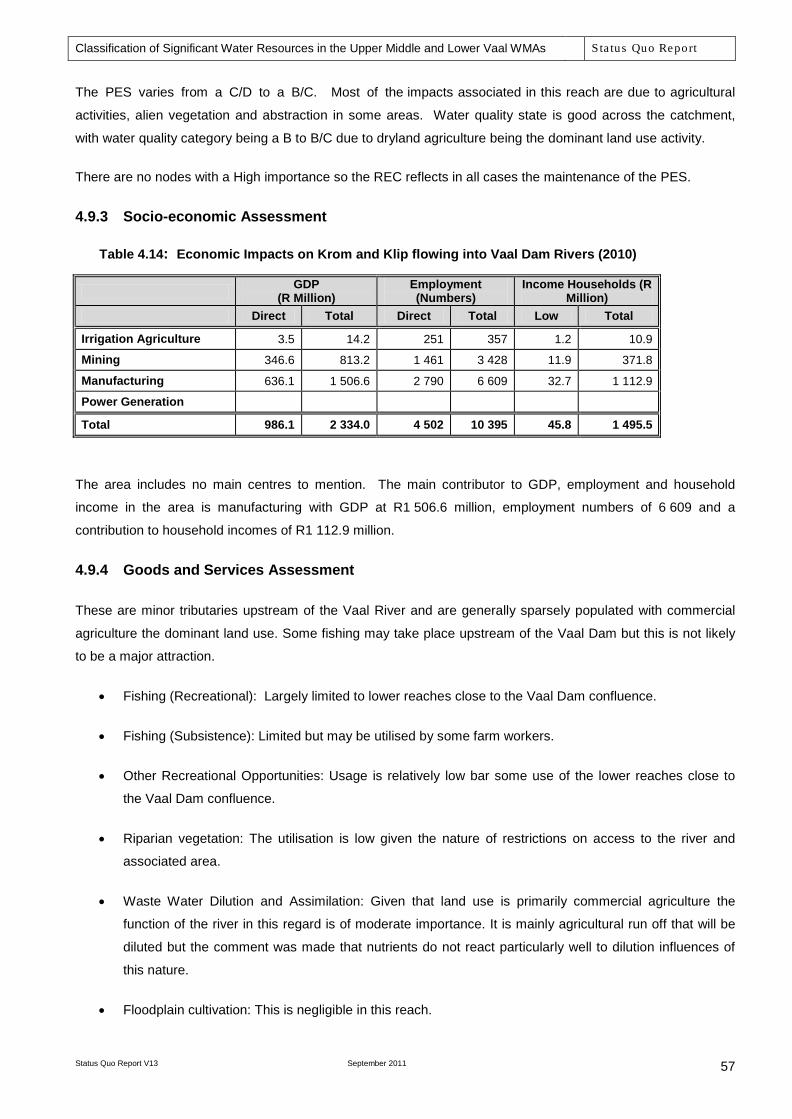
Classification of Significant Water Resources in the Upper Middle and Lower Vaal WMAs Sta tus Quo Report
Status Quo Report V13 September 2011
57
The PES varies from a C/D to a B/C. Most of the impacts associated in this reach are due to agricultural
activities, alien vegetation and abstraction in some areas. Water quality state is good across the catchment,
with water quality category being a B to B/C due to dryland agriculture being the dominant land use activity.
There are no nodes with a High importance so the REC reflects in all cases the maintenance of the PES.
4.9.3 Socio-economic Assessment
Table 4.14: Economic Impacts on Krom and Klip flowing into Vaal Dam Rivers (2010)
GDP (R Million)
Employment (Numbers)
Income Households (R Million)
Direct Total Direct Total Low Total
Irrigation Agriculture 3.5 14.2 251 357 1.2 10.9
Mining 346.6 813.2 1 461 3 428 11.9 371.8
Manufacturing 636.1 1 506.6 2 790 6 609 32.7 1 112.9
Power Generation Total 986.1 2 334.0 4 502 10 395 45.8 1 495.5
The area includes no main centres to mention. The main contributor to GDP, employment and household
income in the area is manufacturing with GDP at R1 506.6 million, employment numbers of 6 609 and a
contribution to household incomes of R1 112.9 million.
4.9.4 Goods and Services Assessment
These are minor tributaries upstream of the Vaal River and are generally sparsely populated with commercial
agriculture the dominant land use. Some fishing may take place upstream of the Vaal Dam but this is not likely
to be a major attraction.
• Fishing (Recreational): Largely limited to lower reaches close to the Vaal Dam confluence.
• Fishing (Subsistence): Limited but may be utilised by some farm workers.
• Other Recreational Opportunities: Usage is relatively low bar some use of the lower reaches close to
the Vaal Dam confluence.
• Riparian vegetation: The utilisation is low given the nature of restrictions on access to the river and
associated area.
• Waste Water Dilution and Assimilation: Given that land use is primarily commercial agriculture the
function of the river in this regard is of moderate importance. It is mainly agricultural run off that will be
diluted but the comment was made that nutrients do not react particularly well to dilution influences of
this nature.
• Floodplain cultivation: This is negligible in this reach.
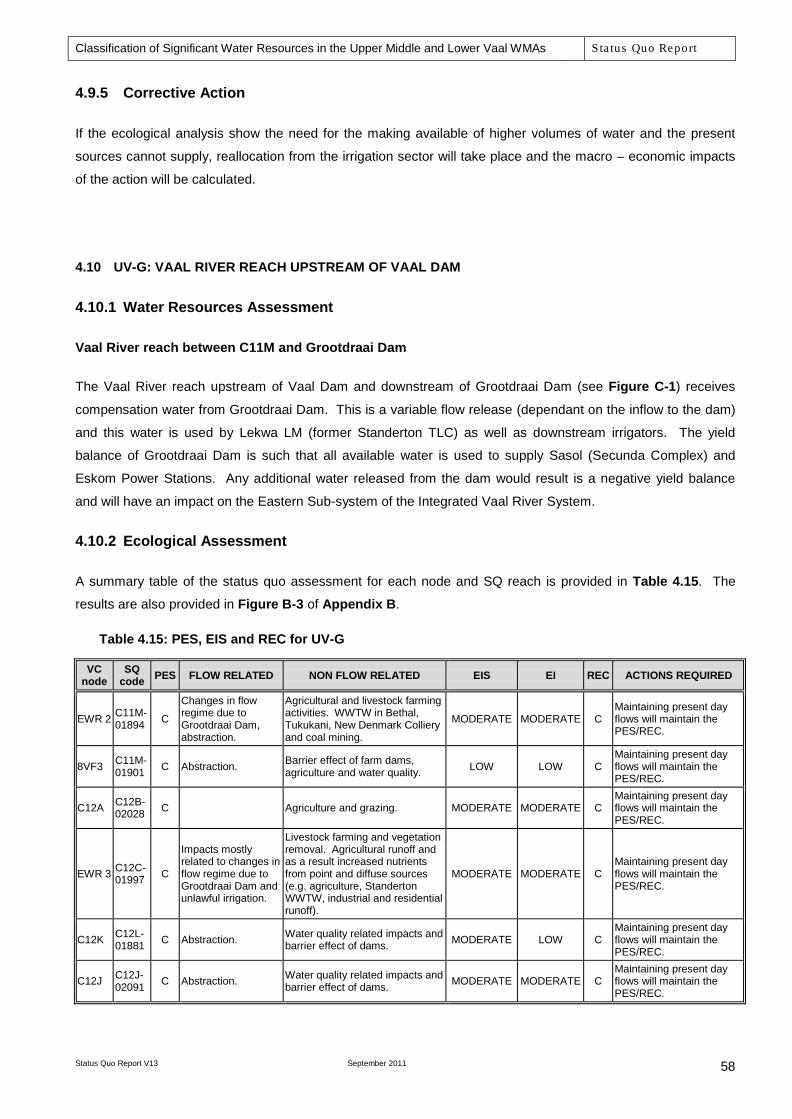
Classification of Significant Water Resources in the Upper Middle and Lower Vaal WMAs Sta tus Quo Report
Status Quo Report V13 September 2011
58
4.9.5 Corrective Action
If the ecological analysis show the need for the making available of higher volumes of water and the present
sources cannot supply, reallocation from the irrigation sector will take place and the macro – economic impacts
of the action will be calculated.
4.10 UV-G: VAAL RIVER REACH UPSTREAM OF VAAL DAM
4.10.1 Water Resources Assessment
Vaal River reach between C11M and Grootdraai Dam
The Vaal River reach upstream of Vaal Dam and downstream of Grootdraai Dam (see Figure C-1) receives
compensation water from Grootdraai Dam. This is a variable flow release (dependant on the inflow to the dam)
and this water is used by Lekwa LM (former Standerton TLC) as well as downstream irrigators. The yield
balance of Grootdraai Dam is such that all available water is used to supply Sasol (Secunda Complex) and
Eskom Power Stations. Any additional water released from the dam would result is a negative yield balance
and will have an impact on the Eastern Sub-system of the Integrated Vaal River System.
4.10.2 Ecological Assessment
A summary table of the status quo assessment for each node and SQ reach is provided in Table 4.15. The
results are also provided in Figure B-3 of Appendix B.
Table 4.15: PES, EIS and REC for UV-G
VC node
SQ code PES FLOW RELATED NON FLOW RELATED EIS EI REC ACTIONS REQUIRED
EWR 2 C11M-01894 C
Changes in flow regime due to Grootdraai Dam, abstraction.
Agricultural and livestock farming activities. WWTW in Bethal, Tukukani, New Denmark Colliery and coal mining.
MODERATE MODERATE C Maintaining present day flows will maintain the PES/REC.
8VF3 C11M-01901 C Abstraction. Barrier effect of farm dams,
agriculture and water quality. LOW LOW C Maintaining present day flows will maintain the PES/REC.
C12A C12B-02028 C Agriculture and grazing. MODERATE MODERATE C
Maintaining present day flows will maintain the PES/REC.
EWR 3 C12C-01997 C
Impacts mostly related to changes in flow regime due to Grootdraai Dam and unlawful irrigation.
Livestock farming and vegetation removal. Agricultural runoff and as a result increased nutrients from point and diffuse sources (e.g. agriculture, Standerton WWTW, industrial and residential runoff).
MODERATE MODERATE C Maintaining present day flows will maintain the PES/REC.
C12K C12L-01881 C Abstraction. Water quality related impacts and
barrier effect of dams. MODERATE LOW C Maintaining present day flows will maintain the PES/REC.
C12J C12J-02091 C Abstraction. Water quality related impacts and
barrier effect of dams. MODERATE MODERATE C Maintaining present day flows will maintain the PES/REC.
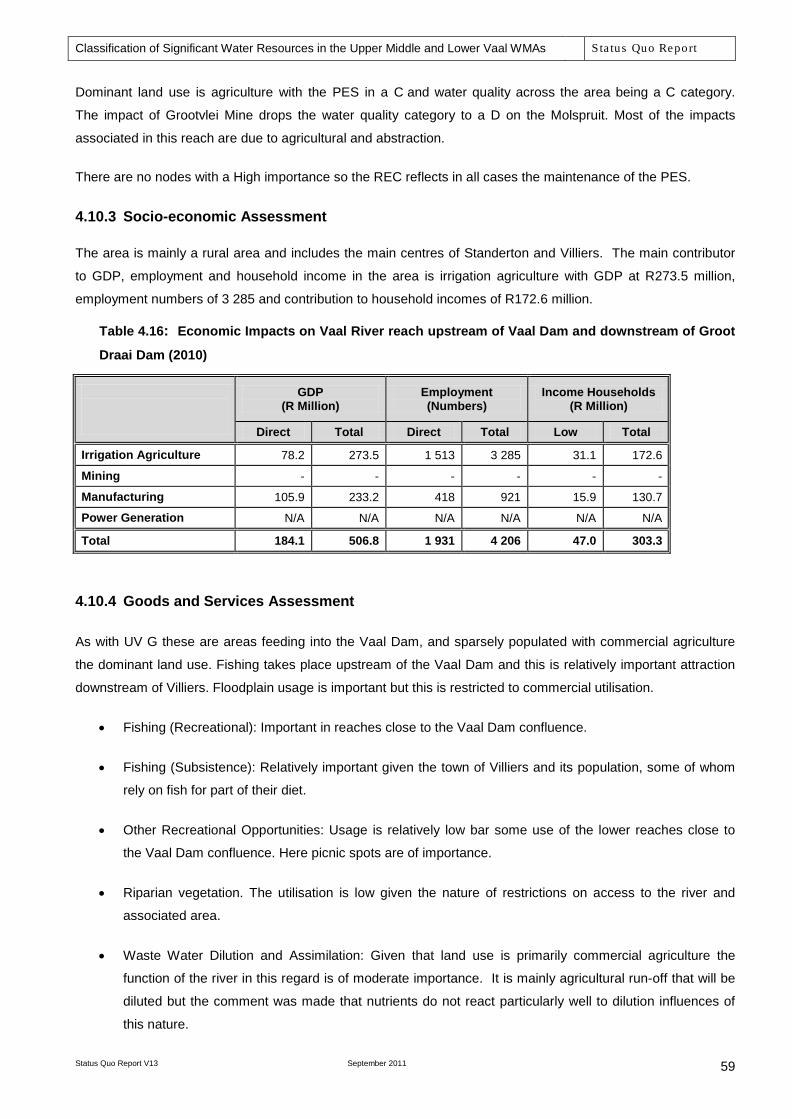
Classification of Significant Water Resources in the Upper Middle and Lower Vaal WMAs Sta tus Quo Report
Status Quo Report V13 September 2011
59
Dominant land use is agriculture with the PES in a C and water quality across the area being a C category.
The impact of Grootvlei Mine drops the water quality category to a D on the Molspruit. Most of the impacts
associated in this reach are due to agricultural and abstraction.
There are no nodes with a High importance so the REC reflects in all cases the maintenance of the PES.
4.10.3 Socio-economic Assessment
The area is mainly a rural area and includes the main centres of Standerton and Villiers. The main contributor
to GDP, employment and household income in the area is irrigation agriculture with GDP at R273.5 million,
employment numbers of 3 285 and contribution to household incomes of R172.6 million.
Table 4.16: Economic Impacts on Vaal River reach upstream of Vaal Dam and downstream of Groot
Draai Dam (2010)
GDP (R Million)
Employment (Numbers)
Income Households (R Million)
Direct Total Direct Total Low Total
Irrigation Agriculture 78.2 273.5 1 513 3 285 31.1 172.6
Mining - - - - - -
Manufacturing 105.9 233.2 418 921 15.9 130.7
Power Generation N/A N/A N/A N/A N/A N/A
Total 184.1 506.8 1 931 4 206 47.0 303.3
4.10.4 Goods and Services Assessment
As with UV G these are areas feeding into the Vaal Dam, and sparsely populated with commercial agriculture
the dominant land use. Fishing takes place upstream of the Vaal Dam and this is relatively important attraction
downstream of Villiers. Floodplain usage is important but this is restricted to commercial utilisation.
• Fishing (Recreational): Important in reaches close to the Vaal Dam confluence.
• Fishing (Subsistence): Relatively important given the town of Villiers and its population, some of whom
rely on fish for part of their diet.
• Other Recreational Opportunities: Usage is relatively low bar some use of the lower reaches close to
the Vaal Dam confluence. Here picnic spots are of importance.
• Riparian vegetation. The utilisation is low given the nature of restrictions on access to the river and
associated area.
• Waste Water Dilution and Assimilation: Given that land use is primarily commercial agriculture the
function of the river in this regard is of moderate importance. It is mainly agricultural run-off that will be
diluted but the comment was made that nutrients do not react particularly well to dilution influences of
this nature.
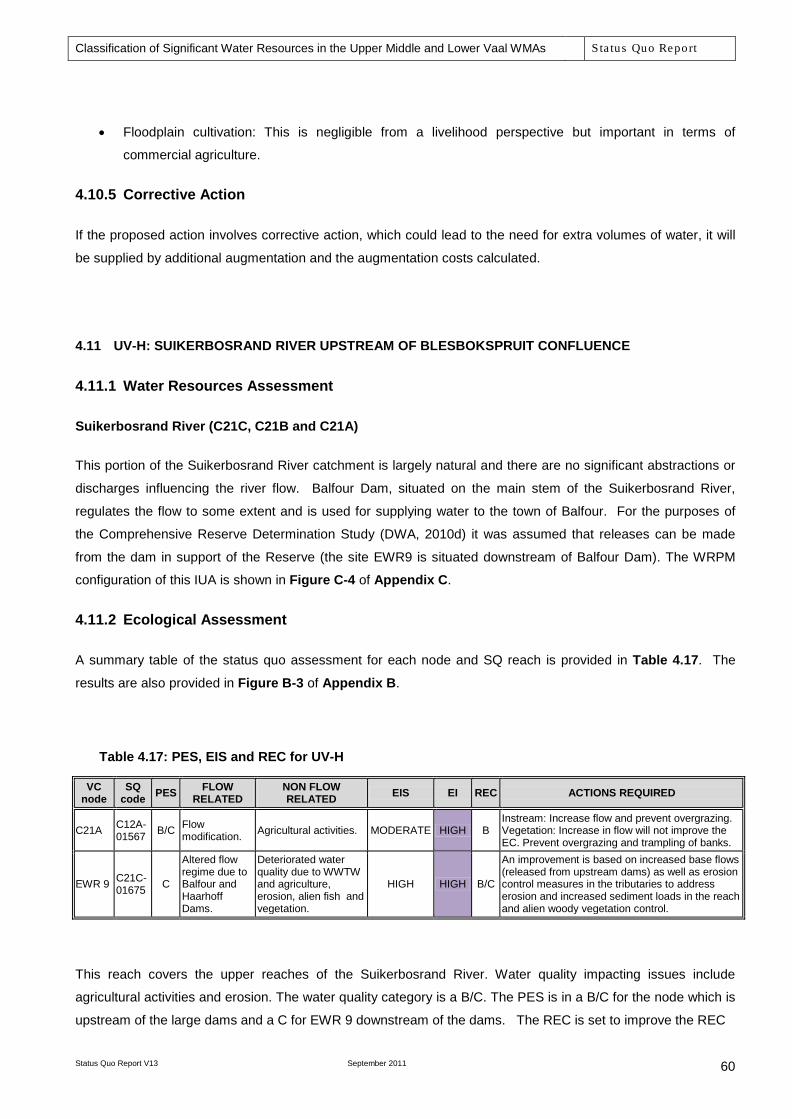
Classification of Significant Water Resources in the Upper Middle and Lower Vaal WMAs Sta tus Quo Report
Status Quo Report V13 September 2011
60
• Floodplain cultivation: This is negligible from a livelihood perspective but important in terms of
commercial agriculture.
4.10.5 Corrective Action
If the proposed action involves corrective action, which could lead to the need for extra volumes of water, it will
be supplied by additional augmentation and the augmentation costs calculated.
4.11 UV-H: SUIKERBOSRAND RIVER UPSTREAM OF BLESBOKSPRUIT CONFLUENCE
4.11.1 Water Resources Assessment
Suikerbosrand River (C21C, C21B and C21A)
This portion of the Suikerbosrand River catchment is largely natural and there are no significant abstractions or
discharges influencing the river flow. Balfour Dam, situated on the main stem of the Suikerbosrand River,
regulates the flow to some extent and is used for supplying water to the town of Balfour. For the purposes of
the Comprehensive Reserve Determination Study (DWA, 2010d) it was assumed that releases can be made
from the dam in support of the Reserve (the site EWR9 is situated downstream of Balfour Dam). The WRPM
configuration of this IUA is shown in Figure C-4 of Appendix C.
4.11.2 Ecological Assessment
A summary table of the status quo assessment for each node and SQ reach is provided in Table 4.17. The
results are also provided in Figure B-3 of Appendix B.
Table 4.17: PES, EIS and REC for UV-H
VC node
SQ code PES FLOW
RELATED NON FLOW RELATED EIS EI REC ACTIONS REQUIRED
C21A C12A-01567 B/C Flow
modification. Agricultural activities. MODERATE HIGH B Instream: Increase flow and prevent overgrazing. Vegetation: Increase in flow will not improve the EC. Prevent overgrazing and trampling of banks.
EWR 9 C21C-01675 C
Altered flow regime due to Balfour and Haarhoff Dams.
Deteriorated water quality due to WWTW and agriculture, erosion, alien fish and vegetation.
HIGH HIGH B/C
An improvement is based on increased base flows (released from upstream dams) as well as erosion control measures in the tributaries to address erosion and increased sediment loads in the reach and alien woody vegetation control.
This reach covers the upper reaches of the Suikerbosrand River. Water quality impacting issues include
agricultural activities and erosion. The water quality category is a B/C. The PES is in a B/C for the node which is
upstream of the large dams and a C for EWR 9 downstream of the dams. The REC is set to improve the REC
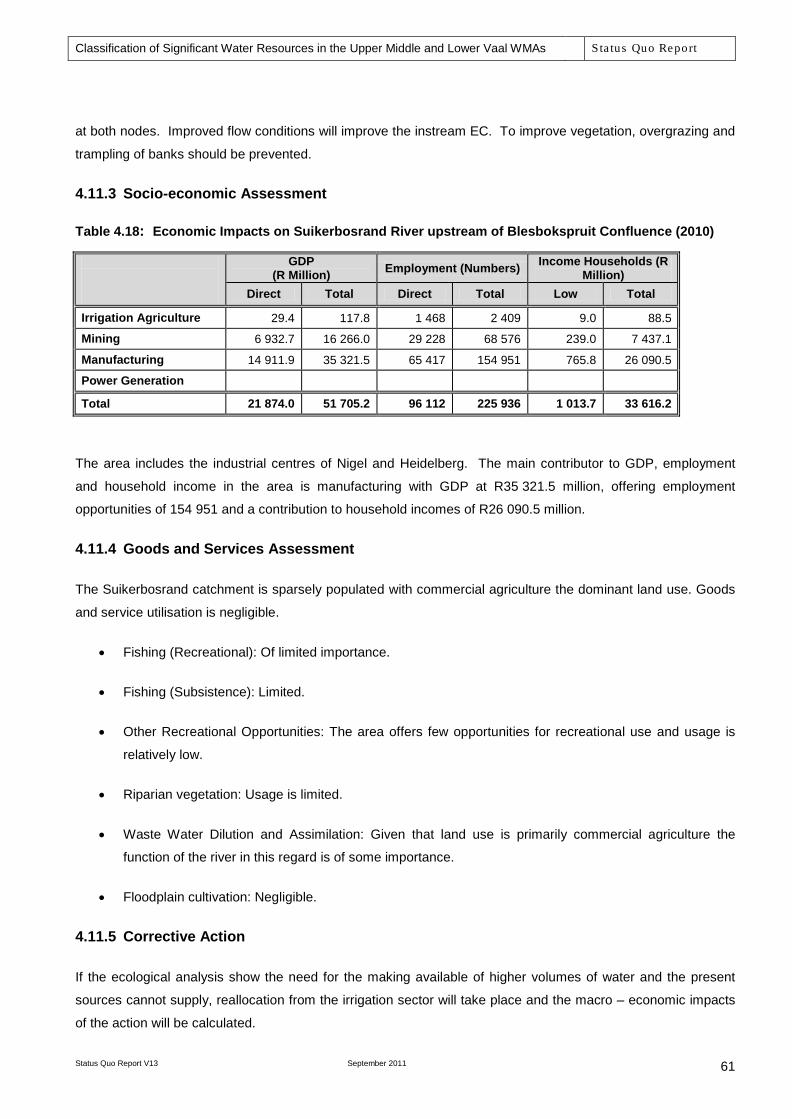
Classification of Significant Water Resources in the Upper Middle and Lower Vaal WMAs Sta tus Quo Report
Status Quo Report V13 September 2011
61
at both nodes. Improved flow conditions will improve the instream EC. To improve vegetation, overgrazing and
trampling of banks should be prevented.
4.11.3 Socio-economic Assessment
Table 4.18: Economic Impacts on Suikerbosrand River upstream of Blesbokspruit Confluence (2010)
GDP (R Million) Employment (Numbers) Income Households (R
Million) Direct Total Direct Total Low Total
Irrigation Agriculture 29.4 117.8 1 468 2 409 9.0 88.5
Mining 6 932.7 16 266.0 29 228 68 576 239.0 7 437.1
Manufacturing 14 911.9 35 321.5 65 417 154 951 765.8 26 090.5
Power Generation Total 21 874.0 51 705.2 96 112 225 936 1 013.7 33 616.2
The area includes the industrial centres of Nigel and Heidelberg. The main contributor to GDP, employment
and household income in the area is manufacturing with GDP at R35 321.5 million, offering employment
opportunities of 154 951 and a contribution to household incomes of R26 090.5 million.
4.11.4 Goods and Services Assessment
The Suikerbosrand catchment is sparsely populated with commercial agriculture the dominant land use. Goods
and service utilisation is negligible.
• Fishing (Recreational): Of limited importance.
• Fishing (Subsistence): Limited.
• Other Recreational Opportunities: The area offers few opportunities for recreational use and usage is
relatively low.
• Riparian vegetation: Usage is limited.
• Waste Water Dilution and Assimilation: Given that land use is primarily commercial agriculture the
function of the river in this regard is of some importance.
• Floodplain cultivation: Negligible.
4.11.5 Corrective Action
If the ecological analysis show the need for the making available of higher volumes of water and the present
sources cannot supply, reallocation from the irrigation sector will take place and the macro – economic impacts
of the action will be calculated.
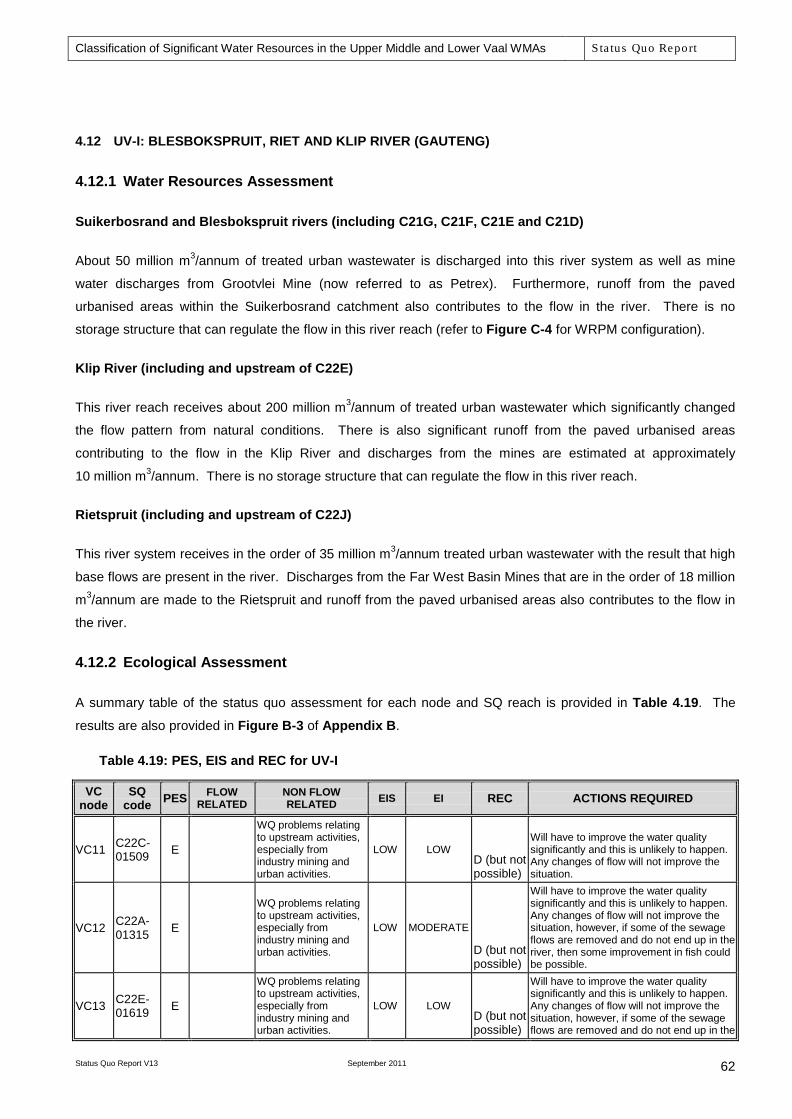
Classification of Significant Water Resources in the Upper Middle and Lower Vaal WMAs Sta tus Quo Report
Status Quo Report V13 September 2011
62
4.12 UV-I: BLESBOKSPRUIT, RIET AND KLIP RIVER (GAUTENG)
4.12.1 Water Resources Assessment
Suikerbosrand and Blesbokspruit rivers (including C21G, C21F, C21E and C21D)
About 50 million m3/annum of treated urban wastewater is discharged into this river system as well as mine
water discharges from Grootvlei Mine (now referred to as Petrex). Furthermore, runoff from the paved
urbanised areas within the Suikerbosrand catchment also contributes to the flow in the river. There is no
storage structure that can regulate the flow in this river reach (refer to Figure C-4 for WRPM configuration).
Klip River (including and upstream of C22E)
This river reach receives about 200 million m3/annum of treated urban wastewater which significantly changed
the flow pattern from natural conditions. There is also significant runoff from the paved urbanised areas
contributing to the flow in the Klip River and discharges from the mines are estimated at approximately
10 million m3/annum. There is no storage structure that can regulate the flow in this river reach.
Rietspruit (including and upstream of C22J)
This river system receives in the order of 35 million m3/annum treated urban wastewater with the result that high
base flows are present in the river. Discharges from the Far West Basin Mines that are in the order of 18 million
m3/annum are made to the Rietspruit and runoff from the paved urbanised areas also contributes to the flow in
the river.
4.12.2 Ecological Assessment
A summary table of the status quo assessment for each node and SQ reach is provided in Table 4.19. The
results are also provided in Figure B-3 of Appendix B.
Table 4.19: PES, EIS and REC for UV-I
VC node
SQ code PES FLOW
RELATED NON FLOW RELATED EIS EI REC ACTIONS REQUIRED
VC11 C22C-01509 E
WQ problems relating to upstream activities, especially from industry mining and urban activities.
LOW LOW D (but not possible)
Will have to improve the water quality significantly and this is unlikely to happen. Any changes of flow will not improve the situation.
VC12 C22A-01315 E
WQ problems relating to upstream activities, especially from industry mining and urban activities.
LOW MODERATE
D (but not possible)
Will have to improve the water quality significantly and this is unlikely to happen. Any changes of flow will not improve the situation, however, if some of the sewage flows are removed and do not end up in the river, then some improvement in fish could be possible.
VC13 C22E-01619 E
WQ problems relating to upstream activities, especially from industry mining and urban activities.
LOW LOW D (but not possible)
Will have to improve the water quality significantly and this is unlikely to happen. Any changes of flow will not improve the situation, however, if some of the sewage flows are removed and do not end up in the
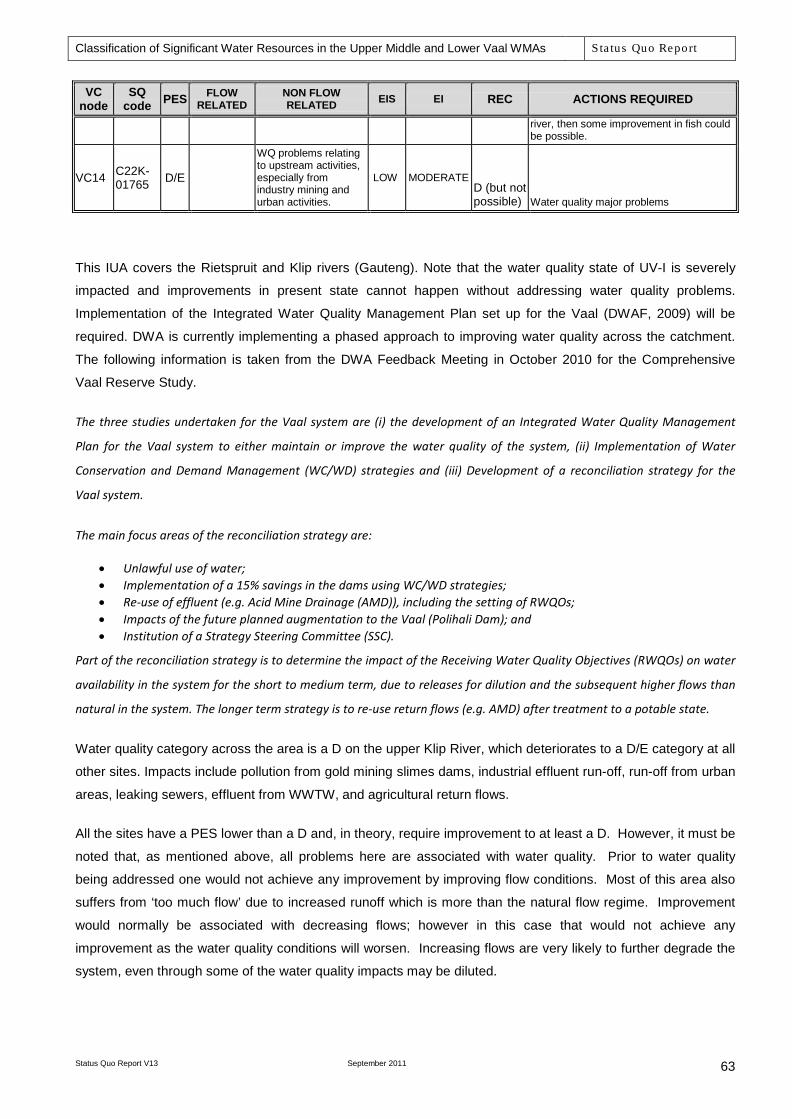
Classification of Significant Water Resources in the Upper Middle and Lower Vaal WMAs Sta tus Quo Report
Status Quo Report V13 September 2011
63
VC node
SQ code PES FLOW
RELATED NON FLOW RELATED EIS EI REC ACTIONS REQUIRED
river, then some improvement in fish could be possible.
VC14 C22K-01765 D/E
WQ problems relating to upstream activities, especially from industry mining and urban activities.
LOW MODERATE D (but not possible) Water quality major problems
This IUA covers the Rietspruit and Klip rivers (Gauteng). Note that the water quality state of UV-I is severely
impacted and improvements in present state cannot happen without addressing water quality problems.
Implementation of the Integrated Water Quality Management Plan set up for the Vaal (DWAF, 2009) will be
required. DWA is currently implementing a phased approach to improving water quality across the catchment.
The following information is taken from the DWA Feedback Meeting in October 2010 for the Comprehensive
Vaal Reserve Study.
The three studies undertaken for the Vaal system are (i) the development of an Integrated Water Quality Management
Plan for the Vaal system to either maintain or improve the water quality of the system, (ii) Implementation of Water
Conservation and Demand Management (WC/WD) strategies and (iii) Development of a reconciliation strategy for the
Vaal system.
The main focus areas of the reconciliation strategy are:
• Unlawful use of water; • Implementation of a 15% savings in the dams using WC/WD strategies; • Re-use of effluent (e.g. Acid Mine Drainage (AMD)), including the setting of RWQOs; • Impacts of the future planned augmentation to the Vaal (Polihali Dam); and • Institution of a Strategy Steering Committee (SSC).
Part of the reconciliation strategy is to determine the impact of the Receiving Water Quality Objectives (RWQOs) on water
availability in the system for the short to medium term, due to releases for dilution and the subsequent higher flows than
natural in the system. The longer term strategy is to re-use return flows (e.g. AMD) after treatment to a potable state.
Water quality category across the area is a D on the upper Klip River, which deteriorates to a D/E category at all
other sites. Impacts include pollution from gold mining slimes dams, industrial effluent run-off, run-off from urban
areas, leaking sewers, effluent from WWTW, and agricultural return flows.
All the sites have a PES lower than a D and, in theory, require improvement to at least a D. However, it must be
noted that, as mentioned above, all problems here are associated with water quality. Prior to water quality
being addressed one would not achieve any improvement by improving flow conditions. Most of this area also
suffers from ‘too much flow’ due to increased runoff which is more than the natural flow regime. Improvement
would normally be associated with decreasing flows; however in this case that would not achieve any
improvement as the water quality conditions will worsen. Increasing flows are very likely to further degrade the
system, even through some of the water quality impacts may be diluted.
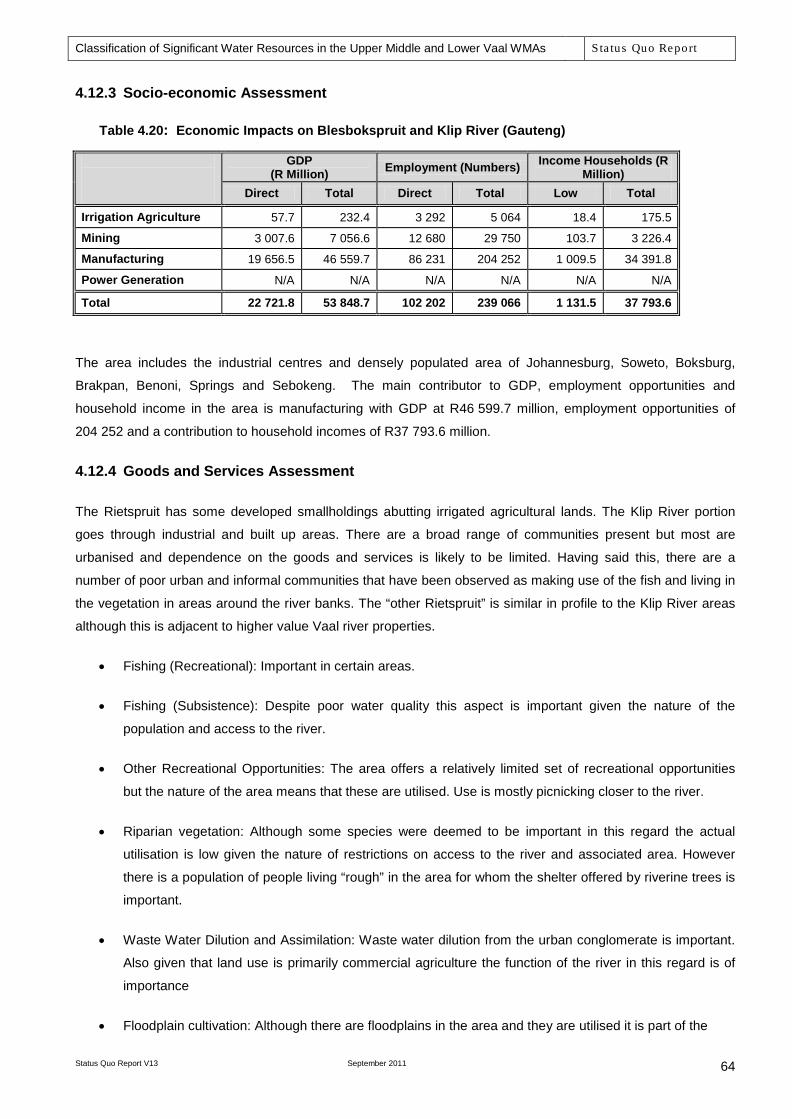
Classification of Significant Water Resources in the Upper Middle and Lower Vaal WMAs Sta tus Quo Report
Status Quo Report V13 September 2011
64
4.12.3 Socio-economic Assessment
Table 4.20: Economic Impacts on Blesbokspruit and Klip River (Gauteng)
GDP (R Million) Employment (Numbers) Income Households (R
Million) Direct Total Direct Total Low Total
Irrigation Agriculture 57.7 232.4 3 292 5 064 18.4 175.5
Mining 3 007.6 7 056.6 12 680 29 750 103.7 3 226.4
Manufacturing 19 656.5 46 559.7 86 231 204 252 1 009.5 34 391.8
Power Generation N/A N/A N/A N/A N/A N/A
Total 22 721.8 53 848.7 102 202 239 066 1 131.5 37 793.6
The area includes the industrial centres and densely populated area of Johannesburg, Soweto, Boksburg,
Brakpan, Benoni, Springs and Sebokeng. The main contributor to GDP, employment opportunities and
household income in the area is manufacturing with GDP at R46 599.7 million, employment opportunities of
204 252 and a contribution to household incomes of R37 793.6 million.
4.12.4 Goods and Services Assessment
The Rietspruit has some developed smallholdings abutting irrigated agricultural lands. The Klip River portion
goes through industrial and built up areas. There are a broad range of communities present but most are
urbanised and dependence on the goods and services is likely to be limited. Having said this, there are a
number of poor urban and informal communities that have been observed as making use of the fish and living in
the vegetation in areas around the river banks. The “other Rietspruit” is similar in profile to the Klip River areas
although this is adjacent to higher value Vaal river properties.
• Fishing (Recreational): Important in certain areas.
• Fishing (Subsistence): Despite poor water quality this aspect is important given the nature of the
population and access to the river.
• Other Recreational Opportunities: The area offers a relatively limited set of recreational opportunities
but the nature of the area means that these are utilised. Use is mostly picnicking closer to the river.
• Riparian vegetation: Although some species were deemed to be important in this regard the actual
utilisation is low given the nature of restrictions on access to the river and associated area. However
there is a population of people living “rough” in the area for whom the shelter offered by riverine trees is
important.
• Waste Water Dilution and Assimilation: Waste water dilution from the urban conglomerate is important.
Also given that land use is primarily commercial agriculture the function of the river in this regard is of
importance
• Floodplain cultivation: Although there are floodplains in the area and they are utilised it is part of the
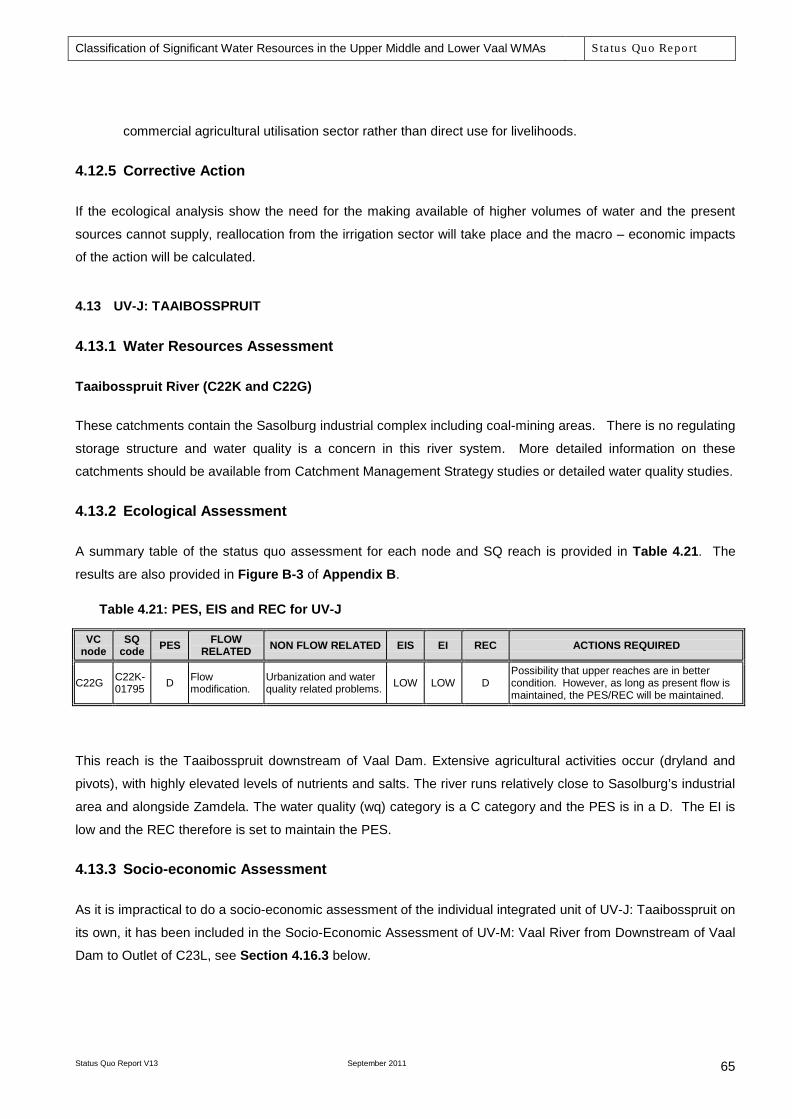
Classification of Significant Water Resources in the Upper Middle and Lower Vaal WMAs Sta tus Quo Report
Status Quo Report V13 September 2011
65
commercial agricultural utilisation sector rather than direct use for livelihoods.
4.12.5 Corrective Action
If the ecological analysis show the need for the making available of higher volumes of water and the present
sources cannot supply, reallocation from the irrigation sector will take place and the macro – economic impacts
of the action will be calculated.
4.13 UV-J: TAAIBOSSPRUIT
4.13.1 Water Resources Assessment
Taaibosspruit River (C22K and C22G)
These catchments contain the Sasolburg industrial complex including coal-mining areas. There is no regulating
storage structure and water quality is a concern in this river system. More detailed information on these
catchments should be available from Catchment Management Strategy studies or detailed water quality studies.
4.13.2 Ecological Assessment
A summary table of the status quo assessment for each node and SQ reach is provided in Table 4.21. The
results are also provided in Figure B-3 of Appendix B.
Table 4.21: PES, EIS and REC for UV-J
VC node
SQ code PES FLOW
RELATED NON FLOW RELATED EIS EI REC ACTIONS REQUIRED
C22G C22K-01795 D Flow
modification. Urbanization and water quality related problems. LOW LOW D
Possibility that upper reaches are in better condition. However, as long as present flow is maintained, the PES/REC will be maintained.
This reach is the Taaibosspruit downstream of Vaal Dam. Extensive agricultural activities occur (dryland and
pivots), with highly elevated levels of nutrients and salts. The river runs relatively close to Sasolburg’s industrial
area and alongside Zamdela. The water quality (wq) category is a C category and the PES is in a D. The EI is
low and the REC therefore is set to maintain the PES.
4.13.3 Socio-economic Assessment
As it is impractical to do a socio-economic assessment of the individual integrated unit of UV-J: Taaibosspruit on
its own, it has been included in the Socio-Economic Assessment of UV-M: Vaal River from Downstream of Vaal
Dam to Outlet of C23L, see Section 4.16.3 below.
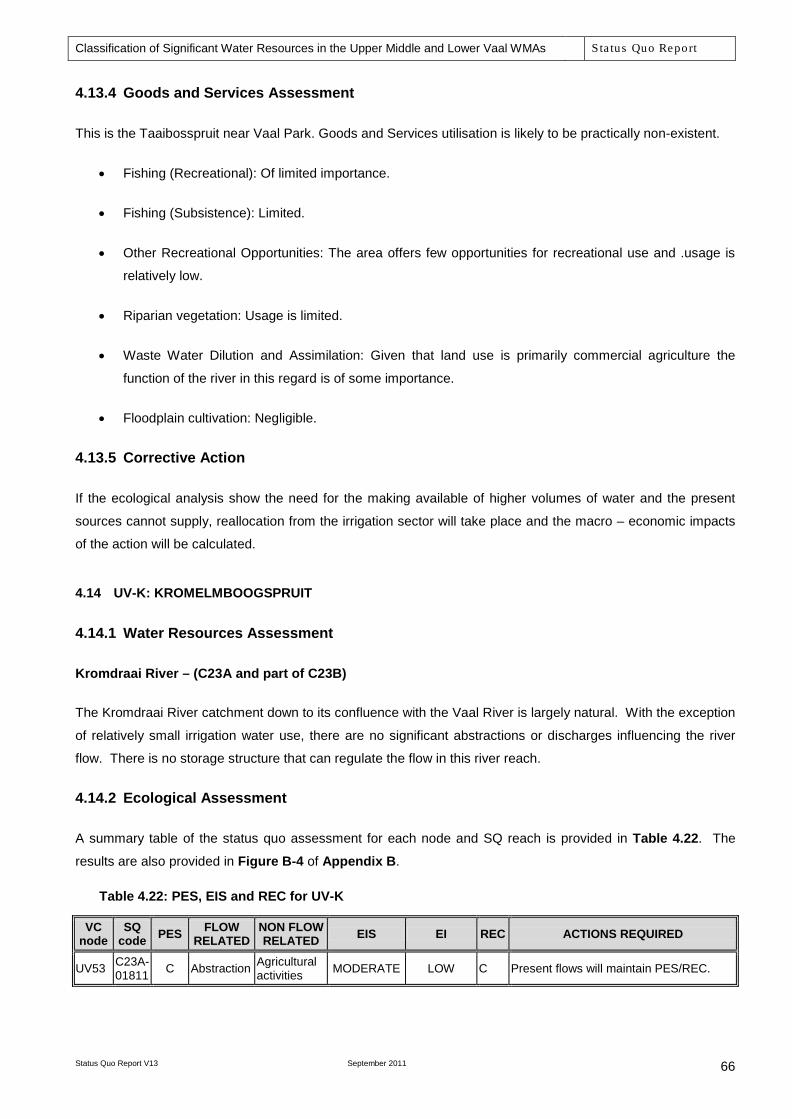
Classification of Significant Water Resources in the Upper Middle and Lower Vaal WMAs Sta tus Quo Report
Status Quo Report V13 September 2011
66
4.13.4 Goods and Services Assessment
This is the Taaibosspruit near Vaal Park. Goods and Services utilisation is likely to be practically non-existent.
• Fishing (Recreational): Of limited importance.
• Fishing (Subsistence): Limited.
• Other Recreational Opportunities: The area offers few opportunities for recreational use and .usage is
relatively low.
• Riparian vegetation: Usage is limited.
• Waste Water Dilution and Assimilation: Given that land use is primarily commercial agriculture the
function of the river in this regard is of some importance.
• Floodplain cultivation: Negligible.
4.13.5 Corrective Action
If the ecological analysis show the need for the making available of higher volumes of water and the present
sources cannot supply, reallocation from the irrigation sector will take place and the macro – economic impacts
of the action will be calculated.
4.14 UV-K: KROMELMBOOGSPRUIT
4.14.1 Water Resources Assessment
Kromdraai River – (C23A and part of C23B)
The Kromdraai River catchment down to its confluence with the Vaal River is largely natural. With the exception
of relatively small irrigation water use, there are no significant abstractions or discharges influencing the river
flow. There is no storage structure that can regulate the flow in this river reach.
4.14.2 Ecological Assessment
A summary table of the status quo assessment for each node and SQ reach is provided in Table 4.22. The
results are also provided in Figure B-4 of Appendix B.
Table 4.22: PES, EIS and REC for UV-K
VC node
SQ code PES FLOW
RELATED NON FLOW RELATED EIS EI REC ACTIONS REQUIRED
UV53 C23A-01811 C Abstraction Agricultural
activities MODERATE LOW C Present flows will maintain PES/REC.

Classification of Significant Water Resources in the Upper Middle and Lower Vaal WMAs Sta tus Quo Report
Status Quo Report V13 September 2011
67
This reach covers the entire Kromelmboogspruit, a tributary of the Vaal River entering the Vaal upstream
of Parys and downstream of Vaal Barrage. Catchment development in the area is mostly agricultural, with
numerous road crossings and pivots in the lower reaches. Elevated salts, nutrients and toxics are expected. The
water quality category and the PES is a C. The EI is low and there is, therefore, no motivation to improve the
PES.
4.14.3 Socio-economic Assessment
As it is impractical to do a socio-economic assessment of the individual integrated unit of UV-K
(Kromelmboogspruit) on its own, it has been included in the Socio-Economic Assessment of UV-M (Vaal River
from Downstream of Vaal Dam to Outlet of C23L), see Section 4.16.3 below.
4.14.4 Goods and Services Assessment
This is the Kromelmboogspruit with commercial farming the dominant landform. Goods and Services utilisation
is likely to be negligible to virtually non-existent.
• Fishing (Recreational): Of limited importance.
• Fishing (Subsistence): Limited.
• Other Recreational Opportunities: The area offers few opportunities for recreational use and .usage is
relatively low.
• Riparian vegetation: Usage is limited.
• Waste Water Dilution and Assimilation: Given that land use is primarily commercial agriculture the
function of the river in this regard is of some importance.
• Floodplain cultivation: Negligible.
4.14.5 Corrective Action
If the ecological analysis show the need for the making available of higher volumes of water and the present
sources cannot supply, reallocation from the irrigation sector will take place and the macro – economic impacts
of the action will be calculated.
4.15 UV-L: MOOI RIVER UP TO CONFLUENCE WITH VAAL
4.15.1 Water Resources Assessment
Mooi River– (C23H, Boskop and Klerkskraal dams)
The WRPM configuration of this sub-system is shown in Figure C-5 of Appendix C. Boskop Dam is located
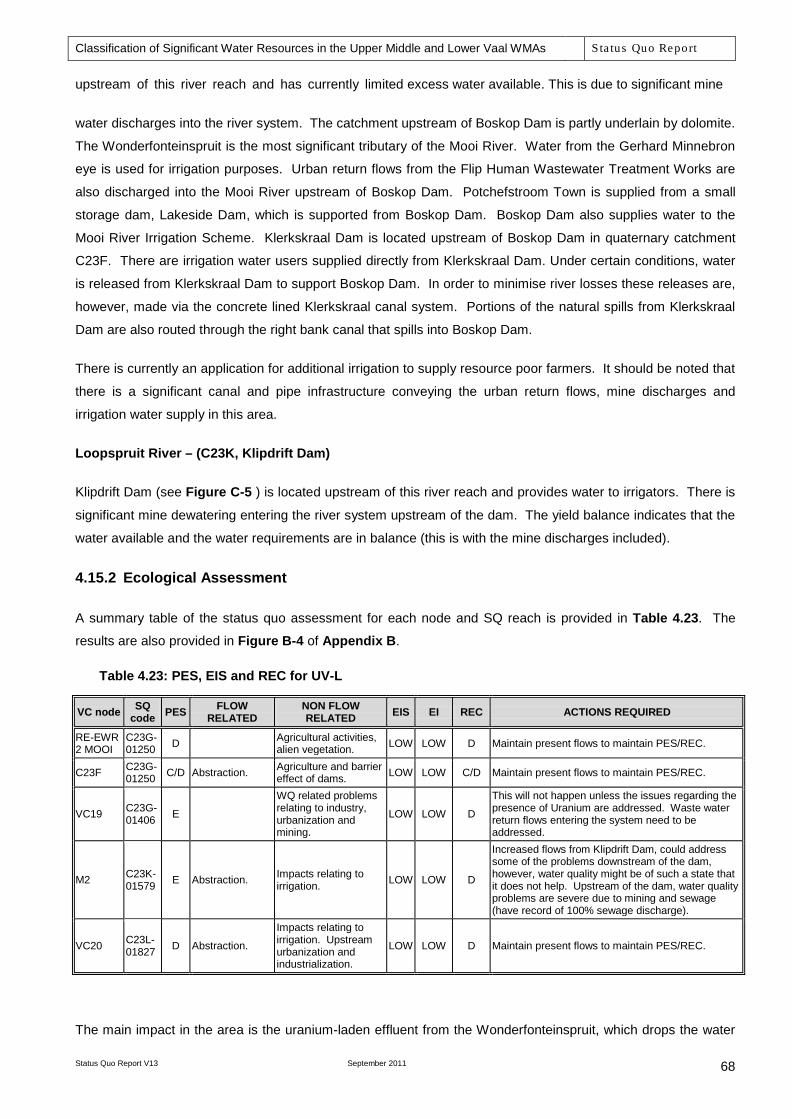
Classification of Significant Water Resources in the Upper Middle and Lower Vaal WMAs Sta tus Quo Report
Status Quo Report V13 September 2011
68
upstream of this river reach and has currently limited excess water available. This is due to significant mine
water discharges into the river system. The catchment upstream of Boskop Dam is partly underlain by dolomite.
The Wonderfonteinspruit is the most significant tributary of the Mooi River. Water from the Gerhard Minnebron
eye is used for irrigation purposes. Urban return flows from the Flip Human Wastewater Treatment Works are
also discharged into the Mooi River upstream of Boskop Dam. Potchefstroom Town is supplied from a small
storage dam, Lakeside Dam, which is supported from Boskop Dam. Boskop Dam also supplies water to the
Mooi River Irrigation Scheme. Klerkskraal Dam is located upstream of Boskop Dam in quaternary catchment
C23F. There are irrigation water users supplied directly from Klerkskraal Dam. Under certain conditions, water
is released from Klerkskraal Dam to support Boskop Dam. In order to minimise river losses these releases are,
however, made via the concrete lined Klerkskraal canal system. Portions of the natural spills from Klerkskraal
Dam are also routed through the right bank canal that spills into Boskop Dam.
There is currently an application for additional irrigation to supply resource poor farmers. It should be noted that
there is a significant canal and pipe infrastructure conveying the urban return flows, mine discharges and
irrigation water supply in this area.
Loopspruit River – (C23K, Klipdrift Dam)
Klipdrift Dam (see Figure C-5 ) is located upstream of this river reach and provides water to irrigators. There is
significant mine dewatering entering the river system upstream of the dam. The yield balance indicates that the
water available and the water requirements are in balance (this is with the mine discharges included).
4.15.2 Ecological Assessment
A summary table of the status quo assessment for each node and SQ reach is provided in Table 4.23. The
results are also provided in Figure B-4 of Appendix B.
Table 4.23: PES, EIS and REC for UV-L
VC node SQ code PES FLOW
RELATED NON FLOW RELATED EIS EI REC ACTIONS REQUIRED
RE-EWR 2 MOOI
C23G-01250 D
Agricultural activities, alien vegetation. LOW LOW D Maintain present flows to maintain PES/REC.
C23F C23G-01250 C/D Abstraction. Agriculture and barrier
effect of dams. LOW LOW C/D Maintain present flows to maintain PES/REC.
VC19 C23G-01406 E
WQ related problems relating to industry, urbanization and mining.
LOW LOW D
This will not happen unless the issues regarding the presence of Uranium are addressed. Waste water return flows entering the system need to be addressed.
M2 C23K-01579 E Abstraction. Impacts relating to
irrigation. LOW LOW D
Increased flows from Klipdrift Dam, could address some of the problems downstream of the dam, however, water quality might be of such a state that it does not help. Upstream of the dam, water quality problems are severe due to mining and sewage (have record of 100% sewage discharge).
VC20 C23L-01827 D Abstraction.
Impacts relating to irrigation. Upstream urbanization and industrialization.
LOW LOW D Maintain present flows to maintain PES/REC.
The main impact in the area is the uranium-laden effluent from the Wonderfonteinspruit, which drops the water
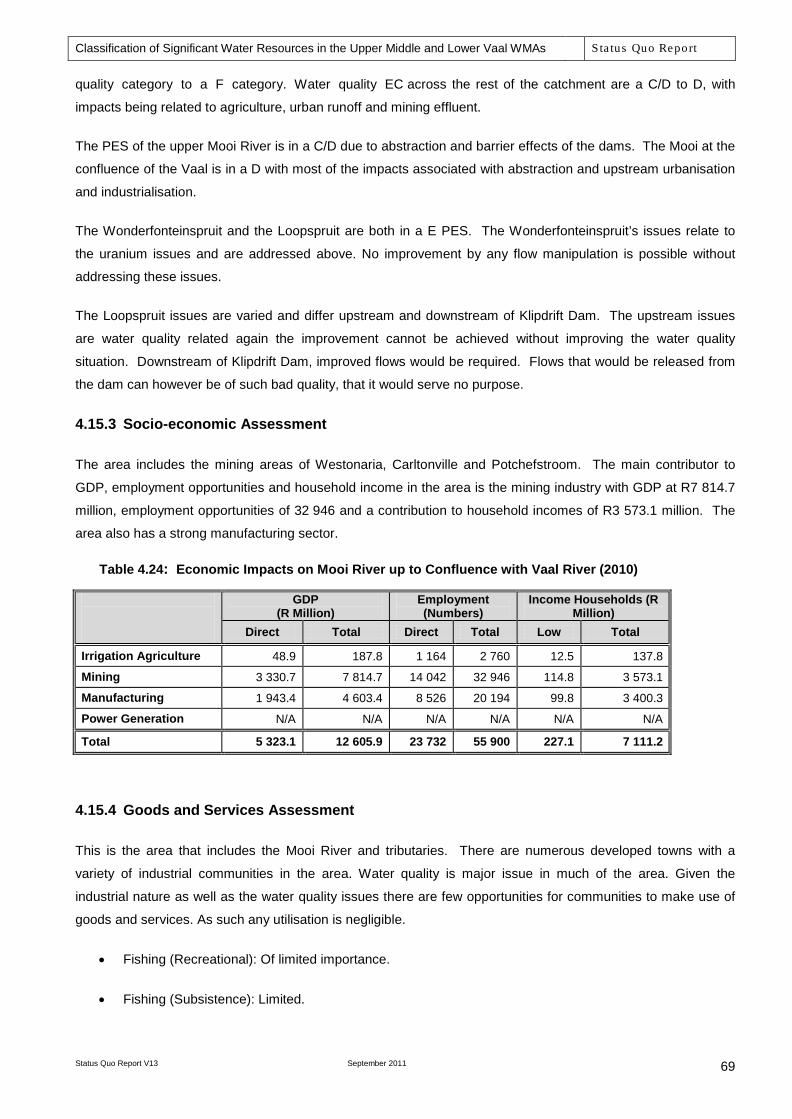
Classification of Significant Water Resources in the Upper Middle and Lower Vaal WMAs Sta tus Quo Report
Status Quo Report V13 September 2011
69
quality category to a F category. Water quality EC across the rest of the catchment are a C/D to D, with
impacts being related to agriculture, urban runoff and mining effluent.
The PES of the upper Mooi River is in a C/D due to abstraction and barrier effects of the dams. The Mooi at the
confluence of the Vaal is in a D with most of the impacts associated with abstraction and upstream urbanisation
and industrialisation.
The Wonderfonteinspruit and the Loopspruit are both in a E PES. The Wonderfonteinspruit’s issues relate to
the uranium issues and are addressed above. No improvement by any flow manipulation is possible without
addressing these issues.
The Loopspruit issues are varied and differ upstream and downstream of Klipdrift Dam. The upstream issues
are water quality related again the improvement cannot be achieved without improving the water quality
situation. Downstream of Klipdrift Dam, improved flows would be required. Flows that would be released from
the dam can however be of such bad quality, that it would serve no purpose.
4.15.3 Socio-economic Assessment
The area includes the mining areas of Westonaria, Carltonville and Potchefstroom. The main contributor to
GDP, employment opportunities and household income in the area is the mining industry with GDP at R7 814.7
million, employment opportunities of 32 946 and a contribution to household incomes of R3 573.1 million. The
area also has a strong manufacturing sector.
Table 4.24: Economic Impacts on Mooi River up to Confluence with Vaal River (2010)
GDP (R Million)
Employment (Numbers)
Income Households (R Million)
Direct Total Direct Total Low Total
Irrigation Agriculture 48.9 187.8 1 164 2 760 12.5 137.8
Mining 3 330.7 7 814.7 14 042 32 946 114.8 3 573.1
Manufacturing 1 943.4 4 603.4 8 526 20 194 99.8 3 400.3
Power Generation N/A N/A N/A N/A N/A N/A
Total 5 323.1 12 605.9 23 732 55 900 227.1 7 111.2
4.15.4 Goods and Services Assessment
This is the area that includes the Mooi River and tributaries. There are numerous developed towns with a
variety of industrial communities in the area. Water quality is major issue in much of the area. Given the
industrial nature as well as the water quality issues there are few opportunities for communities to make use of
goods and services. As such any utilisation is negligible.
• Fishing (Recreational): Of limited importance.
• Fishing (Subsistence): Limited.

Classification of Significant Water Resources in the Upper Middle and Lower Vaal WMAs Sta tus Quo Report
Status Quo Report V13 September 2011
70
• Other Recreational Opportunities: The area offers few opportunities for recreational use
and usage is relatively low.
• Riparian vegetation: Usage is limited but there may be some ad hoc usage from poorer urban centres.
• Waste Water Dilution and Assimilation: Although this would be important the nature of the pollutants has
probably overwhelmed the ability of the river to cope in this regard.
• Floodplain cultivation: Negligible.
4.15.5 Corrective Action
If the ecological analysis show the need for the making available of higher volumes of water and the present
sources cannot supply, reallocation from the irrigation sector will take place and the macro – economic impacts
of the action will be calculated.
4.16 UV-M: VAAL RIVER REACH FROM VAAL DAM TO C23L
4.16.1 Water Resources Assessment
Vaal River reach between Vaal Dam and the Vaal Barrage (C22K)
Water is released from Vaal Dam for abstraction by Rand Water at Lethabo Weir. The water body created by
the Vaal Barrage dam wall dominates the river reach between Vaal Dam and Vaal Barrage. Management of the
flow into this reach is from Vaal Dam and is influenced by the water users in and downstream of the Vaal
Barrage, the urban return flows and mine dewatering discharges as well as the releases form Vaal Dam to
maintain the TDS concentration at 600 mg/l. The three main tributaries (Suikerbosrand, Klip and Rietspruit
rivers) discharging into the Vaal Barrage, each convey significant volumes of treated wastewater and mine
discharge water.
Vaal River reach between the Vaal Barrage (C22K) and the boundary of the Upper Vaal WMA
The main flow regulating capability for this reach is from Vaal Barrage with support from Vaal Dam. There are
contributing flows from the Mooi tributary river. The flow in this river reach is influenced by various factors as
listed below:
• Return flows from mine dewatering and treated urban wastewater into this reach and upstream of the
Vaal Barrage contribute to the flow in this river reach.
• In the past years a flow dilution operating rule has been applied where water is released from Vaal Dam
to maintain the Total Dissolved Solids (TDS) concentration in the Vaal Barrage not to exceed 600 mg/l.
This result in “spills” from Vaal Barrage and in some years it can be as much as 200 million m3/annum.
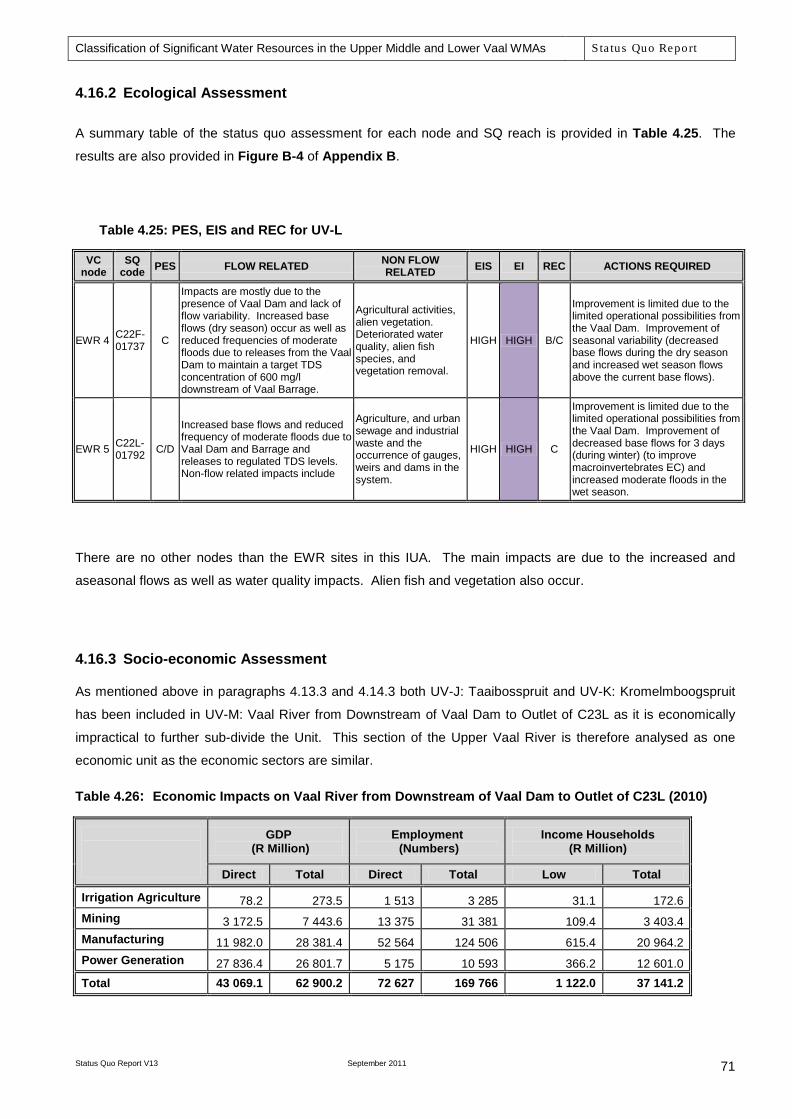
Classification of Significant Water Resources in the Upper Middle and Lower Vaal WMAs Sta tus Quo Report
Status Quo Report V13 September 2011
71
4.16.2 Ecological Assessment
A summary table of the status quo assessment for each node and SQ reach is provided in Table 4.25. The
results are also provided in Figure B-4 of Appendix B.
Table 4.25: PES, EIS and REC for UV-L
VC node
SQ code PES FLOW RELATED NON FLOW
RELATED EIS EI REC ACTIONS REQUIRED
EWR 4 C22F-01737 C
Impacts are mostly due to the presence of Vaal Dam and lack of flow variability. Increased base flows (dry season) occur as well as reduced frequencies of moderate floods due to releases from the Vaal Dam to maintain a target TDS concentration of 600 mg/l downstream of Vaal Barrage.
Agricultural activities, alien vegetation. Deteriorated water quality, alien fish species, and vegetation removal.
HIGH HIGH B/C
Improvement is limited due to the limited operational possibilities from the Vaal Dam. Improvement of seasonal variability (decreased base flows during the dry season and increased wet season flows above the current base flows).
EWR 5 C22L-01792 C/D
Increased base flows and reduced frequency of moderate floods due to Vaal Dam and Barrage and releases to regulated TDS levels. Non-flow related impacts include
Agriculture, and urban sewage and industrial waste and the occurrence of gauges, weirs and dams in the system.
HIGH HIGH C
Improvement is limited due to the limited operational possibilities from the Vaal Dam. Improvement of decreased base flows for 3 days (during winter) (to improve macroinvertebrates EC) and increased moderate floods in the wet season.
There are no other nodes than the EWR sites in this IUA. The main impacts are due to the increased and
aseasonal flows as well as water quality impacts. Alien fish and vegetation also occur.
4.16.3 Socio-economic Assessment
As mentioned above in paragraphs 4.13.3 and 4.14.3 both UV-J: Taaibosspruit and UV-K: Kromelmboogspruit
has been included in UV-M: Vaal River from Downstream of Vaal Dam to Outlet of C23L as it is economically
impractical to further sub-divide the Unit. This section of the Upper Vaal River is therefore analysed as one
economic unit as the economic sectors are similar.
Table 4.26: Economic Impacts on Vaal River from Downstream of Vaal Dam to Outlet of C23L (2010)
GDP (R Million)
Employment (Numbers)
Income Households (R Million)
Direct Total Direct Total Low Total
Irrigation Agriculture 78.2 273.5 1 513 3 285 31.1 172.6 Mining 3 172.5 7 443.6 13 375 31 381 109.4 3 403.4 Manufacturing 11 982.0 28 381.4 52 564 124 506 615.4 20 964.2 Power Generation 27 836.4 26 801.7 5 175 10 593 366.2 12 601.0 Total 43 069.1 62 900.2 72 627 169 766 1 122.0 37 141.2

Classification of Significant Water Resources in the Upper Middle and Lower Vaal WMAs Sta tus Quo Report
Status Quo Report V13 September 2011
72
The area includes the manufacturing areas of Vereeniging, Vanderbijl Park, Sasolburg and Parys. The main
contributor to GDP, employment opportunities and household income in the area is the manufacturing sector
with a GDP of R28 381.4 million, employment opportunities of 124 506 and a contribution to household incomes
of R20 964.2 million.
4.16.4 Goods and Services Assessment
This IUA includes the Vaal River all the way from the Vaal Dam to the end of the Upper Vaal WMA. The towns
of Vereeniging, Vanderbijlpark, Roodia, Parys and a myriad of high value residential estate developments about
the river are located in this area. Industrial development and some mining are also evident in the area. Below
Parys the area is dominated by commercial farms. Also included are areas such as the Lesotho Spruit. Goods
and Services utilisation is likely to be practically non-existent on the tributaries but of high importance,
particularly recreation in the main Vaal stem. The area includes the Vredefort Dome, a World Heritage site.
• Fishing (Recreational): Highly important and it includes some of the prime yellow fish and carp fishing
areas in the country.
• Fishing (Subsistence): Relatively important given the towns and their population, some of whom rely on
fish for part of their diet.
• Other Recreational Opportunities: Usage is of high importance. Boating, canoeing and utilisation of the
area as an aesthetic resource is of prime importance.
• Riparian vegetation. The utilisation is of moderate importance given the towns and their population,
some of whom rely on firewood from trees close to the river for their fuel.
• Waste Water Dilution and Assimilation: Given that land use is urban industrial and commercial
agriculture the function of the river in this regard is of high to moderate importance.
• Floodplain cultivation: This is negligible from a livelihood perspective but important in terms of
commercial agriculture.
4.16.5 Correction Action
If the proposed action involves corrective action, which could lead to the need for extra volumes of water, it will
be supplied by increased augmentation and the augmentation costs calculated.
4.17 UV-N: GROUNDWATER (ABSTRACTION FROM ZUURBEKOM WELLS)
The Zuurbekom dolomitic area (as shown in Figure 4.1) straddles quaternary catchments C22A and C23D. The
principal aquifer is the dolomitic aquifer of the Malmani group. Mean water levels are between 10-50 mbgl and
Classification of Significant Water Resources in the Upper Middle and Lower Vaal WMAs Sta tus Quo Report
Status Quo Report V13 September 2011
73
have not been significantly affected by mine dewatering. Water levels have been constant since the early
1960s. The Malmani Subgroup is composed of dark grey dolomite with variable proportions of interbedded chert
and quartzite.
Major syenite dykes of Pilansberg feature compartmentalise the Zuurbekom. It is separated from the
Gemsbokfontein compartment by the Panvlakte dyke in the south, from the Venterspost Compartment by the
Gemsbokfontein dyke in the west, and from the Upper Kliprivier compartment by the Kliprivier dyke in the east.
Figure 4.1: Location of Zuurbekom dolomitic aquifer
Surface and subsurface water flow is from north to south. Under natural conditions, the subsurface flow was
arrested by the dykes and forced to emanate as springs into the Kliprivier. Enslin (1967) estimated the original
Klipriver eye flow to be 13 689 m3/d before abstraction by Rand Water began in 1896. In 1980 the flow from this
eye varied between 7 200 and 12 000 m3/day, but has since dried up. Recharge has been calculated to be
between 27 379 - 35 600 m3/day, or 15% of the rainfall. Additional inflows are believed to occur from
percolation from surface sources and mine effluents. Transmissivity can range from very low in unweathered
dolomite to extreme in the karst. Storage coefficients for the compartment are estimated at 3%.
The abstraction of groundwater from the Zuurbekom Wells commenced in 1896. Rand Water has been
abstracting water out of the Zuurbekom Wells since 1903 when the Rand Water Board was established. Since
1985 Rand Water has been abstracting 10 Mℓ/d raw water from the wells and is no t planning to increase the
water abstraction volumes. Rand Water is currently operating only one borehole. The abstraction well is

Classification of Significant Water Resources in the Upper Middle and Lower Vaal WMAs Sta tus Quo Report
Status Quo Report V13 September 2011
74
situated on the South-western boundary of the Farm Zuurbekom 297 IQ near the Lenasia urban area (26°
17.9634’ S, 27° 48.8382’ E).
Currently, the Zuurbekom Wells are registered under the National Register of Water Use Certificate 20001409.
The registered abstraction volume is 357 7000 m3/a. A great deal of confusion regarding total water abstraction
exists. Some reports cite a total water use of 17.6 million m3/a, which is 48000 m3/d, however, this value can be
traced back to an original DWA investigation in 1981. Of this volume, only 10 000 m3/d is attributable to Rand
Water. The extent to which this irrigation is currently present needs to be investigated. WARMS lists only 1.8
million m3/a of irrigation for both the Gemsbokfontein and Zuurbekom Compartments. Validation studies indicate
that irrigation within the Zuurbekom compartment is only about 50 ha, or 423 000 m3/a at the present day
development level. Figure 4.2 shows the Google Earth image of the Zuurbekom area.
Figure 4.2: Google Earth image of Zuurbekom area
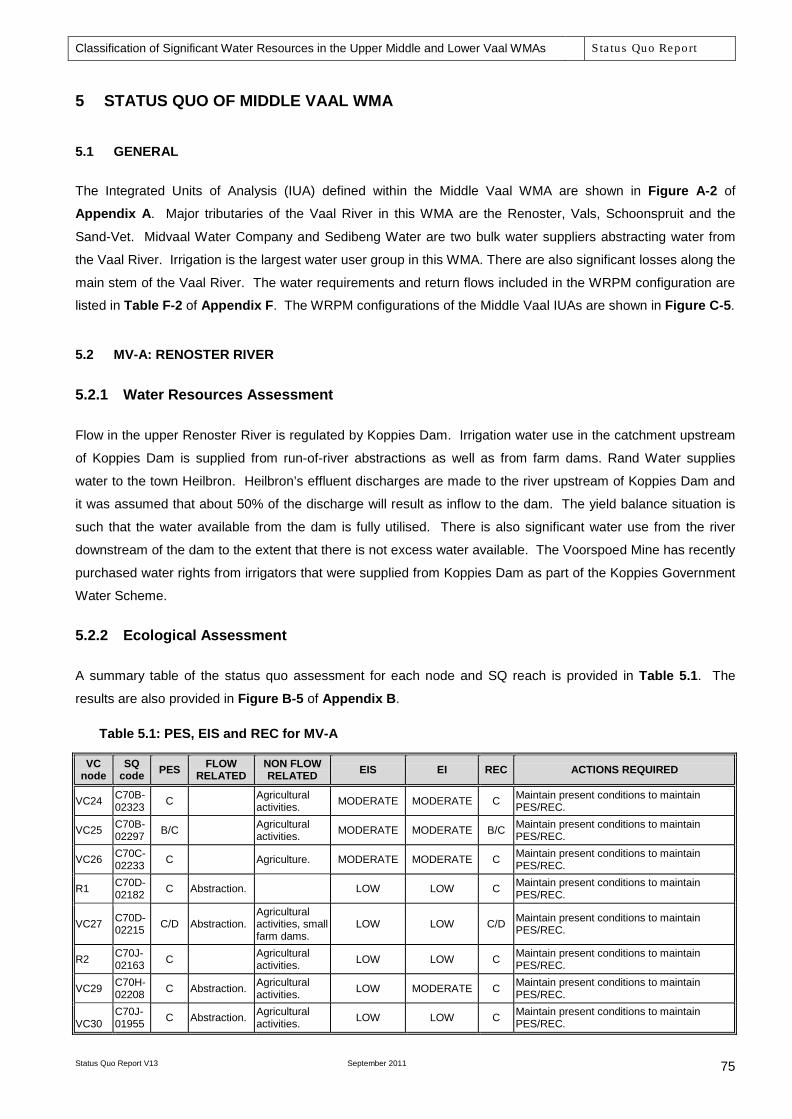
Classification of Significant Water Resources in the Upper Middle and Lower Vaal WMAs Sta tus Quo Report
Status Quo Report V13 September 2011
75
5 STATUS QUO OF MIDDLE VAAL WMA
5.1 GENERAL
The Integrated Units of Analysis (IUA) defined within the Middle Vaal WMA are shown in Figure A-2 of
Appendix A. Major tributaries of the Vaal River in this WMA are the Renoster, Vals, Schoonspruit and the
Sand-Vet. Midvaal Water Company and Sedibeng Water are two bulk water suppliers abstracting water from
the Vaal River. Irrigation is the largest water user group in this WMA. There are also significant losses along the
main stem of the Vaal River. The water requirements and return flows included in the WRPM configuration are
listed in Table F-2 of Appendix F. The WRPM configurations of the Middle Vaal IUAs are shown in Figure C-5.
5.2 MV-A: RENOSTER RIVER
5.2.1 Water Resources Assessment
Flow in the upper Renoster River is regulated by Koppies Dam. Irrigation water use in the catchment upstream
of Koppies Dam is supplied from run-of-river abstractions as well as from farm dams. Rand Water supplies
water to the town Heilbron. Heilbron’s effluent discharges are made to the river upstream of Koppies Dam and
it was assumed that about 50% of the discharge will result as inflow to the dam. The yield balance situation is
such that the water available from the dam is fully utilised. There is also significant water use from the river
downstream of the dam to the extent that there is not excess water available. The Voorspoed Mine has recently
purchased water rights from irrigators that were supplied from Koppies Dam as part of the Koppies Government
Water Scheme.
5.2.2 Ecological Assessment
A summary table of the status quo assessment for each node and SQ reach is provided in Table 5.1. The
results are also provided in Figure B-5 of Appendix B.
Table 5.1: PES, EIS and REC for MV-A
VC node
SQ code PES FLOW
RELATED NON FLOW RELATED EIS EI REC ACTIONS REQUIRED
VC24 C70B-02323 C
Agricultural activities. MODERATE MODERATE C Maintain present conditions to maintain
PES/REC.
VC25 C70B-02297 B/C
Agricultural activities. MODERATE MODERATE B/C Maintain present conditions to maintain
PES/REC.
VC26 C70C-02233 C
Agriculture. MODERATE MODERATE C Maintain present conditions to maintain PES/REC.
R1 C70D-02182 C Abstraction. LOW LOW C Maintain present conditions to maintain
PES/REC.
VC27 C70D-02215 C/D Abstraction.
Agricultural activities, small farm dams.
LOW LOW C/D Maintain present conditions to maintain PES/REC.
R2 C70J-02163 C
Agricultural activities. LOW LOW C Maintain present conditions to maintain
PES/REC.
VC29 C70H-02208 C Abstraction. Agricultural
activities. LOW MODERATE C Maintain present conditions to maintain PES/REC.
VC30 C70J-01955 C Abstraction. Agricultural
activities. LOW LOW C Maintain present conditions to maintain PES/REC.
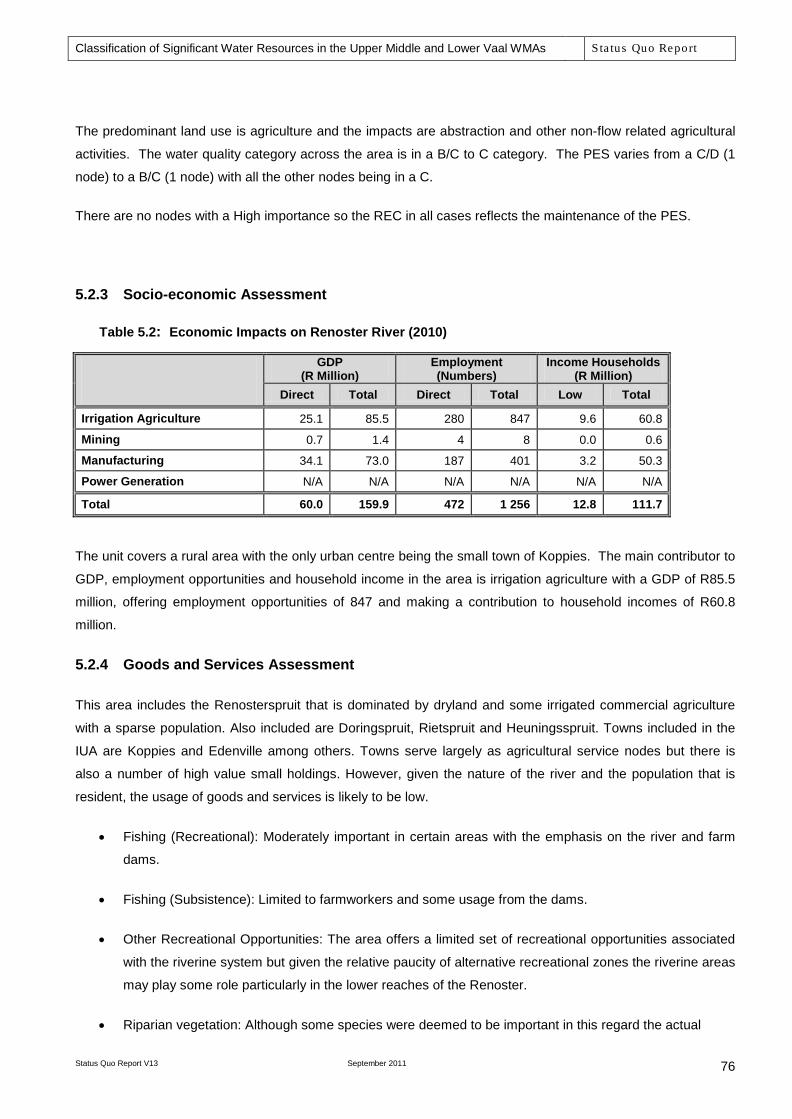
Classification of Significant Water Resources in the Upper Middle and Lower Vaal WMAs Sta tus Quo Report
Status Quo Report V13 September 2011
76
The predominant land use is agriculture and the impacts are abstraction and other non-flow related agricultural
activities. The water quality category across the area is in a B/C to C category. The PES varies from a C/D (1
node) to a B/C (1 node) with all the other nodes being in a C.
There are no nodes with a High importance so the REC in all cases reflects the maintenance of the PES.
5.2.3 Socio-economic Assessment
Table 5.2: Economic Impacts on Renoster River (2010)
GDP (R Million)
Employment (Numbers)
Income Households (R Million)
Direct Total Direct Total Low Total
Irrigation Agriculture 25.1 85.5 280 847 9.6 60.8
Mining 0.7 1.4 4 8 0.0 0.6
Manufacturing 34.1 73.0 187 401 3.2 50.3
Power Generation N/A N/A N/A N/A N/A N/A
Total 60.0 159.9 472 1 256 12.8 111.7
The unit covers a rural area with the only urban centre being the small town of Koppies. The main contributor to
GDP, employment opportunities and household income in the area is irrigation agriculture with a GDP of R85.5
million, offering employment opportunities of 847 and making a contribution to household incomes of R60.8
million.
5.2.4 Goods and Services Assessment
This area includes the Renosterspruit that is dominated by dryland and some irrigated commercial agriculture
with a sparse population. Also included are Doringspruit, Rietspruit and Heuningsspruit. Towns included in the
IUA are Koppies and Edenville among others. Towns serve largely as agricultural service nodes but there is
also a number of high value small holdings. However, given the nature of the river and the population that is
resident, the usage of goods and services is likely to be low.
• Fishing (Recreational): Moderately important in certain areas with the emphasis on the river and farm
dams.
• Fishing (Subsistence): Limited to farmworkers and some usage from the dams.
• Other Recreational Opportunities: The area offers a limited set of recreational opportunities associated
with the riverine system but given the relative paucity of alternative recreational zones the riverine areas
may play some role particularly in the lower reaches of the Renoster.
• Riparian vegetation: Although some species were deemed to be important in this regard the actual
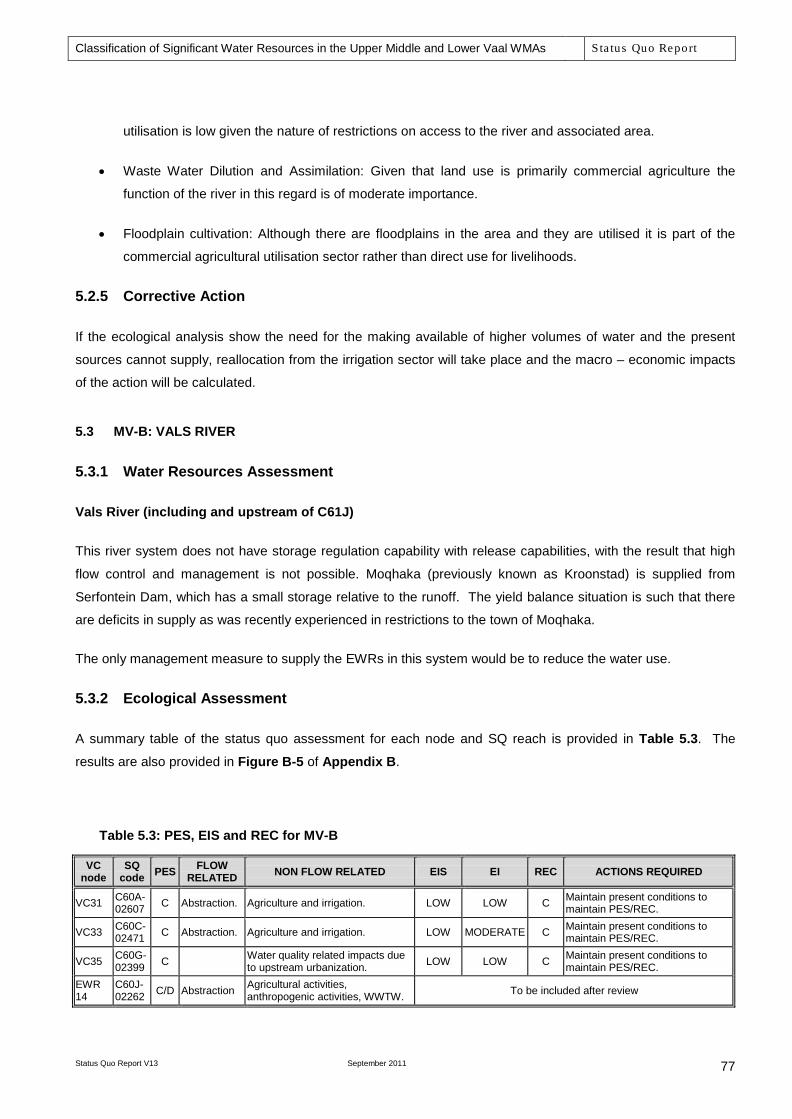
Classification of Significant Water Resources in the Upper Middle and Lower Vaal WMAs Sta tus Quo Report
Status Quo Report V13 September 2011
77
utilisation is low given the nature of restrictions on access to the river and associated area.
• Waste Water Dilution and Assimilation: Given that land use is primarily commercial agriculture the
function of the river in this regard is of moderate importance.
• Floodplain cultivation: Although there are floodplains in the area and they are utilised it is part of the
commercial agricultural utilisation sector rather than direct use for livelihoods.
5.2.5 Corrective Action
If the ecological analysis show the need for the making available of higher volumes of water and the present
sources cannot supply, reallocation from the irrigation sector will take place and the macro – economic impacts
of the action will be calculated.
5.3 MV-B: VALS RIVER
5.3.1 Water Resources Assessment
Vals River (including and upstream of C61J)
This river system does not have storage regulation capability with release capabilities, with the result that high
flow control and management is not possible. Moqhaka (previously known as Kroonstad) is supplied from
Serfontein Dam, which has a small storage relative to the runoff. The yield balance situation is such that there
are deficits in supply as was recently experienced in restrictions to the town of Moqhaka.
The only management measure to supply the EWRs in this system would be to reduce the water use.
5.3.2 Ecological Assessment
A summary table of the status quo assessment for each node and SQ reach is provided in Table 5.3. The
results are also provided in Figure B-5 of Appendix B.
Table 5.3: PES, EIS and REC for MV-B
VC node
SQ code PES FLOW
RELATED NON FLOW RELATED EIS EI REC ACTIONS REQUIRED
VC31 C60A-02607 C Abstraction. Agriculture and irrigation. LOW LOW C Maintain present conditions to
maintain PES/REC.
VC33 C60C-02471 C Abstraction. Agriculture and irrigation. LOW MODERATE C Maintain present conditions to
maintain PES/REC.
VC35 C60G-02399 C
Water quality related impacts due to upstream urbanization. LOW LOW C Maintain present conditions to
maintain PES/REC. EWR 14
C60J-02262 C/D Abstraction Agricultural activities,
anthropogenic activities, WWTW. To be included after review

Classification of Significant Water Resources in the Upper Middle and Lower Vaal WMAs Sta tus Quo Report
Status Quo Report V13 September 2011
78
The PES is in a C/D for the EWR site and a C for the other nodes. Most of the impacts associated in this
reach are due to agricultural activities, and abstraction in some areas. Water quality (wq) is a C to C/D category
for most of the Vals River due to agricultural activities and some urban impacts around Kroonstad. The
unnamed tributary is in a B category for water quality as the predominant land use is dryland agriculture.
There are no nodes with a High importance and the REC in all cases reflects the maintenance of the PES.
5.3.3 Socio-economic Assessment
Table 5.4: Economic Impacts on Vals River (2010)
GDP (R Million)
Employment (Numbers)
Income Households (R Million)
Direct Total Direct Total Low Total
Irrigation Agriculture 38.9 124.9 222 1 038 12.7 85.8
Mining 834.2 1 581.5 5 068 9 607 44.9 689.6
Manufacturing 853.6 1 827.1 4 690 10 040 80.9 1 257.9
Power Generation N/A N/A N/A N/A N/A N/A
Total 1 726.7 3 533.5 9 980 20 686 138.5 2 033.3
The area hosts both mining and manufacturing sectors with Viljoenskroon as urban centre. The main
contributor to GDP, employment opportunities and household income in the area is the manufacturing sector
with a GDP of R1 827.1 million, employment opportunities of 10 040 and a contribution to household incomes of
R1 257.9 million. The area also has a competing mining sector.
5.3.4 Goods and Services Assessment
This part includes the Vals River with dryland commercial agriculture and some limited irrigation. A sparse
population is characteristic of most of the area. Also included as riverine resources, are the Elandspruit,
Renosterpruit and Skikspruit. These are also associated with dryland agriculture. The major town is Kroonstad
with Viljoenskroon also present.
• Fishing (Recreational): Moderately important in certain areas with the emphasis on the river and farm
dams.
• Fishing (Subsistence): Limited to farmworkers and some usage from the dams.
• Other Recreational Opportunities: The area offers a limited set of recreational opportunities associated
with the riverine system but given the relative paucity of alternative recreational zones the riverine areas
may play some role particularly in the lower reaches of the Vals.
• Riparian vegetation: Although some species were deemed to be important in this regard the actual
utilisation is low given the nature of restrictions on access to the river and associated area.
• Waste Water Dilution and Assimilation: Given that land use is primarily commercial agriculture the
Classification of Significant Water Resources in the Upper Middle and Lower Vaal WMAs Sta tus Quo Report
Status Quo Report V13 September 2011
79
function of the river in this regard is of moderate importance.
• Floodplain cultivation: Although there are floodplains in the area and they are utilised it is part of the
commercial agricultural utilisation sector rather than direct use for livelihoods.
5.3.5 Corrective Action
If the ecological analysis show the need for the making available of higher volumes of water and the present
sources cannot supply, reallocation from the irrigation sector will take place and the macro – economic impacts
of the action will be calculated.
5.4 MV-C: SCHOONSPRUIT AND KOEKEMOERSPRUIT
5.4.1 Water Resources Assessment
Schoonspruit River (including and upstream of C24H)
This river system has been the subject of a Catchment Management Strategy Study which also included a
Reserve Determination Study. The hydrology and EWR information from that study was obtained and the
WRPM configuration of the entire Schoonspruit Sub-system was updated as part of the Comprehensive
Reserve Determination Study (DWA, 2010d).
The catchment of the Koekemoerspruit was included in the so-called Bloemhof Dam incremental catchment.
Note that the Schoonspruit was not re-evaluated on a desktop level as part of the water quality assessment as a
Reserve study (DWAF, 2006) had previously been conducted.
5.4.2 Ecological Assessment
A summary table of the status quo assessment for each node and SQ reach is provided in Table 5.5. All the
required information was not explicit in the Schoonspruit EWR reports and the missing sections will have to be
assessed and the rest to be derived. Although it was not planned to include the Schoonspruit in the review of
the Middle and Lower Vaal Reserve studies, some aspects will have to be addressed. The results are also
provided in Figure B-6 of Appendix B.
Table 5.5: PES, EIS and REC for MV-C
VC node
SQ reach PES FLOW RELATED NON FLOW RELATED EIS EI REC ACTIONS REQUIRED
S1 C24E-01164 C/D
Agricultural return flows, flow regulation for irrigation use (less flows in the river).
Not undertaken as part of the Comprehensive
EWR study C/D To be included after review
VC21 C24F-01476 C Abstraction.
Agriculture and barrier effect in lower reaches impacting migration.
LOW MODERATE C Maintaining present day flows will maintain PES/REC.

Classification of Significant Water Resources in the Upper Middle and Lower Vaal WMAs Sta tus Quo Report
Status Quo Report V13 September 2011
80
VC node
SQ reach PES FLOW RELATED NON FLOW RELATED EIS EI REC ACTIONS REQUIRED
S3 C24G-01661 C/D
Agricultural return flows, flow regulation for irrigation use (less flows in the river).
Not undertaken as part of the Comprehensive
EWR study C/D To be included after review
S4 C24H-01860 C/D
Agricultural return flows, flow regulation for irrigation use (less flows in the river).
Water quality related problems relating to urbanization, mining and agriculture.
Not undertaken as part of the Comprehensive
EWR study C/D To be included after review
VC22 C24A-01787 D/E Abstraction.
Water quality related problems relating to urbanization, mining and agriculture.
LOW LOW D
For an improvement in the macroinvertebrate EC, water quality improvement is needed although this is unlikely to. To improve the vegetation, agricultural practices require improvement.
VC23 C24H-01732 D Abstraction.
Water quality related problems relating to urbanization, mining and agriculture.
LOW LOW D
Fish must be improved but this is unlikely to happen unless the Klerksdorp water quality issues are addressed.
Water quality is generally poor across this area, i.e. a D on the Taaibosspruit to a D/E on the Koekemoerspruit
and an E on the Jagspruit. Impacts are largely due to agriculture and urban / mining impacts. To improve the
Koekemoerspruit to a D (the required REC) would require water quality improvements which are unlikely to
happen as well as improvements in agricultural practices.
5.4.3 Socio-economic Assessment
Table 5.6: Economic Impacts on Schoonspruit and Koekemoerspruit (2010)
GDP (R Million) Employment (Numbers) Income Households
(R Million) Direct Total Direct Total Low Total
Irrigation Agriculture 40.5 128.4 211 1 038 13.0 87.6
Mining 5 147.1 9 757.6 31 268 59 276 276.7 4 254.9
Manufacturing 417.5 893.7 2 294 4 911 39.6 615.3
Power Generation N/A N/A N/A N/A N/A N/A
Total 5 605.1 10 779.7 33 773 65 226 329.3 4 957.8
The area is a predominantly mining area. The main contributor to GDP, employment opportunities and
household income in the area is therefore the mining industry with a GDP of R9 757.6 million, employment
opportunities of 59 276 and a contribution to household incomes of R4 254.9 million.
5.4.4 Goods and Services Assessment
This includes the Schoonspruit, Taaibosspruit, Koekemoerspruit and Jagspruit. The important towns are

Classification of Significant Water Resources in the Upper Middle and Lower Vaal WMAs Sta tus Quo Report
Status Quo Report V13 September 2011
81
Ventersdorp, Klerksdorp, Stilfontein, and parts of the outskirts of Orkney. Land use is predominately dryland
and limited irrigated agriculture with the urban nodes largely acting as agricultural service delivery towns as
mentioned, and some mining.
• Fishing (Recreational): This is of moderate important in certain areas with the emphasis on the river and
farm dams.
• Fishing (Subsistence): Limited to farm workers and some usage from the dams although some
populations from the towns may also make limited use of subsistence fishing but access is limited and
the habitat forms are such that fish do not thrive readily.
• Other Recreational Opportunities: The area offers a limited set of recreational opportunities associated
with the riverine system but given the relative paucity of alternative recreational zones the riverine areas
may play some role.
• Riparian vegetation: Although some species were deemed to be important in this regard the actual
utilisation is low given the nature of restrictions on access to the river and associated area.
• Waste Water Dilution and Assimilation: Given that land use is primarily commercial agriculture the
function of the river in this regard is of moderate importance.
• Floodplain cultivation: Negligible.
5.4.5 Corrective Action
If the ecological analysis show the need for the making available of higher volumes of water and the present
sources cannot supply, reallocation from the irrigation sector will take place and the macro – economic impacts
of the action will be calculated.
5.5 MV-D1: UPPER SAND RIVER
5.5.1 Water Resources Assessment
This IUA comprises of the catchment upstream of Allemanskraal Dam which is located on the Sand River in
quaternary catchment C42E. There are a number of small dams in this incremental catchment which supply
water for irrigation. Allemanskraal Dam is over utilised (existing allocations exceed the water resource
availability) and any new allocations in the upstream catchment will have a negative impact on the assurance of
supply to existing water users. Although existing water use comprises mainly of irrigation, Virginia town has an
allocation of 15.2 million m3/a from the dam. The dam has flow release regulating capabilities and it was
recommended that an EWR site be considered downstream of the dam.
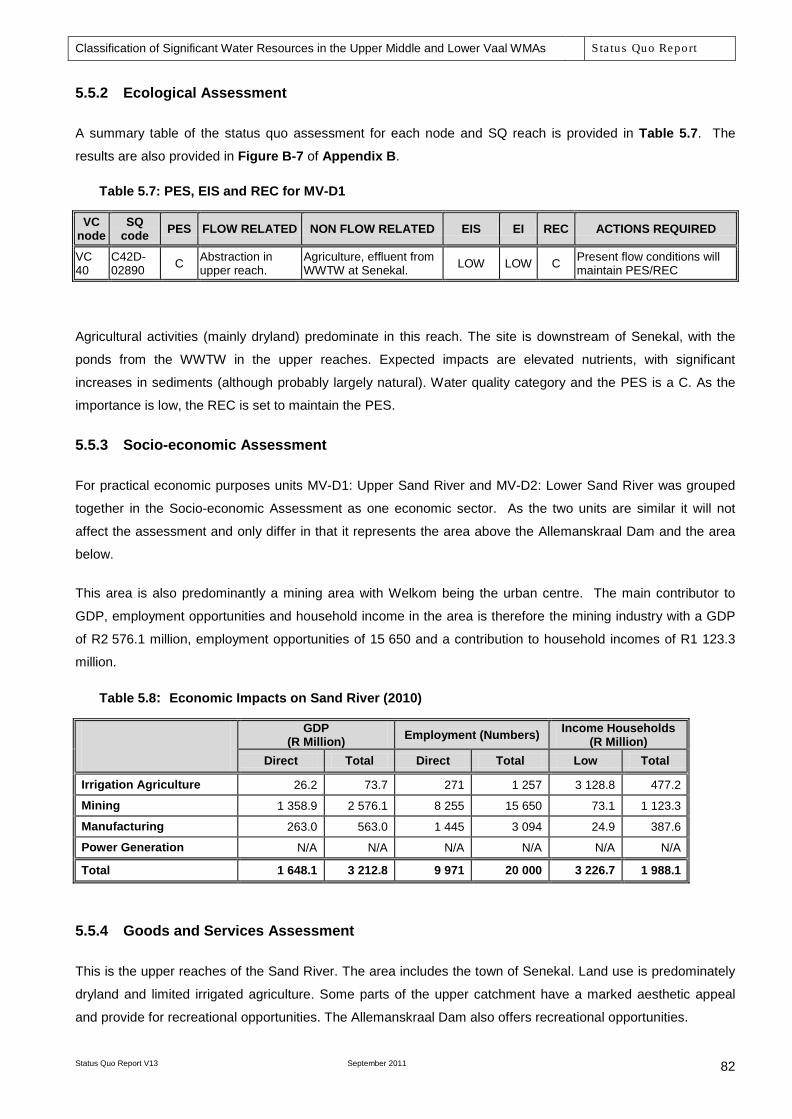
Classification of Significant Water Resources in the Upper Middle and Lower Vaal WMAs Sta tus Quo Report
Status Quo Report V13 September 2011
82
5.5.2 Ecological Assessment
A summary table of the status quo assessment for each node and SQ reach is provided in Table 5.7. The
results are also provided in Figure B-7 of Appendix B.
Table 5.7: PES, EIS and REC for MV-D1
VC node
SQ code PES FLOW RELATED NON FLOW RELATED EIS EI REC ACTIONS REQUIRED
VC 40
C42D-02890 C Abstraction in
upper reach. Agriculture, effluent from WWTW at Senekal. LOW LOW C Present flow conditions will
maintain PES/REC
Agricultural activities (mainly dryland) predominate in this reach. The site is downstream of Senekal, with the
ponds from the WWTW in the upper reaches. Expected impacts are elevated nutrients, with significant
increases in sediments (although probably largely natural). Water quality category and the PES is a C. As the
importance is low, the REC is set to maintain the PES.
5.5.3 Socio-economic Assessment
For practical economic purposes units MV-D1: Upper Sand River and MV-D2: Lower Sand River was grouped
together in the Socio-economic Assessment as one economic sector. As the two units are similar it will not
affect the assessment and only differ in that it represents the area above the Allemanskraal Dam and the area
below.
This area is also predominantly a mining area with Welkom being the urban centre. The main contributor to
GDP, employment opportunities and household income in the area is therefore the mining industry with a GDP
of R2 576.1 million, employment opportunities of 15 650 and a contribution to household incomes of R1 123.3
million.
Table 5.8: Economic Impacts on Sand River (2010)
GDP (R Million) Employment (Numbers) Income Households
(R Million) Direct Total Direct Total Low Total
Irrigation Agriculture 26.2 73.7 271 1 257 3 128.8 477.2
Mining 1 358.9 2 576.1 8 255 15 650 73.1 1 123.3
Manufacturing 263.0 563.0 1 445 3 094 24.9 387.6
Power Generation N/A N/A N/A N/A N/A N/A
Total 1 648.1 3 212.8 9 971 20 000 3 226.7 1 988.1
5.5.4 Goods and Services Assessment
This is the upper reaches of the Sand River. The area includes the town of Senekal. Land use is predominately
dryland and limited irrigated agriculture. Some parts of the upper catchment have a marked aesthetic appeal
and provide for recreational opportunities. The Allemanskraal Dam also offers recreational opportunities.
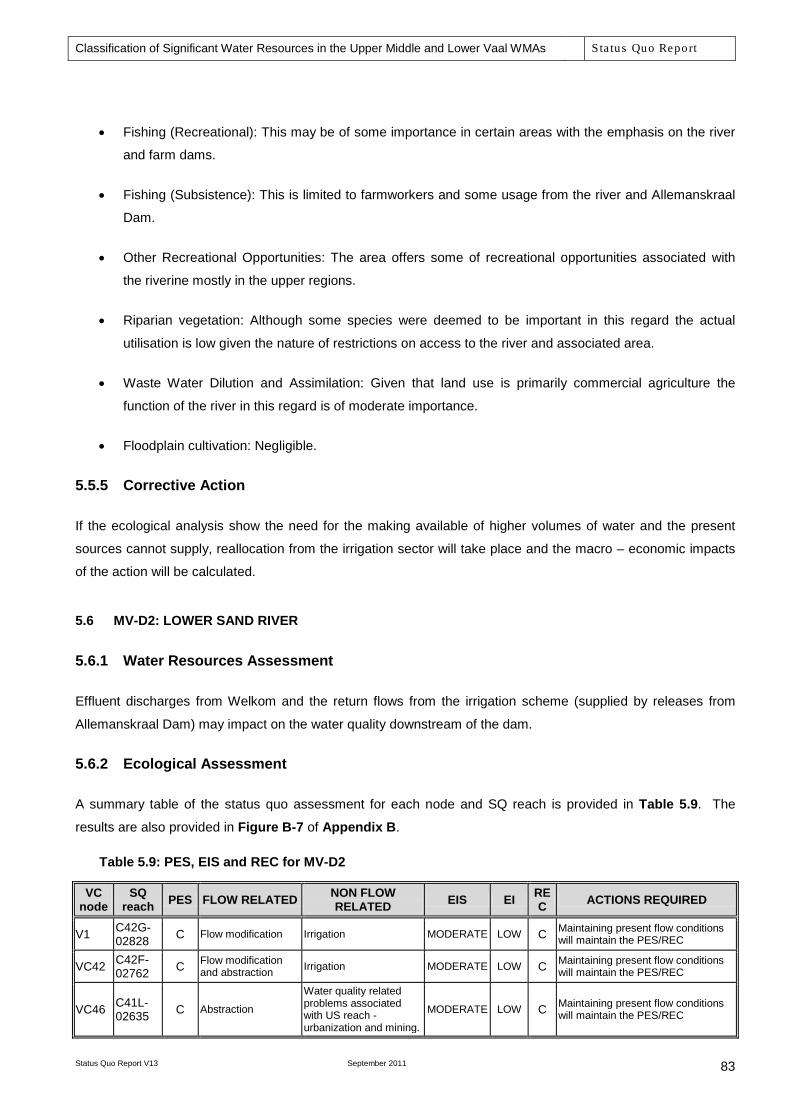
Classification of Significant Water Resources in the Upper Middle and Lower Vaal WMAs Sta tus Quo Report
Status Quo Report V13 September 2011
83
• Fishing (Recreational): This may be of some importance in certain areas with the emphasis on the river
and farm dams.
• Fishing (Subsistence): This is limited to farmworkers and some usage from the river and Allemanskraal
Dam.
• Other Recreational Opportunities: The area offers some of recreational opportunities associated with
the riverine mostly in the upper regions.
• Riparian vegetation: Although some species were deemed to be important in this regard the actual
utilisation is low given the nature of restrictions on access to the river and associated area.
• Waste Water Dilution and Assimilation: Given that land use is primarily commercial agriculture the
function of the river in this regard is of moderate importance.
• Floodplain cultivation: Negligible.
5.5.5 Corrective Action
If the ecological analysis show the need for the making available of higher volumes of water and the present
sources cannot supply, reallocation from the irrigation sector will take place and the macro – economic impacts
of the action will be calculated.
5.6 MV-D2: LOWER SAND RIVER
5.6.1 Water Resources Assessment
Effluent discharges from Welkom and the return flows from the irrigation scheme (supplied by releases from
Allemanskraal Dam) may impact on the water quality downstream of the dam.
5.6.2 Ecological Assessment
A summary table of the status quo assessment for each node and SQ reach is provided in Table 5.9. The
results are also provided in Figure B-7 of Appendix B.
Table 5.9: PES, EIS and REC for MV-D2
VC node
SQ reach PES FLOW RELATED NON FLOW
RELATED EIS EI REC ACTIONS REQUIRED
V1 C42G-02828 C Flow modification Irrigation MODERATE LOW C Maintaining present flow conditions
will maintain the PES/REC
VC42 C42F-02762 C Flow modification
and abstraction Irrigation MODERATE LOW C Maintaining present flow conditions will maintain the PES/REC
VC46 C41L-02635 C Abstraction
Water quality related problems associated with US reach - urbanization and mining.
MODERATE LOW C Maintaining present flow conditions will maintain the PES/REC

Classification of Significant Water Resources in the Upper Middle and Lower Vaal WMAs Sta tus Quo Report
Status Quo Report V13 September 2011
84
The PES is a C for all nodes. Most of the impacts associated in this reach are due to agricultural activities,
abstraction and urbanisation and mining (VC46). Water quality in the area is worst where mining impacts
around Welkom and Virginia dominate. Here water quality is assumed to be a D category. Impacts at the other
two sites are mostly agricultural, and are a B/C to C category
There are no nodes with a High importance so the REC in all cases reflects the maintenance of the PES.
5.6.3 Socio-economic Assessment
See Socio-Economic Assessment in Section 0 above.
5.6.4 Goods and Services Assessment
This is the lower Sand River but also includes the Klipspruit, Koolspruit, Maselspruit, Erasmusspruit, and the
Sloopspruit. Towns include Ventersburg, Henneman, and Virginia. Most land use is dryland agriculture with
limited irrigation. There is some mining. Other than in the towns the population density is very sparse.
• Fishing (Recreational): This is of some importance in certain areas with the emphasis on the river and
farm dams.
• Fishing (Subsistence): This is limited to farmworkers and some usage from the rivers. Poorer sectors of
the towns of Ventersburg, Henneman and Virginia may make use of opportunities but these are likely to
be very limited.
• Other Recreational Opportunities: The area offers some of recreational opportunities associated with
the riverine areas but these are limited and mostly used as a result of the paucity of other options.
• Riparian vegetation: Although some species were deemed to be important in this regard the actual
utilisation is low given the nature of restrictions on access to the river and associated area.
• Waste Water Dilution and Assimilation: Given that land use is primarily commercial agriculture the
function of the river in this regard is of moderate importance.
• Floodplain cultivation: Negligible.
5.6.5 Corrective Action
If the ecological analysis show the need for the making available of higher volumes of water and the present
sources cannot supply, reallocation from the irrigation sector will take place and the macro – economic impacts
of the action will be calculated.
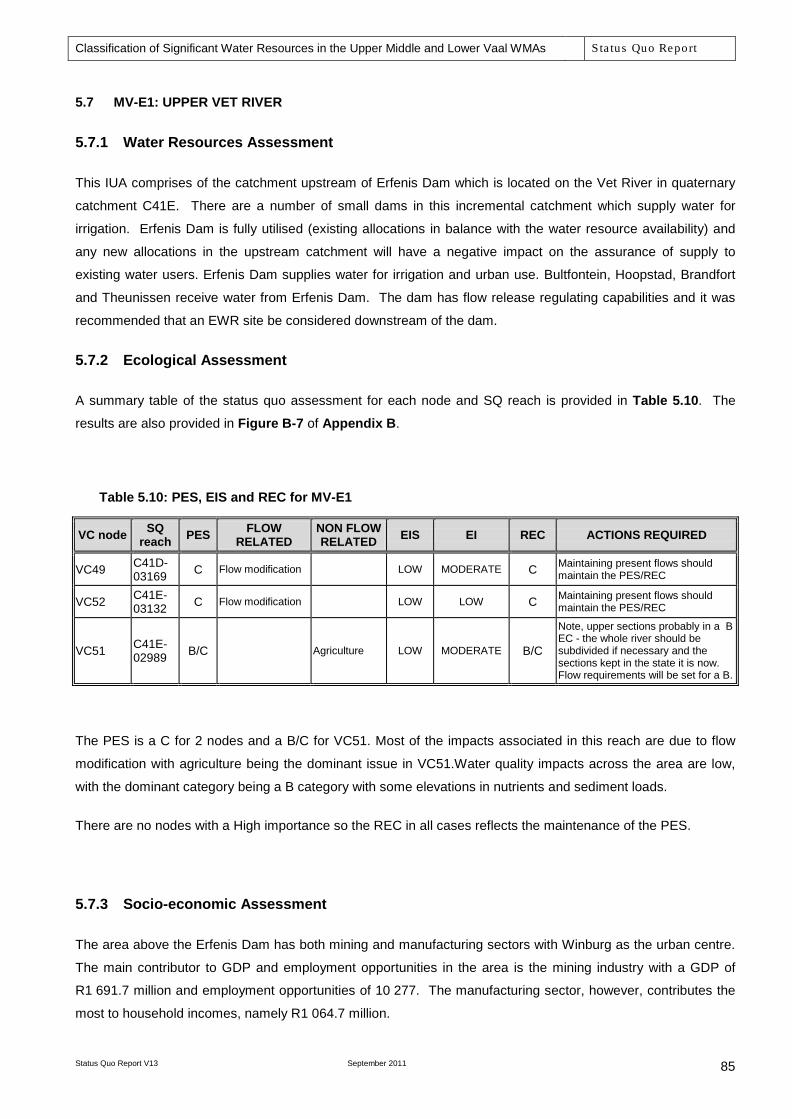
Classification of Significant Water Resources in the Upper Middle and Lower Vaal WMAs Sta tus Quo Report
Status Quo Report V13 September 2011
85
5.7 MV-E1: UPPER VET RIVER
5.7.1 Water Resources Assessment
This IUA comprises of the catchment upstream of Erfenis Dam which is located on the Vet River in quaternary
catchment C41E. There are a number of small dams in this incremental catchment which supply water for
irrigation. Erfenis Dam is fully utilised (existing allocations in balance with the water resource availability) and
any new allocations in the upstream catchment will have a negative impact on the assurance of supply to
existing water users. Erfenis Dam supplies water for irrigation and urban use. Bultfontein, Hoopstad, Brandfort
and Theunissen receive water from Erfenis Dam. The dam has flow release regulating capabilities and it was
recommended that an EWR site be considered downstream of the dam.
5.7.2 Ecological Assessment
A summary table of the status quo assessment for each node and SQ reach is provided in Table 5.10. The
results are also provided in Figure B-7 of Appendix B.
Table 5.10: PES, EIS and REC for MV-E1
VC node SQ reach PES FLOW
RELATED NON FLOW RELATED EIS EI REC ACTIONS REQUIRED
VC49 C41D-03169 C Flow modification LOW MODERATE C Maintaining present flows should
maintain the PES/REC
VC52 C41E-03132 C Flow modification LOW LOW C Maintaining present flows should
maintain the PES/REC
VC51 C41E-02989 B/C Agriculture LOW MODERATE B/C
Note, upper sections probably in a B EC - the whole river should be subdivided if necessary and the sections kept in the state it is now. Flow requirements will be set for a B.
The PES is a C for 2 nodes and a B/C for VC51. Most of the impacts associated in this reach are due to flow
modification with agriculture being the dominant issue in VC51.Water quality impacts across the area are low,
with the dominant category being a B category with some elevations in nutrients and sediment loads.
There are no nodes with a High importance so the REC in all cases reflects the maintenance of the PES.
5.7.3 Socio-economic Assessment
The area above the Erfenis Dam has both mining and manufacturing sectors with Winburg as the urban centre.
The main contributor to GDP and employment opportunities in the area is the mining industry with a GDP of
R1 691.7 million and employment opportunities of 10 277. The manufacturing sector, however, contributes the
most to household incomes, namely R1 064.7 million.
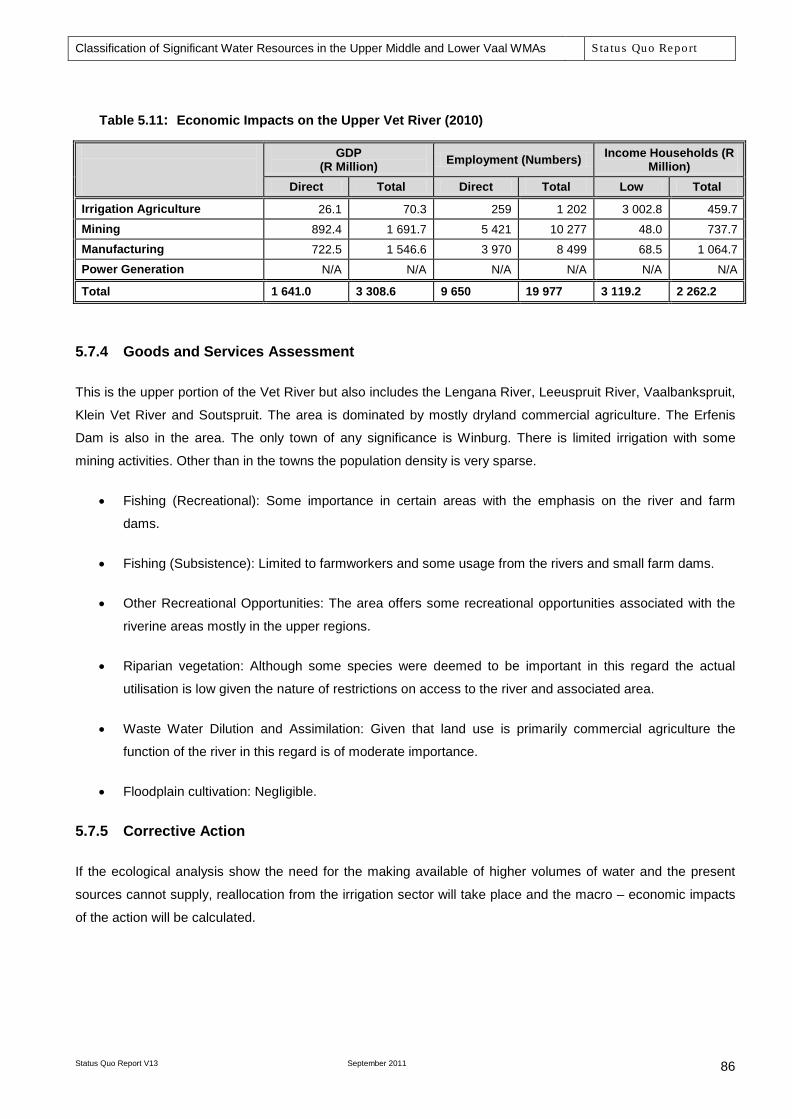
Classification of Significant Water Resources in the Upper Middle and Lower Vaal WMAs Sta tus Quo Report
Status Quo Report V13 September 2011
86
Table 5.11: Economic Impacts on the Upper Vet River (2010)
GDP (R Million) Employment (Numbers) Income Households (R
Million) Direct Total Direct Total Low Total
Irrigation Agriculture 26.1 70.3 259 1 202 3 002.8 459.7 Mining 892.4 1 691.7 5 421 10 277 48.0 737.7 Manufacturing 722.5 1 546.6 3 970 8 499 68.5 1 064.7 Power Generation N/A N/A N/A N/A N/A N/A
Total 1 641.0 3 308.6 9 650 19 977 3 119.2 2 262.2
5.7.4 Goods and Services Assessment
This is the upper portion of the Vet River but also includes the Lengana River, Leeuspruit River, Vaalbankspruit,
Klein Vet River and Soutspruit. The area is dominated by mostly dryland commercial agriculture. The Erfenis
Dam is also in the area. The only town of any significance is Winburg. There is limited irrigation with some
mining activities. Other than in the towns the population density is very sparse.
• Fishing (Recreational): Some importance in certain areas with the emphasis on the river and farm
dams.
• Fishing (Subsistence): Limited to farmworkers and some usage from the rivers and small farm dams.
• Other Recreational Opportunities: The area offers some recreational opportunities associated with the
riverine areas mostly in the upper regions.
• Riparian vegetation: Although some species were deemed to be important in this regard the actual
utilisation is low given the nature of restrictions on access to the river and associated area.
• Waste Water Dilution and Assimilation: Given that land use is primarily commercial agriculture the
function of the river in this regard is of moderate importance.
• Floodplain cultivation: Negligible.
5.7.5 Corrective Action
If the ecological analysis show the need for the making available of higher volumes of water and the present
sources cannot supply, reallocation from the irrigation sector will take place and the macro – economic impacts
of the action will be calculated.
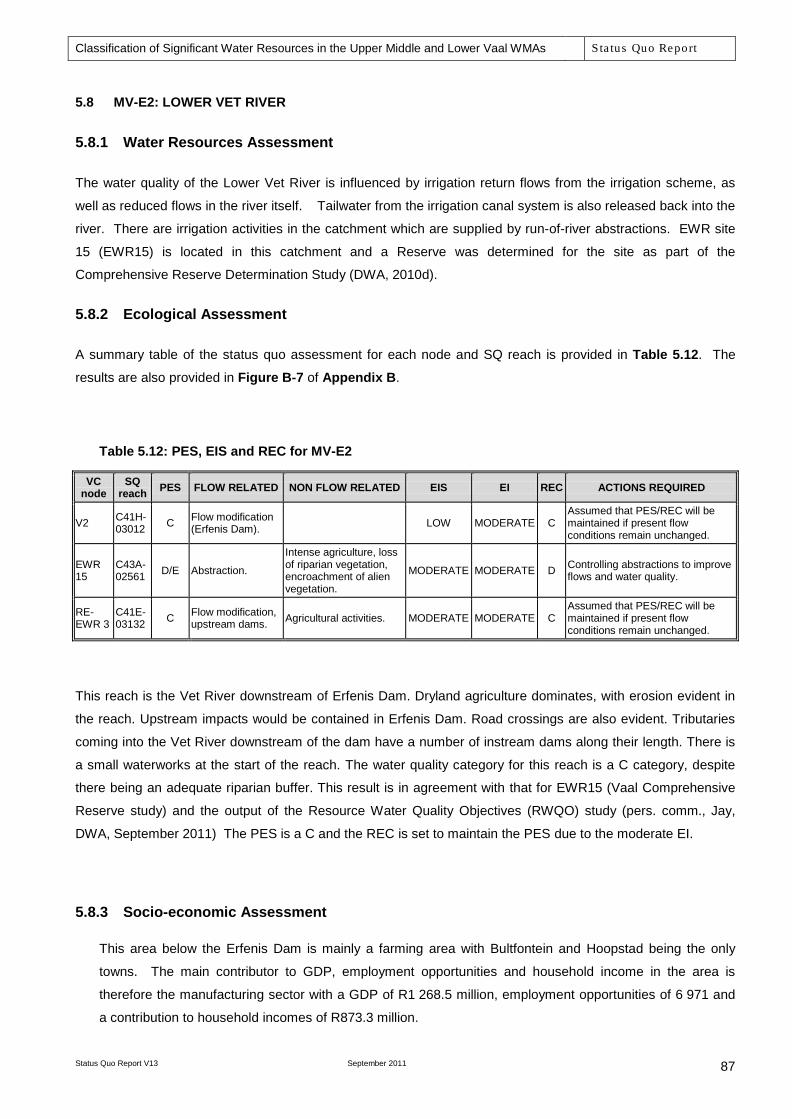
Classification of Significant Water Resources in the Upper Middle and Lower Vaal WMAs Sta tus Quo Report
Status Quo Report V13 September 2011
87
5.8 MV-E2: LOWER VET RIVER
5.8.1 Water Resources Assessment
The water quality of the Lower Vet River is influenced by irrigation return flows from the irrigation scheme, as
well as reduced flows in the river itself. Tailwater from the irrigation canal system is also released back into the
river. There are irrigation activities in the catchment which are supplied by run-of-river abstractions. EWR site
15 (EWR15) is located in this catchment and a Reserve was determined for the site as part of the
Comprehensive Reserve Determination Study (DWA, 2010d).
5.8.2 Ecological Assessment
A summary table of the status quo assessment for each node and SQ reach is provided in Table 5.12. The
results are also provided in Figure B-7 of Appendix B.
Table 5.12: PES, EIS and REC for MV-E2
VC node
SQ reach PES FLOW RELATED NON FLOW RELATED EIS EI REC ACTIONS REQUIRED
V2 C41H-03012 C Flow modification
(Erfenis Dam). LOW MODERATE C Assumed that PES/REC will be maintained if present flow conditions remain unchanged.
EWR 15
C43A-02561 D/E Abstraction.
Intense agriculture, loss of riparian vegetation, encroachment of alien vegetation.
MODERATE MODERATE D Controlling abstractions to improve flows and water quality.
RE-EWR 3
C41E-03132 C Flow modification,
upstream dams. Agricultural activities. MODERATE MODERATE C Assumed that PES/REC will be maintained if present flow conditions remain unchanged.
This reach is the Vet River downstream of Erfenis Dam. Dryland agriculture dominates, with erosion evident in
the reach. Upstream impacts would be contained in Erfenis Dam. Road crossings are also evident. Tributaries
coming into the Vet River downstream of the dam have a number of instream dams along their length. There is
a small waterworks at the start of the reach. The water quality category for this reach is a C category, despite
there being an adequate riparian buffer. This result is in agreement with that for EWR15 (Vaal Comprehensive
Reserve study) and the output of the Resource Water Quality Objectives (RWQO) study (pers. comm., Jay,
DWA, September 2011) The PES is a C and the REC is set to maintain the PES due to the moderate EI.
5.8.3 Socio-economic Assessment
This area below the Erfenis Dam is mainly a farming area with Bultfontein and Hoopstad being the only
towns. The main contributor to GDP, employment opportunities and household income in the area is
therefore the manufacturing sector with a GDP of R1 268.5 million, employment opportunities of 6 971 and
a contribution to household incomes of R873.3 million.

Classification of Significant Water Resources in the Upper Middle and Lower Vaal WMAs Sta tus Quo Report
Status Quo Report V13 September 2011
88
Table 5.13: Economic Impacts on Lower Vet River below the Erfenis Dam (2010)
GDP (R Million)
Employment (Numbers)
Income Households (R Million)
Direct Total Direct Total Low Total
Irrigation Agriculture 17.4 46.9 173 801 2 001.8 306.5 Mining 445.8 845.1 2 708 5 134 24.0 368.5 Manufacturing 592.6 1 268.5 3 257 6 971 56.2 873.3 Power Generation N/A N/A N/A N/A N/A N/A
Total 1 055.8 2 160.5 6 137 12 906 2 082.0 1 548.3
5.8.4 Goods and Services Assessment
This is the lower portion of the Vet River but also includes the Taaibos Spruit and the Bloemhof Dam. The major
urban settlement is Hopetown but, as with the upper Vet portion of the catchment, the population is sparse.
Commercial dryland agriculture is the dominant land use and the population density is therefore scattered and
relatively sparse.
• Fishing (Recreational): This is of some importance in certain areas with the emphasis on the river and
farm dams as well as the areas upstream of the Bloemhof Dam. Commercial fishing is a feature of the
Bloemhof Dam, but this is excluded from this assessment.
• Fishing (Subsistence): Limited to farmworkers.
• Other Recreational Opportunities: The area offers some recreational opportunities associated with the
riverine areas as well as those associated with the points of inflow into Bloemhof dam.
• Riparian vegetation: Although some species were deemed to be important in this regard the actual
utilisation is low given the nature of restrictions on access to the river and associated area.
• Waste Water Dilution and Assimilation: Given that land use is primarily commercial agriculture the
function of the river in this regard is of moderate importance.
• Floodplain cultivation: Negligible from a livelihood perspective although important in terms of
commercial value.
5.8.5 Corrective Action
If the ecological analysis show the need for the making available of higher volumes of water and the present
sources cannot supply, reallocation from the irrigation sector will take place and the macro – economic impacts
of the action will be calculated.

Classification of Significant Water Resources in the Upper Middle and Lower Vaal WMAs Sta tus Quo Report
Status Quo Report V13 September 2011
89
5.9 MV-F: VAAL RIVER FROM C24B TO BLOEMHOF DAM
5.9.1 Water Resources Assessment
Midvaal Water Company and Sedibeng Water are two bulk water suppliers abstracting water from the Vaal
River in this IUA. There are contributing flows from tributary rivers such as the Renoster, Schoonspruit and
Vals. There are also significant evaporative losses in this river reach. The location of Bloemhof Dam, at the
downstream end of this river reach, provides operating flexibility in that water released from the Vaal Barrage is
not necessarily a loss from the Integrated Vaal River System. There are, however, constraints in the volume of
releases that can be made.
5.9.2 Ecological Assessment
A summary table of the status quo assessment for each node and SQ reach is provided in Table 5.14. The
results are also provided in Figure B-8 of Appendix B.
Table 5.14: PES, EIS and REC for MV-F
VC node
SQ reach PES FLOW RELATED NON FLOW
RELATED EIS EI REC ACTIONS REQUIRED
EWR 12
C24B-01817 D
Operation of the system and Vaal Dam upstream.
Mine effluent, agriculture run off and WWTW.
MODERATE MODERATE D
A change in flow seasonality which mimics a natural flow regime. More floods and freshette cues in summer. Water quality management.
EWR 13
C24J-02016 C
Operation of the system and Vaal Dam upstream.
Mine effluent, agriculture run off and WWTW.
Review of this data would be required to confirm the EIS
VC56 C41H-02948 C Flow modification. LOW MODERATE C If present flow conditions are maintained,
then the PES/REC will be maintained
VC56 represents the reach in the lower Klipspruit before its confluence with the Vaal River. Upper tributaries are
largely in dryland agricultural areas. This reach is covered by old agricultural land and is assumed to be
ephemeral. A number of road crossings are present. The water quality is unlikely to move out of an A category,
with the primary water quality issue probably being erosion and sediment loads. The PES is a C due to flow
modification and the REC is set to maintain the PES due to the Moderate EI. The EWR sites are also in a C
PES with the impacts dominated by the flow modification and water quality issues.
5.9.3 Socio-economic Assessment
This area is mainly a manufacturing area. The main contributor to GDP, employment opportunities and
household income in the area is therefore the manufacturing sector with a GDP of R979.5 million, employment
opportunities of 5 383 and a contribution to household incomes of R674.3 million.
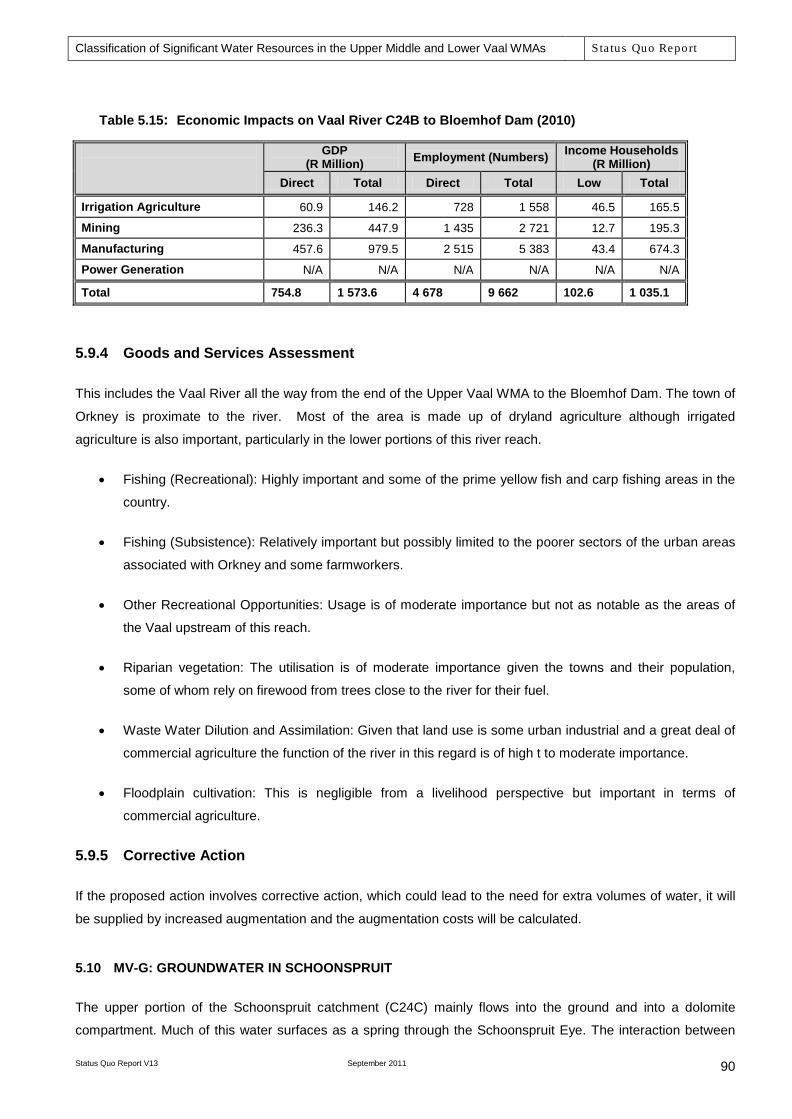
Classification of Significant Water Resources in the Upper Middle and Lower Vaal WMAs Sta tus Quo Report
Status Quo Report V13 September 2011
90
Table 5.15: Economic Impacts on Vaal River C24B to Bloemhof Dam (2010)
GDP (R Million) Employment (Numbers) Income Households
(R Million) Direct Total Direct Total Low Total
Irrigation Agriculture 60.9 146.2 728 1 558 46.5 165.5
Mining 236.3 447.9 1 435 2 721 12.7 195.3
Manufacturing 457.6 979.5 2 515 5 383 43.4 674.3
Power Generation N/A N/A N/A N/A N/A N/A
Total 754.8 1 573.6 4 678 9 662 102.6 1 035.1
5.9.4 Goods and Services Assessment
This includes the Vaal River all the way from the end of the Upper Vaal WMA to the Bloemhof Dam. The town of
Orkney is proximate to the river. Most of the area is made up of dryland agriculture although irrigated
agriculture is also important, particularly in the lower portions of this river reach.
• Fishing (Recreational): Highly important and some of the prime yellow fish and carp fishing areas in the
country.
• Fishing (Subsistence): Relatively important but possibly limited to the poorer sectors of the urban areas
associated with Orkney and some farmworkers.
• Other Recreational Opportunities: Usage is of moderate importance but not as notable as the areas of
the Vaal upstream of this reach.
• Riparian vegetation: The utilisation is of moderate importance given the towns and their population,
some of whom rely on firewood from trees close to the river for their fuel.
• Waste Water Dilution and Assimilation: Given that land use is some urban industrial and a great deal of
commercial agriculture the function of the river in this regard is of high t to moderate importance.
• Floodplain cultivation: This is negligible from a livelihood perspective but important in terms of
commercial agriculture.
5.9.5 Corrective Action
If the proposed action involves corrective action, which could lead to the need for extra volumes of water, it will
be supplied by increased augmentation and the augmentation costs will be calculated.
5.10 MV-G: GROUNDWATER IN SCHOONSPRUIT
The upper portion of the Schoonspruit catchment (C24C) mainly flows into the ground and into a dolomite
compartment. Much of this water surfaces as a spring through the Schoonspruit Eye. The interaction between

Classification of Significant Water Resources in the Upper Middle and Lower Vaal WMAs Sta tus Quo Report
Status Quo Report V13 September 2011
91
surface and groundwater was explicitly modelled as part of the Schoonspruit Study (DWAF, 2006).
Figure 5.1 shows the extent of the Schoonspruit dolomitic compartment.
Figure 5.1: Location of Schoonspruit dolomitic compartment
The Schoonspruit Dolomitic Compartment has been named after the Schoonspruit Eye, which is dependent on
the compartment for flow. It consists of dolomites of the Malmani Group. Chert rich units of the Monte Christo
and Eccles Formations have an increased permeability and storage due to karst solution channels. The
topography slopes downward from the Northeast to the Southwest. The Schoonspruit drains the Schoonspruit
compartment and runs to the Johan Neser Dam.
The area falls in the summer rainfall area, with most of the rainfall occurring from November to February. The
average rainfall for the area is 587 mm/a. Recharge is approximately 6% of the rainfall. The average water level
is 20.5 mbgl, and the average yield is about 15 l/s, hence the compartment is a high yielding aquifer.
The 1 585 km2 compartment is outlined by the contact with the Rooihoogte formation of the Pretoria group in the
North and the contact with the Black Reef formation in the South. A NNW-SSE striking dyke forms the eastern
boundary and a N-S running fault system the western boundary.
An important characteristic of the Schoonspruit System is the strong interaction between groundwater and
surface water resources due to discharges from the dolomitic compartment. Significant irrigation developments
on the dolomitic aquifer began in the late 1980s and significantly impacted on flows from the eye and to the
Classification of Significant Water Resources in the Upper Middle and Lower Vaal WMAs Sta tus Quo Report
Status Quo Report V13 September 2011
92
Schoonspruit system. Borehole abstractions dramatically increased over time from 2 767ha in 1994 to 5 017ha
in 2002, with a total demand of 41 million m3/a. Abstraction has been validated by Schoeman and Vennote over
time windows in order to quantify the areas under irrigation. Over time this irrigation has also migrated and takes
place further away from the spring. This has important implications to the impact on flow from the eye. Flow
from the eye has been reduced from 60 million m3/a under natural conditions after the start of irrigation. The flow
from the eye was successfully simulated over the period 1920 to 2002 (DWAF, 2006), showing that flow
reduced to 20 million m3/a in the early 1990s, rising to 48 million m3/a in 2000 with a reduction in abstraction.
Since flow from the eye contributes 50% of inflows to the Johan Neser Dam and a high proportion of baseflow,
simulating the impacts of abstraction on discharges from the eye is crucial to the yield analysis of the Johan
Neser Dam.

Classification of Significant Water Resources in the Upper Middle and Lower Vaal WMAs Sta tus Quo Report
Status Quo Report V13 September 2011
93
6 STATUS QUO OF LOWER VAAL WMA
6.1 GENERAL
The five Integrated Units of Analysis (IUA) defined within the Lower Vaal WMA are shown in Figure A-3 of
Appendix A and Figure C-6 of Appendix C shows the WRPM configurations of these IUAs. It is important to
note that although the Riet-Modder catchment is part of the Lower Vaal catchment, it falls under the Orange
River WMA and was, therefore, as stated in the Terms of Reference (TOR), not included in this study’s area.
The Vaalharts Irrigation Scheme, situated in the Harts River catchment, is the largest irrigation scheme in the
country. The scheme comprises of the Vaalharts Weir, located on the main stem of the Vaal River downstream
of Bloemhof Dam, and a canal distribution system which is in need of rehabilitation. Losses from the canal
system range between 17% and 35%. The scheme is supplied with water released from Bloemhof Dam. There
are a number of abstractions along the main stem of the Vaal River to supply water for irrigation and urban use
(Kimberley and others). The Vaal-Gamagara Government Water Scheme also abstracts water from the Vaal
River upstream of the Riet-Modder confluence with the Vaal and has an allocation of about 13 million m3/a .
The water requirements, return flows and losses included in the WRPM configuration are listed in Table F-2 of
Appendix F.
6.2 LV-A1: UPPER HARTS RIVER
6.2.1 Water Resources Assessment
This river reach has no upstream regulating storage and there are substantial irrigation abstractions that are
already experiencing low assurance of supply. Water is also transferred from the Harts River (approximately
from the outlet of C31B) into Barberspan (located in quaternary C31D). This transfer will result in some of the
base flow being removed from the river reach. The exact operation of this transfer is unknown (capacity of the
transfer infrastructure etc.) at this point in time and need to be investigated as part of another study. The
ecological benefits of not transferring the water to Barberspan should be weighed against the benefits of having
the water in Barberspan. Barberspan Nature Reserve is positioned 16 km north east of Delareyville. It has
been identified as a RAMSAR site and is a sanctuary for waterfowl.
6.2.2 Ecological Assessment
A summary table of the status quo assessment for each node and SQ reach is provided in Table 6.1. The
results are also provided in Figure B-9 of Appendix B.
Table 6.1: PES, EIS and REC for LV-A1
VC node
SQ reach PES FLOW
RELATED NON FLOW RELATED EIS EI REC ACTIONS REQUIRED
VC55 C31B-01275 C Abstraction
Agriculture and small farm dams LOW LOW C Maintaining present flow conditions will
maintain the PES/REC
VC61 C31C-01665 C Abstraction Agriculture LOW MODERATE C Maintaining present flow conditions will
maintain the PES/REC
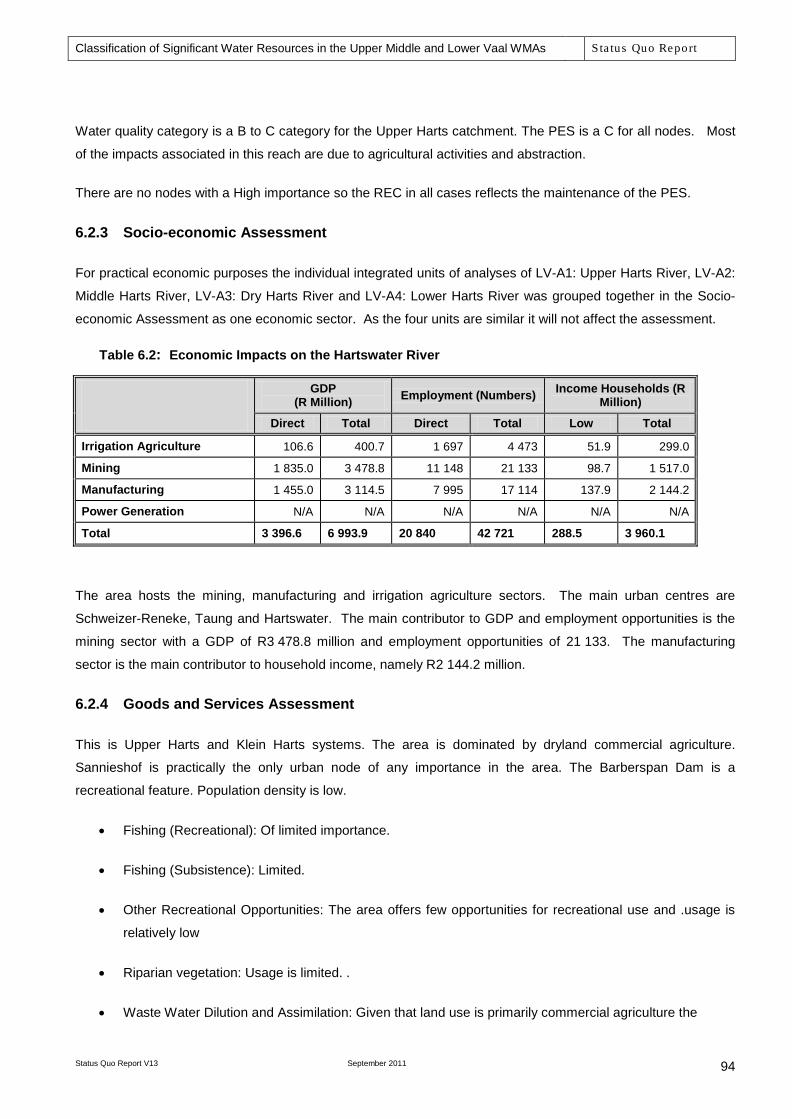
Classification of Significant Water Resources in the Upper Middle and Lower Vaal WMAs Sta tus Quo Report
Status Quo Report V13 September 2011
94
Water quality category is a B to C category for the Upper Harts catchment. The PES is a C for all nodes. Most
of the impacts associated in this reach are due to agricultural activities and abstraction.
There are no nodes with a High importance so the REC in all cases reflects the maintenance of the PES.
6.2.3 Socio-economic Assessment
For practical economic purposes the individual integrated units of analyses of LV-A1: Upper Harts River, LV-A2:
Middle Harts River, LV-A3: Dry Harts River and LV-A4: Lower Harts River was grouped together in the Socio-
economic Assessment as one economic sector. As the four units are similar it will not affect the assessment.
Table 6.2: Economic Impacts on the Hartswater River
GDP (R Million) Employment (Numbers) Income Households (R
Million)
Direct Total Direct Total Low Total
Irrigation Agriculture 106.6 400.7 1 697 4 473 51.9 299.0
Mining 1 835.0 3 478.8 11 148 21 133 98.7 1 517.0
Manufacturing 1 455.0 3 114.5 7 995 17 114 137.9 2 144.2
Power Generation N/A N/A N/A N/A N/A N/A
Total 3 396.6 6 993.9 20 840 42 721 288.5 3 960.1
The area hosts the mining, manufacturing and irrigation agriculture sectors. The main urban centres are
Schweizer-Reneke, Taung and Hartswater. The main contributor to GDP and employment opportunities is the
mining sector with a GDP of R3 478.8 million and employment opportunities of 21 133. The manufacturing
sector is the main contributor to household income, namely R2 144.2 million.
6.2.4 Goods and Services Assessment
This is Upper Harts and Klein Harts systems. The area is dominated by dryland commercial agriculture.
Sannieshof is practically the only urban node of any importance in the area. The Barberspan Dam is a
recreational feature. Population density is low.
• Fishing (Recreational): Of limited importance.
• Fishing (Subsistence): Limited.
• Other Recreational Opportunities: The area offers few opportunities for recreational use and .usage is
relatively low
• Riparian vegetation: Usage is limited. .
• Waste Water Dilution and Assimilation: Given that land use is primarily commercial agriculture the
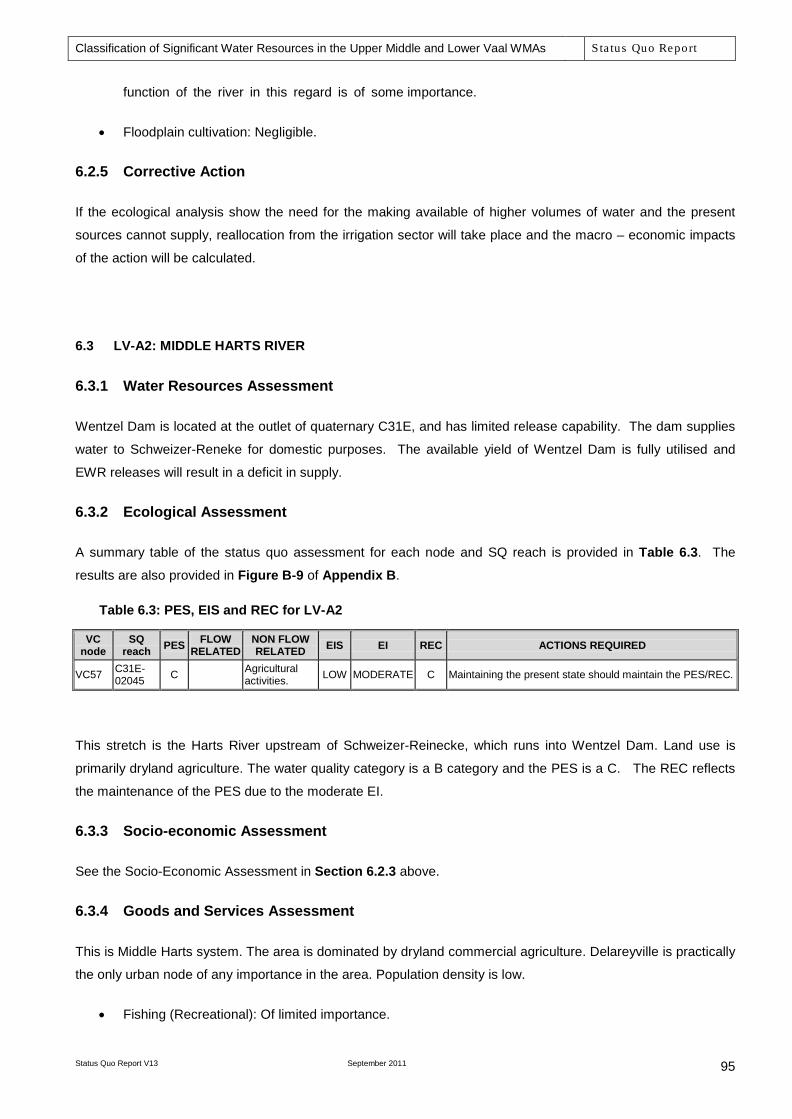
Classification of Significant Water Resources in the Upper Middle and Lower Vaal WMAs Sta tus Quo Report
Status Quo Report V13 September 2011
95
function of the river in this regard is of some importance.
• Floodplain cultivation: Negligible.
6.2.5 Corrective Action
If the ecological analysis show the need for the making available of higher volumes of water and the present
sources cannot supply, reallocation from the irrigation sector will take place and the macro – economic impacts
of the action will be calculated.
6.3 LV-A2: MIDDLE HARTS RIVER
6.3.1 Water Resources Assessment
Wentzel Dam is located at the outlet of quaternary C31E, and has limited release capability. The dam supplies
water to Schweizer-Reneke for domestic purposes. The available yield of Wentzel Dam is fully utilised and
EWR releases will result in a deficit in supply.
6.3.2 Ecological Assessment
A summary table of the status quo assessment for each node and SQ reach is provided in Table 6.3. The
results are also provided in Figure B-9 of Appendix B.
Table 6.3: PES, EIS and REC for LV-A2
VC node
SQ reach PES FLOW
RELATED NON FLOW RELATED EIS EI REC ACTIONS REQUIRED
VC57 C31E-02045 C Agricultural
activities. LOW MODERATE C Maintaining the present state should maintain the PES/REC.
This stretch is the Harts River upstream of Schweizer-Reinecke, which runs into Wentzel Dam. Land use is
primarily dryland agriculture. The water quality category is a B category and the PES is a C. The REC reflects
the maintenance of the PES due to the moderate EI.
6.3.3 Socio-economic Assessment
See the Socio-Economic Assessment in Section 6.2.3 above.
6.3.4 Goods and Services Assessment
This is Middle Harts system. The area is dominated by dryland commercial agriculture. Delareyville is practically
the only urban node of any importance in the area. Population density is low.
• Fishing (Recreational): Of limited importance.

Classification of Significant Water Resources in the Upper Middle and Lower Vaal WMAs Sta tus Quo Report
Status Quo Report V13 September 2011
96
• Fishing (Subsistence): Limited.
• Other Recreational Opportunities: The area offers few opportunities for recreational use and usage is
relatively low.
• Riparian vegetation: Usage is limited.
• Waste Water Dilution and Assimilation: Given that land use is primarily commercial agriculture the
function of the river in this regard is of some importance but probably not as important as the reaches
below this point.
• Floodplain cultivation: Negligible.
6.3.5 Corrective Action
If the ecological analysis show the need for the making available of higher volumes of water and the present
sources cannot supply, reallocation from the irrigation sector will take place and the macro – economic impacts
of the action will be calculated.
6.4 LV-A3: DRY HARTS RIVER
6.4.1 Water Resources Assessment
No regulation storage is present in this catchment and the flow is largely natural. The river is non-perennial.
6.4.2 Ecological Assessment
A summary table of the status quo assessment for each node and SQ reach is provided in Table 6.4. The
results are also provided in Figure B-9 of Appendix B.
Table 6.4: PES, EIS and REC for LV-A3
VC node
SQ reach PES FLOW
RELATED NON FLOW RELATED EIS EI REC ACTIONS REQUIRED
VC58 C32D-03250 D
Upstream of Taung Dam & irrigation.
Agricultural activities. LOW LOW D Maintaining the present day flow will maintain the PES/REC
The upper reaches of the river flow past a number of urban / peri-urban settlements, e.g. Leshobo and
Matlapaneng. In this reach it flows past Mokgareng. The lower end of the reach flows past pivot agriculture
around Taung town. A number of road crossings are found in the reach. Extensive erosion is also evident. The
water quality category is a C category and the PES is a D EC. Due to the low EI, the REC is set to maintain the
D PES.

Classification of Significant Water Resources in the Upper Middle and Lower Vaal WMAs Sta tus Quo Report
Status Quo Report V13 September 2011
97
6.4.3 Socio-economic Assessment
See the Socio-Economic Assessment in Section 6.2.3 above.
6.4.4 Goods and Services Assessment
This is the dry Harts system. The area is dominated by dryland commercial agriculture. Vryburg is the only
urban node of any importance in the area. Population density is low to very sparse.
• Fishing (Recreational): Of limited importance but some Yellowfish are present.
• Fishing (Subsistence): Limited.
• Other Recreational Opportunities: The area offers few opportunities for recreational use and usage is
relatively low.
• Riparian vegetation: Usage is limited.
• Waste Water Dilution and Assimilation: Given that land use is primarily commercial agriculture the
function of the river in this regard is of some importance.
• Floodplain cultivation: Negligible.
6.4.5 Corrective Action
If the ecological analysis show the need for the making available of higher volumes of water and the present
sources cannot supply, reallocation from the irrigation sector will take place and the macro – economic impacts
of the action will be calculated.
6.5 LV-A4: LOWER HARTS RIVER
6.5.1 Water Resources Assessment
Taung Dam is not utilised and investigations are currently underway to determine the feasibility of using the dam
to supply domestic and/or irrigation water requirements from the dam. Taung Dam will have limited release
capability (remedial civil works are being carried out on the release structures). The EWR downstream of the
dam will have a direct influence on the water that will be available to supply the proposed water uses.
Significant flows occur in the Harts River upstream of Spitskop Dam from the return flows of the Vaalharts
Irrigation Scheme. The return flows have substantially changed the flow regime compared to natural conditions.
This river reach receives flows from the Dry Harts River (upstream of and including quaternary C32D), which
has no regulating storage structure as well as from Taung Dam located in quaternary C31F.
The water available in Spitskop Dam is more than the water requirements supplied from the dam. This is due to
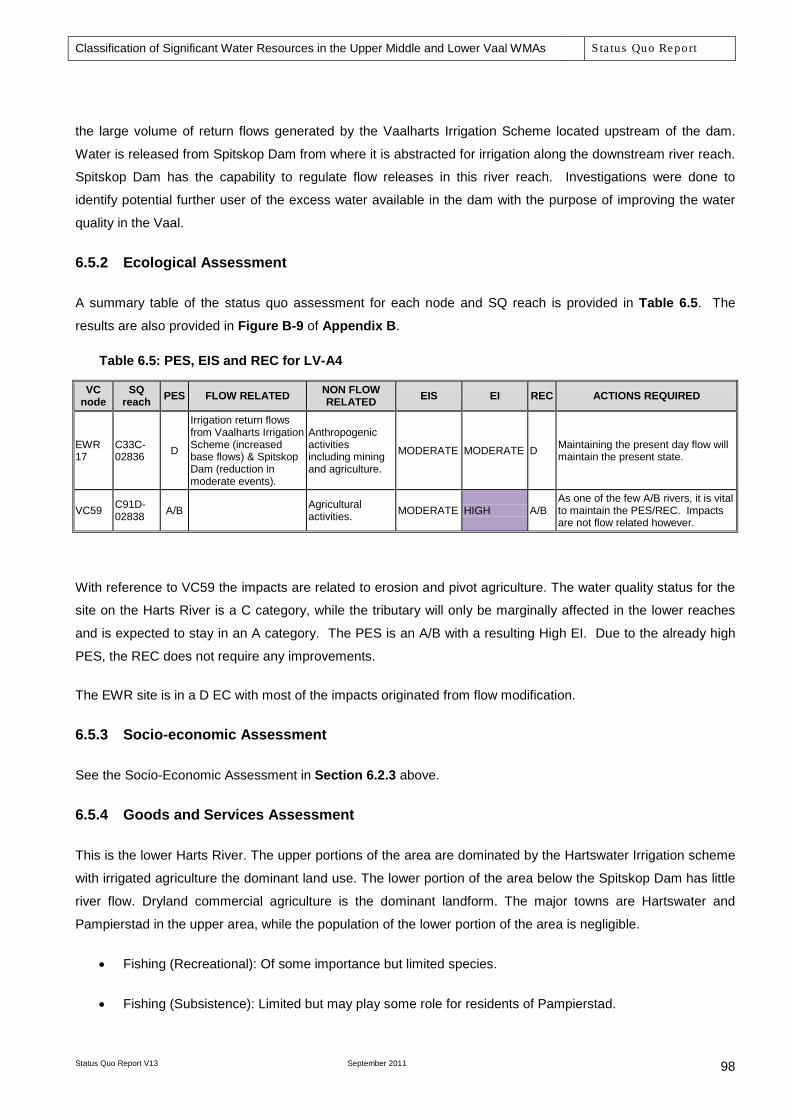
Classification of Significant Water Resources in the Upper Middle and Lower Vaal WMAs Sta tus Quo Report
Status Quo Report V13 September 2011
98
the large volume of return flows generated by the Vaalharts Irrigation Scheme located upstream of the dam.
Water is released from Spitskop Dam from where it is abstracted for irrigation along the downstream river reach.
Spitskop Dam has the capability to regulate flow releases in this river reach. Investigations were done to
identify potential further user of the excess water available in the dam with the purpose of improving the water
quality in the Vaal.
6.5.2 Ecological Assessment
A summary table of the status quo assessment for each node and SQ reach is provided in Table 6.5. The
results are also provided in Figure B-9 of Appendix B.
Table 6.5: PES, EIS and REC for LV-A4
VC node
SQ reach PES FLOW RELATED NON FLOW
RELATED EIS EI REC ACTIONS REQUIRED
EWR 17
C33C-02836 D
Irrigation return flows from Vaalharts Irrigation Scheme (increased base flows) & Spitskop Dam (reduction in moderate events).
Anthropogenic activities including mining and agriculture.
MODERATE MODERATE D Maintaining the present day flow will maintain the present state.
VC59 C91D-02838 A/B Agricultural
activities. MODERATE HIGH A/B As one of the few A/B rivers, it is vital to maintain the PES/REC. Impacts are not flow related however.
With reference to VC59 the impacts are related to erosion and pivot agriculture. The water quality status for the
site on the Harts River is a C category, while the tributary will only be marginally affected in the lower reaches
and is expected to stay in an A category. The PES is an A/B with a resulting High EI. Due to the already high
PES, the REC does not require any improvements.
The EWR site is in a D EC with most of the impacts originated from flow modification.
6.5.3 Socio-economic Assessment
See the Socio-Economic Assessment in Section 6.2.3 above.
6.5.4 Goods and Services Assessment
This is the lower Harts River. The upper portions of the area are dominated by the Hartswater Irrigation scheme
with irrigated agriculture the dominant land use. The lower portion of the area below the Spitskop Dam has little
river flow. Dryland commercial agriculture is the dominant landform. The major towns are Hartswater and
Pampierstad in the upper area, while the population of the lower portion of the area is negligible.
• Fishing (Recreational): Of some importance but limited species.
• Fishing (Subsistence): Limited but may play some role for residents of Pampierstad.
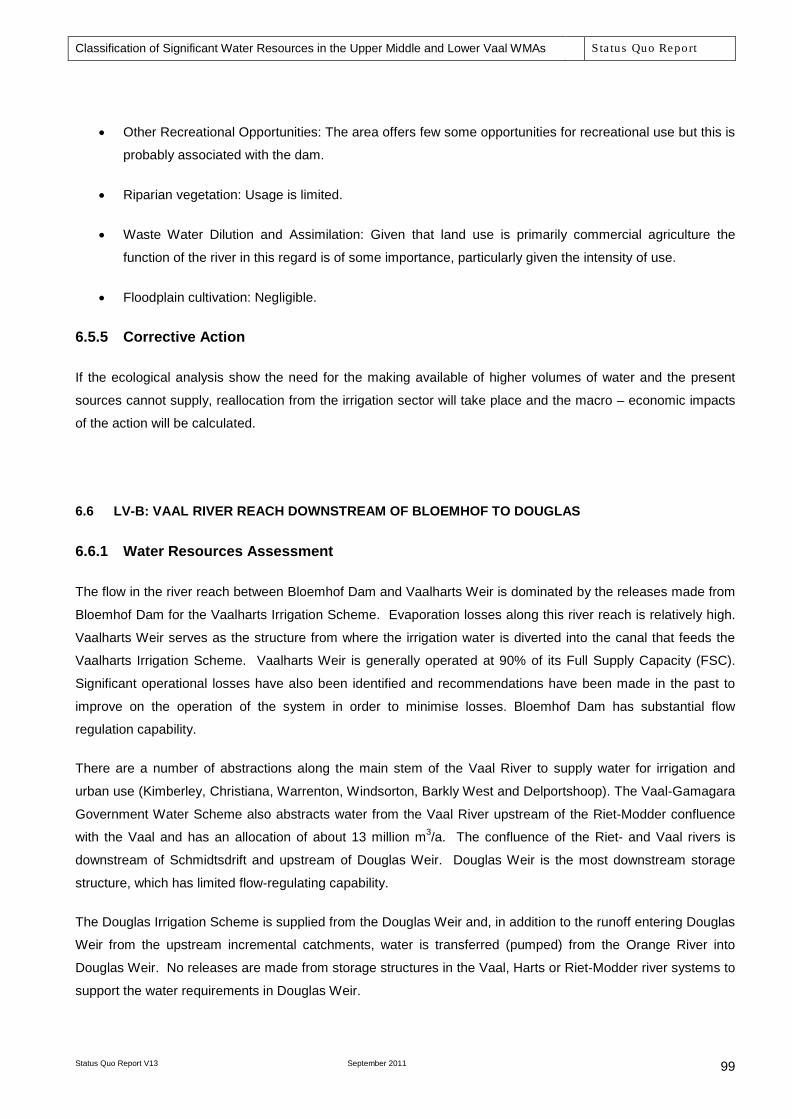
Classification of Significant Water Resources in the Upper Middle and Lower Vaal WMAs Sta tus Quo Report
Status Quo Report V13 September 2011
99
• Other Recreational Opportunities: The area offers few some opportunities for recreational use but this is
probably associated with the dam.
• Riparian vegetation: Usage is limited.
• Waste Water Dilution and Assimilation: Given that land use is primarily commercial agriculture the
function of the river in this regard is of some importance, particularly given the intensity of use.
• Floodplain cultivation: Negligible.
6.5.5 Corrective Action
If the ecological analysis show the need for the making available of higher volumes of water and the present
sources cannot supply, reallocation from the irrigation sector will take place and the macro – economic impacts
of the action will be calculated.
6.6 LV-B: VAAL RIVER REACH DOWNSTREAM OF BLOEMHOF TO DOUGLAS
6.6.1 Water Resources Assessment
The flow in the river reach between Bloemhof Dam and Vaalharts Weir is dominated by the releases made from
Bloemhof Dam for the Vaalharts Irrigation Scheme. Evaporation losses along this river reach is relatively high.
Vaalharts Weir serves as the structure from where the irrigation water is diverted into the canal that feeds the
Vaalharts Irrigation Scheme. Vaalharts Weir is generally operated at 90% of its Full Supply Capacity (FSC).
Significant operational losses have also been identified and recommendations have been made in the past to
improve on the operation of the system in order to minimise losses. Bloemhof Dam has substantial flow
regulation capability.
There are a number of abstractions along the main stem of the Vaal River to supply water for irrigation and
urban use (Kimberley, Christiana, Warrenton, Windsorton, Barkly West and Delportshoop). The Vaal-Gamagara
Government Water Scheme also abstracts water from the Vaal River upstream of the Riet-Modder confluence
with the Vaal and has an allocation of about 13 million m3/a. The confluence of the Riet- and Vaal rivers is
downstream of Schmidtsdrift and upstream of Douglas Weir. Douglas Weir is the most downstream storage
structure, which has limited flow-regulating capability.
The Douglas Irrigation Scheme is supplied from the Douglas Weir and, in addition to the runoff entering Douglas
Weir from the upstream incremental catchments, water is transferred (pumped) from the Orange River into
Douglas Weir. No releases are made from storage structures in the Vaal, Harts or Riet-Modder river systems to
support the water requirements in Douglas Weir.
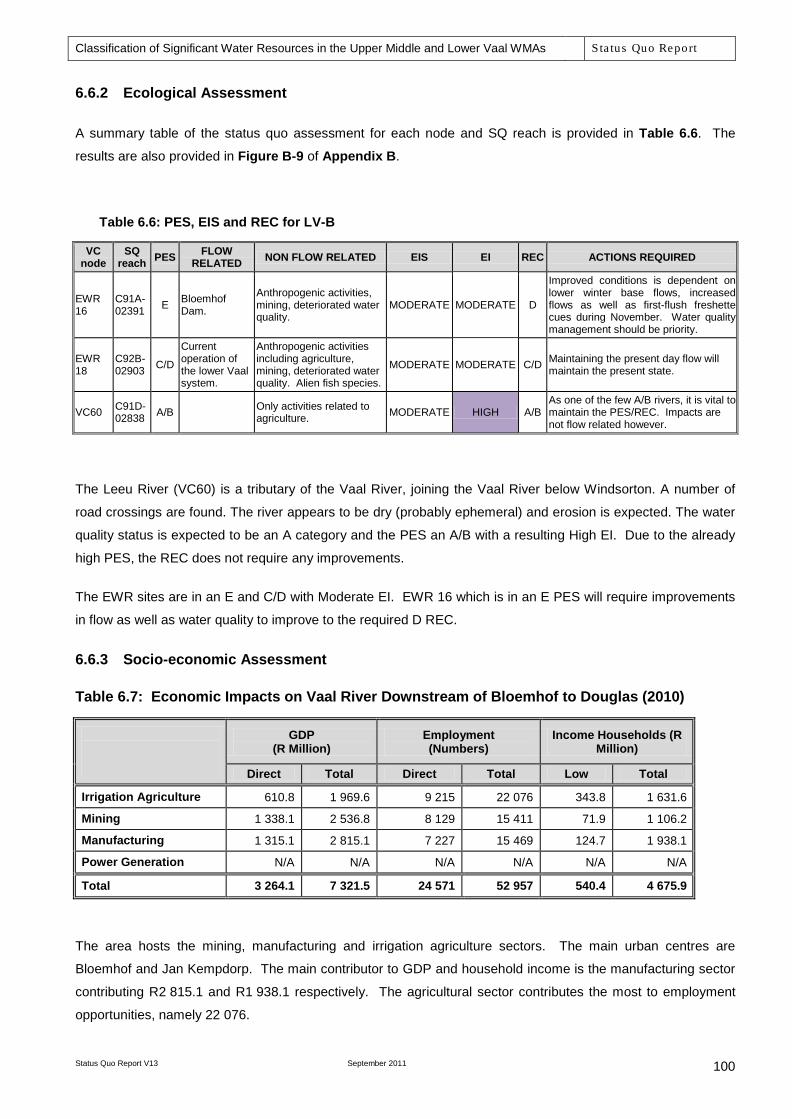
Classification of Significant Water Resources in the Upper Middle and Lower Vaal WMAs Sta tus Quo Report
Status Quo Report V13 September 2011
100
6.6.2 Ecological Assessment
A summary table of the status quo assessment for each node and SQ reach is provided in Table 6.6. The
results are also provided in Figure B-9 of Appendix B.
Table 6.6: PES, EIS and REC for LV-B
VC node
SQ reach PES FLOW
RELATED NON FLOW RELATED EIS EI REC ACTIONS REQUIRED
EWR 16
C91A-02391 E Bloemhof
Dam.
Anthropogenic activities, mining, deteriorated water quality.
MODERATE MODERATE D
Improved conditions is dependent on lower winter base flows, increased flows as well as first-flush freshette cues during November. Water quality management should be priority.
EWR 18
C92B-02903 C/D
Current operation of the lower Vaal system.
Anthropogenic activities including agriculture, mining, deteriorated water quality. Alien fish species.
MODERATE MODERATE C/D Maintaining the present day flow will maintain the present state.
VC60 C91D-02838 A/B Only activities related to
agriculture. MODERATE HIGH A/B As one of the few A/B rivers, it is vital to maintain the PES/REC. Impacts are not flow related however.
The Leeu River (VC60) is a tributary of the Vaal River, joining the Vaal River below Windsorton. A number of
road crossings are found. The river appears to be dry (probably ephemeral) and erosion is expected. The water
quality status is expected to be an A category and the PES an A/B with a resulting High EI. Due to the already
high PES, the REC does not require any improvements.
The EWR sites are in an E and C/D with Moderate EI. EWR 16 which is in an E PES will require improvements
in flow as well as water quality to improve to the required D REC.
6.6.3 Socio-economic Assessment
Table 6.7: Economic Impacts on Vaal River Downstream of Bloemhof to Douglas (2010)
GDP (R Million)
Employment (Numbers)
Income Households (R Million)
Direct Total Direct Total Low Total
Irrigation Agriculture 610.8 1 969.6 9 215 22 076 343.8 1 631.6
Mining 1 338.1 2 536.8 8 129 15 411 71.9 1 106.2
Manufacturing 1 315.1 2 815.1 7 227 15 469 124.7 1 938.1
Power Generation N/A N/A N/A N/A N/A N/A
Total 3 264.1 7 321.5 24 571 52 957 540.4 4 675.9
The area hosts the mining, manufacturing and irrigation agriculture sectors. The main urban centres are
Bloemhof and Jan Kempdorp. The main contributor to GDP and household income is the manufacturing sector
contributing R2 815.1 and R1 938.1 respectively. The agricultural sector contributes the most to employment
opportunities, namely 22 076.

Classification of Significant Water Resources in the Upper Middle and Lower Vaal WMAs Sta tus Quo Report
Status Quo Report V13 September 2011
101
6.6.4 Goods and Services Assessment
This is the Vaal River below the Bloemhof Dam. Settlements include Christiana, Warrenton, Windsorton, Barkly
West and Delportshoop. Settlement is sparse outside of these major settlements. Irrigation is important along
the banks of the river but outside of this zone the dominant landform is dryland commercial agriculture with very
sparse populations.
• Fishing (Recreational): Of some importance.
• Fishing (Subsistence): Limited but may play some role for residents of from the pooper parts of the
towns named above.
• Other Recreational Opportunities: The area offers few some opportunities for recreational use
associated with the river.
• Riparian vegetation: Usage is limited to the poorer communities. Vegetation cover is limited.
• Waste Water Dilution and Assimilation: Given that land use is primarily commercial agriculture the
function of the river in this regard is of some importance, particularly given the intensity of use.
• Floodplain cultivation: Negligible.
6.6.5 Corrective Action
If the proposed action involves corrective action, which could lead to the need for extra volumes of water, it will
be supplied by increased augmentation and the augmentation costs will be calculated.
6.7 LV-C: GROUNDWATER IN LICHTENBURG AREA
The Licthenburg compartment (as shown in Figure 6.1) consists of 10 sub-compartments covering an area of
698 km2 and is largely underlain by the chert poor Lytellton formation. It is separated from the Schoonspruit
compartment to the east by the Doornkop dyke and from the Grootpan compartment to the north by the
Blaauwbank dyke.
Recharge to the aquifer is about 37 million m3/a, which approximately equals the abstraction. Consequently
spring flow from the aquifer at Aaslaagte eye has dried up. Lichtenburg obtains water from boreholes, as do
Itsoseng, Sheila and Bodibe, as well as several cement plants. There is also extensive irrigation in the area,
which accounts for 28 million m3/a of the abstraction. The aquifer is highly stressed and forms part of the Bo-
Molopo Groundwater Control Area.
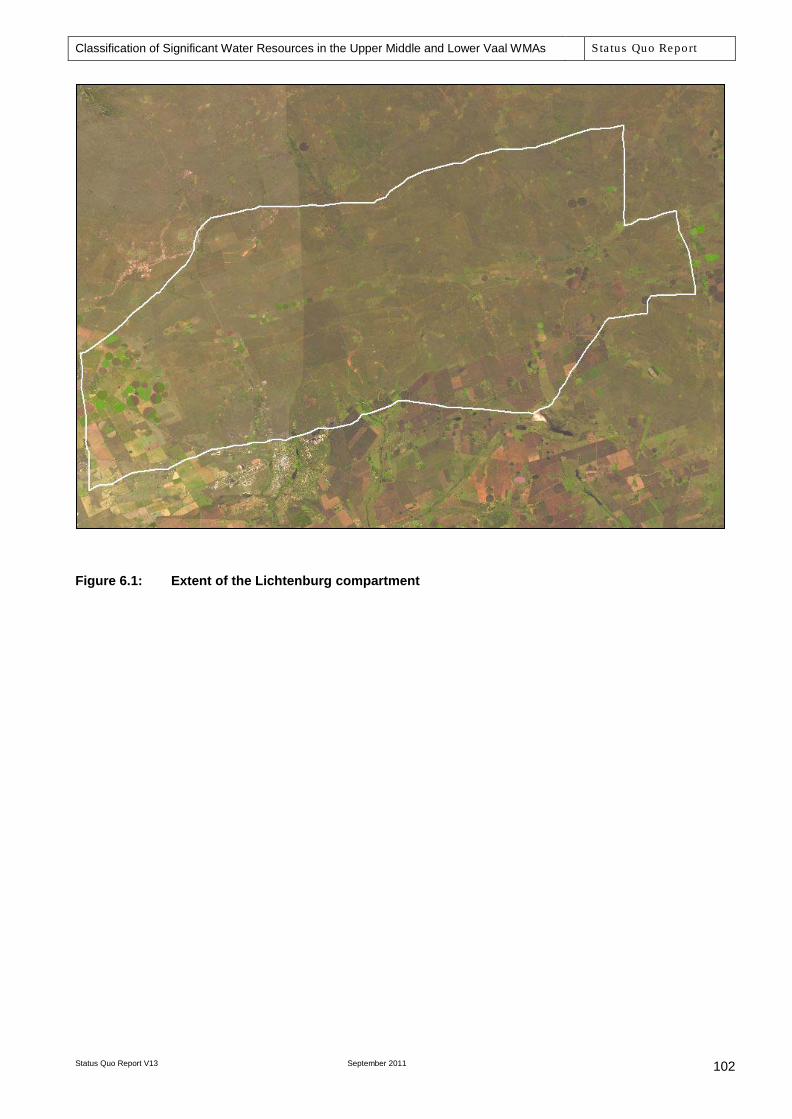
Classification of Significant Water Resources in the Upper Middle and Lower Vaal WMAs Sta tus Quo Report
Status Quo Report V13 September 2011
102
Figure 6.1: Extent of the Lichtenburg compartment

Classification of Significant Water Resources in the Upper Middle and Lower Vaal WMAs Sta tus Quo Report
Status Quo Report V13 September 2011
103
7 SUMMARY AND CONCLUSIONS
7.1 STATUS OF WATER RESOURCES
In terms of the current water resources situation the following should be noted:
• The Vaal River is one of the largest rivers and definitely the most utilised in the country.
• The size of the catchment and the complexity of the operating rules governing the major water
resources of the system, contribute to the uniqueness of the Vaal River System.
• Some of the tributary catchments (Vals, Allemanskraal and Erfenis) are in deficit and implementation of
the Reserve will negatively impact on the assurance of supply to existing water users.
• Information on the reconciliation strategies of small towns presented in Table G-2 of Appendix G
shows that about sixteen of these towns are either currently in deficit or will be experiencing shortfalls in
their water supply within the near future.
7.2 ECOLOGICAL STATUS
Two of the major impacts dominating the Vaal Catchment are water quality impacts and changes in the flow
regime. Changes in the flow regime range from too little flow but the most severe impacts are from too much
flow and changes in seasonality which mainly relate to transfers, releases, irrigation return flows, mining and
urban runoff.
Areas of highest water quality impact across the Vaal River catchments are as follows:
• Rietspruit (C1 Riet-Amers): The quality is a D category, largely due to extensive agricultural activities
with highly elevated nutrients and salts.
• The condition of the lower Klip River (north-west flowing Klip River) catchment is poor, with sites ranging
from a D to a D/E category. The main land use is still agriculture, although there are discharges around
certain urban areas (e.g. Vrede) which reduce the water quality category.
• Rietspruit and Klip rivers (Gauteng) - Note that the water quality state of this portion of the Upper Vaal
catchment is severely impacted and improvements in present state cannot occur without addressing
water quality related problems, e.g. through implementation of the Integrated Water Quality
Management Plan set up for the Vaal (DWAF, 2008d).
• Lower Suikerbosrand and Blesbokspruit – The quality of the Suikerbosrand River is driven by the poor
quality of the Blesbokspruit River. Impacts include mine water decants, diffuse runoff, urban runoff and
point source discharges.
• Waterval catchment - Land use in the upper part of the catchment includes agricultural activities; Sasol
petrochemical industry; Secunda town; coal mining in the Bethal to Secunda area (C11 and C12 tertiary
catchments); and gold mining in the upper Waterval catchment. Impacts include elevated salts and
nutrients, particularly phosphate. Some irrigation takes place in the lower part of the catchment, with
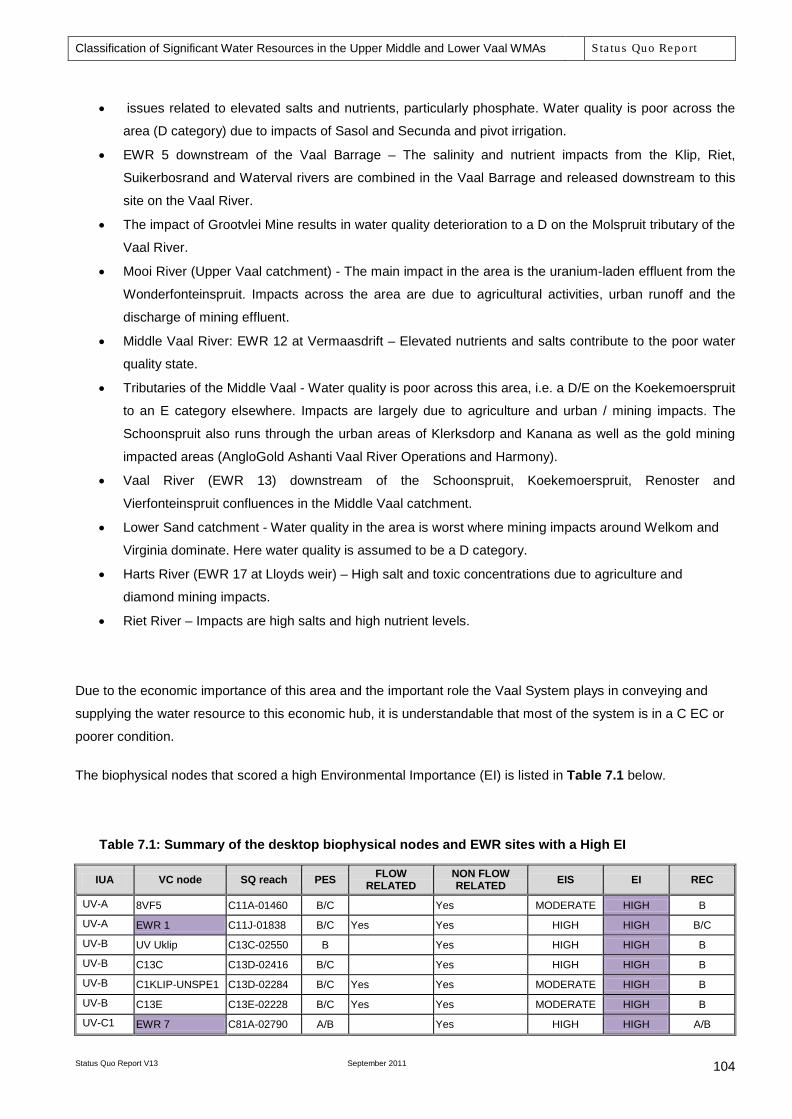
Classification of Significant Water Resources in the Upper Middle and Lower Vaal WMAs Sta tus Quo Report
Status Quo Report V13 September 2011
104
• issues related to elevated salts and nutrients, particularly phosphate. Water quality is poor across the
area (D category) due to impacts of Sasol and Secunda and pivot irrigation.
• EWR 5 downstream of the Vaal Barrage – The salinity and nutrient impacts from the Klip, Riet,
Suikerbosrand and Waterval rivers are combined in the Vaal Barrage and released downstream to this
site on the Vaal River.
• The impact of Grootvlei Mine results in water quality deterioration to a D on the Molspruit tributary of the
Vaal River.
• Mooi River (Upper Vaal catchment) - The main impact in the area is the uranium-laden effluent from the
Wonderfonteinspruit. Impacts across the area are due to agricultural activities, urban runoff and the
discharge of mining effluent.
• Middle Vaal River: EWR 12 at Vermaasdrift – Elevated nutrients and salts contribute to the poor water
quality state.
• Tributaries of the Middle Vaal - Water quality is poor across this area, i.e. a D/E on the Koekemoerspruit
to an E category elsewhere. Impacts are largely due to agriculture and urban / mining impacts. The
Schoonspruit also runs through the urban areas of Klerksdorp and Kanana as well as the gold mining
impacted areas (AngloGold Ashanti Vaal River Operations and Harmony).
• Vaal River (EWR 13) downstream of the Schoonspruit, Koekemoerspruit, Renoster and
Vierfonteinspruit confluences in the Middle Vaal catchment.
• Lower Sand catchment - Water quality in the area is worst where mining impacts around Welkom and
Virginia dominate. Here water quality is assumed to be a D category.
• Harts River (EWR 17 at Lloyds weir) – High salt and toxic concentrations due to agriculture and
diamond mining impacts.
• Riet River – Impacts are high salts and high nutrient levels.
Due to the economic importance of this area and the important role the Vaal System plays in conveying and
supplying the water resource to this economic hub, it is understandable that most of the system is in a C EC or
poorer condition.
The biophysical nodes that scored a high Environmental Importance (EI) is listed in Table 7.1 below.
Table 7.1: Summary of the desktop biophysical nodes and EWR sites with a High EI
IUA VC node SQ reach PES FLOW RELATED
NON FLOW RELATED EIS EI REC
UV-A 8VF5 C11A-01460 B/C Yes MODERATE HIGH B
UV-A EWR 1 C11J-01838 B/C Yes Yes HIGH HIGH B/C
UV-B UV Uklip C13C-02550 B Yes HIGH HIGH B
UV-B C13C C13D-02416 B/C Yes HIGH HIGH B
UV-B C1KLIP-UNSPE1 C13D-02284 B/C Yes Yes MODERATE HIGH B
UV-B C13E C13E-02228 B/C Yes Yes MODERATE HIGH B
UV-C1 EWR 7 C81A-02790 A/B Yes HIGH HIGH A/B
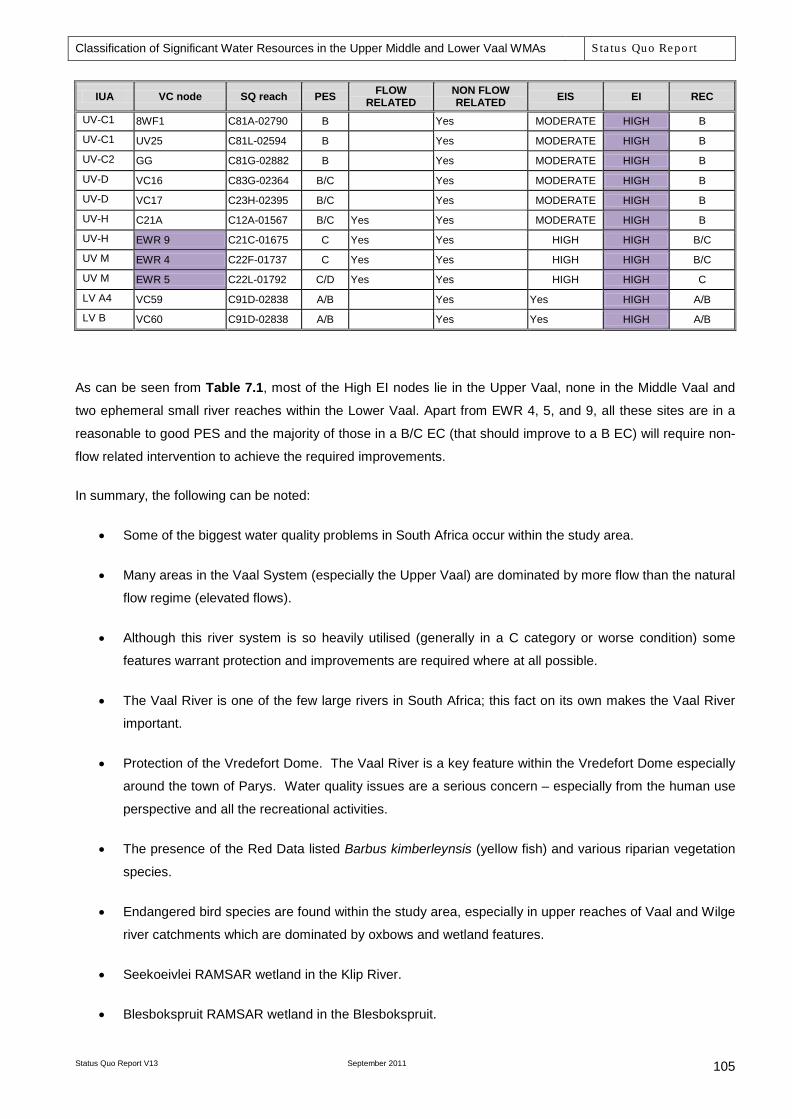
Classification of Significant Water Resources in the Upper Middle and Lower Vaal WMAs Sta tus Quo Report
Status Quo Report V13 September 2011
105
IUA VC node SQ reach PES FLOW RELATED
NON FLOW RELATED EIS EI REC
UV-C1 8WF1 C81A-02790 B Yes MODERATE HIGH B
UV-C1 UV25 C81L-02594 B Yes MODERATE HIGH B
UV-C2 GG C81G-02882 B Yes MODERATE HIGH B
UV-D VC16 C83G-02364 B/C Yes MODERATE HIGH B
UV-D VC17 C23H-02395 B/C Yes MODERATE HIGH B
UV-H C21A C12A-01567 B/C Yes Yes MODERATE HIGH B
UV-H EWR 9 C21C-01675 C Yes Yes HIGH HIGH B/C
UV M EWR 4 C22F-01737 C Yes Yes HIGH HIGH B/C
UV M EWR 5 C22L-01792 C/D Yes Yes HIGH HIGH C
LV A4 VC59 C91D-02838 A/B Yes Yes HIGH A/B
LV B VC60 C91D-02838 A/B Yes Yes HIGH A/B
As can be seen from Table 7.1, most of the High EI nodes lie in the Upper Vaal, none in the Middle Vaal and
two ephemeral small river reaches within the Lower Vaal. Apart from EWR 4, 5, and 9, all these sites are in a
reasonable to good PES and the majority of those in a B/C EC (that should improve to a B EC) will require non-
flow related intervention to achieve the required improvements.
In summary, the following can be noted:
• Some of the biggest water quality problems in South Africa occur within the study area.
• Many areas in the Vaal System (especially the Upper Vaal) are dominated by more flow than the natural
flow regime (elevated flows).
• Although this river system is so heavily utilised (generally in a C category or worse condition) some
features warrant protection and improvements are required where at all possible.
• The Vaal River is one of the few large rivers in South Africa; this fact on its own makes the Vaal River
important.
• Protection of the Vredefort Dome. The Vaal River is a key feature within the Vredefort Dome especially
around the town of Parys. Water quality issues are a serious concern – especially from the human use
perspective and all the recreational activities.
• The presence of the Red Data listed Barbus kimberleynsis (yellow fish) and various riparian vegetation
species.
• Endangered bird species are found within the study area, especially in upper reaches of Vaal and Wilge
river catchments which are dominated by oxbows and wetland features.
• Seekoeivlei RAMSAR wetland in the Klip River.
• Blesbokspruit RAMSAR wetland in the Blesbokspruit.
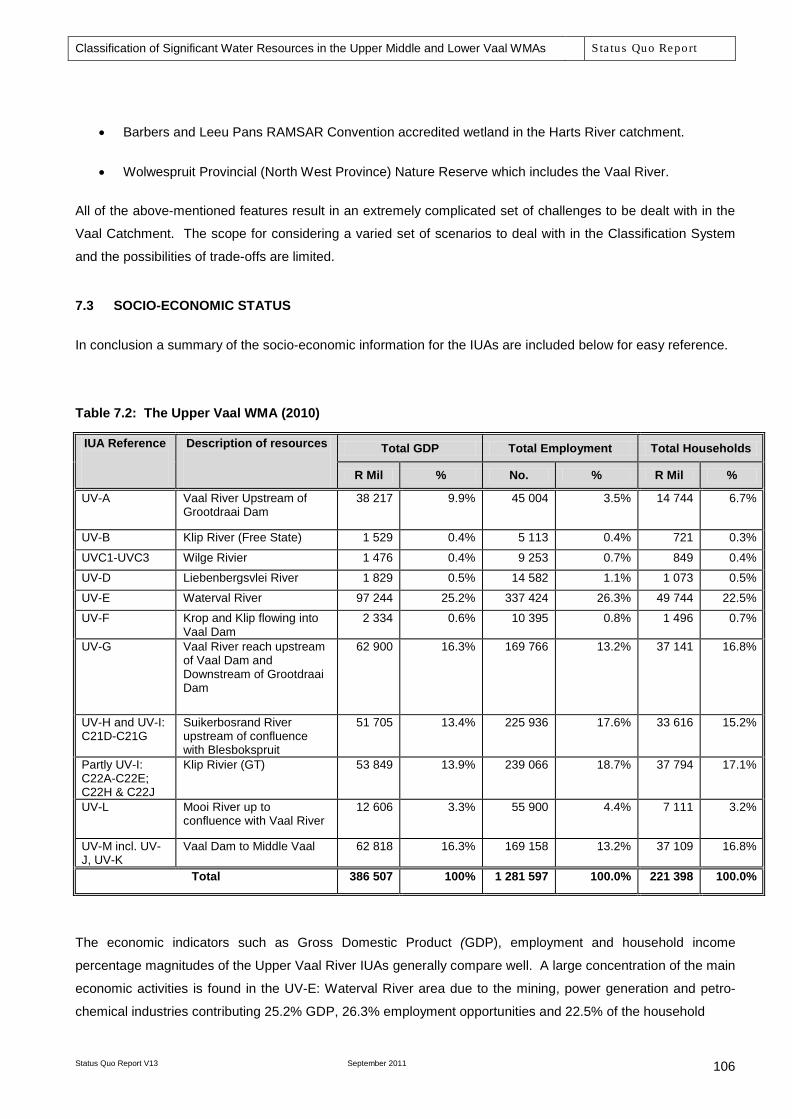
Classification of Significant Water Resources in the Upper Middle and Lower Vaal WMAs Sta tus Quo Report
Status Quo Report V13 September 2011
106
• Barbers and Leeu Pans RAMSAR Convention accredited wetland in the Harts River catchment.
• Wolwespruit Provincial (North West Province) Nature Reserve which includes the Vaal River.
All of the above-mentioned features result in an extremely complicated set of challenges to be dealt with in the
Vaal Catchment. The scope for considering a varied set of scenarios to deal with in the Classification System
and the possibilities of trade-offs are limited.
7.3 SOCIO-ECONOMIC STATUS
In conclusion a summary of the socio-economic information for the IUAs are included below for easy reference.
Table 7.2: The Upper Vaal WMA (2010)
IUA Reference
Description of resources
Total GDP Total Employment Total Households
R Mil % No. % R Mil %
UV-A Vaal River Upstream of Grootdraai Dam
38 217 9.9% 45 004 3.5% 14 744 6.7%
UV-B Klip River (Free State) 1 529 0.4% 5 113 0.4% 721 0.3%
UVC1-UVC3 Wilge Rivier 1 476 0.4% 9 253 0.7% 849 0.4%
UV-D Liebenbergsvlei River 1 829 0.5% 14 582 1.1% 1 073 0.5%
UV-E Waterval River 97 244 25.2% 337 424 26.3% 49 744 22.5%
UV-F Krop and Klip flowing into Vaal Dam
2 334 0.6% 10 395 0.8% 1 496 0.7%
UV-G Vaal River reach upstream of Vaal Dam and Downstream of Grootdraai Dam
62 900 16.3% 169 766 13.2% 37 141 16.8%
UV-H and UV-I: C21D-C21G
Suikerbosrand River upstream of confluence with Blesbokspruit
51 705 13.4% 225 936 17.6% 33 616 15.2%
Partly UV-I: C22A-C22E; C22H & C22J
Klip Rivier (GT) 53 849 13.9% 239 066 18.7% 37 794 17.1%
UV-L Mooi River up to confluence with Vaal River
12 606 3.3% 55 900 4.4% 7 111 3.2%
UV-M incl. UV-J, UV-K
Vaal Dam to Middle Vaal 62 818 16.3% 169 158 13.2% 37 109 16.8%
Total 386 507 100% 1 281 597 100.0% 221 398 100.0%
The economic indicators such as Gross Domestic Product (GDP), employment and household income
percentage magnitudes of the Upper Vaal River IUAs generally compare well. A large concentration of the main
economic activities is found in the UV-E: Waterval River area due to the mining, power generation and petro-
chemical industries contributing 25.2% GDP, 26.3% employment opportunities and 22.5% of the household
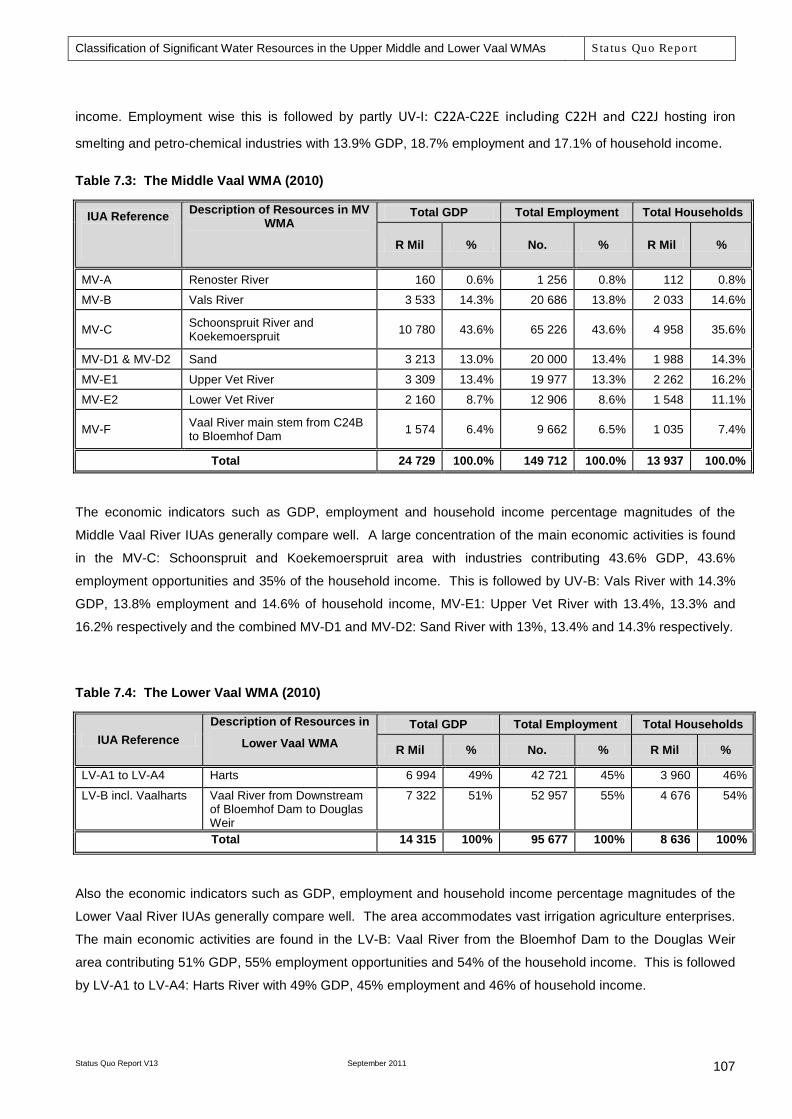
Classification of Significant Water Resources in the Upper Middle and Lower Vaal WMAs Sta tus Quo Report
Status Quo Report V13 September 2011
107
income. Employment wise this is followed by partly UV-I: C22A-C22E including C22H and C22J hosting iron
smelting and petro-chemical industries with 13.9% GDP, 18.7% employment and 17.1% of household income.
Table 7.3: The Middle Vaal WMA (2010)
IUA Reference
Description of Resources in MV WMA
Total GDP Total Employment Total Households
R Mil % No. % R Mil %
MV-A Renoster River 160 0.6% 1 256 0.8% 112 0.8%
MV-B Vals River 3 533 14.3% 20 686 13.8% 2 033 14.6%
MV-C Schoonspruit River and Koekemoerspruit 10 780 43.6% 65 226 43.6% 4 958 35.6%
MV-D1 & MV-D2 Sand 3 213 13.0% 20 000 13.4% 1 988 14.3%
MV-E1 Upper Vet River 3 309 13.4% 19 977 13.3% 2 262 16.2%
MV-E2 Lower Vet River 2 160 8.7% 12 906 8.6% 1 548 11.1%
MV-F Vaal River main stem from C24B to Bloemhof Dam 1 574 6.4% 9 662 6.5% 1 035 7.4%
Total 24 729 100.0% 149 712 100.0% 13 937 100.0%
The economic indicators such as GDP, employment and household income percentage magnitudes of the
Middle Vaal River IUAs generally compare well. A large concentration of the main economic activities is found
in the MV-C: Schoonspruit and Koekemoerspruit area with industries contributing 43.6% GDP, 43.6%
employment opportunities and 35% of the household income. This is followed by UV-B: Vals River with 14.3%
GDP, 13.8% employment and 14.6% of household income, MV-E1: Upper Vet River with 13.4%, 13.3% and
16.2% respectively and the combined MV-D1 and MV-D2: Sand River with 13%, 13.4% and 14.3% respectively.
Table 7.4: The Lower Vaal WMA (2010)
IUA Reference Description of Resources in
Lower Vaal WMA Total GDP Total Employment Total Households
R Mil % No. % R Mil %
LV-A1 to LV-A4 Harts 6 994 49% 42 721 45% 3 960 46%
LV-B incl. Vaalharts Vaal River from Downstream of Bloemhof Dam to Douglas Weir
7 322 51% 52 957 55% 4 676 54%
Total 14 315 100% 95 677 100% 8 636 100%
Also the economic indicators such as GDP, employment and household income percentage magnitudes of the
Lower Vaal River IUAs generally compare well. The area accommodates vast irrigation agriculture enterprises.
The main economic activities are found in the LV-B: Vaal River from the Bloemhof Dam to the Douglas Weir
area contributing 51% GDP, 55% employment opportunities and 54% of the household income. This is followed
by LV-A1 to LV-A4: Harts River with 49% GDP, 45% employment and 46% of household income.

Classification of Significant Water Resources in the Upper Middle and Lower Vaal WMAs Sta tus Quo Report
Status Quo Report V13 September 2011
108
7.4 STATUS OF GOODS AND SERVICES
While the Vaal System is important in terms of its extent, this is tempered by the nature of settlement in the
area. In terms of utilisation and dependence on Goods and Services, the area is home to few communities for
whom these resources would be important. The urbanised nature of the catchment and the fact that the bulk of
the residents live in settings where livelihoods are linked to economic modes of production that are not linked to
direct resource dependence is evident. Outside of the urban centres, the areas are dominated by relatively low
population densities and given over to commercial farming enterprises (typically the upper parts of the
catchment) as well as portions of the middle and lower catchments. These areas also tend to score relatively
low in terms of dependence on Goods and Services.
As indicated, the nature of the Vaal River system and the typology of communities in the area mean that direct
dependence on Goods and Services for livelihoods is restricted. There are however some forms of utilisation of
goods and services that are important. These are:
• Recreational fishing (specifically fly fishing targeting yellow fish);
• Subsistence fishing;
• Other recreational aspects associated with the rivers such as white water rafting, house boats,
swimming;
• Riparian vegetation usage;
• Waste water dilutions; and
• Floodplain agricultural usage of subsistence purposes.
Of these it is probably the recreational aspects associated with the river system and in particular fishing that is
most important. Particular areas of importance include most of the Vaal river main stem and in particular areas
around the Vredefort Dome. There are scattered areas in which the utilisation of riparian and other associated
livelihood resources may be of some restricted importance, particularly to farm workers. However, these are
highly unlikely to react to implementation of possible management and operational scenarios.
Another recreational activity that is important is bird watching which is associated with the various RAMSAR
convention wetlands in the study area. These are Seekoeivlei, Barbers Pan, Leeu Pan and the Blesbokspruit
wetland.
Classification of Significant Water Resources in the Upper Middle and Lower Vaal WMAs Sta tus Quo Report
Status Quo Report V13 September 2011
109
8 REFERENCES
Brand et.al., 2009 Brand, M., Maina, J., Mander, M and O’Brien, G. 2009. Characterisation of the social and economic value of the use and associated conservation of the yellowfishes in the Vaal River.
[Web access]: http://www.fosaf.co.za/documents/Yellowfish%20socio-
economic%20study%20FINAL.pdf
CBD, 1992 The Convention on Biological Diversity (CBD) is an international agreement adopted at the Earth Summit, in Rio de Janeiro, in 1992. It has three main objectives:
• to conserve biological diversity • to use its components in a sustainable way • to share fairly and equitably the benefits arising from the use of genetic
resources. (http://www.biodiv.be/convention)
CSIR, 2010 National Freshwater Ecosystems Priority Areas (NFEPA). Funded by XYZ.
CSIR
De Villiers, P, 2007 De Villiers, P. 2007. Orange-Vaal largemouth yellowfish. In: The state of yellowfishes in South Africa, Wolhuter, L. and D. Impson (Eds.). Report to the
Water Research Commission by the Yellowfish Working Group. WRC Report TT
302/07.
DWAF, 1999 Department of Water Affairs and Forestry, South Africa. Vaal River System Analysis Update: Integrated Vaal River System Analysis. DWAF Report No.
PC000/00/18496. Study carried out by BKS (Pty) Ltd, Stewart Scott Inc and
Ninham Shand (Pty) LTD for the Department of Water Affairs and Forestry.
DWAF, 2005a Department of Water Affairs and Forestry, South Africa. Development of a Water Quality Management Plan for the Waterval River Catchment: Upper Vaal Water Management Area: Ecological Reserve Determination for the
Waterval River Catchment - Water Quantity Component. Study carried out by
BKS (Pty) Ltd for the Department of Water Affairs and Forestry, 2005.
DWAF, 2006 Department of Water Affairs and Forestry, South Africa, 2006. Vaal River Continuous Investigations (Phase 3): Schoonspruit Sub-system Analysis Study. Report Number P RSA C000/00/--. Compiled by HG Maré (WRP
Consulting Engineers (Pty) Ltd).
DWAF, 2007 Department: Water Affairs and Forestry. Chief Directorate: Resource Directed
Measures. Development of the Water Resource Classification System
Classification of Significant Water Resources in the Upper Middle and Lower Vaal WMAs Sta tus Quo Report
Status Quo Report V13 September 2011
110
(WRCS) Volume 1 Overview and 7-step classification procedure. October
2006
DWAF, 2008a Department of Water Affairs, South Africa. Vaal River System: Large Bulk Water Supply Reconciliation Strategy: Second Stage Reconciliation Strategy. Study carried out by DMM Development Consultants, Golder
Associates Africa, SRK, WRP Consulting Engineers and Zitholele Consulting on
behalf of the Directorate: National Water Resource Planning, 2008
DWAF, 2008b Department of Water Affairs and Forestry, South Africa. Reports of the
Integrated Water Quality Management Plan. Study executed by Zitholele
Consulting, Golder Associates, DMM & WRP consultants on behalf of the
Directorate: National Water Resource Planning, 2008.
DWAF, 2008c Department of Water Affairs and Forestry, South Africa. Crocodile (West) River Reconciliation Strategy Version 1. Study executed by BKS (Pty) Ltd. on behalf
of the Directorate: National Water Resource Planning, 2008.
DWAF, 2008d Integrated Water Quality Management Plan for the Vaal River System: Evaluation of Water Quality Management Scenarios. Report Number P RSA
C000/00/2305/5. Prepared by the Consultants: Zitholele Consulting, Golder
Associates Africa, WRP Consulting Engineers (Pty) Ltd and DMM Development
Consultants cc for the Department of Water Affairs and Forestry, South Africa,
2008.
DWAF, 2008e Resource Directed Measures: Comprehensive Reserve determination study of the Integrated Vaal River System. Upper Vaal Water Management Area Technical Component: Resource Unit. Report produced by Koekemoer
Aquatic Services and Water for Africa. Authored by Louw, D. Report no:
RDM/WMA8 C000/01/CON/0208.
DWAF, 2008f Resource Directed Measures: Comprehensive Reserve determination study of the Integrated Vaal River System. Upper Vaal Water Management Area Technical Component: Desktop EcoClassification report. Report produced
by Koekemoer Aquatic Services and Water for Africa. Authored by Louw, D.
Report no: RDM/WMA8C000/01/CON/0207.
DWAF, 2008g Vaal River WRDP: Comparative Study Between LHWP Phase II and Thukela Water Project. Water Resource Analysis Report. Report Number P RSA
000/00/12009/2. Prepared by the Consultants: WRP Consulting Engineers (Pty)
Ltd, Golder Associates, DMM Development Consultants cc, BKS and ACER
(Africa) for the Department of Water Affairs and Forestry, South Africa, 2009.

Classification of Significant Water Resources in the Upper Middle and Lower Vaal WMAs Sta tus Quo Report
Status Quo Report V13 September 2011
111
DWAF, 2009a Resource Directed Measures: Comprehensive Reserve determination study of the Integrated Vaal River System. Middle Vaal Water Management Area Technical Component: Resource Unit Report. Report no: RDM/WMA9
C000/01/CON/0407. Pretoria, South Africa.
DWAF, 2009b Resource Directed Measures: Comprehensive Reserve determination study of the Integrated Vaal River System. Lower Vaal Water Management Area – Vaal River Catchment Technical Component: Resource Unit Report. Report
no: RDM/WMA10 C000/01/CON/0407. Pretoria, South Africa.
DWAF, 2009c Resource Directed Measures: Comprehensive Reserve determination study of the Integrated Vaal River System. Middle Vaal Water Management Area Technical Component: Desktop EcoClassification Report. Report no: RDM/
WMA9 C000/01/CON/0207. Pretoria, South Africa.
DWAF, 2009d Resource Directed Measures: Comprehensive Reserve determination study of the Integrated Vaal River System. Lower Vaal Water Management Area Technical Component: Desktop EcoClassification Report. Report no: RDM/
WMA10 C000/01/CON/0207. Pretoria, South Africa.
DWAF, 2009e Integrated Water Quality Management Plan for the Vaal River System: Task 2: Water Quality Status Assessment of the Vaal River System. Department of
Water Affairs and Forestry, (2009). Directorate National Water Resource
Planning. Report No. P RSA C000/00/2305/1, South Africa.
DWA, 2010a Resource Directed Measures: Comprehensive Reserve determination study of the Integrated Vaal River System. Upper Vaal Water Management Area Technical Component: EcoClassification Report: Volume 1. Report
produced by Koekemoer Aquatic Services and Rivers for Africa. Edited by Louw,
D and Koekemoer, S. Report no: RDM/ WMA8 C000/01/CON/0109.
DWA, 2010b Resource Directed Measures: Comprehensive Reserve determination study for the integrated Vaal River system, Middle Vaal Water Management Area, Ecoclassification report. Report no: RDM/ WMA09C000/ 01/CON/ 0110.
Pretoria, South Africa.
DWA, 2010c Resource Directed Measures: Comprehensive Reserve determination study for the integrated Vaal River System: Lower Vaal Water Management Area, Ecoclassification. Report no: RDM/ WMA10C000/ 01/CON/ 0110. Pretoria,
South Africa.
DWA, 2010d Department of Water Affairs (DWA), 2010. Resource Directed Measures:
Comprehensive Reserve determination study of the Integrated Vaal River System. Water Resource Modelling Report. Report produced by DMM
Classification of Significant Water Resources in the Upper Middle and Lower Vaal WMAs Sta tus Quo Report
Status Quo Report V13 September 2011
112
Development Consultants/Hydrosol/WRP Consulting Engineers. Report no:
RDM/ C000/01/CON/0607
DWA, 2010e Department: Water Affairs, South Africa, 2010. Investigation of Bottlenecks on the Usutu GWS and Usutu Vaal Phase II GWS: Water Requirements and System Analysis Report Prepared by KV3 Engineers in Association with WRP
Consulting Engineers, Aurecon, DMM Development Consultants, Golder
Associates Africa and Kayamandi Development Services. (Draft Reports).
DWA, 2010f Department of Water Affairs (DWAF), 2010. Resource Directed Measures: Comprehensive Reserve determination study of the Integrated Vaal River System. Upper Vaal Water Management Area Technical Component: Estimation Report. Report produced by Koekemoer Aquatic Services and
Rivers for Africa. Authored by Louw, D and Birkhead, AL. Report no:
RDM/WMA8C000/01/CON/0510.
DWA, 2011 Development of Reconciliation Strategies for All Towns in the Central Region. DWA set of reports compiled for individual towns.
Hughes and Forsythe,
2006
Hughes DA and Forsythe DA (2006): A generic database and spatial interface for the application of hydrological and water resource models. Computers
and Geosciences 32, 1389-1402.
Kleynhans, C.J., 2000 Desktop estimates of the ecological importance and sensitivity categories (EISC), default ecological management classes (DEMC), present ecological status categories (PESC), present attainable ecological management classes (present AEMC), and best attainable ecological management class (best AEMC) for quaternary catchments in South Africa. DWAF report.
Institute for Water Quality Studies.
Kleynhans C.J and
Louw, M.D., 2007
Module A: EcoClassification and EcoStatus determination in River EcoClassification: Manual for EcoStatus Determination (version 2). Joint
Water Research Commission and Department of Water Affairs and Forestry
report. WRC Report No. TT329-08.
Louw et.al., 2006 Louw, D., Kleynhans, C., Thirion, C., Todd, C., Birkhead, A. and Hughes, D.
2006: The development of a decision support system (DSS) to address the issue of extrapolating ecological reserve (flow) information to other river locations. Draft report, WRC research project K8-657, Pretoria, South Africa.
Other references can be provided on request.
Louw, MD and Huggins,
G., 2007
Desktop Assessment of the Importance and Ecological State of the Maputo River Quaternary catchments. Produced by Water for Africa as part of the

Classification of Significant Water Resources in the Upper Middle and Lower Vaal WMAs Sta tus Quo Report
Status Quo Report V13 September 2011
113
Joint Maputo River Basin Water Resources Study – Moçambique, Swaziland and
South Africa.
Mander et al., 2007 Mander M, Ntuli L, Diedericks N, Mavundla K (2007). South Africa’s traditional medicines industry. Department of Trade and Industry, South Africa.
Perrings, 2006 Perrings, C. A. 2006. Resilience and sustainable development. Environment and Development Economics 11:417-427.
Scherman, 2010 Scherman, P-A (2010). Orange River EFR study: Water quality. Appendix
prepared for Rivers for Africa EFR study for ORASECOM.
WRC, 1990 Surface Water Resources of South Africa 1990: User’s Manual. WRC Report
No. 298/1/94. Study undertaken by the Water Research Commission (WRC) and
the Water Resources 1990 Joint Venture.
Status Quo Report V13_1.docx September 2011
Appendix A:
Map of Water Management Areas
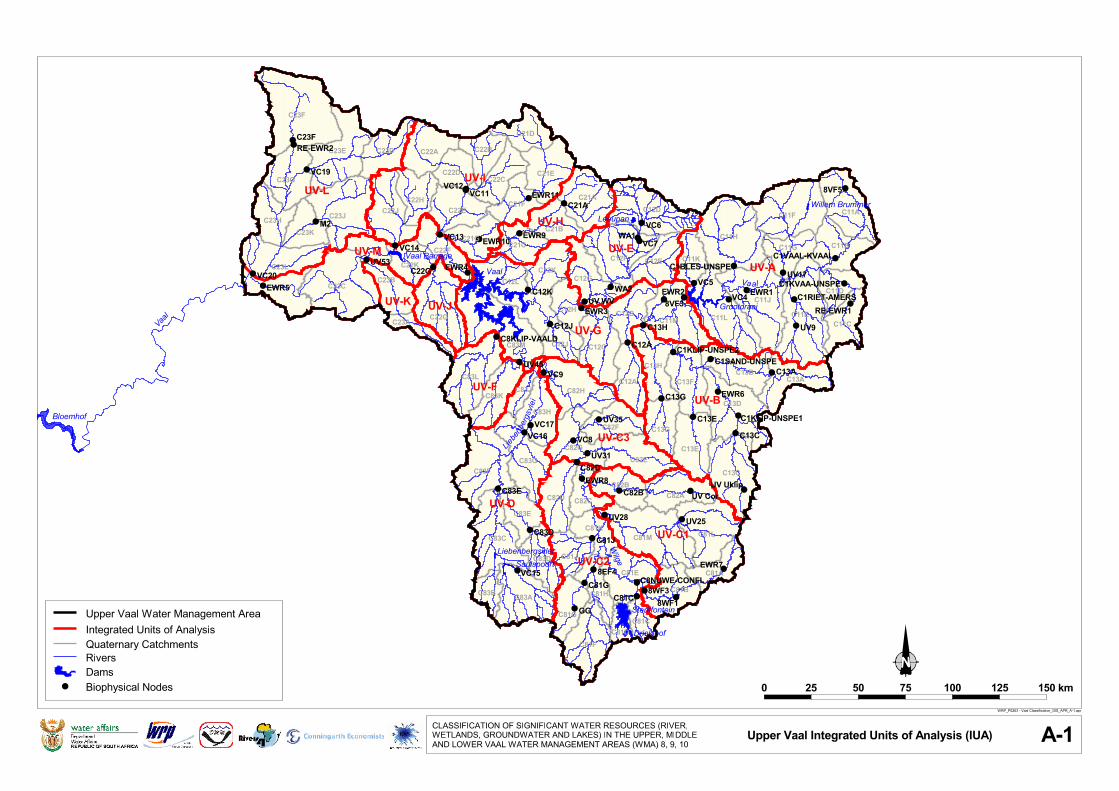
#
#
#
##
##
##
#
#
#
##
#
#
#
#
##
##
##
##
#
#
##
##
#
#
#
#
#
#
##
###
##
#
#
#
#
#
#
###
##
##
#
#
#
##
##
##
#
#
##
#
#
#
#
C23F
C21D
C23E C23D C22A C22B
C21EC22CC23G
C22D
C11AC21A
C11FC21FC22H
C22J C12DC23J C22E
C11H
C23HC21B
C11BC23K
C21G
C12FC22F C11GC21C
C11KC12E
C12GC23BC12KC23L C22K
C11EC11J
C23C C11DC12L
C11LC22GC11CC11M
C12BC12H
C83M C12C
C23A
C12J
C13HC83L C13F
C13BC12A C13A
C83J C82HC83KC13D
C83H
C13GC82F
C13EC82GC83G
C13CC83FC82E
C82D C82C
C82BC82A
C83E
C81LC83C C81MC81K
C83DC81A
C81J
C81E
C81H C81BC83AC83B
C81GC81C
C81FC81D
8VF5
C1VAAL-KVAAL
UV9
C1RIET-AMERSC1KVAA-UNSPE
UV17C1BLES-UNSPE
VC4VC5
UV Uklip
C13C
C1KLIP-UNSPE1
C13AC1SAND-UNSPE
C13E
C1KLIP-UNSPE2
C13G
C13H
8WF18WF3
UV25UV28
UV CorC82B
8EF4C81G
GG
C81J
C81C
C8NUWE-CONFL
C82DUV31
VC8
UV35
VC9
VC15
C83D
C83E
VC16VC17
VC6WA1
VC7
WA2UV WV
UV45
C8KLIP-VAALD
8VF3
C12A
C12K
C12J
C21AVC11
VC12
VC13VC14
C22GUV53
C23F
VC19
M2
VC20 Vaal
Grootdraai
Saulspoort
Sterkfontein
Driekloof
Vaal Barrage
Liebenbergsvlei
Willem BrummerLeeupan
Vaal
Vaal
Liebe
nberg
svlei
Wilge
UV-A
UV-C1
UV-C2
UV-C3
UV-D
UV-E
UV-F
UV-G
UV-H
UV-J
UV-L
UV-K
UV-M
UV-B
UV-I
Bloemhof
EWR1EWR2
EWR3
EWR4
EWR5
EWR6
EWR8
EWR9EWR10
EWR11
RE-EWR1
RE-EWR2
EWR7
CLASSIFICATION OF SIGNIFICANT WATER RESOURCES (RIVER,WETLANDS, GROUNDWATER AND LAKES) IN THE UPPER, MIDDLEAND LOWER VAAL WATER MANAGEMENT AREAS (WMA) 8, 9, 10
Upper Vaal Integrated Units of Analysis (IUA) A-1WRP_P0263 - Vaal Classification_GIS_APR_A-1.apr
0 25 50 75 100 125 150 kmBiophysical NodesDamsRiversQuaternary CatchmentsIntegrated Units of AnalysisUpper Vaal Water Management Area
#

#
##
####
#
#
#
#
#
##
##
#
#
###
#
#
#
#
#
#
#
#
#
Vaal
C24F
C24C
C24E C24D
C24AC24G
C24H
C24J
C25D
C24B
C25E
C25AC70K
C70EC70J
C25C
C70CC70F
C70DC70H
C70GC60J
C25F
C60GC70B
C25B C60H C70AC60D C60C
C43DC60F
C60BC43C C42JC43B
C60E
C60AC43A
C42HC42FC42L
C42KC42AC41J C42B
C42G C42D
C42E
C42C
C41G
C41H C41E
C41AC41F
C41B
C41DC41C
VC24
VC25VC26
R1VC27R2
VC29
VC30
VC31
VC33
VC35
VC21
VC22VC23
VC40V1
VC42
VC46
VC49VC52
VC51V2
VC56MV-F
MV-E2
MV-E1
MV-D1
MV-D2
MV-C
MV-A
MV-B
Johan Nesser
Koppies
Allemanskraal
Erfenis
Bloemhof
Vaalharts
Vaal Grootdraai
Vaal Barrage
Vaal
Vaal
Sand
Vet
Renoster
Vals
EWR12
EWR13
EWR15
EWR14
S1
S3
S4
CLASSIFICATION OF SIGNIFICANT WATER RESOURCES (RIVER,WETLANDS, GROUNDWATER AND LAKES) IN THE UPPER, MIDDLEAND LOWER VAAL WATER MANAGEMENT AREAS (WMA) 8, 9, 10
Middle Vaal Integrated Units of Analysis (IUA) A-2WRP_P0263 - Vaal Classification_GIS_APR_A-2.apr
0 25 50 75 100 125 150 kmBiophysical NodesDamsRiversQuaternary CatchmentsIntegrated Units of AnalysisMiddle Vaal Water Management Area
#
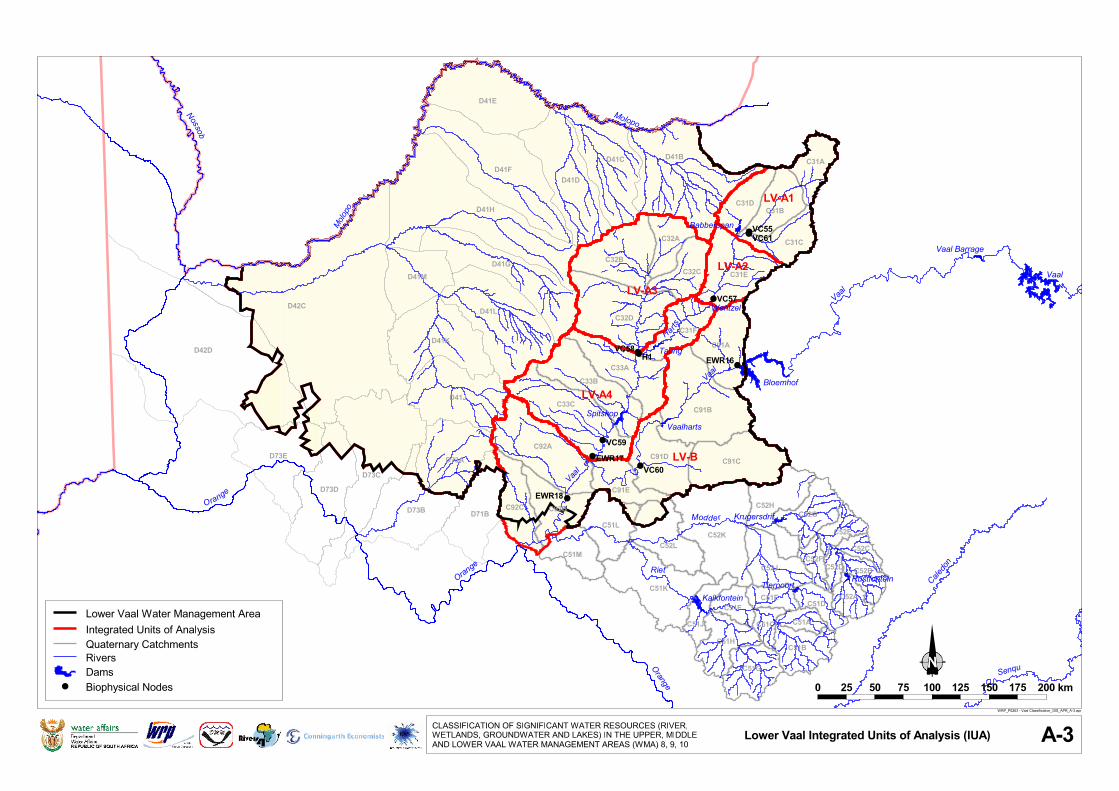
##
#
##
#
#
#
#
#
Vaal
Vaal
Spitskop
Krugersdrif
RustfonteinTierpoortKalkfontein
Babberspan
Bloemhof
Vaalharts
Wentzel
Taung
Vaal
Vaal Barrage
Vaal
Orange
Orange
Orange
Senqu
Caledo
n
C31A
C31BC31D
C31C
C32B
C32A
C31EC32C
C32DC31F
C91A
C33AC33B
C91BC33C
C92AC91D C91C
C92C
C91EC52HC92B C52G
C52KC51L
C52LC52E
C52JC51M C52C
C52F
C51K
C52D C52B
C52A
C51J
C51DC51EC51F
C51AC51C
C51HC51B
C51G
D41E
D41CD41F
D41D
D41B
D41H
D42C
D42D
D41GD41M
D41L
D41K
D41J
D73CD73AD73E
D73D
D73B D71B
VC55VC61
VC57
VC58H1
VC59
VC60
LV-A4
LV-A2
LV-A1
LV-A3
LV-B
Molopo
Molopo
Nossob
Modder
Riet
Harts
EWR16
EWR17
EWR18
CLASSIFICATION OF SIGNIFICANT WATER RESOURCES (RIVER,WETLANDS, GROUNDWATER AND LAKES) IN THE UPPER, MIDDLEAND LOWER VAAL WATER MANAGEMENT AREAS (WMA) 8, 9, 10
Lower Vaal Integrated Units of Analysis (IUA) A-3WRP_P0263 - Vaal Classification_GIS_APR_A-3.apr
Biophysical NodesDamsRiversQuaternary CatchmentsIntegrated Units of AnalysisLower Vaal Water Management Area
# 0 25 50 75 100 125 150 175 200 km
Status Quo Report V13_1.docx September 2011
Appendix B:
Catchment Maps of the Integrated Units of Analysis

#
#
#
#
#
##
#
#
#
##
#
#
#
#
C11AC11FC12D
C11H
C11B
C12F
C11G
C11K
C12E
C12G
C11EC11J
C11D
C11LC11C
Vaal Grootdraai
Willem Brummer
Leeupan
UV-AUV-E
8VF5
C1VAAL-KVAAL
UV9
C1RIET-AMERS
C1KVAA-UNSPE
UV17C1BLES-UNSPE
VC4
VC5
VC6
WA1VC7
WA2
UV WV
Vaal
Vaal
Waterval
EWR1
RE-EWR1
CLASSIFICATION OF SIGNIFICANT WATER RESOURCES (RIVER,WETLANDS, GROUNDWATER AND LAKES) IN THE UPPER, MIDDLEAND LOWER VAAL WATER MANAGEMENT AREAS (WMA) 8, 9, 10
IUA : UV-A and UV-E B-1WRP_P0263 - Vaal Classification_GIS_APR_B-1b.apr
Biophysical NodesDamsRiversQuaternary CatchmentsIntegrated Units of Analysis
# 0 10 20 30 40 50 km
CM
CL
DL
BH
DL
DM
CM
CM
CM
CL
Recommended Ecological CategoryEnvironmental ImportancePresent Ecological State
ECOLOGICAL STATE
ABC
F
DE
CM
Environmental Importance
ML Low
Moderate
Very HighHigh
VHH
Ecological Categories
C/DL
C/DL
C/DL
B/CM
PESEI
REC CMC
PESEI
REC B/CH
B/C
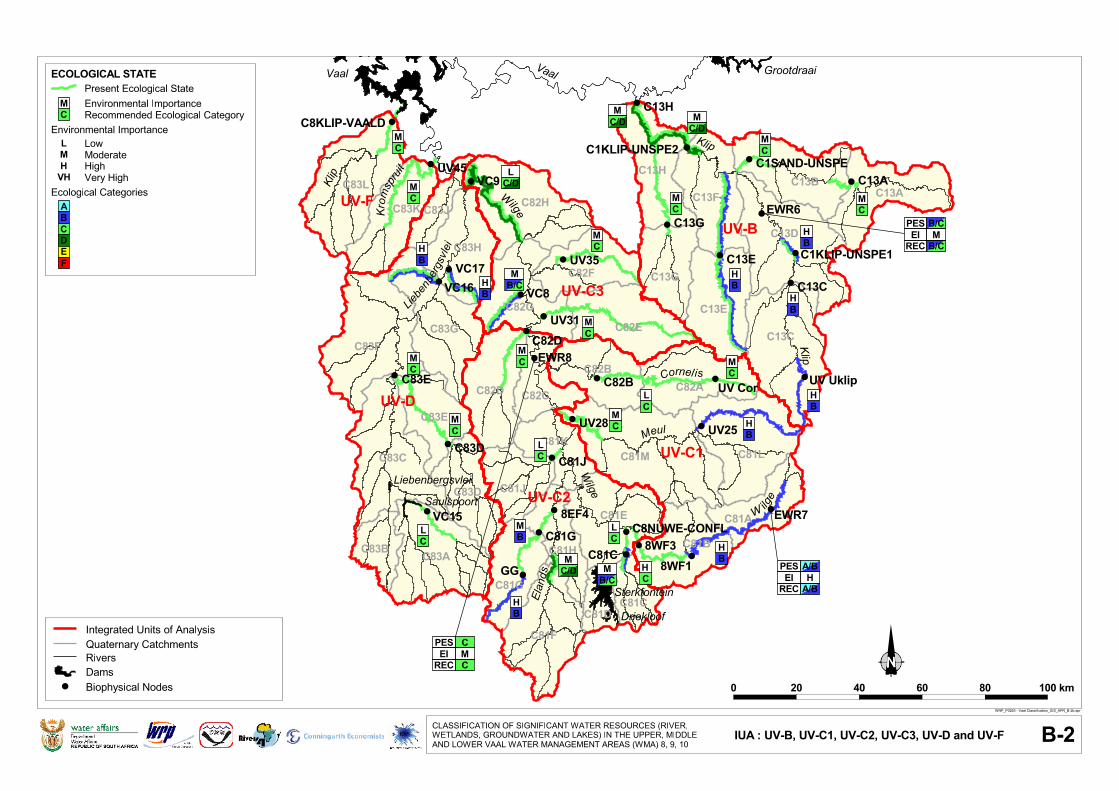
#
#
#
#
#
#
#
#
#
##
##
##
#
#
#
#
#
#
##
#
#
#
#
#
#
##
#
#
#
#
#
C13HC83L
C13FC13B
C13AC83J C82HC83K
C13DC83H
C13GC82F
C13EC82GC83G C13C
C83FC82E
C82D C82C
C82BC82A
C83E
C81LC83C C81MC81K
C83D
C81A
C81J
C81E
C81H C81BC83AC83B
C81GC81C
C81FC81D
UV Uklip
C13C
C1KLIP-UNSPE1
C13AC1SAND-UNSPE
C13E
C1KLIP-UNSPE2
C13G
C13H
8WF18WF3
UV25UV28
UV CorC82B
8EF4C81G
GG
C81J
C81C
C8NUWE-CONFL
C82DUV31
VC8
UV35
VC9
VC15
C83D
C83E
VC16VC17
UV45
C8KLIP-VAALD
Vaal Grootdraai
Saulspoort
Sterkfontein
Driekloof
Liebenbergsvlei
Liebenberg
svlei
Wilge
UV-C1
UV-C2
UV-C3
UV-D
UV-FUV-B
Vaal
Klip
Klip
Wilge
Cornel is
Meul
Klip
Krom
spruit
W ilge
Elands
EWR6
EWR8
EWR7
CLASSIFICATION OF SIGNIFICANT WATER RESOURCES (RIVER,WETLANDS, GROUNDWATER AND LAKES) IN THE UPPER, MIDDLEAND LOWER VAAL WATER MANAGEMENT AREAS (WMA) 8, 9, 10
IUA : UV-B, UV-C1, UV-C2, UV-C3, UV-D and UV-F B-2WRP_P0263 - Vaal Classification_GIS_APR_B-2b.apr
C/DMRecommended Ecological Category
Environmental ImportancePresent Ecological State
ECOLOGICAL STATE
BC
F
DE
A
CM
Environmental Importance
ML Low
Moderate
Very HighHigh
VHH
Ecological Categories
CL
CM
CM
CM
BH
CL
CH
Biophysical NodesDamsRiversQuaternary CatchmentsIntegrated Units of Analysis
#
BH
BH
BH
BH
C/DM
BHC
M
CM
C/DM
BH
BM
B/CM
CL
CM
CM
B/CM
CM
C/DL
CL
CM
CM
BH
BH
CM
CM
0 20 40 60 80 100 km
PESEI
REC B/CM
B/C
PESEI
REC CMC
PESEI
REC A/BH
A/B
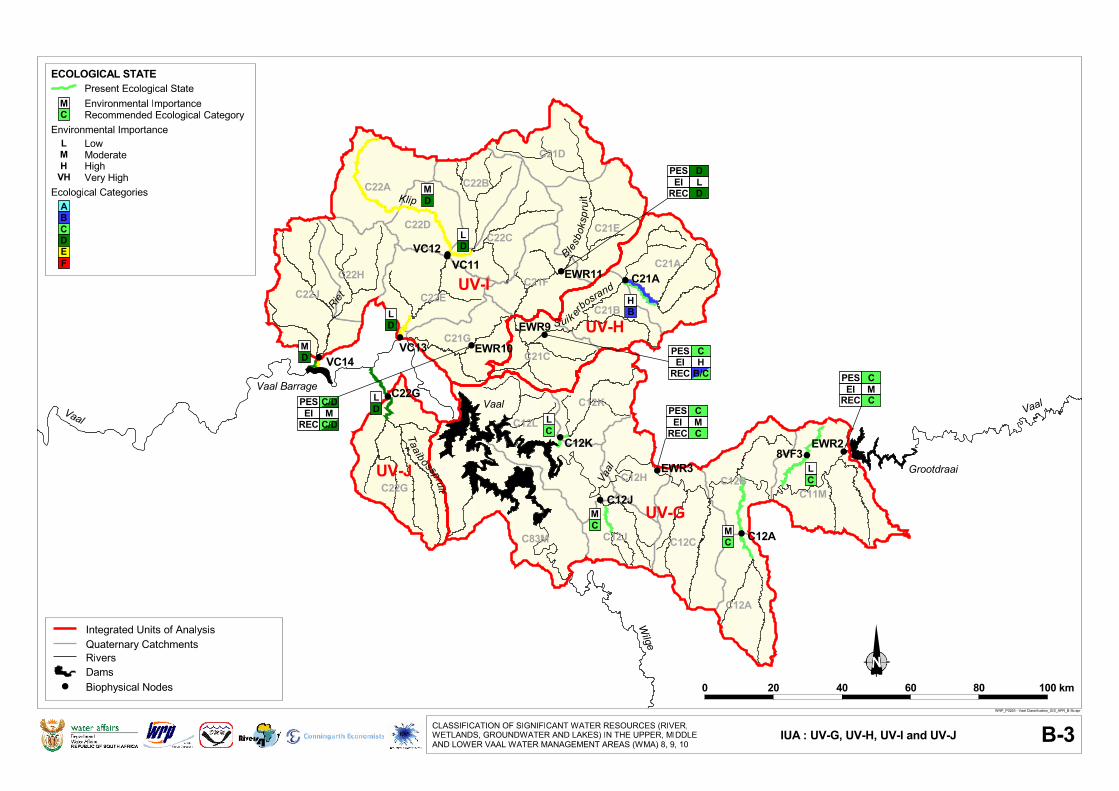
#
#
#
#
#
##
#
#
#
#
#
##
#
C21D
C22A C22B
C21EC22C
C22D
C21AC21FC22H
C22J C22EC21B
C21GC21C
C12KC12L
C22G C11MC12BC12H
C83M C12CC12J
C12A
8VF3
C12A
C12K
C12J
C21AVC11
VC12
VC13VC14
C22GVaal
Grootdraai
Vaal Barrage
UV-G
UV-H
UV-J
UV-I
VaalVaal
Vaal
Taaibosspruit
Suik erbosrand
Klip
Blesbo
kspr
uit
Riet
Wilge
EWR2
EWR3
EWR9EWR10
EWR11
CLASSIFICATION OF SIGNIFICANT WATER RESOURCES (RIVER,WETLANDS, GROUNDWATER AND LAKES) IN THE UPPER, MIDDLEAND LOWER VAAL WATER MANAGEMENT AREAS (WMA) 8, 9, 10
IUA : UV-G, UV-H, UV-I and UV-J B-3WRP_P0263 - Vaal Classification_GIS_APR_B-3b.apr
DL
Biophysical NodesDamsRiversQuaternary CatchmentsIntegrated Units of Analysis
#
Recommended Ecological CategoryEnvironmental ImportancePresent Ecological State
ECOLOGICAL STATE
ABC
F
DE
CM
Environmental Importance
ML Low
Moderate
Very HighHigh
VHH
Ecological Categories
0 20 40 60 80 100 km
CL
CM
CL
CM
BH
DL
DM
DM
DL
PESEI
REC CMC
PESEI
REC B/CHC
PESEI
REC CMC
PESEI
RECM
C/D
C/D
PESEI
REC DLD

#
#
#
#
# #
#
#
C23F
C23EC23D
C23G
C23JC23H
C23K
C22F
C23B
C23L C22K
C23C
C23A
Vaal
Vaal Barrage
Vaal
UV-L
UV-K
UV-M
Vaal
Mooi
Mooi
Vaal
Kromelmboogspru itUV53
C23F
VC19
M2
VC20 EWR4EWR5
RE-EWR2
CLASSIFICATION OF SIGNIFICANT WATER RESOURCES (RIVER,WETLANDS, GROUNDWATER AND LAKES) IN THE UPPER, MIDDLEAND LOWER VAAL WATER MANAGEMENT AREAS (WMA) 8, 9, 10
IUA : UV-K, UV-L and UV-M B-4WRP_P0263 - Vaal Classification_GIS_APR_B-4b.apr
Recommended Ecological CategoryEnvironmental ImportancePresent Ecological State
ECOLOGICAL STATE
ABC
F
DE
CM
Environmental Importance
ML Low
Moderate
Very HighHigh
VHH
Ecological Categories
Biophysical NodesDamsRiversQuaternary CatchmentsIntegrated Units of Analysis
# 0 20 40 60 80 100 km
CL
C/DL
DL
DL
DL
PESEI
REC B/CHC
PESEI
RECH
C/D
C
PESEI
REC DLD

#
#
#
####
#
#
#
#
#
Vaal
C70KC70E
C70J
C70CC70F
C70DC70H
C70GC60J
C60GC70B
C60H C70AC60D C60C
C60FC60B
C60E
C60A
VC24
VC25
VC26
R1VC27
R2VC29
VC30
VC31
VC33
VC35
MV-A
MV-B
Koppies
Bloemhof
Vaal
VaalRenoster
Vals Renoster
Vals
Blomspruit
EWR14
CLASSIFICATION OF SIGNIFICANT WATER RESOURCES (RIVER,WETLANDS, GROUNDWATER AND LAKES) IN THE UPPER, MIDDLEAND LOWER VAAL WATER MANAGEMENT AREAS (WMA) 8, 9, 10
IUA : MV-A and MV-B B-5WRP_P0263 - Vaal Classification_GIS_APR_B-5b.apr
0 20 40 60 80 kmBiophysical NodesDamsRiversQuaternary CatchmentsIntegrated Units of Analysis
#
Recommended Ecological CategoryEnvironmental ImportancePresent Ecological State
ECOLOGICAL STATE
ABC
F
DE
CM
Environmental Importance
ML Low
Moderate
Very HighHigh
VHH
Ecological Categories
CM
B/CM
CM
CL
C/DL
CL
CM
CL
CL
CM
CL
PESEI
RECH
C/D
C/D

#
#
#
#
#
#
C24F
C24C
C24EC24D
C24AC24G
C24H
VC21
VC22
VC23
MV-C
Johan NesserVaal Barrage
Vaal
Scho
onsp
ruit
Koekempoerspruit
S1
S3
S4
CLASSIFICATION OF SIGNIFICANT WATER RESOURCES (RIVER,WETLANDS, GROUNDWATER AND LAKES) IN THE UPPER, MIDDLEAND LOWER VAAL WATER MANAGEMENT AREAS (WMA) 8, 9, 10
IUA : MV-C B-6WRP_P0263 - Vaal Classification_GIS_APR_B-6b.apr
Recommended Ecological CategoryEnvironmental ImportancePresent Ecological State
ECOLOGICAL STATE
ABC
F
DE
CM
Environmental Importance
ML Low
Moderate
Very HighHigh
VHH
Ecological Categories
Biophysical NodesDamsRiversQuaternary CatchmentsIntegrated Units of Analysis
#
CM
DL
DL
0 10 20 30 40 50 km
PESEI
REC
C/D
C/D
PESEI
REC
C/D
C/D
PESEI
REC
C/D
C/D
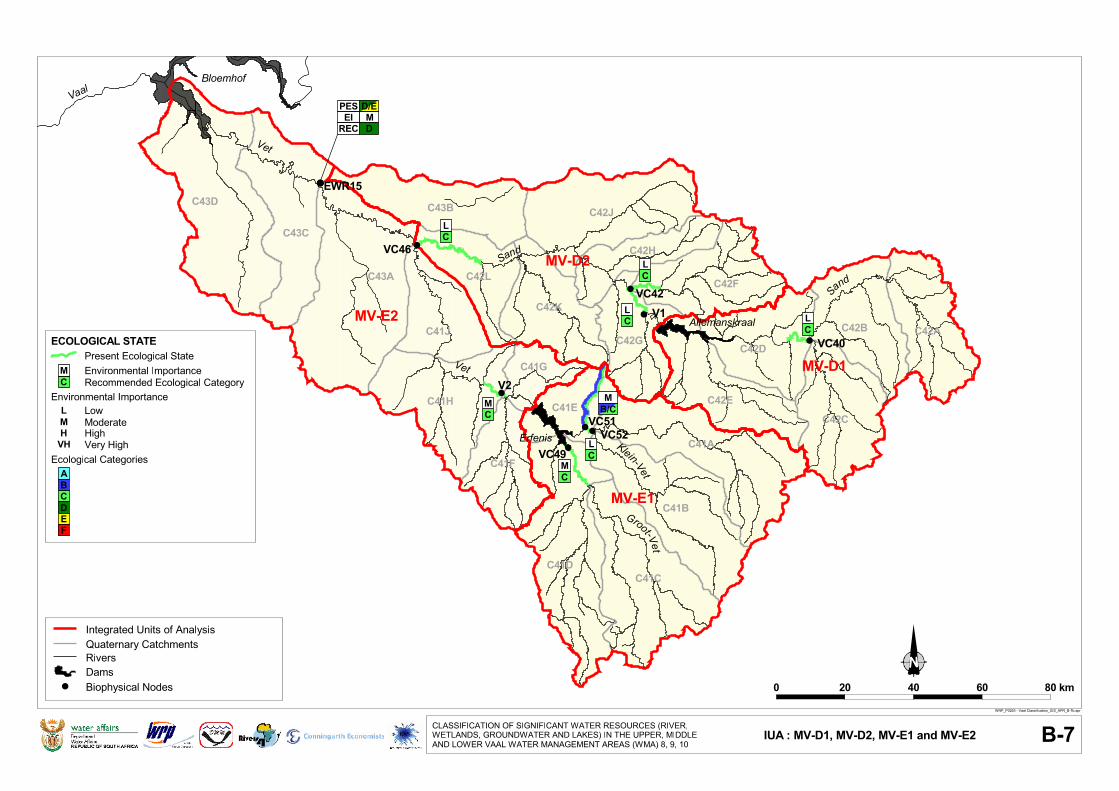
#
#
#
#
###
#
#C43D
C43CC42JC43B
C43A
C42H
C42FC42L
C42K
C42AC41J C42BC42G C42D
C42EC42C
C41G
C41H C41E
C41AC41F
C41B
C41DC41C
VC40
V1VC42
VC46
VC49VC52
VC51
V2
MV-E2
MV-E1
MV-D1
MV-D2
Allemanskraal
Erfenis
Bloemhof
Sand
Vet
Vet
Groot-VetKlein-Vet
Vaal
Sand
EWR15
CLASSIFICATION OF SIGNIFICANT WATER RESOURCES (RIVER,WETLANDS, GROUNDWATER AND LAKES) IN THE UPPER, MIDDLEAND LOWER VAAL WATER MANAGEMENT AREAS (WMA) 8, 9, 10
IUA : MV-D1, MV-D2, MV-E1 and MV-E2 B-7WRP_P0263 - Vaal Classification_GIS_APR_B-7b.apr
0 20 40 60 80 kmBiophysical NodesDamsRiversQuaternary CatchmentsIntegrated Units of Analysis
#
Recommended Ecological CategoryEnvironmental ImportancePresent Ecological State
ECOLOGICAL STATE
ABC
F
DE
CM
Environmental Importance
ML Low
Moderate
Very HighHigh
VHH
Ecological Categories
CLC
L
CL
CL
CM
CL
B/CM
CM
PESEI
RECM
D/E
D

#
#
#
#
###
#
#C43D
C43CC42JC43B
C43A
C42H
C42FC42L
C42K
C42AC41J C42BC42G C42D
C42EC42C
C41G
C41H C41E
C41AC41F
C41B
C41DC41C
VC40
V1VC42
VC46
VC49VC52
VC51
V2
MV-E2
MV-E1
MV-D1
MV-D2
Allemanskraal
Erfenis
Bloemhof
Sand
Vet
Vet
Groot-VetKlein-Vet
Vaal
Sand
EWR15
CLASSIFICATION OF SIGNIFICANT WATER RESOURCES (RIVER,WETLANDS, GROUNDWATER AND LAKES) IN THE UPPER, MIDDLEAND LOWER VAAL WATER MANAGEMENT AREAS (WMA) 8, 9, 10
IUA : MV-D1, MV-D2, MV-E1 and MV-E2 B-7WRP_P0263 - Vaal Classification_GIS_APR_B-7b.apr
0 20 40 60 80 kmBiophysical NodesDamsRiversQuaternary CatchmentsIntegrated Units of Analysis
#
Recommended Ecological CategoryEnvironmental ImportancePresent Ecological State
ECOLOGICAL STATE
ABC
F
DE
CM
Environmental Importance
ML Low
Moderate
Very HighHigh
VHH
Ecological Categories
CLC
L
CL
CL
CM
CL
B/CM
CM
PESEI
RECM
D/E
D

#
#
#
Vaal
C24J
C25D
C24B
C25E
C25A
C25C
C25F
C25B
VC56MV-F
Bloemhof
Vaal
Vaal
Vaal
EWR12
EWR13
CLASSIFICATION OF SIGNIFICANT WATER RESOURCES (RIVER,WETLANDS, GROUNDWATER AND LAKES) IN THE UPPER, MIDDLEAND LOWER VAAL WATER MANAGEMENT AREAS (WMA) 8, 9, 10
IUA : MV-F B-8WRP_P0263 - Vaal Classification_GIS_APR_B-8b.apr
Recommended Ecological CategoryEnvironmental ImportancePresent Ecological State
ECOLOGICAL STATE
ABC
F
DE
CM
Environmental Importance
ML Low
Moderate
Very HighHigh
VHH
Ecological Categories
Biophysical NodesDamsRiversQuaternary CatchmentsIntegrated Units of Analysis
#
CM
0 10 20 30 40 50 km
PESEI
REC DMD
PESEI
REC CHC
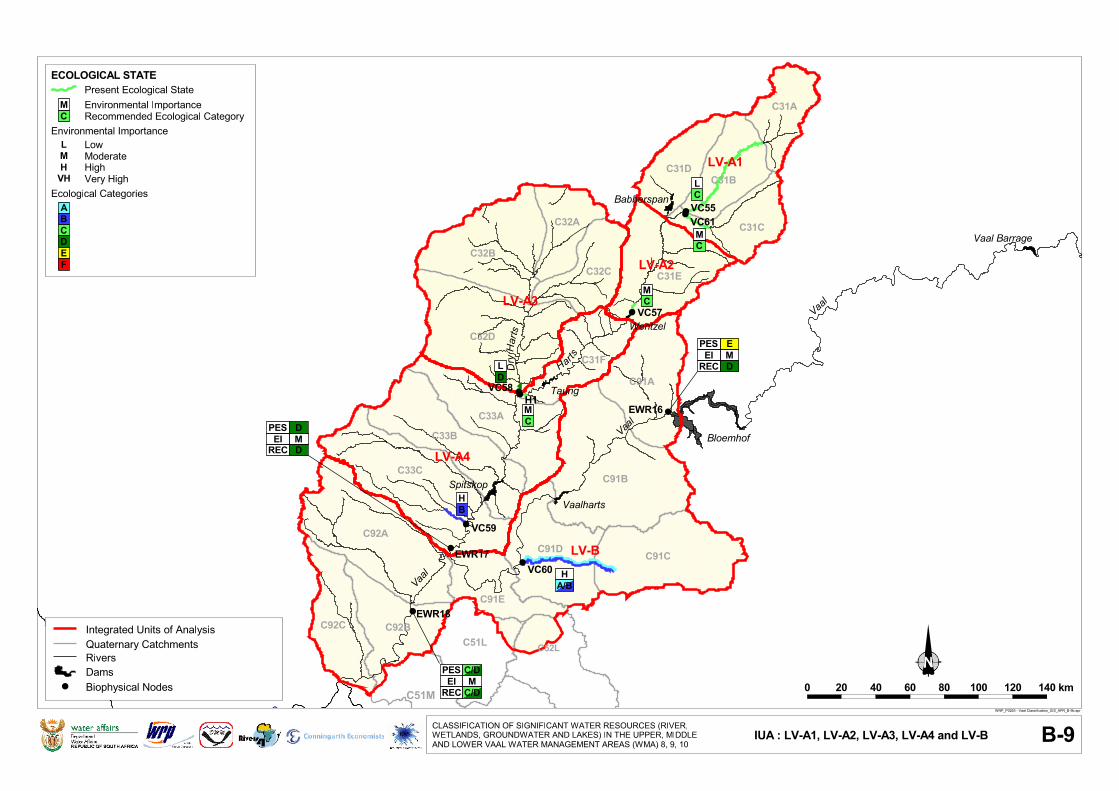
##
#
##
#
#
#
#
#
Vaal
Vaal
Spitskop
Babberspan
Bloemhof
Vaalharts
Wentzel
Taung
Vaal Barrage
Vaal
Orange
C31A
C31BC31D
C31C
C32B
C32A
C31EC32C
C32D
C31F
C91A
C33AC33B
C91BC33C
C92AC91D C91C
C92C
C91E
C92BC51L
C51M
VC55VC61
VC57
VC58H1
VC59
VC60
LV-A4
LV-A2
LV-A1
LV-A3
LV-B
Harts
C52L
Dry H
arts
EWR16
EWR17
EWR18
CLASSIFICATION OF SIGNIFICANT WATER RESOURCES (RIVER,WETLANDS, GROUNDWATER AND LAKES) IN THE UPPER, MIDDLEAND LOWER VAAL WATER MANAGEMENT AREAS (WMA) 8, 9, 10
IUA : LV-A1, LV-A2, LV-A3, LV-A4 and LV-B B-9WRP_P0263 - Vaal Classification_GIS_APR_B-9b.apr
A/BH
Biophysical NodesDamsRiversQuaternary CatchmentsIntegrated Units of Analysis
#
Recommended Ecological CategoryEnvironmental ImportancePresent Ecological State
ECOLOGICAL STATE
ABC
F
DE
CM
Environmental Importance
ML Low
Moderate
Very HighHigh
VHH
Ecological Categories CL
CM
CM
DL
CM
BH
PESEI
REC DMD
PESEI
RECM
C/D
C/D
PESEI
REC DME
0 20 40 60 80 100 120 140 km
Status Quo Report V13_1.docx September 2011
Appendix C:
WRPM Schematic Diagrams

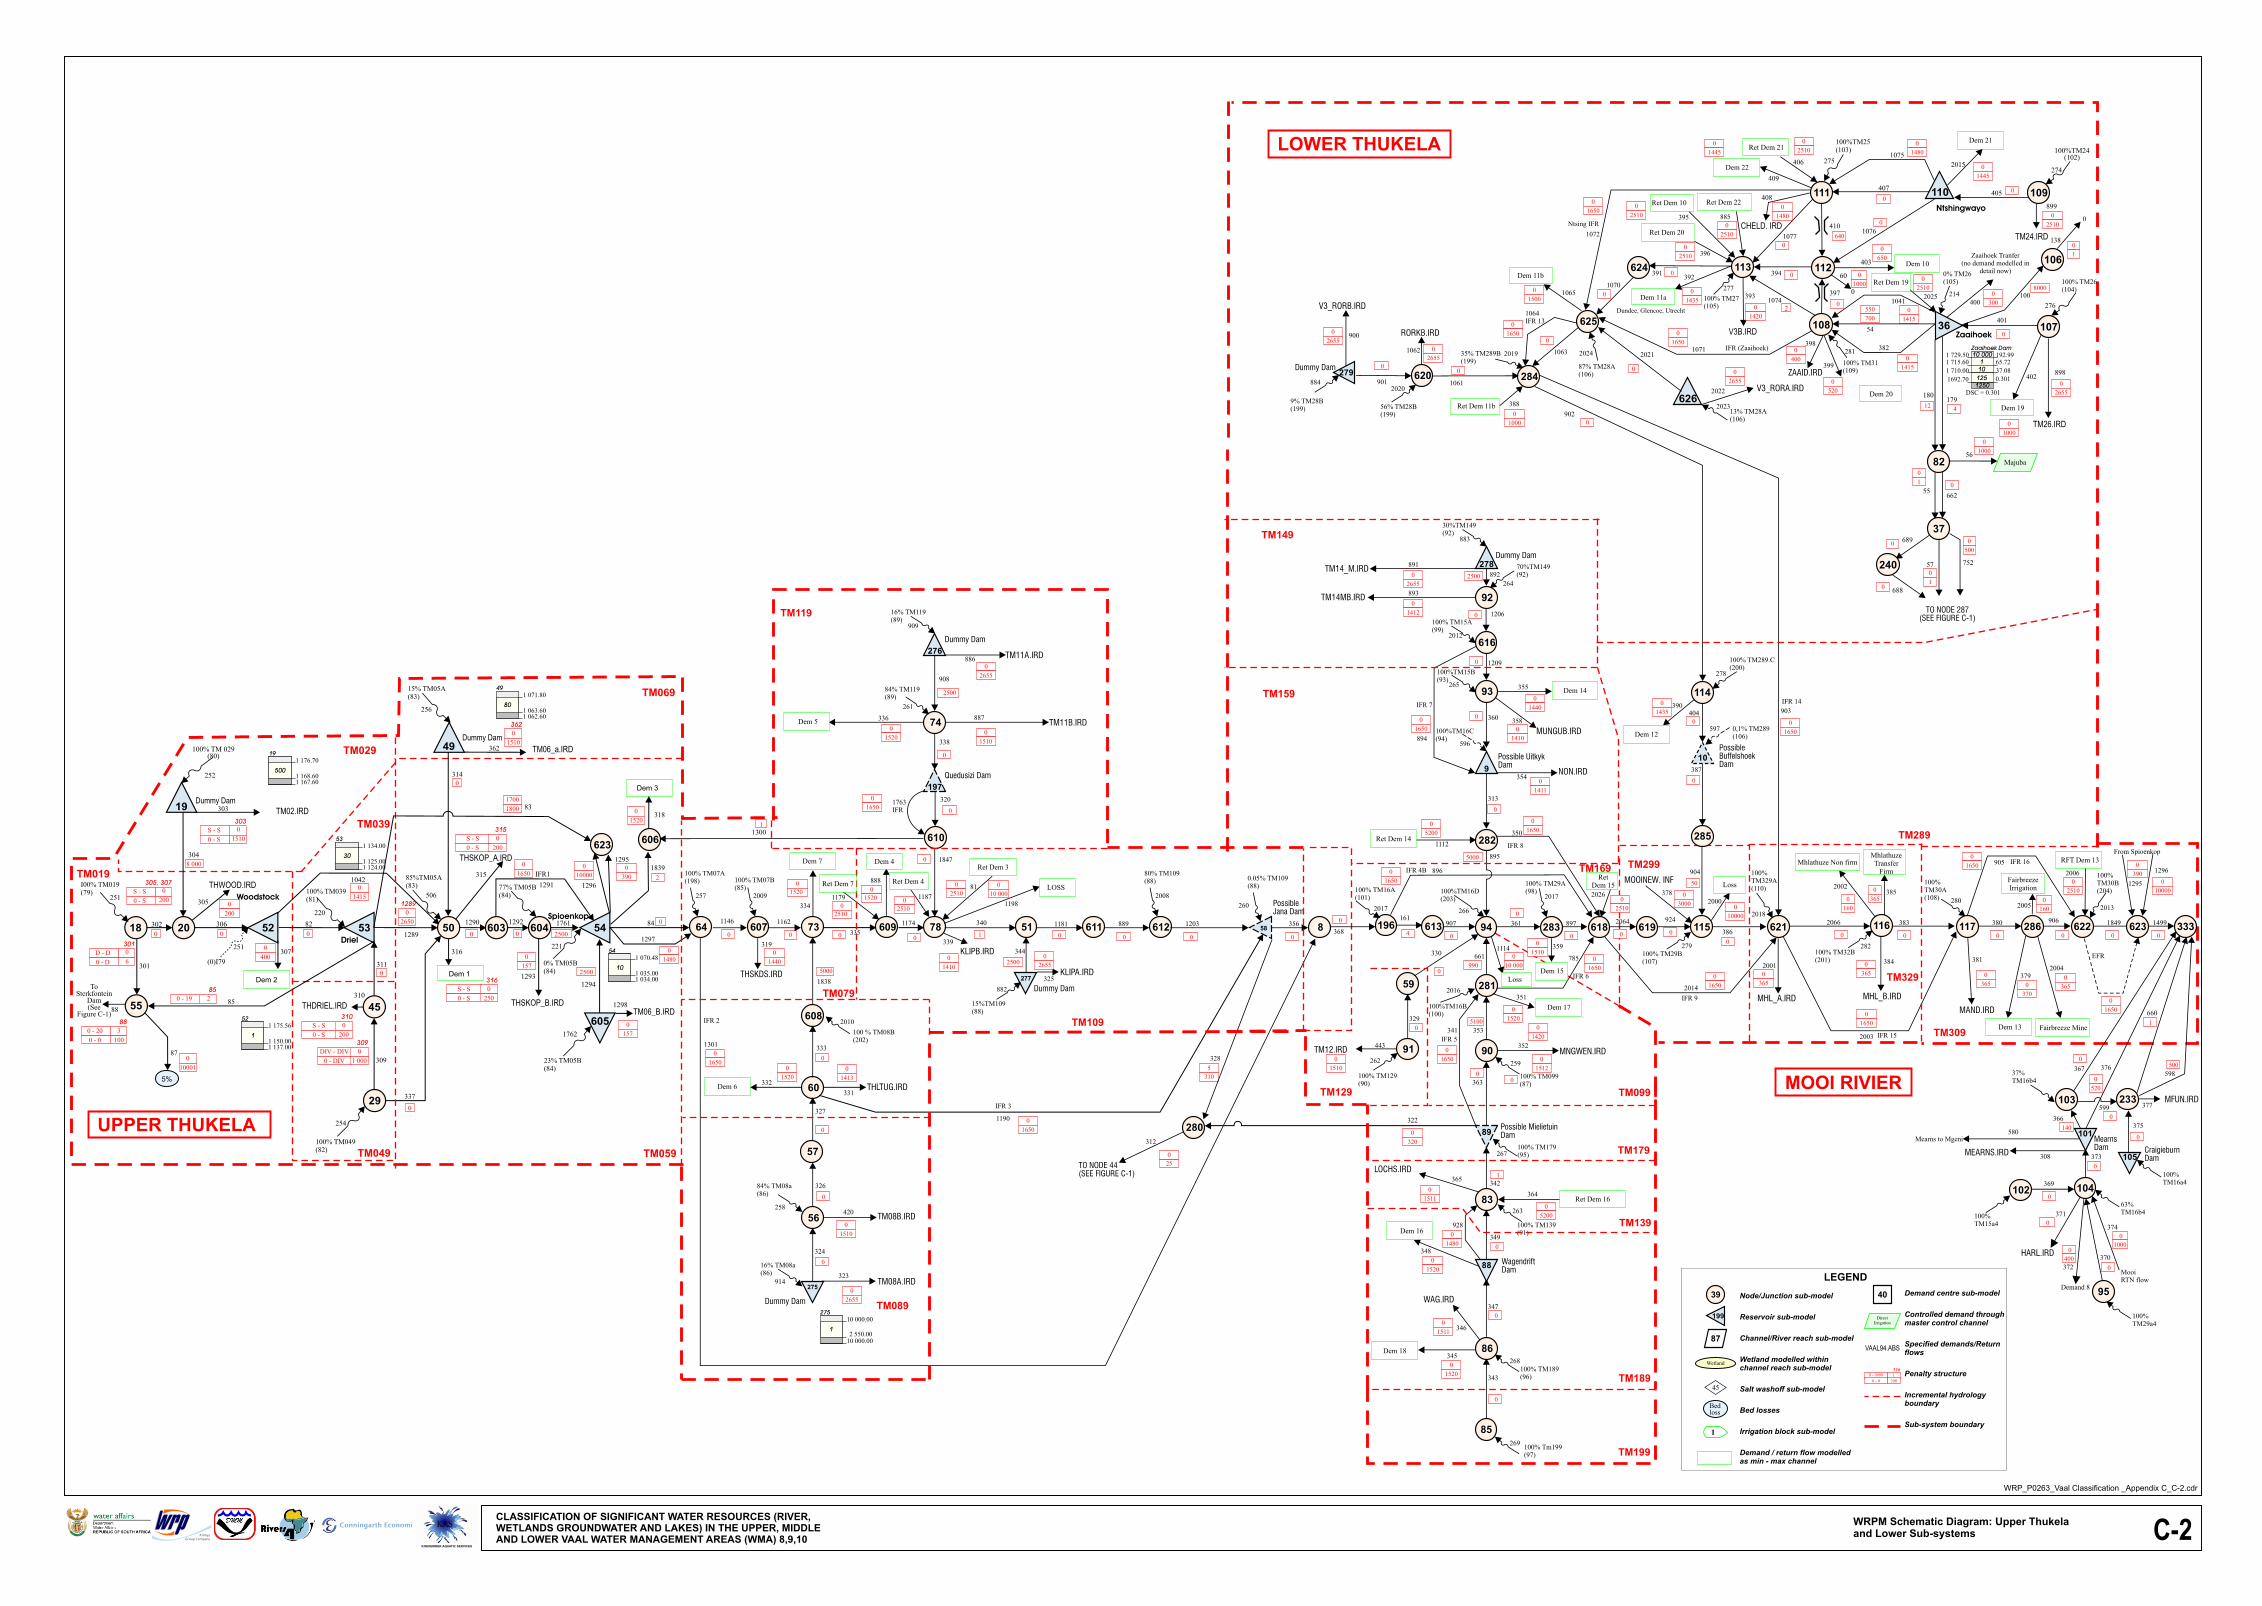
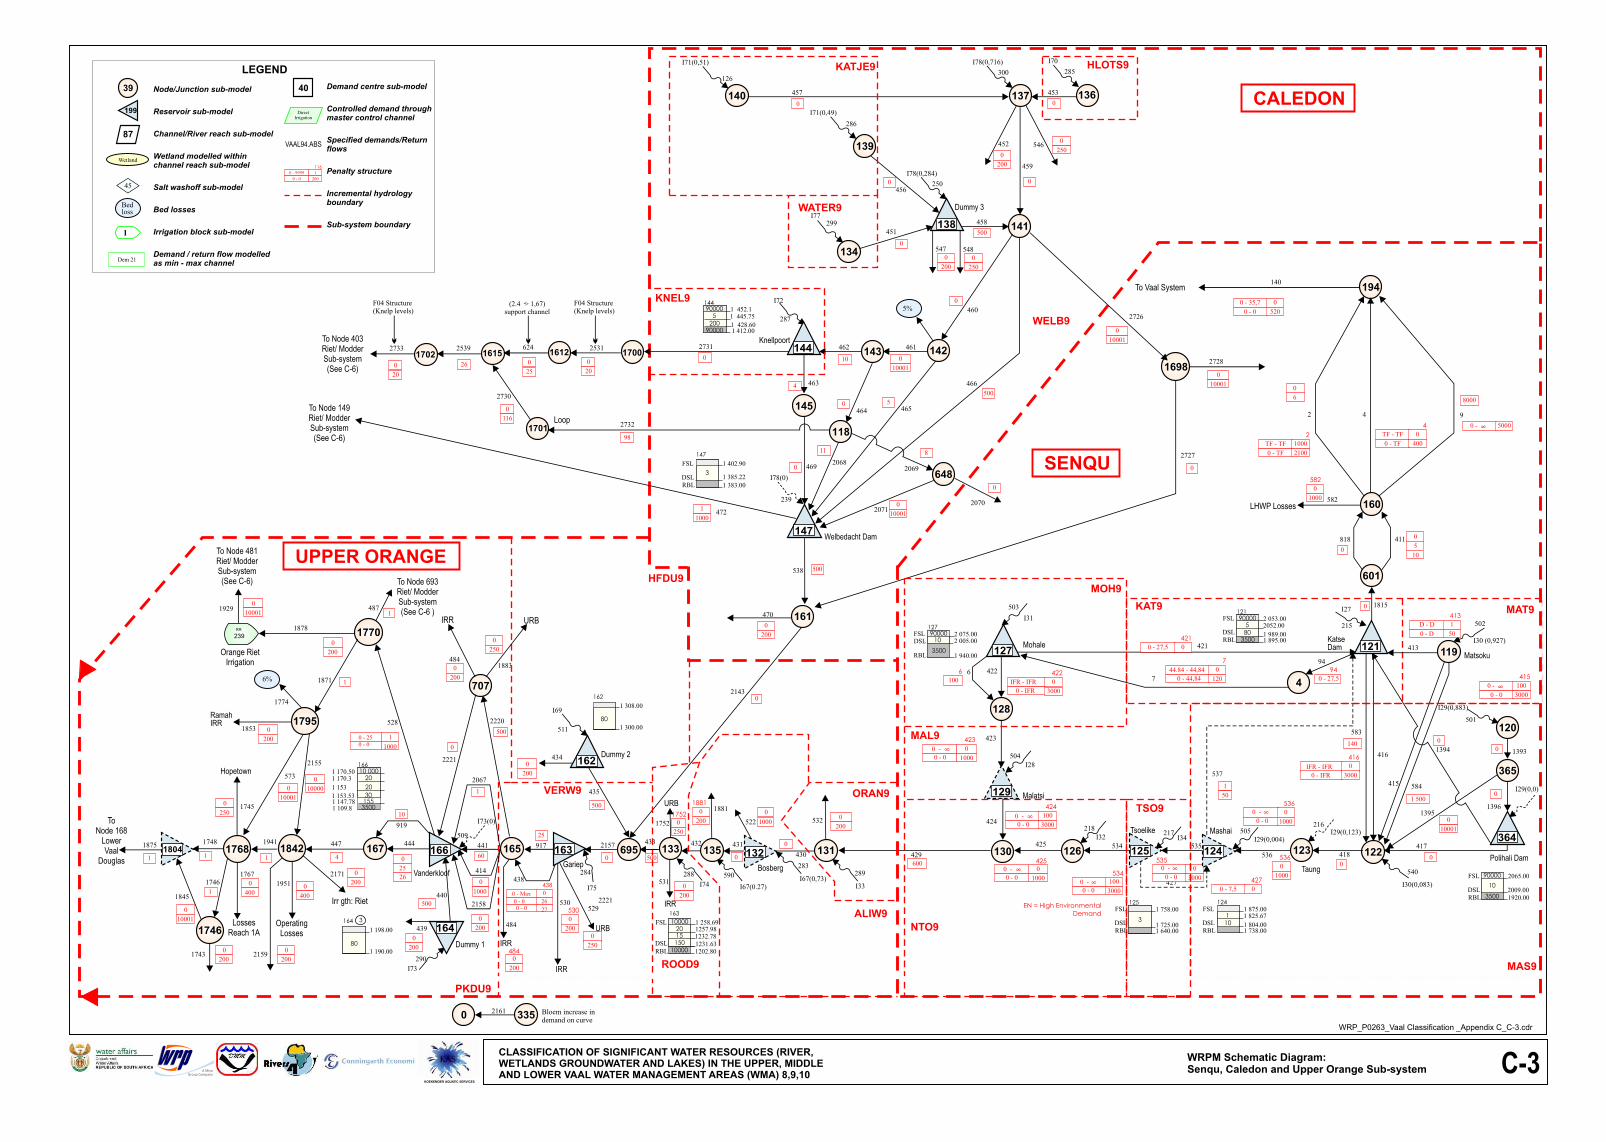

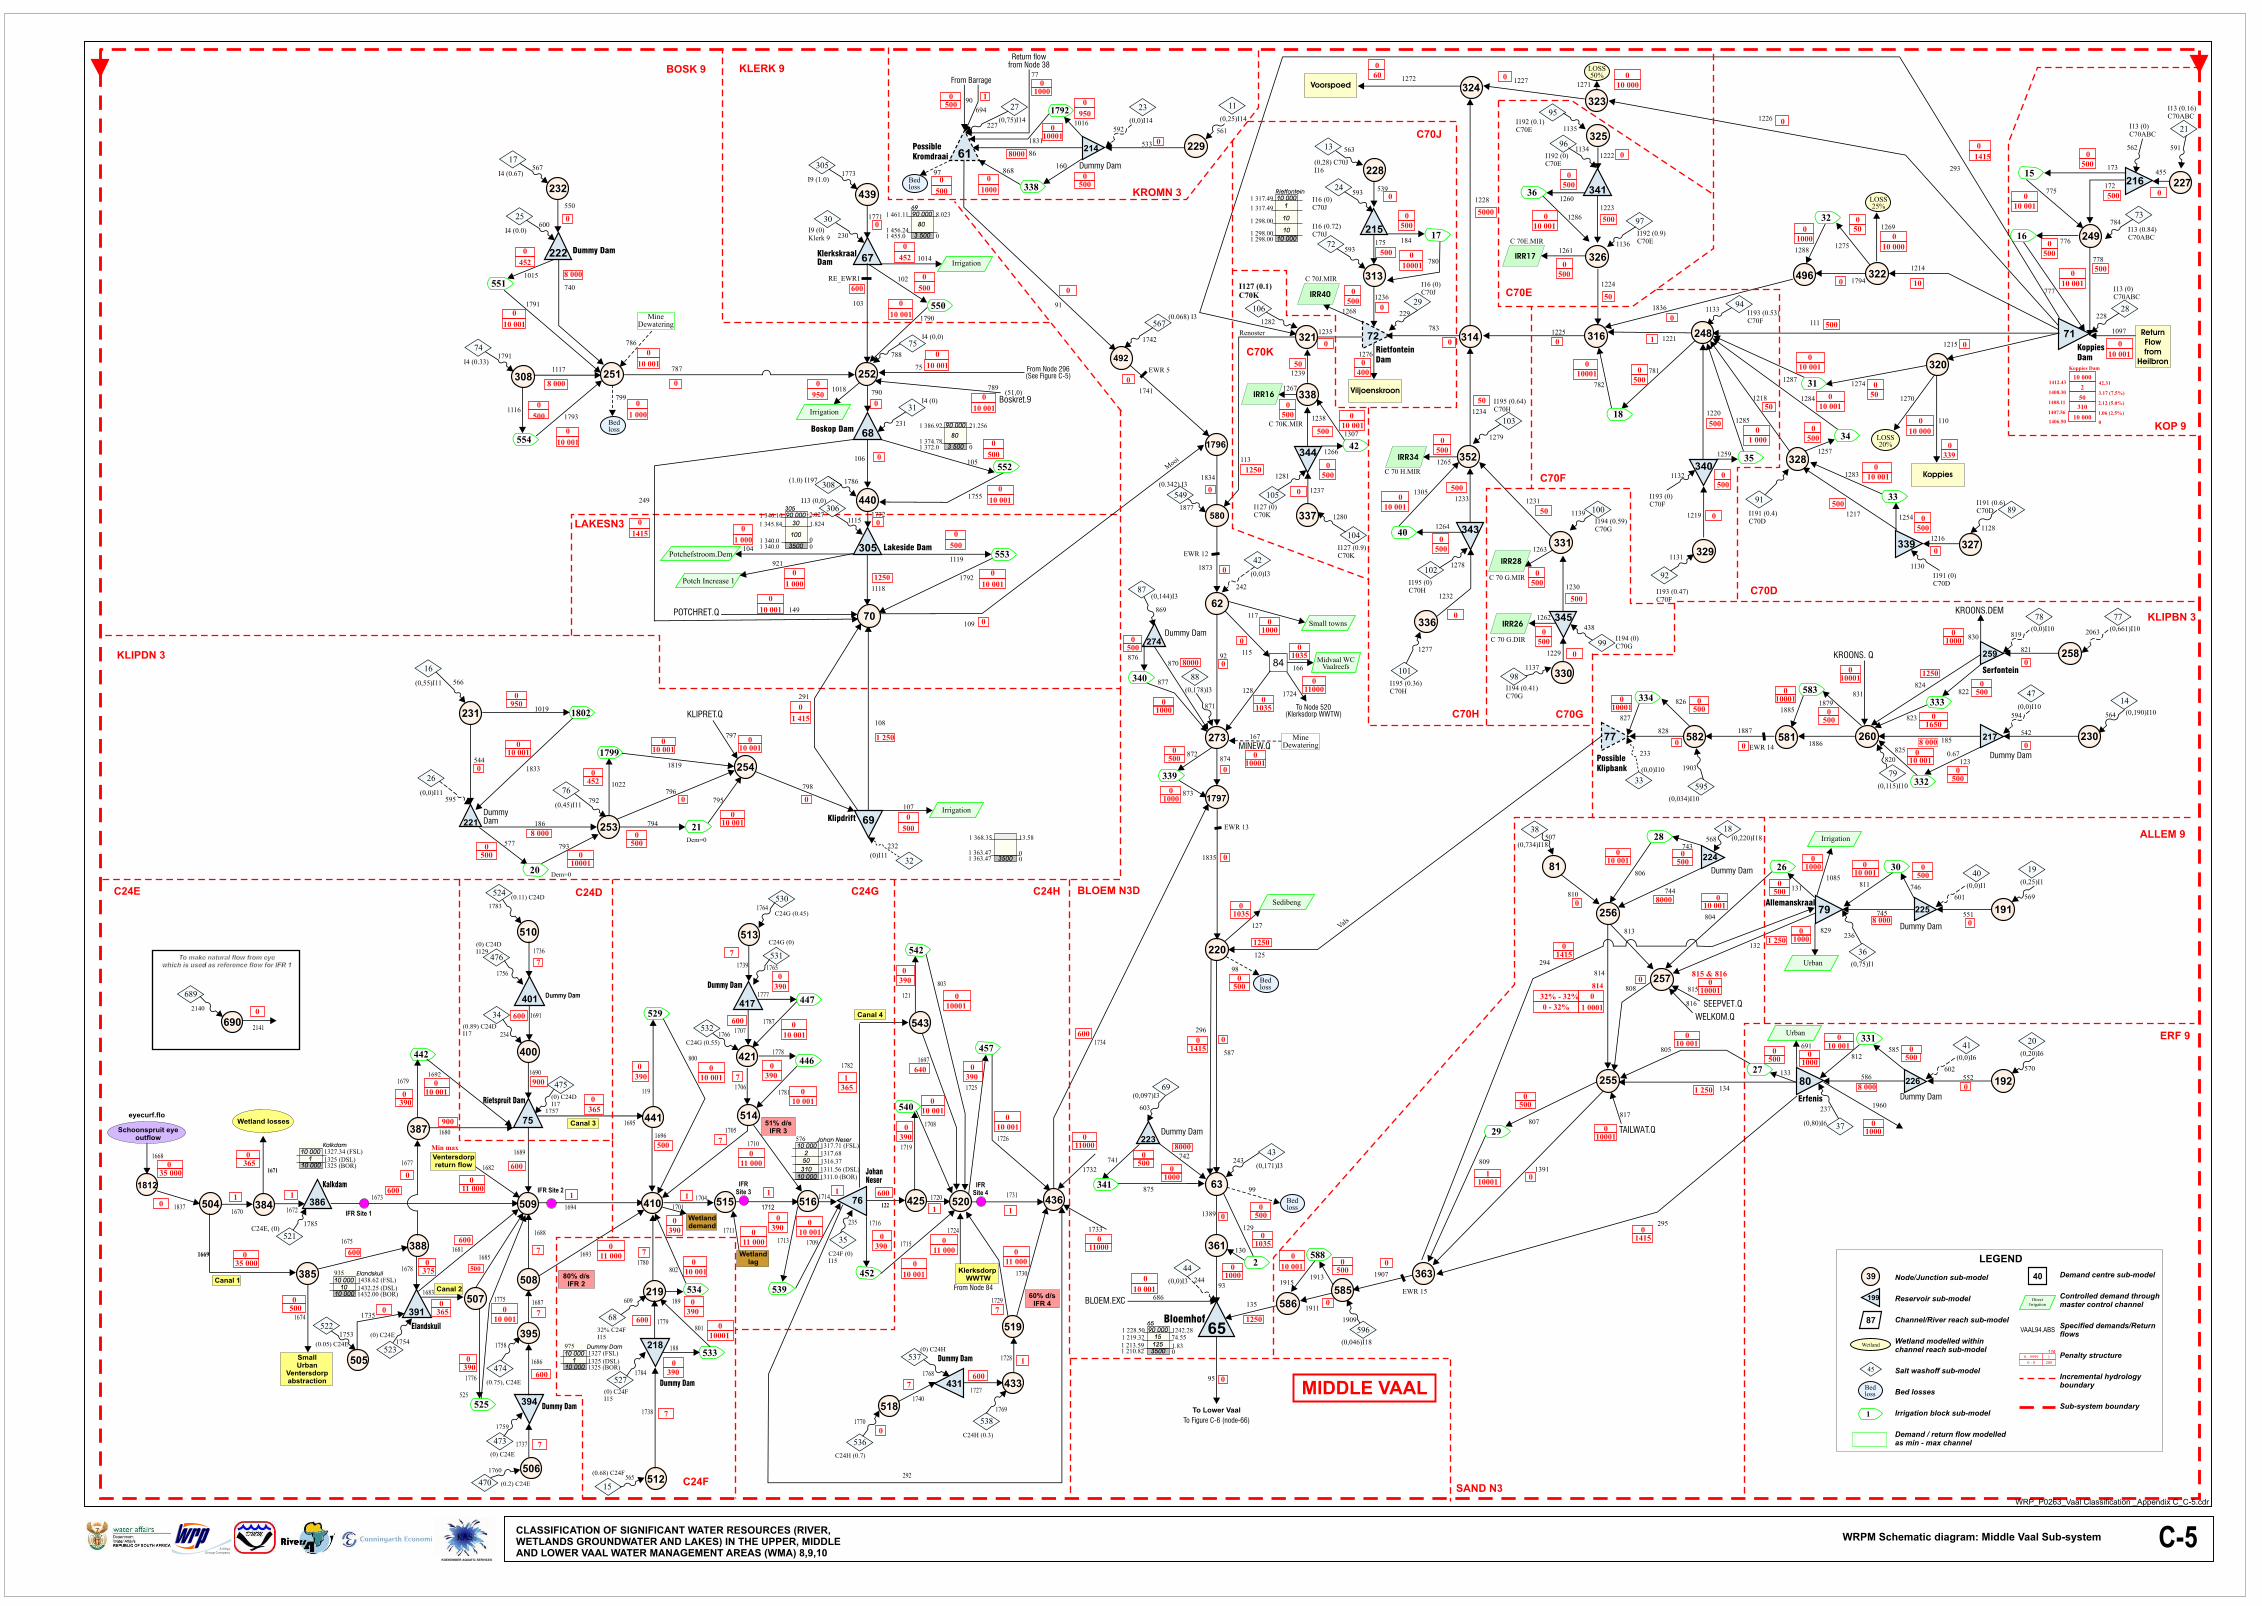
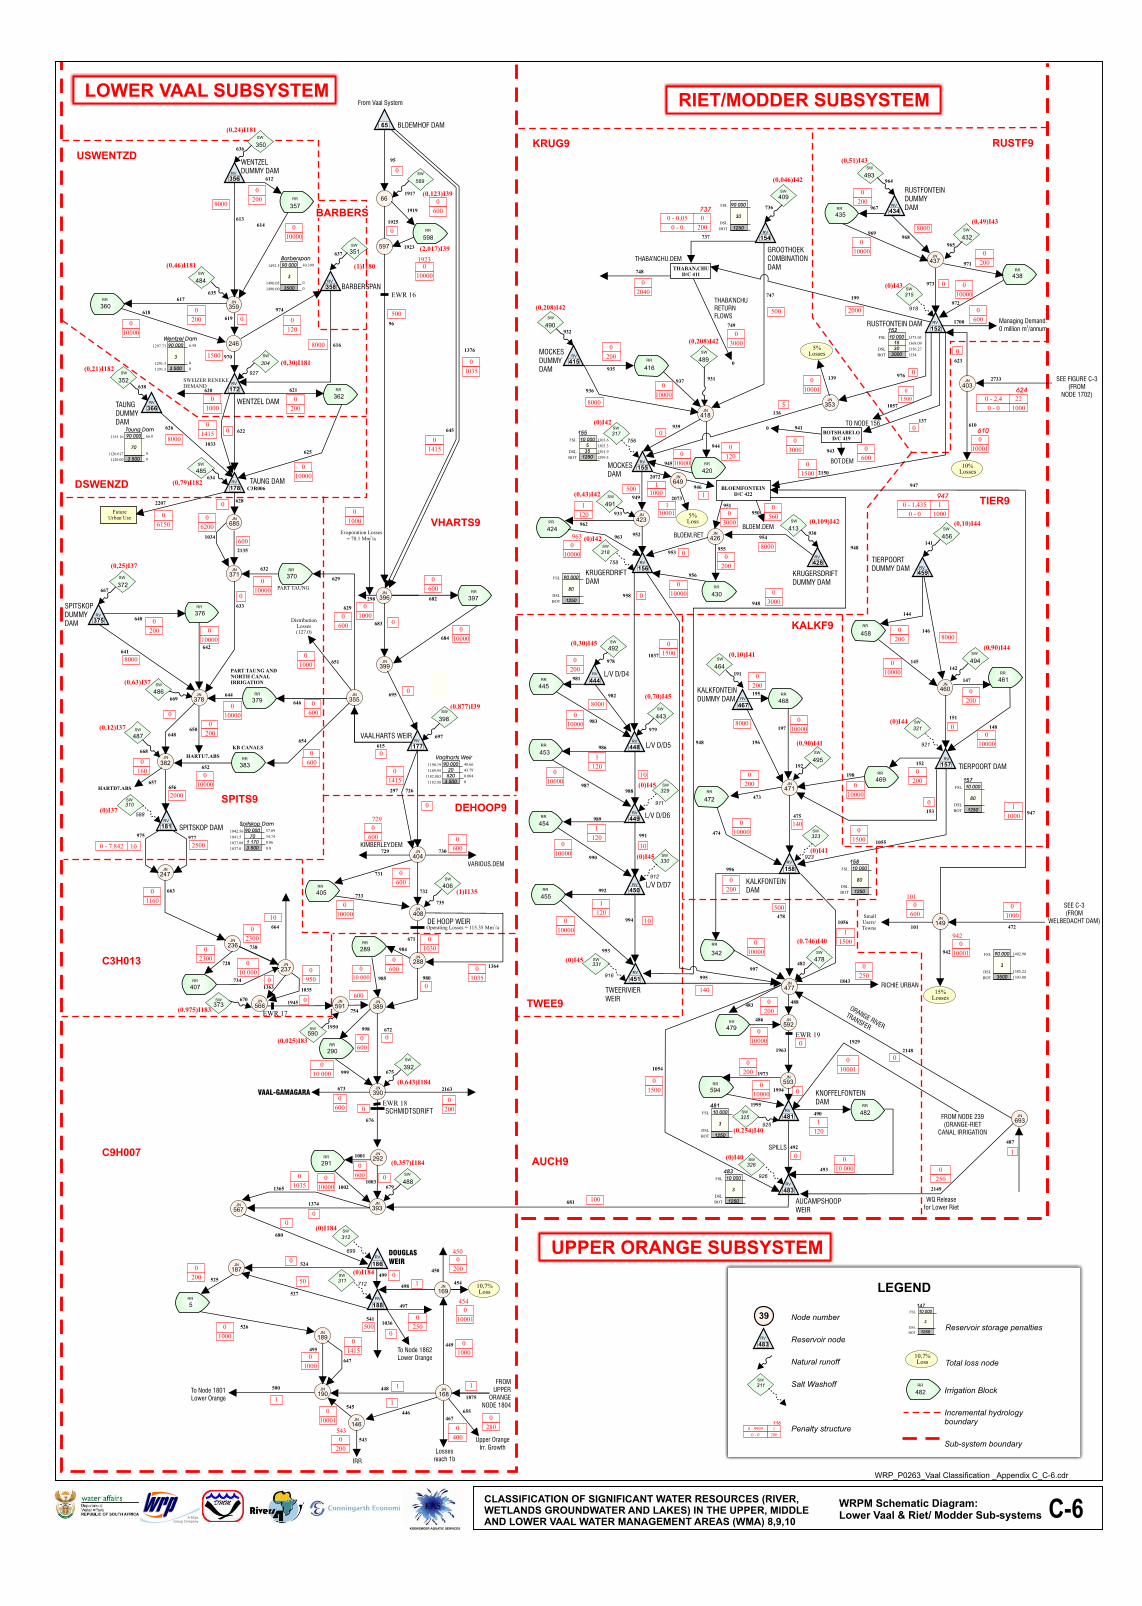
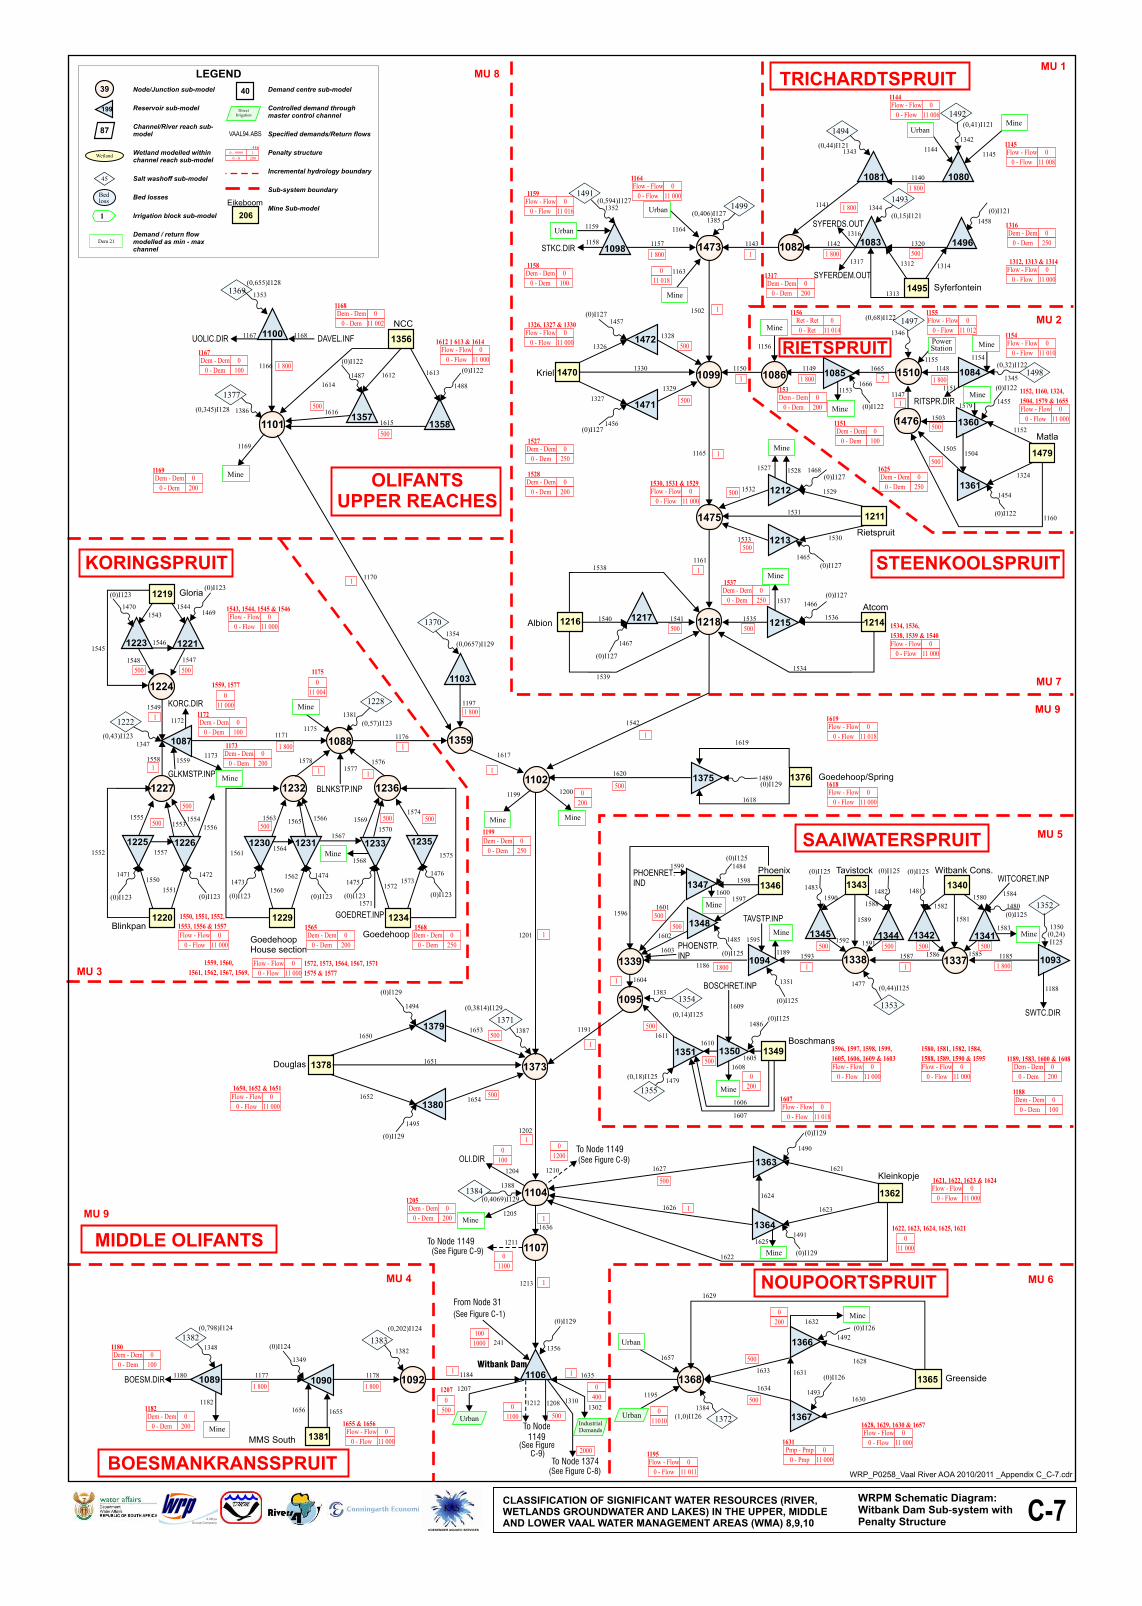

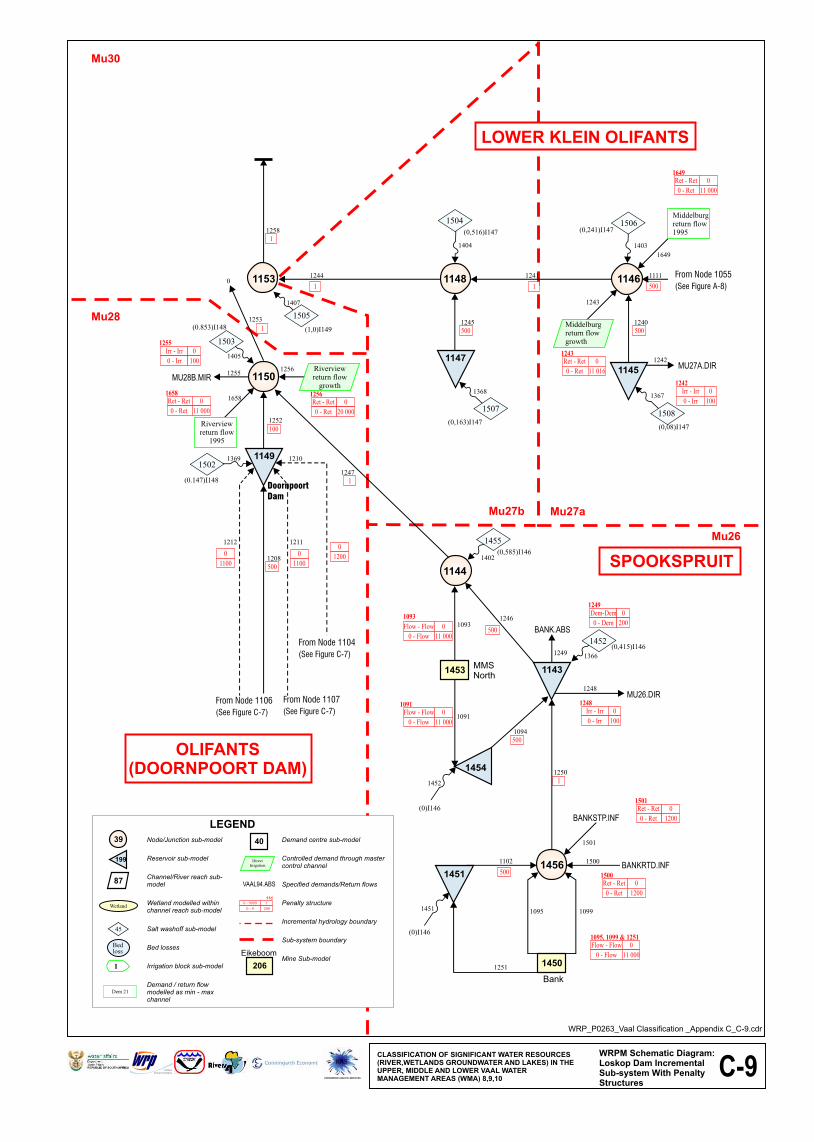

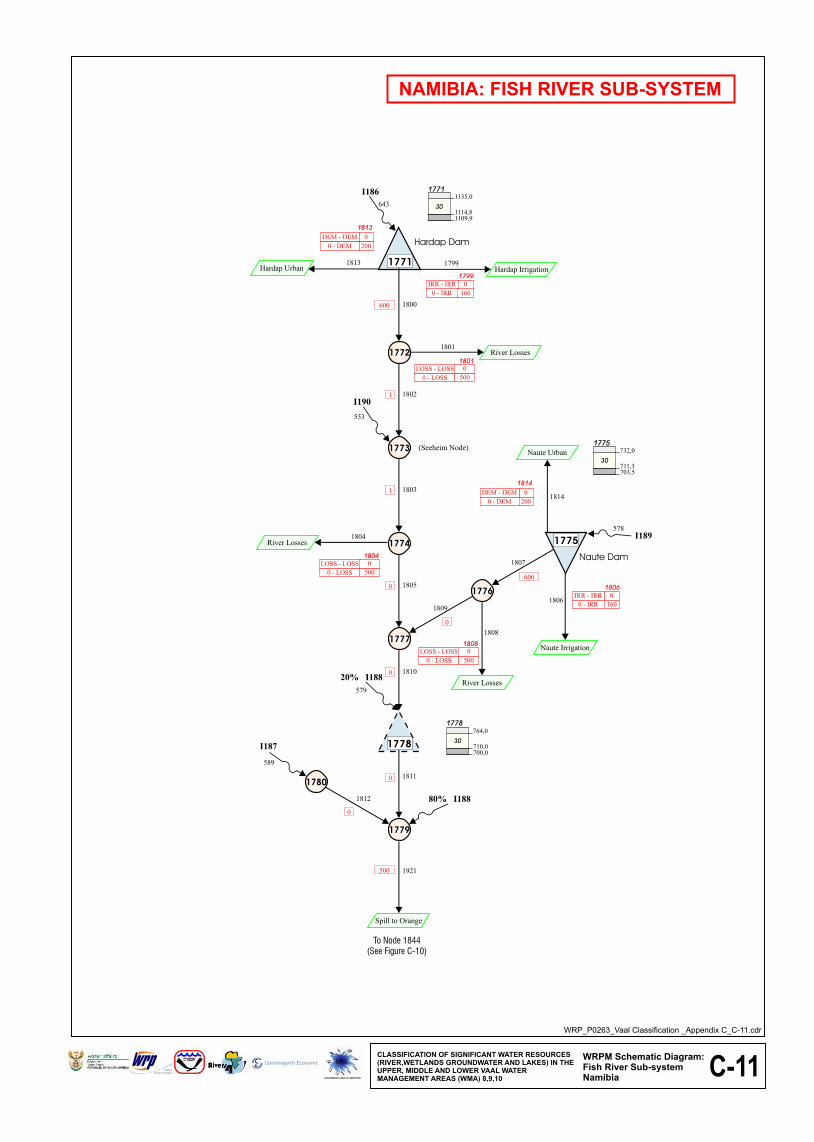
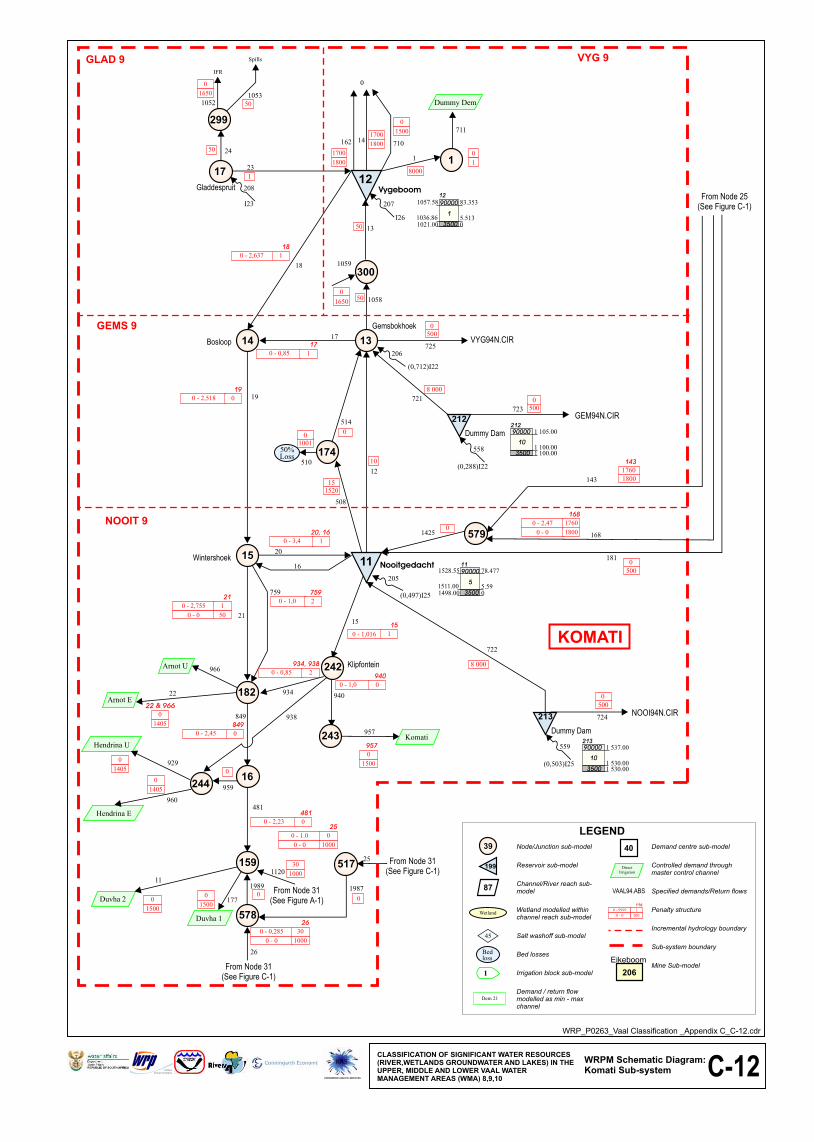
Status Quo Report V13_1.docx September 2011
Appendix D:
Water Resource Classification System Guidelines:
Seven Step Diagram

Status Quo Report V13_1.docx September 2011
Figure D-1: Seven Step Diagram of the WRCS Guidelines

Status Quo Report V13_1.docx September 2011
Appendix E:
Description of the Integrated Vaal River System
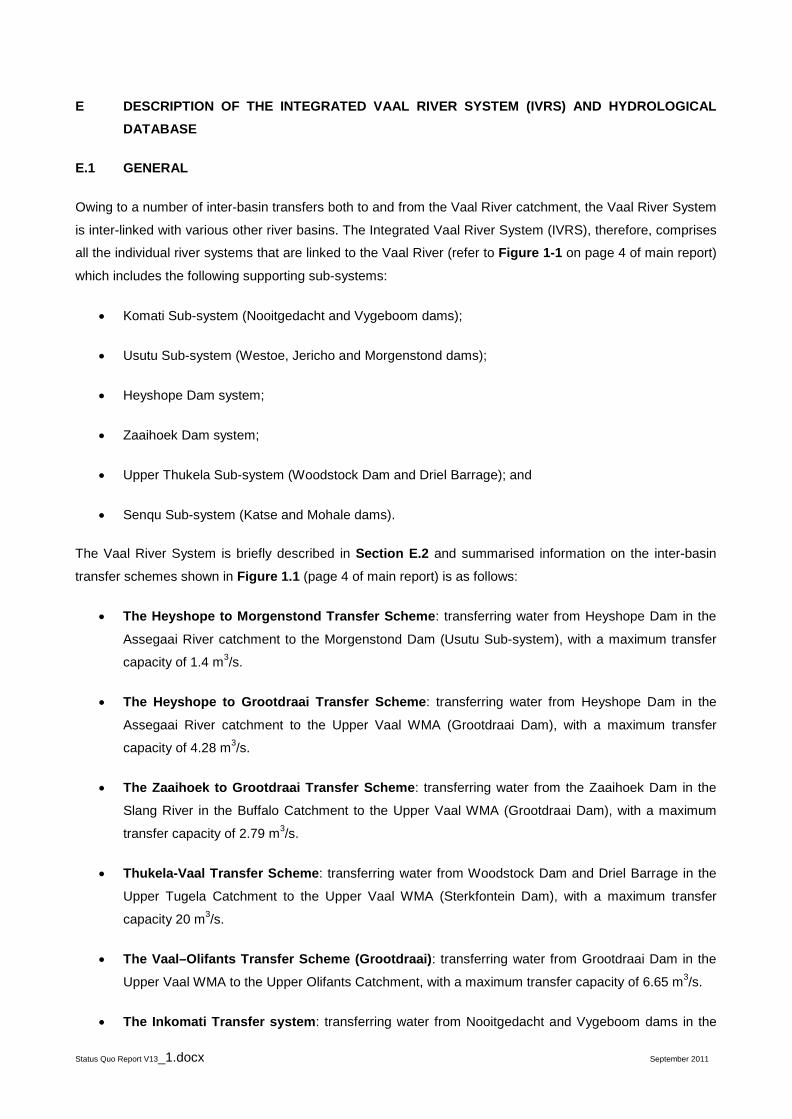
Status Quo Report V13_1.docx September 2011
E DESCRIPTION OF THE INTEGRATED VAAL RIVER SYSTEM (IVRS) AND HYDROLOGICAL DATABASE
E.1 GENERAL
Owing to a number of inter-basin transfers both to and from the Vaal River catchment, the Vaal River System
is inter-linked with various other river basins. The Integrated Vaal River System (IVRS), therefore, comprises
all the individual river systems that are linked to the Vaal River (refer to Figure 1-1 on page 4 of main report)
which includes the following supporting sub-systems:
• Komati Sub-system (Nooitgedacht and Vygeboom dams);
• Usutu Sub-system (Westoe, Jericho and Morgenstond dams);
• Heyshope Dam system;
• Zaaihoek Dam system;
• Upper Thukela Sub-system (Woodstock Dam and Driel Barrage); and
• Senqu Sub-system (Katse and Mohale dams).
The Vaal River System is briefly described in Section E.2 and summarised information on the inter-basin
transfer schemes shown in Figure 1.1 (page 4 of main report) is as follows:
• The Heyshope to Morgenstond Transfer Scheme: transferring water from Heyshope Dam in the
Assegaai River catchment to the Morgenstond Dam (Usutu Sub-system), with a maximum transfer
capacity of 1.4 m3/s.
• The Heyshope to Grootdraai Transfer Scheme: transferring water from Heyshope Dam in the
Assegaai River catchment to the Upper Vaal WMA (Grootdraai Dam), with a maximum transfer
capacity of 4.28 m3/s.
• The Zaaihoek to Grootdraai Transfer Scheme: transferring water from the Zaaihoek Dam in the
Slang River in the Buffalo Catchment to the Upper Vaal WMA (Grootdraai Dam), with a maximum
transfer capacity of 2.79 m3/s.
• Thukela-Vaal Transfer Scheme: transferring water from Woodstock Dam and Driel Barrage in the
Upper Tugela Catchment to the Upper Vaal WMA (Sterkfontein Dam), with a maximum transfer
capacity 20 m3/s.
• The Vaal–Olifants Transfer Scheme (Grootdraai): transferring water from Grootdraai Dam in the
Upper Vaal WMA to the Upper Olifants Catchment, with a maximum transfer capacity of 6.65 m3/s.
• The Inkomati Transfer system: transferring water from Nooitgedacht and Vygeboom dams in the
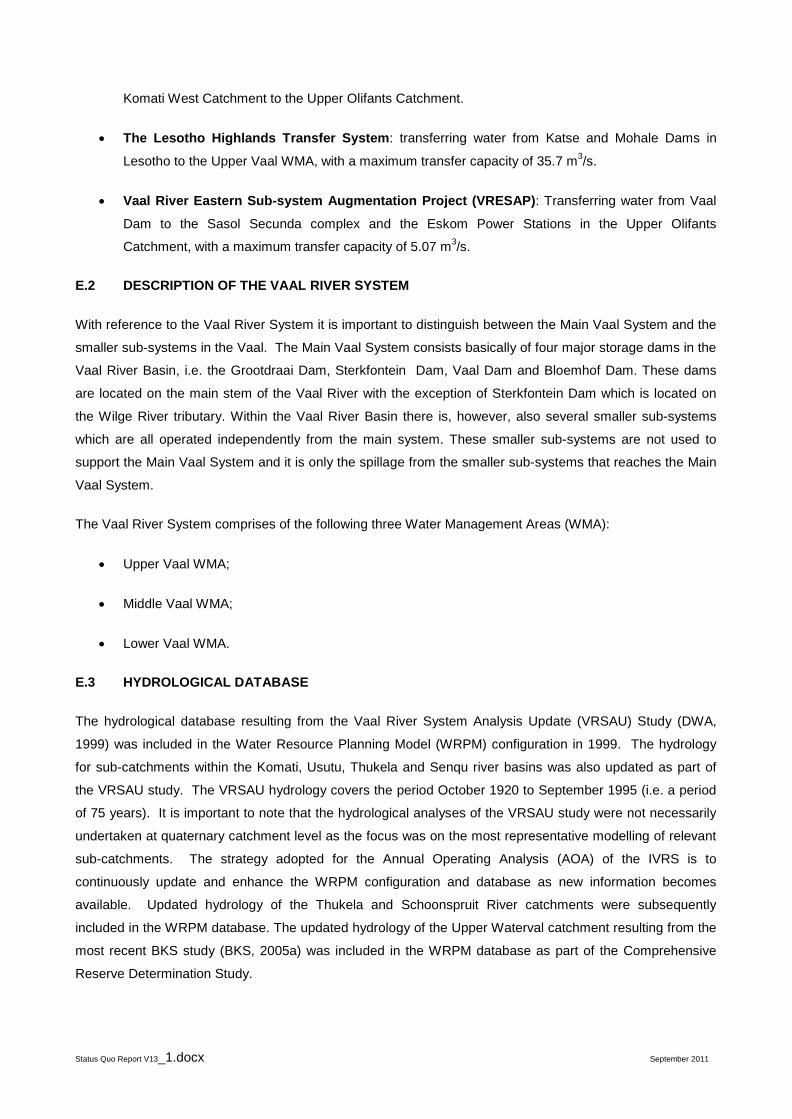
Status Quo Report V13_1.docx September 2011
Komati West Catchment to the Upper Olifants Catchment.
• The Lesotho Highlands Transfer System: transferring water from Katse and Mohale Dams in
Lesotho to the Upper Vaal WMA, with a maximum transfer capacity of 35.7 m3/s.
• Vaal River Eastern Sub-system Augmentation Project (VRESAP): Transferring water from Vaal
Dam to the Sasol Secunda complex and the Eskom Power Stations in the Upper Olifants
Catchment, with a maximum transfer capacity of 5.07 m3/s.
E.2 DESCRIPTION OF THE VAAL RIVER SYSTEM
With reference to the Vaal River System it is important to distinguish between the Main Vaal System and the
smaller sub-systems in the Vaal. The Main Vaal System consists basically of four major storage dams in the
Vaal River Basin, i.e. the Grootdraai Dam, Sterkfontein Dam, Vaal Dam and Bloemhof Dam. These dams
are located on the main stem of the Vaal River with the exception of Sterkfontein Dam which is located on
the Wilge River tributary. Within the Vaal River Basin there is, however, also several smaller sub-systems
which are all operated independently from the main system. These smaller sub-systems are not used to
support the Main Vaal System and it is only the spillage from the smaller sub-systems that reaches the Main
Vaal System.
The Vaal River System comprises of the following three Water Management Areas (WMA):
• Upper Vaal WMA;
• Middle Vaal WMA;
• Lower Vaal WMA.
E.3 HYDROLOGICAL DATABASE
The hydrological database resulting from the Vaal River System Analysis Update (VRSAU) Study (DWA,
1999) was included in the Water Resource Planning Model (WRPM) configuration in 1999. The hydrology
for sub-catchments within the Komati, Usutu, Thukela and Senqu river basins was also updated as part of
the VRSAU study. The VRSAU hydrology covers the period October 1920 to September 1995 (i.e. a period
of 75 years). It is important to note that the hydrological analyses of the VRSAU study were not necessarily
undertaken at quaternary catchment level as the focus was on the most representative modelling of relevant
sub-catchments. The strategy adopted for the Annual Operating Analysis (AOA) of the IVRS is to
continuously update and enhance the WRPM configuration and database as new information becomes
available. Updated hydrology of the Thukela and Schoonspruit River catchments were subsequently
included in the WRPM database. The updated hydrology of the Upper Waterval catchment resulting from the
most recent BKS study (BKS, 2005a) was included in the WRPM database as part of the Comprehensive
Reserve Determination Study.
Status Quo Report V13_1.docx September 2011
E.4 WATER REQUIREMENTS
The water requirement projections of water users in the IVRS are updated on an annual basis as part of the
Vaal River Annual Operating Analysis (AOA). Water requirement projections of bulk water users (Rand
Water, Midvaal Water Company and Sedibeng Water) and large industrial users (Eskom, Sasol and Mittal
Steel) are updated on a regular basis by these users themselves. The projections of other water use sectors
are updated as new information becomes available from more recent assessments.
Information on water requirements and return flows is captured within a database spreadsheet. Information is
available for so-called demand centres and is summarised within the context of sub-systems and user
groups rather than at quaternary catchment level.
The operation of the IVRS system is based on the principle that demands are restricted during severe
drought events. The objective of these restrictions is to reduce supply to less essential use to be able to
protect the assurance of supply to more essential use. The basis on which restrictions are implemented is
defined by means of the user priority classification definition.
The user priority classification definition requires that the different water users be grouped together into user
categories and these categories should be classified according to priority for water supply. The four user
categories that were considered for the IVRS are Domestic, Industrial, Strategic Industries and Irrigation.
The four user categories were each split into three different levels of assurance of supply namely a Low,
Medium and High priority level.
Status Quo Report V13_1.docx September 2011
Appendix F:
Summary of Water Requirement Projections
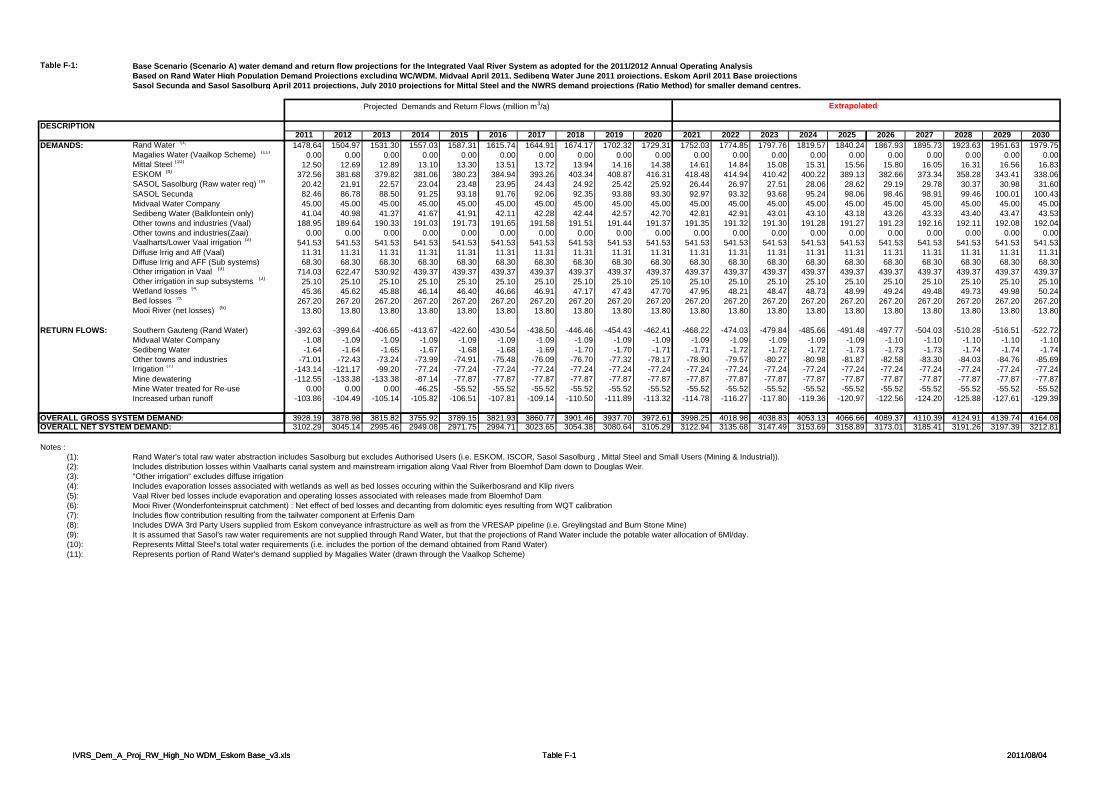
Table F-1: Base Scenario (Scenario A) water demand and return flow projections for the Integrated Vaal River System as adopted for the 2011/2012 Annual Operating Analysis Based on Rand Water High Population Demand Projections excluding WC/WDM, Midvaal April 2011, Sedibeng Water June 2011 projections, Eskom April 2011 Base projectionsSasol Secunda and Sasol Sasolburg April 2011 projections, July 2010 projections for Mittal Steel and the NWRS demand projections (Ratio Method) for smaller demand centres.
Projected Demands and Return Flows (million m3/a) Extrapolated
DESCRIPTION2011 2012 2013 2014 2015 2016 2017 2018 2019 2020 2021 2022 2023 2024 2025 2026 2027 2028 2029 2030
DEMANDS: Rand Water (1) 1478.64 1504.97 1531.30 1557.03 1587.31 1615.74 1644.91 1674.17 1702.32 1729.31 1752.03 1774.85 1797.76 1819.57 1840.24 1867.93 1895.73 1923.63 1951.63 1979.75Magalies Water (Vaalkop Scheme) (11) 0.00 0.00 0.00 0.00 0.00 0.00 0.00 0.00 0.00 0.00 0.00 0.00 0.00 0.00 0.00 0.00 0.00 0.00 0.00 0.00Mittal Steel (10) 12.50 12.69 12.89 13.10 13.30 13.51 13.72 13.94 14.16 14.38 14.61 14.84 15.08 15.31 15.56 15.80 16.05 16.31 16.56 16.83ESKOM (8) 372.56 381.68 379.82 381.06 380.23 384.94 393.26 403.34 408.87 416.31 418.48 414.94 410.42 400.22 389.13 382.66 373.34 358.28 343.41 338.06SASOL Sasolburg (Raw water req) (9) 20.42 21.91 22.57 23.04 23.48 23.95 24.43 24.92 25.42 25.92 26.44 26.97 27.51 28.06 28.62 29.19 29.78 30.37 30.98 31.60SASOL Secunda 82.46 86.78 88.50 91.25 93.18 91.76 92.06 92.35 93.88 93.30 92.97 93.32 93.68 95.24 98.06 98.46 98.91 99.46 100.01 100.43Midvaal Water Company 45.00 45.00 45.00 45.00 45.00 45.00 45.00 45.00 45.00 45.00 45.00 45.00 45.00 45.00 45.00 45.00 45.00 45.00 45.00 45.00Sedibeng Water (Balkfontein only) 41.04 40.98 41.37 41.67 41.91 42.11 42.28 42.44 42.57 42.70 42.81 42.91 43.01 43.10 43.18 43.26 43.33 43.40 43.47 43.53Other towns and industries (Vaal) 188.95 189.64 190.33 191.03 191.73 191.65 191.58 191.51 191.44 191.37 191.35 191.32 191.30 191.28 191.27 191.23 192.16 192.11 192.08 192.04Other towns and industries(Zaai) 0.00 0.00 0.00 0.00 0.00 0.00 0.00 0.00 0.00 0.00 0.00 0.00 0.00 0.00 0.00 0.00 0.00 0.00 0.00 0.00Vaalharts/Lower Vaal irrigation (2) 541.53 541.53 541.53 541.53 541.53 541.53 541.53 541.53 541.53 541.53 541.53 541.53 541.53 541.53 541.53 541.53 541.53 541.53 541.53 541.53Diffuse Irrig and Aff (Vaal) 11.31 11.31 11.31 11.31 11.31 11.31 11.31 11.31 11.31 11.31 11.31 11.31 11.31 11.31 11.31 11.31 11.31 11.31 11.31 11.31Diffuse Irrig and AFF (Sub systems) 68.30 68.30 68.30 68.30 68.30 68.30 68.30 68.30 68.30 68.30 68.30 68.30 68.30 68.30 68.30 68.30 68.30 68.30 68.30 68.30Other irrigation in Vaal (3) 714.03 622.47 530.92 439.37 439.37 439.37 439.37 439.37 439.37 439.37 439.37 439.37 439.37 439.37 439.37 439.37 439.37 439.37 439.37 439.37Other irrigation in sup subsystems (3) 25.10 25.10 25.10 25.10 25.10 25.10 25.10 25.10 25.10 25.10 25.10 25.10 25.10 25.10 25.10 25.10 25.10 25.10 25.10 25.10Wetland losses (4) 45.36 45.62 45.88 46.14 46.40 46.66 46.91 47.17 47.43 47.70 47.95 48.21 48.47 48.73 48.99 49.24 49.48 49.73 49.98 50.24Bed losses (5) 267.20 267.20 267.20 267.20 267.20 267.20 267.20 267.20 267.20 267.20 267.20 267.20 267.20 267.20 267.20 267.20 267.20 267.20 267.20 267.20Mooi River (net losses) (6) 13.80 13.80 13.80 13.80 13.80 13.80 13.80 13.80 13.80 13.80 13.80 13.80 13.80 13.80 13.80 13.80 13.80 13.80 13.80 13.80
RETURN FLOWS: Southern Gauteng (Rand Water) -392.63 -399.64 -406.65 -413.67 -422.60 -430.54 -438.50 -446.46 -454.43 -462.41 -468.22 -474.03 -479.84 -485.66 -491.48 -497.77 -504.03 -510.28 -516.51 -522.72Midvaal Water Company -1.08 -1.09 -1.09 -1.09 -1.09 -1.09 -1.09 -1.09 -1.09 -1.09 -1.09 -1.09 -1.09 -1.09 -1.09 -1.10 -1.10 -1.10 -1.10 -1.10Sedibeng Water -1.64 -1.64 -1.65 -1.67 -1.68 -1.68 -1.69 -1.70 -1.70 -1.71 -1.71 -1.72 -1.72 -1.72 -1.73 -1.73 -1.73 -1.74 -1.74 -1.74Other towns and industries -71.01 -72.43 -73.24 -73.99 -74.91 -75.48 -76.09 -76.70 -77.32 -78.17 -78.90 -79.57 -80.27 -80.98 -81.87 -82.58 -83.30 -84.03 -84.76 -85.69Irrigation (7) -143.14 -121.17 -99.20 -77.24 -77.24 -77.24 -77.24 -77.24 -77.24 -77.24 -77.24 -77.24 -77.24 -77.24 -77.24 -77.24 -77.24 -77.24 -77.24 -77.24Mine dewatering -112.55 -133.38 -133.38 -87.14 -77.87 -77.87 -77.87 -77.87 -77.87 -77.87 -77.87 -77.87 -77.87 -77.87 -77.87 -77.87 -77.87 -77.87 -77.87 -77.87Mine Water treated for Re-use 0.00 0.00 0.00 -46.25 -55.52 -55.52 -55.52 -55.52 -55.52 -55.52 -55.52 -55.52 -55.52 -55.52 -55.52 -55.52 -55.52 -55.52 -55.52 -55.52Increased urban runoff -103.86 -104.49 -105.14 -105.82 -106.51 -107.81 -109.14 -110.50 -111.89 -113.32 -114.78 -116.27 -117.80 -119.36 -120.97 -122.56 -124.20 -125.88 -127.61 -129.39
OVERALL GROSS SYSTEM DEMAND: 3928 19 3878 98 3815 82 3755 92 3789 15 3821 93 3860 77 3901 46 3937 70 3972 61 3998 25 4018 98 4038 83 4053 13 4066 66 4089 37 4110 39 4124 91 4139 74 4164 08
IVRS_Dem_A_Proj_RW_High_No WDM_Eskom Base_v3.xls Table F-1 2011/08/04
OVERALL GROSS SYSTEM DEMAND: 3928.19 3878.98 3815.82 3755.92 3789.15 3821.93 3860.77 3901.46 3937.70 3972.61 3998.25 4018.98 4038.83 4053.13 4066.66 4089.37 4110.39 4124.91 4139.74 4164.08OVERALL NET SYSTEM DEMAND: 3102.29 3045.14 2995.46 2949.08 2971.75 2994.71 3023.65 3054.38 3080.64 3105.29 3122.94 3135.68 3147.49 3153.69 3158.89 3173.01 3185.41 3191.26 3197.39 3212.81
Notes : (1): Rand Water's total raw water abstraction includes Sasolburg but excludes Authorised Users (i.e. ESKOM, ISCOR, Sasol Sasolburg , Mittal Steel and Small Users (Mining & Industrial)). (2): Includes distribution losses within Vaalharts canal system and mainstream irrigation along Vaal River from Bloemhof Dam down to Douglas Weir. (3): "Other irrigation" excludes diffuse irrigation (4): Includes evaporation losses associated with wetlands as well as bed losses occuring within the Suikerbosrand and Klip rivers (5): Vaal River bed losses include evaporation and operating losses associated with releases made from Bloemhof Dam (6): Mooi River (Wonderfonteinspruit catchment) : Net effect of bed losses and decanting from dolomitic eyes resulting from WQT calibration (7): Includes flow contribution resulting from the tailwater component at Erfenis Dam (8): Includes DWA 3rd Party Users supplied from Eskom conveyance infrastructure as well as from the VRESAP pipeline (i.e. Greylingstad and Burn Stone Mine) (9): It is assumed that Sasol's raw water requirements are not supplied through Rand Water, but that the projections of Rand Water include the potable water allocation of 6Ml/day. (10): Represents Mittal Steel's total water requirements (i.e. includes the portion of the demand obtained from Rand Water) (11): Represents portion of Rand Water's demand supplied by Magalies Water (drawn through the Vaalkop Scheme)
IVRS_Dem_A_Proj_RW_High_No WDM_Eskom Base_v3.xls Table F-1 2011/08/04

Table F-2 : Base Scenario (Scenario A) water demand and return flow projections for the Integrated Vaal River System as adopted for the 2011/2012 Annual Operating Analysis Based on Rand Water High Population Demand Projections excluding WC/WDM, Midvaal April 2011, Sedibeng Water June 2011 projections, Eskom April 2011 Base projectionsSasol Secunda and Sasol Sasolburg April 2011 projections, July 2010 projections for Mittal Steel and the NWRS demand projections (Ratio Method) for smaller demand centres.
Projections (Million m3/a)
KOMATI SUB-SYSTEM2011 2012 2013 2014 2015 2016 2017 2018 2019 2020 2021 2022 2023 2024 2025 2026 2027 2028 2029 2030
ESKOM(1): Komati Power Station 15.24 19.79 18.68 17.15 13.69 10.86 11.16 10.94 11.10 11.39 11.53 11.39 11.20 10.08 6.42 2.77 2.62 2.62 2.62 2.62Arnot 29.91 30.47 30.34 30.24 30.47 31.42 31.45 31.34 31.24 30.77 29.84 29.28 28.15 25.63 23.64 23.64 22.74 19.11 14.73 13.32Hendrina 29.00 28.31 29.08 29.25 30.30 31.53 31.42 31.73 31.46 31.25 29.56 25.98 22.83 19.21 17.29 14.95 12.23 9.47 5.26 1.29Duvha 1 (Groot) - excess(2) 23.67 28.90 31.56 31.56 31.56 31.56 31.56 31.56 31.56 31.56 31.56 31.56 31.56 31.56 31.56 31.56 31.56 31.56 31.56 31.56Duvha 2 (Komati/Usutu) 15.52 14.43 10.27 10.28 13.24 16.49 16.61 17.58 17.31 16.93 16.39 15.82 15.31 14.58 13.36 13.36 12.74 11.51 11.57 11.67New Stations 0.00 0.00 0.00 0.00 0.00 0.00 0.00 0.00 0.00 0.00 0.00 0.00 0.00 0.00 0.00 0.00 0.00 0.00 0.00 0.00DWAF 3rd Party Users along Komati Pipeline 7.14 7.14 7.14 7.14 7.14 7.14 7.14 7.14 7.14 7.14 7.14 7.14 7.14 7.14 7.14 7.14 7.14 7.14 7.14 7.14DWAF 3rd Party Users along Hendrina-Duvha Pipeline 5.07 5.08 5.09 5.11 5.12 5.12 5.13 5.13 5.13 5.14 5.14 5.15 5.16 5.17 5.18 5.18 5.18 5.18 5.18 5.17Other Users(3): Total DWAF 3rd Party Users 12.20 12.22 12.23 12.24 12.26 12.26 12.26 12.27 12.27 12.27 12.28 12.29 12.30 12.31 12.31 12.31 12.31 12.31 12.31 12.31
-12.20 -12.22 -12.23 -12.24 -12.26 -12.26 -12.26 -12.27 -12.27 -12.27 -12.28 -12.29 -12.30 -12.31 -12.31 -12.31 -12.31 -12.31 -12.31 -12.31
IRRIGATION: Nooitgedacht dummy dam 2.16 2.16 2.16 2.16 2.16 2.16 2.16 2.16 2.16 2.16 2.16 2.16 2.16 2.16 2.16 2.16 2.16 2.16 2.16 2.16Gemsbokhoek dummy dam 4.67 4.67 4.67 4.67 4.67 4.67 4.67 4.67 4.67 4.67 4.67 4.67 4.67 4.67 4.67 4.67 4.67 4.67 4.67 4.67Gemsbokhoek node 9.74 9.74 9.74 9.74 9.74 9.74 9.74 9.74 9.74 9.74 9.74 9.74 9.74 9.74 9.74 9.74 9.74 9.74 9.74 9.74
DIFFUSE: Gladdespruit Weir 0.00 0.00 0.00 0.00 0.00 0.00 0.00 0.00 0.00 0.00 0.00 0.00 0.00 0.00 0.00 0.00 0.00 0.00 0.00 0.00" 18.93 18.93 18.93 18.93 18.93 18.93 18.93 18.93 18.93 18.93 18.93 18.93 18.93 18.93 18.93 18.93 18.93 18.93 18.93 18.93Vygeboom Dam 2.85 2.85 2.85 2.85 2.85 2.85 2.85 2.85 2.85 2.85 2.85 2.85 2.85 2.85 2.85 2.85 2.85 2.85 2.85 2.85" 24.24 24.24 24.24 24.24 24.24 24.24 24.24 24.24 24.24 24.24 24.24 24.24 24.24 24.24 24.24 24.24 24.24 24.24 24.24 24.24Gemsbokhoek Weir 3.06 3.06 3.06 3.06 3.06 3.06 3.06 3.06 3.06 3.06 3.06 3.06 3.06 3.06 3.06 3.06 3.06 3.06 3.06 3.06" 0.23 0.23 0.23 0.23 0.23 0.23 0.23 0.23 0.23 0.23 0.23 0.23 0.23 0.23 0.23 0.23 0.23 0.23 0.23 0.23Nooitgedacht Dam 0.00 0.00 0.00 0.00 0.00 0.00 0.00 0.00 0.00 0.00 0.00 0.00 0.00 0.00 0.00 0.00 0.00 0.00 0.00 0.00" 0.08 0.08 0.08 0.08 0.08 0.08 0.08 0.08 0.08 0.08 0.08 0.08 0.08 0.08 0.08 0.08 0.08 0.08 0.08 0.08
Notes (1): The total ESKOM demand in the Komati System is allocated as follows: 1st 70 million m3/a on channel 11, 2nd 9 million m3/a on channel 177 and rest on channel 22. (2): Transfers from Grootdraai to Olifants. With present poor water quality in Witbank Dam, it is unlikely that more than 9 million m3/a will be transferred through channel 177. (3): Other users include DWAF third party users along the Hendrina-Duvha pipeline, as well as users supplied from Nooitgedacht and Vygeboom Dams. \...KOMATI SUB-SYSTEM
Projections (Million m3/a)
USUTU SUB-SYSTEM2011 2012 2013 2014 2015 2016 2017 2018 2019 2020 2021 2022 2023 2024 2025 2026 2027 2028 2029 2030
ESKOM: Camden 19.04 18.35 18.09 17.56 15.75 14.64 14.97 14.65 14.72 14.69 14.61 14.11 13.42 13.19 12.56 11.00 8.60 3.48 0.53 0.53Kriel_1 (Usutu-sup from Grootdraai) 39.92 40.77 41.90 41.24 41.17 41.83 42.45 42.45 42.77 42.89 42.13 41.58 40.82 40.82 40.82 40.82 40.82 39.78 35.87 32.22Kriel_2 (Grootdraai) 0.00 0.00 0.00 0.00 0.00 0.00 0.00 0.00 0.00 0.00 0.00 0.00 0.00 0.00 0.00 0.00 0.00 0.00 0.00 0.00Kriel (Total) 39.92 40.77 41.90 41.24 41.17 41.83 42.45 42.45 42.77 42.89 42.13 41.58 40.82 40.82 40.82 40.82 40.82 39.78 35.87 32.22Kriel (Total) -39.92 -40.77 -41.90 -41.24 -41.17 -41.83 -42.45 -42.45 -42.77 -42.89 -42.13 -41.58 -40.82 -40.82 -40.82 -40.82 -40.82 -39.78 -35.87 -32.22Matla 1 (Usutu capacity) 18.16 17.23 16.14 16.94 17.14 16.35 13.67 9.54 9.18 8.86 9.23 9.74 10.18 10.04 10.22 10.22 10.23 11.36 15.39 19.04Matla 2 (Groot) - excess(1) 29.87 31.21 32.54 33.84 35.30 36.85 42.92 50.34 53.60 56.62 56.50 55.92 54.48 52.18 50.58 50.56 49.87 47.53 43.42 39.45Matla (total) : Including Kusile ) New CF_1 PS 48.03 48.45 48.68 50.78 52.44 53.20 56.59 59.88 62.78 65.48 65.73 65.65 64.66 62.22 60.80 60.78 60.09 58.89 58.81 58.48Matla (total) -48.03 -48.45 -48.68 -50.78 -52.44 -53.20 -56.59 -59.88 -62.78 -65.48 -65.73 -65.65 -64.66 -62.22 -60.80 -60.78 -60.09 -58.89 -58.81 -58.48Kendal_1 (Usutu-sup from Grootdraai) 3.73 3.80 3.77 3.63 3.50 3.63 5.69 9.81 9.86 10.06 10.45 10.49 10.81 10.95 10.77 10.77 10.76 10.68 10.55 10.55Kendal_2 (Grootdraai) 0.00 0.00 0.00 0.00 0.00 0.00 0.00 0.00 0.00 0.00 0.00 0.00 0.00 0.00 0.00 0.00 0.00 0.00 0.00 0.00Kendal (Total) 3.73 3.80 3.77 3.63 3.50 3.63 5.69 9.81 9.86 10.06 10.45 10.49 10.81 10.95 10.77 10.77 10.76 10.68 10.55 10.55Kendal (Total) -3.73 -3.80 -3.77 -3.63 -3.50 -3.63 -5.69 -9.81 -9.86 -10.06 -10.45 -10.49 -10.81 -10.95 -10.77 -10.77 -10.76 -10.68 -10.55 -10.55New Stations 0.00 0.00 0.00 0.00 0.00 0.00 0.00 0.00 0.00 0.00 0.00 0.00 0.00 0.00 0.00 0.00 0.00 0.00 0.00 0.00Other Users(2) 7.11 7.20 7.29 7.38 7.47 7.51 7.55 7.59 7.63 7.67 7.71 7.75 7.79 7.83 7.88 7.89 7.91 7.93 7.94 7.96
DIFFUSE: Westoe Dam 0.00 0.00 0.00 0.00 0.00 0.00 0.00 0.00 0.00 0.00 0.00 0.00 0.00 0.00 0.00 0.00 0.00 0.00 0.00 0.00 " 2.64 2.64 2.64 2.64 2.64 2.64 2.64 2.64 2.64 2.64 2.64 2.64 2.64 2.64 2.64 2.64 2.64 2.64 2.64 2.64Jericho Dam 0.00 0.00 0.00 0.00 0.00 0.00 0.00 0.00 0.00 0.00 0.00 0.00 0.00 0.00 0.00 0.00 0.00 0.00 0.00 0.00 " 1.28 1.28 1.28 1.28 1.28 1.28 1.28 1.28 1.28 1.28 1.28 1.28 1.28 1.28 1.28 1.28 1.28 1.28 1.28 1.28Morgenstond Dam 1.53 1.53 1.53 1.53 1.53 1.53 1.53 1.53 1.53 1.53 1.53 1.53 1.53 1.53 1.53 1.53 1.53 1.53 1.53 1.53 " 6.31 6.31 6.31 6.31 6.31 6.31 6.31 6.31 6.31 6.31 6.31 6.31 6.31 6.31 6.31 6.31 6.31 6.31 6.31 6.31Churchill Weir 0.00 0.00 0.00 0.00 0.00 0.00 0.00 0.00 0.00 0.00 0.00 0.00 0.00 0.00 0.00 0.00 0.00 0.00 0.00 0.00 " 0.00 0.00 0.00 0.00 0.00 0.00 0.00 0.00 0.00 0.00 0.00 0.00 0.00 0.00 0.00 0.00 0.00 0.00 0.00 0.00
Notes (1): Transfers from Grootdraai to Olifants through channel 10. (2): Other users include DWAF third party users along the following pipelines: Jericho-Camden-Lilliput and Heyshope-Grootdraai. \...USUTU SUB-SYSTEM
IVRS_Dem_A_Proj_RW_High_No WDM_Eskom Base_v3.xls Table F-2 2011/08/04
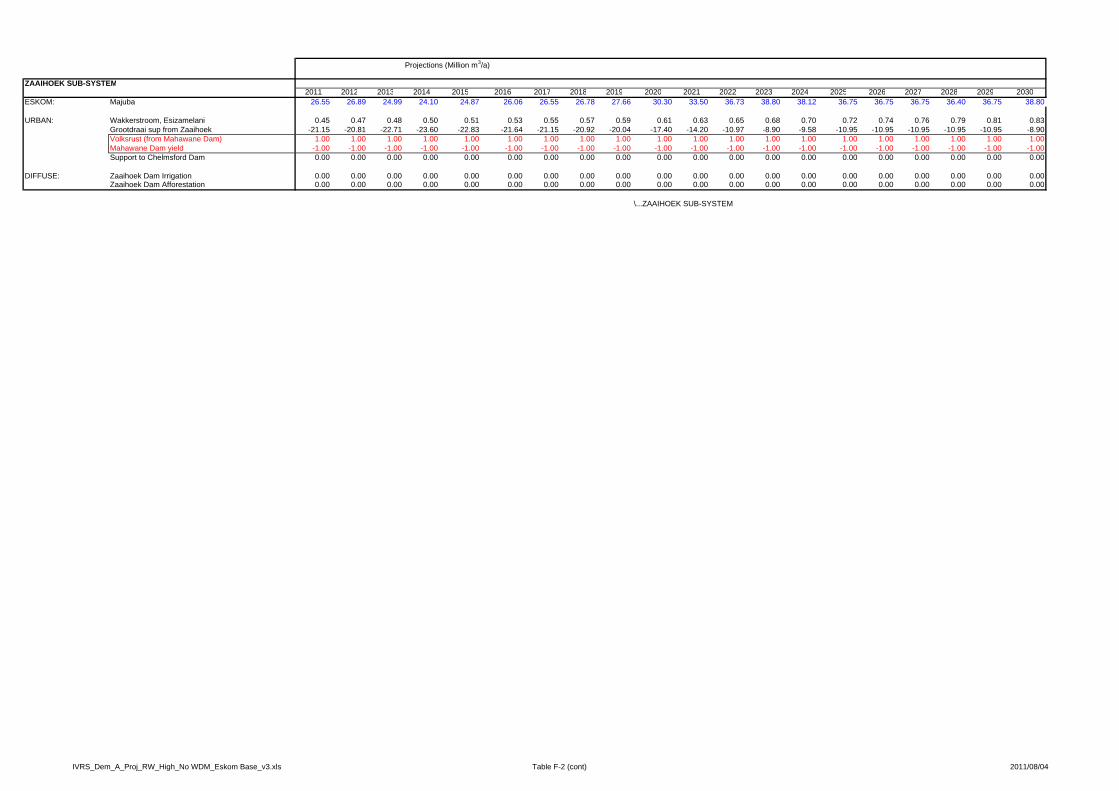
Projections (Million m3/a)
ZAAIHOEK SUB-SYSTEM2011 2012 2013 2014 2015 2016 2017 2018 2019 2020 2021 2022 2023 2024 2025 2026 2027 2028 2029 2030
ESKOM: Majuba 26.55 26.89 24.99 24.10 24.87 26.06 26.55 26.78 27.66 30.30 33.50 36.73 38.80 38.12 36.75 36.75 36.75 36.40 36.75 38.80
URBAN: Wakkerstroom, Esizamelani 0.45 0.47 0.48 0.50 0.51 0.53 0.55 0.57 0.59 0.61 0.63 0.65 0.68 0.70 0.72 0.74 0.76 0.79 0.81 0.83Grootdraai sup from Zaaihoek -21.15 -20.81 -22.71 -23.60 -22.83 -21.64 -21.15 -20.92 -20.04 -17.40 -14.20 -10.97 -8.90 -9.58 -10.95 -10.95 -10.95 -10.95 -10.95 -8.90Volksrust (from Mahawane Dam) 1.00 1.00 1.00 1.00 1.00 1.00 1.00 1.00 1.00 1.00 1.00 1.00 1.00 1.00 1.00 1.00 1.00 1.00 1.00 1.00Mahawane Dam yield -1.00 -1.00 -1.00 -1.00 -1.00 -1.00 -1.00 -1.00 -1.00 -1.00 -1.00 -1.00 -1.00 -1.00 -1.00 -1.00 -1.00 -1.00 -1.00 -1.00Support to Chelmsford Dam 0.00 0.00 0.00 0.00 0.00 0.00 0.00 0.00 0.00 0.00 0.00 0.00 0.00 0.00 0.00 0.00 0.00 0.00 0.00 0.00
DIFFUSE: Zaaihoek Dam Irrigation 0.00 0.00 0.00 0.00 0.00 0.00 0.00 0.00 0.00 0.00 0.00 0.00 0.00 0.00 0.00 0.00 0.00 0.00 0.00 0.00Zaaihoek Dam Afforestation 0.00 0.00 0.00 0.00 0.00 0.00 0.00 0.00 0.00 0.00 0.00 0.00 0.00 0.00 0.00 0.00 0.00 0.00 0.00 0.00
\...ZAAIHOEK SUB-SYSTEM
IVRS_Dem_A_Proj_RW_High_No WDM_Eskom Base_v3.xls Table F-2 (cont) 2011/08/04

Projections (Million m3/a)
GROOTDRAAI SUB-SYSTEM2011 2012 2013 2014 2015 2016 2017 2018 2019 2020 2021 2022 2023 2024 2025 2026 2027 2028 2029 2030
ESKOM: Tutuka 36.93 35.68 33.48 33.47 33.34 33.01 33.46 34.21 34.38 36.16 38.49 38.42 38.82 39.40 39.40 39.40 39.40 39.40 39.40 39.40Other Users(1) 1.00 1.00 1.00 1.00 1.00 1.00 1.00 1.00 1.00 1.00 1.00 1.00 1.00 1.00 1.00 1.00 1.00 1.00 1.00 1.00
SASOL Secunda: 82.46 86.78 88.50 91.25 93.18 91.76 92.06 92.35 93.88 93.30 92.97 93.32 93.68 95.24 98.06 98.46 98.91 99.46 100.01 100.43VRESAP Users Greylingstad 0.69 0.69 0.69 0.69 0.69 0.69 0.69 0.69 0.69 0.69 0.69 0.69 0.69 0.69 0.69 0.69 0.69 0.69 0.69 0.69
Burn Stone Mine and Others 2.86 4.08 5.82 8.31 8.31 8.31 8.31 8.31 8.31 8.31 8.31 8.31 8.31 8.31 8.31 8.31 8.31 8.31 8.31 8.31
URBAN: Lekwa LM (Former Standerton TLC) 10.57 10.70 10.84 10.97 11.11 11.16 11.21 11.25 11.30 11.35 11.42 11.48 11.55 11.62 11.69 11.72 11.75 11.77 11.80 11.82Amersfoort (const.1994 demand) 0.17 0.17 0.17 0.17 0.17 0.17 0.17 0.17 0.17 0.17 0.17 0.17 0.17 0.17 0.17 0.17 0.17 0.17 0.17 0.17Amersfoort (growth only) 0.74 0.74 0.75 0.75 0.76 0.77 0.78 0.78 0.79 0.80 0.81 0.82 0.82 0.83 0.84 0.85 0.86 0.87 0.88 0.89Amersfoort (total) 0.91 0.91 0.92 0.92 0.93 0.94 0.95 0.95 0.96 0.97 0.98 0.99 0.99 1.00 1.01 1.02 1.03 1.04 1.05 1.06Amersfoort (total) -0.91 -0.91 -0.92 -0.92 -0.93 -0.94 -0.95 -0.95 -0.96 -0.97 -0.98 -0.99 -0.99 -1.00 -1.01 -1.02 -1.03 -1.04 -1.05 -1.06Breyten (Yield from own sources) 0.33 0.33 0.33 0.33 0.33 0.33 0.33 0.33 0.33 0.33 0.33 0.33 0.33 0.33 0.33 0.33 0.33 0.33 0.33 0.33Breyten (growth only): Supplied from Camden pipeline) 0.79 0.80 0.81 0.82 0.83 0.83 0.84 0.84 0.84 0.85 0.84 0.83 0.82 0.82 0.81 0.81 0.81 0.80 0.80 0.80Breyten (total) 1.12 1.13 1.14 1.15 1.16 1.16 1.17 1.17 1.17 1.18 1.17 1.16 1.15 1.15 1.14 1.14 1.14 1.13 1.13 1.13Breyten (total) -1.12 -1.13 -1.14 -1.15 -1.16 -1.16 -1.17 -1.17 -1.17 -1.18 -1.17 -1.16 -1.15 -1.15 -1.14 -1.14 -1.14 -1.13 -1.13 -1.13Msukaligwa LM (Former Ermelo TLC) (local sources) 2.04 2.04 2.04 2.04 2.04 2.04 2.04 2.04 2.04 2.04 2.04 2.04 2.04 2.04 2.04 2.04 2.04 2.04 2.04 2.04Msukaligwa LM (Former Ermelo TLC) (growth on pipel 2.25 2.31 2.37 2.42 2.48 2.51 2.53 2.56 2.58 2.61 2.65 2.69 2.73 2.77 2.81 2.82 2.83 2.84 2.86 2.87Msukaligwa LM (Former Ermelo TLC) (total) 4.29 4.35 4.41 4.46 4.52 4.55 4.57 4.60 4.62 4.65 4.69 4.73 4.77 4.81 4.85 4.86 4.87 4.88 4.90 4.91Msukaligwa LM (Former Ermelo TLC) (total) -4.29 -4.35 -4.41 -4.46 -4.52 -4.55 -4.57 -4.60 -4.62 -4.65 -4.69 -4.73 -4.77 -4.81 -4.85 -4.86 -4.87 -4.88 -4.90 -4.91Morgenzon (Demand supplied from own sources) 0.48 0.48 0.48 0.48 0.48 0.48 0.48 0.48 0.48 0.48 0.48 0.48 0.48 0.48 0.48 0.48 0.48 0.48 0.48 0.48Morgenzon (growth exceeding yield from own sources) 0.01 0.02 0.04 0.05 0.06 0.06 0.07 0.08 0.08 0.09 0.09 0.09 0.10 0.10 0.11 0.11 0.11 0.11 0.11 0.11Morgenzon (total) 0.49 0.50 0.52 0.53 0.54 0.54 0.55 0.56 0.56 0.57 0.57 0.57 0.58 0.58 0.59 0.59 0.59 0.59 0.59 0.59Morgenzon (total) -0.49 -0.50 -0.52 -0.53 -0.54 -0.54 -0.55 -0.56 -0.56 -0.57 -0.57 -0.57 -0.58 -0.58 -0.59 -0.59 -0.59 -0.59 -0.59 -0.59Daggakraal 1.18 1.21 1.23 1.26 1.28 1.27 1.26 1.24 1.23 1.22 1.20 1.18 1.17 1.15 1.13 1.11 1.09 1.08 1.06 1.04Driefontein 0.82 0.86 0.91 0.95 1.00 1.01 1.02 1.03 1.04 1.05 1.09 1.13 1.17 1.21 1.25 1.29 1.33 1.37 1.41 1.46
REGION B: Demand on own sources 75.98 75.86 75.74 75.62 75.50 75.50 75.50 75.50 75.50 75.50 75.50 75.50 75.50 75.50 75.50 75.50 75.50 75.50 75.50 75.50Part of increase(2)Losses on transfer 0.00 0.00 0.00 0.00 0.00 0.00 0.00 0.00 0.00 0.00 0.00 0.00 0.00 0.00 0.00 0.00 0.00 0.00 0.00 0.00Supply from own sources -75.98 -75.86 -75.74 -75.62 -75.50 -75.50 -75.50 -75.50 -75.50 -75.50 -75.50 -75.50 -75.50 -75.50 -75.50 -75.50 -75.50 -75.50 -75.50 -75.50
IRRIGATION: Heyshope mainstream 1.71 1.71 1.71 1.71 1.71 1.71 1.71 1.71 1.71 1.71 1.71 1.71 1.71 1.71 1.71 1.71 1.71 1.71 1.71 1.71Heyshope dummy dam 6.82 6.82 6.82 6.82 6.82 6.82 6.82 6.82 6.82 6.82 6.82 6.82 6.82 6.82 6.82 6.82 6.82 6.82 6.82 6.82Grootdraai RE-EWR1 Mstr Irrig (RR368)-Unlawful Use 2.20 1.55 0.90 0.25 0.25 0.25 0.25 0.25 0.25 0.25 0.25 0.25 0.25 0.25 0.25 0.25 0.25 0.25 0.25 0.25Grootdraai RE-EWR1 Mstr Irrig (RR369)-Lawful Use 0.43 0.43 0.43 0.43 0.43 0.43 0.43 0.43 0.43 0.43 0.43 0.43 0.43 0.43 0.43 0.43 0.43 0.43 0.43 0.43Grootdraai EWR1 Mstr Irrig (RR1782)-Unlawful Use 14.09 9.93 5.77 1.61 1.61 1.61 1.61 1.61 1.61 1.61 1.61 1.61 1.61 1.61 1.61 1.61 1.61 1.61 1.61 1.61Grootdraai EWR1 Mstr Irrig (RR1800)-Lawful Use 7.70 7.70 7.70 7.70 7.70 7.70 7.70 7.70 7.70 7.70 7.70 7.70 7.70 7.70 7.70 7.70 7.70 7.70 7.70 7.70Grootdraai EWR2 Mstr Irrig (RR398)-Unlawful Use 6.33 4.46 2.59 0.72 0.72 0.72 0.72 0.72 0.72 0.72 0.72 0.72 0.72 0.72 0.72 0.72 0.72 0.72 0.72 0.72Grootdraai EWR2 Mstr Irrig (RR414)-Lawful Use 4.41 4.41 4.41 4.41 4.41 4.41 4.41 4.41 4.41 4.41 4.41 4.41 4.41 4.41 4.41 4.41 4.41 4.41 4.41 4.41
Original irrigation block Grootdraai mainstream (RR1800)- Lawful Use 12.53 12.53 12.53 12.53 12.53 12.53 12.53 12.53 12.53 12.53 12.53 12.53 12.53 12.53 12.53 12.53 12.53 12.53 12.53 12.53Original irrigation block Grootdraai mainstream (RR1782)- Sug 2005 - Lawful U 1.84 1.84 1.84 1.84 1.84 1.84 1.84 1.84 1.84 1.84 1.84 1.84 1.84 1.84 1.84 1.84 1.84 1.84 1.84 1.84
DIFFUSE: Heyshope Dam (Assegaai) 0.00 0.00 0.00 0.00 0.00 0.00 0.00 0.00 0.00 0.00 0.00 0.00 0.00 0.00 0.00 0.00 0.00 0.00 0.00 0.00 " 4.30 4.30 4.30 4.30 4.30 4.30 4.30 4.30 4.30 4.30 4.30 4.30 4.30 4.30 4.30 4.30 4.30 4.30 4.30 4.30Grootdraai Dam (RR12) 0.00 0.00 0.00 0.00 0.00 0.00 0.00 0.00 0.00 0.00 0.00 0.00 0.00 0.00 0.00 0.00 0.00 0.00 0.00 0.00 " 0.00 0.00 0.00 0.00 0.00 0.00 0.00 0.00 0.00 0.00 0.00 0.00 0.00 0.00 0.00 0.00 0.00 0.00 0.00 0.00
RETURN: Ermelo (growth only) ( 50 % ) -1.13 -1.15 -1.18 -1.21 -1.24 -1.25 -1.27 -1.28 -1.29 -1.30 -1.32 -1.34 -1.36 -1.38 -1.40 -1.41 -1.42 -1.42 -1.43 -1.43Bethal -3.99 -4.11 -4.22 -4.34 -4.45 -4.58 -4.71 -4.83 -4.96 -5.09 -5.25 -5.41 -5.57 -5.73 -5.89 -6.09 -6.29 -6.49 -6.69 -6.89Tutuka seepage -0.97 -0.94 -0.88 -0.88 -0.87 -0.87 -0.88 -0.90 -0.90 -0.95 -1.01 -1.01 -1.02 -1.03 -1.03 -1.03 -1.03 -1.03 -1.03 -1.03Mine seepage -0.36 -0.36 -0.36 -0.36 -0.36 -0.36 -0.36 -0.36 -0.36 -0.36 -0.36 -0.36 -0.36 -0.36 -0.36 -0.36 -0.36 -0.36 -0.36 -0.36Grootdraai RE-EWR Mstr Irrig (RR368)-Unlawful Use -0.28 -0.19 -0.11 -0.03 -0.03 -0.03 -0.03 -0.03 -0.03 -0.03 -0.03 -0.03 -0.03 -0.03 -0.03 -0.03 -0.03 -0.03 -0.03 -0.03Grootdraai RE-EWR Mstr Irrig (RR369)-Lawful Use -0.05 -0.05 -0.05 -0.05 -0.05 -0.05 -0.05 -0.05 -0.05 -0.05 -0.05 -0.05 -0.05 -0.05 -0.05 -0.05 -0.05 -0.05 -0.05 -0.05Grootdraai EWR1 Mstr Irrig (RR1782)-Unlawful Use -1.77 -1.25 -0.73 -0.20 -0.20 -0.20 -0.20 -0.20 -0.20 -0.20 -0.20 -0.20 -0.20 -0.20 -0.20 -0.20 -0.20 -0.20 -0.20 -0.20Grootdraai EWR1 Mstr Irrig (RR1800)-Lawful Use -0.92 -0.92 -0.92 -0.92 -0.92 -0.92 -0.92 -0.92 -0.92 -0.92 -0.92 -0.92 -0.92 -0.92 -0.92 -0.92 -0.92 -0.92 -0.92 -0.92Grootdraai EWR2 Mstr Irrig (RR398)-Unlawful Use -0.79 -0.56 -0.33 -0.09 -0.09 -0.09 -0.09 -0.09 -0.09 -0.09 -0.09 -0.09 -0.09 -0.09 -0.09 -0.09 -0.09 -0.09 -0.09 -0.09Grootdraai EWR2 Mstr Irrig (RR414)-Lawful Use -0.52 -0.52 -0.52 -0.52 -0.52 -0.52 -0.52 -0.52 -0.52 -0.52 -0.52 -0.52 -0.52 -0.52 -0.52 -0.52 -0.52 -0.52 -0.52 -0.52
Original irrigation block Grootdraai irrigation (RR12) Lawful Use -1.49 -1.49 -1.49 -1.49 -1.49 -1.49 -1.49 -1.49 -1.49 -1.49 -1.49 -1.49 -1.49 -1.49 -1.49 -1.49 -1.49 -1.49 -1.49 -1.49Original irrigation block Grootdraai mainstream (RR12)- Sug 2005 - Lawful Use -0.18 -0.18 -0.18 -0.18 -0.18 -0.18 -0.18 -0.18 -0.18 -0.18 -0.18 -0.18 -0.18 -0.18 -0.18 -0.18 -0.18 -0.18 -0.18 -0.18
Ermelo (up to 1994 only - 50 % ) (3) -1.02 -1.02 -1.02 -1.02 -1.02 -1.02 -1.02 -1.02 -1.02 -1.02 -1.02 -1.02 -1.02 -1.02 -1.02 -1.02 -1.02 -1.02 -1.02 -1.02
PAVED AREAS : Waterval increased runoff -7.13 -7.48 -7.86 -8.25 -8.66 -9.09 -9.55 -10.03 -10.53 -11.06 -11.61 -12.19 -12.80 -13.44 -14.11 -14.82 -15.56 -16.33 -17.15 -18.0122.62 15.94 9.27 2.59
Notes (1): Other users include DWAF third party users along the following pipelines: Grootdraai-Tutuka, Trichardsfontein-Matla and Naauwpoort-Duvha-Slang River. (2): Water transferred from Grrotdraai Dam to drainage region B for urban and industrial use. (3): Ermelo's return flow based on 1994 demands (abstracted through Ch700) is not considered as part of Ch 47 to overcome problems with negative demands resulting from all urban return flows entering through Ch47 (4): Tutuka 1994 seepage from hydrology report.
IVRS_Dem_A_Proj_RW_High_No WDM_Eskom Base_v3.xls Table F-2 (cont) 2011/08/04

Projections (Million m3/a)
VAAL & BARRAGE2011 2012 2013 2014 2015 2016 2017 2018 2019 2020 2021 2022 2023 2024 2025 2026 2027 2028 2029 2030
ESKOM: Grootvlei 14.96 14.47 15.19 15.20 12.03 9.35 9.66 9.47 9.54 9.41 9.24 9.24 9.24 9.24 9.16 7.76 4.46 2.11 0.77 0.77Lethabo 46.21 46.19 46.76 46.27 46.18 46.41 46.08 46.19 46.17 46.40 46.40 46.12 46.32 46.54 46.30 46.38 46.19 46.39 46.44 46.16Kragbron(1) 0.00 0.00 0.00 0.00 0.00 0.00 0.00 0.00 0.00 0.00 0.00 0.00 0.00 0.00 0.00 0.00 0.00 0.00 0.00 0.00
New coal fired 3 and 4 (Vaal Dam 0.00 0.00 0.00 0.72 1.94 5.19 5.78 6.92 8.42 9.09 9.06 8.53 8.39 8.54 10.13 12.52 14.15 16.64 18.28 20.40New coal fired 2 (Mokolo catchment) 0.00 0.00 0.00 0.00 0.00 0.00 0.00 0.00 0.00 0.00 0.00 0.00 0.00 0.00 0.00 0.00 0.00 0.00 0.00 0.00
Mittal Steel: (Previously known as Iscor) Incl supply from RW 12.50 12.69 12.89 13.10 13.30 13.51 13.72 13.94 14.16 14.38 14.61 14.84 15.08 15.31 15.56 15.80 16.05 16.31 16.56 16.83
SASOL Sasolburg: Sasolburg Complex: Raw water from Vaal Rive 20.42 21.91 22.57 23.04 23.48 23.95 24.43 24.92 25.42 25.92 26.44 26.97 27.51 28.06 28.62 29.19 29.78 30.37 30.98 31.60
SMALL USERS: (Mining & Industrial)(2) 0.00 0.00 0.00 0.00 0.00 0.00 0.00 0.00 0.00 0.00 0.00 0.00 0.00 0.00 0.00 0.00 0.00 0.00 0.00 0.00Mining abs. from Blesbokspruit 4.56 4.56 4.56 4.56 4.56 4.56 4.56 4.56 4.56 4.56 4.56 4.56 4.56 4.56 4.56 4.56 4.56 4.56 4.56 4.56Balfour abstractions (Blesboksp) 1.56 1.59 1.61 1.63 1.66 1.67 1.68 1.70 1.71 1.72 1.74 1.75 1.76 1.77 1.79 1.80 1.81 1.82 1.84 1.85
URBAN:Rand Water Jun99 growth rates
DC40: Demand Rand Water (with Return Flows to Klip River 427.59 435.22 442.85 450.48 460.05 468.53 477.03 485.53 494.04 502.57 508.74 514.93 521.11 527.30 533.50 540.20 546.87 553.53 560.16 566.76Rand Water Rgn A+C -427.59 -435.22 -442.85 -450.48 -460.05 -468.53 -477.03 -485.53 -494.04 -502.57 -508.74 -514.93 -521.11 -527.30 -533.50 -540.20 -546.87 -553.53 -560.16 -566.76Rand Water: Southn Gauteng(4 427.59 435.22 442.85 450.48 460.05 468.53 477.03 485.53 494.04 502.57 508.74 514.93 521.11 527.30 533.50 540.20 546.87 553.53 560.16 566.76Rand Water: Northern Users - Crocodile 831.66 846.51 861.37 875.62 891.20 906.55 922.63 938.78 953.81 967.66 980.82 994.07 1007.41 1019.64 1030.71 1048.05 1065.53 1083.14 1100.88 1118.76
Supply from Magalies Rand Water: Northern Users (Vaalkop Scheme 0.00 0.00 0.00 0.00 0.00 0.00 0.00 0.00 0.00 0.00 0.00 0.00 0.00 0.00 0.00 0.00 0.00 0.00 0.00 0.00
RW SG: Return Flow RW Southern Gauteng Total return flow 392.63 399.64 406.65 413.67 422.60 430.54 438.50 446.46 454.43 462.41 468.22 474.03 479.84 485.66 491.48 497.77 504.03 510.28 516.51 522.72-392.63 -399.64 -406.65 -413.67 -422.60 -430.54 -438.50 -446.46 -454.43 -462.41 -468.22 -474.03 -479.84 -485.66 -491.48 -497.77 -504.03 -510.28 -516.51 -522.72
DC293 : Demand Rand Water (with return flows to Suikerbosrand 98.23 100.28 102.32 104.36 106.73 108.84 110.95 113.06 115.18 117.29 118.83 120.38 121.92 123.46 125.01 126.67 128.34 130.00 131.65 133.30
DC294 : Demand Rand Water (with return flows to Upper Riet 50.13 50.92 51.70 52.48 53.59 54.57 55.55 56.53 57.52 58.50 59.22 59.94 60.65 61.37 62.09 62.86 63.63 64.40 65.16 65.93
DC295 : Demand Rand Water (with return flows to Lower Riet 58.21 59.08 59.95 60.81 62.14 63.33 64.52 65.71 66.91 68.10 68.97 69.84 70.72 71.59 72.46 73.39 74.32 75.25 76.18 77.11
DC296 : Demand Rand Water (with return flows to Mooi River 12.81 12.96 13.12 13.27 13.61 13.92 14.24 14.55 14.87 15.19 15.44 15.70 15.96 16.21 16.47 16.76 17.04 17.32 17.60 17.88
Mine Water Re-use Mine water treated for re-use by Rand Wate 0.00 0.00 0.00 -46.25 -55.52 -55.52 -55.52 -55.52 -55.52 -55.52 -55.52 -55.52 -55.52 -55.52 -55.52 -55.52 -55.52 -55.52 -55.52 -55.52
Boreholes: Zuurbekom supply to Rand Wate -4.56 -4.56 -4.56 -4.56 -4.56 -4.56 -4.56 -4.56 -4.56 -4.56 -4.56 -4.56 -4.56 -4.56 -4.56 -4.56 -4.56 -4.56 -4.56 -4.56Pretoria demand (incl. Rietvlei etc. 25.00 25.00 25.00 25.00 25.00 25.00 25.00 25.00 25.00 25.00 25.00 25.00 25.00 25.00 25.00 25.00 25.00 25.00 25.00 25.00Zuurbekom supply to Rand Wate 4.56 4.56 4.56 4.56 4.56 4.56 4.56 4.56 4.56 4.56 4.56 4.56 4.56 4.56 4.56 4.56 4.56 4.56 4.56 4.56Pretoria demand (incl. Rietvlei etc. -25.00 -25.00 -25.00 -25.00 -25.00 -25.00 -25.00 -25.00 -25.00 -25.00 -25.00 -25.00 -25.00 -25.00 -25.00 -25.00 -25.00 -25.00 -25.00 -25.00
Region B: From R W (Only from Grootdraai) 0.00 0.00 0.00 0.00 0.00 0.00 0.00 0.00 0.00 0.00 0.00 0.00 0.00 0.00 0.00 0.00 0.00 0.00 0.00 0.00
Towns: Bethlehem (const.1994 demand 5.48 5.48 5.48 5.48 5.48 5.48 5.48 5.48 5.48 5.48 5.48 5.48 5.48 5.48 5.48 5.48 5.48 5.48 5.48 5.48Bethlehem (growth only 2.46 2.41 2.37 2.32 2.27 2.18 2.09 2.00 1.91 1.82 1.73 1.65 1.56 1.47 1.38 1.29 1.20 1.11 1.02 0.94Bethlehem (total) 7.94 7.89 7.85 7.80 7.75 7.66 7.57 7.48 7.39 7.30 7.21 7.13 7.04 6.95 6.86 6.77 6.68 6.59 6.50 6.42Bethlehem (total) -7.94 -7.89 -7.85 -7.80 -7.75 -7.66 -7.57 -7.48 -7.39 -7.30 -7.21 -7.13 -7.04 -6.95 -6.86 -6.77 -6.68 -6.59 -6.50 -6.42Deneysville 0.94 0.96 0.98 1.01 1.03 1.05 1.07 1.09 1.10 1.12 1.14 1.16 1.18 1.19 1.21 1.23 1.25 1.27 1.29 1.30Small Users(5) 3.15 3.15 3.15 3.15 3.15 3.15 3.14 3.14 3.14 3.14 3.14 3.14 3.14 3.14 3.14 3.13 3.13 3.13 3.13 3.13Villiers 0.88 0.90 0.92 0.94 0.96 0.98 0.99 1.00 1.01 1.03 1.04 1.05 1.07 1.08 1.09 1.11 1.12 1.13 1.15 1.16Frankfort 2.41 2.43 2.46 2.48 2.51 2.52 2.53 2.53 2.54 2.55 2.56 2.57 2.58 2.58 2.59 2.60 2.61 2.62 2.63 2.64Harrismith (const.1994 demand 2.39 2.39 2.39 2.39 2.39 2.39 2.39 2.39 2.39 2.39 2.39 2.39 2.39 2.39 2.39 2.39 2.39 2.39 2.39 2.39Harrismith (growth only 2.08 2.16 2.24 2.32 2.40 2.45 2.51 2.57 2.62 2.68 2.73 2.79 2.84 2.90 2.96 3.01 3.07 3.12 3.18 3.23Harrismith (total) 4.47 4.55 4.63 4.71 4.79 4.84 4.90 4.96 5.01 5.07 5.12 5.18 5.23 5.29 5.35 5.40 5.46 5.51 5.57 5.62Harrismith (total) -4.47 -4.55 -4.63 -4.71 -4.79 -4.84 -4.90 -4.96 -5.01 -5.07 -5.12 -5.18 -5.23 -5.29 -5.35 -5.40 -5.46 -5.51 -5.57 -5.62Memel (const.1994 demand 0.00 0.00 0.00 0.00 0.00 0.00 0.00 0.00 0.00 0.00 0.00 0.00 0.00 0.00 0.00 0.00 0.00 0.00 0.00 0.00Memel (growth only) 0.19 0.20 0.20 0.20 0.20 0.20 0.20 0.20 0.20 0.20 0.20 0.20 0.20 0.20 0.20 0.20 0.20 0.20 0.20 0.20Memel (total) 0.19 0.20 0.20 0.20 0.20 0.20 0.20 0.20 0.20 0.20 0.20 0.20 0.20 0.20 0.20 0.20 0.20 0.20 0.20 0.20Memel (total) -0.19 -0.20 -0.20 -0.20 -0.20 -0.20 -0.20 -0.20 -0.20 -0.20 -0.20 -0.20 -0.20 -0.20 -0.20 -0.20 -0.20 -0.20 -0.20 -0.20Volksrust (Balfour Dam) 1994 0.00 0.00 0.00 0.00 0.00 0.00 0.00 0.00 0.00 0.00 0.00 0.00 0.00 0.00 0.00 0.00 0.00 0.00 0.00 0.00Volksrust (growth only 1.50 1.57 1.65 1.72 1.80 1.90 2.00 2.11 2.21 2.31 2.41 2.51 2.61 2.71 2.81 2.95 3.09 3.22 3.36 3.50Volksrust (total) 1.50 1.57 1.65 1.72 1.80 1.90 2.00 2.11 2.21 2.31 2.41 2.51 2.61 2.71 2.81 2.95 3.09 3.22 3.36 3.50Volksrust (total) -1.50 -1.57 -1.65 -1.72 -1.80 -1.90 -2.00 -2.11 -2.21 -2.31 -2.41 -2.51 -2.61 -2.71 -2.81 -2.95 -3.09 -3.22 -3.36 -3.50Reitz(6) 2.28 2.31 2.34 2.36 2.39 2.40 2.40 2.41 2.42 2.42 2.43 2.44 2.44 2.45 2.45 2.46 2.47 2.47 2.48 2.49Warden (up to 1994) 0.82 0.82 0.82 0.82 0.82 0.82 0.82 0.82 0.82 0.82 0.82 0.82 0.82 0.82 0.82 0.82 0.82 0.82 0.82 0.82Warden (growth only -0.41 -0.43 -0.45 -0.47 -0.49 -0.50 -0.51 -0.53 -0.54 -0.56 -0.57 -0.59 -0.60 -0.62 -0.63 -0.64 -0.66 -0.67 -0.69 -0.70Warden (total) 0.41 0.39 0.37 0.35 0.33 0.32 0.30 0.29 0.27 0.26 0.24 0.23 0.21 0.20 0.19 0.17 0.16 0.14 0.13 0.11Warden (total) -0.41 -0.39 -0.37 -0.35 -0.33 -0.32 -0.30 -0.29 -0.27 -0.26 -0.24 -0.23 -0.21 -0.20 -0.19 -0.17 -0.16 -0.14 -0.13 -0.11
Notes (1): Kragbron is Highveld and Taaibos and their use is registered as "Sasol (Vaal)" as part of the Autorised User (2): Small Users (Mining & Industrial) include USCO, Vereeniging Refractories, Vereeniging Municipality and TOS (3): Rand Water's total raw water abstraction includes Sasolburg but excludes Authorised Users (i.e. ESKOM, ISCOR, Sasol I and Small Users (Mining & Industria (4): Sasolburg is supplied by Rand Water and is included in the Southern Gauteng deman (5): Small users include Jim Fouche, Oranjeville and Vaal Marina. 1998 consumption not available - interpolation us (6): Reitz includes Tweeling and Petrus Steyn
IVRS_Dem_A_Proj_RW_High_No WDM_Eskom Base_v3.xls Table F-2 (cont) 2011/08/04

Projections (Million m3/a)
VAAL & BARRAGE (Cont 1)2011 2012 2013 2014 2015 2016 2017 2018 2019 2020 2021 2022 2023 2024 2025 2026 2027 2028 2029 2030
URBAN:Towns: 0.97 0.97 0.97 0.97
Vrede (const.1994 demand) 0.74 0.74 0.74 0.74 0.74 0.74 0.74 0.74 0.74 0.74 0.74 0.74 0.74 0.74 0.74 0.74 0.74 0.74 0.74 0.74Vrede (growth only) 0.33 0.34 0.34 0.34 0.34 0.34 0.33 0.32 0.32 0.31 0.30 0.30 0.29 0.28 0.28 0.27 0.26 0.26 0.25 0.24Vrede (total) 1.07 1.08 1.08 1.08 1.08 1.08 1.07 1.06 1.06 1.05 1.04 1.04 1.03 1.02 1.02 1.01 1.00 1.00 0.99 0.98Vrede (total) -1.07 -1.08 -1.08 -1.08 -1.08 -1.08 -1.07 -1.06 -1.06 -1.05 -1.04 -1.04 -1.03 -1.02 -1.02 -1.01 -1.00 -1.00 -0.99 -0.98Heilbron(1) Used for return flow calcs 1.17 1.18 1.18 1.19 1.20 1.20 1.20 1.20 1.19 1.19 1.19 1.19 1.19 1.19 1.19 1.18 1.18 1.18 1.18 1.18Heilbron (1) Used for return flow calcs: Correction -1.17 -1.18 -1.18 -1.19 -1.20 -1.20 -1.20 -1.20 -1.19 -1.19 -1.19 -1.19 -1.19 -1.19 -1.19 -1.18 -1.18 -1.18 -1.18 -1.18QwaQwa (const.1994 demand) 9.37 9.37 9.37 9.37 9.37 9.37 9.37 9.37 9.37 9.37 9.37 9.37 9.37 9.37 9.37 9.37 9.37 9.37 9.37 9.37QwaQwa (growth only) -0.31 -0.45 -0.59 -0.73 -0.87 -1.04 -1.21 -1.38 -1.56 -1.73 -1.90 -2.07 -2.24 -2.41 -2.59 -2.76 -2.93 -3.10 -3.27 -3.45QwaQwa (total) 9.06 8.92 8.78 8.64 8.50 8.33 8.16 7.99 7.81 7.64 7.47 7.30 7.13 6.96 6.78 6.61 6.44 6.27 6.10 5.92QwaQwa (total) -9.06 -8.92 -8.78 -8.64 -8.50 -8.33 -8.16 -7.99 -7.81 -7.64 -7.47 -7.30 -7.13 -6.96 -6.78 -6.61 -6.44 -6.27 -6.10 -5.92
IRRIGATION: Frankfort Dummy Dam1 (RR9) Lawful Use 13.61 13.61 13.61 13.61 13.61 13.61 13.61 13.61 13.61 13.61 13.61 13.61 13.61 13.61 13.61 13.61 13.61 13.61 13.61 13.61Frankfort Dummy Dam1 (RR1783) Unlawful Use 21.92 15.45 8.98 2.51 2.51 2.51 2.51 2.51 2.51 2.51 2.51 2.51 2.51 2.51 2.51 2.51 2.51 2.51 2.51 2.51Frankfort EWR8 mainstream (RR11) Lawful Use 6.22 6.22 6.22 6.22 6.22 6.22 6.22 6.22 6.22 6.22 6.22 6.22 6.22 6.22 6.22 6.22 6.22 6.22 6.22 6.22Frankfort EWR8 mainstream (RR549) Unlawful Use 16.34 11.52 6.70 1.87 1.87 1.87 1.87 1.87 1.87 1.87 1.87 1.87 1.87 1.87 1.87 1.87 1.87 1.87 1.87 1.87Frankfort Dummy Dam2 (RR571) Lawful Use 4.17 4.17 4.17 4.17 4.17 4.17 4.17 4.17 4.17 4.17 4.17 4.17 4.17 4.17 4.17 4.17 4.17 4.17 4.17 4.17Frankfort Dummy Dam2 (RR572) Unlawful Use 13.71 9.66 5.62 1.57 1.57 1.57 1.57 1.57 1.57 1.57 1.57 1.57 1.57 1.57 1.57 1.57 1.57 1.57 1.57 1.57Frankfort mainstream (RR575) Lawful Use 4.01 4.01 4.01 4.01 4.01 4.01 4.01 4.01 4.01 4.01 4.01 4.01 4.01 4.01 4.01 4.01 4.01 4.01 4.01 4.01Frankfort mainstream (RR576) Unlawful Use 17.63 12.42 7.22 2.02 2.02 2.02 2.02 2.02 2.02 2.02 2.02 2.02 2.02 2.02 2.02 2.02 2.02 2.02 2.02 2.02Saulspoort Dummy Dam (RR10) Lawful Use 0.99 0.99 0.99 0.99 0.99 0.99 0.99 0.99 0.99 0.99 0.99 0.99 0.99 0.99 0.99 0.99 0.99 0.99 0.99 0.99Saulspoort Dummy Dam (RR1784) Unlawful Use 0.89 0.63 0.36 0.10 0.10 0.10 0.10 0.10 0.10 0.10 0.10 0.10 0.10 0.10 0.10 0.10 0.10 0.10 0.10 0.10Liebenbergsvlei mainstream (RR489) Lawful Use 16.46 16.46 16.46 16.46 16.46 16.46 16.46 16.46 16.46 16.46 16.46 16.46 16.46 16.46 16.46 16.46 16.46 16.46 16.46 16.46Liebenbergsvlei mainstream (RR488) Unlawful Use 19.55 13.78 8.01 2.24 2.24 2.24 2.24 2.24 2.24 2.24 2.24 2.24 2.24 2.24 2.24 2.24 2.24 2.24 2.24 2.24Delangesdrift Incremental Lawful (as diffuse demands)Delangesdrift Incr (RR465) Unlawful Use 6.71 4.73 2.75 0.77 0.77 0.77 0.77 0.77 0.77 0.77 0.77 0.77 0.77 0.77 0.77 0.77 0.77 0.77 0.77 0.77Delangesdrift Incr (RR1781) Unlawful Use 2.96 2.09 1.21 0.34 0.34 0.34 0.34 0.34 0.34 0.34 0.34 0.34 0.34 0.34 0.34 0.34 0.34 0.34 0.34 0.34Upper Waterval Dummy dam(RR629) Lawfu 1.11 1.11 1.11 1.11 1.11 1.11 1.11 1.11 1.11 1.11 1.11 1.11 1.11 1.11 1.11 1.11 1.11 1.11 1.11 1.11Upper Waterval Dummy dam(RR642) Unlawfu 2.37 1.67 0.97 0.27 0.27 0.27 0.27 0.27 0.27 0.27 0.27 0.27 0.27 0.27 0.27 0.27 0.27 0.27 0.27 0.27Upper Waterval Mainstream (RR630) Lawful 0.30 0.30 0.30 0.30 0.30 0.30 0.30 0.30 0.30 0.30 0.30 0.30 0.30 0.30 0.30 0.30 0.30 0.30 0.30 0.30Lower Waterval Dummy Dam1 (RR558) Lawful 1.20 1.20 1.20 1.20 1.20 1.20 1.20 1.20 1.20 1.20 1.20 1.20 1.20 1.20 1.20 1.20 1.20 1.20 1.20 1.20Lower Waterval Dummy Dam1 (RR547) Unlawfu 2.57 1.81 1.05 0.29 0.29 0.29 0.29 0.29 0.29 0.29 0.29 0.29 0.29 0.29 0.29 0.29 0.29 0.29 0.29 0.29Lower Waterval Mainstream (RR561) Lawful 1.95 1.95 1.95 1.95 1.95 1.95 1.95 1.95 1.95 1.95 1.95 1.95 1.95 1.95 1.95 1.95 1.95 1.95 1.95 1.95Lower Waterval Mainstream (RR632) Unlawful 4.16 2.94 1.71 0.48 0.48 0.48 0.48 0.48 0.48 0.48 0.48 0.48 0.48 0.48 0.48 0.48 0.48 0.48 0.48 0.48Lower Waterval Dummy Dam2 (RR640) Lawful 1.14 1.14 1.14 1.14 1.14 1.14 1.14 1.14 1.14 1.14 1.14 1.14 1.14 1.14 1.14 1.14 1.14 1.14 1.14 1.14Lower Waterval Dummy Dam2 (RR643) Unlawfu 2.44 1.72 1.00 0.28 0.28 0.28 0.28 0.28 0.28 0.28 0.28 0.28 0.28 0.28 0.28 0.28 0.28 0.28 0.28 0.28Lower Waterval Mainstream (RR638) Lawful 2.79 2.79 2.79 2.79 2.79 2.79 2.79 2.79 2.79 2.79 2.79 2.79 2.79 2.79 2.79 2.79 2.79 2.79 2.79 2.79Lower Waterval Mainstream (RR644) Unlawful 5.96 4.20 2.44 0.68 0.68 0.68 0.68 0.68 0.68 0.68 0.68 0.68 0.68 0.68 0.68 0.68 0.68 0.68 0.68 0.68Vaal Incr EWR3 Mainstream (RR499) Lawful 13.71 13.71 13.71 13.71 13.71 13.71 13.71 13.71 13.71 13.71 13.71 13.71 13.71 13.71 13.71 13.71 13.71 13.71 13.71 13.71Vaal Incr EWR3 Mainstream (RR502) Unlawful 25.64 18.07 10.51 2.94 2.94 2.94 2.94 2.94 2.94 2.94 2.94 2.94 2.94 2.94 2.94 2.94 2.94 2.94 2.94 2.94Vaal EWR3 Dummy Dam1 (RR13) Lawful Use 4.57 4.57 4.57 4.57 4.57 4.57 4.57 4.57 4.57 4.57 4.57 4.57 4.57 4.57 4.57 4.57 4.57 4.57 4.57 4.57Vaal EWR3 Dummy Dam1 (RR1786) Unlawful Use 8.55 6.03 3.50 0.98 0.98 0.98 0.98 0.98 0.98 0.98 0.98 0.98 0.98 0.98 0.98 0.98 0.98 0.98 0.98 0.98Vaal mainstream (RR14) Lawful Use 7.61 7.61 7.61 7.61 7.61 7.61 7.61 7.61 7.61 7.61 7.61 7.61 7.61 7.61 7.61 7.61 7.61 7.61 7.61 7.61Vaal mainstream (RR1787) Unlawful Use 49.83 35.12 20.41 5.71 5.71 5.71 5.71 5.71 5.71 5.71 5.71 5.71 5.71 5.71 5.71 5.71 5.71 5.71 5.71 5.71Vaal Dummy Dam2 (RR545) Lawful Use 2.54 2.54 2.54 2.54 2.54 2.54 2.54 2.54 2.54 2.54 2.54 2.54 2.54 2.54 2.54 2.54 2.54 2.54 2.54 2.54Vaal Dummy Dam2 (RR546) Unlawful Use 16.61 11.70 6.80 1.90 1.90 1.90 1.90 1.90 1.90 1.90 1.90 1.90 1.90 1.90 1.90 1.90 1.90 1.90 1.90 1.90Blesbokspruit Dummy Dam (RR1) Lawful Use 1.29 1.29 1.29 1.29 1.29 1.29 1.29 1.29 1.29 1.29 1.29 1.29 1.29 1.29 1.29 1.29 1.29 1.29 1.29 1.29Blesbokspruit Mainstream (RR1788) Unlawful Use 3.80 2.68 1.56 0.44 0.44 0.44 0.44 0.44 0.44 0.44 0.44 0.44 0.44 0.44 0.44 0.44 0.44 0.44 0.44 0.44Upper Suikerbos Mainstream (RR463) Unlawful Use 1.32 0.93 0.54 0.15 0.15 0.15 0.15 0.15 0.15 0.15 0.15 0.15 0.15 0.15 0.15 0.15 0.15 0.15 0.15 0.15Upper Suikerbos Dummy Dam (RR245) Lawful Use 0.41 0.41 0.41 0.41 0.41 0.41 0.41 0.41 0.41 0.41 0.41 0.41 0.41 0.41 0.41 0.41 0.41 0.41 0.41 0.41Lower Suikerbos Dummy Dam1 (RR335) Lawful Use 1.43 1.43 1.43 1.43 1.43 1.43 1.43 1.43 1.43 1.43 1.43 1.43 1.43 1.43 1.43 1.43 1.43 1.43 1.43 1.43Lower Suikerbos Mainstream (RR1789) Unlawful Use 6.63 4.67 2.71 0.76 0.76 0.76 0.76 0.76 0.76 0.76 0.76 0.76 0.76 0.76 0.76 0.76 0.76 0.76 0.76 0.76Lower Suikerbos Dummy Dam2 (RR602) Lawful Use 0.62 0.62 0.62 0.62 0.62 0.62 0.62 0.62 0.62 0.62 0.62 0.62 0.62 0.62 0.62 0.62 0.62 0.62 0.62 0.62Lower Suikerbos Mainstream (RR615) Unlawful Use 2.29 1.62 0.94 0.26 0.26 0.26 0.26 0.26 0.26 0.26 0.26 0.26 0.26 0.26 0.26 0.26 0.26 0.26 0.26 0.26Klip River Mainstream (RR336) Lawful Use 8.63 8.63 8.63 8.63 8.63 8.63 8.63 8.63 8.63 8.63 8.63 8.63 8.63 8.63 8.63 8.63 8.63 8.63 8.63 8.63Klip River Mainstream (RR1790) Unlawful Use 25.17 17.74 10.31 2.88 2.88 2.88 2.88 2.88 2.88 2.88 2.88 2.88 2.88 2.88 2.88 2.88 2.88 2.88 2.88 2.88Barrage Mainstream (RR337) Lawful Use 10.69 10.69 10.69 10.69 10.69 10.69 10.69 10.69 10.69 10.69 10.69 10.69 10.69 10.69 10.69 10.69 10.69 10.69 10.69 10.69Barrage Mainstream (RR1791) Unlawful Use 24.40 17.20 10.00 2.79 2.79 2.79 2.79 2.79 2.79 2.79 2.79 2.79 2.79 2.79 2.79 2.79 2.79 2.79 2.79 2.79
DIFFUSE: Tugela Diversion Weir 0.00 0.00 0.00 0.00 0.00 0.00 0.00 0.00 0.00 0.00 0.00 0.00 0.00 0.00 0.00 0.00 0.00 0.00 0.00 0.00" 2.85 2.85 2.85 2.85 2.85 2.85 2.85 2.85 2.85 2.85 2.85 2.85 2.85 2.85 2.85 2.85 2.85 2.85 2.85 2.85Woodstock Dam 0.00 0.00 0.00 0.00 0.00 0.00 0.00 0.00 0.00 0.00 0.00 0.00 0.00 0.00 0.00 0.00 0.00 0.00 0.00 0.00" 0.00 0.00 0.00 0.00 0.00 0.00 0.00 0.00 0.00 0.00 0.00 0.00 0.00 0.00 0.00 0.00 0.00 0.00 0.00 0.00Driel Barrage 0.00 0.00 0.00 0.00 0.00 0.00 0.00 0.00 0.00 0.00 0.00 0.00 0.00 0.00 0.00 0.00 0.00 0.00 0.00 0.00" 0.00 0.00 0.00 0.00 0.00 0.00 0.00 0.00 0.00 0.00 0.00 0.00 0.00 0.00 0.00 0.00 0.00 0.00 0.00 0.00Spioenkop Dam 0.00 0.00 0.00 0.00 0.00 0.00 0.00 0.00 0.00 0.00 0.00 0.00 0.00 0.00 0.00 0.00 0.00 0.00 0.00 0.00" 0.00 0.00 0.00 0.00 0.00 0.00 0.00 0.00 0.00 0.00 0.00 0.00 0.00 0.00 0.00 0.00 0.00 0.00 0.00 0.00Sterkfontein Dam 0.00 0.00 0.00 0.00 0.00 0.00 0.00 0.00 0.00 0.00 0.00 0.00 0.00 0.00 0.00 0.00 0.00 0.00 0.00 0.00" 0.00 0.00 0.00 0.00 0.00 0.00 0.00 0.00 0.00 0.00 0.00 0.00 0.00 0.00 0.00 0.00 0.00 0.00 0.00 0.00Frankfort incremental (RR11) 0.00 0.00 0.00 0.00 0.00 0.00 0.00 0.00 0.00 0.00 0.00 0.00 0.00 0.00 0.00 0.00 0.00 0.00 0.00 0.00" 0.00 0.00 0.00 0.00 0.00 0.00 0.00 0.00 0.00 0.00 0.00 0.00 0.00 0.00 0.00 0.00 0.00 0.00 0.00 0.00Delangesdrift incremental - Lawful Use 2.79 2.79 2.79 2.79 2.79 2.79 2.79 2.79 2.79 2.79 2.79 2.79 2.79 2.79 2.79 2.79 2.79 2.79 2.79 2.79" 0.00 0.00 0.00 0.00 0.00 0.00 0.00 0.00 0.00 0.00 0.00 0.00 0.00 0.00 0.00 0.00 0.00 0.00 0.00 0.00Vaal Dam incremental (RR14) 0.00 0.00 0.00 0.00 0.00 0.00 0.00 0.00 0.00 0.00 0.00 0.00 0.00 0.00 0.00 0.00 0.00 0.00 0.00 0.00" 0.00 0.00 0.00 0.00 0.00 0.00 0.00 0.00 0.00 0.00 0.00 0.00 0.00 0.00 0.00 0.00 0.00 0.00 0.00 0.00Suikerbosrand incremental 0.00 0.00 0.00 0.00 0.00 0.00 0.00 0.00 0.00 0.00 0.00 0.00 0.00 0.00 0.00 0.00 0.00 0.00 0.00 0.00" 0.00 0.00 0.00 0.00 0.00 0.00 0.00 0.00 0.00 0.00 0.00 0.00 0.00 0.00 0.00 0.00 0.00 0.00 0.00 0.00Klip River incremental 0.00 0.00 0.00 0.00 0.00 0.00 0.00 0.00 0.00 0.00 0.00 0.00 0.00 0.00 0.00 0.00 0.00 0.00 0.00 0.00" 0.00 0.00 0.00 0.00 0.00 0.00 0.00 0.00 0.00 0.00 0.00 0.00 0.00 0.00 0.00 0.00 0.00 0.00 0.00 0.00Barrage incremental 0.00 0.00 0.00 0.00 0.00 0.00 0.00 0.00 0.00 0.00 0.00 0.00 0.00 0.00 0.00 0.00 0.00 0.00 0.00 0.00" 0.00 0.00 0.00 0.00 0.00 0.00 0.00 0.00 0.00 0.00 0.00 0.00 0.00 0.00 0.00 0.00 0.00 0.00 0.00 0.00
Notes (1): Only component not supplied by Rand Water. HeIlbron from 1998 assumed to be included with demand "Rand Water Rgn A+C
IVRS_Dem_A_Proj_RW_High_No WDM_Eskom Base_v3.xls Table F-2 (cont) 2011/08/04
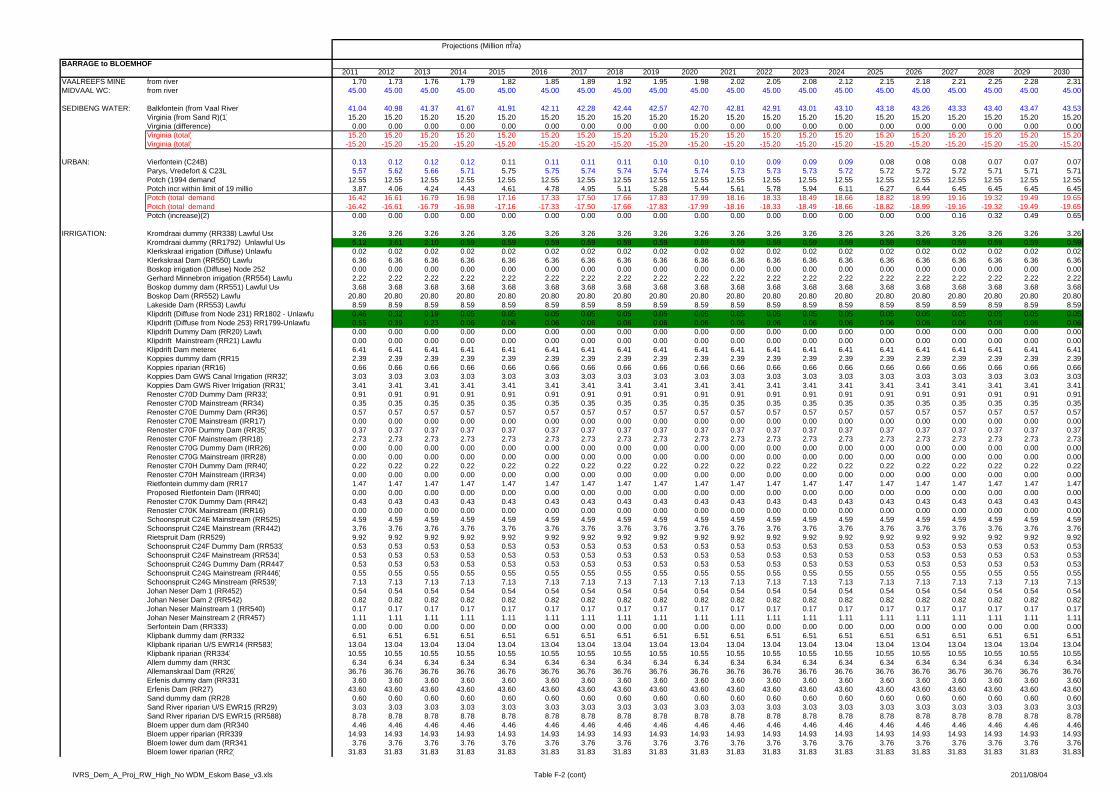
Projections (Million m3/a)
BARRAGE to BLOEMHOF2011 2012 2013 2014 2015 2016 2017 2018 2019 2020 2021 2022 2023 2024 2025 2026 2027 2028 2029 2030
VAALREEFS MINE: from river 1.70 1.73 1.76 1.79 1.82 1.85 1.89 1.92 1.95 1.98 2.02 2.05 2.08 2.12 2.15 2.18 2.21 2.25 2.28 2.31MIDVAAL WC: from river 45.00 45.00 45.00 45.00 45.00 45.00 45.00 45.00 45.00 45.00 45.00 45.00 45.00 45.00 45.00 45.00 45.00 45.00 45.00 45.00
SEDIBENG WATER: Balkfontein (from Vaal River) 41.04 40.98 41.37 41.67 41.91 42.11 42.28 42.44 42.57 42.70 42.81 42.91 43.01 43.10 43.18 43.26 43.33 43.40 43.47 43.53Virginia (from Sand R)(1) 15.20 15.20 15.20 15.20 15.20 15.20 15.20 15.20 15.20 15.20 15.20 15.20 15.20 15.20 15.20 15.20 15.20 15.20 15.20 15.20Virginia (difference) 0.00 0.00 0.00 0.00 0.00 0.00 0.00 0.00 0.00 0.00 0.00 0.00 0.00 0.00 0.00 0.00 0.00 0.00 0.00 0.00Virginia (total) 15.20 15.20 15.20 15.20 15.20 15.20 15.20 15.20 15.20 15.20 15.20 15.20 15.20 15.20 15.20 15.20 15.20 15.20 15.20 15.20Virginia (total) -15.20 -15.20 -15.20 -15.20 -15.20 -15.20 -15.20 -15.20 -15.20 -15.20 -15.20 -15.20 -15.20 -15.20 -15.20 -15.20 -15.20 -15.20 -15.20 -15.20
URBAN: Vierfontein (C24B) 0.13 0.12 0.12 0.12 0.11 0.11 0.11 0.11 0.10 0.10 0.10 0.09 0.09 0.09 0.08 0.08 0.08 0.07 0.07 0.07Parys, Vredefort & C23L 5.57 5.62 5.66 5.71 5.75 5.75 5.74 5.74 5.74 5.74 5.73 5.73 5.73 5.72 5.72 5.72 5.72 5.71 5.71 5.71Potch (1994 demand) 12.55 12.55 12.55 12.55 12.55 12.55 12.55 12.55 12.55 12.55 12.55 12.55 12.55 12.55 12.55 12.55 12.55 12.55 12.55 12.55Potch incr within limit of 19 millio 3.87 4.06 4.24 4.43 4.61 4.78 4.95 5.11 5.28 5.44 5.61 5.78 5.94 6.11 6.27 6.44 6.45 6.45 6.45 6.45Potch (total demand) 16.42 16.61 16.79 16.98 17.16 17.33 17.50 17.66 17.83 17.99 18.16 18.33 18.49 18.66 18.82 18.99 19.16 19.32 19.49 19.65Potch (total demand) -16.42 -16.61 -16.79 -16.98 -17.16 -17.33 -17.50 -17.66 -17.83 -17.99 -18.16 -18.33 -18.49 -18.66 -18.82 -18.99 -19.16 -19.32 -19.49 -19.65Potch (increase)(2) 0.00 0.00 0.00 0.00 0.00 0.00 0.00 0.00 0.00 0.00 0.00 0.00 0.00 0.00 0.00 0.00 0.16 0.32 0.49 0.65
IRRIGATION: Kromdraai dummy (RR338) Lawful Use 3.26 3.26 3.26 3.26 3.26 3.26 3.26 3.26 3.26 3.26 3.26 3.26 3.26 3.26 3.26 3.26 3.26 3.26 3.26 3.26Kromdraai dummy (RR1792) Unlawful Use 5.12 3.61 2.10 0.59 0.59 0.59 0.59 0.59 0.59 0.59 0.59 0.59 0.59 0.59 0.59 0.59 0.59 0.59 0.59 0.59Klerkskraal irrigation (Diffuse) Unlawfu 0.02 0.02 0.02 0.02 0.02 0.02 0.02 0.02 0.02 0.02 0.02 0.02 0.02 0.02 0.02 0.02 0.02 0.02 0.02 0.02Klerkskraal Dam (RR550) Lawfu 6.36 6.36 6.36 6.36 6.36 6.36 6.36 6.36 6.36 6.36 6.36 6.36 6.36 6.36 6.36 6.36 6.36 6.36 6.36 6.36Boskop irrigation (Diffuse) Node 252 0.00 0.00 0.00 0.00 0.00 0.00 0.00 0.00 0.00 0.00 0.00 0.00 0.00 0.00 0.00 0.00 0.00 0.00 0.00 0.00Gerhard Minnebron irrigation (RR554) Lawfu 2.22 2.22 2.22 2.22 2.22 2.22 2.22 2.22 2.22 2.22 2.22 2.22 2.22 2.22 2.22 2.22 2.22 2.22 2.22 2.22Boskop dummy dam (RR551) Lawful Use 3.68 3.68 3.68 3.68 3.68 3.68 3.68 3.68 3.68 3.68 3.68 3.68 3.68 3.68 3.68 3.68 3.68 3.68 3.68 3.68Boskop Dam (RR552) Lawful 20.80 20.80 20.80 20.80 20.80 20.80 20.80 20.80 20.80 20.80 20.80 20.80 20.80 20.80 20.80 20.80 20.80 20.80 20.80 20.80Lakeside Dam (RR553) Lawful 8.59 8.59 8.59 8.59 8.59 8.59 8.59 8.59 8.59 8.59 8.59 8.59 8.59 8.59 8.59 8.59 8.59 8.59 8.59 8.59Klipdrift (Diffuse from Node 231) RR1802 - Unlawfu 0.46 0.32 0.19 0.05 0.05 0.05 0.05 0.05 0.05 0.05 0.05 0.05 0.05 0.05 0.05 0.05 0.05 0.05 0.05 0.05Klipdrift (Diffuse from Node 253) RR1799-Unlawfu 0.55 0.39 0.23 0.06 0.06 0.06 0.06 0.06 0.06 0.06 0.06 0.06 0.06 0.06 0.06 0.06 0.06 0.06 0.06 0.06Klipdrift Dummy Dam (RR20) Lawfu 0.00 0.00 0.00 0.00 0.00 0.00 0.00 0.00 0.00 0.00 0.00 0.00 0.00 0.00 0.00 0.00 0.00 0.00 0.00 0.00Klipdrift Mainstream (RR21) Lawfu 0.00 0.00 0.00 0.00 0.00 0.00 0.00 0.00 0.00 0.00 0.00 0.00 0.00 0.00 0.00 0.00 0.00 0.00 0.00 0.00Klipdrift Dam metered 6.41 6.41 6.41 6.41 6.41 6.41 6.41 6.41 6.41 6.41 6.41 6.41 6.41 6.41 6.41 6.41 6.41 6.41 6.41 6.41Koppies dummy dam (RR15 2.39 2.39 2.39 2.39 2.39 2.39 2.39 2.39 2.39 2.39 2.39 2.39 2.39 2.39 2.39 2.39 2.39 2.39 2.39 2.39Koppies riparian (RR16) 0.66 0.66 0.66 0.66 0.66 0.66 0.66 0.66 0.66 0.66 0.66 0.66 0.66 0.66 0.66 0.66 0.66 0.66 0.66 0.66Koppies Dam GWS Canal Irrigation (RR32) 3.03 3.03 3.03 3.03 3.03 3.03 3.03 3.03 3.03 3.03 3.03 3.03 3.03 3.03 3.03 3.03 3.03 3.03 3.03 3.03Koppies Dam GWS River Irrigation (RR31) 3.41 3.41 3.41 3.41 3.41 3.41 3.41 3.41 3.41 3.41 3.41 3.41 3.41 3.41 3.41 3.41 3.41 3.41 3.41 3.41Renoster C70D Dummy Dam (RR33) 0.91 0.91 0.91 0.91 0.91 0.91 0.91 0.91 0.91 0.91 0.91 0.91 0.91 0.91 0.91 0.91 0.91 0.91 0.91 0.91Renoster C70D Mainstream (RR34) 0.35 0.35 0.35 0.35 0.35 0.35 0.35 0.35 0.35 0.35 0.35 0.35 0.35 0.35 0.35 0.35 0.35 0.35 0.35 0.35Renoster C70E Dummy Dam (RR36) 0.57 0.57 0.57 0.57 0.57 0.57 0.57 0.57 0.57 0.57 0.57 0.57 0.57 0.57 0.57 0.57 0.57 0.57 0.57 0.57Renoster C70E Mainstream (IRR17) 0.00 0.00 0.00 0.00 0.00 0.00 0.00 0.00 0.00 0.00 0.00 0.00 0.00 0.00 0.00 0.00 0.00 0.00 0.00 0.00Renoster C70F Dummy Dam (RR35) 0.37 0.37 0.37 0.37 0.37 0.37 0.37 0.37 0.37 0.37 0.37 0.37 0.37 0.37 0.37 0.37 0.37 0.37 0.37 0.37Renoster C70F Mainstream (RR18) 2.73 2.73 2.73 2.73 2.73 2.73 2.73 2.73 2.73 2.73 2.73 2.73 2.73 2.73 2.73 2.73 2.73 2.73 2.73 2.73Renoster C70G Dummy Dam (IRR26) 0.00 0.00 0.00 0.00 0.00 0.00 0.00 0.00 0.00 0.00 0.00 0.00 0.00 0.00 0.00 0.00 0.00 0.00 0.00 0.00Renoster C70G Mainstream (IRR28) 0.00 0.00 0.00 0.00 0.00 0.00 0.00 0.00 0.00 0.00 0.00 0.00 0.00 0.00 0.00 0.00 0.00 0.00 0.00 0.00Renoster C70H Dummy Dam (RR40) 0.22 0.22 0.22 0.22 0.22 0.22 0.22 0.22 0.22 0.22 0.22 0.22 0.22 0.22 0.22 0.22 0.22 0.22 0.22 0.22Renoster C70H Mainstream (IRR34) 0.00 0.00 0.00 0.00 0.00 0.00 0.00 0.00 0.00 0.00 0.00 0.00 0.00 0.00 0.00 0.00 0.00 0.00 0.00 0.00Rietfontein dummy dam (RR17 1.47 1.47 1.47 1.47 1.47 1.47 1.47 1.47 1.47 1.47 1.47 1.47 1.47 1.47 1.47 1.47 1.47 1.47 1.47 1.47Proposed Rietfontein Dam (IRR40) 0.00 0.00 0.00 0.00 0.00 0.00 0.00 0.00 0.00 0.00 0.00 0.00 0.00 0.00 0.00 0.00 0.00 0.00 0.00 0.00Renoster C70K Dummy Dam (RR42) 0.43 0.43 0.43 0.43 0.43 0.43 0.43 0.43 0.43 0.43 0.43 0.43 0.43 0.43 0.43 0.43 0.43 0.43 0.43 0.43Renoster C70K Mainstream (IRR16) 0.00 0.00 0.00 0.00 0.00 0.00 0.00 0.00 0.00 0.00 0.00 0.00 0.00 0.00 0.00 0.00 0.00 0.00 0.00 0.00Schoonspruit C24E Mainstream (RR525) 4.59 4.59 4.59 4.59 4.59 4.59 4.59 4.59 4.59 4.59 4.59 4.59 4.59 4.59 4.59 4.59 4.59 4.59 4.59 4.59Schoonspruit C24E Mainstream (RR442) 3.76 3.76 3.76 3.76 3.76 3.76 3.76 3.76 3.76 3.76 3.76 3.76 3.76 3.76 3.76 3.76 3.76 3.76 3.76 3.76Rietspruit Dam (RR529) 9.92 9.92 9.92 9.92 9.92 9.92 9.92 9.92 9.92 9.92 9.92 9.92 9.92 9.92 9.92 9.92 9.92 9.92 9.92 9.92Schoonspruit C24F Dummy Dam (RR533) 0.53 0.53 0.53 0.53 0.53 0.53 0.53 0.53 0.53 0.53 0.53 0.53 0.53 0.53 0.53 0.53 0.53 0.53 0.53 0.53Schoonspruit C24F Mainstream (RR534) 0.53 0.53 0.53 0.53 0.53 0.53 0.53 0.53 0.53 0.53 0.53 0.53 0.53 0.53 0.53 0.53 0.53 0.53 0.53 0.53Schoonspruit C24G Dummy Dam (RR447) 0.53 0.53 0.53 0.53 0.53 0.53 0.53 0.53 0.53 0.53 0.53 0.53 0.53 0.53 0.53 0.53 0.53 0.53 0.53 0.53Schoonspruit C24G Mainstream (RR446) 0.55 0.55 0.55 0.55 0.55 0.55 0.55 0.55 0.55 0.55 0.55 0.55 0.55 0.55 0.55 0.55 0.55 0.55 0.55 0.55Schoonspruit C24G Minstream (RR539) 7.13 7.13 7.13 7.13 7.13 7.13 7.13 7.13 7.13 7.13 7.13 7.13 7.13 7.13 7.13 7.13 7.13 7.13 7.13 7.13Johan Neser Dam 1 (RR452) 0.54 0.54 0.54 0.54 0.54 0.54 0.54 0.54 0.54 0.54 0.54 0.54 0.54 0.54 0.54 0.54 0.54 0.54 0.54 0.54Johan Neser Dam 2 (RR542) 0.82 0.82 0.82 0.82 0.82 0.82 0.82 0.82 0.82 0.82 0.82 0.82 0.82 0.82 0.82 0.82 0.82 0.82 0.82 0.82Johan Neser Mainstream 1 (RR540) 0.17 0.17 0.17 0.17 0.17 0.17 0.17 0.17 0.17 0.17 0.17 0.17 0.17 0.17 0.17 0.17 0.17 0.17 0.17 0.17Johan Neser Mainstream 2 (RR457) 1.11 1.11 1.11 1.11 1.11 1.11 1.11 1.11 1.11 1.11 1.11 1.11 1.11 1.11 1.11 1.11 1.11 1.11 1.11 1.11Serfontein Dam (RR333) 0.00 0.00 0.00 0.00 0.00 0.00 0.00 0.00 0.00 0.00 0.00 0.00 0.00 0.00 0.00 0.00 0.00 0.00 0.00 0.00Klipbank dummy dam (RR332 6.51 6.51 6.51 6.51 6.51 6.51 6.51 6.51 6.51 6.51 6.51 6.51 6.51 6.51 6.51 6.51 6.51 6.51 6.51 6.51Klipbank riparian U/S EWR14 (RR583) 13.04 13.04 13.04 13.04 13.04 13.04 13.04 13.04 13.04 13.04 13.04 13.04 13.04 13.04 13.04 13.04 13.04 13.04 13.04 13.04Klipbank riparian (RR334) 10.55 10.55 10.55 10.55 10.55 10.55 10.55 10.55 10.55 10.55 10.55 10.55 10.55 10.55 10.55 10.55 10.55 10.55 10.55 10.55Allem dummy dam (RR30 6.34 6.34 6.34 6.34 6.34 6.34 6.34 6.34 6.34 6.34 6.34 6.34 6.34 6.34 6.34 6.34 6.34 6.34 6.34 6.34Allemanskraal Dam (RR26) 36.76 36.76 36.76 36.76 36.76 36.76 36.76 36.76 36.76 36.76 36.76 36.76 36.76 36.76 36.76 36.76 36.76 36.76 36.76 36.76Erfenis dummy dam (RR331) 3.60 3.60 3.60 3.60 3.60 3.60 3.60 3.60 3.60 3.60 3.60 3.60 3.60 3.60 3.60 3.60 3.60 3.60 3.60 3.60Erfenis Dam (RR27) 43.60 43.60 43.60 43.60 43.60 43.60 43.60 43.60 43.60 43.60 43.60 43.60 43.60 43.60 43.60 43.60 43.60 43.60 43.60 43.60Sand dummy dam (RR28 0.60 0.60 0.60 0.60 0.60 0.60 0.60 0.60 0.60 0.60 0.60 0.60 0.60 0.60 0.60 0.60 0.60 0.60 0.60 0.60Sand River riparian U/S EWR15 (RR29) 3.03 3.03 3.03 3.03 3.03 3.03 3.03 3.03 3.03 3.03 3.03 3.03 3.03 3.03 3.03 3.03 3.03 3.03 3.03 3.03Sand River riparian D/S EWR15 (RR588) 8.78 8.78 8.78 8.78 8.78 8.78 8.78 8.78 8.78 8.78 8.78 8.78 8.78 8.78 8.78 8.78 8.78 8.78 8.78 8.78Bloem upper dum dam (RR340 4.46 4.46 4.46 4.46 4.46 4.46 4.46 4.46 4.46 4.46 4.46 4.46 4.46 4.46 4.46 4.46 4.46 4.46 4.46 4.46Bloem upper riparian (RR339) 14.93 14.93 14.93 14.93 14.93 14.93 14.93 14.93 14.93 14.93 14.93 14.93 14.93 14.93 14.93 14.93 14.93 14.93 14.93 14.93Bloem lower dum dam (RR341 3.76 3.76 3.76 3.76 3.76 3.76 3.76 3.76 3.76 3.76 3.76 3.76 3.76 3.76 3.76 3.76 3.76 3.76 3.76 3.76Bloem lower riparian (RR2) 31.83 31.83 31.83 31.83 31.83 31.83 31.83 31.83 31.83 31.83 31.83 31.83 31.83 31.83 31.83 31.83 31.83 31.83 31.83 31.83
IVRS_Dem_A_Proj_RW_High_No WDM_Eskom Base_v3.xls Table F-2 (cont) 2011/08/04

DIFFUSE: All afforestation 0.00 0.00 0.00 0.00 0.00 0.00 0.00 0.00 0.00 0.00 0.00 0.00 0.00 0.00 0.00 0.00 0.00 0.00 0.00 0.00Kromdraai irrigation 0.00 0.00 0.00 0.00 0.00 0.00 0.00 0.00 0.00 0.00 0.00 0.00 0.00 0.00 0.00 0.00 0.00 0.00 0.00 0.00Klerkskraal irrigation 0.00 0.00 0.00 0.00 0.00 0.00 0.00 0.00 0.00 0.00 0.00 0.00 0.00 0.00 0.00 0.00 0.00 0.00 0.00 0.00Boskop irrigation 0.00 0.00 0.00 0.00 0.00 0.00 0.00 0.00 0.00 0.00 0.00 0.00 0.00 0.00 0.00 0.00 0.00 0.00 0.00 0.00Klipdrift irrigation 0.44 0.44 0.44 0.44 0.44 0.44 0.44 0.44 0.44 0.44 0.44 0.44 0.44 0.44 0.44 0.44 0.44 0.44 0.44 0.44Koppies irrigation (RR16) 0.00 0.00 0.00 0.00 0.00 0.00 0.00 0.00 0.00 0.00 0.00 0.00 0.00 0.00 0.00 0.00 0.00 0.00 0.00 0.00Rietfontein irrigation (RR18) 4.28 4.28 4.28 4.28 4.28 4.28 4.28 4.28 4.28 4.28 4.28 4.28 4.28 4.28 4.28 4.28 4.28 4.28 4.28 4.28Klipbank irrigation (RR334) 0.00 0.00 0.00 0.00 0.00 0.00 0.00 0.00 0.00 0.00 0.00 0.00 0.00 0.00 0.00 0.00 0.00 0.00 0.00 0.00Rietspruit irrigation 0.07 0.07 0.07 0.07 0.07 0.07 0.07 0.07 0.07 0.07 0.07 0.07 0.07 0.07 0.07 0.07 0.07 0.07 0.07 0.07Neser irrigation 0.00 0.00 0.00 0.00 0.00 0.00 0.00 0.00 0.00 0.00 0.00 0.00 0.00 0.00 0.00 0.00 0.00 0.00 0.00 0.00Allemanskraal irrigation 1.17 1.17 1.17 1.17 1.17 1.17 1.17 1.17 1.17 1.17 1.17 1.17 1.17 1.17 1.17 1.17 1.17 1.17 1.17 1.17Erfenis irrigation 1.28 1.28 1.28 1.28 1.28 1.28 1.28 1.28 1.28 1.28 1.28 1.28 1.28 1.28 1.28 1.28 1.28 1.28 1.28 1.28Sand irrigation (RR29) 1.28 1.28 1.28 1.28 1.28 1.28 1.28 1.28 1.28 1.28 1.28 1.28 1.28 1.28 1.28 1.28 1.28 1.28 1.28 1.28Bloemhof incr irrigation 0.00 0.00 0.00 0.00 0.00 0.00 0.00 0.00 0.00 0.00 0.00 0.00 0.00 0.00 0.00 0.00 0.00 0.00 0.00 0.00
6.13 4.32 2.51Notes (1): Goudveld quota limits abstraction from the Sand River, Virginia, to 12.8 million m3/a (higher for at leat the first year of the projection at 15.2 million m3 (2): Potchefstroom demand above 19 million m3/a supplied from Vaal Rive
IVRS_Dem_A_Proj_RW_High_No WDM_Eskom Base_v3.xls Table F-2 (cont) 2011/08/04
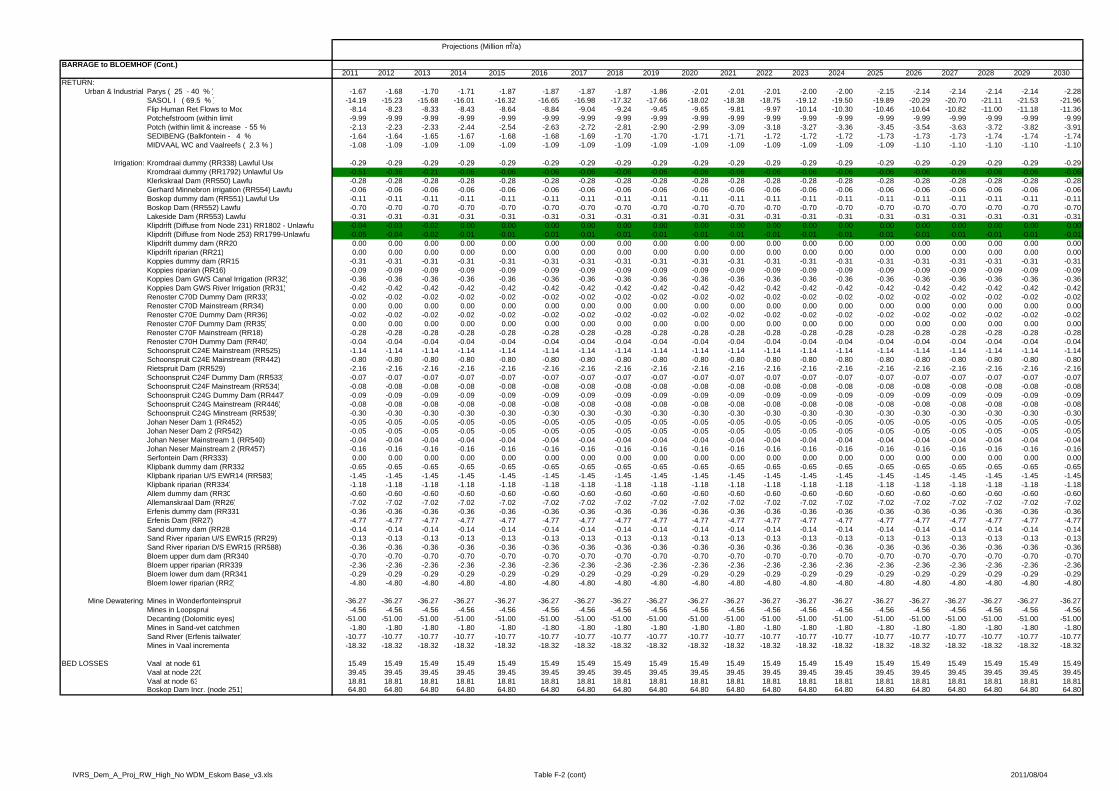
Projections (Million m3/a)
BARRAGE to BLOEMHOF (Cont.)2011 2012 2013 2014 2015 2016 2017 2018 2019 2020 2021 2022 2023 2024 2025 2026 2027 2028 2029 2030
RETURN:Urban & Industrial Parys ( 25 - 40 % ) -1.67 -1.68 -1.70 -1.71 -1.87 -1.87 -1.87 -1.87 -1.86 -2.01 -2.01 -2.01 -2.00 -2.00 -2.15 -2.14 -2.14 -2.14 -2.14 -2.28
SASOL I ( 69.5 % ) -14.19 -15.23 -15.68 -16.01 -16.32 -16.65 -16.98 -17.32 -17.66 -18.02 -18.38 -18.75 -19.12 -19.50 -19.89 -20.29 -20.70 -21.11 -21.53 -21.96Flip Human Ret Flows to Moo -8.14 -8.23 -8.33 -8.43 -8.64 -8.84 -9.04 -9.24 -9.45 -9.65 -9.81 -9.97 -10.14 -10.30 -10.46 -10.64 -10.82 -11.00 -11.18 -11.36Potchefstroom (within limit -9.99 -9.99 -9.99 -9.99 -9.99 -9.99 -9.99 -9.99 -9.99 -9.99 -9.99 -9.99 -9.99 -9.99 -9.99 -9.99 -9.99 -9.99 -9.99 -9.99Potch (within limit & increase - 55 % -2.13 -2.23 -2.33 -2.44 -2.54 -2.63 -2.72 -2.81 -2.90 -2.99 -3.09 -3.18 -3.27 -3.36 -3.45 -3.54 -3.63 -3.72 -3.82 -3.91SEDIBENG (Balkfontein - 4 % ) -1.64 -1.64 -1.65 -1.67 -1.68 -1.68 -1.69 -1.70 -1.70 -1.71 -1.71 -1.72 -1.72 -1.72 -1.73 -1.73 -1.73 -1.74 -1.74 -1.74MIDVAAL WC and Vaalreefs ( 2.3 % ) -1.08 -1.09 -1.09 -1.09 -1.09 -1.09 -1.09 -1.09 -1.09 -1.09 -1.09 -1.09 -1.09 -1.09 -1.09 -1.10 -1.10 -1.10 -1.10 -1.10
Irrigation: Kromdraai dummy (RR338) Lawful Use -0.29 -0.29 -0.29 -0.29 -0.29 -0.29 -0.29 -0.29 -0.29 -0.29 -0.29 -0.29 -0.29 -0.29 -0.29 -0.29 -0.29 -0.29 -0.29 -0.29Kromdraai dummy (RR1792) Unlawful Use -0.51 -0.36 -0.21 -0.06 -0.06 -0.06 -0.06 -0.06 -0.06 -0.06 -0.06 -0.06 -0.06 -0.06 -0.06 -0.06 -0.06 -0.06 -0.06 -0.06Klerkskraal Dam (RR550) Lawfu -0.28 -0.28 -0.28 -0.28 -0.28 -0.28 -0.28 -0.28 -0.28 -0.28 -0.28 -0.28 -0.28 -0.28 -0.28 -0.28 -0.28 -0.28 -0.28 -0.28Gerhard Minnebron irrigation (RR554) Lawfu -0.06 -0.06 -0.06 -0.06 -0.06 -0.06 -0.06 -0.06 -0.06 -0.06 -0.06 -0.06 -0.06 -0.06 -0.06 -0.06 -0.06 -0.06 -0.06 -0.06Boskop dummy dam (RR551) Lawful Use -0.11 -0.11 -0.11 -0.11 -0.11 -0.11 -0.11 -0.11 -0.11 -0.11 -0.11 -0.11 -0.11 -0.11 -0.11 -0.11 -0.11 -0.11 -0.11 -0.11Boskop Dam (RR552) Lawful -0.70 -0.70 -0.70 -0.70 -0.70 -0.70 -0.70 -0.70 -0.70 -0.70 -0.70 -0.70 -0.70 -0.70 -0.70 -0.70 -0.70 -0.70 -0.70 -0.70Lakeside Dam (RR553) Lawful -0.31 -0.31 -0.31 -0.31 -0.31 -0.31 -0.31 -0.31 -0.31 -0.31 -0.31 -0.31 -0.31 -0.31 -0.31 -0.31 -0.31 -0.31 -0.31 -0.31Klipdrift (Diffuse from Node 231) RR1802 - Unlawfu -0.04 -0.03 -0.02 0.00 0.00 0.00 0.00 0.00 0.00 0.00 0.00 0.00 0.00 0.00 0.00 0.00 0.00 0.00 0.00 0.00Klipdrift (Diffuse from Node 253) RR1799-Unlawfu -0.05 -0.04 -0.02 -0.01 -0.01 -0.01 -0.01 -0.01 -0.01 -0.01 -0.01 -0.01 -0.01 -0.01 -0.01 -0.01 -0.01 -0.01 -0.01 -0.01Klipdrift dummy dam (RR20 0.00 0.00 0.00 0.00 0.00 0.00 0.00 0.00 0.00 0.00 0.00 0.00 0.00 0.00 0.00 0.00 0.00 0.00 0.00 0.00Klipdrift riparian (RR21) 0.00 0.00 0.00 0.00 0.00 0.00 0.00 0.00 0.00 0.00 0.00 0.00 0.00 0.00 0.00 0.00 0.00 0.00 0.00 0.00Koppies dummy dam (RR15 -0.31 -0.31 -0.31 -0.31 -0.31 -0.31 -0.31 -0.31 -0.31 -0.31 -0.31 -0.31 -0.31 -0.31 -0.31 -0.31 -0.31 -0.31 -0.31 -0.31Koppies riparian (RR16) -0.09 -0.09 -0.09 -0.09 -0.09 -0.09 -0.09 -0.09 -0.09 -0.09 -0.09 -0.09 -0.09 -0.09 -0.09 -0.09 -0.09 -0.09 -0.09 -0.09Koppies Dam GWS Canal Irrigation (RR32) -0.36 -0.36 -0.36 -0.36 -0.36 -0.36 -0.36 -0.36 -0.36 -0.36 -0.36 -0.36 -0.36 -0.36 -0.36 -0.36 -0.36 -0.36 -0.36 -0.36Koppies Dam GWS River Irrigation (RR31) -0.42 -0.42 -0.42 -0.42 -0.42 -0.42 -0.42 -0.42 -0.42 -0.42 -0.42 -0.42 -0.42 -0.42 -0.42 -0.42 -0.42 -0.42 -0.42 -0.42Renoster C70D Dummy Dam (RR33) -0.02 -0.02 -0.02 -0.02 -0.02 -0.02 -0.02 -0.02 -0.02 -0.02 -0.02 -0.02 -0.02 -0.02 -0.02 -0.02 -0.02 -0.02 -0.02 -0.02Renoster C70D Mainstream (RR34) 0.00 0.00 0.00 0.00 0.00 0.00 0.00 0.00 0.00 0.00 0.00 0.00 0.00 0.00 0.00 0.00 0.00 0.00 0.00 0.00Renoster C70E Dummy Dam (RR36) -0.02 -0.02 -0.02 -0.02 -0.02 -0.02 -0.02 -0.02 -0.02 -0.02 -0.02 -0.02 -0.02 -0.02 -0.02 -0.02 -0.02 -0.02 -0.02 -0.02Renoster C70F Dummy Dam (RR35) 0.00 0.00 0.00 0.00 0.00 0.00 0.00 0.00 0.00 0.00 0.00 0.00 0.00 0.00 0.00 0.00 0.00 0.00 0.00 0.00Renoster C70F Mainstream (RR18) -0.28 -0.28 -0.28 -0.28 -0.28 -0.28 -0.28 -0.28 -0.28 -0.28 -0.28 -0.28 -0.28 -0.28 -0.28 -0.28 -0.28 -0.28 -0.28 -0.28Renoster C70H Dummy Dam (RR40) -0.04 -0.04 -0.04 -0.04 -0.04 -0.04 -0.04 -0.04 -0.04 -0.04 -0.04 -0.04 -0.04 -0.04 -0.04 -0.04 -0.04 -0.04 -0.04 -0.04Schoonspruit C24E Mainstream (RR525) -1.14 -1.14 -1.14 -1.14 -1.14 -1.14 -1.14 -1.14 -1.14 -1.14 -1.14 -1.14 -1.14 -1.14 -1.14 -1.14 -1.14 -1.14 -1.14 -1.14Schoonspruit C24E Mainstream (RR442) -0.80 -0.80 -0.80 -0.80 -0.80 -0.80 -0.80 -0.80 -0.80 -0.80 -0.80 -0.80 -0.80 -0.80 -0.80 -0.80 -0.80 -0.80 -0.80 -0.80Rietspruit Dam (RR529) -2.16 -2.16 -2.16 -2.16 -2.16 -2.16 -2.16 -2.16 -2.16 -2.16 -2.16 -2.16 -2.16 -2.16 -2.16 -2.16 -2.16 -2.16 -2.16 -2.16Schoonspruit C24F Dummy Dam (RR533) -0.07 -0.07 -0.07 -0.07 -0.07 -0.07 -0.07 -0.07 -0.07 -0.07 -0.07 -0.07 -0.07 -0.07 -0.07 -0.07 -0.07 -0.07 -0.07 -0.07Schoonspruit C24F Mainstream (RR534) -0.08 -0.08 -0.08 -0.08 -0.08 -0.08 -0.08 -0.08 -0.08 -0.08 -0.08 -0.08 -0.08 -0.08 -0.08 -0.08 -0.08 -0.08 -0.08 -0.08Schoonspruit C24G Dummy Dam (RR447) -0.09 -0.09 -0.09 -0.09 -0.09 -0.09 -0.09 -0.09 -0.09 -0.09 -0.09 -0.09 -0.09 -0.09 -0.09 -0.09 -0.09 -0.09 -0.09 -0.09Schoonspruit C24G Mainstream (RR446) -0.08 -0.08 -0.08 -0.08 -0.08 -0.08 -0.08 -0.08 -0.08 -0.08 -0.08 -0.08 -0.08 -0.08 -0.08 -0.08 -0.08 -0.08 -0.08 -0.08Schoonspruit C24G Minstream (RR539) -0.30 -0.30 -0.30 -0.30 -0.30 -0.30 -0.30 -0.30 -0.30 -0.30 -0.30 -0.30 -0.30 -0.30 -0.30 -0.30 -0.30 -0.30 -0.30 -0.30Johan Neser Dam 1 (RR452) -0.05 -0.05 -0.05 -0.05 -0.05 -0.05 -0.05 -0.05 -0.05 -0.05 -0.05 -0.05 -0.05 -0.05 -0.05 -0.05 -0.05 -0.05 -0.05 -0.05Johan Neser Dam 2 (RR542) -0.05 -0.05 -0.05 -0.05 -0.05 -0.05 -0.05 -0.05 -0.05 -0.05 -0.05 -0.05 -0.05 -0.05 -0.05 -0.05 -0.05 -0.05 -0.05 -0.05Johan Neser Mainstream 1 (RR540) -0.04 -0.04 -0.04 -0.04 -0.04 -0.04 -0.04 -0.04 -0.04 -0.04 -0.04 -0.04 -0.04 -0.04 -0.04 -0.04 -0.04 -0.04 -0.04 -0.04Johan Neser Mainstream 2 (RR457) -0.16 -0.16 -0.16 -0.16 -0.16 -0.16 -0.16 -0.16 -0.16 -0.16 -0.16 -0.16 -0.16 -0.16 -0.16 -0.16 -0.16 -0.16 -0.16 -0.16Serfontein Dam (RR333) 0.00 0.00 0.00 0.00 0.00 0.00 0.00 0.00 0.00 0.00 0.00 0.00 0.00 0.00 0.00 0.00 0.00 0.00 0.00 0.00Klipbank dummy dam (RR332 -0.65 -0.65 -0.65 -0.65 -0.65 -0.65 -0.65 -0.65 -0.65 -0.65 -0.65 -0.65 -0.65 -0.65 -0.65 -0.65 -0.65 -0.65 -0.65 -0.65Klipbank riparian U/S EWR14 (RR583) -1.45 -1.45 -1.45 -1.45 -1.45 -1.45 -1.45 -1.45 -1.45 -1.45 -1.45 -1.45 -1.45 -1.45 -1.45 -1.45 -1.45 -1.45 -1.45 -1.45Klipbank riparian (RR334) -1.18 -1.18 -1.18 -1.18 -1.18 -1.18 -1.18 -1.18 -1.18 -1.18 -1.18 -1.18 -1.18 -1.18 -1.18 -1.18 -1.18 -1.18 -1.18 -1.18Allem dummy dam (RR30 -0.60 -0.60 -0.60 -0.60 -0.60 -0.60 -0.60 -0.60 -0.60 -0.60 -0.60 -0.60 -0.60 -0.60 -0.60 -0.60 -0.60 -0.60 -0.60 -0.60Allemanskraal Dam (RR26) -7.02 -7.02 -7.02 -7.02 -7.02 -7.02 -7.02 -7.02 -7.02 -7.02 -7.02 -7.02 -7.02 -7.02 -7.02 -7.02 -7.02 -7.02 -7.02 -7.02Erfenis dummy dam (RR331) -0.36 -0.36 -0.36 -0.36 -0.36 -0.36 -0.36 -0.36 -0.36 -0.36 -0.36 -0.36 -0.36 -0.36 -0.36 -0.36 -0.36 -0.36 -0.36 -0.36Erfenis Dam (RR27) -4.77 -4.77 -4.77 -4.77 -4.77 -4.77 -4.77 -4.77 -4.77 -4.77 -4.77 -4.77 -4.77 -4.77 -4.77 -4.77 -4.77 -4.77 -4.77 -4.77Sand dummy dam (RR28 -0.14 -0.14 -0.14 -0.14 -0.14 -0.14 -0.14 -0.14 -0.14 -0.14 -0.14 -0.14 -0.14 -0.14 -0.14 -0.14 -0.14 -0.14 -0.14 -0.14Sand River riparian U/S EWR15 (RR29) -0.13 -0.13 -0.13 -0.13 -0.13 -0.13 -0.13 -0.13 -0.13 -0.13 -0.13 -0.13 -0.13 -0.13 -0.13 -0.13 -0.13 -0.13 -0.13 -0.13Sand River riparian D/S EWR15 (RR588) -0.36 -0.36 -0.36 -0.36 -0.36 -0.36 -0.36 -0.36 -0.36 -0.36 -0.36 -0.36 -0.36 -0.36 -0.36 -0.36 -0.36 -0.36 -0.36 -0.36Bloem upper dum dam (RR340 -0.70 -0.70 -0.70 -0.70 -0.70 -0.70 -0.70 -0.70 -0.70 -0.70 -0.70 -0.70 -0.70 -0.70 -0.70 -0.70 -0.70 -0.70 -0.70 -0.70Bloem upper riparian (RR339) -2.36 -2.36 -2.36 -2.36 -2.36 -2.36 -2.36 -2.36 -2.36 -2.36 -2.36 -2.36 -2.36 -2.36 -2.36 -2.36 -2.36 -2.36 -2.36 -2.36Bloem lower dum dam (RR341 -0.29 -0.29 -0.29 -0.29 -0.29 -0.29 -0.29 -0.29 -0.29 -0.29 -0.29 -0.29 -0.29 -0.29 -0.29 -0.29 -0.29 -0.29 -0.29 -0.29Bloem lower riparian (RR2) -4.80 -4.80 -4.80 -4.80 -4.80 -4.80 -4.80 -4.80 -4.80 -4.80 -4.80 -4.80 -4.80 -4.80 -4.80 -4.80 -4.80 -4.80 -4.80 -4.80
Mine Dewatering: Mines in Wonderfonteinspruit -36.27 -36.27 -36.27 -36.27 -36.27 -36.27 -36.27 -36.27 -36.27 -36.27 -36.27 -36.27 -36.27 -36.27 -36.27 -36.27 -36.27 -36.27 -36.27 -36.27Mines in Loopspruit -4.56 -4.56 -4.56 -4.56 -4.56 -4.56 -4.56 -4.56 -4.56 -4.56 -4.56 -4.56 -4.56 -4.56 -4.56 -4.56 -4.56 -4.56 -4.56 -4.56Decanting (Dolomitic eyes) -51.00 -51.00 -51.00 -51.00 -51.00 -51.00 -51.00 -51.00 -51.00 -51.00 -51.00 -51.00 -51.00 -51.00 -51.00 -51.00 -51.00 -51.00 -51.00 -51.00Mines in Sand-vet catchmen -1.80 -1.80 -1.80 -1.80 -1.80 -1.80 -1.80 -1.80 -1.80 -1.80 -1.80 -1.80 -1.80 -1.80 -1.80 -1.80 -1.80 -1.80 -1.80 -1.80Sand River (Erfenis tailwater) -10.77 -10.77 -10.77 -10.77 -10.77 -10.77 -10.77 -10.77 -10.77 -10.77 -10.77 -10.77 -10.77 -10.77 -10.77 -10.77 -10.77 -10.77 -10.77 -10.77Mines in Vaal incrementa -18.32 -18.32 -18.32 -18.32 -18.32 -18.32 -18.32 -18.32 -18.32 -18.32 -18.32 -18.32 -18.32 -18.32 -18.32 -18.32 -18.32 -18.32 -18.32 -18.32
BED LOSSES: Vaal at node 61 15.49 15.49 15.49 15.49 15.49 15.49 15.49 15.49 15.49 15.49 15.49 15.49 15.49 15.49 15.49 15.49 15.49 15.49 15.49 15.49Vaal at node 220 39.45 39.45 39.45 39.45 39.45 39.45 39.45 39.45 39.45 39.45 39.45 39.45 39.45 39.45 39.45 39.45 39.45 39.45 39.45 39.45Vaal at node 63 18.81 18.81 18.81 18.81 18.81 18.81 18.81 18.81 18.81 18.81 18.81 18.81 18.81 18.81 18.81 18.81 18.81 18.81 18.81 18.81Boskop Dam Incr. (node 251) 64.80 64.80 64.80 64.80 64.80 64.80 64.80 64.80 64.80 64.80 64.80 64.80 64.80 64.80 64.80 64.80 64.80 64.80 64.80 64.80
IVRS_Dem_A_Proj_RW_High_No WDM_Eskom Base_v3.xls Table F-2 (cont) 2011/08/04
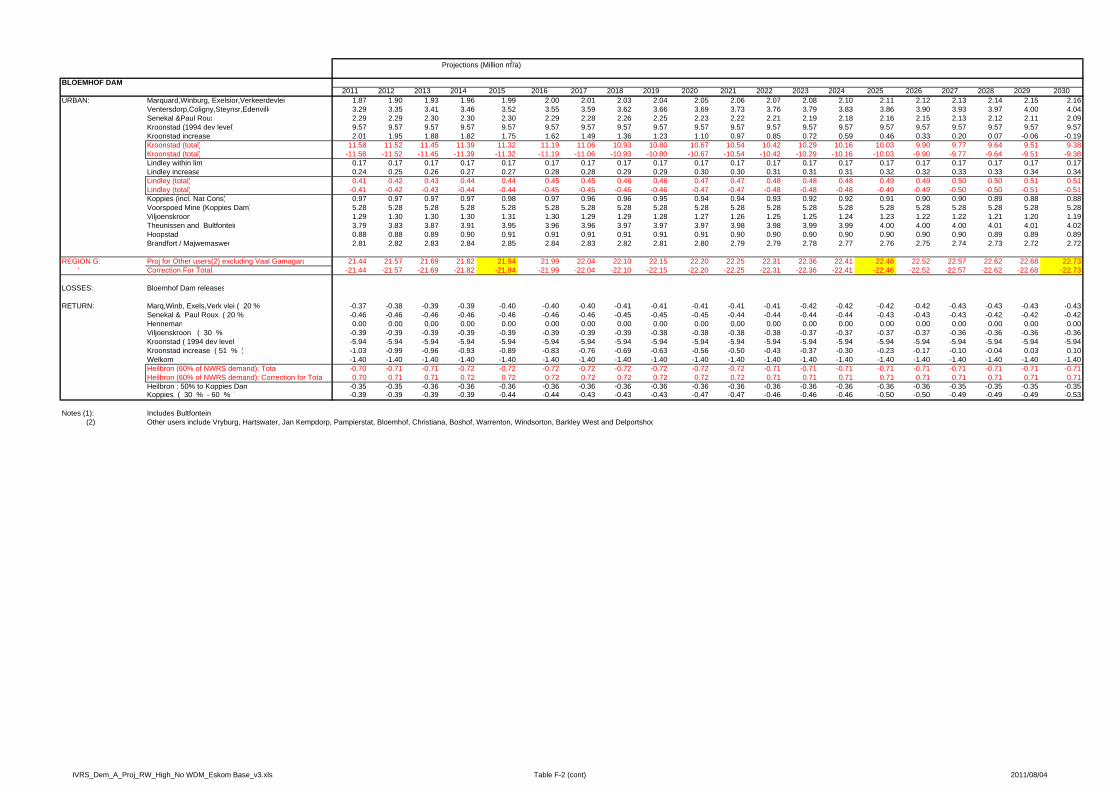
Projections (Million m3/a)
BLOEMHOF DAM2011 2012 2013 2014 2015 2016 2017 2018 2019 2020 2021 2022 2023 2024 2025 2026 2027 2028 2029 2030
URBAN: Marquard,Winburg, Exelsior,Verkeerdevlei 1.87 1.90 1.93 1.96 1.99 2.00 2.01 2.03 2.04 2.05 2.06 2.07 2.08 2.10 2.11 2.12 2.13 2.14 2.15 2.16Ventersdorp,Coligny,Steynsr,Edenville 3.29 3.35 3.41 3.46 3.52 3.55 3.59 3.62 3.66 3.69 3.73 3.76 3.79 3.83 3.86 3.90 3.93 3.97 4.00 4.04Senekal &Paul Roux 2.29 2.29 2.30 2.30 2.30 2.29 2.28 2.26 2.25 2.23 2.22 2.21 2.19 2.18 2.16 2.15 2.13 2.12 2.11 2.09Kroonstad (1994 dev level) 9.57 9.57 9.57 9.57 9.57 9.57 9.57 9.57 9.57 9.57 9.57 9.57 9.57 9.57 9.57 9.57 9.57 9.57 9.57 9.57Kroonstad increase 2.01 1.95 1.88 1.82 1.75 1.62 1.49 1.36 1.23 1.10 0.97 0.85 0.72 0.59 0.46 0.33 0.20 0.07 -0.06 -0.19Kroonstad (total) 11.58 11.52 11.45 11.39 11.32 11.19 11.06 10.93 10.80 10.67 10.54 10.42 10.29 10.16 10.03 9.90 9.77 9.64 9.51 9.38Kroonstad (total) -11.58 -11.52 -11.45 -11.39 -11.32 -11.19 -11.06 -10.93 -10.80 -10.67 -10.54 -10.42 -10.29 -10.16 -10.03 -9.90 -9.77 -9.64 -9.51 -9.38Lindley within lim 0.17 0.17 0.17 0.17 0.17 0.17 0.17 0.17 0.17 0.17 0.17 0.17 0.17 0.17 0.17 0.17 0.17 0.17 0.17 0.17Lindley increase 0.24 0.25 0.26 0.27 0.27 0.28 0.28 0.29 0.29 0.30 0.30 0.31 0.31 0.31 0.32 0.32 0.33 0.33 0.34 0.34Lindley (total) 0.41 0.42 0.43 0.44 0.44 0.45 0.45 0.46 0.46 0.47 0.47 0.48 0.48 0.48 0.49 0.49 0.50 0.50 0.51 0.51Lindley (total) -0.41 -0.42 -0.43 -0.44 -0.44 -0.45 -0.45 -0.46 -0.46 -0.47 -0.47 -0.48 -0.48 -0.48 -0.49 -0.49 -0.50 -0.50 -0.51 -0.51Koppies (incl. Nat Cons) 0.97 0.97 0.97 0.97 0.98 0.97 0.96 0.96 0.95 0.94 0.94 0.93 0.92 0.92 0.91 0.90 0.90 0.89 0.88 0.88Voorspoed Mine (Koppies Dam) 5.28 5.28 5.28 5.28 5.28 5.28 5.28 5.28 5.28 5.28 5.28 5.28 5.28 5.28 5.28 5.28 5.28 5.28 5.28 5.28Viljoenskroon 1.29 1.30 1.30 1.30 1.31 1.30 1.29 1.29 1.28 1.27 1.26 1.25 1.25 1.24 1.23 1.22 1.22 1.21 1.20 1.19Theunissen and Bultfontein 3.79 3.83 3.87 3.91 3.95 3.96 3.96 3.97 3.97 3.97 3.98 3.98 3.99 3.99 4.00 4.00 4.00 4.01 4.01 4.02Hoopstad 0.88 0.88 0.89 0.90 0.91 0.91 0.91 0.91 0.91 0.91 0.90 0.90 0.90 0.90 0.90 0.90 0.90 0.89 0.89 0.89Brandfort / Majwemasweu 2.81 2.82 2.83 2.84 2.85 2.84 2.83 2.82 2.81 2.80 2.79 2.79 2.78 2.77 2.76 2.75 2.74 2.73 2.72 2.72
REGION G: Proj for Other users(2) excluding Vaal Gamagara 21.44 21.57 21.69 21.82 21.94 21.99 22.04 22.10 22.15 22.20 22.25 22.31 22.36 22.41 22.46 22.52 22.57 22.62 22.68 22.73 " Correction For Total -21.44 -21.57 -21.69 -21.82 -21.94 -21.99 -22.04 -22.10 -22.15 -22.20 -22.25 -22.31 -22.36 -22.41 -22.46 -22.52 -22.57 -22.62 -22.68 -22.73
LOSSES: Bloemhof Dam releases
RETURN: Marq,Winb, Exels,Verk vlei ( 20 % -0.37 -0.38 -0.39 -0.39 -0.40 -0.40 -0.40 -0.41 -0.41 -0.41 -0.41 -0.41 -0.42 -0.42 -0.42 -0.42 -0.43 -0.43 -0.43 -0.43Senekal & Paul Roux ( 20 % -0.46 -0.46 -0.46 -0.46 -0.46 -0.46 -0.46 -0.45 -0.45 -0.45 -0.44 -0.44 -0.44 -0.44 -0.43 -0.43 -0.43 -0.42 -0.42 -0.42Henneman 0.00 0.00 0.00 0.00 0.00 0.00 0.00 0.00 0.00 0.00 0.00 0.00 0.00 0.00 0.00 0.00 0.00 0.00 0.00 0.00Viljoenskroon ( 30 % ) -0.39 -0.39 -0.39 -0.39 -0.39 -0.39 -0.39 -0.39 -0.38 -0.38 -0.38 -0.38 -0.37 -0.37 -0.37 -0.37 -0.36 -0.36 -0.36 -0.36Kroonstad ( 1994 dev level ) -5.94 -5.94 -5.94 -5.94 -5.94 -5.94 -5.94 -5.94 -5.94 -5.94 -5.94 -5.94 -5.94 -5.94 -5.94 -5.94 -5.94 -5.94 -5.94 -5.94Kroonstad increase ( 51 % ) -1.03 -0.99 -0.96 -0.93 -0.89 -0.83 -0.76 -0.69 -0.63 -0.56 -0.50 -0.43 -0.37 -0.30 -0.23 -0.17 -0.10 -0.04 0.03 0.10Welkom -1.40 -1.40 -1.40 -1.40 -1.40 -1.40 -1.40 -1.40 -1.40 -1.40 -1.40 -1.40 -1.40 -1.40 -1.40 -1.40 -1.40 -1.40 -1.40 -1.40Heilbron (60% of NWRS demand): Tota -0.70 -0.71 -0.71 -0.72 -0.72 -0.72 -0.72 -0.72 -0.72 -0.72 -0.72 -0.71 -0.71 -0.71 -0.71 -0.71 -0.71 -0.71 -0.71 -0.71Heilbron (60% of NWRS demand): Correction for Tota 0.70 0.71 0.71 0.72 0.72 0.72 0.72 0.72 0.72 0.72 0.72 0.71 0.71 0.71 0.71 0.71 0.71 0.71 0.71 0.71Heilbron : 50% to Koppies Dam -0.35 -0.35 -0.36 -0.36 -0.36 -0.36 -0.36 -0.36 -0.36 -0.36 -0.36 -0.36 -0.36 -0.36 -0.36 -0.36 -0.35 -0.35 -0.35 -0.35Koppies ( 30 % - 60 % ) -0.39 -0.39 -0.39 -0.39 -0.44 -0.44 -0.43 -0.43 -0.43 -0.47 -0.47 -0.46 -0.46 -0.46 -0.50 -0.50 -0.49 -0.49 -0.49 -0.53
Notes (1): Includes Bultfontein (2): Other users include Vryburg, Hartswater, Jan Kempdorp, Pampierstat, Bloemhof, Christiana, Boshof, Warrenton, Windsorton, Barkley West and Delportshoo
IVRS_Dem_A_Proj_RW_High_No WDM_Eskom Base_v3.xls Table F-2 (cont) 2011/08/04
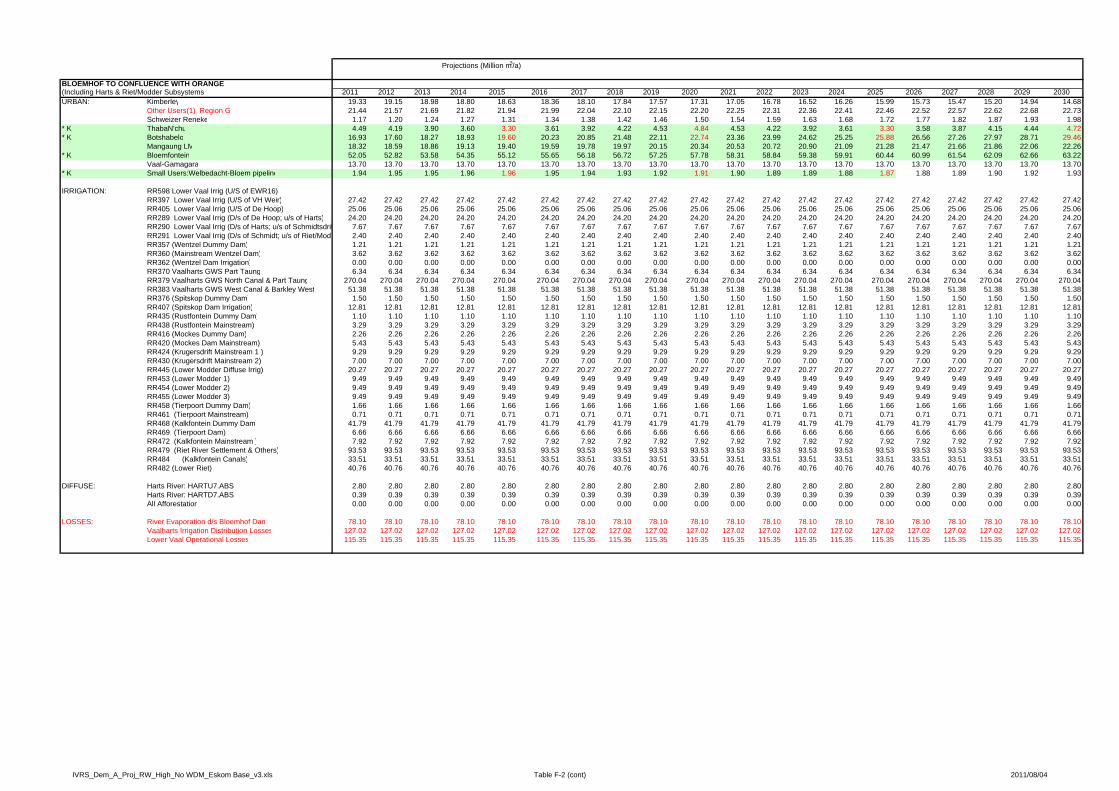
Projections (Million m3/a)
BLOEMHOF TO CONFLUENCE WITH ORANGE(Including Harts & Riet/Modder Subsystems 2011 2012 2013 2014 2015 2016 2017 2018 2019 2020 2021 2022 2023 2024 2025 2026 2027 2028 2029 2030URBAN: Kimberley 19.33 19.15 18.98 18.80 18.63 18.36 18.10 17.84 17.57 17.31 17.05 16.78 16.52 16.26 15.99 15.73 15.47 15.20 14.94 14.68
Other Users(1) Region G 21.44 21.57 21.69 21.82 21.94 21.99 22.04 22.10 22.15 22.20 22.25 22.31 22.36 22.41 22.46 22.52 22.57 22.62 22.68 22.73Schweizer Reneke 1.17 1.20 1.24 1.27 1.31 1.34 1.38 1.42 1.46 1.50 1.54 1.59 1.63 1.68 1.72 1.77 1.82 1.87 1.93 1.98
* K ThabaN'chu 4.49 4.19 3.90 3.60 3.30 3.61 3.92 4.22 4.53 4.84 4.53 4.22 3.92 3.61 3.30 3.58 3.87 4.15 4.44 4.72* K Botshabelo 16.93 17.60 18.27 18.93 19.60 20.23 20.85 21.48 22.11 22.74 23.36 23.99 24.62 25.25 25.88 26.56 27.26 27.97 28.71 29.46
Mangaung LM 18.32 18.59 18.86 19.13 19.40 19.59 19.78 19.97 20.15 20.34 20.53 20.72 20.90 21.09 21.28 21.47 21.66 21.86 22.06 22.26* K Bloemfontein 52.05 52.82 53.58 54.35 55.12 55.65 56.18 56.72 57.25 57.78 58.31 58.84 59.38 59.91 60.44 60.99 61.54 62.09 62.66 63.22
Vaal-Gamagara 13.70 13.70 13.70 13.70 13.70 13.70 13.70 13.70 13.70 13.70 13.70 13.70 13.70 13.70 13.70 13.70 13.70 13.70 13.70 13.70* K Small Users:Welbedacht-Bloem pipeline 1.94 1.95 1.95 1.96 1.96 1.95 1.94 1.93 1.92 1.91 1.90 1.89 1.89 1.88 1.87 1.88 1.89 1.90 1.92 1.93
IRRIGATION: RR598 Lower Vaal Irrig (U/S of EWR16)RR397 Lower Vaal Irrig (U/S of VH Weir) 27.42 27.42 27.42 27.42 27.42 27.42 27.42 27.42 27.42 27.42 27.42 27.42 27.42 27.42 27.42 27.42 27.42 27.42 27.42 27.42RR405 Lower Vaal Irrig (U/S of De Hoop) 25.06 25.06 25.06 25.06 25.06 25.06 25.06 25.06 25.06 25.06 25.06 25.06 25.06 25.06 25.06 25.06 25.06 25.06 25.06 25.06RR289 Lower Vaal Irrig (D/s of De Hoop; u/s of Harts) 24.20 24.20 24.20 24.20 24.20 24.20 24.20 24.20 24.20 24.20 24.20 24.20 24.20 24.20 24.20 24.20 24.20 24.20 24.20 24.20RR290 Lower Vaal Irrig (D/s of Harts; u/s of Schmidtsdrif 7.67 7.67 7.67 7.67 7.67 7.67 7.67 7.67 7.67 7.67 7.67 7.67 7.67 7.67 7.67 7.67 7.67 7.67 7.67 7.67RR291 Lower Vaal Irrig (D/s of Schmidt; u/s of Riet/Mod 2.40 2.40 2.40 2.40 2.40 2.40 2.40 2.40 2.40 2.40 2.40 2.40 2.40 2.40 2.40 2.40 2.40 2.40 2.40 2.40RR357 (Wentzel Dummy Dam) 1.21 1.21 1.21 1.21 1.21 1.21 1.21 1.21 1.21 1.21 1.21 1.21 1.21 1.21 1.21 1.21 1.21 1.21 1.21 1.21RR360 (Mainstream Wentzel Dam) 3.62 3.62 3.62 3.62 3.62 3.62 3.62 3.62 3.62 3.62 3.62 3.62 3.62 3.62 3.62 3.62 3.62 3.62 3.62 3.62RR362 (Wentzel Dam Irrigation) 0.00 0.00 0.00 0.00 0.00 0.00 0.00 0.00 0.00 0.00 0.00 0.00 0.00 0.00 0.00 0.00 0.00 0.00 0.00 0.00RR370 Vaalharts GWS Part Taung 6.34 6.34 6.34 6.34 6.34 6.34 6.34 6.34 6.34 6.34 6.34 6.34 6.34 6.34 6.34 6.34 6.34 6.34 6.34 6.34RR379 Vaalharts GWS North Canal & Part Taung 270.04 270.04 270.04 270.04 270.04 270.04 270.04 270.04 270.04 270.04 270.04 270.04 270.04 270.04 270.04 270.04 270.04 270.04 270.04 270.04RR383 Vaalharts GWS West Canal & Barkley West 51.38 51.38 51.38 51.38 51.38 51.38 51.38 51.38 51.38 51.38 51.38 51.38 51.38 51.38 51.38 51.38 51.38 51.38 51.38 51.38RR376 (Spitskop Dummy Dam) 1.50 1.50 1.50 1.50 1.50 1.50 1.50 1.50 1.50 1.50 1.50 1.50 1.50 1.50 1.50 1.50 1.50 1.50 1.50 1.50RR407 (Spitskop Dam Irrigation) 12.81 12.81 12.81 12.81 12.81 12.81 12.81 12.81 12.81 12.81 12.81 12.81 12.81 12.81 12.81 12.81 12.81 12.81 12.81 12.81RR435 (Rustfontein Dummy Dam) 1.10 1.10 1.10 1.10 1.10 1.10 1.10 1.10 1.10 1.10 1.10 1.10 1.10 1.10 1.10 1.10 1.10 1.10 1.10 1.10RR438 (Rustfontein Mainstream) 3.29 3.29 3.29 3.29 3.29 3.29 3.29 3.29 3.29 3.29 3.29 3.29 3.29 3.29 3.29 3.29 3.29 3.29 3.29 3.29RR416 (Mockes Dummy Dam) 2.26 2.26 2.26 2.26 2.26 2.26 2.26 2.26 2.26 2.26 2.26 2.26 2.26 2.26 2.26 2.26 2.26 2.26 2.26 2.26RR420 (Mockes Dam Mainstream) 5.43 5.43 5.43 5.43 5.43 5.43 5.43 5.43 5.43 5.43 5.43 5.43 5.43 5.43 5.43 5.43 5.43 5.43 5.43 5.43RR424 (Krugersdrift Mainstream 1 ) 9.29 9.29 9.29 9.29 9.29 9.29 9.29 9.29 9.29 9.29 9.29 9.29 9.29 9.29 9.29 9.29 9.29 9.29 9.29 9.29RR430 (Krugersdrift Mainstream 2) 7.00 7.00 7.00 7.00 7.00 7.00 7.00 7.00 7.00 7.00 7.00 7.00 7.00 7.00 7.00 7.00 7.00 7.00 7.00 7.00RR445 (Lower Modder Diffuse Irrig) 20.27 20.27 20.27 20.27 20.27 20.27 20.27 20.27 20.27 20.27 20.27 20.27 20.27 20.27 20.27 20.27 20.27 20.27 20.27 20.27RR453 (Lower Modder 1) 9.49 9.49 9.49 9.49 9.49 9.49 9.49 9.49 9.49 9.49 9.49 9.49 9.49 9.49 9.49 9.49 9.49 9.49 9.49 9.49RR454 (Lower Modder 2) 9.49 9.49 9.49 9.49 9.49 9.49 9.49 9.49 9.49 9.49 9.49 9.49 9.49 9.49 9.49 9.49 9.49 9.49 9.49 9.49RR455 (Lower Modder 3) 9.49 9.49 9.49 9.49 9.49 9.49 9.49 9.49 9.49 9.49 9.49 9.49 9.49 9.49 9.49 9.49 9.49 9.49 9.49 9.49RR458 (Tierpoort Dummy Dam) 1.66 1.66 1.66 1.66 1.66 1.66 1.66 1.66 1.66 1.66 1.66 1.66 1.66 1.66 1.66 1.66 1.66 1.66 1.66 1.66RR461 (Tierpoort Mainstream) 0.71 0.71 0.71 0.71 0.71 0.71 0.71 0.71 0.71 0.71 0.71 0.71 0.71 0.71 0.71 0.71 0.71 0.71 0.71 0.71RR468 (Kalkfontein Dummy Dam) 41.79 41.79 41.79 41.79 41.79 41.79 41.79 41.79 41.79 41.79 41.79 41.79 41.79 41.79 41.79 41.79 41.79 41.79 41.79 41.79RR469 (Tierpoort Dam) 6.66 6.66 6.66 6.66 6.66 6.66 6.66 6.66 6.66 6.66 6.66 6.66 6.66 6.66 6.66 6.66 6.66 6.66 6.66 6.66RR472 (Kalkfontein Mainstream ) 7.92 7.92 7.92 7.92 7.92 7.92 7.92 7.92 7.92 7.92 7.92 7.92 7.92 7.92 7.92 7.92 7.92 7.92 7.92 7.92RR479 (Riet River Settlement & Others) 93.53 93.53 93.53 93.53 93.53 93.53 93.53 93.53 93.53 93.53 93.53 93.53 93.53 93.53 93.53 93.53 93.53 93.53 93.53 93.53RR484 (Kalkfontein Canals) 33.51 33.51 33.51 33.51 33.51 33.51 33.51 33.51 33.51 33.51 33.51 33.51 33.51 33.51 33.51 33.51 33.51 33.51 33.51 33.51RR482 (Lower Riet) 40.76 40.76 40.76 40.76 40.76 40.76 40.76 40.76 40.76 40.76 40.76 40.76 40.76 40.76 40.76 40.76 40.76 40.76 40.76 40.76
DIFFUSE: Harts River: HARTU7.ABS 2.80 2.80 2.80 2.80 2.80 2.80 2.80 2.80 2.80 2.80 2.80 2.80 2.80 2.80 2.80 2.80 2.80 2.80 2.80 2.80Harts River: HARTD7.ABS 0.39 0.39 0.39 0.39 0.39 0.39 0.39 0.39 0.39 0.39 0.39 0.39 0.39 0.39 0.39 0.39 0.39 0.39 0.39 0.39All Afforestation 0.00 0.00 0.00 0.00 0.00 0.00 0.00 0.00 0.00 0.00 0.00 0.00 0.00 0.00 0.00 0.00 0.00 0.00 0.00 0.00
LOSSES: River Evaporation d/s Bloemhof Dam 78.10 78.10 78.10 78.10 78.10 78.10 78.10 78.10 78.10 78.10 78.10 78.10 78.10 78.10 78.10 78.10 78.10 78.10 78.10 78.10Vaalharts Irrigation Distribution Losses 127.02 127.02 127.02 127.02 127.02 127.02 127.02 127.02 127.02 127.02 127.02 127.02 127.02 127.02 127.02 127.02 127.02 127.02 127.02 127.02Lower Vaal Operational Losses 115.35 115.35 115.35 115.35 115.35 115.35 115.35 115.35 115.35 115.35 115.35 115.35 115.35 115.35 115.35 115.35 115.35 115.35 115.35 115.35
IVRS_Dem_A_Proj_RW_High_No WDM_Eskom Base_v3.xls Table F-2 (cont) 2011/08/04
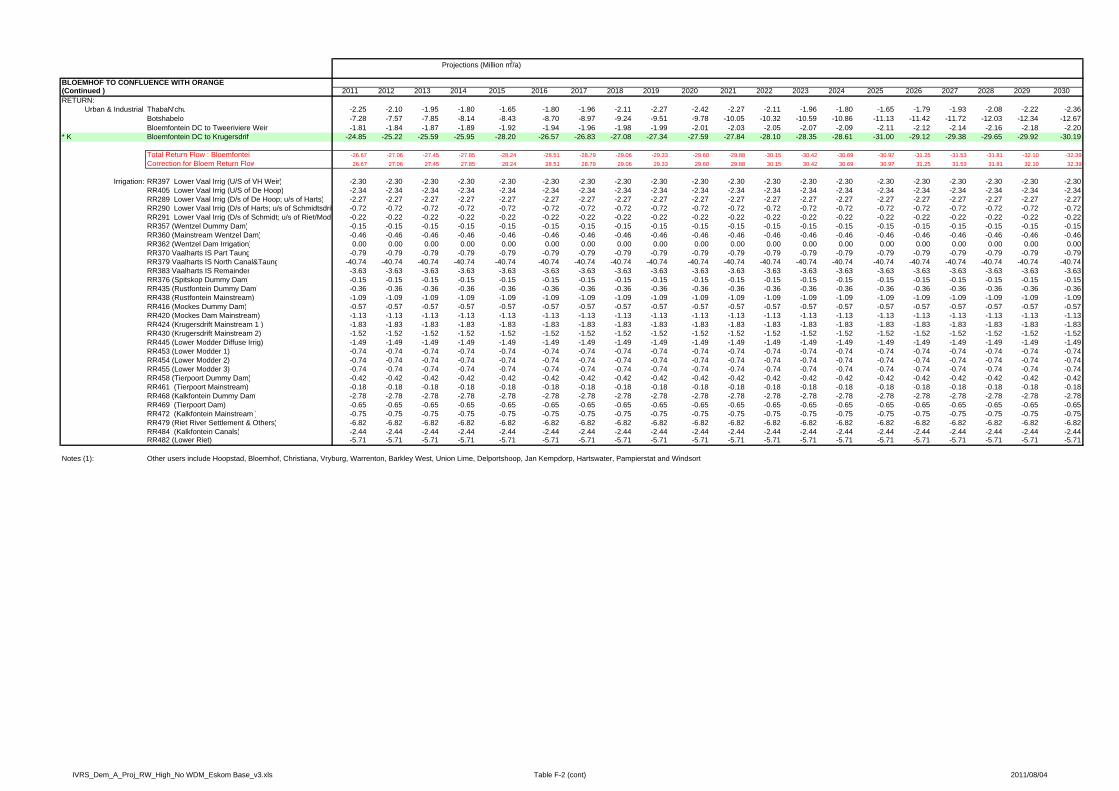
Projections (Million m3/a)
BLOEMHOF TO CONFLUENCE WITH ORANGE(Continued ) 2011 2012 2013 2014 2015 2016 2017 2018 2019 2020 2021 2022 2023 2024 2025 2026 2027 2028 2029 2030RETURN:
Urban & Industrial ThabaN'chu -2.25 -2.10 -1.95 -1.80 -1.65 -1.80 -1.96 -2.11 -2.27 -2.42 -2.27 -2.11 -1.96 -1.80 -1.65 -1.79 -1.93 -2.08 -2.22 -2.36Botshabelo -7.28 -7.57 -7.85 -8.14 -8.43 -8.70 -8.97 -9.24 -9.51 -9.78 -10.05 -10.32 -10.59 -10.86 -11.13 -11.42 -11.72 -12.03 -12.34 -12.67Bloemfontein DC to Tweeriviere Weir -1.81 -1.84 -1.87 -1.89 -1.92 -1.94 -1.96 -1.98 -1.99 -2.01 -2.03 -2.05 -2.07 -2.09 -2.11 -2.12 -2.14 -2.16 -2.18 -2.20
* K Bloemfontein DC to Krugersdrift -24.85 -25.22 -25.59 -25.95 -28.20 -26.57 -26.83 -27.08 -27.34 -27.59 -27.84 -28.10 -28.35 -28.61 -31.00 -29.12 -29.38 -29.65 -29.92 -30.19
Total Return Flow : Bloemfontein -26.67 -27.06 -27.45 -27.85 -28.24 -28.51 -28.79 -29.06 -29.33 -29.60 -29.88 -30.15 -30.42 -30.69 -30.97 -31.25 -31.53 -31.81 -32.10 -32.39Correction for Bloem Return Flow 26.67 27.06 27.45 27.85 28.24 28.51 28.79 29.06 29.33 29.60 29.88 30.15 30.42 30.69 30.97 31.25 31.53 31.81 32.10 32.39
Irrigation: RR397 Lower Vaal Irrig (U/S of VH Weir) -2.30 -2.30 -2.30 -2.30 -2.30 -2.30 -2.30 -2.30 -2.30 -2.30 -2.30 -2.30 -2.30 -2.30 -2.30 -2.30 -2.30 -2.30 -2.30 -2.30RR405 Lower Vaal Irrig (U/S of De Hoop) -2.34 -2.34 -2.34 -2.34 -2.34 -2.34 -2.34 -2.34 -2.34 -2.34 -2.34 -2.34 -2.34 -2.34 -2.34 -2.34 -2.34 -2.34 -2.34 -2.34RR289 Lower Vaal Irrig (D/s of De Hoop; u/s of Harts) -2.27 -2.27 -2.27 -2.27 -2.27 -2.27 -2.27 -2.27 -2.27 -2.27 -2.27 -2.27 -2.27 -2.27 -2.27 -2.27 -2.27 -2.27 -2.27 -2.27RR290 Lower Vaal Irrig (D/s of Harts; u/s of Schmidtsdrif -0.72 -0.72 -0.72 -0.72 -0.72 -0.72 -0.72 -0.72 -0.72 -0.72 -0.72 -0.72 -0.72 -0.72 -0.72 -0.72 -0.72 -0.72 -0.72 -0.72RR291 Lower Vaal Irrig (D/s of Schmidt; u/s of Riet/Mod -0.22 -0.22 -0.22 -0.22 -0.22 -0.22 -0.22 -0.22 -0.22 -0.22 -0.22 -0.22 -0.22 -0.22 -0.22 -0.22 -0.22 -0.22 -0.22 -0.22RR357 (Wentzel Dummy Dam) -0.15 -0.15 -0.15 -0.15 -0.15 -0.15 -0.15 -0.15 -0.15 -0.15 -0.15 -0.15 -0.15 -0.15 -0.15 -0.15 -0.15 -0.15 -0.15 -0.15RR360 (Mainstream Wentzel Dam) -0.46 -0.46 -0.46 -0.46 -0.46 -0.46 -0.46 -0.46 -0.46 -0.46 -0.46 -0.46 -0.46 -0.46 -0.46 -0.46 -0.46 -0.46 -0.46 -0.46RR362 (Wentzel Dam Irrigation) 0.00 0.00 0.00 0.00 0.00 0.00 0.00 0.00 0.00 0.00 0.00 0.00 0.00 0.00 0.00 0.00 0.00 0.00 0.00 0.00RR370 Vaalharts IS Part Taung -0.79 -0.79 -0.79 -0.79 -0.79 -0.79 -0.79 -0.79 -0.79 -0.79 -0.79 -0.79 -0.79 -0.79 -0.79 -0.79 -0.79 -0.79 -0.79 -0.79RR379 Vaalharts IS North Canal&Taung -40.74 -40.74 -40.74 -40.74 -40.74 -40.74 -40.74 -40.74 -40.74 -40.74 -40.74 -40.74 -40.74 -40.74 -40.74 -40.74 -40.74 -40.74 -40.74 -40.74RR383 Vaalharts IS Remainder -3.63 -3.63 -3.63 -3.63 -3.63 -3.63 -3.63 -3.63 -3.63 -3.63 -3.63 -3.63 -3.63 -3.63 -3.63 -3.63 -3.63 -3.63 -3.63 -3.63RR376 (Spitskop Dummy Dam) -0.15 -0.15 -0.15 -0.15 -0.15 -0.15 -0.15 -0.15 -0.15 -0.15 -0.15 -0.15 -0.15 -0.15 -0.15 -0.15 -0.15 -0.15 -0.15 -0.15RR435 (Rustfontein Dummy Dam) -0.36 -0.36 -0.36 -0.36 -0.36 -0.36 -0.36 -0.36 -0.36 -0.36 -0.36 -0.36 -0.36 -0.36 -0.36 -0.36 -0.36 -0.36 -0.36 -0.36RR438 (Rustfontein Mainstream) -1.09 -1.09 -1.09 -1.09 -1.09 -1.09 -1.09 -1.09 -1.09 -1.09 -1.09 -1.09 -1.09 -1.09 -1.09 -1.09 -1.09 -1.09 -1.09 -1.09RR416 (Mockes Dummy Dam) -0.57 -0.57 -0.57 -0.57 -0.57 -0.57 -0.57 -0.57 -0.57 -0.57 -0.57 -0.57 -0.57 -0.57 -0.57 -0.57 -0.57 -0.57 -0.57 -0.57RR420 (Mockes Dam Mainstream) -1.13 -1.13 -1.13 -1.13 -1.13 -1.13 -1.13 -1.13 -1.13 -1.13 -1.13 -1.13 -1.13 -1.13 -1.13 -1.13 -1.13 -1.13 -1.13 -1.13RR424 (Krugersdrift Mainstream 1 ) -1.83 -1.83 -1.83 -1.83 -1.83 -1.83 -1.83 -1.83 -1.83 -1.83 -1.83 -1.83 -1.83 -1.83 -1.83 -1.83 -1.83 -1.83 -1.83 -1.83RR430 (Krugersdrift Mainstream 2) -1.52 -1.52 -1.52 -1.52 -1.52 -1.52 -1.52 -1.52 -1.52 -1.52 -1.52 -1.52 -1.52 -1.52 -1.52 -1.52 -1.52 -1.52 -1.52 -1.52RR445 (Lower Modder Diffuse Irrig) -1.49 -1.49 -1.49 -1.49 -1.49 -1.49 -1.49 -1.49 -1.49 -1.49 -1.49 -1.49 -1.49 -1.49 -1.49 -1.49 -1.49 -1.49 -1.49 -1.49RR453 (Lower Modder 1) -0.74 -0.74 -0.74 -0.74 -0.74 -0.74 -0.74 -0.74 -0.74 -0.74 -0.74 -0.74 -0.74 -0.74 -0.74 -0.74 -0.74 -0.74 -0.74 -0.74RR454 (Lower Modder 2) -0.74 -0.74 -0.74 -0.74 -0.74 -0.74 -0.74 -0.74 -0.74 -0.74 -0.74 -0.74 -0.74 -0.74 -0.74 -0.74 -0.74 -0.74 -0.74 -0.74RR455 (Lower Modder 3) -0.74 -0.74 -0.74 -0.74 -0.74 -0.74 -0.74 -0.74 -0.74 -0.74 -0.74 -0.74 -0.74 -0.74 -0.74 -0.74 -0.74 -0.74 -0.74 -0.74RR458 (Tierpoort Dummy Dam) -0.42 -0.42 -0.42 -0.42 -0.42 -0.42 -0.42 -0.42 -0.42 -0.42 -0.42 -0.42 -0.42 -0.42 -0.42 -0.42 -0.42 -0.42 -0.42 -0.42RR461 (Tierpoort Mainstream) -0.18 -0.18 -0.18 -0.18 -0.18 -0.18 -0.18 -0.18 -0.18 -0.18 -0.18 -0.18 -0.18 -0.18 -0.18 -0.18 -0.18 -0.18 -0.18 -0.18RR468 (Kalkfontein Dummy Dam) -2.78 -2.78 -2.78 -2.78 -2.78 -2.78 -2.78 -2.78 -2.78 -2.78 -2.78 -2.78 -2.78 -2.78 -2.78 -2.78 -2.78 -2.78 -2.78 -2.78RR469 (Tierpoort Dam) -0.65 -0.65 -0.65 -0.65 -0.65 -0.65 -0.65 -0.65 -0.65 -0.65 -0.65 -0.65 -0.65 -0.65 -0.65 -0.65 -0.65 -0.65 -0.65 -0.65RR472 (Kalkfontein Mainstream ) -0.75 -0.75 -0.75 -0.75 -0.75 -0.75 -0.75 -0.75 -0.75 -0.75 -0.75 -0.75 -0.75 -0.75 -0.75 -0.75 -0.75 -0.75 -0.75 -0.75RR479 (Riet River Settlement & Others) -6.82 -6.82 -6.82 -6.82 -6.82 -6.82 -6.82 -6.82 -6.82 -6.82 -6.82 -6.82 -6.82 -6.82 -6.82 -6.82 -6.82 -6.82 -6.82 -6.82RR484 (Kalkfontein Canals) -2.44 -2.44 -2.44 -2.44 -2.44 -2.44 -2.44 -2.44 -2.44 -2.44 -2.44 -2.44 -2.44 -2.44 -2.44 -2.44 -2.44 -2.44 -2.44 -2.44RR482 (Lower Riet) -5.71 -5.71 -5.71 -5.71 -5.71 -5.71 -5.71 -5.71 -5.71 -5.71 -5.71 -5.71 -5.71 -5.71 -5.71 -5.71 -5.71 -5.71 -5.71 -5.71
Notes (1): Other users include Hoopstad, Bloemhof, Christiana, Vryburg, Warrenton, Barkley West, Union Lime, Delportshoop, Jan Kempdorp, Hartswater, Pampierstat and Windsorto
IVRS_Dem_A_Proj_RW_High_No WDM_Eskom Base_v3.xls Table F-2 (cont) 2011/08/04

Projections (Million m3/a)
BLOEMHOF TO CONFLUENCE WITH ORANGE(Including Harts & Riet/Modder Subsystems 2011 2012 2013 2014 2015 2016 2017 2018 2019 2020 2021 2022 2023 2024 2025 2026 2027 2028 2029 2030URBAN: Kimberley 19.33 19.15 18.98 18.80 18.63 18.36 18.10 17.84 17.57 17.31 17.05 16.78 16.52 16.26 15.99 15.73 15.47 15.20 14.94 14.68
Other Users(1) Region G 21.44 21.57 21.69 21.82 21.94 21.99 22.04 22.10 22.15 22.20 22.25 22.31 22.36 22.41 22.46 22.52 22.57 22.62 22.68 22.73Schweizer Reneke 1.17 1.20 1.24 1.27 1.31 1.34 1.38 1.42 1.46 1.50 1.54 1.59 1.63 1.68 1.72 1.77 1.82 1.87 1.93 1.98
* K ThabaN'chu 4.49 4.19 3.90 3.60 3.30 3.61 3.92 4.22 4.53 4.84 4.53 4.22 3.92 3.61 3.30 3.58 3.87 4.15 4.44 4.72* K Botshabelo 16.93 17.60 18.27 18.93 19.60 20.23 20.85 21.48 22.11 22.74 23.36 23.99 24.62 25.25 25.88 26.56 27.26 27.97 28.71 29.46
Mangaung LM 18.32 18.59 18.86 19.13 19.40 19.59 19.78 19.97 20.15 20.34 20.53 20.72 20.90 21.09 21.28 21.47 21.66 21.86 22.06 22.26* K Bloemfontein 52.05 52.82 53.58 54.35 55.12 55.65 56.18 56.72 57.25 57.78 58.31 58.84 59.38 59.91 60.44 60.99 61.54 62.09 62.66 63.22
Vaal-Gamagara 13.70 13.70 13.70 13.70 13.70 13.70 13.70 13.70 13.70 13.70 13.70 13.70 13.70 13.70 13.70 13.70 13.70 13.70 13.70 13.70* K Small Users:Welbedacht-Bloem pipeline 1.94 1.95 1.95 1.96 1.96 1.95 1.94 1.93 1.92 1.91 1.90 1.89 1.89 1.88 1.87 1.88 1.89 1.90 1.92 1.93
IRRIGATION: RR598 Lower Vaal Irrig (U/S of EWR16)RR397 Lower Vaal Irrig (U/S of VH Weir) 27.42 27.42 27.42 27.42 27.42 27.42 27.42 27.42 27.42 27.42 27.42 27.42 27.42 27.42 27.42 27.42 27.42 27.42 27.42 27.42RR405 Lower Vaal Irrig (U/S of De Hoop) 25.06 25.06 25.06 25.06 25.06 25.06 25.06 25.06 25.06 25.06 25.06 25.06 25.06 25.06 25.06 25.06 25.06 25.06 25.06 25.06RR289 Lower Vaal Irrig (D/s of De Hoop; u/s of Harts) 24.20 24.20 24.20 24.20 24.20 24.20 24.20 24.20 24.20 24.20 24.20 24.20 24.20 24.20 24.20 24.20 24.20 24.20 24.20 24.20RR290 Lower Vaal Irrig (D/s of Harts; u/s of Schmidtsdrif 7.67 7.67 7.67 7.67 7.67 7.67 7.67 7.67 7.67 7.67 7.67 7.67 7.67 7.67 7.67 7.67 7.67 7.67 7.67 7.67RR291 Lower Vaal Irrig (D/s of Schmidt; u/s of Riet/Mod 2.40 2.40 2.40 2.40 2.40 2.40 2.40 2.40 2.40 2.40 2.40 2.40 2.40 2.40 2.40 2.40 2.40 2.40 2.40 2.40RR357 (Wentzel Dummy Dam) 1.21 1.21 1.21 1.21 1.21 1.21 1.21 1.21 1.21 1.21 1.21 1.21 1.21 1.21 1.21 1.21 1.21 1.21 1.21 1.21RR360 (Mainstream Wentzel Dam) 3.62 3.62 3.62 3.62 3.62 3.62 3.62 3.62 3.62 3.62 3.62 3.62 3.62 3.62 3.62 3.62 3.62 3.62 3.62 3.62RR362 (Wentzel Dam Irrigation) 0.00 0.00 0.00 0.00 0.00 0.00 0.00 0.00 0.00 0.00 0.00 0.00 0.00 0.00 0.00 0.00 0.00 0.00 0.00 0.00RR370 Vaalharts GWS Part Taung 6.34 6.34 6.34 6.34 6.34 6.34 6.34 6.34 6.34 6.34 6.34 6.34 6.34 6.34 6.34 6.34 6.34 6.34 6.34 6.34RR379 Vaalharts GWS North Canal & Part Taung 270.04 270.04 270.04 270.04 270.04 270.04 270.04 270.04 270.04 270.04 270.04 270.04 270.04 270.04 270.04 270.04 270.04 270.04 270.04 270.04RR383 Vaalharts GWS West Canal & Barkley West 51.38 51.38 51.38 51.38 51.38 51.38 51.38 51.38 51.38 51.38 51.38 51.38 51.38 51.38 51.38 51.38 51.38 51.38 51.38 51.38RR376 (Spitskop Dummy Dam) 1.50 1.50 1.50 1.50 1.50 1.50 1.50 1.50 1.50 1.50 1.50 1.50 1.50 1.50 1.50 1.50 1.50 1.50 1.50 1.50RR407 (Spitskop Dam Irrigation) 12.81 12.81 12.81 12.81 12.81 12.81 12.81 12.81 12.81 12.81 12.81 12.81 12.81 12.81 12.81 12.81 12.81 12.81 12.81 12.81RR435 (Rustfontein Dummy Dam) 1.10 1.10 1.10 1.10 1.10 1.10 1.10 1.10 1.10 1.10 1.10 1.10 1.10 1.10 1.10 1.10 1.10 1.10 1.10 1.10RR438 (Rustfontein Mainstream) 3.29 3.29 3.29 3.29 3.29 3.29 3.29 3.29 3.29 3.29 3.29 3.29 3.29 3.29 3.29 3.29 3.29 3.29 3.29 3.29RR416 (Mockes Dummy Dam) 2.26 2.26 2.26 2.26 2.26 2.26 2.26 2.26 2.26 2.26 2.26 2.26 2.26 2.26 2.26 2.26 2.26 2.26 2.26 2.26RR420 (Mockes Dam Mainstream) 5.43 5.43 5.43 5.43 5.43 5.43 5.43 5.43 5.43 5.43 5.43 5.43 5.43 5.43 5.43 5.43 5.43 5.43 5.43 5.43RR424 (Krugersdrift Mainstream 1 ) 9.29 9.29 9.29 9.29 9.29 9.29 9.29 9.29 9.29 9.29 9.29 9.29 9.29 9.29 9.29 9.29 9.29 9.29 9.29 9.29RR430 (Krugersdrift Mainstream 2) 7.00 7.00 7.00 7.00 7.00 7.00 7.00 7.00 7.00 7.00 7.00 7.00 7.00 7.00 7.00 7.00 7.00 7.00 7.00 7.00RR445 (Lower Modder Diffuse Irrig) 20.27 20.27 20.27 20.27 20.27 20.27 20.27 20.27 20.27 20.27 20.27 20.27 20.27 20.27 20.27 20.27 20.27 20.27 20.27 20.27RR453 (Lower Modder 1) 9.49 9.49 9.49 9.49 9.49 9.49 9.49 9.49 9.49 9.49 9.49 9.49 9.49 9.49 9.49 9.49 9.49 9.49 9.49 9.49RR454 (Lower Modder 2) 9.49 9.49 9.49 9.49 9.49 9.49 9.49 9.49 9.49 9.49 9.49 9.49 9.49 9.49 9.49 9.49 9.49 9.49 9.49 9.49RR455 (Lower Modder 3) 9.49 9.49 9.49 9.49 9.49 9.49 9.49 9.49 9.49 9.49 9.49 9.49 9.49 9.49 9.49 9.49 9.49 9.49 9.49 9.49RR458 (Tierpoort Dummy Dam) 1.66 1.66 1.66 1.66 1.66 1.66 1.66 1.66 1.66 1.66 1.66 1.66 1.66 1.66 1.66 1.66 1.66 1.66 1.66 1.66RR461 (Tierpoort Mainstream) 0.71 0.71 0.71 0.71 0.71 0.71 0.71 0.71 0.71 0.71 0.71 0.71 0.71 0.71 0.71 0.71 0.71 0.71 0.71 0.71RR468 (Kalkfontein Dummy Dam) 41.79 41.79 41.79 41.79 41.79 41.79 41.79 41.79 41.79 41.79 41.79 41.79 41.79 41.79 41.79 41.79 41.79 41.79 41.79 41.79RR469 (Tierpoort Dam) 6.66 6.66 6.66 6.66 6.66 6.66 6.66 6.66 6.66 6.66 6.66 6.66 6.66 6.66 6.66 6.66 6.66 6.66 6.66 6.66RR472 (Kalkfontein Mainstream ) 7.92 7.92 7.92 7.92 7.92 7.92 7.92 7.92 7.92 7.92 7.92 7.92 7.92 7.92 7.92 7.92 7.92 7.92 7.92 7.92RR479 (Riet River Settlement & Others) 93.53 93.53 93.53 93.53 93.53 93.53 93.53 93.53 93.53 93.53 93.53 93.53 93.53 93.53 93.53 93.53 93.53 93.53 93.53 93.53RR484 (Kalkfontein Canals) 33.51 33.51 33.51 33.51 33.51 33.51 33.51 33.51 33.51 33.51 33.51 33.51 33.51 33.51 33.51 33.51 33.51 33.51 33.51 33.51RR482 (Lower Riet) 40.76 40.76 40.76 40.76 40.76 40.76 40.76 40.76 40.76 40.76 40.76 40.76 40.76 40.76 40.76 40.76 40.76 40.76 40.76 40.76
DIFFUSE: Harts River: HARTU7.ABS 2.80 2.80 2.80 2.80 2.80 2.80 2.80 2.80 2.80 2.80 2.80 2.80 2.80 2.80 2.80 2.80 2.80 2.80 2.80 2.80Harts River: HARTD7.ABS 0.39 0.39 0.39 0.39 0.39 0.39 0.39 0.39 0.39 0.39 0.39 0.39 0.39 0.39 0.39 0.39 0.39 0.39 0.39 0.39All Afforestation 0.00 0.00 0.00 0.00 0.00 0.00 0.00 0.00 0.00 0.00 0.00 0.00 0.00 0.00 0.00 0.00 0.00 0.00 0.00 0.00
LOSSES: River Evaporation d/s Bloemhof Dam 78.10 78.10 78.10 78.10 78.10 78.10 78.10 78.10 78.10 78.10 78.10 78.10 78.10 78.10 78.10 78.10 78.10 78.10 78.10 78.10Vaalharts Irrigation Distribution Losses 127.02 127.02 127.02 127.02 127.02 127.02 127.02 127.02 127.02 127.02 127.02 127.02 127.02 127.02 127.02 127.02 127.02 127.02 127.02 127.02Lower Vaal Operational Losses 115.35 115.35 115.35 115.35 115.35 115.35 115.35 115.35 115.35 115.35 115.35 115.35 115.35 115.35 115.35 115.35 115.35 115.35 115.35 115.35
IVRS_Dem_A_Proj_RW_High_No WDM_Eskom Base_v3.xls Table F-2 (cont) 2011/08/04
Status Quo Report V13_1.docx September 2011
Appendix G:
Summary of Information Relative to Biophysical Nodes
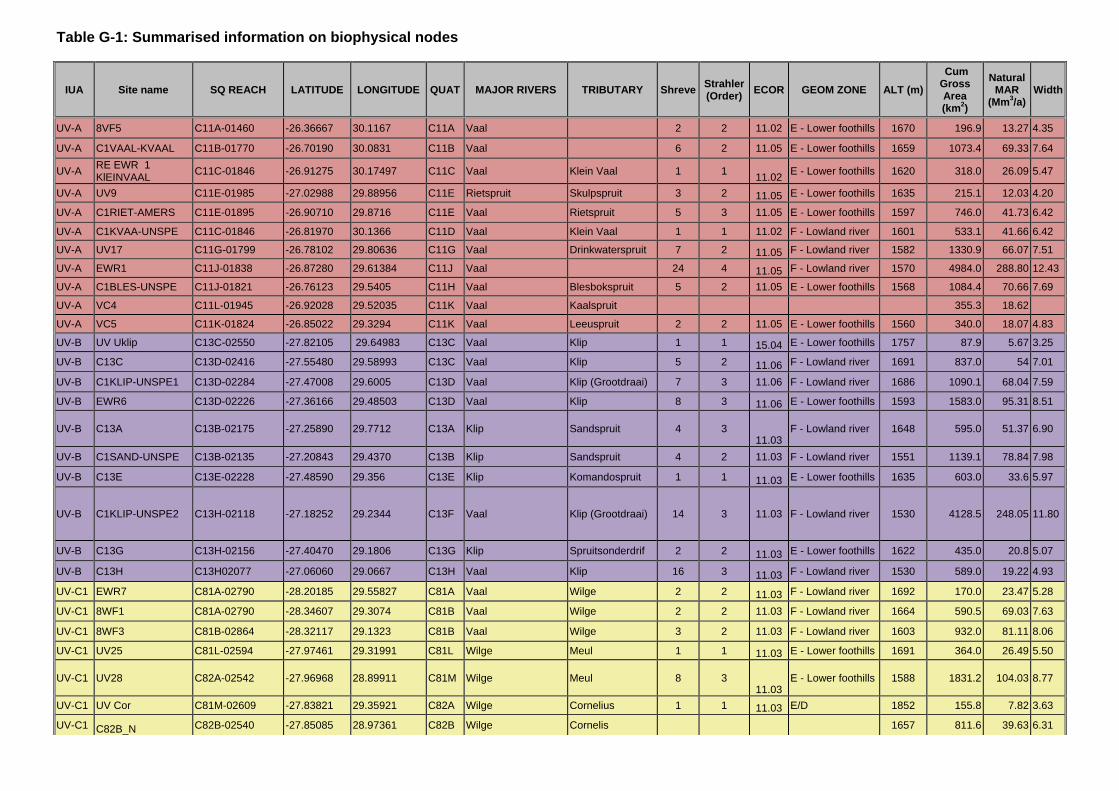
Table G-1: Summarised information on biophysical nodes
IUA Site name SQ REACH LATITUDE LONGITUDE QUAT MAJOR RIVERS TRIBUTARY Shreve Strahler (Order) ECOR GEOM ZONE ALT (m)
Cum Gross Area (km2)
Natural MAR
(Mm3/a) Width
UV-A 8VF5 C11A-01460 -26.36667 30.1167 C11A Vaal 2 2 11.02 E - Lower foothills 1670 196.9 13.27 4.35
UV-A C1VAAL-KVAAL C11B-01770 -26.70190 30.0831 C11B Vaal 6 2 11.05 E - Lower foothills 1659 1073.4 69.33 7.64
UV-A RE EWR 1 KlEINVAAL C11C-01846 -26.91275 30.17497 C11C Vaal Klein Vaal 1 1 11.02 E - Lower foothills 1620 318.0 26.09 5.47
UV-A UV9 C11E-01985 -27.02988 29.88956 C11E Rietspruit Skulpspruit 3 2 11.05 E - Lower foothills 1635 215.1 12.03 4.20
UV-A C1RIET-AMERS C11E-01895 -26.90710 29.8716 C11E Vaal Rietspruit 5 3 11.05 E - Lower foothills 1597 746.0 41.73 6.42
UV-A C1KVAA-UNSPE C11C-01846 -26.81970 30.1366 C11D Vaal Klein Vaal 1 1 11.02 F - Lowland river 1601 533.1 41.66 6.42
UV-A UV17 C11G-01799 -26.78102 29.80636 C11G Vaal Drinkwaterspruit 7 2 11.05 F - Lowland river 1582 1330.9 66.07 7.51
UV-A EWR1 C11J-01838 -26.87280 29.61384 C11J Vaal 24 4 11.05 F - Lowland river 1570 4984.0 288.80 12.43
UV-A C1BLES-UNSPE C11J-01821 -26.76123 29.5405 C11H Vaal Blesbokspruit 5 2 11.05 E - Lower foothills 1568 1084.4 70.66 7.69
UV-A VC4 C11L-01945 -26.92028 29.52035 C11K Vaal Kaalspruit 355.3 18.62
UV-A VC5 C11K-01824 -26.85022 29.3294 C11K Vaal Leeuspruit 2 2 11.05 E - Lower foothills 1560 340.0 18.07 4.83
UV-B UV Uklip C13C-02550 -27.82105 29.64983 C13C Vaal Klip 1 1 15.04 E - Lower foothills 1757 87.9 5.67 3.25
UV-B C13C C13D-02416 -27.55480 29.58993 C13C Vaal Klip 5 2 11.06 F - Lowland river 1691 837.0 54 7.01
UV-B C1KLIP-UNSPE1 C13D-02284 -27.47008 29.6005 C13D Vaal Klip (Grootdraai) 7 3 11.06 F - Lowland river 1686 1090.1 68.04 7.59
UV-B EWR6 C13D-02226 -27.36166 29.48503 C13D Vaal Klip 8 3 11.06 E - Lower foothills 1593 1583.0 95.31 8.51
UV-B C13A C13B-02175 -27.25890 29.7712 C13A Klip Sandspruit 4 3 11.03
F - Lowland river 1648 595.0 51.37 6.90
UV-B C1SAND-UNSPE C13B-02135 -27.20843 29.4370 C13B Klip Sandspruit 4 2 11.03 F - Lowland river 1551 1139.1 78.84 7.98
UV-B C13E C13E-02228 -27.48590 29.356 C13E Klip Komandospruit 1 1 11.03 E - Lower foothills 1635 603.0 33.6 5.97
UV-B C1KLIP-UNSPE2 C13H-02118 -27.18252 29.2344 C13F Vaal Klip (Grootdraai) 14 3 11.03 F - Lowland river 1530 4128.5 248.05 11.80
UV-B C13G C13H-02156 -27.40470 29.1806 C13G Klip Spruitsonderdrif 2 2 11.03 E - Lower foothills 1622 435.0 20.8 5.07
UV-B C13H C13H02077 -27.06060 29.0667 C13H Vaal Klip 16 3 11.03 F - Lowland river 1530 589.0 19.22 4.93
UV-C1 EWR7 C81A-02790 -28.20185 29.55827 C81A Vaal Wilge 2 2 11.03 F - Lowland river 1692 170.0 23.47 5.28
UV-C1 8WF1 C81A-02790 -28.34607 29.3074 C81B Vaal Wilge 2 2 11.03 F - Lowland river 1664 590.5 69.03 7.63
UV-C1 8WF3 C81B-02864 -28.32117 29.1323 C81B Vaal Wilge 3 2 11.03 F - Lowland river 1603 932.0 81.11 8.06
UV-C1 UV25 C81L-02594 -27.97461 29.31991 C81L Wilge Meul 1 1 11.03 E - Lower foothills 1691 364.0 26.49 5.50
UV-C1 UV28 C82A-02542 -27.96968 28.89911 C81M Wilge Meul 8 3 11.03
E - Lower foothills 1588 1831.2 104.03 8.77
UV-C1 UV Cor C81M-02609 -27.83821 29.35921 C82A Wilge Cornelius 1 1 11.03 E/D 1852 155.8 7.82 3.63
UV-C1 C82B_N C82B-02540 -27.85085 28.97361 C82B Wilge Cornelis 1657 811.6 39.63 6.31

Table G-1 (cont): Summarised information on biophysical nodes
IUA Site name SQ REACH LATITUDE LONGITUDE QUAT MAJOR RIVERS TRIBUTARY Shreve Strahler (Order) ECOR GEOM ZONE ALT (m)
Cum Gross Area (km2)
Natural MAR
(Mm3/a) Width
UV-C2 C81G C81G-02882 -28.29600 28.8042 C81G Elands Klerkspruit 1 1 15.01 E - Lower foothills 1614 435.0 22.13 5.18
UV-C2 GG C81G-02882 -28.41915 28.7569 C81G 115.0 5.85
UV-C2 C81J C81K-02710 -28.08190 28.8374 C81J Wilge Vaalbanksspruit 6 3 11.03 E - Lower foothills 1591 392.0 12 4.20
UV-C2 C81C C81C-02978 -28.34950 29.0921 C81C Nuwejaarspruit Fraser/Modder 3 2 11.03 E - Lower foothills 1621 250.0 18.41 4.86
UV-C2 C8NUWE-CONFL C81E-02930 -28.28459 29.0902 C81E Wilge Nuwejaarspruit 4 2 11.03 E - Lower foothills 1604 526.6 39.87 6.33
UV-C2 EWR8 C82C-2505 -27.80017 28.76778 C82C Vaal Wilge 37 4 11.03 F - Lowland river 1573 7503.0 474.25 14.72
UV-C2 C82D C82D-02490 -27.72390 28.7378 C82D Wilge Rus-se-spruit 2 2 11.03 E - Lower foothills 1556 572.0 19.6 4.97
UV-C3 UV31 C82E-02418 -27.67999 28.79244 C82G Wilge Holspruit 1 1 11.03
E - Lower foothills 1558 728.7 32.90 5.92
UV-C3 VC8 C82G-02415 -27.62093 28.71455 C82G Wilge Wilge Trib
151.5 6.34 3.38
UV-C3 UV35 C82F-02326 -27.5164 28.84841 C82F Wilge Grootspruit 1 1 11.03 E - Lower foothills 1581 295.6 11.08 4.09
UV-C3 VC9 C82H-02200 -27.30345 28.54006 C82H Vaal Wilge 10632.8 591.39 15.87
UV-D VC15 C83A-02863 -28.24825 28.43693 C83A Liebenbergsvlei 374.9 14.36
UV-D C83D C83E-02588 -28.05430 28.496 C83D Liebenbergsvlei Tierkloof 5 2 11.03 F - Lowland river 1634 465.0 12.42 4.25
UV-D C83E_N C83E-02579 -27.86420 28.3152 C83E Liebenbergsvlei Tierkloof 6 2 11.03 F - Lowland river 1590 891.0 23.31 5.27
UV-D VC16 C83G-02364 -27.59181 28.44803 C83G Liebenbergsvlei Unnamed tributary 138.7 4.74
UV-D VC17 C23H-02395 -27.55691 28.47909 C83H Liebenbergsvlei Unnamed tributary 75.5 2.66
UV-E VC6 C12D-01576 -26.57524 2903541 C12D Vaal Waterval 695.4 59.33
UV-E WA1 C12F-01722 -26.64608 29.0186 C12F Vaal Waterval 36 4 11.05 F - Lowland river 1560 970.3 80.37 8.03
UV-E VC7 C12F-01728 -26.66121 29.02656 C12F Waterval Unnamed tribuutary 41.3 2.12
UV-E WA2 C12G-01896 -26.88543 28.8836 C12F Vaal Waterval 46 4 11.05 F - Lowland river 1534 2278.0 149.84 9.93
UV-E UV WV C12G-01963 -26.96028 28.74577 C12G Vaal Waterval 56 4 11.05 F - Lowland river 1499 2786.9 177.67 10.53
UV-F UV45 C83K-02204 -27.25842 28.40691 C83K Wilge Kromspruit 2 2 11.03 F - Lowland river 1492 545.6 25.70 5.45
UV-F C8KLIP-VAALD C83L-02057 -27.14232 28.2780 C83L Vaal Klip (flows into Vaal Dam from FS)
5 2 11.03 F - Lowland river 1490 764.7 35.59 6.09
UV-G EWR2 C11M-01894 -26.92110 29.27929 C11M Vaal 39 4 11.03 F - Lowland river 1537 7995.0 457.68 14.54
UV-G 8VF3 C11M-01901 -26.93450 29.1716 C11M Vaal Brakspruit 1 1 11.05 E - Lower foothills 1553 75.1 3.36 2.72
UV-G C12A C12B-02028 -27.14630 28.9869 C12A Vaal Venterspruit 2 2 11.03 E - Lower foothills 1527 485.0 21 5.08
UV-G EWR3 C12C-01997 -26.99087 28.72971 C12H Vaal 64 4 11.03 F - Lowland river 1487 15638.0 852.13 17.97
UV-G C12K C12L-01881 -26.91350 28.4396 C12K Vaal Molspruit 3 2 11.03 E - Lower foothills 1492 479.0 22 5.16
UV-G C12J C12J-02091 -27.07250 28.5643 C12J Vaal Bankplaasspruit 4 3 11.03 E - Lower foothills 1492 344.0 12.43 4.25

Table G-1 (cont): Summarised information on biophysical nodes
IUA Site name SQ REACH LATITUDE LONGITUDE QUAT MAJOR RIVERS TRIBUTARY Shreve Strahler (Order) ECOR GEOM ZONE ALT (m)
Cum Gross Area (km2)
Natural MAR
(Mm3/a) Width
UV-H C21A C12A-01567 -26.49603 28.61488 C21A Vaal Suikerbosrand 4 3 11.03 F - Lowland river 1598 707.0 28.65 5.65
UV-H EWR 9 C21C-01675 -26.64670 28.38197 C21C Vaal Suikerbosrand 5 3 11.01 E - Lower foothills 1509 1175.0 31.31 5.83
UV-I EWR10 C21G-01627 -26.68137 28.16798 C21G Vaal Suikerbosrand 15 3 11.01 F - Lowland river 1453 3271.0 86.97 8.25
UV-I EWR11 C21F-01447 -26.47892 28.42488 C21F Suikerbosrand Blesbokspruit 5 2 11.03 E - Lower foothills 1528 1098.0 29.14 5.68
UV-I VC11 C22C-01509 -26.45020 28.08742 C22C Klip River Rietspruit
857.0 36.60 6.14
UV-I VC12 C22A-01315 -26.44551 28.0883 C22D Vaal Klip River
893.0 39.21 6.29
UV-I VC13 C22E-01619 -26.66614 27.95634 C22E Vaal Klip River
2309.4 96.98 8.57
UV-I VC14 C22K-01765 -26.72464 27.71865 C22J Vaal Rietspruit
926.1 22.10 5.17
UV-J C22G C22K-01795 -26.82200 27.9262 C22G Vaal Taaibosspruit 5 3 11.03 F - Lowland river 1430 831.0 18.4 4.86
UV-K UV53 C23A-01811 -26.79594 27.56550 C23B Vaal Kromelmboogspruit 1 1 11.01 E - Lower foothills 1416 724.1 14.30 4.46
UV-L C23F C23G-01250 -26.23650 27.1525 C23F Vaal Mooi River 2 2 11.01 E - Lower foothills 1469 1324.0 37.69 6.21
UV-L RE EWR 2 MOOI C23G-01250 -26.25867 27.15973 C23G Vaal Mooi 2 2 11.01 E - Lower foothills 1457 1324.0 37.69 6.21
UV-L VC19 C23G-01406 -26.37560 27.23191 C23E Mooi Mooirivierloop
1360.00 25.96 5.46
UV-L M2 C23K-01579 -26.62159 27.28771 C23K Mooi Loopspruit
890.0 20.26 5.02
UV-L VC20 C23L-01827 -26.87589 26.95687 C23L Vaal Mooi 5535.30 132.21 9.52
UV-M EWR4 -26.84262 28.1123 C22F Vaal 212 5 11.03 E - Lower foothills 1445 38638.0 1977.26 23.95
UV-M EWR5 -26.93243 27.01367 C23L Vaal 254 5 11.08 F - Lowland river 1309 49739.0 2288.01 25.17
MV-A VC24 C70B-02323 -27.58352 27.882275 C70A Vaal River Renoster River 2 2 11.03 E - Lower foothills 1506 613 18.46 4.86
MV-A VC25 C70B-02297 -27.40814 27.785685 C70B Renoster River Renoster River 3 2 11.03 E - Lower foothills 1444 881.2 25.55 5.43
MV-A VC26 C70C-02233 -27.31769 27.8012 C70C Renoster River Leufonteinspruit 1 1 11.03 F - Lowland river 1429 80.69 2.11 2.32
MV-A R1 C70D-02182 -27.26827 27.548079 C70D Vaal River Renoster River 9 3 11.03 F - Lowland river 1380 2413.28 63.86 7.43
MV-A VC27 C70D-02215 -27.27708 27.547543 C70D Renoster River Doringspruit 1 1 11.03 Z 1378 421.72 7.86 3.64
MV-A R2 C70J-02163 -27.26447 27.17648 C70F Vaal River Renoster River 15 3 11.01 F - Lowland river 1336 4092 93.14 8.45
MV-A VC29 C70H-02208 -27.27119 27.176474 C70H Renoster River Heuningspruit 3 2 11.01 F - Lowland river 1347 1152 17.94 4.82
MV-A VC30 C70J-01955 -26.98060 26.93294 C70K Vaal River Renoster River 21 3 11.08 Z 1301 5867.6 120.92 9.23
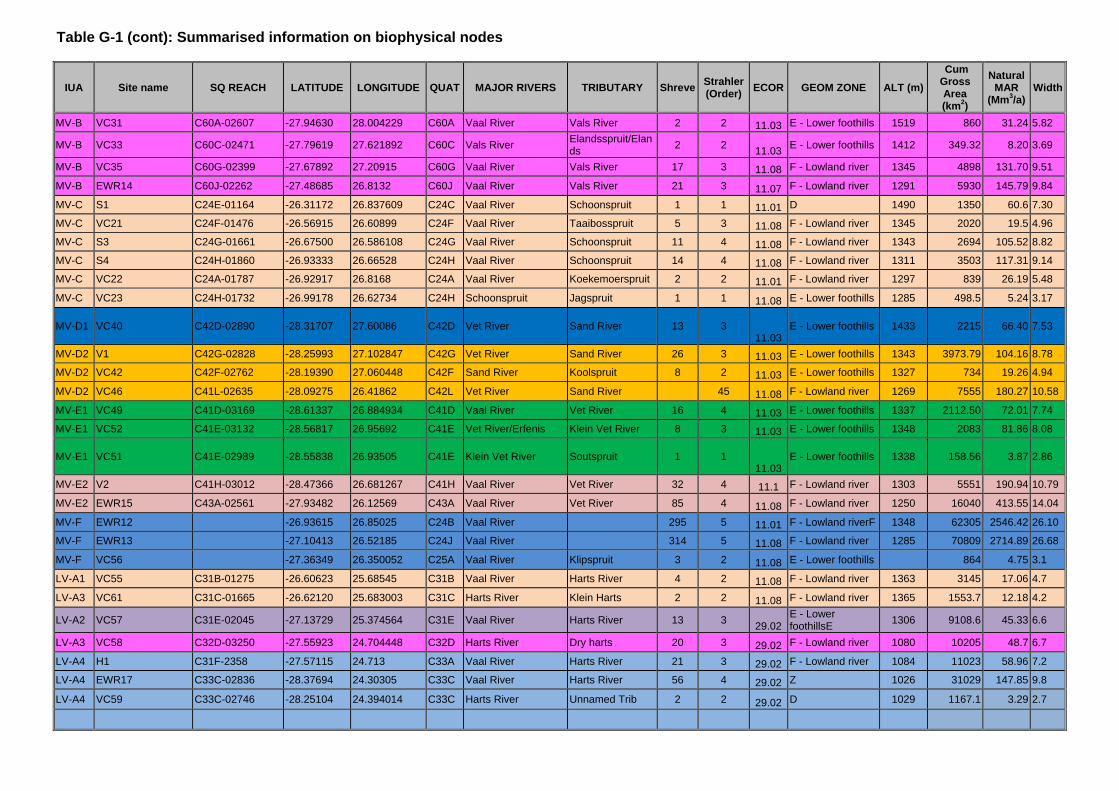
Table G-1 (cont): Summarised information on biophysical nodes
IUA Site name SQ REACH LATITUDE LONGITUDE QUAT MAJOR RIVERS TRIBUTARY Shreve Strahler (Order) ECOR GEOM ZONE ALT (m)
Cum Gross Area (km2)
Natural MAR
(Mm3/a) Width
MV-B VC31 C60A-02607 -27.94630 28.004229 C60A Vaal River Vals River 2 2 11.03 E - Lower foothills 1519 860 31.24 5.82
MV-B VC33 C60C-02471 -27.79619 27.621892 C60C Vals River Elandsspruit/Elands 2 2 11.03 E - Lower foothills 1412 349.32 8.20 3.69
MV-B VC35 C60G-02399 -27.67892 27.20915 C60G Vaal River Vals River 17 3 11.08 F - Lowland river 1345 4898 131.70 9.51
MV-B EWR14 C60J-02262 -27.48685 26.8132 C60J Vaal River Vals River 21 3 11.07 F - Lowland river 1291 5930 145.79 9.84
MV-C S1 C24E-01164 -26.31172 26.837609 C24C Vaal River Schoonspruit 1 1 11.01 D 1490 1350 60.6 7.30
MV-C VC21 C24F-01476 -26.56915 26.60899 C24F Vaal River Taaibosspruit 5 3 11.08 F - Lowland river 1345 2020 19.5 4.96
MV-C S3 C24G-01661 -26.67500 26.586108 C24G Vaal River Schoonspruit 11 4 11.08 F - Lowland river 1343 2694 105.52 8.82
MV-C S4 C24H-01860 -26.93333 26.66528 C24H Vaal River Schoonspruit 14 4 11.08 F - Lowland river 1311 3503 117.31 9.14
MV-C VC22 C24A-01787 -26.92917 26.8168 C24A Vaal River Koekemoerspruit 2 2 11.01 F - Lowland river 1297 839 26.19 5.48
MV-C VC23 C24H-01732 -26.99178 26.62734 C24H Schoonspruit Jagspruit 1 1 11.08 E - Lower foothills 1285 498.5 5.24 3.17
MV-D1 VC40 C42D-02890 -28.31707 27.60086 C42D Vet River Sand River 13 3 11.03
E - Lower foothills 1433 2215 66.40 7.53
MV-D2 V1 C42G-02828 -28.25993 27.102847 C42G Vet River Sand River 26 3 11.03 E - Lower foothills 1343 3973.79 104.16 8.78
MV-D2 VC42 C42F-02762 -28.19390 27.060448 C42F Sand River Koolspruit 8 2 11.03 E - Lower foothills 1327 734 19.26 4.94
MV-D2 VC46 C41L-02635 -28.09275 26.41862 C42L Vet River Sand River 45 11.08 F - Lowland river 1269 7555 180.27 10.58
MV-E1 VC49 C41D-03169 -28.61337 26.884934 C41D Vaal River Vet River 16 4 11.03 E - Lower foothills 1337 2112.50 72.01 7.74
MV-E1 VC52 C41E-03132 -28.56817 26.95692 C41E Vet River/Erfenis Klein Vet River 8 3 11.03 E - Lower foothills 1348 2083 81.86 8.08
MV-E1 VC51 C41E-02989 -28.55838 26.93505 C41E Klein Vet River Soutspruit 1 1 11.03
E - Lower foothills 1338 158.56 3.87 2.86
MV-E2 V2 C41H-03012 -28.47366 26.681267 C41H Vaal River Vet River 32 4 11.1 F - Lowland river 1303 5551 190.94 10.79
MV-E2 EWR15 C43A-02561 -27.93482 26.12569 C43A Vaal River Vet River 85 4 11.08 F - Lowland river 1250 16040 413.55 14.04
MV-F EWR12 -26.93615 26.85025 C24B Vaal River 295 5 11.01 F - Lowland riverF 1348 62305 2546.42 26.10
MV-F EWR13 -27.10413 26.52185 C24J Vaal River 314 5 11.08 F - Lowland river 1285 70809 2714.89 26.68
MV-F VC56 -27.36349 26.350052 C25A Vaal River Klipspruit 3 2 11.08 E - Lower foothills 864 4.75 3.1
LV-A1 VC55 C31B-01275 -26.60623 25.68545 C31B Vaal River Harts River 4 2 11.08 F - Lowland river 1363 3145 17.06 4.7
LV-A3 VC61 C31C-01665 -26.62120 25.683003 C31C Harts River Klein Harts 2 2 11.08 F - Lowland river 1365 1553.7 12.18 4.2
LV-A2 VC57 C31E-02045 -27.13729 25.374564 C31E Vaal River Harts River 13 3 29.02E - Lower foothillsE 1306 9108.6 45.33 6.6
LV-A3 VC58 C32D-03250 -27.55923 24.704448 C32D Harts River Dry harts 20 3 29.02 F - Lowland river 1080 10205 48.7 6.7
LV-A4 H1 C31F-2358 -27.57115 24.713 C33A Vaal River Harts River 21 3 29.02 F - Lowland river 1084 11023 58.96 7.2
LV-A4 EWR17 C33C-02836 -28.37694 24.30305 C33C Vaal River Harts River 56 4 29.02 Z 1026 31029 147.85 9.8
LV-A4 VC59 C33C-02746 -28.25104 24.394014 C33C Harts River Unnamed Trib 2 2 29.02 D 1029 1167.1 3.29 2.7
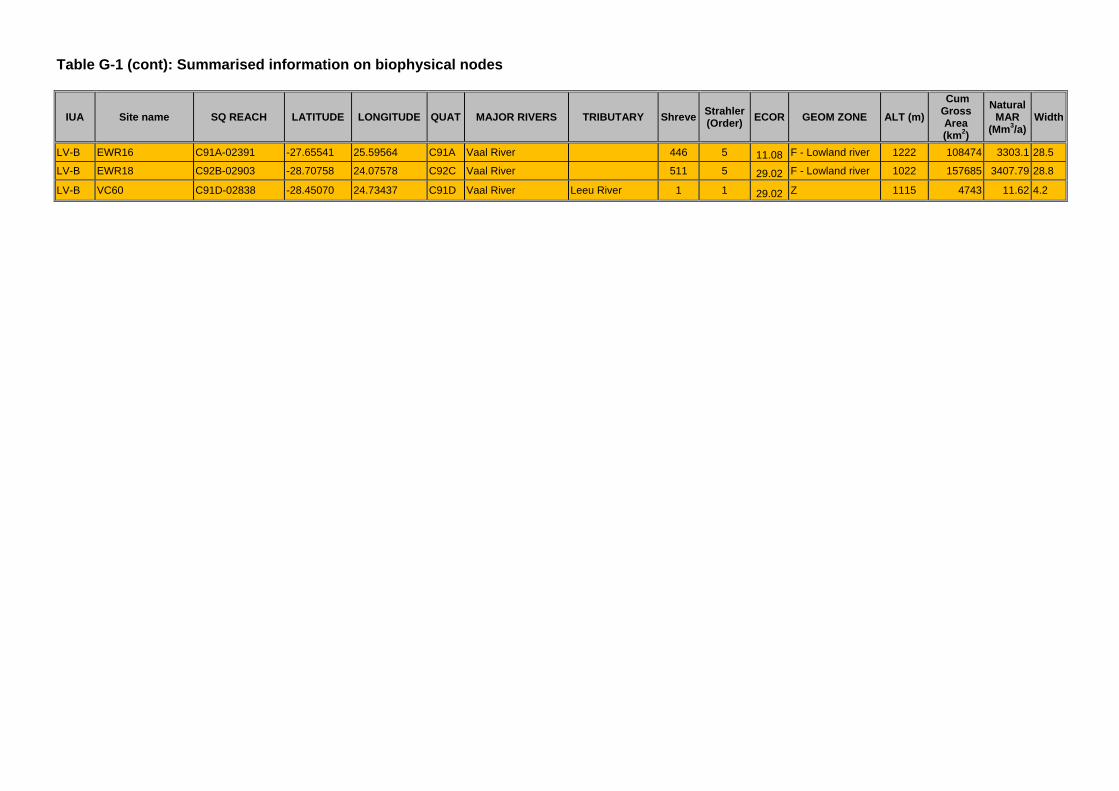
Table G-1 (cont): Summarised information on biophysical nodes
IUA Site name SQ REACH LATITUDE LONGITUDE QUAT MAJOR RIVERS TRIBUTARY Shreve Strahler (Order) ECOR GEOM ZONE ALT (m)
Cum Gross Area (km2)
Natural MAR
(Mm3/a) Width
LV-B EWR16 C91A-02391 -27.65541 25.59564 C91A Vaal River 446 5 11.08 F - Lowland river 1222 108474 3303.1 28.5
LV-B EWR18 C92B-02903 -28.70758 24.07578 C92C Vaal River 511 5 29.02 F - Lowland river 1022 157685 3407.79 28.8
LV-B VC60 C91D-02838 -28.45070 24.73437 C91D Vaal River Leeu River 1 1 29.02 Z 1115 4743 11.62 4.2
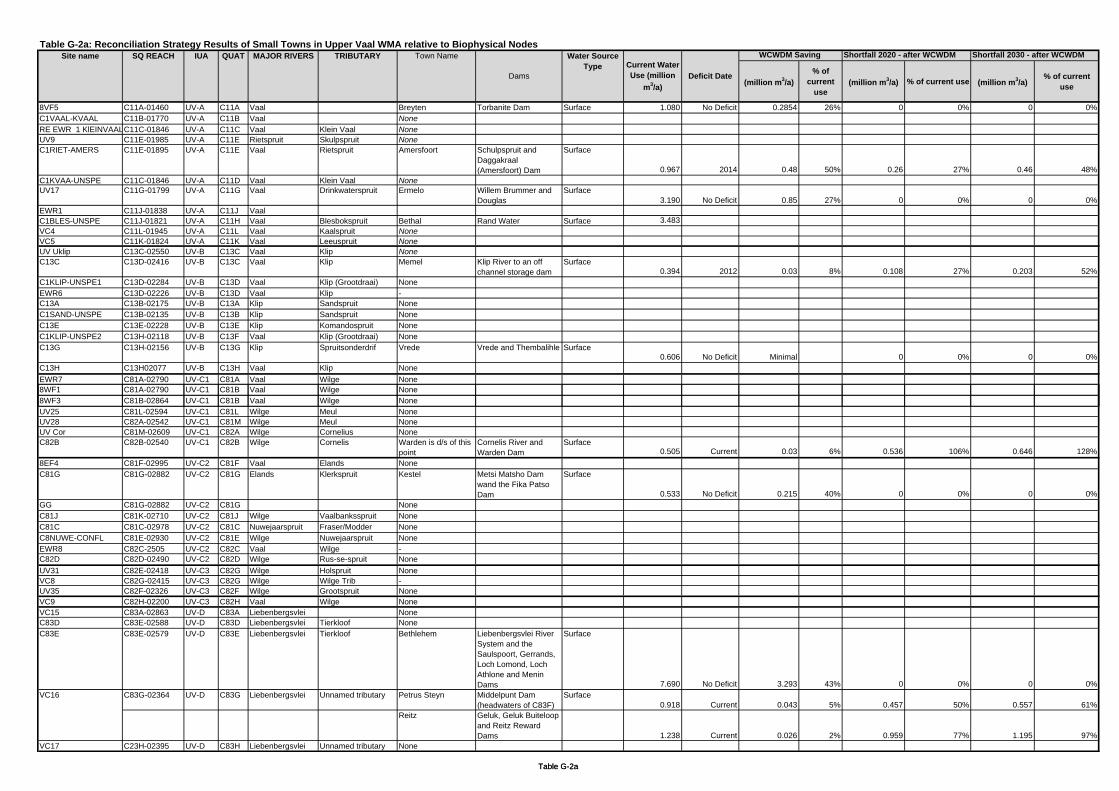
Table G-2a: Reconciliation Strategy Results of Small Towns in Upper Vaal WMA relative to Biophysical Nodes
(million m3/a)% of
current use
(million m3/a) % of current use (million m3/a)% of current
use
8VF5 C11A-01460 UV-A C11A Vaal Breyten Torbanite Dam Surface 1.080 No Deficit 0.2854 26% 0 0% 0 0%C1VAAL-KVAAL C11B-01770 UV-A C11B Vaal NoneRE EWR 1 KlEINVAALC11C-01846 UV-A C11C Vaal Klein Vaal NoneUV9 C11E-01985 UV-A C11E Rietspruit Skulpspruit NoneC1RIET-AMERS C11E-01895 UV-A C11E Vaal Rietspruit Amersfoort Schulpspruit and
Daggakraal (Amersfoort) Dam
Surface
0.967 2014 0.48 50% 0.26 27% 0.46 48%C1KVAA-UNSPE C11C-01846 UV-A C11D Vaal Klein Vaal NoneUV17 C11G-01799 UV-A C11G Vaal Drinkwaterspruit Ermelo Willem Brummer and
DouglasSurface
3.190 No Deficit 0.85 27% 0 0% 0 0%EWR1 C11J-01838 UV-A C11J VaalC1BLES-UNSPE C11J-01821 UV-A C11H Vaal Blesbokspruit Bethal Rand Water Surface 3.483VC4 C11L-01945 UV-A C11L Vaal Kaalspruit NoneVC5 C11K-01824 UV-A C11K Vaal Leeuspruit NoneUV Uklip C13C-02550 UV-B C13C Vaal Klip NoneC13C C13D-02416 UV-B C13C Vaal Klip Memel Klip River to an off
channel storage dam Surface
0.394 2012 0.03 8% 0.108 27% 0.203 52%C1KLIP-UNSPE1 C13D-02284 UV-B C13D Vaal Klip (Grootdraai) NoneEWR6 C13D-02226 UV-B C13D Vaal Klip -C13A C13B-02175 UV-B C13A Klip Sandspruit NoneC1SAND-UNSPE C13B-02135 UV-B C13B Klip Sandspruit NoneC13E C13E-02228 UV-B C13E Klip Komandospruit NoneC1KLIP-UNSPE2 C13H-02118 UV-B C13F Vaal Klip (Grootdraai) NoneC13G C13H-02156 UV-B C13G Klip Spruitsonderdrif Vrede Vrede and Thembalihle Surface
0.606 No Deficit Minimal 0 0% 0 0%C13H C13H02077 UV-B C13H Vaal Klip NoneEWR7 C81A-02790 UV-C1 C81A Vaal Wilge None8WF1 C81A-02790 UV-C1 C81B Vaal Wilge None
IUA QUAT MAJOR RIVERS TRIBUTARY WCWDM Saving Shortfall 2020 - after WCWDM Shortfall 2030 - after WCWDMCurrent Water Use (million
m3/a)
Site name Town Name
Dams
Water Source Type
Deficit Date
SQ REACH
Table G-2a
8WF3 C81B-02864 UV-C1 C81B Vaal Wilge NoneUV25 C81L-02594 UV-C1 C81L Wilge Meul NoneUV28 C82A-02542 UV-C1 C81M Wilge Meul NoneUV Cor C81M-02609 UV-C1 C82A Wilge Cornelius NoneC82B C82B-02540 UV-C1 C82B Wilge Cornelis Warden is d/s of this
pointCornelis River and Warden Dam
Surface0.505 Current 0.03 6% 0.536 106% 0.646 128%
8EF4 C81F-02995 UV-C2 C81F Vaal Elands NoneC81G C81G-02882 UV-C2 C81G Elands Klerkspruit Kestel Metsi Matsho Dam
wand the Fika Patso Dam
Surface
0.533 No Deficit 0.215 40% 0 0% 0 0%GG C81G-02882 UV-C2 C81G NoneC81J C81K-02710 UV-C2 C81J Wilge Vaalbanksspruit NoneC81C C81C-02978 UV-C2 C81C Nuwejaarspruit Fraser/Modder NoneC8NUWE-CONFL C81E-02930 UV-C2 C81E Wilge Nuwejaarspruit NoneEWR8 C82C-2505 UV-C2 C82C Vaal Wilge -C82D C82D-02490 UV-C2 C82D Wilge Rus-se-spruit NoneUV31 C82E-02418 UV-C3 C82G Wilge Holspruit NoneVC8 C82G-02415 UV-C3 C82G Wilge Wilge Trib -UV35 C82F-02326 UV-C3 C82F Wilge Grootspruit NoneVC9 C82H-02200 UV-C3 C82H Vaal Wilge NoneVC15 C83A-02863 UV-D C83A Liebenbergsvlei NoneC83D C83E-02588 UV-D C83D Liebenbergsvlei Tierkloof NoneC83E C83E-02579 UV-D C83E Liebenbergsvlei Tierkloof Bethlehem Liebenbergsvlei River
System and the Saulspoort, Gerrands, Loch Lomond, Loch Athlone and Menin Dams
Surface
7.690 No Deficit 3.293 43% 0 0% 0 0%C83G-02364 UV-D C83G Liebenbergsvlei Unnamed tributary Petrus Steyn Middelpunt Dam
(headwaters of C83F)Surface
0.918 Current 0.043 5% 0.457 50% 0.557 61%Reitz Geluk, Geluk Buiteloop
and Reitz Reward Dams 1.238 Current 0.026 2% 0.959 77% 1.195 97%
VC17 C23H-02395 UV-D C83H Liebenbergsvlei Unnamed tributary None
VC16
Table G-2a
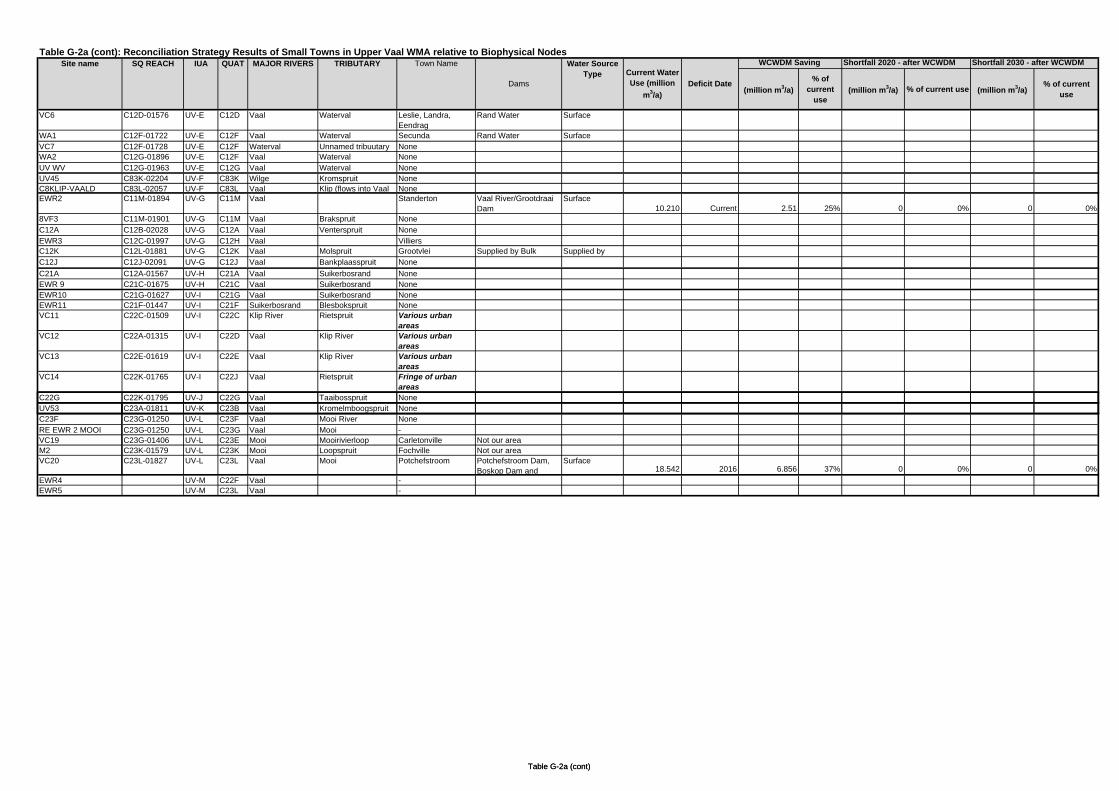
Table G-2a (cont): Reconciliation Strategy Results of Small Towns in Upper Vaal WMA relative to Biophysical Nodes
(million m3/a)% of
current use
(million m3/a) % of current use (million m3/a)% of current
use
VC6 C12D-01576 UV-E C12D Vaal Waterval Leslie, Landra, Eendrag
Rand Water Surface
WA1 C12F-01722 UV-E C12F Vaal Waterval Secunda Rand Water SurfaceVC7 C12F-01728 UV-E C12F Waterval Unnamed tribuutary NoneWA2 C12G-01896 UV-E C12F Vaal Waterval NoneUV WV C12G-01963 UV-E C12G Vaal Waterval NoneUV45 C83K-02204 UV-F C83K Wilge Kromspruit NoneC8KLIP-VAALD C83L-02057 UV-F C83L Vaal Klip (flows into Vaal NoneEWR2 C11M-01894 UV-G C11M Vaal Standerton Vaal River/Grootdraai
DamSurface
10.210 Current 2.51 25% 0 0% 0 0%8VF3 C11M-01901 UV-G C11M Vaal Brakspruit NoneC12A C12B-02028 UV-G C12A Vaal Venterspruit NoneEWR3 C12C-01997 UV-G C12H Vaal VilliersC12K C12L-01881 UV-G C12K Vaal Molspruit Grootvlei Supplied by Bulk Supplied by C12J C12J-02091 UV-G C12J Vaal Bankplaasspruit NoneC21A C12A-01567 UV-H C21A Vaal Suikerbosrand NoneEWR 9 C21C-01675 UV-H C21C Vaal Suikerbosrand NoneEWR10 C21G-01627 UV-I C21G Vaal Suikerbosrand NoneEWR11 C21F-01447 UV-I C21F Suikerbosrand Blesbokspruit None VC11 C22C-01509 UV-I C22C Klip River Rietspruit Various urban
areasVC12 C22A-01315 UV-I C22D Vaal Klip River Various urban
areasVC13 C22E-01619 UV-I C22E Vaal Klip River Various urban
areasVC14 C22K-01765 UV-I C22J Vaal Rietspruit Fringe of urban
areasC22G C22K-01795 UV-J C22G Vaal Taaibosspruit None
Current Water Use (million
m3/a)Deficit Date
WCWDM Saving Shortfall 2020 - after WCWDM Shortfall 2030 - after WCWDMQUAT MAJOR RIVERS TRIBUTARY Town Name
Dams
Water Source Type
Site name SQ REACH IUA
Table G-2a (cont)
UV53 C23A-01811 UV-K C23B Vaal Kromelmboogspruit NoneC23F C23G-01250 UV-L C23F Vaal Mooi River NoneRE EWR 2 MOOI C23G-01250 UV-L C23G Vaal Mooi -VC19 C23G-01406 UV-L C23E Mooi Mooirivierloop Carletonville Not our areaM2 C23K-01579 UV-L C23K Mooi Loopspruit Fochville Not our areaVC20 C23L-01827 UV-L C23L Vaal Mooi Potchefstroom Potchefstroom Dam,
Boskop Dam and Surface
18.542 2016 6.856 37% 0 0% 0 0%EWR4 UV-M C22F Vaal -EWR5 UV-M C23L Vaal -
Table G-2a (cont)
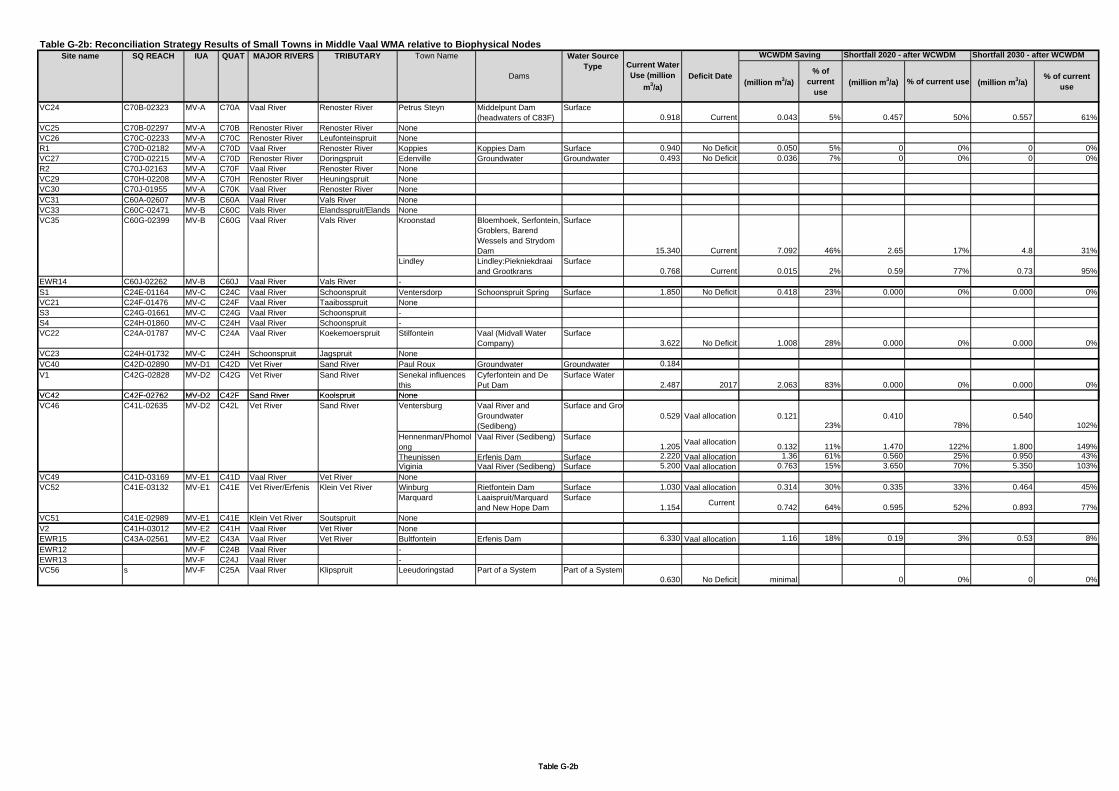
Table G-2b: Reconciliation Strategy Results of Small Towns in Middle Vaal WMA relative to Biophysical Nodes
(million m3/a)% of
current use
(million m3/a) % of current use (million m3/a)% of current
use
VC24 C70B-02323 MV-A C70A Vaal River Renoster River Petrus Steyn Middelpunt Dam (headwaters of C83F)
Surface0.918 Current 0.043 5% 0.457 50% 0.557 61%
VC25 C70B-02297 MV-A C70B Renoster River Renoster River NoneVC26 C70C-02233 MV-A C70C Renoster River Leufonteinspruit NoneR1 C70D-02182 MV-A C70D Vaal River Renoster River Koppies Koppies Dam Surface 0.940 No Deficit 0.050 5% 0 0% 0 0%VC27 C70D-02215 MV-A C70D Renoster River Doringspruit Edenville Groundwater Groundwater 0.493 No Deficit 0.036 7% 0 0% 0 0%R2 C70J-02163 MV-A C70F Vaal River Renoster River NoneVC29 C70H-02208 MV-A C70H Renoster River Heuningspruit NoneVC30 C70J-01955 MV-A C70K Vaal River Renoster River NoneVC31 C60A-02607 MV-B C60A Vaal River Vals River NoneVC33 C60C-02471 MV-B C60C Vals River Elandsspruit/Elands None
Kroonstad Bloemhoek, Serfontein, Groblers, Barend Wessels and Strydom Dam
Surface
15.340 Current 7.092 46% 2.65 17% 4.8 31%Lindley Lindley:Piekniekdraai
and GrootkransSurface
0.768 Current 0.015 2% 0.59 77% 0.73 95%EWR14 C60J-02262 MV-B C60J Vaal River Vals River -S1 C24E-01164 MV-C C24C Vaal River Schoonspruit Ventersdorp Schoonspruit Spring Surface 1.850 No Deficit 0.418 23% 0.000 0% 0.000 0%VC21 C24F-01476 MV-C C24F Vaal River Taaibosspruit NoneS3 C24G-01661 MV-C C24G Vaal River Schoonspruit -S4 C24H-01860 MV-C C24H Vaal River Schoonspruit -VC22 C24A-01787 MV-C C24A Vaal River Koekemoerspruit Stilfontein Vaal (Midvall Water
Company)Surface
3.622 No Deficit 1.008 28% 0.000 0% 0.000 0%VC23 C24H-01732 MV-C C24H Schoonspruit Jagspruit NoneVC40 C42D-02890 MV-D1 C42D Vet River Sand River Paul Roux Groundwater Groundwater 0.184V1 C42G-02828 MV-D2 C42G Vet River Sand River Senekal influences
thisCyferfontein and De Put Dam
Surface Water2.487 2017 2.063 83% 0.000 0% 0.000 0%
VC42 C42F-02762 MV-D2 C42F Sand River Koolspruit None
Water Source Type Current Water
Use (million m3/a)
Deficit Date
WCWDM Saving Shortfall 2020 - after WCWDM Shortfall 2030 - after WCWDMSite name SQ REACH IUA QUAT MAJOR RIVERS TRIBUTARY Town Name
Dams
VC35 Vals RiverVaal RiverC60GMV-BC60G-02399
Table G-2b
VC42 C42F-02762 MV-D2 C42F Sand River Koolspruit NoneVentersburg Vaal River and
Groundwater (Sedibeng)
Surface and Grou0.529 Vaal allocation 0.121
23%0.410
78%0.540
102%Hennenman/Phomolong
Vaal River (Sedibeng) Surface1.205 Vaal allocation 0.132 11% 1.470 122% 1.800 149%
Theunissen Erfenis Dam Surface 2.220 Vaal allocation 1.36 61% 0.560 25% 0.950 43%Viginia Vaal River (Sedibeng) Surface 5.200 Vaal allocation 0.763 15% 3.650 70% 5.350 103%
VC49 C41D-03169 MV-E1 C41D Vaal River Vet River NoneWinburg Rietfontein Dam Surface 1.030 Vaal allocation 0.314 30% 0.335 33% 0.464 45%Marquard Laaispruit/Marquard
and New Hope DamSurface
1.154 Current 0.742 64% 0.595 52% 0.893 77%VC51 C41E-02989 MV-E1 C41E Klein Vet River Soutspruit NoneV2 C41H-03012 MV-E2 C41H Vaal River Vet River NoneEWR15 C43A-02561 MV-E2 C43A Vaal River Vet River Bultfontein Erfenis Dam 6.330 Vaal allocation 1.16 18% 0.19 3% 0.53 8%EWR12 MV-F C24B Vaal River -EWR13 MV-F C24J Vaal River -VC56 s MV-F C25A Vaal River Klipspruit Leeudoringstad Part of a System Part of a System
0.630 No Deficit minimal 0 0% 0 0%
VC52 C41E-03132 MV-E1 C41E Vet River/Erfenis Klein Vet River
VC46 C41L-02635 MV-D2 C42L Vet River Sand River
Table G-2b
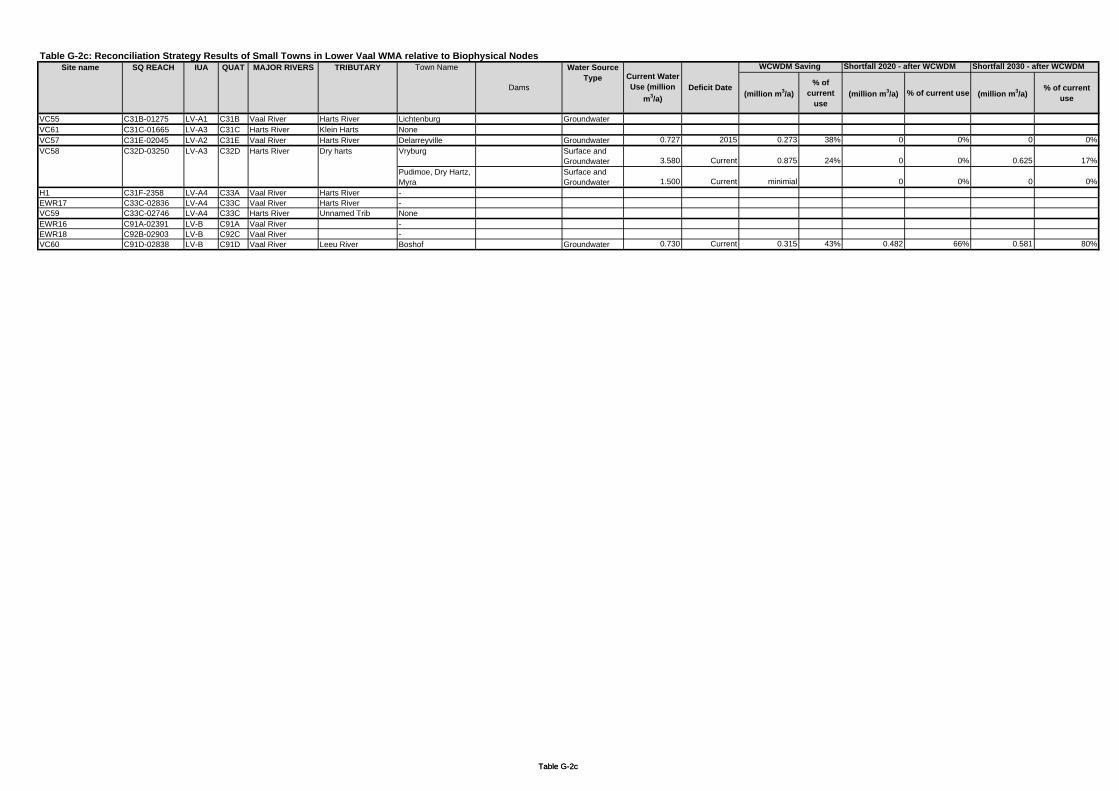
Table G-2c: Reconciliation Strategy Results of Small Towns in Lower Vaal WMA relative to Biophysical Nodes
(million m3/a)% of
current use
(million m3/a) % of current use (million m3/a)% of current
use
VC55 C31B-01275 LV-A1 C31B Vaal River Harts River Lichtenburg GroundwaterVC61 C31C-01665 LV-A3 C31C Harts River Klein Harts NoneVC57 C31E-02045 LV-A2 C31E Vaal River Harts River Delarreyville Groundwater 0.727 2015 0.273 38% 0 0% 0 0%
Vryburg Surface and Groundwater 3.580 Current 0.875 24% 0 0% 0.625 17%
Pudimoe, Dry Hartz, Myra
Surface and Groundwater 1.500 Current minimial 0 0% 0 0%
H1 C31F-2358 LV-A4 C33A Vaal River Harts River -EWR17 C33C-02836 LV-A4 C33C Vaal River Harts River -VC59 C33C-02746 LV-A4 C33C Harts River Unnamed Trib NoneEWR16 C91A-02391 LV-B C91A Vaal River -EWR18 C92B-02903 LV-B C92C Vaal River -VC60 C91D-02838 LV-B C91D Vaal River Leeu River Boshof Groundwater 0.730 Current 0.315 43% 0.482 66% 0.581 80%
Shortfall 2020 - after WCWDM Shortfall 2030 - after WCWDMTown Name
Dams
Water Source Type Current Water
Use (million m3/a)
Deficit Date
WCWDM Saving Site name SQ REACH IUA QUAT MAJOR RIVERS TRIBUTARY
VC58 C32D-03250 LV-A3 C32D Harts River Dry harts
Table G-2c Table G-2c

Status Quo Report V13_1.docx September 2011
Appendix H:
Members of Project Steering Committee
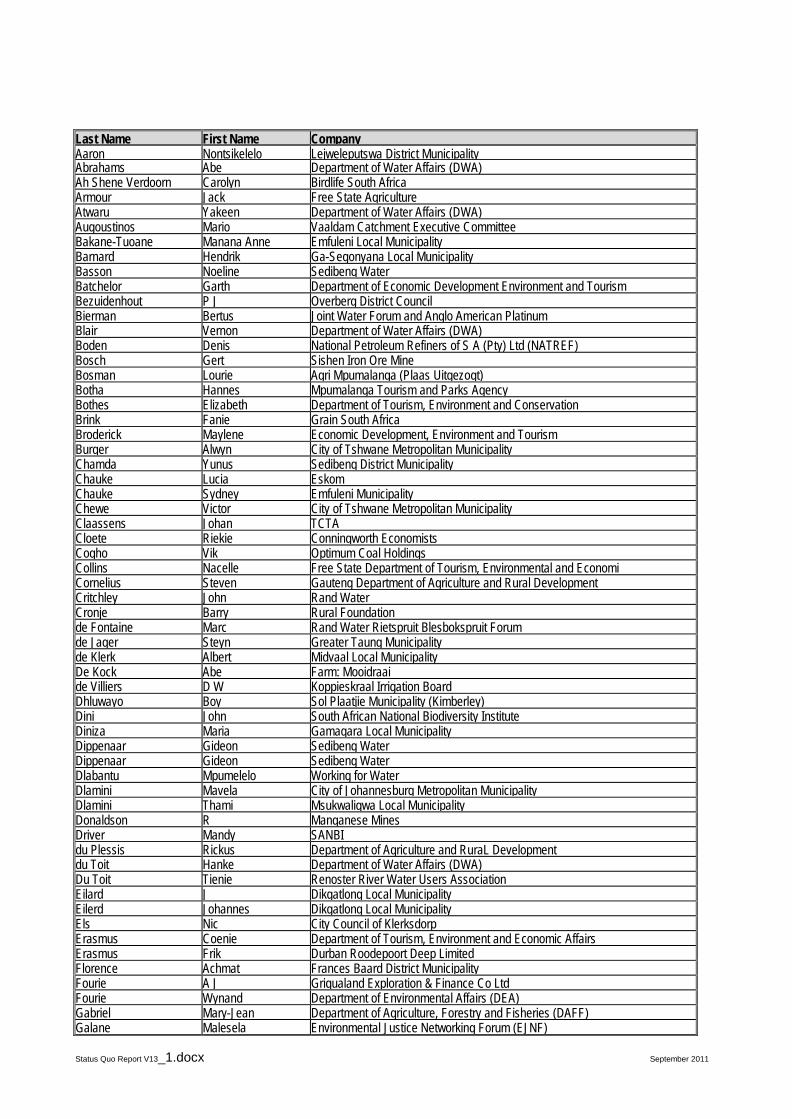
Status Quo Report V13_1.docx September 2011
Last Name First Name Company Aaron Nontsikelelo Lejweleputswa District Municipality Abrahams Abe Department of Water Affairs (DWA) Ah Shene Verdoorn Carolyn Birdlife South Africa Armour Jack Free State Agriculture Atwaru Yakeen Department of Water Affairs (DWA) Augoustinos Mario Vaaldam Catchment Executive Committee Bakane-Tuoane Manana Anne Emfuleni Local Municipality Barnard Hendrik Ga-Segonyana Local Municipality Basson Noeline Sedibeng Water Batchelor Garth Department of Economic Development Environment and Tourism Bezuidenhout P J Overberg District Council Bierman Bertus Joint Water Forum and Anglo American Platinum Blair Vernon Department of Water Affairs (DWA) Boden Denis National Petroleum Refiners of S A (Pty) Ltd (NATREF) Bosch Gert Sishen Iron Ore Mine Bosman Lourie Agri Mpumalanga (Plaas Uitgezogt) Botha Hannes Mpumalanga Tourism and Parks Agency Bothes Elizabeth Department of Tourism, Environment and Conservation Brink Fanie Grain South Africa Broderick Maylene Economic Development, Environment and Tourism Burger Alwyn City of Tshwane Metropolitan Municipality Chamda Yunus Sedibeng District Municipality Chauke Lucia Eskom Chauke Sydney Emfuleni Municipality Chewe Victor City of Tshwane Metropolitan Municipality Claassens Johan TCTA Cloete Riekie Conningworth Economists Cogho Vik Optimum Coal Holdings Collins Nacelle Free State Department of Tourism, Environmental and Economi Cornelius Steven Gauteng Department of Agriculture and Rural Development Critchley John Rand Water Cronje Barry Rural Foundation de Fontaine Marc Rand Water Rietspruit Blesbokspruit Forum de Jager Steyn Greater Taung Municipality de Klerk Albert Midvaal Local Municipality De Kock Abe Farm: Mooidraai de Villiers D W Koppieskraal Irrigation Board Dhluwayo Boy Sol Plaatjie Municipality (Kimberley) Dini John South African National Biodiversity Institute Diniza Maria Gamagara Local Municipality Dippenaar Gideon Sedibeng Water Dippenaar Gideon Sedibeng Water Dlabantu Mpumelelo Working for Water Dlamini Mavela City of Johannesburg Metropolitan Municipality Dlamini Thami Msukwaligwa Local Municipality Donaldson R Manganese Mines Driver Mandy SANBI du Plessis Rickus Department of Agriculture and RuraL Development du Toit Hanke Department of Water Affairs (DWA) Du Toit Tienie Renoster River Water Users Association Eilard J Dikgatlong Local Municipality Eilerd Johannes Dikgatlong Local Municipality Els Nic City Council of Klerksdorp Erasmus Coenie Department of Tourism, Environment and Economic Affairs Erasmus Frik Durban Roodepoort Deep Limited Florence Achmat Frances Baard District Municipality Fourie A J Griqualand Exploration & Finance Co Ltd Fourie Wynand Department of Environmental Affairs (DEA) Gabriel Mary-Jean Department of Agriculture, Forestry and Fisheries (DAFF) Galane Malesela Environmental Justice Networking Forum (EJNF)
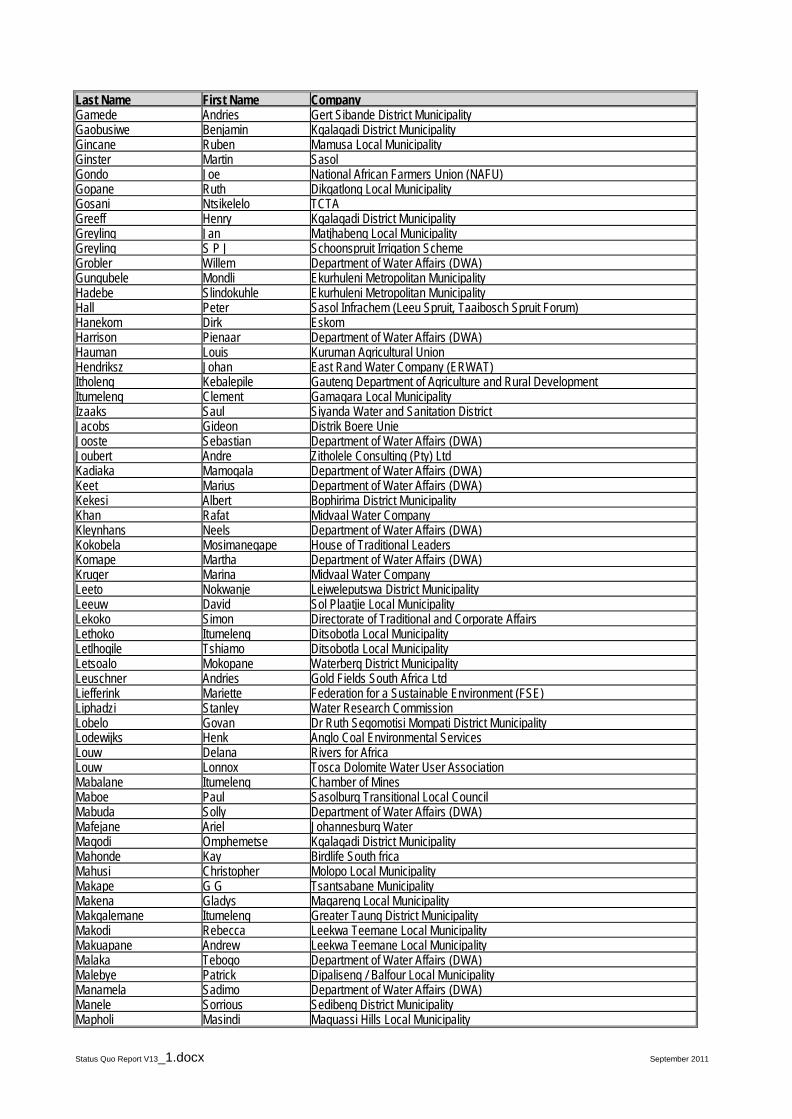
Status Quo Report V13_1.docx September 2011
Last Name First Name Company Gamede Andries Gert Sibande District Municipality Gaobusiwe Benjamin Kgalagadi District Municipality Gincane Ruben Mamusa Local Municipality Ginster Martin Sasol Gondo Joe National African Farmers Union (NAFU) Gopane Ruth Dikgatlong Local Municipality Gosani Ntsikelelo TCTA Greeff Henry Kgalagadi District Municipality Greyling Jan Matjhabeng Local Municipality Greyling S P J Schoonspruit Irrigation Scheme Grobler Willem Department of Water Affairs (DWA) Gungubele Mondli Ekurhuleni Metropolitan Municipality Hadebe Slindokuhle Ekurhuleni Metropolitan Municipality Hall Peter Sasol Infrachem (Leeu Spruit, Taaibosch Spruit Forum) Hanekom Dirk Eskom Harrison Pienaar Department of Water Affairs (DWA) Hauman Louis Kuruman Agricultural Union Hendriksz Johan East Rand Water Company (ERWAT) Itholeng Kebalepile Gauteng Department of Agriculture and Rural Development Itumeleng Clement Gamagara Local Municipality Izaaks Saul Siyanda Water and Sanitation District Jacobs Gideon Distrik Boere Unie Jooste Sebastian Department of Water Affairs (DWA) Joubert Andre Zitholele Consulting (Pty) Ltd Kadiaka Mamogala Department of Water Affairs (DWA) Keet Marius Department of Water Affairs (DWA) Kekesi Albert Bophirima District Municipality Khan Rafat Midvaal Water Company Kleynhans Neels Department of Water Affairs (DWA) Kokobela Mosimanegape House of Traditional Leaders Komape Martha Department of Water Affairs (DWA) Kruger Marina Midvaal Water Company Leeto Nokwanje Lejweleputswa District Municipality Leeuw David Sol Plaatjie Local Municipality Lekoko Simon Directorate of Traditional and Corporate Affairs Lethoko Itumeleng Ditsobotla Local Municipality Letlhogile Tshiamo Ditsobotla Local Municipality Letsoalo Mokopane Waterberg District Municipality Leuschner Andries Gold Fields South Africa Ltd Liefferink Mariette Federation for a Sustainable Environment (FSE) Liphadzi Stanley Water Research Commission Lobelo Govan Dr Ruth Segomotisi Mompati District Municipality Lodewijks Henk Anglo Coal Environmental Services Louw Delana Rivers for Africa Louw Lonnox Tosca Dolomite Water User Association Mabalane Itumeleng Chamber of Mines Maboe Paul Sasolburg Transitional Local Council Mabuda Solly Department of Water Affairs (DWA) Mafejane Ariel Johannesburg Water Magodi Omphemetse Kgalagadi District Municipality Mahonde Kay Birdlife South frica Mahusi Christopher Molopo Local Municipality Makape G G Tsantsabane Municipality Makena Gladys Magareng Local Municipality Makgalemane Itumeleng Greater Taung District Municipality Makodi Rebecca Leekwa Teemane Local Municipality Makuapane Andrew Leekwa Teemane Local Municipality Malaka Tebogo Department of Water Affairs (DWA) Malebye Patrick Dipaliseng / Balfour Local Municipality Manamela Sadimo Department of Water Affairs (DWA) Manele Sorrious Sedibeng District Municipality Mapholi Masindi Maquassi Hills Local Municipality

Status Quo Report V13_1.docx September 2011
Last Name First Name Company Maposa Delportshoop TLC Marx Karin Wildlife and Environment Society of South Africa (WESSA) Maseng Benardo Kgatelopele Local Municipality Masondo Amos City of Johannesburg Metropolitan Municipality Maswuma Zacharia Department of Water Affairs (DWA) Matseba Mogale Department of Water Affairs (DWA) Mazwi Nosie Department of Water Affairs (DWA) McCourt Liz Department of Environmental Affairs (DEA) Meintjes Louis Transvaal Agricultural Union South Africa (TAUSA) Mere Shedrick Magareng Local Municipality Midgley Ian Eskom Mlambo-Izquierdo-
Poppy Kgatelopele Local Municipality
Mmarete Charles Department of Water Affairs (DWA) Mmoiemang Kenneth Kgalagadi District Municipality Mngomezulu Willy Pixley Ka Seme Local Municipality Mnisi Jones Johannesburg Water (Pty) Ltd Mochware Ontlametse Kagisano Local Municipality Modisakeng Busisiwe Lesedi Local Municipality Mofokeng Mahole Sedibeng District Municipality Mofokeng Mpho Greater Taung District Municipality Mofokeng Puleng Department of Agriculture, Forestry and Fisheries Mogotlhe Paul North West Department of Agriculture, Conservation, Environment and Tourism Mohapi Ndileka Department of Water Affairs (DWA) Mokadi Andrew Vaal University of Technology Mokgosi Mantebo Moqhaka Local Municipality Mokgosi Mantebu Moqhaka Local Municipality Molema Kemonna Tribal Authority Molema Shelley Bophirima District Council Mompati Rose Naledi Local Municipality Mongake Monty Fezile Dabi District Municipality Mongolola Gift Ga-Segonyane Municipality Moraka William South African Local Government Association (SALGA) Mosai Sipho Rand Water Mothibi Dimakatso Department of Agriculture and Land Reform Motlhale Kelehile Tswelopele Local Municipality Motoko Phihadu Ratlou Local Municipality Mshudulu S A Emfuleni Local Municipality Mthimunye George Naledi Local Municipality Mtsuku Samuel Department of Tourism, Environment and Economic Affairs Mudau Stephinah Chamber of Mines South Africa Mulangaphuma Lawrence Department of Water Affairs (DWA) Muller Anton Bloemhofdam Kom Mutyorauta J J Department of Agriculture Mutyorauta Julius Department of Tourism, Environment and Conservation (DTEC) Mvula Obed Department of Land Affairs Mwaka Beason Department of Water Affairs (DWA) Mweli Zandisile Maquassi Hills Local Municipality Nagel Marius Government Communication and Information Systems (GCIS) Naidoo Shane Department of Water Affairs (DWA) Nakana Lesego Greater Taung Local Municipality Namusi Sedirilwe Molopo Local Municipality Nast Timothy Midvaal Local Municipality Naude Piet Free State Agricultural Water Committee Nengovhela Rufus Department of Water Affairs (DWA) Ngamole G Masilonyana Municipality Ngangelizwe Sebenzile Matjhabeng Local Municipality Ngcobo Mbuleleni Gert Sibande District Municipality Ngcobo Sonwabo Tswaing Local Municipality Ngema Khaya Ekurhuleni Metropolitan Municipality Ngila Zelna Siyanda District Municipality Ngomane Lulu Gauteng Water Sector Forum Ngxanga Eric Siyanda District Municipality

Status Quo Report V13_1.docx September 2011
Last Name First Name Company Nkonyane Martha Nkwane Oupa City of Tshwane Metropolitan Municipality Nosi Thabo Frances Baard District Municipality Ntili Tseliso Department of Water Affairs (DWA) Ntsepe Sello Mantsopa Local Municipality Ntsizi Thembile Wes Vaal Chamber of Commerce Ntwe Francisco Ratlou Local Municipality Nyamande Tovhowani Department of Water Affairs (DWA) Oagile Mothus Kagisano Local Municipality Oosthuizen Christo Louwna/Coetzerdam Water User Association Opperman Dirk Land Affairs Opperman Nic Agri SA Peek Bobby GroundWork - Friends of the Earth South Africa Petersen Thabo Matjhabeng Local Municipality Phukuntsi Rosy Tswelopele Local Municipality Pienaar Harrison Department of Water Affairs (DWA) Pienaar P G Vyf Hoek South Management Board Pillay Nava Metsweding District Municipality Potgieter Ampie Sasol Mining Rights Department (SMRD) Potgieter Jan Department of Agriculture, Forestry and Fisheries Potgieter Sandra Dow Plastics Pretorius Theuns Kaalfontein Boerevereniging Distriks Landbou Unie Pyke Peter Department of Water Affairs (DWA) Radebe Khulu Male Development Agency Rademeyer Seef Department of Water Affairs (DWA) Ramaema Lowrence Department of Tourism, Enviroment and Economic Affairs Ramokgopa Kgosientsho City of Tshwane Metropolitan Municipality Ramokhoase Jonas Fezile Dabi District Municipality Rampai Constance Mantsopa Local Municipality Rampine M K South African National Civic Organisation (SANCO) Boikhotsong Reinecke C J Potchefstroom Univ for CHE Reitz J J C Kalahari East Water User Association Rossouw Lourens Tokologo Local Municipality Rust Nelia Matjhabeng Local Municipality Sales Malcolm Lebalelo Water User Association Samson Paballo Moshaweng Local Municipality Sebusho Sipho Kgalagadi District Municipality Seikaneng Tefo Moshaweng Local Municipality Shabalala Sam Emfuleni Local Municipality Shone Steve Grain SA Sindane Jabulani Lekwa Local Municipality Slabbert Nadene Department of Water Affairs Smit Hennie Department of Water Affairs (DWA) Snyders Louis Department of Water Affairs (DWA) Stoch Leslie Geotech (Lower Wonderfonteinspruit Forum) Stoltz Gert Molopo Farmers Union Surendra Anesh Eskom Sutton Malcolm Anglogold Swart Susan WRP Consulting Engineers (Pty) Ltd Takalo Mmabatho City of Tshwane Metropolitan Municipality Terrè-Blanche Riana Namaqualand Water and Sanitation Support Group (NAWASAN) Thakurdin Manisha Department of Water Affairs (DWA) Theron Danie Christiana Farmers Association Theron J H Vaalharts Water Users Association Theron Piet Munisipaliteit van Delportshoop Thirion Christa Department of Water Affairs Thompson Isa Department of Water Affairs (DWA) Tlhape Manketse Tswaing Local Municipality Tshipelo Kenneth Mamusa Local Municipality Tsotetsi Mabalone Dipaliseng Local Municipality Ubisi Makumu Sedibeng Water van Aswegen Johann Department of Water Affairs (DWA)
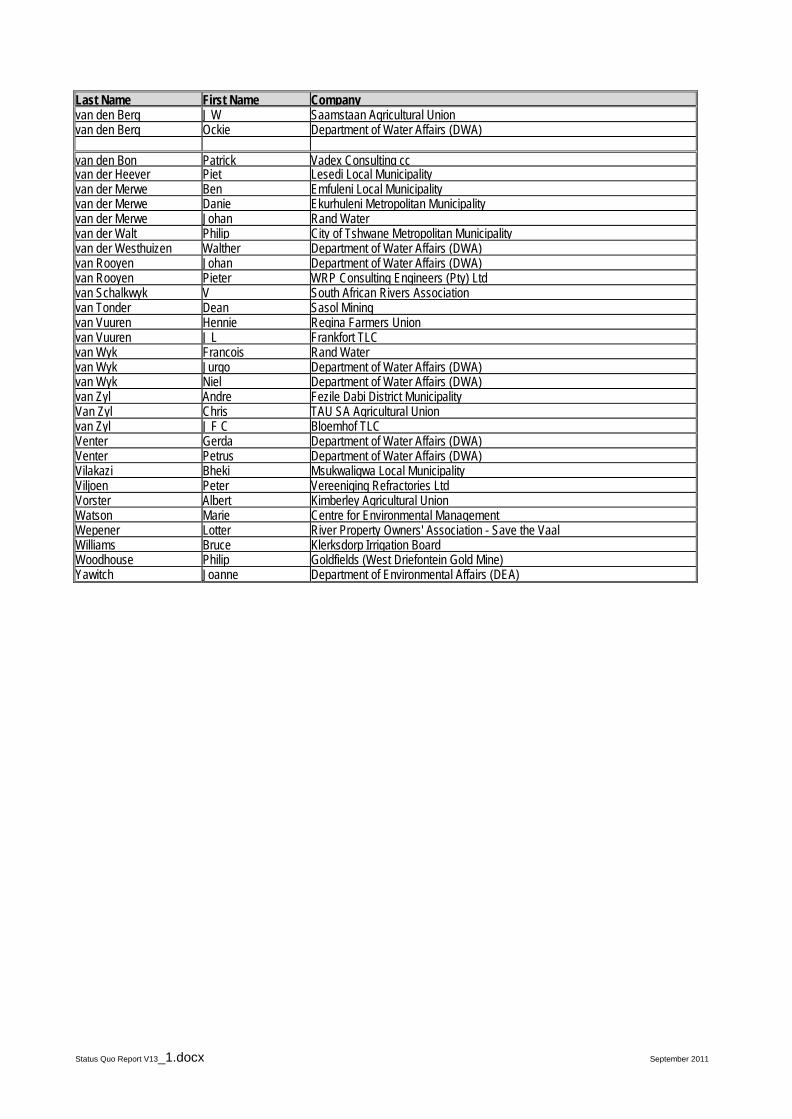
Status Quo Report V13_1.docx September 2011
Last Name First Name Company van den Berg J W Saamstaan Agricultural Union van den Berg Ockie Department of Water Affairs (DWA) van den Bon Patrick Vadex Consulting cc van der Heever Piet Lesedi Local Municipality van der Merwe Ben Emfuleni Local Municipality van der Merwe Danie Ekurhuleni Metropolitan Municipality van der Merwe Johan Rand Water van der Walt Philip City of Tshwane Metropolitan Municipality van der Westhuizen Walther Department of Water Affairs (DWA) van Rooyen Johan Department of Water Affairs (DWA) van Rooyen Pieter WRP Consulting Engineers (Pty) Ltd van Schalkwyk V South African Rivers Association van Tonder Dean Sasol Mining van Vuuren Hennie Regina Farmers Union van Vuuren J L Frankfort TLC van Wyk Francois Rand Water van Wyk Jurgo Department of Water Affairs (DWA) van Wyk Niel Department of Water Affairs (DWA) van Zyl Andre Fezile Dabi District Municipality Van Zyl Chris TAU SA Agricultural Union van Zyl J F C Bloemhof TLC Venter Gerda Department of Water Affairs (DWA) Venter Petrus Department of Water Affairs (DWA) Vilakazi Bheki Msukwaligwa Local Municipality Viljoen Peter Vereeniging Refractories Ltd Vorster Albert Kimberley Agricultural Union Watson Marie Centre for Environmental Management Wepener Lotter River Property Owners' Association - Save the Vaal Williams Bruce Klerksdorp Irrigation Board Woodhouse Philip Goldfields (West Driefontein Gold Mine) Yawitch Joanne Department of Environmental Affairs (DEA)
Status Quo Report V13_1.docx September 2011
Appendix I:
Comments and Responses
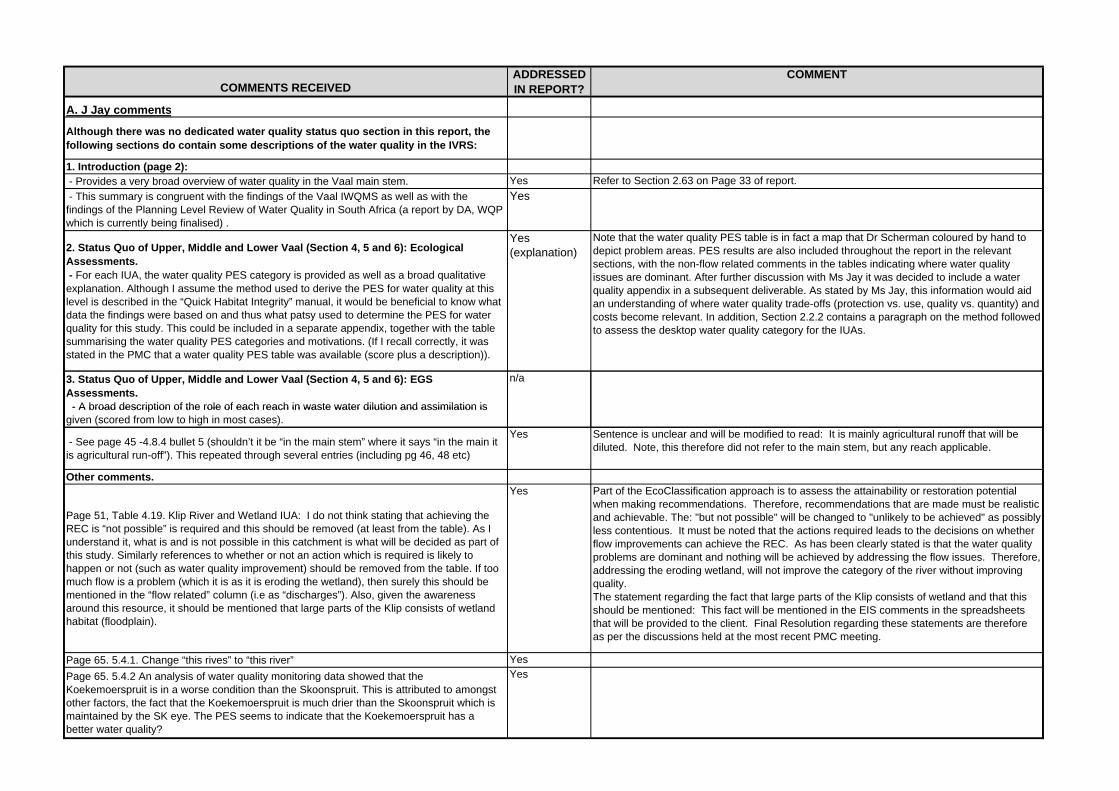
COMMENTS RECEIVEDADDRESSED IN REPORT?
COMMENT
A. J Jay comments
Although there was no dedicated water quality status quo section in this report, the following sections do contain some descriptions of the water quality in the IVRS:
1. Introduction (page 2): - Provides a very broad overview of water quality in the Vaal main stem. Yes Refer to Section 2.63 on Page 33 of report. - This summary is congruent with the findings of the Vaal IWQMS as well as with the findings of the Planning Level Review of Water Quality in South Africa (a report by DA, WQP which is currently being finalised) .
Yes
2. Status Quo of Upper, Middle and Lower Vaal (Section 4, 5 and 6): Ecological Assessments. - For each IUA, the water quality PES category is provided as well as a broad qualitative explanation. Although I assume the method used to derive the PES for water quality at this level is described in the “Quick Habitat Integrity” manual, it would be beneficial to know what data the findings were based on and thus what patsy used to determine the PES for water quality for this study. This could be included in a separate appendix, together with the table summarising the water quality PES categories and motivations. (If I recall correctly, it was stated in the PMC that a water quality PES table was available (score plus a description)).
Yes (explanation)
Note that the water quality PES table is in fact a map that Dr Scherman coloured by hand to depict problem areas. PES results are also included throughout the report in the relevant sections, with the non-flow related comments in the tables indicating where water quality issues are dominant. After further discussion with Ms Jay it was decided to include a water quality appendix in a subsequent deliverable. As stated by Ms Jay, this information would aid an understanding of where water quality trade-offs (protection vs. use, quality vs. quantity) and costs become relevant. In addition, Section 2.2.2 contains a paragraph on the method followed to assess the desktop water quality category for the IUAs.
3. Status Quo of Upper, Middle and Lower Vaal (Section 4, 5 and 6): EGS Assessments.- A broad description of the role of each reach in waste water dilution and assimilation is
n/a
- A broad description of the role of each reach in waste water dilution and assimilation is given (scored from low to high in most cases).
- See page 45 -4.8.4 bullet 5 (shouldn’t it be “in the main stem” where it says “in the main it is agricultural run-off”). This repeated through several entries (including pg 46, 48 etc)
Yes Sentence is unclear and will be modified to read: It is mainly agricultural runoff that will be diluted. Note, this therefore did not refer to the main stem, but any reach applicable.
Other comments.
Page 51, Table 4.19. Klip River and Wetland IUA: I do not think stating that achieving the REC is “not possible” is required and this should be removed (at least from the table). As I understand it, what is and is not possible in this catchment is what will be decided as part of this study. Similarly references to whether or not an action which is required is likely to happen or not (such as water quality improvement) should be removed from the table. If too much flow is a problem (which it is as it is eroding the wetland), then surely this should be mentioned in the “flow related” column (i.e as “discharges”). Also, given the awareness around this resource, it should be mentioned that large parts of the Klip consists of wetland habitat (floodplain).
Yes Part of the EcoClassification approach is to assess the attainability or restoration potential when making recommendations. Therefore, recommendations that are made must be realistic and achievable. The: "but not possible" will be changed to "unlikely to be achieved" as possibly less contentious. It must be noted that the actions required leads to the decisions on whether flow improvements can achieve the REC. As has been clearly stated is that the water quality problems are dominant and nothing will be achieved by addressing the flow issues. Therefore, addressing the eroding wetland, will not improve the category of the river without improving quality. The statement regarding the fact that large parts of the Klip consists of wetland and that this should be mentioned: This fact will be mentioned in the EIS comments in the spreadsheets that will be provided to the client. Final Resolution regarding these statements are therefore as per the discussions held at the most recent PMC meeting.
Page 65. 5.4.1. Change “this rives” to “this river” YesPage 65. 5.4.2 An analysis of water quality monitoring data showed that the Koekemoerspruit is in a worse condition than the Skoonspruit. This is attributed to amongst other factors, the fact that the Koekemoerspruit is much drier than the Skoonspruit which is maintained by the SK eye. The PES seems to indicate that the Koekemoerspruit has a better water quality?
Yes

COMMENTS RECEIVEDADDRESSED IN REPORT?
COMMENT
Page 71 5.8 An analysis of water quality along the vet river shows that water quality for upper sand and vet as relatively similar. The Sand River below Allemanskraal is highly influenced by inputs from Mosterd Canal (which carries treated sewerage, mining wastewater and stormwater) and less so from the Doring River (which also carried waste water inputs). Inputs from the Doorn and Mosterd Canal and diversion of water from the sand river (from Allemanskraal into the sand canal) has deteriorated the water quality in the Sand River such that it has generally worse quality than the Vet. This is particularly true for EC, Sulphate, Nitates and Phosphates. Below Erfenis the salts and nutrient levels increase due to surrounding agricultural activity and a reduction in flows in the River itself.( most of the flow is transported via a canal). Below the confluence with the Sand: Sand River inputs causes an increase in Sulphate, Chloride, Phosphate and Ammonium concentrations in lower Vet. Lower down in the Vet River, at the Vet River floodplain a decrease in EC as well as PO4, SO4 and NH3 occurs. The reason for this is unclear, although this could be due to the buffering of the floodplain or ground water inputs (the farmers in the area suspect that the floodplain is groundwater fed) or the fact that more flows are present (sand and vet canals “decant” into the Vet just below the confluence with the sand to provide water for the riparian irrigations on the lower vet). Additional comment after discussion with the PSP: The aim was to indicate that although the recent water quality status anaysis of the system has confirmed Patsy's statements in terms of the fact that 1) the upper Vet is in a better water quality state than the upper sand and 2) the lower vet WQ is in a better state than the lower Sand, it does not support the statement that the lower Vet (section 5.8 - which on my report starts on page 71) is in the same largly natural state as the upper Vet (stated in the Report as follows: "The water quality category for this reach is a B category as there also seems to
Yes After further discussion with Ms Jay, it was agreed to change the desktop present state of the Lower Vet River below Erfenis Dam to a C category. This alteration is in line with the results of the Reserve study for EWR 15, as well as recent output from the RWQO model. The table below was provided by Ms Jay, and illustrates the case with the Sand and Vet rivers. Ms Jay's recommendation for the Lower Vet River was therefore accepted and altered.
as follows: The water quality category for this reach is a B category as there also seems to be an adequate riparian Buffer"). What the study showed was that the Vet river below Erfenis dam upto the confluence with the sand had a decline in water quality. Then when it flows into to the lower Vet below the confluence with the sand river we found that the vet river quality improved for some variables but declined for others (see summary in "comments recieved" section). The improvement was however generally not to the standard of water quality that was meansured abve the dam. I.e It is questionable whether the Vet can be a B category above as well as below the Dam. The Reserve at EWR 15 also showed the WQ PES to be a C, not a B.
The point here is that WQ has been assigned as a C, which may be true for the lowest point, but is quite likely not true for the upper parts of the IUA (lower Vet), and some improvement may be necessary. If not considered to fine scale, it may be worth mentioning this in the report.
See comment The C category is for the Upper Sand River, with the Upper Vet River being a B Category. A paragraph has also been included regarding the data sources and the desktop approach followed for the assessment.
Page 26. Section 3: IUA’s. It should be noted that the Modder Riet is not included and why (As I understand it, although it forms part of the lower Vaal catchment, only a portion of the catchment uses water from the catchment. The rest of the Modder Riet uses Orange River water which is transferred in. I’m assuming this is why it was excluded?). (Note: after evaluating the PSP comment, Ms Jay still feels that the reason for exclusion should be stated. If the report states that the Riet-Modder is not part of the study area, and why, it proves that the Riet-Modder was left out intentionally and not as an oversight).
Yes ( See comment)
The Riet-Modder is not part of the study area. This is not an oversight as stated in report the TOR defined the study area as comprising of the three Vaal WMAs. The Riet-Modder catchment forms part of the Orange River WMA.
Section 2.2. See table 2.1. Where is the reference to this table in the text. Yes Reference was below the table and the table has been moved

COMMENTS RECEIVEDADDRESSED IN REPORT?
COMMENT
Section 2.2.2. An explanation of how the REC was determined (criteria used) and how the SCI was determined should be included. The Title I feel, should rather be “ Assessing EI (PES, EIS, SCI) and the REC” instead of “Assessing PES and EIS” as it includes more than just the PES and EIS method descriptions.
Yes
General Comments: MapsIm assuming the maps we saw at the PMC (each reach was highlighted with the PES and REC) will be included in subsequent reports?
Yes All maps were updated accordingly.
I would recommend that the maps to show the IUA’s be refined. E.g by using different colours to show the IUA’s. These maps will likely be used in a number of presentations / follow-up reports and could be improved upon. (Note: Ms Jay agreed with the PSP comment).
No I don't agree as using different colours is going to turn the maps into a smartie box and cause confusions with the A to F colours representing Ecological Categories. Those have been tried and this format is linked to the standard output for the technical information. I would suggest that we leave it like this for the technical report and the stakeholder consultant, can, in conjunction with the client decide how best to present the maps at the stage of stakeholder documentation and meetings.
Figure 1.1 is of poor quality and does not print well. A high definition map is required. N/A Printing quality proved to be fine. Probably to do with printer resolution setting.B. Sadimo comments:Determination of biophysical nodesIt is evident that biophysical nodes were not established in terms of the guidelines for the Water Resource Classification System. The allocation nodes were not considered. Also there was no establishment of the ecosystem- specific units e.g wetlands. As a result of this’ important aspects e.g. geomorphic zones were omitted. Groundwater nodes were also not considered.
Yes (See comments)
Allocation nodes were considered and was supplied and included upfront by WRP and are included. Regarding following the Water Resource Classification System. During a discussion with Ms Naidoo, and as stated in the accepted inception report (contract), the principles of the main steps of the WRCS must be followed, but the practicalities of the detail approaches recommended must be carefully considered. As the WRCS has not been tested on any system (apart from it being developed on the Olifants), many of the tools and approaches are impractical and not cost-effective considering the scale of the study area. Following the WRCS and the exact methods would have resulted in a cost of probably in the order of thirtyWRCS and the exact methods would have resulted in a cost of probably in the order of thirty million Rand. Furthermore, since the WRCS guidelines were finalised, the current PES and EI-ES study was initiated and the selection of these SQ reaches (and therefore the nodes) superceded the WRCS. This concept was presented by DWA RQS to Ms Naidoo during an Olifants Steering Committee and accepted. We have used these SQ reaches which indicate the locality of the nodes, but however could not use all of them as this would have added a million rand to the budget. The best compromise approach as agreed to by the client in the inception report was therefore reached. This has been described in the status quo report. Regarding the groundwater nodes, three areas namely Zuurbekom, Schoonspruit and Lichtenburg were identified. Desriptions of these groundwater areas were included in the report. Integrated surface-groundwater analyses will be done whereby alternative abstractions (present day and future development) will be simulated and the impact thereof on the baseflow/outflow from the eyes will be quantified. The effect of these on the relevant surface water Reserve nodes situated immediately downstream of these grounwater areas will then be evaluated.
Socio economic assessmentComments are based specifically on table 2.2 structure of production cost
What is missing this table is the cost to the environment. If this cost is not given the necessary attention it deserves we will find ourselves in a situation where the real cost of production is underestimated and pave way for externalization of costs.
This structure disaggegregates the economic flow of production to the specific sectors in the economy. The cost of the environment is therefore out of the boundries of the production costs. The environmental components to be addressed will be included into the scoring system that makes provision for the externalities aspects.
C. Lawrence Mulangaphuma comments:
Production Industry Model (PIM) is not detailed and does show what data required/input to support the model.
Yes
The PIM doesn’t show key output. Yes

COMMENTS RECEIVEDADDRESSED IN REPORT?
COMMENT
What is wrong with the model such as SAFRIM? The combination of WIM and SAFRIM can take into consideration of the potential impacts of a particular development on the economic environment of a study area (which can be delineated according to impact intensity) which was the case during Vaal Reserve determination study.
Yes
During the last PMC meeting the William Mullins said the evaluation of economic development (WIM) doesn’t take into consideration the potential impacts of a particular development on the economic environment of the study area. For me that’s worrying.
Yes
The similar methodology (WIM and SAFRIM) was used to assess the ecosystem services in the Thukela Water Project: Reserve Determination Module.
Yes Scoring system has been explained in more detail.
The models can also be used to calculate the micro-economic impacts of water use in the different zones.
The micro-economic aspects will be addressed as a macro-economic model application when the volume of water scenarios will be allocated in the different IUA for the next phase of the study.
The report doesn’t clearly show socio-economic guidelines for the 7-step classification procedure (step by step as indicated in the WRCS guidelines).For example, doesn’t talk anything about the decision-making framework, their methodology should use WRCS guideline as basis.
The economics performed in the Status Quo-report dealt with Task 3a (Step 1: Delineate units of analysis and describe the status quo) and Task 3b (Step 2: Link value and condition)
The SAMs that were used for the purposes of this study were for Mpumalanga, Gauteng and Free State provinces. Why not Northern Cape?
Yes
Spelling check: page 21, paragraph 3, fourth sentence: upplied instead of supplied YesSpelling check: page 24, paragraph 4, seventh sentence: th instead of the. YesD. Tovho Nyamande comments:Socio-economic assessment or framework – Is Water Quality component fully addressed on the framework, for example, the negative value wastewater brings into the water
th t f t t t t t I W t Di h Ch S t
The inception report didn't include water quality aspects and also didn't include the Waste Discharge System, however, where water quality is a cost item it will be addressed in the
d lresources or the cost of wastewater treatment. Is Waste Discharge Charge System incorporated on the framework?
model.
Scoring system – The Evaluation Criteria of the Scoring System can be better presented by a table, in order to see which criteria has a big weight per IUA. According to the Inception Report Deliverable/Milestones, you have indicated that Analysis of Scoring System will be provided in Q2, so I take the Scoring System will be practically defined using Vaal area.
Yes
P.56 –UV-L should have been provided and clearly demarcated in B-4, Appendix B Yes Not clear what this means as UV-L is demarcated in Figure B-4.P.61, Paragraph 5.1, General – is Figure B-5 (Not B-2) Yes Correct references were made (should read Figure A-2).P.76, Paragraph 5.1, General – Figure B-9 (not B-3) Yes Correct references were made (should read Figure A-3).Groundwater assessment (e.g. P.60, 75 etc.):It is advisable to write some information, to show that one has applied a mind on the issue, rather than leaving the heading blank, for example:
Yes Information from Validation studies and other exissting reports was summarised as background information.
1. Ecological assessment –Is there any groundwater / surface water interactions or baseflow contribution in relation to the aquifer:Any potential threats or impact/s on water quality?.
To be evaluated as part of qualitative assessment
2. Socio-economic assessment – Is there no community or farming activities dependent on groundwater? Even if is insignificant, can be stated.
The analysis concentrate on the use of water dispite their origin and wasn't addressed at this stage.
E. General comments from DWA received on 23 August 2011:Page ix: the following assumptions have been accepted in the calculation of the possible socio-economic costs: who accepted the assumption? And if they are coming from Reconcialtion study reference should be made.
Yes Rephrased sentence.

COMMENTS RECEIVEDADDRESSED IN REPORT?
COMMENT
Page 6: ……Upper Waterval catchment resulting from the most recent BKS study ……is not BKS study because the study was commissioned by DWA, reference should be DWA.
Yes
Page 9: second last paragraph, last sentence: ….in excel format and code written . Clarify code written.
Yes
Page 10: the NFEPA was commissioned by the same ministry (Ministry of Water and Environmental Affairs). the criticism of NFEPA study is not justifiable. Find a way to incorporate NFEPA layer of Maps OR points.
Yes
Page 18: immersed inputs for WIM-model . What are immersed inputs? Yes These immersed inputs consist of an array of multipliers deduced from the appropriate provincial SAM, and are crucial in calculating the macro-economic and socio-economic impacts emanating from water re-allocations across individual water users in the different sub-systems.
Page 23: what informs weight? YesPage 24: the above table indicate that in this specific case the overall scoring in the zone does not change and that the proposed reallocation of water would probably be acceptable. The present classification system makes provision for a class change every 10%, therefore, a 10% score change will necessitate a changed classification . The statement is confusing and clarity is required.
Yes
Page 25: that each EZ has already been allocated an environmental classification-class A – F . the classification has REC A - D and Management class 1 – 3.
Yes Corrected
Page 32, 2.6: reference it, if coming from Reconciliation study. Yes Reference shown in footnote on page 32.Page 38, first paragraph: Sasol is not strategic water user only Eskom is. Yes Statement corrected. Page 42, first paragraph: the heading is Proposed Action and the content is talking about
ti ti l ifYes The proposed action involves corrective action
corrective action, clarify.Page 47, 54, 56, 58, 60, 63, 68: those areas are believed to have power generations, please confirm.
Yes No, only in UV-A: Vaal River upstream of Grootdraai and UV-M incl. UV-J and UV-K
Page 53, last paragraph: salinity balance done by Chris Herald , instead done by Chris Herold.
Yes Corrected
Page 66, first paragraph: clarity on the EI is low and there is no motivation to improve the PES.
Yes
Page 69: spelling check: the flow in this river reach is influence by various factors as listed below , instead of influenced by……..
Yes Corrected
Page 72: map doesn’t have reference point. No The purpose of the map is to illustrate the location of the Zuurbekom area relative to quaternary catchments (the latter are indicated on the map as references). There is a Google Earth map on page 73 (Figure 4.2 ) showing a reference point for the Zuurbekom area.
Page 92: the exact operation of this transfer is unknown (capacity of the transfer infrastrure etc) at this point in time and need to be investigated. This falls outside the scope of work.
Yes Stated that this is not part of current study's TOR.
Page 96, first bullet: spelling check, yellowfish. Yes Corrected