Embed Size (px)
Citation preview

Copyright © 2019, Texas Education Agency. All rights reserved. Reproduction of all or portions of this work is prohibited without expresswritten permission from the Texas Education Agency.
Algebra I
Administered May 2019
STAAR Algebra I 09/30/2019 [This footer should NOT be printed.] AL1SP19R_rev01

STAAR Algebra I 09/20/2019 [This footer should NOT be printed.] AL1SP19R_rev00
( )
y yx x
y y
( )
a b ( )
( )
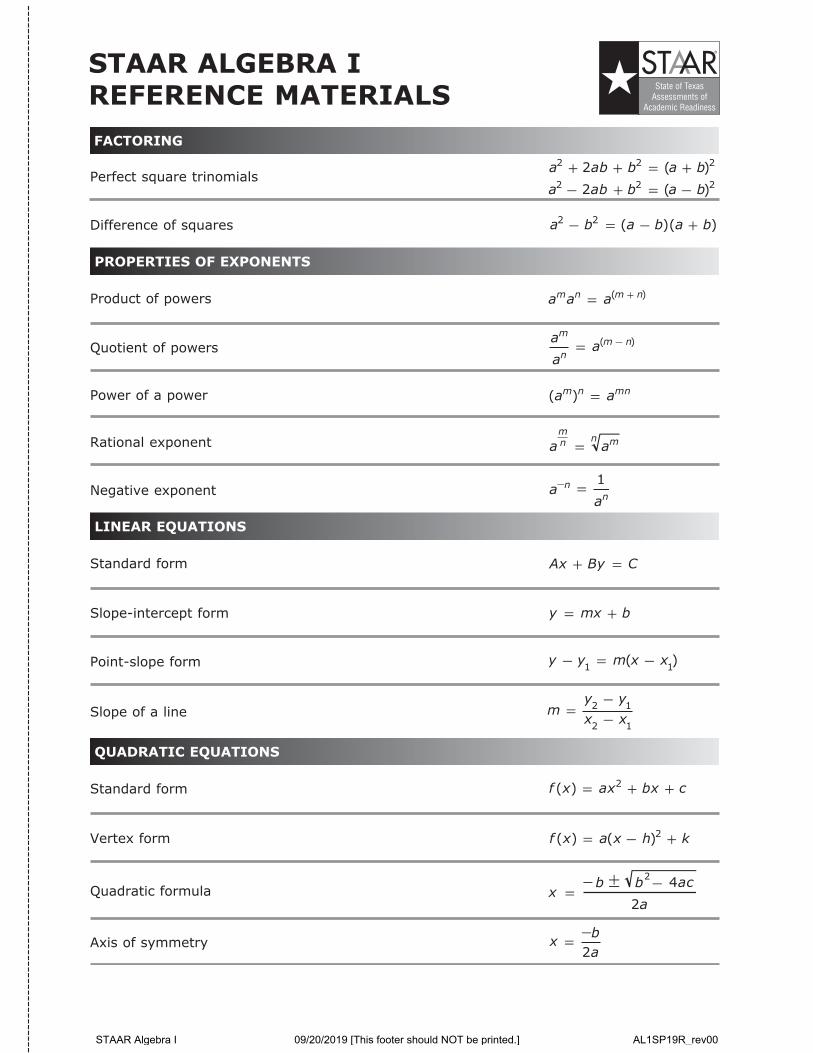
FACTORING
1)
b+ )
m
k
STAAR ALGEBRA IREFERENCE MATERIALS State of Texas
Assessments of Academic Readiness
STAAR®
Perfect square trinomialsa ab b a b2 2 22 +− −=
−−
−
−
−−
− −
−
−
=
− −=
a ab b a b2 2 22+ + = +( )
Difference of squares a b a2 2 (
PROPERTIES OF EXPONENTS
Product of powers a a am n m n= +( )
Quotient of powers aa
an
m n=
Power of a power ( )a am n mn=
Rational exponent a amn mn=
Negative exponent aa
nn
=1
LINEAR EQUATIONS
Standard form Ax By C+ =
Slope-intercept form y mx b= +
Point-slope form m x x1 (
Slope of a line m = 2 1
2 1
QUADRATIC EQUATIONS
Standard form f x ax bx c( ) = + +2
Vertex form f x a x h( ) = +2
Quadratic formula xb b ac
a=
2 4
2
Axis of symmetry x ba
=2
-------------------------------------------------------------------------------------------------------------------------------------------------------------------------------------- STAAR Algebra I 09/20/2019 [This footer should NOT be printed.] AL1SP19R_rev00

--------------------------------------------------------------------------------------------------------------------------------------------------------------------------------------STAAR Algebra I 09/20/2019 [This footer should NOT be printed.] AL1SP19R_rev00

ALGEBRA I
Algebra I
Page 7STAAR Algebra I 09/20/2019 [This footer should NOT be printed.] AL1SP19R_rev00
DIRECTIONS
Read each question carefully. For a multiple-choice question, determine thebest answer to the question from the four answer choices provided. For agriddable question, determine the best answer to the question. Then fill in theanswer on your answer document.
1 What is the slope of the graph of y x12 19= −− ?
A 19−−
B1219
−−
C1912
D 12
Algebra I
Page 8STAAR Algebra I 09/20/2019 [This footer should NOT be printed.] AL1SP19R_rev00

2 A golfer hit a golf ball from a tee box that is 6 yards above the ground. The graph shows theheight in yards of the golf ball above the ground as a quadratic function of x, the horizontaldistance in yards of the golf ball from the tee box.
(0, 6)
y
x(230, 0)
(110, 36)
What is the domain of the function for this situation?
F x0 230≤ ≤
G y6 36≤ ≤
H y0 36≤ ≤
J x6 230≤ ≤
3 Which value of x makes the equation x1.25(4 10) 7.5=−− true?
A 3.5
B 1−−
C 0.5−−
D 4
Algebra I
Page 9STAAR Algebra I 09/20/2019 [This footer should NOT be printed.] AL1SP19R_rev00
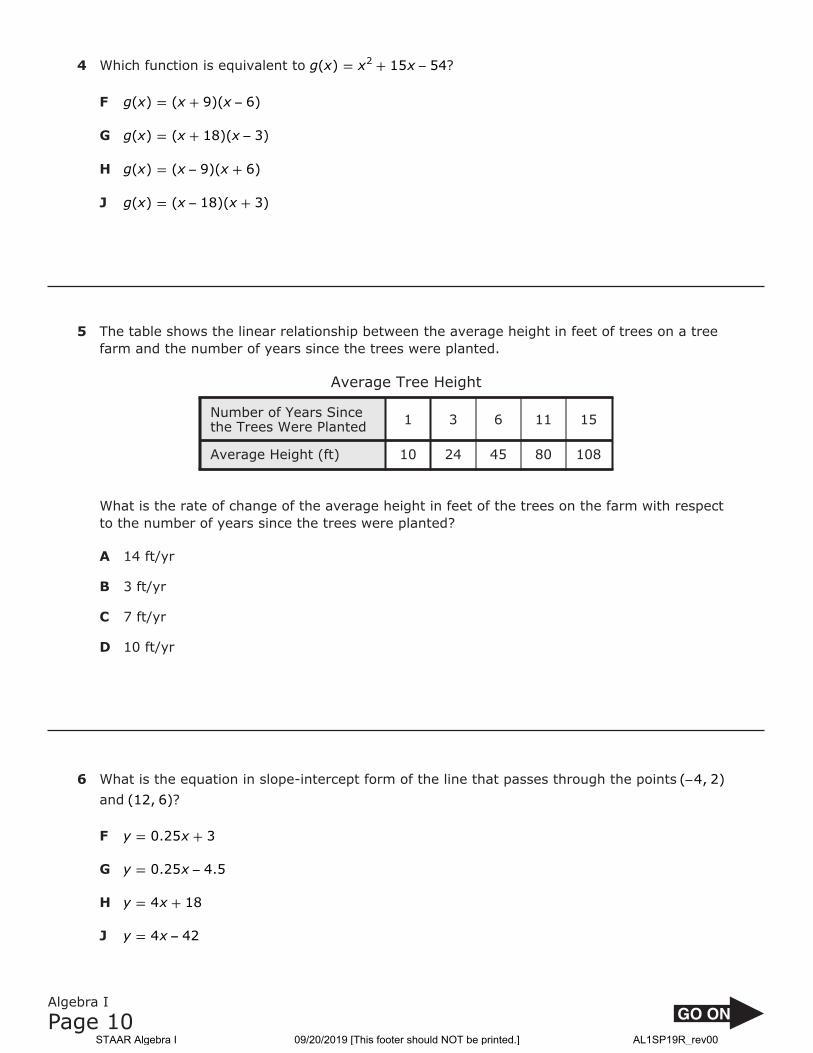
4 Which function is equivalent to g x x x( ) 15 542= + −− ?
F g x x x( ) ( 9)( 6)= + −−
G g x x x( ) ( 18)( 3)= + −−
H g x x x( ) ( 9)( 6)= +−−
J g x x x( ) ( 18)( 3)= +−−
5 The table shows the linear relationship between the average height in feet of trees on a treefarm and the number of years since the trees were planted.
Average Tree Height
Number of Years Sincethe Trees Were Planted 1 3 6 11 15
Average Height (ft) 10 24 45 80 108
What is the rate of change of the average height in feet of the trees on the farm with respectto the number of years since the trees were planted?
A 14 ft/yr
B 3 ft/yr
C 7 ft/yr
D 10 ft/yr
6 What is the equation in slope-intercept form of the line that passes through the points ( 4, 2)−−
and (12, 6)?
F y x0.25 3= +
G y x0.25 4.5= −−
H y x4 18= +
J y x4 42= −−
Algebra I
Page 10STAAR Algebra I 09/20/2019 [This footer should NOT be printed.] AL1SP19R_rev00
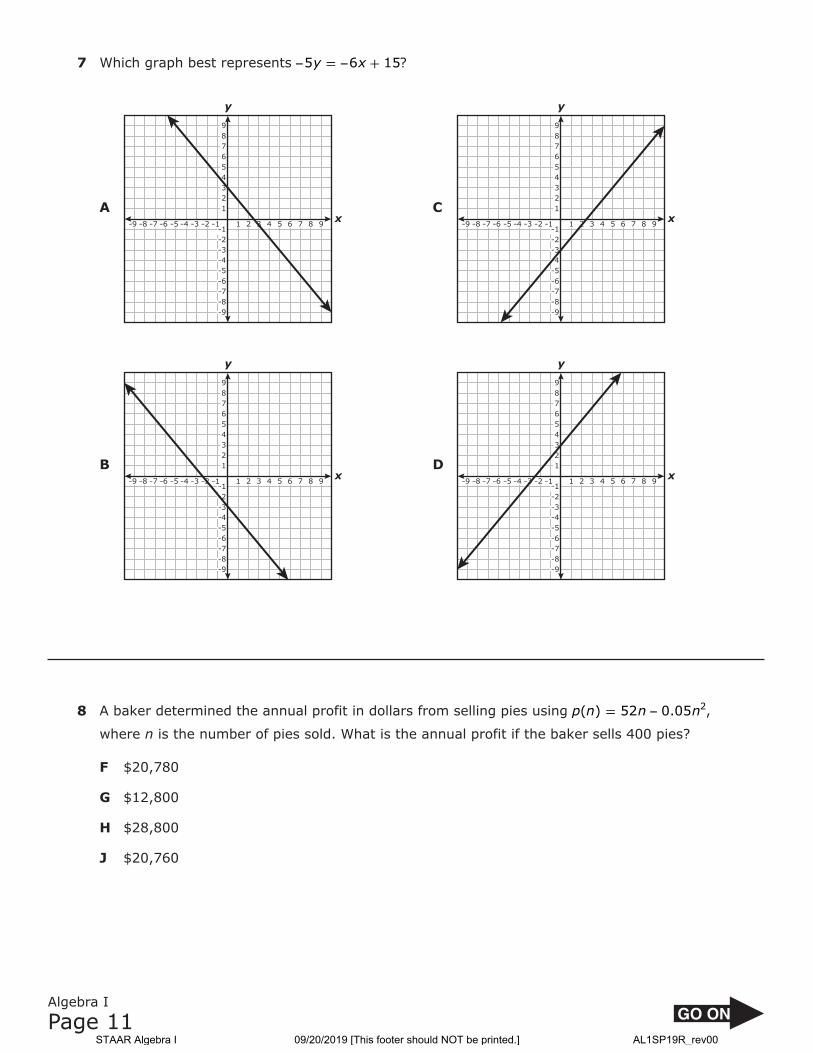
7 Which graph best represents y x5 6 15= +−− −− ?
A–1 1–2–3–4–5–6–7–8–9 2 3 4 5 6 7 8 9 x
–5–4
–6–7–8–9
–3–2–1
1234
6789
5
y
C–1 1–2–3–4–5–6–7–8–9 2 3 4 5 6 7 8 9 x
–5–4
–6–7–8–9
–3–2–1
1234
6789
5
y
B–1 1–2–3–4–5–6–7–8–9 2 3 4 5 6 7 8 9 x
–5–4
–6–7–8–9
–3–2–1
1234
6789
5
y
D–1 1–2–3–4–5–6–7–8–9 2 3 4 5 6 7 8 9 x
–5–4
–6–7–8–9
–3–2–1
1234
6789
5
y
8 A baker determined the annual profit in dollars from selling pies using p n n n( ) 52 0.05 2= −− ,
where n is the number of pies sold. What is the annual profit if the baker sells 400 pies?
F $20,780
G $12,800
H $28,800
J $20,760
Algebra I
Page 11STAAR Algebra I 09/20/2019 [This footer should NOT be printed.] AL1SP19R_rev00

9 An exponential function is graphed on the grid.
4−1 5 6 71 2 3x
−2
8
10
12
14
16
18
20
2
4
6
y
Which function is best represented by the graph?
A g x( ) 613
x
=⎛
⎝⎜
⎞
⎠⎟
B g x( ) 6(3)x=
C g x( ) 613
x
= −−⎛
⎝⎜
⎞
⎠⎟
D g x( ) 6 (3)x= −−
Algebra I
Page 12STAAR Algebra I 09/20/2019 [This footer should NOT be printed.] AL1SP19R_rev00

10 What is the equation in slope-intercept form of the line that crosses the x-axis at 36 and is
perpendicular to the line represented by y x49
5= +−− ?
F y x49
16= +
G y x49
16= −−
H y x94
81= +
J y x94
81= −−
Algebra I
Page 13STAAR Algebra I 09/20/2019 [This footer should NOT be printed.] AL1SP19R_rev00

11 A student worked out at a gym continuously for 50 minutes. The graph shows the remainingpercentage of the workout as a linear function of x, the time in minutes.
50
20
10
30
40
50
60
70
80
90
100
10 15 20 25 30 35 40 45 50
y
x
Minutes
Student’s Workout
Perc
enta
ge R
emai
ning
Which answer choice best describes the domain and range of the function for this situation?
A Domain: All real numbers greater than or equal to 0 and less than or equal to 100Range: All real numbers greater than or equal to 0 and less than or equal to 50
B Domain: 2−−{ }Range: 100{ }
C Domain: All real numbers greater than or equal to 0 and less than or equal to 50Range: All real numbers greater than or equal to 0 and less than or equal to 100
D Domain: 100{ }Range: 2−−{ }
Algebra I
Page 14STAAR Algebra I 09/20/2019 [This footer should NOT be printed.] AL1SP19R_rev00

12 The graph of quadratic parent function f was transformed to create the graph of
g x f x( ) ( 2) 5= + −− . Which graph best represents g?
F−1 1−2−3−4−5−6−7 2 3 4 5 6 7
x
−5−4
−6−7
−3−2−1
1234567
y
H−1 1−2−3−4−5−6−7 2 3 4 5 6 7
x
−5−4
−6−7
−3−2−1
1234567
y
G−1 1−2−3−4−5−6−7 2 3 4 5 6 7
x
−5−4
−6−7
−3−2−1
1234567
y
J−1 1−2−3−4−5−6−7 2 3 4 5 6 7
x
−5−4
−6−7
−3−2−1
1234567
y
Algebra I
Page 15STAAR Algebra I 09/20/2019 [This footer should NOT be printed.] AL1SP19R_rev00

13 Which expression is equivalent tom p v
m p v
45
15
6 2 12
2 8 4
−−
−− −− for all values of m, p, and v where the
expression is defined?
Av
m p
3 8
8 6
Bv
m p
3 16
4 6
Cm
p v
30 3
4 3
Dv
m p
30 3
3 4
14 What is the positive solution to this equation?
x x4 12 1352 + =
Record your answer and fill in the bubbles on your answer document.
15 A grill at a barbecue restaurant will be used to cook sausage links that are 2 lb each andbriskets that are 6 lb each. No more than 120 lb of sausage links and briskets will be cookedon the grill.
Which inequality represents all possible combinations of x, the number of sausage links thatwill be cooked on the grill, and y, the number of briskets that will also be cooked?
A x y6 2 120+ <
B x y2 6 120+ ≤
C x y6 2 120+ >
D x y2 6 120+ ≥
Algebra I
Page 16STAAR Algebra I 09/20/2019 [This footer should NOT be printed.] AL1SP19R_rev00

16 Which expression is equivalent to r r r r(10 7 ) ( 6 18 5 )2 2+ + +−− −− −− ?
F r r7 2 82 + +−−
G r r7 12 82 + +
H r r7 12 82 +−− −−
J r r7 2 82 + −−
17 Which graph best represents the solution set of y x3 4> −− ?
A
−5−4
−6−7−8−9
−10
−3−2−1
123456789
10
−1 1−2−3−4−5−6−7−8−9−10 2 3 4 5 6 7 8 9 10
y
xC
−5−4
−6−7−8−9
−10
−3−2−1
123456789
10
−1 1−2−3−4−5−6−7−8−9−10 2 3 4 5 6 7 8 9 10
y
x
B
−5−4
−6−7−8−9
−10
−3−2−1
123456789
10
−1 1−2−3−4−5−6−7−8−9−10 2 3 4 5 6 7 8 9 10
y
xD
−5−4
−6−7−8−9
−10
−3−2−1
123456789
10
−1 1−2−3−4−5−6−7−8−9−10 2 3 4 5 6 7 8 9 10
y
x
Algebra I
Page 17STAAR Algebra I 09/20/2019 [This footer should NOT be printed.] AL1SP19R_rev00

18 A bank account earning annual compound interest was opened, and no additional deposits or
withdrawals were made after the initial deposit. The balance in the account after x years can
be modeled by b x( ) 850(1.025)x= .
Which statement is the best interpretation of one of the values in this function?
F The initial balance of the account decreases at a rate of 97.5% each year.
G The balance in the account increases at a rate of 2.5% each year.
H The initial balance of the account was $1,025.
J The balance in the account at the end of one year is $850.
19 A company collected data for the number of text messages sent and received using atext-message application since October 2011. The table shows the number of text messagessent and received in billions over time. The data can be modeled by a quadratic function.
Text Messages
Number of Monthssince October 2011, t
Number of TextMessages, n(t)
(billions)
5 3
10 10
15 17
20 27
25 44
30 64
35 86
40 112
Which function best models the data?
A n t t t( ) 0.002 0.55 5.022−−= + +
B n t t t( ) 0.072 0.15 2.732= +−−
C n t t( ) 0.002 5.022= +−−
D n t t( ) 0.072 2.732= +
Algebra I
Page 18STAAR Algebra I 09/20/2019 [This footer should NOT be printed.] AL1SP19R_rev00
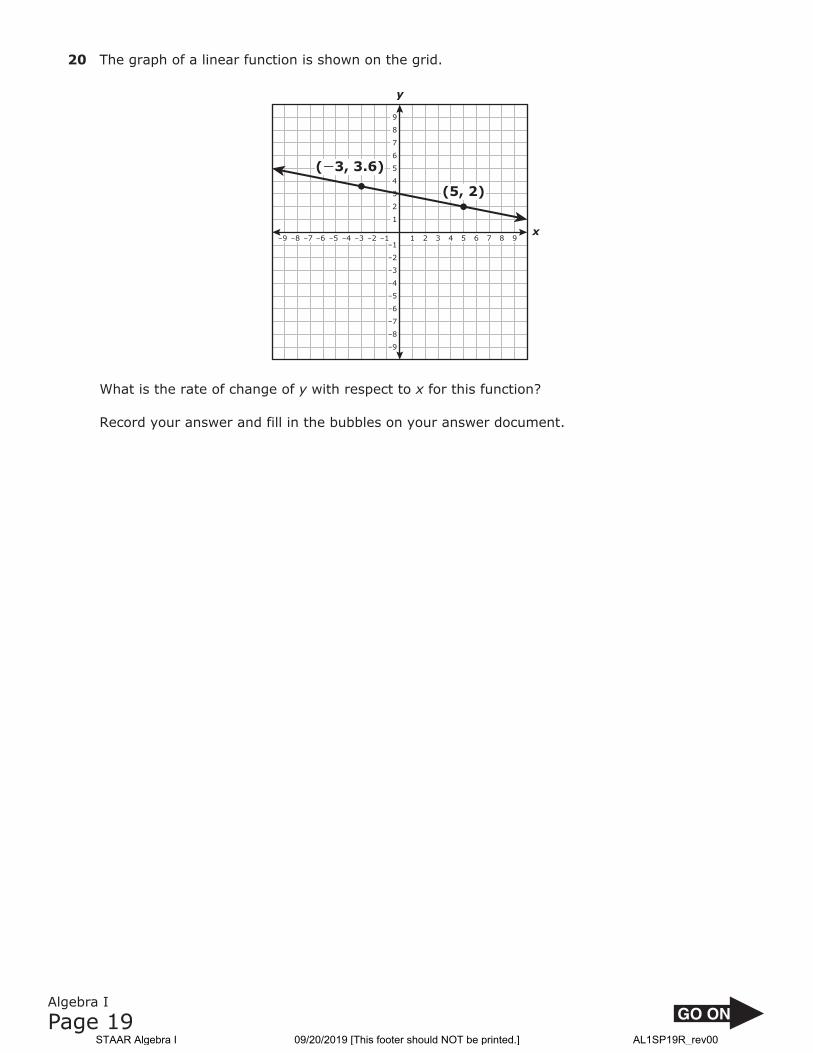
20 The graph of a linear function is shown on the grid.
−1 1−2−3−4−5−6−7−8−9 2 3 4 5 6 7 8 9x
−5
−4
−6
−7
−8
−9
−3
−2
−1
1
2
3
4
5
6
7
8
9
y
(5, 2)
(−3, 3.6)
What is the rate of change of y with respect to x for this function?
Record your answer and fill in the bubbles on your answer document.
Algebra I
Page 19STAAR Algebra I 09/20/2019 [This footer should NOT be printed.] AL1SP19R_rev00

21 Which graph best represents y x x6 12= +−− −− ?
A−1 1−2−3−4−5−6−7−8−9−10 2 3 4 5 6 7 8 9 10 x
−5−4
−6−7−8−9
−10
−3−2−1
123456789
10
y
C−1 1−2−3−4−5−6−7−8−9−10 2 3 4 5 6 7 8 9 10 x
−5−4
−6−7−8−9
−10
−3−2−1
123456789
10
y
B−1 1−2−3−4−5−6−7−8−9−10 2 3 4 5 6 7 8 9 10 x
−5−4
−6−7−8−9
−10
−3−2−1
123456789
10
y
D−1 1−2−3−4−5−6−7−8−9−10 2 3 4 5 6 7 8 9 10 x
−5−4
−6−7−8−9
−10
−3−2−1
123456789
10
y
Algebra I
Page 20STAAR Algebra I 09/20/2019 [This footer should NOT be printed.] AL1SP19R_rev00

22 A company advertises on a website. A worker tracked the number of visits to the website andthe number of clicks on the advertisement. The table shows the data for several days. A linearfunction can be used to model the data.
Website Advertisement
Number of Visitsto Website, x
Number of Clickson Advertisement, y
153 14
629 38
471 30
914 53
307 21
1,045 60
510 32
1,106 63
Based on the table, what is the best prediction of the number of clicks on the advertisement if1,500 people visit the website?
F 77
G 137
H 83
J 105
Algebra I
Page 21STAAR Algebra I 09/20/2019 [This footer should NOT be printed.] AL1SP19R_rev00

23 The graph of a linear function is shown on the grid.
−1 1−2−3−4−5−6−7−8−9 2 3 4 5 6 7 8 9x
−5
−4
−6
−7
−8
−9
−3
−2
−1
1
2
3
4
5
6
7
8
9
y
Which equation is best represented by this graph?
A y x275
( 7)+ = +
B y x275
( 7)=−− −−
C y x257
( 7)+ = +
D y x257
( 7)=−− −−
Algebra I
Page 22STAAR Algebra I 09/20/2019 [This footer should NOT be printed.] AL1SP19R_rev00
24 Which expression is equivalent to xy( )6 2−− for all values of x and y where the expression is
defined?
F xy 36−−
G xy36
H x y2 12−−
J x y2 12
25 A college student completed some courses worth 3 credits and some courses worth 4 credits.The student earned a total of 59 credits after completing 18 courses.
How many courses worth 3 credits did the student complete?
A 13
B 5
C 20
D 39
Algebra I
Page 23STAAR Algebra I 09/20/2019 [This footer should NOT be printed.] AL1SP19R_rev00

26 The graph of linear function f passes through the point (1, 9)−− and has a slope of 3−− .
−1 1−2−3−4−5−6−7−8−9 2 3 4 5 6 7 8 9x
−5
−4
−6
−7
−8
−9
−3
−2
−1
1
2
3
4
5
6
7
8
9
y
What is the zero of f ?
F 2
G 4
H 6−−
J 2−−
27 What is the value of the y-intercept of the graph of h x( ) 29(5.2)x= ?
Record your answer and fill in the bubbles on your answer document.
Algebra I
Page 24STAAR Algebra I 09/20/2019 [This footer should NOT be printed.] AL1SP19R_rev00

28 The graph of a quadratic function is shown on the grid.
x4−1−2−3 5 61 2 3 7 8 9
y
−9
−8
−10
−7
−6
−5
−4
−3
−2
−1
1
2
Which function is best represented by this graph?
F h x x x( ) 3 92= −− −−
G h x x x( ) 3 92= + −−
H h x x x( ) 62= −−
J h x x x( ) 62= +
29 Which expression is equivalent to x x24 22 52 +−− ?
A x x(12 5)(2 1)+ +
B x x(8 5)(3 1)−− −−
C x x(12 5)(2 1)−− −−
D x x(8 5)(3 1)+ +
Algebra I
Page 25STAAR Algebra I 09/20/2019 [This footer should NOT be printed.] AL1SP19R_rev00

30 A system of equations is graphed on the grid.
−1 1−2−3−4−5−6−7 2 3 4 5 6 7x
y
−5
−4
−6
−7
−3
−2
−1
1
2
3
4
5
6
7
(1, 5)
(−1, −2)
(−4, 4) (−1, 3)
Which system of equations does the graph represent?
F y xy x
42 2
==
−− −−−−
G y xy x
42 4
= +=
−−−−
H y xy x
42 2
==
−−−− −−
J y xy x
42 4−− −−
= +=
Algebra I
Page 26STAAR Algebra I 09/20/2019 [This footer should NOT be printed.] AL1SP19R_rev00

31 The table represents some points on the graph of an exponential function.
x f(x)
2−− 12.5
1−− 15
0 18
1 21.6
2 25.92
Which function represents the same relationship?
A f x( ) 1556
x
=⎛
⎝⎜
⎞
⎠⎟
B f x( ) 1865
x
=⎛
⎝⎜
⎞
⎠⎟
C f x( ) 1565
x
=⎛
⎝⎜
⎞
⎠⎟
D f x( ) 1856
x
=⎛
⎝⎜
⎞
⎠⎟
Algebra I
Page 27STAAR Algebra I 09/20/2019 [This footer should NOT be printed.] AL1SP19R_rev00
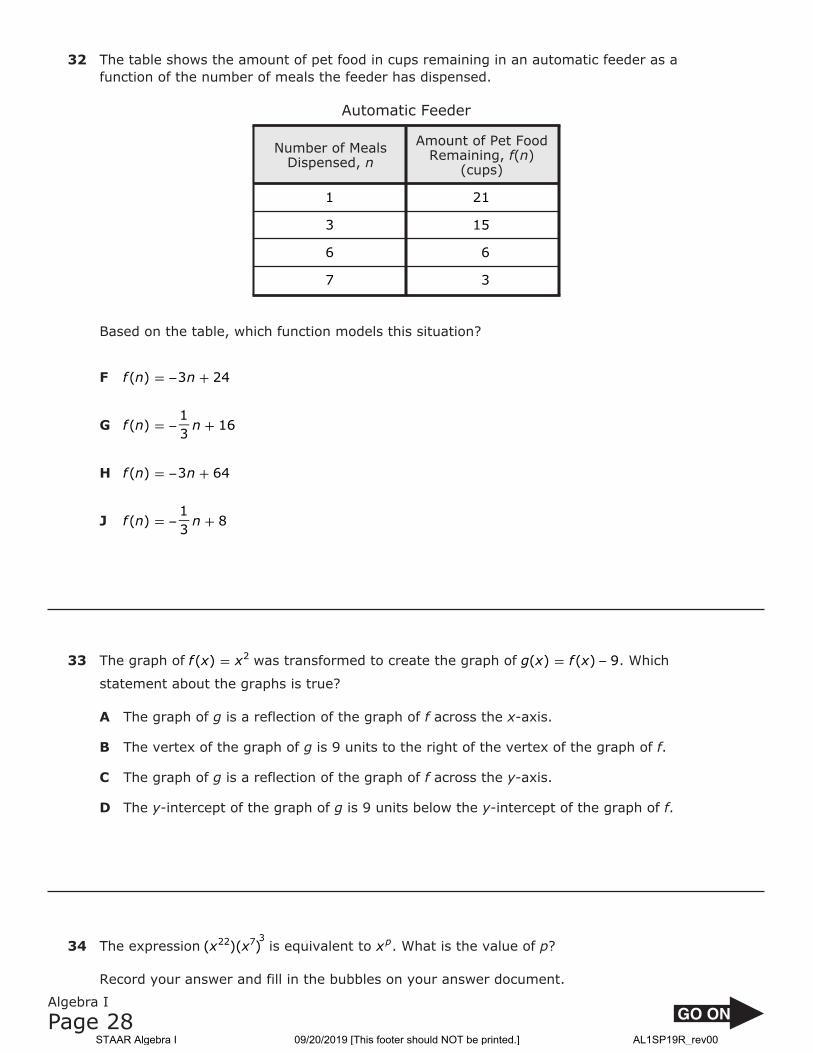
32 The table shows the amount of pet food in cups remaining in an automatic feeder as afunction of the number of meals the feeder has dispensed.
Automatic Feeder
Number of MealsDispensed, n
Amount of Pet FoodRemaining, f(n)
(cups)
1 21
3 15
6 6
7 3
Based on the table, which function models this situation?
F f n n( ) 3 24= +−−
G f n n( )13
16= +−−
H f n n( ) 3 64= +−−
J f n n( )13
8= +−−
33 The graph of f x x( ) 2= was transformed to create the graph of g x f x( ) ( ) 9= −− . Which
statement about the graphs is true?
A The graph of g is a reflection of the graph of f across the x-axis.
B The vertex of the graph of g is 9 units to the right of the vertex of the graph of f.
C The graph of g is a reflection of the graph of f across the y-axis.
D The y-intercept of the graph of g is 9 units below the y-intercept of the graph of f.
34 The expression x x( )( )22 7 3is equivalent to xp. What is the value of p?
Record your answer and fill in the bubbles on your answer document.
Algebra I
Page 28STAAR Algebra I 09/20/2019 [This footer should NOT be printed.] AL1SP19R_rev00

35 The graph of linear function k passes through the points ( 7, 0)−− and (1, 8).
−1 1−2−3−4−5−6−7−8−9 2 3 4 5 6 7 8 9x
−5
−4
−6
−7
−8
−9
−3
−2
−1
1
2
3
4
5
6
7
8
9
y
Which statement must be true?
A The slope of the graph of k is43
−− .
B The graph of k passes through the point ( 1, 8)−− −− .
C The zero of k is 7.
D The x-intercept of the graph of k is 7−− .
Algebra I
Page 29STAAR Algebra I 09/20/2019 [This footer should NOT be printed.] AL1SP19R_rev00

36 Which expression is equivalent to d d210 632 −− ?
F d d21 (10 3)−−
G d d21 (10 3)+
H d21(10 3)+
J d21(10 3)−−
37 What is the value of x in the solution to this system of equations?
x yy x
3 5 225 32
== +
−−−−
A 6.5−−
B 0.5
C 6.5
D 0.5−−
Algebra I
Page 30STAAR Algebra I 09/20/2019 [This footer should NOT be printed.] AL1SP19R_rev00

38 Which graph best represents y 10(0.85)x= ?
F
–2–4–6–8–10–12–14 2 4 x–1–2–3–4
1234
6789
1011121314
5
y
H
–2–4–6–8–10–12–14 2 4 x–1–2–3–4
1234
6789
1011121314
5
y
G
–2–4 2 4 6 8 10 12 14 x–1–2–3–4
1234
6789
1011121314
5
y
J
–2–4 2 4 6 8 10 12 14 x–1–2–3–4
1234
6789
1011121314
5
y
Algebra I
Page 31STAAR Algebra I 09/20/2019 [This footer should NOT be printed.] AL1SP19R_rev00

39 The table shows a linear relationship between x and y.
x y
20−− 96
12−− 60
6−− 33
2−− 15
What is the rate of change of y with respect to x?
A92
−−
B29
C29
−−
D92
40 Which value of x is a solution to this equation?
x x5 36 36 02 + =−−
F x 6−−=
G x 4=
H x 1.8= −−
J x 1.2=
Algebra I
Page 32STAAR Algebra I 09/20/2019 [This footer should NOT be printed.] AL1SP19R_rev00

41 A part of an exponential function is graphed on the grid.
x−1−2 1 2
y
6
7
8
4
5
2
3
1
9
10
Which inequality best represents the domain of the part shown?
A x 2≥ −−
B y 4.5≥
C x 4.5≥
D y 2≥ −−
42 What is the solution to m m(6 8) 4(17 )+ =−− −− ?
Record your answer and fill in the bubbles on your answer document.
Algebra I
Page 33STAAR Algebra I 09/20/2019 [This footer should NOT be printed.] AL1SP19R_rev00

43 Which function is equivalent to y x3( 2) 72= + + ?
A y x x3 12 332= + +
B y x x3 12 192= + +
C y x3 192= +
D y x3 332= +
44 Which table shows y as a function of x?
Fx 13−− 13−− 13−− 13−−
y 2−− 0 5 7
Hx 1 3 7 12
y 4 4 4 4
Gx 6−− 1−− 1−− 10
y 3 1−− 5 9−−
Jx 9−− 2−− 0 0
y 7−− 5−− 0 6
Algebra I
Page 34STAAR Algebra I 09/20/2019 [This footer should NOT be printed.] AL1SP19R_rev00

45 What is the equation in slope-intercept form of the line that passes through the point (5, 0)
and is parallel to the line represented by y x1.2 3.8= + ?
A y x1.2 6= −−
B y x1.2 6= +−−
C y x1.2 5= +
D y x1.2 5= −− −−
46 The graph of quadratic function k is shown on the grid.
−1−2−3−4−5−6−7−8 1 2 3 4 5 6x
y
−1
−2
1
2
3
4
5
6
7
8
9
10
11
12
Which statements are best supported by the graph of k?
I. The x-intercept is located at ( 3, 0)−− .
II. The coordinates of the y-intercept are (0, 9).
III. The axis of symmetry is x 3−−= .
F I and II only
G I and III only
H II and III only
J I, II, and III
Algebra I
Page 35STAAR Algebra I 09/20/2019 [This footer should NOT be printed.] AL1SP19R_rev00

47 A college student has two different jobs. Her combined work schedules consist of no morethan 48 hours in one week.
Which graph best represents the solution set for all possible combinations of x, the number ofhours she worked at her first job, and y, the number of hours she worked at her second job,in one week?
A
0
126
18
30
42
54
24
36
48
12 186 24 30 36 42 48 54
Work Schedule
Number of Hours Worked at First Job
Num
ber
of H
ours
Wor
ked
at S
econ
d Jo
b
y
x
C
0
126
18
30
42
54
24
36
48
12 186 24 30 36 42 48 54
Work Schedule
Number of Hours Worked at First Job
Num
ber
of H
ours
Wor
ked
at S
econ
d Jo
b
y
x
B
0
126
18
30
42
54
24
36
48
12 186 24 30 36 42 48 54
Work Schedule
Number of Hours Worked at First Job
Num
ber
of H
ours
Wor
ked
at S
econ
d Jo
b
y
x
D
0
126
18
30
42
54
24
36
48
12 186 24 30 36 42 48 54
Work Schedule
Number of Hours Worked at First Job
Num
ber
of H
ours
Wor
ked
at S
econ
d Jo
by
x
Algebra I
Page 36STAAR Algebra I 09/20/2019 [This footer should NOT be printed.] AL1SP19R_rev00

48 Which function is equivalent to q x x x( ) 9 24 16?2= +−−
F q x x x( ) (9 4)( 4)= −− −−
G q x x( ) (3 4)2= +
H q x x x( ) (9 4)( 4)= + +
J q x x( ) (3 4)2= −−
49 Which graph best represents this system of equations and its solution?
x yx y8 4 16
3 15 6=
+ =−− −−
−−
A−1 1−2−3−4−5−6−7 2 3 4 5 6 7
x
−5−4
−6−7
−3−2−1
1234567
y
C−1 1−2−3−4−5−6−7 2 3 4 5 6 7
x
−5−4
−6−7
−3−2−1
1234567
y
B−1 1−2−3−4−5−6−7 2 3 4 5 6 7
x
−5−4
−6−7
−3−2−1
1234567
y
D−1 1−2−3−4−5−6−7 2 3 4 5 6 7
x
−5−4
−6−7
−3−2−1
1234567
y
Algebra I
Page 37STAAR Algebra I 09/20/2019 [This footer should NOT be printed.] AL1SP19R_rev00

50 What are the domain and range of g x x( )14
( 17) 612= +−− −− ?
F Domain: All real numbersRange: g x( ) 61≤
G Domain: x 17≤Range: g x( ) 61≤
H Domain: All real numbersRange: x 17≤
J Domain: g x( ) 61≥Range: x 17≤
51 A customer at a store paid $64 for 3 large candles and 4 small candles. At the same store, asecond customer paid $4 more than the first customer for 1 large candle and 8 small candles.The price of each large candle is the same, and the price of each small candle is the same.
Which system of equations can be used to find the price in dollars of each large candle, x, andeach small candle, y?
A y xy x
4 3 648 68
= += +
B y xy x
4 3 648 60
= += +
C x yx y3 4 64
8 68+ =
+ =
D x yx y3 4 64
8 60+ =
+ =
Algebra I
Page 38STAAR Algebra I 09/20/2019 [This footer should NOT be printed.] AL1SP19R_rev00

52 Linear parent function f is graphed on the grid.
−1 1−2−3−4−5−6−7−8−9 2 3 4 5 6 7 8 9x
−5
−4
−6
−7
−8
−9
−3
−2
−1
1
2
3
4
5
6
7
8
9
y
Which graph best represents h x f x( ) ( ) 3= +−− ?
F–1 1–2–3–4–5–6–7–8–9 2 3 4 5 6 7 8 9 x
–5–4
–6–7–8–9
–3–2–1
1234
6789
5
y
H–1 1–2–3–4–5–6–7–8–9 2 3 4 5 6 7 8 9 x
–5–4
–6–7–8–9
–3–2–1
1234
6789
5
y
G–1 1–2–3–4–5–6–7–8–9 2 3 4 5 6 7 8 9 x
–5–4
–6–7–8–9
–3–2–1
1234
6789
5
y
J–1 1–2–3–4–5–6–7–8–9 2 3 4 5 6 7 8 9 x
–5–4
–6–7–8–9
–3–2–1
1234
6789
5
y
Algebra I
Page 39STAAR Algebra I 09/20/2019 [This footer should NOT be printed.] AL1SP19R_rev00

53 Which expression is equivalent to 4 147?
A 196 3
B 12 7
C 3 7
D 28 3
54 The total distance in centimeters a toy robot moves varies directly with the time in seconds.The toy robot moves a total distance of 264 centimeters in 11 seconds.
What is the time in seconds the toy robot moves when the total distance is 408 centimeters?
F 24 s
G 17 s
H 13 s
J 37 s
Algebra I
Page 40STOP
BE SURE YOU HAVE RECORDED ALL OF YOUR ANSWERSON THE ANSWER DOCUMENT.
STAAR Algebra I 09/20/2019 [This footer should NOT be printed.] AL1SP19R_rev00

STAAR Algebra I 09/20/2019 [This footer should NOT be printed.] AL1SP19R_rev00

STAAR Algebra I 09/20/2019 [This footer should NOT be printed.] AL1SP19R_rev00

STAAR Algebra I 09/20/2019 [This footer should NOT be printed.] AL1SP19R_rev00

STAAR
Algebra IMay 2019
STAAR Algebra I 09/20/2019 [This footer should NOT be printed.] AL1SP19R_rev00