Embed Size (px)
Citation preview
Hobbs Municipal Schools with process support from The Charles A. Dana Center at the University of Texas at Austin
55
Algebra 1, Quarter 4, Unit 4.1
Comparing Linear, Quadratic, and Exponential Models
Overview Number of instructional days: 10 (1 day = 45–60 minutes)
Content to be learned Mathematical practices to be integrated • Solve systems of equations and inequalities
graphically.
• Prove that linear functions grow by equal differences over equal intervals.
• Prove that exponential functions grow by equal factors over equal intervals.
• Graph square root functions.
• Graph cube root functions.
• Graph piecewise-defined functions.
• Graph absolute value functions.
• Identify the effect on a graph as the operation of k changes.
Model with mathematics.
• Use scales and units to make graphs that appropriately represent data.
• Make conjectures about the form and meaning of solutions.
Use appropriate tools strategically.
• Use graphing calculators.
• Use rulers, pencil, paper, and concrete models.
Attend to precision.
• Take care in specifying units of measure and labeling axes to clarify the correspondence of quantities in a problem.
• Express numerical answers with a degree of precision appropriate for the problem context.
Essential questions • What is the meaning of a duel-shaded area
when graphing a system of inequalities?
• How can you differentiate between an exponential model and a linear model given a real-world set of data?
• What are the characteristics of the graph of a square root function?
• What is effect on the graph of f(x) when replacing f(x) with f(x) + k, k f(x), f(kx), and f(x+k) for specific values of k (both positive and negative)?

Algebra 1, Quarter 4, Unit 4.1 Comparing Linear, Quadratic, and Exponential Models (10 days)
Hobbs Municipal Schools with process support from The Charles A. Dana Center at the University of Texas at Austin
56
Written Curriculum
Common Core State Standards for Mathematical Content
Linear, Quadratic, and Exponential Models★ F-LE
Construct and compare linear, quadratic, and exponential models and solve problems
F-LE.1 Distinguish between situations that can be modeled with linear functions and with exponential functions.★
a. Prove that linear functions grow by equal differences over equal intervals, and that exponential functions grow by equal factors over equal intervals.
b. Recognize situations in which one quantity changes at a constant rate per unit interval relative to another.
c. Use the properties of exponents to transform expressions for exponential functions. For example the expression 1.15t can be rewritten as (1.151/12)12t ≈ 1.01212t to reveal the approximate equivalent monthly interest rate if the annual rate is 15%.
Interpreting Functions F-IF
Analyze functions using different representations [Linear, exponential, quadratic, absolute value, step, piecewise-defined]
F-IF.7 Graph functions expressed symbolically and show key features of the graph, by hand in simple cases and using technology for more complicated cases.★
b. Graph square root, cube root, and piecewise-defined functions, including step functions and absolute value functions.
Building Functions F-BF
Build new functions from existing functions [Linear and quadratic]
F-BF.3 Identify the effect on the graph of replacing f(x) by f(x) + k, k f(x), f(kx), and f(x + k) for specific values of k (both positive and negative); find the value of k given the graphs. Experiment with cases and illustrate an explanation of the effects on the graph using technology. Include recognizing even and odd functions from their graphs and algebraic expressions for them.
Common Core Standards for Mathematical Practice
4 Model with mathematics.
Mathematically proficient students can apply the mathematics they know to solve problems arising in everyday life, society, and the workplace. In early grades, this might be as simple as writing an addition equation to describe a situation. In middle grades, a student might apply proportional reasoning to plan a school event or analyze a problem in the community. By high school, a student might use geometry to solve a design problem or use a function to describe how one quantity of interest depends on another. Mathematically proficient students who can apply what they know are comfortable making assumptions
Algebra 1, Quarter 4, Unit 4.1 Comparing Linear, Quadratic, and Exponential Models (10 days)
Hobbs Municipal Schools with process support from The Charles A. Dana Center at the University of Texas at Austin
57
and approximations to simplify a complicated situation, realizing that these may need revision later. They are able to identify important quantities in a practical situation and map their relationships using such tools as diagrams, two-way tables, graphs, flowcharts and formulas. They can analyze those relationships mathematically to draw conclusions. They routinely interpret their mathematical results in the context of the situation and reflect on whether the results make sense, possibly improving the model if it has not served its purpose.
5 Use appropriate tools strategically.
Mathematically proficient students consider the available tools when solving a mathematical problem. These tools might include pencil and paper, concrete models, a ruler, a protractor, a calculator, a spreadsheet, a computer algebra system, a statistical package, or dynamic geometry software. Proficient students are sufficiently familiar with tools appropriate for their grade or course to make sound decisions about when each of these tools might be helpful, recognizing both the insight to be gained and their limitations. For example, mathematically proficient high school students analyze graphs of functions and solutions generated using a graphing calculator. They detect possible errors by strategically using estimation and other mathematical knowledge. When making mathematical models, they know that technology can enable them to visualize the results of varying assumptions, explore consequences, and compare predictions with data. Mathematically proficient students at various grade levels are able to identify relevant external mathematical resources, such as digital content located on a website, and use them to pose or solve problems. They are able to use technological tools to explore and deepen their understanding of concepts.
6 Attend to precision.
Mathematically proficient students try to communicate precisely to others. They try to use clear definitions in discussion with others and in their own reasoning. They state the meaning of the symbols they choose, including using the equal sign consistently and appropriately. They are careful about specifying units of measure, and labeling axes to clarify the correspondence with quantities in a problem. They calculate accurately and efficiently, express numerical answers with a degree of precision appropriate for the problem context. In the elementary grades, students give carefully formulated explanations to each other. By the time they reach high school they have learned to examine claims and make explicit use of definitions.
Clarifying the Standards
Prior Learning
In grade 1, students represented and interpreted data, including how much is more or less, and they answered questions about the total number of data points. In grade 2, students represented information in pictographs and interpreted its meaning. Third-grade students were introduced to line plots with whole numbers, and fourth-grade students learned line plots with one-half, one-fourth, and one-eighth. In grade 5, students used operations on fractions with line plots to solve problems. Sixth-grade students incorporated box plots and histograms, and they identified median and/or mean. They described overall patterns of data and striking deviations from the overall pattern with reference to the context in which the data were gathered. In grade 7, students computed unit rates associated with fractions, and they recognized and represented proportional relationships between quantities. Eighth-grade students recognized the equation y = mx + b as a linear equation whose graph is a straight line, and they gave examples of nonlinear equations.

Algebra 1, Quarter 4, Unit 4.1 Comparing Linear, Quadratic, and Exponential Models (10 days)
Hobbs Municipal Schools with process support from The Charles A. Dana Center at the University of Texas at Austin
58
Current Learning
Students represent and solve equations and inequalities graphically by making tables, making approximations, and using technology. This includes cases where the functions are linear, polynomial, rational, and absolute value functions. Students distinguish between situations that can be modeled with linear functions and with exponential functions. They prove that linear functions grow by equal differences over equal intervals, and that exponential functions grow by equal factors over equal intervals. Students graph functions expressed symbolically and show key features of the graphs by hand (linear, exponential, and quadratic functions) and using technology (absolute value, step, and piecewise-defined functions). Students identify the effect on the graph of replacing f(x) by f(x) + k, kf(x), and f(x+k) for specific values of k (both positive and negative), and they find the value of k given the graphs.
Future Learning
In Algebra 2, students will solve exponential and logarithmic equations and inequalities graphically. Students will use logarithms to find solutions of exponential equations. Interpretations of functions will focus on using key features to guide the selection of appropriate type functions to model problem situations. In Algebra 2, students will build functions including exponential, logarithmic, and trigonometric functions; they will emphasize the common effect of each transformation across function types.
Additional Findings
According to PARCC Model Content Frameworks: Mathematics, Grades 3–11, Version 3.0 (November 2012), the Algebra I Assessment Limits and Clarifications are the following:
Represent and solve equations and inequalities graphically
i) Tasks that assess conceptual understanding of the indicated concept may involve any of the function types mentioned in the standard except exponential and logarithmic functions. ii) Finding the solutions approximately is limited to cases where f(x) and g(x) are polynomial functions.
Build new functions from existing functions
i) Identifying the effect on the graph of replacing f(x) by f(x) + k, k f(x), f(kx), and f(x+k) for specific values of k (both positive and negative) is limited to linear and quadratic functions.
ii) Experimenting with cases and illustrating an explanation of the effects on the graph using technology is limited to linear functions, quadratic functions, square root functions, cube root functions, piecewise-defined functions (including step functions and absolute value functions), and exponential functions with domains in the integers.
iii) Tasks do not involve recognizing even and odd functions.
Hobbs Municipal Schools with process support from The Charles A. Dana Center at the University of Texas at Austin
59
Algebra 1, Quarter 4, Unit 4.2
Representing Data and Statistics with One Variable
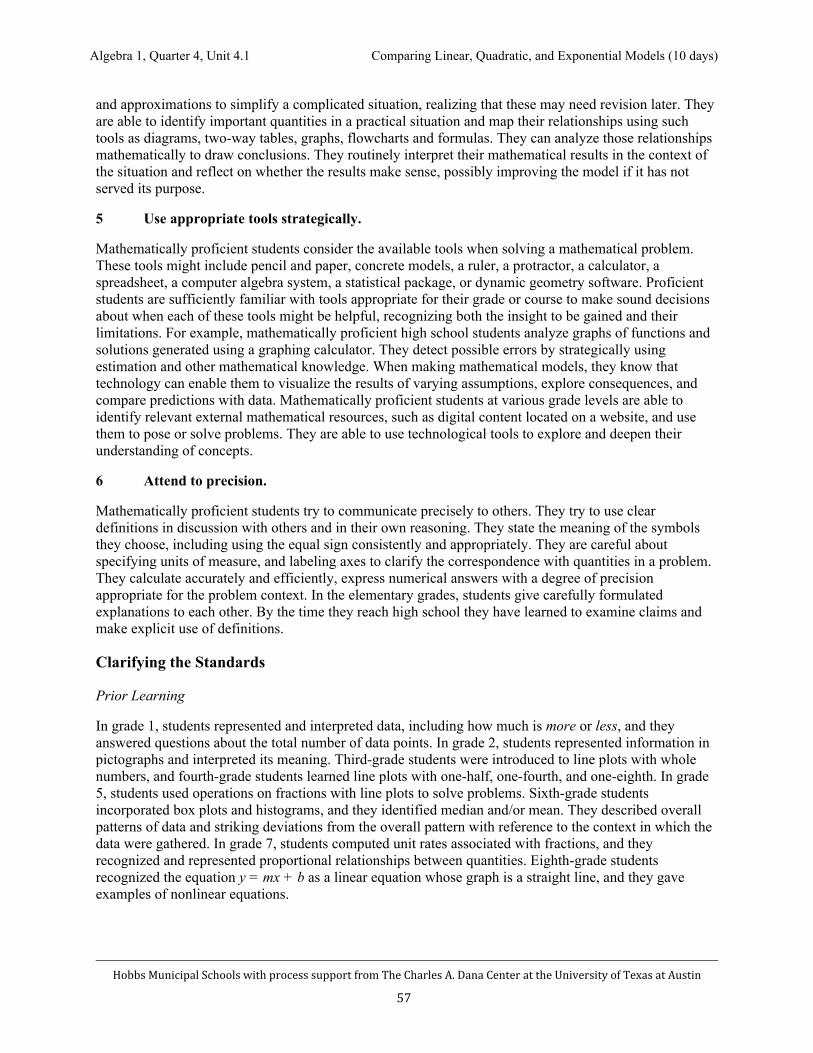
Overview Number of instructional days: 15 (1 day = 45–60 minutes)
Content to be learned Mathematical practices to be integrated • Represent data by plotting on a real number
line.
• Compare two or more different data sets using measures of central tendency.
• Interpret differences in data sets accounting for possible effects of outliers.
• Summarize categorical data for two categories in two-way frequency tables.
• Recognize possible associations and trends in the data.
Model with mathematics.
• Represent data using box plots, histograms, and dot plots.
• Analyze relationships of data to draw conclusions.
Use appropriate tools strategically.
• Use pencil, paper, and ruler for simple problems.
• Use a graphing calculator for more complex problems and to verify solutions.
Attend to precision.
• Examine predictions for validity.
• Determine appropriate units of value used in graphing and labeling.
Essential questions • How can you gather, organize, and display data
to communicate and justify results?
• How can you analyze data to make inferences and/or predictions?
• How can you summarize categorical data for two categories?

Algebra 1, Quarter 4, Unit 4.2 Representing Data and Statistics with One Variable (15 days)
Hobbs Municipal Schools with process support from The Charles A. Dana Center at the University of Texas at Austin
60
Written Curriculum
Common Core State Standards for Mathematical Content
Interpreting Categorical and Quantitative Data★ S-ID
Summarize, represent, and interpret data on a single count or measurement variable
S-ID.1 Represent data with plots on the real number line (dot plots, histograms, and box plots).★
S-ID.2 Use statistics appropriate to the shape of the data distribution to compare center (median, mean) and spread (interquartile range, standard deviation) of two or more different data sets.★
S-ID.3 Interpret differences in shape, center, and spread in the context of the data sets, accounting for possible effects of extreme data points (outliers).★
Summarize, represent, and interpret data on two categorical and quantitative variables [Linear focus, discuss general principle]
S-ID.5 Summarize categorical data for two categories in two-way frequency tables. Interpret relative frequencies in the context of the data (including joint, marginal, and conditional relative frequencies). Recognize possible associations and trends in the data.★
Common Core Standards for Mathematical Practice
4 Model with mathematics.
Mathematically proficient students can apply the mathematics they know to solve problems arising in everyday life, society, and the workplace. In early grades, this might be as simple as writing an addition equation to describe a situation. In middle grades, a student might apply proportional reasoning to plan a school event or analyze a problem in the community. By high school, a student might use geometry to solve a design problem or use a function to describe how one quantity of interest depends on another. Mathematically proficient students who can apply what they know are comfortable making assumptions and approximations to simplify a complicated situation, realizing that these may need revision later. They are able to identify important quantities in a practical situation and map their relationships using such tools as diagrams, two-way tables, graphs, flowcharts and formulas. They can analyze those relationships mathematically to draw conclusions. They routinely interpret their mathematical results in the context of the situation and reflect on whether the results make sense, possibly improving the model if it has not served its purpose.
5 Use appropriate tools strategically.
Mathematically proficient students consider the available tools when solving a mathematical problem. These tools might include pencil and paper, concrete models, a ruler, a protractor, a calculator, a spreadsheet, a computer algebra system, a statistical package, or dynamic geometry software. Proficient students are sufficiently familiar with tools appropriate for their grade or course to make sound decisions about when each of these tools might be helpful, recognizing both the insight to be gained and their limitations. For example, mathematically proficient high school students analyze graphs of functions and solutions generated using a graphing calculator. They detect possible errors by strategically using estimation and other mathematical knowledge. When making mathematical models, they know that technology can enable them to visualize the results of varying assumptions, explore consequences, and

Algebra 1, Quarter 4, Unit 4.2 Representing Data and Statistics with One Variable (15 days)
Hobbs Municipal Schools with process support from The Charles A. Dana Center at the University of Texas at Austin
61
compare predictions with data. Mathematically proficient students at various grade levels are able to identify relevant external mathematical resources, such as digital content located on a website, and use them to pose or solve problems. They are able to use technological tools to explore and deepen their understanding of concepts.
Clarifying the Standards
Prior Learning
In grade 1, students represented and interpreted data, including how much is more or less, and they answered questions about the total number of data points. In grade 2, students represented information in pictographs and interpreted its meaning. Sixth-grade students incorporated box plots and histograms, and they identified median and/or mean. They described overall patterns of data and striking deviations from the overall pattern with reference to the context in which the data were gathered. In grade 7, students computed unit rates associated with fractions, and they recognized and represented proportional relationships between quantities. Eighth-grade students constructed and interpreted scatterplots for bivariate measurement data to investigate patterns of association.
Current Learning
Students represent data with plots on the real number line, including dot plots, histograms, and box plots. They use statistics appropriate to the shape of the data distribution to compare center (mean, median) and spread (interquartile range, standard deviation) of two or more different data sets. Students interpret differences in shape, center, and spread in the context of the data sets, accounting for possible effects of extreme data points (outliers). They summarize categorical data for two categories in two-way frequency tables, and they interpret relative frequencies in the context of the data (including joint, marginal, and conditional relative frequencies). Students recognize possible associations and trends in the data.
Future Learning
In Algebra 2, students will summarize, represent, and interpret data on a single count or measurement variable. Careers using these skills include political analyst, statistician, budget analyst, actuary, economist, and positions in various health, medical, and engineering fields. These skills will be further visited in Statistics and used in business classes.
Additional Findings
None found.

Algebra 1, Quarter 4, Unit 4.2 Representing Data and Statistics with One Variable (15 days)
Hobbs Municipal Schools with process support from The Charles A. Dana Center at the University of Texas at Austin
62

Hobbs Municipal Schools with process support from The Charles A. Dana Center at the University of Texas at Austin
63
Algebra 1, Quarter 4, Unit 4.3
Interpreting Linear Models with Data
Overview Number of instructional days: 15 (1 day = 45–60 minutes)
Content to be learned Mathematical practices to be integrated • Interpret linear models.
• Compute, using technology, the correlation coefficient of linear fit.
• Interpret the correlation coefficient of linear fit.
• Distinguish between correlation and causation.
Model with mathematics.
• Interpret mathematical results of the represented data.
• Analyze relationships between data to draw conclusions.
Use appropriate tools strategically.
• Use pencil, paper, and ruler for simple problems.
• Use a graphing calculator for more complex problems and to verify solutions.
Look for and make use of structure.
• Look closely to discern a pattern or structure from data.
• Shift perspective gained by insight of the overview of data.
Essential questions • How are causation and correlation of data
different? • How does the correlation coefficient determine
line of best fit?
Algebra 1, Quarter 4, Unit 4.3 Interpreting Linear Models with Data (15 days)
Hobbs Municipal Schools with process support from The Charles A. Dana Center at the University of Texas at Austin
64
Written Curriculum
Common Core State Standards for Mathematical Content
Interpreting Categorical and Quantitative Data★ S-ID
Summarize, represent, and interpret data on two categorical and quantitative variables [Linear focus, discuss general principle]
S-ID.6 Represent data on two quantitative variables on a scatter plot, and describe how the variables are related.★
a. Fit a function to the data; use functions fitted to data to solve problems in the context of the data. Use given functions or choose a function suggested by the context. Emphasize linear, quadratic, and exponential models.
b. Informally assess the fit of a function by plotting and analyzing residuals.
c. Fit a linear function for a scatter plot that suggests a linear association.
Interpret linear models
S-ID.7 Interpret the slope (rate of change) and the intercept (constant term) of a linear model in the context of the data.★
S-ID.8 Compute (using technology) and interpret the correlation coefficient of a linear fit.★
S-ID.9 Distinguish between correlation and causation.★
Common Core Standards for Mathematical Practice
4 Model with mathematics.
Mathematically proficient students can apply the mathematics they know to solve problems arising in everyday life, society, and the workplace. In early grades, this might be as simple as writing an addition equation to describe a situation. In middle grades, a student might apply proportional reasoning to plan a school event or analyze a problem in the community. By high school, a student might use geometry to solve a design problem or use a function to describe how one quantity of interest depends on another. Mathematically proficient students who can apply what they know are comfortable making assumptions and approximations to simplify a complicated situation, realizing that these may need revision later. They are able to identify important quantities in a practical situation and map their relationships using such tools as diagrams, two-way tables, graphs, flowcharts and formulas. They can analyze those relationships mathematically to draw conclusions. They routinely interpret their mathematical results in the context of the situation and reflect on whether the results make sense, possibly improving the model if it has not served its purpose.
5 Use appropriate tools strategically.
Mathematically proficient students consider the available tools when solving a mathematical problem. These tools might include pencil and paper, concrete models, a ruler, a protractor, a calculator, a spreadsheet, a computer algebra system, a statistical package, or dynamic geometry software. Proficient students are sufficiently familiar with tools appropriate for their grade or course to make sound decisions about when each of these tools might be helpful, recognizing both the insight to be gained and their
Algebra 1, Quarter 4, Unit 4.3 Interpreting Linear Models with Data (15 days)
Hobbs Municipal Schools with process support from The Charles A. Dana Center at the University of Texas at Austin
65
limitations. For example, mathematically proficient high school students analyze graphs of functions and solutions generated using a graphing calculator. They detect possible errors by strategically using estimation and other mathematical knowledge. When making mathematical models, they know that technology can enable them to visualize the results of varying assumptions, explore consequences, and compare predictions with data. Mathematically proficient students at various grade levels are able to identify relevant external mathematical resources, such as digital content located on a website, and use them to pose or solve problems. They are able to use technological tools to explore and deepen their understanding of concepts.
7 Look for and make use of structure.
Mathematically proficient students look closely to discern a pattern or structure. Young students, for example, might notice that three and seven more is the same amount as seven and three more, or they may sort a collection of shapes according to how many sides the shapes have. Later, students will see 7 × 8 equals the well remembered 7 × 5 + 7 × 3, in preparation for learning about the distributive property. In the expression x2 + 9x + 14, older students can see the 14 as 2 × 7 and the 9 as 2 + 7. They recognize the significance of an existing line in a geometric figure and can use the strategy of drawing an auxiliary line for solving problems. They also can step back for an overview and shift perspective. They can see complicated things, such as some algebraic expressions, as single objects or as being composed of several objects. For example, they can see 5 – 3(x – y)2 as 5 minus a positive number times a square and use that to realize that its value cannot be more than 5 for any real numbers x and y.
Clarifying the Standards
Prior Learning
In grade 1, students represented and interpreted data, including how much is more or less, and they answered questions about the total number of data points. In grade 2, students represented information in pictographs and interpreted its meaning. Sixth-grade students incorporated box plots and histograms, and they identified median and/or mean. They described overall patterns of data and striking deviations from the overall pattern with reference to the context in which the data were gathered. In grade 7, students computed unit rates associated with fractions, and they recognized and represented proportional relationships between quantities. Eighth-grade students constructed and interpreted scatterplots for bivariate measurement data to investigate patterns of association.
Current Learning
Students use rate of change and the intercept of a linear model to interpret the context of the data. They use technology to compute and interpret the correlation coefficient of linear fit. Students distinguish between causation and correlation of data.
Future Learning
In Algebra 2 and Statistics, students will continue to apply the content of this unit to real-world situations. Careers using these skills include underwriter, political analyst, statistician, budget analyst, actuary, economist, and positions in various health, medical, and engineering fields.
Additional Findings
None found.

Algebra 1, Quarter 4, Unit 4.3 Interpreting Linear Models with Data (15 days)
Hobbs Municipal Schools with process support from The Charles A. Dana Center at the University of Texas at Austin
66