Embed Size (px)
Citation preview
Leveraging Aid for Trade Capacity in Uganda
Abstract:
Working Paper 1October 2014
Alex Thomas Ijjo, Isaac Shinyekwa
The hindrances to the gainful participation of least developed countries (LDCs) in international trade are predominantly domestic supply related constraints rather than foreign market access. These constraints include variable productive capacity, economic infrastructure bottlenecks, and inability to meet international quality standards. In recognition of such challenges facing LDCs, the World Trade Organization (WTO) launched the “Aid for Trade” (AFT) initiative in 2005 to coordinate international support for strengthening trade capacity in LDCs. Looking at the case of Uganda, we initially examine the role of overall Official Development Assistance (ODA) in driving Uganda’s external trade and then specifically that of AFT in strengthening national trade capacity. Although we find reasonable alignment between aid and national development priorities, there is, as yet, very little evidence of a robust aid impact especially on export capability vis-à-vis that of import. The paper underscores persisting deficiency in Uganda’s capacity to meet internationally accepted standards and to ensure stability and consistency in export supplies. While we note the development of some capacity in trade policy formulation and the mainstreaming of more relevant trade strategies into the country’s National Development Plan (NDP) with aid support, we recommend that future aid support be directed into unlocking the crippling constraints in Uganda’s productive capacity, standards development, economic infrastructure and sound trade policy analysis and formulation.
Acknowledgement: This paper was fully sponsored by the Economic Policy Research Center in Kampala, Uganda. The authors wish to thank USAID for funding the creation of the Uganda geocoded data and Rob Marty of AidData for assembling the geocoded information on the spatial distribution of trade related aid in Uganda.
Keywords: Aid for Trade, Official Development Assistance, Liberalization, Co-integration, Enhanced Integrated Framework, Competitiveness
The views expressed in AidData Working Papers are those of the authors and should not be attributed to AidData, funders of AidData’s work, or to the institutions the authors represent.

Working Paper 1October 2014
Dr. Ijjio is a Senior Research Fellow at the Economic Policy Research Centre and holds a PhD in Development Economics from Bradford Centre for International Development (BCID) at Bradford University, United Kingdom. His research interests include productivity, competitiveness and sustainable (green) growth, market models, trade and regional integration, and development policy.
Dr. Shinyekwa is a Research Fellow at the Economic Policy Research Centre and holds a PhD in Economics from Makerere University. His research interests include trade and regional integration, rural development and poverty, and education.
AidData – a joint venture of the College of William and Mary, Development Gateway and Brigham Young University – is a research and innovation lab that seeks to make development finance more transparent, accountable, and effective. Users can track over $40 trillion in funding for development including remittances, foreign direct investment, aid, and most recently US private foundation flows all on a publicly accessible data portal on AidData.org. AidData’s work is made possible through funding from and partnerships with USAID, the World Bank, the Asian Development Bank, the African Development Bank, the Islamic Development Bank, the Open Aid Partnership, DFATD, the Hewlett Foundation, the Gates Foundation, Humanity United, and 20+ finance and planning ministries in Asia, Africa, and Latin America.
Leveraging Aid for Trade Capacity in Uganda
Alex Thomas IjjoCorrespondence to: [email protected]
Isaac ShinyekwaCorrespondence to: [email protected] www.eprc.or.ug
AidDataCorrespondence to:[email protected]

3
Contents Abstract .................................................................................................................................................. 1
Acronyms ............................................................................................................................................... 5
1. Introduction ........................................................................................................................................ 7
1.1 Background to Aid for Trade ........................................................................................................ 7
1.2 The Paris Declaration Principles ................................................................................................ 10
1.3 Policy Questions ........................................................................................................................ 10
1.4 Study Objectives ........................................................................................................................ 10
1.5 Justification for the study ............................................................................................................ 11
2. Review of Literature ......................................................................................................................... 11
3. Theoretical Framework .................................................................................................................... 15
4. Methodology ..................................................................................................................................... 16
4.1 Specification of the Models ........................................................................................................ 16
4.1.1 Export Function ................................................................................................................... 16
4.1.2 The Import Function ............................................................................................................ 17
4.1.3 The Trade Balance .............................................................................................................. 18
4.2 Type and Sources of Data ......................................................................................................... 18
4.3 Data Analyses ............................................................................................................................ 19
5. Descriptive Statistical Analysis ........................................................................................................ 19
5.1 The Structure of Aid Flows to Uganda ....................................................................................... 19
5.2 Uganda’s External Sector Performance ..................................................................................... 23
6. Estimation of Export, Import and Trade Balance Models ................................................................. 24
6.1 Stationarity Tests on the Data Series ......................................................................................... 24
6.2 The Export Model ....................................................................................................................... 25
6.2.1 Tests of Co-integration ........................................................................................................ 25
6.2.2 The Error Correction Model ................................................................................................. 25
6.3 The Import Model ....................................................................................................................... 27
6.3.1 Co-integration Tests ............................................................................................................ 27
6.3.2 The Error Correction Model ................................................................................................. 28
6.4 The Trade Balance Model .......................................................................................................... 30
6.4.1 Co-integration Test .............................................................................................................. 30
6.4.2 The Error Correction Model ................................................................................................. 30
7. Sector and Project Level Performance of AFT ................................................................................. 32
7.1 Policy Formulation and Regulation Capacity ............................................................................. 32
7.2 Economic Infrastructure Development ....................................................................................... 33
7.3 Building Productive Capacity ..................................................................................................... 34

4
7.4 Multilateral Trade Negotiation Capacity ..................................................................................... 35
7.5 Implementation of WTO Rules ................................................................................................... 37
7.6 Mitigating Adjustment Costs ....................................................................................................... 37
8. Summary and Conclusion ................................................................................................................ 37
9. Policy Implications ........................................................................................................................... 38
9.1 Alignment of AFT with National Development Priorities ............................................................. 39
9.2 Achievements Justifying the Continuation of the AFT Policy ..................................................... 39
9.3 Enhancement of AFT-Domestic Policy Complementarity .......................................................... 40
References ........................................................................................................................................... 62

5
Acronyms AAA = Accra Agenda for Action
ADI = African Development Indicators
AFT = Aid for Trade
AGOA = African Growth Opportunity Act
CRS = Creditor Reporting System
DAC = Development Assistance Committee
DTIS = Diagnostic Trade Integration Study
EBA = Everything But Arms
EIF = Enhanced Integrated Framework
EU = European Union
FMA = Foreign Market Access
GATT = General Agreements on Tariff and Trade
GDP = Gross Domestic Product
GIS = Geographical Information System
GNI = Gross National Income
IF = Integrated Framework
IITC = Inter-institutional Trade Committee
ISO = International Organization for Standardization
JICA = Japan International Cooperation Agency
MDA = Ministries Departments Agencies
MDGs = Millennium Development Goals
NDF = Nordic Development Fund
NES = National Export Strategy
NTP = National Trade Policy
NTSDP = National Trade Sector Development Plan
ODA = Official Development Assistance
OECD = Organization for Economic Cooperation and Development
PD = Paris Declarations
REER = Real Effective Exchange Rate
RER = Real Exchange Rate
SC = Supply Capacity
SCT = Single Customs Territory
SSA = Sub Saharan Africa
TB = Trade Balance
UBOS = Uganda Bureau of Statistics
UEPB = Uganda Export Promotion Board
UNCTAD = United Nations Conference on Trade and Development

6
UPTOP = Uganda Program for Trade Opportunities and Policy
WB = World Bank
WDI = World Development Indicators
WTO = World Trade Organization

7
1. Introduction Trade liberalization is considered to be instrumental in raising the level of trade between countries. At
multilateral level liberalization has been pursued for more than six decades initially under the auspices
of the General Agreements on Tariffs and Trade (GATT) and now under the World Trade Organization
(WTO). In addition, over the last three to four decades, many developing countries have implemented
World Bank and IMF sponsored market oriented reforms to enhance the role of market forces in their
respective economies. It quickly became evident however that many least developed countries
(LDCs) lack the capacity to gainfully participate in global trading within such liberal framework due
especially to a wide range of supply related capacity constraints including unstable productive
capacities, deficient market infrastructure and inability to meet requisite quality and standards (WTO
2005).
1.1 Background to Aid for Trade
Awareness of the supply capacity related challenges in LDCs is not new; indeed since its creation in
1964, UNCTAD has provided trade-related capacity building support to LDCs to assist them to
effectively integrate into the international trading system (UNCTAD 2008). In a renewed recognition of
the critical role of trade capacity for trading in a liberal trade environment, the WTO at its Hong Kong
Ministerial Conference in 2005, launched the “Aid for Trade” (AFT) initiative to coordinate international
support for strengthening trade capacity specifically in LDCs. The WTO Task Force formed in 2006 to
operationalize the AFT recommended the following objectives for the AFT initiative:
(1) Enable developing countries, particularly least developed countries, to use trade more
effectively to promote growth, development and poverty reduction and to achieve their
development objectives, including the MDGs;
(2) Help facilitate developing countries, particularly LDCs to build supply-side capacity and
trade-related infrastructure in order to facilitate their access to markets and to export
more;
(3) Help facilitate, implement and adjust to trade reform and liberalization;
(4) Assist countries’ smooth integration into the world trading system; and
(5) Assist in the implementation of trade agreements.
Aid for trade refers to the component of Official Development Assistance (ODA) that goes to support
“activities identified as trade-related development priorities in the recipient country's national
development strategies”. Official Development Assistance (ODA) represents official flows to LDCs for
the purpose of promoting economic development and welfare and conveys a 25 percent grant
element at discount rate of 10 percent. Over 90 percent of ODA originates from Development
Assistance Committee (DAC) countries of the Organization of Economic Cooperation and
Development (OECD). The key focus areas of AFT are the following:

8
• Capacity building in trade policy formulation and regulation;
• Economic infrastructure development;
• Building productive capacity and trade development;
• Building capacity in multilateral trade negotiations;
• Implementation and compliance with WTO agreements and rules;
• Mitigation of adjustment related costs;
• Any other trade related activity.
To realize the above objectives, the AFT initiative particularly aimed to mainstream trade into the
development policy of LDCs and contribute toward the formulation of trade strategies that would
create the necessary conditions to stimulate export volumes, export value added, and export
diversification by domestic firms. In addition, the AFT initiative is envisaged to be instrumental in
encouraging export-oriented inward FDI with job creation potential. Thus, the initiative sought to
empower LDCs to participate and benefit from institutional arrangements, negotiations and processes
that shape national trade policy and international trade rules and practices. Ultimately under
appropriate intervention conditions AFT is expected to increase LDC trade flows in general and export
volumes in particular. Between 2009 and 2012 a total of nearly US$ 1 billion was disbursed to Uganda
by multilateral and bilateral development partners under the AFT initiative (Table 1).
Table 1. Aid for trade disbursements to Uganda by source 2009-2012
Donor Amount (USD) % of Total
ADF(ADB) 319,748,339 33.1
IDA (WB) 279,431,863 28.9
Norway 124,423,810 12.9
EU 105,192,656 10.9
China 45,396,762 4.7
GEF 34,095,959 3.5
IFAD 32,865,614 3.4
Japan 10,766,752 1.1
Denmark 6,531,058 0.7
Sweden 6,423,797 0.7
NDF 1,458,333 0.2
Egypt 15,000 0.0
Total 966,349,944 100.0
Source: MOFPED
The objectives of the AFT initiative also reflect the multidimensional, multi-sectoral nature of trade.
Specifically the interventions envisaged under AFT include support for physical trade infrastructure

9
such as roads, ports, telecommunications, energy and electricity, transport systems, water supply and
sanitation; support for trade enabling institutions such as customs, trade finance, marketing and
distribution facilities; the strengthening of productive capacity for trade; and support toward
adjustment costs incurred by enterprises and households in trade and trade policy regulation. The
multi-sectoral reach of the AFT initiative is clear in the sectoral breakdown of the recent
disbursements to Uganda shown in table 2.
Table 2: Aid for trade 2009-2012: sectoral breakdown
Sector Amount (USD) % of Total
Agriculture 187,044,631 19.4
Energy 294,997,521 30.5
ICT 47,540,986 4.9
Tourism and Trade 12,823,142 1.3
Works and Transport 423,943,665 43.9
Total 966,349,944 100.0
Source: MOFPED
A primary indicator of growth in trade capacity is the performance of the export subsector which
reflects the level of competitiveness attained by firms in the domestic economy in relation to quality,
productivity, and consistency of supply. On the other hand, imports are largely driven by growth in
domestic incomes, foreign exchange availability, real effective exchange rate and domestic tastes and
preferences. Although capital inputs importation is critical to the competiveness of the domestic
economy, success in the development of domestic trade capacity is primarily seen in terms of the
growth of “export” competitiveness rather than the flow of “imports” into the country.
The weak supply related capacity that is characteristic of many LDCs is evident in looking at Uganda’s
external trade sector performance. Imports have consistently outstripped exports in the last four to five
decades and as a result the country has run a widening trade deficit. Export growth and diversification
are relatively low and much of the concessional market opportunities such as the EU’s Everything but
Arms (EBA), and the US’s African Growth and Opportunity Act (AGOA) are largely unexploited
(Muhwezi, 2013, Mevel et al 2013). Uganda’s total formal and informal exports reached US$ 2.5
billion and imports US $ 5.6 billion in 2011 (UBOS 2012). While both exports and imports have grown
year on year, growth in the exports has been generally weaker with a visible decline in the trade
balance especially from 2009 to date (UBOS 2012).
Uganda’s weak external trade sector performance is evidence of the supply related capacity
constraints that affects many LDCs. Thus, the development of export capacity and competitiveness
remains an outstanding challenge for many LDCs. In view of this, it has become important to examine

10
the role of the key drivers of external trade competitiveness including external assistance targeted into
the trade sector. In addition to this and the complexity of the effects of aid flows on LDC economies,
UNCTAD recognized the need for “more in-depth country level analysis of aid for trade” (UNCTAD
2008). Apart from reviews of the AFT interventions at multilateral level and occasionally at country
levels, the World Bank’s Diagnostic Trade Integration Studies (DTIS) of 2006 and 2013 in Uganda,
and the case study of aid for trade in Kenya, Tanzania and Uganda by PricewaterhouseCoopers
(2009), very little else appears to have been done to evaluate the performance of AFT at country
level. This study attempts to fill some of that void.
1.2 The Paris Declaration Principles
Aid has been and continues to be controversial not least in regards to its effectiveness to deliver
growth and development in recipient countries. The Paris Declarations (PD) principles of 2005 are aim
at enhancing aid effectiveness and are premised on decades of aid-related experience. The PD
principles not only aim to ensure aid effectiveness but also mutual accountability on the part of
recipients and donors. These PD principles include “national ownership” of the development
strategies, proper “alignment” of aid to national development priorities, the “harmonization” of aid effort
by development partners, “result orientation” in the management of aid and mutual “accountability” of
aid recipients and their development partners. The PD principles were further buttressed by the Accra
Agenda for Action (2008) and the Bussan Partnership for effective development cooperation (2011).
1.3 Policy Questions
This paper examines three basic policy questions, namely: how are the key aid for trade areas of
focus aligned to Uganda’s national development priorities? Two, are there tangible aid driven impacts
on Uganda’s capacity to trade? And three, how can the complementarity between the AFT initiatives
and Uganda’s national development priorities be enhanced for greater positive impact on the
country’s trade capacity and competitiveness?
1.4 Study Objectives
The aim of this paper is to examine the contribution of aid and especially AFT in strengthening
Uganda’s trade capacity. Specifically the study examines: trends in the amount and structure of
Official Development Assistance (ODA) in general and aid for trade (AFT) in particular so far directed
into Uganda; the contribution of ODA to Uganda’s external trade through the estimation of
econometric models of export, import and trade balance with ODA as one of the explanatory
variables; the achievement of the AFT interventions in relation to the strengthening of Uganda’s trade
capacity in the framework of the PD criteria for aid effectiveness; policy options for enhancing the
complementarity between aid and national priorities for greater positive impact on development
outcomes.

11
1.5 Justification for the study
Evidence of aid effectiveness is far from conclusive. Despite the latter, a priori expectation that aid
should positively impact economic growth continues to persist. Neoclassical theory in particular sees
aid as one of the options for filling the two gaps – savings and foreign exchange that usually constrain
investment and growth in low income countries. This inconclusiveness may be due to lack of impact
or our inability to capture robust evidence of impact. In fact capturing robust evidence of aid impact
has been more elusive than presumed.
However in view of the AFT initiative taken in the framework of Paris Principles, the Accra Agenda for
Action and the Bussan Agreement for Development Cooperation all aimed at redesigning the aid
architecture for more effectiveness, a revisit of the aid effectiveness debate therefore seems
warranted. Using World Bank data and focusing on the specific case of Uganda, we examine the
impact of aid on Uganda’s trade capacity by estimating an error correction model for Uganda with
GDP growth as the dependent variable and aid as one of the explanatory variables.
Evidence of aid effectiveness is important for aid givers and recipients alike. It constitutes an
important plank in the accountability to the electorate and tax payers in recipient and donor countries
respectively in accordance with the PD criteria (OECD 2005). Evidence of aid “ineffectiveness” on the
other hand may signal the need for the elimination of aid (Moyo 2009) or its reconceptualization and
redesign (Easterly, Levine and Roodman 2000, Burnside and Dollar 2000).
The analysis of the effectiveness of the AFT initiative is also necessary in mapping out the causal
chain between specific AFT interventions and their impacts. This is useful in determining the most
effective policy measures and complementarities between different policy measures. This paper
attempts to throw light on policy measures likely to be effective in maximizing the positive impact of
AFT in Uganda.
2. Review of Literature In the wake of classical arguments of mutual benefit, trade has come to constitute a critical
component especially in neoliberal growth perspective. There is a wealth of research and information
on the “positive effects” of trade openness on growth and development (Wacziarg and Welch 2003,
Sachs and Warner 1995, Rodriguez and Rodrik 2000), yet relatively little on the requisite conditions to
insure the positive or beneficial effects of market liberalization especially in developing economies.
The central argument that trade has the potential to mutually benefit participating countries is now
largely uncontested. An immediate question however is whether this assertion has largely remained a
mere unattainable wish in the case of LDCs. Although market liberalization is seen as a necessary
12
means for realizing such a mutually beneficial trade, its sufficiency for translating trade potential into
tangible benefit has increasingly come under question in the case of LDCs.
Indeed in the course of the liberalization effort through GATT and WTO at multilateral level and
through the IMF and WB in a wide range of countries, the gross incapacity of LDCs to effectively and
gainfully participate in international trade due to domestic supply related constraints became clear.
These constraints include low and fluctuating productive capacities, deficient trade infrastructure,
inability to meet requisite quality standards and others. Under such conditions liberalization only leads
to unsustainable consumption, fall in capacity utilization or outright de-industrialization in case of
failure to compete. Such challenges have been instrumental in establishing the concept of trade-
specific development assistance as an integral part of any trade policy reform effort to insure
meaningful participation in trade by least developed economies (UNCTAD 2008).
It should be pointed out that neither the concept of AFT nor the money is new. AFT represents part of
Official Development Assistance (ODA) going into “trade facilitation”. The UNCTAD report (2008: 1)
says “As part of the development component of the United Nations system, UNCTAD has since its
creation in 1964 provided trade-related and capacity-building support, namely, aid for trade - to
developing countries and countries with economies in transition to effectively integrate into and realize
development benefits from the international trading system”. Accordingly a significant part of ODA
targeted in LDCs even before the official launch of AFT initiative qualifies to be categorized under the
concept of AFT.
Granted that trade is potentially mutually beneficial, a related question is whether aid driven trade
facilitation has boosted trade between countries. Using OECD creditor reported aid data, Helble,
Mann and Wilson (2009) find a positive impact on the level of trade flows from aid disbursements for
trade facilitation. They find that a 1% increase in aid targeted into trade policy reform and regulation
(USD 11.7 million) could generate USD 818 million worth of trade flows. Trade facilitation which aims
to reduce the cost of trade especially through reforms in regulation policy and customs procedures
represents an important component of AFT.
Aid for Trade is, as it were, an attempt to “level the trade playing field” so that all countries including
the least developed countries can benefit from international trading. Rajan and Subramanian (2005:4)
point out the moral imperative of foreign aid especially if “relatively small transfer of resources from
rich countries” could set the poor countries on a growth path. The same spirit is reflected in the
Millennium Declaration of world leaders in New York in 2000 – “we will spare no effort to free our
fellow men, women and children…” In addition political economists would point out the moral
imperative, especially on former colonial masters, to assist former colonies in order to redress some
of the ravages of exploitative colonial relations in the 19th and 20th centuries.
13
The potential of foreign aid as an instrument to accelerate development in other countries came to the
fore in the wake of the Marshall Plan (1947) involving US financial support for the reconstruction of
post-war Europe, Big Push theories of economic development (1950s), Recent Millennium
Development Declarations (2000) and calls for the attainment of clearly defined millennium
development goals (MDGs); the 2005 Paris Declaration (PD) on aid effectiveness; the 2008 Accra
Agenda for Action (AAA); and the Bussan meeting on aid effectiveness in South Korea in 2011.
In spite of the above declarations, many questions continue to haunt foreign aid, not least questions
like: who gives aid to who and for what purpose? (Woods 2008). How effective is foreign aid in
delivering growth and poverty reduction in the recipient countries? What conditions influence the
effectiveness of aid support? How serious and likely are risks of “aid trap” and aid related “Dutch
Disease” in recipient countries and how may they being avoided? What policy best practices are there
in targeting and managing aid? And how about the effects of policy conditionality associated with aid?
In view of these myriad of questions, an associated body of literature on aid effectiveness has grown
enormously in the last two decades. Doucouliagos H and Paldam, M (2008) review this body of
literature. Their main conclusion from the synthesis is that while the overall effect of aid on the
economy appears to be positive on average, this has unfortunately been persistently insignificant
statistically and declining.
Although the a priori expectation of aid impact on the economy seems to be generally positive, direct
negative effects especially of excessive aid inflows are possible. For example in the short-run,
massive aid inflows into a country can lead to Dutch Disease, which refers to the appreciation of the
domestic exchange rate along with the associated decline in competitiveness especially of traditional
sectors with adverse effects on the balance of payments. Adam and Bevan (2006) find evidence of
long run supply side effect of aid beyond Dutch Disease especially through aid funded public
infrastructure expenditure. They find that aid driven infrastructure investments tend to generate
productivity spillovers in the supply side of the economy.
Although much of the theoretical literature relate to the rationale for aid and how to ensure its
effectiveness basically taking the potential benefit of aid as given, there are some that have
questioned even the latter. One of the strongest criticisms of aid is by Moyo (2009) who sees aid as
an “unmitigated political, economic and humanitarian disaster”. According to Moyo, aid has fueled
dependency and corruption in poor countries. She argues that open ended aid commitments confer
“entitlement” to recipient country leaders and undermine democratic accountability to local electorate
and subsequently the perpetuation of corrupt regimes in power. Nunn and Qian (2012) make a similar
point in warning that aid can indeed be detrimental to developing countries without “accountable
governance”. Furthermore Mosley (1987) finds no robust relationship between aid and growth.

14
Arguably one of the most influential papers on the effect of aid on growth however, is that of Burnside
and Dollar (2000) who report that in a good domestic policy environment, foreign aid does appear to
have significant positive effect on growth. Further studies on the aid-growth relationship however
questioned the robustness of the positive relationship between aid and growth suggested by Burnside
and Dollar (see for example, Easterly, Levine and Roodman 2000; Boone 2006). Rotarou and Ueta
(2009) find a positive ODA impact on GDP growth though not poverty reduction. Probably on the basis
of such studies, Sachs (2005), who represents one of the strongest voices in support of foreign aid,
called for more than a doubling of aid from US$65 billion in 2005 to US$135 billion in 2006.
Aid for trade is premised on the potential for mutually beneficial trade. However, there is need to
review the available evidence on the experience of liberalization and growth, in general and the effect
of AFT on trade in particular. The UNCTAD “Trade and Development Report” 2007, concluded that
trade liberalization, while necessary, is not a sufficient condition for growth in trade. The report found
evidence of the positive effect of regional trade liberalization on the subsequent integration of
countries into the wider global economy. The report argues that factors, such as transport connectivity
appear to be even more important in the growth of trade and competitiveness. Indeed Francois and
Manchin (2007) observed that transport infrastructure seems more important in explaining trade
growth than tariff reductions, thus underscoring the critical role of NTBs vis-à-vis tariff barriers. This
finding agrees with UNCTAD (2008) which put emphasis on domestic “supply capacity” (SC) as
opposed to “foreign market access” (FMA) as the key factor in LDC trade.
UNCTAD (2007) however reports mixed results for liberalization effort in many less developed
economies, a number of which “remain marginalized from international trade, attract limited foreign
investment, and are stuck in the supply of a limited range of primary goods and services”. As its aim
for the Fourth Global Review of Aid for Trade, the WTO therefore proposed to examine strategies to
link developing country firms to international value chains, assist them move up the value chain, and
examine the attendant development benefits in the context of the debate about the post 2015
development agenda.
According to UNCTAD (2008), there are however a number of notable successful experiences of the
positive effect of aid on trade and growth. The report echoes the need for the right conditions for aid to
provide a “strong impetus” to trade and growth. The report cites examples from Asian economies such
as Japan, the Republic of Korea, Taiwan, especially between 1950 and 1970s along with more recent
strong Asian performers. The above view is also espoused by Hoekman and Olarreaga (2007) who
have argued that for aid to have a consistent positive effect on trade, it must be combined with
complimentary policy measures that create an “enabling environment”. In addition, Hoekman and
Njinkeu (2007) argue that the efficacy of aid is enhanced when it is targeted into sectors which
represent the comparative advantages of the recipient countries. This finding underscores the
importance of developing competitiveness in sectors of comparative advantage.

15
The preceding arguments suggest that the positive impact of development assistance is not a given.
Much of the thinking seems to concede that external financial support can play a positive role in
growth and development but only as part of a well-thought-out development strategy in the context of
accountable governance. If the latter premise is accepted, then the big question to address will be
what constitutes that effective mix of development strategies, financial management and governance
environment that is complimentary with foreign aid support. This paper engages with some of these
issues in order to inform policy toward a more effective aid program in LDCs in general and Uganda in
particular.
One critical issue emerges out of the review of the empirical evidence on aid effectiveness and that is
the lack of robust evidence on the impact of aid on growth in a number of countries. This may be due
to lack of impact or failure to capture the evidence of impact. This challenge is not to be discounted
especially in view of the multiplicity of factors in the causal chain leading to the impact of aid on
economic growth. Some of the factors in the causal chain include governance, policy framework, aid
amounts and conditionality. This is a methodological issue and involves the challenge of accurately
modeling the mechanism of aid delivery so as to capture its impact.
3. Theoretical Framework Trade is driven by both supply and demand side factors. For example, exports are driven by both
foreign demand and domestic supply conditions. Similarly, imports are driven by domestic demand for
foreign goods and foreign supply conditions. Traditional analyses of export and import trade dynamics
have largely focused on the demand drivers of trade (Funke and Holly 1992). In developing countries,
however, supply side factors have come to assume a more critical role, especially in determining
export capability (UNCTAD 2004). In the case of many LDCs, the crippling effect of the supply-related
constraints are even more evident in view of unexploited preferential market access opportunities
such as the AGOA, EBA, and others. Accordingly, addressing the supply side factors has come to
assume a very critical significance both in policy and the modelling of export participation by LDCs.
Studies such as Majeed and Ahmad (2006), Haider et al (2011), Bahmani-Oskooee (1998), and
Warner and Kreinin (1983) hypothesize exports to be driven by domestic GDP, representing the
capacity of the domestic residents to produce goods which may be exported, real effective exchange
rate (REER) which is the nominal exchange rate adjusted for the level of prices in foreign and
domestic markets and represents the relative price of domestic goods to foreigners (this variable may
also be represented separately by the nominal exchange rate along with the rates of inflation and
tariffs), a measure of the level of infrastructure development as this is a critical determinant of the
cost of production and subsequently export competitiveness; FDI inflow which captures the
contribution of especially export oriented FDI, Official development Assistance (ODA) representing

16
foreign aid support often aimed at trade related technical support and trade facilitation, and the
average income of key trading partners to capture the factor of foreign demand for domestic goods.
In regards to imports, the empirical works of Kotan and Saygili (1999), Bahmani-Oskooee (1998),
Warner and Kreinin (1983), Sinha (1997), and Rogers (2000) model imports as being influenced by
domestic income measured by GDP, representing the purchasing power of domestic residents; and
the real effective exchange rate (as defined above), representing the price of foreign goods in terms of
domestic resources. The ODA variable is associated with support for trade liberalization and trade
facilitation reforms in customs procedures and market infrastructure development which facilitate the
flow of goods.
Additional insights come from directly examining the trade balance (TB), which gauges the overall
effect of the drivers of both exports and imports on the trade balance. One key aim in modeling the TB
in the literature is to test the Marshall-Lerner hypothesis and determine whether currency depreciation
or devaluation has any effect on the TB (Onafowora 2003; Bahmani-Oskooee 1998). Changes in the
trade balance are hypothesized to be driven primarily by domestic income, foreign income and real
effective exchange rate (Onafowora 2003, Shirvani and Wilbratte 1997). In addition to these variables,
we assess the relative impact of five other factors on TB. In particular, we add ODA, taxation,
infrastructure proxied by gross fixed capital formation, manufacturing value added, and foreign direct
investment.
4. Methodology We employ three analytical approaches to examine the contribution of aid to Uganda’s trade capacity.
In the first place we summarize and analyze data on aid flows by amounts, type, and sector. Secondly
we estimate three simple macro-models of export, import and trade balance with ODA as one of the
explanatory variables. Thirdly, we analyze the impact of AFT programs vis-à-vis predetermined
objectives in key focus areas, namely: policy capacity building, economic infrastructure development,
production capacity enhancement, trade negotiation capacity development, implementation of
multilateral agreements and the mitigation of adjustment costs.
4.1 Specification of the Models
4.1.1 Export Function
Drawing on the literature and especially the work of Majeed and Ahmad (2006), Haider et al (2011)
and UNCTAD (2004, 2008) we hypothesize exports to be driven by the gross domestic product
(UGDP), the real effective exchange rate (REER), official development assistance (ODA), savings out
of the national income (SVG), the tax regime prevailing in the country (TAX), inward foreign direct
investment (FDI), manufacturing value added (MVA), as proxy for the level of industrialization, the

17
state of physical infrastructure proxied by gross fixed capital formation (GFCF), and the average
income of trading partners proxied by the GDP of Kenya (KGDP). Thus, we specify the export function
as,
𝑋 = 𝑋(𝑈𝐺𝐷𝑃,𝑇𝐴𝑋, 𝑆𝑉𝐺,𝑅𝐸𝐸𝑅,𝑂𝐷𝐴,𝑀𝑉𝐴,𝐾𝐺𝐷𝑃,𝐺𝐹𝐶𝐹,𝐹𝐷𝐼)
Where,
X = Exports as percent of GDP
GDP = Gross Domestic Product of Uganda in constant USD
FDI = Foreign Direct Investment as percent of GDP
ODA = Official Development Assistance as percent of GNI
REER = Real Effective Exchange Rate
KGDP = GDP of key Trading Partner(s) (Kenya)
GFCF = Gross Fixed Capital Formation
SVG = Savings as Percent of GDP
TAX = Tax as percent of GDP
Our primary interest is the relationship between ODA and exports. However we examine the overall
model to assess the relation between the variables and the conformity of the coefficients with a priori
theoretical expectations.
4.1.2 The Import Function
In the import function, we hypothesize imports to be driven by domestic national income (UGDP), real
effective exchange rates (REER) and aid (ODA). That is,
𝑀 = 𝑀(𝐺𝐷𝑃,𝑅𝐸𝐸𝑅,𝑂𝐷𝐴)
Where,
M = Imports as percent of GDP
ODA = Official Development Assistance as percent of GNI
REER = Real Effective Exchange Rate
GDP = Gross Domestic Product of Uganda in constant USD
Again our primary interest is to examine the relationship between imports and ODA even as we
examine the plausibility of the overall model vis-à-vis a priori suppositions.

18
4.1.3 The Trade Balance
Finally, we run the absolute value of the trade balance |X-M| on the variables hypothesized to explain
the external trade balance namely GDP, REER, SVG, TAX, SCH, KGDP, FDI, GFCF, MVA and ODA
to further examine the role of the drivers of trade:
𝑋 −𝑀 = 𝐹 𝑈𝐺𝐷𝑃,𝑅𝐸𝐸𝑅,𝑂𝐷𝐴, 𝑆𝑉𝐺,𝑇𝐴𝑋, 𝑆𝐶𝐻,𝑇𝑃𝐺𝐷𝑃,𝐺𝐹𝐶𝐹,𝐹𝐷𝐼,𝑀𝑉𝐴
Since the trade balance has been negative (deficit) for the entire period of the data set employed, we
take without any complications the absolute value of the trade balance as the dependent variable. An
increase in the dependent variable is seen as a widening of the trade deficit and may occur through
increase in imports, or decrease in exports or both. This is valid for the selected range of years 1998-
2011.
4.2 Type and Sources of Data
Exports (X) represent a key endogenous variable and are expressed as export value as percent of
GDP. This data is available in World Development Indicators (WDI). Similarly imports (M) are
expressed as value of imports normalized by GDP. The import data are also obtained from the WDI.
The Gross Domestic Product (GDP) is the real GDP data in constant 2005 USD obtained from the
WDI database version 2013.
Real Effective Exchange Rate (REER) is the weighted average of the bilateral real exchange rate for
Uganda with its trading partners. It is an approximation of the real, inflation-adjusted price of Uganda’s
exports. A depreciation of the domestic currency makes exports cheaper for foreign consumers and
vice-versa. This data is obtained from the WDI database version 2013.
Foreign Direct Investment (FDI) is the net inflow of FDI as percent of GDP. Its effect on exports is
largely dependent on the export “orientation” or motivation of the FDI. FDI may be targeting cheap
inputs in the domestic economy with the aim of producing for export or for the domestic market. The
effect of export-oriented FDI is likely to be positive on export growth. On the other hand FDI aimed at
“tariff jumping” is not likely to drive the growth of exports. This data is obtained from the WDI database
version 2013.
The data on Official Development Assistance (ODA) as percent of Gross National Income (GNI), Tax
to GDP, Manufacturing Value Added (MVA), the GDP of Kenya, Savings as percent of GDP are all
obtained from the WDI, 2013 version. The study also used geo-coded national and project level aid
data and GIS software to summarize the distribution of trade related aid projects in the country by
geographical location. Finally for all the datasets, we convert the WDI annual dataset to quarterly data
using Gretl Software.

19
4.3 Data Analyses
We employ time series econometric analysis to estimate macro-models of export, import and trade
balance. We first transform the variables into logarithms to dampen excessive variation in the data
and to enable elasticity interpretations. We then test the transformed data for stationarity. As
commonly expected in macroeconomic data, the data turned out to be non-stationarity from which we
proceeded to perform co-integration tests based on the Johansen procedure. On the basis of the
cointegration of the variables, we determined the appropriate lag length and then estimate an error
correction model (ECM) within a Vector Auto Regression (VAR) framework. The econometric
techniques are further augmented with descriptive statistical analysis, documentary review and
qualitative logical analysis.
5. Descriptive Statistical Analysis
5.1 The Structure of Aid Flows to Uganda
The long-term trend in aid flows to least developed countries especially in the Sub-Saharan Africa
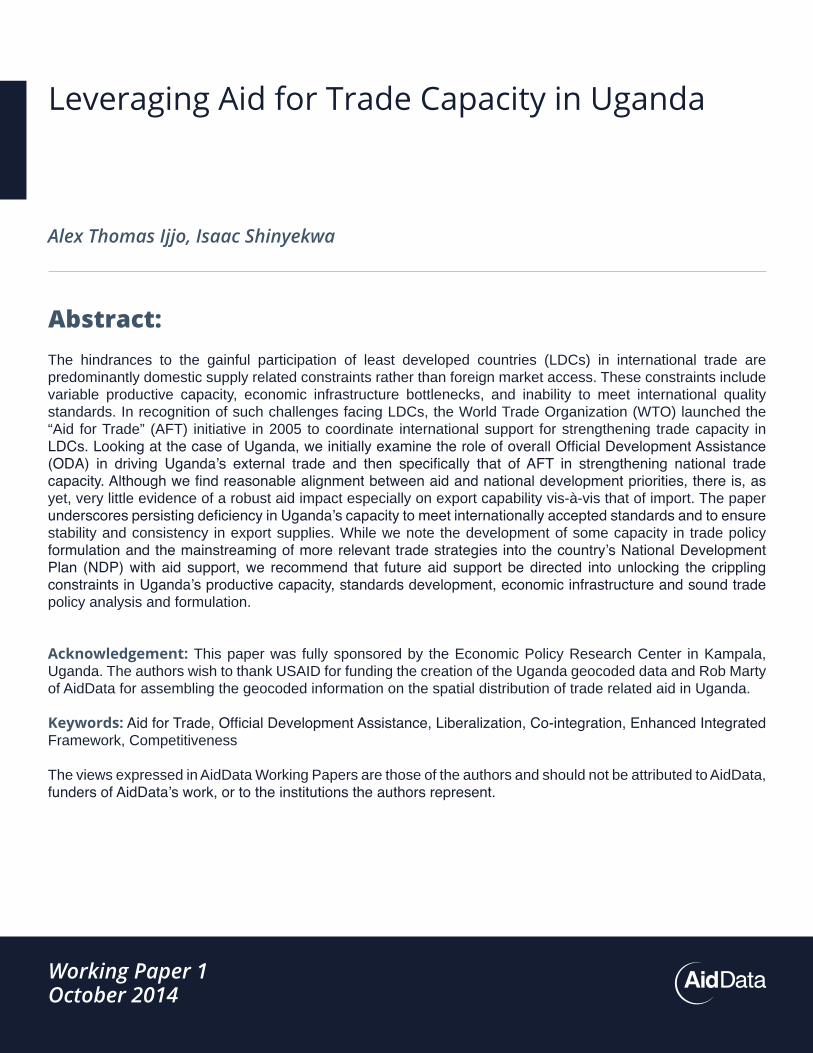
(SSA) region appears to have been generally upward. In the EAC, Rwanda and Burundi stand out in
terms of per capita aid receipts but also in terms of aid receipts as percent of gross national income
(GNI). Rwanda particularly experienced a marked surge in aid flows as percent of GNI in the
aftermath of the 1994 genocide (Figure 1).
From around 2002 Burundi has received more aid as percent of its GNI than the other five EAC
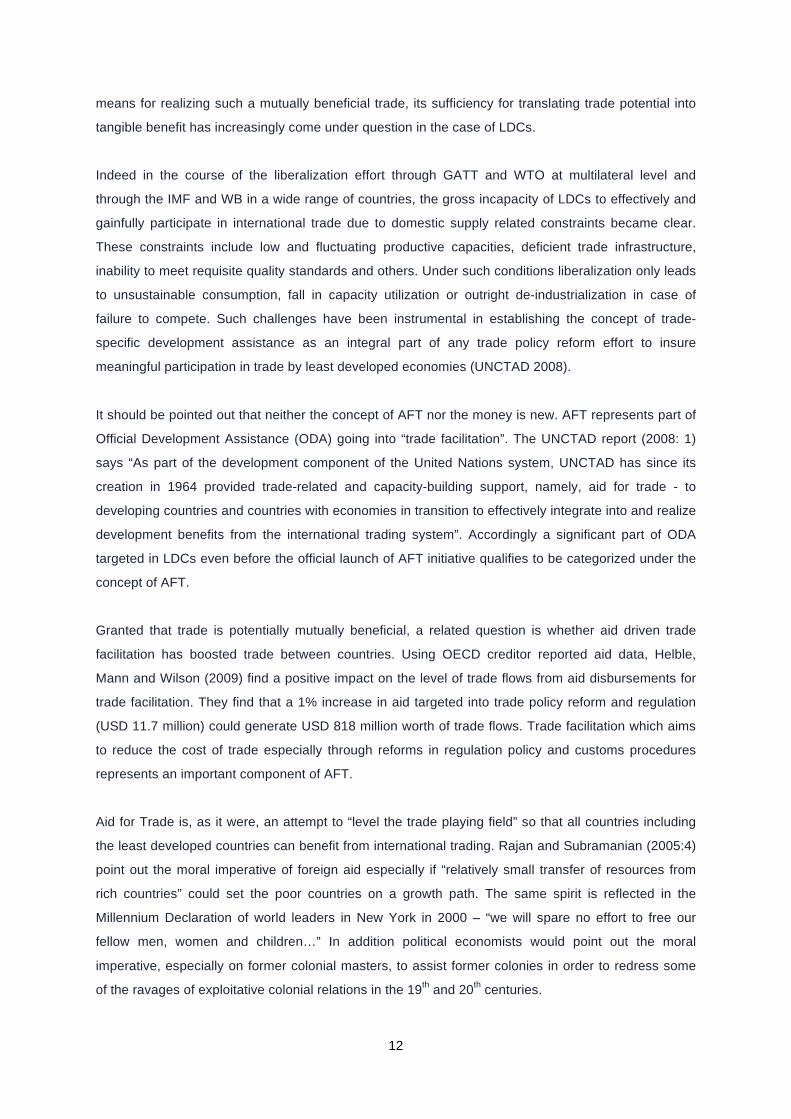
countries. In per capita terms the picture is slightly different though. Rwanda has received more aid
per capita than the other four countries in the EAC in the last fifteen to twenty years (Figure 2). Aid to
Tanzania in the last decade has hovered just over 10 percent of its GNI.
Apart from short-run fluctuations around long run trends in aid disbursements, aid flows into the EAC
countries formed just under 10 percent of national income in the early 1960s but rose steadily to
between 20 and 30 percent of GNI except for Kenya where ODA remained under 10 percent of GNI
for the most part. ODA into Uganda is now between 10 to 20 percent of the country’s GNI. Uganda’s
aid per capita receipts averaged USD 20.8 per year over 1960 to 2011 period, while total ODA as
percent of GNP averaged 8.6 percent of GNI a year over the 1960 to 2011 period (WB-WDI, 2013).
20
Figure 1. ODA as percent of GNI for EAC countries
Source: World Bank, WDI 2013
Figure 2. ODA per capita for EAC countries
Source: World Bank, WDI 2013
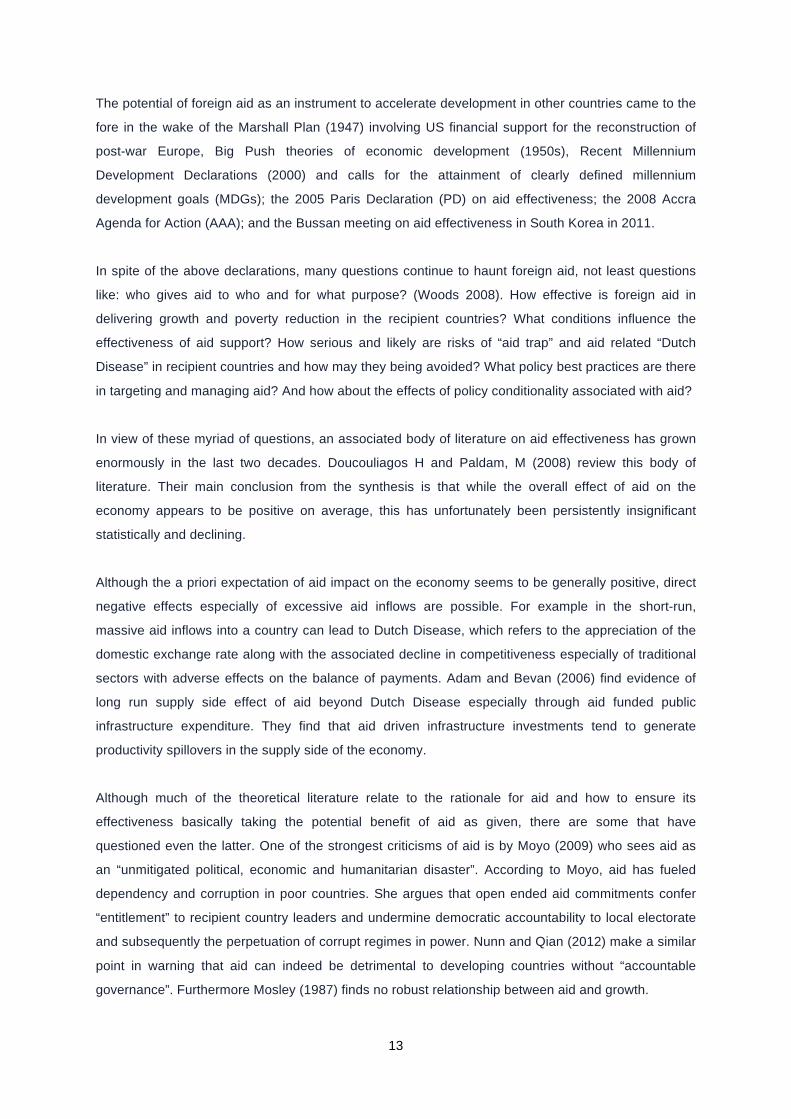
Figure 3 shows the level of AFT flows in relation to total ODA. AFT which represents aid targeted into
trade related sectors has formed approximately 20 to 30 percent of overall ODA. Although there has
been ODA support in trade-related sectors prior to 2002, data on such flows have not been
disaggregated from overall ODA flows.
Figure 3. AFT and ODA in Uganda
Source: OECD-CRS
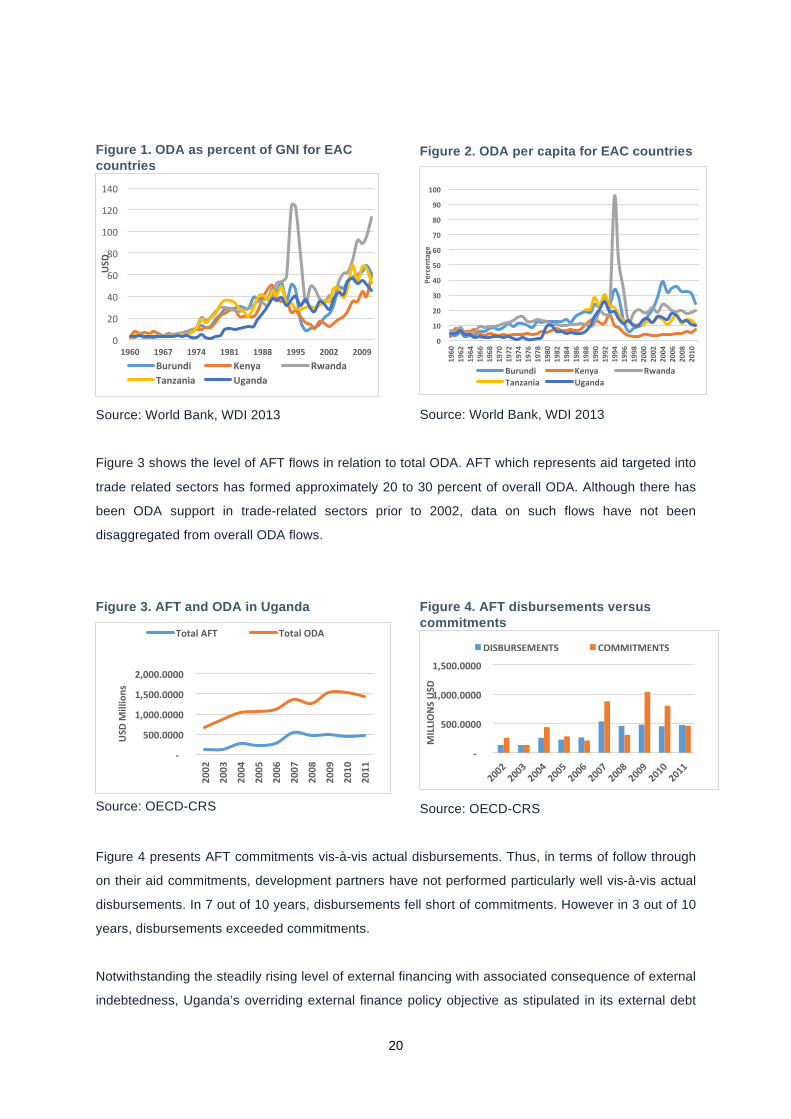
Figure 4. AFT disbursements versus commitments
Source: OECD-CRS
Figure 4 presents AFT commitments vis-à-vis actual disbursements. Thus, in terms of follow through
on their aid commitments, development partners have not performed particularly well vis-à-vis actual
disbursements. In 7 out of 10 years, disbursements fell short of commitments. However in 3 out of 10
years, disbursements exceeded commitments.
Notwithstanding the steadily rising level of external financing with associated consequence of external
indebtedness, Uganda’s overriding external finance policy objective as stipulated in its external debt
0
20
40
60
80
100
120
140
1960 1967 1974 1981 1988 1995 2002 2009
USD
Burundi Kenya Rwanda Tanzania Uganda
0
10
20
30
40
50
60
70
80
90
100
1960
1962
1964
1966
1968
1970
1972
1974
1976
1978
1980
1982
1984
1986
1988
1990
1992
1994
1996
1998
2000
2002
2004
2006
2008
2010
Percen
tage
Burundi Kenya Rwanda Tanzania Uganda
-‐
500.0000
1,000.0000
1,500.0000
MILLIONS USD
DISBURSEMENTS COMMITMENTS
-‐
500.0000
1,000.0000
1,500.0000
2,000.0000
2002
2003
2004
2005
2006
2007
2008
2009
2010
2011
USD
Millions
Total AFT Total ODA

21
strategy remains to ensure long-term external debt sustainability; consistency with macroeconomic
objectives of fiscal consolidation and reduced aid dependency; the realization of an appropriate level
of external financing at minimum cost; and the restriction of borrowing for productive sectors”
(MOFPED 2007:16).
Figure 5. AFT grants versus loans for Uganda
Source: OECD-CRS
Figure 6. AFT disbursements by sector (million USD)
Source: OECD-CRS, 2013
Another critical aspect of aid is its composition in terms of grants and loans. Grants are transfers of
cash, goods or services with no requirement for repayment. Loans on the other hand are similar
transfers for which repayment is required. Figure 5 shows that for all years 2002 to 2011 except 2007,
2009 and 2010, Uganda has emphasized grants over loans.
Uganda’s preference for grants as opposed to loans reflects the country’s emphasis on
concessionality vis-à-vis commercial borrowing (MOFPED 2007). Thus, much of the country’s
borrowing especially under the Multilateral Debt Relief Initiative (MDRI) for Heavily Indebted Poor
Countries (HIPC) has been through the International Development Association (IDA) of the World
Bank, the African Development Fund (ADF) of African Development Bank (ADB) and others on
concessional terms of 40 year loan maturity, 10 year grace period and 0.75 percent interest
(MOFPED, 2007).
Uganda adopted the above strategy to external financing in order to ensure an appropriate level of
external financing at the lowest possible cost and with long-run external debt sustainability. Although
Uganda’s external indebtedness now stands at USD 5.7 billion, the recent IDA/IMF debt sustainability
analysis (DSA) shows that Uganda’s external debt portfolio is sustainable and the country runs only a
low risk of debt distress (WB and IMF, 2011).
-‐
50.0000
100.0000
150.0000
200.0000
250.0000
300.0000
350.0000
400.0000
2002
2003
2004
2005
2006
2007
2008
2009
2010
2011
MILLIONS OF USD
GRANTS LOANS
0 50 100 150 200 250
Transport & Storage Communica:ons
Energy Banking & Financial
Business & Other Agriculture
Forestry Fishing
Industry Mineral Resources &
Trade Policies & Tourism
2011 2010 2009 2008 2007

22
In the particular case of AFT, the sectoral breakdown of the aid flows into Uganda is of special
relevance especially in analyzing the sectoral emphasis of AFT vis-à-vis national priorities. To see
where the bulk of the money has gone, we lump together the ten years (2002-2011) of Uganda’s
detailed sector or program specific AFT flows by sector (Figure 6).
The spikes in the chart (Figure 6) show that much of the funding has gone into transport
infrastructure, energy, agriculture while a little went into industry, mineral resource and trade policy
capacity building. Viewed against the backdrop of the NDP, the targeting of the AFT disbursements is
seen to reflect Uganda’s national priorities fairly closely.
Government appropriates external financing in three main ways, namely budget support (BS), project
support (PS) and technical assistance (TA). Of the grants that the government of Uganda received in
the Financial Years (FY) 2008/09 to 2011/12 period, the breakdown in terms of budget and project
supports are as in Table 3.
Table 3. Grant disbursements by type
Grant Type 2008/09 2009/10 2010/11 2011/12*
Budget Support 179.3 154.6 152.3 113.3
Project Support 212.5 200.5 67.2 175.4
Total Grants 391.8 355.1 219.5 288.7
Source: MOFPED, 2012. *As at 31/03/2012
The government of Uganda has preference budget support rather than project support in external
financing as this gives it more control on the funds (MOFPED 2007). The latter contrasts with the
tendency of Development Partners to emphasize project support through their agencies as this also
gives them more control over the use of the funds. Thus project support becomes especially attractive
in the case of perceived financial impropriety or corruption on the part of the recipient government as
was the case for Uganda during the 2010-2013 period.
Thus, in 2012 donors suspended much of their budget support to Uganda due to the corruption
scandals in the office of the Prime Minister (OPM) in which Uganda reportedly lost an estimated UGX
60 billion or USD 24 million, a significant part of which was aid money meant for the Peace, Recovery
and Development Plan (PRDP) for the war ravaged northern Uganda.
The latter incidence of financial impropriety prompted the suspension of up to USD 300 Million of
largely budget support aid no less than eight western development partners (Jeanne and Njoroge
2012). Key among the suspensions was the World Bank’s 30 percent contribution to Uganda’s budget

23
support (Mugabe 2013). In fact Ireland, Sweden and Norway went further to suspend their project
support to Uganda as well in 2011 (Jeanne and Njoroge 2012).
5.2 Uganda’s External Sector Performance
In the last decade, Uganda put in a significant amount of effort in developing a sound trade sector
development strategy and mainstreaming it into its overarching policy framework, the National
Development Plan (NDP). In addition approximately USD (constant 2011) 3.4 billion of AFT has been
directed into trade related sectors between 2002 and 2011 (OECD-CRS 2013).
Figure 7. Uganda’s recent exports, imports and trade balance
Source: UBOS, 2013
Despite the above, the performance of Uganda’s external sector has remained relatively weak
particularly in relation to exports. In 2012 for example, Uganda’s total export earnings were worth USD
2.8 billion while total expenditure on imports in the same year peaked at USD 6.1 billion, widening the
deficit to approximately USD 3.3 billion (UBOS 2013).
Table 4. Uganda’s external trade sector performance (USD millions)
Trade Flow 2008 2009 2010 2011 2012
Informal Exports 807.7 798.5 528.3 355.8 453.7
Formal Exports 1724.3 1567.6 1618.6 2159.1 2357.5
Total Exports 2532.0 2366.1 2146.9 2514.9 2811.2
Informal Imports 78.1 82.0 66.5 53.9 53.0
Formal Imports 4525.9 4257.6 4664.3 5630.9 6042.8
Total Imports 4604.0 4339.6 4730.8 5684.8 6095.8
Trade Balance -2,072.0 -1,973.5 -2,583.9 -3,169.9 -3,284.6
% change (Exports) -7% -9% 17% 12%
% change (Imports) -6% 9% 20% 7%
Source: UBOS, 2013
-‐4000
-‐3000
-‐2000
-‐1000
0
1000
2000
3000
4000
5000
6000
7000
2008 2009 2010 2011
US $ '000,000
Exports, Imports and Trade Balance
-‐15% -‐10% -‐5% 0% 5% 10% 15% 20% 25%
2008 2009 2010 2011
Percen
t
Growth in Exports and Imports
% change (Exports) % change (Imports)

24
On a positive note however, the exports earnings of USD 2.8 billion in 2012 represented growth of
11.8 percent in exports which is over and above the 7.2 percent growth in imports registered in the
same year. However, even though exports grew faster than imports in 2012, the actual deficit
increased over the previous USD 3.2 billion (Table 4). It is therefore clear that closing the deficit will
require more sustained strong growth in exports.
Secondly some diversification in Uganda’s traditional exports of coffee, cotton, and tea into non-
traditional exports such as maize, fish, beans and cut-flowers took place in the last two and half
decades; however, value-added export diversification has remained limited. Thus, Uganda’s exports
continue to be highly concentrated in a limited range of primary agricultural products. In 2008
agriculture contributed upwards of 46 percent to Uganda’s total export earnings (MAAIF, 2010).
More recently however, there has been some growth in Uganda’s manufactured exports especially to
the EAC and other regional markets such as the COMESA. This has been mainly in products such as
cement, sugar, iron and steel and to some extent soap, beers, cigarettes, sodas, juices, water, spirits,
confectionaries and wheat flour. Strengthening manufacturing value addition for regional export
market can provide the much needed value-added diversification that Uganda needs to stabilize
export receipts.
6. Estimation of Export, Import and Trade Balance Models
6.1 Stationarity Tests on the Data Series
After logarithmic transformation, we use the Augmented Dickey-Fuller (ADF) and Phillip-Peron (PP)
procedures to test for stationarity. The tests show that all the variables are largely non-stationary in
levels.
Table 5. Results of ADF and PP stationarity tests
Variable Order Variable Order
Log_EXPORTS I(1) – ADF Log_MVA I(1) – ADF
Log_GDP I(1) – ADF Log_FDI I(1) – PP
Log_ODA I(1) – ADF Log_KGDP I(1) – ADF
Log_GFCF I(1) – ADF Log_GNE I(1) – ADF
Log_TAX I(1) – ADF Log_IMPORTS I(1) – ADF
Log_SVG I(1) – ADF Log_TRADE I(1) – ADF
Log_REER I(1) – ADF
Source: ADF and PP unit root test results

25
The ADF and PP unit root tests of stationarity on the variables in first difference confirm that all the
variables are stationary and therefore I(1) at 5 percent. Due to the non-stationarity of the data, the use
of standard Ordinary Least Squares (OLS) is not advisable as this often leads to spurious regression
relationships. It is therefore necessary to explore the option of co-integration to see if the variables
have stable long-run steady-state relationships. We perform this separately for the export and import
functions.
6.2 The Export Model
6.2.1 Tests of Co-integration
The unrestricted co-integration test results presented in table 5 show that the variables in the export
function are co-integrated. We fail to reject the hypothesis of “At most 6” co-integrating equations at
the 5percent level of significance (Table 5). This indicates that up to 6 cointegrating equation
combinations of the variables are possible.
Since there is evidence of co-integration, we now justify the choice of the co-integrating equation to
estimate. This process is largely informed by theory and exogeniety tests through which we confirm
the endogeniety of exports. We then proceed to the estimation of the cointegrating equation and the
error correction model (ECM).
6.2.2 The Error Correction Model
The estimation of the long-run co-integrating equation yields results in which the coefficients of the
ODA, GDP, SVG, REER, and MVA variables carry the expected positive signs and are significant
(See Table 6 in the Appendix). The ODA variable has a positive effect on the export variable implying
that aid translates positively into export growth. The coefficient of the ODA variable which is
interpreted as the elasticity of exports with respect to ODA is 0.696621 or approximately 0.7, implying
that one percentage increase in ODA translates into approximately 0.7 percentage points of exports.
Recalling that ODA is a broader measure of aid than AFT (which is the component of ODA targeted
into trade related sectors) it may be deduced that the relationship between AFT and exports is likely to
be stronger. On the basis of the coefficients obtained, the estimated co-integrating equation may be
written as,
𝑙𝑛𝑋!!! − 24.17926 − 3.908860𝑙𝑛𝐺𝐷𝑃!!! − 0.431339𝑙𝑛𝑇𝐴𝑋!!! − 0.320189𝑙𝑛𝑆𝑉𝐺!!!− 2.474323𝑙𝑛𝑅𝐸𝐸𝑅!!! − 0.696621𝑙𝑛𝑂𝐷𝐴 − 0.634061𝑙𝑛𝑀𝑉𝐴!!! + 5.404412𝑙𝑛𝐾𝐺𝐷𝑃
− 0.119660𝑙𝑛𝐺𝐹𝐶𝐹!!! + 0.013245𝑙𝑛𝐹𝐷𝐼!!! = 0

26
The GFCF variable which was used as proxy for infrastructure turned out with the expected positive
sign but not statistically significant. The theory is clear however that economic (and especially
transport) infrastructure constitutes a key factor in the flow of goods and in the cost of production and
supply of goods. Two possible explanations may be offered for the observed lack of statistical
significance. First GFCF may not be capturing the infrastructure variable well enough to bring out any
consistency in the relationship. Two, the relative brevity of time (and therefore investment in the
transport infrastructure subsector) and the “noise” from the multiplicity of other factors affecting
exports may have obscured the relationship between infrastructure and exports for the case of
Uganda.
The REER variable turned out with the expected positive sign and is also statistically significant. This
empirical evidence shows that movements in the real effective exchange rates do influence export
demand. A depreciation in the local currency which shows up as a rise in the REER (the real price of
foreign currency in terms of local currency units) makes Uganda’s exports cheaper for foreign
consumers and vice-versa. The coefficient 2.47 of the REER variable which is greater than unity
shows that foreign demand for Uganda’s exports is highly elastic with respect to the exchange rate
changes. A percentage unit depreciation in the value of the local currency raises export demand by
approximately 2.5 percentage points.
Growth in the GDP of Kenya, one of Uganda’s key trading partners is negatively correlated with
Uganda’s export growth. This result may be indicative of the slowly shifting role of Kenya as an
important export destination to other export destinations such as South Sudan, Rwanda and Eastern
DRC. The coefficient of 5.404412 shows that the Kenyan demand for Uganda’s exports is highly and
negatively income elastic.
The FDI variable is negatively related to exports but is not statistically significant. The negative sign is
likely to be indicative of the local rather than export market orientation of much of the inward FDI in
Uganda. This result reflects the fact that a good amount of the inward FDI in Uganda are largely
oriented toward the domestic market rather than global export market. This would not be the case if
much of the inward FDI are oriented toward exporting as in the case of Export Processing Zones
(EPZs) which Uganda is yet to prioritize.
To construct the error correction model we combine the long run steady state relationship with the
short-run adjustments. We retain the suggested lag length of 2 to avoid excessive loss in degrees of
freedom given the data points employed are 53. The error correction model for the export function is
presented as:

27
∆𝑙𝑛𝑋! = 𝛼 + 𝛽!∆𝑙𝑛𝑋!!! !
!!!
+ 𝛾!∆𝑙𝑛𝐺𝐷𝑃!!! + 𝛿!∆𝑙𝑛𝑅𝐸𝐸𝑅!!! +!
!!!
!
!!!
𝜃!∆𝑙𝑛𝑂𝐷𝐴!!! +!
!!!
𝜖!Δ𝑙𝑛𝐹𝐷𝐼!!!
!
!!!
+ µμ!Δ𝑙𝑛𝑆𝑉𝐺!!!
!
!!!
+ 𝜋!𝑙𝑛𝑇𝐴𝑋!!! + 𝜌!𝑙𝑛𝐺𝐹𝐶𝐹!!! + 𝜏!𝑙𝑛𝑀𝑉𝐴!!! + 𝜔!𝑙𝑛𝐾𝐺𝐷𝑃!!!
!
!!!
!
!!!
!
!!!
!
!!!
+ 𝜆𝐸𝐶𝑀!!! + 𝜀
The Greek letters represent the coefficients of the variables. The statistically significant coefficients of
the ECM are presented in table 7 and the rest in table A5 in the appendix. The results show that the
error correction term of − 0.255770 carries the expected negative sign and is significant at 10%. The
ECT shows that approximately 26% of any deviation from the long run steady state is corrected in
each quarter.
Table 7. Error correction model for the export function
Variable Coefficient Coefficient Standard Error
t-Statistic Probability
ECT λ -0.255770 0.143835 -1.778225 0.0852
Δ(lnXt-1) β(1) 1.183792 0.200864 5.893496 0.0000
Δ(lnSVGt-1) μ(1) -0.118509 0.045292 -2.616584 0.0136
Δ(lnMVAt-1) τ(1) -0.259160 0.102387 -2.531185 0.0167
Constant α 0.008909 0.018122 0.491590 0.6265
Source: EViews output
Secondly most of the lagged variables of the model with the exception of SVG and MVA variables are
not significant and so may be dropped in a parsimonious model. Looking at the regression diagnostics
and especially the adjusted R2 of 0.59, Durbin-Watson of 2.38 and a significant F-Statistics, we can
conclude that the specified model fits the data reasonably well. The adjusted R2 of 0.59, shows that
the explanatory variables of the model including the ODA variable explain approximately 60% of the
variation in Uganda’s export volumes. The DW is close to 2 implying negligible autocorrelation.
6.3 The Import Model
6.3.1 Co-integration Tests
On the basis of the Johansen co-integration test we are able to reject the null hypothesis of no co-
integration between the variables in favor of at least one co-integrating equation for the import model.
The results of the Johansen co-integration rank test are shown in table 8 in the appendix.

28
6.3.2 The Error Correction Model
Our basic hypothesis is that imports (M) are driven by domestic national income and the real effective
exchange rates. In the case of Uganda however, aid support has been instrumental in trade
facilitation especially through the reform of customs procedures, harmonization of clearance
documentation, removal of NTBs, and the introduction of an integrated IT system and others towards
an ultimate single customs territory (SCT) in the EAC.
These interventions will undoubtedly have had some effect on the flow of goods in and out of the
country. Based on the latter, we add ODA variable as a possible explanatory variable in the import
function. We then estimate the long-run co-integrating equation of the import model. The coefficients
obtained are presented in table 9 in the appendix. The three explanatory variables of GDP, REER and
ODA all turned out significant. However all except the REER variable carry the expected signs as
shown in the equation below.
𝑙𝑛𝑀 + 17.34906 − 0.685034𝑙𝑛𝐺𝐷𝑃 − 0.901103𝑙𝑛𝑅𝐸𝐸𝑅 − 0.286164𝑙𝑛𝑂𝐷𝐴 = 0
In the equation, we note that the coefficient of the GDP variable bears the expected positive sign and
is statistically significant. As noted, domestic GDP is hypothesized to be a key motivator of import
demand and the positive relationship between GDP and imports is therefore consistent with the a
priori theoretical expectation. The coefficient of 0.685 of the GDP variable can be interpreted as the
import elasticity with respect to national income. A one percent increase in national income translates
into approximately 0.7 percentage points of import demand.
The ODA variable also carries a positive sign implying that imports positively correlate with ODA.
Several explanations may be offered for this empirical observation. The most common and obvious
interpretation is that of “tied aid” in which an aid-recipient nation is required to spend at least part of
aid money in the donor nations usually in terms purchase of project inputs and technical assistance.
Secondly aid money contributes to the national pool of foreign currency and capacitates the recipient
nation in importing goods and services. Finally in the case of Uganda, aid money especially in form of
AFT has gone into trade facilitation which boosts both imports and exports. The elasticity of import
growth with respect to aid is approximately 0.3, implying that one percentage increase in ODA
translates into approximately 0.3 percentage points of import growth in the long run relationship.
The real effective exchange rate (REER) variable turned up with a positive sign contrary to a priori
expectation. However given that much of Uganda’s imports comprise of essential petroleum and
petroleum products, capital inputs and consumer manufactured goods and services, we may not
expect any significant elasticity in Uganda’s import demand. In fact a positive “Giffen-good” type
relation between the country’s imports and REER (which represents the price of imports) is quite

29
possible. This may be manifested through simultaneous growth in import demand along with
depreciation of the local currency. The error correction model combining the long and short-run
relationship is expressed as,
∆𝑙𝑛𝑀! = 𝛼 + 𝛽!∆𝑙𝑛𝑀!!! !
!!!
+ 𝛾!∆𝑙𝑛𝑈𝐺𝐷𝑃!!! + 𝛿!∆𝑙𝑛𝑅𝐸𝐸𝑅!!! +!
!!!
!
!!!
𝜃!∆𝑙𝑛𝑂𝐷𝐴!!! +!
!!!
𝜆𝐸𝐶𝑀!!! + 𝜀
Where, α represents the intercept, βi the coefficients of the lagged import variables, γi the coefficients
of the lagged UGDP variables, δi the coefficients of the lagged REER variables, θi the coefficients of
the lagged ODA variables, λ is the error correction term and ε the residual. The statistically significant
coefficients are summarized in table 10 while all the coefficients are presented in the appendix. In the
first place the error correction term (λ) with value of -0.309 bears the expected negative sign and is
statistically significant at 1%. The magnitude of λ shows that the system adjusts toward its long run
steady state at the rate of 30% every quarter.
In addition, the first lagged difference of the import variable (ΔlnMt-1) has a positive and significant
effect on current imports. The coefficient of the second lagged difference of the import variable (ΔlnMt-
2) however is not statistically significant. Both the first and second lagged differences of the GDP
variable are not significant implying that the ECM is largely influenced by the current rather than
previous levels of GDP. The first lagged difference of the REER variable is significant even though the
second is not. Finally and more importantly, both the first and second lagged differences of the ODA
variable are significant at 5% in the ECM. This shows that ODA has played a significant role in
strengthening Uganda’s import capacity.
Table 10. Error correction Model for the Import Function
Coefficient Standard Error t-Statistic Probability
ECT(𝝀) -0.309008 0.056479 -5.471184 0.0000
lnMt-1 0.525633 0.143363 3.666444 0.0007
lnREERt-1 -0.403680 0.181445 -2.224803 0.0314
lnODAt-1 -0.062951 0.017657 -3.565297 0.0009
lnODAt-2 -0.026932 0.013304 -2.024333 0.0492
Constant -0.004908 0.008249 -0.594997 0.5550
Source: EViews output
We also note that the adjusted R-Squared of 0.69 suggesting an approximately 70 percent
explanation of import variation, a Durbin-Watson statistic of 2.0 implying no autocorrelation and a
highly significant F-Statistic shows that the import model fits the data reasonably well.

30
Finally while the analysis shows that ODA can positively impact Uganda’s capacity to trade through
both exports and imports, there is need to strengthen export competitiveness given the widening
deficit in the external trade sector. It is also worth noting that building export capacity and
competitiveness is more challenging than building import capacity. Thus, evidence of aid impact on
trade capacity underscores the need for Uganda to supplement domestic effort with aid support in the
quest for a healthy external trade sector performance.
6.4 The Trade Balance Model
We now turn to the issue of Uganda’s external trade balance. As discussed in section 5.2, Uganda’s
trade balance has been in deficit for the last several decades. Expenditure on imports has generally
outstripped receipts from exports. This in turn has engendered a steady depreciation of the local
currency against major foreign currencies, a reflection of the imbalance in demand for imports and
exports. To closely examine the dynamics of the external trade sector, and especially the drivers of
the external trade balance, we run the trade balance on the domestic GDP, REER, ODA, FDI, GFCF,
SCH, TAX and foreign GDP. The results of the estimation should throw light on the role of each
variable in the balance of external trade.
6.4.1 Co-integration Test
The Johansen co-integration test shows that the trade balance function can have up to 6 cointegrating
equations (CEs) according to the trace criteria and up to 3 CEs according to the maximum eigenvalue
criteria. Given the evidence of cointegration, we proceed to estimate the cointegrating equation(s). On
the basis of theory and weak exogeniety tests, we run the cointegrating relationship with the trade
balance, |X-M| as the dependent variable on the explanatory variables identified (see section 6.4).
6.4.2 The Error Correction Model
The measure of trade balance employed in the analysis is the difference between exports and imports
expressed as percent of GDP (merchandize and services). For the period of time examined, Uganda’s
trade balance has been in deficit, that is, imports have exceeded exports. In the analysis we take the
absolute value of the trade balance. The long run relationship estimated turned out as,
𝑙𝑛𝑇𝐷𝐹𝐶𝑇 = −3.01517710556𝑙𝑛𝑈𝐺𝐷𝑃 − 0.0964363224391𝑙𝑛𝑂𝐷𝐴 − 0.0293230055028𝑙𝑛𝑅𝐸𝐸𝑅
+ 2.53641528562𝑙𝑛𝑆𝐶𝐻 + 0.236770074039𝑙𝑛𝑆𝑉𝐺 + 1.22513895893𝑙𝑛𝑇𝐴𝑋
+ 1.19700081651𝑙𝑛𝑀𝑉𝐴 + 4.78715558613𝑙𝑛𝐾𝐺𝐷𝑃 − 4.10434564907𝑙𝑛𝐺𝐹𝐶𝐹
− 0.317502447601𝑙𝑛𝐹𝐷𝐼 − 41.9387808219

31
The relationship shows that domestic GDP, ODA, REER GFCF and FDI appear to have an overall
negative effect on the trade balance – that is, they tend to reduce the deficit in the long run. On the
other hand the SCH, SVG, MVA and KGDP tend to increase Uganda’s trade deficit in the long run.
The ECM is presented in the form:
∆𝑙𝑛𝑇𝐷𝐹𝐶𝑇! = 𝛼 + 𝛽!∆𝑙𝑛𝑇𝐷𝐹𝐶𝑇!!! !
!!!
+ 𝛽!∆𝑙𝑛𝑋!!! !
!!!
+ 𝛾!∆𝑙𝑛𝐺𝐷𝑃!!! + 𝛿!∆𝑙𝑛𝑅𝐸𝐸𝑅!!! +!
!!!
!
!!!
𝜃!∆𝑙𝑛𝑂𝐷𝐴!!! +!
!!!
𝜖!Δ𝑙𝑛𝐹𝐷𝐼!!!
!
!!!
+ µμ!Δ𝑙𝑛𝑆𝑉𝐺!!!
!
!!!
+ 𝜋!𝑙𝑛𝑇𝐴𝑋!!! + 𝜌!𝑙𝑛𝐺𝐹𝐶𝐹!!! + 𝜏!𝑙𝑛𝑀𝑉𝐴!!! + 𝜔!𝑙𝑛𝐾𝐺𝐷𝑃!!!
!
!!!
!
!!!
!
!!!
!
!!!
+ 𝜆𝐸𝐶𝑀!!! + 𝜀
In looking at the overall error correction model (ECM) however, we underscore that fact that the error
correction term of -1.109193, while bearing the expected negative sign is not statistically significant.
The statistically significant coefficients in the above model are summarized in table 11. We note
however that domestic GDP lag one, gross fixed capital formation lag one and manufacturing value
added lag one are significant at 10%, 5%, and 10% respectively.
In comparing the model for the trade balance and the independent models for import and exports, we
note that the results of the econometric estimation of the import model shows more robustness in
terms of the F statistics, the adjusted R-square, the J-B test of normality of the residuals and other
diagnostics. The effect of the ODA variable also seems more robust on imports than on exports. We
may conclude that aid appears to have had relatively stronger effect on the growth of imports than
exports.
Table 11. Error correction model for the TB
Coefficient Std. Error t-Statistic Prob.
ECT -1.109193 0.690540 -1.606268 0.1191
ΔlnUGDP(-1) 16.31804 9.462794 1.724442 0.0953
ΔlnGFCF(-1) 4.099950 2.273705 1.803202 0.0818
ΔlnGFCF(-2) 2.423753 1.149461 2.108601 0.0437
ΔlnMVA(-1) -1.515542 0.767149 -1.975553 0.0578
Constant -0.284292 0.145410 -1.955107 0.0603
Source: Computed using EViews

32
The effect of ODA on exports especially through the AFT initiative is still insignificant even though
micro-level analysis of AFT programs show that some significant outputs which can impact trade in
the long run have been realized even though the overall effect of this is yet to be observed at macro-
level. The overall long run effect of the REER on the TB is negative, that is, a depreciation of the
domestic currency tends to improve the trade balance. Except for the statistical insignificance, this
result would otherwise be in support of the Marshall-Lerner condition. The overall results show that
more needs to be done on the export side to improve the external trade balance.
7. Sector and Project Level Performance of AFT In this section we now examine the contribution of aid for trade (AFT) in the key focus areas of policy
formulation and regulation capacity, economic infrastructure development, productive capacity
development, multilateral trade negotiation capacity, compliance with WTO rules and standards, and
mitigation of trade reform adjustment costs. The paper examines sectoral disbursements and where
possible project level outputs so far realized with aid support.
7.1 Policy Formulation and Regulation Capacity
Uganda has received significant technical support through the Integrated Framework (IF) and now the
Enhanced Integrated Framework (EIF) toward building trade capacity in the country especially in
developing technical capacity for policy formulation and regulation. Some of the support has come
through such programs as the Uganda Program for Trade Opportunities and Policy (UPTOP) of the
European Union which sponsored a series of trade sector review workshops and the development of
the national trade policy and sector development plan. In addition the country undertook diagnostic
trade integration studies (DTIS) aimed at identifying sector specific constraints and developing an
action matrix to remove the constraints.
Thus, some reasonable capacity in policy formulation and regulation has been realized. In 2007
Uganda came up with its first National Trade Policy (NTP). In addition to the NTP, the country
developed the National Trade Sector Development Plan (NTSDP) to operationalize the NTP. The
Uganda Export Promotion Board (UEPB) in collaboration with relevant MDAs and aid support,
developed the National Export Strategy (NES) and the Competitiveness Secretariat developed the
Competitiveness and Investment Climate Strategy I and II all of which are critical components of a
comprehensive trade strategy.
The key milestones realized with AFT support in relation to policy capacity in Uganda are therefore
the development of the country’s national trade policy and complimentary strategies and
mainstreaming these into the National Development Plan (NDP). The realization of the enhanced
trade policy capacity also scores reasonably well in relation to the Paris Declaration principles of

33
policy “ownership” and “alignment” with national priorities. The sector reviews and national trade
policy workshops were participative and instrumental in the development of the NTP.
Future aid support in the policy area could be directed into the operationalization of the Single
Customs Territory (SCT), the implementation of a comprehensive national competitiveness strategy to
take full advantage of the East African Customs Union (EAC-CU) and the Tripartite Free Trade Area
(TFTA). The latter have to address the issues of Uganda’s low productive capacity, considerable
fluctuations in supply quantities and high cost of production.
7.2 Economic Infrastructure Development
The NDP places considerable emphasis on infrastructure development and in budgetary allocations
as per the 2013/14 and earlier budgets (MFPED, 2012/13, 2013/14). The bulk of AFT support has
gone into infrastructure and rightly so as the efficiency of the transportation network directly impacts
the country’s cost of doing business and subsequent competitiveness. The prioritization of
infrastructure development in AFT disbursements reflects a good aid alignment with the priorities of
Uganda’s national development strategy.
In looking at the subsectors of infrastructure however, it is worth noting that the bulk of the money has
gone into the development of road transportation network and only USD 7.7 Million into cheaper rail
and approximately USD 0.93 Million in waterway networks since 2002. No AFT was targeted into the
development of storage facilities. It is important to note however that storage facilities are critical and
complimentary to efforts at boosting Uganda’s productive capacity and smoothing trade supply
quantities.
A regionally integrated transport network is required to significantly facilitate trade growth in the EAC
and beyond. Although there is a regional Railways master plan which is a component of the overall
transport infrastructure master plan, not much of the investments have been directed into these.
There is therefore urgent need to prioritize and fast track a regionally planned road, railway, waterway
networks and ports, harbors, and storage facilities. This requires significant investments in view of the
fact that the infrastructure inherited by the country from the colonial era was not designed for the
purpose of intra and inter-regional trade. Aid commitments to Uganda’s economic infrastructure based
on AidData information and summarized using GIS maps are shown in figure 8 for the energy,
transport and ICT sectors.

34
Figure 8. Aid to economic infrastructure development 1988-2013
Source: GIS map based on AidData information
Government put priority on the power sector and it is in this sector that reasonable progress can be
reported. One of the major additions to the hydroelectric power generation in the country is the 250
Megawatts Bujagali hydroelectric power dam co-financed by the African Development Bank (ADB),
the World Bank (WB), and the European Investment Bank (EIB) and commissioned in 2012.
Investments in the energy sector have led to some degree of stabilization in electrical power supply
and associated production especially electrical power based processing. It is noteworthy that in the
power sector, the government of Uganda demonstrated strong “ownership” of the policy in line with
the Paris principles. It is however debatable whether donor financial support has been “closely”
aligned to this particular policy priority of government especially in view of the withdrawal of donor
support in the initial attempt at the construction of the dam!
7.3 Building Productive Capacity
Over USD 900 Million of aid money has gone into Uganda’s agriculture sector from 2002 to 2011 to
support various projects. The sectoral disbursements of AFT are in line with Uganda’s comparative
advantage in agriculture and agro-based processing which contributes nearly 60% of export revenue.
AFT support in this sector represents good alignment with a national priority sector and comparative
advantage.
Information on aid directed into Uganda’s production sector is available from various sources. Figure 9
below summarizes data on aid into Uganda’s agriculture and tourism sectors obtained from AidData
and summarized using GIS maps. Aid targeted into building Uganda’s productive sector represent a
key priority as much of the binding constraints are in the production sector. These include such things

35
as near total dependence on natural climatic conditions especially in regards to agricultural
production, but also economic infrastructure constraints that undermine the competitiveness of
domestic enterprises.
Other related categories of key constrains in Uganda’s production sector include low productive
capacity, low levels of technological innovation and low productivity. These factors have led to
fluctuating output quantities especially in regards to agricultural produce where production is highly
dependent on natural climatic conditions, rudimentary technologies and low quality inputs. Reliability
and consistency in supply is key in trade competitiveness. There is therefore need to prioritize this so
as to strengthen and stabilize supply quantities for trade.
Figure 10: Aid to building productive capacity 1988-2013
Source: GIS map based on AidData information.
A lot however remains to be done in order to strengthen Uganda’s productive capacity and especially
in the agriculture sector in terms of making the sector less dependent on natural climatic conditions. In
this regard the critical areas to invest in are irrigation systems, quality of agricultural inputs, and better
technology and storage facilities. Another complimentary goal in relation to productive capacity is the
need to lower production costs in the country through investments in low cost transportation, utility
services, fuel and storage.
7.4 Multilateral Trade Negotiation Capacity
Uganda still has a limited capacity for multilateral trade negotiations. From 2002 to 2011,
approximately USD 0.67 million of AFT money has gone into multilateral trade negotiation and
approximately USD 0.5 Million into regional trade agreements (RTA) (OECD 2013). Rudaheranwa

36
(2005) highlighted the following key challenges facing Uganda in multilateral trade negotiations at the
WTO:
• Inadequacy of technical skills especially of international trade law and trade economics in the
ministry of trade, Uganda’s mission at the WTO but also among private sector players to
undertake rigorous analysis and synthesis of often complex trade issues and their
development implications. Closely related to this is the need for a state of the art resource
center to provide invaluable information and allow trade stakeholders to share vital
information;
• Understaffing of trade negotiators at the WTO, EU and ACP missions. WTO trade
agreements are reached through consensus which in turn require wide and on-going
consultations. In a number of cases there are regular and occasional meetings some of which
are simultaneous. Due to inadequacy of staff, Uganda is often not represented in some of the
meetings. This problem however faces many least developed countries who have come to
realize the importance of pooling their resources and negotiating as a block;
• Inadequacy of funds to the relevant ministries and the Inter-institutional Trade Committee
(IITC) that has been coordinating the pre-negotiation consultations with national trade
stakeholders. The IITC has been largely supported by aid for trade funds through the Uganda
Program for Trade Opportunities and Policy (UPTOP) from the EU and the Japan
International Cooperation Agency (JICA). The need to regularize the IITC and its operations
has been articulated on a number of occasions;
• There is also the challenge of inadequate feedback mechanism to canvass the views of trade
stakeholders and accurately synthesize them in the preparation of national negotiating
positions. The consequences of some of the instruments for negotiation can only be fully
fathomed through consultations with stakeholders in the trade related production sectors.
As pointed out, Uganda’s existing but obviously inadequate capacity in multilateral trade negotiation
has been largely realized through aid for trade donor funding especially from the EU and Japan. There
is need to explore both national and regional options to beef up the country’s trade negotiation
capacity.
Finally it is important to note that the negotiation of good trade deals is critical but must be
accompanied or even preceded by the development of strong production and supply capacity
otherwise the negotiated facilities will be underutilized just like the preferential trade opportunities
currently available to Uganda.

37
7.5 Implementation of WTO Rules
Compliance with WTO quality and standards in trade draws on a number of things. These include
knowledge of the acceptable quality and standards for goods defined by the International Standards
Organization (ISO), the necessary education of trade stakeholders relating to the standards, trade
facilitation, technological and scientific knowledge and the overall trade policy framework and
management.
Rudaheranwa (2005) has pointed out the challenges facing Uganda’s ability to comply with WTO
related quality and standards in multilateral trade namely: the inadequacy of the relevant equipment
and infrastructure, low technical know-how of standards development, lack of awareness of technical
information on standards among trade stakeholders, limited participation in international standards
setting processes, weak capacity for the enforcement of standards and under-resourcing of key
institutions like Uganda National Bureau of Standards (UNBS), Uganda Industrial Research Institute
(UIRI) and others for the development and enforcement of WTO standards especially in Sanitary and
Phytosanitary (SPS).
From 2002 to 2011, approximately USD 0.44 USD have been targeted into trade-related education;
approximately USD 10.27 in technological research and development (R&D), USD 37.8 in trade policy
administration and management; USD 7.33 in trade facilitation (OECD, 2013). The impact of the AFT
support in building domestic capacity to comply with multilateral trade standards is still limited.
7.6 Mitigating Adjustment Costs
Aid oriented reforms aimed at streamlining ports and customs procedures, the removal of NTBs and
further liberalization are likely to bring about loss of revenue for government and businesses for some
trade players.
Such adjustments costs are inevitable and constitute a trade-off for ensuring efficiency in regional
trade flows. However so far no AFT support has gone into the mitigation of reform related adjustment
costs (OECD CRS).
8. Summary and Conclusion The main findings of this paper may be summarized as follows:
The macro-model estimations shows that aid has positively influenced both Uganda’s import and
export trade. The results however show the impact of aid on imports to be more robust than the effect
on exports.

38
Uganda has built some reasonable capacity in trade policy formulation and regulation and has
developed the national trade policy, national export strategy, competitiveness strategy and has in
addition mainstreamed these into the national development plan (NDP) with AFT support. However
there is no dedicated, fully resourced policy analysis unit capable of doing cross sectoral policy
analysis within an inter-institutional framework.
The power sector has seen some notable growth with electricity supply largely stable especially after
the addition of 250 MW from Bujagali with significant role of AFT especially through the African
Development Bank and the European Union. This has positively affected the country’s productive
capacity especially power based processing. It is also worth noting that in regards to the power sector
development, the government showed strong policy “ownership” in line with the Paris Declarations.
The road transportation infrastructure sub-sector has also seen some positive trade enhancing
changes with aid support even though little or nothing has been done in the cheaper rail and
waterway transportation infrastructure development. Aid support into infrastructure is properly aligned
to Uganda’s current national development priority.
Finally little aid for trade support has gone into building negotiation capacity and none in mitigating the
effects of adjustment reforms.
A key principle in the Paris Declaration is policy “ownership”. This is to be interpreted that the aid-
recipient partner sets its development priorities. Thus, aid is complimentary but not a “replacement” of
national development effort.
All in all Liberalization which preceded the formulation of Uganda’s national trade policy “caught” the
country unprepared especially in terms of strategic trade options. Ideally liberalization should be
undertaken in tandem with the development of domestic trade capacity and competitiveness. This
lesson is important for future liberalization of EAC Common External Tariff (CET). No country can
gainfully participate in trade if it has nothing to offer. The result would only be unsustainable
consumption.
The overall conclusion of the study is that aid can produce positive impact on trade capacity when it is
properly aligned to sound national policy priorities and policy framework.
9. Policy Implications We now address the policy questions posed earlier in the light of the findings of the study and offers
some policy advice under the broad headings of – alignment of AFT with national priorities, AFT

39
supported achievements and options for enhancing the positive impact of AFT on Uganda’s external
trade sector.
9.1 Alignment of AFT with National Development Priorities
This paper established that Aid for Trade money during the 2002 - 2011 period largely went into
transport infrastructure, energy, agriculture and to a lesser extent into industry, mineral prospection
and exploration and trade policy capacity development (OECD-CRS 2013). The latter targeting is
reasonably consistent with Uganda’s national priorities as spelled out in the NDP and as articulated by
the country’s leadership and policy makers. Infrastructure, energy and agricultural development
remain part of Uganda’s policy priority.
The close alignment of AFT to national priorities fulfills one of the PD principles for aid effectiveness.
According to the AAA, the aid recipient economy spearheads the policy agenda while AFT effort
compliments government effort. Uganda has demonstrated strong policy ownership especially in
regards to the development of the energy sector and road infrastructure network. Government created
a special fund for energy and infrastructure development out of annual budgetary allocations. This
ensures that even where donor funds are not forthcoming, the country is able to press on with critical
development in the priority sectors.
Notwithstanding the reasonably good alignment of AFT support to government’s priority areas, a
number of areas critical for the competitiveness of the country remain under-resourced. These include
low cost railway and waterway transportation networks, storage facilities and productive capacity. The
latter includes boosting productivity especially in the agriculture sector through such things as
technological innovation and water for agricultural production possibly in form of irrigation systems.
Interventions in these areas are critical and should be prioritized so as to enhance competitiveness
arising from production cost related efficiencies and supply reliability.
9.2 Achievements Justifying the Continuation of the AFT Policy
In view of the notable outputs in the AFT supported government interventions especially in the power,
infrastructure, and to some extent agriculture sectors, it is reasonable to expect positive impact in
longer term outcomes such as increased export competitiveness and export volumes. This can be
possible with sound policy framework and better AFT targeting.
While the type of aid and the associated conditionality are important, even more important is how the
recipient economy utilizes the aid support. Thus, the problem is not with aid money per se but with
how it is applied in dealing with Uganda’s development challenges. In view of the latter it seems

40
reasonable to recommend a continuation of the AFT program in Uganda along with pro-trade policy
reforms and unambiguous emphasis on export competitiveness.
9.3 Enhancement of AFT-Domestic Policy Complementarity
A handful of factors have emerged as key game changers in the quest for more positive impact of aid
on trade and growth in this and previous studies. These include – the broader economic and political
context, political leadership, public finance management institutions, financial accountability
structures, and the soundness of the domestic policy framework.
The critical importance of the above factors have been clearly demonstrated during financial
mismanagement and misappropriations in the Office of the Prime Minister (OPM) in Uganda over the
2011 – 2012 period. These developments threatened the flow of aid itself as they triggered the
suspension of aid by up to eight key development partners. Not only is it necessary to ensure
predictability in the aid flow but also proper targeting and utilization. It is necessary in the first place to
develop sound financial management and accountability systems to ensure proper utilization of aid
money. This is also critical for Uganda’s ability to maintain the confidence of its development partners.
Thus, the issue of putting in place a sound financial management and accountability system needs to
feature prominently in the public finance management bill that the country is considering.
Another key requirement to enhance the impact of aid in Uganda is for government to show the kind
of strong ownership and leadership seen in the development of energy sector in dealing with other
critical sectors currently under-emphasized and under-resourced. These include the regionally
integrated cheaper rail and waterway transportation networks, storage facilities and the stabilization of
production and supply factors. Investments in these areas should be prioritized to enable the
significant lowering of production costs and the enhancement of Uganda’s competitiveness in a liberal
global trade environment.
There should also be a clear emphasis on strengthening export competitiveness in view of the huge
deficit in the trade balance but also addressing the unique challenges involved in export development
vis-à-vis import facilitation. In this regard both government effort and AFT support should be directed
into building competitive productive capacity in the country’s comparative advantage sectors and
value chains. Policy measures should aim at ensuring stability of output and supply which are critical
dimensions of competitiveness. In the particular case of agriculture, interventions relating to this issue
may include the development of irrigation systems, storage facilities and the like to reduce the
dependence of output supply on natural conditions.
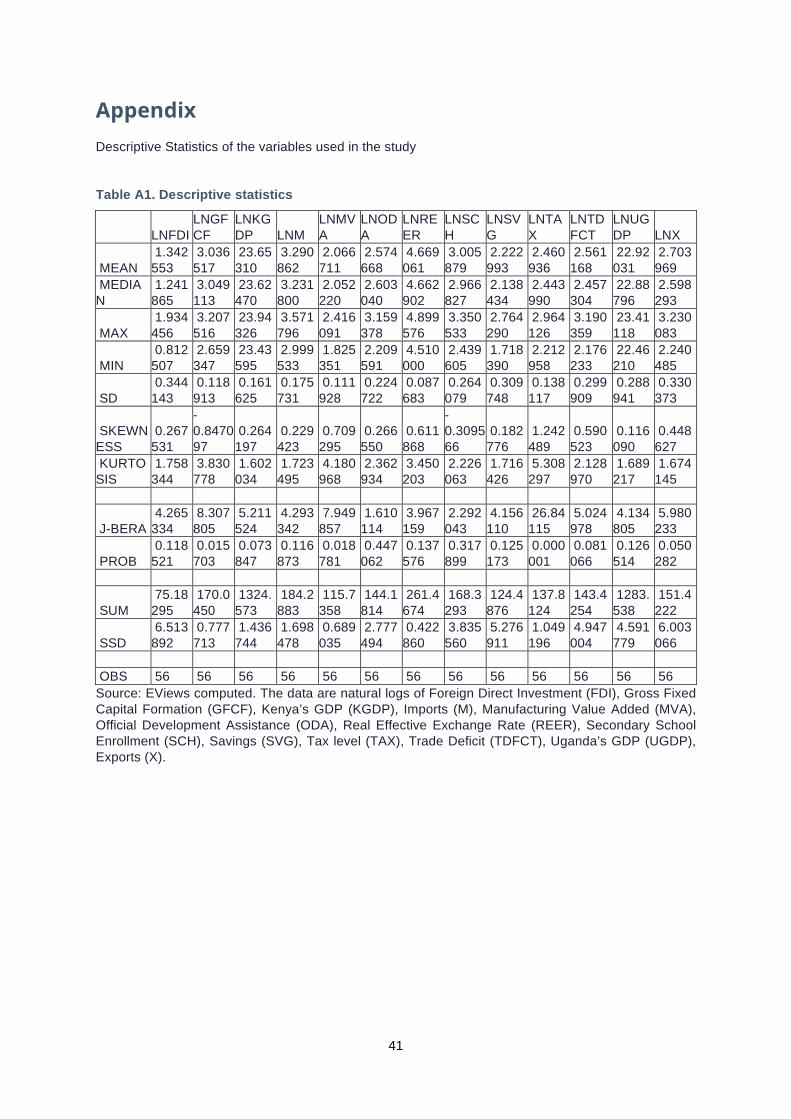
41
Appendix
Descriptive Statistics of the variables used in the study
Table A1. Descriptive statistics
LNFDI LNGFCF
LNKGDP LNM
LNMVA
LNODA
LNREER
LNSCH
LNSVG
LNTAX
LNTDFCT
LNUGDP LNX
MEAN 1.342553
3.036517
23.65310
3.290862
2.066711
2.574668
4.669061
3.005879
2.222993
2.460936
2.561168
22.92031
2.703969
MEDIAN
1.241865
3.049113
23.62470
3.231800
2.052220
2.603040
4.662902
2.966827
2.138434
2.443990
2.457304
22.88796
2.598293
MAX 1.934456
3.207516
23.94326
3.571796
2.416091
3.159378
4.899576
3.350533
2.764290
2.964126
3.190359
23.41118
3.230083
MIN 0.812507
2.659347
23.43595
2.999533
1.825351
2.209591
4.510000
2.439605
1.718390
2.212958
2.176233
22.46210
2.240485
SD 0.344143
0.118913
0.161625
0.175731
0.111928
0.224722
0.087683
0.264079
0.309748
0.138117
0.299909
0.288941
0.330373
SKEWNESS
0.267531
-0.847097
0.264197
0.229423
0.709295
0.266550
0.611868
-0.309566
0.182776
1.242489
0.590523
0.116090
0.448627
KURTOSIS
1.758344
3.830778
1.602034
1.723495
4.180968
2.362934
3.450203
2.226063
1.716426
5.308297
2.128970
1.689217
1.674145
J-BERA 4.265334
8.307805
5.211524
4.293342
7.949857
1.610114
3.967159
2.292043
4.156110
26.84115
5.024978
4.134805
5.980233
PROB 0.118521
0.015703
0.073847
0.116873
0.018781
0.447062
0.137576
0.317899
0.125173
0.000001
0.081066
0.126514
0.050282
SUM 75.18295
170.0450
1324.573
184.2883
115.7358
144.1814
261.4674
168.3293
124.4876
137.8124
143.4254
1283.538
151.4222
SSD 6.513892
0.777713
1.436744
1.698478
0.689035
2.777494
0.422860
3.835560
5.276911
1.049196
4.947004
4.591779
6.003066
OBS 56 56 56 56 56 56 56 56 56 56 56 56 56 Source: EViews computed. The data are natural logs of Foreign Direct Investment (FDI), Gross Fixed Capital Formation (GFCF), Kenya’s GDP (KGDP), Imports (M), Manufacturing Value Added (MVA), Official Development Assistance (ODA), Real Effective Exchange Rate (REER), Secondary School Enrollment (SCH), Savings (SVG), Tax level (TAX), Trade Deficit (TDFCT), Uganda’s GDP (UGDP), Exports (X).
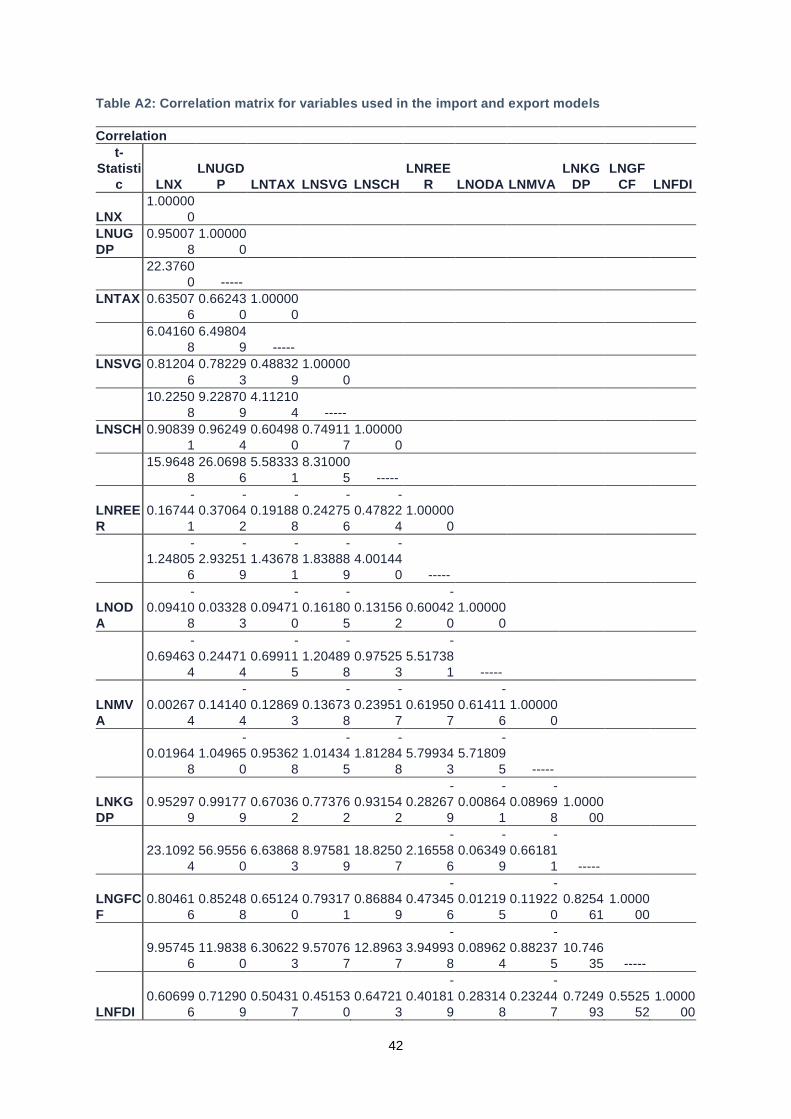
42
Table A2: Correlation matrix for variables used in the import and export models
Correlation
t-Statisti
c LNX LNUGD
P LNTAX LNSVG LNSCH LNREE
R LNODA LNMVA LNKG
DP LNGF
CF LNFDI
LNX 1.00000
0 LNUGDP
0.950078
1.000000
22.3760
0 ----- LNTAX
0.635076
0.662430
1.000000
6.04160
8 6.49804
9 ----- LNSVG
0.812046
0.782293
0.488329
1.000000
10.2250
8 9.22870
9 4.11210
4 ----- LNSCH
0.908391
0.962494
0.604980
0.749117
1.000000
15.9648
8 26.0698
6 5.58333
1 8.31000
5 -----
LNREER
-0.16744
1
-0.37064
2
-0.19188
8
-0.24275
6
-0.47822
4 1.00000
0
-1.24805
6
-2.93251
9
-1.43678
1
-1.83888
9
-4.00144
0 -----
LNODA
-0.09410
8 0.03328
3
-0.09471
0
-0.16180
5 0.13156
2
-0.60042
0 1.00000
0
-0.69463
4 0.24471
4
-0.69911
5
-1.20489
8 0.97525
3
-5.51738
1 -----
LNMVA
0.002674
-0.14140
4 0.12869
3
-0.13673
8
-0.23951
7 0.61950
7
-0.61411
6 1.00000
0
0.01964
8
-1.04965
0 0.95362
8
-1.01434
5
-1.81284
8 5.79934
3
-5.71809
5 -----
LNKGDP
0.952979
0.991779
0.670362
0.773762
0.931542
-0.28267
9
-0.00864
1
-0.08969
8 1.0000
00
23.1092
4 56.9556
0 6.63868
3 8.97581
9 18.8250
7
-2.16558
6
-0.06349
9
-0.66181
1 -----
LNGFCF
0.804616
0.852488
0.651240
0.793171
0.868849
-0.47345
6 0.01219
5
-0.11922
0 0.8254
61 1.0000
00
9.95745
6 11.9838
0 6.30622
3 9.57076
7 12.8963
7
-3.94993
8 0.08962
4
-0.88237
5 10.746
35 -----
LNFDI 0.60699
6 0.71290
9 0.50431
7 0.45153
0 0.64721
3
-0.40181
9 0.28314
8
-0.23244
7 0.7249
93 0.5525
52 1.0000
00
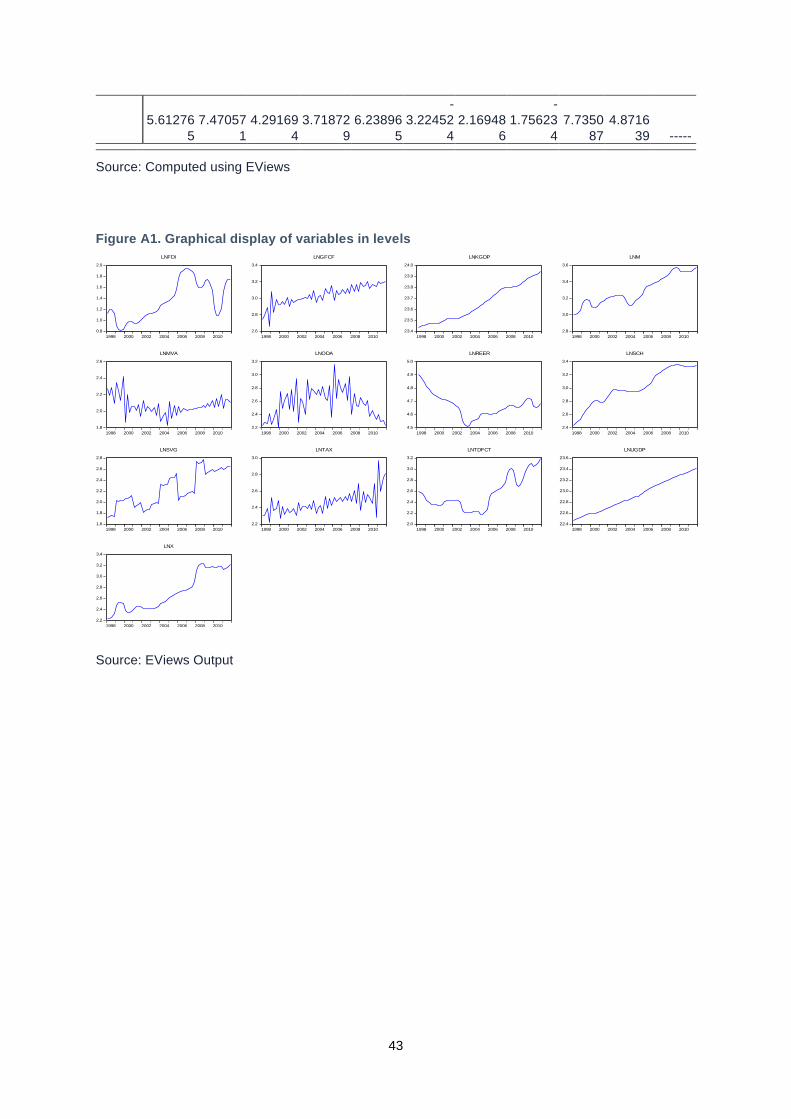
43
5.61276
5 7.47057
1 4.29169
4 3.71872
9 6.23896
5
-3.22452
4 2.16948
6
-1.75623
4 7.7350
87 4.8716
39 ----- Source: Computed using EViews
Figure A1. Graphical display of variables in levels
0.8
1.0
1.2
1.4
1.6
1.8
2.0
1998 2000 2002 2004 2006 2008 2010
LNFDI
2.6
2.8
3.0
3.2
3.4
1998 2000 2002 2004 2006 2008 2010
LNGFCF
23.4
23.5
23.6
23.7
23.8
23.9
24.0
1998 2000 2002 2004 2006 2008 2010
LNKGDP
2.8
3.0
3.2
3.4
3.6
1998 2000 2002 2004 2006 2008 2010
LNM
1.8
2.0
2.2
2.4
2.6
1998 2000 2002 2004 2006 2008 2010
LNMVA
2.2
2.4
2.6
2.8
3.0
3.2
1998 2000 2002 2004 2006 2008 2010
LNODA
4.5
4.6
4.7
4.8
4.9
5.0
1998 2000 2002 2004 2006 2008 2010
LNREER
2.4
2.6
2.8
3.0
3.2
3.4
1998 2000 2002 2004 2006 2008 2010
LNSCH
1.6
1.8
2.0
2.2
2.4
2.6
2.8
1998 2000 2002 2004 2006 2008 2010
LNSVG
2.2
2.4
2.6
2.8
3.0
1998 2000 2002 2004 2006 2008 2010
LNTAX
2.0
2.2
2.4
2.6
2.8
3.0
3.2
1998 2000 2002 2004 2006 2008 2010
LNTDFCT
22.4
22.6
22.8
23.0
23.2
23.4
23.6
1998 2000 2002 2004 2006 2008 2010
LNUGDP
2.2
2.4
2.6
2.8
3.0
3.2
3.4
1998 2000 2002 2004 2006 2008 2010
LNX
Source: EViews Output

44
Figure A2. Graphical display of the variables in first difference
-.4
-.2
.0
.2
.4
1998 2000 2002 2004 2006 2008 2010
DLNFDI
-.4
-.2
.0
.2
.4
.6
1998 2000 2002 2004 2006 2008 2010
DLNGFCF
-.004
.000
.004
.008
.012
.016
.020
.024
1998 2000 2002 2004 2006 2008 2010
DLNKGDP
-.08
-.04
.00
.04
.08
.12
1998 2000 2002 2004 2006 2008 2010
DLNM
-.6
-.4
-.2
.0
.2
.4
1998 2000 2002 2004 2006 2008 2010
DLNMVA
-0.8
-0.4
0.0
0.4
0.8
1.2
1998 2000 2002 2004 2006 2008 2010
DLNODA
-.08
-.06
-.04
-.02
.00
.02
.04
1998 2000 2002 2004 2006 2008 2010
DLNREER
-.04
-.02
.00
.02
.04
.06
.08
1998 2000 2002 2004 2006 2008 2010
DLNSCH
-.6
-.4
-.2
.0
.2
.4
.6
1998 2000 2002 2004 2006 2008 2010
DLNSVG
-.6
-.4
-.2
.0
.2
.4
.6
.8
1998 2000 2002 2004 2006 2008 2010
DLNTAX
-.3
-.2
-.1
.0
.1
.2
.3
1998 2000 2002 2004 2006 2008 2010
DLNTDFCT
.00
.01
.02
.03
.04
1998 2000 2002 2004 2006 2008 2010
DLNUGDP
-.2
-.1
.0
.1
.2
1998 2000 2002 2004 2006 2008 2010
DLNX
Source: EViews Output
The Export Model
Table A3. Unrestricted co-integration rank test (Trace) for the export model
No. of CE(s) Eigenvalue Trace Statistic Critical Value
(0.05) Prob.** None * 0.788647 378.5664 239.2354 0.0000 At most 1 * 0.755216 294.6381 197.3709 0.0000 At most 2 * 0.649697 218.6397 159.5297 0.0000 At most 3 * 0.579311 161.9960 125.6154 0.0001 At most 4 * 0.535679 115.2395 95.75366 0.0012 At most 5 * 0.412856 73.81182 69.81889 0.0232 At most 6 0.358214 45.05761 47.85613 0.0895 At most 7 0.239908 21.10862 29.79707 0.3509 At most 8 0.108993 6.295588 15.49471 0.6606 At most 9 0.001182 0.063849 3.841466 0.8005 Trace test indicates 6 co-integrating equation(s) at the 0.05 level. * denotes rejection of the hypothesis at the 0.05 level and **MacKinnon-Haug-Michelis (1999) p-values.

45
Table A4. Coefficients of the long-run relationship for the export function
Variable Coefficients Standard Error t-Statistics lnX(-1) 1.000000 lnGDP(-1) -3.908860 0.10914 -35.8159 lnTAX(-1) -0.431339 0.05354 -8.05608 lnSVG(-1) -0.320189 0.01328 -24.1087 lnREER(-1) -2.474323 0.07428 -33.3089 lnODA(-1) -0.696621 0.02913 -23.9136 lnMVA(-1) -0.634061 0.04790 -13.2369 lnKGDP(-1) 5.404412 0.20255 26.6815 lnGFCF(-1) -0.119660 0.06345 -1.88597 lnFDI(-1) 0.013245 0.01105 1.19902 C -24.17926 Sample (adjusted): 1998Q4 2011Q4. Included observations: 53 after adjustments.
Table A5: Error correction model for the export function
Variable Coefficient Coefficient
Standard Error t-Statistic Probability
ECT C(1) -0.255770 0.143835 -1.778225 0.0852 Δ(lnXt-1) C(2) 1.183792 0.200864 5.893496 0.0000 Δ(lnXt-2) C(3) -0.069835 0.266515 -0.262032 0.7950 Δ(lnGDPt-1) C(4) -0.008029 1.653572 -0.004856 0.9962 Δ(lnGDPt-2) C(5) -1.224124 1.611744 -0.759502 0.4533 Δ(lnTAXt-1) C(6) -0.115654 0.066881 -1.729244 0.0937 Δ(lnTAXt-2 C(7) -0.067962 0.054261 -1.252519 0.2197 Δ(lnSVGt-1) C(8) -0.118509 0.045292 -2.616584 0.0136 Δ(lnSVGt-2) C(9) -0.035865 0.033053 -1.085093 0.2862 Δ(lnREERt-1) C(10) -0.101549 0.376694 -0.269580 0.7893 Δ(lnREERt-2) C(11) -0.048959 0.407438 -0.120162 0.9051 Δ(lnODAt-1) C(12) -0.100646 0.082304 -1.222852 0.2306 Δ(lnODAt-2) C(13) -0.019572 0.044293 -0.441880 0.6616 Δ(lnMVAt-1) C(14) -0.259160 0.102387 -2.531185 0.0167 Δ(lnMVAt-2) C(15) -0.108094 0.082445 -1.311099 0.1995 Δ(lnKGDPt-1) C(16) -2.608397 1.823633 -1.430330 0.1626 Δ(lnKGDPt-2) C(17) 3.793954 2.009930 1.887605 0.0685 Δ(lnGFCFt-1) C(18) 0.082392 0.099199 0.830579 0.4126 Δ(lnGFCFt-2) C(19) 0.117933 0.102250 1.153376 0.2576 Δ(lnFDIt-1) C(20) -0.052456 0.081655 -0.642403 0.5253 Δ(lnFDIt-2) C(21) 0.171920 0.087441 1.966132 0.0583 Constant C(22) 0.008909 0.018122 0.491590 0.6265 Regression Diagnostics for the Export Error Correction Model
R-squared 0.757924 Mean dependent variable 0.017923 Adjusted R-squared 0.593936 S.D. dependent variable 0.044269 S.E. of regression 0.028209 Akaike info criterion -4.004432 Sum squared residuals 0.024669 Schwarz criterion -3.186575 Log likelihood 128.1175 Hannan-Quinn criterion. -3.689924 F-statistic 4.621845 Durbin-Watson statistics 2.380890 Probability (F-statistic) 0.000065 Sample: 1998Q4 2011Q4. Included observations: 53 after adjustments.
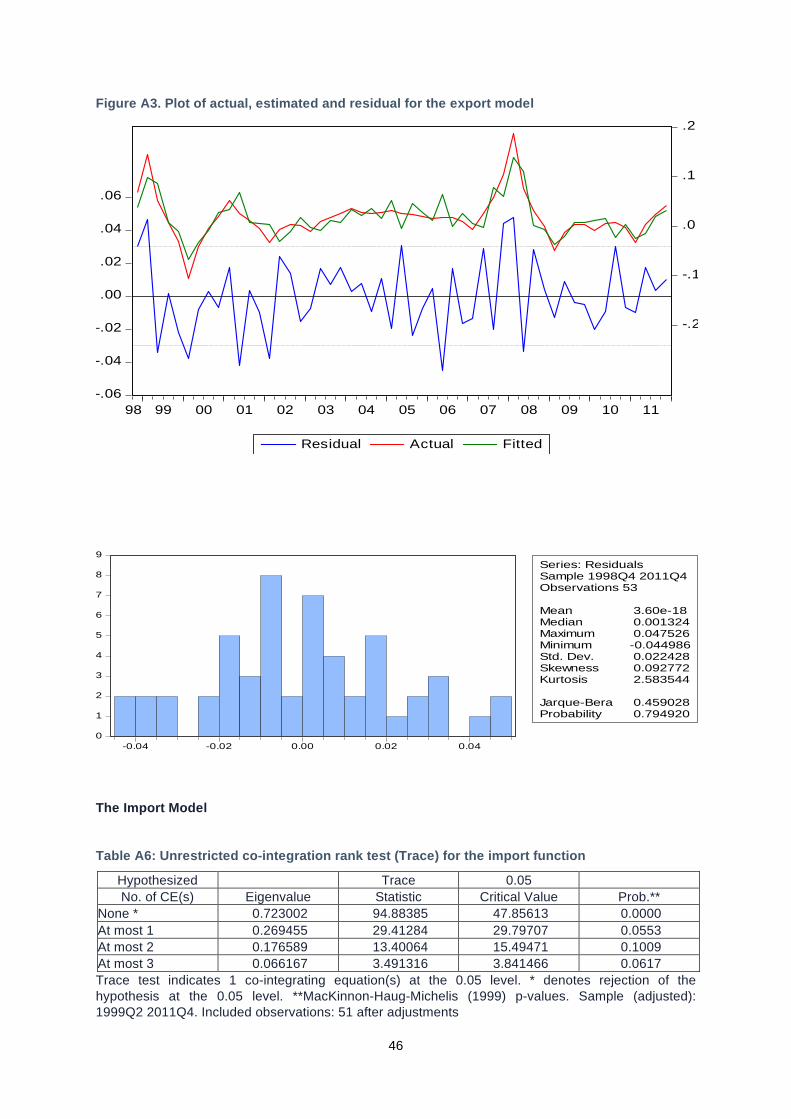
46
Figure A3. Plot of actual, estimated and residual for the export model
-.06
-.04
-.02
.00
.02
.04
.06
-.2
-.1
.0
.1
.2
98 99 00 01 02 03 04 05 06 07 08 09 10 11
Residual Actual Fitted
0
1
2
3
4
5
6
7
8
9
-0.04 -0.02 0.00 0.02 0.04
Series: ResidualsSample 1998Q4 2011Q4Observations 53
Mean 3.60e-18Median 0.001324Maximum 0.047526Minimum -0.044986Std. Dev. 0.022428Skewness 0.092772Kurtosis 2.583544
Jarque-Bera 0.459028Probability 0.794920
The Import Model
Table A6: Unrestricted co-integration rank test (Trace) for the import function
Hypothesized Trace 0.05 No. of CE(s) Eigenvalue Statistic Critical Value Prob.**
None * 0.723002 94.88385 47.85613 0.0000 At most 1 0.269455 29.41284 29.79707 0.0553 At most 2 0.176589 13.40064 15.49471 0.1009 At most 3 0.066167 3.491316 3.841466 0.0617 Trace test indicates 1 co-integrating equation(s) at the 0.05 level. * denotes rejection of the hypothesis at the 0.05 level. **MacKinnon-Haug-Michelis (1999) p-values. Sample (adjusted): 1999Q2 2011Q4. Included observations: 51 after adjustments

47
Table A7. Coefficients of the long-run co-integrating equation for the import model
Variable Coefficients Standard Error t-statistic lnM(-1) 1.000000 lnGDP(-1) -0.685034 0.02904 -23.5853 lnREER(-1) -0.901103 0.16000 -5.63191 lnODA(-1) -0.286164 0.08372 -3.41813 C 17.34906 Sample (adjusted): 1998Q4 2011Q4. Included observations: 53 after adjustments.
Table A8. Error correction model for the import function
Coefficient Standard Error t-Statistic Probability ECT -0.309008 0.056479 -5.471184 0.0000 Δ (lnMt-1) 0.525633 0.143363 3.666444 0.0007 Δ (lnMt-2) 0.013463 0.140442 0.095859 0.9241 Δ (lnGDPt-1) 0.806256 0.745504 1.081492 0.2855 Δ (lnGDPt-2) -0.404779 0.733081 -0.552162 0.5837 Δ (lnREERt-1) -0.403680 0.181445 -2.224803 0.0314 Δ (lnREERt-2) -0.266732 0.190070 -1.403335 0.1677 Δ (lnODAt-1) -0.062951 0.017657 -3.565297 0.0009 Δ (lnODA t-2) -0.026932 0.013304 -2.024333 0.0492 Constant -0.004908 0.008249 -0.594997 0.5550
R-squared 0.741374 Mean dependent variable 0.010429 Adjusted R-squared 0.687243 S.D. dependent variable 0.025392 S.E. of regression 0.014200 Akaike info criterion -5.502865 Sum squared residual 0.008671 Schwarz criterion -5.131112 Log likelihood 155.8259 Hannan-Quinn criterion -5.359907 F-statistic 13.69593 Durbin-Watson stat 2.006015 Probability (F-statistic) 0.000000 Dependent Variable: Δ (LNM). Method: Least Squares. Sample (adjusted): 1998Q4 2011Q4. Included observations: 53 after adjustments

48
Figure A4. Plot of the actual, estimated and residual for the import model
-.04
-.02
.00
.02
.04
-.08
-.04
.00
.04
.08
.12
98 99 00 01 02 03 04 05 06 07 08 09 10 11
Residual Actual Fitted
0
2
4
6
8
10
12
14
-0.04 -0.03 -0.02 -0.01 0.00 0.01 0.02 0.03
Series: ResidualsSample 1998Q4 2011Q4Observations 53
Mean -1.65e-17Median -0.000617Maximum 0.031666Minimum -0.035613Std. Dev. 0.012913Skewness -0.285729Kurtosis 3.733448
Jarque-Bera 1.909127Probability 0.384980
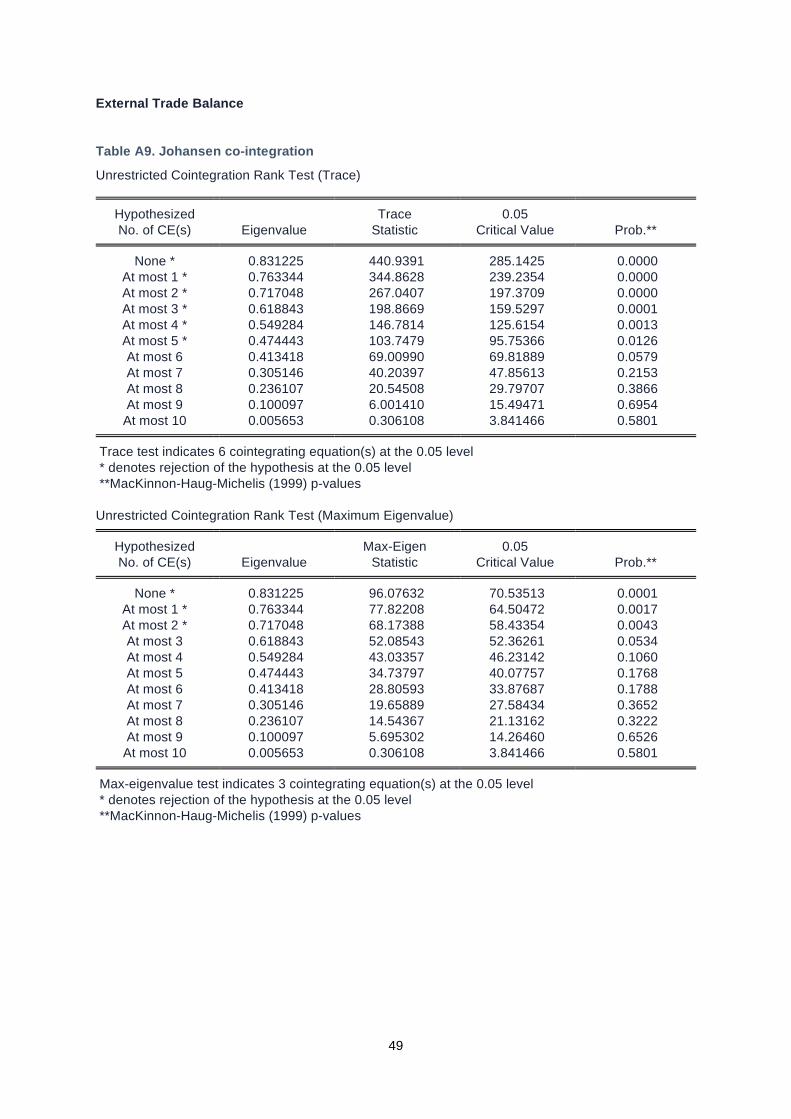
49
External Trade Balance
Table A9. Johansen co-integration
Unrestricted Cointegration Rank Test (Trace)
Hypothesized Trace 0.05
No. of CE(s) Eigenvalue Statistic Critical Value Prob.** None * 0.831225 440.9391 285.1425 0.0000
At most 1 * 0.763344 344.8628 239.2354 0.0000 At most 2 * 0.717048 267.0407 197.3709 0.0000 At most 3 * 0.618843 198.8669 159.5297 0.0001 At most 4 * 0.549284 146.7814 125.6154 0.0013 At most 5 * 0.474443 103.7479 95.75366 0.0126 At most 6 0.413418 69.00990 69.81889 0.0579 At most 7 0.305146 40.20397 47.85613 0.2153 At most 8 0.236107 20.54508 29.79707 0.3866 At most 9 0.100097 6.001410 15.49471 0.6954
At most 10 0.005653 0.306108 3.841466 0.5801 Trace test indicates 6 cointegrating equation(s) at the 0.05 level * denotes rejection of the hypothesis at the 0.05 level **MacKinnon-Haug-Michelis (1999) p-values
Unrestricted Cointegration Rank Test (Maximum Eigenvalue) Hypothesized Max-Eigen 0.05
No. of CE(s) Eigenvalue Statistic Critical Value Prob.** None * 0.831225 96.07632 70.53513 0.0001
At most 1 * 0.763344 77.82208 64.50472 0.0017 At most 2 * 0.717048 68.17388 58.43354 0.0043 At most 3 0.618843 52.08543 52.36261 0.0534 At most 4 0.549284 43.03357 46.23142 0.1060 At most 5 0.474443 34.73797 40.07757 0.1768 At most 6 0.413418 28.80593 33.87687 0.1788 At most 7 0.305146 19.65889 27.58434 0.3652 At most 8 0.236107 14.54367 21.13162 0.3222 At most 9 0.100097 5.695302 14.26460 0.6526
At most 10 0.005653 0.306108 3.841466 0.5801 Max-eigenvalue test indicates 3 cointegrating equation(s) at the 0.05 level * denotes rejection of the hypothesis at the 0.05 level **MacKinnon-Haug-Michelis (1999) p-values
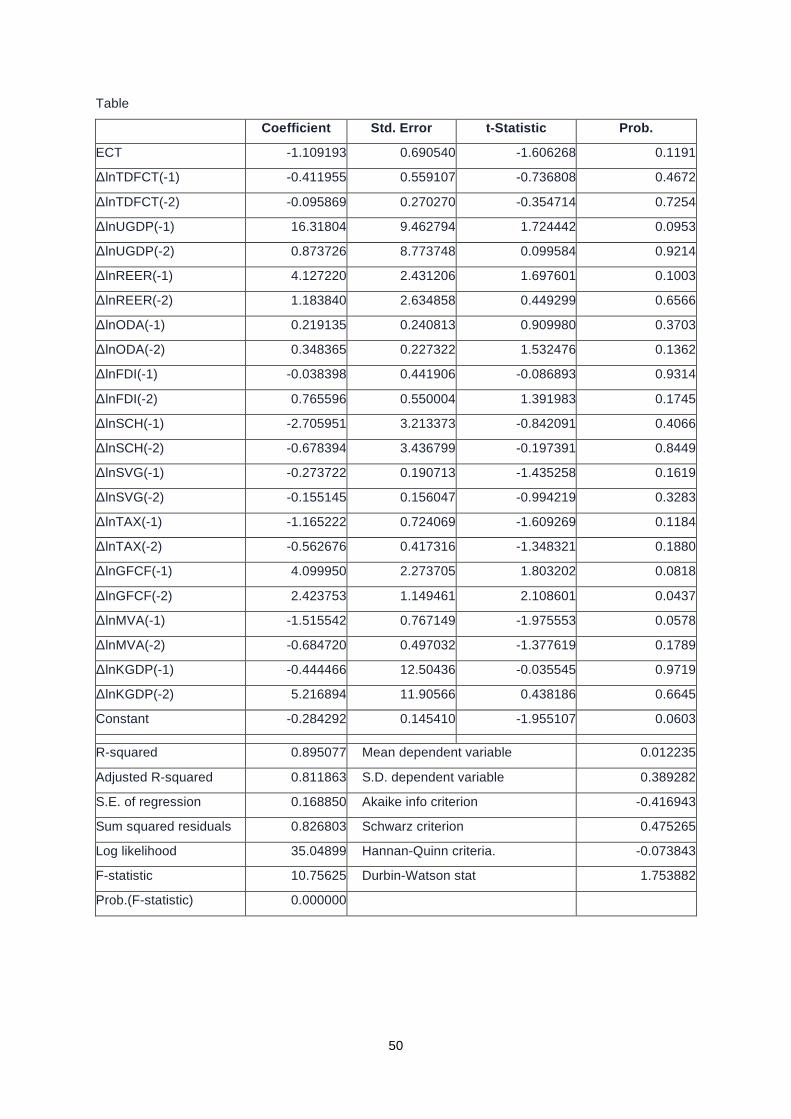
50
Table
Coefficient Std. Error t-Statistic Prob.
ECT -1.109193 0.690540 -1.606268 0.1191
ΔlnTDFCT(-1) -0.411955 0.559107 -0.736808 0.4672
ΔlnTDFCT(-2) -0.095869 0.270270 -0.354714 0.7254
ΔlnUGDP(-1) 16.31804 9.462794 1.724442 0.0953
ΔlnUGDP(-2) 0.873726 8.773748 0.099584 0.9214
ΔlnREER(-1) 4.127220 2.431206 1.697601 0.1003
ΔlnREER(-2) 1.183840 2.634858 0.449299 0.6566
ΔlnODA(-1) 0.219135 0.240813 0.909980 0.3703
ΔlnODA(-2) 0.348365 0.227322 1.532476 0.1362
ΔlnFDI(-1) -0.038398 0.441906 -0.086893 0.9314
ΔlnFDI(-2) 0.765596 0.550004 1.391983 0.1745
ΔlnSCH(-1) -2.705951 3.213373 -0.842091 0.4066
ΔlnSCH(-2) -0.678394 3.436799 -0.197391 0.8449
ΔlnSVG(-1) -0.273722 0.190713 -1.435258 0.1619
ΔlnSVG(-2) -0.155145 0.156047 -0.994219 0.3283
ΔlnTAX(-1) -1.165222 0.724069 -1.609269 0.1184
ΔlnTAX(-2) -0.562676 0.417316 -1.348321 0.1880
ΔlnGFCF(-1) 4.099950 2.273705 1.803202 0.0818
ΔlnGFCF(-2) 2.423753 1.149461 2.108601 0.0437
ΔlnMVA(-1) -1.515542 0.767149 -1.975553 0.0578
ΔlnMVA(-2) -0.684720 0.497032 -1.377619 0.1789
ΔlnKGDP(-1) -0.444466 12.50436 -0.035545 0.9719
ΔlnKGDP(-2) 5.216894 11.90566 0.438186 0.6645
Constant -0.284292 0.145410 -1.955107 0.0603
R-squared 0.895077 Mean dependent variable 0.012235
Adjusted R-squared 0.811863 S.D. dependent variable 0.389282
S.E. of regression 0.168850 Akaike info criterion -0.416943
Sum squared residuals 0.826803 Schwarz criterion 0.475265
Log likelihood 35.04899 Hannan-Quinn criteria. -0.073843
F-statistic 10.75625 Durbin-Watson stat 1.753882
Prob.(F-statistic) 0.000000

51
Figure A5. Plot of the actual, estimated and residual for the trade balance model
-.4
-.2
.0
.2
.4
-1.2
-0.8
-0.4
0.0
0.4
0.8
1.2
98 99 00 01 02 03 04 05 06 07 08 09 10 11
Residual Actual Fitted
0
2
4
6
8
10
12
14
-0.4 -0.3 -0.2 -0.1 0.0 0.1 0.2
Series: ResidualsSample 1998Q4 2011Q4Observations 53
Mean 1.18e-15Median 0.018226Maximum 0.218016Minimum -0.385116Std. Dev. 0.126095Skewness -0.883975Kurtosis 3.931772
Jarque-Bera 8.819737Probability 0.012157
Table A9. Sector specific aid for trade disbursement to Uganda (USD millions)
Time Period 2002
2003
2004 2005 2006 2007 2008 2009 2010 2011
Sector(s) Transport policy and administrative management
0.92
1.05
2.55
1.43
1.34
2.67
5.80
10.88
7.24
31.17
Road transport 51.9
7
39.2
3
80.71
45.39
73.78
120.4
6
175.3
1
98.60
153.9
7
162.9
9 Rail transport
0.77
0.92 .. .. ..
1.17 .. ..
1.43
3.41 Water transport .. .. .. .. ..
0.38 .. ..
0.28
0.27 Air transport ..
0.00
0.63
0.02
0.26
0.03
0.15 ..
0.02
0.05 Storage .. .. .. .. .. .. .. .. .. .. Education and training in
0.00
.. .. .. .. .. .. .. .. ..

52
transport and storage Communications policy and administrative management
1.55
0.38
0.64
0.11
0.42
0.36
0.37
0.07
1.02
0.14
Telecommunications
0.11
0.23
0.57
2.05
0.56
1.47
2.17
0.91
0.12
..
Radio/television/print media
1.04
0.53
0.41
0.93
0.31
0.51
9.98
3.46
0.37
0.15
Information and communication technology (ICT)
.. .. .. 0.04
0.10
0.14
0.36
0.43
1.15
0.84
Energy policy and administrative management
2.18
1.52
3.39
3.49
12.17
13.07
12.62
10.91
11.83
7.16
Power generation/non-renewable sources
5.96
2.92
16.73
12.47
5.17
19.82
15.27
3.15
0.33
0.11
Power generation/renewable sources
2.64
0.10
1.80
1.78
0.32
1.29
1.60
2.14
6.68
8.88
Electrical transmission/ distribution
11.9
0
15.8
6
20.86
12.25
5.60
10.48
28.52
24.40
23.25
24.09
Gas distribution .. .. .. .. .. .. .. .. .. .. Oil-fired power plants
.. .. .. .. .. 0.01
.. .. .. ..
Gas-fired power plants
.. .. .. .. .. .. .. .. .. ..
Coal-fired power plants
.. .. .. .. .. .. .. .. .. ..
Nuclear power plants
.. .. .. .. .. .. 0.21
0.25
0.06
0.02
Hydro-electric power plants
0.03
.. .. .. .. 83.54
41.66
90.80
99.06
29.42
Geothermal energy
.. .. .. .. .. .. .. .. .. ..
Solar energy 0.02
0.46
0.35
0.02
0.05
0.07
0.01
0.07
3.64
3.08
Wind power .. .. .. 0.06
.. .. .. .. .. ..
Ocean power .. .. .. .. .. .. .. .. .. .. Biomass
0.07
0.02 .. .. .. .. ..
0.11
0.21
0.46 Energy education/training
0.08
.. .. .. 0.05
0.05
0.12
0.26
0.21
..
Energy research .. .. .. .. 0.05
0.08
0.10
0.18
0.16
0.06
Financial policy and administrative management
1.00
1.40
7.26
2.79
1.71
7.93
8.00
6.07
3.67
18.36
Monetary institutions
.. .. .. .. .. .. .. 0.34
0.33
0.19

53
Formal sector financial intermediaries
0.20
3.96
1.21
0.06
.. 38.37
0.24
15.58
2.50
9.09
Informal/semi-formal financial intermediaries
11.5
4
4.45
10.26
8.53
10.58
8.95
(2.84)
5.77
12.87
5.14
Education/training in banking and financial services
.. 0.05
.. .. 0.03
0.05
.. 1.09
1.17
0.08
Business support services and institutions
2.30
7.35
6.77
7.26
10.49
19.83
6.65
9.96
7.31
17.23
Privatization 0.65
0.96
0.67
0.26
0.41
.. .. 0.03
.. ..
Agricultural policy and administrative management
6.46
5.46
24.25
30.15
35.44
42.34
40.00
20.61
19.29
31.38
Agricultural development
2.43
12.6
3
38.09
50.83
32.39
37.52
14.16
59.55
38.82
45.69
Agricultural land resources
0.72
0.36
0.02
0.01
.. 0.07
0.03
0.04
0.07
0.02
Agricultural water resources
0.13
0.01
.. .. .. .. .. 0.66
0.60
0.44
Agricultural inputs 0.09
0.03
0.01
0.04
3.51
0.07
1.83
0.29
0.06
2.49
Food crop production
0.23
1.10
0.40
0.45
1.21
14.02
0.57
0.83
0.93
0.85
Industrial crops/export crops
0.05
5.76
0.56
0.34
0.95
0.18
1.10
0.75
0.45
0.27
Livestock 0.52
0.16
0.31
1.01
6.71
9.74
11.77
1.83
0.74
0.49
Agrarian reform 0.46
.. .. .. .. .. .. .. 0.01
..
Agricultural alternative development
.. .. .. 0.03
0.17
0.21
0.09
11.16
.. ..
Agricultural extension
7.48
5.42
6.54
10.31
8.58
7.59
10.63
15.00
0.77
2.38
Agricultural education/training
0.27
0.71
1.07
1.48
1.39
1.03
0.90
0.97
2.30
3.83
Agricultural research
1.55
1.47
4.00
5.19
7.14
14.08
20.59
11.99
1.00
2.34
Agricultural services
1.61
2.02
3.76
5.01
13.60
29.05
13.55
6.80
1.14
1.17
Plant and post-harvest protection and pest control
0.24
0.01
.. .. .. .. .. .. 0.00
..
Agricultural financial services
0.00
.. .. .. .. .. 0.09
0.03
0.01
0.27
Agricultural co-operatives
.. 0.39
0.74
0.80
0.98
0.71
1.15
1.15
1.43
1.64
Livestock/veterinary services
0.01
0.08
0.00
0.07
0.07
0.58
0.40
0.12
1.88
3.30

54
Forestry policy and administrative management
3.44
4.73
12.16
5.89
5.62
15.04
1.47
2.42
0.84
1.89
Forestry development
4.41
0.22
0.08
0.23
0.15
0.14
0.09
0.02
2.21
1.13
Fuel wood/charcoal
.. .. .. .. .. .. .. 0.06
0.05
0.08
Forestry education/training
0.04
.. 0.11
0.06
.. 0.03
.. .. .. ..
Forestry research .. .. .. .. .. .. .. .. .. .. Forestry services .. .. .. .. .. .. ..
1.21
2.24
1.59 Fishing policy and administrative management
.. .. 0.02
0.10
0.05
.. 0.02
0.05
.. 1.34
Fishery development
1.03
0.96
0.44
1.13
3.86
1.61
10.61
8.38
0.52
0.40
Fishery education/training
.. .. .. 0.05
0.03
.. .. 0.05
0.00
..
Fishery research .. .. .. .. .. .. .. .. .. .. Fishery services .. .. .. .. .. .. .. ..
1.48
0.93 Industrial policy and administrative management
.. 0.01
0.48
0.86
4.03
2.58
4.46
6.71
3.93
3.91
Industrial development
1.42
0.57
0.70
0.61
0.24
0.72
0.09
0.38
0.14
0.18
Small and medium-sized enterprises (SME) development
0.37
6.01
4.31
3.05
4.05
3.97
2.38
24.94
8.09
11.35
Cottage industries and handicraft
.. .. 0.11
0.04
0.20
0.53
0.68
0.72
0.34
0.39
Agro-industries 0.93
0.64
2.54
3.18
3.87
1.50
2.20
2.27
5.10
4.93
Forest industries .. .. .. .. .. 0.03
0.11
0.03
.. 0.04
Textiles, leather and substitutes
0.28
.. 0.52
0.62
0.07
0.08
.. 0.03
.. ..
Chemicals .. .. .. .. .. .. .. .. .. .. Fertilizer plants .. .. .. .. .. .. .. .. .. .. Cement/lime/plaster
.. .. .. 0.24
0.05
0.00
.. .. .. ..
Energy manufacturing
.. .. .. .. .. .. .. .. .. ..
Pharmaceutical production
.. .. .. .. .. .. .. .. .. ..
Basic metal industries
.. .. 0.28
.. 0.12
0.02
0.03
.. .. ..
Non-ferrous metal industries
.. .. .. .. .. .. .. .. .. ..
Engineering ..

55
0.10 0.10 0.13 0.03 0.13 0.26 0.31 0.57 2.89 Transport equipment industry
.. .. .. .. .. .. .. .. .. ..
Technological research and development
0.09
0.29
0.01
0.01
2.85
1.39
1.74
2.27
0.91
0.71
Mineral/mining policy and administrative management
.. .. 0.46
0.16
2.03
3.76
3.07
7.41
4.76
9.77
Mineral prospection and exploration
.. 0.07
0.60
0.23
0.98
2.52
3.54
3.72
1.69
1.94
Coal .. .. .. .. .. .. .. .. .. .. Oil and gas .. .. .. .. .. ..
0.48
0.01
2.59
1.66 Ferrous metals .. .. .. .. .. .. .. .. .. .. Nonferrous metals
.. .. .. .. .. .. .. .. .. ..
Precious metals/materials
.. .. .. .. .. .. .. .. .. ..
Industrial minerals
.. .. .. .. .. .. .. .. .. ..
Fertilizer minerals .. 0.44
.. .. 0.08
0.08
0.11
0.09
.. ..
Offshore minerals .. .. .. .. .. .. .. .. .. .. Trade policy and administrative management
0.95
0.31
(0.00)
1.54
1.27
15.66
2.42
3.73
7.99
3.93
Trade facilitation .. 0.02
0.01
.. .. .. 0.19
0.27
0.07
6.77
Regional trade agreements (RTAs)
.. .. 0.04
0.21
0.19
0.06
.. .. .. ..
Multilateral trade negotiations
0.12
.. .. .. .. .. .. 0.55
.. ..
Trade-related adjustment
.. .. .. .. .. .. .. .. .. ..
Trade education/training
.. .. .. 0.20
0.00
0.02
0.00
0.06
0.18
0.18
Tourism policy and administrative management
0.12
1.17
1.32
1.29
0.61
0.81
0.31
0.08
0.11
0.17
V. TOTAL SECTOR ALLOCABLE (I+II+III+IV)
653.
91
875.
89
1,034
.46
1,060
.32
1,108
.06
1,365
.29
1,261
.55
1,524
.74
1,538
.40
1,427
.46

56
Table A10. Agriculture aid funded projects 1988-2013
Project Title Activity Code Donor Aid Commitment
Aid Disbursements
SUPPORT TO PMA SECRETARIAT
Aid to education ministries
European Union | United Kingdom
27728926 25171432
SUPPORT TO FISHERIES DEVELOPMENT PROGRAMME
Aid to education ministries
African Development Fund | China | Sweden
73261068 34786135
NORTHERN UGANDA POST WAR RECOVERY PLAN
Education policy and administrative management
Denmark / DANIDA | Austria | European Union
37755303 11942894
ASPS/NAADS AGRICULTURE SECTOR BUDGET SUPPORT
Community participation and development
Denmark/DANIDA 1010253 4004558
UGANDA MEAT EXPORTS DEVELOPMENT PROJECT
n/a Norway 3430510 0
AGRICULTURE SECTOR PROGRAM SUPPORT - HASP
Community participation and development
Denmark/DANIDA 8245333 2645885
AGRICULTURE SECTOR PROGRAM SUPPORT - FARMER ORGANISATIONS
Community participation and development
Denmark/DANIDA 10452545 8365742
AGRICULTURE SECTOR PROGRAM SUPPORT - LSRP/NARO
Community participation and development
Denmark/DANIDA 9463105 1022218
AGRICULTURE SECTOR PROGRAM SUPPORT - MOES
Community participation and development
Denmark/DANIDA 14993820 4420627
MAAIF COORDINATION/U-GROWTH
Education policy and administrative management
Denmark/DANIDA 90890870 0
RESTORATION OF AGRIC. LIVELIHOODS IN NORTHERN UGANDA PHASE 2 (RALNUC2)
Education sector policy
Denmark/DANIDA 0 0
30 UNITS OF 18 HORSEPOWER HAND TRACTORS
Community participation and development
China 84428.1 0
AGRICULTURAL IMPLEMENTS
Community participation and development
China 337428.6 0
SENIOR AGRICULTURAL EXPERTS
Education China 303403.1 0
AGRICULTURAL BIOTECHNOLOGY SUPPORT PROGRAM II (ABSP II)
Community participation and development
United States of America
0 0
COMMUNITY CONNECTOR
Conflict prevention and resolution / Oil
United States of America
0 0

57
and gas
AGRICULTURAL PLANNING ADVISER
Community participation and development
Japan 0 0
IRRIGATION ADVISER Education policy and administrative management
Japan 0 0
THE PROJECT FOR IMPROVING AGRICULTURAL PRODUCTIVITY THROUGH PROMOTING ANIMAL TRACTION IN 5 DISTRICTS IN EASTERN UGANDA
Education Japan 0 0
THE PROJECT FOR ALLEVIATION OF POVERTY THROUGH COFFEE PROCESSING
Education Japan 0 0
THE PROJECT FOR SUPPORTING FARMERS' GROUP IN LANGO REGION
Education Japan 0 0
THE PROJECT FOR THE EMERGENCY RELIEF ASSISTANCE TO POPULATIONS AFFECTED BY THE LANDSLIDES AND FLOODS IN EASTERN UGANDA
Education Japan 105062.8 100780.8
PROJECT FOR IMPROVING AGRICULTURAL PRODUCTIVITY THROUGH PROMOTING ANIMAL TRACTION
Education policy and administrative management
Japan 45374.24 0
POVERTY ALLEVIATION THROUGH COMMERCIALISATION OF AGRICULTURE
Education policy and administrative management
Norway 0 0
IMPLEMENTATION OF A FISHERIES MANAGEMENT PROJECT FOR LAKE VICTORIA
Education policy and administrative management
European Union 43596621 30806339
FARMER'S VOICE "IMPROVING FOOD SECURITY GOVERNANCE IN EAST AFRICA"
Education policy and administrative management
European Union 0 0
COMMUNITY REHABILITATION PROGRAMME IN ACHOLILAND, NORTHERN UGANDA
Elementary vocational training and secondary level technical
European Union 945932.2 683558.6
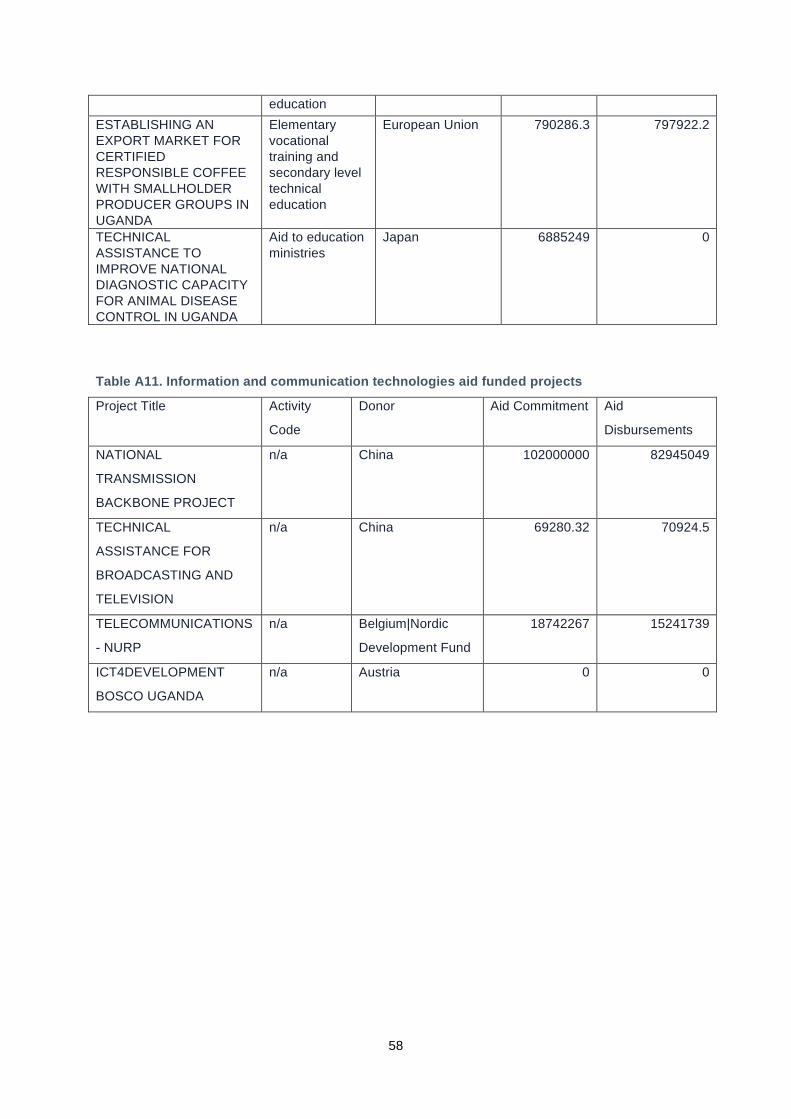
58
education
ESTABLISHING AN EXPORT MARKET FOR CERTIFIED RESPONSIBLE COFFEE WITH SMALLHOLDER PRODUCER GROUPS IN UGANDA
Elementary vocational training and secondary level technical education
European Union 790286.3 797922.2
TECHNICAL ASSISTANCE TO IMPROVE NATIONAL DIAGNOSTIC CAPACITY FOR ANIMAL DISEASE CONTROL IN UGANDA
Aid to education ministries
Japan 6885249 0
Table A11. Information and communication technologies aid funded projects
Project Title Activity
Code
Donor Aid Commitment Aid
Disbursements
NATIONAL
TRANSMISSION
BACKBONE PROJECT
n/a China 102000000 82945049
TECHNICAL
ASSISTANCE FOR
BROADCASTING AND
TELEVISION
n/a China 69280.32 70924.5
TELECOMMUNICATIONS
- NURP
n/a Belgium|Nordic
Development Fund
18742267 15241739
ICT4DEVELOPMENT
BOSCO UGANDA
n/a Austria 0 0

59
Table A12. Tourism, trade and industry
Project Title Activity Code
Donor Aid Commitment Aid Disbursements
SUPPORT TO UGANDA INDUSTRIAL RESEARCH INSTITUTE (UIRI)- NAKAWA
n/a China 7069055 7997365
EAST AFRICA TRADE & TRANSPORT FACILITATION PROJECT
n/a International Development Association
60071458 11853632
KIGEZI BUSINESS DEVELOPMENT SERVICES
n/a Austria 874485.4 0
BUSINESS MENTORING AND REGIONAL TRADE PROMOTION
n/a Ireland 0 0
SUPPORT TO TRADEMARK E. AFRICA COUNTRY STRATEGY FOR EAC TRADE FACILITATION
n/a Sweden 0 0
GLOBAL BUSINESS LABS IN KAMPALA- ACCELERATING ENTREPRENEURSHIP IN EAST AFRICA
n/a Sweden 0 0
Table A13. Works and transport
Project Title Activity Code
Donor Aid Commitment Aid Disbursements
RECONSTRUCTION OF TORORO-SOROTI ROAD
n/a International Development Association
188000000 0
CONSTRUCTION OF GOVERNMENT OFFICE BLOCK
n/a China 42311279 25464568
KARAMOJA ROAD DEVELOPMENT PROGRAMME
n/a European Union 15237974 5564615
CONSTRUCTION OF KAMPALA BY-PASS
n/a European Union 58504626 61561277
REHABILITATION OF KAMPALA CITY ROADS - EEC
n/a European Union 74298979 62554039
STRENGTHENING THE NORTHERN CORRIDOR
n/a European Union 138000000 31449598
UPGRADING FORTPORTAL-BUNDIBUGYO-LAMIA ROAD
n/a African Development Fund
91530262 25992815
UPGRADING OF GULU- ATIAK -NIMULE ROAD PROJECT
n/a International Development Association | Japan
84738796 0
NORTHERN CORRIDOR- n/a European Union 177000000 0

60
MBARARA-KATUNA ROAD ROAD SECTOR POLICY SUPPORT PROGRAMME- INSTITUTIONAL CAPACITY BUILDING
n/a European Union 13298753 0
KAMPALA-ENTEBBE EXPRESS HIGHWAY
n/a China 0 0
SURFACE TRANSPORT COORDINATION - UGANDA, RWANDA & DRC
n/a Belgium 1573489 494356.6
UPGRADING OF MASAKA-BUKAKATA ROAD PROJECT
n/a Arab Bank for Economic Development in Africa | Organisation of Petroleum Exporting Countries
0 0
CONSTRUCTION OF A NEW BRIDGE ACROSS RIVER NILE AT JINJA PROJECT
n/a Japan 122000000 0
ENTEBBE INTERNATIONAL AIRPORT
n/a Denmark/DANIDA 45541573 43787728
8 DISTRICTS ROAD NETWORK - FEEDER ROADS
n/a Denmark/DANIDA 35266864 19868886
RSISTAP - STUDIES Feasibility study for and design of the Kampala-Gayaza-Zirobwe road and Zirobwe-Wobulenzi road
International Development Association
42919586 29237041
ISHAKA-KAGAMBA ROAD
n/a African Development Fund
23785173 0
39000 RECHARGEABLE LAMPS (INCLUDING SPARE BATTERIES)
n/a China 758598.5 0
KCC ROAD UNIT AND SANITATION EQUIPMENT
n/a China 10319832 0
REHABILITATION OF DISTRICT ROADS
n/a Japan 0 0
THE PROJECT FOR SOCIAL INFRASTRUCTURE DEVELOPMENT FOR PROMOTING RETURN AND RESETTLEMENT
n/a Japan 14531767 5696245

61
OF INTERNALLY DISPLACED PERSONS THE PROJECT FOR STREET LIGHTS INSTALLATION IN TORORO MUNICIPALITY
n/a Japan 88892.97 88127.63
CREATING OPPORTUNITIES FOR SUSTAINABLE SPENDING ON ROADS-CROSS ROADS (WSP)
n/a United Kingdom 0 0
KAMPALA MASAKA ROAD
n/a European Union 164000000 109000000
KAMPALA NORTHERN BYPASS PHASE II
n/a European Union 0 0

62
References Adam S. C. and Bevan, L. D. Aid and the Supply Side: Public Investment, Export Performance and
Dutch Disease in Low-Income Countries in World Economic Review. Vol. 20, No. 2, pp. 261-
290.
Addison, T. Arndt, C. and Tarp, F. 2009. The Triple Crisis and the Global Aid Architecture. Helsinki,
UNU-WIDER.
Bahmani-Oskooee, M. 1998. “Cointegration Approach to Estimate the long run trade Elasticities in
LDCs in International Economic Journal. Volume 12, Number 3.
Burnside, C. and Dollar, D. 2000, ‘Aid, Policies, and Growth’, American Economic Review 90(4), 847-
68.
Easterly, W. Levine, R. Roodman, D. 2003. New Data, New Doubts: A Comment on Burnside and
Dollar’s “Aid, Policies, and Growth”.
Easterly, W. 2003. ‘Can Foreign Aid Buy Growth?’, Journal of Economic Perspectives. 17(3), 23-48.
Easterly, W. Levine, R. and Roodman, D. 2004. ‘New Data, New Doubts: A Comment on Burnside
and Dollar’s “Aid, Policies, and Growth”’. American Economic Review. 94(3), 774-80.
Funke, M. and Holly, S. 1992. The Determinants of West German Exports of Manufactures: An
Integrated Demand and Supply Approach. Weltwirtschaftliches Archive. 128(3). pp. 498-512.
Geda, A., Ndug’u, N. Zerfu, D. 2012. Applied Time Series Econometrics: A Practical Guide for
Macroeconomic Researchers with a Focus on Africa. Nairobi, University of Nairobi Press and
African Economic Research Consortium.
Guloba, M. Kilimani, N. and Nabiddo, W. 2010. Impact of China-Africa Aid Relations: A Case Study of
Uganda.
Haider, J. Afzal, M. and Riaz, F. 2011. Estimation of Import and Export Demand Functions Using
Bilateral Trade Data: The Case of Pakistan. Business and Economics Horizons. 6(3). pp. 40-
53.
Helble, M. Mann, C and Wilson, J. S. 2009. Aid for Trade Facilitation. Research Working Paper 5064.
Washington D. C. World Bank Development Research Group.
Hoekman, B. and Njinkeu, D. 2007. Aid for Trade and Export Competitiveness: New Opportunities for
Africa.
Jeanne, D. and Njoroge, J. 2012. Africa Review. Tuesday December 4, 2012.
Kotan, Z. and Saygili, M. 1999. Estimating and Import Function for Turkey. Ankara, Central Bank of
the Republic of Turkey.
Majeed, M. T. and Ahmad, E. 2006. Determinants of Exports in Developing Countries. The Pakistan
Development Review 45(4 Part II) pp. 1265-1276.
Mevel S. et al. 2013. The Africa Growth and Opportunity Act: An Empirical Analysis of the Possibilities
Post-2015. Washington, AGI at Brookings and UNECA.
Ministry of Agriculture Animal Industry and Fisheries. 2010. Agriculture for Food and Income Security:
Agriculture Sector Development Strategy and Investment Plan. Kampala, MAAIF. July 2010.

63
Ministry of Finance, Planning and Economic Development. 2007. The Republic of Uganda Debt
Strategy. Kampala, Ministry of Finance Planning and Economic Development.
Mugabe, D. 2013. “World Bank stops supporting Uganda’s budget” in The New Vision of April 25,
2013.
Muhwezi, S. 2013. “Uganda Can Still Salvage AGOA” in New Vision, Thursday 29, 2013. Kampala,
The New Vision.
OECD and WTO. 2006. Aid for Trade at a Glance 2007. OECD, Paris.
OECD and WTO. 2009. Aid for Trade at a Glance 2009. OECD, Paris.
OECD Website: www.oecd.org/
OECD. 2005. Paris Declaration on Aid Effectiveness. Paris, OECD.
OECD. 2006. Aid for Trade: Making it Effective. OECD, Paris.
OECD. 2006. Trade-Related Assistance: What Do Recent Evaluations Tell Us? OECD, Paris.
OECD. 2006. Trading Up: Economic Perspectives on Development Issues in the Multilateral Trading
System. OECD, Paris.
OECD. 2009. Binding Constraints to Trade Expansion: Aid for Trade Objectives and Diagnostic Tools.
OECD, Paris.
OECD. 2009. Increasing the Impact of Trade Expansion on Growth: Lessons from Trade Reforms for
the Design of Aid for Trade. OECD, Paris.
OECD. 2009. Trading Out of Poverty: How Aid for Trade can help. OECD, Paris.
Onafowora O. (2003) "Exchange rate and trade balance in East Asia: Is there a J−curve?" Economics
Bulletin, Vol. 5, No. 18 pp. 1−13
Price Water House Coopers. 2009. Aid for Trade: Making Trade Effective for Development – Case
Studies for Kenya, Tanzania and Uganda. Hamburg, Hamburg Institute of International
Economics.
Rajan, R. G. and Subramanian, A. 2005. Aid and Growth: What Does the Cross-Country Evidence
Really Show? IMF Working Paper WP/05/127. IMF.
Rogers, A. 2000. An Analysis of the Determinants of Fiji’s Imports. Working Paper 2000/03. Suva,
Economics Department, Reserve Bank of Fiji.
Rotarou and Ueta. 2009. “Foreign Aid and Economic Development: Tanzania’s Experience with ODA”
in Kyoto Economic Review. 78(2): 157-189.
Rudaheranwa, N. (2005). Institutional Challenges Facing Uganda’s Participation in WTO Negotiations.
Kampala, Economic Policy Research Center.
Rudaheranwa, N. (2005). Uganda’s Challenges in Complying with WTO Agreements. Kampala,
Economic Policy Research Center.
Sachs, J. 2005. The End of Poverty: How we can make it Happen in our Lifetime. Penguin Books.
Shirvani, H. and Wilbratte, B. 1997. The Relationship between the Real Exchange Rate and the Trade
Balance: An Empirical Reassessment. International Economic Journal 39. Volume 11,
Number 1, Spring 1997.
Sinha, D. 1997. Determinants of Import Demand in Thailand. International Economic Journal. 11(4).

64
UNCTAD. 2004. Export Performance and Its Determinants: Supply and Demand Constraints. New
York and Geneva. United Nations.
UNCTAD. 2008. Aid for Trade and Development: Global and Regional Perspectives. New York and
Geneva, United Nations.
Wacziarg, R. and Welch, K. H. 2003. Trade Liberalization and Growth: New Evidence. Stanford,
NBER and Stanford Graduate School of Business.
Warner, D. and Kreinin, M. E. 1983. Determinants of International Aid Flows. The Review of
Economics and Statistics. 65(1). pp. 96-104.
World Bank. 2006. Uganda Diagnostic Trade Integration Study (DTIS). Washington D.C. The World
Bank.
World Bank. 2013. Uganda Diagnostic Trade Integration Study (DTIS) Update: Prepared for the
Enhanced Integrated Framework. Washington D.C. World Bank.
Zada, N. et al. Determinants of Exports of Pakistan: A Country-wise Disaggregated Analysis.
Islamabad, International Islamic University.
![Ties That Bind - AidDatadocs.aiddata.org/ad4/pdfs/Ties_That_Bind--Full_Report.pdf · A Research Lab at William & Mary [Intentionally left blank] Acknowledgments This report was prepared](https://img.dokumen.tips/doc/110x75/5e70e1ceaed16c1ea26f8ffe/ties-that-bind-a-research-lab-at-william-mary-intentionally-left-blank.jpg)