Embed Size (px)
Citation preview

______________________________________________________________________________ This document is available to the public from the National Technical Information Service, Springfield, VA 22161
U.S. Department of Transportation National Highway Traffic Safety Administration
DOT HS 809 579 April 2003 Technical Report
Alcohol Involvement in Fatal Crashes 2001
Published By:
National Center for Statistics and Analysis Advanced Research and Analysis


______________________________________________________________________________ National Center for Statistics and Analysis, 400 Seventh St., S.W., Washington, DC 20590
This publication is distributed by the U.S. Department of Transportation, National Highway Traffic Safety Administration, in the interest of information exchange. The opinions, findings and conclusions expressed in this publication are those of the author(s) and not necessarily those of the Department of Transportation or the National Highway Traffic Safety Administration. The United States Government assumes no liability for its contents or use thereof. If trade or manufacturers’ names are mentioned, it is only because they are considered essential to the object of the publication and should not be construed as an endorsement. The United States Government does not endorse products or manufacturers.


______________________________________________________________________________ National Center for Statistics and Analysis, 400 Seventh St., S.W., Washington, DC 20590
Technical Report Documentation Page 1. Report No. DOT HS 809 579
2. Government Accession No.
3. Recipients's Catalog No.
5. Report Date
April, 2003
4. Title and Subtitle Alcohol Involvement in Fatal Crashes 2001
6. Performing Organization Code
NPO-121 7. Author(s) Rajesh Subramanian
8. Performing Organization Report No. 10. Work Unit No. (TRAIS)n code
9. Performing Organization Name and Address Mathematical Analysis Division, National Center for Statistics and Analysis National Highway Traffic Safety Administration U.S. Department of Transportation NPO-121, 400 Seventh Street, S.W. Washington, DC 20590
11. Contract of Grant No.
13. Type of Report and Period Covered NHTSA Technical Report
12. Sponsoring Agency Name and Address Mathematical Analysis Division, National Center for Statistics and Analysis National Highway Traffic Safety Administration U.S. Department of Transportation NPO-121, 400 Seventh Street, S.W. Washington, DC 20590
14. Sponsoring Agency Code
15. Supplementary Notes
Rajesh Subramanian is a Programmer Analyst employed by Rainbow Technology, Inc., a contractor for the Mathematical Analysis Division of the National Center for Statistics and Analysis. 16. Abstract Alcohol related fatalities are defined as fatalities that occur in crashes where at least one driver or nonoccupant (pedestrian or pedalcyclist) involved in the crash has a positive Blood Alcohol Concentration (BAC) value. This report presents estimates of alcohol involvement in fatal traffic crashes that occurred during 2001. The data are abstracted from the Fatality Analysis Reporting System (FARS) and represent a combination of actual Blood Alcohol Conentration (BAC) test results and estimated BAC distributions when the BAC test results are not available. Estimates of alcohol involvement have been presented along various categories of interest like Driver Age, Gender and crash characteristics like rural/urban, single-vehicle/multiple vehicle crash comparisons. Charts compare the extent of alcohol involvement for the last five years and underlying data for the comparisons up to the 1982 data year are provided in the Appendix. Descriptive measures like the mean and median BAC values are catalogued in the Appendix. Also, continuous BAC distributions are provided for each of the categories. 17. Key Words Alcohol Related Fatalities, Driver, Age, Gender, Crash Type, BAC Distributions
18. Distribution Statement Document is available to the public through the National Technical Information Service, Springfield, VA 22161
19. Security Classif. (of this report) Unclassified
20. Security Classif. (of this page) Unclassified
21. No of Pages 57
22. Price
Form DOT F1700.7 (8-72) Reproduction of completed page authorized


______________________________________________________________________________ National Center for Statistics and Analysis, 400 Seventh St., S.W., Washington, DC 20590
Table of Contents Abstract ........................................................................................................................................1 Highlights .....................................................................................................................................1 1. Introduction.............................................................................................................................2
Alcohol-Related Fatalities by Person Role .....................................................................3 Occupant Fatalities in Alcohol-Related Crashes...........................................................3 Fatalities by Person Role in High Alcohol-Crashes (Crash BAC=0.08+) ................4
3. Drivers ......................................................................................................................................5 4. Young Drivers .......................................................................................................................15 5. Pedestrians ...........................................................................................................................15 6. States ......................................................................................................................................16 7. Repeat Offenders (Recidivism) ........................................................................................17 8. Conclusions ..........................................................................................................................19 References.................................................................................................................................20 Glossary .....................................................................................................................................20 Appendix ....................................................................................................................................23
Descriptive Statistics ..........................................................................................................53 Alcohol-Related Fatalities – Q&As ..................................................................................56

______________________________________________________________________________ National Center for Statistics and Analysis, 400 Seventh St., S.W., Washington, DC 20590
1
Abstract Objectives – This report presents data on alcohol involvement in fatal crashes in the U.S. in 2001 according to crash and demographic characteristics such as age, gender, time of the day, day of the week etc. A companion publication presents summary alcohol data for 2001 (NHTSA, [2]). Definitions – Alcohol-Impairment Blood Alcohol Concentration (BAC) levels are between 0.01 and 0.07 while Intoxication is 0.08 and above and Involvement (alcohol-related) is 0.01 and above. The glossary at the end of this report provides definitions of various other terminologies used in this report. Methods and Data – The data are abstracted from the Fatality Analysis Reporting System (FARS) Annual Report File (ARF – to be updated to a final version later this year) and represent a combination of actual BAC test results and estimated BAC values for those drivers and nonoccupants (pedestrians and pedalcyclists) for whom BAC test results are not reported (Rubin [4] and Subramanian [5]). Interpretation – Alcohol involvement cannot be interpreted as a direct causal relationship between alcohol use and any other attribute of fatal crashes. Inferences concerning causality can only be made on the basis of additional information that is independent of the FARS data. Conclusions – Alcohol still remains a significant factor in motor vehicle traffic crashes in the U.S. After years of steady decline, alcohol- related fatalities have been rising in the last two years.
Highlights In 2001, a total of 37,795 fatal motor vehicle traffic crashes were recorded in the United States that accounted for 42,116 fatalities. Of these crashes, an estimated 41 percent were alcohol-related, i.e., at least one driver, pedestrian or pedalcyclist had a BAC of 0.01 or greater. Alcohol- related crashes accounted for about 41 percent of all fatalities in traffic crashes. About 21 percent of all drivers involved in fatal crashes were intoxicated, i.e., their BAC was 0.08 or greater (0.08+). Twenty-four percent of all male drivers involved were intoxicated as compared to 13 percent of all female drivers. About 33 percent of all drivers aged 21-24 involved in fatal crashes were intoxicated. Of all motorcycle operators involved in fatal crashes, 29 percent were intoxicated. This compares to about 23 percent for drivers of passenger cars and 23 percent for drivers of Light Trucks and Vans. About 52 percent of all drivers killed in nighttime crashes were intoxicated. About 63 percent of all drivers killed in single-vehicle nighttime crashes were intoxicated. The rate of alcohol involvement among fatally injured unbelted drivers of passenger vehicles was 46 percent as compared to 15 percent for belted drivers. Alcohol- impaired or intoxicated drivers with prior DWI convictions were involved in crashes that accounted for about 10 percent of all alcohol-related fatalities. About 33 percent of all pedestrians killed in traffic crashes were intoxicated.
______________________________________________________________________________ National Center for Statistics and Analysis, 400 Seventh St., S.W., Washington, DC 20590
2
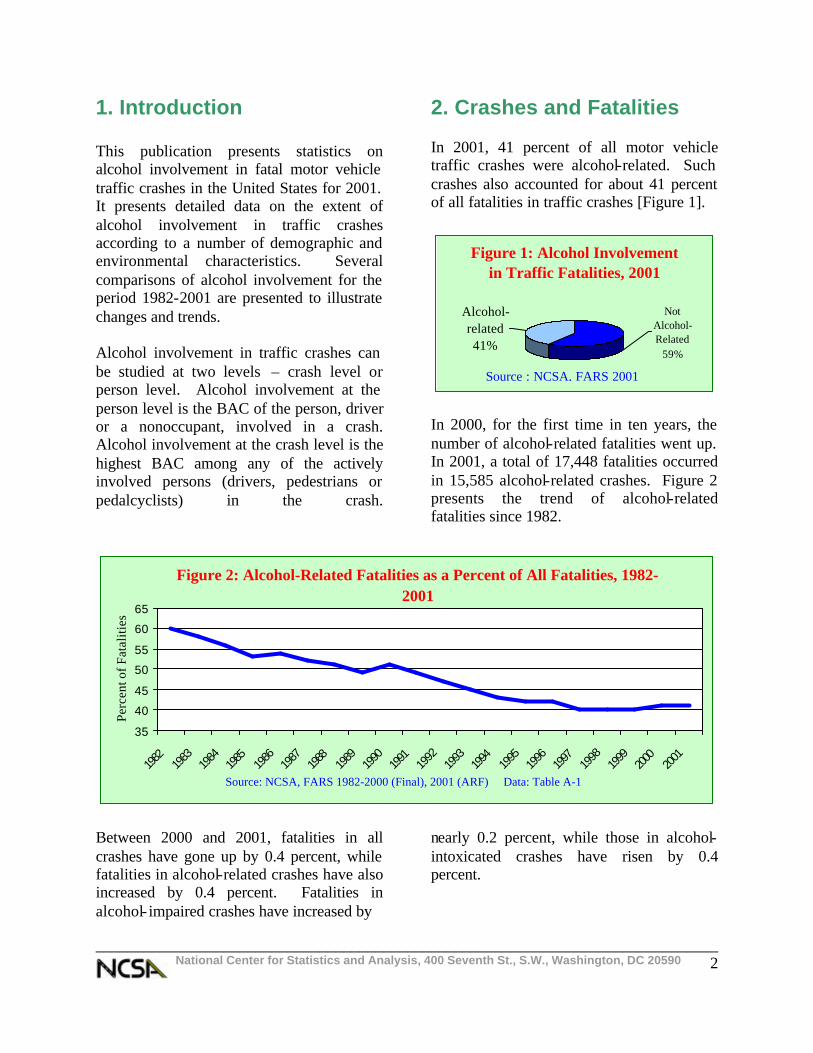
1. Introduction This publication presents statistics on alcohol involvement in fatal motor vehicle traffic crashes in the United States for 2001. It presents detailed data on the extent of alcohol involvement in traffic crashes according to a number of demographic and environmental characteristics. Several comparisons of alcohol involvement for the period 1982-2001 are presented to illustrate changes and trends. Alcohol involvement in traffic crashes can be studied at two levels – crash level or person level. Alcohol involvement at the person level is the BAC of the person, driver or a nonoccupant, involved in a crash. Alcohol involvement at the crash level is the highest BAC among any of the actively involved persons (drivers, pedestrians or pedalcyclists) in the crash.
2. Crashes and Fatalities In 2001, 41 percent of all motor vehicle traffic crashes were alcohol-related. Such crashes also accounted for about 41 percent of all fatalities in traffic crashes [Figure 1].
Figure 1: Alcohol Involvement in Traffic Fatalities, 2001
Not Alcohol-Related
59%
Alcohol-related 41%
Source : NCSA, FARS 2001
In 2000, for the first time in ten years, the number of alcohol-related fatalities went up. In 2001, a total of 17,448 fatalities occurred in 15,585 alcohol-related crashes. Figure 2 presents the trend of alcohol-related fatalities since 1982.
Figure 2: Alcohol-Related Fatalities as a Percent of All Fatalities, 1982-2001
35
40
45
50
55
60
65
1982
1983
1984
1985
1986
1987
1988
1989
1990
1991
1992
1993
1994
1995
1996
1997
1998
1999
2000
2001
Perc
ent o
f Fat
aliti
es
Source: NCSA, FARS 1982-2000 (Final), 2001 (ARF) Data: Table A-1
Between 2000 and 2001, fatalities in all crashes have gone up by 0.4 percent, while fatalities in alcohol-related crashes have also increased by 0.4 percent. Fatalities in alcohol- impaired crashes have increased by
nearly 0.2 percent, while those in alcohol-intoxicated crashes have risen by 0.4 percent.

______________________________________________________________________________ National Center for Statistics and Analysis, 400 Seventh St., S.W., Washington, DC 20590
3
A majority of alcohol-related fatalities occur in crashes where at least one of the actively involved participants had a BAC of 0.08 or greater. As in prior years, over 85 percent of all alcohol-related fatalities occurred in such crashes during 2001 [Figure 3].
Figure 3: Fatalities in Alcohol- Related Crashes by Extent of
Alcohol, 2001
Alcohol Related?
No59%
Yes41%
0.08+ (86%)
0.01-0.07 (14%)Source: NCSA, FARS 2001 (ARF) Data: Table A-1
Alcohol-Related Fatalities by Person Role A total of 17,448 persons were killed in alcohol-related crashes in 2001. Table 1 breaks down these fatalities by the role of the person, i.e., if the person was a driver, a passenger or a non-occupant.
Table 1: Alcohol-Related Fatalities by Person Role, 2001
Person Role
Driver Passenger Non-Occupant
Total
Number 10,781 3,978 2,689 17,448
Percent 62% 23% 15% 100%
Source: NCSA, FARS 2001 (ARF)
A total of 14,759 or about 85 percent of fatalities in alcohol-related crashes occurred to occupants of vehicles.
Occupant Fatalities in Alcohol-Related Crashes This section analyzes the circumstances involving the fatalities to 14,759 occupants who were killed in alcohol-related crashes. These occupants include any person riding in a passenger vehicle, large truck, bus or a motorcycle in transport. Table 2 further breaks down the data in Table 1 by providing a distribution of alcohol involvement among various groups of drivers and passengers.
Table 2: Occupant Fatalities in Alcohol-Related Crashes by Role and Driver
Impairment, 2001
Person Role Number Percent
Non-Sober Driver 9,573 65%
Sober Driver 1,208 8%
Passengers Riding with Non-Sober Drivers**
2,916 20%
Passengers Riding with Sober Drivers**
1,006 7%
Total* 14,759 100%
Source: NCSA, FARS 2001 (ARF)
*Note: Components do not add up to total as not all passengers have coded drivers in FARS.
**Number of Passengers do not total to 3,978 as not all passengers have coded drivers.
Alcohol involvement in these crashes cannot be interpreted as a direct causal relationship between alcohol use and any other attribute of fatal crashes. Inferences concerning causality can only be made on the basis of additional information that is independent of the FARS data. However, other factors like restraint use, rollover etc. are factors that may be significant in determining the injury outcome for the persons involved in the crash.

______________________________________________________________________________ National Center for Statistics and Analysis, 400 Seventh St., S.W., Washington, DC 20590
4
Figure 4 illustrates other factors that may have a causative effect for the fatality, namely restraint use (safety belts, helmets and child safety seats) and rollover occurrence.
Figure 4: Occupant Fatalities in Alcohol-Related Crashes by Restraint
Use and Rollover Occurence, 2001
Unrestrained + Rollover
28%
Other 8%
Unrestrained+Non-Rollover
38%
Restrained+Non-Rollover
21%
Restrained+Rollover
6%
Source: NCSA, FARS 2001 (ARF) Data:Table 3
As shown in Figure 4, about two-thirds of occupants killed in alcohol-related crashes were also not restrained. Also, about 34 percent of occupants killed in alcohol-related crashes were in vehicles that rolled over. Table 3 depicts the data underlying the chart in Figure 4.
Table 3: Occupant Fatalities in Alcohol-Related Crashes by Restraint Use and
Rollover Occurence, 2001
Restraint Use/ Rollover Number Percent
Rollover+Unrestrained 4,067 28%
Non-Rollover+Unrestrained 5,595 38%
Rollover+Restrained 852 6%
Non-Rollover+Restrained 3,030 21%
Other 1,215 8%
Total 14,759 100%
Source: NCSA, FARS 2001 (ARF)
Fatalities by Person Role in High Alcohol-Crashes (Crash BAC=0.08+) This section looks at the role of persons (drivers, passengers, pedestrians, etc.) who were fatally injured in crashes where at least one of the involved drivers or non-occupants was intoxicated (BAC=0.08+). Figure 5 presents the distribution by person type of the 14,933 fatalities that occurred in such crashes.
Figure 5: Fatalities in Alcohol-Intoxicated Crashes by Person Type,
2001Nonintoxicated Nonoccupants
4%
Intoxicated Nonoccupants 12%
Intoxicated Drivers
56%
Passengers22%
Non-Intoxicated Drivers
7%
Source: NCSA, FARS 2001 (ARF) Data:Table A-2
The number of non-occupants killed in such crashes increased by about 4 percent from 2000 to 2001. 13 percent (64 non-occupants) more non-intoxicated non-occupants were killed in such crashes in 2001 as compared to 2000. Comparatively, the number of intoxicated drivers killed in such crashes increased only marginally (2 percent) from 2000 to 2001 [Table A-2].

______________________________________________________________________________ National Center for Statistics and Analysis, 400 Seventh St., S.W., Washington, DC 20590
5
3. Drivers This section analyzes the extent of alcohol involvement by the BAC of the driver. In 2001, 57,480 drivers were involved in fatal crashes. Of these drivers, 74 percent were sober, 4 percent had BAC between 0.01 and 0.07, and 21 percent were intoxicated (BAC=0.08+). Figure 6 depicts the distribution of BAC for all drivers who were involved in fatal crashes in 2001. In FARS, reported BAC values range from 0 to a plausible maximum of 0.94.
Figure 6: Distribution of BAC Among Drivers Involved in Fatal Crashes, 2001 (excluding BAC=0)
0
0.2
0.4
0.6
0.8
1
1.2
1.4
0.01
0.11
0.21
0.31
0.41
0.51
0.61
0.71
0.81
0.91
BAC (g/dl)
Perc
ent
Percentages calculated as proportion of 57,480 drivers involved
Source: NCSA, FARS 2001 (ARF) Data:Table A-3
Table 4 shows descriptive statistical measures for BAC values among all non-sober drivers involved in fatal crashes in 2001. A median BAC of 0.16 implies that the BAC of half of all non-sober drivers involved in fatal crashes in 2001 are above 0.16, which is twice the legal limit of intoxication, namely 0.08.
Table 4: Summary Statistics: Non-Sober Drivers Involved in Fatal Crashes, 2001
Drivers Involved
Average BAC
Median BAC
75th Percentile
25th Percentile
All Drivers
0.16 0.16 0.21 0.10
Source: NCSA, FARS 2001 (ARF)
Impaired drivers comprise a large proportion of the non-sober participants in fatal motor vehicle traffic crashes while non-sober pedestrians and pedalcyclists accounted for a relatively smaller proportion. It is important to identify the characteristics of the impaired drivers, the circumstances surrounding the crash involving such drivers as well as the geographical representation of the occurrence of such crashes. The following sub-sections present data and findings on the alcohol involvement of drivers in fatal crashes for the factors that have shown the strongest association with evidence of alcohol use in these crashes. These factors are listed below. Demographic characteristics:
• Age of the Driver • Gender of the Driver • Restraint Use • License Status • Severity of Injury
Crash circumstances:
• Type of the Crash (Single or Multiple Vehicle)
• Time of the Day • Day of the Week • Rural/Urban

______________________________________________________________________________ National Center for Statistics and Analysis, 400 Seventh St., S.W., Washington, DC 20590
6
Injury Severity A fatally injured driver is about twice as likely to have consumed alcohol as compared to a driver who survived the crash. Fatally injured drivers are tested for alcohol by the medical examiner. The proportion of all fatally injured drivers with whom alcohol was associated was about twice that of all drivers who survived the fatal crash. Figure 7 presents a five-year trend of the extent of alcohol involvement by the survival status of the driver.
Figure 7: Alcohol Involvement Among Drivers Involved in Fatal Crashes by Injury Severity, 1997-
2001
010203040
1997
1998
1999
2000
2001
Perc
ent
Fatal Survived
Source: NCSA, FARS 1997-2000 (Final) 2001 (ARF) Data:Table A-4
Figure 8 shows the distribution of the BAC values among drivers involved by their survival status.
Figure 8: Distribution of BAC Among Drivers in Fatal Crashes
by Injury Severity, 2001
00.5
11.5
22.5
0.01
0.11
0.21
0.31
0.41
0.51
0.61
0.71
0.81
0.91
BAC (g/dl)
Perc
ent
Fatal Survived
Percentages calculated as proportion of Total Drivers involved in each category.
Source: NCSA, FARS 2001 (ARF) Data:Table A-5
Table A-28, in the Statistical Abstracts section of the Appendix, shows descriptive statistical measures for BAC values among drivers involved by their survival status. The extent of alcohol involvement among drivers involved in fatal crashes by their survival status is shown in Table 5.
Table 5: Drivers Involved by Their BAC and Injury Severity, 2001
Percent of Drivers Involved by Driver BAC
Injury Severity
No Alcohol
0.01-0.07
0.08+
Total Drivers
Involved
Fatal 63% 5% 32% 25,840
Survived 84% 4% 13% 31,640
Total 74% 4% 21% 57,480
Source: NCSA, FARS 2001 (ARF)
It can be inferred that drivers who survive fatal crashes are intoxicated much less frequently than fatally injured drivers. Some of the difference can be attributed to higher levels of BAC reporting for fatally injured drivers as compared to drivers who survived a fatal crash. However, NHTSA’s imputation methodology reduces this bias significantly by estimating the BAC for the large number of surviving drivers with missing BAC.
______________________________________________________________________________ National Center for Statistics and Analysis, 400 Seventh St., S.W., Washington, DC 20590
7
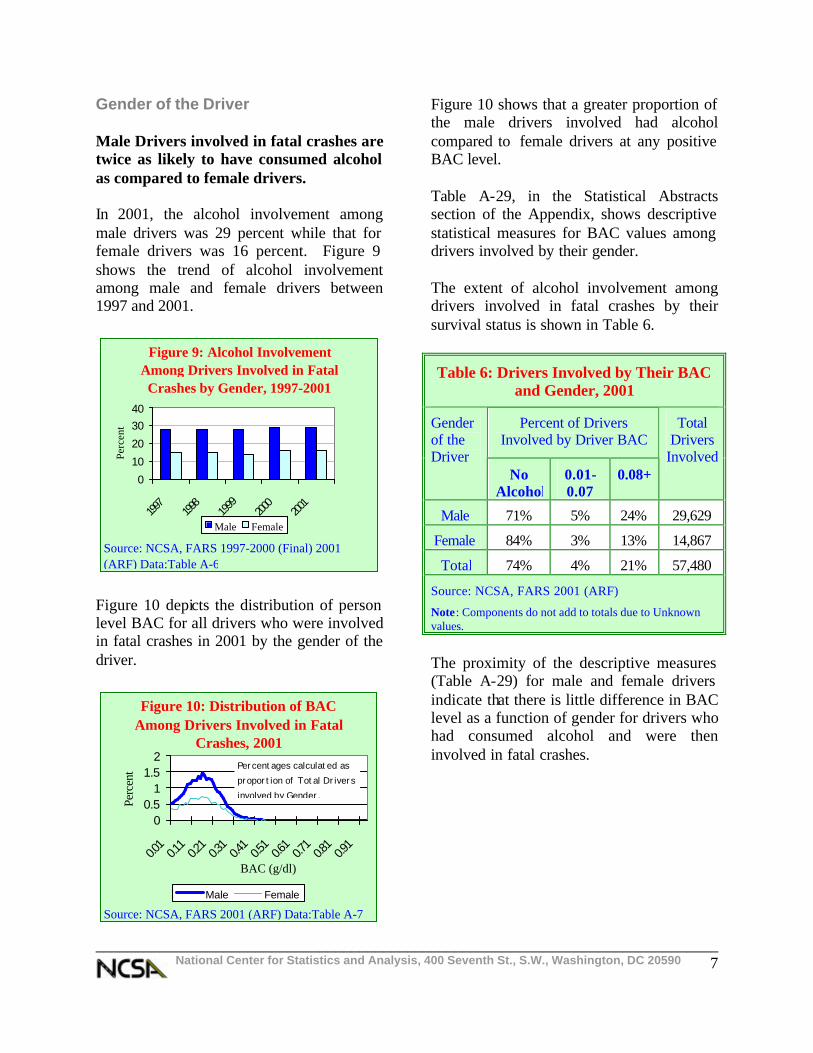
Gender of the Driver Male Drivers involved in fatal crashes are twice as likely to have consumed alcohol as compared to female drivers. In 2001, the alcohol involvement among male drivers was 29 percent while that for female drivers was 16 percent. Figure 9 shows the trend of alcohol involvement among male and female drivers between 1997 and 2001.
Figure 9: Alcohol Involvement Among Drivers Involved in Fatal Crashes by Gender, 1997-2001
0
10
20
3040
1997
1998
1999
2000
2001
Perc
ent
Male Female
Source: NCSA, FARS 1997-2000 (Final) 2001 (ARF) Data:Table A-6
Figure 10 depicts the distribution of person level BAC for all drivers who were involved in fatal crashes in 2001 by the gender of the driver.
Figure 10: Distribution of BAC Among Drivers Involved in Fatal
Crashes, 2001
00.5
11.5
2
0.01
0.11
0.21
0.31
0.41
0.51
0.61
0.71
0.81
0.91
BAC (g/dl)
Perc
ent
Male Female
Percentages calculated as proportion of Total Drivers involved by Gender.
Source: NCSA, FARS 2001 (ARF) Data:Table A-7
Figure 10 shows that a greater proportion of the male drivers involved had alcohol compared to female drivers at any positive BAC level. Table A-29, in the Statistical Abstracts section of the Appendix, shows descriptive statistical measures for BAC values among drivers involved by their gender. The extent of alcohol involvement among drivers involved in fatal crashes by their survival status is shown in Table 6.
Table 6: Drivers Involved by Their BAC and Gender, 2001
Percent of Drivers Involved by Driver BAC
Gender of the Driver
No Alcohol
0.01-0.07
0.08+
Total Drivers
Involved
Male 71% 5% 24% 29,629
Female 84% 3% 13% 14,867
Total 74% 4% 21% 57,480
Source: NCSA, FARS 2001 (ARF)
Note : Components do not add to totals due to Unknown values.
The proximity of the descriptive measures (Table A-29) for male and female drivers indicate that there is little difference in BAC level as a function of gender for drivers who had consumed alcohol and were then involved in fatal crashes.

______________________________________________________________________________ National Center for Statistics and Analysis, 400 Seventh St., S.W., Washington, DC 20590
8
Age of the Driver Figure 11 depicts the extent of alcohol involvement among drivers involved in fatal crashes by the age of the driver.
Figure 11: Alcohol Involvement Among Drivers Involved by
Age Group, 2001
01020304050
16-20
21-24
25-34
35-44
45-64 65
+
Age Group
Perc
ent
Source: NCSA, FARS 2001 (ARF) Data:Table A-8
As shown in Table 7, drivers in the age group 21-24 were most likely to be intoxicated followed by drivers aged 25 to
34. Table A-30, in the Appendix, shows descriptive statistical measures for BAC values among drivers involved by their age.
Table 7: Drivers Involved by their BAC and Age, 2001
Age of the Driver
Percent of Drivers Involved by Driver BAC
Total Drivers
Involved No
Alcohol 0.01-0.07
0.08+
16-20 77% 5% 18% 7,963
21-24 61% 6% 33% 6,016
25-34 67% 5% 28% 11,534
35-44 70% 4% 25% 11,201
45-64 81% 3% 17% 13,005
65+ 92% 2% 6% 6,421
Source: NCSA, FARS 2001 (ARF)
Figure 12 depicts the distribution of person level BAC for all drivers who were involved in fatal crashes in 2001 by the age of the driver.
Figure 12: Distribution of BAC among Drivers involved in Fatal Crashes by Age, 2001
0
0.5
1
1.5
2
2.5
0.01
0.11
0.21
0.31
0.41
0.51
0.61
0.71
0.81
0.91
BAC (g/dl)
Perc
ent
16-20 21-24 25-34 35-44 45-64 65+
Percentages calculated as proportion of Total Drivers involved by Age Group
Source: NCSA, FARS 2001 (ARF) Data:Table A-9

______________________________________________________________________________ National Center for Statistics and Analysis, 400 Seventh St., S.W., Washington, DC 20590
9
Type of Vehicle Alcohol involvement among operators of motorcycles was the highest among drivers by categories of vehicles. Figure 13 and Table 8 show the extent of alcohol involvement by vehicle type for drivers involved in fatal crashes.
Figure 13: Alcohol Involvement Among Drivers Involved in
Fatal Crashes by Vehicle Type, 2001
0
10
20
30
40
Pass
Cars SUVs
Pickup
sSU
Vs
Lar T
rks
Motorcy
cles
Vehicle Type
Perc
ent
Source: NCSA, FARS 2001 (ARF) Data:Table A-10
In 2001, alcohol involvement was highest among operators of motorcycles, followed by drivers of pickup trucks. Table A-31, in the Appendix, shows descriptive statistical measures for BAC values among drivers involved by vehicle type.
Table 8: Drivers Involved by Their BAC and Vehicle Type, 2001
Percent of Drivers involved by Driver BAC
Vehicle Type
No Alcohol
0.01-0.07
0.08+
Total Drivers
Involved
Cars 73% 4% 23% 27,287
Vans 84% 3% 13% 3,707
SUVs 73% 4% 22% 5,889
Pickups 69% 4% 27% 10,892
Lg.Trucks 98% 1% 1% 4,749
M.Cycles 63% 8% 29% 3,245
Source: NCSA, FARS 2001 (ARF)
Figure 14 depicts the distribution of person level BAC for all drivers who were involved in fatal crashes in 2001 by the type of vehicle they were driving.
Figure 14: Distribution of BAC Among Drivers Involved in Fatal Crashes by Vehicle Type, 2001
0
0.5
1
1.5
2
2.5
0.01
0.11
0.21
0.31
0.41
0.51
0.61
0.71
0.81
0.91
BAC (g/dl)
Perc
ent
Cars Vans SUV Pickup Lar Trks Motorcycles
Percentages calculated as proportion of Total Drivers involved by Vehicle Type
Source: NCSA, FARS 2001 (ARF) Data:Table A-11
______________________________________________________________________________ National Center for Statistics and Analysis, 400 Seventh St., S.W., Washington, DC 20590
10
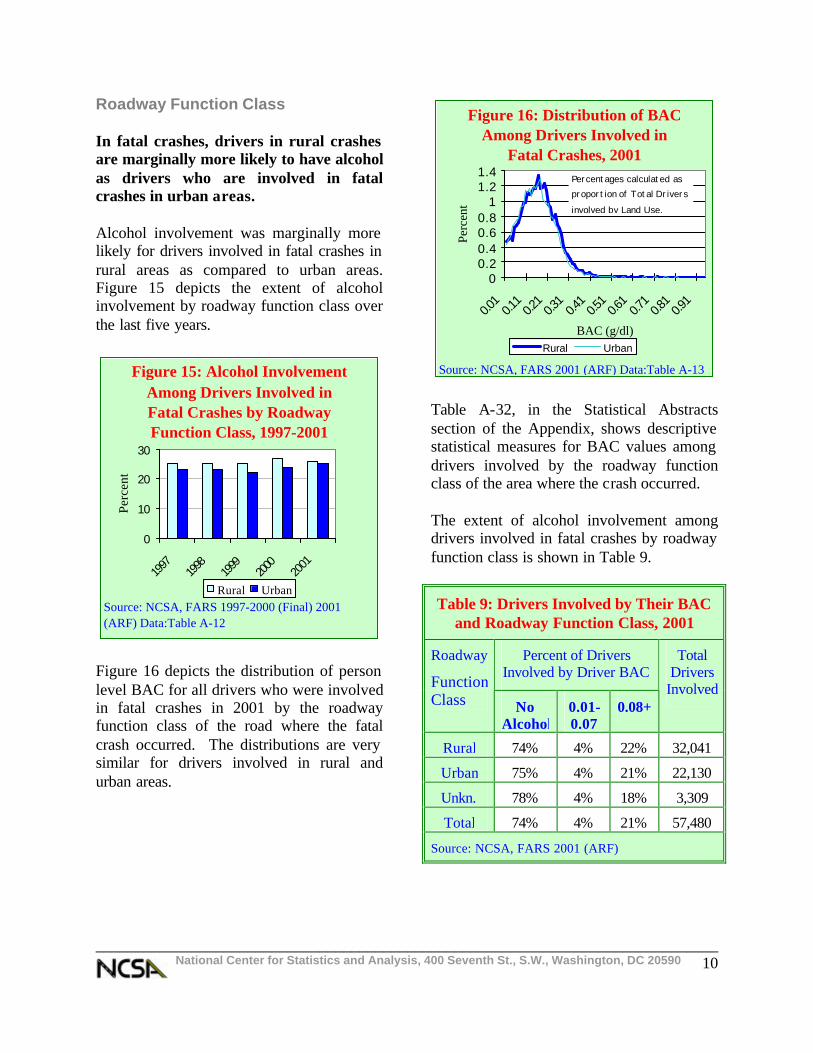
Roadway Function Class In fatal crashes, drivers in rural crashes are marginally more likely to have alcohol as drivers who are involved in fatal crashes in urban areas. Alcohol involvement was marginally more likely for drivers involved in fatal crashes in rural areas as compared to urban areas. Figure 15 depicts the extent of alcohol involvement by roadway function class over the last five years.
Figure 15: Alcohol Involvement Among Drivers Involved in Fatal Crashes by Roadway Function Class, 1997-2001
0
10
20
30
1997
1998
1999
2000
2001
Perc
ent
Rural UrbanSource: NCSA, FARS 1997-2000 (Final) 2001 (ARF) Data:Table A-12
Figure 16 depicts the distribution of person level BAC for all drivers who were involved in fatal crashes in 2001 by the roadway function class of the road where the fatal crash occurred. The distributions are very similar for drivers involved in rural and urban areas.
Figure 16: Distribution of BAC Among Drivers Involved in
Fatal Crashes, 2001
00.20.40.60.8
11.21.4
0.01
0.11
0.21
0.31
0.41
0.51
0.61
0.71
0.81
0.91
BAC (g/dl)
Perc
ent
Rural Urban
Percentages calculated as proportion of Total Drivers involved by Land Use.
Source: NCSA, FARS 2001 (ARF) Data:Table A-13 Table A-32, in the Statistical Abstracts section of the Appendix, shows descriptive statistical measures for BAC values among drivers involved by the roadway function class of the area where the crash occurred. The extent of alcohol involvement among drivers involved in fatal crashes by roadway function class is shown in Table 9.
Table 9: Drivers Involved by Their BAC and Roadway Function Class, 2001
Percent of Drivers Involved by Driver BAC
Roadway
Function Class No
Alcohol 0.01-0.07
0.08+
Total Drivers
Involved
Rural 74% 4% 22% 32,041
Urban 75% 4% 21% 22,130
Unkn. 78% 4% 18% 3,309
Total 74% 4% 21% 57,480
Source: NCSA, FARS 2001 (ARF)

______________________________________________________________________________ National Center for Statistics and Analysis, 400 Seventh St., S.W., Washington, DC 20590
11
Time of the Day Drivers involved in Nighttime fatal crashes are more than four times as likely to have had alcohol as compared drivers involved in daytime fatal crashes. A greater proportion of drivers involved in nighttime crashes tend to have alcohol as compared to those in daytime crashes. Figure 17 depicts the extent of alcohol involvement by the time of the day over the last five years.
Figure 17: Alcohol Involvement Among Drivers Involved in Fatal Crashes by the Time of the Day,
1997-2001
01020304050
1997
1998
1999
2000
2001
Perc
ent
Day Night
Source: NCSA, FARS 1997-2000 (Final), 2001 (ARF) Data:Table A-14
Figure 18 depicts the distribution of person level BAC for all drivers who were involved in fatal crashes in 2001 by the time of the day when the crash occurred.
Figure 18: Distribution of BAC Among Drivers Involved in
Fatal Crashes, 2001
0
0.5
1
1.5
2
2.5
0.01
0.11
0.21
0.31
0.41
0.51
0.61
0.71
0.81
0.91
BAC (g/dl)
Perc
ent
Day Night
Percentages calculated as proportion of Total Drivers involved by Time of the Day
Source: NCSA, FARS 2001 (ARF) Data:Table A-15
Table A-33, in the Statistical Abstracts section of the Appendix, shows descriptive statistical measures for BAC values among drivers involved by the time of the day. The extent of alcohol involvement among drivers involved in fatal crashes by the time of the day is shown in Table 10.
Table 10: Drivers Involved by Their BAC and Time of the Day, 2001
Percent of Drivers Involved by Driver BAC
Time of the Day
No Alcohol
0.01-0.07
0.08+
Total Drivers
Involved
Daytime 89% 2% 8% 31,564
Nighttime 57% 6% 37% 25,611
Total 74% 4% 21% 57,480
Source: NCSA, FARS 2001 (ARF)
Note : Components do not add to totals due to Unknown values.

______________________________________________________________________________ National Center for Statistics and Analysis, 400 Seventh St., S.W., Washington, DC 20590
12
Day of the Week In fatal crashes, drivers in crashes that occur during a weekend are about twice as likely be intoxicated as drivers who are involved in crashes that occur during a weekday. A greater proportion of drivers involved in crashes that occur during the weekend tend to have alcohol as compared to those that occur during the week. Figure 19, which depicts the extent of alcohol involvement by the day of the week over the last five years, shows that a greater proportion of drivers involved in fatal crashes that occur during the weekend tend to have alcohol as compared to drivers involved in fatal crashes that occur during the week.
Figure 19: Alcohol Involvement Among Drivers Involved in
Fatal Crashes by the Day of the Week, 1997-2001
01020304050
1997
1998
1999
2000
2001
Perc
ent
Weekday Weekend
Source: NCSA, FARS 1997-2000 (Final), 2001 (ARF) Data:Table A-16
Figure 20 depicts the distribution of person level BAC for all drivers who were involved in fatal crashes in 2001 by the day of the week when the crash occurred.
Figure 20: Distribution of BAC Among Drivers Involved in
Fatal Crashes, 2001
0
0.5
1
1.5
2
0.01
0.11
0.21
0.31
0.41
0.51
0.61
0.71
0.81
0.91
BAC (g/dl)
Perc
ent
Weekday Weekend
Percentages calculated as proportion of Total Drivers involved by Day of the Week
Source: NCSA, FARS 2001 (ARF) Data:Table A-17
Table A-34, in the Statistical Abstracts section of the Appendix, shows descriptive statistical measures for BAC values among drivers involved by the day of the week. The extent of alcohol involvement among drivers involved in fatal crashes by the day of the week is shown in Table 11.
Table 11: Drivers Involved by Their BAC and Day of the Week, 2001
Percent of Drivers Involved by Driver BAC
Day of the Week
No Alcohol
0.01-0.07
0.08+
Total Drivers
Involved
Weekday 81% 3% 16% 34,918
Weekend 64% 6% 30% 22,462
Total 74% 4% 21% 57,480
Source: NCSA, FARS 2001 (ARF)
Note : Components do not add to totals due to Unknown values.

______________________________________________________________________________ National Center for Statistics and Analysis, 400 Seventh St., S.W., Washington, DC 20590
13
Type of the Crash In fatal crashes, drivers in single vehicle crashes are about three times as likely to be intoxicated as drivers who are involved in multiple vehicle crashes. A greater proportion of drivers involved in single vehicle crashes as compared to multiple vehicle crashes had alcohol. Figure 21 depicts the extent of alcohol involvement by the type of crash over the last five years.
Figure 21: Alcohol Involvement Among Drivers Involved in
Fatal Crashes by the Type of the Crash, 1997-2001
0
10
20
30
40
50
1997
1998
1999
2000
2001
Perc
ent
Single Vehicle Multiple Vehicle
Source: NCSA, FARS 1997-2000 (Final) 2001 (ARF) Data:Table A-18
Figure 22 depicts the distribution of person level BAC for all drivers who were involved in fatal crashes in 2001 by the type of the crash.
Figure 22: Distribution of BAC Among Drivers Involved in
Fatal Crashes, 2001
0
0.5
1
1.5
2
2.5
0.01
0.11
0.21
0.31
0.41
0.51
0.61
0.71
0.81
0.91
BAC (g/dl)
Perc
ent
Single Vehicle Multiple Vehicle
Percentages calculated as proportion of Total Drivers involved by Crash Type
Source: NCSA, FARS 2001 (ARF) Data:Table A-19 Table A-35, in the Statistical Abstracts section of the Appendix, shows descriptive statistical measures for BAC values among drivers involved by Crash Type. The extent of alcohol involvement among drivers involved in fatal crashes by Crash Type is shown in Table 12.
Table 12: Drivers Involved by Their BAC and Crash Type, 2001
Percent of Drivers Involved by Driver BAC
Crash Type
No Alcohol
0.01-0.07
0.08+
Total Drivers
Involved
S. Veh 57% 6% 37% 21,365
M.Veh 85% 3% 12% 36,115
Total 74% 4% 21% 57,480
Source: NCSA, FARS 2001 (ARF)

______________________________________________________________________________ National Center for Statistics and Analysis, 400 Seventh St., S.W., Washington, DC 20590
14
Safety Belt Use In fatal crashes, drivers of passenger vehicles who are unbelted are about four times as likely to be intoxicated as drivers who are wearing safety belts. This section analyzes the extent of alcohol involvement by safety belt use among drivers of passenger vehicles (Cars, Light Trucks and Vans). A greater proportion of drivers who did not use safety belts had alcohol as compared to drivers who used safety belts. Figure 23 depicts the extent of alcohol involvement by the belt use for drivers of passenger vehicle over the last five years.
Figure 23: Alcohol Involvement Among Drivers of Passenger
Vehicles Involved in Fatal Crashes by Safety Belt Use,
1997-2001
01020304050
1997
1998
1999
2000
2001
Perc
ent
Belted Unbelted
Source: NCSA, FARS 1997-2000 (Final), 2001 (ARF) Data:Table A-20
Figure 24 depicts the distribution of person level BAC for all drivers of passenger vehicles who were involved in fatal crashes in 2001 by their safety belt use.
Figure 24: Distribution of BAC Among Drivers of Passenger Vehicles by Their Safety Belt
Use, 2001
00.5
11.5
22.5
3
0.01
0.11
0.21
0.31
0.41
0.51
0.61
0.71
0.81
0.91
BAC (g/dl)
Perc
ent
Unbelted Belted
Percentages calculated as proportion of Total Drivers involved by Belt Use
Source: NCSA, FARS 2001 (ARF) Data:Table A-21
Table A-36, in the Statistical Abstracts section of the Appendix, shows descriptive statistical measures for BAC values among drivers of passenger vehicles involved by their safety belt use. The extent of alcohol involvement among drivers of passenger vehicles involved in fatal crashes by their safety belt use is shown in Table 13.
Table 13: Drivers of Passenger Vehicles Involved by Their BAC and Safety Belt
Use, 2001
Percent of Drivers Involved by Driver BAC
Safety Belt Use
No Alcohol
0.01-0.07
0.08+
Total Drivers
Involved
Used 85% 3% 12% 27,068
Not Used 54% 6% 40% 16,455
Total* 73% 4% 23% 47,882
Source: NCSA, FARS 2001 (ARF)
*Includes Unknown Restraint Use

______________________________________________________________________________ National Center for Statistics and Analysis, 400 Seventh St., S.W., Washington, DC 20590
15
4. Young Drivers This section depicts the extent of alcohol involvement among young drivers (Ages 16-20). The total number of young drivers involved in fatal crashes decreased marginally from 2000 to 2001. The number of such drivers who were intoxicated also decreased marginally. In 2001, the percent of intoxicated drivers among younger drivers involved in fatal crashes ranged from 8 percent for drivers aged 16 to 26 percent for drivers aged 20. Figure 25 shows the percentage of drivers who were intoxicated by the age of the drivers involved.
Figure 25: Percentage of Intoxicated Drivers Among Young Drivers Involved in
Fatal Crashes, 2001
05
1015202530
16 17 18 19 20
Age
Perc
ent
Source: NCSA, FARS 2001 (ARF) Data:Table A-22
5. Pedestrians In 2001, there were 4,790 crashes in which one or more pedestrians were killed. These crashes resulted in 4,882 pedestrian fatalities. Alcohol involvement – whether for the driver or for the pedestrian – was reported in 47 percent of the traffic crashes that result in a pedestrian fatality. Table 14 depicts the extent of alcohol involvement by person-type in crashes where a pedestrian was fatally injured. Of the pedestrians
involved, 33 percent were intoxicated. 15 percent of the drivers involved in such crashes were intoxicated. In 6 percent of such crashes, both the driver and the pedestrian were intoxicated.
Table 14: Alcohol Involvement in Fatal Pedestrian Crashes, 2001
Driver BAC Pedestrian BAC No
Alcohol 0.01-0.07
0.08+ Total
No Alcohol 2,520 (53%)
110 (2%)
360 (8%)
2,990 (62%)
0.01-0.07 170 (4%)
12 (0%)
37 (1%)
219 (5%)
0.08+ 1,184 (25%)
97 (2%)
301 (6%)
1,581 (33%)
Total 3,873 (81%)
219 (5%)
697 (15%)
4,790 (100%)
Source: NCSA, FARS 2001 (ARF)
Pedestrians who were killed in nighttime crashes were about five times more likely to be intoxicated as compared to those who were killed in daytime crashes [Figure 26].
Figure 26: Percentage Intoxicated Among Pedestrians
Killed in Fatal Crashes by Time of the Day, 1997-2001
0
20
40
60
1997
1998
1999
2000
2001
Perc
ent
Day NightSource: NCSA, FARS 1997-2000 (Final), 2001 (ARF) Data:Table A-23

______________________________________________________________________________ National Center for Statistics and Analysis, 400 Seventh St., S.W., Washington, DC 20590
16
6. States This section presents the extent of alcohol involvement individually for the 50 states, the District of Columbia and Puerto Rico (not included in the national totals). Caution should be exercised in comparing the estimates of alcohol involvement among the states. Differences in alcohol involvement can be due to any number of factors not necessarily directly related to a state’s alcohol traffic safety program. For example, the accuracy and the reliability of the estimates presented depend upon the extent of alcohol testing for drivers, pedestrians and pedalcyclists. Figure 27 shows the
extent of alcohol- related fatalities in the U.S by state. The categories represent percentages of all fatalities in a state that were alcohol related. A NHTSA Technical Report (Utter et. al., 2002) shows alcohol-related fatalities and rates per Vehicle Miles of Travel (VMT) by state from 1982 to 2001 and contains state maps of alcohol-related fatalities at the county level. Answers to frequently asked questions regarding differences between the number of alcohol-related fatalities reported by NHTSA and some states are provided in the Appendix. Statistics on alcohol testing among drivers involved in fatal crashes by state are available in NHTSA’s State Alcohol Estimates fact sheet.
Figure 27: Alcohol-related fatalities as a percent of all fatalities in the U.S., 2001

______________________________________________________________________________ National Center for Statistics and Analysis, 400 Seventh St., S.W., Washington, DC 20590
17
7. Repeat Offenders (Recidivism) In fatal crashes, drivers with prior DWI (Driving While Intoxicated) convictions are more than three times as likely to be intoxicated as compared to those that do not have any prior DWI convictions. Recidivism with respect to alcohol is coded in the Previous-DWI variable in FARS. The number of previously recorded DWI convictions that occurred within the last three years of the crash is coded in this variable. This section presents the extent of repeat offenders in fatal crashes that were alcohol related. Drivers with one or more prior DWI convictions were more than twice as likely to be intoxicated when involved in a fatal crash. In 2001, among drivers with no prior DWI convictions, 20 percent were intoxicated as compared to 62 percent of those drivers who had one or more prior DWI convictions. Table 15 shows these proportions from 1997 to 2001. Table 15: Extent of Intoxication Among
Drivers involved in Fatal Crashes by Prior Convictions of the Driver, 1997-
2001 Year
No Prior DWI
Convictions
Prior DWI Convictions
1997 19% 63% 1998 19% 61% 1999 19% 63% 2000 20% 63% 2001 20% 62% Source: NCSA, FARS 1997-2000 (Final), 2001 (ARF)
Figure 28 shows the percentage of drivers who were intoxicated and who had a prior driving record in the form of a crash, citation(s) for speeding, or prior suspensions.
Figure 28: Intoxication Among Drivers by Prior Convictions,
FARS 2001
0 20 40 60 80Percent
Yes No
Previous Suspensions
Previous Crashes
Previous Speeding
Previous DWI
Source: NCSA, FARS 2001 (ARF) Data:Table A-25
As seen in Figure 28, drivers involved in fatal crashes who also had a prior DWI or prior suspensions were more than twice as likely to be intoxicated as compared to those that had a prior crash or speeding conviction. In 2001, as a proportion of all drivers who consumed any alcohol (0.01+), about 14 percent had a prior DWI conviction. Figure 29 shows the same proportion over the last five years.

______________________________________________________________________________ National Center for Statistics and Analysis, 400 Seventh St., S.W., Washington, DC 20590
18
Figure 29: Alcohol-Involved Drivers with Prior DWI
Convictions as a Proportion of all Drivers with Alcohol, 1997-
2001
0
2
4
6
8
10
1997
1998
1999
2000
2001
Age
Perc
ent
Source: NCSA, FARS 1997-2000 (Final), 2001 (ARF) Data:Table A-26
Figure 30 depicts the distribution of BAC for all drivers who were involved in fatal crashes in 2001 by prior DWI convictions.
Figure 30: Distribution of BAC Among Drivers Involved in
Fatal Crashes, 2001
0
1
2
3
4
0.01
0.11
0.21
0.31
0.41
0.51
0.61
0.71
0.81
0.91
BAC (g/dl)
Perc
ent
None Prior DWI
Percentages calculated as proportion of Total Drivers involved by Prior DWI Convictions
Source: NCSA, FARS 2001 (ARF) Data:Table A-27
`
As seen in Figure 29, conditional on being involved in a fatal crash, drivers with prior DWI convictions are more likely to test
positive for alcohol as compared to drivers who have had no prior DWI convictions. Table A-37 in the Statistical Abstracts section of the Appendix shows descriptive statistical measures for BAC values among drivers involved by prior DWI convictions. The extent of alcohol involvement among drivers involved in fatal crashes by prior DWI Convictions is shown in Table 14.
Table 16: Drivers Involved by Their BAC and Prior DWI Convictions, 2001
Percent of Drivers Involved by Driver
BAC
Prior DWI Convictions
No Alcohol
0.01-0.07
0.08+
Total Drivers
Involved
None 76% 4% 20% 53,321
1 or more 32% 6% 62% 1,888
Total 74% 4% 21% 57,480
Source: NCSA, FARS 2001 (ARF)
Note : Components do not add to totals due to Unknown values.

______________________________________________________________________________ National Center for Statistics and Analysis, 400 Seventh St., S.W., Washington, DC 20590
19
8. Conclusions About 41 percent of all fatalities in the U.S. in 2001 occurred in crashes that were alcohol-related. This continues an upward trend in alcohol-related fatalities that began in 2000 – the first time in ten years, in which there was an increase in such fatalities. Although alcohol involvement cannot be interpreted as a direct causal relationship between alcohol use and any other attribute of fatal crashes, it does provide insight into the extent of impaired driving along various categories that are of interest to those involved in policy-making or in directing impaired-driving countermeasures.
Alcohol-related fatalities are at a five-year high in 2001, after a decade of sustained decreases. The increase in alcohol involvement cannot be particularly traced to one cross-section of the driving population or specific environmental characteristics surrounding the crash. The increase in the overall number of fatalities is also reflected in corresponding increases in alcohol involvement among various categories of interest.

______________________________________________________________________________ National Center for Statistics and Analysis, 400 Seventh St., S.W., Washington, DC 20590
20
References
1. Klein, T.M., (1986) A Method for estimating Posterior BAC distributions for persons involved in fatal traffic accidents. Report DOT-HS-807-094, National Highway Traffic Safety Administration, Department of Transportation.
2. NHTSA (2002) Traffic Safety Facts
– Alcohol. 3. Rubin, D.B. (1987) Multiple
Imputation of Nonresponse in Surveys. J.Wiley and Sons, New York.
4. Rubin, D.B, Shafer, J.L. and
Subramanian, R. (1998) Multiple Imputation of Missing Blood Alcohol Concentration (BAC) Values in FARS. Report DOT-HS-808-816, National Highway Traffic Safety Administration, Department of Transportation.
5. Subramanian, R. (2002)
Transitioning to Multiple Imputation – A New Method to Impute Missing Blood Alcohol Concentration (BAC) values in FARS.
6. Utter, D.E., Subramanian, R. and
Deutermann, W. (2002) State Alcohol Related Fatality Rates. Report DOT-HS-809-528, National Highway Traffic Safety Administration, Department of Transportation.
Glossary Actively Involved Persons These include all drivers or nonoccupants involved in a fatal crash. Nonoccupants include pedestrians and pedalcyclists. The term “actively- involved” qualifies persons whose actions and characteristics are significant determinants of the crash. Alcohol Related Crashes A Crash is said to be alcohol-related if any one of the actively- involved persons in a police-reported fatal traffic crash had a BAC of 0.01 g/dl or greater (0.01+). Alcohol Related Fatalities A fatality is said to be alcohol-related if it occurred in a crash where any one of the actively- involved persons in the crash had a BAC of 0.01 g/dl or greater. Any Alcohol
A positive BAC value (BAC=0.01+) for any driver or nonoccupant in the crash. ARF
Annual Report File of the Fatality Analysis Reporting System. A compilation of preliminary data on fatal motor vehicle traffic crashes each year in the U.S. BAC The Blood Alcohol Concentration (BAC) that is determined either by police-administered tests on surviving persons or from the medical records of fatally- injured
______________________________________________________________________________ National Center for Statistics and Analysis, 400 Seventh St., S.W., Washington, DC 20590
21
persons. BAC is usually measured in grams per deciliter (g/dl) of blood and plausible values in FARS range from 0.00 to 0.94+ g/dl. Crash BAC The highest BAC among all the actively- involved persons in the crash. For example, in a crash involving a vehicle and a pedestrian, if the driver of the vehicle had a BAC of 0.01 g/dl and the pedestrian had a BAC of 0.11 g/dl, the Crash BAC is 0.11 g/dl. Discriminant Analysis A multivariate statistical technique for estimating linear functions of variables, and using these linear functions to calculate the (posterior) probability to each of several mutually exclusive groups. Driver BAC The BAC of any driver in in a crash. Imputation A procedure used to fill in missing data using statistical procedures. These procedures use the cases with known BAC values to learn about the variables that show significant relationship with the extent of BAC. This knowledge is in turn used on the characteristics of cases with missing BAC to “estimate” a value of BAC. Impairment (Impaired) For the purposes of this document, a person is said to be impaired if their BAC is between 0.01 and 0.07 g/dl (0.01-0.07).
Injury Severity Presented as fatal or surviving. Any injury code other than fatal is treated as surviving. Intoxication (Intoxicated) For the purposes of this document, a person is said to be intoxicated if their BAC is 0.08 g/dl or greater (0.08+). Multiple Imputation A peer-reviewed, well-accepted statistical procedure to estimate missing BAC. Each missing BAC is replaced with “multiple” BAC values which are then combined to estimate extent of alcohol involvement. Enables reporting of errors, confidence intervals, etc. Nonoccupant Any person involved in a crash who is not the occupant of a motor vehicle. Pedestrians, pedal-cyclists, persons on roller-blades, skateboards, etc., are nonoccupants. Person BAC The BAC of a driver, pedestrian or pedalcyclist. Prior DWI Convictions Counts prior alcohol/drug convictions within three years from crash date

______________________________________________________________________________ National Center for Statistics and Analysis, 400 Seventh St., S.W., Washington, DC 20590
22
Recidivism The tendency to repeatedly relapse into a criminal or delinquent habit such as Driving While Intoxicated (DWI). Rural/Urban Land Use based on Federal Highway Administration classification.
Weekday From 6 a.m. Monday to 5:59 p.m. Friday. .
Weekend From 6 p.m. Friday to 5:59 a.m. Monday.

______________________________________________________________________________ National Center for Statistics and Analysis, 400 Seventh St., S.W., Washington, DC 20590
23
Appendix
Table A-1: Alcohol-Related Fatalities by Crash BAC Levels, FARS 1982-2001
Total No Alcohol 0.01-0.07 0.08+ 0.01+ Year
Num Num Percent Num Percent Num Percent Num Percent
1982 43,945 17,773 40 2,927 7 23,246 53 26,173 60
1983 42,589 17,955 42 2,594 6 22,041 52 24,635 58
1984 44,257 19,496 44 3,046 7 21,715 49 24,762 56
1985 43,825 20,659 47 3,081 7 20,086 46 23,167 53
1986 46,087 21,070 46 3,546 8 21,471 47 25,017 54
1987 46,390 22,297 48 3,398 7 20,696 45 24,094 52
1988 47,087 23,254 49 3,234 7 20,599 44 23,833 51
1989 45,582 23,159 51 2,893 6 19,531 43 22,424 49
1990 44,599 22,012 49 2,980 7 19,607 44 22,587 51
1991 41,508 21,349 51 2,560 6 17,599 42 20,159 49
1992 39,250 20,960 53 2,443 6 15,847 40 18,290 47
1993 40,150 22,242 55 2,361 6 15,547 39 17,908 45
1994 40,716 23,409 57 2,322 6 14,985 37 17,308 43
1995 41,817 24,085 58 2,490 6 15,242 36 17,732 42
1996 42,065 24,316 58 2,486 6 15,263 36 17,749 42
1997 42,013 25,302 60 2,290 5 14,421 34 16,711 40
1998 41,501 24,828 60 2,465 6 14,207 34 16,673 40
1999 41,717 25,145 60 2,321 6 14,250 34 16,572 40
2000 41,945 24,565 59 2,511 6 14,870 35 17,380 41
2001 42,116 24,668 59 2,515 6 14,933 35 17,448 41
Source: NCSA, FARS 1982-2000 (Final), 2001 (ARF)

______________________________________________________________________________ National Center for Statistics and Analysis, 400 Seventh St., S.W., Washington, DC 20590
24
Table A-2: Fatalities by Role in Crashes Where the Highest BAC in the Crash was 0.08 and Above, FARS 1982-2001
Intox. Drivers
Nonintox. Drivers Passengers
Intoxicated Nonoccs
Nonint. Nonocc Total Year
Num % Num % Num % Num % Num % Num
1982 12,139 52 1,636 7 5,264 23 2,943 13 1,264 5 23,246
1983 11,543 52 1,581 7 5,118 23 2,695 12 1,104 5 22,041
1984 11,499 53 1,659 8 4,781 22 2,652 12 1,124 5 21,715
1985 10,685 53 1,509 8 4,452 22 2,473 12 967 5 20,086
1986 11,409 53 1,634 8 4,938 23 2,466 11 1,024 5 21,471
1987 11,058 53 1,640 8 4,671 23 2,368 11 959 5 20,696
1988 11,103 54 1,541 7 4,682 23 2,366 11 907 4 20,599
1989 10,637 54 1,392 7 4,322 22 2,365 12 815 4 19,531
1990 10,395 53 1,431 7 4,536 23 2,337 12 908 5 19,607
1991 9,485 54 1,221 7 4,028 23 2,107 12 758 4 17,599
1992 8,452 53 1,132 7 3,627 23 2,028 13 608 4 15,847
1993 8,322 54 1,111 7 3,398 22 2,071 13 645 4 15,547
1994 7,913 53 1,167 8 3,345 22 1,890 13 670 4 14,985
1995 8,307 55 1,054 7 3,264 21 1,996 13 622 4 15,242
1996 8,175 54 1,017 7 3,491 23 1,997 13 583 4 15,263
1997 7,843 54 1,017 7 3,201 22 1,832 13 528 4 14,421
1998 7,834 55 920 6 3,042 21 1,887 13 524 4 14,207
1999 7,918 56 951 7 3,063 21 1,864 13 454 3 14,250
2000 8,167 55 1,084 7 3,378 23 1,736 12 505 3 14,870
2001 8,308 56 1,034 7 3,253 22 1,770 12 569 4 14,933
Source: NCSA, FARS 1982-2000 (Final), 2001 (ARF)

______________________________________________________________________________ National Center for Statistics and Analysis, 400 Seventh St., S.W., Washington, DC 20590
25
Table A-3: Distribution of BAC Among Drivers Involved in Fatal Crashes, 2001
Drivers Involved BAC (g/dl) Number Percent*
0 42,774 74.42 .01 270 0.47 .02 290 0.50 .03 311 0.54 .04 325 0.56 .05 386 0.67 .06 410 0.71 .07 423 0.74 .08 491 0.85 .09 550 0.96 .10 591 1.03 .11 632 1.10 .12 633 1.10 .13 625 1.09 .14 673 1.17 .15 659 1.15 .16 738 1.28 .17 691 1.20 .18 638 1.11 .19 647 1.12 .20 606 1.05 .21 558 0.97 .22 503 0.87 .23 443 0.77 .24 438 0.76 .25 381 0.66 .26 330 0.57 .27 286 0.50 .28 222 0.39 .29 188 0.33 .30 149 0.26 .31 112 0.20 .32 89 0.15 .33 76 0.13 .34 64 0.11 .35 49 0.08 .36 43 0.08 .37 42 0.07 .38 20 0.03 .39 23 0.04
.40 & Above 105 0.18 *As a percent of all Drivers involved in Category Source: NCSA, FARS 2001 (ARF)

______________________________________________________________________________ National Center for Statistics and Analysis, 400 Seventh St., S.W., Washington, DC 20590
26
Table A-4: Alcohol Involvement Among Drivers Involved by Injury Severity of the Driver and the Driver’s BAC, 1982-2001
Fatally Injured Drivers Surviving Drivers
Total BAC=0.01+ BAC=0.08+ Total BAC=0.01+ BAC=0.08+ Year
Number Percent Number Percent Number Percent Number Percent Number Percent Number Percent
1982 24,690 100 13,675 55 12,139 49 31,339 100 9,152 29 7,537 24 1983 24,138 100 12,949 54 11,543 48 30,518 100 8,633 28 7,223 24
1984 25,589 100 13,113 51 11,499 45 31,923 100 8,556 27 6,936 22 1985 25,337 100 12,377 49 10,685 42 32,546 100 7,625 23 6,174 19 1986 26,630 100 13,287 50 11,409 43 33,705 100 8,440 25 6,681 20 1987 26,833 100 12,780 48 11,058 41 34,609 100 8,039 23 6,426 19 1988 27,253 100 12,835 47 11,103 41 35,000 100 7,730 22 6,165 18 1989 26,389 100 12,143 46 10,637 40 34,046 100 6,853 20 5,552 16 1990 25,750 100 11,892 46 10,395 40 33,143 100 7,561 23 6,092 18 1991 23,930 100 10,792 45 9,485 40 30,461 100 6,304 21 5,059 17
1992 22,584 100 9,678 43 8,452 37 29,317 100 5,639 19 4,467 15 1993 23,142 100 9,490 41 8,322 36 30,259 100 5,401 18 4,254 14 1994 23,691 100 9,079 38 7,913 33 30,858 100 5,528 18 4,449 14 1995 24,390 100 9,549 39 8,307 34 31,774 100 5,141 16 4,059 13 1996 24,534 100 9,401 38 8,175 33 32,467 100 5,309 16 4,173 13 1997 24,667 100 8,997 36 7,843 32 32,021 100 4,763 15 3,736 12 1998 24,743 100 9,005 36 7,834 32 31,861 100 4,835 15 3,727 12
1999 25,257 100 9,131 36 7,918 31 31,245 100 4,513 14 3,529 11 2000 25,567 100 9,451 37 8,167 32 31,713 100 5,186 16 4,094 13 2001 25,840 100 9,573 37 8,308 32 31,640 100 5,133 16 3,985 13
Source: NCSA, FARS 1982-2000 (Final), 2001 (ARF)

______________________________________________________________________________ National Center for Statistics and Analysis, 400 Seventh St., S.W., Washington, DC 20590
27
Table A-5: BAC Distributions of Drivers Involved in Fatal Crashes by Injury Severity, 2001
Fatally Injured Drivers Surviving Drivers BAC Number Percent* Number Percent*
0 16,267 74.48 26,507 83.78 .01 168 0.77 102 0.32 .02 174 0.80 116 0.37 .03 170 0.78 141 0.45 .04 155 0.71 169 0.53 .05 193 0.88 193 0.61 .06 197 0.90 213 0.67 .07 208 0.95 215 0.68 .08 229 1.05 262 0.83 .09 291 1.33 259 0.82 .10 321 1.47 270 0.85 .11 342 1.57 290 0.92 .12 358 1.64 274 0.87 .13 351 1.61 274 0.87 .14 408 1.87 266 0.84 .15 414 1.89 245 0.77 .16 512 2.34 226 0.72 .17 472 2.16 219 0.69 .18 446 2.04 192 0.61 .19 473 2.16 174 0.55 .20 440 2.02 165 0.52 .21 418 1.91 140 0.44 .22 382 1.75 121 0.38 .23 339 1.55 104 0.33 .24 348 1.59 90 0.28 .25 306 1.40 74 0.23 .26 266 1.22 64 0.20 .27 227 1.04 59 0.19 .28 174 0.80 48 0.15 .29 163 0.75 25 0.08 .30 120 0.55 29 0.09 .31 92 0.42 20 0.06 .32 71 0.33 17 0.05 .33 65 0.30 11 0.04 .34 52 0.24 11 0.04 .35 39 0.18 10 0.03 .36 34 0.16 9 0.03 .37 36 0.16 6 0.02 .38 15 0.07 5 0.01 .39 18 0.08 6 0.02
.40 + 87 0.40 18 0.06 *As a percent of all Drivers involved in Category Source: NCSA, FARS 2001 (ARF)

______________________________________________________________________________ National Center for Statistics and Analysis, 400 Seventh St., S.W., Washington, DC 20590
28
Table A-6: Alcohol Involvement Among Drivers Involved by Gender of the Driver and the
Driver’s BAC, 1982-2001
Gender of the Driver
Male Female Unknown Total
Total BAC =0.01+ Total BAC =0.01+ Total BAC =0.01+ Total BAC =0.01+ Year
Num Num % Num Num % Num Num % Num Num %
1982 44,370 19,478 44 10,675 2,854 27 984 496 50 56,029 22,827 41
1983 42,812 18,374 43 10,958 2,737 25 886 470 53 54,656 21,582 39
1984 44,723 18,417 41 11,907 2,921 25 882 331 37 57,512 21,669 38
1985 44,846 17,001 38 12,142 2,679 22 895 323 36 57,883 20,003 35
1986 46,653 18,459 40 12,744 2,774 22 938 494 53 60,335 21,727 36
1987 46,884 17,518 37 13,614 2,909 21 944 391 41 61,442 20,818 34
1988 47,402 17,446 37 13,951 2,799 20 900 320 36 62,253 20,565 33
1989 45,448 16,037 35 14,054 2,696 19 933 264 28 60,435 18,997 31
1990 44,281 16,408 37 13,726 2,741 20 886 305 34 58,893 19,453 33
1991 40,731 14,350 35 12,825 2,434 19 835 312 37 54,391 17,096 31
1992 38,598 12,873 33 12,596 2,297 18 707 146 21 51,901 15,317 30
1993 39,556 12,471 32 13,082 2,178 17 763 242 32 53,401 14,891 28
1994 40,233 12,105 30 13,567 2,279 17 749 222 30 54,549 14,606 27
1995 41,235 12,178 30 14,184 2,255 16 745 256 34 56,164 14,690 26
1996 41,376 12,142 29 14,850 2,382 16 775 185 24 57,001 14,709 26
1997 40,954 11,381 28 14,954 2,215 15 780 163 21 56,688 13,759 24
1998 40,816 11,345 28 15,089 2,262 15 699 233 33 56,604 13,840 24
1999 41,012 11,399 28 14,835 2,116 14 655 130 20 56,502 13,644 24
2000 41,795 12,070 29 14,790 2,402 16 695 164 24 57,280 14,637 26
2001 41,711 12,082 29 14,867 2,311 16 902 313 35 57,480 14,706 26
Source: NCSA, FARS 1982-2000 (Final), 2001 (ARF)

______________________________________________________________________________ National Center for Statistics and Analysis, 400 Seventh St., S.W., Washington, DC 20590
29
Table A-7: BAC Distributions of Drivers Involved in
Fatal Crashes by Gender , FARS 2001 Drivers Involved
Male Female
BAC Number Percent* Number Percent*
0 29,629 71.03 12,556 84.49 .01 214 0.51 53 0.36 .02 235 0.56 49 0.33 .03 253 0.61 49 0.33 .04 262 0.63 49 0.33 .05 299 0.72 73 0.49 .06 325 0.78 67 0.45 .07 340 0.81 68 0.45 .08 393 0.94 80 0.54 .09 458 1.10 73 0.49 .10 474 1.14 98 0.66 .11 512 1.23 101 0.68 .12 518 1.24 99 0.66 .13 509 1.22 100 0.67 .14 563 1.35 96 0.65 .15 543 1.30 104 0.70 .16 616 1.48 111 0.75 .17 577 1.38 103 0.69 .18 521 1.25 106 0.72 .19 537 1.29 99 0.67 .20 521 1.25 78 0.53 .21 468 1.12 83 0.56 .22 414 0.99 82 0.55 .23 366 0.88 71 0.48 .24 360 0.86 72 0.49 .25 323 0.77 53 0.36 .26 278 0.67 49 0.33 .27 228 0.55 55 0.37 .28 178 0.43 41 0.28 .29 155 0.37 31 0.21 .30 126 0.30 22 0.15 .31 93 0.22 18 0.12 .32 76 0.18 11 0.07 .33 64 0.15 12 0.08 .34 56 0.13 7 0.05 .35 40 0.10 8 0.05 .36 37 0.09 6 0.04 .37 31 0.07 10 0.07 .38 14 0.03 6 0.04 .39 20 0.05 4 0.02
.40 + 87 0.21 17 0.11 *As a percent of all Drivers involved in Category Source: NCSA, FARS 2001 (ARF)

______________________________________________________________________________ National Center for Statistics and Analysis, 400 Seventh St., S.W., Washington, DC 20590
30
Table A-8: Alcohol Involvement Among Drivers Involved by Age of the Driver and the Driver’s BAC, 1982-2001
Age of the Driver
16-20 21-24 25-34 35-44 45-64 65+ Unknown Total
Total 0.01+ Total 0.01+ Total 0.01+ Total 0.01+ Total 0.01+ Total 0.01+ Total 0.01+ Total 0.01+ Year
Num % Num % Num % Num % Num % Num % Num % Num %
1982 9,858 45 9,018 53 14,787 46 7,984 38 8,921 29 3,894 15 1,567 41 56,029 41 1983 9,334 43 8,432 53 14,470 46 8,068 37 8,854 26 4,026 13 1,472 43 54,656 39 1984 9,804 40 8,963 52 15,233 44 8,563 35 9,143 25 4,316 14 1,490 33 57,512 38 1985 9,386 35 9,046 47 15,257 42 8,892 32 9,262 23 4,479 12 1,561 32 57,883 35 1986 10,163 37 9,129 49 16,179 43 9,240 33 9,096 23 4,881 12 1,647 41 60,335 36 1987 9,910 33 8,808 47 16,562 43 9,778 32 9,693 21 5,078 11 1,613 34 61,442 34 1988 10,171 33 8,555 47 16,398 42 10,077 32 10,081 21 5,376 11 1,595 30 62,253 33 1989 9,442 30 7,723 45 15,928 40 10,106 32 10,240 21 5,431 10 1,565 25 60,435 31 1990 8,821 33 7,195 46 15,764 43 10,177 33 9,935 21 5,501 10 1,500 31 58,893 33 1991 8,002 30 6,748 45 14,151 41 9,482 32 9,153 20 5,471 9 1,384 31 54,391 31 1992 7,192 27 6,323 42 13,049 40 9,284 31 9,360 20 5,474 10 1,219 21 51,901 30 1993 7,256 24 6,406 40 13,038 37 9,738 30 9,794 20 5,848 8 1,321 26 53,401 28 1994 7,723 24 6,291 39 12,891 36 9,951 29 10,321 19 6,061 9 1,311 25 54,549 27 1995 7,725 21 6,263 38 13,048 35 10,677 30 10,894 19 6,240 8 1,317 27 56,164 26 1996 7,824 23 6,205 38 12,889 34 10,955 29 11,364 19 6,387 9 1,377 21 57,001 26 1997 7,719 22 5,705 36 12,453 32 10,904 29 11,916 18 6,715 8 1,276 18 56,688 24 1998 7,767 22 5,613 37 11,925 32 11,241 28 12,168 18 6,690 8 1,200 28 56,604 24 1999 7,985 22 5,639 38 11,763 32 11,059 28 12,316 18 6,597 8 1,143 18 56,502 24 2000 8,024 24 5,950 38 11,739 33 11,132 30 13,000 19 6,281 8 1,154 22 57,280 26 2001 7,963 23 6,016 39 11,534 33 11,201 30 13,005 19 6,421 8 1,340 30 57,480 26
Source: NCSA, FARS 1982-2000 (Final), 2001 (Annual Report File)

______________________________________________________________________________ National Center for Statistics and Analysis, 400 Seventh St., S.W., Washington, DC 20590
31
Table A-9: BAC Distribution of Drivers Involved in Fatal Crashes by Age, 2001
Drivers involved by BAC level as a percentage of all drivers in age-group BAC 16-20 21-24 25-34 35-44 45-64 65+
0 76.91 60.58 67.41 70.36 80.72 92.18 .01 0.62 0.60 0.42 0.41 0.44 0.48 .02 0.63 0.59 0.61 0.48 0.39 0.36 .03 0.58 0.86 0.67 0.64 0.28 0.22 .04 0.68 1.01 0.59 0.57 0.32 0.31 .05 0.99 1.05 0.70 0.64 0.42 0.29 .06 0.88 1.24 0.83 0.72 0.43 0.19 .07 0.91 1.14 0.84 0.77 0.46 0.27 .08 1.19 1.34 1.04 0.83 0.46 0.32 .09 1.12 1.77 1.16 0.87 0.61 0.31 .10 1.22 1.58 1.30 0.99 0.71 0.35 .11 1.37 2.07 1.32 1.05 0.63 0.35 .12 1.12 1.74 1.43 1.21 0.75 0.30 .13 1.20 2.11 1.37 1.02 0.67 0.34 .14 1.11 1.76 1.49 1.41 0.84 0.35 .15 1.05 2.14 1.56 1.21 0.78 0.22 .16 1.17 2.13 1.80 1.32 0.94 0.37 .17 1.14 1.88 1.56 1.33 0.89 0.40 .18 0.80 1.80 1.48 1.49 0.74 0.27 .19 0.86 1.70 1.48 1.37 0.94 0.25 .20 0.74 1.52 1.45 1.36 0.83 0.28 .21 0.70 1.43 1.45 1.09 0.76 0.28 .22 0.64 1.18 1.20 1.19 0.66 0.23 .23 0.50 1.15 1.06 1.02 0.62 0.15 .24 0.37 1.16 0.99 1.05 0.70 0.14 .25 0.33 0.93 0.91 0.92 0.57 0.18 .26 0.20 0.84 0.72 0.83 0.56 0.17 .27 0.20 0.62 0.71 0.62 0.53 0.14 .28 0.16 0.34 0.51 0.61 0.40 0.08 .29 0.16 0.49 0.42 0.39 0.36 0.06 .30 0.10 0.29 0.26 0.48 0.27 0.04 .31 0.07 0.21 0.25 0.30 0.22 0.01 .32 0.05 0.21 0.14 0.23 0.19 0.05 .33 0.03 0.09 0.13 0.28 0.16 0.00 .34 0.04 0.10 0.15 0.13 0.15 0.00 .35 0.04 0.06 0.11 0.16 0.08 0.01 .36 0.01 0.08 0.10 0.11 0.09 0.01 .37 0.02 0.05 0.07 0.11 0.12 0.01 .38 0.01 0.02 0.06 0.06 0.03 0.01 .39 0.00 0.04 0.05 0.10 0.03 0.00
.40 + 0.10 0.12 0.19 0.29 0.25 0.02 *As a percent of all Drivers involved in Category Source: NCSA, FARS 2001 (ARF)

______________________________________________________________________________ National Center for Statistics and Analysis, 400 Seventh St., S.W., Washington, DC 20590
32
Table A-10: Alcohol Involvement Among Drivers Involved by the Vehicle Type and the Driver’s BAC, 1982-2001
Vehicle Type
Passenger Cars
Light Trks and Vans
Large Trucks Motorcycles
Other/ Unknown Total
Total 0.01
+ Total 0.01
+ Total 0.01+ Total 0.01+ Total 0.01
+ Total 0.01+
Year
Num % Num % Num % Num % Num % Num %
1982 34,121 42 11,199 44 4,582 10 4,490 55 1,637 37 56,029 41
1983 33,069 40 11,017 43 4,790 10 4,288 57 1,492 37 54,656 39 1984 34,395 39 11,866 41 5,056 9 4,650 55 1,545 33 57,512 38 1985 34,071 36 12,372 37 5,091 7 4,598 53 1,751 28 57,883 35 1986 35,959 36 13,208 38 5,015 7 4,558 56 1,595 43 60,335 36 1987 36,371 35 14,407 37 5,046 5 4,061 51 1,557 32 61,442 34 1988 36,769 34 15,167 37 5,141 6 3,704 51 1,472 28 62,253 33 1989 35,204 32 15,579 35 4,903 4 3,182 53 1,567 23 60,435 31 1990 33,893 34 15,501 36 4,709 5 3,269 52 1,521 25 58,893 33
1991 31,102 31 14,702 35 4,291 4 2,816 52 1,480 32 54,391 31 1992 29,670 30 14,540 33 3,980 3 2,435 49 1,276 18 51,901 30 1993 30,060 28 15,207 31 4,271 4 2,471 45 1,392 26 53,401 28 1994 30,103 28 16,235 29 4,592 3 2,330 41 1,289 21 54,549 27 1995 30,773 27 17,483 29 4,410 4 2,262 42 1,236 25 56,164 26 1996 30,595 27 18,118 28 4,703 3 2,175 43 1,410 18 57,001 26 1997 29,896 26 18,502 26 4,859 3 2,159 41 1,272 17 56,688 24
1998 28,907 26 19,247 26 4,905 2 2,333 41 1,212 26 56,604 24 1999 27,878 25 19,865 26 4,868 3 2,528 40 1,363 17 56,502 24 2000 27,661 28 20,393 26 4,948 3 2,971 40 1,307 19 57,280 26 2001 27,287 27 20,595 27 4,749 2 3,245 37 1,604 27 57,480 26
Source: NCSA, FARS 1982-2000 (Final), 2001 (ARF)

______________________________________________________________________________ National Center for Statistics and Analysis, 400 Seventh St., S.W., Washington, DC 20590
33
Table A-11: BAC Distribution of Drivers involved in Fatal Crashes by Vehicle -Type, FARS 2001
Drivers as a percent of all drivers in Vehicle -Type BAC Cars Vans SUVs Pickups Large
Trucks Motorcycles
0 72.83 83.68 73.47 69.14 97.53 63.29 .01 0.48 0.37 0.52 0.44 0.28 0.83 .02 0.52 0.42 0.33 0.60 0.22 0.80 .03 0.51 0.42 0.57 0.49 0.25 1.28 .04 0.59 0.41 0.49 0.51 0.19 1.02 .05 0.75 0.41 0.72 0.60 0.14 1.06 .06 0.72 0.46 0.67 0.75 0.14 1.39 .07 0.72 0.53 0.80 0.85 0.11 1.30 .08 0.87 0.66 0.70 1.03 0.06 1.47 .09 1.03 0.60 0.94 1.02 0.07 1.65 .10 1.12 0.69 1.02 1.07 0.10 1.61 .11 1.20 0.54 1.18 1.20 0.06 1.69 .12 1.24 0.59 0.94 1.20 0.10 1.96 .13 1.22 0.61 1.06 1.28 0.03 1.34 .14 1.24 0.71 1.04 1.49 0.03 1.90 .15 1.30 0.59 1.03 1.30 0.04 1.77 .16 1.36 0.65 1.30 1.66 0.05 2.16 .17 1.35 0.70 1.18 1.37 0.05 1.83 .18 1.19 0.56 1.14 1.48 0.02 1.41 .19 1.17 0.68 1.10 1.55 0.07 1.46 .20 1.10 0.78 1.05 1.41 0.01 1.24 .21 1.08 0.47 1.02 1.19 0.08 1.41 .22 0.93 0.49 1.00 1.21 0.05 0.83 .23 0.78 0.62 0.98 1.03 0.04 0.83 .24 0.85 0.48 0.79 0.98 0.05 0.82 .25 0.66 0.35 0.82 0.97 0.03 0.76 .26 0.63 0.49 0.64 0.68 0.05 0.62 .27 0.53 0.25 0.68 0.69 0.05 0.37 .28 0.38 0.25 0.63 0.49 0.03 0.45 .29 0.37 0.35 0.38 0.38 0.00 0.18 .30 0.24 0.19 0.38 0.42 0.00 0.19 .31 0.18 0.24 0.27 0.27 0.01 0.17 .32 0.15 0.11 0.20 0.21 0.02 0.18 .33 0.13 0.08 0.13 0.22 0.00 0.14 .34 0.11 0.13 0.10 0.16 0.00 0.12 .35 0.09 0.03 0.08 0.12 0.00 0.12 .36 0.07 0.09 0.09 0.13 0.00 0.06 .37 0.06 0.12 0.10 0.11 0.00 0.06 .38 0.04 0.01 0.04 0.06 0.00 0.01 .39 0.04 0.04 0.11 0.03 0.00 0.02
.40 + 0.18 0.17 0.29 0.21 0.02 0.22 *As a percent of all Drivers involved in Category Source: NCSA, FARS 2001 (ARF)

______________________________________________________________________________ National Center for Statistics and Analysis, 400 Seventh St., S.W., Washington, DC 20590
34
Table A-12: Alcohol Involvement Among Drivers Involved by Roadway Function Class, 1982-2001
Rural Urban Unknown
Total .01+ .08+ Total .01+ .08+ Total .01+ .08+ Year
Number % Number % Number % Number % Number % Number % Number % Number % Number %
1982 24,673 100 9,728 39 8,344 34 31,012 100 12,985 42 11,231 36 344 100 115 33 101 29
1983 24,219 100 9,347 39 8,092 33 30,338 100 12,196 40 10,639 35 99 100 39 39 35 35
1984 25,160 100 9,231 37 7,841 31 32,312 100 12,420 38 10,577 33 40 100 18 46 17 43
1985 25,786 100 8,658 34 7,248 28 32,060 100 11,336 35 9,605 30 37 100 9 24 6 16
1986 27,049 100 9,373 35 7,750 29 33,252 100 12,345 37 10,334 31 34 100 9 26 6 19
1987 34,589 100 12,088 35 10,191 29 26,792 100 8,713 33 7,277 27 61 100 17 28 16 26
1988 35,383 100 12,174 34 10,294 29 26,816 100 8,369 31 6,956 26 54 100 22 41 18 33
1989 33,800 100 11,005 33 9,397 28 26,596 100 7,981 30 6,782 25 39 100 11 28 10 26
1990 32,691 100 11,152 34 9,512 29 26,164 100 8,292 32 6,967 27 38 100 9 24 8 20
1991 30,584 100 10,142 33 8,659 28 23,735 100 6,932 29 5,866 25 72 100 22 31 19 26
1992 28,921 100 9,026 31 7,694 27 22,694 100 6,218 27 5,167 23 286 100 72 25 58 20
1993 30,121 100 8,751 29 7,437 25 22,928 100 6,053 26 5,071 22 352 100 87 25 68 19
1994 30,582 100 8,627 28 7,322 24 23,897 100 5,957 25 5,025 21 70 100 22 31 15 21
1995 31,433 100 8,782 28 7,423 24 24,439 100 5,844 24 4,884 20 292 100 64 22 59 20
1996 31,952 100 8,647 27 7,330 23 24,857 100 6,017 24 4,986 20 192 100 45 23 33 17
1997 32,719 100 8,268 25 6,999 21 23,902 100 5,479 23 4,569 19 67 100 13 19 11 16
1998 33,000 100 8,387 25 7,087 21 23,481 100 5,427 23 4,453 19 123 100 27 22 21 17
1999 33,333 100 8,461 25 7,144 21 23,006 100 5,149 22 4,273 19 163 100 35 21 30 18
2000 32,611 100 8,654 27 7,292 22 23,238 100 5,653 24 4,683 20 1,431 100 331 23 285 20
2001 32,041 100 8,403 26 7,094 22 22,130 100 5,591 25 4,617 21 3,309 100 713 22 582 18 Source: NCSA, FARS 1982-2000 (Final), 2001 (ARF)

______________________________________________________________________________ National Center for Statistics and Analysis, 400 Seventh St., S.W., Washington, DC 20590
35
Table A-13: BAC Distributions of Drivers Involved in Fatal Crashes by Roadway Function Class, 2001
Drivers Involved Rural Urban
BAC
Number Percent* Number Percent* 0 23,638 73.77 16,539 74.74
.01 154 0.48 98 0.44
.02 163 0.51 112 0.51
.03 174 0.54 121 0.55
.04 159 0.50 148 0.67
.05 210 0.65 157 0.71
.06 219 0.68 167 0.75
.07 231 0.72 172 0.78
.08 262 0.82 204 0.92
.09 312 0.97 209 0.94
.10 314 0.98 252 1.14
.11 357 1.11 245 1.11
.12 347 1.08 260 1.17
.13 359 1.12 234 1.06
.14 375 1.17 267 1.20
.15 374 1.17 259 1.17
.16 427 1.33 277 1.25
.17 376 1.17 286 1.29
.18 380 1.18 229 1.03
.19 395 1.23 220 0.99
.20 365 1.14 211 0.95
.21 309 0.96 215 0.97
.22 296 0.92 179 0.81
.23 243 0.76 175 0.79
.24 267 0.83 150 0.68
.25 224 0.70 143 0.65
.26 206 0.64 114 0.52
.27 181 0.56 89 0.40
.28 131 0.41 83 0.38
.29 106 0.33 72 0.33
.30 96 0.30 46 0.21
.31 74 0.23 32 0.14
.32 56 0.17 29 0.13
.33 52 0.16 22 0.10
.34 37 0.12 21 0.09
.35 29 0.09 16 0.07
.36 26 0.08 17 0.08
.37 27 0.08 15 0.07
.38 14 0.04 5 0.02
.39 14 0.04 9 0.04 .40 + 67 0.21 33 0.15
*As a percent of all Drivers involved in Category Source: NCSA, FARS 2001 (ARF)

______________________________________________________________________________ National Center for Statistics and Analysis, 400 Seventh St., S.W., Washington, DC 20590
36
Table A-14: Alcohol Involvement Among Drivers Involved by the Time of the Day, 1982-2001
Day Night
Total BAC=0.01+ BAC=0.08+ Total BAC=0.01+ BAC=0.08+ Year
Number Percent Number Percent Number Percent Number Percent Number Percent Number Percent
1982 23,725 100 4,484 19 3,654 15 32,085 100 18,188 57 15,880 49
1983 24,381 100 4,385 18 3,639 15 30,037 100 17,019 57 14,972 50
1984 26,415 100 4,562 17 3,646 14 30,775 100 16,879 55 14,581 47
1985 27,578 100 4,281 16 3,357 12 30,008 100 15,526 52 13,329 44
1986 28,434 100 4,635 16 3,575 13 31,543 100 16,837 53 14,294 45
1987 29,227 100 4,400 15 3,471 12 31,854 100 16,183 51 13,800 43
1988 30,196 100 4,368 14 3,424 11 31,715 100 15,964 50 13,647 43
1989 29,953 100 4,038 13 3,231 11 30,170 100 14,750 49 12,767 42
1990 28,797 100 4,152 14 3,257 11 29,778 100 15,069 51 13,017 44
1991 26,829 100 3,445 13 2,748 10 27,249 100 13,426 49 11,595 43
1992 26,236 100 3,248 12 2,497 10 25,380 100 11,875 47 10,252 40
1993 27,770 100 3,166 11 2,494 9 25,355 100 11,549 46 9,925 39
1994 29,134 100 3,316 11 2,605 9 25,112 100 11,105 44 9,594 38
1995 30,066 100 3,331 11 2,614 9 25,755 100 11,121 43 9,547 37
1996 30,802 100 3,324 11 2,606 8 25,864 100 11,164 43 9,552 37
1997 30,979 100 3,163 10 2,467 8 25,368 100 10,390 41 8,937 35
1998 31,389 100 3,234 10 2,478 8 24,879 100 10,401 42 8,903 36
1999 31,212 100 3,239 10 2,500 8 24,968 100 10,194 41 8,750 35
2000 31,236 100 3,411 11 2,622 8 25,710 100 11,009 43 9,444 37
2001 31,564 100 3,435 11 2,678 8 25,611 100 11,080 43 9,445 37 Source: NCSA, FARS 1982-2000 (Final), 2001 (ARF)

______________________________________________________________________________ National Center for Statistics and Analysis, 400 Seventh St., S.W., Washington, DC 20590
37
Table A-15: BAC Distributions of Drivers Involved in Fatal Crashes by Time of the Day, 2001
Day Night BAC Number Percent* Number Percent*
0 28,129 89.12 14,531 56.74 .01 114 0.36 154 0.60 .02 115 0.36 171 0.67 .03 92 0.29 216 0.84 .04 98 0.31 224 0.87 .05 115 0.36 265 1.04 .06 115 0.36 294 1.15 .07 109 0.34 311 1.22 .08 122 0.39 366 1.43 .09 142 0.45 405 1.58 .10 139 0.44 446 1.74 .11 147 0.47 479 1.87 .12 133 0.42 494 1.93 .13 128 0.41 485 1.90 .14 141 0.45 526 2.06 .15 127 0.40 524 2.04 .16 147 0.46 583 2.28 .17 147 0.46 536 2.09 .18 133 0.42 494 1.93 .19 127 0.40 508 1.99 .20 111 0.35 484 1.89 .21 121 0.38 429 1.67 .22 97 0.31 398 1.55 .23 89 0.28 348 1.36 .24 90 0.28 339 1.33 .25 82 0.26 290 1.13 .26 81 0.26 240 0.94 .27 71 0.23 211 0.82 .28 48 0.15 169 0.66 .29 40 0.13 143 0.56 .30 42 0.13 104 0.41 .31 32 0.10 79 0.31 .32 19 0.06 69 0.27 .33 25 0.08 50 0.20 .34 18 0.06 46 0.18 .35 13 0.04 35 0.14 .36 9 0.03 34 0.13 .37 13 0.04 28 0.11 .38 6 0.02 14 0.06 .39 8 0.02 16 0.06
.40 + 31 0.10 72 0.28 *As percent of all drivers involved in category Source: NCSA FARS 2001 (ARF)

______________________________________________________________________________ National Center for Statistics and Analysis, 400 Seventh St., S.W., Washington, DC 20590
38
Table A-16: Alcohol Involvement Among Drivers Involved by the Day of the Week, 1982-2001
Weekday Weekend
Total BAC=0.01+ BAC=0.08+ Total BAC=0.01+ BAC=0.08+ Year
Number Percent Number Percent Number Percent Number Percent Number Percent Number Percent
1982 31,021 100 10,027 32 8,549 28 24,937 100 12,748 51 11,080 44
1983 30,948 100 9,242 30 7,994 26 23,646 100 12,296 52 10,738 45
1984 32,381 100 9,375 29 7,908 24 25,057 100 12,247 49 10,485 42
1985 33,676 100 8,743 26 7,350 22 24,121 100 11,212 46 9,467 39
1986 34,577 100 9,588 28 7,874 23 25,678 100 12,079 47 10,166 40
1987 35,234 100 8,975 25 7,457 21 26,107 100 11,774 45 9,962 38
1988 35,889 100 8,695 24 7,259 20 26,270 100 11,810 45 9,962 38
1989 35,080 100 7,968 23 6,741 19 25,282 100 10,982 43 9,405 37
1990 33,732 100 8,131 24 6,779 20 25,072 100 11,258 45 9,648 38
1991 31,477 100 7,203 23 6,054 19 22,826 100 9,832 43 8,438 37
1992 30,411 100 6,521 21 5,407 18 21,419 100 8,752 41 7,476 35
1993 31,692 100 6,331 20 5,308 17 21,640 100 8,517 39 7,229 33
1994 32,571 100 6,084 19 5,061 16 21,881 100 8,470 39 7,252 33
1995 33,723 100 6,259 19 5,223 15 22,340 100 8,362 37 7,083 32
1996 34,973 100 6,397 18 5,268 15 21,921 100 8,247 38 7,025 32
1997 34,388 100 5,875 17 4,892 14 22,209 100 7,835 35 6,647 30
1998 34,796 100 6,033 17 4,930 14 21,727 100 7,760 36 6,590 30
1999 34,346 100 5,837 17 4,839 14 22,081 100 7,757 35 6,563 30
2000 34,788 100 6,151 18 5,054 15 22,392 100 8,424 38 7,156 32
2001 34,918 100 6,542 19 5,419 16 22,462 100 8,111 36 6,827 30
Source: NCSA, FARS 1982-2000 (Final), 2001 (ARF)

______________________________________________________________________________ National Center for Statistics and Analysis, 400 Seventh St., S.W., Washington, DC 20590
39
Table A-17: BAC Distributions of Drivers Involved in Fatal Crashes by Day of the Week, 2001
Weekday Weekend BAC Number Percent* Number Percent*
0 28,376 81.26 14,351 63.89 .01 152 0.44 118 0.53 .02 136 0.39 153 0.68 .03 128 0.37 182 0.81 .04 146 0.42 178 0.79 .05 178 0.51 207 0.92 .06 192 0.55 217 0.97 .07 192 0.55 229 1.02 .08 210 0.60 280 1.25 .09 244 0.70 305 1.36 .10 267 0.76 323 1.44 .11 282 0.81 348 1.55 .12 279 0.80 352 1.57 .13 269 0.77 353 1.57 .14 302 0.86 370 1.65 .15 270 0.77 385 1.72 .16 321 0.92 413 1.84 .17 307 0.88 383 1.70 .18 274 0.79 362 1.61 .19 262 0.75 383 1.70 .20 271 0.78 332 1.48 .21 251 0.72 305 1.36 .22 227 0.65 275 1.22 .23 195 0.56 247 1.10 .24 207 0.59 227 1.01 .25 166 0.47 213 0.95 .26 144 0.41 183 0.81 .27 128 0.37 156 0.69 .28 102 0.29 119 0.53 .29 77 0.22 107 0.48 .30 63 0.18 85 0.38 .31 51 0.15 61 0.27 .32 45 0.13 44 0.20 .33 37 0.11 39 0.17 .34 29 0.08 35 0.15 .35 24 0.07 25 0.11 .36 22 0.06 22 0.10 .37 21 0.06 21 0.09 .38 10 0.03 9 0.04 .39 16 0.04 8 0.03
.40 + 48 0.14 56 0.25 *As percent of all drivers involved in category Source: NCSA FARS 2001 (ARF)

______________________________________________________________________________ National Center for Statistics and Analysis, 400 Seventh St., S.W., Washington, DC 20590
40
Table A-18: Alcohol Involvement Among Drivers Involved by Crash Type, 1982-2001
Single vehicle Multiple Vehicle
Total BAC=0.01+ BAC=0.08+ Total BAC=0.01+ BAC=0.08+ Year
Number Percent Number Percent Number Percent Number Percent Number Percent Number Percent
1982 23,731 100 13,317 56 11,859 50 32,298 100 9,511 29 7,817 24
1983 22,925 100 12,646 55 11,299 49 31,731 100 8,936 28 7,466 24
1984 23,545 100 12,540 53 11,056 47 33,967 100 9,128 27 7,379 22
1985 22,774 100 11,595 51 10,091 44 35,109 100 8,408 24 6,769 19
1986 24,163 100 12,776 53 11,066 46 36,172 100 8,951 25 7,025 19
1987 24,039 100 12,077 50 10,482 44 37,403 100 8,741 23 7,002 19
1988 24,587 100 12,155 49 10,552 43 37,666 100 8,411 22 6,716 18
1989 23,638 100 11,364 48 9,989 42 36,797 100 7,632 21 6,201 17
1990 23,314 100 11,697 50 10,258 44 35,579 100 7,756 22 6,229 18
1991 21,776 100 10,531 48 9,263 43 32,615 100 6,565 20 5,281 16
1992 20,291 100 9,306 46 8,124 40 31,610 100 6,010 19 4,795 15
1993 20,454 100 9,070 44 7,942 39 32,947 100 5,821 18 4,634 14
1994 20,416 100 8,749 43 7,673 38 34,133 100 5,857 17 4,689 14
1995 21,129 100 9,114 43 7,919 37 35,035 100 5,576 16 4,446 13
1996 21,021 100 9,002 43 7,834 37 35,980 100 5,707 16 4,514 13
1997 20,689 100 8,342 40 7,279 35 35,999 100 5,417 15 4,300 12
1998 20,805 100 8,643 42 7,495 36 35,799 100 5,198 15 4,066 11
1999 20,805 100 8,554 41 7,433 36 35,697 100 5,090 14 4,015 11
2000 21,026 100 9,030 43 7,806 37 36,254 100 5,607 15 4,455 12
2001 21,365 100 9,139 43 7,900 37 36,115 100 5,567 15 4,392 12
Source: NCSA, FARS 1982-2000 (Final), 2001 (ARF)

______________________________________________________________________________ National Center for Statistics and Analysis, 400 Seventh St., S.W., Washington, DC 20590
41
Table A-19: BAC Distributions of Drivers Involved in Fatal Crashes by Crash-Type, 2001
Single -Vehicle Multiple Vehicle BAC Number Percent* Number Percent*
0 12,226 57.22 30,548 84.59 .01 119 0.55 152 0.42 .02 139 0.65 151 0.42 .03 152 0.71 159 0.44 .04 172 0.80 153 0.42 .05 200 0.93 186 0.52 .06 230 1.08 180 0.50 .07 228 1.07 195 0.54 .08 269 1.26 222 0.62 .09 328 1.54 222 0.61 .10 349 1.63 242 0.67 .11 395 1.85 237 0.66 .12 384 1.80 249 0.69 .13 373 1.75 251 0.70 .14 414 1.94 259 0.72 .15 411 1.92 248 0.69 .16 473 2.21 266 0.74 .17 460 2.15 231 0.64 .18 396 1.86 242 0.67 .19 452 2.12 194 0.54 .20 414 1.94 192 0.53 .21 370 1.73 188 0.52 .22 335 1.57 168 0.47 .23 283 1.32 160 0.44 .24 306 1.43 132 0.37 .25 266 1.25 114 0.32 .26 221 1.03 109 0.30 .27 194 0.91 91 0.25 .28 153 0.71 70 0.19 .29 131 0.62 57 0.16 .30 102 0.48 46 0.13 .31 76 0.36 36 0.10 .32 56 0.26 33 0.09 .33 56 0.26 21 0.06 .34 39 0.18 25 0.07 .35 34 0.16 15 0.04 .36 30 0.14 13 0.04 .37 29 0.14 13 0.03 .38 12 0.06 8 0.02 .39 13 0.06 11 0.03
.40 + 76 0.36 29 0.08 *As percent of drivers involved in category Source: NCSA FARS 2001 (ARF)

______________________________________________________________________________ National Center for Statistics and Analysis, 400 Seventh St., S.W., Washington, DC 20590
42
Table A-20: Alcohol Involvement Among Drivers of Passenger Vehicles Involved in Fatal Crashes by Safety Belt Use, 1982-2001
Safety Belt Use
Not Used Used Unknown Total
Total BAC =0.01+ Total BAC =0.01+ Total BAC =0.01+ Total BAC =0.01+ Year
Number Number Percent Number Number Percent Number Number Percent Number Number Percent
1982 33,793 7,664 23 1,515 377 25 10,012 3,603 36 45,320 11,643 26 1983 32,332 6,993 22 1,835 433 24 9,919 3,463 35 44,086 10,888 25 1984 32,979 6,983 21 2,756 604 22 10,526 3,472 33 46,261 11,058 24
1985 29,705 5,800 20 6,172 1,339 22 10,566 2,966 28 46,443 10,105 22 1986 28,778 6,050 21 10,891 2,372 22 9,498 2,628 28 49,167 11,050 22 1987 28,154 5,909 21 14,474 2,889 20 8,150 2,038 25 50,778 10,836 21 1988 28,146 5,883 21 16,948 3,395 20 6,842 1,628 24 51,936 10,906 21 1989 26,764 5,424 20 17,545 3,290 19 6,474 1,455 22 50,783 10,169 20 1990 24,706 5,044 20 18,340 3,564 19 6,348 1,523 24 49,394 10,132 21 1991 21,843 10,308 47 18,457 2,922 16 5,504 1,732 31 45,804 14,963 33
1992 19,836 9,213 46 19,106 2,921 15 5,268 1,638 31 44,210 13,772 31 1993 19,139 8,657 45 20,932 3,078 15 5,196 1,506 29 45,267 13,241 29 1994 18,946 8,429 44 22,763 3,309 15 4,629 1,489 32 46,338 13,228 29 1995 19,428 8,497 44 24,165 3,332 14 4,663 1,457 31 48,256 13,286 28 1996 18,759 8,372 45 25,207 3,506 14 4,747 1,481 31 48,713 13,360 27 1997 18,286 7,781 43 25,313 3,357 13 4,799 1,394 29 48,398 12,532 26 1998 17,601 7,643 43 25,854 3,421 13 4,699 1,377 29 48,154 12,441 26 1999 17,693 7,589 43 25,498 3,358 13 4,552 1,334 29 47,743 12,280 26
2000 16,995 7,663 45 26,690 3,986 15 4,369 1,414 32 48,054 13,063 27 2001 16,455 7,567 46 27,068 4,004 15 4,359 1,388 32 47,882 12,958 27
Source: NCSA, FARS 1982-2000 (Final), 2001 (ARF)

______________________________________________________________________________ National Center for Statistics and Analysis, 400 Seventh St., S.W., Washington, DC 20590
43
Table A-21: BAC Distributions of Drivers of Passenger Vehicles Involved in Fatal Crashes by Their Safety Belt Use, 2001
Unbelted Belted BAC Number Percent* Number Percent*
0 8,889 54.02 23,064 85.21 .01 94 0.57 99 0.37 .02 104 0.63 117 0.43 .03 104 0.63 106 0.39 .04 130 0.79 105 0.39 .05 168 1.02 121 0.45 .06 160 0.97 136 0.50 .07 183 1.11 134 0.50 .08 206 1.25 156 0.58 .09 226 1.37 184 0.68 .10 254 1.54 192 0.71 .11 285 1.73 199 0.74 .12 297 1.81 186 0.69 .13 318 1.93 173 0.64 .14 323 1.96 203 0.75 .15 347 2.11 166 0.61 .16 392 2.38 190 0.70 .17 353 2.14 187 0.69 .18 363 2.21 156 0.58 .19 369 2.24 155 0.57 .20 348 2.11 150 0.55 .21 318 1.93 135 0.50 .22 307 1.87 110 0.41 .23 264 1.60 103 0.38 .24 274 1.66 91 0.34 .25 241 1.47 74 0.27 .26 200 1.21 73 0.27 .27 180 1.09 71 0.26 .28 135 0.82 48 0.18 .29 122 0.74 43 0.16 .30 95 0.58 31 0.11 .31 78 0.47 17 0.06 .32 57 0.35 17 0.06 .33 51 0.31 14 0.05 .34 43 0.26 9 0.03 .35 26 0.16 11 0.04 .36 29 0.18 8 0.03 .37 28 0.17 6 0.02 .38 14 0.08 4 0.01 .39 14 0.08 8 0.03
.40 + 71 0.43 18 0.07 *As percent of all drivers in category Source: NCSA FARS 2001 (ARF)
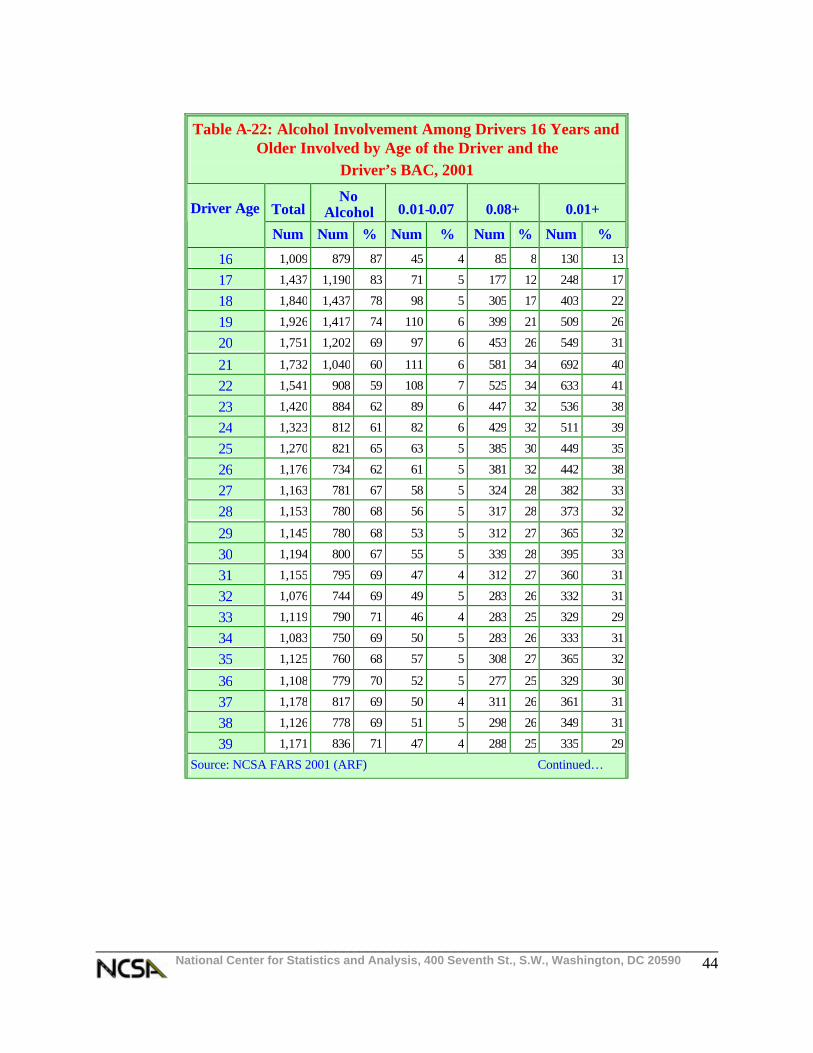
______________________________________________________________________________ National Center for Statistics and Analysis, 400 Seventh St., S.W., Washington, DC 20590
44
Table A-22: Alcohol Involvement Among Drivers 16 Years and Older Involved by Age of the Driver and the
Driver’s BAC, 2001
Total No
Alcohol 0.01-0.07 0.08+ 0.01+ Driver Age
Num Num % Num % Num % Num %
16 1,009 879 87 45 4 85 8 130 13
17 1,437 1,190 83 71 5 177 12 248 17
18 1,840 1,437 78 98 5 305 17 403 22
19 1,926 1,417 74 110 6 399 21 509 26
20 1,751 1,202 69 97 6 453 26 549 31
21 1,732 1,040 60 111 6 581 34 692 40
22 1,541 908 59 108 7 525 34 633 41
23 1,420 884 62 89 6 447 32 536 38
24 1,323 812 61 82 6 429 32 511 39
25 1,270 821 65 63 5 385 30 449 35
26 1,176 734 62 61 5 381 32 442 38
27 1,163 781 67 58 5 324 28 382 33
28 1,153 780 68 56 5 317 28 373 32
29 1,145 780 68 53 5 312 27 365 32
30 1,194 800 67 55 5 339 28 395 33
31 1,155 795 69 47 4 312 27 360 31
32 1,076 744 69 49 5 283 26 332 31
33 1,119 790 71 46 4 283 25 329 29
34 1,083 750 69 50 5 283 26 333 31
35 1,125 760 68 57 5 308 27 365 32
36 1,108 779 70 52 5 277 25 329 30
37 1,178 817 69 50 4 311 26 361 31
38 1,126 778 69 51 5 298 26 349 31
39 1,171 836 71 47 4 288 25 335 29
Source: NCSA FARS 2001 (ARF) Continued…

______________________________________________________________________________ National Center for Statistics and Analysis, 400 Seventh St., S.W., Washington, DC 20590
45
Table A-22: Alcohol Involvement Among Drivers 16 Years and Older Involved by Age of the Driver and the
Driver’s BAC, 2001
Total No
Alcohol 0.01-0.07 0.08+ 0.01+ Driver Age
Num Num % Num % Num % Num %
40 1,128 792 70 49 4 287 25 336 30
41 1,088 762 70 45 4 281 26 326 30
42 1,135 833 73 41 4 261 23 302 27
43 1,075 791 74 38 4 246 23 284 26
44 1,067 733 69 45 4 290 27 334 31
45 1,006 760 76 27 3 219 22 246 24
46 949 723 76 27 3 200 21 227 24
47 905 678 75 34 4 194 21 227 25
48 835 654 78 20 2 161 19 181 22
49 853 647 76 24 3 182 21 206 24
50 767 587 76 33 4 148 19 180 24
51 760 615 81 19 2 127 17 145 19
52 736 589 80 20 3 127 17 147 20
53 744 600 81 15 2 129 17 144 19
54 752 618 82 17 2 117 16 134 18
55 572 475 83 17 3 80 14 97 17
56 533 461 86 10 2 62 12 72 14
57 542 460 85 11 2 71 13 82 15
58 573 472 82 13 2 88 15 101 18
59 503 418 83 20 4 65 13 86 17
60 455 394 87 14 3 46 10 61 13
61 439 392 89 8 2 39 9 47 11
62 404 351 87 12 3 42 10 53 13
63 379 338 89 8 2 33 9 41 11
64 298 268 90 8 3 23 8 31 10
65+ 6,421 5,919 92 136 2 366 6 502 8
Unknown 1,340 934 70 99 7 308 23 407 30
Total 57,480 42774 74 2,414 4 12293 21 14706 26
Source: NCSA FARS 2001 (ARF)

______________________________________________________________________________ National Center for Statistics and Analysis, 400 Seventh St., S.W., Washington, DC 20590
46
Table A-23: Alcohol Involvement Among Pedestrians Killed by Time of the Day, 1982-2001
Day Night
Total BAC=0.01+ BAC=0.08+ Total BAC=0.01+ BAC=0.08+ Year
Number Percent Number Percent Number Percent Number Percent Number Percent Number Percent
1982 2,347 100 289 12 239 10 4,937 100 2,795 57 2,515 51
1983 2,339 100 275 12 231 10 4,457 100 2,569 58 2,313 52
1984 2,448 100 266 11 219 9 4,534 100 2,531 56 2,281 50
1985 2,448 100 264 11 192 8 4,324 100 2,434 56 2,155 50
1986 2,381 100 263 11 192 8 4,359 100 2,382 55 2,112 48
1987 2,439 100 338 14 237 10 4,263 100 2,217 52 1,965 46
1988 2,596 100 278 11 215 8 4,233 100 2,227 53 1,993 47
1989 2,372 100 270 11 203 9 4,144 100 2,246 54 2,014 49
1990 2,383 100 221 9 163 7 4,073 100 2,211 54 2,004 49
1991 2,049 100 188 9 151 7 3,719 100 1,974 53 1,776 48
1992 1,955 100 229 12 178 9 3,572 100 1,896 53 1,713 48
1993 2,074 100 232 11 185 9 3,549 100 1,880 53 1,721 48
1994 2,037 100 222 11 180 9 3,419 100 1,743 51 1,554 45
1995 2,000 100 224 11 188 9 3,559 100 1,816 51 1,623 46
1996 1,901 100 205 11 161 8 3,528 100 1,840 52 1,672 47
1997 1,987 100 215 11 178 9 3,303 100 1,619 49 1,477 45
1998 1,876 100 234 12 177 9 3,321 100 1,713 52 1,521 46
1999 1,699 100 178 10 142 8 3,211 100 1,686 53 1,527 48
2000 1,676 100 194 12 158 9 3,055 100 1,577 52 1,396 46
2001 1,721 100 210 12 159 9 3,131 100 1,588 51 1,418 45
Source: NCSA, FARS 1982-2000 (Final), 2001 (ARF)

______________________________________________________________________________ National Center for Statistics and Analysis, 400 Seventh St., S.W., Washington, DC 20590
47
Table A-24: Fatalities in Traffic Crashes by Crash BAC and State, 2001
Total No Alcohol 0.01-0.07 0.08+ 0.01+ State
Fatalities Fatalities % Fatalities % Fatalities % Fatalities %
Alabama 994 618 62 39 4 336 34 376 38
Alaska 85 42 50 4 4 39 46 43 50
Arizona 1,048 560 53 64 6 424 40 488 47
Arkansas 611 418 68 44 7 150 25 193 32
California 3,956 2,387 60 292 7 1,277 32 1,569 40
Colorado 736 408 55 50 7 278 38 328 45
Connecticut 312 154 49 19 6 139 45 158 51
Delaware 136 71 52 8 6 58 42 65 48
Dist of Columbia 68 30 45 5 8 32 48 38 55
Florida 3,011 1,748 58 175 6 1,088 36 1,264 42
Georgia 1,615 1,058 65 91 6 466 29 557 35
Hawaii 140 80 57 9 7 51 36 60 43
Idaho 259 162 63 11 4 85 33 97 37
Illinois 1,414 794 56 86 6 535 38 620 44
Indiana 909 572 63 54 6 283 31 337 37
Iowa 447 292 65 29 6 126 28 155 35
Kansas 494 300 61 25 5 169 34 194 39
Kentucky 845 598 71 35 4 213 25 247 29
Louisiana 954 509 53 62 6 383 40 445 47
Maine 192 127 66 5 3 60 31 65 34
Maryland 660 370 56 51 8 239 36 290 44
Massachusetts 477 244 51 28 6 206 43 234 49
Michigan 1,328 810 61 77 6 441 33 518 39
Minnesota 568 342 60 30 5 196 34 226 40
Source: NCSA FARS 2001 (ARF) Continued…

______________________________________________________________________________ National Center for Statistics and Analysis, 400 Seventh St., S.W., Washington, DC 20590
48
Table A-24: Fatalities in Traffic Crashes by Crash BAC and State, 2001
Total No Alcohol 0.01-0.07 0.08+ 0.01+ State
Fatalities Fatalities % Fatalities % Fatalities % Fatalities %
Mississippi 784 502 64 29 4 253 32 282 36
Missouri 1,098 575 52 82 7 441 40 523 48
Montana 230 126 55 8 4 96 42 104 45
Nebraska 246 150 61 17 7 79 32 96 39
Nevada 313 180 58 21 7 112 36 133 42
New Hampshire 142 73 51 15 10 55 39 70 49
New Jersey 747 450 60 53 7 244 33 297 40
New Mexico 463 249 54 35 7 179 39 214 46
New York 1,548 1,050 68 94 6 404 26 498 32
North Carolina 1,530 997 65 77 5 456 30 533 35
North Dakota 105 52 50 8 8 44 42 53 50
Ohio 1,378 774 56 89 6 515 37 604 44
Oklahoma 676 410 61 33 5 233 34 266 39
Oregon 488 298 61 34 7 157 32 190 39
Pennsylvania 1,530 867 57 83 5 580 38 663 43
Rhode Island 81 32 40 9 11 40 49 49 60
South Carolina 1,059 467 44 73 7 519 49 592 56
South Dakota 171 87 51 9 5 75 44 84 49
Tennessee 1,251 714 57 75 6 462 37 537 43
Texas 3,724 1,935 52 205 5 1,584 43 1,789 48
Utah 292 224 77 12 4 56 19 68 23
Vermont 92 57 62 2 2 33 35 35 38
Virginia 935 595 64 54 6 287 31 340 36
Washington 649 368 57 42 6 239 37 281 43
West Virginia 376 241 64 16 4 119 32 135 36
Wisconsin 763 399 52 39 5 325 43 364 48
Wyoming 186 105 56 11 6 71 38 81 44
U.S. 42,116 24668 59 2,515 6 14933 35 17,448 41
Puerto Rico 481 235 49 36 7 210 44 246 51
Source: NCSA FARS 2001 (ARF)

______________________________________________________________________________ National Center for Statistics and Analysis, 400 Seventh St., S.W., Washington, DC 20590
49
Table A-25: Extent of Intoxication Among Drivers involved in Fatal Crashes by Prior Convictions Previous DWI Previous Crashes
None 1 or More None 1 or More Total BAC=0.08+ Total BAC=0.08+ Total BAC=0.08+ Total BAC=0.08+
Year
Num Num % Num Num % Num Num % Num Num %
1982 50,843 16,820 33 2,288 1,587 69 42,716 14,235 33 10,416 4,172 40
1983 49,861 16,148 32 2,389 1,594 67 42,690 13,963 33 9,560 3,779 40
1984 52,528 15,812 30 2,630 1,732 66 44,708 13,658 31 10,450 3,886 37
1985 52,803 14,231 27 2,744 1,789 65 44,913 12,541 28 10,635 3,480 33
1986 54,794 15,044 27 3,028 2,015 67 46,783 13,416 29 11,039 3,643 33
1987 55,922 14,568 26 3,053 2,024 66 48,011 13,129 27 10,964 3,463 32
1988 56,988 14,566 26 2,932 1,957 67 48,905 13,054 27 11,015 3,469 31
1989 55,381 13,701 25 2,696 1,791 66 47,186 12,181 26 10,891 3,311 30
1990 53,920 13,904 26 2,667 1,813 68 46,310 12,595 27 10,223 3,102 30
1991 49,817 12,181 24 2,561 1,754 69 42,835 11,115 26 9,145 2,704 30
1992 47,920 10,971 23 2,254 1,512 67 41,170 10,079 24 8,595 2,294 27
1993 49,298 10,612 22 2,188 1,439 66 42,421 9,698 23 8,618 2,232 26
1994 50,707 10,525 21 2,073 1,353 65 42,652 9,410 22 10,128 2,468 24
1995 52,205 10,459 20 2,097 1,359 65 44,137 9,432 21 10,165 2,386 23
1996 53,350 10,732 20 1,919 1,209 63 44,949 9,494 21 10,320 2,446 24
1997 53,181 10,092 19 1,808 1,132 63 45,183 8,998 20 9,806 2,226 23
1998 53,074 9,957 19 1,849 1,128 61 45,363 8,912 20 9,560 2,173 23
1999 52,930 9,917 19 1,871 1,173 63 43,777 8,762 20 11,024 2,328 21
2000 53,344 10,568 20 1,896 1,193 63 44,166 9,176 21 11,073 2,585 23
2001 53,321 10,482 20 1,888 1,178 62 44,012 9,244 21 11,197 2,416 22
Source: NCSA FARS 1982-2000 (Final), 2001 (ARF) Continued…

______________________________________________________________________________ National Center for Statistics and Analysis, 400 Seventh St., S.W., Washington, DC 20590
50
Table A-25 (Contd.): Extent of Intoxication Among Drivers involved in Fatal Crashes by Prior Convictions Previous Speeding Convictions Previous Suspensions None 1 or More None 1 or More
Total BAC=0.08+ Total BAC=0.08+ Total BAC=0.08+ Total BAC=0.08+
Year
Num Num % Num Num % Num Num % Num Num % 1982 37,017 11,965 32 16,115 6,441 40 48,461 15,812 33 4,670 2,596 56
1983 37,218 11,789 32 15,032 5,953 40 47,418 15,088 32 4,832 2,654 55
1984 39,870 11,961 30 15,288 5,583 37 49,543 14,634 30 5,615 2,910 52
1985 40,089 10,840 27 15,459 5,180 34 49,590 12,936 26 5,959 3,086 52
1986 42,105 11,776 28 15,717 5,283 34 51,210 13,577 27 6,612 3,483 53
1987 43,060 11,486 27 15,915 5,107 32 52,091 13,123 25 6,884 3,470 50
1988 43,612 11,230 26 16,308 5,293 32 52,355 12,814 24 7,565 3,709 49
1989 42,810 10,788 25 15,267 4,703 31 50,638 11,873 23 7,439 3,618 49
1990 41,841 11,043 26 14,746 4,674 32 48,977 11,934 24 7,610 3,783 50
1991 38,937 9,746 25 13,442 4,189 31 45,324 10,394 23 7,054 3,541 50
1992 38,023 9,137 24 12,151 3,346 28 43,814 9,474 22 6,359 3,009 47
1993 39,553 8,859 22 11,933 3,191 27 45,151 9,090 20 6,335 2,960 47
1994 41,079 8,931 22 11,701 2,947 25 46,340 9,015 19 6,440 2,862 44
1995 42,447 8,809 21 11,855 3,009 25 47,441 8,822 19 6,861 2,996 44
1996 43,134 8,943 21 12,135 2,998 25 48,668 9,090 19 6,601 2,851 43
1997 43,199 8,468 20 11,790 2,757 23 48,716 8,518 17 6,273 2,706 43
1998 43,388 8,388 19 11,535 2,697 23 48,461 8,360 17 6,462 2,725 42
1999 43,243 8,409 19 11,558 2,681 23 47,943 8,248 17 6,858 2,842 41
2000 43,302 8,844 20 11,938 2,918 24 48,041 8,694 18 7,198 3,067 43
2001 43,150 8,736 20 12,060 2,923 24 48,276 8,796 18 6,933 2,864 41
Source: NCSA FARS 1982-2000 (Final), 2001 (ARF)

______________________________________________________________________________ National Center for Statistics and Analysis, 400 Seventh St., S.W., Washington, DC 20590
51
Table A-26: Prior DWI Convictions Among Drivers who had any Alcohol (BAC=0.01+), 1982-2001
Prior DWI Convictions
None Yes Unknown Total Year
Number Percent Number Percent Number Percent Number Percent
1982 19,669 86 1,726 8 1,432 6 22,827 100
1983 18,668 86 1,727 8 1,187 5 21,582 100
1984 18,725 86 1,918 9 1,026 5 21,669 100
1985 17,064 85 1,964 10 976 5 20,003 100
1986 18,281 84 2,224 10 1,222 6 21,727 100
1987 17,581 84 2,198 11 1,039 5 20,818 100
1988 17,528 85 2,140 10 897 4 20,565 100
1989 16,217 85 1,948 10 832 4 18,997 100
1990 16,594 85 1,971 10 889 5 19,453 100
1991 14,461 85 1,905 11 730 4 17,096 100
1992 13,163 86 1,640 11 514 3 15,317 100
1993 12,693 85 1,565 11 633 4 14,891 100
1994 12,588 86 1,476 10 543 4 14,606 100
1995 12,585 86 1,471 10 634 4 14,690 100
1996 12,897 88 1,321 9 492 3 14,709 100
1997 12,101 88 1,240 9 419 3 13,759 100
1998 12,042 87 1,243 9 556 4 13,840 100
1999 11,940 88 1,283 9 420 3 13,644 100
2000 12,737 87 1,311 9 590 4 14,637 100
2001 12,641 86 1,292 9 774 5 14,706 100
Source: NCSA FARS 1982-2000 (Final), 2001 (ARF)

______________________________________________________________________________ National Center for Statistics and Analysis, 400 Seventh St., S.W., Washington, DC 20590
52
Table A-27: BAC Distributions of Drivers Involved in Fatal Crashes by Prior DWI Convictions, 2001
Prior Convictions No prior DWI Prior DWI
BAC
Number Percent* Number Percent* 0 40,680 76.29 596 31.58
.01 251 0.47 10 0.51
.02 262 0.49 14 0.74
.03 282 0.53 11 0.59
.04 292 0.55 13 0.68
.05 341 0.64 22 1.17
.06 359 0.67 21 1.13
.07 373 0.70 23 1.21
.08 427 0.80 32 1.67
.09 476 0.89 36 1.91
.10 527 0.99 29 1.51
.11 553 1.04 40 2.10
.12 550 1.03 47 2.49
.13 538 1.01 48 2.56
.14 573 1.07 63 3.35
.15 574 1.08 56 2.97
.16 635 1.19 69 3.64
.17 596 1.12 62 3.29
.18 550 1.03 58 3.05
.19 550 1.03 64 3.41
.20 514 0.96 67 3.55
.21 467 0.88 65 3.46
.22 427 0.80 53 2.80
.23 372 0.70 52 2.75
.24 368 0.69 47 2.48
.25 323 0.61 43 2.26
.26 277 0.52 39 2.05
.27 238 0.45 33 1.73
.28 182 0.34 28 1.48
.29 155 0.29 23 1.24
.30 112 0.21 30 1.60
.31 92 0.17 17 0.90
.32 70 0.13 14 0.72
.33 57 0.11 15 0.81
.34 53 0.10 8 0.43
.35 39 0.07 8 0.43
.36 35 0.07 5 0.24
.37 32 0.06 7 0.39
.38 17 0.03 2 0.10
.39 18 0.03 4 0.23 .40 + 85 0.16 15 0.81
*As a percent of all drivers involved in Category Source: NCSA FARS 2001 (ARF)

______________________________________________________________________________ National Center for Statistics and Analysis, 400 Seventh St., S.W., Washington, DC 20590
53
Descriptive Statistics
Table A-28: Summary Statistics: Drivers Involved by Injury Severity, 2001
Injury Severity
Average BAC
Median BAC
75th Percentile
25th Percentile
Fatal 0.17 0.17 0.23 0.11 Survived 0.14 0.13 0.18 0.08
Source: NCSA, FARS 2001 (ARF)
Table A-29: Summary Statistics: Drivers Involved by Gender, 2001
Gender of the Driver
Average BAC
Median BAC
75th Percentile
25th Percentile
Male 0.16 0.16 0.21 0.10
Female 0.16 0.15 0.21 0.10
Source: NCSA, FARS 2001 (ARF)
Table A-30: Summary Statistics: Drivers Involved by Age, 2001
Age Group
Average BAC
Median BAC
75th Percentile
25th Percentile
16-20 0.13 0.13 0.18 0.08
21-24 0.15 0.15 0.20 0.10 25-34 0.16 0.16 0.21 0.11 35-44 0.17 0.17 0.23 0.11 45-64 0.17 0.17 0.23 0.11 65+ 0.13 0.12 0.18 0.08
Source: NCSA, FARS 2001 (ARF)
Table A-31: Summary Statistics: Drivers Involved by Vehicle Type, 2001
Vehicle Type
Average BAC
Median BAC
75th Percentile
25th Percentile
P.Cars 0.16 0.16 0.21 0.10 SUV 0.17 0.16 0.23 0.10
Pickups 0.17 0.16 0.22 0.11 Vans 0.16 0.16 0.22 0.09 Large Trucks
0.10 0.07 0.16 0.03
Motorcycles 0.14 0.14 0.19 0.09
Source: NCSA, FARS 2001 (ARF)
Table A-32: Summary Statistics: Drivers Involved by Roadway Function Class,
2001
Roadway Function
Average BAC
Median BAC
75th Percentile
25th Percentile
Rural 0.16 0.16 0.22 0.10 Urban 0.15 0.15 0.21 0.10
Source: NCSA, FARS 2001 (ARF)
Table A-33: Summary Statistics: Drivers Involved by the Time of the Day, 2001
Time of the Day
Average BAC
Median BAC
75th Percentile
25th Percentile
Daytime 0.15 0.15 0.21 0.08
Nighttime 0.16 0.16 0.21 0.10
Source: NCSA, FARS 2001 (ARF)

______________________________________________________________________________ National Center for Statistics and Analysis, 400 Seventh St., S.W., Washington, DC 20590
54
Table A-34: Summary Statistics: Drivers Involved by the Day of the Week, 2001
Day of the Week
Average BAC
Median BAC
75th Percentile
25th Percentile
Weekday 0.16 0.16 0.21 0.10
Weekend 0.16 0.16 0.21 0.10
Source: NCSA, FARS 2001 (ARF)
Table A-35: Summary Statistics: Drivers Involved by the Type of Crash, 2001
Crash Type
Average BAC
Median BAC
75th Percentile
25th Percentile
S. Vehicle 0.16 0.16 0.22 0.11
M.Vehicle 0.15 0.14 0.20 0.08
Source: NCSA, FARS 2001 (ARF)
Table A-36: Summary Statistics: Drivers of Passenger Vehicles Involved by their
Safety Belt Use, 2001
Crash Type
Average BAC
Median BAC
75th Percentile
25th Percentile
Belted 0.16 0.16 0.22 0.11 Unbelted 0.15 0.14 0.20 0.08
Source: NCSA, FARS 2001 (ARF)
Table 37: Summary Statistics: Drivers Involved by prior DWI Convictions of the
Driver, 2001
Crash Type
Average BAC
Median BAC
75th Percentile
25th Percentile
None 0.16 0.15 0.21 0.10 1 or more 0.19 0.18 0.24 0.13
Source: NCSA, FARS 2001 (ARF)


National Center for Statistics and Analysis 400 Seventh St., S.W., Washington, D.C. 20590
56
Alcohol-Related Fatalities – Q&As
This document answers questions related to the differences between the number of alcohol-related fatalities as reported by some states and those reported by NHTSA.
1. Why do some states report a smaller number of alcohol-related fatalities than the number reported by NHTSA?
A. Discrepancies may occur because NHTSA and a state may use different
approaches to counting alcohol- related fatalities. The primary reason for these discrepancies is that some states include only those fatalities that occur in crashes where alcohol involvement is known. NHTSA, on the other hand, also includes those fatalities that occur in crashes where actual alcohol involvement is unknown, but is estimated using imputation.
2. What is “imputation”?
A. Imputation, the statistical procedure of ‘filling in’ missing data with plausible
values, is an effective approach to estimating missing data. Imputation is widely used by researchers whose analyses would otherwise be biased by missing data.
3. Are there a large number of fatal crashes where alcohol involvement is not known?
A. Yes. On an average, in more than 50 percent of the cases, alcohol involvement, as
determined by actual alcohol testing, is not known. Alcohol test results may not be known for any of several reasons: the test was given, but the results were not obtained by the Fatality Analysis Reporting System (FARS); the test was refused; FARS was unable to determine if the tests were given; or, the test was not given.
4. How does NHTSA “impute” alcohol involvement?
A. Imputation, as applied by NHTSA, uses characteristics of the persons involved in
the crash to predict alcohol involvement when it is not known. Those characteristics include police-reported drinking, age, gender, restraint-use, type of crash, time of day, and driver of striking or struck vehicle.
5. How does NHTSA count alcohol-related fatalities?
A. NHTSA counts a fatality as alcohol related if it occurs in a crash where any of the
drivers, pedestrians or pedalcyclists involved has a Blood Alcohol Concentration (BAC) of 0.01 or more. BAC is the grams of alcohol per deciliter of blood (g/dl). NHTSA determines a fatality to be alcohol related based on known BACs in the FARS as well as imputed BACs when an alcohol test result is not reported.

National Center for Statistics and Analysis 400 Seventh St., S.W., Washington, D.C. 20590
57
6. What is the disadvantage of not imputing alcohol involvement?
A. Because alcohol test results are unknown for a large proportion of cases, reporting alcohol-related fatalities based only on those cases with known results could lead to a significant underestimate of alcohol-related fatalities. When imputation is not used, cases with unknown alcohol involvement are treated as not being alcohol related.
7. What are the benefits of imputing alcohol involvement?
A. Because the reporting of alcohol test results varies widely by state, imputation
provides a more meaningful way for states to assess the problem of alcohol involvement in fatal crashes and compare the extent of their problem with other states. In addition, because NHTSA has applied imputation back to 1982 data, using the NHTSA estimates enables a state to perform a consistent assessment of its progress as well as to better allocate funds to impaired driving programs. Without imputation, the wide variation in a state’s year-to-year reporting of alcohol involvement could produce a less consistent assessment of progress.
8. Are there any other reasons why NHTSA’s estimates of alcohol-related fatalities
may differ from those reported by some states?
A. Yes. Other reasons that a state estimate of alcohol-related fatalites would differ from NHTSA’s estimate include: the state may exclude fatalities that occur in some jurisdictions; the state may count only fatalities in crashes with an alcohol involved driver; the state may use an alcohol threshold other than 0.01 g/dl for counting alcohol related fatalities; or, the state may use data that has not yet been reported to FARS. While these definitional differences may cause a descrepancy in some states, the principal difference is whether or not imputation is used.
9. How could estimates of alcohol-related fatalities be improved?
A. Data are most reliable when they are known. Consequently, if states tested all
drivers involved in fatal crashes (killed and surviving) as well as improved the reporting of alcohol (BAC) test results to FARS, improved estimates of alcohol-related fatalities could be obtained.
More information about the methodology to impute missing BAC test results can be found
in the following report located on NHTSA’s web site: http://www-nrd.nhtsa.dot.gov/pdf/nrd-30/NCSA/Rpts/2002/809-403.pdf
Additional information about imputation and
Statistics on alcohol-related fatalities can be found at: http://www-nrd.nhtsa.dot.gov/departments/nrd-30/ncsa/AvailInf.html


U.S. Department Of Transportation National Highway Traffic Safety Administration 400 Seventh St., S.W. Washington, D.C. 20590 Official Business Penalty for Private Use $300
U.S. Department
of Transportation National Highway Traffic Safety Administration