Embed Size (px)
Citation preview

ISBN: 978-1-4601-3678-2 Posted August 2018
Any comments or questions on the content of this report may be directed to:
Alberta Environment and Parks South Saskatchewan Region, Operations Division #303 Deerfoot Square Building 2938 - 11th Street NE Calgary, Alberta T2E 7L7
General inquiries on management framework development and implementation can be directed to:
Alberta Environment and Parks Planning Branch, Policy and Planning Division 3rd floor, South Petroleum Plaza 9915-108 Street, Edmonton, Alberta T5K 2G8
For copies of this report, please contact:
Information Centre Alberta Environment and Parks Phone: Toll Free Alberta 310-3773Email: [email protected] Website: www.aep.alberta.ca
Copyright in this publication, regardless of format, belongs to Her Majesty the Queen in right of the Province of Alberta. Reproduction of this publication, in whole or in part, regardless of purpose, requires the prior written permission of Alberta Environment and Parks.
© Her Majesty the Queen in right of the Province of Alberta, 2018
Citation: Alberta Environment and Parks (AEP). 2018. South Saskatchewan Region Status of Management Response for Environmental Management Framework, as of October 2017. Government of Alberta. Available at open.alberta.ca/publications/9781460136782.
iSouth Saskatchewan Region - Status of Management Response for Environmental Management Frameworks
Executive Summary
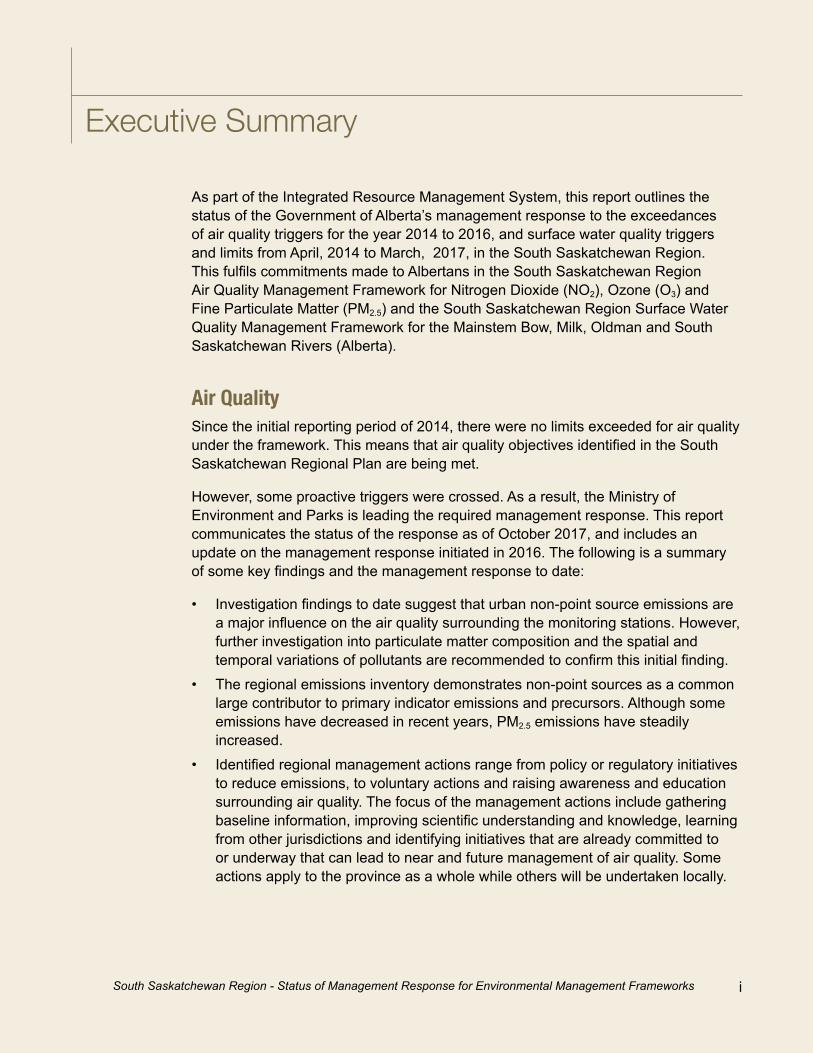
As part of the Integrated Resource Management System, this report outlines the status of the Government of Alberta’s management response to the exceedances of air quality triggers for the year 2014 to 2016, and surface water quality triggers and limits from April, 2014 to March, 2017, in the South Saskatchewan Region. This fulfils commitments made to Albertans in the South Saskatchewan Region Air Quality Management Framework for Nitrogen Dioxide (NO2), Ozone (O3) and Fine Particulate Matter (PM2.5) and the South Saskatchewan Region Surface Water Quality Management Framework for the Mainstem Bow, Milk, Oldman and South Saskatchewan Rivers (Alberta).
Air QualitySince the initial reporting period of 2014, there were no limits exceeded for air quality under the framework. This means that air quality objectives identified in the South Saskatchewan Regional Plan are being met.
However, some proactive triggers were crossed. As a result, the Ministry of Environment and Parks is leading the required management response. This report communicates the status of the response as of October 2017, and includes an update on the management response initiated in 2016. The following is a summary of some key findings and the management response to date:
• Investigation findings to date suggest that urban non-point source emissions area major influence on the air quality surrounding the monitoring stations. However,further investigation into particulate matter composition and the spatial andtemporal variations of pollutants are recommended to confirm this initial finding.
• The regional emissions inventory demonstrates non-point sources as a commonlarge contributor to primary indicator emissions and precursors. Although someemissions have decreased in recent years, PM2.5 emissions have steadilyincreased.
• Identified regional management actions range from policy or regulatory initiativesto reduce emissions, to voluntary actions and raising awareness and educationsurrounding air quality. The focus of the management actions include gatheringbaseline information, improving scientific understanding and knowledge, learningfrom other jurisdictions and identifying initiatives that are already committed toor underway that can lead to near and future management of air quality. Someactions apply to the province as a whole while others will be undertaken locally.
ii South Saskatchewan Region - Status of Management Response for Environmental Management Frameworks
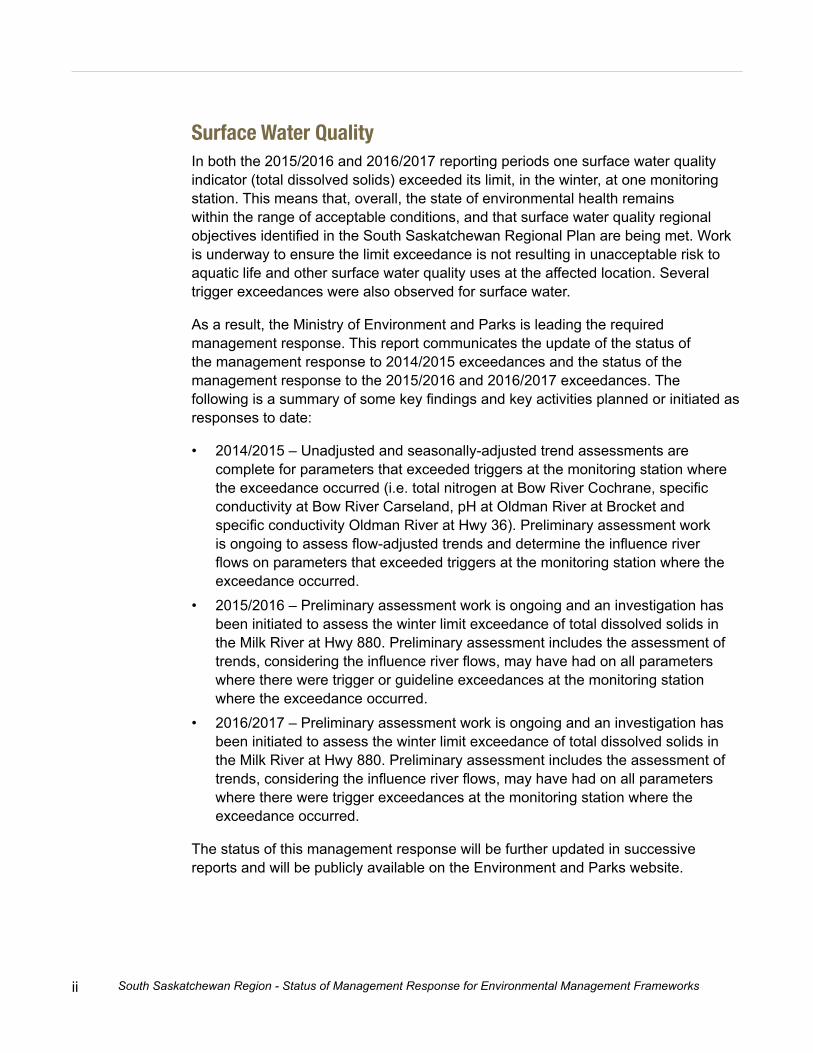
Surface Water QualityIn both the 2015/2016 and 2016/2017 reporting periods one surface water quality indicator (total dissolved solids) exceeded its limit, in the winter, at one monitoring station. This means that, overall, the state of environmental health remains within the range of acceptable conditions, and that surface water quality regional objectives identified in the South Saskatchewan Regional Plan are being met. Work is underway to ensure the limit exceedance is not resulting in unacceptable risk to aquatic life and other surface water quality uses at the affected location. Several trigger exceedances were also observed for surface water.
As a result, the Ministry of Environment and Parks is leading the required management response. This report communicates the update of the status of the management response to 2014/2015 exceedances and the status of the management response to the 2015/2016 and 2016/2017 exceedances. The following is a summary of some key findings and key activities planned or initiated as responses to date:
• 2014/2015 – Unadjusted and seasonally-adjusted trend assessments arecomplete for parameters that exceeded triggers at the monitoring station wherethe exceedance occurred (i.e. total nitrogen at Bow River Cochrane, specificconductivity at Bow River Carseland, pH at Oldman River at Brocket andspecific conductivity Oldman River at Hwy 36). Preliminary assessment workis ongoing to assess flow-adjusted trends and determine the influence riverflows on parameters that exceeded triggers at the monitoring station where theexceedance occurred.
• 2015/2016 – Preliminary assessment work is ongoing and an investigation hasbeen initiated to assess the winter limit exceedance of total dissolved solids inthe Milk River at Hwy 880. Preliminary assessment includes the assessment oftrends, considering the influence river flows, may have had on all parameterswhere there were trigger or guideline exceedances at the monitoring stationwhere the exceedance occurred.
• 2016/2017 – Preliminary assessment work is ongoing and an investigation hasbeen initiated to assess the winter limit exceedance of total dissolved solids inthe Milk River at Hwy 880. Preliminary assessment includes the assessment oftrends, considering the influence river flows, may have had on all parameterswhere there were trigger exceedances at the monitoring station where theexceedance occurred.
The status of this management response will be further updated in successive reports and will be publicly available on the Environment and Parks website.

iiiSouth Saskatchewan Region - Status of Management Response for Environmental Management Frameworks
Table of Contents
Status of Air Quality Management Response
1.0 Introduction ..................................................................................................... 1
2.0 Summary of Ambient Levels Assigned ........................................................ 4
3.0 Status of Management Response ................................................................. 6
3.1 Verification and Preliminary Assessment.................................................. 7 3.2 Investigation Update ................................................................................. 8 3.3 Identification of Management Actions ..................................................... 21 3.4 Oversight/Dellivery of Management Actions ........................................... 26
4.0 Next Steps ..................................................................................................... 27
5.0 References .................................................................................................... 28
6.0 Appendices ...................................................................................................... 30
Appendix A: South Sasktachewan Region Air Quality Management Action Plan ...................................................................................................... 30
Status of Surface Water Quality Management Response .......... 35

iv South Saskatchewan Region - Status of Air Quality Management Response
FiguresFigure 1. Location of Continuous Ambient Air Monitoring Stations in the South Saskatchewan Region ................................................................................................1
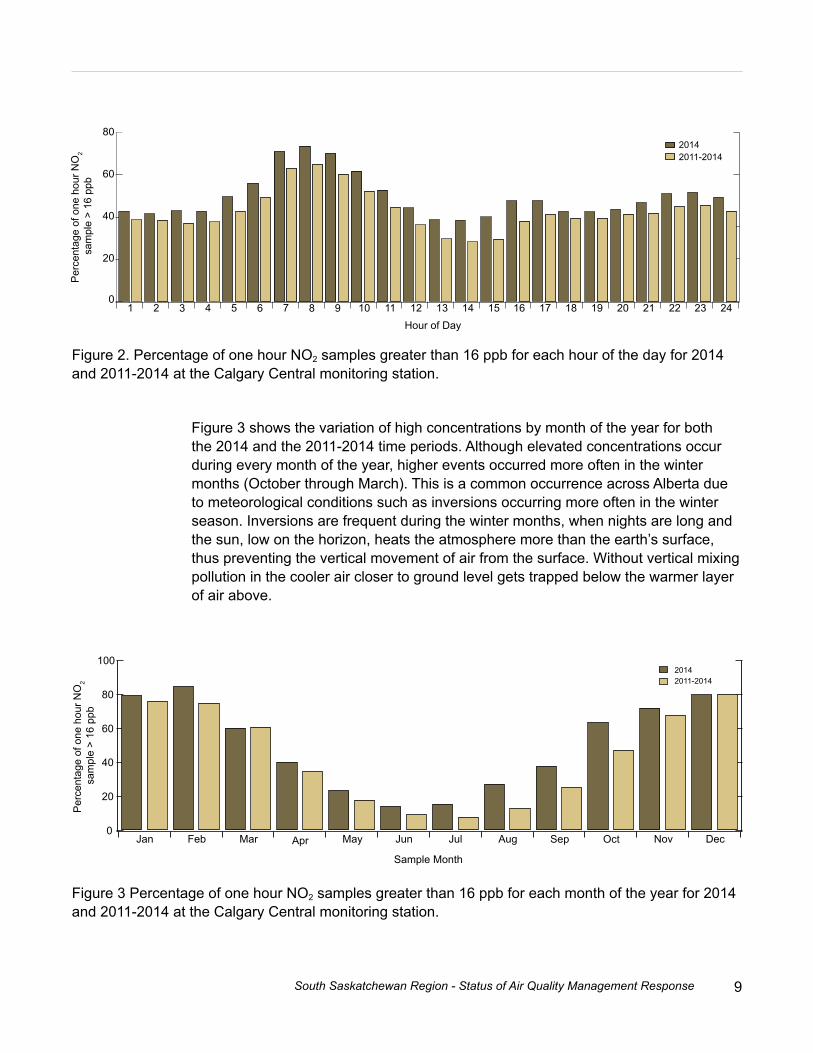
Figure 2. Percentage of one hour NO2 samples greater than 16 ppb for each hour of the day for 2014 and 2011-2014 at the Calgary Central monitoring station. ........................... 9
Figure 3. Percentage of one hour NO2 samples greater than 16 ppb for each month of the year for 2014 and 2011-2014 at the Calgary Central monitoring station. ............. 9
Figure 4. Percentage of one hour NO2 samples greater than 16 ppb by year for 2011, 2012, 2103 and 2014 at the Calgary Central monitoring station. .............. 10
Figure 5. Annual average NO2 concentrations from 2000 through 2014 at the Calgary Central, Calgary Central (2), Calgary Southeast and Calgary Northwest monitoring stations. .................................................................................................. 11
Figure 6. Percentage of 24 hour PM2.5 samples greater than 19 μg/m3 for each hour of the day for 2011-2013 at the Calgary Northwest, Lethbridge and Medicine Hat monitoring stations. ..................................................................................................12
Figure 7. Percentage of 24 hour PM2.5 samples greater than 19 μg/m3 for each month of the year for 2011-2013 at the Calgary Northwest, Lethbridge and Medicine Hat monitoring stations. ..................................................................................................13
Figure 8. Percentage of 24 hour PM2.5 samples greater than 19 μg/m3 by year for 2011, 2012 and 2013 at the Calgary Northwest, Lethbridge and Medicine Hat monitoring stations. ..................................................................................................13
Figure 9. Wind Roses (Wind Speed and Direction) at Calgary Northwest station (a) Lethbridge station (b) and Medicine Hat station (c) for sample periods when24 hour PM2.5 concentrations were greater than 19 μg/m3 (2011-2013). .................. 14
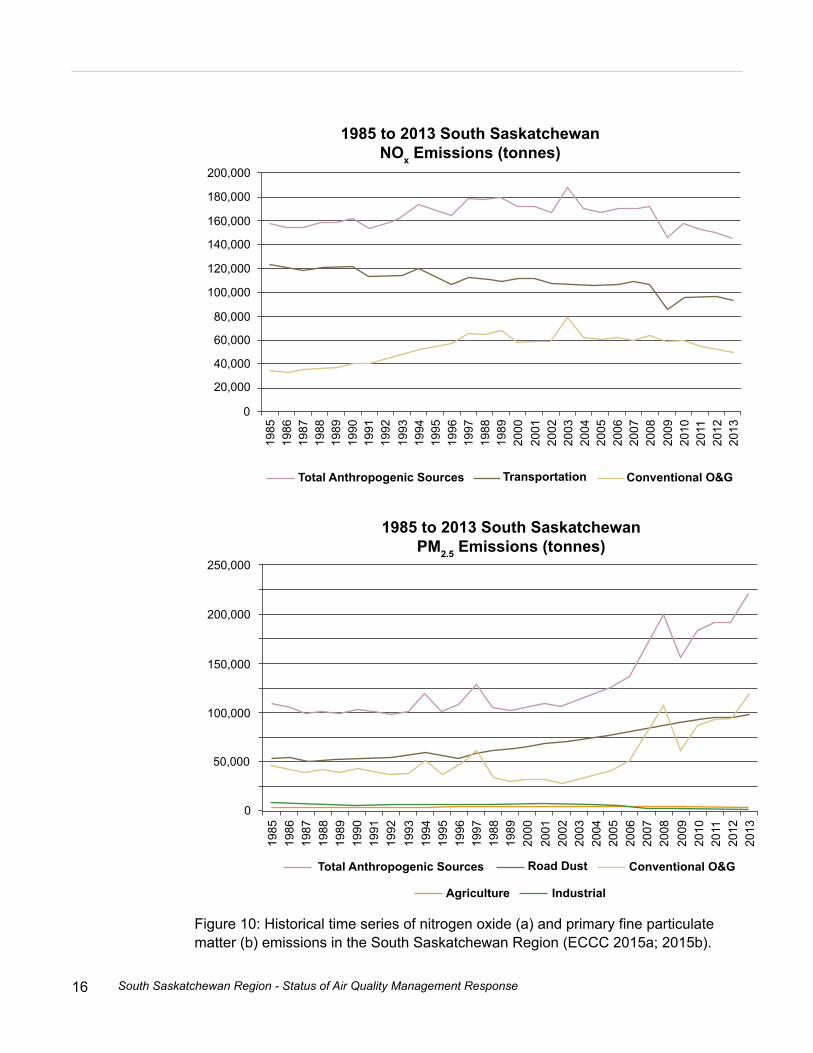
Figure 10. Historical time series of nitrogen oxide (a) and primary fine particulate matter (b) emissions in the South Saskatchewan Region (ECCC 2015a; 2015b). ............. 17
vSouth Saskatchewan Region - Status of Air Quality Management Response
Figure 11. Total Mass Emissions by Pollutant (top) and Percent of Total Emissions by Sector (bottom) for the Calgary Census Metropolitan Area (AEP 2011b). ............... 19
Figure 12. Total Mass Emissions by Pollutant (top) and Percent of Total Emissions by Sector (bottom) for the Lethbridge Census Metropolitan Area (AEP 2011b). ........... 19
Figure 13. Total Mass Emissions by Pollutant (top) and Percent of Total Emissions by Sector (bottom) for the Medicine Hat Census Metropolitan Area (AEP 2011b). ....... 20

vi South Saskatchewan Region - Status of Air Quality Management Response
TablesTable 1. Ambient levels assigned to air quality monitoring stations in the South Saskatchewan Region for 2014, 2015 and 2016 based on triggers and limits established in the framework for the Average of the Annual Hourly data and Interim Upper Range of Hourly Data triggers for NO2 and 2011-2013, 2012-2014 and 2013-2015 Management Levels for the Ozone, PM2.5 24-hour and PM2.5 Annual Metrics (AEP 2017c; 2017d).. .................................................................................................3
Table 2. Description and Management Intent for Average of Annual Hourly Data for NO2 and the PM2.5 and O3 Ambient Air Quality ...........................................................7
Table 3. Levels Management Intent for Upper Range of the Hourly Data Ambient Air Quality Levels for NO2. ..........................................................................................7
Table 4. Status of Delivery of Management Actions ...............................................................26

1South Saskatchewan Region - Status of Air Quality Management Response
Introduction1.0
Under the South Saskatchewan Regional Plan (SSRP) (GoA 2012), a management response is initiated when a trigger or limit has been exceeded, as determined by the Minister of Environment and Parks. Part of the management response is determining the need for management action(s). Presently, three substances (nitrogen dioxide, ozone and fine particulate matter) are evaluated annually under the South Saskatchewan Region Air Quality Management Framework (AESRD 2014) using data collected at continuous monitoring stations located in Calgary, Lethbridge and Medicine Hat (Figure 1).
Figure 1. Location of Continuous Ambient Air Monitoring Stations in the South Saskatchewan Region.
2 South Saskatchewan Region - Status of Air Quality Management Response
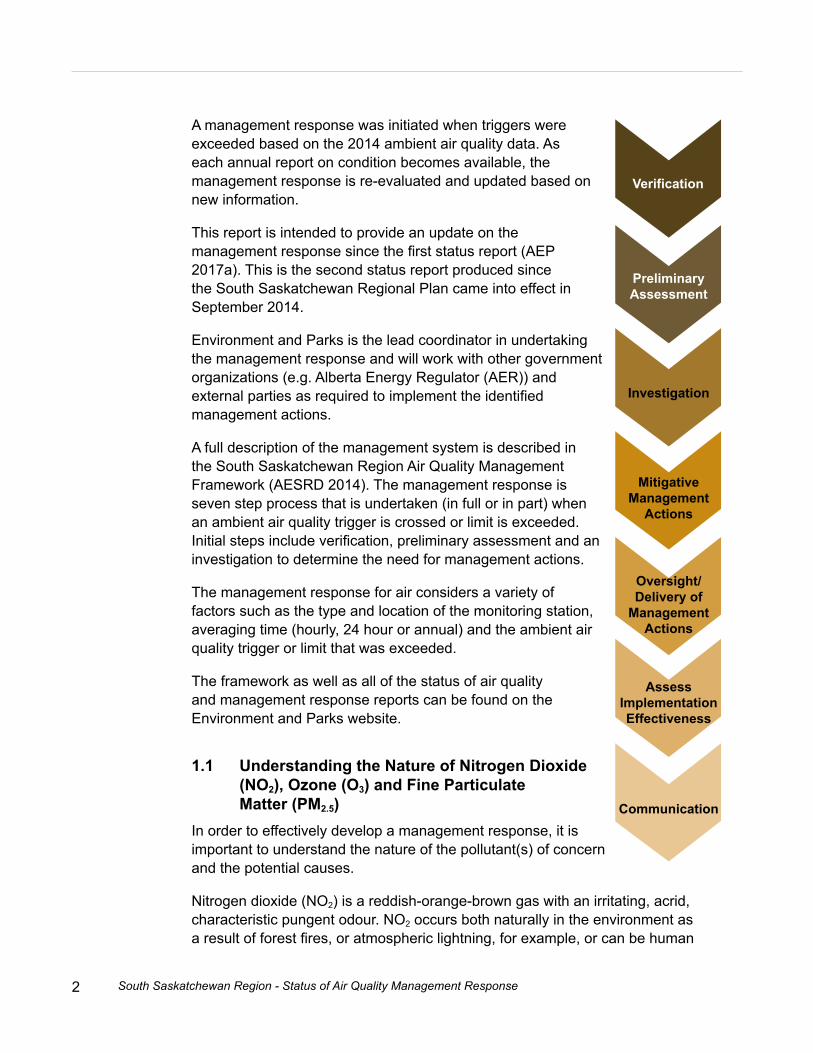
A management response was initiated when triggers were exceeded based on the 2014 ambient air quality data. As each annual report on condition becomes available, the management response is re-evaluated and updated based on new information.
This report is intended to provide an update on the management response since the first status report (AEP 2017a). This is the second status report produced since the South Saskatchewan Regional Plan came into effect in September 2014.
Environment and Parks is the lead coordinator in undertaking the management response and will work with other government organizations (e.g. Alberta Energy Regulator (AER)) and external parties as required to implement the identified management actions.
A full description of the management system is described in the South Saskatchewan Region Air Quality Management Framework (AESRD 2014). The management response is seven step process that is undertaken (in full or in part) when an ambient air quality trigger is crossed or limit is exceeded. Initial steps include verification, preliminary assessment and an investigation to determine the need for management actions.
The management response for air considers a variety of factors such as the type and location of the monitoring station, averaging time (hourly, 24 hour or annual) and the ambient air quality trigger or limit that was exceeded.
The framework as well as all of the status of air quality and management response reports can be found on the Environment and Parks website.
1.1 Understanding the Nature of Nitrogen Dioxide (NO2), Ozone (O3) and Fine Particulate Matter (PM2.5)In order to effectively develop a management response, it is important to understand the nature of the pollutant(s) of concern and the potential causes.
Nitrogen dioxide (NO2) is a reddish-orange-brown gas with an irritating, acrid, characteristic pungent odour. NO2 occurs both naturally in the environment as a result of forest fires, or atmospheric lightning, for example, or can be human
Verification
PreliminaryAssessment
MitigativeManagement
Actions
Oversight/Delivery of
ManagementActions
Investigation
AssessImplementationEffectiveness
Communication

3South Saskatchewan Region - Status of Air Quality Management Response
caused, mainly the result of combustion processes, such as the combustion of fuel for vehicles or the combustion of coal, oil and natural gas for heating or industrial processes. NO2 can be directly released to air but more often, it is produced by the conversion of nitric oxide (NOx) released from combustion processes. In sunlight, NO2 can lead to the formation of ozone, nitric acid and nitrate-containing particles (AEP 2011a).
Ground-level ozone is a colourless gas which comes from natural causes such as vegetative processes or from human caused emissions. Ozone is not directly emitted into the atmosphere but is formed through complex chemical reactions between emissions of nitrogen oxides and volatile organic compounds in the presence of heat and sunlight.
Particulate matter refers to either solid or liquid particles suspended in the atmosphere. The size distribution and composition of particulate matter is a significant factor in determining the risks posed to human health. Fine particulate matter (PM2.5) has a diameter less than 2.5µm. These smaller particles can penetrate deeper into the lungs, irritating the respiratory system, reducing the effective surface area for oxygen exchange or can also transfer toxic compounds in particulate matter into the blood stream (AEP 2013).
PM2.5 comes from both natural and human caused sources. Natural sources of PM2.5 include wind-blown dust and forest or grass fires. Examples of human caused sources include transportation, industrial processes, home heating, and burning of vegetation for land clearing and land-use change (AEP 2013). PM2.5 can be emitted directly into the atmosphere (known as primary PM2.5) or derived as secondary PM2.5 which is formed in the atmosphere from chemical reactions involving other gases (e.g., sulphur dioxide (SO2), nitrous oxides (NOx) and volatile organic compounds (VOCs)) reacting in favourable meteorological conditions. Management actions need to not only consider primary emissions of PM2.5, but will also need to target the known gases that contribute to the formation of secondary PM2.5.
Air pollution from nitrogen dioxide, ozone and fine particulate matter can have serious impacts on human and environmental health. Health impacts linked to these pollutants include chronic bronchitis, asthma and premature deaths (CCME 2017). Air pollution also results in increased costs and pressures on the health care system. Environmental effects of the framework indicators include reduced visibility, crop damage and greater vulnerability to disease in some tree species (CCME 2017).
4 South Saskatchewan Region - Status of Air Quality Management Response
Summary of Ambient Levels Assigned2.0
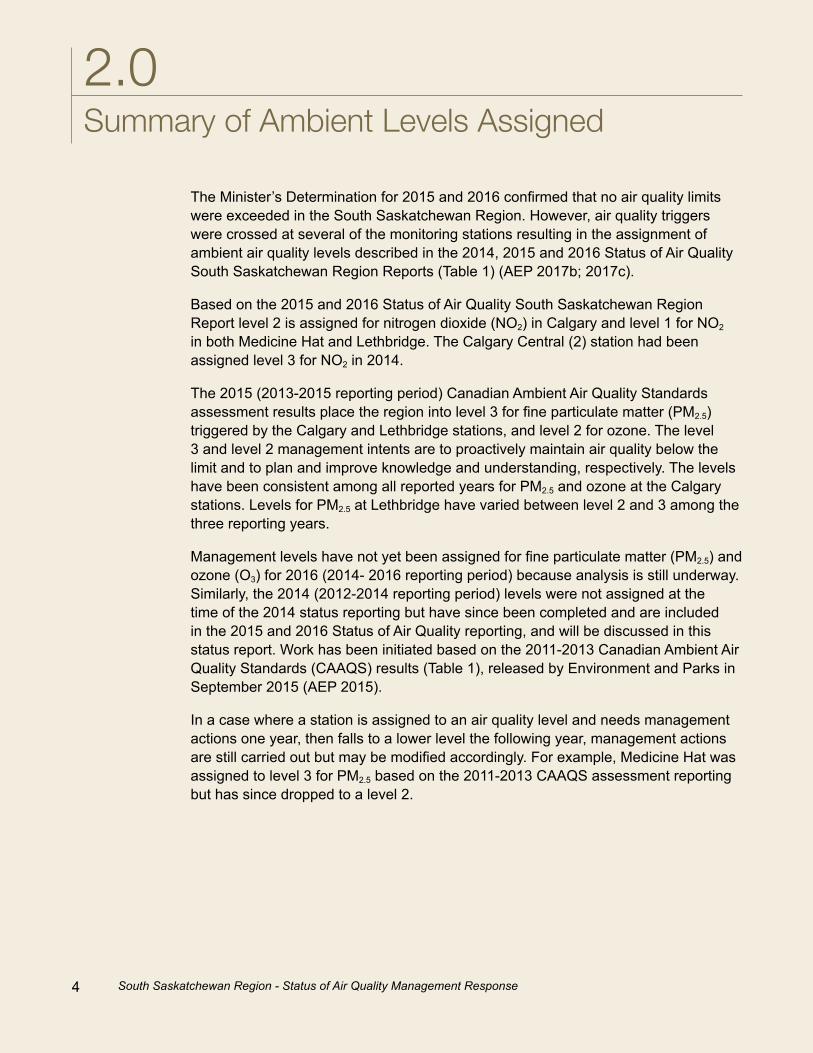
The Minister’s Determination for 2015 and 2016 confirmed that no air quality limits were exceeded in the South Saskatchewan Region. However, air quality triggers were crossed at several of the monitoring stations resulting in the assignment of ambient air quality levels described in the 2014, 2015 and 2016 Status of Air Quality South Saskatchewan Region Reports (Table 1) (AEP 2017b; 2017c).
Based on the 2015 and 2016 Status of Air Quality South Saskatchewan Region Report level 2 is assigned for nitrogen dioxide (NO2) in Calgary and level 1 for NO2 in both Medicine Hat and Lethbridge. The Calgary Central (2) station had been assigned level 3 for NO2 in 2014.
The 2015 (2013-2015 reporting period) Canadian Ambient Air Quality Standards assessment results place the region into level 3 for fine particulate matter (PM2.5) triggered by the Calgary and Lethbridge stations, and level 2 for ozone. The level 3 and level 2 management intents are to proactively maintain air quality below the limit and to plan and improve knowledge and understanding, respectively. The levels have been consistent among all reported years for PM2.5 and ozone at the Calgary stations. Levels for PM2.5 at Lethbridge have varied between level 2 and 3 among the three reporting years.
Management levels have not yet been assigned for fine particulate matter (PM2.5) and ozone (O3) for 2016 (2014- 2016 reporting period) because analysis is still underway. Similarly, the 2014 (2012-2014 reporting period) levels were not assigned at the time of the 2014 status reporting but have since been completed and are included in the 2015 and 2016 Status of Air Quality reporting, and will be discussed in this status report. Work has been initiated based on the 2011-2013 Canadian Ambient Air Quality Standards (CAAQS) results (Table 1), released by Environment and Parks in September 2015 (AEP 2015).
In a case where a station is assigned to an air quality level and needs management actions one year, then falls to a lower level the following year, management actions are still carried out but may be modified accordingly. For example, Medicine Hat was assigned to level 3 for PM2.5 based on the 2011-2013 CAAQS assessment reporting but has since dropped to a level 2.
5South Saskatchewan Region - Status of Air Quality Management Response
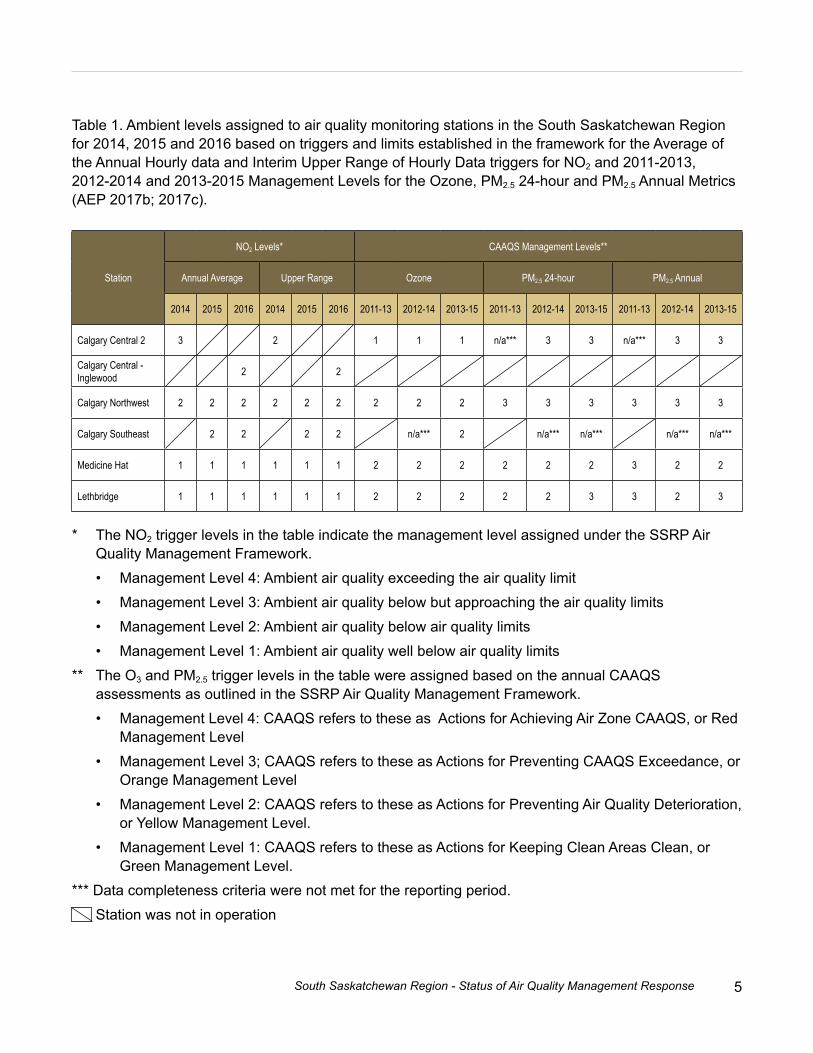
Table 1. Ambient levels assigned to air quality monitoring stations in the South Saskatchewan Region for 2014, 2015 and 2016 based on triggers and limits established in the framework for the Average of the Annual Hourly data and Interim Upper Range of Hourly Data triggers for NO2 and 2011-2013, 2012-2014 and 2013-2015 Management Levels for the Ozone, PM2.5 24-hour and PM2.5 Annual Metrics (AEP 2017b; 2017c).
Station
NO2 Levels* CAAQS Management Levels**
Annual Average Upper Range Ozone PM2.5 24-hour PM2.5 Annual
2014 2015 2016 2014 2015 2016 2011-13 2012-14 2013-15 2011-13 2012-14 2013-15 2011-13 2012-14 2013-15
Calgary Central 2 3 2 1 1 1 n/a*** 3 3 n/a*** 3 3
Calgary Central - Inglewood 2 2
Calgary Northwest 2 2 2 2 2 2 2 2 2 3 3 3 3 3 3
Calgary Southeast 2 2 2 2 n/a*** 2 n/a*** n/a*** n/a*** n/a***
Medicine Hat 1 1 1 1 1 1 2 2 2 2 2 2 3 2 2
Lethbridge 1 1 1 1 1 1 2 2 2 2 2 3 3 2 3
* The NO2 trigger levels in the table indicate the management level assigned under the SSRP Air Quality Management Framework.
• Management Level 4: Ambient air quality exceeding the air quality limit
• Management Level 3: Ambient air quality below but approaching the air quality limits
• Management Level 2: Ambient air quality below air quality limits
• Management Level 1: Ambient air quality well below air quality limits
** The O3 and PM2.5 trigger levels in the table were assigned based on the annual CAAQS assessments as outlined in the SSRP Air Quality Management Framework.
• Management Level 4: CAAQS refers to these as Actions for Achieving Air Zone CAAQS, or Red Management Level
• Management Level 3; CAAQS refers to these as Actions for Preventing CAAQS Exceedance, or Orange Management Level
• Management Level 2: CAAQS refers to these as Actions for Preventing Air Quality Deterioration, or Yellow Management Level.
• Management Level 1: CAAQS refers to these as Actions for Keeping Clean Areas Clean, or Green Management Level.
*** Data completeness criteria were not met for the reporting period.
Station was not in operation

6 South Saskatchewan Region - Status of Air Quality Management Response
Status of Management Response3.0
The management response is a set of steps that is taken (in full or in part) when an ambient trigger or limit is exceeded. The management response will support the management intent associated with each trigger level or limit exceeded (Table 2 and Table 3) A full description of the management system is found in the South Saskatchewan Region Air Quality Management Framework for Nitrogen Dioxide (NO2), Ozone (O3) and Fine Particulate Matter (PM2.5).
Level Description Management Intent4 Ambient air quality exceeding
the air quality limitImprove ambient air quality to below the limit
Limit3 Ambient air quality below but
approaching the air quality limitsProactively maintain air quality below the limit
Trigger into Level 32 Ambient air quality below air
quality limitsImprovide knowledge and understanding, and plan
Trigger into Level 21 Ambient air quality below air
quality limitsMaintain air quality through standard regulatory and non-regulatory approaches
Table 2. Description and Management Intent for Average of Annual Hourly Data for NO2 and the PM2.5 and O3 Ambient Air Quality
7South Saskatchewan Region - Status of Air Quality Management Response
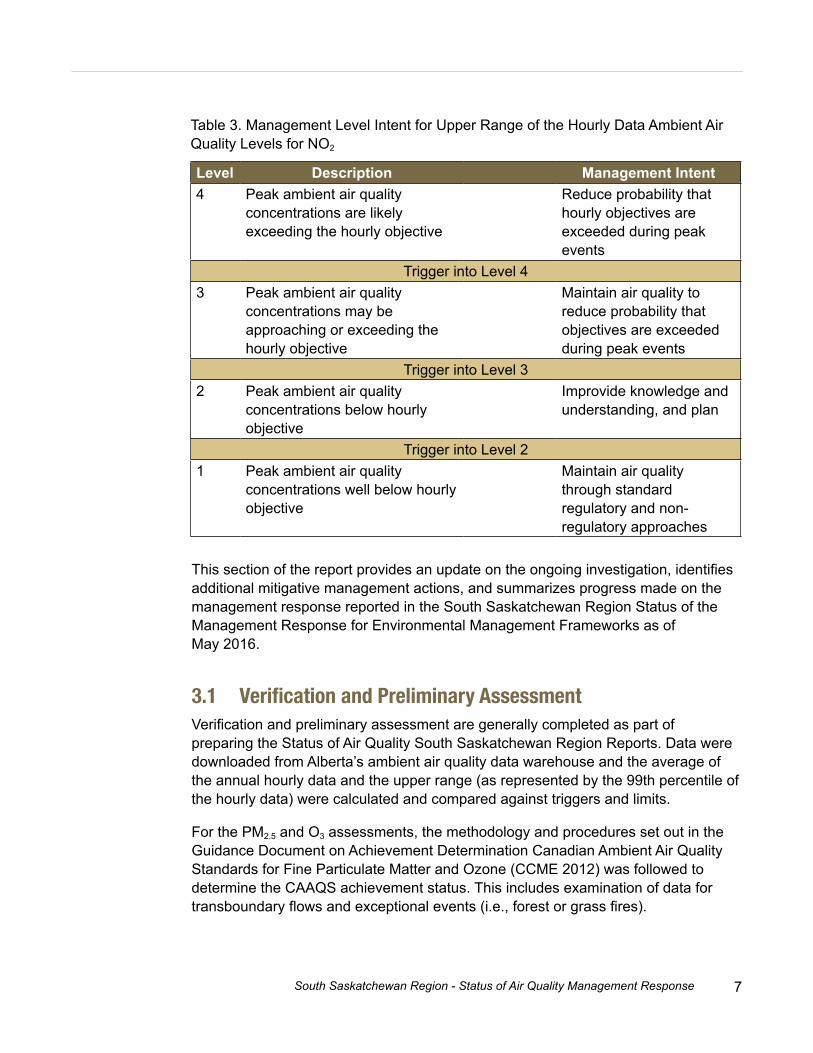
Table 3. Management Level Intent for Upper Range of the Hourly Data Ambient Air Quality Levels for NO2
Level Description Management Intent4 Peak ambient air quality
concentrations are likely exceeding the hourly objective
Reduce probability that hourly objectives are exceeded during peak events
Trigger into Level 43 Peak ambient air quality
concentrations may be approaching or exceeding the hourly objective
Maintain air quality to reduce probability that objectives are exceeded during peak events
Trigger into Level 32 Peak ambient air quality
concentrations below hourly objective
Improvide knowledge and understanding, and plan
Trigger into Level 21 Peak ambient air quality
concentrations well below hourly objective
Maintain air quality through standard regulatory and non-regulatory approaches
This section of the report provides an update on the ongoing investigation, identifies additional mitigative management actions, and summarizes progress made on the management response reported in the South Saskatchewan Region Status of the Management Response for Environmental Management Frameworks as of May 2016.
3.1 VerificationandPreliminaryAssessmentVerification and preliminary assessment are generally completed as part of preparing the Status of Air Quality South Saskatchewan Region Reports. Data were downloaded from Alberta’s ambient air quality data warehouse and the average of the annual hourly data and the upper range (as represented by the 99th percentile of the hourly data) were calculated and compared against triggers and limits.
For the PM2.5 and O3 assessments, the methodology and procedures set out in the Guidance Document on Achievement Determination Canadian Ambient Air Quality Standards for Fine Particulate Matter and Ozone (CCME 2012) was followed to determine the CAAQS achievement status. This includes examination of data for transboundary flows and exceptional events (i.e., forest or grass fires).

8 South Saskatchewan Region - Status of Air Quality Management Response
3.2 InvestigationUpdateAnalysis of ambient concentrations and trends and the identification of potential emission sources leading to elevated ambient concentrations are ongoing. A summary of the work completed since the last status report is described below. The analysis of ambient trends discussed in the following sections has focused on stations assigned to a level 3 in the 2014 Status of Air Quality report as that was the data available at the time.
3.2.1 2014 Investigation – Nitrogen Dioxide (NO2) – Level 3 StationThe NO2 investigation has focused on the Calgary Central station where the trigger into level 3 was exceeded in 2014. In order to gain a better understanding of NO2 trends and conditions, historical data were analyzed from this station. The data analysis explored temporal variations of nitrogen dioxide events. Elevated concentrations or ‘events’ were defined as 1-hour averaged NO2 concentrations greater than 16 ppb (30 µg/m3) (the trigger into level 3). Wind information was not collected at the station, given its location in the downtown core; therefore meteorological impacts were not able to be explored.
Figure 2 shows the variation of high concentrations by hour of the day for both the 2014 and the 2011-2014 time periods. Although elevated concentrations occur at all hours of the day a period of higher NO2 concentrations is noted in the morning hours peaking between 7 and 10 am. Higher ambient concentrations are common during this time of day since the boundary layer in the atmosphere is lower, which leads to less mixing height for ambient concentrations to disperse. Ambient NO2 is most often due to combustion activities such as commercial and residential heating, traffic or industrial activities. The monitoring station is located in the downtown core thus the surrounding land use includes office towers and paved roadways. The land use and the time of day that elevated concentrations are occurring implies that traffic emissions could likely be a driver for elevated concentrations. A frequency of higher concentrations is less evident during the afternoon rush hours as the boundary layer is higher, thus allowing for more mixing and dispersion of emissions.
9South Saskatchewan Region - Status of Air Quality Management Response
Figure 2. Percentage of one hour NO2 samples greater than 16 ppb for each hour of the day for 2014 and 2011-2014 at the Calgary Central monitoring station.
80
60
40
01 2 3 4 5 6 7 8 9 10 11 12 13 14 15 16 17 18 19 20 21 22 23 24
Hour of Day
20142011-2014
Perc
enta
ge o
f one
hou
r NO
2 sa
mpl
e >
16 p
pb
20
Figure 3 shows the variation of high concentrations by month of the year for both the 2014 and the 2011-2014 time periods. Although elevated concentrations occur during every month of the year, higher events occurred more often in the winter months (October through March). This is a common occurrence across Alberta due to meteorological conditions such as inversions occurring more often in the winter season. Inversions are frequent during the winter months, when nights are long and the sun, low on the horizon, heats the atmosphere more than the earth’s surface, thus preventing the vertical movement of air from the surface. Without vertical mixing pollution in the cooler air closer to ground level gets trapped below the warmer layer of air above.
Figure 3 Percentage of one hour NO2 samples greater than 16 ppb for each month of the year for 2014 and 2011-2014 at the Calgary Central monitoring station.
100
80
60
40
20
0
Perc
enta
ge o
f one
hou
r NO
2 sa
mpl
e >
16 p
pb
Jan Feb Mar Apr May Jun Jul Aug Sep Oct Nov Dec
Sample Month
2014 2011-2014

10 South Saskatchewan Region - Status of Air Quality Management Response
Figure 4 shows the variation of high concentrations by year for 2011 through 2014. Although elevated concentrations occurred in all years of the time period studied, 2014 had the highest frequency of occurrence of elevated concentrations.
50
40
30
20
10
02011 2012 2013 2014
Sample Year
Calgary Central
Perc
enta
ge o
f one
hou
r NO
2 sam
ple
> 16
ppb
Figure 4. Percentage of one hour NO2 samples greater than 16 ppb by year for 2011, 2012, 2103 and 2014 at the Calgary Central monitoring station.
Figure 5 shows a longer term trend of the annual averages for NO2 at the various Calgary ambient air monitoring station locations from 2000 to 2014. As indicated in Figure 5, the annual overall NO2 trends are slowly decreasing. The decreases in NO2 are likely the result of improved pollution reduction technologies in motor vehicles.
3.2.2 2014 Investigation – Fine Particulate Matter (PM2.5) – Level 3 StationsThe PM2.5 investigation focused on the Calgary Northwest, Lethbridge and Medicine Hat monitoring stations where the trigger into level 3 was exceeded in 2014. In order to gain a better understanding of PM2.5 trends and conditions, historical data was analyzed from these air monitoring stations. The data analysis explored temporal variations of PM2.5 events and associated meteorological conditions. Elevated concentrations or ‘events’ were defined as 24-hour averaged PM2.5 concentrations greater than 19 µg/m3 (the trigger into level 3).

11South Saskatchewan Region - Status of Air Quality Management Response
Figure 5. Annual average NO2 concentrations from 2000 through 2014 at the Calgary Central, Calgary Central (2), Calgary Southeast and Calgary Northwest monitoring stations.
2000 2002 2004 2006 2008 2010 2012 2014
30x10-3
25
20
15
10
5
0
NO
2 (pp
m)
CentralCentral 2EastNorthest
The data from the 2011-2013 CAAQS assessment reporting was analyzed as that was the information available. As part of the CAAQS assessment, the sample days with identified transboundary and exceptional events (which includes days identified as impacted by forest or grass fires) were removed from the data in order to isolate the human caused concentrations.
Figure 6 shows the variation of high concentrations by hour of the day for the Calgary Northwest, Lethbridge and Medicine Hat stations during the 2011-2013 time period. Although elevated concentrations occur at all hours of the day a period of higher NO2 concentrations is noted in the morning hours peaking between 7 and 10 am at the Lethbridge and Medicine Hat stations. Similar boundary layer affects are impacting PM2.5 concentrations as seen in the NO2 analysis. The land use and the time of day that elevated concentrations are occurring implies that traffic emissions could be a driver for elevated concentrations.
Elevated concentrations at the Calgary Northwest station were most likely to occur in the early afternoon and later into the evening under the nocturnal boundary layer. The nocturnal boundary layer forms after sunset, when the ground begins to cool, in turn cooling the air immediately above it. This creates a thick blanket of cold, calm air close to the earth’s surface. Cool air sinks, preventing the vertical mixing that usually disperses pollutants into the atmosphere during the day.

12 South Saskatchewan Region - Status of Air Quality Management Response
Figure 6. Percentage of 24 hour PM2.5 samples greater than 19 µg/m3 for each hour of the day for 2011-2013 at the Calgary Northwest, Lethbridge and Medicine Hat monitoring stations.
8
6
4
2
01 2 3 4 5 6 7 8 9 10 11 12 13 14 15 16 17 18 19 20 21 22 23 24
Hour of Day
Calgary Lethbridge Medicine Hat
Perc
enta
ge o
f dat
a w
ith P
M2.
5 > 1
9m g
/m3
The seasonal PM2.5 variation was similar between the data from all the South Saskatchewan air monitoring stations, as indicated in Figure 7. Although elevated concentrations may be observed throughout the year, such concentrations were more likely in the colder winter months (November through March) and least likely to be observed in the summer. March had the highest occurrence of elevated particulate matter days across the region. The frequency of elevated concentrations was also higher in August at the Calgary Northwest station and September at the Calgary Northwest and Lethbridge stations. These are most likely due to residual forest fire effects where days that did not fit the exclusion criteria (transboundary and exceptional events) were included but are adjacent to days experiencing forest fire smoke events.
Figure 8 shows the variation of high concentrations by year for 2011 through 2013. For Lethbridge and Medicine Hat, the percentage of data with elevated concentrations occurred similarly across all three years, with only slight differences of annual occurrence. At the Calgary Northwest station, the frequency of elevated concentration events appears to be slightly dropping from 2011 through 2013. A long-term trend of PM2.5 concentrations cannot be shown at this time due to insufficient data availability and the change in monitoring technology to more sensitive equipment in 2009, thus changing the overall monitored trend. The possibility of a downward trend will be further examined as additional years of data become available.

13South Saskatchewan Region - Status of Air Quality Management Response
18
14
12
10
8
6
4
2
0
Perc
enta
ge o
f dat
a w
ith P
M2.
5 > 1
9 µg
/m3
Jan Feb Mar Apr May Jun Jul Aug Sep Oct Nov Dec
Month
Calgary Lethbridge Medicine Hat
Figure 7 Percentage of 24 hour PM2.5 samples greater than 19 µg/m3 for each month of the year for 2011-2013 at the Calgary Northwest, Lethbridge and Medicine Hat monitoring stations.
Figure 8 Percentage of 24 hour PM2.5 samples greater than 19 µg/m3 by year for 2011, 2012 and 2013 at the Calgary Northwest, Lethbridge and Medicine Hat monitoring stations.
Calgary Lethbridge Medicine Hat
8
6
4
2
0
Perc
enta
ge o
f dat
a w
ith P
M2.
5 > 1
9m g
/m3
2011 2012 2013Year

14 South Saskatchewan Region - Status of Air Quality Management Response
0
0.03
0.06
0.09
0.12
0.15
0.18
0.03 0.06 0.09 0.12 0.15 0.18
0
45
90
135
180
225
270
315
Wind Speed (km/hr)0 - 10 10 - 20 20 - 30 30+
0
0.025
0.05
0.075
0.1
0.125
0.025 0.05 0.075 0.1 0.125
0
45
90
135
180
225
270
315
Wind Speed (km/hr)0 - 5 5 - 10 10 - 15 15 - 20 20 - 25 25+
0
0.03
0.06
0.09
0.12
0.15
0.18
0.03 0.06 0.09 0.12 0.15 0.18
0
45
90
135180
225
270
315
Wind Speed (km/hr)0 - 5 5 - 10 10 - 15 15 - 20 20+
Figure 9 Wind Roses (Wind Speed and Direction) at Calgary Northwest station (a), Lethbridge station (b) and Medicine Hat station (c) for sample periods when 24 hour PM2.5 concentrations were greater than 19 µg/m3 (2011-2013).
a) b)
c)
Wind roses reflect the relative frequency of the wind direction and wind speed at a particular place over a period of time. Figure 9 shows the wind roses (wind speed and direction) at Calgary Northwest station (a), Lethbridge station (b) and Medicine Hat station (c) for sample periods when 24 hour PM2.5 concentrations were greater than 19 µg/m3 for the 2011-2013 time period. Although elevated concentrations were observed to occur from all directions at any speed, the wind directions with the greatest percentage of elevated concentrations were distinctly associated with low wind speeds. Lower wind speeds inhibit dispersion of fine particulate matter and other pollutant gases.
15South Saskatchewan Region - Status of Air Quality Management Response
Another factor influencing elevated PM2.5 levels across the province was the replacement of particulate monitoring technology to more sensitive equipment in 2009 increasing the overall monitored trend of PM2.5. These factors plus more stringent air quality standards (CAAQS) have triggered the need for air quality management in the smaller urban centres of Medicine Hat and Lethbridge as well as Calgary where a PM and O3 Management Plan has been implemented since 2008 (SNC-Lavalin 2014).
3.2.3 2015 Investigation – Fine Particulate Matter (PM2.5) – Level 3 StationsThe 2015 and 2016 Status of Air Quality South Saskatchewan Region Report (AEP 2017c) identifies an additional station that has been assigned a level 3 for PM2.5. The ongoing investigation will expand to include the Calgary Central (2) station for PM2.5 and analysis of the additional years of data for the other stations will be conducted, upon availability.
3.2.4 Emission Trends for NOx and PM2.5
Both point and non-point emission sources contribute to ambient air concentrations. Nitrogen oxides, which oxidize to NO2 upon release to the atmosphere, are directly emitted into the atmosphere, whereas particulate matter can be emitted directly (known as primary particulate matter) or derived as secondary particulate matter which is formed in the atmosphere from chemical reactions involving other gases (e.g., sulphur dioxide, nitrous oxides and volatile organic compounds) reacting in favourable meteorological conditions. Management actions need to not only consider primary emissions of PM2.5, but will also target the known gases that contribute to the formation of secondary PM2.5.
Figure 10 shows the total human-caused nitrogen oxide (a) and primary PM2.5 emissions (b) from 1985 to 2013 for the South Saskatchewan region as well as emissions broken down by the four largest contributing sectors. This information is based on the Environment and Climate Change Canada 1985-2013 Air Pollutant Emission Inventory (ECCC 2015a). This data set is complemented with data from the Environment and Climate Change Canada National Pollutant Release Inventory, a compilation of the reported pollution emissions from industrial facilities (ECCC 2015b).
16 South Saskatchewan Region - Status of Air Quality Management Response
Figure 10: Historical time series of nitrogen oxide (a) and primary fine particulate matter (b) emissions in the South Saskatchewan Region (ECCC 2015a; 2015b).
1985
1986
1987
1988
1989
1990
1991
1992
1993
1994
1995
1996
1997
1988
1989
2000
2001
2002
2003
2004
2005
2006
2007
2008
2009
2010
2011
2012
2013
200,000
180,000
160,000
140,000
120,000
100,000
80,000
60,000
40,000
20,000
0
1985 to 2013 South SaskatchewanNOx Emissions (tonnes)
Total Anthropogenic Sources Transportation Conventional O&G
1985
1986
1987
1988
1989
1990
1991
1992
1993
1994
1995
1996
1997
1988
1989
2000
2001
2002
2003
2004
2005
2006
2007
2008
2009
2010
2011
2012
2013
250,000
200,000
150,000
100,000
50,000
0
1985 to 2013 South SaskatchewanPM2.5 Emissions (tonnes)
Total Anthropogenic Sources Road Dust Conventional O&G
Agriculture Industrial

17South Saskatchewan Region - Status of Air Quality Management Response
This inventory is a national and provincial/territorial level emissions inventory prepared for meeting various international reporting obligations and to inform Canadians about air emission levels. The inventory provides emission trends for a long period of time, which can be used to help indicate how emission levels in Alberta (and specific large regions of the province) have changed over time. It does not provide emissions data more detailed than totals for large regions of Alberta. As with any emissions inventory this data has various limitations and is developed using a combination of reported industrial emissions and area and mobile source emissions determined using various models and top-down estimation methods. The information is valuable however, for showing reasonable overall emission trends.
Total South Saskatchewan Region emissions of primary PM2.5 have generally been increasing steadily over the last 15 years. Emissions from substances that contribute to the formation of secondary PM2.5 such as nitrous oxides and volatile organic compounds have seen a slow decrease and sulphur dioxide emissions have greatly decreased, likely due to adoption of more sophisticated industrial pollution abatement equipment. Ammonia emissions have slowly risen since 1990 due to increased agricultural production. Particulate matter emissions are expected to continue to increase as population growth continues with associated development unless management actions are implemented.
3.2.5 EmissionSourceInventoryProfilesEmission inventories are used to track emission sources in a particular area for a specific period of time. Inventories include both point sources (emissions from a single identifiable, stationary source) and non-point sources (mobile, area, line, volume or group of point sources that don’t have a single point of origin). Examples of point sources include industrial facility stack emission sources, whereas, examples of non-point sources include emissions from vehicles and commercial and home heating etc. Many emissions are not directly measured (predominate for non-point sources) but must be estimated using various models and or top down estimation methods.
Emission inventories quantify the source contribution to primary (directly emitted) air pollutants, whereas, secondary air pollutants that form in the atmosphere as a result of complex reactions and chemical transformations are not presented. Ambient concentrations measured at the continuous monitoring stations in the region contain both primary and secondary air pollutants. Another consideration, when using inventory information, is that the emission totals are annual totals, although emissions may be seasonal and may not make a contribution to air quality year round.
18 South Saskatchewan Region - Status of Air Quality Management Response
The Alberta Air Emissions Inventory (AEP 2011b) was used to identify major anthropogenic sources in the Calgary, Lethbridge and Medicine Hat Census Metropolitan Areas. The Census Metropolitan Areas (CMAs) are areas consisting of one or more neighbouring municipalities situated around a major urban core and represent a greater extent of possible emissions impacting a monitoring station.
The Alberta Air Emissions Inventory is an emissions inventory with source-level emissions information down to the census subdivision (county/city) level for a single representative year. While these data are a few years old, they represent the most complete and comprehensive information available for the sub-regions within the South Saskatchewan Region, including non-point sources, and small sources, and are felt to be representative of the current breakdown of emissions.
Figures 11, 12 and 13 provide emissions of selected parameters, showing total mass emissions by pollutant (top) and percent of total emissions by sector (bottom) for the Calgary, Lethbridge and Medicine Hat CMAs, respectively. Primary PM2.5 has the largest mass emission rate for the Calgary CMA followed by NOx and volatile organic compounds (VOCs). The emission sectors contributing the greatest amounts to primary PM2.5 are open area sources such as construction and road dust whereas NOx emissions are dominated by both on and off-road transportation.
The mass emission rates in the Lethbridge CMA are dominated by VOCs followed by ammonia and PM2.5. The agriculture sector contributes the greatest amounts to both the VOCs and ammonia emissions. The emission source sector contributing the most to primary PM2.5 emissions is the open area source sector including emissions from road and construction dust.
NOx has the largest mass emission rate for the Medicine Hat CMA followed by VOCs and PM2.5. The emission sectors contributing the greatest amounts to NOx emissions are the industrial source sector followed by transportation. The largest contributing industries to the industrial sector include oil and gas and the chemical and fertilizer industries. VOCs are also dominated by the industrial source sector whereas open area sources contribute the greatest to primary PM2.5 emissions.
Overall, non-point sources are the largest contributors to primary PM2.5 emission sources in all three cities and to NOx emissions in Calgary and Lethbridge. Industrial activities dominate the NOx emissions in the Medicine Hat CMA.

19South Saskatchewan Region - Status of Air Quality Management Response
Figure 11. Total Mass Emissions by Pollutant (top) and Percent of Total Emissions by Sector (bottom) for the Calgary Census Metropolitan Area (AEP 2011b).
0
10,000
20,000
30,000
40,000
50,000
60,000
70,000
80,000
90,000
Mas
s em
issio
n ra
te (t
onne
s/ye
ar)
CMA Total Emissions
0%
10%
20%
30%
40%
50%
60%
70%
80%
90%
100%
(Fine ParticulateMatter)*
(Sulphur dioxide) (Oxides of Nitrogen) (Volatile organicComponds)
(Ammonia)
PM2.5 SO2 NOx VOCs NH3
Perc
ent o
f tot
al C
MA
emiss
ions
(%) Open Area Sources - Agriculture
Open Area Sources
Residential and Commercial Heating
Transportation - Off Road
Transportation - On Road
Miscellaneous Non-point Sources
Industrial - Non-point Sources
Industrial - Other
Industrial - Rock, Sand and Gravel
Industrial -Grain Industries
Industrial - Oil and Gas
Non-point Sources
Point Sources
0
2,000
4,000
6,000
8,000
10,000
12,000
14,000
16,000
Mas
s em
issio
n ra
te (t
onne
s/ye
ar)
CMA Total Emissions
0%
10%
20%
30%
40%
50%
60%
70%
80%
90%
100%
(Fine ParticulateMatter)*
(Sulphur dioxide) (Oxides of Nitrogen) (Volatile organicComponds)
(Ammonia)
PM2.5 SO2 NOx VOCs NH3
Perc
ent o
f tot
al C
MA
emiss
ions
(%) Open Area Sources - Agriculture
Open Area Sources
Residential and Commercial Heating
Transportation - Off Road
Transportation - On Road
Miscellaneous Non-point Sources
Industrial - Non-point Sources
Industrial - Other
Industrial - Food Preparation
Industrial -Grain Industries
Industrial - Oil and Gas
Non-point Sources
Point Sources
Figure 12. Total Mass Emissions by Pollutant (top) and Percent of Total Emissions by Sector (bottom) for the Lethbridge Census Metropolitan Area (AEP 2011b).

20 South Saskatchewan Region - Status of Air Quality Management Response
Figure 13. Total Mass Emissions by Pollutant (top) and Percent of Total Emissions by Sector (bottom) for the Medicine Hat Census Metropolitan Area (AEP 2011b).
0
5,000
10,000
15,000
20,000
25,000
30,000
Mas
s em
issio
n ra
te (t
onne
s/ye
ar)
CMA Total Emissions
0%
10%
20%
30%
40%
50%
60%
70%
80%
90%
100%
(Fine ParticulateMatter)*
(Sulphur dioxide) (Oxides of Nitrogen) (Volatile organicComponds)
(Ammonia)
PM2.5 SO2 NOx VOCs NH3
Perc
ent o
f tot
al C
MA
emiss
ions
(%)
Open Area Sources
Residential and Commercial Heating
Transportation - Off Road
Transportation - On Road
Miscellaneous Non-point Sources
Industrial - Non-point Sources
Industrial - Other
Industrial - Fertilizer
Industrial -Chemical
Industrial - Oil and Gas
Non-point Sources
Point Sources
3.2.6 Investigation SummaryThe findings of the investigation completed so far provide valuable information to better understand the factors contributing to the elevated NO2 and PM2.5 concentrations in the region. The seasonal variation was similar between the monitoring data measured at all the air monitoring stations in the South Saskatchewan region. While elevated concentrations may be observed throughout the year, such concentrations were more likely in the winter months during calm conditions. The seasonal variation of event days and the association of event days with lower wind speeds suggest that dispersion limiting mechanisms are likely driving NO2 and PM2.5 events.
Although some emissions have decreased in recent years, PM2.5 emissions have steadily increased. In addition to industrial point sources, un-regulated, non-point sources have been identified as significant contributors to the air emissions profile in the areas around the monitoring stations. Point source pollution is a term used to describe emissions from a single discharge source that can be easily identified. Non-point source pollution is subtle and gradual, caused by the release of pollutants from many different and diffuse sources largely managed in Alberta by a mixture of municipal, provincial and federal initiatives, and associated with activities such as industry, transportation, urbanization and agriculture. Management of non-point source emitters is inherently complex; it is an inter-governmental and cross-jurisdictional issue.
21South Saskatchewan Region - Status of Air Quality Management Response
Overall, the investigation findings to date suggest that effective management should focus on urban non-point source emissions, however further investigation into particulate matter composition and the spatial and temporal variations of pollutants are recommended to confirm this assumption. Management of non-point sources is a challenge given the multitude of contributing emissions; determining appropriate management approaches requires collaboration amongst a variety of stakeholders.
3.3 IdentificationofManagementActionsThe management intents at Level 2 and 3 are to improve knowledge and understanding, and plan and to proactively maintain air quality below the limit, respectively. Based on the current information and understanding about key sectors and pressures within the South Saskatchewan region, AEP staff met with the Palliser Airshed Society, Calgary Region Airshed Zone and Lethbridge area stakeholders to identify initiatives that are already committed to or underway that contribute to the overall management of PM2.5. Particulate matter was the substance of focus at the time, as the need to manage this substance was triggered for Calgary, Lethbridge and Medicine Hat. Some initiatives directly relate to PM2.5 while others relate indirectly through the management of gases which can lead to the PM formation (NOx, SO2 and VOCs). The added benefit of many of the listed actions is that NOx emissions are directly or indirectly managed as well. These actions and initiatives were compiled into a South Saskatchewan Region Air Quality Management Action Plan, which is included in Appendix A. Collectively the management initiatives as a whole comprise a plan to achieve the goal of maintaining and improving air quality.
Stakeholder discussions were initiated based on the Alberta Air Zones Report: 2011-2013 (AEP 2015) which contained the initial assessment against the Canadian Ambient Air Quality Standards (CAAQS) for PM2.5 and O3 because the 2014 Status of Air Quality, South Saskatchewan Region Report was not yet published.
Achieving the goal of the management actions within the South Saskatchewan region requires a proactive and future based approach. Management actions are intended to support, rather than replace existing policies and regulations. These actions range from policy or regulatory initiatives to reduce emissions, to voluntary actions and raising awareness and education surrounding air quality.
The focus of the management actions include gathering baseline information, improving scientific understanding and knowledge, learning from other jurisdictions and identifying initiatives that are already committed or underway that can lead to near and future air quality management. It is important to recognize the impact of implementing certain actions may take several years before being realized. Collaboration of all stakeholders is key to the success of the proactive air management actions.

22 South Saskatchewan Region - Status of Air Quality Management Response
A series of additional recommended management actions were also identified as part of the South Saskatchewan Air Zone Government of Alberta Action Plan Canadian Ambient Air Quality Standards Response (AEP 2017d) which are detailed below. Several of the policies and management actions listed can also apply provincially to improve protection of air quality. Ongoing investigation and studies will continue to inform and establish necessary and appropriate mitigative actions.
Policy Actions:
Alberta is assessing policies that can be applied in air zones that have triggered the need for management. While some of these actions may not be directly applicable to the South Saskatchewan air zone, pollution can be transported long distances, so actions taken in one air zone may lead to air quality improvements in others as well. Technology and equipment standards and policy for point sources such as large industry and non-point sources such as transportation will be assessed.
Action DescriptionEstablish provincial air emission policy, including defining standards / tools to apply to reduce emissions in air zones that require management based on environmental framework trigger exceedances.
Jurisdictional review has been completed and published online.
Based on the jurisdictional review of international policy approaches and regulatory tools applied in areas requiring air quality management, the Government of Alberta will subsequently identify policy gaps and develop tools for air zones that require management based on environmental framework trigger exceedances.
Establish and update source standards for both industrial sectors and equipment to reduce emissions.
Coal fired power plants are some of the major polluters in Alberta, and their emissions can impact air quality across the province. Requiring the electricity generating sector (existing coal-fired units) to meet the Alberta emission management framework standards for sulphur dioxide and nitrogen dioxide to significantly lower fine particulate matter precursor gases. Alberta’s Climate Leadership Plan will phase out coal-fired electricity sources by 2030.
Provincial roll out of more stringent equipment standards for new boilers and heaters.

23South Saskatchewan Region - Status of Air Quality Management Response
Action DescriptionReduce methane emissions in Alberta under the Climate Leadership Plan.
Reduction in methane emissions will have co-benefits in improving air quality. In Alberta, the government’s current initiative to reduce methane by 45% from the oil and gas industry by 2025 will have a co-benefit of also reducing VOCs, precursors to particulate matter and ozone, from these sources.
Action on non-point sources such as transportation.
The Government is collaborating with industry, non-government organizations, and airsheds cross-provincially through the Clean Air Strategic Alliance (CASA) to provide recommendations for potential management actions on non-point source emissions such as transportation and wood burning.
The Government continues to support the development of green transit alternatives and continues to collaborate with federal/provincial/territorial jurisdictions through the Canadian Council of Ministers of the Environment (CCME) Mobile Sources Working Group to help inform further transportation management actions in Alberta.
Provide support and guidance to assist municipalities when making decisions on land-use planning for improved environmental outcomes.
Emissions from municipalities include sources such as vehicles, home-heating furnaces, backyard fire pits, and small engines such as lawn mowers. Provide technical support to municipalities for their planning, by-law development and public education efforts to reduce air emissions.
Better understand contributions from small businesses and manufacturing that do not require an Environmental Protection and Enhancement Act approval to the fine particulate matter issue.
Assess contributions from small businesses and manufacturing to better inform what impacts these have on air quality and help identify partners and promote collaboration.
Update Alberta Ambient Air Quality Objectives
Updates to Objectives for fine particulate matter, ozone, nitrogen dioxide, sulphur dioxide, and hydrogen sulphide and potential new Objective for total reduced sulphur compounds are planned over the next few years.

24 South Saskatchewan Region - Status of Air Quality Management Response
Regulatory Process Actions:
Industrial facilities in Alberta regulated by the Environmental Protection and Enhancement Act operate under the terms and conditions stipulated in their respective approval documents, which include emission control standards. These standards are updated when the facility approval are renewed on a 10-year cycle. Efforts are ongoing to ensure principles of continuous improvement are incorporated into the approval process to support environmental outcomes. The Government of Alberta is committed to taking actions to reduce emissions from existing sources and requiring control technologies on par with leading jurisdictions for major new sources.
Action DescriptionAction on industrial emissions
Industrial approvals in Alberta are normally issued for a ten-year period. The Alberta Energy Regulator and Environment and Parks are requesting more stringent emissions standards be applied to all the industrial sources in renewal applications that are in air zones which require management based on environmental frameworks. Data and information on current operations, management practices and technologies will be collected.
Knowledge Improvement:
Currently, Alberta has the largest network of air monitoring stations in Canada. Alberta Environment and Parks will work with local airshed organizations and other partners to advance the knowledge in the priority areas and inform management approaches.
Action DescriptionAmbient data analysis Analyze available monitoring data to investigate
possible cause or influences on elevated concentrations. Look at links to meteorology (wind/wind direction) and covariance between pollutants. Identify any long term trends etc.
Additional ambient air monitoring
Commissioning of new continuous, permanent air monitoring station in Airdrie.
Short-term mobile air monitoring survey in the City of Lethbridge to assess spatial variability of air quality in the City.
Palliser Airshed Society mobile Airpointer ambient monitor sited temporarily near the Medicine Hat airport to assess representativeness of permanent Crescent Heights station.
25South Saskatchewan Region - Status of Air Quality Management Response
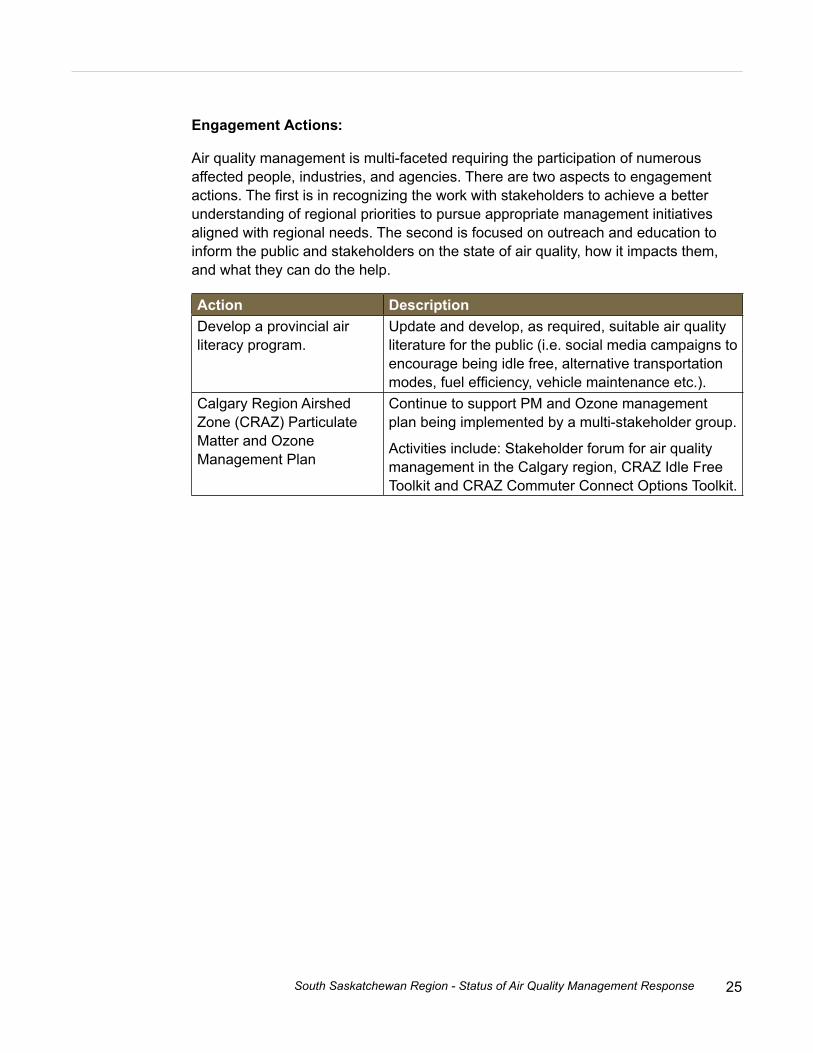
Engagement Actions:
Air quality management is multi-faceted requiring the participation of numerous affected people, industries, and agencies. There are two aspects to engagement actions. The first is in recognizing the work with stakeholders to achieve a better understanding of regional priorities to pursue appropriate management initiatives aligned with regional needs. The second is focused on outreach and education to inform the public and stakeholders on the state of air quality, how it impacts them, and what they can do the help.
Action DescriptionDevelop a provincial air literacy program.
Update and develop, as required, suitable air quality literature for the public (i.e. social media campaigns to encourage being idle free, alternative transportation modes, fuel efficiency, vehicle maintenance etc.).
Calgary Region Airshed Zone (CRAZ) Particulate Matter and Ozone Management Plan
Continue to support PM and Ozone management plan being implemented by a multi-stakeholder group.
Activities include: Stakeholder forum for air quality management in the Calgary region, CRAZ Idle Free Toolkit and CRAZ Commuter Connect Options Toolkit.
26 South Saskatchewan Region - Status of Air Quality Management Response
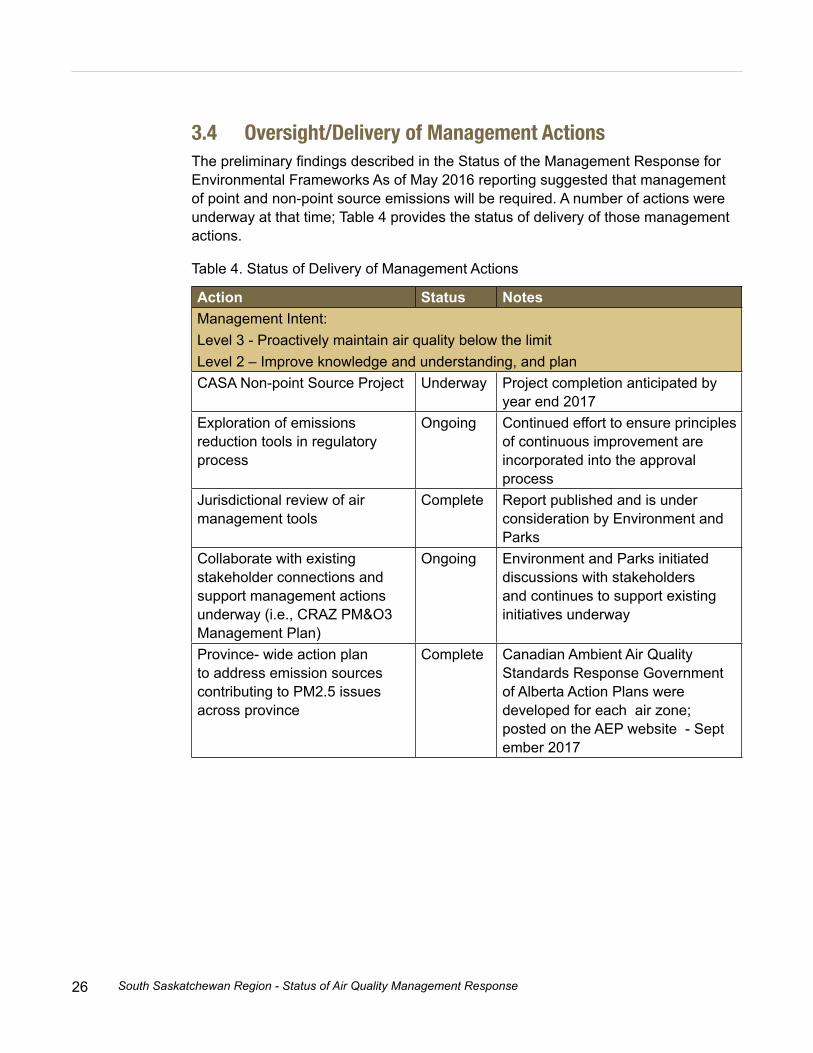
3.4 Oversight/Delivery of Management ActionsThe preliminary findings described in the Status of the Management Response for Environmental Frameworks As of May 2016 reporting suggested that management of point and non-point source emissions will be required. A number of actions were underway at that time; Table 4 provides the status of delivery of those management actions.
Table 4. Status of Delivery of Management Actions
Action Status NotesManagement Intent:Level 3 - Proactively maintain air quality below the limitLevel 2 – Improve knowledge and understanding, and planCASA Non-point Source Project Underway Project completion anticipated by
year end 2017Exploration of emissions reduction tools in regulatory process
Ongoing Continued effort to ensure principles of continuous improvement are incorporated into the approval process
Jurisdictional review of air management tools
Complete Report published and is under consideration by Environment and Parks
Collaborate with existing stakeholder connections and support management actions underway (i.e., CRAZ PM&O3 Management Plan)
Ongoing Environment and Parks initiated discussions with stakeholders and continues to support existing initiatives underway
Province- wide action plan to address emission sources contributing to PM2.5 issues across province
Complete Canadian Ambient Air Quality Standards Response Government of Alberta Action Plans were developed for each air zone; posted on the AEP website - Sept ember 2017

27South Saskatchewan Region - Status of Air Quality Management Response
Next Steps 4.0
Environment and Parks will continue to oversee the delivery of the identified management actions while also continuing the investigation into the 2015 and 2016 trigger exceedances, particularly at the stations triggering into level 3. AEP will work with specific stakeholders to inform the investigation and assist in identifying any additional management actions that may be necessary to address point and non- point source emissions.
This work will be reported on when updating the status of the Management Response in the 2017 Annual report.

28 South Saskatchewan Region - Status of Air Quality Management Response
References 5.0
Alberta Environment and Parks. 2011a. Alberta Ambient Air Quality Objectives For Nitrogen Dioxide. June 2011. Available at: http://aep.alberta.ca/air/legislation/ambient-air-quality-objectives/documents/AAQO-NitrogenDioxide-Jun2011.pdf.
Alberta Environment and Parks. 2011b. Alberta Air Emissions Inventory (2008 compiled Access database), Air Policy Division. September 2011.
Alberta Environment and Parks. 2013. Fine Particulate Matter in the Capital Region– Fact Sheet. Available at: http://aep.alberta.ca/land/cumulative-effects/regionalplanning/capital-region/documents/FineParticulateMatter-Factsheet.pdf.
Alberta Environment and Parks. 2015. Alberta Air Zones Report: 2011-2013. Air and Climate Change Policy Branch. Policy Division. ISBN: 978-1-4601-2312-3 (PDF).Available at: http://aep.alberta.ca/air/management-frameworks/canadian-ambientair-quality-standards/documents/2011-13-CAAQS-SouthSaskatchewan-Sep2015.pdf.
Alberta Environment and Parks (AEP). 2017a. South Saskatchewan Region Status of Management Response for Environmental Management Frameworks as of May 2016. Government of Alberta. ISBN: 978-1-4601-3457-3 (PDF). Available at: https://open.alberta.ca/publications/9781460134573.
Alberta Environment and Parks (AEP). 2017b. Status of Air Quality South Saskatchewan Region, Alberta for January 2014 – December 2014. Government of Alberta. ISBN: 978-1-4601-3067-4. Available at: https://open.alberta.ca/publications/9781460130674.
Alberta Environment and Parks (AEP). 2017c. 2015 and 2016 Status of Air Quality South Saskatchewan Region, Alberta for January 2015 – December 2016. Government of Alberta. ISBN: 978-1-4601-3581-5. Available at: https://open.alberta.ca/publications/9781460135815.
Alberta Environment and Parks. 2017d. South Saskatchewan Air Zone Government of Alberta Action Plan Canadian Ambient Air Quality Standards Response. ISBN: 978-1-4601-3596-9 (PDF). September 2017.
Alberta Environment and Sustainable Resource Development (AESRD). 2014. South Saskatchewan Region Air Quality Management Framework: for Nitrogen Dioxide (NO2), Ozone (O3) and Fine Particulate Matter (PM2.5). Government of Alberta. ISBN: 978-1-4601-1858-0 (Print); 978-1-4601-1859-7 (PDF). Available at: https://open.alberta.ca/publications/9781460118597.

29South Saskatchewan Region - Status of Air Quality Management Response
Canadian Council of Ministers of the Environment. 2012. Guidance Document on Achievement Determination Canadian Ambient Air Quality Standards for Fine Particulate Matter and Ozone. ISBN: 978-1-896997-91-9 (PDF).
Canadian Council of the Ministers of the Environment. 2014. Air Quality Management System. Available at: http://www.ccme.ca/en/resources/air/pm_ozone.html.
Clean Air Strategic Alliance. 2014. Non-Point Source Project Charter Presented by the Non-Point Source Working Group to the CASA Board of Directors. Environment and Climate Change Canada. 2015a. Air Pollutant Emission Inventory (APEI). Available at: http://open.canada.ca/data/en/dataset/fa1c88a8-bf78-4fcb-9c1e-2a5534b92131.
Environment and Climate Change Canada. 2015b. National Pollutant Release Inventory (NPRI). Available at: https://www.ec.gc.ca/inrp-npri/.
ENVIRON Canada Inc. 2013. Air Quality Modelling Exercise using Community Multiscale Air Quality (CMAQ) Model for South Saskatchewan Regional Plan Summary Report. Prepared for Alberta Environment and Sustainable Resource Development. ISBN: 978-1-04601-0769-0.
Government of Alberta (GoA). 2012. Lower Athabasca Regional Plan 2012 - 2022. ISBN: 978-1-4601-0537-5 (Print); 978-1-4601-0538-2 (PDF). Available at: https://open.alberta.ca/publications/9781460105382.
SNC-Lavalin. 2014. Calgary Region Airshed Zone Particulate Matter and Ozone Management Plan Review and Update. Prepared for Calgary Region Airshed Zone.
Sonoma Technology, Inc. 2014. Ambient Air Monitoring Network Assessment of the South Saskatchewan Region. Prepared for Alberta Environment and Sustainable Resource Development. Available at: http://aep.alberta.ca/air/reportsdata/documents/AmbientAirMonitoringSouthSaskatchewan-2014.pdf.

30 South Saskatchewan Region - Status of Surface Water Quality Management Response
Appendices6.0
AppendixA
South Saskatchewan Region Air Quality Management Action PlanGoal
The goal of the management actions are to proactively maintain air quality below the limit and improve air quality through active air management and prevent a Level 4 (or CAAQS) exceedance.
Achievement
Achieving the goal of the management actions within the South Saskatchewan region requires a proactive and future based approach. Management actions are intended to support, rather than replace existing policies and regulations. These actions range from policy or regulatory initiatives to reduce emissions to voluntary actions and raising awareness and education surrounding air quality.
The focus of the management actions include gathering baseline information, improving scientific understanding and knowledge, learning from other jurisdictions and identifying initiatives that are already committed or underway that can lead to near and future management of fine particulate matter.
Collectively the management initiatives as a whole comprise a plan to achieve the goal of maintaining and improving air quality.
Collective responsibility
It is important to recognize the impact of implementing certain actions may take several years before being realized. All levels of government have the responsibility of implementation of management actions and CAAQS achievement (CCME, 2012). Collaboration of all stakeholders is key to the success of the proactive air management actions.
31South Saskatchewan Region - Status of Air Quality Management Response
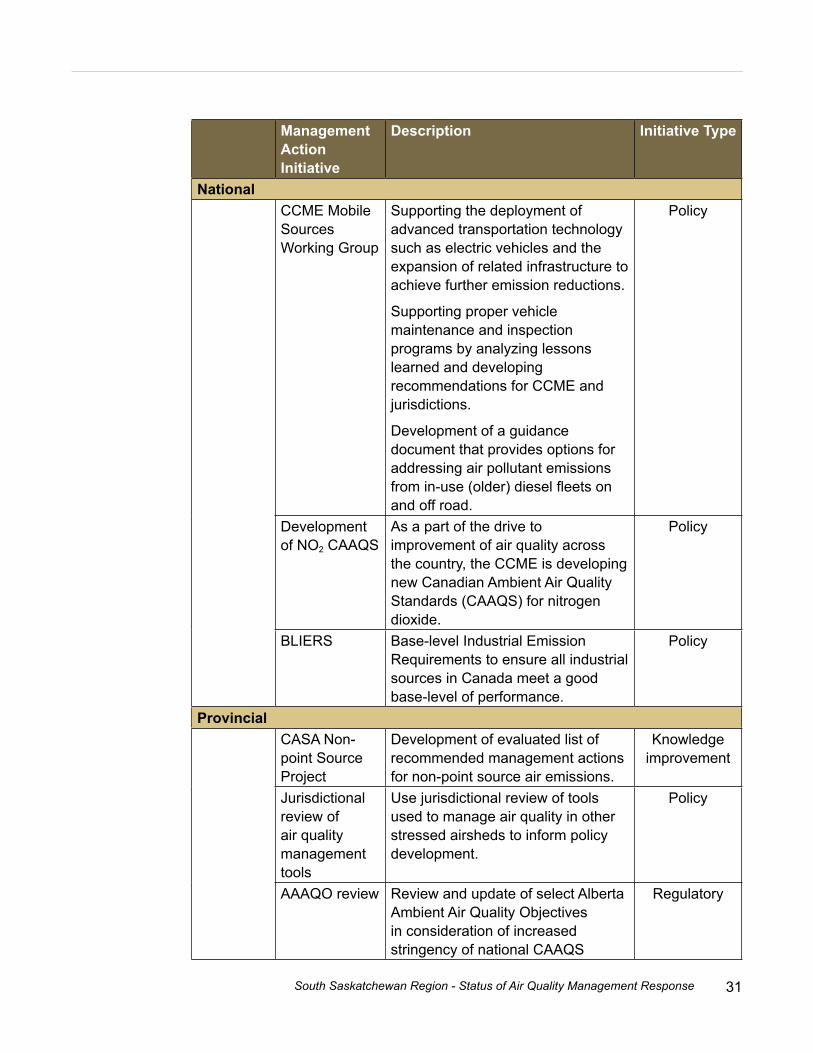
Management Action Initiative
Description Initiative Type
NationalCCME Mobile Sources Working Group
Supporting the deployment of advanced transportation technology such as electric vehicles and the expansion of related infrastructure to achieve further emission reductions.
Supporting proper vehicle maintenance and inspection programs by analyzing lessons learned and developing recommendations for CCME and jurisdictions.
Development of a guidance document that provides options for addressing air pollutant emissions from in-use (older) diesel fleets on and off road.
Policy
Development of NO2 CAAQS
As a part of the drive to improvement of air quality across the country, the CCME is developing new Canadian Ambient Air Quality Standards (CAAQS) for nitrogen dioxide.
Policy
BLIERS Base-level Industrial Emission Requirements to ensure all industrial sources in Canada meet a good base-level of performance.
Policy
ProvincialCASA Non-point Source Project
Development of evaluated list of recommended management actions for non-point source air emissions.
Knowledge improvement
Jurisdictional review of air quality management tools
Use jurisdictional review of tools used to manage air quality in other stressed airsheds to inform policy development.
Policy
AAAQO review Review and update of select Alberta Ambient Air Quality Objectives in consideration of increased stringency of national CAAQS
Regulatory

32 South Saskatchewan Region - Status of Air Quality Management Response
Provincial - continued
Climate Leadership Plan
Alberta will invest in work to lower greenhouse gas emissions and address climate change in Alberta through a renewed climate change action plan
Policy
Use of emissions reductions tools in regulatory process
Utilize the authorization process to adapt and improve environmental performance at regulated industrial facilities.
Regulatory
Ambient data analysis
Analyze available monitoring data to investigate possible cause or influences on elevated concentrations. Consider meteorology (wind/wind direction) and covariance between pollutants.
Knowledge improvement
Expand ambient air monitoring network
Siting and start-up of new continuous, permanent air monitoring station in Airdrie.
Short-term mobile air monitoring survey in City of Lethbridge.
Knowledge improvement
Further knowledge of particulate matter composition
Analysis of Calgary Central Station PM2.5 speciation data.
Knowledge improvement
LocalCRAZ Particulate Matter and Ozone Management Plan
Air quality management plan implemented by a multi-stakeholder group.
Participation in multi-year joint University of Calgary and Health Canada land use regression model study of PM2.5 in the City of Calgary.
Knowledge improvement, Education and Engagement
33South Saskatchewan Region - Status of Air Quality Management Response
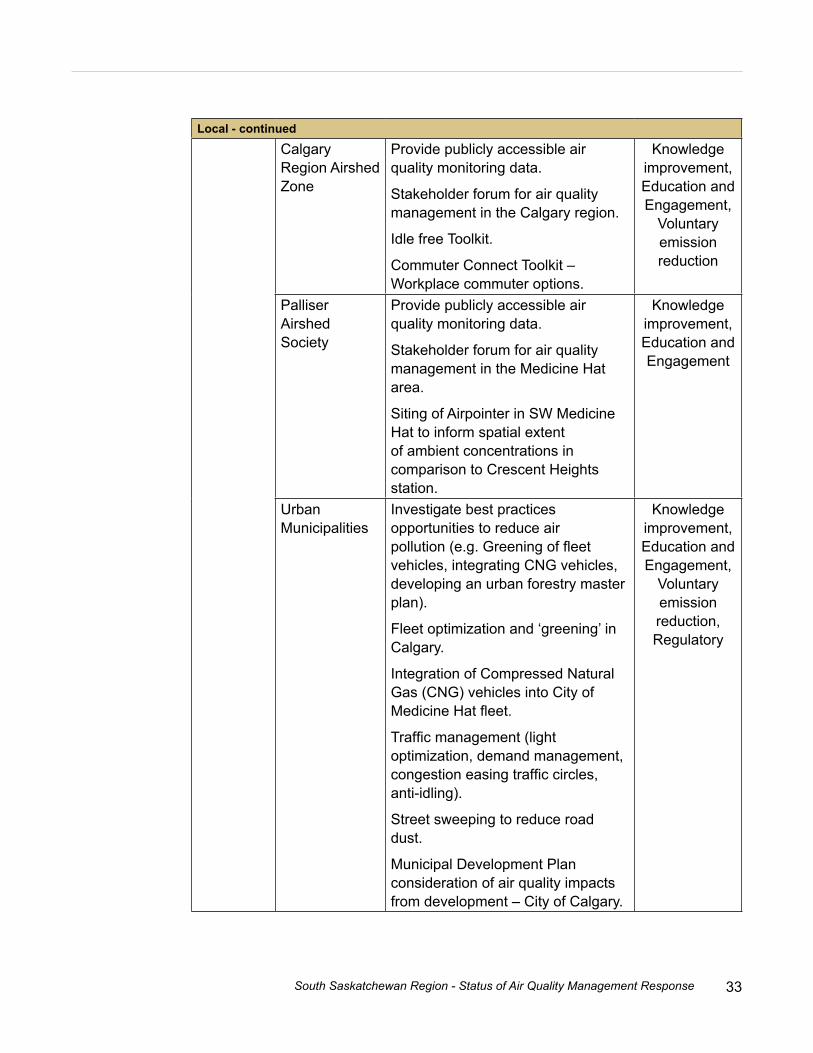
Local - continued
Calgary Region Airshed Zone
Provide publicly accessible air quality monitoring data.
Stakeholder forum for air quality management in the Calgary region.
Idle free Toolkit.
Commuter Connect Toolkit – Workplace commuter options.
Knowledge improvement, Education and Engagement,
Voluntary emission reduction
Palliser Airshed Society
Provide publicly accessible air quality monitoring data.
Stakeholder forum for air quality management in the Medicine Hat area.
Siting of Airpointer in SW Medicine Hat to inform spatial extent of ambient concentrations in comparison to Crescent Heights station.
Knowledge improvement, Education and Engagement
Urban Municipalities
Investigate best practices opportunities to reduce air pollution (e.g. Greening of fleet vehicles, integrating CNG vehicles, developing an urban forestry master plan).
Fleet optimization and ‘greening’ in Calgary.
Integration of Compressed Natural Gas (CNG) vehicles into City of Medicine Hat fleet.
Traffic management (light optimization, demand management, congestion easing traffic circles, anti-idling).
Street sweeping to reduce road dust.
Municipal Development Plan consideration of air quality impacts from development – City of Calgary.
Knowledge improvement, Education and Engagement,
Voluntary emission reduction, Regulatory

34 South Saskatchewan Region - Status of Air Quality Management Response
Local - continued
Urban Municipalities - continued
Calgary Transportation Plan – improved air quality as co-benefit from transportation policies mitigation initiatives.
City of Lethbridge initiative to develop policy recommendations of targets/direction for future growth with the consideration of SSRP outcomes.
Urban forestry plan in Calgary.Rural Municipalities
Gravel road dust mitigation.
Municipal Development Plan consideration of air quality impacts from development - MD of Bighorn.
Urban forestry programs (Rocky View County).
Best Management Practices workshops for farmers/ranchers – soil erosion controls and effective nutrient management.
Regulatory, Voluntary emission reduction

35South Saskatchewan Region - Status of Surface Water Quality Management Responsee
Table of Contents
Status of Surface Water Quality Management Response
1.0 Introduction ................................................................................................... 37
2.0 Summary of Trigger Exceedances and Status of Management Response ................................................................................ 39
3.0 Status of Management Response ................................................................41
3.1 2014-15 Management Response ........................................................... 41 3.2 2015-16 Management Response ........................................................... 46 3.3 2016-17 Management Response ........................................................... 53
4.0 Next Steps ..................................................................................................... 58
5.0 References .................................................................................................... 59
6.0 Appendix ....................................................................................................... 60 Figures
Figure 1. Location of nine Long-term River Network Water Quality Monitoring Stations included in the South Saskatchewan Regional Plan Water Quality Monitoring Framework. ...............................................................................................................38
Figure 2. Summary of the surface water quality indicator limit, trigger or guideline exceedances in the SSR WQMF monitoring stations 2014-2017 ............................ 39
Figure 3. Box Plots of the Specific Conductance Data in the Bow River at Carseland Station During Open Water and Winter from April 1999 to March 2015. .................. 43
Figure 4. Box Plots of the Specific Conductance Data in the Oldman River at Hwy 36 Station During Open Water and Winter from April 1999 to March 2015. .................. 44
Figure 5. Box Plots of the pH Data in the Oldman River at Brocket Station During Open Water and Winter from April 1999 to March 2015 (note: pH range is 0-14, however, for visual detail the graph scale ......................................... 44
Figure 6. Box Plots of the Total Nitrogen Data in the Bow River at Cochrane Station During Winter from April 1999 to March 2015. .........................................................45

36 South Saskatchewan Region - Status of Surface Water Quality Management Response
Figure 7. Box Plots of the Total Dissolved Solids in the Milk River at Hwy 880 Station During Winter from April 2003 to March 2016. .........................................................47
Figure 8. Box Plots of the Total Nitrogen Data in the Bow River at Cochrane Station During Winter from April 1999 to March 2016. .........................................................48
Figure 9. Box Plots of the Total Nitrogen Data in the Bow River at Ronalane Station During Open Water and Winter from April 1999 to March 2016. .............................. 49
Figure 10. Box Plots of the Nitrate Data in the Bow River at Ronalane Station During Open Water and Winter from April 1999 to March 2016. .......................................... 50
Figure 11. Box Plots of the Sodium Adsorption Ratio Data in the Oldman River at Hwy 3 Station During Open Water and Winter from April 1999 to March 2016. .................. 51
Figure 12. Box Plots of the Total Selenium Data in the Oldman River at Hwy 36 Station During Winter from April 2004 to March 2016. .........................................................52
Figure 13. Box Plots of the Total Dissolved Solids Data in the Milk River at Hwy 880 Station During Winter from April 2003 to March 2017. .........................................................54
Figure 14. Box Plots of the Sulphate Data in the Bow River at Cochrane Station During Open Water and Winter from April 1999 to March 2017. .......................................... 55
Figure 15. Box Plots of the Sulphate Data in the Bow River at Carseland Station During Open Water and Winter from April 1999 to March 2017 ........................................... 56
Figure 16. Box Plots of the Total Dissolved Solids Data in the Bow River at Cluny Station During Open Water and Winter from April 1999 to March 2017. .............................. 57
Tables
Table 1. List of primary indicators SSRP: SWQMF ................................................................37
Table 2. List of secondary indicators SSRP: SWQMF ...........................................................37
Table 3 Status of trend assessments for the 2014/2015 management response ................. 42

37South Saskatchewan Region - Status of Surface Water Quality Management Responsee
Introduction1.0
Under the South Saskatchewan Regional Plan (GoA 2014), a management response must be initiated when the condition of one of the 15 primary indicators (Table 1) has exceeded a trigger or limit, as determined by the Minister of Environment and Parks. The South Saskatchewan Region Surface Water Quality Management Framework (SWQMF) (AESRD 2014) also identifies six secondary indicators (Table 2). While no triggers or limits exist for secondary indicators (due to their limited historic data), exceedances of relevant surface water quality guidelines must be reported and a management response may be undertaken. Part of the management response is determining the need for management action(s).
There are nine ambient water quality monitoring stations in the South Saskatchewan Region whose data are used for the annual assessment (Figure 1). The framework follows the water year, with assessments completed annually for the open water season (April to October) and winter season (November to March).
This is the second status of management response report produced since the South Saskatchewan Regional Plan came into effect in September 2014.
Table 1. List of primary indicators for SSRP: SWQMF
Total Ammonia Specific ConductivityChloride Total Dissolved SolidsNitrate Total Organic CarbonTotal Nitrogen Total Suspended SolidsTotal Dissolved Phosphorus TurbidityTotal Phosphorus pHSulphate Escherichia coliSodium Adsorption Ratio (SAR)
Mercury DicambaSelenium Methylchlorophenoxyacetic acid (MCPA)2,4-Dichlorophenoxyacetic acid (2,4-D)
Total Organic Carbon
Table 2. List of secondary indicators for SSRP: SWQMF

38 South Saskatchewan Region - Status of Surface Water Quality Management Response
A full description of the management system is in the South Saskatchewan Region SWQMF. The management response is a set of seven steps that must be undertaken (in full or in part) when an ambient water quality trigger or limit is exceeded. Since trigger exceedances are statistically defined, they do not necessarily signal additional risk to the aquatic environment or water uses. Initial steps include verification and preliminary assessment to determine the need for further investigation and management actions.
The management response for surface water quality will consider a variety of factors including: the number and location of monitoring stations where exceedances were reported, an assessment of risk of the exceedances to the aquatic environment or water uses, and any unusual circumstances (natural or human-caused) including the influence of flow and trends on the data.
This status report summarizes work that has been completed to date on the management response. It provides an update on the management response that was initiated in 2015 (AEP 2017a) in response to the 2014/15 trigger exceedances, and describes the management response undertaken to date for the 2015/16 and 2016/17 exceedances. Environment and Parks is the lead in undertaking the management response and will work with other government organizations and external parties as required.
Figure 1. Location of nine Long-term River Network Water Quality Monitoring Stations included in the South Saskatchewan Regional Plan Water Quality Monitoring Framework.

39South Saskatchewan Region - Status of Surface Water Quality Management Responsee
Summary of Trigger Exceedances and Status of Management Response
2.0
A visual summary of the exceedances to date is presented in Figure 1 (AEP 2017b, c, d). In the three years since the framework took effect, indicators exceeded a trigger at one or more surface water quality monitoring stations: four in 2014/2015; four in 2015/2016; and three in 2016/2017. One indicator (TDS) exceeded a limit in the Milk River at Hwy 880 station in 2015/2016 and 2016/2017. In 2015/2016, one of the secondary indicators (selenium) exceeded a guideline in the Oldman River at Hwy 36.
Figure 2. Summary of the surface water quality indicator limit, trigger or guideline exceedances in the SSR WQMF monitoring stations 2014-2017; • Blue: trigger exceedance of primary indicator (median or peak)• Red: limit exceedance of primary indicator• Green: guideline exceedance of secondary indicator• W: exceedance occurred in winter• OW: exceedance occurred in open water period

40 South Saskatchewan Region - Status of Surface Water Quality Management Response
All indicators that exceeded a trigger or limit in the past reporting periods are currently in the preliminary assessment phase of the management response, focused initially at the station where the exceedance was observed. The management response for the indicator that exceeded a limit will proceed immediately to investigation. A management response for the secondary indicator that exceeded a guideline has also been initiated, including the same preliminary assessment steps as per the primary indicators.
The principle steps in this preliminary assessment are:
• comparison of the recent annual data with all available data since the beginning of the SWQMF framework’s historical dataset at the monitoring station where the exceedance occurred,
• comparison of data from upstream and downstream monitoring locations,
• completing unadjusted, seasonally-adjusted and flow-adjusted trend analyses, and
• consideration of other site-specific influences or factors.
The scope of the preliminary assessment may change in the future.

41South Saskatchewan Region - Status of Surface Water Quality Management Responsee
Status of Management Response3.0
3.1 2014/2015 Management ResponseThe Minister’s Determination for 2014/2015 (monthly water quality data collected and assessed for the period April 2014 to March 2015) confirmed that no limits were exceeded by indicator seasonal medians. However, the following trigger exceedances were reported (AEP 2017b):
• Bow River at Cochrane station exceedance of the total nitrogen median trigger for the winter period.
• Bow River at Carseland station exceedance of the specific conductance peak triggers for both the open water and winter periods.
• Oldman River at Brocket station exceedance of the pH peak triggers for both the open water and winter periods.
• Oldman River at Highway 36 station exceedance of the specific conductance median triggers for both the open water and winter periods.
The ‘next steps’ of the management response identified for the 2014/15 exceedances in the last status of management response report (AEP 2017a) are:
• trend analysis and flow analysis on the indicators exceeding a trigger, at the monitoring stations where the exceedances occurred, and
• trend analysis on specific conductance at the seven monitoring stations where an exceedance did not occur, including analysis of the parameters that comprise specific conductance.
This section of the report summarizes progress made on the 2014/2015 management response.
VerificationandPreliminaryAssessment
Environment and Parks has verified the 2014/2015 surface water quality data and calculated the water quality metrics used to assess ambient water quality conditions against triggers and limits. This work was completed in the preparation of the 2014/2015 Status of Water Quality report (AEP 2017a).
Preliminary assessment of the 2014/2015 management response is partially complete. The first step in the assessment, comparison with historical data and data from up and down-stream stations, was presented in the previous status report (AEP 2017a). Since that time, unadjusted and seasonally-adjusted trend assessments (HDR 2011) have been completed and are described below; however, flow-adjusted trend assessments (Helsel et al. 2006) are ongoing (Table 3). Additionally, trend assessments were completed on parameters that comprise specific conductance

42 South Saskatchewan Region - Status of Surface Water Quality Management Response
at the two stations where specific conductance triggers were exceeded as well as specific conductance at the remaining 7 stations used in the SWQMF. A closer examination of data for all three parameters that exceeded a trigger was also conducted on data from the neighboring stations to ensure watershed-scale patterns are not missed.
Table 3. Status of trend assessments for the 2014/2015 management response.
Since flow is a potential explanatory factor influencing water quality concentrations, flow-adjusted trends will be conducted on all three indicators that exceeded a trigger in 2014/2015 at the station where the exceedance occurred. This analysis will complete the preliminary assessment phase and help determine whether an investigation is required.
Currently unadjusted and seasonally-adjusted trend assessments are complete for each indicator/station that exceeded a trigger in 2014/2015 for 3 timeframes (1999-2015, 1999-2009 and 2009-2015). A summary of the unadjusted and seasonally-adjusted trends results as well as additional trend assessments is given in the following section.
SpecificConductance–BowRiveratCarseland,OpenWaterandWinterPeakTrigger Exceedances
Visual representation of the data for specific conductance at Bow River at Carseland is in Figure 3. The maximum values observed are approximately half the 1000 µS/cm limit value, though trend assessments reveal some statistically significant increasing
Trigger Exceedance Unadjusted Trend
Seasonally-adjusted Trend
Flow-adjusted Trend
Specific Conductance Peak Winter/Open waterBow at Carseland
Complete Complete Ongoing
Specific Conductance Median Winter/Open waterOldman at Hwy 36
Complete Complete Ongoing
Total Nitrogen Median Winter Bow at Cochrane
Complete Complete Ongoing
pH Peak Winter/Open waterOldman at Brocket
Complete Complete Ongoing
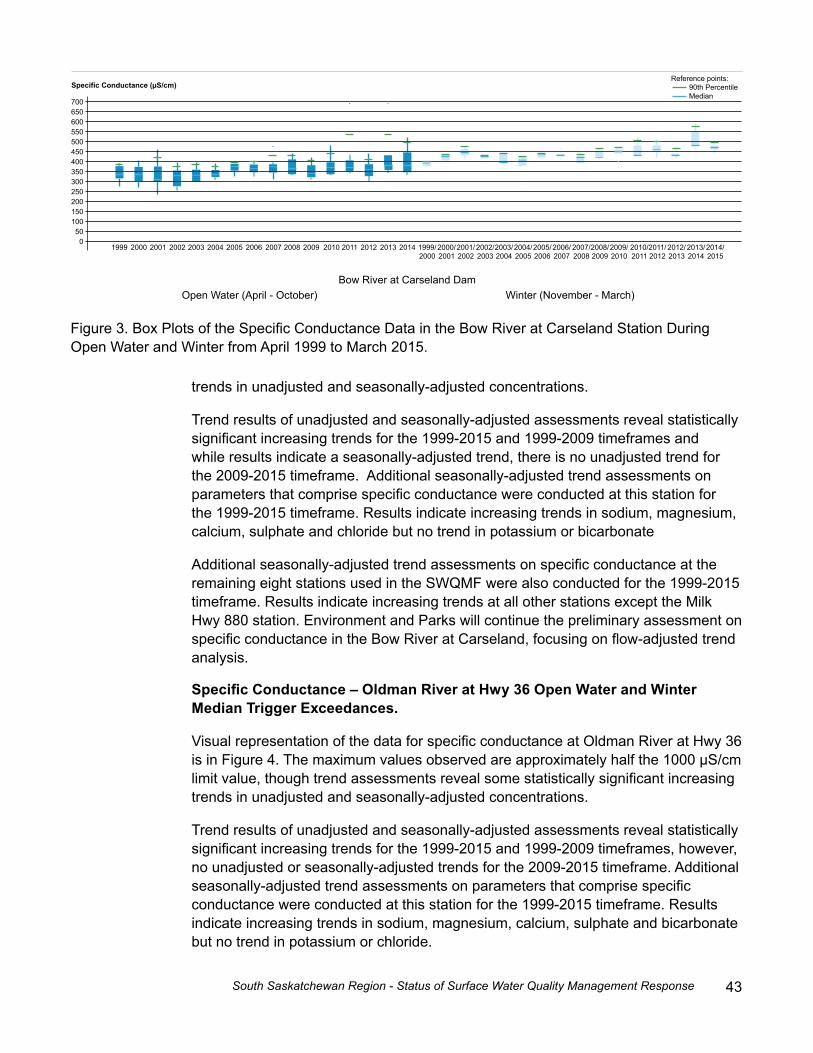
43South Saskatchewan Region - Status of Surface Water Quality Management Response
Figure 3. Box Plots of the Specific Conductance Data in the Bow River at Carseland Station During Open Water and Winter from April 1999 to March 2015.
700650600550500450400350300250200150100
500
1999 2000 2001 2002 2003 2004 2005 2006 2007 2008 2009 2010 2011 2012 2013 2014 1999/2000
2000/2001
2001/2002
2002/2003
2003/2004
2004/2005
2005/2006
2006/2007
2007/2008
2008/2009
2009/2010
2010/2011
2011/2012
2012/2013
2013/2014
2014/2015
Bow River at Carseland DamOpen Water (April - October) Winter (November - March)
Reference points: 90th Percentile Median
Specific Conductance (µS/cm)
trends in unadjusted and seasonally-adjusted concentrations.
Trend results of unadjusted and seasonally-adjusted assessments reveal statistically significant increasing trends for the 1999-2015 and 1999-2009 timeframes and while results indicate a seasonally-adjusted trend, there is no unadjusted trend for the 2009-2015 timeframe. Additional seasonally-adjusted trend assessments on parameters that comprise specific conductance were conducted at this station for the 1999-2015 timeframe. Results indicate increasing trends in sodium, magnesium, calcium, sulphate and chloride but no trend in potassium or bicarbonate
Additional seasonally-adjusted trend assessments on specific conductance at the remaining eight stations used in the SWQMF were also conducted for the 1999-2015 timeframe. Results indicate increasing trends at all other stations except the Milk Hwy 880 station. Environment and Parks will continue the preliminary assessment on specific conductance in the Bow River at Carseland, focusing on flow-adjusted trend analysis.
SpecificConductance–OldmanRiveratHwy36OpenWaterandWinterMedian Trigger Exceedances.
Visual representation of the data for specific conductance at Oldman River at Hwy 36 is in Figure 4. The maximum values observed are approximately half the 1000 µS/cm limit value, though trend assessments reveal some statistically significant increasing trends in unadjusted and seasonally-adjusted concentrations.
Trend results of unadjusted and seasonally-adjusted assessments reveal statistically significant increasing trends for the 1999-2015 and 1999-2009 timeframes, however, no unadjusted or seasonally-adjusted trends for the 2009-2015 timeframe. Additional seasonally-adjusted trend assessments on parameters that comprise specific conductance were conducted at this station for the 1999-2015 timeframe. Results indicate increasing trends in sodium, magnesium, calcium, sulphate and bicarbonate but no trend in potassium or chloride.
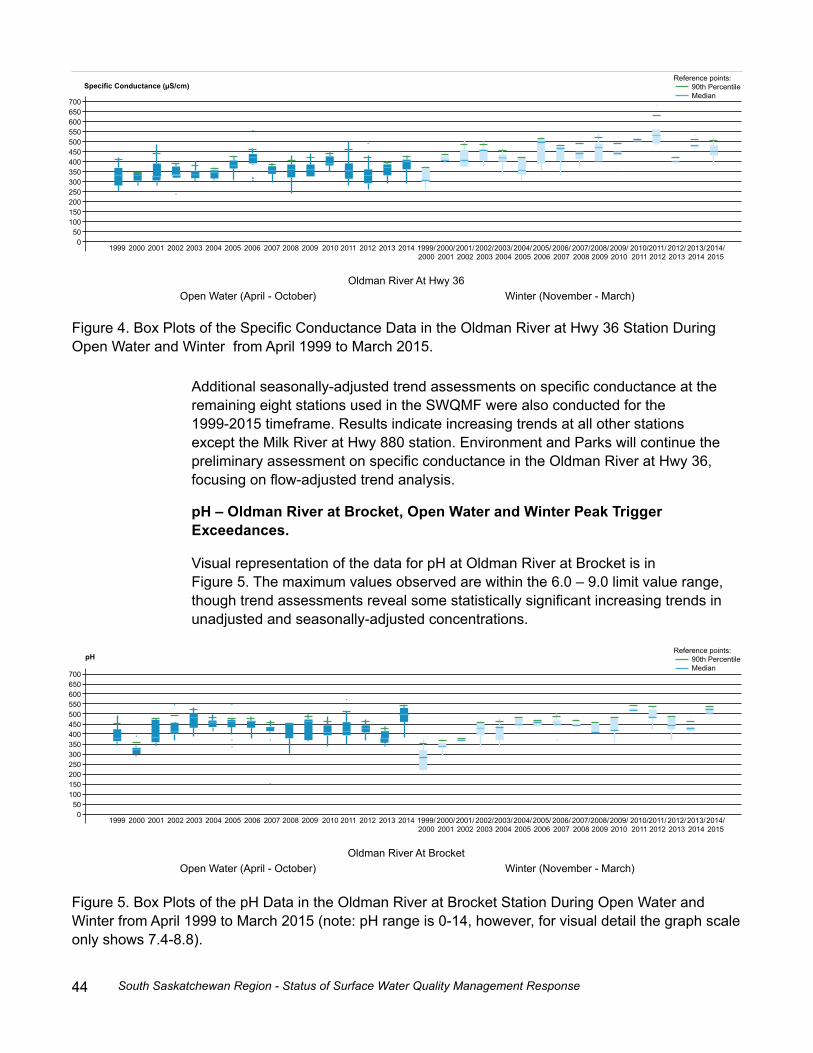
44 South Saskatchewan Region - Status of Surface Water Quality Management Response
Additional seasonally-adjusted trend assessments on specific conductance at the remaining eight stations used in the SWQMF were also conducted for the 1999-2015 timeframe. Results indicate increasing trends at all other stations except the Milk River at Hwy 880 station. Environment and Parks will continue the preliminary assessment on specific conductance in the Oldman River at Hwy 36, focusing on flow-adjusted trend analysis.
pH–OldmanRiveratBrocket,OpenWaterandWinterPeakTriggerExceedances.
Visual representation of the data for pH at Oldman River at Brocket is in Figure 5. The maximum values observed are within the 6.0 – 9.0 limit value range, though trend assessments reveal some statistically significant increasing trends in unadjusted and seasonally-adjusted concentrations.
Figure 5. Box Plots of the pH Data in the Oldman River at Brocket Station During Open Water and Winter from April 1999 to March 2015 (note: pH range is 0-14, however, for visual detail the graph scale only shows 7.4-8.8).
700650600550500450400350300250200150100500
1999 2000 2001 2002 2003 2004 2005 2006 2007 2008 2009 2010 2011 2012 2013 2014 1999/2000
2000/2001
2001/2002
2002/2003
2003/2004
2004/2005
2005/2006
2006/2007
2007/2008
2008/2009
2009/2010
2010/2011
2011/2012
2012/2013
2013/2014
2014/2015
Oldman River At BrocketOpen Water (April - October) Winter (November - March)
Reference points: 90th Percentile Median
pH
Figure 4. Box Plots of the Specific Conductance Data in the Oldman River at Hwy 36 Station During Open Water and Winter from April 1999 to March 2015.
700650600550500450400350300250200150100500
1999 2000 2001 2002 2003 2004 2005 2006 2007 2008 2009 2010 2011 2012 2013 2014 1999/2000
2000/2001
2001/2002
2002/2003
2003/2004
2004/2005
2005/2006
2006/2007
2007/2008
2008/2009
2009/2010
2010/2011
2011/2012
2012/2013
2013/2014
2014/2015
Oldman River At Hwy 36Open Water (April - October) Winter (November - March)
Reference points: 90th Percentile Median
Specific Conductance (µS/cm)

45South Saskatchewan Region - Status of Surface Water Quality Management Response
Trend results of unadjusted and seasonally-adjusted assessments reveal statistically significant increasing trends for the 1999-2015 and 1999-2009 timeframes, however, no unadjusted or seasonally-adjusted trends for the 2009-2015 timeframe.
Additional seasonally-adjusted trend assessments on pH at the remaining two Oldman and one South Saskatchewan mainstem stations used in the SWQMF were also conducted for the 1999-2015 timeframe. Results indicate increasing trends at all other stations. Environment and Parks will continue the preliminary assessment on pH in the Oldman River at Brocket, focusing on flow-adjusted trend analysis.
TotalNitrogen–BowRiveratCochrane,WinterMedianTriggerExceedance
Visual representation of the data for total nitrogen at Bow River at Cochrane is in Figure 6. No limit value is currently established for this indicator and trend assessments reveal few statistically significant increasing trends in unadjusted and seasonally-adjusted concentrations.
Figure 6. Box Plots of the Total Nitrogen Data in the Bow River at Cochrane Station During Winter from April 1999 to March 2015.
1.00
0.90
0.80
0.70
0.60
0.50
0.40
0.30
0.20
0.10
0.001999/2000
2000/2001
2001/2002
2002/2003
2003/2004
2004/2005
2005/2006
2006/2007
2007/2008
2008/2009
2009/2010
2010/2011
2011/2012
2012/2013
2013/2014
2014/2015
Oldman River CochraneWinter (November - March)
Reference points: 90th Percentile Median
Total Nitrogen mg/L
Trend results of unadjusted and seasonally-adjusted assessments reveal no statistically significant increasing trends for the 1999-2015 and 1999-2009 timeframes, however, results indicate increasing unadjusted and seasonally-adjusted trends during the winter for the 2009-2015 timeframe.
Additional seasonally-adjusted trend assessments on total nitrogen at the remaining three Bow and one South Saskatchewan mainstem stations used in the SWQMF were also conducted for the 1999-2015 timeframe. Results indicate increasing trends in the Bow at Ronalane and South Saskatchewan at Hwy 1 Stations, however, a decreasing trend in the Bow at Carseland station and no trend in the Bow at Cluny station. Environment and Parks will continue the preliminary assessment on total nitrogen in the Bow River at Cochrane, focusing on flow-adjusted trend analysis.

46 South Saskatchewan Region - Status of Surface Water Quality Management Response
3.2 2015/16 Management ResponseThe Minister’s Determination for 2015/2016 (monthly water quality data collected and assessed for the period April 2015 to March 2016) confirmed that one limit and four triggers were exceeded for the primary indicators and one guideline was exceeded for the secondary indicators. These exceedances were reported as follows (AEP 2017c):
• Milk River at Hwy 880 station median exceedance of the total dissolved solids limit for the winter period.
• Bow River at Cochrane station exceedance of the total nitrogen median trigger for the winter period.
• Bow River at Ronalane station exceedance of the total nitrogen median triggers for both the open water and winter periods.
• Bow River at Ronalane station exceedance of the nitrate median triggers for both the open water and winter periods.
• Oldman River at Highway 3 station exceedance of the sodium adsorption ratio median trigger for both the open water and winter periods.
• Oldman River at Hwy 36 station median exceedance of the total selenium guideline for the winter period.
The limit exceedance will move directly into the preliminary assessment and investigation phase, while the remaining trigger and guideline exceedances will move into the preliminary assessment phase of the management response. All indicators that exceeded a trigger, limit or guideline are currently in the preliminary assessment phase of the management response. For those indicators that exceeded a trigger or guideline, the preliminary assessment will determine the need for an investigation. Because total dissolved solids at Milk River at Hwy 880 exceeded a limit, it will be moved into the investigation stage, which will be informed by the results of the preliminary assessment.
VerificationandPreliminaryAssessment
Verification of the 2015/2016 data is complete. The 2015/2016 data were downloaded from Alberta Environment and Park’s Water Data System and the median and 90th percentile values were calculated and compared against historic triggers and limits. This work was undertaken by Environment and Parks, Environmental Monitoring and Science Division (EMSD) in preparation of the 2015/2016 Status of Surface Water Quality Report (2017c).
The preliminary assessment of triggers that were exceeded also involved looking at all data available since April 1999. This included additional data from April 2009 to March 2016 that were not included in the annual assessment of trigger exceedances. These additional years of data were included in the preliminary assessment data examination since they represent recent water quality.

47South Saskatchewan Region - Status of Surface Water Quality Management Response
TotalDissolvedSolids–MilkRiveratHwy880,WinterMedianLimitExceedance
The 2015/2016 winter median for total dissolved solids (TDS) was over the limit in the Milk River at Hwy 880 station.
Examination of the dataset revealed that TDS has a considerable amount of variability from year to year. While the winter median value of 510 mg/L for 2015/2016 is above the 500 mg/L limit value, it is below the median trigger value of 606 mg/L. It is also a lower median value than has been observed in other winters in the dataset (Figure 7). An increasing trend is not apparent in data since 2003.
TDS concentrations in the winter at the Milk River at Hwy 880 are higher than those seen in the Oldman, Bow or South Saskatchewan Rivers.
Further analysis is needed to evaluate the influence of river flow on TDS concentrations observed at this station and to confirm there is no statistical trend. This work will be undertaken to complete the preliminary assessment. Moreover, the Milk River is an international river whose waters are apportioned under the 1909 Boundary Waters Treaty, consequently the Milk River flow is heavily modified and further assessment will be considered regarding that influence on TDS at Hwy 880.
Since a limit was exceeded, total dissolved solids in the Milk River at Hwy 880 will be moved in to the investigation phase to better understand potential sources and the potential risk that existing conditions may pose. Preliminary review of activities requiring an Environment and Parks Approval did not indicate any point sources of total dissolved solids to the Milk River at Hwy 880 existed; however, potential diffuse point sources, as well as other influences such as runoff and groundwater, will continue to be explored. The total dissolved solids limit is based on an irrigation guideline, however, the exceedance occur during the winter period, therefore risk is expected to be low. A more detailed risk assessment will be conducted to confirm this. This investigation will inform the need for management actions.
Figure 7. Box Plots of the Total Dissolved Solids in the Milk River at Hwy 880 Station During Winter from April 2003 to March 2016.
1300125012001150110010501000950900850800750700650600550500450400350300250200150
Milk River At Hwy 880Winter (November - March)
2003/2004 2004/2005 2005/2006 2006/2007 2007/2008 2008/2009 2010/2011 2011/2012 2012/2013 2013/2014 2014/2015 2015/20162009/2010
Tota
l Dis
solv
ed S
olid
s (C
ALC
D.)
mg/
L
Reference points: 90th Percentile Median
Total Dissolved Solids (CALCD.) mg/L

48 South Saskatchewan Region - Status of Surface Water Quality Management Response
TotalNitrogen–BowRiveratCochrane,WinterMedianTriggerExceedance
As in 2014/15, a median trigger exceedance occurred again in 2015/16 for total nitrogen in the Bow River at Cochrane station, in the winter period.
Examination of the dataset revealed that total nitrogen has a considerable amount of variability from year to year. The winter median value for 2015/2016 is similar to what has been observed in other winters in the dataset (Figure 8) and was the exact same value as the 2014/2015 winter median (0.24 mg/L). No limit value is currently established for this indicator. An increasing trend is still not apparent in data since 1999.
Overall, the total nitrogen concentrations in the Bow River at Cochrane are lower than the three downstream stations (Carseland, Cluny and Ronalane) on the Bow River and similar to those seen in the corresponding most upstream station (Brocket) on the Oldman River.
Further analysis is needed to evaluate the influence of river flow on total nitrogen concentrations at this station and to confirm there is no statistical trend. Moreover, the Cochrane station is less than 20 kilometers downstream of the power generating Ghost Reservoir dam outlet and further assessment will consider the influence of flow modification on total nitrogen at Cochrane.
Figure 8. Box Plots of the Total Nitrogen Data in the Bow River at Cochrane Station During Winter from April 1999 to March 2016.
Reference points: 90th Percentile Median
1.000.950.900.850.800.750.700.650.600.550.500.450.400.350.300.250.200.150.100.050.00
Nitr
ogen
Tot
al (
CA
LCD
_) m
g/L
Nitrogen Total (CALCD_) mg/L
Bow River at CochraneWinter (November - March)
2003/2004 2004/2005 2005/2006 2006/20071999/2000 2000/2001 2001/2002 2002/2003 2007/2008 2008/2009 2010/2011 2011/2012 2012/2013 2013/2014 2014/2015 2015/20162009/2010
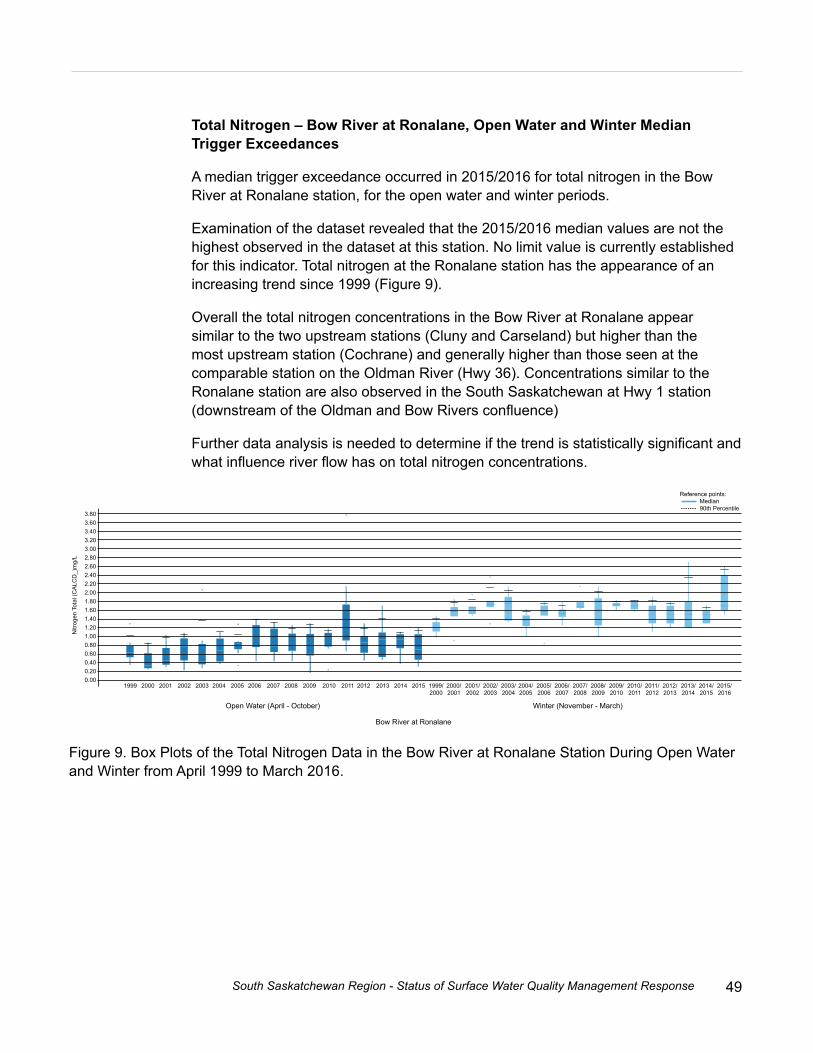
49South Saskatchewan Region - Status of Surface Water Quality Management Response
TotalNitrogen–BowRiveratRonalane,OpenWaterandWinterMedianTrigger Exceedances
A median trigger exceedance occurred in 2015/2016 for total nitrogen in the Bow River at Ronalane station, for the open water and winter periods.
Examination of the dataset revealed that the 2015/2016 median values are not the highest observed in the dataset at this station. No limit value is currently established for this indicator. Total nitrogen at the Ronalane station has the appearance of an increasing trend since 1999 (Figure 9).
Overall the total nitrogen concentrations in the Bow River at Ronalane appear similar to the two upstream stations (Cluny and Carseland) but higher than the most upstream station (Cochrane) and generally higher than those seen at the comparable station on the Oldman River (Hwy 36). Concentrations similar to the Ronalane station are also observed in the South Saskatchewan at Hwy 1 station (downstream of the Oldman and Bow Rivers confluence)
Further data analysis is needed to determine if the trend is statistically significant and what influence river flow has on total nitrogen concentrations.
Figure 9. Box Plots of the Total Nitrogen Data in the Bow River at Ronalane Station During Open Water and Winter from April 1999 to March 2016.
3.803.603.403.203.002.802.602.402.202.001.801.601.401.201.000.800.600.400.200.00
1999/2000
2000/2001
2001/2002
2002/2003
2003/2004
2004/2005
2005/2006
2006/2007
2007/2008
2008/2009
2009/2010
2010/2011
2011/2012
2012/2013
2013/2014
2014/2015
2015/2016
1999 2000 2001 2002 2003 2004 2005 2006 2007 2008 2009 2010 2011 2012 2013 2014 2015
Bow River at Ronalane
Winter (November - March)Open Water (April - October)
Nitr
ogen
Tot
al (C
ALC
D_)
mg/
L
Reference points: Median 90th Percentile
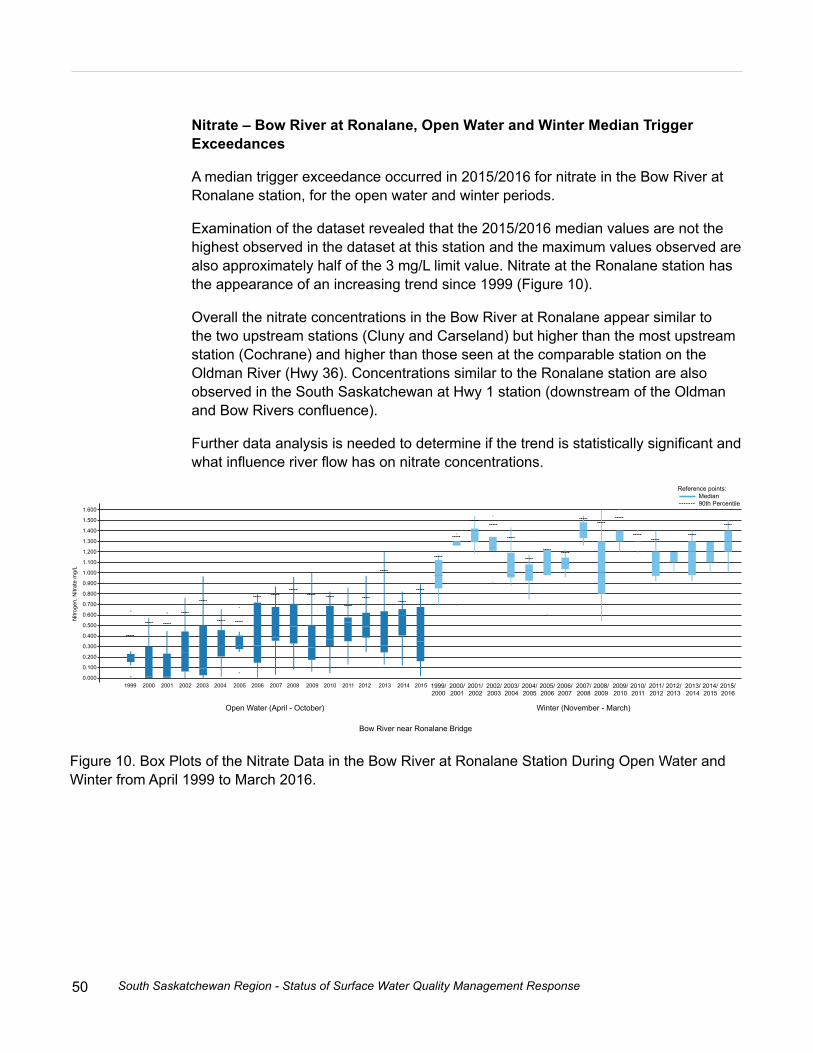
50 South Saskatchewan Region - Status of Surface Water Quality Management Response
Nitrate–BowRiveratRonalane,OpenWaterandWinterMedianTriggerExceedances
A median trigger exceedance occurred in 2015/2016 for nitrate in the Bow River at Ronalane station, for the open water and winter periods.
Examination of the dataset revealed that the 2015/2016 median values are not the highest observed in the dataset at this station and the maximum values observed are also approximately half of the 3 mg/L limit value. Nitrate at the Ronalane station has the appearance of an increasing trend since 1999 (Figure 10).
Overall the nitrate concentrations in the Bow River at Ronalane appear similar to the two upstream stations (Cluny and Carseland) but higher than the most upstream station (Cochrane) and higher than those seen at the comparable station on the Oldman River (Hwy 36). Concentrations similar to the Ronalane station are also observed in the South Saskatchewan at Hwy 1 station (downstream of the Oldman and Bow Rivers confluence).
Further data analysis is needed to determine if the trend is statistically significant and what influence river flow has on nitrate concentrations.
Figure 10. Box Plots of the Nitrate Data in the Bow River at Ronalane Station During Open Water and Winter from April 1999 to March 2016.
Reference points: Median 90th Percentile
1.600
1.500
1.400
1.300
1.200
1.100
1.000
0.900
0.800
0.700
0.600
0.500
0.400
0.300
0.200
0.100
0.000
Nitr
ogen
, Nitr
ate
mg/
L
1999/2000
2000/2001
2001/2002
2002/2003
2003/2004
2004/2005
2005/2006
2006/2007
2007/2008
2008/2009
2009/2010
2010/2011
2011/2012
2012/2013
2013/2014
2014/2015
2015/2016
1999 2000 2001 2002 2003 2004 2005 2006 2007 2008 2009 2010 2011 2012 2013 2014 2015
Bow River near Ronalane Bridge
Winter (November - March)Open Water (April - October)

51South Saskatchewan Region - Status of Surface Water Quality Management Response
SodiumAdsorptionRatio–OldmanRiveratHwy3OpenWaterandWinterMedian Trigger Exceedances
A median trigger exceedance occurred in 2015/2016 for sodium adsorption ratio (SAR) in the Oldman River at Hwy 3 station, for the open water and winter periods.
Examination of the dataset revealed that the 2015/2016 medians are not the highest observed in the dataset at this station and the maximum values observed are one fifth the limit value of 5. An increasing trend is not apparent in data since 1999.
Overall the SAR values in the Oldman River at Hwy 3 appear higher than observed at the upstream stations (Brocket), lower than the downstream station (Hwy 36) and are within the range observed at the corresponding stations in the Bow River (Cluny and Ronalane).
Further analysis is needed to evaluate the influence of river flow on SAR values observed at this station and to confirm there is no statistical trend.
Figure 11. Box Plots of the Sodium Adsorption Ratio Data in the Oldman River at Hwy 3 Station During Open Water and Winter from April 1999 to March 2016.
1.25
1.15
1.05
0.95
0.85
0.75
0.65
0.55
0.45
0.35
0.25
0.151999/2000
2000/2001
2001/2002
2002/2003
2003/2004
2004/2005
2005/2006
2006/2007
2007/2008
2008/2009
2009/2010
2010/2011
2011/2012
2012/2013
2013/2014
2014/2015
2015/2016
1999 2000 2001 2002 2003 2004 2005 2006 2007 2008 2009 2010 2011 2012 2013 2014 2015
Oldman River Above Lethbridge at Hwy 3
Winter (November - March)Open Water (April - October)
Reference points: Median 90th Percentile
SAR
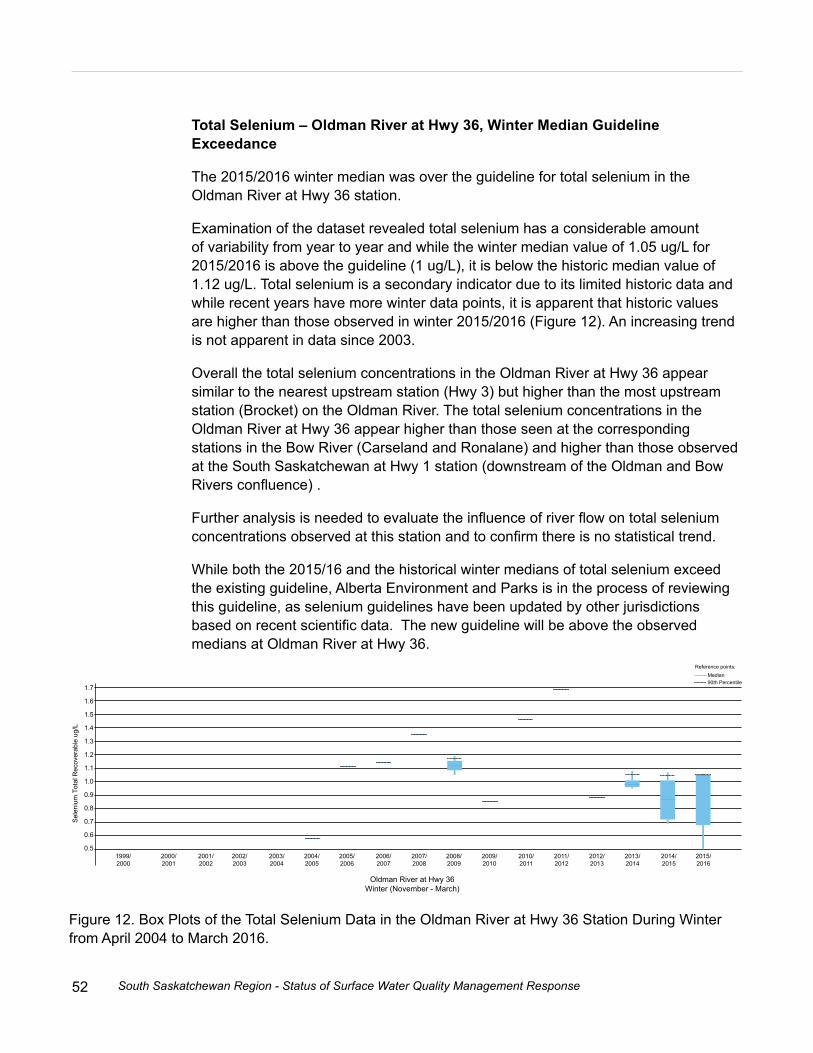
52 South Saskatchewan Region - Status of Surface Water Quality Management Response
TotalSelenium–OldmanRiveratHwy36,WinterMedianGuidelineExceedance
The 2015/2016 winter median was over the guideline for total selenium in the Oldman River at Hwy 36 station.
Examination of the dataset revealed total selenium has a considerable amount of variability from year to year and while the winter median value of 1.05 ug/L for 2015/2016 is above the guideline (1 ug/L), it is below the historic median value of 1.12 ug/L. Total selenium is a secondary indicator due to its limited historic data and while recent years have more winter data points, it is apparent that historic values are higher than those observed in winter 2015/2016 (Figure 12). An increasing trend is not apparent in data since 2003.
Overall the total selenium concentrations in the Oldman River at Hwy 36 appear similar to the nearest upstream station (Hwy 3) but higher than the most upstream station (Brocket) on the Oldman River. The total selenium concentrations in the Oldman River at Hwy 36 appear higher than those seen at the corresponding stations in the Bow River (Carseland and Ronalane) and higher than those observed at the South Saskatchewan at Hwy 1 station (downstream of the Oldman and Bow Rivers confluence) .
Further analysis is needed to evaluate the influence of river flow on total selenium concentrations observed at this station and to confirm there is no statistical trend.
While both the 2015/16 and the historical winter medians of total selenium exceed the existing guideline, Alberta Environment and Parks is in the process of reviewing this guideline, as selenium guidelines have been updated by other jurisdictions based on recent scientific data. The new guideline will be above the observed medians at Oldman River at Hwy 36.
Figure 12. Box Plots of the Total Selenium Data in the Oldman River at Hwy 36 Station During Winter from April 2004 to March 2016.
Reference points:Median90th Percentile
1999/2000
2000/2001
2001/2002
2002/2003
2003/2004
2004/2005
2005/2006
2006/2007
2007/2008
2008/2009
2009/2010
2010/2011
2011/2012
2012/2013
2013/2014
2014/2015
2015/2016
Oldman River at Hwy 36Winter (November - March)
1.7
1.6
1.5
1.4
1.3
1.2
1.1
1.0
0.9
0.8
0.7
0.6
0.5
Sele
nium
Tot
al R
ecov
erab
le u
g/L

53South Saskatchewan Region - Status of Surface Water Quality Management Response
3.3 2016/17 Management ResponseThe Minister’s Determination for 2016/2017 (monthly water quality data collected and assessed for the period April 2016 to March 2017) confirmed that one limit and four triggers were exceeded for the primary indicators. These exceedances were reported as follows (AEP 2017d):
• Milk River at Hwy 880 station exceedance of the total dissolved solids limit for the winter period.
• Bow River at Cochrane station exceedance of the sulphate peak triggers for both the open water and winter periods.
• Bow River at Carseland station exceedance of the sulphate peak triggers for both the open water and winter periods.
• Bow River at Cluny station exceedance of the total dissolved solids median trigger for both the open water and winter periods.
The limit exceedance will move directly into the preliminary assessment and investigation phase, while the remaining trigger exceedances will move into the preliminary assessment phase of the management response. All indicators that exceeded a trigger, limit or guideline are currently in the preliminary assessment phase of the management response. For those indicators that exceeded a trigger or guideline, the preliminary assessment will determine the need for an investigation. Because total dissolved solids in the Milk River at Hwy 880 again exceeded a limit, it will continue its course to be moved into the investigation stage, which will be informed by the results of the preliminary assessment.
VerificationandPreliminaryAssessment
Verification of the 2016/2017 data is complete. The 2016/2017 data were downloaded from Alberta Environment and Park’s Water Data System and the median and 90th percentile values were calculated and compared against historic triggers and limits. This work was undertaken by Environment and Parks, Environmental Monitoring and Science Division in preparation of the 2016/2017 Status of Surface Water Quality Report (2017d).
The preliminary assessment of triggers that were exceeded also involved looking at all data available since April 1999. This included additional data from April 2009 to March 2016 that were not included in the annual assessment of trigger exceedances. These additional years of data were included in the preliminary assessment data examination since they represent recent water quality.

54 South Saskatchewan Region - Status of Surface Water Quality Management Response
TotalDissolvedSolids–MilkRiveratHwy880,WinterMedianLimitExceedance
As in 2015/16, the 2016/2017 winter median was again over the limit for total dissolved solids in the Milk River at Hwy 880 station.
Examination of the dataset revealed that TDS has a considerable amount of variability from year to year and while the winter median value of 510 mg/L for 2016/2017 is above the 500 mg/L limit value, it is below the median trigger value of 606 mg/L. It is also a lower median value than has been observed in other winters in the dataset and was the exact same value as 2015/2016 (510 mg/L) (Figure 13). An increasing trend is still not apparent in data since 2003.
Overall the TDS concentrations during the winter in the Milk River at Hwy 880 are higher than those seen in the Oldman, Bow or South Saskatchewan Rivers.
Further analysis is needed to evaluate the influence of river flow on TDS concentrations observed at this station and to confirm there is no statistical trend. This work will be undertaken to complete the preliminary assessment. Moreover, the Milk River is an international river whose waters are apportioned under the 1909 Boundary Waters Treaty, consequently the Milk River flow is heavily modified and further assessment will be considered regarding that influence on TDS at Hwy 880.
Figure 13. Box Plots of the Total Dissolved Solids Data in the Milk River at Hwy 880 Station During Winter from April 2003 to March 2017.
Reference points:Median90th Percentile
1300125012001150110010501000950900850800750700650600550500450400350300250200150
Tota
l Dis
solv
ed S
olid
s (C
ALC
D.)
mg/
L
2003/2004 2004/2005 2005/2006 2006/2007 2007/2008 2008/2009 2009/2010 2010/2011 2011/2012 2012/2013 2013/2014 2014/2015 2015/2016 2016/2017
Milk River At Hwy 880Winter (November - March)
Since this limit was again exceeded, total dissolved solids in the Milk River at Hwy 880 will continue to be moved in to the investigation phase to better understand potential sources and the potential risk that existing conditions may pose. Preliminary review of activities requiring an Environment and Parks approval did not indicate any existing point sources that may contribute total dissolved solids to the Milk River at Hwy 880, however, potential diffuse point sources, as well as other influences such as runoff and groundwater, will continue to be explored. The limit for total dissolved solids is based on an irrigation guideline, however, the exceedance

55South Saskatchewan Region - Status of Surface Water Quality Management Response
occurred during the winter period, therefore risk is expected to be low. A more detailed risk assessment will be conducted to confirm this. This investigation will inform the need for management actions.
Sulphate–BowRiveratCochrane,OpenWaterandWinterPeakTriggerExceedance
A peak trigger exceedance occurred in 2015/2016 for sulphate in the Bow River at Cochrane station, for the winter period.
Examination of the dataset revealed that although the 2016/2017 90th percentile values are the highest observed in the dataset at this station (winter only), no samples exceeded the calculated limit value (based on hardness). Sulphate at the Cochrane station has the appearance of an increasing trend since 1999 (Figure 14).
Overall, sulphate concentrations in the Bow River at Cochrane are lower than the downstream stations (Carseland, Cluny and Ronalane) and are similar to those seen in the corresponding most upstream station (Brocket) on the Oldman River.
Further data analysis is needed to determine if the trend is statistically significant and what influence river flow has on sulphate concentrations. Moreover, the Cochrane station is less than 20 km downstream of the power generating Ghost Dam outlet and further assessment will be considered regarding the dams influence on sulphate at Cochrane.
Figure 14. Box Plots of the Sulphate Data in the Bow River at Cochrane Station During Open Water and Winter from April 1999 to March 2017.
Bow River at Cochrane
52.050.048.046.044.042.040.038.036.034.032.030.028.026.024.022.020.0
Sulp
hate
Dis
solv
ed m
g/L
1999/2000
2000/2001
2001/2002
2002/2003
2003/2004
2004/2005
2005/2006
2006/2007
2007/2008
2008/2009
2009/2010
2010/2011
2011/2012
2012/2013
2013/2014
2014/2015
2015/2016
2016/2017
1999 2000 2001 2002 2003 2004 2005 2006 2007 2008 2009 2010 2011 2012 2013 2014 2015 2016
Winter (November - March)Open Water (April - October)
Reference points:Median90th Percentile

56 South Saskatchewan Region - Status of Surface Water Quality Management Response
Figure 15. Box Plots of the Sulphate Data in the Bow River at Carseland Station During Open Water and Winter from April 1999 to March 2017
Reference points:Median90th Percentile
Bow River at Carseland Dam
73.571.068.566.063.561.058.556.053.551.048.546.043.541.038.536.033.531.028.526.023.5
Sulp
hate
Dis
solv
ed m
g/L
1999/2000
2000/2001
2001/2002
2002/2003
2003/2004
2004/2005
2005/2006
2006/2007
2007/2008
2008/2009
2009/2010
2010/2011
2011/2012
2012/2013
2013/2014
2014/2015
2015/2016
2016/2017
1999 2000 2001 2002 2003 2004 2005 2006 2007 2008 2009 2010 2011 2012 2013 2014 2015 2016
Winter (November - March)Open Water (April - October)
Sulphate–BowRiveratCarseland,OpenWaterandWinterPeakTriggerExceedances
A mean trigger exceedance occurred in 2015/2016 for sulphate in the Bow River at Carseland station, for the open water and winter periods.
Examination of the dataset revealed that although the 2016/2017 90th percentile values are the highest observed in the dataset at this station (winter only), no samples exceeded the calculated limit value (based on hardness). Sulphate at the Carseland station has the appearance of an increasing trend since 1999 (Figure 15).
Overall, sulphate concentrations in the Bow River at Carseland are higher than observed at the upstream station (Cochrane) similar to or lower than the downstream stations (Cluny and Ronalane) and are within the range observed at the corresponding stations on the Oldman River (Hwy 3).
Further data analysis is needed to determine if the trend is statistically significant and what influence river flow has on sulphate concentrations.

57South Saskatchewan Region - Status of Surface Water Quality Management Response
Figure 16. Box Plots of the Total Dissolved Solids Data in the Bow River at Cluny Station During Open Water and Winter from April 1999 to March 2017.
TotalDissolvedSolids–BowRiveratClunyOpenWaterandWinterMedianTrigger Exceedances
A mean trigger exceedance occurred in 2015/2016 for total dissolved solids in the Bow River at Cluny station, for the open water and winter periods.
Examination of the dataset revealed that the 2016/2017 TDS medians are the highest observed in the dataset at this station (winter only) and the maximum values observed are approximately half the 500 mg/L limit value. TDS at the Cluny station has the appearance of an increasing trend since 1999 (Figure 16).
Overall TDS concentrations in the Bow River at Cluny appear similar to the upstream and downstream stations (Carseland and Ronalane) but higher than the most upstream station (Cochrane) and similar to the values at the comparable station on the Oldman River (Hwy 3).
Further data analysis is needed to determine if the trend is statistically significant and what influence river flow has on TDS concentration.
Reference points:Median90th Percentile
Bow River at Cluny
360
340
320
300
280
260
240
220
200
180
160
Tota
l Dis
solv
ed S
olid
s (C
ALC
D.)m
g/L
1999/2000
2000/2001
2001/2002
2002/2003
2003/2004
2004/2005
2005/2006
2006/2007
2007/2008
2008/2009
2009/2010
2010/2011
2011/2012
2012/2013
2013/2014
2014/2015
2015/2016
2016/2017
1999 2000 2001 2002 2003 2004 2005 2006 2007 2008 2009 2010 2011 2012 2013 2014 2015 2016
Winter (November - March)Open Water (April - October)

58 South Saskatchewan Region - Status of Surface Water Quality Management Response
Next Steps4.0
Alberta Environment and Parks will complete the preliminary assessment for all indicators exceeding a trigger, limit or guideline in 2014/15, 2015/16 and 2016/17. This includes:
• flow-adjusted trend assessments on the indicators with trigger exceedances in 2014/2015, at the stations where the exceedance occurred and
• unadjusted, seasonally-adjusted and flow-adjusted trend assessments on the indicators that exceeded a trigger, limit or guideline in 2015/16 or 2016/17, at the stations where the exceedance occurred.
Total dissolved solids in the Milk River at Hwy 880 will be moved in to the investigation phase, with analyses focusing on understanding sources of total dissolved solids and the risk current conditions pose for aquatic life and other uses.
The status of this management response will be further updated in successive reports and will be publicly available on the Environment and Parks website.

59South Saskatchewan Region - Status of Surface Water Quality Management Responsee
References5.0
ReferencesforSSRWater
Alberta Environment and Parks (AEP). 2017a. South Saskatchewan Region Status of Management Response for Environmental Management Frameworks as of May 2016. Government of Alberta. ISBN: 978-1-4601-3457-3 (PDF). Available at: https://open.alberta.ca/publications/9781460134573.
Alberta Environment and Parks (AEP). 2017b. Status of Water Quality South Saskatchewan Region, Alberta for April 2014 – March 2015. Government of Alberta. ISBN: 978-1-4601-3068-1. Available at: https://open.alberta.ca/publications/9781460130681.
Alberta Environment and Parks (AEP). 2017c. Status of Surface Water Quality South Saskatchewan Region, Alberta for April 2015 – March 2016. Government of Alberta. ISBN: 978-1-4601-3582-2. Available at: https://open.alberta.ca/publications/9781460135822.
Alberta Environment and Parks (AEP). 2017d. Status of Surface Water Quality South Saskatchewan Region, Alberta for April 2016 – March 2017. Government of Alberta. ISBN: 978-1-4601-3583-9. Available at: https://open.alberta.ca/publications/978146013583-9.
Alberta Environment and Sustainable Resource Development (AESRD). 2014. South Saskatchewan Region Surface Water Quality Management Framework: for the Mainstem Bow, Milk, Oldman and South Saskatchewan Rivers (Alberta). Government of Alberta. ISBN: 978-1-4601-1860-3 (Printed); 978-1-4601-1861-0 (PDF) Available at: https://open.alberta.ca/publications/9781460118603.
Government of Alberta (GoA). 2012. Lower Athabasca Regional Plan 2012 - 2022. ISBN: 978-1-4601-0537-5 (Print); 978-1-4601-0538-2 (PDF). Available at: https://open.alberta.ca/publications/9781460105382.
HDR Corporation. 2011. South Saskatchewan Regional Plan Surface Water Quality Management Framework: Statistical Methods Final Report. Prepared for Alberta Environment. ISBN 978-1-4601-2539-7 (PDF). July 2014. Available at: https://open.alberta.ca/publications/9781460125397.
Helsel, D. R., D. K.Mueller, and J. R. Slack. 2006. Computer program for the Kendall family of trend tests: U.S. Geological Survey Scientific Investigations Report 2005-5275, p. 4. USGS.

60 South Saskatchewan Region - Status of Surface Water Quality Management Response
Appendix
Outside value
Upper adjacent value
Lower adjacent value
90th Percentile
Upper quartile (Q3)
Lower quartile (Q3)
Median
6.0