Embed Size (px)
Citation preview

Alaska Training Program Performance 2012 Employment and Wages of Training Program Participants Exiting in FY 2011
A report prepared for the
Alaska Workforce Investment Board
by the
Alaska Department of Labor and Workforce
Development
Division of Administrative Services
Research and Analysis Section
Brynn Keith, Director, Administrative Services
Dan Robinson, Research Chief
Katherine Regester, Research Analyst
Yuancie Lee, Economist
February 2013

2 | P a g e
Training Program Performance Report
Alaska Department of Labor and Workforce Development, Research and Analysis Section
Overview
Letter from the AWIB Chairman i
Overview and Executive Summary ii
FY 2011 Performance Measures Summary 3
Training Funds
Carl Perkins IV Fund
Carl Perkins—Postsecondary 6
Carl Perkins—Secondary 7
Denali Training Fund 8
State Training and Employment Program (STEP) 9
Alaska Technical Vocational Education Program (TVEP) 10
Workforce Investment Act (WIA)
WIA 1B Adult 11
WIA 1B Dislocated Workers 12
WIA Title 1B Youth 13
Training Programs
Adult Basic Education 15
Alaska Construction Academy 16
Alaska Pipeline Worker Training 17
Alaska Technical Center-Kotzebue 18
AVTEC 19
Delta Career Advancement Center 20
Galena Interior Learning Academy 21
Ilisagvik College 22
Northwestern Alaska Career and Technical Center (NACTEC) 23
New Frontier Vocational Technical Center 24
Northern Industrial Training 25
Southwest Alaska Vocational and Education Center (SAVEC) 26
University of Alaska Vocational Education Programs 27
Yuut Elitnaurviat 28
Appendix
Explanation of Performance Measures 30
Methodology 31
AWIB Priorities 32
Multiple Programs 33
Year Round Employment 34
Adult Basic Education by Location 35
Alaska’s Institute of Technology by Program 36
UA Voc Ed Detail 37
List of Acronyms 43
Table of Contents

Department of Labor and Workforce Development
Alaska Workforce Investment Board
1016 West Sixth Avenue, Suite 401
Anchorage, Alaska 99501
Main: 907.269.7485
Fax: 907.269.7489
i | P a g e
Training Program Performance Report
Alaska Department of Labor and Workforce Development, Research and Analysis Section
February 14, 2013
I am pleased to present the Alaska Workforce Investment Board’s executive summary highlighting
the Alaska Training Program Performance 2012 report, prepared for the board by the Research &
Analysis section of the Alaska Department of Labor and Workforce Development. The FY 2012
report verifies a more effective and efficient workforce development system in Alaska with more
clarity and transparency.
As the lead planning and coordinating entity for Alaska’s public workforce development system, the board provides policy oversight of state and federally funded job training and vocational education programs. AWIB members, a majority of whom are private sector leaders, examine employment trends and emerging occupations to ensure training efforts are aligned and Alaskans are ready for the good paying, high demand jobs that are available to them.
Each year the AWIB is required to report to the Alaska State Legislature on the performance and
evaluation of training programs within its purview, as specified in Alaska Statute 23.15.580(b)(9) and
(f). The report details the training programs and identifies the major providers resourced by state,
federal and private sector funds. The high percentage of partnerships between the education and
training entities and the employers in business and industry contributes to high placements, high
retention and increase in wages for the trainees, as well as an improving means for access by those in
all regions of the state.
The full report is on our website www.labor.state.ak.us/awib/home.htm. We will provide a hard
copy to legislators upon request. The board is establishing this practice in the interests of reducing
costs and responsible stewardship of our budget.
The Alaska Workforce Investment Board welcomes your support and perspectives. We look
forward to working closely with you to build a quality workforce and a prosperous, satisfying future
for all Alaskans
Jim Lynch, Chair
ii | P a g e
Training Program Performance Report
Alaska Department of Labor and Workforce Development, Research and Analysis Section
Alaska Workforce Investment Board
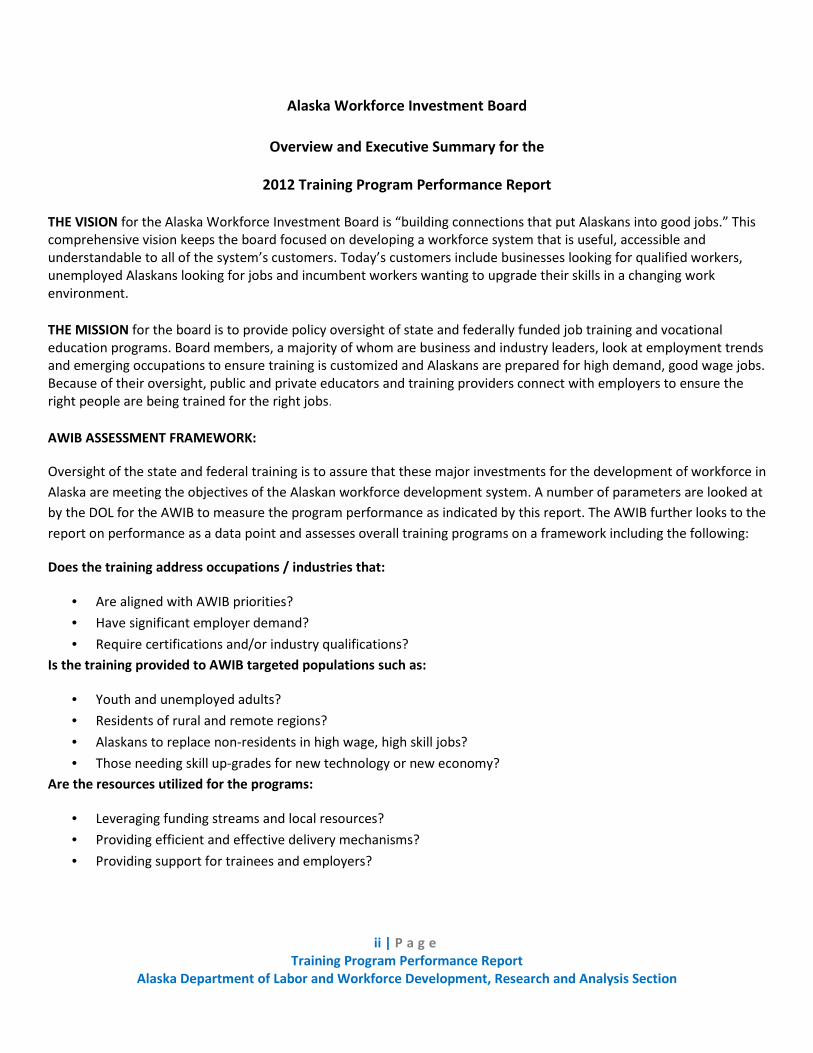
Overview and Executive Summary for the
2012 Training Program Performance Report
THE VISION for the Alaska Workforce Investment Board is “building connections that put Alaskans into good jobs.” This
comprehensive vision keeps the board focused on developing a workforce system that is useful, accessible and
understandable to all of the system’s customers. Today’s customers include businesses looking for qualified workers,
unemployed Alaskans looking for jobs and incumbent workers wanting to upgrade their skills in a changing work
environment.
THE MISSION for the board is to provide policy oversight of state and federally funded job training and vocational
education programs. Board members, a majority of whom are business and industry leaders, look at employment trends
and emerging occupations to ensure training is customized and Alaskans are prepared for high demand, good wage jobs.
Because of their oversight, public and private educators and training providers connect with employers to ensure the
right people are being trained for the right jobs.
AWIB ASSESSMENT FRAMEWORK:
Oversight of the state and federal training is to assure that these major investments for the development of workforce in
Alaska are meeting the objectives of the Alaskan workforce development system. A number of parameters are looked at
by the DOL for the AWIB to measure the program performance as indicated by this report. The AWIB further looks to the
report on performance as a data point and assesses overall training programs on a framework including the following:
Does the training address occupations / industries that:
• Are aligned with AWIB priorities?
• Have significant employer demand?
• Require certifications and/or industry qualifications?
Is the training provided to AWIB targeted populations such as:
• Youth and unemployed adults?
• Residents of rural and remote regions?
• Alaskans to replace non-residents in high wage, high skill jobs?
• Those needing skill up-grades for new technology or new economy?
Are the resources utilized for the programs:
• Leveraging funding streams and local resources?
• Providing efficient and effective delivery mechanisms?
• Providing support for trainees and employers?

iii | P a g e
Training Program Performance Report
Alaska Department of Labor and Workforce Development, Research and Analysis Section
Are the programs delivering good performance as measured by:
• ROI?
• Placement rates?
• Retention?
• Wage increases?
• Trainee and employer satisfaction?
RESULTS IN 2012:
• Programs have attained high marks for placement, retention and employer satisfaction. In addition there has
been substantial wage growth for trainees
• There has been a continuing growth of partnerships across providers, between business / industry and
education, and between agencies and projects resulting in reduced duplication, leveraging of funding streams
and easier access for the trainees.
• The programs have been on-target for priority industries and the current economy with a developing capability
for serving growth industries and major projects.
• There has been good support for Regional Training Centers with many programs reaching into rural areas
• Pilot programs have resulted in templates for more effective and efficient training programs for both entry into
the workforce and upgrading of skills to meet new standards or career opportunities.
AWIB RECOMMENDATIONS FOR THE GOVERNOR AND LEGISLATURE:
Following are recommendations for the 2013 Legislature and the Governor to support the systems and the policies for
workforce development. These five recommendations will both reach down into our schools to prepare Alaskans for the
workforce as well as to assist the growth of our economy.
• Support the implementation of the state’s CTE plan,
o Provide funding to the DEED / DOL / UA to support the plan
o Provide funding for schools to develop the infrastructure for the CTE plan: facilities / resources, qualified
instructors and career guides / counselors to assure students are oriented to careers and have the
opportunity for career activities in the schools and communities.
o The CTE plan will continue to build partnerships to connect education with business / industry
• Support the AK Performance Scholarship plan for degree & CTE / training programs
o This may be a key to entice students into post-secondary training, increase the graduation rate, and
better articulate progression from secondary to post-secondary to careers.

iv | P a g e
Training Program Performance Report
Alaska Department of Labor and Workforce Development, Research and Analysis Section
o The scholarship program will raise the standards for students in schools and should help create a more
skilled workforce for the future. Few high skill / high wage jobs exist that do not require more math,
technology and communication skills than our graduates have.
• Expand the “academy “model piloted with the construction trades to include other AWIB priority industries.
o The academies require close connections between education & business to assure industry standards
are met and careers are well communicated.
o The academies coupled with a Tech-Prep approach have resulted in direct hire of graduates for entry-
level and smooth transition into post-secondary training for higher level jobs.
• Continue to support skill training for occupations vital to Alaska’s current and future economy such as mining
and other natural resources, renewable energy/energy efficiency, health systems and infrastructure
construction projects as well as emerging sectors.
o Align capital expenditures for projects with economic development coupled with the workforce
development to grow the economy.
• Continue to support workforce development in all areas of the state:
o Continue TVEP to support Regional Training Centers across the state.
Assist regional economic development councils with workforce development to grow local economies.

v | P a g e
Training Program Performance Report
Alaska Department of Labor and Workforce Development, Research and Analysis Section
AWIB Membership
As of February, 2013 the board consists of 24 representatives of business and industry, education, organized labor, and
state government and other individuals with specific experience/expertise in accordance with Alaska Statute 23.15.550.
Mead Treadwell Dawn Salesky
Lieutenant Governor Adult Basic Education
Dianne Blumer Corey Baxter
Commissioner, Department of Labor and Organized Labor
Workforce Development
Jim Lynch
Michael Hanley Business/Industry
Commissioner, Department of Education and
Early Development John MacKinnon
Private Sector
William Streur
Commissioner, Department of Health and Social Pearl Strub
Services Business and Industry
Susan Bell Joey Merrick
Commissioner, Department of Community Organized Labor
Commerce and Economic Development
Florian Borowski
Patrick Gamble Business and Industry
President, University of Alaska
Martin Anderson
Ken Peltier Secondary Vocational Education
Post Secondary Education/Vocational Education
Doug Ward
John Cannon Private Sector
Professional Experience with Developmental
Disabilities Mike Woods
Public Education
Charles Edwardson
Native Education/Training Organization Michelle Zenger
Business and Industry
William Bieber
Private Sector Terry Wanzer
Private Sector
Christopher Gregg
Organized Labor Krisha Losescher
Private Sector
3 | P a g e
Training Program Performance Report
Alaska Department of Labor and Workforce Development, Research and Analysis Section
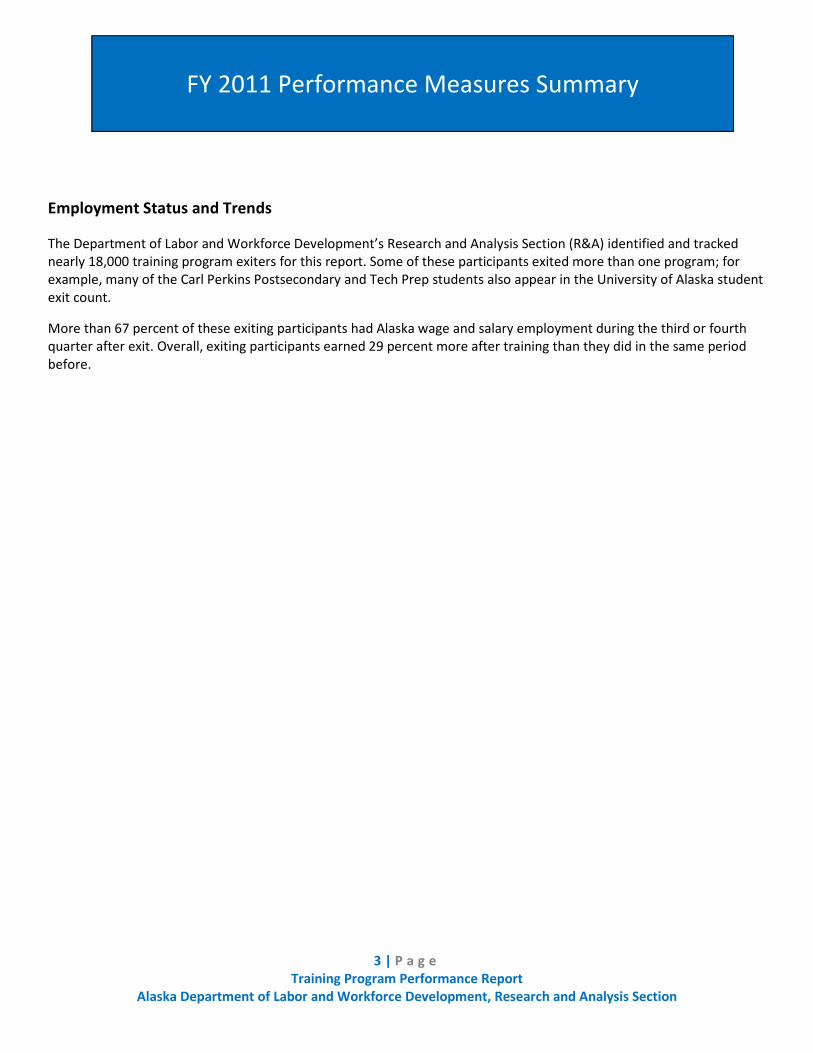
Employment Status and Trends
The Department of Labor and Workforce Development’s Research and Analysis Section (R&A) identified and tracked
nearly 18,000 training program exiters for this report. Some of these participants exited more than one program; for
example, many of the Carl Perkins Postsecondary and Tech Prep students also appear in the University of Alaska student
exit count.
More than 67 percent of these exiting participants had Alaska wage and salary employment during the third or fourth
quarter after exit. Overall, exiting participants earned 29 percent more after training than they did in the same period
before.
FY 2011 Performance Measures Summary

4 | P a g e
Training Program Performance Report
Alaska Department of Labor and Workforce Development, Research and Analysis Section
FY 2011 Employment and Earnings Before and After Training Program (Months 7 to 12) by Training Type
Number
Exiting
Number
Employed % Employed Total Wages
Total Qtrs
Worked
Avg.
Earnings/Qtr
Total Median
Wages
Before After Before After Before After Before After Before After Before After
Training
Funds 11,666 7,215 8,226 61.8 70.5 $82,825,502 $114,730,582 10,508 12,774 $7,882 $8,982 $7,852 $10,462
Training
Programs 9,400 5,374 6,015 57.2 64.0 $65,134,599 $88,705,893 8,120 9,372 $8,022 $9,465 $8,229 $11,451
Note: Includes individuals who participated in multiple training programs.
Source: Alaska Department of Labor and Workforce Development, Research and Analysis Section
FY 2011 Employment and Earnings Before and After Training Program (Months 7 to 12)
FY 2011 Programs Number
Exiting
Number
Employed % Employed Total Wages
Total Qtrs
Worked Avg. Wages/Qtr Total Median Wages
Before After Before After Before After Before After Before After Before After
Carl Perkins—
Postsecondary 5,424 3,536 3,867 65.2 71.3 $39,156,266 $51,353,414 5,446 6,264 $7,190 $8,198 $8,690 $11,148
Carl Perkins—
Secondary 1,994 794 1,326 39.8 66.5 $1,805,278 $7,693,386 810 1,706 $2,229 $4,510 $1,828 $4,361
Denali Training
Fund 66 54 60 81.8 90.9 $476,765 $702,177 88 106 $5,418 $6,624 $7,809 $10,224
STEP 2,080 1,769 1,765 85.0 84.9 $30,406,258 $39,674,714 2,682 2,870 $11,337 $13,824 $14,364 $20,091
TVEP 977 462 508 47.3 52.0 $5,164,678 $6,654,851 606 744 $8,523 $8,945 $5,142 $8,582
WIA 1B Adult 332 213 234 64.2 70.5 $2,058,876 $3,758,796 330 398 $6,239 $9,444 $7,533 $14,470
WIA 1B Dislocated
Workers 226 166 146 73.5 64.6 $3,211,994 $2,949,112 286 260 $11,231 $11,343 $14,890 $16,711
WIA Title 1B
Youth 567 221 320 39.0 56.4 $569,455 $1,944,131 260 426 $2,190 $4,564 $2,006 $3,733
Adult Basic
Education 1,462 587 701 40.2 47.9 $2,998,606 $4,607,590 708 872 $4,235 $5,284 $2,752 $4,748
Alaska
Construction
Academy 432 249 310 57.6 71.8 $2,142,470 $3,723,750 332 462 $6,453 $8,060 $5,681 $10,673
Pipeline Training 493 397 431 80.5 87.4 $7,841,724 $10,088,260 668 714 $11,739 $14,129 $17,574 $21,458
AK Tech—
Kotzebue 160 106 108 66.3 67.5 $1,268,444 $1,584,203 150 168 $8,456 $9,430 $7,548 $10,707
AVTEC 653 446 480 68.3 73.5 $5,997,638 $7,433,598 670 776 $8,952 $9,579 $9,242 $12,262
Delta Career
Advancement
Center 114 56 64 49.1 56.1 $1,055,641 $1,073,419 90 98 $11,729 $10,953 $16,258 $10,369
Galena 10 8 10 80.0 100.0 $170,846 $202,039 16 20 $10,678 $10,102 $19,945 $18,929
Ilisagvik 25 18 21 72.0 84.0 $223,485 $369,755 28 40 $7,982 $9,244 $9,787 $17,394
NACTEC 267 23 44 8.6 16.5 $45,703 $128,590 14 36 $3,265 $3,572 $703 $786
New Frontier VTC 24 9 15 37.5 62.5 $68,477 $141,428 12 28 $5,706 $5,051 $7,604 $7,713
Northern
Industrial Training 251 166 207 66.1 82.5 $2,239,467 $4,026,669 250 350 $8,958 $11,505 $10,689 $18,098
SAVEC 132 87 103 65.9 78.0 $1,533,039 $2,152,306 124 182 $12,363 $11,826 $13,915 $22,512
UA Voc Ed 4,407 2,605 2,894 59.1 65.7 $33,284,575 $45,404,542 4,228 4,712 $7,872 $9,636 $9,785 $13,110
Yuut Elitnaurviat 970 617 627 63.6 64.6 $6,264,484 $7,769,745 830 914 $7,548 $8,501 $4,778 $7,167
Source: Alaska Department of Labor and Workforce Development, Research and Analysis Section
ND: Nondisclosable
Total Training Program Performance Indicators
for Participants Exiting in FY 2011

5 | P a g e
Training Program Performance Report
Alaska Department of Labor and Workforce Development, Research and Analysis Section
TRAINING FUNDS

6 | P a g e
Training Program Performance Report
Alaska Department of Labor and Workforce Development, Research and Analysis Section
The purpose of the federal Carl D. Perkins Career and Technical Education Improvement Act of 2006 (Perkins IV) is to
develop the academic, career, and technical skills of secondary and postsecondary education students needed to
succeed in a knowledge-and-skills based economy. The most frequent uses of funds include: equipment, curriculum
materials, curriculum development or modification, staff hiring and development, career counseling and guidance,
academic-vocational integration, services for special populations, and expansion of tech prep programs.
For more information about the Carl Perkins IV Fund: http://education.alaska.gov/tls/CTE/perkins.html
The Perkins IV postsecondary allocation was distributed via competitive grants to six institutions: (1) Alaska’s Institute of
Technology, (2) the University of Alaska Anchorage Community and Technical College, (3) Sitka Campus of the University
of Alaska Southeast, and the University of Alaska Fairbanks’ (4) Tanana Valley Campus, (5) College of Rural and
Community Development, and (6) Bristol Bay Campus.
Statutory[1]
Training Program Performance Indicators
for Participants Exiting in FY 2011
Total Training Participants 5,424
Alaska Employed One Year After Leaving Training Program [2] 3,684
Department of Defense or Office of Personnel Management Employed [3] 131
Median Total Wages 7-12 Months After Exit [4] $11,148
Percentage of Participants Employed in Training-Related Jobs NA[5] [1]
AS 23.15.580.
[2] Worked in the fourth quarter after completing training with the first quarter defined as the first full quarter after training was
completed. Does not include self-employed workers.
[3] Federal employment except U.S. Postal Service.
[4]
Median wages during the third and fourth quarter after training was completed with the first quarter defined as the first full
quarter after training was completed. This only includes unemployment insurance wage earnings.
[5] For a variety of reasons, training programs cannot always be linked to the jobs participants obtain.
0
20
40
60
80
100
2008 2009 2010 2011
Percent of Participants Employed
Pre- & Post-Training (Months 7-12)Pre-Training Post-Training
Source: Alaska Department of Labor and Workforce Development,
Research and Analysis Section
$0
$5,000
$10,000
$15,000
2008 2009 2010 2011
Median Total Wages
Pre- & Post-Training (Months 7-12)Pre-Training Post-Training
Source: Alaska Department of Labor and Workforce Development,
Research and Analysis Section
Carl Perkins—Postsecondary
7 | P a g e
Training Program Performance Report
Alaska Department of Labor and Workforce Development, Research and Analysis Section
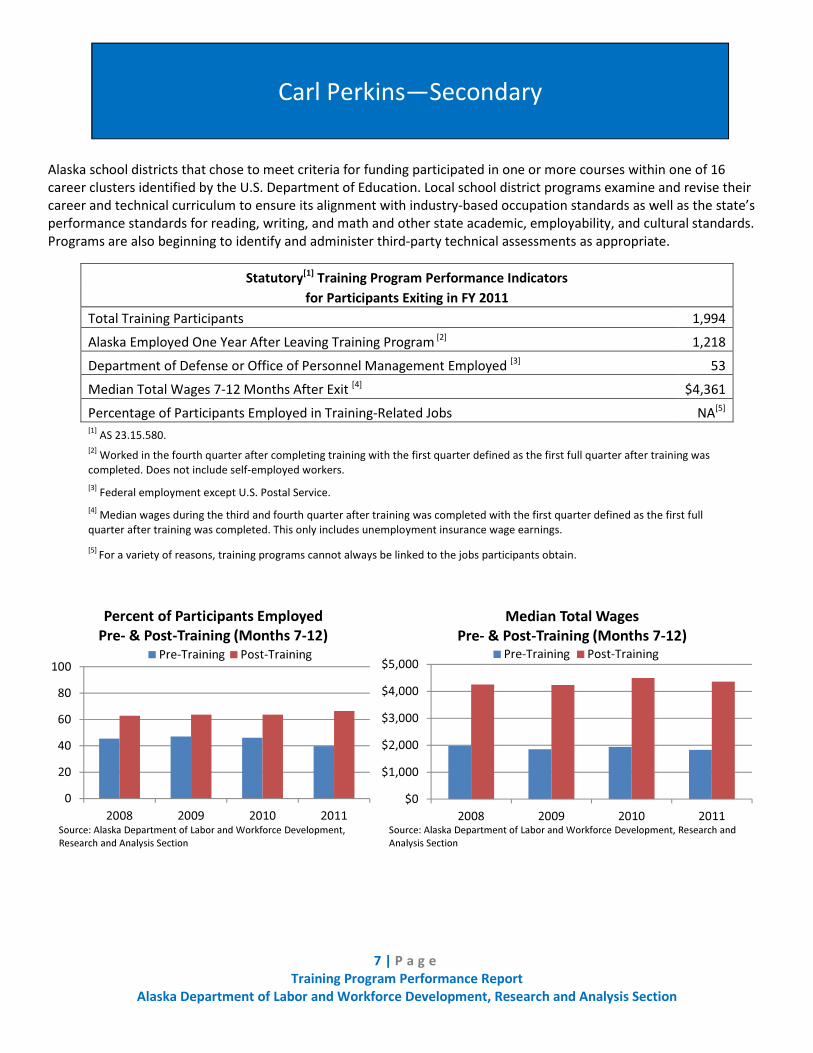
Alaska school districts that chose to meet criteria for funding participated in one or more courses within one of 16
career clusters identified by the U.S. Department of Education. Local school district programs examine and revise their
career and technical curriculum to ensure its alignment with industry-based occupation standards as well as the state’s
performance standards for reading, writing, and math and other state academic, employability, and cultural standards.
Programs are also beginning to identify and administer third-party technical assessments as appropriate.
Statutory[1]
Training Program Performance Indicators
for Participants Exiting in FY 2011
Total Training Participants 1,994
Alaska Employed One Year After Leaving Training Program [2] 1,218
Department of Defense or Office of Personnel Management Employed [3] 53
Median Total Wages 7-12 Months After Exit [4] $4,361
Percentage of Participants Employed in Training-Related Jobs NA[5] [1]
AS 23.15.580.
[2] Worked in the fourth quarter after completing training with the first quarter defined as the first full quarter after training was
completed. Does not include self-employed workers.
[3] Federal employment except U.S. Postal Service.
[4]
Median wages during the third and fourth quarter after training was completed with the first quarter defined as the first full
quarter after training was completed. This only includes unemployment insurance wage earnings.
[5] For a variety of reasons, training programs cannot always be linked to the jobs participants obtain.
0
20
40
60
80
100
2008 2009 2010 2011
Percent of Participants Employed
Pre- & Post-Training (Months 7-12)
Pre-Training Post-Training
Source: Alaska Department of Labor and Workforce Development,
Research and Analysis Section
$0
$1,000
$2,000
$3,000
$4,000
$5,000
2008 2009 2010 2011
Median Total Wages
Pre- & Post-Training (Months 7-12)Pre-Training Post-Training
Source: Alaska Department of Labor and Workforce Development, Research and
Analysis Section
Carl Perkins—Secondary

8 | P a g e
Training Program Performance Report
Alaska Department of Labor and Workforce Development, Research and Analysis Section
The Denali Training Fund was established by the Denali Commission and is administered by the Division of Business
Partnerships. The federally funded program provides job training assistance to Alaska’s rural residents. The Denali
Commission’s goal is to ensure residents have the opportunity to learn and to earn an income from local projects. The
Denali Training Fund focuses its resources on developing skills in construction, transportation, heavy equipment, and
healthcare occupations. Funding is also available for non-Denali Commission infrastructure projects that lead each
participant directly to employment.
For more information about the Denali Training Fund: http://labor.alaska.gov/bp/denali.htm
Statutory[1]
Training Program Performance Indicators
for Participants Exiting in FY 2011
Total Training Participants 66
Alaska Employed One Year After Leaving Training Program [2] 56
Department of Defense or Office of Personnel Management Employed [3] 0
Median Total Wages 7-12 Months After Exit [4] $10,224
Percentage of Participants Employed in Training-Related Jobs NA[5] [1]
AS 23.15.580.
[2] Worked in the fourth quarter after completing training with the first quarter defined as the first full quarter after training was
completed. Does not include self-employed workers.
[3] Federal employment except U.S. Postal Service.
[4]
Median wages during the third and fourth quarter after training was completed with the first quarter defined as the first full
quarter after training was completed. This only includes unemployment insurance wage earnings.
[5] For a variety of reasons, training programs cannot always be linked to the jobs participants obtain.
Note: Charts are unavailable because historical data were inconsistent with current records.
Denali Training Fund
9 | P a g e
Training Program Performance Report
Alaska Department of Labor and Workforce Development, Research and Analysis Section
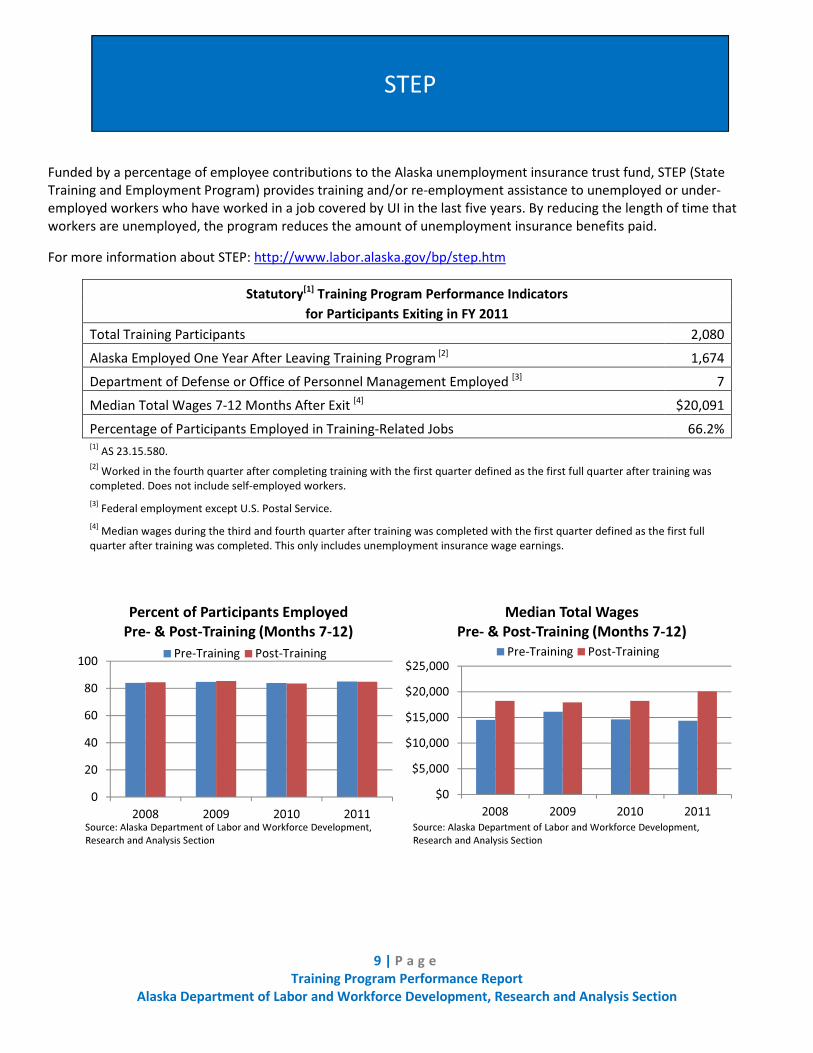
Funded by a percentage of employee contributions to the Alaska unemployment insurance trust fund, STEP (State
Training and Employment Program) provides training and/or re-employment assistance to unemployed or under-
employed workers who have worked in a job covered by UI in the last five years. By reducing the length of time that
workers are unemployed, the program reduces the amount of unemployment insurance benefits paid.
For more information about STEP: http://www.labor.alaska.gov/bp/step.htm
Statutory[1]
Training Program Performance Indicators
for Participants Exiting in FY 2011
Total Training Participants 2,080
Alaska Employed One Year After Leaving Training Program [2] 1,674
Department of Defense or Office of Personnel Management Employed [3] 7
Median Total Wages 7-12 Months After Exit [4] $20,091
Percentage of Participants Employed in Training-Related Jobs 66.2% [1]
AS 23.15.580.
[2] Worked in the fourth quarter after completing training with the first quarter defined as the first full quarter after training was
completed. Does not include self-employed workers.
[3] Federal employment except U.S. Postal Service.
[4]
Median wages during the third and fourth quarter after training was completed with the first quarter defined as the first full
quarter after training was completed. This only includes unemployment insurance wage earnings.
0
20
40
60
80
100
2008 2009 2010 2011
Percent of Participants Employed
Pre- & Post-Training (Months 7-12)
Pre-Training Post-Training
Source: Alaska Department of Labor and Workforce Development,
Research and Analysis Section
$0
$5,000
$10,000
$15,000
$20,000
$25,000
2008 2009 2010 2011
Median Total Wages
Pre- & Post-Training (Months 7-12)
Pre-Training Post-Training
Source: Alaska Department of Labor and Workforce Development,
Research and Analysis Section
STEP
10 | P a g e
Training Program Performance Report
Alaska Department of Labor and Workforce Development, Research and Analysis Section
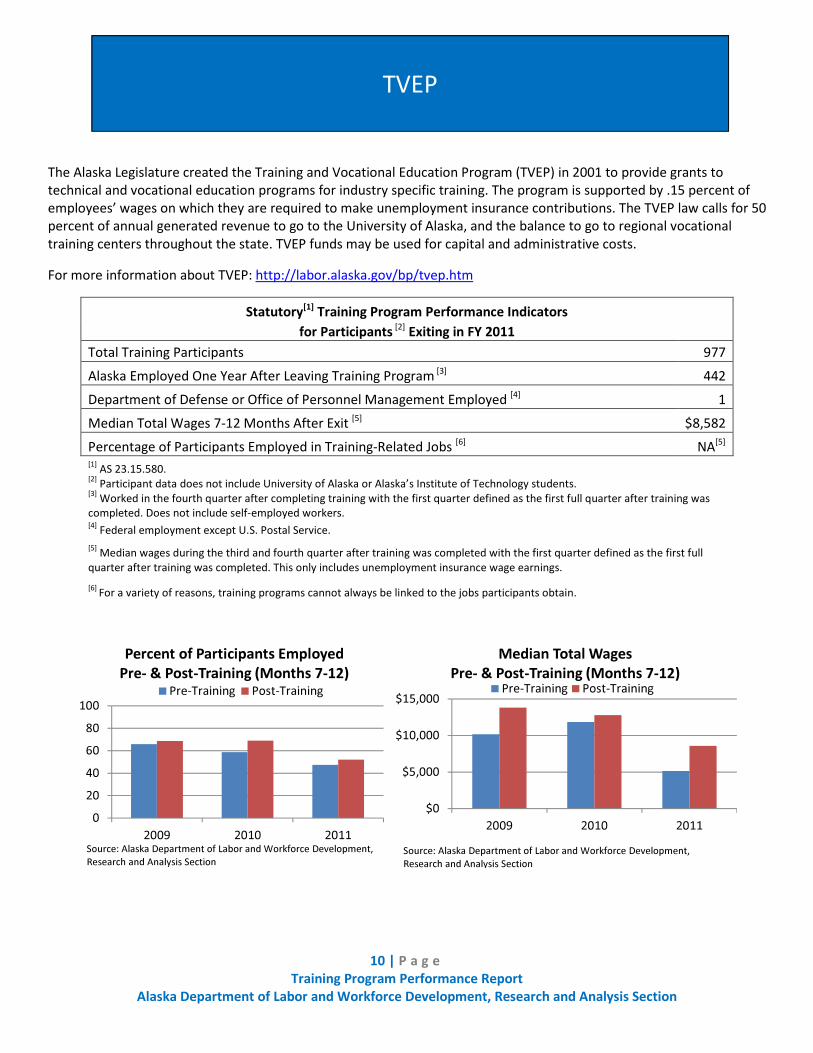
The Alaska Legislature created the Training and Vocational Education Program (TVEP) in 2001 to provide grants to
technical and vocational education programs for industry specific training. The program is supported by .15 percent of
employees’ wages on which they are required to make unemployment insurance contributions. The TVEP law calls for 50
percent of annual generated revenue to go to the University of Alaska, and the balance to go to regional vocational
training centers throughout the state. TVEP funds may be used for capital and administrative costs.
For more information about TVEP: http://labor.alaska.gov/bp/tvep.htm
Statutory[1]
Training Program Performance Indicators
for Participants [2]
Exiting in FY 2011
Total Training Participants 977
Alaska Employed One Year After Leaving Training Program [3] 442
Department of Defense or Office of Personnel Management Employed [4] 1
Median Total Wages 7-12 Months After Exit [5] $8,582
Percentage of Participants Employed in Training-Related Jobs [6] NA[5] [1]
AS 23.15.580. [2]
Participant data does not include University of Alaska or Alaska’s Institute of Technology students. [3]
Worked in the fourth quarter after completing training with the first quarter defined as the first full quarter after training was
completed. Does not include self-employed workers. [4]
Federal employment except U.S. Postal Service.
[5] Median wages during the third and fourth quarter after training was completed with the first quarter defined as the first full
quarter after training was completed. This only includes unemployment insurance wage earnings.
[6] For a variety of reasons, training programs cannot always be linked to the jobs participants obtain.
0
20
40
60
80
100
2009 2010 2011
Percent of Participants Employed
Pre- & Post-Training (Months 7-12)Pre-Training Post-Training
Source: Alaska Department of Labor and Workforce Development,
Research and Analysis Section
$0
$5,000
$10,000
$15,000
2009 2010 2011
Median Total Wages
Pre- & Post-Training (Months 7-12)Pre-Training Post-Training
Source: Alaska Department of Labor and Workforce Development,
Research and Analysis Section
TVEP

11 | P a g e
Training Program Performance Report
Alaska Department of Labor and Workforce Development, Research and Analysis Section
The U.S. Department of Labor produced the Workforce Investment Act of 1998 (WIA) to help job seekers attain
employment in areas where businesses need workers. WIA authorizes three funding streams: Adult, Youth, and
Dislocated Workers.
For more information about the Workforce Investment Act: http://www.doleta.gov/usworkforce/wia/
The WIA Adult Program (along with the Dislocated Worker and Youth programs) is federally funded under the Workforce
Investment Act of 1998.
The Adult Program supports training and services for unemployed adults with emphasis on public assistance recipients
and other low-income adults. Program services include needs/skills assessments, classroom training, on-the-job training,
job-search assistance, work experience, counseling, basic skills training, and support services.
Statutory[1]
Training Program Performance Indicators
for Participants Exiting in FY 2011
Total Training Participants 332
Alaska Employed One Year After Leaving Training Program [2] 221
Department of Defense or Office of Personnel Management Employed [3] 3
Median Total Wages 7-12 Months After Exit [4] $14,470
Percentage of Participants Employed in Training-Related Jobs 85.0% [1]
AS 23.15.580.
[2] Worked in the fourth quarter after completing training with the first quarter defined as the first full quarter after training was
completed. Does not include self-employed workers.
[3] Federal employment except U.S. Postal Service.
[4]
Median wages during the third and fourth quarter after training was completed with the first quarter defined as the first full
quarter after training was completed. This only includes unemployment insurance wage earnings.
0
20
40
60
80
100
2008 2009 2010 2011
Percent of Participants Employed
Pre- & Post-Training (Months 7-12)
Pre-Training Post-Training
Source: Alaska Department of Labor and Workforce Development, Research
and Analysis Section
$0
$5,000
$10,000
$15,000
$20,000
2008 2009 2010 2011
Median Total Wages
Pre- & Post-Training (Months 7-12)
Pre-Training Post-Training
Source: Alaska Department of Labor and Workforce Development,
Research and Analysis Section
WIA 1B Adult

12 | P a g e
Training Program Performance Report
Alaska Department of Labor and Workforce Development, Research and Analysis Section
The WIA Dislocated Worker Program provides employment and training assistance for dislocated workers. To be eligible
for the program, workers must have been laid off, terminated, or unable to work due to economic circumstances.
Available services include career counseling, testing, job placement, occupational training, and relocation assistance.
Statutory[1]
Training Program Performance Indicators
for Participants Exiting in FY 2011
Total Training Participants 226
Alaska Employed One Year After Leaving Training Program [2] 137
Department of Defense or Office of Personnel Management Employed [3] 4
Median Total Wages 7-12 Months After Exit [4] $16,711
Percentage of Participants Employed in Training-Related Jobs 85.6% [1]
AS 23.15.580.
[2] Worked in the fourth quarter after completing training with the first quarter defined as the first full quarter after training was
completed. Does not include self-employed workers.
[3] Federal employment except U.S. Postal Service.
[4]
Median wages during the third and fourth quarter after training was completed with the first quarter defined as the first full
quarter after training was completed. This only includes unemployment insurance wage earnings.
0
20
40
60
80
100
2008 2009 2010 2011
Percent of Participants Employed
Pre- & Post-Training (Months 7-12)
Pre-Training Post-Training
Source: Alaska Department of Labor and Workforce Development,
Research and Analysis Section
$0
$5,000
$10,000
$15,000
$20,000
2008 2009 2010 2011
Median Total Wages
Pre- & Post-Training (Months 7-12)Pre-Training Post-Training
Source: Alaska Department of Labor and Workforce Development, Research
and Analysis Section
WIA 1B Dislocated Workers

13 | P a g e
Training Program Performance Report
Alaska Department of Labor and Workforce Development, Research and Analysis Section
The federally funded WIA Youth Program provides a comprehensive system of training and support services for young
people ages 14 to 21. The program is dedicated to academic excellence, career preparation for youth in the workplace
and community, development and support in a safe environment, and visible and active leadership roles for participants.
Youth services are provided primarily through grants allocated to both private and public entities throughout the state.
In-school and out-of-school youth served include those who have dropped out of school. Participants enrolled in a WIA
program may also be eligible for a funding to pursue post-secondary training.
Statutory[1]
Training Program Performance Indicators
for Participants Exiting in FY 2011
Total Training Participants 567
Alaska Employed One Year After Leaving Training Program [2] 274
Department of Defense or Office of Personnel Management Employed [3] 5
Median Total Wages 7-12 Months After Exit [4] $3,733
Percentage of Participants Employed in Training-Related Jobs NA[5] [1]
AS 23.15.580.
[2] Worked in the fourth quarter after completing training with the first quarter defined as the first full quarter after training was
completed. Does not include self-employed workers.
[3] Federal employment except U.S. Postal Service.
[4]
Median wages during the third and fourth quarter after training was completed with the first quarter defined as the first full
quarter after training was completed. This only includes unemployment insurance wage earnings.
[5] For a variety of reasons, training programs cannot always be linked to the jobs participants obtain.
0
20
40
60
80
100
2008 2009 2010 2011
Percent of Participants Employed
Pre- & Post-Training (Months 7-12)
Pre-Training Post-Training
Source: Alaska Department of Labor and Workforce Development,
Research and Analysis Section
$0
$1,000
$2,000
$3,000
$4,000
$5,000
2008 2009 2010 2011
Median Total Wages
Pre- & Post-Training (Months 7-12)Pre-Training Post-Training
Source: Alaska Department of Labor and Workforce Development,
Research and Analysis Section
WIA Title 1B Youth

14 | P a g e
Training Program Performance Report
Alaska Department of Labor and Workforce Development, Research and Analysis Section
TRAINING PROGRAMS

15 | P a g e
Training Program Performance Report
Alaska Department of Labor and Workforce Development, Research and Analysis Section
The purpose of the Adult Basic Education (ABE) Program is to prepare Alaskans for employment by providing instruction
in the basic skills of reading, writing, and mathematics; and to prepare students for the General Educational
Development (GED) test. The program also teaches English as a Second Language (ESL). With all subjects, the goal is to
prepare students for the transition into the labor market or higher academic or vocational training.
For more information about Adult Basic Education: http://www.ajcn.state.ak.us/abe/
Statutory[1]
Training Program Performance Indicators
for Participants Exiting in FY 2011
Total Training Participants 1,462
Alaska Employed One Year After Leaving Training Program [2] 578
Department of Defense or Office of Personnel Management Employed [3] 0
Median Total Wages 7-12 Months After Exit [4] $4,748
Percentage of Participants Employed in Training-Related Jobs NA[5] [1]
AS 23.15.580.
[2] Worked in the fourth quarter after completing training with the first quarter defined as the first full quarter after training was
completed. Does not include self-employed workers.
[3] Federal employment except U.S. Postal Service.
[4]
Median wages during the third and fourth quarter after training was completed with the first quarter defined as the first full
quarter after training was completed. This only includes unemployment insurance wage earnings.
[5] For a variety of reasons, training programs cannot always be linked to the jobs participants obtain.
0
20
40
60
80
100
2008 2009 2010 2011
Percent of Participants Employed
Pre- & Post-Training (Months 7-12)Pre-Training Post-Training
Source: Alaska Department of Labor and Workforce Development,
Research and Analysis Section
$0
$1,000
$2,000
$3,000
$4,000
$5,000
2008 2009 2010 2011
Median Total Wages
Pre- & Post-Training (Months 7-12)Pre-Training Post-Training
Source: Alaska Department of Labor and Workforce Development,
Research and Analysis Section
Adult Basic Education
16 | P a g e
Training Program Performance Report
Alaska Department of Labor and Workforce Development, Research and Analysis Section
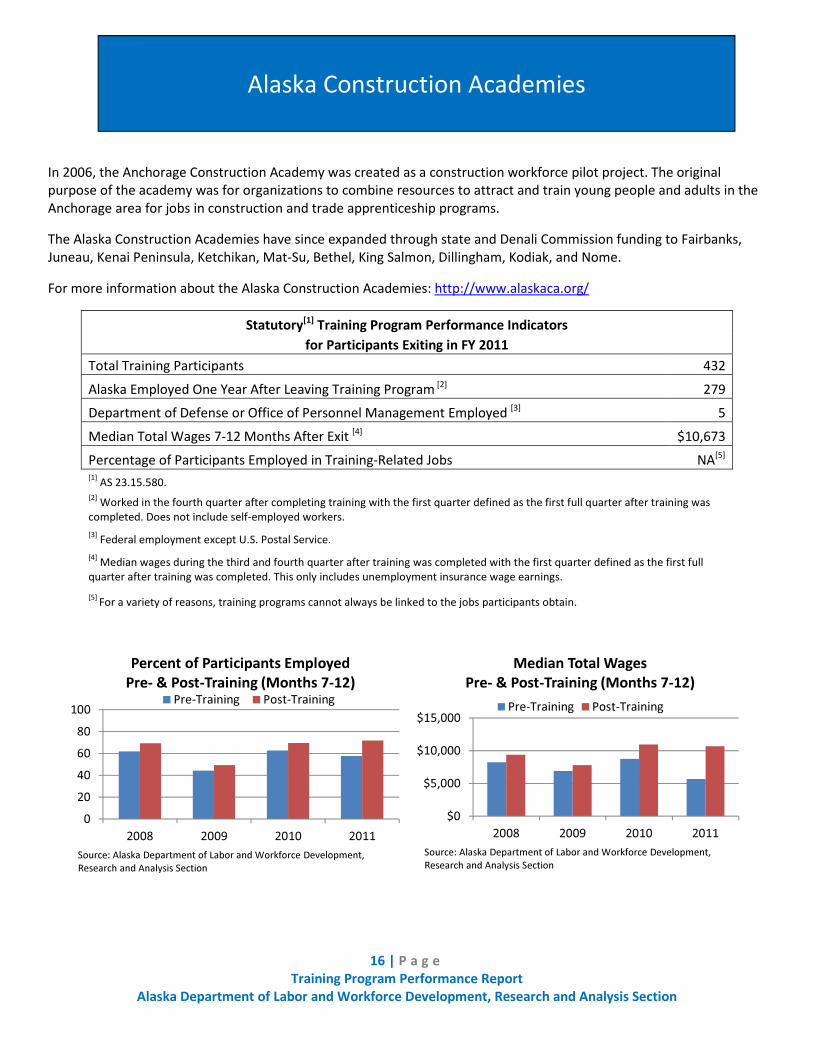
In 2006, the Anchorage Construction Academy was created as a construction workforce pilot project. The original
purpose of the academy was for organizations to combine resources to attract and train young people and adults in the
Anchorage area for jobs in construction and trade apprenticeship programs.
The Alaska Construction Academies have since expanded through state and Denali Commission funding to Fairbanks,
Juneau, Kenai Peninsula, Ketchikan, Mat-Su, Bethel, King Salmon, Dillingham, Kodiak, and Nome.
For more information about the Alaska Construction Academies: http://www.alaskaca.org/
Statutory[1]
Training Program Performance Indicators
for Participants Exiting in FY 2011
Total Training Participants 432
Alaska Employed One Year After Leaving Training Program [2] 279
Department of Defense or Office of Personnel Management Employed [3] 5
Median Total Wages 7-12 Months After Exit [4] $10,673
Percentage of Participants Employed in Training-Related Jobs NA[5] [1]
AS 23.15.580.
[2] Worked in the fourth quarter after completing training with the first quarter defined as the first full quarter after training was
completed. Does not include self-employed workers.
[3] Federal employment except U.S. Postal Service.
[4]
Median wages during the third and fourth quarter after training was completed with the first quarter defined as the first full
quarter after training was completed. This only includes unemployment insurance wage earnings.
[5] For a variety of reasons, training programs cannot always be linked to the jobs participants obtain.
0
20
40
60
80
100
2008 2009 2010 2011
Percent of Participants Employed
Pre- & Post-Training (Months 7-12)Pre-Training Post-Training
Source: Alaska Department of Labor and Workforce Development,
Research and Analysis Section
$0
$5,000
$10,000
$15,000
2008 2009 2010 2011
Median Total Wages
Pre- & Post-Training (Months 7-12)
Pre-Training Post-Training
Source: Alaska Department of Labor and Workforce Development,
Research and Analysis Section
Alaska Construction Academies

17 | P a g e
Training Program Performance Report
Alaska Department of Labor and Workforce Development, Research and Analysis Section
The Alaska Pipeline Worker Training Project (APWTP) began in 2008. The project was designed to increase the supply of
new workers from urban and rural Alaska for jobs identified in the Alaska Gasline Inducement Act (AGIA) Training
Strategic Plan. The program is designed to develop the talent of a new generation of workers for good jobs and legacy
careers in building, operating, and maintaining oil and gas pipelines in Alaska. Training will provide pipeline support jobs
in transportation, construction, power and energy transmission, communications, and logistical support. The program
addresses many areas including:
- Outreach to youth and adults
- Connecting career paths
- Entry-level training
- Industry-based education and training
- Incumbent worker industry certificate training to upgrade workforce skills
For more information about the APWTP: http://akwp.org/index.php?page=Pipeline-Training
Statutory[1]
Training Program Performance Indicators
for Participants Exiting in FY 2011
Total Training Participants 493
Alaska Employed One Year After Leaving Training Program [2] 411
Department of Defense or Office of Personnel Management Employed [3] 0
Median Total Wages 7-12 Months After Exit [4] $21,458
Percentage of Participants Employed in Training-Related Jobs NA[5] [1]
AS 23.15.580.
[2] Worked in the fourth quarter after completing training with the first quarter defined as the first full quarter after training was
completed. Does not include self-employed workers.
[3] Federal employment except U.S. Postal Service.
[4]
Median wages during the third and fourth quarter after training was completed with the first quarter defined as the first full
quarter after training was completed. This only includes unemployment insurance wage earnings.
[5] For a variety of reasons, training programs cannot always be linked to the jobs participants obtain.
0
20
40
60
80
100
2009 2010 2011
Percent of Participants Employed
Pre- & Post-Training (Months 7-12)Pre-Training Post-Training
Source: Alaska Department of Labor and Workforce Development,
Research and Analysis Section
0
10,000
20,000
30,000
2009 2010 2011
Median Total Wages
Pre- & Post-Training (Months 7-12)Pre-Training Post-Training
Source: Alaska Department of Labor and Workforce Development,
Research and Analysis Section
Alaska Pipeline Working Training

18 | P a g e
Training Program Performance Report
Alaska Department of Labor and Workforce Development, Research and Analysis Section
The Alaska Technical Center is an adult vocational school designed to meet the vocational and technical training needs
of rural Alaskans. The Alaska Technical Center has four core program areas: office occupations, building industrial
technology, industrial mine maintenance, and health occupations. In addition, the Alaska Technical Center provides
Adult Basic Education, GED programs, and a variety of short-term training during the year.
For more information about the Alaska Technical Center: http://www.nwarctic.org/atc
Statutory[1]
Training Program Performance Indicators
for Participants Exiting in FY 2011
Total Training Participants 160
Alaska Employed One Year After Leaving Training Program [2] 97
Department of Defense or Office of Personnel Management Employed [3] 0
Median Total Wages 7-12 Months After Exit [4] $10,707
Percentage of Participants Employed in Training-Related Jobs NA[5] [1]
AS 23.15.580.
[2] Worked in the fourth quarter after completing training with the first quarter defined as the first full quarter after training was
completed. Does not include self-employed workers.
[3] Federal employment except U.S. Postal Service.
[4]
Median wages during the third and fourth quarter after training was completed with the first quarter defined as the first full
quarter after training was completed. This only includes unemployment insurance wage earnings.
[5] For a variety of reasons, training programs cannot always be linked to the jobs participants obtain.
Note: Charts are unavailable because historical data were inconsistent with current records.
Alaska Technical Center—Kotzebue
19 | P a g e
Training Program Performance Report
Alaska Department of Labor and Workforce Development, Research and Analysis Section
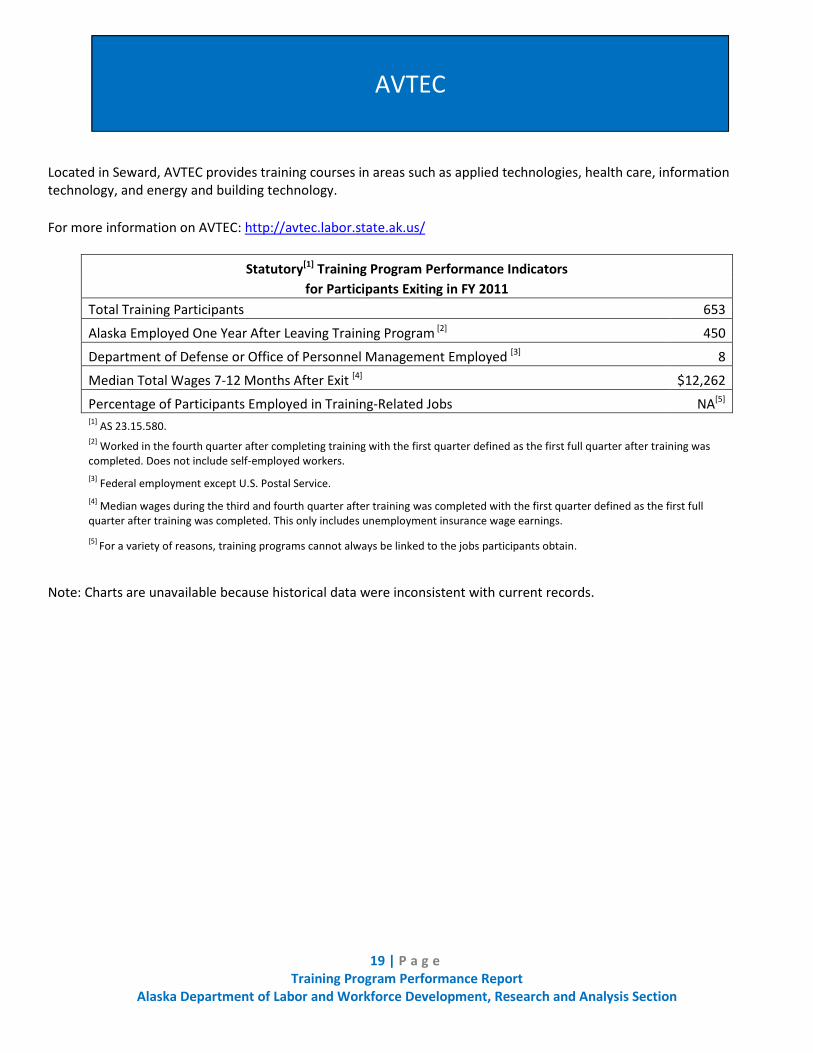
Located in Seward, AVTEC provides training courses in areas such as applied technologies, health care, information
technology, and energy and building technology.
For more information on AVTEC: http://avtec.labor.state.ak.us/
Statutory[1]
Training Program Performance Indicators
for Participants Exiting in FY 2011
Total Training Participants 653
Alaska Employed One Year After Leaving Training Program [2] 450
Department of Defense or Office of Personnel Management Employed [3] 8
Median Total Wages 7-12 Months After Exit [4] $12,262
Percentage of Participants Employed in Training-Related Jobs NA[5] [1]
AS 23.15.580.
[2] Worked in the fourth quarter after completing training with the first quarter defined as the first full quarter after training was
completed. Does not include self-employed workers.
[3] Federal employment except U.S. Postal Service.
[4]
Median wages during the third and fourth quarter after training was completed with the first quarter defined as the first full
quarter after training was completed. This only includes unemployment insurance wage earnings.
[5] For a variety of reasons, training programs cannot always be linked to the jobs participants obtain.
Note: Charts are unavailable because historical data were inconsistent with current records.
AVTEC
20 | P a g e
Training Program Performance Report
Alaska Department of Labor and Workforce Development, Research and Analysis Section
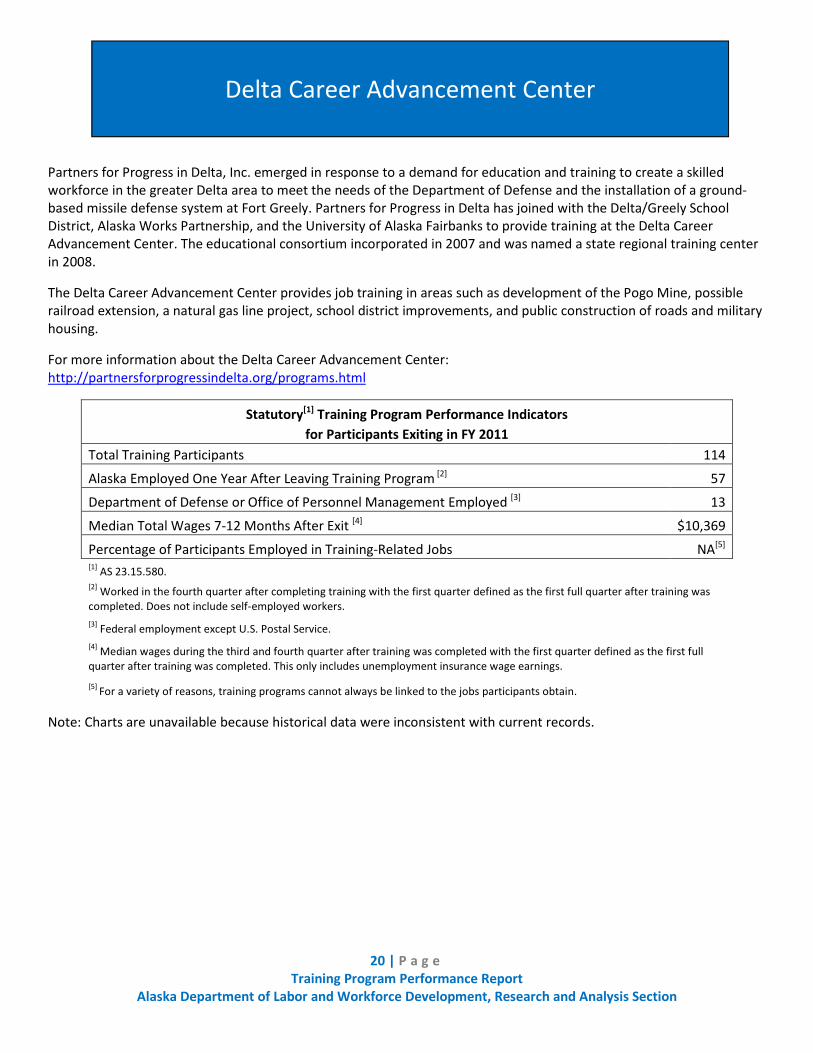
Partners for Progress in Delta, Inc. emerged in response to a demand for education and training to create a skilled
workforce in the greater Delta area to meet the needs of the Department of Defense and the installation of a ground-
based missile defense system at Fort Greely. Partners for Progress in Delta has joined with the Delta/Greely School
District, Alaska Works Partnership, and the University of Alaska Fairbanks to provide training at the Delta Career
Advancement Center. The educational consortium incorporated in 2007 and was named a state regional training center
in 2008.
The Delta Career Advancement Center provides job training in areas such as development of the Pogo Mine, possible
railroad extension, a natural gas line project, school district improvements, and public construction of roads and military
housing.
For more information about the Delta Career Advancement Center:
http://partnersforprogressindelta.org/programs.html
Statutory[1]
Training Program Performance Indicators
for Participants Exiting in FY 2011
Total Training Participants 114
Alaska Employed One Year After Leaving Training Program [2] 57
Department of Defense or Office of Personnel Management Employed [3] 13
Median Total Wages 7-12 Months After Exit [4] $10,369
Percentage of Participants Employed in Training-Related Jobs NA[5] [1]
AS 23.15.580.
[2] Worked in the fourth quarter after completing training with the first quarter defined as the first full quarter after training was
completed. Does not include self-employed workers.
[3] Federal employment except U.S. Postal Service.
[4]
Median wages during the third and fourth quarter after training was completed with the first quarter defined as the first full
quarter after training was completed. This only includes unemployment insurance wage earnings.
[5] For a variety of reasons, training programs cannot always be linked to the jobs participants obtain.
Note: Charts are unavailable because historical data were inconsistent with current records.
Delta Career Advancement Center

21 | P a g e
Training Program Performance Report
Alaska Department of Labor and Workforce Development, Research and Analysis Section
The Galena Interior Learning Academy (GILA) is a 9-12 grade vocational boarding school. GILA is a section of the Galena
City School District that opened for post-secondary students in mid-2002.
For more information about the Galena Interior Learning Academy: http://gila.galenaalaska.org/GCSDHome5.html
Statutory[1]
Training Program Performance Indicators
for Participants Exiting in FY 2011
Total Training Participants 10
Alaska Employed One Year After Leaving Training Program [2] 10
Department of Defense or Office of Personnel Management Employed [3] 0
Median Total Wages 7-12 Months After Exit [4] $18,929
Percentage of Participants Employed in Training-Related Jobs NA[5] [1]
AS 23.15.580.
[2] Worked in the fourth quarter after completing training with the first quarter defined as the first full quarter after training was
completed. Does not include self-employed workers.
[3] Federal employment except U.S. Postal Service.
[4]
Median wages during the third and fourth quarter after training was completed with the first quarter defined as the first full
quarter after training was completed. This only includes unemployment insurance wage earnings.
[5] For a variety of reasons, training programs cannot always be linked to the jobs participants obtain.
Note: Charts are unavailable because historical data were inconsistent with current records.
Galena Interior Learning Academy
22 | P a g e
Training Program Performance Report
Alaska Department of Labor and Workforce Development, Research and Analysis Section
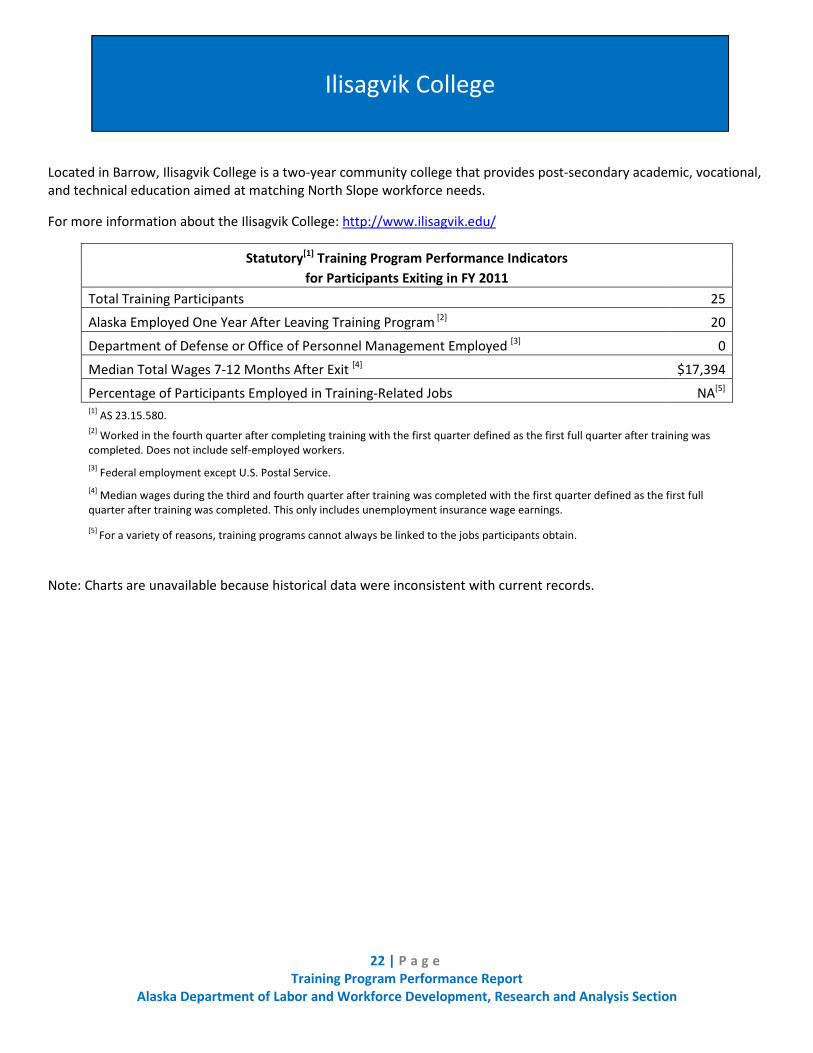
Located in Barrow, Ilisagvik College is a two-year community college that provides post-secondary academic, vocational,
and technical education aimed at matching North Slope workforce needs.
For more information about the Ilisagvik College: http://www.ilisagvik.edu/
Statutory[1]
Training Program Performance Indicators
for Participants Exiting in FY 2011
Total Training Participants 25
Alaska Employed One Year After Leaving Training Program [2] 20
Department of Defense or Office of Personnel Management Employed [3] 0
Median Total Wages 7-12 Months After Exit [4] $17,394
Percentage of Participants Employed in Training-Related Jobs NA[5] [1]
AS 23.15.580.
[2] Worked in the fourth quarter after completing training with the first quarter defined as the first full quarter after training was
completed. Does not include self-employed workers.
[3] Federal employment except U.S. Postal Service.
[4]
Median wages during the third and fourth quarter after training was completed with the first quarter defined as the first full
quarter after training was completed. This only includes unemployment insurance wage earnings.
[5] For a variety of reasons, training programs cannot always be linked to the jobs participants obtain.
Note: Charts are unavailable because historical data were inconsistent with current records.
Ilisagvik College
23 | P a g e
Training Program Performance Report
Alaska Department of Labor and Workforce Development, Research and Analysis Section
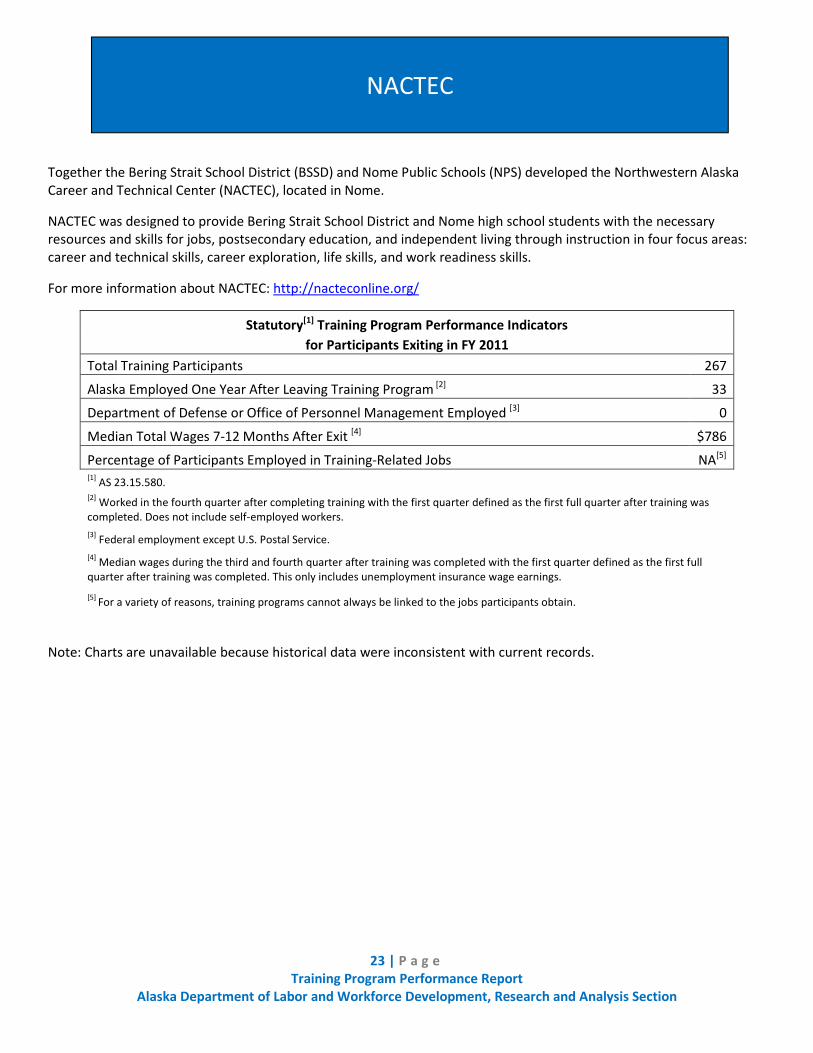
Together the Bering Strait School District (BSSD) and Nome Public Schools (NPS) developed the Northwestern Alaska
Career and Technical Center (NACTEC), located in Nome.
NACTEC was designed to provide Bering Strait School District and Nome high school students with the necessary
resources and skills for jobs, postsecondary education, and independent living through instruction in four focus areas:
career and technical skills, career exploration, life skills, and work readiness skills.
For more information about NACTEC: http://nacteconline.org/
Statutory[1]
Training Program Performance Indicators
for Participants Exiting in FY 2011
Total Training Participants 267
Alaska Employed One Year After Leaving Training Program [2] 33
Department of Defense or Office of Personnel Management Employed [3] 0
Median Total Wages 7-12 Months After Exit [4] $786
Percentage of Participants Employed in Training-Related Jobs NA[5] [1]
AS 23.15.580.
[2] Worked in the fourth quarter after completing training with the first quarter defined as the first full quarter after training was
completed. Does not include self-employed workers.
[3] Federal employment except U.S. Postal Service.
[4]
Median wages during the third and fourth quarter after training was completed with the first quarter defined as the first full
quarter after training was completed. This only includes unemployment insurance wage earnings.
[5] For a variety of reasons, training programs cannot always be linked to the jobs participants obtain.
Note: Charts are unavailable because historical data were inconsistent with current records.
NACTEC

24 | P a g e
Training Program Performance Report
Alaska Department of Labor and Workforce Development, Research and Analysis Section
New Frontier Vocational Technical Center (NFVTC) is a vocational school located on the Kenai Peninsula between Kenai
and Soldotna. NFVTC focuses on entry level business and medical office education. Programs and courses teach skills for
accounting clerk, professional medical coding, and computer operation.
For more information about NVFTC: http://www.nfvtc.org/
Statutory[1]
Training Program Performance Indicators
for Participants Exiting in FY 2011
Total Training Participants 24
Alaska Employed One Year After Leaving Training Program [2] 14
Department of Defense or Office of Personnel Management Employed [3] 0
Median Total Wages 7-12 Months After Exit [4] $7,713
Percentage of Participants Employed in Training-Related Jobs NA[5] [1]
AS 23.15.580.
[2] Worked in the fourth quarter after completing training with the first quarter defined as the first full quarter after training was
completed. Does not include self-employed workers.
[3] Federal employment except U.S. Postal Service.
[4]
Median wages during the third and fourth quarter after training was completed with the first quarter defined as the first full
quarter after training was completed. This only includes unemployment insurance wage earnings.
[5] For a variety of reasons, training programs cannot always be linked to the jobs participants obtain.
0
20
40
60
80
100
2008 2009 2010 2011
Percent of Participants Employed
Pre- & Post-Training (Months 7-12)Pre-Training Post-Training
Source: Alaska Department of Labor and Workforce Development,
Research and Analysis Section
$0
$5,000
$10,000
$15,000
2008 2009 2010 2011
Median Total Wages
Pre- & Post-Training (Months 7-12)Pre-Training Post-Training
Source: Alaska Department of Labor and Workforce Development, Research
and Analysis Section
New Frontier Vocational Technical Center
25 | P a g e
Training Program Performance Report
Alaska Department of Labor and Workforce Development, Research and Analysis Section
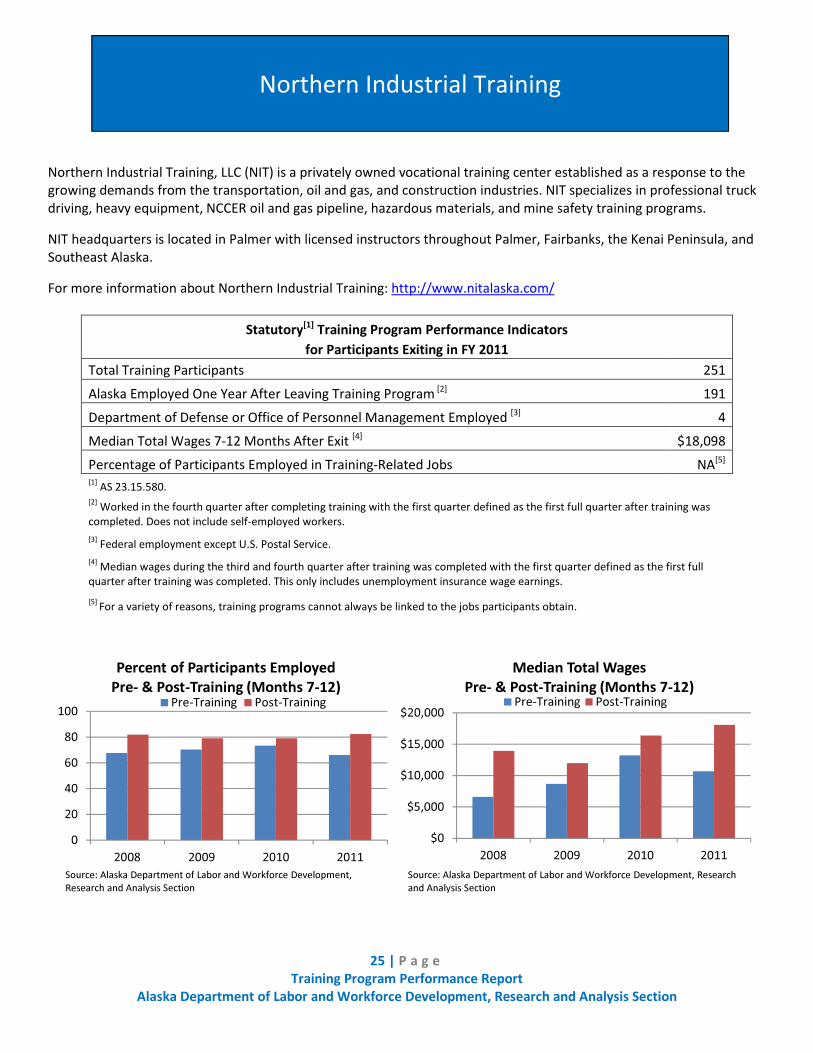
Northern Industrial Training, LLC (NIT) is a privately owned vocational training center established as a response to the
growing demands from the transportation, oil and gas, and construction industries. NIT specializes in professional truck
driving, heavy equipment, NCCER oil and gas pipeline, hazardous materials, and mine safety training programs.
NIT headquarters is located in Palmer with licensed instructors throughout Palmer, Fairbanks, the Kenai Peninsula, and
Southeast Alaska.
For more information about Northern Industrial Training: http://www.nitalaska.com/
Statutory[1]
Training Program Performance Indicators
for Participants Exiting in FY 2011
Total Training Participants 251
Alaska Employed One Year After Leaving Training Program [2] 191
Department of Defense or Office of Personnel Management Employed [3] 4
Median Total Wages 7-12 Months After Exit [4] $18,098
Percentage of Participants Employed in Training-Related Jobs NA[5] [1]
AS 23.15.580.
[2] Worked in the fourth quarter after completing training with the first quarter defined as the first full quarter after training was
completed. Does not include self-employed workers.
[3] Federal employment except U.S. Postal Service.
[4]
Median wages during the third and fourth quarter after training was completed with the first quarter defined as the first full
quarter after training was completed. This only includes unemployment insurance wage earnings.
[5] For a variety of reasons, training programs cannot always be linked to the jobs participants obtain.
0
20
40
60
80
100
2008 2009 2010 2011
Percent of Participants Employed
Pre- & Post-Training (Months 7-12)Pre-Training Post-Training
Source: Alaska Department of Labor and Workforce Development,
Research and Analysis Section
$0
$5,000
$10,000
$15,000
$20,000
2008 2009 2010 2011
Median Total Wages
Pre- & Post-Training (Months 7-12)Pre-Training Post-Training
Source: Alaska Department of Labor and Workforce Development, Research
and Analysis Section
Northern Industrial Training

26 | P a g e
Training Program Performance Report
Alaska Department of Labor and Workforce Development, Research and Analysis Section
The Southwest Alaska Vocational and Education Center (SAVEC) was founded in June 2002 as a 501 (c)3 organization in
the Bristol Bay region. The center provides career and workforce development training to the residents of Bristol Bay
and to rural residents from around the state. Courses may include commercial driver training, weatherization, and heavy
equipment operation.
For more information about SAVEC: http://www.savec.org/
Statutory[1]
Training Program Performance Indicators
for Participants Exiting in FY 2011
Total Training Participants 132
Alaska Employed One Year After Leaving Training Program [2] 97
Department of Defense or Office of Personnel Management Employed [3] 0
Median Total Wages 7-12 Months After Exit [4] $22,512
Percentage of Participants Employed in Training-Related Jobs NA[5] [1]
AS 23.15.580.
[2] Worked in the fourth quarter after completing training with the first quarter defined as the first full quarter after training was
completed. Does not include self-employed workers.
[3] Federal employment except U.S. Postal Service.
[4]
Median wages during the third and fourth quarter after training was completed with the first quarter defined as the first full
quarter after training was completed. This only includes unemployment insurance wage earnings.
[5] For a variety of reasons, training programs cannot always be linked to the jobs participants obtain.
0
20
40
60
80
100
2008 2009 2010 2011
Percent of Participants Employed
Pre- & Post-Training (Months 7-12)Pre-Training Post-Training
Source: Alaska Department of Labor and Workforce Development,
Research and Analysis Section
$0
$5,000
$10,000
$15,000
$20,000
$25,000
$30,000
2008 2009 2010 2011
Median Total Wages
Pre- & Post-Training (Months 7-12)Pre-Training Post-Training
Source: Alaska Department of Labor and Workforce Development,
Research and Analysis Section
SAVEC

27 | P a g e
Training Program Performance Report
Alaska Department of Labor and Workforce Development, Research and Analysis Section
The University of Alaska’s vocational education students were defined two ways:
- Students who were enrolled in a vocational degree—such as Occupational Endorsement Certificate (OEC),
Certificate (CT1, CT2), Associate of Applied Science (AAS)—and took at least three credits in GPA-eligible
courses, and earned credits
- Non degree-seeking students who took at least three credits in vocational, GPA-eligible courses and earned
credits. The students must not have returned to the university to take another class in fall of 2012.
For more information about the University of Alaska Vocational Education Programs: http://www.alaska.edu/alaska/
Statutory[1]
Training Program Performance Indicators
for Participants Exiting in FY 2011
Total Training Participants 4,407
Alaska Employed One Year After Leaving Training Program [2] 2,658
Department of Defense or Office of Personnel Management Employed [3] 159
Median Total Wages 7-12 Months After Exit [4] $13,110
Percentage of Participants Employed in Training-Related Jobs NA[5] [1]
AS 23.15.580.
[2] Worked in the fourth quarter after completing training with the first quarter defined as the first full quarter after training was
completed. Does not include self-employed workers.
[3] Federal employment except U.S. Postal Service.
[4]
Median wages during the third and fourth quarter after training was completed with the first quarter defined as the first full
quarter after training was completed. This only includes unemployment insurance wage earnings.
[5] For a variety of reasons, training programs cannot always be linked to the jobs participants obtain.
0
20
40
60
80
100
2008 2009 2010 2011
Percent of Participants Employed
Pre- & Post-Training (Months 7-12)Pre-Training Post-Training
Source: Alaska Department of Labor and Workforce Development,
Research and Analysis Section
Note: AGIA-program students included prior to 2011.
$0
$5,000
$10,000
$15,000
2008 2009 2010 2011
Median Total Wages
Pre- & Post-Training (Months 7-12)
Pre-Training Post-Training
Source: Alaska Department of Labor and Workforce Development, Research
and Analysis Section
Note: AGIA-program students included prior to 2011.
University of Alaska Vocational Education Programs
28 | P a g e
Training Program Performance Report
Alaska Department of Labor and Workforce Development, Research and Analysis Section
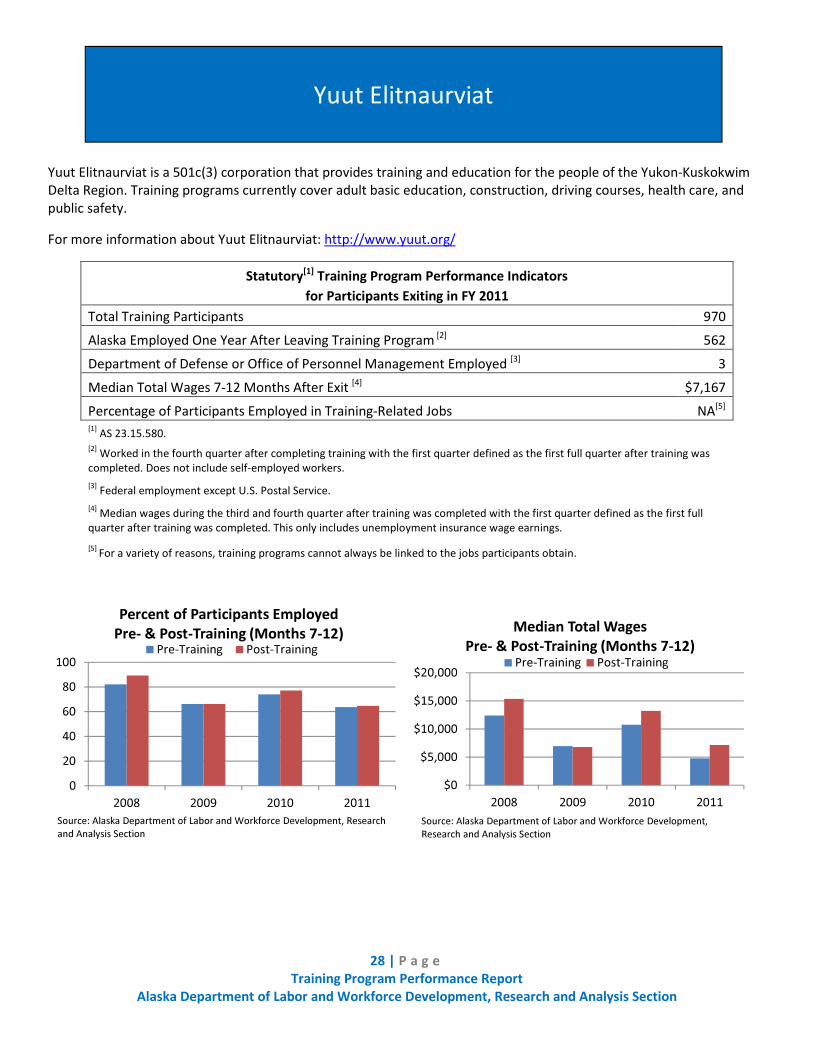
Yuut Elitnaurviat is a 501c(3) corporation that provides training and education for the people of the Yukon-Kuskokwim
Delta Region. Training programs currently cover adult basic education, construction, driving courses, health care, and
public safety.
For more information about Yuut Elitnaurviat: http://www.yuut.org/
Statutory[1]
Training Program Performance Indicators
for Participants Exiting in FY 2011
Total Training Participants 970
Alaska Employed One Year After Leaving Training Program [2] 562
Department of Defense or Office of Personnel Management Employed [3] 3
Median Total Wages 7-12 Months After Exit [4] $7,167
Percentage of Participants Employed in Training-Related Jobs NA[5] [1]
AS 23.15.580.
[2] Worked in the fourth quarter after completing training with the first quarter defined as the first full quarter after training was
completed. Does not include self-employed workers.
[3] Federal employment except U.S. Postal Service.
[4]
Median wages during the third and fourth quarter after training was completed with the first quarter defined as the first full
quarter after training was completed. This only includes unemployment insurance wage earnings.
[5] For a variety of reasons, training programs cannot always be linked to the jobs participants obtain.
0
20
40
60
80
100
2008 2009 2010 2011
Percent of Participants Employed
Pre- & Post-Training (Months 7-12)Pre-Training Post-Training
Source: Alaska Department of Labor and Workforce Development, Research
and Analysis Section
$0
$5,000
$10,000
$15,000
$20,000
2008 2009 2010 2011
Median Total Wages
Pre- & Post-Training (Months 7-12)Pre-Training Post-Training
Source: Alaska Department of Labor and Workforce Development,
Research and Analysis Section
Yuut Elitnaurviat

29 | P a g e
Training Program Performance Report
Alaska Department of Labor and Workforce Development, Research and Analysis Section
APPENDIX

30 | P a g e
Training Program Performance Report
Alaska Department of Labor and Workforce Development, Research and Analysis Section
Overview of Performance Measures
The Alaska Department of Labor and Workforce Development, through the Alaska Workforce Investment Board (AWIB),
evaluates state employment-related training programs to determine the employment status, wages, and customer
satisfaction of program participants after exiting the program. Specific required performance measures, as identified in
AS 23.15.580 (e-f), to be calculated include:
The percentage of former participants who have jobs one year after leaving the training program
The percentage of employed training program participants is determined by matching training program records with
Alaska unemployment insurance wage records one year after exit from the training program (the fourth quarter starting
from the first full quarter after training.)
The median wage of former participants seven to 12 months after leaving the program
The Alaska unemployment insurance wage records are used to determine median total wages of training program
participants during months seven to 12 following the quarter they exited the training program. R&A calculates total
wages from all employers, and then arranges all workers with some reported wages from lowest to highest. Half of the
exiting participants with wages fall above the median wage level and half fall below.
The percentage of former participants who were employed after leaving the training program who received training
under the program that was directly related, or somewhat related, to their jobs, seven to 12 months after leaving the
training program
With some of the programs, the department’s Division of Business Partnership (DBP) provides data from case managers
indicating whether or not students gained employment in a training-related occupation. Currently, training-related data
are available from:
- STEP
- WIA Adult
- WIA Dislocated Workers
Explanation of Performance Measures

31 | P a g e
Training Program Performance Report
Alaska Department of Labor and Workforce Development, Research and Analysis Section
Each training program or fund provided participant Social Security Numbers, training start dates, and training
completion or exit dates. Some programs provided information on the types of training in which the participants were
enrolled, as well as demographic information.
R&A matched participant records with historical Alaska unemployment insurance wage records. Alaska UI wage records
provide the most comprehensive quarter by quarter source of historical employment, wages, occupation, and place of
work information for each training program participant. UI wage records do not include those who are self-employed or
working for the federal government. Employment and wage outcome data are based on Alaska UI wage record data
unless otherwise noted. To provide additional information on current work status, continuing education, and residency,
R&A also matched program participant records with:
- Federal military and civilian payroll records
- National Student Clearinghouse records providing information on continuing postsecondary education anywhere in
the U.S.
- Alaska Permanent Fund Dividend records to determine current residency status
The Programs and the Performance Measures
Because each program is unique and serves a different clientele with varying needs and work histories, comparing the
wages and employment measures across programs may not be appropriate. Some programs are not designed to lead to
employment, but are directed at the unemployed and can result in dramatic performance gains after training. Direct
year-to-year comparison of the broad programs and training institutions is problematic due to the changing mix of
served populations and training programs.
Some programs provide services to younger workers, older workers, those with no skills, or those recently laid off from
skilled jobs or positions with high wages. Many programs serve clients who are likely to leave the state, continue their
education, or become self-employed upon completion of their training. Those workers would likely not be included in
Alaska post-training wages and employment statistics.
Methodology

32 | P a g e
Training Program Performance Report
Alaska Department of Labor and Workforce Development, Research and Analysis Section
The AWIB has adopted a training priority list of industries and occupations based on economic, employment, and other
relevant data to maximize job opportunities for program participants. R&A matched FY 2011 exiting participants’
industry and occupation with AWIB priority industries/occupations to identify the number employed in these priority
sectors. The most recent AWIB priorities include health care, construction, information technology occupations,
education, natural resources and mining, transportation, hospitality and tourism, and seafood harvesting and
processing. R&A determined the number of participants employed in priority industries and/or occupations by
examining UI wage records during months seven to 12 following exit from each program. Galena, Alaska Pipeline Worker
Training, and STEP participants had the highest priority industry employment rates following exit.
FY 2011 Program Participants Employed in Priority Industry/Occupations in Alaska in Months Seven to 12 Following Exit
No
t P
rio
rity
Ind
ust
ry/O
ccu
pa
tio
n
Co
nst
ruct
ion
He
alt
h C
are
Se
afo
od
Pro
cess
ing
To
uri
sm H
ote
ls
To
uri
sm E
ati
ng
/Dri
nk
ing
IT O
ccu
pa
tio
ns
Tra
nsp
ort
ati
on
Ed
uca
tio
n
Na
tura
l Re
sou
rce
s/M
inin
g
To
tal
Adult Basic Education 1,139 47 39 14 29 133 3 30 16 12 1,462
AK Tech—Kotzebue 109 9 24 2 0 1 1 1 7 6 160
Alaska Construction Academy 272 63 5 6 5 18 0 17 9 37 432
AVTEC 393 37 72 4 8 23 5 65 18 28 653
Carl Perkins—Postsecondary 3,426 148 720 25 68 274 56 200 312 195 5,424
Carl Perkins—Secondary 1,432 109 68 18 31 171 10 76 53 26 1,994
Delta Career Advancement Center 88 4 7 0 0 4 1 1 9 0 114
Denali Training Fund 55 4 4 1 0 0 0 2 0 0 66
Galena 2 0 0 0 0 0 0 6 2 0 10
Ilisagvik 17 0 1 0 0 0 0 0 5 2 25
NACTEC 250 1 3 0 0 2 0 2 9 0 267
New Frontier VTC 19 0 3 0 0 0 0 1 1 0 24
Northern Industrial Training 124 32 1 3 0 8 0 25 4 54 251
Pipeline Training 148 221 2 1 3 7 8 13 22 68 493
SAVEC 84 2 0 0 0 1 2 1 8 34 132
STEP 797 680 66 7 6 23 32 53 44 372 2,080
TVEP 761 17 73 5 2 6 4 18 51 40 977
UA Voc Ed 2,931 151 490 23 44 189 43 149 224 163 4,407
WIA 1B Adult 208 22 31 0 5 8 6 16 14 22 332
WIA 1B Dislocated Workers 142 13 14 0 3 4 5 15 8 22 226
WIA Title 1B Youth 396 17 26 6 18 69 6 13 8 8 567
Yuut Elitnaurviat 727 23 75 7 2 6 2 23 102 3 970
Source: Alaska Department of Labor and Workforce Development, Research and Analysis Section
AWIB Priorities

33 | P a g e
Training Program Performance Report
Alaska Department of Labor and Workforce Development, Research and Analysis Section
Training participants often receive services from multiple providers. A number of identified participants had obtained
and completed services from multiple programs during FY 2011. The left column of the table shows the FY 2011 training
programs. The matching program column shows the number of exiters in FY 2011, while the other columns show the
number of students in that program who also participated in other programs during the same period. For example, 23 of
the 970 Yuut Elitnaurviat participants who exited in FY 2011 also exited a training program at the University of Alaska
Vocation Education program in FY 2011.
Number of FY 2011 Training Program Exiters Who Exited One or More Programs in FY 2010 and/or FY2011
To
tal
Ca
rl P
erk
ins-
Po
stse
co
nd
ary
Ca
rl P
erk
ins-
Se
co
nd
ary
De
na
li T
rain
ing
Fu
nd
ST
EP
TV
EP
WIA
Ad
ult
WIA
Dis
loca
ted
Wo
rke
rs
WIA
Yo
uth
Ad
ult
Ba
sic E
du
ca
tio
n
Ala
ska
Co
nst
ructi
on
Aca
de
mie
s
Pip
elin
e T
rain
ing
AK
Te
ch
-Ko
tze
bu
e
AV
TE
C
De
lta
Ca
ree
r A
dva
nce
me
nt
Ce
nte
r
Ga
len
a
Ilis
ag
vik
NA
CT
EC
Ne
w F
ron
tie
r V
TC
No
rth
ern
In
du
stri
al
Tra
inin
g
SA
VE
C
UA
Vo
c E
d
Yu
ut
Eli
tna
urv
iat
Carl Perkins—Postsecondary 5,424 5,424 57 0 66 6 41 10 12 12 9 3 3 15 3 0 0 1 0 1 1 920 6
Carl Perkins—Secondary 1,994 57 1,994 0 1 13 0 0 3 4 10 6 7 2 7 0 0 6 0 0 0 104 5
Denali Training Fund 66 0 0 66 10 2 2 0 1 0 1 5 0 22 0 0 0 0 0 0 0 0 4
STEP 2,080 66 1 10 2,080 45 106 44 5 4 185 199 3 30 0 0 0 0 1 38 39 79 14
TVEP 977 6 13 2 45 977 5 1 9 42 1 1 160 1 0 0 0 267 24 4 132 60 392
WIA Adult 332 41 0 2 106 5 332 9 13 2 3 4 2 18 0 0 0 0 0 9 3 35 1
WIA Dislocated Workers 226 10 0 0 44 1 9 226 1 1 2 3 0 0 1 0 0 0 1 1 0 10 0
WIA Youth 567 12 3 1 5 9 13 1 567 12 5 2 1 25 0 0 0 6 2 0 0 19 0
Adult Basic Education 1,462 12 4 0 4 42 2 1 12 1,462 7 0 3 0 1 0 0 0 0 0 0 11 55
Alaska Construction Academies 432 9 10 1 185 1 3 2 5 7 432 58 0 3 0 0 0 0 0 2 0 36 11
Pipeline Training 493 3 6 5 199 1 4 3 2 0 58 493 0 5 6 0 0 0 0 1 0 6 1
AK Tech—Kotzebue 160 3 7 0 3 160 2 0 1 3 0 0 160 0 0 0 0 0 0 2 0 4 1
AVTEC 653 15 2 22 30 1 18 0 25 0 3 5 0 653 0 0 0 0 0 1 0 26 3
Delta Career Advancement Center 114 3 7 0 0 0 0 1 0 1 0 6 0 0 114 0 0 0 0 0 0 21 0
Galena 10 0 0 0 0 0 0 0 0 0 0 0 0 0 0 10 0 0 0 0 0 0 0
Ilisagvik 25 0 0 0 0 0 0 0 0 0 0 0 0 0 0 0 25 0 0 0 0 1 0
NACTEC 267 1 6 0 0 267 0 0 6 0 0 0 0 0 0 0 0 267 0 0 0 8 0
New Frontier VTC 24 0 0 0 1 24 0 1 2 0 0 0 0 0 0 0 0 0 24 0 0 0 0
Northern Industrial Training 251 1 0 0 38 4 9 1 0 0 2 1 2 1 0 0 0 0 0 251 2 2 0
SAVEC 132 1 0 0 39 132 3 0 0 0 0 0 0 0 0 0 0 0 0 2 132 37 0
UA Voc Ed 4,407 920 104 0 79 60 35 10 19 11 36 6 4 26 21 0 1 8 0 2 37 4,407 23
Yuut Elitnaurviat 970 6 5 4 14 392 1 0 0 55 11 1 1 3 0 0 0 0 0 0 0 23 970
Source: Alaska Department of Labor and Workforce Development, Research and Analysis Section
Participants Served by Multiple Programs
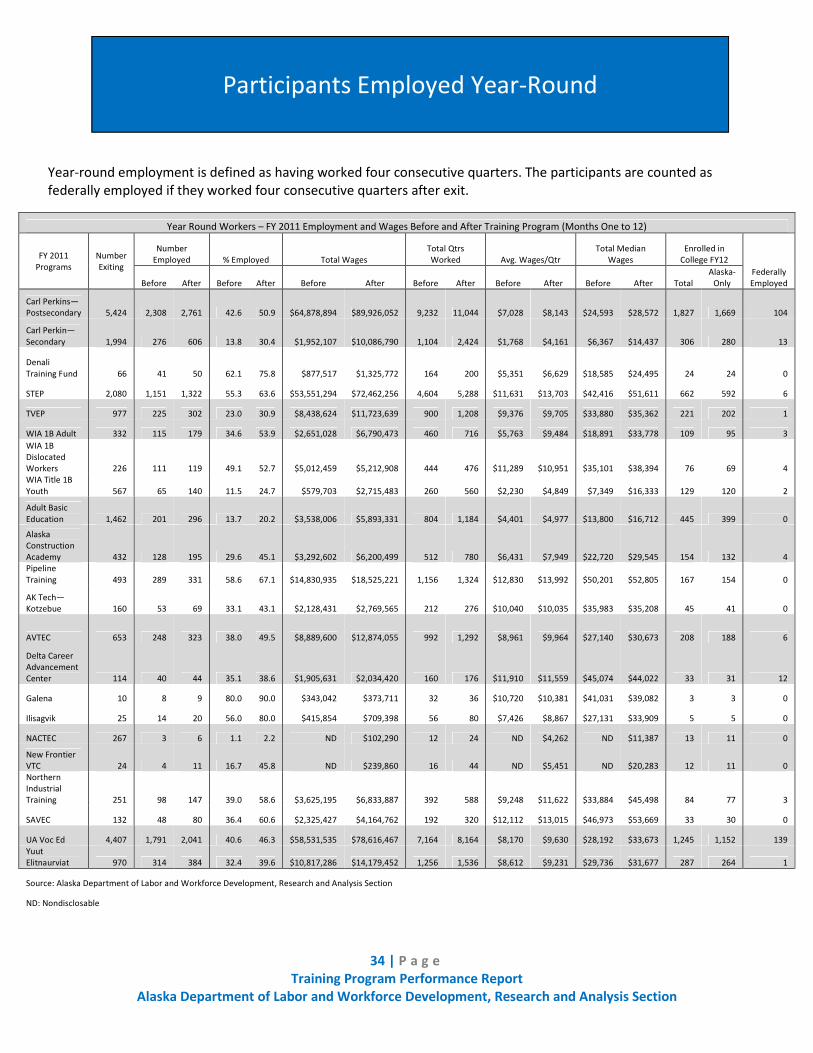
34 | P a g e
Training Program Performance Report
Alaska Department of Labor and Workforce Development, Research and Analysis Section
Year-round employment is defined as having worked four consecutive quarters. The participants are counted as
federally employed if they worked four consecutive quarters after exit.
Year Round Workers – FY 2011 Employment and Wages Before and After Training Program (Months One to 12)
FY 2011
Programs
Number
Exiting
Number
Employed % Employed Total Wages
Total Qtrs
Worked Avg. Wages/Qtr
Total Median
Wages
Enrolled in
College FY12
Federally
Employed Before After Before After Before After Before After Before After Before After Total
Alaska-
Only
Carl Perkins—
Postsecondary 5,424 2,308 2,761 42.6 50.9 $64,878,894 $89,926,052 9,232 11,044 $7,028 $8,143 $24,593 $28,572 1,827 1,669 104
Carl Perkin—
Secondary 1,994 276 606 13.8 30.4 $1,952,107 $10,086,790 1,104 2,424 $1,768 $4,161 $6,367 $14,437 306 280 13
Denali
Training Fund 66 41 50 62.1 75.8 $877,517 $1,325,772 164 200 $5,351 $6,629 $18,585 $24,495 24 24 0
STEP 2,080 1,151 1,322 55.3 63.6 $53,551,294 $72,462,256 4,604 5,288 $11,631 $13,703 $42,416 $51,611 662 592 6
TVEP 977 225 302 23.0 30.9 $8,438,624 $11,723,639 900 1,208 $9,376 $9,705 $33,880 $35,362 221 202 1
WIA 1B Adult 332 115 179 34.6 53.9 $2,651,028 $6,790,473 460 716 $5,763 $9,484 $18,891 $33,778 109 95 3
WIA 1B
Dislocated
Workers 226 111 119 49.1 52.7 $5,012,459 $5,212,908 444 476 $11,289 $10,951 $35,101 $38,394 76 69 4
WIA Title 1B
Youth 567 65 140 11.5 24.7 $579,703 $2,715,483 260 560 $2,230 $4,849 $7,349 $16,333 129 120 2
Adult Basic
Education 1,462 201 296 13.7 20.2 $3,538,006 $5,893,331 804 1,184 $4,401 $4,977 $13,800 $16,712 445 399 0
Alaska
Construction
Academy 432 128 195 29.6 45.1 $3,292,602 $6,200,499 512 780 $6,431 $7,949 $22,720 $29,545 154 132 4
Pipeline
Training 493 289 331 58.6 67.1 $14,830,935 $18,525,221 1,156 1,324 $12,830 $13,992 $50,201 $52,805 167 154 0
AK Tech—
Kotzebue 160 53 69 33.1 43.1 $2,128,431 $2,769,565 212 276 $10,040 $10,035 $35,983 $35,208 45 41 0
AVTEC 653 248 323 38.0 49.5 $8,889,600 $12,874,055 992 1,292 $8,961 $9,964 $27,140 $30,673 208 188 6
Delta Career
Advancement
Center 114 40 44 35.1 38.6 $1,905,631 $2,034,420 160 176 $11,910 $11,559 $45,074 $44,022 33 31 12
Galena 10 8 9 80.0 90.0 $343,042 $373,711 32 36 $10,720 $10,381 $41,031 $39,082 3 3 0
Ilisagvik 25 14 20 56.0 80.0 $415,854 $709,398 56 80 $7,426 $8,867 $27,131 $33,909 5 5 0
NACTEC 267 3 6 1.1 2.2 ND $102,290 12 24 ND $4,262 ND $11,387 13 11 0
New Frontier
VTC 24 4 11 16.7 45.8 ND $239,860 16 44 ND $5,451 ND $20,283 12 11 0
Northern
Industrial
Training 251 98 147 39.0 58.6 $3,625,195 $6,833,887 392 588 $9,248 $11,622 $33,884 $45,498 84 77 3
SAVEC 132 48 80 36.4 60.6 $2,325,427 $4,164,762 192 320 $12,112 $13,015 $46,973 $53,669 33 30 0
UA Voc Ed 4,407 1,791 2,041 40.6 46.3 $58,531,535 $78,616,467 7,164 8,164 $8,170 $9,630 $28,192 $33,673 1,245 1,152 139
Yuut
Elitnaurviat 970 314 384 32.4 39.6 $10,817,286 $14,179,452 1,256 1,536 $8,612 $9,231 $29,736 $31,677 287 264 1
Source: Alaska Department of Labor and Workforce Development, Research and Analysis Section
ND: Nondisclosable
Participants Employed Year-Round
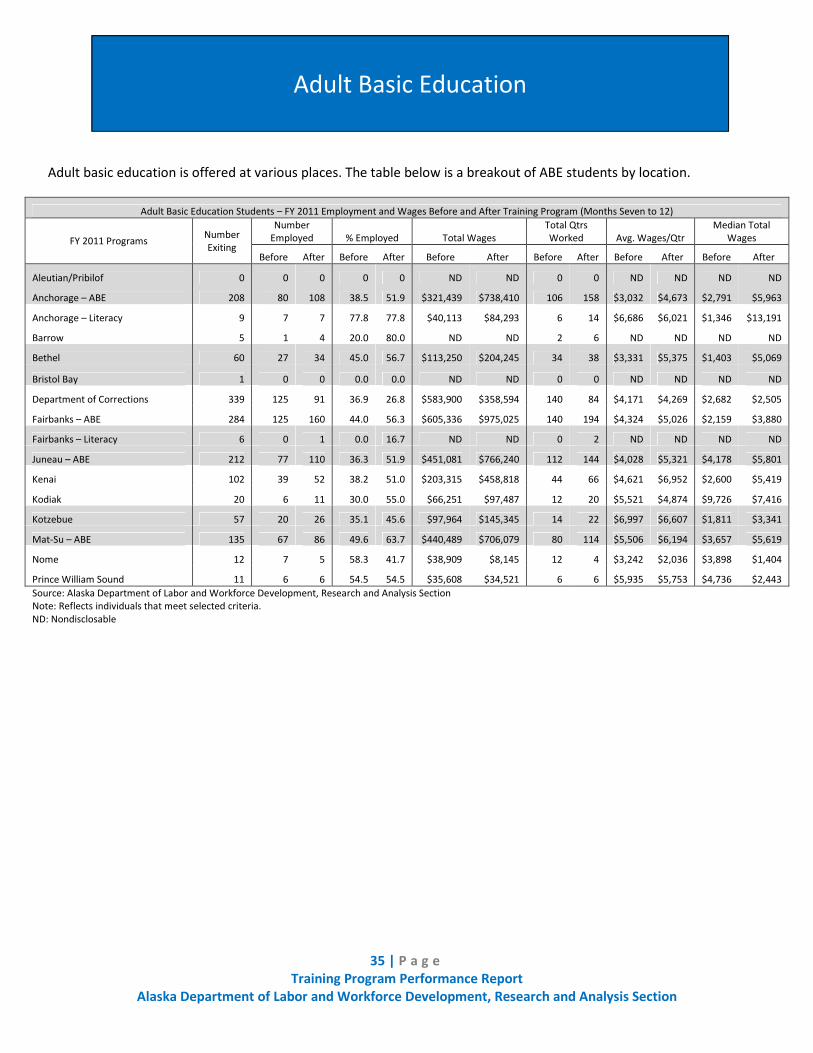
35 | P a g e
Training Program Performance Report
Alaska Department of Labor and Workforce Development, Research and Analysis Section
Adult basic education is offered at various places. The table below is a breakout of ABE students by location.
Adult Basic Education Students – FY 2011 Employment and Wages Before and After Training Program (Months Seven to 12)
FY 2011 Programs Number
Exiting
Number
Employed % Employed Total Wages
Total Qtrs
Worked Avg. Wages/Qtr
Median Total
Wages
Before After Before After Before After Before After Before After Before After
Aleutian/Pribilof 0 0 0 0 0 ND ND 0 0 ND ND ND ND
Anchorage – ABE 208 80 108 38.5 51.9 $321,439 $738,410 106 158 $3,032 $4,673 $2,791 $5,963
Anchorage – Literacy 9 7 7 77.8 77.8 $40,113 $84,293 6 14 $6,686 $6,021 $1,346 $13,191
Barrow 5 1 4 20.0 80.0 ND ND 2 6 ND ND ND ND
Bethel 60 27 34 45.0 56.7 $113,250 $204,245 34 38 $3,331 $5,375 $1,403 $5,069
Bristol Bay 1 0 0 0.0 0.0 ND ND 0 0 ND ND ND ND
Department of Corrections 339 125 91 36.9 26.8 $583,900 $358,594 140 84 $4,171 $4,269 $2,682 $2,505
Fairbanks – ABE 284 125 160 44.0 56.3 $605,336 $975,025 140 194 $4,324 $5,026 $2,159 $3,880
Fairbanks – Literacy 6 0 1 0.0 16.7 ND ND 0 2 ND ND ND ND
Juneau – ABE 212 77 110 36.3 51.9 $451,081 $766,240 112 144 $4,028 $5,321 $4,178 $5,801
Kenai 102 39 52 38.2 51.0 $203,315 $458,818 44 66 $4,621 $6,952 $2,600 $5,419
Kodiak 20 6 11 30.0 55.0 $66,251 $97,487 12 20 $5,521 $4,874 $9,726 $7,416
Kotzebue 57 20 26 35.1 45.6 $97,964 $145,345 14 22 $6,997 $6,607 $1,811 $3,341
Mat-Su – ABE 135 67 86 49.6 63.7 $440,489 $706,079 80 114 $5,506 $6,194 $3,657 $5,619
Nome 12 7 5 58.3 41.7 $38,909 $8,145 12 4 $3,242 $2,036 $3,898 $1,404
Prince William Sound 11 6 6 54.5 54.5 $35,608 $34,521 6 6 $5,935 $5,753 $4,736 $2,443
Source: Alaska Department of Labor and Workforce Development, Research and Analysis Section
Note: Reflects individuals that meet selected criteria.
ND: Nondisclosable
Adult Basic Education

36 | P a g e
Training Program Performance Report
Alaska Department of Labor and Workforce Development, Research and Analysis Section
AVTEC Students - FY 2011 Employment and Wages Before and After Training Program (Months Seven to 12)
Reported Major or Program of
Study
Number
Exiting
Number
Employed % Employed Total Wages
Total Qtrs
Worked Avg. Wages/Qtr Median Total Wages
Before After Before After Before After Before After Before After Before After
Able Seaman 6 4 2 66.7 33.3 ND ND 4 2 ND ND ND ND
Advanced Fire Fighting 3 3 3 100.0 100.0 ND ND 6 6 ND ND ND ND
Advanced Powerplant Operation 7 7 6 100.0 85.7 $51,294 $63,887 12 10 $4,275 $6,389 $7,192 $7,419
A La Cart Breads and Pastries 1 0 0 0.0 0.0 ND ND 0 0 ND ND ND ND
Automatic Radar Plotting Aid
Operation 4 4 4 100.0 100.0 ND ND 8 6 ND ND ND ND
Automotive Technology 21 9 14 42.9 66.7 $29,980 $197,096 10 26 $2,998 $7,581 $2,587 $12,702
Basic Safety Training 13 8 9 61.5 69.2 $111,372 $88,199 14 16 $7,955 $5,512 $12,127 $9,415
Bridge Resource Management 13 10 11 76.9 84.6 $546,250 $574,158 20 20 $27,313 $28,708 $46,623 $57,126
Bulk Fuel 28 22 25 78.6 89.3 $218,373 $285,974 40 44 $5,459 $6,499 $6,881 $10,931
Business and Office Technology 42 32 35 76.2 83.3 $246,888 $290,323 52 48 $4,748 $6,048 $6,136 $6,547
Certified Nurse Assistant –
Anchorage 120 75 86 62.5 71.7 $637,353 $890,069 106 142 $6,013 $6,268 $5,631 $10,526
Certified Nurse Asst Anc –
Reciprocity 3 1 2 33.3 66.7 ND ND 2 4 ND ND ND ND
Culinary Baking 1 1 0 100.0 0.0 ND ND 0 0 ND ND ND ND
Diesel and Heavy Equipment
Technician 36 23 27 63.9 75.0 $180,889 $435,041 38 40 $4,760 $10,876 $6,169 $14,296
Facility Maintenance
Construction 18 13 14 72.2 77.8 $114,519 $176,968 24 22 $4,772 $8,044 $5,816 $10,327
Global Maritime Distress and
Safety System 3 2 2 66.7 66.7 ND ND 4 4 ND ND ND ND
Hydro Power Generator 3 2 2 66.7 66.7 ND ND 4 4 ND ND ND ND
Industrial Electricity 37 26 34 70.3 91.9 $270,480 $426,564 34 50 $7,955 $8,531 $9,432 $11,050
Information Technology 20 14 15 70.0 75.0 $128,361 $189,727 20 24 $6,418 $7,905 $7,926 $13,143
Licensed Practical Nurse Train 25 23 19 92.0 76.0 $221,869 $289,636 36 36 $6,163 $8,045 $10,281 $13,838
Master/Mate Limited 10 7 8 70.0 80.0 $44,523 $86,451 6 14 $7,421 $6,175 $4,063 $9,282
Master/Mate OUPV 6 2 2 33.3 33.3 ND ND 2 4 ND ND ND ND
Medical Care Provider 12 7 9 58.3 75.0 $277,140 $305,676 14 18 $19,796 $16,982 $32,955 $31,879
Microsoft Excel v2007 5 4 3 80.0 60.0 ND ND 8 6 ND ND ND ND
Microsoft Office Specialist –
Word 3 1 0 33.3 0.0 ND ND 0 0 ND ND ND ND
Pastry Arts 1 1 1 100.0 100.0 ND ND 0 2 ND ND ND ND
Pipe Welding 9 9 8 100.0 88.9 $122,180 $192,295 12 12 $10,182 $16,025 $6,604 $12,861
Plumbing and Heating 18 13 12 72.2 66.7 $171,798 $170,368 14 18 $12,271 $9,465 $12,597 $12,113
Power Plant Operation 19 16 15 84.2 78.9 $123,402 $169,138 22 28 $5,609 $6,041 $4,102 $9,324
Professional Cooking and Baking 33 23 23 69.7 69.7 $183,816 $250,759 28 40 $6,565 $6,269 $6,174 $8,052
Proficiency in Survival Craft 31 24 21 77.4 67.7 $363,859 $409,430 36 28 $10,107 $14,622 $18,102 $19,075
Qualified Member of the Engine
Dept. 10 8 8 80.0 80.0 $97,242 $72,784 8 8 $12,155 $9,098 $11,357 $8,838
Radar Observer 7 5 7 71.4 100.0 $155,761 $111,050 8 8 $19,470 $13,881 $24,038 $16,695
Radar Observer, Recertification 15 11 11 73.3 73.3 $444,534 $454,091 20 20 $22,227 $22,705 $42,087 $44,762
Radar Refresher 7 3 2 42.9 28.6 ND ND 4 4 ND ND ND ND
Rating Forming Part Navigation 7 3 4 42.9 57.1 ND ND 6 6 ND ND ND ND
Structural Welding 42 21 28 50.0 66.7 $182,709 $326,691 36 42 $5,075 $7,778 $9,218 $8,196
Tankship – Dangerous Liquids 14 9 8 64.3 57.1 $174,805 $270,258 12 14 $14,567 $19,304 $14,224 $37,916
Totals reflect individuals that meet selected criteria
Source: Alaska Department of Labor and Workforce Development, Research and Analysis Section
ND: Nondisclosable
AVTEC

37 | P a g e
Training Program Performance Report
Alaska Department of Labor and Workforce Development, Research and Analysis Section
University of Alaska Vocational Education Students – FY 2011;
Employment and Wages Before and After Training Program by Completer Status, Branch, and Campus (Months Seven to 12)
Number
Exiting
Number
Employed % Employed Total Wages
Total Qtrs
Worked Avg. Wages/Qtr
Median Total
Wages
Before After Before After Before After Before After Before After Before After
Nongraduate Total[1]
3,829 2,207 2,443 57.6 63.8 $28,096,630 $34,798,480 3,572 3,894 $7,866 $8,936 $9,631 $11,516
An
cho
rag
e
Total 2,350 1,311 1,490 55.8 63.4 $16,685,479 $20,814,897 2,134 2,376 $7,819 $8,760 $9,231 $10,556
Anchorage 1,449 862 930 59.5 64.2 $10,610,690 $12,925,071 1,398 1,516 $7,590 $8,526 $9,215 $11,392
Kenai 309 185 217 59.9 70.2 $3,121,427 $4,111,687 302 346 $10,336 $11,883 $11,864 $13,639
Kodiak 148 55 71 37.2 48.0 $565,460 $838,973 74 104 $7,641 $8,067 $3,971 $6,120
Mat-Su 369 153 217 41.5 58.8 $1,652,144 $2,081,801 262 322 $6,306 $6,465 $7,230 $6,269
PWSCC 75 56 55 74.7 73.3 $735,758 $857,365 98 88 $7,508 $9,743 $13,831 $15,446
Fa
irba
nk
s
Total 1,029 627 670 60.9 65.1 $8,189,045 $10,061,709 1,000 1,070 $8,189 $9,403 $10,690 $12,595
Fairbanks 279 174 186 62.4 66.7 $2,839,587 $3,487,796 310 314 $9,160 $11,108 $14,935 $16,401
Bristol Bay 81 56 59 69.1 72.8 $998,479 $951,716 86 90 $11,610 $10,575 $16,191 $14,584
Chukchi 8 7 7 87.5 87.5 $154,380 $225,322 14 14 $11,027 $16,094 $23,592 $31,413
Int. Aleutians 115 74 69 64.3 60.0 $776,306 $764,636 116 96 $6,692 $7,965 $7,664 $9,486
Kuskokwim 70 47 56 67.1 80.0 $515,561 $562,811 80 76 $6,445 $7,405 $10,438 $7,157
Northwest 39 16 23 41.0 59.0 $133,853 $177,097 16 32 $8,366 $5,534 $3,581 $3,827
Rural College 7 3 3 42.9 42.9 ND ND 6 4 ND ND ND ND
CTC 430 250 267 58.1 62.1 $2,710,517 $3,855,146 372 444 $7,286 $8,683 $7,999 $12,946
So
uth
ea
st
Total 450 269 283 59.8 62.9 $3,222,106 $3,921,874 438 448 $7,356 $8,754 $9,785 $12,446
Juneau 244 154 149 63.1 61.1 $1,832,025 $2,209,618 242 240 $7,570 $9,207 $9,549 $12,913
Ketchikan 78 51 57 65.4 73.1 $667,240 $781,904 90 96 $7,414 $8,145 $10,820 $11,784
Sitka 128 64 77 50.0 60.2 $722,841 $930,352 106 112 $6,819 $8,307 $8,970 $11,650
Graduate Total[1]
577 397 450 68.8 78.0 $5,175,881 $10,591,959 654 816 $7,914 $12,980 $10,292 $22,611
An
cho
rag
e
Total 389 269 307 69.2 78.9 $3,386,131 $7,303,395 454 554 $7,458 $13,183 $9,559 $22,574
Anchorage 268 192 214 71.6 79.9 $2,095,251 $4,691,107 328 390 $6,388 $12,028 $8,955 $22,325
Kenai 64 42 54 65.6 84.4 $782,741 $1,867,849 70 98 $11,182 $19,060 $12,070 $32,804
Kodiak 8 4 3 50.0 37.5 ND ND 8 2 ND ND ND ND
Mat-Su 40 23 29 57.5 72.5 $293,546 $549,198 32 50 $9,173 $10,984 $6,159 $19,884
PWSCC 9 8 7 88.9 77.8 $151,628 $164,438 16 14 $9,477 $11,746 $16,807 $21,079
Fa
irba
nk
s
Total 128 90 93 70.3 72.7 $1,192,439 $2,159,095 136 168 $8,768 $12,852 $10,795 $21,377
Fairbanks 3 3 3 100.0 100.0 ND ND 4 4 ND ND ND ND
Bristol Bay 3 3 1 100.0 33.3 ND ND 2 2 ND ND ND ND
Chukchi 0 0 0 0.0 0.0 ND ND 0 0 ND ND ND ND
Int. Aleutians 7 6 4 85.7 57.1 $87,119 ND 12 8 $7,260 ND $15,393 ND
Kuskokwim 0 0 0 0.0 0.0 ND ND 0 0 ND ND ND ND
Northwest 1 0 0 0.0 0.0 ND ND 0 0 ND ND ND ND
Rural College 0 0 0 0.0 0.0 ND ND 0 0 ND ND ND ND
CTC 114 78 85 68.4 74.6 $1,023,051 $2,011,370 118 154 $8,670 $13,061 $10,216 $22,403
So
uth
ea
st
Total 60 38 50 63.3 83.3 $597,311 $1,129,469 64 94 $9,333 $12,016 $17,099 $23,821
Juneau 27 19 20 70.4 74.1 $330,753 $415,892 36 36 $9,188 $11,553 $17,616 $17,918
Ketchikan 4 4 4 100.0 100.0 ND ND 8 8 ND ND ND ND
Sitka 29 15 26 51.7 89.7 $210,683 $634,421 20 50 $10,534 $12,688 $10,066 $25,468
Note: Total training participants include an unduplicated count of exiting training participants with SSNs. 1Totals reflect individuals that meet selected criteria.
ND: Nondisclosable
University of Alaska Vocational Education Programs
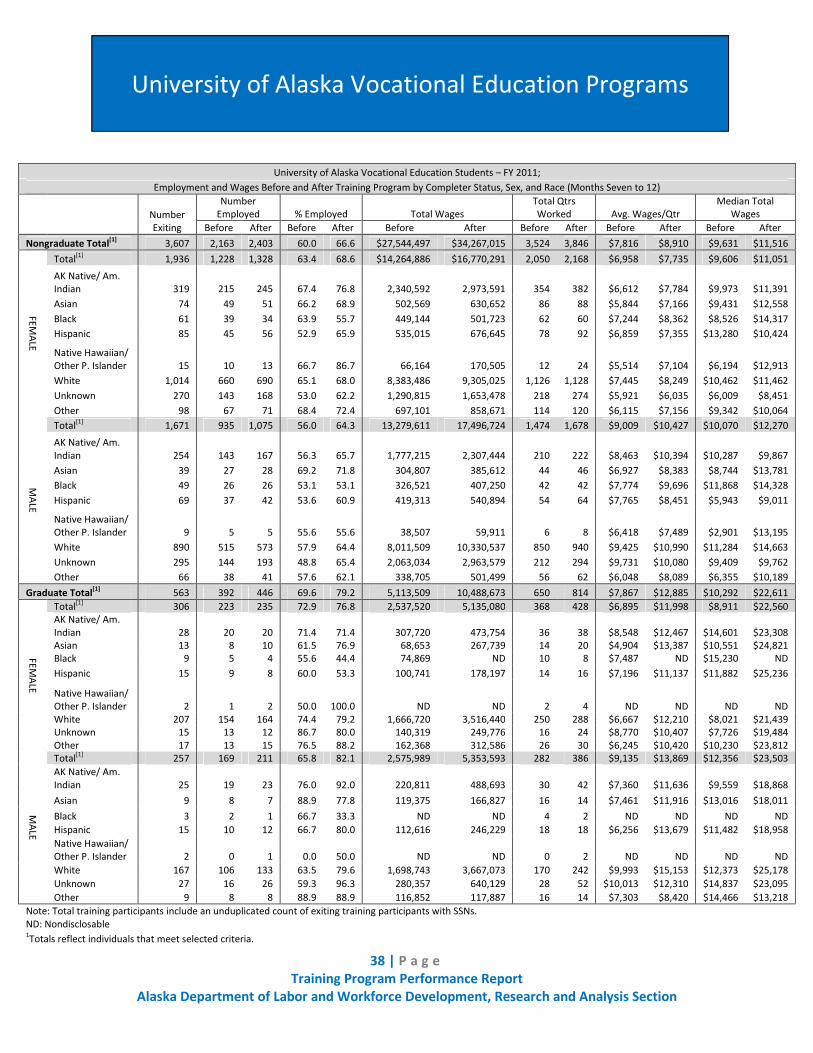
38 | P a g e
Training Program Performance Report
Alaska Department of Labor and Workforce Development, Research and Analysis Section
University of Alaska Vocational Education Students – FY 2011;
Employment and Wages Before and After Training Program by Completer Status, Sex, and Race (Months Seven to 12)
Number
Exiting
Number
Employed % Employed Total Wages
Total Qtrs
Worked Avg. Wages/Qtr
Median Total
Wages
Before After Before After Before After Before After Before After Before After
Nongraduate Total[1]
3,607 2,163 2,403 60.0 66.6 $27,544,497 $34,267,015 3,524 3,846 $7,816 $8,910 $9,631 $11,516
FE
MA
LE
Total[1]
1,936 1,228 1,328 63.4 68.6 $14,264,886 $16,770,291 2,050 2,168 $6,958 $7,735 $9,606 $11,051
AK Native/ Am.
Indian 319 215 245 67.4 76.8 2,340,592 2,973,591 354 382 $6,612 $7,784 $9,973 $11,391
Asian 74 49 51 66.2 68.9 502,569 630,652 86 88 $5,844 $7,166 $9,431 $12,558
Black 61 39 34 63.9 55.7 449,144 501,723 62 60 $7,244 $8,362 $8,526 $14,317
Hispanic 85 45 56 52.9 65.9 535,015 676,645 78 92 $6,859 $7,355 $13,280 $10,424
Native Hawaiian/
Other P. Islander 15 10 13 66.7 86.7 66,164 170,505 12 24 $5,514 $7,104 $6,194 $12,913
White 1,014 660 690 65.1 68.0 8,383,486 9,305,025 1,126 1,128 $7,445 $8,249 $10,462 $11,462
Unknown 270 143 168 53.0 62.2 1,290,815 1,653,478 218 274 $5,921 $6,035 $6,009 $8,451
Other 98 67 71 68.4 72.4 697,101 858,671 114 120 $6,115 $7,156 $9,342 $10,064
MA
LE
Total[1]
1,671 935 1,075 56.0 64.3 13,279,611 17,496,724 1,474 1,678 $9,009 $10,427 $10,070 $12,270
AK Native/ Am.
Indian 254 143 167 56.3 65.7 1,777,215 2,307,444 210 222 $8,463 $10,394 $10,287 $9,867
Asian 39 27 28 69.2 71.8 304,807 385,612 44 46 $6,927 $8,383 $8,744 $13,781
Black 49 26 26 53.1 53.1 326,521 407,250 42 42 $7,774 $9,696 $11,868 $14,328
Hispanic 69 37 42 53.6 60.9 419,313 540,894 54 64 $7,765 $8,451 $5,943 $9,011
Native Hawaiian/
Other P. Islander 9 5 5 55.6 55.6 38,507 59,911 6 8 $6,418 $7,489 $2,901 $13,195
White 890 515 573 57.9 64.4 8,011,509 10,330,537 850 940 $9,425 $10,990 $11,284 $14,663
Unknown 295 144 193 48.8 65.4 2,063,034 2,963,579 212 294 $9,731 $10,080 $9,409 $9,762
Other 66 38 41 57.6 62.1 338,705 501,499 56 62 $6,048 $8,089 $6,355 $10,189
Graduate Total[1]
563 392 446 69.6 79.2 5,113,509 10,488,673 650 814 $7,867 $12,885 $10,292 $22,611
FE
MA
LE
Total[1]
306 223 235 72.9 76.8 2,537,520 5,135,080 368 428 $6,895 $11,998 $8,911 $22,560
AK Native/ Am.
Indian 28 20 20 71.4 71.4 307,720 473,754 36 38 $8,548 $12,467 $14,601 $23,308
Asian 13 8 10 61.5 76.9 68,653 267,739 14 20 $4,904 $13,387 $10,551 $24,821
Black 9 5 4 55.6 44.4 74,869 ND 10 8 $7,487 ND $15,230 ND
Hispanic 15 9 8 60.0 53.3 100,741 178,197 14 16 $7,196 $11,137 $11,882 $25,236
Native Hawaiian/
Other P. Islander 2 1 2 50.0 100.0 ND ND 2 4 ND ND ND ND
White 207 154 164 74.4 79.2 1,666,720 3,516,440 250 288 $6,667 $12,210 $8,021 $21,439
Unknown 15 13 12 86.7 80.0 140,319 249,776 16 24 $8,770 $10,407 $7,726 $19,484
Other 17 13 15 76.5 88.2 162,368 312,586 26 30 $6,245 $10,420 $10,230 $23,812
MA
LE
Total[1]
257 169 211 65.8 82.1 2,575,989 5,353,593 282 386 $9,135 $13,869 $12,356 $23,503
AK Native/ Am.
Indian 25 19 23 76.0 92.0 220,811 488,693 30 42 $7,360 $11,636 $9,559 $18,868
Asian 9 8 7 88.9 77.8 119,375 166,827 16 14 $7,461 $11,916 $13,016 $18,011
Black 3 2 1 66.7 33.3 ND ND 4 2 ND ND ND ND
Hispanic 15 10 12 66.7 80.0 112,616 246,229 18 18 $6,256 $13,679 $11,482 $18,958
Native Hawaiian/
Other P. Islander 2 0 1 0.0 50.0 ND ND 0 2 ND ND ND ND
White 167 106 133 63.5 79.6 1,698,743 3,667,073 170 242 $9,993 $15,153 $12,373 $25,178
Unknown 27 16 26 59.3 96.3 280,357 640,129 28 52 $10,013 $12,310 $14,837 $23,095
Other 9 8 8 88.9 88.9 116,852 117,887 16 14 $7,303 $8,420 $14,466 $13,218
Note: Total training participants include an unduplicated count of exiting training participants with SSNs.
ND: Nondisclosable 1Totals reflect individuals that meet selected criteria.
University of Alaska Vocational Education Programs
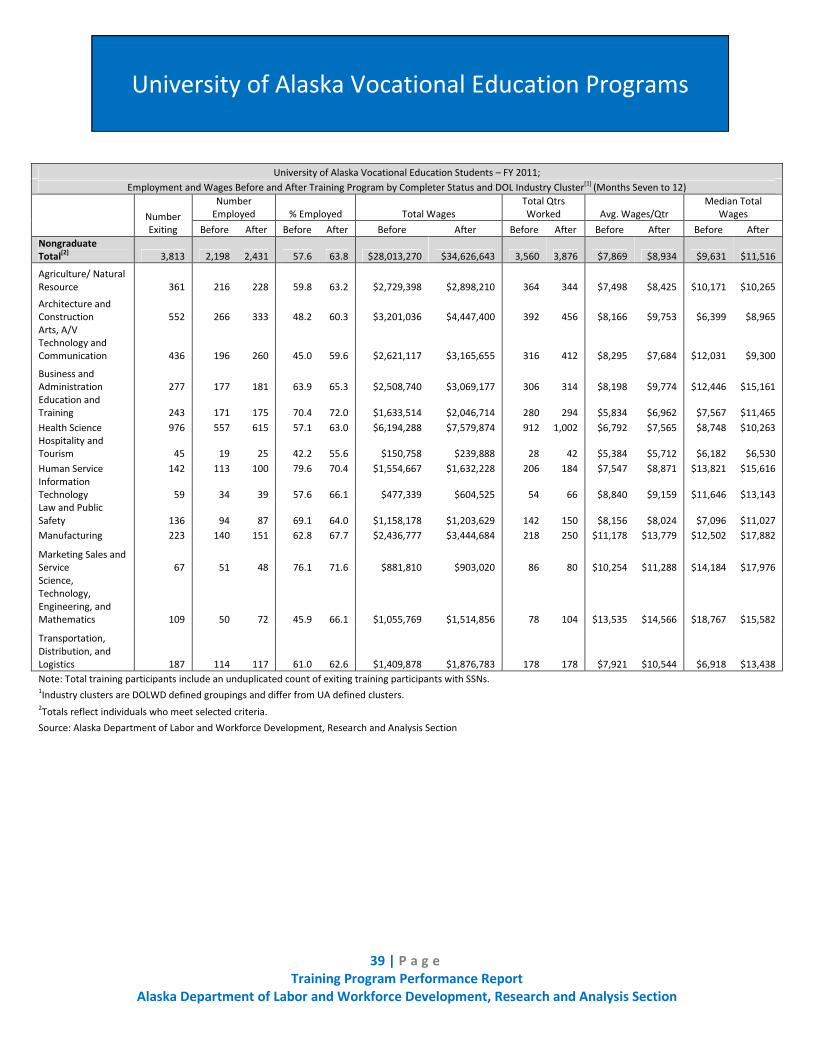
39 | P a g e
Training Program Performance Report
Alaska Department of Labor and Workforce Development, Research and Analysis Section
University of Alaska Vocational Education Students – FY 2011;
Employment and Wages Before and After Training Program by Completer Status and DOL Industry Cluster[1]
(Months Seven to 12)
Number
Exiting
Number
Employed % Employed Total Wages
Total Qtrs
Worked Avg. Wages/Qtr
Median Total
Wages
Before After Before After Before After Before After Before After Before After
Nongraduate
Total[2]
3,813 2,198 2,431 57.6 63.8 $28,013,270 $34,626,643 3,560 3,876 $7,869 $8,934 $9,631 $11,516
Agriculture/ Natural
Resource 361 216 228 59.8 63.2 $2,729,398 $2,898,210 364 344 $7,498 $8,425 $10,171 $10,265
Architecture and
Construction 552 266 333 48.2 60.3 $3,201,036 $4,447,400 392 456 $8,166 $9,753 $6,399 $8,965
Arts, A/V
Technology and
Communication 436 196 260 45.0 59.6 $2,621,117 $3,165,655 316 412 $8,295 $7,684 $12,031 $9,300
Business and
Administration 277 177 181 63.9 65.3 $2,508,740 $3,069,177 306 314 $8,198 $9,774 $12,446 $15,161
Education and
Training 243 171 175 70.4 72.0 $1,633,514 $2,046,714 280 294 $5,834 $6,962 $7,567 $11,465
Health Science 976 557 615 57.1 63.0 $6,194,288 $7,579,874 912 1,002 $6,792 $7,565 $8,748 $10,263
Hospitality and
Tourism 45 19 25 42.2 55.6 $150,758 $239,888 28 42 $5,384 $5,712 $6,182 $6,530
Human Service 142 113 100 79.6 70.4 $1,554,667 $1,632,228 206 184 $7,547 $8,871 $13,821 $15,616
Information
Technology 59 34 39 57.6 66.1 $477,339 $604,525 54 66 $8,840 $9,159 $11,646 $13,143
Law and Public
Safety 136 94 87 69.1 64.0 $1,158,178 $1,203,629 142 150 $8,156 $8,024 $7,096 $11,027
Manufacturing 223 140 151 62.8 67.7 $2,436,777 $3,444,684 218 250 $11,178 $13,779 $12,502 $17,882
Marketing Sales and
Service 67 51 48 76.1 71.6 $881,810 $903,020 86 80 $10,254 $11,288 $14,184 $17,976
Science,
Technology,
Engineering, and
Mathematics 109 50 72 45.9 66.1 $1,055,769 $1,514,856 78 104 $13,535 $14,566 $18,767 $15,582
Transportation,
Distribution, and
Logistics 187 114 117 61.0 62.6 $1,409,878 $1,876,783 178 178 $7,921 $10,544 $6,918 $13,438
Note: Total training participants include an unduplicated count of exiting training participants with SSNs. 1Industry clusters are DOLWD defined groupings and differ from UA defined clusters.
2Totals reflect individuals who meet selected criteria.
Source: Alaska Department of Labor and Workforce Development, Research and Analysis Section
University of Alaska Vocational Education Programs
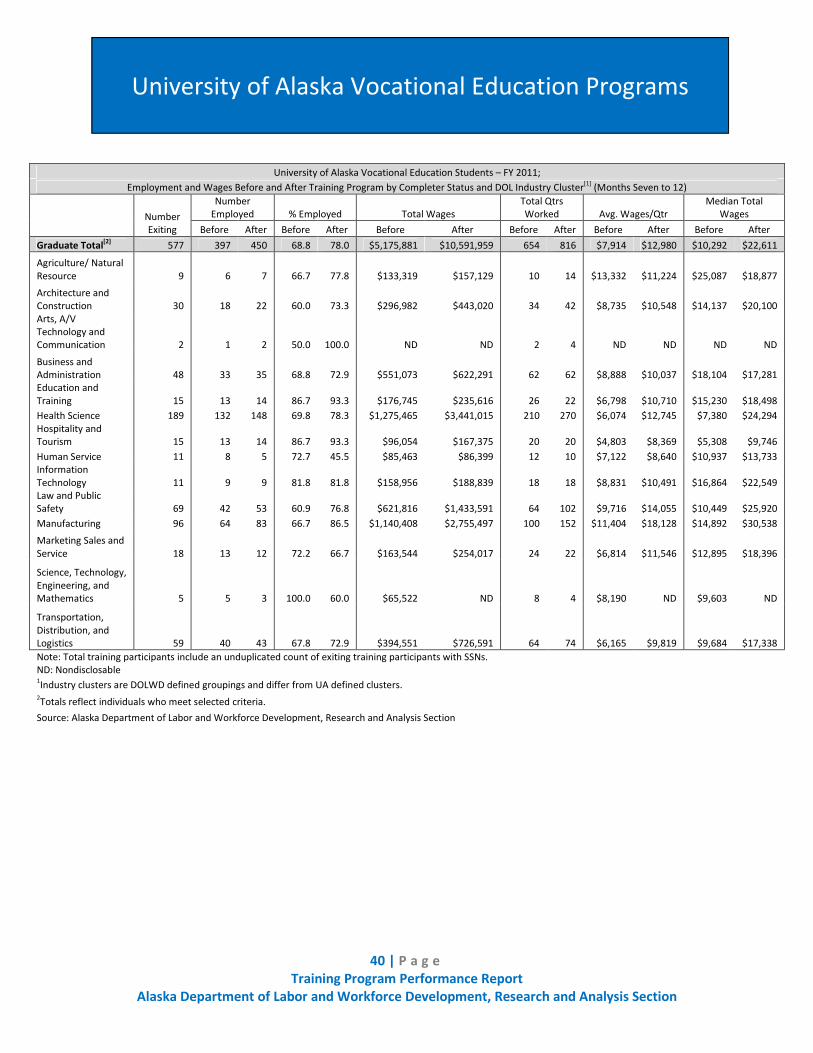
40 | P a g e
Training Program Performance Report
Alaska Department of Labor and Workforce Development, Research and Analysis Section
University of Alaska Vocational Education Students – FY 2011;
Employment and Wages Before and After Training Program by Completer Status and DOL Industry Cluster[1]
(Months Seven to 12)
Number
Exiting
Number
Employed % Employed Total Wages
Total Qtrs
Worked Avg. Wages/Qtr
Median Total
Wages
Before After Before After Before After Before After Before After Before After
Graduate Total[2]
577 397 450 68.8 78.0 $5,175,881 $10,591,959 654 816 $7,914 $12,980 $10,292 $22,611
Agriculture/ Natural
Resource 9 6 7 66.7 77.8 $133,319 $157,129 10 14 $13,332 $11,224 $25,087 $18,877
Architecture and
Construction 30 18 22 60.0 73.3 $296,982 $443,020 34 42 $8,735 $10,548 $14,137 $20,100
Arts, A/V
Technology and
Communication 2 1 2 50.0 100.0 ND ND 2 4 ND ND ND ND
Business and
Administration 48 33 35 68.8 72.9 $551,073 $622,291 62 62 $8,888 $10,037 $18,104 $17,281
Education and
Training 15 13 14 86.7 93.3 $176,745 $235,616 26 22 $6,798 $10,710 $15,230 $18,498
Health Science 189 132 148 69.8 78.3 $1,275,465 $3,441,015 210 270 $6,074 $12,745 $7,380 $24,294
Hospitality and
Tourism 15 13 14 86.7 93.3 $96,054 $167,375 20 20 $4,803 $8,369 $5,308 $9,746
Human Service 11 8 5 72.7 45.5 $85,463 $86,399 12 10 $7,122 $8,640 $10,937 $13,733
Information
Technology 11 9 9 81.8 81.8 $158,956 $188,839 18 18 $8,831 $10,491 $16,864 $22,549
Law and Public
Safety 69 42 53 60.9 76.8 $621,816 $1,433,591 64 102 $9,716 $14,055 $10,449 $25,920
Manufacturing 96 64 83 66.7 86.5 $1,140,408 $2,755,497 100 152 $11,404 $18,128 $14,892 $30,538
Marketing Sales and
Service 18 13 12 72.2 66.7 $163,544 $254,017 24 22 $6,814 $11,546 $12,895 $18,396
Science, Technology,
Engineering, and
Mathematics 5 5 3 100.0 60.0 $65,522 ND 8 4 $8,190 ND $9,603 ND
Transportation,
Distribution, and
Logistics 59 40 43 67.8 72.9 $394,551 $726,591 64 74 $6,165 $9,819 $9,684 $17,338
Note: Total training participants include an unduplicated count of exiting training participants with SSNs.
ND: Nondisclosable 1Industry clusters are DOLWD defined groupings and differ from UA defined clusters.
2Totals reflect individuals who meet selected criteria.
Source: Alaska Department of Labor and Workforce Development, Research and Analysis Section
University of Alaska Vocational Education Programs

41 | P a g e
Training Program Performance Report
Alaska Department of Labor and Workforce Development, Research and Analysis Section
University of Alaska Vocational Education Students – FY 2011;
Employment and Wages Before and After Training Program by Program Type[1]
(Months Seven to 12)
Number
Exiting
Number
Employed % Employed Total Wages
Total Qtrs
Worked Avg. Wages/Qtr
Median Total
Wages
Before After Before After Before After Before After Before After Before After
Nongraduate
Total[2]
2,046 1,258 1,311 61.5 64.1 $14,651,304 $19,145,497 2,020 2,138 $7,253 $8,955 $9,631 $11,516
Agriculture/
Natural Resource 362 163 194 45.0 53.6 $1,472,798 $2,034,371 240 268 $6,137 $7,591 $5,111 $6,757
Architecture and
Construction 118 87 84 73.7 71.2 $1,031,769 $1,458,109 134 132 $7,700 $11,046 $7,596 $16,305
Arts, A/V
Technology and
Communications 8 5 5 62.5 62.5 $48,506 $51,558 10 10 $4,851 $5,156 $11,398 $11,112
Business and
Administration 228 153 155 67.1 68.0 $1,882,971 $2,287,913 262 270 $7,187 $8,474 $10,883 $13,156
Education and
Training 19 18 17 94.7 89.5 $261,684 $316,962 36 30 $7,269 $10,565 $14,083 $18,565
Health Science 656 415 406 63.3 61.9 $4,901,059 $5,548,850 702 686 $6,982 $8,089 $10,048 $12,907
Hospitality and
Tourism 42 20 26 47.6 61.9 $133,212 $292,085 30 48 $4,440 $6,085 $5,454 $7,912
Human Services 64 51 41 79.7 64.1 $565,194 $492,397 88 68 $6,423 $7,241 $10,540 $12,266
Information
Technology 15 12 12 80.0 80.0 $121,798 $185,989 20 18 $6,090 $10,333 $11,160 $16,303
Law and Public
Safety 102 64 66 62.7 64.7 $553,701 $976,102 90 116 $6,152 $8,415 $5,717 $12,943
Manufacturing 262 165 196 63.0 74.8 $2,654,971 $4,062,084 244 320 $10,881 $12,694 $10,878 $15,829
Marketing Sales
and Service 65 46 48 70.8 73.8 $449,995 $563,684 76 76 $5,921 $7,417 $7,563 $9,482
Science,
Technology,
Engineering, and
Mathematics 11 4 6 36.4 54.5 ND $92,345 4 10 ND $9,235 ND $16,945
Transportation,
Distribution, and
Logistics 94 55 55 58.5 58.5 $518,317 $783,049 84 86 $6,170 $9,105 $5,236 $11,548
Note: Total training participants include an unduplicated count of exiting training participants with SSNs.
ND: Nondisclosable 1Program Type is a UA defined cluster grouping and differ from DOL defined industry clusters.
2Totals reflect individuals who meet selected criteria.
Source: Alaska Department of Labor and Workforce Development, Research and Analysis Section
University of Alaska Vocational Education Programs
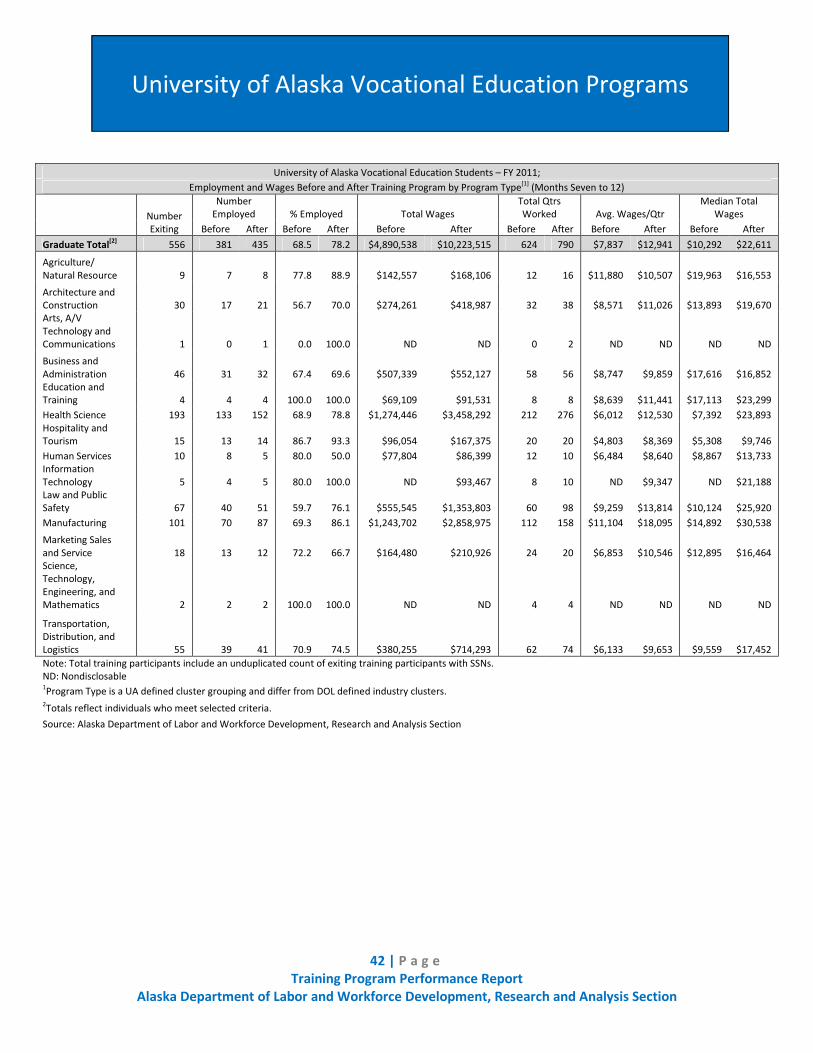
42 | P a g e
Training Program Performance Report
Alaska Department of Labor and Workforce Development, Research and Analysis Section
University of Alaska Vocational Education Students – FY 2011;
Employment and Wages Before and After Training Program by Program Type[1]
(Months Seven to 12)
Number
Exiting
Number
Employed % Employed Total Wages
Total Qtrs
Worked Avg. Wages/Qtr
Median Total
Wages
Before After Before After Before After Before After Before After Before After
Graduate Total[2]
556 381 435 68.5 78.2 $4,890,538 $10,223,515 624 790 $7,837 $12,941 $10,292 $22,611
Agriculture/
Natural Resource 9 7 8 77.8 88.9 $142,557 $168,106 12 16 $11,880 $10,507 $19,963 $16,553
Architecture and
Construction 30 17 21 56.7 70.0 $274,261 $418,987 32 38 $8,571 $11,026 $13,893 $19,670
Arts, A/V
Technology and
Communications 1 0 1 0.0 100.0 ND ND 0 2 ND ND ND ND
Business and
Administration 46 31 32 67.4 69.6 $507,339 $552,127 58 56 $8,747 $9,859 $17,616 $16,852
Education and
Training 4 4 4 100.0 100.0 $69,109 $91,531 8 8 $8,639 $11,441 $17,113 $23,299
Health Science 193 133 152 68.9 78.8 $1,274,446 $3,458,292 212 276 $6,012 $12,530 $7,392 $23,893
Hospitality and
Tourism 15 13 14 86.7 93.3 $96,054 $167,375 20 20 $4,803 $8,369 $5,308 $9,746
Human Services 10 8 5 80.0 50.0 $77,804 $86,399 12 10 $6,484 $8,640 $8,867 $13,733
Information
Technology 5 4 5 80.0 100.0 ND $93,467 8 10 ND $9,347 ND $21,188
Law and Public
Safety 67 40 51 59.7 76.1 $555,545 $1,353,803 60 98 $9,259 $13,814 $10,124 $25,920
Manufacturing 101 70 87 69.3 86.1 $1,243,702 $2,858,975 112 158 $11,104 $18,095 $14,892 $30,538
Marketing Sales
and Service 18 13 12 72.2 66.7 $164,480 $210,926 24 20 $6,853 $10,546 $12,895 $16,464
Science,
Technology,
Engineering, and
Mathematics 2 2 2 100.0 100.0 ND ND 4 4 ND ND ND ND
Transportation,
Distribution, and
Logistics 55 39 41 70.9 74.5 $380,255 $714,293 62 74 $6,133 $9,653 $9,559 $17,452
Note: Total training participants include an unduplicated count of exiting training participants with SSNs.
ND: Nondisclosable 1Program Type is a UA defined cluster grouping and differ from DOL defined industry clusters.
2Totals reflect individuals who meet selected criteria.
Source: Alaska Department of Labor and Workforce Development, Research and Analysis Section
University of Alaska Vocational Education Programs

43 | P a g e
Training Program Performance Report
Alaska Department of Labor and Workforce Development, Research and Analysis Section
AAS – Associate of Applied Science
ABE – Adult Basic Education
AGIA – Alaska Gasline Inducement Act
AKDOL – Alaska Department of Labor and Workforce Development
AWIB – Alaska Workforce Investment Board
BSSD – Bering Strait School District
CIP – Classification of Instructional Programs
CT1, CT2 – Certificate program
DBP—Alaska Department of Labor, Division of Business Partnerships
ESL — English as a Second Language
FY 2011 – Fiscal Year 2011 (July 1st, 2010 – June 30th, 2011)
GED – General Educational Development
GILA – Galena Interior Learning Academy
GPA – Grade Point Average
NACTEC – Northwestern Alaska Career and Technical Center
NIT – Northern Industrial Training
NPS – Nome Public Schools
NFVTC – New Frontier Vocational Technical Center
OEC – Occupational Endorsement Certificate
PFD – Alaska Permanent Fund Dividend
SAVEC – Southwest Alaska Vocational and Education Center
STEP – State Training and Employment Program
TVEP – Training and Vocational Education Program
UA Voc Ed – University of Alaska Vocational Education
UI – Unemployment Insurance
WIA – Workforce Investment Act of 1998
Acronyms