Embed Size (px)
Citation preview
HYDROGEOLOGICAL BULLETIN
FOR THE BUA CATCHMENT ,
WATER RESOURCE UNIT NUMBER 5
by
A.K. SMITH-CARINGTON
GROUNDWATER SECTION
DEPARTMENT OF LANDS .~LUATION AND WATER
PRIVATE BAG 311,
LILONGWE 3,
MALAWI.
MAY, 1983

HYDR~EOLOG!CAL BULLETIN FOR THE BUA CATCHMENT
WATER RESOURCE UNIT NUMBER 5
CONTENTS
List of Contents
List of Figures ,
List of Tables
Background
Summary
1 • I~RODUCTION
1.1 Location
1.2. Topography and Drainage
1.311 Geology
114, Climate
1.5 Soil
1.6 Land use
1.7 population
2. HYDROGEOLOGY
2.1 Occurrence of Groundwater
2.2 Aquifer Properties
2~3 -,
Groundwa ter Level Fluctuations
2.4 Groundwater Movement
2.5 Groundwater ChemistrY
3. C~TCEMENT WATER BALANCE AND GIOUNDWATER RESOURCE EVALUATION
3,.2
3t3 3 4
3.5
lbin[a:l1
Evaporation and Transpiration
Surface hydrology
Surface waler hydrograph analysis
water Balance and Groundwater Resource Evaluation
PAGE
1
12
28
4. G~OUNDWATER DEVELOPMENT 48 . I
4,1 Existi'rtg, Hater demands and supplies
4.2·; Groundwater abstraction methods
4.3 Scope for further groundwater development

~T OF FIGURES
1. Blla Catchment, drainage and topography
2. Geology
3. Idealised section of typical. catena sequence of plateau soils
4. Typical profile of \veathered basement aquifer
5. Groundwater level fluctuations' (seasonal)
6. Grounch.ater levels from borehole maintenance records
7. Map to show piezometric form
8. Electrical oonductivity survey in Hadisi area
9. 'l'rilinear plot of bydrochemistry
- A) Unit 5D
- B) Unit SE
10. Thiesocn polygons for estimating total catchment rainfall
11. River hydrograph, station 50 1, 1964/65
12. Dambo model
1. Soils of the plateaq area
2. Estimated population of the Bua catchment (1977)
4. Typical water quality of groundwater in plateau area
5. Estimates of evaporation and transpiration
6A. Estimates of actual evarotransp±ration dambo arelfs
6B. Estimates of actual evapotranspitation t interfluve area, cropped and fallo\!
6C. Estimates of actual eVapotranspiration area, trees
7A. Hydrograph analysis SC 'I
7C. Hydrograph ,analysis 5D 2
interfluve
8. Summary of averag'e hydro:logical components ,a,nd water balance for catchm·s-rif: t".", Si) i.
9. Urban water supplies
PAGE
6
11
19
24
29
32
33.,
34
38
39
40
45
50

BACKGROUND
This hydrogeological bulletin was completed as part of the evaluation
of the water resources of Malawi for the National Water,Resources
Master Plan and was prepared under the auspices of the Groundwater
Project.
The report represents a three month desk study and is largely
devoted to a presentation of hydrogeological conditions in the
weathered basement aquifer of a plateau area. As such it is a
pioneering work but it is clear from the available data that
little is known and more detailed research work is required to
further understanding of the complexities of the hydrogeoiogy.
There has been little published work which is of direct relevance
to the groundwater hydrology of the Bua catchment. The most
important texts giving the background hydrogeology are by Chilton
(1979) and wilderspin (1974); a summary of surface water hydrology
is given by Dray ton et al (1980) and a large volume of meteoroio·
gical data is presented by van der Velden (1979, 1980). ~ ,
,
. ,

SUMMARY
The Bua Catchment can be divided into three major hydrological zones:
i) the flat plateau drained by dambos,
ii) the steep slopes of the uplands and rift valley escarpment and
~ii) the lakeshore plain.
The weathered basement rocks form the principal aquifer which Is
present over extensive areas of the plateau. Tbis bulletin is largely
devoted to a consideration of hydrogeological conditions in this area.
m the dissected escarpment and upland~ the ,weathered ~one is thin
and the bedrock rarely gives rise to Significant aquifers even where
it is fractured, as the availab.7e, storage is negligible. Tbere is
little scope for groundwater development in these areas. Tbe
~lluvial lakeshore deposits :cover a relatively small area, but form
potentially good aquifers where there are significant thicknesses
of sands and gravels,
fhe weathered basement aquifer of the plateau area :is relatively
thin (10 - 25 m) wlthgenerally low permeabilities and potential
yields of 0.5 - 3 l/sec. The aquifer material is variable, with
the most permeable material usually found towards the base of the
weathered profile. Tbese zones tend to be semi-confined by compacted
$urface clays. The aquifer yields are quite adequate for rural
domestiC'supplies and it forms an"important, extensive sourCe of
protected water supplies. Seasonal water level fluctuations
appear to be in the range of 2 - 4 m, and long term monitoring
does not show any evidence of declining groundwater levels. Tbe
groundwater quality is generally good with low mineralisation'; it
is usually quite potable though there are frequently high iron
concentrations' whicb m,: ... ke it unpalatable-. Hm\~eV'er, there are some
qery localised areas of saline groundwater, which are not fit for' , human consumption.
Surface water hydrographs have been'analysed and a catchment water
balance has been attempted for the pleateau area. Replenish' able
groundwater resources have been evaluated using a ~ambo model
which is considered to be more realistic than the traditiona1 method
of baseflowseparation.

Average annual recharge is likely to be 18 mm at minimum, and could
be significantly greater if the interflow contribution to baseflow
is negligible and the evapotranspiration from the dambo areas
throughout the dry season is maintained by grounawater rather than
storage in the dambo clays. However, the aquifer properties (e.g.
transmissivity, hydraulic gradient) and surface water drainage
pattern are such that the average annual groundwater discharge (and
by implication, recharge) is unlikely to exceed 40 mm.
There is considerable scope for further widespread development of
groundwater for rural domestic supplies without depleting
replenishable resources, as the yields required are relatively
small (0.25 - 0.5 llsec). Conditions are suitable virtually all
over the plateau and lakeshore plain. Groundwater abstraction
methods are discussed. There is also some scope for small town
supplies and small irrigated plots where aquifer properties and
recharge conditions are favourable in the weathered bedrock aquifer .•
Some potential for larger irrigation schemes may exist in the lake
shore areas where the alluvium is relatively thick and sandy.
-,
,

1. INTRODOCTION
1 .1. LOCATION
The Bua River drains an area of some 10,000 km' and discharges into
Lake Malawi at a point 20 km north of Nkhotakota. The catchment lies
approximately between lonqitudes 32°35' and 34°15'E and latitudes
12°40'and 12°SS'S. It lies within the administrative districts of
Mchinji, Kasungu, Dewa, Ntchisi, Lilongwe and Nkhotakota. Under the
Water Resources Branch classification system (1979) the Bua River
catchment is numbered as resource unit 5 and is divided into four
sUb-catchments SC, 50, SE and SF (figure 1).
1 • 2. TOPOGRAPHY AND DRAINAGE
The Bua Catchment can be divided into three distinct hydrological
zones, based on topoqraph¥ (figure 1):-
(a) plateau
(b) steep slopes on the highland rising from the plateau
and the rift valley escarpment
(c) lakeshore plain.
The most extensive part of the upper catchment comprises a gently.un
dulating plateau at an altitude of between 1000 and 1200 m. The val"
leys are broad, the slopes are mainlY less than 2° and there are large
level areas on the interfluves.~ This "African·Surface" is an ancient
late Cretaceous - early Miocene
peneplained (Dixey 1.937, Lister
sur.face which has been. extensively
1967) • The
the SW as a result of uplift along the rift
erosion surface slopes to
valley but the drainage
system has kept pace with these earth movements and drains ~I as a
result the valleys become more incised towards. the ~scarpment. The plateau
is largely drained by 'dambo. • which are broad, per iodically inundated,
grass-covered swampy depressions with poorly defined channels. The areas
which are liab~e to, flood cover 20 - 30% oftM plateau1 those in the flat
test area towards Kasungu are most susceptible to inundation where there
are few major tributaries to the north bank of the RUlla River. The dambo
headWaters from different tributaries may even coalesce where they are
well-developed. There is a dendritic drainage pattern which may be con
trolled by structural weaknesses along fracture traces. Aerial photographs
show major lineations trending SW - NE and minor ones NNW - SSE which . . '
are ~ommon~y preferentially followed by dambo· • The main rivers have

Figure 1: BUA CATCHMENT • DRAINAGE AND TOPOGRAPHY
Kasu~ ...
\ \
I I
I
I I
I
I I
I , ,."'-- .... \
\ \ \ \ \ \ \ \ I \ I \ +Dow~
N
t I~ 2.0\<m t
Malawi
Rift eS«W/'Ihent. 4< steel' sIoyoes
~/.~.\ lo~ pbi" .......
50 Water Resource Unit

2.
well-graded profiles and numerous meanders typical of a very old erosion
surface.
There are some areas of highland rising abruptly from the plateau where
the underlying strata are more resistant to erosion. In the SW of the
catchment the Mchinji Hills form a ridge with steep slopes grading into
pediment. This forms the headwaters of the Sua and its main tributary
the Rusa. The ridge rises to over 1700 m and represents a remnant of
the Post Gondwana Jurassic to mid-Cretaceous erosion surface. The
Namitete River rises in the northern end of the Dzalanyama Hills in the
South West of the catchment. The Dowa Hills on the crest of the rift
valley escarpment also have steep slopes and dissected valleys. Other
tiplandareas' are small inselbergs rising abruptly from the plateau
surface.
The escarpment falls steeply towards Lake Malawi in a series of fault
.controlled steps down to 500 m a.s.l. The slopes are very dissected
with deep valleys and tributary gUllies and there are gorges with
rapids over the faul t sections.
On entering the lakeshore plain the gradient becomes very gentle and as
a result much of the river load is deposited. There is annual flooding in
the rainy season and the alluvium is spread over the plain. The Dzadeda
Swamps behind Bua Point are partly caused by floods and partly by sand
spits o~ lacustrine sands which I1ave become infUled formirig marshes.
1 • 3 • 1 • GEOLOGY'
Almost all of the Bua Catchment is underlain by Pre Cambrian.'- Lower
Palaeozoic gneisses, granulites and schists ass.igned.to the Malawi
Basement Complex (Carter and Bennet, 1973). In the 'east on the lakeshore
Plain these are over lain by Quaternary alluvial sediments (figure 2). , Bulletins 24,25,26, 27, 30, 31 and 32 of the Geol~ical Sur¥eyof
Malawi describe the geology in detail.
1.3.2. Structure
The Basement Complex forms part of the Malawi Province of the Mozambique
Orogenic Belt (Cannon et a1., 1969). There is evidence of polyphase
deformation 1 the major structural axes of folding trend NNW in the
Mchinji Ridge and over much of the plateau and NNE in. the escarpment zone.

\ :J:. 2. <> ." -p ,. ~
'"
rz-Jl8lJ L' ''0,.::<, ---:- - : ..... :!:;
'" .,- ", p p .';
lA m " ., m ~
<> n m
'" c p " '" '" "' '" '" '" ~ P t::l"
" .... :cl r.; .... "-n ~:'.\
" "' 3 El I ." '" r- e to ~
.., ~, x p
" c:: 3 El_ 3 <> .... P '0 '" :;.,- '" N n !2,
-------_ ...
"1'1
to c: .., I\)
N
Cl IT! e re Cl -<

3.
Fracture traces can be picked out on aerial photographs and occur on a
variety of trends; those aligning NW or NNH are particularly prominent
and exercise some control over orai.naqe patternso There is considerable
faul t ing j n th e (~~~c~u: };,m.c.;nt aJ~t:.',:;. :·· .. ·.;~·":)c ~_.;..< ~.Jci ,.,1. t;l "che DE:'v"e lopment of the
Malmd Rift Valley ",nd th" uplift of the eastern edge of the plateau
area. Most faults trend NI\J1v and do"\'!nthrow to the east often with promi
nent scarps (Harr i.son and Chapusa, 1975).
1.3.3. .0!:b.?29SilX._~tr_aLigra!2l:y
'rh" crystalline metamorphic rocks of the Basement Complex are believed to
be of both sedimentary and igneous origin •. They comprise predominantly
fine to medium grained bioti te and hornblende gneisses over the plateau
area, with the occurrence locally of varying types of granulites and
schists and intrusion" of syenite or basic metagabbros. The Mchinji
Hills comprise mainly coarse grained quartzites and schists. The coarser
grained parent materials give rise to the best aquifers as they decompose
to a more sandy texture. Locally marbles occur, which can form important
aquifers when they an" \VeIl fractured. Where the rocks are more resistant
to erosion they remain a" -1.""01 h0ras or as uplands as in the Mchinji Ridge.
Over most of the plateau, oxcept in the east tOl.ards the escarpment, the
bedrock is deeply ;'eathered and largely covered by residual soils and
colluvium. It is th"se deposits '<lhich form the prinicpal aquifer. Towards
rnent of the Rift Valley ha" resulted in rejuvenation of the rivers ·and
increased erosion of the I{eathered material. On the escarpment area itself,
the l'I<'>athering products L \\7(' been la.rg-ely stripped away_ by erosion. The
lakeshore plain is underl}i.n by a variable sequence of Quaternary alluvium,
~.Thich comprises zdternati/lg layers of claysr silts and sands. The total
thickness of the alluvia.> sequEmce varies,but in general the 'depth to
bedrock increases towards Lake MalaNi with a maximum of over 30 m recorded.
'"xposed to the nor th of i :ua Poi nt:.
1. 4 • 9d.:,!!~
The climate is markedly seasonal and rainfall is largely associated with
the migration of the Inter-1'ropical Convergence zone. However climatic
ccnditions are complex due to the range in altitude of the catchment and
the influence of Lake Mal.dVlL

The rainy seaSOn usually extends from November to March, initially
intermittent and becoming more continuous in January. Rainfall over
the plateau occurs largely as hea\ry convectional tropical storms
'tlhich C.:ln b0 V(;f y lcc,:;)lised, how'over the total annua.l rainfall
(mean 800 - 1000 rm~) is suspected to be less spatially variable.
Over the esoarpment and uplands e~posed to the prevailing south
easterly Idnds, rainfall is also orographic and the annual total can
be three times that of adjacent areas (Dray ton et a1, 1980). These
areas may receive orograpilic rainfall and mists, ImOl1l1 as Chiperoni,
during the 'cool dry' season which extends from May to August.
P~infall along the escarpment is relatively high (1200 - 1500 mm)
dry with progressively increasing temperatures,and occurs from
September to Novemb"r, or. early December.
Temperatures are closely related to altitude (van der Velden,
1979, 1980). The mean monthly temperature ranges from 16° - 26° C
on the plateau with actual maximum temperatures over 3D· C in
No·,ember ana December. On the higher ground temperature falls with
monthly averages ranging from HO - n" C and on the lakeshore plain
it is h~gher, in the range of 20° 27° C.
The average annua.l pan evaporation ranges from 1600 - 1950 mm on
the plateau to arOl...m;'l ::::;.on 1[,(: Oil t.:~;(: 1.i.:kC.:::r..J':::0 (V':""ii (.;2r Velden,
1979). This is likely to be IllIlch greater than average annual
actual evapbtranspir'ation.
1.501. SOILS
Soils in tb" BCla catchment [all i.nto fol.l!:" main groups based on the
classification by Brmm an':i Young \ 1965) ,-
(a) Latosols are found on the gentle slopes of the plateau. , These are 'formed by prolonged weatherin,! .clays and .down-
t,<1ard leachirq of e7~cha.rigeable bases ann stlica.tes.
Strongly leached ferrallitic soils with an advanced
state of clay mineral weathering (mainly kaolinite)
are most common and generally have poor .nutrient status.
They often have associated laterite layers which
may restrict draina90" ?e .... ~H,~1.nlJus soils are

found where the ,,'ea thed ng of parent ma tor ials is less
advanced and the soils are relatively weakly leached.
(b) Lithosols are shallow, immature and stony soils found on the
steep slopes of the Rift Valley escarpment and highlands
rising from the plateau. There is little horizon differen
tiation and any weathering of parent material is balanced
by losses through slope wash or soil creep. Drainage may',
be rapid but the shallow profile resUlts in low moisture
retention.
(c) Hydromorphic soils are waterlogged for all or most of the
year and are found in valley floor sites on both the plateau
and the lakeshore plain. These are swelling clays with
a very heavy texture and thus low permeability~ this
coupled with poor site drainage results in annual flooding.
(d) Calcimorphic soils are derived mainly from alluvial parent
material and found on the lakeshore plain. The texture
varies widely with alternating layers of clays, silts and
sands commonly occurring. The clays are stronglY swelling
but do not usually crack on drying out due to the high
proportion of silt. Drainage is impeded where the water
t.a.ble is high. -,
Physical characteristics" of soils in relation to recharge
On the plateau area the soils are predominantly fine textured and
the clay content usually increases with depth (Soil Survey Re~rts,
,'5.
1969 - 1973). The soils appear to have relatively low infiltration
capacities (Table 1.) although infiltometer measurements cannot be taken
as totally reliable. Surface runoff is high and often the lower soil
layers are dry llven following prolonged rainfall. Soakaway pits from
boreholes are commonly very poorly drained, confi.rming the low'perl\\ea
bility. Most variations in texture' can be related broadly to ,topography
and are determined by the extent of erosion, leaching and relative
position of the water table. A distinct catena sequence occurs from 'the
interfluves to the drainage lines (figure 3). This sequence is modified
by geology and in detail tpe pattern of soil types is~()(j)plelC. In,
general more basic parent materials resul,t in more heavily textured,
darker red soils.

Figure: 3 IDEALISED SECTION OF TYPICAL (ATENA SEQUENCE OF PLATEAU SOILS
FerraUitic soils
large S110 after
Ferrallitic soils with taterite
dry season th~refore I-
little recharge i ~'f"",-41'()(I 10-1$' ........... "'>lo. '!If) F. " IQ; I{ I/, ~ --fa", ~
_RWL (max)I, "fil'f~/'i'(! Q(;fill'~" . - - - - - - _ _ 'if <Cl! ("et. "(j r("..... ........
------ ---__ -- ---- -!.o~0;g..!'-f,,--""
i
(olluvial soil
Hydro ril°rPhic soils
Vertisols
----- -~,~- ----. -- - . ----IQX::/~Q Jl~=---------- -~;,;:- ___ . _______ . RWl(max) -<T' :!{_~~ __ ,.~ -- - "e'''' ~ .. ;--____ _
- - - - - ...'..r,"@.']B .2':ertiC91 {~ 3 . -- _J _____ __ RWL!mm)
Soil
weathered bedrock

Table 1,
Soils of the Plateau Area*
Soil type
Latosols
a) Ferrallitic soils
b) Ferrallitic soils ,dth laterite
c) Ferruginous soils
<1) Colluvial soils
Hydromorphic soils
a) Dambo soils
b) Ver tisols
Lithosols
Estimated % Area
45
35
12
2
3.5
1.5
Bstimated Infiltration Capacity (cm/hour)
Based on infiltrometer measurements
7 - 23
o where massive laterite
3 - 12
2· - 30
2 - 10
0.2 - 9
2 - 25
* After Lowole (Soil Survey Branoh, 1982, personal oommunioation)
·6 .•
Latosols are found on the· ·crests, upper and middle slope positions and
range from loamy sands to sandy olays. These soils are relatively deep
(1 - 3 m) and are generally more permeable than the soils of the valley
bottoms (Table 1), though dra.inage may be impeded where the interfluves are . .
flat· andl or where massive laterite is present, associated with ferral-
li tic soils. ,.
On the lower slopes where the water. table is high, fluotua~
tions in water level may give rise to soft incipient groundwater laterite,
but this tends to be indurated in better drained sites. Fossil laterites
may be found anywhere, even on crests and are generally lower in the
profile on upper slopes. Where the laterite is massive and at shallow
depth (a feature which is quite common around Mchinji·and Kasungu) exoess
rainfall enters the soil :OUl'f2:::e but vertical flow is impeded and infil-.
tration to the ~ter table is likely to be neglible. Lateral throu9h
flow along the top of the laterite directs the water,downslope where water
logging may occur if satUl:ilti.(Y'. builds up to the surface. Nearer the
valley bottom, if the laterite is less developed, subsequent infiltration
to groundwater may occur. It the.laterite is nodular or fraotured vertical
drainage is possible but is significantly reduced. If there is no laterite
and the texture is sandy', ferrallitic soils have very high permeabilities.
Ferruginous soils, despite 'their heaviel:· texture, tend to have relatively
high infiltration rates as there is usually no impeded internal drainage

7.
anq the soils are moderat.ely "7ell structured. Ferruginous soils are
found mainly in the soo.th·ea.st of the plateau area towards the Dowa Hills
where the slopes ·~re gently rolling and the stage of weathering is less
aclvancedo Over lllU0/1 '~'Ji: th;"·' :(0St nf f:h~ plateal.1 Cir.ea ferrallitic soils
are dominant: t.hey are sandier 2r.'d most strongly leached and weathered
in the Rusa cat""ment and towards Kosungu !ihere the topography is extremely
flat, but the development of laterHe is widespread in these areas.
Very large soil. moisture Clerici ts can build up in the upland soils during
the dry season; li ttle penetration of recharge to the water table can occur
until the soil has been restored to field qapacity. It may take a major
pal:t of the rainy S0'C:",n 1:.0 Jati3fy this condition and some years it is
possible that no recharge to groundwater occurs at all.
Termites have a·considen,b;.e ,-nfluence on soils and have had for a very
long time, as . they continually worl, the soil over and break down orqanic
matter. Termite mounds are found all over the plateau except in the
centre of the dambos where water logging is permanent. They tend to be
large domes on the interfluves and low mounds at the dambo margins.
l;cti ve termi taria are generally found where the water table is shallow.
The surface of the mound tends to be a structureless clay with low
intrinsic permeability but the soils beneath have a network of burrows
which significantly increases permeability. Any infiltrating water
reaching these channels il!o8si;~ly vi" ~hrouglldow from upsill9pt!) will
be able. to take these flow routes.. Mixing and reworking of soil by
termi tee on the old erosion sur face .over a long ·period.is thought to
lead to the creation of 'stone lines' since large particles cannot be
moved and tend to accumulate at the base of the zone of termite activity.
These stone lines could provid, preferential flow routes divtlrting
infiltration water laterally. It is clear that termite activity is a
very important mechanism in the moulding of the Plateau landscape.
Colluvial soils' whicfJ have been transported short distances downslope
by gravi ty generally o"cupY a 1a.rrm7 transi Hon between upland and
hydromorphic soils. They may extend over the whole of the valley
floor where the dambo is immature, slopes are steep or waterlogging is
not perennial. These soils are deposited from upslope wash of material
into the valleys and are generally coarse loamy sands or sandy clay
loams with heavier texturep in the st!bsoil. In the absence of laterite
8.
colluvial soils are very permeable and drain rap~dly although they may be
waterlogged for short periods during the rainy season when the water table
is at ground level. 1'here may be localised development of laterite within
the zone of \<lateL~·tCJ.ble :f1 tlctu()tion as for e~ample on the Kasungu and
Mchinji Plains. If this is the case dOl-inward water movement is reduced
despi te high permeability of the surface layers, and infiltrating water is
directed laterally into t.he dambo where it either drains as surface runoff
(return flow), evaporates or infiltrates depending on the relative height
of the water table.
Hydromorphic black dambo clay soils are found in the valley bottoms where
water logging is pr,"lons,/; 2<1 t.hough they mE]' be some drying out in the
dry season. Low permeability clayey textures are most commom although
some sandy loams may occur. Interbedded clays and colluvial sands may
occur, marking changes in erosional and depositional processes and shifts
in the channel position. These layers are mostly restricted to the heads
and sides of dambos. C.ood examples of washed sandS in the dambo head are
found near Mchinji, where they are to be used for making glass. High water
tables in the dambo areas will prevent infiltration for most of the year
and recharge to groundwater will be very limited.
In the centre of wide dambos there may be vectisols which have high.
contents of montmorillonite clays. These expand when wet and contract on
drying resulting in heavy soii cracKing a" tne surface during the dry
season.· l<1i th the initial rains a very Hmi ted amount of water may
penetrate to the water table via the cracks but these quickly seal UP.
and infiltration rates rapioly decrease. Recharge is likely to Qe
negligible because of high Hater tables for most of the year.
Lithosols found surrounding inselbergs and on steep slopes of higher
land rising from t.he plateau are usually saprolites (i.e. developed in
situ). They have variable but generally low permeabilities, though any , surface runoff may infiltrate on reaching the deeper latosols.
It is clear that recharge to groundwater over the plateau area is complex
as·it is both spatially and temporally var iable; the influence. of
la teri te and the water table position are both very important in deter
mining the extent of in flIt ration.

8.
colluvial soils are very permeable and drain rapidly although they may be
waterlogged for short periods during the rainy season when the water table
is at ground level. ~'here may be localised development OL laterite within
the zone of '\vate1:-table fJ uct.nRtion as for ~xampl€ on the Kasungu and
Mchinji Plains. If this is the case dOWlmaI:d water movement is reduced
despite high permeability of the surface layers, and infiltrating water is
directed laterally into th" dnnbo where it ei·ther drains as surface runoff
(return flow), evaporates or infiltrates depending on the relative height
of the ",ater table.
Hydromorphic black dambo clay soils are found il1 the valley bottoms where
dry season. Low permeability clayey textures are most comrnorn although
some sandy loams may occur. Interbedded clays and colluvial sands may
occur, marking changes in erosional and depositional processes and shifts
in the channel position. These layers are mostly restricted to the heads
and sides of dambos. Good examples of washed sandS in the dambo head are
found near Mchinji, where they are to be used for making glass. High water
tables in the dambo areas will prevent infiltration for most of the year
and recharge to groundwater will be very limited.
In the centre of wide dambes there may be vertisols which have high.
contents of montrnori1lonite clays. These expand when wet and contract on
drying reSUlting in heavy soil cracKlng ae toe surface during the dry
season." With the initial rains a very limited amount of water may
penetral!e to the water table via the cracks but these quickly seal uP.
and infiltration rates rapidly decrease. Recharge is likely to be
negligible because of high Nater tables for most of the year.
Lithosols found surrounding inselbergs and on steep slopes of higher
land rising from the plateau are usually saprolites (i.e. developed in
situ). They have variable but generally low permeabilities, though any , surface runoff may i'nfiltrate on reaching the deeper latosols.
It is clear that recharge to groundwater over the plateau area is complex
as"i t is both spatially and temporally variable; the influence. of
lated te and the water table position are both very important in deter
mining the extent of infiltration.

9.
Soils on the escarpment are predominantlY 1ithoso1s with same associated
ferra11itic or ferruginous soils in areas which are less dissected. This
area is of little hydr.ogcological significanc".
On the lakeshore plain the Goils are mainly alluvial calcimorphic soils
commonly comprising alternating layers of clay, sand and silt. These
soils have generally high permeabilities on the old flood plain of the
Bua River, but infiltration may be restricted by high water tables.
Close to the river and in the Dzadaza S",amp area there are hydromorphic
soils where there is perennial waterlogging caused by high water tables
and 101< gradients. Along the lakeshore there are coarse lacustrine sands
,.,hich nw,y develop f0rrz.l.l.i.t.ic scils"
1.6. LAND USE
The natural vegetation of· the plateau area is Brachystegia-Julbernardia (Miombo)
woodland, though much of this has been recently cleared for cultivation.
The interfluveareas have only been populated since the 1930's with the
provision of water from borehbles. It is estimated that about two thirds
of the cultivable land in the Central Region is fallow or unused (National
and Shire Irrigation Study, 1980). Waterlogged areas in the dambos are
unsuitable for cultivation and remain as marsh·grasslan9. In the small
areas adjacent to dambos where water levels are always close to the ground
surface "dimba gardens" are found wltn crops grown all year roUnd.
-. Smallholder crops account for most of the agricultural-output. The
principal sUbsistance crop is maize with smaller amounts of beans and
cassava. Tobacco and groundnuts are the two main cash crops. There are
some large commercial estates, covering about 15% of the plateau in total,
where cash crops (mainly tob3cco) are grown for export. The growing
season is broadly speakIng November to May. Agricultural potential is
moderate but may be restricted where soils are highly leached of nutrients , or waterlogged (Land Husbandry Identification Reports, 1978 ~ 1981).
Kasungu Agricultural Development Division (KADD), which administers ··most
of the plateau area, is encouraging development within the Ntchisi and
Dowa West areas (Project Preparation Report, 1980) under the National
Rural Development Programme (NRDP); There are also plans for agricultural
development projects in the Mchinji and Rasungu South areas.

10.
On the steep slopes of the escarpment and the upland areas, soils are
thin and natural Brachystegia woodland remains. There is very little
cultivation and much of these areas are forestry reserves. Nkhotakota
Forest Reserve, Mchinji Ridge Forest Reserve, Dzalanyama Forest Reserve
and the western edge of Kasungu National Park are the main examples.
The lakeshore plain is moderately cultivated where soils are not water
logged, the principal crops being maize, groundnuts and cassava. The
area is administered by the Salima Lakeshore Agricultural Development
Division (SLAnD); this was set up in the early 1970's and is one of
the oldest of the NRDP projects. There is .an irrigation scheme, estab
lished by the Chinese Agricultural Mission in 1976 and now managed by
the Ministry of Agriculture and Natural Resources. This scheme takes
water from the Bua River by direct run-of-river abstraction, which
enables rice to be grown over sorne 200 hectares. The scheme is subject
to severe water shortages ·in the dry season and flood damage in the wet
season.,
1.7. POPULATION
The 1977 population of the Bua catchment is estimated to be about
530,000 (National Statistical Office, 1980). The census figures show
that settlement is mainly concentrated on the plateau and is predominantly
in rural villages (Table 2). The main towns are Mchinji and Ntchisi,
which "re district centres with ,~bornas" (administrative offices) and
Mponela, which has expanded rapidly. with the impact of-the tar road
running north from Lilongwe. The densest rural population (over 100/km')
is found in parts of Dowa District (Dzoole, Chiponda and Kayambe
Traditional Authorities) where agriculture is most producti~. The
population is relatively low in Mchinji and Kasungu Districts, where
settlement is predominantly recent, with the establishment of tobacco
estates.
Towards the top of the escarpment there are scattered settlements but
the lower slopes within the Nkhotakota Game Reserve are unpopulated.
The small area of the lakeshore plain has rural population densities of
25 - SO/km" but no large centres.
The national intercensal (1966 - 1977) population growth rate was 2.9%
per annum but it was much higher in Kasungu and Mchinji Districts (6.6%
and 5.8% respectively) with the growth of the estates. The urban growth

rate is high and growth has been parti.cularly rapid in Mponela. The
projected 1990 population is in the order of 800,000.
Table 2.
Estimated Population of the Bua Catchment (1977)*
Population
Rural population on plateau 513,000
Mchinji town 2,000
Mponela town 3,400
Ntchisi town 1,700
Escarpment 7,000
Lakeshore plain 4,000
Total 531,000
Area (km' )
9,500
10
8
5
1,000
100
flensity (per km')
30 - 140
19.6
420
331
0 - 20
25 - 50
* Based on 1977 Population Census figures (National Statistical Office, 1980)
'.
11.

12.
2. HYDROGEOLOGY
2.1 • OCCURENCE OF GROUNDWATER
The prolonged in-si tu weathering of the crystalline basement rocks of the
plateau area has resulted in a layer of unconsolidated saprolite material
which is commonly 15 - 30 m thick but locally may be over 30 m. The
degree of alteration and unconsolidation increases progressively upwards
from the fresh, unweathered· bedrock. A generalised profile is given in
Figure 4. Above the hard, fresh bedrock there is a zone of broken and
hydrated rock where the surfaces are chemically weathered and stained but
the centres of the blocks remain fresh and unweathered. This grades into
a zone of crumbling decomposed bedrock often of sandy or gravelly
texture which retains the original structurer these lower layers would
generally have the highest permeability and effective porosity. Above,
there are pale brown or buff sandy clays or clayey sands often with many
small quartz fragments. This whole sequence makes up the aquifer and is
commonly 10 - 25 m thick. The aquifer is then partly confined by an over
lying thickness of 5 - 10 m of red-brown compacted clays and latosols at
the surface. In detail the character of the weathered zone varies with
parent rock type and texture, fracture patterns and topography. There is
considerable spatial heterogeneity even over short distances and the more
permeable horizons may have only limited lateral extent. Nevertheless
this relatively thin weathered zone of the basement shield forms the
important aquifer over most of tQe plateau.
The aquifer is partly confined by the compacted clay layers at the surface;
groundwater is first struck at the base of the clays and usually rises
(sometimes by several metres) before its static level is found. Despite
the semi-confining effect of the surface clays it is most likely that
recharge occurs regionally over the plateau. This i~ confirmed by the chemical
dominance of bicarbonate ions and the generally very fresh nature of the
groundwater. it is .probable that recharge is spatially very variable and
occurs preferentially along specific zones, for example, where fractured
quartz veins and pegmatites extend· to the ground surface, and to a lesser
areal extent around the bases of inselbergs and higher ground where the
talus or outwash material has a higher permeability. It is possible that
there is also some recharge via cracks in the dambo clays a.t the beginning

FIGURE 4
TYPICAL PROFILE OF WEATHERED BASEMENT AQUIFER*
'" r.: ....
Latosol
Red/brown compacted clays
:;: Pale brown or buff sandy clay or clayey
~ sand often with many quartz fragments
~ '0
<11 UJ
'" <11
" g ....
Crumbling decomposed bedrock, often
sandy or gravelly but original struc
ture retained. Clay matrix common •
Broken, hydrated bedl:ock u ~ ::.:'~ ~~'eathered
and stained surfaces but hard "core"
blocks
Fresh oedroc1<
* After Chilton and Grey, 1981
confining layer (5-10 m)
Aquifer (10 - 25 m)

13.
of the rainy season, but this must be of limited extent before the clays
swell and seal. The interfluves, where still wooded, may only allow
limited recharge since the evapotranspiration demands are very high and
tap roots can draw moistu.t:e dirf;ctl:i from the W6.ter table from depths of
15 m or more. With cultivation, it is suspected that the permeability
of the soil is increased by the tillage, the transpiration losses are
reduced and as a result there may be more recharge.
Infiltrating water may be directed laterally by laterites or flow with
least resistance along the more permeable zones associated with stone
lines and thus become concentrated in certain areas. Preferential flow
routes may also be found in the network of burrows. in termite mounds.
Although potential borehole yields are relatively low (less than 5 llsec
and often less than 1 l/sec) the aquifer is more or less continuous and
an important source of rural domestic water supply. Yields are generally
greatest where the bedrock is coarsest and the weathered zone is thickest.
However there is considerable lateral variation which partly reflects the
heterogeneous weathering profile. yields are also affected by borehole
design, which has in the past been very poor. Towards the rift valley
escarpment the aquifer is thinner where rejuvenated drainage has partly
stripped away the weathered layers, thus yields in unit 5D are generally
lower.
The weathering profiles in the dambo areas themselves are largely unknown , and thought to be highly variable depending locally on the various .~
of aggradation and erosion in the genesis of the drainage syst~. Bed
rock is seen to outcrop in some incised dambos with well defined channels,
yet other dambos are thought to be underlain by relatively t~ick weathered
zones ..
In the pediment to the Mchinji Ridge coarse quartz sands are found in
the river beds. ' These are derived from the quartzites of the uplands
and have been transported downnlcpe. The thickness and laterial eK
tent of the deposits is not well known but the potential groundwater
yields and recharge are likely to be relatively high due to the coarse
nature of the sediments.
. ~-'

14.
The underlying fresh bedrock is rarely a significant aquifer even
where fractured as the available storage is negligible. Although
there are many boreholes drilled to considerable depths into fresh
rock (often 50 - 60 m deep) these will rely on storage in the over
lying weathered zone. Outcrop of fresh rock is found where insel
bergs project above the plateau surface and on the escarpment. In
these areas the soil cover and weathered material are thin and
aquifers are poor and discontinuous. Occasionally high yielding
boreholes occur where they tap a system of interconnecting fractures
but in general yields are unreliable even where fracture traces can
be located. Runoff is high on the steep slopes and recharge is nOt . -dependable. As a result there are few existing bore holes in these
regions and scope for further groundwater development is limited.
There may be significant recharge via the runoff into the more
permeable material of surrounding pediment areas.
The alluvial lakeshore deposits in the Bua catchment comprise a
variable sequence of clays, silts and sands, though lithological
records from boreholes give little detailed information on the
succession. The yields appear to be generally low, but this probably
reflects poor borehole design. However, records from adjacent areas
(Mauluka, 1983) indicate that groundwater yields can be high (over
15 l/sec) where boreholes have been properly designed, especially
where there are significant thicknesses of sands in the alluvial
sequence. The thickness of th~.alluvium increases towards Lake
Malawi and may exceed 20 m. Near the base of the escarpment where
the alluvium is thin, groundwater will be derived mainly from the
underlying weathered basement aquifer with which it is in hydraulic
continuity.
2.2. AQUIFER PROPERTIES
There have behn ve,y few aquifer tests with detailed monitoring of
groundwater levels so estimates of aquifer properties are necessarily
rather crude and it is suspected that conditions are extremely variable
even on a very local scale, depending on the structure and lithology
of the bedrock and on the depth and nature of the weathered zone.
Poor borehole design further complicate~ the estimation of aquifer
properties. Conditions tn the .weathered bedrock aquifer are broadly
discussed below.

2.2.1. Borehole Yields
Records of bore hole yields are at best the result of short drillers
pumping tests (commonly five hour but sometimes 12 hour tests) but
for the older boreholes the only indication may be a driller's recom
mended yield. These records are more meaningful where the drawdown
is measured too but in many cases the yield gives the only idea of
aquifer performance. The records are of the discharge rate at which
the borehole was tested and may reflect the pump capacity rather
than the aquifer capacity. Over much of the plateau area the bore
hole test yields appear to be low to very low (mostly less than 1.5
l/sec) and in general are lowest in Unit 50 where the weathered zone
is thinner, however the yields are usually adequate for rural domestic
supplies. The low test yields at least in part reflect the very poor
borehole construction (see Section 4.2) and it is likely that many
of the boreholes are very inefficient due to high well losses. With
improved borehole designs, yields of 1 - 3 l/sec might PQssibly be
obtained over much of the weathered plateau, with even higher yields
where the weathered zone is thickest which could be important for
agricultural development. On the escarpment, yields are usually low
and unreliable because of low storage.
2.2.2. SpeCific capacity(S.C.)
The Specific Capacity (yield divided by drawdown) can be determined
where water levels were measured during the drillers pump tests.
Records are only available for ~ limited number of boreholes and
are not strictly comparable since they are not for a ~niform time
and the specific capacity is likely to be severely non linear for
different yields. Nevertheless they give a better indication of
aquifer and well performance than the records of yield on eheir own.
The Specific Capacity appears to be very low (mostly less than
0.1 l/sec/mr. The very large drawdowns (often 20 - 40 m during five
hour tests) are thought to largely reflect poor borehole design and , inefficiency as well as the aquifer characteristics.
Multiple rate step tests have been carried out for some of the urban
supply boreholes in Mponela. These show that at lower discharge
rates the incremental drawdown for an increase in pumping rate is
relatively constant or gradually increasing. However at high
pumping rates there is cQffimonly a substantial increase in well
losses and incremental drawdown and a reduction of bore hole efficiency.
Pumping rates should be chosen so that they are less than that where
such a "breakaway situation" arises.

16.
2.2.3. Transmissivity (T)
The fel< aquifer tests v/hich have been carried out are on the boreholes
at Mponela. They are mostly of too short a duration for detailed
analysis and only have limited water. level Measurements taken within
the pumping borehole itself. These are subject to inaccuracies due
to surging of water, fluctuations in discharge rate and well storage
effects at the start of the test. In addition it is suspected that
the weathered zone is largely cased out or lined with screen of very
low open area and the borehole is only open in the hard bedrock below.
The heterogeneity of the material (both vertically and laterally)
will result in variable contribution of f,low from ~i££erent layers
in the aquifer 0 The f:I1i::J.lysis of data should therefore be treated
with caution since the basic assumptions for conventional pumping
test analysis are not satisfied.
The corrections of water, level measurements for dewatering are
difficult to estimate because of the variable contributions from
different layers. Approximately the first ten minutes are affected
by well storage in the pumping borehole, and later data appears to
have a component of delayed gravity storage typical of water table
aquifers so straight line methods of analysis would be misleading.
The data is difficult to match with accuracy to Boulton or
Neuman Log-Log Type Curves because of the shallow gradients, so the
estimates of Transmissivity ate only a guide as to the order of
magnit.ude. '.
Seventy-two hour tests were carried out on boreholes at Mponela in
1980 and the transmissivity appears to range from 5 - to m'/d)
however it must be emphasised that the data is very suspect,' and is
likely to give an estimate of Transmissivity for the underlying
bedrock. Other tests on these boreholes at Mponela were carried out
in 1979 (Howard Humphries) but the tests were too short, at variable
discharge rates and, the analysiS is somewhat suspect,.
The dangers of estimating transmissivity from measurements within
a poorly designed pumping well itself cannot be overstated. It
should be noted that detailed aquifer tests carried out with obser
vation boreholes at Lilongwe Airport (to the south of the Bua
Catchment but likely to b~ typical of the weathered bedrock aquifer
of the plateau) are difficult to analyse, using conventional methods.

17.
This is despite the fact that t,he boreholes were known to be well
designed and with linear specific capacity. The complexities appear
to be due to hydraulic bounderies, aquifer layering and dewatering.
It is likely that there could be considerable variation in transmis
sivity over the plateau area even within short distances, depending
on the nature of the weathered zone and the extent of residual
fracturing which is likely to retain a Significant influence on the
permeability.
2.2.4. Permeability (K)
On the basis that the estimated transmissivity of the weathered
aquifer in the plateau area is 5 - 10 m'/d and that the aquifer
thickness is typically 10 - 20 m, the average permeability is likely
to be in the range 0.3 - 1 m/d. This can only be a rough approxima
tion and the permeability is likely to vary considerably both late
rally and vertically in different layers of the aquifer. Highly
variable water quality over very short distances (see Section 2.5)
suggests low permeabilities.
2.2.5. Storage.Coefficient (S)
Since there have been no aquifer tests with water levels monitored
in observation wells the storage coefficient cannot be easily
determined. For a semi-confined aquifer with a granular, though
often·poorly sorted and clay r~ch matrix, the'storage coefficient
is likely to be in the range of 5 x 10-' to 10-'.
2.3. GROUNDWATER LEVEL FLUCTUATIONS
Groundwater levels have been monitored at three sites within the
Bua Catchment with autographic recorders since 1980 (Figure 5).
These give an indication of the seasonal changes in the volume of
stored groundwater., and with continued measurements the long term
effects of groundwater abstraction can be evaluated.
Observation wells 5E325 X (grid reference WV651849) and SF 153 X
(grid reference WA055180) are sited in on the lower slopes of valleys
and show seasonal fluctuations of 2 - 3 m. The slightly larger
fluctuations of the latter site could reflect lower storage co
efficient of higher recharge at this site, which is near a dambo.

Figure 5~ GROUNOWATER LEVEL FLUCTUATIONS ( seQsonQI)
2 MllllbUIIQSE 32SXCSM 284) .
3 ,
.... --. , ,. I ,I' I
I 10 I , 5 ---- -----
Chimwonikllngo 5 F153)IGK121l
1-[1 '" -",,--. / ir2 , I ,
~-,
lt3 ,.' "11' , ~I:
, "..f\ ----!.R ~- --,. --~ Kotondo Estllte 5ESXlL 158J II -
,
MAY. JUN AUG SEP OCT
1981 1982

18.
Water levels do not begin to rise until two to three months after the
beginning of the rainy season; much of the early rainfall is used to
satisfy large moisture deficits which have built up in the soil and
unsaturated zone during the dry season and little infiltration can
occur until these have been made up. Maximum groundwater levels occur
around March/April, towards the end of the wet season implying that
percolation to the water table is relatively slow. A gradual recession
of water levels follows reaching a minimum bet\~een December and
February. Water levels at these two sites are relatively close to
the ground surface Cl - 5 m) and remain within the semi-confining clays.
The percolation rates will vary temporally with the rainfall occurence.
and intensity, moisture conditions in the unsaturated zone, and
spatially with the nature'of the weathered profile. The possibility
of lateral throughflow along laterite layers could cause considerably
different responses within small distances.
The observation well 5E 5X (grid reference WA 45220'1) is sHed on an
interfluve. The hydrograph shm,'s " ,.,,,,,ti nued rise in groundwater level
Over the monitoring period. One possible explanation for the lack of
seasonal variation is that the direct recharge is minimal at this site
(and possibly over crest sites generally). The gradual rise in water
level ("'er the '11('m'toeing period could be caused by higher than average
rainfall and recharge over the region during che antecedent couple of
years. ·The result could be a baeking up of groundwater with overall
annual discharge being less than the recharge. Also c~nges in land
use in the surrounding area, from woodland Or smallholder farms to
tobacco estates, may have led to reduced evapotranspiration and better
structured soils thereby increasing recharge. The effect coold have
been transferred upslope causing the general rise in.groundwater levels
seen at the recorder site. This is only a tt>nta f:h,,, explanation and
further investigation is necessary.
It would be desirable to install a series of piezomaters across an
interfluve and into a dambo to monitor grourtdwater levels and thus further
understanding of the spatial variability of recharge and local patterns of
groundwater movement.
19.
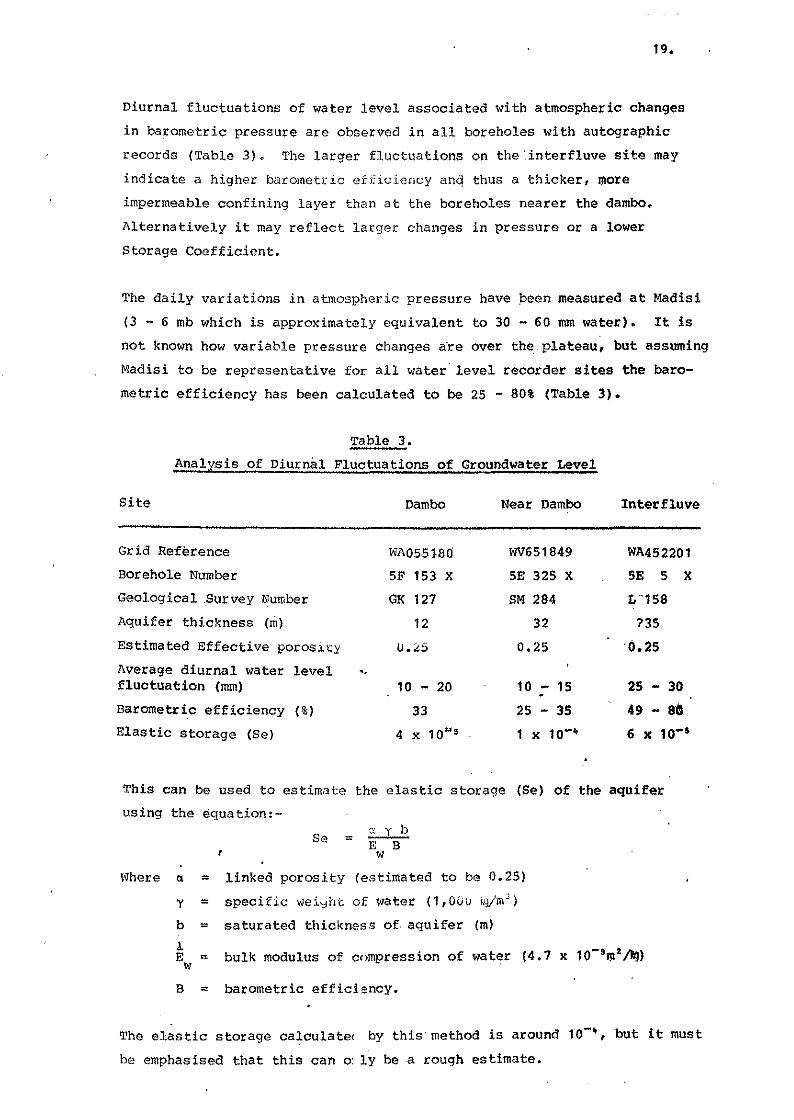
Diurnal fluctuations of water level associated with atmospheric changes
in barometric pressure are observed in all boreholes with autographic
records (Table 3). The larger fluctuations on the ',interfluve site may
indicate a higher barometric efficiency anq thus a thicker, more
impermeable confining layer than at the boreholes nearer the dambc.
Alternatively it may reflect larger changes in pressure or a lower
Storage Coefficient.
The daily variations in atmospheric pressure have peen measured at Madisi
(3 - 6 mb which is approximately equivalent to 30 - 60 mm water). It is
not known how variable pressure changes a're over the plateau, but assuming
Madisi to be representative for all water level recorder sites the baro
metric efficiency has been calculated to be 25 - 80% (Table 3).
Table 3.
Analysis of Diurnal Fluctuations of Groundwater Level
Site
Grid Reference
Borehole Number
Geological ,Survey Number
Aquifer thickness (rn)
Estimated Effective porosicY
Average diurnal water level fluctuation (mm)
Barometric efficiency (%)
Elastic storage (Se)
"
Dambc
WA05518(j
5F 153 X
GK 127
12
10 - 20
33
4 x 10~·
Near Dambc
WV651849
SE 325 X
SM 284
32
0.25
10 - 15
25 - 35
1 x 10--
Interfluve
WA452201
5E 5 X
L-158
?35
O.2S
2S - 30
49 - 8" 6 x 10-0
This can be used to estimate the elastic storage (Se) of the aquifer
using the equation,-
l'1here Cl =
y =
b =
l E = w
, Se = " y b E B w
linked porosity (estimated to be 0.25)
specific weiyht of water (1,00v kg/m')
saturated thickness of, aquifer (m)
bulk modulus of compression of water (4.7 x 10⁻⁹m2 /"l)
B = barometric efficiency.
The elastic storage calculate( by this'method is around 10-', but it must
be emphasised that this can 0: 1y be a rough estimate.

Figure 6: GROUNOYJATER LEVELS FROM
.. After Chilton (1979)
BOREHOLE MAINTENANCE RECORDS
OOREHOLE GEOLOGICAL NUMB£II SURVEY depths in metres below ground level
SE 27
5E47
5E41
5F3
5080
508
5E6
5031
NUMBE~~ ________________________________________ -r ____ ~ ______________ ~
([154)
(W1541
('11241
5
10
5
10
15 0
5
10
10--...... --- , ..... -----... --__ __.4----------- ...... ------.-_. ___ -:-4'- -, ....... -----.-----..----- - .----. --\ .... -- \ 1'-------\ ..--------.::0_-- 0--- _*_ __ ..... ..... _0
.. ..... f" ---------~-------" , , , '01
.. ___ -... __ - ---·0 ... ---- .... - \ .,..------ ........ ...,.:.-,-------------.~-_--0_._______ --..... __ ---.
~o 0.------"--./)'\ P'>... /.----,~----------.-- -----\ I ..... - ,/- --. -..... ~,,/ \. J -_ '
\ 1 -__ ,," (W231 15 \/ - ~ .. .....- ........... /
(0.2191 15 2()'
,,--- . ......... ___ ---~------..... ;" -- ..... ~---__ ~" ---0-_____ ~ • __ -04-'"
5 (K65) 10
15
c..-- --_.
~ ---'..... _--....----0-" ---.o"'1I!! _---, -.--- ... - _ .... --- -- ...... ----------... -------" ---- ........
(H07) 5 ... ---"-- .-------l.._ ... __ ,/ -__ _0 __
1()."'·------ JI--........ ---..... -- ./ -.-----.--- ----- __ e
1 -----" .. -0--_-0"
fE110) 10 1"11:- -------- -_ -0 _______ -- ---0-- --0--- -- -0- -0-- -0_ l;;r ,~~- --__ -..
1971 1972 1973 1974 1975 1976 1977 1978 ' 1979 1980 1981

20.
It is considered thllt the surface clays are only semi-conffning and
that there must be some component of gravity drainage with the decline
of groundwater levels. Thus the determination of Se canno): be used
to approximate the Storage Coefficient (S) which could r~alistical1y
be in the range of 5 x 10-' to 10- 2 where the water level remains
within' the clays. Thus at SE 325 X and SF 153 X, the seasonal water
level fluctuations of 2.5 to 3.5 m [including an extrapolation of dry
season recession rates (Figure 6)) could result from annual recharge
ranging from 13 mm to 35 mm. The Storage coefficient is only crudely
estimated so the recharge cannot be determined with any greater
precision. If the groundwater level falls, below the confining clays
there will be increased yield as the aquifer passes from semi
confined to water-table conditions; the storage coefficient will
thus vary temporally and this method of determining recharge cannot
be used with any confidence.
Groundwater levels have been measured in boreholes by Borehole
Maintenance Units since 1971 but readings are irregular as they lire
only taken when handpumps are removed Ilnd in addition many of the
measurements are suspect. They do'however show that in general the
piezometric levels (liS shown by water levels in boreholes) over the
platellu are relatively close to the ground surface, being commonly
shallowest towards the dambos, in the range of 2 - 10 m. Boreholes
with the most frequent records (Figure 6) show that there is no evidenae of dealing water levels. over the period 1971 - 1981 despite
an increase in abstraction, and there is no suggestion- of aquifer
depletion.
Piezometric measurements suggest that seasonal fluctuations.'of water
level in the alluvial material at Bua Point ar,!! in the order of 0.5
- 1 m but the record is only of six months duration. A longer period
of data collection is required before any analysis to determin!! the , Storage Coefficient. can be made.
2.4. GROUNDWATER MOVEMENT
A generalised form of the regional piezometric surface has been ob~
tained using estimates of minimum qroundwater levels for the plateau
area (Figure 7). Groundwater flow is generally radially towards the
basin centre with discharge to the Bua River and its tributaries and
with an outflow to the North East. There are insufficient data

21.
points to aonetruct more detailed groundwater level contours but it
is likely that on a small scale they are much more ,crenulated with
localised flow routes to the dambo headwaters.
TO the south-west of the Mchinji Ridge the groundwater flow is
structurally controlled by the upland rising from the plains.
Groundwater flow in the upper valley of the Bua River is along the
edge of the ridge as far as Mchinji Town then it is diverted to the
east onto the main plateau area.
The average regional hydraulic gradient appears to be extremely low
(0.001 - 0.005) especially upstream of the conf1uence'of the Bua and
Rusa Rivers, and on a local scale will be considerably lower where
the flow routes towards the dambos are very tortuous,
gradient increases towards the escarpment (approaching
The hydraulic
0.01) where
the slope of the ground surface increases, ,the plateau is more
dissected and there is a smaller percentage of area covered by dambos,
for example in the Kasingadzi and Mtiti catchments.
A flow net analysis has been attempted using the equation:-
Q .. nf T h where
Q ., discharge
nf .. number of flow tubes
T .. transmissivity -, h .. water level contour interval
Using an estimated transmissivity of 10 m'/d and a contour interval
of 50 m the groundwater discharge from the catchment to the ,gauge at •
5D I in 40 flow tubes is estimated to be 7.3 x 10' m·/yr. This would
represent an average of 0.8 mm recharge over the catchment (9410 km') which is considered to be a large underestimate for the reasons which
follow. ,
This method is clearly inappropriate for calculating the groundwater
discharge from catchments on the plateau and the analysis could be
very misleading. This is largely because it is possible that there
is significant evaporation of groundwater discharged into the dambos
(see Section 3.5). Also although a generalised contour map of
piezometric form can be drawn because the slope of the ground/surface
is so gentle, the water level data is insdequate to draw sufficiently

o ,
FIGURE 7; MAP TO SHOW PIEZONETRIC FORM
",
...... ,,' ,~;j..';'o-, ', ..
10 2.01<", ,
" .....
(/ at; ,
.'\ .... " 0°
~ , 0'
... ,~ . , 0°
,'I' ,
~: : ,: $' " , , " .p
", .' " : ~ " ~,'"
, ,,' <\~Zl' : .. " . .
: " "
: "
.. ,1150 .. , pie'Zomcl;y,c. -iO~ ...... line rne.tn?s ",loo"", c:I"bJ,.,."
05E.5)< si!:.e.. of a....t."'~ .... p"'ic. wa.le..- le~\ re<».-c>le.r

22.
detailed contours for meaningful flow net analysis. On a local scale
the direction of groundwater movement is likely to be very variable,
with flow towards, and discharge along, each dambo tributary. Thus
it is likely that considerably too few flow tubes have been considered.
In addition the estimated transmissivity of the weathered basement
aquifer could be in error, although this is difficult to quantify.
Detailed monitoring of piezometric levels over a single interfluve
would allow a better calculation ·of groundwater flow through the
aquifer to>lards a dambo area and could be extrapolated to cover larger
simila.r areas.
Using the equation
O· = TiW where
Q = discharge
T = transmissivity
i = hydraulic gradient
W " width
a consideration of the maximum expected hydraulic gradient (0.01)
together with a maximum transmissivity (10 mO/d) would give a maximum
annual groundwater discharge of 36,600 m' through a one kilometre
wide section of the aquifer. In the long run, the annual groundwater
discharge will be balanced by recharge over the area; This assumes
that there is no evaporativG loss directly from the water tabl~ because
of th~ semi-confined nature of ~he aquifer, and that downward leakage
into the bedrock beneath is neglib~ble. The surface ~ater drainage
pattern is such that the lateral separation between the interfluve
crest and the dambo margin is commonly about one kilometre. The
implied maximum recharge over the area or 1 km' is thus 37 mm.
2.5. GROUNDWATER CHEMISTRY
The existing 6ata 9n groundwater quality is, ·for the most part, major
element chemical analyses (some only partial· analYses) carried out
by the Geological Survey during the 1970's. This archive is considered
to provide a useful indication of water quality, but it cannot be
taken as completely reliable. This is evident as the ion balance is
often poor, frequently greater than 5%. Caution must be t;aken in.
interpreting the analyses as the samples were probably collected
without filt.ration, unstable parameters (pH and bicarbonate) were not
measured in the field, Some of the analytical techniques may not be

23.
reliable and sampling/storage conditions are likely to have been poor.
Nevertheless the records are valuable in the absence of any other
analyses.
The Department of Lands valuation and water are now constructing a
water quality laboratory with facilities to make more accurate and
reliable water anlayses. As yet sampling in the Bua Catchment has
been restricted mainly to a small area near Madisi.
Electrical conductivity (EC) of groundwater has been measured in
samples from many boreholesl this gives ,an indication of total
mineralisation of groundwater over the plateau area: The EC is
generally very low, usually less than 1,000 ~S/cm and commonly below
500 ~S/cm. This indicates that the weathered zone is highly leached
of soluble minerals and that the groundwater is likely to be derived
from relatively recent recharge. In units SE and SF the EC is
generally in the range 100 - 600 ~S/cm. The groundwater quality is
generally slightly more mineralised in unit 50 with higher average
concentrations of ions and locally BC greater than 3,000 ~S/cm,
which could be a function of the thinner, less leached zone of
weathering. It is suspected that there is quality layering within
the aqu ifer •
The water quality can be very variable even over short distanCes.
For example a survey in part at the Powa West· Agricultural Project
Area showed saline water with EC approaching 4,000 ~S/cm at Madisi
with fresh water (EC < 1,000 ~S/cm only one kilometre away (Figure 8).
There appear to be some areas where the water quality is worse regard
less of whether the water comes from a borehole, dug well br surface
water source, for example along the Chawawa Dambo. It is clear that
there can also be considerable variation in conductivity at different
water points within one village. This is evidence of low aquifer
permeabilitil!s an4 slow groundwater movement. The EC of water in
the Lithembwe and Nkalalo Rivers is high (greater than 1,000 ~S/cm),
however nearby protec.ted water sources appear to be less mineralised.
The groundwater is classified predominantly as calcium (Ca) - bicar
bonate (HCO,) (Table 4 and Figure 9) although there are cases where
magnesium (Mg) and/or sodium (Na) are the dominant cations and in
some areas there are frequently high concentrations of sulphate (SO,).

Figure ~:J ELECTRICAL CONDUCTIVITY SURVEY IN MADISI AREA
KEY
o Borehole v Open dug well
a Protected dug well
A Stream river dam 350 Electrical conductivity (y sIc m)
o 1 2 3 4 5 Km • ! , , ••
MPONELA

24.
The distinctive hydrochemical facies and generally very low minera
lisation is thought to be the result of silicate alteration reactions
as recharge water moves through the weathered zone. The pH measure
ments in the old records are unreliable since they are not field
measurements and samples are likely to have 'been stored for sometime.
The few more reliable measurements show that the groundwater is
usually slightly acid (pH 5 - 7/'.
The dominance of the HCO, ion (mainly in the range 100 - 500 mg/l)
suggests that the infiltration is recent and that the water quality
is controlled by solution processes in the, soil and weathered profile.
TABLE 4.
Typical Water Quality of Groundwater in the Plateau Area
Electrical conductivity (EC)
Total Oisolved solids (TDS)
calcium (Ca)
Magnesium (Mg)
Sodium (Na)
Potassium (R)
Total Iron (Fe)
Bicarbonate (HCO, l
Sulphate (SO.)
Chlor ide (Cl)
Nitrate (NO,-N)
Fl.uor ide (F)
'.
100 ~ 1,000 pS/cm
60 - 600 mg/l
10 - 100 mg/l
5 - 25 mg/l
5 - 70 mg/l
1 - 6 mg/l
1 - 5 mg/l
100 - 500 mg/l
5 - 1000 mg/l
< 20 mg/l
< 1 mg/l
< 1 mg/l
Sulphate (SO.) levels are generally low (less than 20 mg/l).'although
there are some local areas with very high levels (greater than 1,000 mg/ll,'
It is thought that in those areas where relatively high concentration~
of SO,occur in groundwater these are produced by a progressive , oxidation of sulphl:de-rich parent material (Bath, .1980). In the
Dowa West Agricultural Project area, in Unit 50, high SO. concentrations
appear to be linked with the occurrence of high Mg and ca concentrations.
In Units 5E and 5Fthere appears to be high total iron (Fe) associated
with high SO. levels, some of which could have ~en released into
solution by the acidic conditions produced by sulphide oxidation .
although this is not seen in Unit 50.

25.
concentrations of Fe are very variable but high levels are widespread,
commonly up to 5 mg/l,\whiCh is far in excess of the WHO advised limit
of 0.1 mg/l and maximum permissible limit of 1 mg/l. This leads to
problems of acceptability of water because of the bitter taste and
discolouration of laundry and food. It must be noted that the Geological c
Survey records are for total Fe (i.e. dissolved and colloidal) as the
samples were not filtered. However measurements on both filtered and
unfiltered samples taken in the Lilongwe Plain to the South of the Bua
Catchment suggest that Fe is initially present as soluble complexes and
subsequently precipitates out due to oxidation after, prolonged standing
or boiling (Bath, 1980) • The iron is most likely to be derived from
ferromagnesian minerals during weathering and the presence of organic
fulvic acids may result in the ccmplexing and increased mobilisation of
Fe. Corrosion of borehole casing, pump or rising main by acidic ground
water may also contribute to the iron problem. This corrosion is
commonly encountered, and can result in the need to replace rods and
pipes as often as every couple of years. The causes of high iron
concentrations and their apparently random occurrence are not yet
fully understood.
Chloride concentrations are relatively low (mostly 20 mg/l), concen
trations in rainfall are being determined in order to estimate the
recha]:ge from their relative c •. l concentrations.
The low chloride levels together with the generally low nitrate'
(NO,-N) concentrations (mostly < 1 mg/l) indicate that groundwater
pollution is usually minimal. It is likely that the surface clays
offer considerable protection to the aquifer from surface contamination
derived from sewage and/or fertilisers by absorbing NH.. In water
logged clays conditions are likely to be anaerobic, thus nitrification
would not ocbur. There are a few sites where there may be a pollution
risk, which is most likely to occur from the surface where the bore
hole surrounds are poorly constr)lcted or maintained.
Calcium (mainly 10 - 100 mg/l), magnesium (5 - 2S mg/l) and sodium
(5 - 70 mg/l) all show considerable scatter but'the Ca ion is most
often the dominant cation. This may reflect the variation in
weatherable minerals in the basement complex and also the possibility

26.
of some cation exchange on clay surfaces. Potassium concentrations
are low (1 - 6 mg/l) as are fluoride concentrations (less than 1 mg/l).
The trilinear plot of bydroc)wllliGtL'y for Unit 5D ("'igure 9.A) shows
that there is considerable variation in the' composition of the water
quality. Ca is often but always the dominant anion. The position
of the samples on the "diamond field" of the trili,near plot show
that carbonate harness is dominant (i.e. weak acids and alkali earths
are the main controls) >lhere the TDS are low, and non carbonate
hardness is considerably more in high SO, water (strong acids) which
tend to have higher TDS. The trilinear Pfot of anions for Unit SE
(Figure 9.B) also sho>ls scatter'which appears to be mainly related, to
the occurrence of occasional sulphide rich parent material. Where
these are present, SO, concentrations are relatively high and tend
to dominate the anions. The proportion of ReO, is then corres
pondingly reduced although the actual Heo, concentrations are not
always lower. The overall mineralisation of these water samples
appears to be greater than those from other sites within Unit SE.
The trilinear cation plot sho"m considerable variability in ground
water type. This would appear to be related to the underlying bed
rock minerology which controls the ions that are available for
leaching, rather than any progressive evolution of groundwater types
across the ;'cater resource unit. The position of the samples from
SE on the "diamond field" of the trilinear plot show that alkali
earths are dominant: The twe.of hardness var,ies depending on whether
weak acids or strong acids are the, main control (carbonate hardness
resulting from the former and non carbonate hardness from the latter).
The generally low mineralisation of groundwater on the pla~au area
renders it perfectly potable in most cases. There,are, however,
small localised areas wnHe the conducti vi tv is too high (> 3 ,000 ~S/cm)
for domestic consumption. The only other drawback for domestic use is
the occurrenc~ of l;1igh Fe in SOme sources f there is no danger on
grounds of health but the wo,ter may be rejec",ed as unpalatable or
because of the staining it causes', resulting in the return to
traditional and more polluted water 'sources. The water would appear
to be suitable for irrigation, although minor element concentrations
are not known, but the yields which could be supplied are ,small.

Figure 9A. TRlllNEAR PLOT OF HYOROCHEMISTRY 1
UNIT SO (after Bath J 1980)
Ca

___ -_'0 .... (a
Figure 96 TRILlNEAR PLOT OF HYDROCHEMISTRY UNIT 5 E (after Bath, 1980)
(1 + NO~

27.
The groundwater quality in the Bua lakeshore plain is largely unknown,
but in adjacent lakeshore areas the electrical conductivity is higher
(commonly over 1,000 ~S/crn) especially nearest to the escarpment.

28.
3. CATCHMENT WATER BALANCE ANO GROUNOWATER RESOURCE EVALUATION
3.1. RAINFALL
Long-term measurements of rainfall have been made at several sites.
Using area weightings for the Thiessen polygons (Figure 10), average
annual rainfall over the plateau
50 1 and 50 2 has been estimated
to the river gauqing
{Tables 7B and 7C).
stations at
This can only
be an approximation at best because of the uneven distribution of
rainfall stations over the catchment. There are no long term rep
resentative rainfall measurements in the RUBa Catchment to the north
west, although this is suspected to have relatively low rainfall OVer
the plains. and the uplands of the Mchinji Ridge can receive rainfall
throughout the year. Rainfall is generally intermittant at the
beginning of the wet season with storms becoming more frequent and
heavier in January with rainfall intensities of over 20 mm/day being
quite common. Storms then decrease in number and intensity towards
the end of March (figure 5). There is very large spatial variability
in torpical·storms even over short distances but the annual total
rainfall at any site is suspected to be reasonably representative of
the local area.
3.2. EVAPORATION AND TRANSPIRATION
Measurement or estimation of evaporation and transpiration is commonly
subject; to large error margins which is particularly Significant in
the tropics where this is a relatively large factor in-the water
balance. There is no long term data for any stations within the
Bua Catchment.
Open water pan evaporation measurements are available from 1951 for
Lilongwe in the Linthipe Catchment to the south. This is the most
representative station for the. plateau although rainfall is sig-, . . nificantly lower. Estimates of open water evaporation (Eo) have also
been made using the empirical Penman method for Lilongwe from 1972/73
- 1977/78 (Table 5). These are· significantly lower (Pan factor of 0.9)
which confirms the generally accepted fact that pan evaporation
measurements are overestimates. Both of these estimates of open
water evaporation are well in excess of precipitation
much greater than average actual evapotranspiration.
evapotranspiration (Et) has also been estimated using
and are obviously
Potential
the Penman

Figure 10: THIESSEN POLYGONS FOR ESTIMATING TOTAL CATCHMENT RAINFALL
, " " " " "
A Streclm gauging station
lit .. KASIYA ( 944)
I(ASUNGU
(i) Rainfall stations with mean o.nnLlal ruinfall (1959160-197415) ( 884) ""-, /' \ Thiessen polygon
,/ lI. / \ /'
v

29.
met:lOd "for a short green crop with no shortage of water". The Et
rat',s vary from 2.0 mm/d in June to 5.5 mm/d in October. The method
of ',omputation of Penman estimates is satisfactory but the empirical
rel.,tionship used to estimate radiation from the number of hours of
sun:;hine (Glover and McCulloch, 1958) may not be totally reliable.
Act' .• al evapotranspiration will be less than potential wherever large
soil moisture deficits build up, but no measurements have been made.
Datd for Nkhotakota is representative of the lakeshore.
In:he dambo areas it is possible that water will continue to be lost
to .. he atmosphere for most of the year at ~east at the potential rate.
The:'e is a general presumption that evapotranspiration from dambo
veg •. 'tation is much greater than evaporation from a free water surface
of ':he same size. Actual evapotranspiration measurements from a dambo
wer,- shown to be higher than potential in the rainy season and much
reduced in the dry season· (Ba1ek, 1977). It is clear that there must
be considerable spatial variation of evapotranspiration over short
dis·cances.
Lil,ongwe
Nkho)takota
Table 5
Estimates of Evaporation and Transpiration
Water Year
1972/73
1973/74
1974/75
1975/76
1976/77
1977/78
Mean
1972/73
1973/74
1974/75
1975/76
1976/77
1977/78
Mean
Rainfall (mm)
600
1,090
900
900
1,150
780
903
1,800
1,790
1,350
1,980
1,340
2,060
1,720
-,
Pan EVdporation {mm)
2,000
1,800
1,890
1,850
1,880
1,882
2,060
2,460
2,280
2,500
2,325
E (Penman) o (mm)
1,850
1,530
1,640
1.650.
1,700
1,560
1,655
2,080
1,820
1,900
1,910
1 ,950
1,820
1,913
Et (Penman) (mm)
(potential)
1,440
1,170
1,270
1,270
1,320
1,200
1,278
1,650
1,420
1,500
1,500
1,540
1,410
1,503

JO.
The Morton method (1978) of estimating actual evapotranspiration from
observations of temperature, .humidity and sunshine was used for data
from Lilong>le by Chilton (1979). Estimates for the period 1965/66 -
1974/75 .were, shown to be outside the 10% accuracy limits for the method,
in excess of the preoipitation and clearly too high.
It is felt that the most reliable eaSily obtained estimate of average
actual evapotranspiration for the plateaU area as a whole might be
obtained by subtracting the total runoff from the rainfall (Section 3.5
and Tables and 6 and 7) despite the errors involved in determining both
these parameters. The method also assumes .that there are no changes
in groundwater storage from year to year and that underflow from
catchment in the weathered basement aquifer or deep percolation through
fractures in the bedrock i.s negligible.
Estimates of actual Et rates for dambo andinterfluve areas* have been
made based on the calculation of Penman potential Et for Lilongwe
(Table 6A - 6C), resulting in an average of 779 mm over the whole
catchment.
In the darnbo areas the actual Et is considered to be 120% of potential
during the wet season (once any moisture deficits have been made up)
because of the inte~c'='!pt:!'("'In ll"\f?'e:~~ from the grasses and direct evapo
ration from the ,Slow moving surface run off. Field observationS of
dambo vegetation and soil moisut~e conditions from aeriel photos and
satellite images taken during the d~yseason suggest that active
evapotranspiration continues and actual Et does not reduce as much
as observed by Balek and Perry (1973) for wooded dambo catchments in
Zambia. A reduction to 50% of potential Et by the end of th~ dry
season is considered appropriate. The figures .are v,ery generalised
and in practise concEdo"" ·"il1 vary cor.siderably over the catchment
dependin9 on factors such .as antecendent moisture conditions, rainfall
intenSity and ~uratton, relative humidity, temperature and vegetation
type.
Estimates of average actual Et losses·have.also been made for the
interfluves area (Table 6B and 6C). The overall losses are considered
to be much less than those observed by Balek and Perry (1973) for the
wooded catchments (where the deep tree roots and permanent vegetation
mmmi!liilm!1!Hm!H!l!ll!m!mm!mHlmii!HHHj~!!!m!!imH~i!jlm!lmWn!!lmfmmHlmmHm"!!mmHHl!!!fmmm1l!!mm!1!IH!mmlHlmmmmmmmmi!r
* Helpful discussions on eva~otranspiration rates were held with W. Stephens from I<asinthula Agricultural Research Station, Chikwawa

31.
ensure active transpiration throughout the year, possibly directly
tapping groundlrater. The greater p<3rt of the plateau area of the Bua
catchment is cultivated. Average actual Et from the cropped and fallow
aroas n2'!$ ~:::~~ -::.c;t{mtd~c:1 using a root constant of 140 mm and a limiting
soil mixture d,~ficit of '{SO mm (Table 6B)" 'fhe figures show that
actual Et quickly deops belmr potential after rainfall ceases, and the
limiting soil moisture defici t8 result in very low actual Et by the
crop harvesting ti.me in June. Further evaporative losses from the
fallot< land and the bare soil are small and drop to zero by the end
of the dry season.
This overall drop :i.n ?<,tual Et over the catchment is confirmed by
measurements of relative humidity (tal,en at 1400 hours at Lilongwe
Airport d.\lring 1981 and .1982). These ShOlv a mean monthly figure of
73% in January and fall. to mean monthly figure of 39% relative humidity
in September. The mositure in the air in September is probably derived
from evapotranspiration in the dambo areas. The drop in actual Et
rates during the dry season has been observed for various crop types
in Kenya (Edwards, 1979).
The proportion of the catchment of permanent trees is taken as 5%.
There is a greater leaf area for interception than on cultivated '"
vegetation or dambo grasses, so that once moisture deficits are made
up, .which will tc,;:0 :O.1S::".>t' \ .. >:..<',: :L".:- t:.::_ c;t:nG::" v~set~tion types, actual
Et is taken to occur at a rate greater than potential (up to 12!;%)~
Average· actual Et during the dr~.season has been estimatea using a
root constant of 2()O 1,"" ".1<,1 a limiting soil moisture deficit of 230 mm
(Table GC). It can be s(.en that Et. rates do not fall off as rapidly
as for the cultivated areas and that some moisutre continues to be
lost to the atmosphere right until the end of the dry season:
There have been [j,V ih::lu l1k:a;;::"w.i..:ements vi:: acc.ucll Et: nor soil moisture
deficits and the figures pre'sented in Tables 6A - 6C can only give a
generalised id~a of .possible catchment conditions. It is realised
that there will be conswerab.Le variation on a local scale depending
on the crop type, date of planting, climatic conditions and antecedent
soil moisture status. ~'he meteorological conditions (rainfall inten
sity and duration) I~ill be particularly important in the early wet
season when moisture deficits are being restored. On the i·nterfluves
the deficits will take longer to satisfy than in the dambo areas so
maximum Et rates will be achieved later •.

Table 6A Estimates of Actual Evapotranspiration, Dambo Area
Month Potential Estimated Actual Estimated Actively Estimated Actual Et Estimated l-,ctual Et Et (mm) Et as % of Potential Actual Et Transpiring from surface RO from baseflow
(mm) dambo areas as (mill over oatchment) (mm over c<,tchment) ,% of catchment
Jan 110 120 132 20 26
Feb 85 120 102 20 21
March 95 120 114 20 23
April 90 110 99 20 20
May 95 100 95 19 18
June 75 90 ! 68 18 12
July- 75 80 60 17 10
Aug 110 70 77 16· 12
Sept 135 60 81 15 12
Dct 155 50 78 15 12
Nov 150 80 120 17 20
Dec 110 100 110 20 22 -Total 1285 1136 130 78

Table GB : Estimates of Actual Evapotranspiration, Interfluve Area (Cropped and Fallow Area.
Month
Jan
Feb
March
April
May
June
July
Aug
Sept
OCt
Nov
Dec
Total
Rainfall (mu)
224
212
120
63
14
0
0
0
0
9
58
206
904
Potential Et Estimated Actual (mm) Et as % of Potential
110 100
85 120
95 120
90 , 100
95 100
75 82
75 13
110 6
135 2
155 0
150 0
110 100
-. -1285
* Limiting SMO 2 190 mm
RC = Root constant
Estimated Actual Et*· RC = 140 mm
(mm)
110
102
114
90
95
62
10
7
3
0
0
110
703
Interfluve Area as% of catcliinent
75
75
75
75
76 -
77
78
79
80
80
78
75
Estimated Actual Et (nml over
catchment
83
77
86
68
72
48
8
6
2
0
0
83
533
... w •

Table 6e Estimates of Actual EvaE2transpiration, Interfluve Trees
~lonth
Jan
Feb
March
April
May
June
July
Aug
Sept
Oct
Nov
Dec
. Total
Rainfall (mm)
'224
212
120
63
14
0
0
0
0
9
58
206
904
Potential Et (mml
110
85
95
90
95
75
75
110
135
155
150
110
1285 ..
* Limiting SMD = 230 mm
RC = root constant
t
Estimated Actual Et as % of Potential·
105
125
125
105
100
100
43
8
3
1
1
100
Estimated Actual Et* RC = 200 mm
(mm>
115
106
114
95
95
75
32
9
4
2
1
110
763
Interfluve Area as %of catchment
5
5
5
5
5
5
5
5
5
5
5
5
Estimated Actual Et (mm over catchment)
5.7
5 .. 3
5.9
4.8
4.8
3.7
1.6
0.5
0.2
0.1
0.1
5.5
38.2
w .... •

3.3. SURFACE HYDROLOGY
There are nine streamflow stations in the Bua Catchment where the
river and its tributaries are currently gauged (Figure 1).
35.
Resource Units 5D, SE and 5F ,3re drained principally by dambos developed
on the shield surface. The dambo land form is very delicately balanced
and there is a complex interrelationship of climate, soils, vegetation
and base level of erosion. The dambo character varies with small changes
in any of these controlling factors. For example where dykes of more
resistant rock type crop out the valley slopes are steeper, the dambo
cross-sectional area is reduced and as a result the flow velocity is
higher and a more defincd or evcn incisecl channel may occur. Balek and
Perry (1973) give a generalised consideration of dambo form and evolution.
The genesis of dambo landforms is complex and further study of the effect
of climatic conditions, landform evolution and anthropogenic influence
is required. Agnew (1971) argues that the recent stripping of vegetation
for cultivation which had been present on the plateau for most of the
Quaternary is likely to result in major changes to the hydrological cycle.
It is possible that the transpiration and surface protection will have
been reduced significantly and as a result runoff and erosion increased •.
This could lead to incision of well defined channels, faster flow and
possibly drainage of some dambos. Incision of some dambos is also
occurring towards the rift valley escarpment where rejuvenation is taking
place due to tilting or upwarp (Agnew, 1971), and the dambo form appears
to be very unstable. The complexity of the nature and ~haviour of . ~.
dambos is not yet well understood and a detailed study of their hydrology
and interrelationships with groundwater is required.
The dambo hydrographs often have a very distinctive "square.iI shape
(Figure 11) especially where the catchments are large. The rising
limb is very· st""p., "ossiblv because early rai)')fall over the large
area of the dambo (20 % of the land area for much of the Bua catchment)'
and limited idfilt~ation into the dambo clays (due to their low
permeability and negligible storage) resu]c':s in a 'steady and fairly
rapid flow build up at the gauge., The size of the catchment acts .to
"buffer" the peaks of irregular rainfall and isolated storms and this
together with the dampening effect of dambo vegetation and gentle
slopes retarding overland flow results in a flattened hydrpgraph
with none of the peakiness that o0ulcl be expected, and is obtained
in catchments with few dambos. It is possible that there is temporary

Figure 11:
125
..,. v
'" £ 75 S '-' 0)
e' So
~ 2.S ~
0
\00
RIVER HYOROGRAPH
... ,. ".~;
STATION 501 1964/65
A Separotions on normal scale'·
- i.cttAI cli~5e n~~ ____ 9(()IA.VI(:\WG.\:e;r cl.i~e I-\~d->'O~ ~ 1:>000~\oW s~()'"'
.. ...... h~0!3~ of .f,ve ~ Mi"i""",
-.-.-~ ¥~og"',¥h
~ ----1---."' ---- ----." ----- -----
I I \
B Semi-log base flow separation
i \0 __________________ L ________________ -=-_
- ---~
t "6 0·\ r-----.J
No" .la" Feb
1%5

36.
bank storage of water in the dambo clays during the rains. Following
the end of the wet seaSon the temperature is high, relative humidity
falls and the high evapotranspiration over the large dambe area results
in a sudden decrease in flow rate, as the dambe drains. Low flows
are maintained in the dambo for a period of several months with
seepage occurring around all dambo headwaters, probably sustained by
groundwater discharge, although it is possible that some of the base flow
is from inter flow and temporally perched water tables. Subsu'rface' flow
towards the valleys is maintained throughout the year which ensures that
large moisture deficits do not build up in the dambe area. However the',
contribution to surface runoff is considerably reduced by high evapotrans
piration and eventually river flow ceaseS. This is only a tentative
explanation of processes controlling dambe hydrograph form, and their
behaviour is not fully understood (Grey, 1980).
Discrete groundwater discharge points in the dambe areas may be marked
by 'salt licks' where animals are attracted by the salts which have
precipitated on evaporation of groundwater. Seepage lines are commonly
marked by a line of termitaria parallel to the edge of the dambes, as
termites like to be able to reach water but avoid waterlogged conditions. '
As groundwater levels rise, seepage is thought to occur through fossil
termitaria, which,may have punctured confining clay layers. Discharge
may occur along the top of lated te ZO,','::8 where these have temporarily
perched groundwater 1 these ar,e generally associated with fluct'uaUons of
water level but some fossillate!:ites maybe found higher on the interfluves.
Stream hydrographs from smaller catchments tend to show more flashy
responses to rainfall because there is less dambe area for temporary
ret.ention of the water. Hydrographs are also flashier near the
uplands, where the slopes are steeper and dambes comprise a smaller
proportion of' the catchment area. This, occurs in the Mtiti catchment
(gauge 50 3) which drains part of
waters of the Bua (~E 6 and SE 2)
the Oowa Hills, and also the head
close to the Mchinji Ridge, and the
upper reaches of the Namitete (SE 1) near the Ozalanyama Range. At
all the gauging points there is little or no flow towards the end of
the dry season even near the higher land where rainfall is more
dependable.

37.
The gauge at Chizuma (SC 1) on the lakeshore plain shows a runoff per·
unit area which tends to be proportionately greater than at the plateau
stations. This is due to higher rainfall and possibly lower evapo
transpiration on the escarpment section. The flow can be rather flashy
caused by rapid runoff from the many tributaries in the steep escarpment,
substantial floods occur seasonally but the river may cease to flow in
the dry season so the flow duration curves are very steep.
3.4. SURFACE WATER HYDROGRAPH ANALYSIS
The gauge at Chizuma on the lakeshore plain gives a record of the total
runoff from the catchment (Table 7A). There is a wide stable channel
with good natural rock bar control, and a single well-defined rating
curve has been used to estimate discharge from stage measurements.
Since there will be little groundwater contribution from the steep
slopes of the escarpment detailed analysis of hydrographs has been
restricted to those on the plateau.
Data from the gauging station &t Bua Drift (5D 1) have been analysed
since this monitors dambe discharge from the whole of the plateau area.
The station has a control rock bar and the record from 1959 is considered
to be good except for 1970/71 and 1974/75, where total discharge and
low-flow gauge readings are unreliable. The inconsistent rainfall
runoff relationship meantioned by Chilton (1979) is to be expected
,since eimple rainfall-t:unoff m~ls can rarely reflect the complexity
of conditions within the catchment.·
The hydrographs have the distinctive ·square" form "tyPical of large dambo
catchments and the flow-duration curves are very steep as a .consequence
of the very large annual range in discharge rate (Orayton et al, 1980).
Data from the gauging station on the Bua at Kasese (SO 2) have also , been analysed as there is a good rock control for high flows and a
sandy bed for Iml flOl'5, and the whole record' is considered to be
reliable.

38.
Table 7A
Rydrograph Analysis SC 1 (catchment area 10600 km2j
Water Year Average Catchment Total Total Rainfall Ra infal! * (mm) Runoff Runoff minus runoff
(mm) (10"m') (mm)
1959/60 970 35 373 935
1960/61 1,340 68 721 1,272
1961/62 1,310 133 1,412 1,177
1962/63 1,250 143 1,510 1,107
1963/64 1 ,0110 114 1,204 966
1964/65 1,250 82 870 1,168
1965/66 840 48 509 792
1966/67 1,100 46 489 1,054
1967/68 890 18 185 872
1968/69 1,360 B3 882 1,277
1969/70 980 33 349 947
1970/71 1,460 192 2,035 1,268
1971/72 1,150 59 624 1,091
1972/73 1,080 64 675 1,016
1973/74 1,250 158 1,674 1.092
1974(75 1,010 80 849 930 ".
16 Year Mean 1,145 84.8 897.6" 1,060.2
* Estimates as used by Dray ton et al (1980)
Computer-generated hydrographs are available on both arithmetric and semi
logarithmic scales; tnese were used to obtain an estimate of groundwater
discharge. On a semi-l09 plot, the straight line portion of the falling , limb represents the g.round"Jater recession. From a backward extrapolation
of this line to a point just after the total hydrograph peak a continuation
of the falling limb of the groundwater hydrograph can be produced. This
can be replotted on the arithmetic scale and the rising limb drawn in by
eye (Figure 11).
Annual groundwater discharge can be estimated by measuring the area under
the groundwater hydrograph. Rainfall, total runoff (derived from monthly
flow summaries)and groundwater discharge for the catchments to 5D 1 and

39.
5D 2 are shown for the period 1959/60 - 1974/75 in Tables 7B and 7C. The
data is all. expressed in millimetres per unit area of the catchment to
allow a water balance to be made, but it should be recognised that surface
runoff, groundwater discharge, and evapotranspiration will all vary from
area to area within the catchment.
Table 7B
Hydrograph Analysis 5D1 (catchment area 9410 km 2
Water Average Year Catchment
Rainfall (mm)
1959/60 805
1960/61 986
1961/62 1,095
1962/63 1,059
1963/64 805
1964/65 933
1965/66 707
1966/67 850
1967/68 698
1968/69 1,058
1969/70 680
1970/71
1971/72
1972/73
1973/74
1974/75
16 Year
1,100
763
788
1,095
1,039
Mean 904
14 Year Mean (omitting 1970/71 and 1974/75) 880
Total Runoff
(mm)
42
69
153
138
99
71
38
28
8
80
30
171*
67
24
140
52*
75.6
70.5
Total Runoff (10"m')
397
653
1,438
1,299
933
668
353
260
91
757
277
1,608*
631
225
1,325
490*
711
665
Estimated Groundwater
Discharge (mm)
16
11
28
38
12
15
6
2
27
41
'. 23
·6
37
10
17.8
16.8
Groundwater as % -rotal
Runoff (nun)
38
16
18
27
12
21
22
22
24
33
22
24
35
25
26
19
24.0
24.4
<Or iver gauge readings suspected to be unreliable
Rainfall Minus Runoff
(mm)
763
917
942
921
706
862
669
822
690
978
650
929
·696
764
955
987
828
810
Recession Constant
!(
0.911
0.981
0.984
0.984
0.993
0.989
0.982
0.984
0.911
0.972
0.979
0.992
0.975
0.981
0.985
0.984
0.9824
0.9816

40.
Table 7C
Hydrograph 'Analysis 50 2 (catchment area 6790 km')
water Average Total Total Estimated Groundwater Rainfall Recession Year Catchment Runoff Runoff Groundwater as ,% Total minus Constant
Rainfall (mm) (lO'm') Discharge Runoff (mm) Runoff K (mm) (mm) (mm)
1959/60 765 24 164 8 31 741 0.971
1960/61 1,089 61 417 10 16 1,028 0.982
1961/62 1,144 155 1,053 31 20 989 0.984
1962/63 1,149 123 833 32 26 1,026 0.984
1963/64 828 99 669 7 7 729 0.994
1964/65 997 81 549 12 15 9Hi 0.986
1965/66 722 42 288 9 21 680 0.980
1966/67 841 27 184 6 21 814 0.985
1967/68 744 7 48 2 29 737' 0.977
1968/69 1,222 110 750 34 31 1,112 0.976
1969/70 678 36 247 7 20 642 0.974
1970/71 1,023 164 1,113 21 13 859 0.986
1971/72 805 55 375 13 23 750 0.978
1972/73 829 17 114 3 18 812 0.987
1973/74 1,185 158 1,072 34 22 1,027 0.980
1974/75 917 72 492 12 16 845 0.982
16 Year Mean 934 77 523 -.15 20.5 857 0.982
The semi-log hydrographs have been used to estimate the recession constant
(R) for the groundwater component using Barnes equation:-
Log K = Log Qt - Log Qo
t
, Wher'e Qt = discharge at time t
Qo = Ini tial discharge
The recession constants obtained are similar from year to year but relati
vely low for groundwater contributions. This rapid recession of water
levels may indicate that the discharge contribution is from interflow or
perched groundwater. The effect of high evapotranspiration in the dambo
will also have the effect of increasing the rate of recession.

41, ..
Usually about 4 - 6 weeks elapse after rainfall commences before signifi
cant flow occurs in··the dambo. The period of surface flow after the end
of the rains appears to be related to the length of the wet season rather
than the amount of rainfall although t.hIs effect ",ay be masked by other
factors. Usually about one month elapses after rains have ceased before
the drainage from storage on the inundated dambo surfaces is complete,
after which flow is likely to be entirely groundwater.
The total runoff can be broadly related to the annual rainfall over the
catchment, although the latter can only be estimates at best.
Hill and Kidd (1980) derived linear regression equations relating these
variables but using only two or three rainfall stations:-
Annual yield for 50 1 (mm) = 0.27 [Annual Rainfsll (mm) - 584)
Annual yield for 5D 2 (mm) = 0.24 [Annual Rainfall (mm) - 5981
with correlation coefficients of 0.89 and 0.77 respectively. They suggest
that a refined equation taking into account the" increased evaporation
associated with dambos might be more appropriate.
The groundwater component 0;: ~",. :cc,,,," ",,,,,off estimated using the .conven
tional method described, appears to be mainly in the range t5- 30' of
total. flow. The groundwater discharge is variable with a mean oflS mm
and fa mm over the catchments to 50 2 and 501 respectively assuming no
significant Qhahges in gt"ouncl't'7ater ~to!,,~cre~ This ::"e eqUivalent .to ,
approximately 1.5 - 2% of the mean annual rainfall. . ~
These estimates of gr.ound,,'Ja( er. discharge and; ts proportion of surfaoe
runoff are low, and the method of analysis used for theil:' derivatlon
is considered to be too sill':olistic. The very high evapotranspiration
at nearly, or even above, p,)tential rate which OCCUI:'S in the dambo
areas during much of the ye~r is not tak~n into account in the conven
tional ~nal.ysis ">">;0:: :Ch'" . 'y:'ve. It!.s pnsgib!.e :';-.)'0 " significant
proportion of tlhe gr?undwater dis.oharged upstream of the river gauging
station is evaporated 01:' transpired to the atmosphere before :it r.eaches
the gauge because of th" \1( .:y slcvl,river flo,,' ,:atc"s and the large
surface area of the dambo. This effect will be more marked in that
period after the rainy season when runoff is almost entirely ground
water. The groundwater contribution to stream flow observed at the
gauge could thus represent only a residual proportion of the total
groundwater discharge and could give cc" erroneously emall idea of

,
42.
reobarge over the catchment, It should however give some idea of the
millimum recharge, An attempt to obtain an order of magnitude estimate
cd! grounc'{!mt€'t dlsch:-:=90 (and by implication recharge) is made in the
gr.oundwater. ba.lanc;e calculations (Section 3.5).
1
1 :::i;:::~:u::c o:r:::::~::~ ~:::::e~:s (::::1:~:: ::d::~i:~C:~e m:::.::ver
/
1 flow using the mi.nima of successive non-overlapping five day periods.
Where the minima are less than 0.9 times the adjacent points they are
used to construct a hydrograph which for UK catchments seems to provide
a valid estimate of groundwater discharge. However for the catchments to
Sf) 1 2inc1 5D 2 the gi:ounowc:.":t:r discharge est"J .. Hlated by t:his method is con
siderably greater than th'at derived by subjective baseflow separation and
it is likel.y to include much of the water which is temporally stored on
the dambo surface ana released slowly (Figure 11). The average Base Flow
I IndIces of 5D 1 and 5D 2 are 85% and 86% respectively which are considered i I' to be much greater than the groundwater contribution to total flowl this
lY;0thod of analysis is not recommended for dambo catchments in tropical
climates ..
3.5.1. Int.E.9.duc~
Usi.ng hydrological and meterological data an attempt to pt;oduce a water '.
balance can be maae using the general. equation:.
p :;; R j. R + E ± S -± Sg ± SMD s g 1£ s'
l<1here P ~ precipitation
R -s surface runoff .. R ~ grounawater aischarg~ g ,.
r. ,;C ;,J('J; 1 €\?apot:r aris~)l r ,~I !~~ i·:)I'l
S = cniJnge in surface storage s S = change in groundwater storage
9 Sbl:J 'Cl-.", ... ';I';';'· . in soil moistUi.e defioits
Assuming a sufficiently long period of analysis the changes in surface
and qrotmd"ater stor;1lge and soil moisture deficit can be considered to be
negl.igible ana the equation reduces to:-
p =
43.
However it is clear from the preceeding sections that determinations
of ground>later dJ.scharge from hydrograph separation could be, under
estimates of l:'GC!~'{E.o::'0e p.r:.1 that tht:: Sp&t:t:;,.1 ~.r~.t'iation of actual evapo~
transpiration could be considerable. A simplistic consideration of
the water balance would thus be misleading; An attempt to produce
a possible model of dambo hyClt·ology processes (shovm in Figure 12)
and order of magnitude esti.matGs for the components within the
hydrolog~cal cycl.e helve been made (Section 3.5.3).
3.5.2. ~he Oambo M~~
Dur ing the wet S0i:.iSOrl.. t'2cba;:ge from prec,ipi tation occurs to the
weathered basement aquifer OVer parts of the interfluve area of the
catchment, once the soil moisutre deficits have been satisfied.
There may also be scme temporary perching of water, for example on
laterite layers, and interflow towards the valley bottoms.. Evapo~
transpiration occurs at or above the potential rate all over the
catchment becuase of interception on vegetation surfaces. The inter~
ception effect will be greater on trees and shrubs than grass because
the leaf surface area presented is greater" Rapid surface runoff occurs
over the interfluve area because of the high intensity of tropical
storms and the low infiltration capacities of the soil. In the
valley bottoms. the groundwater level is at or near the surface, and
overland flow occurs due to saturated soil conditions (although infil
tration capacities are also low in the damboareas). Baseflow contri
butes' to the total runoff; it..is possible that this is entirely
groundwater discharge but there could also be some component of inter
flow. Evapotranspiration from the dambo area during the wet season
is considered to occur from the surface runoff alone, a~d losses from
baseflo~l are tai<en to be negligible.
After the wet season surface runoff ceases, the storage in the dambo
grasses drains, the discharge rate falls rapidly and dry season flows
are maintain4d by.baseflml. These are affected by evapotranspiration
which has a very significant effect over the 'large dambo area.' Any
observed runoff is therefore only residual baseflow. Eventually the
evaporative'losses keep pace ~/ith the baBeflow discharge so there is
no runoff from the catchment until the following wet season. Actual
evapotranspiration rates are conI) i.d~red to reduce during the dry season
because of the build up of soil moisture deficits. However, they
remain relatively high in the dambo areas where moister conditions

Wet Season Figure 12 DAMBO MODEL
Evapotranspiration from surface runoff at or above potE,nloial rate
Precipitation Evapotranspiration at less than potential rate unti I soil moi s tUre deficits restored
Runoff from catchment .~-I
Dambo Surface runoff Interfluve
isurface runoff plus baseflow) Interflow
ground water discharge
deep groundwater percolation
Dry Season
Evapotranspiration. of baseflow at less than potential rate with build up of soil moisture deficits \ . in clays
Runoff from __ -I catchment
Dambo
. residual baseflm1 ) Interflow
recharge
Evapotranspiration at potentio rate reducing to zero as largl soil moisture deficits build UI
Interfluve
groundwater discharge
deep groundwater percolation ~--------~~--------~----------------~

44.
are maintained by groundwater discharge, and the dambe grasses .emain
green. In the interfluve areas actual evapotranspiration rates reduce
rapidly as, moisture availability falls and the crops ripen. After crop
harvesting, evapor,~ tion fro!:'! the bar~ 805.1 and transpiration from the
remaining scrub vegetation is considered to be much reduced because of
the large soil moisture deficits and negligible active plant growth.
It is poss ibIe that there may be a component of groundwater uridt,r'flow
through' the weathered basement aquifer and/or deep percolation via
fractures in the bedrock.
A water balancH hc{i::) been attempted using the c1ambo model as described
abeve using meteorological and hydrological data typical for the
catchment to the gauging station at 5D 1. This area forms a large
natural geographical unit typified by dambo drainage on the plateau
(see Section 3.5.3).
Aerial photographs and satellite images show the dambe are to be 20%
of the catchment. Ground observations and satellite images taken at
different times of the year show that the area of actively transpiring
green dambo grasses reduces slightly, to perhaps 15% on average by the
end of the dry season. Conditions vary from dambe to dambe depending
on many interrelated factors including the bedrock type, depth of
weathering, soil character, slope vegetation types, climate and lOcal , moistur~ conditions within the dambo.
3.5.3. Catchment Water Balance and Groundwater Resource Evaluation
A water balance has been attempted using hydrological data presented
in Sections 3.1 - 3.4 and a summary is given in Table 8. It'must be
noted that there are errors in estimating each hydrological component
of a water balance I the groundwater discharge estimates should, thus,
be treated with caution as they are a relatively small component which
can easily be iost vithin the margin of error of larger components
(e.g. rainfall, evapot.ronspiration). The i.mbillance of the equation
is therefore acceptable, although it could reflect a component of
groundwater under flow through the wea'thered zone or deep percolation
through fractured bedrock.
The estimates of actual evapotr?M,c.piration are slightly less (779 mm)
than rainfall minus runoff for the catchment (828 mm). This could be due
to an underestimate of actual Et or groundwater underflow as mentioned above 0

Table 8
§.~§!E,Y_C:f. AV$E.0..~..J~X5~L.(),L~\))·aal, f.omR2n~
~!i~:.!-!:_:,,""Ti~I,~'J;:~£.'!~'lfQ~. to 5D 1
Anmlal rainfall (P)
Total runoff gauged at 50 1
Rainfall minus total runoff
Residual ground>later discharge at 50 1 (Rg) (from hydrograph separation)
Surface runoff at 50 1 (R ) s
Estimated actual E (averaged over t '
\1hole catchment)
Estimated actaul Et from dambo bet>leen June and November
'"
'"
'"
-
'"
'"
'"
904 mm
76 mm
904 - 76
18 mm
76 - 18 '"
208 + 53J
78 mm
'" 828 mm
58 mm
+ 33 '" 779
Possible maximum ground;'1ater dischD.rge '" t'E:'sidual qroundwater +
mm
Et from dambo 1n dry season
Water Balance equation
'" 18 t 78 '" 96
RS + Rg + Et ± imbalance
904 '" <;A ... 1 R + 779:1: imbalance
p =
mm
Therefore imbalance '" 49 mm
The groundwater recharge is difficult to determine with any accuracy
witho~~~: fu:rt::i2f ,:'2;-,':,;.1E:c monit,oring of dambo catchments~ At minimum
it "ill be represented
from simple hydrcgraph
by the residual ground"ater discharge deriVed
separation (18 mm), but i,t could be .signifi->,
cantly greater due to the evapotranspiration of baseflo~ in dambos
upstream of the gauging station. Total ground"ater discharge could
45.
in theory be' as much as 96 m;n if interno" is negligible and the evapo
transpiration from dambos is not derived from storage in the .clays.
Since base flow extends for a period of several months into the dry
season it i-s suspecte(~ ~':h:?}: 9l:"o:.lnd~rater is sllstnining t.he bulk of the
flow and that interflo" is not a major component, other"ise flow would
cease soon after the wet season. It should be noted that the aquifer
properties (e.g. transmis'l;.v;ty), hydraulic g::',vl:lel'f. and surface water
drainage pattern are such that the annual groundwater discharge to
surface "ater (and hence recharge) is unlikely to exceed 40 mm (see
Section 2.4). The average annual recharge is therefore more likely
to fall somewhere between this limit and the minimum estima~e from
simple hydrcgraph separation (i.e. 'J j ." i,O nun).

It should be noted that conventional hydrogra.ph analysis of the
River Livulezi (Y7&ter Resource Unit 3) and Ri.ver Lm.elezi (Water
Resource Unit 6) suggests a groundwat0t' component comm.only of 60 -
46.
80 mm per unit ci:cea. :(8p.ceH~~'r{i.:ir:'J br.uund 30~t of the total discharge.
1'hese catchments are similar to the Bua Plateau in terms of under
lying geology (l<1eathered ba.sement) and climate, but the principal
difference is the presence of ~lell defined river channels and few
damboa. The larger groundwater cmnponent obtained from simple
Hydrograph analysis for these catchments corroborates the suggestion
that a significant amount of groundwater discharge from catchments
largely drained by dambos could be evapora~ed upstream of the gauging
station. There ~lill hOI,'ever be a component of recharge from infil
tration of ~Iater from river beds into the outwash material at the
base of the escarpment in the Livulezi Catchment.
The alternative methods of estimating temporary replenishment resources
in the plateau area discussed in previous sections are insufficiently
preci.se or are not cons idered to be very reliable. For example the
analysis of ground~later ::'c,ve: [:," :,.,:,'cicms suggests that recharge ia
likely to be 13 - 35 mm but a lack of knowledge of specific yield and
sufficient hydrograph data mean that the estimates cannot be better
defined. The flOw net analysis is hampered by evaporation of ground-
geological complelCi ty; this method is thought to be inaccurate' and
a larg~ underestimate. Infiltrometer tests and' poorly draining soak
away pits suggest that ),e' :1arge is slow but the groundwater quality
confirms that it is lil<el,/ to b2 recent.
The permanent resources oan be evaluated in terms of aquifer.' geometry
and physical properties. Bm1ever, the lack of detailed knowledge of
speci fie yield ard v~,,:;: :L. l,(j?l :t n saturat~~t:~ ~-l.,: 0\' ~':'::: :.! pr<?clude an~l
accurate estimate of permonent resources.
In the escaprment ;':;2:)tic:'~ C;-.2 ·Bua catch. ... .:. ...... "L.:.2 ~_·oundwater contri
bution to the' river dischnrge is expected to be negligible because the
weathered zone is very thin or non existant. There could be a small
contribution from fractured bedrocl< but this will be minor. On entering
the lakeshore plain, the rivers may lose some or all of their flow thus
recharging the alluvium where P':"""",,;Jilities are sufficiently high.
The reverse could occur nearer Lake Malawi with groundwater discharge

47.
from the alluvium to the river although there is inusuffioient data
to show this. There is likely to be some groundwater underflow through
the alluvium discharging into the lake (Mauluka, 1983) and possibly
some deep percolation ill fissures in the underlying bedrock; these
are difficult to quantify but are .likely to be small components of
the hydrological balanoe considering the narrow portion of the lake
shore in question.
"
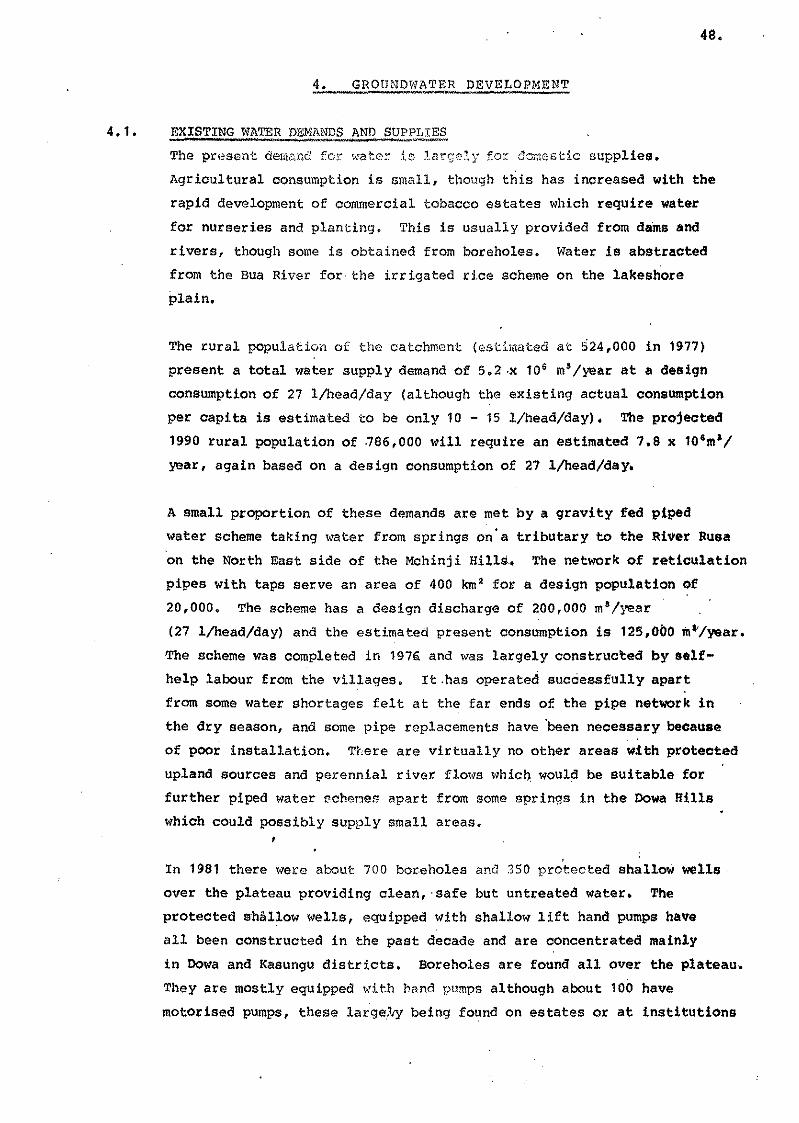
48.
4. GROUNDWATER DEVELOPMENT
4.1. EXISTING WATER DEMANDS AND SU~~
The present dem2ua fo;~ <;.<,"ater j.8 1ars,:.::.y for aCl'l10stic supplies.
Agricultural consumption is small, though this has increased with the
rapid development of commercial tobacco estates which require water
for nurseries and planting. This is usually provided from dams and
rivers, though some is obtained from boreholes. Water is abstracted
from the Bua River for· the irrigated rice scheme on the lakeshore
plain.
The rural population of the oatohment (estimated at 524,000 in 1977)
present a total water supply demand of 5.2·x 10· mS/year at a design
consumption of 27 l/head/day (although the existing actual consumption
per capita is estimated to be only 10 - 15 l/head/day). The projected
1990 rural population of .786,000 will require an estimated 1.8 x 10·m'/
year, again based on a design consumption of 21 l/head/day.
A small proportion of these demands are met by a gravity fed piped
water scheme taking ''later from springs on' a tributary to the River Rusa
on the North East side of the Mchinji Hills. The network of reticulation
pipes with taps serve an area of 400 km' for a design population Qf
20,000. The scheme has a design discharge of 200,000 m'/l~ar
(21 l/head/day) and the estimated present consumption is 125,000 rn~/year.
The scheme was completed in 197fi and was largely construc~ed by self
help labour from the villages. It.has operated successfully apart
from some water shortages felt at the far ends of the pipe network in
the dry season, and some pipe replacements have 'been neoessary because
of poor installation. Tt.ere are virtually no other areas w.tth protected
upland sources and perennial river flO\qs whioo. would be suitable for
further piped water !Joh",nes apart from some springs in the Pewa Hills
\,hich could possibly supply small areas.
In 1981 there were about 700 bor.eholes and 350 prctected shalloW wells
over the plateau providing clean, ·safe but untreated water. The
protected shallow I.ells, equipped with shallow lift hand pumps have
all been constructed in the past decade and are concentrated mainly
in Pewa and Kasungu districts. Boreholes are found all over the plateau.
They are mostly equipped with hand pumps although about 100 have
motorised pumps, these large'lY being found on estates or at institutions

49.
such as schools or health centres. On average there is one protected
water point in every 10km'. There are only about 25 boreholes in
Resource Unit se because of the sparce population and unreliable
groundwater yields.
Each borehole produces on average perhaps 700 l/hour and 5,0.0.0. l/daYI
a protected dlJg well ",ould produce about half this quantity. The total
groundwater abstraction for rural 11ater supplies is thus in the order
of 1.6 x 10.' m' /year, the abstraction from the escarpment and lakeshore
areas being v"ry minor. The annual abstraction from the plateau area
is equivalent to 0.2 mm over the whole area which is considerably less
than the available replenishment resources by whatever· method reoharge
is estimated. There is therefore considerable scope for further
development of groundwater for rural domestic demands without a danger
of depletion of permanent stock resources.
Each bore hole is estimated to serve perhaps 350. people at present
(each abstracting about 15· l/head/day) and there are often very long
walking distances of several IdJ.W'~~~e.s i.,wolved. It is clear that
the existing \later points are insuffioient and too widely spread to
serve the dem,md for rural domestic supplies, and as a result many
unprotected sc>urces are used in addi Hon. The water taken from
unprotected wells i ~pr~],gz ~ d2.nIs and r:l.vers is a health hazard since
it can transmi.t waterborne diseases such as cholera, typhoid and
dysentary. "
It is estimate'd that a total of only 2.2 x 10.' m'/year of clean, safe
water is consL'med by villagers at present. ..: Less· than half of.
the el!isting population have access to these protected suppl:!:es and
the long walking distances may result in inadequate quantities of
water being c~'llecte(L. Th5.,·. '.ea"es a t"equirem(mt of '" f"rther
5.6 x 10.'m' /year which ,/ill be necessar.y to serve the 1990 population
at the design cbncumption of 27 l/head/day.
The district centres and some sub-c~ntres are supplied with water by
the Urban Water Supply Branch of the Department of Lands Valuation
and Water. These are served by ground\~ater from boreholes equipped
with motor pumps or by abstraction from rivers. The storage reservoirs
are linked to reticulation system~ 1:;".C;1 c;llpply to standpipes serving
several houses or to individual houses if the owners can afford the

50.
connections, A supply of 70 to 100 l/head/day is made in urban areas
but the service does not always extend to the entire population of
the centre. An estimate of the average annual consumption is given
in Table 9, Hchinj i 'co,m used to be served by direct abstraction frem
the Bua River but since the 10~1 f10~1 was unreliable the town now
depends on supplies piped from springs to the north-east in the
Mchinji Hills where flow is perennial. The Water Supplies Branch are
also responsible for some institutional supplies 'and their maintenance
(for example, secondary schools and health centres) and they supply
water kiosks in Mchinji as well.
Location
Mponela
Kabudula Health Centre
Kochilila Health Centre
.Mchinji
Ntchisi
Type of Source
Boreholes
Borehole
Large Diameter Wells
Springs
Ri,ver
Total
Table 9
Urban Water Supplies
'.' Borehole Numbers
5044 (A41)
Estimated Annual
Consumption 19B1 ' (m'/yr)
54,000 SDttl8(SM1S6i 5D224(W11~)
5D212(W32~) , " 5D223 (Rl'!'2g),'
SE 49 (W155) 5,000
-, 12,000
50,000
33,000
154,000
4.2. GROUNOWATER ABSTRACTION METHODS
Estimated 1982
Population served
4,200
150
300 -
3,500
2,000
Estimated Average
Consumption (l/head/day)
70
100
100
70
70
Where the depth to groundwater is 'shallow (less than 3 m) 1n the dambo
margins the most appropriate method for abstraotion for rural suppli~s
is hand dug wells. Where grou .. ,,::',,':ctc>: levels are deeper, drilled bore
holes 'offer the only solution for seasonably reliable water supplies.

51.
4.2.1. Boreholes
Boreholes have been drilled from t.he 1930's onwards using percussion
methods. ~Jany have been drilled since 1970 under a dispersed proqramme
at villages selected throuqh District Development Committees and funded
by the Christian Services Committee of the Churches of Malawi.
Resistivity surveys have been routinely used to locate all the sites.
However, the reliability of these surveys in predioting depth to
bedrock and groundwater levels is oomplicated by the presence of
laterite which gives anomolously high resistivity and/or graphitic
bedrock causing 1011 resistivity anomolies which may be oonfused with
a thiok weathered zqne. Other geophysioal methods for groundwater
exploration in Malawi have been investigated (Carruthers, 1981) but
no completely reliable method has been found. He found that maqneto~
meter surveys are complicated by the presenoe of magnetite and ferro~
megnesian minerals; the changes in depth of weathering tend to be
masked by variation in bedrock mineralogy. Seism~c refraction aurveya
were hampered by heterogenous conditions, the laok of well defined
layering and no simple bedrock refractor", Electromagnetic (EM) surveya
may be able to pick up fraoture traces, but the presence of graphite
and surface conductors will tend to have overriding effects. EM
surveys might be a cheap and rapid method of determining areas of
shallow bedrock and help to avoid abortiveboreholes in marginal areas.
The maj6rity of the, boreholes are' poorly designed with very high
construction and"maintenance costs. ' Most of the boreholes are 40 m
or deeper often reaching well into fresh bedrock. They are all
completed with imported steel lining (mainly 150 mm diameter), which . is usually slotted for the lower third or half.. The hacksaw'slots
are widely spaced
very low (0.1%).
so that the open area of the ~creened portions is
In addition the higher yielding levels in the
weathered aquifer are often cased out and groundwater is forced to , pass vertically down'to the fresh bedrock before it,can enter: the
borehole. The head losses are larqe, the entrance velocity of water
is high and the boreholes are qener'ally very inefficient, The low
specific capacities reflect poor borehole design as muoh as a low
yieldinq aquifer. Where there is a gravel pack it,is ,usually very thin
and comprises coarse crushed 9 - 12 mm roadstone, but often there is
no pack. In either case there is no effective filter and sand from
the aquifer is drawn into the boreholes. ' As a result the boreholes
tend to silt up with time. Also there is often exoessive wear on pump oomponents (especially oup leathers in handpumps which need to

be replaced tldcs a year on average), so maintenance is costly and
required frequently.
Most of the e'tist~.ng 1::-ot'2f;;-:.len e.::0 Gcr ... ;ir::rcG Hi tll handpumps J there
are several different types in use but all are imported, expensive
52.
and difficult to maintain. A truck \1ith a winch is required to remove
all the downhole components to enable even the most basic repairs to
be carried out. Haintenance is a great burden on Government and
cpsts have risen to 1(200 per borehol€' pet' year (1982 prices). There
are about 150 private estate, urban and institutional supply bore
holes which have motor pumps.
4.2.2. Improved Borehole 1)e9,1gns for Rural Wat,er Supplies
Since 1980 a considerable effort by the Groundwater Project and the
Groundwater Section of the Department of Lands Valuation and Water
has been devoted to improving the bore hole designs at the same time
as reducing the costs. This has been achieved by matching an under
standing of the geology and groundwateroccurrence with the most
economic and appropriate 'methods of abstraction. The improved desiqns
have been successfully implemented in other parts of Malawi with' a
weathered basement aquifer, and are being used in a rural water
supply programme constructing bore holes in Oowa west durinq 1982/83.
Borehole designs have been improved by several changes. The recog
nition.that the weathered basement is a more important aquifer than
the fractured bedrock below enables. bcreholes to be drilled to much
shallower depths. A minimum saturated aquifer thickness of 10 m is
aimed for, and usually a total depth of only 20 - 25 m would be
necessary. Borehole diameters have been reduced to a maximQm of
200 mm. This makes the use of smaller,:',rigs, v.ehicles and crews
possible, drilling tim~s and costs are both considerably reduced.
Adequate yields for rur!.ll water supplies (0.25 -0,'5 l/second) should
be possible o"er tht;! greater part of the plateau where the weathered
profile is well develop",(J. As a consequen,e 'the need for detai1'ed
geophysical site surveying will be unnecessary except for urban or
institutional supplies requiring higher yields, and possibly for
delineating areas where depth to bedrock is shallow.

Borehole designs ,,"'VB been improved by i.ncreasing the open area of
the slotted screen to 8 % a"cl reducin9 the slot size to 0.75 mm.
53.
The lo\,r0~:" en~:xan('!? velooi ties and correct pl.s:cin::,!, ef '::11'2 scre.';;n results
in increased hydral11l.c effid,ency and improvea yielas. The use of a
locally manufactured ana slotted PVC lining (1 io lMl diameter) is
considerably cheaper than imported steel linIng (150 mm diameter) and
probably results in increased borehole life due to its inert nature.
It may also reduce the problem-of hi9h iron concentrations in ground
water which could be partly associated 11ith dissolution of steel
lining.
The use of a correctly graded gravel pack has also improved hydraulic
efficiency and reduced the inflUl( of sand into the boreholes. Surveys
have sho,m that Lake t"I,,1,,",1 beach sand at: several. locations has the
ideal grain size distribution (0.7 - 2.5 mm diameter). A thicker
pack is achieved by inserting smaller diameter lining (usually 110 mm rather _than 150 mm) ,rith a drilled diameter of 200 mm.
Borehole surrounds ate «ell ,,~'"'''., .,,,~c,_, with brick based concrete -
aprons ana channels for the drainage «ater. Soakaway pits are dug
at distances of at least 5 m away from the borehole to avoid surface
pollution of the groundwater. It i3 intended that eventually rural'
communities. To enable this a hundapump has been developed in
Malawi with ease of maintenance bPeing a major design feature together
with 10'1 cost and the po' ";nth). for loc-11 rcanufacture •• Repairs or
servicing will be possib,e by hand and it is intended that spare
parts made local1y \\.Ul 'Je available at village stores. The frequency
of handpump repairs requ'red «ill be considerably reduced with the
construction of impl'OV{2d design boreholes."
4.2.3. pug Wells
Shallow hand dug \.,'.:211-8 &J:'f: iilOS'i: c~ppr:Cp'.::i.Ed=:G [er t'ural ~\~ater supplies
in areas \-There tht'? 'v,. Sfc)undwater L~ ~,_;""~"_,,,,, ;,"1> Yi~lds are
lower than for boreholes because of· the low permeability and they
cannot serve as many people. To avoid- pollution of the water supply
the wells are protected by coverin9 the top, lining -the sides and
installing a shallow lift handpump. Some of the ~l<3lls in the plateau
area are also backfilled for ,,,;6,_.~_ "c0tC!ction from pollution, although

54.
this makes access difficult i.f the handpump fails or the well requires
deepening. The protected \~ellG have 1:>2en constructed since 1975 usinq
self-help J.abour from the villages involvedll ThG~ vIGIls ate dug to a
sufficient depth (gen",ral1y 3 - (; co) to maintain a relaible dry season
supply. A minimum depth of 3 In of water in the well is desirable.
Construction ia carried out in the dry season wherever possible so
that groundwater levels are as low as possible and the pumping required
to keep the well drained is' kept to a minimum. Locally made shallow
lift hand pumps are being developed for the wells programmel it is
intended that these could eventually be largely maintained by the
community.
4.2.4. Integrated Projects
The DDC Programme of C;dlling dispersed b'j~eholes has suffered from
a lacl< of planning, and management, inefficient. use of equipment
and from poor supervision" As result the boreholes have very high'
construction costs as well as being poorly designed. The concept of
"Integrated Projects for Rural Groundwater Supplies" has been developed
by the Groundwater Section of U',,, i)"partment of Lands Valuation and
Water to provide more efficient low cost water supplies (Groundwater
Project, 1982). An Integrated Project aims to provide complete
coverage of an area ~lith water points within a maximum walking
distance of 500 11,. "'L~£ iG ""C::.:·:·,: :...". ~'::·,"':"::':'i,;;"i:.ing existing
boreholes, protecting suitable springs and existing dug wells and
construeting new, better designeot boreholes or wells •. The'yields
required for rural dClin(i;s d.o use are ,small so geophysical. surveying
is generally not necess5ry to choose the new sites.
Aer ial photographs are used to locate areas t<hich should be "voided
where BedrOCk outcrops, and to pick out possibl.e fracture traces.
They are also' U$GO to i.~.l~a,-8 'v..;.11ey OO ...... OiU 8itlit$ where the depth to
groundwa ter is less so tha t wells are dug in these areas and bore holes
drilled on the'inter.fluves. The community involvement is maximised
with the villagers 'choosing sites as far as possible and providing
self-help labour. Because borehole drilling is concentrated in one
area the transport costs can be considerably reduced. A low-cost
borehole with a handpump in an Integrated Projeot costs K1,500 (1982
prices) which is appro~imately one quarter of that for an old design
borehole in a dii,spersed programme. 'rhe design consumption is 27 1/
head/day~ a borehole is oonsidered to s~rve 250 people, and a ,

55.
protected shallow I"ell to s","ve 125 people and constructed for half the
cost (1750 in 1982).
An In.t0~;rcated Pro:Jccl; C~YVei.'lng I,,'d£'C tJ): tl1~::: DOII!a West Agricultural Project
Area is currently unc1en,ay and aims to serve '60,000 peopleoduring 1983
and 1984. All the ne\~ly constructed boreholes will be of low cost
improved design and locally produced handpumps will be installed
throughout the area.
4.3.1. Rural Wate,r SURJ2li.9.':.
It is clear that :Ct.1r.tb0)' r:::~ol1ndwater cl$\1;.:-lc:?r.v3:nt. 1s required to meet
the demands of the projected 1990 rural population of about 786,000
(see Section 4.1). More ,rater points are needed to supply an adequate
amount of protected "Iater within a reasonable walldng distance (1&S8
t.han 500, m I~herever possible). It is estimated that a further 5.6 x
'~""" :;;;tIon will be required"
With the improved 1oo1'l')b010 designs, the yields ",ill generally be suf
ficient for handpump supplies (0.25 - 0,5 1/8'Oc) over most of the
require aettdlec1 site surveying- ei-!cept perhaps to delineate those areas
\,,'here depth to bedrock 13 limite\.-a.Q Dug \>12118 can be consttucted in all
areas close to dambn nib_"'- .. ; n:~ \:'Jl~'~re the f·'al.~("r ":atJ"lf: is ahallo\".. The
t'ur.al village demands (":r'> gr;'oundlivat·2:,r &r-t~ relatively small and can
€:asily be met ,"'d lhout d~. pletlcn of t'cplenishable groundwat®r resources;
they are well 't,,rithin t.h0. n~charge eDcimates by \<!hatever meth6d they are
calculated. Grouncl"',yt",, yiolds&nd recharge in the alluvial lakeshore
lJo't1"ver, there is 1i ttl.v scope for gr:oundvmter development in the
(~!3catpme-rtt. ared except ~::or very lex::al cu:'eas,. because yields are
unreliable and aer:,::nJ c l".~·;:;...~secting f(:;-.:.~L.:":"k_O
It is possible that grou:1o>later development in the plateau area by
drilling boreholes on th" Interfluves could be the best way of maximising
,mter reSOUrces by tappit",g rese~ves ~lhich ~lould otherwise be lost by
evapotranspiration in the ~'be effect might be to reCluce
the saturated area on the dambo followinQ the rainy season and to decrease
the length of surface "at('r flol1 into t.he dry season. Anthropogenic inf
luence via cultivation could cause incision of channels and dambo drainage.

It ,1.s rGCOmHK~'n(}ed tbat 8,n "Integratecl Project il approach is taken to
provide complete CCiVGn:'ige of pe.r.t.icu:tar rural areas. Sufficient
water: f't."i~~~,.::; .t-'~iUL, '.~_l, •. ,.<~., c-·)ns"i::rnctec1 by the most effic:~/::nt,~ c~conolnic and
56.
appropr.: iatc· rn.uthods of: 'V;ate.r supply (> Further agricultural develop-
ment of pa~ts of ~lahinji, Kasungu and DOVla Districts is planned under
the National Rural DeveLc>pment Programmes, Tt '>JOuld seem appropriate
to i.mprove rural «ater supplies in parallel Vlith this as there are
insLlfficient protected sources serving the community.. Significant
improvements i.n sanitation and infrastructure oan also be achieved
~1i thin these prcgramrnes, thus maximising the impact of development.
4.3.2. ~1 Su.epl~
Locally for small cml",,1 and instl. tuti.onal supplies, the demands per
capita are larger c.I~0 . ',;L',; i.;L-~.:.:ilDtion is mot';.:; ,,;\',;~.c0r~tl:'ated, so more
detailed information is required on local recharge conditions and
Vlhether the permeability of the aquifer could sustain the reqtidlred
yields ",ithout excessive pumping dr/lI,downs. Geophysical surveys and
interpretation of aerial photographs "ill be necessary to help. avoid
areas vlith shallow bedu,ck and to lJcdcE' the most favourable sites for
drilling boreholes where the per.meability is highest and the depth of
~Ieathering is greatest. It is possible that yields of 1 - 3 l/sec
might be obtained on t!1e plateau p but towards the escarpment where the
w ... ~ • .L Le: Hlvt.-e unreliable.
fractured marbles outcrop ':here may be favourable drilling sites.
Yields of 5 l/sec or more night loe obtained from boreholes' 1n the
alluvial lakeshore at-eas ~
Where
Collector ""lls "ith .later ,b drilled from a central shaft might be
another soluHCl1 to provId, larger more re1i.able Yields for small town
.supplies. High€~ yi.elds ,nuid be achieved by increasing chances of
int.ersection of ml.,):Co pE:rl'ii( aO.le zones e.nd providing larger storsg.e
within the v,ell. Collector ,1611 systems would be relatively expensive , to construct and teahnica 1 1.y mor.e, difficult to maintl'lin. Consideration
of each individual site WOJld be required to determine Vlhether it is an
economically viable propos'. tion and whether local recharge could sustain
the proposed abstraction rptes.

57.
<, ~ 3 ~ 3 ~ .!.EE..j~:;;V'l. t;.~
rrhe basement nquifer is unlikely to have sufficient seasonal recharge
n()r high en()ugh tr.ansml.ssivity for the yields required for large
i1'r JS8. tion sohmn28 ~ HOvlCVGl:' f 51';";'-1::' sc~le agt: icul tural plots (say
0.5 - 2 hectares) could successfully be irrigated (requiring yields
of 0.5 - 2 l/sec) using motor pumps).
Yields from the alluvium of the lakeshore plain should be sufficient
for large irrigation schemes where the succession is relatively sandy
and thick (N.S.I.S., 1980).

58.
REFERENCES
A'1ne'-I, S. 1971. The Natm:e of Dambo, Presented at Dambo Utilisation
Bale 11 , J. and Perry, J .E. 1973. Hydrology of seasonally inundated
African Headwater Swamps. J. Hydrology, 19, 227 - 250.
Balel<, J. 1977. Hydrology and Water Resources in Tropical Africa,
Elsevier.
Bath, A.H. 1980. Ilydrochemistry in Grollndl1ater Development: Report
on an Advisory visit to MaIm.!, I.G.S. Report No.
WD!OS/gO/20 (Ul1Clllblished) •.
Bellingham, K.S. and Bromley, J. 1973. The Geology of the Ntchisi -
Middle Bua Area. Bull. Geology Surv. Malawi, 27.
Brown P. and Young, A. 1965. "fhe Physical EnvIronment of Central
Malawi with special reference to soils and
Agriculture. Malawi Government Printer, Zomba.
Cannon, P.T. et al., 1969. Polyphase deformation in the Mozambique
belt, Northern 11alawi. . Bull. Geology 500. Amer. 80 .•
2615 - 2622.
Caruthers, R.M. 1981. Report on a visit to Malawi to advise on 'the
use of Geophysics in Groundl<ater Development. hG.S.
Report No. 123 (unpublished).
c,::~ tor I '! 973 ~ The Geology at~d I·!i.n(?r.al
Resources of Malawi. Bull. Geology Surv., Malawi; 6.
Chiltol1i P.J. and Grey, D.R.C. ~il81. The Occurrence and Otilisation
of Groundl~at"r in t·he Tropical shield Areas in
Developing COll1tries. Paper presented at UNESCO
Seminar on Grc.undwa ter in Hard Rocl, Areas, Arusha,
rranzania"
Diltey, F. 1937. Early Cretaceous and Miocene peneplains of Nyasaland
and th(;;';t:" i~c1lt:1.:.n to the Rift 't"lFI.l1.<:::y~ Geology
Mag., 74, 49 -- 67.
DO~la West Projo'ot Preparation r:eport, 1980. Ministry of Agrioulture
Dray ton, R.S. et aI, 1980. A Ragional Analysis of River Floods and
Low Flows in. Malawi. - Water Resources Branch,
D .. L .. V.W., No .. 'f .. P.8 ..
Dray ton, R.S. 1980. A preliminary survey of the Water Resources of
Mala~1i. Water Hesom:C-:'::5 :.3rcnch, O.L.V.W., No. T.P.11 ..

58.
Edwards, K.A., 1979. The water balance of the ~Ibeya Experimental
Catchments. E. African Agric. 4 Forestry Journal, 43,
2?1 '" 247.
Glover, J. and [~cCulloch, J .,; .(;, " ')" G. '['he Empir ical relationship
between solar radiation and hours of bright sunshine
in the high altituoe tropics. Q.J. Ray. Met. Soc., 84,
56 ,,~ 60.
Grey, n.R.C., 1980. Hydrology and Hydrogeology of plateau landforms
in 11a1ald with special reference to headwater dambos.
Paper presented at Landform Dynamics seminar, Lifupa,
Groundwater Project, 1982. Manual for Integrated Projects for Rural
Groundwater Supplies. ODA-UNDP-Malawi Government.
Harrison, D.R. and Chaptlsa, F.VI.P. 1975. The Geclogy of the Nkhotakota
Benga Area. Bull. Geology Surv .• Malawi, 32 .•
Hill, J.L. and Kidd, C.R.R.. 1980. Rainfall-run off relationships
for 47 Malawi Catchments. water Resources Branch,
O.L.V.W., No. T.P.7.
Boward Rumphrey and Sons, 1979. Die;"" lets Water Supplies Project
Design. Report and Appendices. Ministry of Works and
Supplies.
Institute of Hydrology. 1978. Low Flow Studies Report.
Kemp, J. 1974. 'fhe (;oc::.o;./ c. th,:" ')~·:.-:-:·--:T.'la "Are::... iJull.Geology Surv.
Malawi, 31.
Land Husbandry Identification Reports, 1978 - 1981. Ntchisi, OOwa
West, I1cbinji Districts. t4inistry of Agriculture.
Lister, L.A. 1967. Erosion Surfaces in Malawi. Rec. Geology. Survey
Malawi, 7.
Mauluka, L.H., 1983. HydroCjeological Bu1l2tin for the Nkhot1;lkota -
Salima Lakeshore Area. Water Resource Unit No. 5.
Morton, p" I. 1978" "':"Sc:lHl~t.:.ing Eiapotransp~{J.t..i.ol1 £r'0111 fJotential
Evaporation: Practicality of an Iconoclastic Approach. , J. Hgdrol. 38. 1 - 32.
National and Shire IrrigaClon Study, 1980. ,'lnal National Report.
Bunting Technical Services Ltd., MacDonald and
Partners and Ministry of Agriculture and Natural
Resources, Malawi.
National Statistical Office, 1980. Malawi Population Census, 1977.
Malawi Government.

59.
Peters, E.R. 1969. The Geology of the Kasungu Area. Bull. Geologg
Survey Malawi, 25.
Thatcher, F..C. and l'Jildcrspin, K.E. 1968. The Geology of the Mchinji
- Upper Bua Area. Bull. Geology Survey Malawi. 24.
Velden, J. van de, 1979. A summary of Rainfall, Pan Evaporation and
Temperature at Pan Evaporation Stations in Malawi.
Water Resources Branch, D.L.V.W., No. T.P.3.
Velden, J. van de, 1980. A summary and review of monthly temperature
data in Malawi. Water Resources Branch, D.L.V.W.,
No. T.P. 4.
Walter, M.J. 1972. The Ge"logy of the Lilong",e - Dowa Area. Bull.
Geology Survey Malawi, 26.
WaIter, M.J. 1972. The Geology of the Salima - Mvera Mission Area.
Bull. Geolo,!,! Survey Mala.ri, 30.
Water Resources Branch, D.L.V.W., 1979. Directory of Hydrometric
Stations 1-n Malawi current in November, 1979. No.
T.P. 2.
wilderspin, K., 1974. The hydrogeology of the Central Region highlands.
Geological SurvcOY, """la"i (unpublished report).
-,


![~~m~flllll]llliiljl~(II~~llliy - BGS Resources Serverresources.bgs.ac.uk/sadcreports/botswana1997obakenghydrogeologyb… · Fig. 29 Composite plot of drawdowns in piezometers D and](https://img.dokumen.tips/doc/110x75/5aa177da7f8b9a07758ba298/mflllllllliiljliillliy-bgs-resources-fig-29-composite-plot-of-drawdowns.jpg)


