Embed Size (px)
Citation preview

AIXTRON Investor Presentation First Half 2015 Results (July 28, 2015)
© AIXTRON Investor Relations, July 2015

DISCLAIMER 2
Forward-Looking Statements
This document may contain forward-looking statements regarding the business, results of operations, financial condition and earnings outlook of AIXTRON within the meaning of the safe harbor provisions of the US Private Securities Litigation Reform Act of 1995. These statements may be identified by words such as “may”, “will”, “expect”, “anticipate”, “contemplate”, “intend”, “plan”, “believe”, “continue” and “estimate” and variations of such words or similar expressions. These forward-looking statements are based on our current views and assumptions and are subject to risks and uncertainties. You should not place undue reliance on these forward-looking statements. Actual results and trends may differ materially from those reflected in our forward-looking statements. This could result from a variety of factors, such as actual customer orders received by AIXTRON, the level of demand for deposition technology in the market, the timing of final acceptance of products by customers, the condition of financial markets and access to financing for AIXTRON, general conditions in the market for deposition plants and macroeconomic conditions, cancellations, rescheduling or delays in product shipments, production capacity constraints, extended sales and qualification cycles, difficulties in the production process, the general development in the semi-conductor industry, increased competition, fluctuations in exchange rates, availability of public funding, fluctuations and/or changes in interest rates, delays in developing and marketing new products, a deterioration of the general economic situation and any other factors discussed in any reports or other announcements field by AIXTRON with the U.S. Securities and Exchange Commission. Any forward-looking statements contained in this document are based on current expectations and projections of the Executive Board and on information currently available to it and are made as at the date hereof. AIXTRON undertakes no obligation to revise or update any forward-looking statements as a result of new information, future events or otherwise, unless expressly required to do so by law.

Key Financials Q2/2015*
3
*) rounded figures; may not add up 1) Restated; please refer to “Accounting Policies” in Q1-Report 2) Operating CF + Investing CF + Changes in Cash Deposits, adjusted for acquisition effects (upfront payments and loan)
(€ million) H1/15 H1/14
Restated YoY Q2/15 Q1/15 QoQ
Revenues 80.7 90.1 -10% 40.4 40.3 0%
Gross profit 12.4 22.61 -45% 3.6 8.8 -59%
Gross margin 15% 25%1 -10 pp 9% 22% -13 pp
EBITDA -21.8 -13.4 -63% -15.3 -6.4 -139%
Operating result (EBIT) -26.7 -21.5 -24% -17.9 -8.8 -103%
EBIT margin -33% -24% -9 pp -44% -22% -22 pp
Net result -27.6 -23.4 -18% -18.1 -9.5 -91%
Net result margin -34% -26% -8 pp -45% -23% -22 pp
Net result per share - basic (EUR) -0.25 -0.21 -19% -0.17 -0.08 -113%
Net result per share - diluted (EUR) -0.25 -0.21 -19% -0.17 -0.08 -113%
Free Cash Flow2 -12.3 -31.3 61% -0.1 -12.1 99%
Equipment order intake 101.4 99.21 2% 52.5 48.9 7%
Equipment order backlog (end of period) 91.2 66.4 37% 91.2 79.0 15%
FINANCIALS

Consolidated Income Statement*
4
(€ million) H1/15 H1/14
Restated +/- Q2/15 Q1/15 +/-
Revenues 80.7 90.1 -10% 40.4 40.3 0%
Cost of sales 68.3 67.61 1% 36.8 31.5 17%
Gross profit 12.4 22.61 -45% 3.6 8.8 -59%
Gross Margin 15% 25%1 -10 pp 9% 22% -13 pp
Selling expenses 6.3 6.41 -2% 3.0 3.3 -9%
General & admin expenses 8.5 9.6 -11% 4.2 4.3 -2%
R&D 27.6 29.2 -6% 14.6 12.9 13%
Net other op.(income)/expenses -3.3 -1.3 -154% -0.3 -3.0 -90%
EBITDA -21.8 -13.4 -63% -15.3 -6.4 -139%
EBIT -26.7 -21.5 -24% -17.9 -8.8 -103%
EBIT Margin -33% -24% -9 pp -44% -22% -22 pp
Result before tax -26.2 -20.8 -26% -17.7 -8.5 -108%
Pre-Tax Margin -33% -23% -10 pp -44% -21% -23 pp
Net result -27.6 -23.4 -18% -18.1 -9.5 -91%
Net Return on Sales -34% -26% -8 pp -45% -23% -22 pp
FINANCIALS
*) rounded figures; may not add up 1) Restated; please refer to “Accounting Policies” in H1-Report

Consolidated Statement of Cash Flows*
5
(€ million) H1/15 H1/14 Q2/15 Q1/15
Cash Flow from operating activities -6.4 -25.1 3.7 -10.1
Cash Flow from investing activities 8.9 -19.9 -2.4 11.3
Cash Flow from financing activities -0.2 -0.2 -0.2 0.0
Exchange rate changes 5.2 0.6 -1.0 6.2
Net change in Cash & Cash Equivalents 7.5 -44.6 0.1 7.4
Cash & Cash Equivalents (beginning of period) 116.6 167.5 124.0 116.6
Cash & Cash Equivalents (end of period) 124.1 122.8 124.1 124.0
Change in Cash Deposits -22.5 13.8 -7.6 -14.8
Free Cash Flow1 -12.3 -31.3 -0.1 -12.1
Capex -7.4 -6.2 -3.8 -3.5
FINANCIALS
*) rounded figures; may not add up 1) Operating CF + Investing CF + Changes in Cash Deposits, adjusted for acquisition effects (upfront payments and loan)

Consolidated Statement of Financial Position*
6
(€ million) 30/6/15 31/12/14 30/6/14
Property, plant & equipment 80.6 77.3 78.3
Goodwill 77.1 64.8 64.5
Other intangible assets 5.7 2.5 2.7
Others 4.8 4.6 5.8
Non-current assets 168.2 149.2 151.3
Inventories, WIP & Finished Goods 85.8 81.7 72.7
Trade receivables 23.5 26.3 30.3
Others 9.4 8.3 9.3
Cash & Cash Equivalents incl. CD 255.4 268.1 275.6
Current Assets 374.1 384.4 387.8
Shareholders' equity 398.6 415.7 443.6
Non-current liabilities 3.8 1.3 2.0
Trade payables 12.6 16.4 14.4
Advance payments from customers 95.1 66.9 51.1
Others 32.2 33.2 28.1
Current liabilities 139.9 116.5 93.7
Balance Sheet total 542.3 533.5 539.2
FINANCIALS
*) rounded figures; may not add up

Compound Semiconductors
MOCVD ALD/MOCVD
LEDs, Lasers and
Optoelectronics
• LEDs for display: TVs, mobile phones, tablets, etc.
• LEDs for lighting
• LEDs for automotive
• LEDs for data communication
• Telecom lasers
• Concentrator Photovoltaics
Increasing Equipment
Demand Expected by:
2014/2015
Our Technology Portfolio
7
Silicon Semiconductors
• RF transistors
• AC-DC converters
• DC-DC converters
• Solar inverters
• Motor drives in industrial applications automotive and consumer electronics
Power Management GaN / SiC
• DRAM Dielectric and Metal Electrode
• Flash Inter Poly Dielectric and Metals
• Logic Gate stack
• ReRAM and PCRAM Active element and Electrode
• Logic High Mobility Channel
Silicon Semiconductors
Increasing Equipment
Demand Expected by:
end of 2014/2015
Increasing Equipment
Demand Expected by:
2015
• OLEDs for display: TVs, mobile phones, tablets, etc.
• OLEDs for lighting
• Organic, flexible electronics
• Organic Photovoltaics
• Transistors
• Interconnects
• Flexible Electronics
• Energy Storage
• Sensors, etc.
Organic Electronics Graphene,
CNTs and CNWs
Organic Carbon
OVPD®/PVPD®/(TFE) PECVD
Increasing Equipment
Demand Expected by:
2016/2017
Increasing Equipment
Demand Expected by:
Beyond 2018
AIXTRON TECHNOLOGIES AND PRODUCTS

Summary and Outlook
OUTLOOK 8
• Tangible Growth Opportunities in Target Markets
• 2015 Outlook:
H2 growth supported by strong backlog 2015 revenues: between EUR 220 and EUR 250 million
Largest Contribution from LED, Power, Memory & Logic
EBITDA breakeven to be reached within H2/2015
• Disciplined Cost and Cash Management
Technology. Materials. Performance.

Financial Calendar & Contact Data
• October 2015 9M/2015 Results, Conference Call
• February 2016 FY 2015 Results, Conference Call
• April 2016 Q1/2016 Results, Conference Call
• May 25, 2016 Annual General Meeting, Aachen
For further information please contact:
Investor Relations & Corporate Communications AIXTRON SE Dornkaulstr. 2 52134 Herzogenrath, Germany
IR Team Europe Phone: +49 (241) 8909-444 Email: [email protected]
IR Team USA – Andrea Su Phone: +1 (408) 747-7140 ext. 1292 Email: [email protected]
9

AIXTRON SE Dornkaulstraße 2 52134 Herzogenrath Germany Phone +49 (2407) 9030-0 Fax +49 (2407) 9030-40 E-Mai [email protected]
AIXTRON – Our technology. Your future.
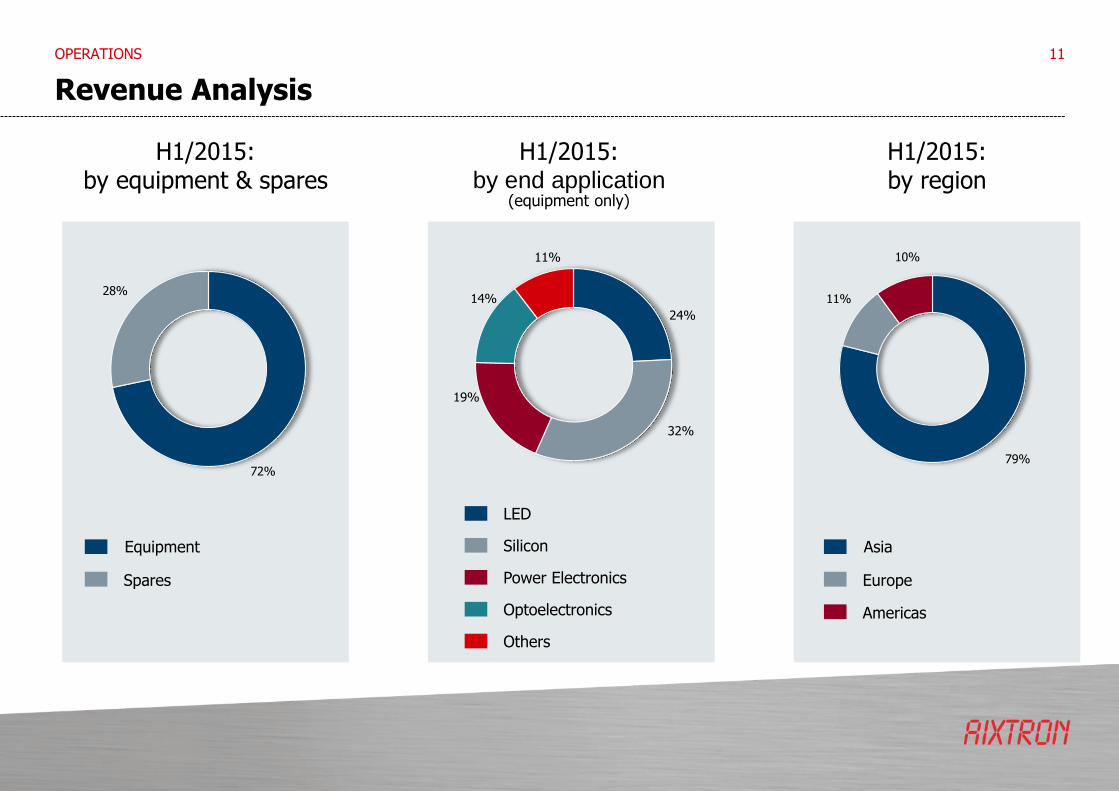
Revenue Analysis
OPERATIONS 11
H1/2015: by region
H1/2015: by equipment & spares
72%
28%
Spares
Equipment
H1/2015: by end application
(equipment only)
24%
32%
19%
14%
11%
79%
11%
10%
Americas
Europe
Asia
Power Electronics
Silicon
LED
Optoelectronics
Others

72.859.6 64.2 66.4 70.7 65.2
79.091.2
24 - Month Business Development
FINANCIALS 12
Q3/2013 Q4/2013 Q1/2014 Q2/2014 Q3/2014 Q4/2014 Q1/2015 Q2/2015
46.2 51.1 43.9 46.2 45.658.0
40.3 40.4
47.0 49.0 49.5 49.7 50.2 49.3 48.9 52.5Order Intake1
(€ million)
Total Revenues
Order Backlog
1) total order intake including spares & service from Q1/2015; adopted for Q2/2013~Q4/2014 for comparison reasons
USD order intake and backlog were recorded at the prevailing budget rate (2015: $1.25/€)
USD revenues were converted at the actual period average FX rate (H1/2015: $1.126/€)
*
@ $1.30
@ $1.30
@ 1.327
@ $1.35
@ $1.35
@ $1.334
*) revalued on Jan.1, 2015 to €69.0m at $1.25/€
@ $1.25
@ $1.25
@ $1.126