Embed Size (px)
Citation preview

Airtankers and wildfire management in the US ForestService: examining data availability and exploringusage and cost trends
Matthew P. ThompsonA,B, David E. CalkinA, Jason HerynkA,Charles W. McHughA and Karen C. ShortA
ARocky Mountain Research Station, US Forest Service, Missoula, MT, USA.BCorresponding author. Email: [email protected]
Abstract. Evaluating the effectiveness and efficiency of fixed- and rotary-wing aircraft is a crucial component ofstrategic wildfire management and planning. In this manuscript, we focus on the economics of fire and aviationmanagement within the US Forest Service. Substantial uncertainties challenge comprehensive analysis of airtanker use,
prompting calls from federal oversight agencies for improved aerial firefighting data collection and analysis. Here, weexplore the availability and sufficiency of agency aviation data to track airtanker use and cost trends, and to categoriseairtanker use bymission type and fire size class. Although the primary intended use of the airtanker fleet is for initial attack
of wildfires, our results indicate that the use of these aircraft tends to occur for extended attack or large- fire support, with asignificant number of flights associated with very large fires greater than 4047 ha (10 000 acres). Our results highlightapparent trends in airtanker use that challenge our ability to evaluate cost-effectiveness of airtankers. Data quality and
availability issues limited our analysis, leading to a recommendation for improved data collection on flight objective anddrop location. We conclude by offering suggested avenues of future research that may help address informationaland analytical shortcomings.
Additional keywords: aviation, cost–benefit analysis, suppression.
Received 22 March 2011, accepted 24 April 2012, published online 10 August 2012
Introduction
Evaluating the effectiveness and efficiency of fixed- and rotary-wing aircraft is a crucial component of strategic wildfire
management and planning. In this manuscript, we focus on theeconomics of fire and aviation management within the USForest Service, which currently contracts an aging fleet of fixed-
wing airtankers for wildfire management but is exploring fleetmodernisation opportunities. As of 2010, the airtanker fleetcomprised 19 surplus military aircraft, with model year rangingfrom 1954 to 1964, and retardant load capacity ranging from
7881L (2082 gallons) to 9653 L (2550 gallons). The ForestService recently released an airtanker modernisation strategy,which calls for updating the fleet with a mixture of Type 1
(.11 356L) and Type 2 (6813–11 353L) airtankers (USDAForest Service 2012). A fundamental tenet of the replacementstrategy, and of existing guidance for aerial firefighting, is that
airtanker use must be cost-effective (National WildfireCoordinating Group 2011). Challenging economic analysis ofairtanker use is substantial uncertainty regarding aerial fire-
fighting effectiveness, especially for large fires (Finney et al.
2009; USDA Office of Inspector General 2009).Thus improved aerial firefighting data collection and analy-
sis are warranted. This conclusion is shared by the US General
Accounting Office (US General Accounting Office 2007),which recommended the Forest Service develop improvedsystems for ‘recording and analysing data about the cost and
use of these assets at the time of the fire’. Further motivatinganalysis of airtanker use are questions from federal oversightagency investigations, economic analyses and investigative
reports regarding the efficiency of historic airtanker use(Donovan and Brown 2005; US General Accounting Office2007; Cart and Boxall 2008; Donovan et al. 2008). The possibleinefficient use of aviation resources is of great concern owing to
escalating suppression expenditures and limited success to datein achieving cost-containment objectives (USGeneral Account-ing Office 2009; USDA Office of Inspector General 2009). An
enhanced ability to characterise airtanker usage could highlightopportunities for increased efficiency and inform estimates offleet effectiveness.
A prerequisite for deriving estimates of airtanker effective-ness is the ability to track the location of airtanker drops andevaluate alignment of outcomes with specific mission objec-
tives, given information on the fire environment (weather,terrain, etc.). To date, this information has not been available,limiting opportunities to characterise effectiveness. Here, webegin by exploring the availability and sufficiency of extant
CSIRO PUBLISHING
International Journal of Wildland Fire
http://dx.doi.org/10.1071/WF11041
Journal compilation � IAWF 2012 www.publish.csiro.au/journals/ijwf

agency aviation data to answer these questions, and to the extentpossible, to quantify trends in airtanker use, cost and missiontype. Our work is not intended to be a comprehensive analysis of
federal fire-aviation management, but rather to highlight infor-mation deficiencies and to identify key research needs, inparticular as they relate to the prominent, policy-relevant
question of potential airtanker acquisition.The remainder of this manuscript is organised as follows:
first, we briefly review aerial firefighting and past studies that
have attempted to model effectiveness. Second, we providecontext for aerial firefighting and optimal fleet design in theUnited States. Third, we describe our analytical methods, whichentailed the design, creation and querying of a database assem-
bled from US Forest Service aviation, finance and fire incidentrecords in order to categorise and understand large-airtankeruse. After presenting results, we discuss implications of our
findings, and last, we conclude with recommended avenues offurther research.
Aerial firefighting and modelling studies
Wildfire-management aircraft perform a multitude of duties,
including reconnaissance, personnel and equipment transport,and, most relevant to this discussion, firefighting. Aviationfirefighting resources can create containment lines (hereafter,fireline(s)) before arrival of ground resources, can augment the
fireline-producing capacity of ground-based firefightingresources and can further provide point protection for structuresand other threatened assets. Types of aircraft include heli-
copters, single engine airtankers (SEATs), fixed-wing water-scooping aircraft (scoopers) and multi-engine large airtankers.These aerial resources differ in terms of costs, flight speed,
coverage distance, turnaround time, manoeuvrability, tankcapacity and the type and effectiveness of material (water,suppressant or retardant) able to be delivered.
Use of firefighting aircraft varies throughout the world,
a function of accumulated experience, management legacy,resource availability, environmental factors, fire regimes andassociated fire-management needs. In Australia, for instance,
helicopters and SEATS are common whereas scoopers andmulti-engine airtankers are thought to be less effective(Plucinski 2010; Plucinski et al. 2007). In the Mediterranean
countries of Europe, the close proximity of the sea to the mostflammable forest lands makes the use of scoopers quite preva-lent and helicopters are alsowidely used. In theUnited States, by
contrast, multi-engine airtankers play a predominant role infederal wildfire management, along with SEATS, helicoptersand limited use of very large airtankers and scoopers. Keyadvantages of airtankers include their ability to quickly travel
long distances to reach remote fires and their relatively largestorage capacity, which enables bursts of high fireline produc-tivity provided by retardant drops. For the purposes of this paper,
we limit our analysis to fixed-wing airtankers.Relative to ground-based resources, the main advantage of
aircraft use for wildfire suppression is their ability to quickly
reach the fire and prevent spread before the fire grows large(USDAForest Service andDOI 1995; USDAForest Service andDOI Bureau of Land Management 1996; McCarthy 2003; Fire
Program Solutions 2005; Plucinski et al. 2007; Ganewatta andHandmer 2009). As such, aircraft use in wildfire management isoften prioritised for initial attack operations, which are typically
defined by size limits or time windows within which the fireshould be contained. In the United States, the primary intendeduse of the airtanker fleet is for initial attackA of wildfires (Rey
and Scarlett 2004; USDAForest Service 2011). It is important tonote that definitions of initial attack, extended attack and large-fire support differ by purpose. For reporting purposes, firesgreater than 121 ha (300 acres) are generally considered large
wildland fires, and firefighting operations associated with themare described as in extended attack or large-fire support ratherthan initial-attack mode. Operationally, however, fires can be
much larger while still seeing initial-attack activities in the firstburn period and the National Wildfire Coordinating Groupglossary (see http://www.nwcg.gov/pms/pubs/glossary/index.
htm, accessed 1 November 2011) does not mention fire sizewhen defining extended attack.
Attempts at characterising the effect of aerial firefighting
typically model aircraft as creating containment lines withsuccessive drops and analyse outcomes by comparing the rateof fireline production with the rate of perimeter growth of thefire (Mees et al. 1994; Fried et al. 2006; Podur andMartell 2007;
Alexandridis et al. 2011). Aircraft differ from ground-basedfirefighting resources in response time, cycle time and firelineproduction rate. In this modelling context, where the cumulative
fireline building capacity of ground and aerial firefightingresources exceeds the growth rate of the fire, the fire issuccessfully contained. In practice, airtanker productivity varies
with environmental characteristics such as wind speed anddirection, flight and drop pattern, topography and fuel type,among other factors. Empirical investigations of effectiveness(George 1985) in operational firefighting environments across a
diversity of conditions to inform modelling efforts are quitelimited, although recent research using remote sensing techni-ques offers promise (Perez et al. 2011), as does formalised
incorporation of expert judgment (Plucinski et al. 2011).Information to support modelling efforts is particularly
limited for extended attack and for large-fire support operations.
Most investigations into the efficiency of aerial firefighting havefocussed exclusively on initial attack (Greulich and O’Regan1975; Hodgson and Newstead 1978; Greulich and O’Regan
1982; MacLellan and Martell 1996; Islam and Martell 1998;Fried et al. 2006). The literature contains very few applicationsof operations research to large-fire management problems(Martell 2007), which are limited by overly simplistic models
of fire (Hof et al. 2000), the acknowledgement that little isknown regarding aerial drop effectiveness (Mees and Strauss1992; Mees et al. 1994; Podur and Martell 2007), or a lack of
ability to distinguish productivity across suppression resources(Wei et al. 2011). Airtanker use for extended attack and large-fire support is more complex than initial attack, requiring not
AThe Forest Service FY 2011 Guidance for Use of Incident Job Codes (http://www.fs.fed.us/fire/ibp/cost_accounting/2011_incident_job_code_direction.pdf,
verified 2 July 2012) transitions to a lexicon using ‘initial response’ and ‘extended response’. Here, we largely retain the phrases ‘initial attack’ and ‘extended
attack’, which we consider more consistent with international use and past use within the US.
B Int. J. Wildland Fire M. P. Thompson et al.

only consideration of line-building capabilities but also theeffectiveness of retardant delivery for point protection and thebenefits of buying time by delaying rather than preventing
eventual fire spread. In summary, ‘the effectiveness of suppres-sion efforts on the progress or containment of large fires has notbeen modeled or even characterised, and it is presently not
known what or how different factors are related to successfulcontainment’ (Finney et al. 2009). Thus, we have a limited bodyof knowledge with which to analyse initial attack operations,
and insufficient knowledge and data to crediblymodel outcomeswith and without airtanker use for extended attack and large-firesupport.
Forest Service management of large airtankersin the United States
The Forest Service is faced with important questions of how toutilise existing, aging aircraft and how to safely and cost-
effectively manage future aviation firefighting. A report onaerial firefighting safety and effectiveness commissioned inresponse to fatal accidents in the 2002 fire season identified a
series of key problems, including that the safety record of fixed-wing aircraft and helicopters was unacceptable and that orga-nisational, structural and managerial factors could compromise
the safety and effectiveness of wildland fire management (BlueRibbon Panel 2002). In fiscal yearB 2004, the airtanker fleet wasreduced when the contracts with 33 airtankers comprising thenational Forest Service and Bureau of Land Management fleet
were terminated ‘due to concerns over their airworthiness’ (Reyand Scarlett 2004).
Earlier nationwide studies within the United States (USDA
Forest Service and DOI 1995; USDA Forest Service and DOIBureau of Land Management 1996) identified 38 airtankers asan optimal federal fleet size, based exclusively on meeting
initial attack demand. The studies further noted ‘extensiveuse’ of aircraft on fires larger than 40 ha (100 acres), and arguedfor an additional three airtankers for large-fire support (bringing
the total recommended fleet size to 41 airtankers). A 2005follow-up study (Fire Program Solutions 2005) confirmed theresults of these earlier studies, stating that airtankers are an‘integral component’ for initial attack.
Issues of data adequacy led the Forest Service to excludethese results in a recent submission to the Office ofManagementand Budget (USDA Office of Inspector General 2009). An
important limitation of these studies is that no attempt wasmade to model airtanker use on changing large-fire outcomes.Rather, observed historic use on large fires was implicitly
assumed to be efficient without examination of costs or contri-bution to suppression operations.
To briefly summarise, airtanker use in the United States issubject to uncertain trade-offs regarding safety and cost relative
to perceived effectiveness, and previous modelling effortsattempting to derive optimal fleet compositions have explicitlyassumed near-exclusive use for initial attack. Assumptions
regarding airtanker use and effectiveness have not to datebeen empirically demonstrated. Insufficient data thus make
performing a comprehensive cost-effectiveness analysis of largeairtanker use extremely challenging, if not altogether infeasible(USDA Office of Inspector General 2009). Understanding how
the current fleet is used is a necessary component to project howincreases or decreases in the current fleet size might changewildfire outcomes.
Methods
We queried US Forest Service aviation, finance and fire-incident records in order to categorise and understand largeairtanker use. In total, we obtained records for 20 765 flights.Our analysis required integrating information from multiple
platforms, and in some cases further required development ofheuristic logic to deal withmissing or incorrect data and a lack ofmetadata.We focussed on twomajor themes: (1) airtanker usage
and cost statistics (number of flights, flight time, etc.) and howthese may have changed in the wake of the fleet reduction and,more importantly, (2) airtanker mission type, in terms of initial
attack, extended attack and large-fire support. Owing to datasufficiency and availability issues, we were only able to analyseairtanker mission type for fiscal years 2007–10.
Analysing airtanker use and cost trends
We acquired airtanker empirical data from the US ForestService’s Aviation Business System (ABS) database. ABSbecame functional in 2007. It replaced and inherited records
from the Aviation Management Information System (AMIS),via phased implementation, as the system of record for ForestService aircraft usage data. We drew large-airtanker flight time
records on 28 October 2010 from the ABS Queries and Reportspage of the FAMWEB Data Warehouse (see http://famtest.nwcg.gov/fam-web/help/famweb_data_warehouse/fdw_topic_
areas/fdw_aviation_management.htm, accessed 24 February2012) for the entire United States for fiscal years 1993–2010.With these data, we then designed a database so we couldanalyse use and cost trends over time. The fundamental unit of
analysis is a flight, which is recorded every time an aircraft takesoff after reloading. A load can be split into multiple dropsdepending onmission objectives. Detailed descriptions of tables
and queries within the airtanker use database are available fromthe authors on request.
Analysing airtanker mission type
To characterise airtanker mission type requires informationregarding fire size and other characteristics of the incidents towhich aircraft were deployed, and ultimately requires clear
articulation of flight and overall incident objectives. Unfortu-nately, the ABS database does not directly provide this infor-mation. We adopted two approaches to characterise airtankermission type by proxy, first by incident job code use description
(Table 1), and second where feasible by matching flight recordsto fire perimeter information collected from the GeospatialMultiple-Agency Coordination (GeoMAC) Group (see
http://www.geomac.gov/, accessed 1 November 2011). Fig. 1provides a conceptual model of our relational database for
BIn the United States, a fiscal year extends from 1 October through 30 September. The fiscal year largely overlaps with typical fire seasons for most regions of
the country.
Analysing data availability and airtanker usage trends Int. J. Wildland Fire C

analysing airtanker missions, which relates three key piecesof information: the fire code, the incident job code and theflight date.C
The incident job code is an eight-digit alphanumeric stringthat links information about the flight mission and the fireincident. As an example, with ‘P6EK2P09’ the first character
(P) is the job use code, the second character (6) is the ForestService region number in which the fire is located, the third,fourth, fifth and sixth characters (EK2P) are a unique identifier
from the fire code system, and the last two digits (09) correspond
to the fiscal year. Job codes are assigned to every fire incidentfollowing guidance from the Incident Business Practices (IBP)website, which coordinates business practices for wildfire, non-
fire and Federal Emergency Management Agency emergencyresponses for the US Forest Service (see http://www.fs.fed.us/fire/ibp/archives/archives.html, accessed 1 November 2011).
We compiled job-code look-up tables using IBP job-codespreadsheets and related these back to job-use descriptions.
With the job-use descriptions, we aimed to ultimately classify
flights according to whether they were for initial-attack
CAMIS data did not include some of this information, so relating older flight information to incidents was difficult and could be incomplete.
Table 1. Airtanker job code use categories
Forest Service fiscal year 2011 job code descriptions use ‘response’ rather than ‘attack’
Use Description
Forest Service Extended response Extended response (.121 ha (300 acres)) and fires less than 121 ha (300 acres) that have
one of the following criteria: human-caused, trespass, expected reimbursement, cost share,
or a Type 1, 2 or 3 incident-management team assigned
Forest Service Initial response Initial response fires (,121 ha (300 acres)), false alarm codes and extended response fires
if less than 121 ha (300 acres)
FEMA Incident support Federal Emergency Management Agency support
BIA Support Bureau of Indian Affairs assistance
BLM Support Bureau of Land Management assistance
NPS Support National Park Service assistance
FWS Support Fish and Wildlife Service assistance
Non-wildland Federal Fire Departments Included but not limited to the Department of Defence and the Tennessee Valley Authority
Non-Federal support Forest Service support of non-federal fires
Severity assistance Assistance to the Department of the Interior severity authorisations
Staging Flights coded for prepositioning
Administratively Determined Support Training and work capacity testing
Resource benefit Lightning-caused fires that are managed for resource benefits
FAMWEB ABS database
Job code
Flight date
Job code
P 6 EK2P 09 Fiscal year
FSregioncode
Fire code
Approach 2:
GeoMAC fire perimeters
Fire code
Flight date
fire size classesJob use
descriptioncode
Approach 1:
IBPjob use
descriptions
job use descriptions
Fig. 1. Relational database model for analysing airtanker mission type. For all flights, we first analysed job use
code descriptions to characterise mission type (Approach 1). Further, for fires for which we could match flight
records (fire code and flight date) to GeoMAC fire perimeters (at the date of the drop), we analysed flights by fire
size (Approach 2).
D Int. J. Wildland Fire M. P. Thompson et al.

operations. Ideally, the job-use codes would classify flights intotwo fire size classes accurately for every agency: fires greaterthan and less than 121 ha (300 acres). Because the guidelines for
initial- and extended-attack classes overlap when fire sizes areless than 121 ha, it’s not clear what proportion of initial-attack-coded fires is in extended attack, and not clear what proportion
of extended-attack-coded fires are less than 121 ha.Because job code use descriptions do not clearly differenti-
ate fire size classes, we used fire perimeter data to ascertain
fire size. We matched flight records to fire perimeter sizeclasses using data collected from the GeoMAC group websitefor calendar years 2007–10. GeoMAC is an internet-basedmapping tool originally designed for fire managers to access
online maps of current fire locations and perimeters in theconterminous 48 states and Alaska. Perimeters are located byor submitted to GeoMAC from various sources and local field
offices. These data are then compiled and posted to anoutgoing database website through the Rocky Mountain Geo-graphic Science Center for downloading (http://rmgsc.cr.usgs.
gov/outgoing/geomac/historic_fire_data/, verified 2 July2012). Archive files contain all fire perimeters that werelocated by or submitted to GeoMAC for a given year. Current
archived datasets have perimeters dating back to the year 2000.We matched airtanker flights to fire perimeters by extractingthe four-digit alphanumeric fire code embedded within the jobcode and linking to the fire code within the GeoMAC fire
perimeters look-up table.The GeoMAC website is not an all-inclusive archive for all
fire incident data; 7546 flights could not be matched to a
GeoMAC fire perimeter. Fire perimeter compilation qualityvaries throughout the GeoMAC dataset for those fires we couldmatch (n¼ 13 219). Generally, fire perimeters are digitised into
a spatial format approximately once per day over the duration ofthe fire incident. From these data, we can extract an estimatedfire size from each daily perimeter. Using the fire code, we canmatch an airtanker flight to an approximate fire perimeter
size on the day of the flight using a simple parsing logic asdescribed below.
For an airtanker flight where the fire code matches a fire
perimeter code:
� if the flight date¼ perimeter date: assign the flight the
minimum recorded fire perimeter fire size (n¼ 7030)� if the flight date. latest perimeter date: assign the flight themaximum recorded fire perimeter size (n¼ 1812)
� if the flight date, latest perimeter date: assign the flight theminimum recorded fire perimeter size (n¼ 4377).
It is expected that this parsing scheme will reasonablycapture flight use by fire size, but errors are possible, particularly
regarding fire complexes. Fire complexes are areas that haveconcurrent fires indicated bymultiple polygons recorded for anygiven day within the GeoMAC perimeter dataset. Our parsing
logic assumes that airtankers are primarily used for initial attackand will assign a flight the minimum recorded size for all firesincluding fire complexes except when the flight date is greater
than the latest perimeter date. In this case, the maximumrecorded fire perimeter size is assigned to the flight. As anexample, assume that a fire complex has three separate polygons(x, y and z) with the following areas: x¼ 100 ha, y¼ 250 ha,
recorded on 9 July, and z¼ 1000 ha recorded on 12 July. Assumea flight flew to this fire complex on 9 July. Using the parsinglogic, the flightwill be assigned fire size x because the flight date
equals the perimeter date of 9 July, and the minimum perimetersize of 100 ha is assigned. If a flight occurred on 11 July, theflight is assigned fire perimeter y because the flight date is
greater than the perimeter date of 9 July and the maximumrecorded area is assigned from all perimeters recorded before theflight date. Finally, if a flight occurred on 15 July, the flight isassigned fire perimeter z because the flight date is greater than
the latest perimeter date.For summary purposes, we categorised flights with peri-
meter matches into 13 fire size classes. Traditionally, fire size
classes are broken into seven separate classes (A–G) eachrepresenting a range of fire sizes (see http://www.nwcg.gov/pms/pubs/glossary/index.htm). As size class G represents all
fires greater than 2023 ha (5000 acres), our ability to analyseairtanker use on very large fires that typically accrue thegreatest suppression costs would be limited. We therefore
added six additional fire size classes H–M. In our classificationscheme, we redefined fire size class G as 2023–4047 ha (5000–10 000 acres), and established H as 4047–8094 ha (10 000–20 000 acres) and I–L in 8094-ha (20 000 acre) increments up to
size class M, with size class M representing fires greater than40 469 ha (100 000 acres) in size.
Results
Airtanker use and cost trends
Fig. 2 summarises findings on airtanker flights logged (solid
line – left y-axis), average flights per airtanker (dashed line –right y-axis) and fleet size (marked lines – right y-axis) for fiscal
0
50
100
150
200
250
300
350
400
0
2000
4000
6000
8000
10 000
12 000
1992 1994 1996 1998 2000 2002 2004 2006 2008 2010 2012
Ave
rage
num
ber
of fl
ight
s an
d nu
mbe
r of
airt
anke
rs
Tot
al n
umbe
r of
flig
hts
Fiscal year
Number offlights
Average number offlights per airtanker
Number ofairtankers
Fig. 2. Summary findings for airtanker fleet size and utilisation trends
across fiscal years 1993–2010. Airtankers are contracted by calendar year,
though we report fleet size by fiscal year to be consistent with other
quantities reported from Aviation Business System (ABS).
Analysing data availability and airtanker usage trends Int. J. Wildland Fire E
years 1993–2010. The number of airtankers reported in the ABSdatabase as contracted to the Forest Service and flying withinany region ranged from a high of 44 in fiscal year 2002 to a low
of 16 in fiscal year 2005. In fiscal year 2004, the airtanker fleetreduction began, and by 2005, the airtanker fleet was 36% of itspeak size. The high inter-annual variability in airtanker use
reflects fire season variability, although some trends are evident.The number of flights per year expectedly experienced a sharpdrop in 2004 and in subsequent years, there are generally fewer
flights logged per year (1993–2003 average¼ 6606 flights;2005–2010 average¼ 5299 flights). However, the averagenumber of flights per aircraft per year increases dramaticallyafter 2004, peaking at 359.75 in 2006 and averaging 269.74
flights per airtanker per year for fiscal years 2005–10 (relative to175.75 for fiscal years 1993–2003).
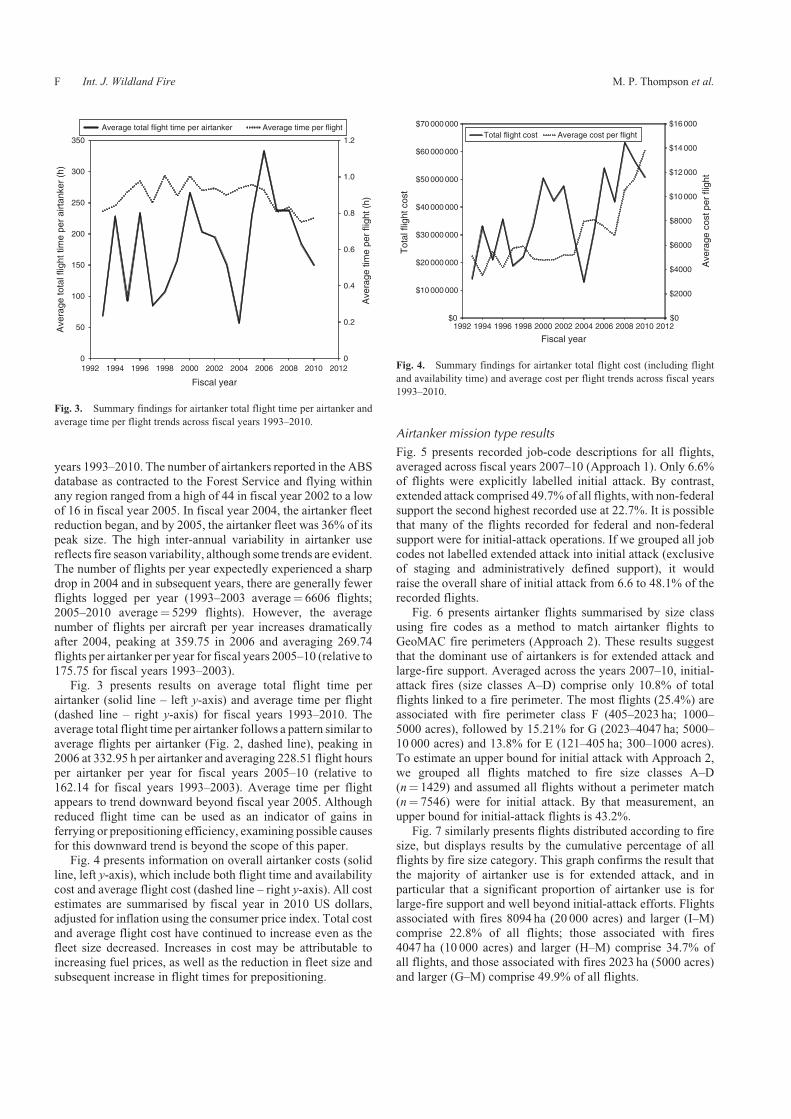
Fig. 3 presents results on average total flight time per
airtanker (solid line – left y-axis) and average time per flight(dashed line – right y-axis) for fiscal years 1993–2010. Theaverage total flight time per airtanker follows a pattern similar to
average flights per airtanker (Fig. 2, dashed line), peaking in2006 at 332.95 h per airtanker and averaging 228.51 flight hoursper airtanker per year for fiscal years 2005–10 (relative to
162.14 for fiscal years 1993–2003). Average time per flightappears to trend downward beyond fiscal year 2005. Althoughreduced flight time can be used as an indicator of gains inferrying or prepositioning efficiency, examining possible causes
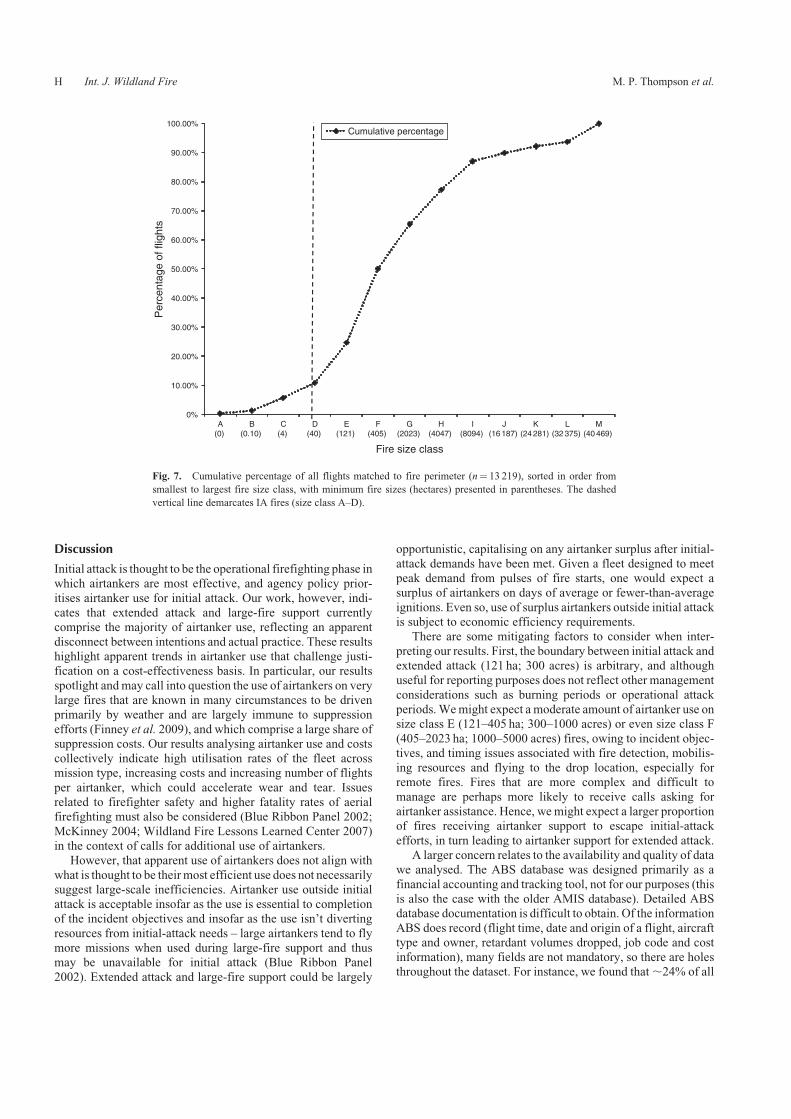
for this downward trend is beyond the scope of this paper.Fig. 4 presents information on overall airtanker costs (solid
line, left y-axis), which include both flight time and availability
cost and average flight cost (dashed line – right y-axis). All costestimates are summarised by fiscal year in 2010 US dollars,adjusted for inflation using the consumer price index. Total cost
and average flight cost have continued to increase even as thefleet size decreased. Increases in cost may be attributable toincreasing fuel prices, as well as the reduction in fleet size andsubsequent increase in flight times for prepositioning.
Airtanker mission type results
Fig. 5 presents recorded job-code descriptions for all flights,averaged across fiscal years 2007–10 (Approach 1). Only 6.6%of flights were explicitly labelled initial attack. By contrast,
extended attack comprised 49.7% of all flights, with non-federalsupport the second highest recorded use at 22.7%. It is possiblethat many of the flights recorded for federal and non-federal
support were for initial-attack operations. If we grouped all jobcodes not labelled extended attack into initial attack (exclusiveof staging and administratively defined support), it would
raise the overall share of initial attack from 6.6 to 48.1% of therecorded flights.
Fig. 6 presents airtanker flights summarised by size classusing fire codes as a method to match airtanker flights to
GeoMAC fire perimeters (Approach 2). These results suggestthat the dominant use of airtankers is for extended attack andlarge-fire support. Averaged across the years 2007–10, initial-
attack fires (size classes A–D) comprise only 10.8% of totalflights linked to a fire perimeter. The most flights (25.4%) areassociated with fire perimeter class F (405–2023 ha; 1000–
5000 acres), followed by 15.21% for G (2023–4047 ha; 5000–10 000 acres) and 13.8% for E (121–405 ha; 300–1000 acres).To estimate an upper bound for initial attack with Approach 2,we grouped all flights matched to fire size classes A–D
(n¼ 1429) and assumed all flights without a perimeter match(n¼ 7546) were for initial attack. By that measurement, anupper bound for initial-attack flights is 43.2%.
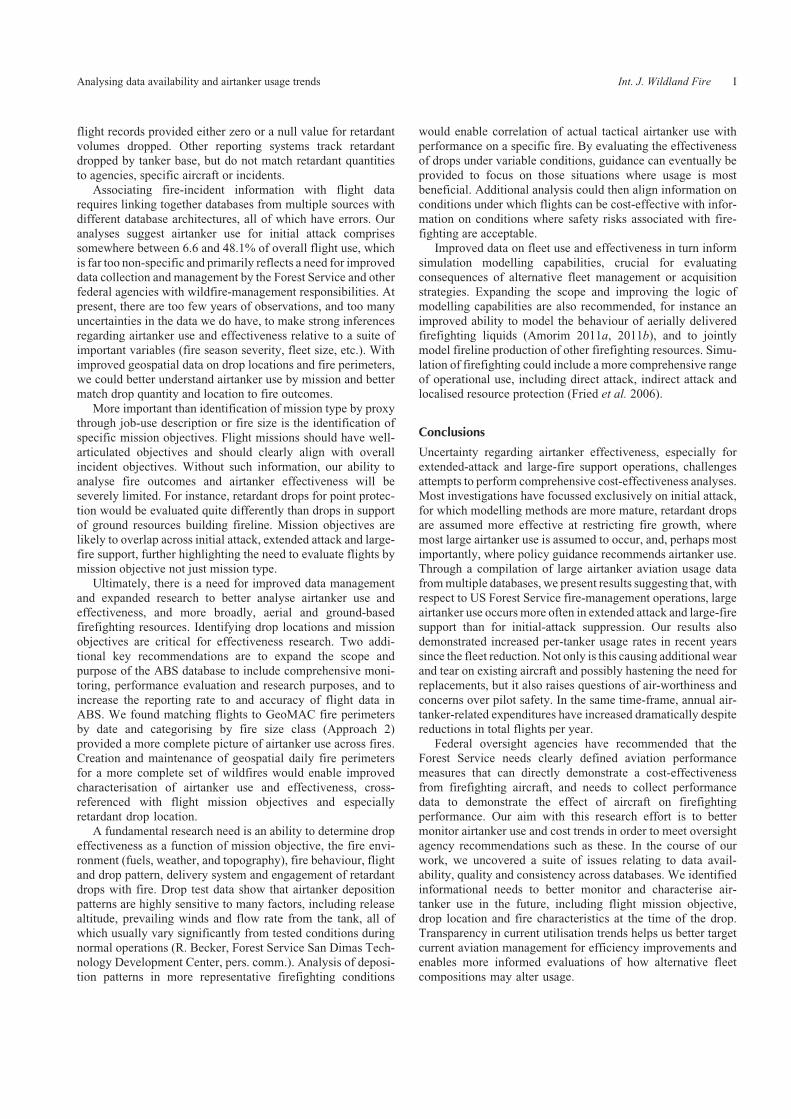
Fig. 7 similarly presents flights distributed according to firesize, but displays results by the cumulative percentage of allflights by fire size category. This graph confirms the result that
the majority of airtanker use is for extended attack, and inparticular that a significant proportion of airtanker use is forlarge-fire support and well beyond initial-attack efforts. Flights
associated with fires 8094 ha (20 000 acres) and larger (I–M)comprise 22.8% of all flights; those associated with fires4047 ha (10 000 acres) and larger (H–M) comprise 34.7% ofall flights, and those associated with fires 2023 ha (5000 acres)
and larger (G–M) comprise 49.9% of all flights.
0
0.2
0.4
0.6
0.8
1.0
1.2
0
50
100
150
200
250
300
350
1992 1994 1996 1998 2000 2002 2004 2006 2008 2010 2012A
vera
ge ti
me
per
fligh
t (h)
Ave
rage
tota
l flig
ht ti
me
per
airt
anke
r (h
)
Fiscal year
Average total flight time per airtanker Average time per flight
Fig. 3. Summary findings for airtanker total flight time per airtanker and
average time per flight trends across fiscal years 1993–2010.
$0
$2000
$4000
$6000
$8000
$10 000
$12 000
$14 000
$16 000
$0
$10 000 000
$20 000 000
$30 000 000
$40 000 000
$50 000 000
$60 000 000
$70 000 000
1992 1994 1996 1998 2000 2002 2004 2006 2008 2010 2012
Ave
rage
cos
t per
flig
ht
Tot
al fl
ight
cos
t
Fiscal year
Total flight cost Average cost per flight
Fig. 4. Summary findings for airtanker total flight cost (including flight
and availability time) and average cost per flight trends across fiscal years
1993–2010.
F Int. J. Wildland Fire M. P. Thompson et al.

In summary, data quality and reporting standards makedifficult an accurate assessment of airtanker mission type,although both approaches we adopted suggest significant use
for extended attack and large-fire support. Lower bounds
derived with both approaches put airtanker use for initial-attack operations in the range of 6.6–10.8% of all flights.Upper bounds put airtanker use for initial attack in the range of
43.2–48.1%.
0
500
FS exte
nded
resp
onse
FS initia
l res
pons
e
FEMA in
ciden
t sup
port
BLM su
ppor
tNPS su
ppor
t
Non-F
eder
al wild
land
fire
depa
rtmen
t
Non-F
eder
al su
ppor
t
Sever
ity a
ssist
ance
Stagin
gAD su
ppor
t
Resou
rce
bene
fit
FWS su
ppor
t
BIA su
ppor
t
1000
1500
2000
2500
3000
Ave
rage
num
ber
of fl
ight
s
Average number of flights (FY 2007–2010)
Job code use description
Fig. 5. Job code use descriptions for all airtanker flights averaged across fiscal years 2007–10 (x-axis labels
relate to job codes presented in Table 1).
0
100
200
300
400
500
600
700
800
900
A B C D E F G H I J K L M
Ave
rage
num
ber
of fl
ight
s
Fire size class
Average number of flights HectaresA: 0–0.10B: 0.10–4 C: 4–40 D: 40–121E: 121–405F: 405–2023G: 2023–4047H: 4047–8094I: 8094–16 187J: 16 187–24 281K: 24 281–32 375L: 32 375–40 469M: 40 469�
AcresA: 0–0.25B: 0.25–10C: 10–100D: 100–300E: 300–1000F: 1000–5000G: 5000–10 000H: 10 000–20 000I: 20 000–40 000J: 40 000–60 000K: 60 000–80 000L: 80 000–100 000M: 100 000�
Fig. 6. Airtanker flights by size class within the United States for fiscal years 2007–10, for fires with
perimeter matches (n¼ 13 219). Units are reported in acres, consistent with established USA federal fire
size classes for reporting purposes.
Analysing data availability and airtanker usage trends Int. J. Wildland Fire G
Discussion
Initial attack is thought to be the operational firefighting phase inwhich airtankers are most effective, and agency policy prior-
itises airtanker use for initial attack. Our work, however, indi-cates that extended attack and large-fire support currentlycomprise the majority of airtanker use, reflecting an apparent
disconnect between intentions and actual practice. These resultshighlight apparent trends in airtanker use that challenge justi-fication on a cost-effectiveness basis. In particular, our results
spotlight andmay call into question the use of airtankers on verylarge fires that are known in many circumstances to be drivenprimarily by weather and are largely immune to suppression
efforts (Finney et al. 2009), and which comprise a large share ofsuppression costs. Our results analysing airtanker use and costscollectively indicate high utilisation rates of the fleet acrossmission type, increasing costs and increasing number of flights
per airtanker, which could accelerate wear and tear. Issuesrelated to firefighter safety and higher fatality rates of aerialfirefighting must also be considered (Blue Ribbon Panel 2002;
McKinney 2004; Wildland Fire Lessons Learned Center 2007)in the context of calls for additional use of airtankers.
However, that apparent use of airtankers does not align with
what is thought to be theirmost efficient use does not necessarilysuggest large-scale inefficiencies. Airtanker use outside initialattack is acceptable insofar as the use is essential to completionof the incident objectives and insofar as the use isn’t diverting
resources from initial-attack needs – large airtankers tend to flymore missions when used during large-fire support and thusmay be unavailable for initial attack (Blue Ribbon Panel
2002). Extended attack and large-fire support could be largely
opportunistic, capitalising on any airtanker surplus after initial-attack demands have been met. Given a fleet designed to meetpeak demand from pulses of fire starts, one would expect asurplus of airtankers on days of average or fewer-than-average
ignitions. Even so, use of surplus airtankers outside initial attackis subject to economic efficiency requirements.
There are some mitigating factors to consider when inter-
preting our results. First, the boundary between initial attack andextended attack (121 ha; 300 acres) is arbitrary, and althoughuseful for reporting purposes does not reflect other management
considerations such as burning periods or operational attackperiods.Wemight expect a moderate amount of airtanker use onsize class E (121–405 ha; 300–1000 acres) or even size class F
(405–2023 ha; 1000–5000 acres) fires, owing to incident objec-tives, and timing issues associated with fire detection, mobilis-ing resources and flying to the drop location, especially forremote fires. Fires that are more complex and difficult to
manage are perhaps more likely to receive calls asking forairtanker assistance. Hence, wemight expect a larger proportionof fires receiving airtanker support to escape initial-attack
efforts, in turn leading to airtanker support for extended attack.A larger concern relates to the availability and quality of data
we analysed. The ABS database was designed primarily as a
financial accounting and tracking tool, not for our purposes (thisis also the case with the older AMIS database). Detailed ABSdatabase documentation is difficult to obtain. Of the information
ABS does record (flight time, date and origin of a flight, aircrafttype and owner, retardant volumes dropped, job code and costinformation), many fields are not mandatory, so there are holesthroughout the dataset. For instance, we found that,24% of all
0%
10.00%
20.00%
30.00%
40.00%
50.00%
60.00%
70.00%
80.00%
90.00%
100.00%
A(0)
B(0.10)
C(4)
D(40)
E(121)
F(405)
G(2023)
H(4047)
I(8094)
J(16 187)
K(24 281)
L(32 375)
M(40 469)
Per
cent
age
of fl
ight
s
Fire size class
Cumulative percentage
Fig. 7. Cumulative percentage of all flights matched to fire perimeter (n¼ 13 219), sorted in order from
smallest to largest fire size class, with minimum fire sizes (hectares) presented in parentheses. The dashed
vertical line demarcates IA fires (size class A–D).
H Int. J. Wildland Fire M. P. Thompson et al.
flight records provided either zero or a null value for retardantvolumes dropped. Other reporting systems track retardantdropped by tanker base, but do not match retardant quantities
to agencies, specific aircraft or incidents.Associating fire-incident information with flight data
requires linking together databases from multiple sources with
different database architectures, all of which have errors. Ouranalyses suggest airtanker use for initial attack comprisessomewhere between 6.6 and 48.1% of overall flight use, which
is far too non-specific and primarily reflects a need for improveddata collection and management by the Forest Service and otherfederal agencies with wildfire-management responsibilities. Atpresent, there are too few years of observations, and too many
uncertainties in the data we do have, to make strong inferencesregarding airtanker use and effectiveness relative to a suite ofimportant variables (fire season severity, fleet size, etc.). With
improved geospatial data on drop locations and fire perimeters,we could better understand airtanker use by mission and bettermatch drop quantity and location to fire outcomes.
More important than identification of mission type by proxythrough job-use description or fire size is the identification ofspecific mission objectives. Flight missions should have well-
articulated objectives and should clearly align with overallincident objectives. Without such information, our ability toanalyse fire outcomes and airtanker effectiveness will beseverely limited. For instance, retardant drops for point protec-
tion would be evaluated quite differently than drops in supportof ground resources building fireline. Mission objectives arelikely to overlap across initial attack, extended attack and large-
fire support, further highlighting the need to evaluate flights bymission objective not just mission type.
Ultimately, there is a need for improved data management
and expanded research to better analyse airtanker use andeffectiveness, and more broadly, aerial and ground-basedfirefighting resources. Identifying drop locations and missionobjectives are critical for effectiveness research. Two addi-
tional key recommendations are to expand the scope andpurpose of the ABS database to include comprehensive moni-toring, performance evaluation and research purposes, and to
increase the reporting rate to and accuracy of flight data inABS. We found matching flights to GeoMAC fire perimetersby date and categorising by fire size class (Approach 2)
provided a more complete picture of airtanker use across fires.Creation and maintenance of geospatial daily fire perimetersfor a more complete set of wildfires would enable improved
characterisation of airtanker use and effectiveness, cross-referenced with flight mission objectives and especiallyretardant drop location.
A fundamental research need is an ability to determine drop
effectiveness as a function of mission objective, the fire envi-ronment (fuels, weather, and topography), fire behaviour, flightand drop pattern, delivery system and engagement of retardant
drops with fire. Drop test data show that airtanker depositionpatterns are highly sensitive to many factors, including releasealtitude, prevailing winds and flow rate from the tank, all of
which usually vary significantly from tested conditions duringnormal operations (R. Becker, Forest Service San Dimas Tech-nology Development Center, pers. comm.). Analysis of deposi-tion patterns in more representative firefighting conditions
would enable correlation of actual tactical airtanker use withperformance on a specific fire. By evaluating the effectivenessof drops under variable conditions, guidance can eventually be
provided to focus on those situations where usage is mostbeneficial. Additional analysis could then align information onconditions under which flights can be cost-effective with infor-
mation on conditions where safety risks associated with fire-fighting are acceptable.
Improved data on fleet use and effectiveness in turn inform
simulation modelling capabilities, crucial for evaluatingconsequences of alternative fleet management or acquisitionstrategies. Expanding the scope and improving the logic ofmodelling capabilities are also recommended, for instance an
improved ability to model the behaviour of aerially deliveredfirefighting liquids (Amorim 2011a, 2011b), and to jointlymodel fireline production of other firefighting resources. Simu-
lation of firefighting could include a more comprehensive rangeof operational use, including direct attack, indirect attack andlocalised resource protection (Fried et al. 2006).
Conclusions
Uncertainty regarding airtanker effectiveness, especially forextended-attack and large-fire support operations, challengesattempts to perform comprehensive cost-effectiveness analyses.Most investigations have focussed exclusively on initial attack,
for which modelling methods are more mature, retardant dropsare assumed more effective at restricting fire growth, wheremost large airtanker use is assumed to occur, and, perhaps most
importantly, where policy guidance recommends airtanker use.Through a compilation of large airtanker aviation usage datafrommultiple databases, we present results suggesting that, with
respect to US Forest Service fire-management operations, largeairtanker use occurs more often in extended attack and large-firesupport than for initial-attack suppression. Our results alsodemonstrated increased per-tanker usage rates in recent years
since the fleet reduction. Not only is this causing additional wearand tear on existing aircraft and possibly hastening the need forreplacements, but it also raises questions of air-worthiness and
concerns over pilot safety. In the same time-frame, annual air-tanker-related expenditures have increased dramatically despitereductions in total flights per year.
Federal oversight agencies have recommended that theForest Service needs clearly defined aviation performancemeasures that can directly demonstrate a cost-effectiveness
from firefighting aircraft, and needs to collect performancedata to demonstrate the effect of aircraft on firefightingperformance. Our aim with this research effort is to bettermonitor airtanker use and cost trends in order to meet oversight
agency recommendations such as these. In the course of ourwork, we uncovered a suite of issues relating to data avail-ability, quality and consistency across databases. We identified
informational needs to better monitor and characterise air-tanker use in the future, including flight mission objective,drop location and fire characteristics at the time of the drop.
Transparency in current utilisation trends helps us better targetcurrent aviation management for efficiency improvements andenables more informed evaluations of how alternative fleetcompositions may alter usage.
Analysing data availability and airtanker usage trends Int. J. Wildland Fire I
Continued work is necessary to evaluate the effectiveness oflarge airtanker firefighting and, more broadly, of firefightingeffectiveness in general. Similar work identifying data avail-
ability and sufficiency is necessary across the spectrum offirefighting resources and how effectiveness and resource usevary with other factors such as fire season severity and high
levels of synchronous demand for firefighting resources.Analysis of airtanker trends in concert with analysis of theroles and use of other resources, in particular aviation resources
that may substitute for airtankers (single-engine airtankers,scoopers, helicopters) would allow a more comprehensiveevaluation of fire and aviation management.
Acknowledgements
Wewould like to thank Diane Tretheway, Aaron Schoolcraft and Paul Linse
for their reviews and comments, as well as anonymous referees and the
editorial board. Thanks also to Bob Roth and Ryan Becker for their expertise
and input.
References
AlexandridisA, Russo L, Vakalis D, Bafas GV, Siettos CI (2011)Wildland
fire spread modelling using cellular automata: evolution in large-scale
spatially heterogeneous environments under fire suppression tactics.
International Journal of Wildland Fire 20, 633–647. doi:10.1071/
WF09119
Amorim JH (2011a) Numerical modelling of the aerial drop of firefighting
agents by fixed-wing aircraft. Part I: model development. International
Journal of Wildland Fire 20, 384–393. doi:10.1071/WF09122
Amorim JH (2011b) Numerical modelling of the aerial drop of firefighting
agents by fixed-wing aircraft. Part II: model validation. International
Journal of Wildland Fire 20, 394–406. doi:10.1071/WF09123
Blue Ribbon Panel (2002) Federal aerial firefighting: assessing safety and
effectiveness. Blue Ribbon Panel Report to the Chief, USDA Forest
Service and Director, USDI Bureau of Land Management. Available at
http://www.wildlandfire.com/docs/2003_n_before/BRP_Final12052002-1.
pdf [Verified 1 November 2011]
Cart J, Boxall B (2008) Air tanker drops in wildfires are often just for show.
Los Angeles Times 29 July 2008. Available at http://www.latimes.com/
news/local/la-me-wildfires29-2008jul29,0,5666042.story [Verified 24
February 2012]
Donovan GH, Brown TC (2005) An alternative incentive structure for
wildfire management on National Forest Land. Forest Science 51(5),
387–395.
Donovan GH, Brown TC, Dale L (2008) Incentives and wildfire manage-
ment in the United States. In ‘The Economics of Forest Disturbance’.
(Eds TP Holmes,JP Prestemon, and KL Abt) pp. 323–340. (Springer
ScienceþBusiness Media BV: Dordrecht, The Netherlands)
Finney MA, Grenfell IC, McHugh CW (2009) Modeling containment of
large wildfires using generalized linear mixed-model analysis. Forest
Science 55(3), 249–255.
Fire Program Solutions (2005) Wildland Fire Management Aerial Applica-
tion Study. Available at http://www.fs.fed.us/fire/publications/aviation/
nats3_wfmaas_report_final.pdf [Verified 2 July 2012]
Fried JS, Gilles JK, Spero J (2006)Analysing initial attack onwildland fires
using stochastic simulation. International Journal of Wildland Fire 15,
137–146. doi:10.1071/WF05027
Ganewatta G, Handmer J (2009) The cost-effectiveness of aerial firefighting
in Australia. Bushfire CRC, Technical Report A.09.01. (Melbourne)
George CW (1985) An operational retardant effectiveness study. Fire
Management Notes 46(2), 18–23.
Greulich FE, O’Regan WG (1975) Allocation model for air tanker initial
attack in firefighting. USDA Forest Service, Research Note PSW-301.
Pacific Southwest Forest and Range Experiment Station. (Berkeley, CA)
Greulich FE, O’Regan WG (1982) Optimum use of air tankers in initial
attack: selection, basing, and transfer rules. USDA Forest Service,
Research Paper PSW-163. Pacific Southwest Forest and Range Experi-
ment Station. (Berkeley, CA)
Hodgson MJ, Newstead RG (1978) Location-allocation models for one-
strike initial attack of forest fires by airtanker. Canadian Journal of
Forest Research 8(2), 145–154. doi:10.1139/X78-024
Hof J, Omi PN, Bevers M, Laven RD (2000) A timing-oriented approach
to spatial allocation of fire management effort. Forest Science 46(3),
442–451.
Islam KMS, Martell DL (1998) Performance of initial attack airtanker
systems with interacting bases and variable initial attack ranges.
Canadian Journal of Forest Research 28(10), 1448–1455. doi:10.1139/
X98-127
MacLellan JI, Martell DL (1996) Basing airtankers for forest fire control
in Ontario. Operations Research 44(5), 677–686. doi:10.1287/OPRE.
44.5.677
Martell DL (2007) Forest fire management. In ‘Handbook of Operations
Research in Natural Resources’. (Eds A Weintraub, C Romero,
T Bjørndal, R Epstein and J Miranda) (Springer: New York)
McCarthy GJ (2003) Effectiveness of aircraft operations by the Department
of Natural Resources and Environment and the Country Fire Authority
1997–1998. Department of Sustainability and Environment, Victoria,
Research Report Number 52. (Melbourne)
McKinney E, Jr (2004) Learning by fire: the learning challenges facing US
Forest Service aviation. Government Information Quarterly 21, 86–98.
doi:10.1016/J.GIQ.2003.11.002
Mees R, Strauss D (1992) Allocating resources to large wildland fires:
a model with stochastic production rates. Forest Science 38(4),
842–853.
Mees R, Strauss D, Chase R (1994) Minimizing the cost of wildland fire
suppression: a model with uncertainty in predicted flame length and fire-
line width produced. Canadian Journal of Forest Research 24,
1253–1259. doi:10.1139/X94-164
National Wildfire Coordinating Group (2011) Interagency aerial supervi-
sion guide, InteragencyAerial SupervisionGuide PMS505,NFES2544.
Available at http://www.nwcg.gov/pms/pubs/pms505.pdf [Verified 1
November 2011]
Perez Y, Pastor E, Plana E, Plucinski M, Gould J (2011) Computing forest
fires aerial suppression effectiveness by IR monitoring. Fire Safety
Journal 46, 2–8. doi:10.1016/J.FIRESAF.2010.06.004
Plucinski MP (2010) ‘Evaluation of the Effectiveness of the 10 Tanker Air
Carrier DC-10 Airtanker, Victoria 2010.’ (Bushfire CRC: Melbourne)
Plucinski M, Gould J, McCarthy G, Hollis J (2007) The effectiveness and
efficiency of aerial firefighting in Australia, Part 1. Bushfire CRC,
Technical Report A0701. (Melbourne)
PlucinskiMP, McCarthy GJ, Hollis JJ, Gould JS (2011) The effect of aerial
suppression on the containment time ofAustralianwildfires estimated by
fire-management personnel. International Journal of Wildland Fire.
doi:10.1071/WF11063
Podur JJ, Martell DL (2007) A simulation model of the growth and
suppression of large forest fires in Ontario. International Journal of
Wildland Fire 16, 285–294. doi:10.1071/WF06107
Rey M, Scarlett L (2004) Statement before Senate Commerce Committee
concerning firefighting aircraft safety. Available at http://www.fs.fed.
us/congress/108/senate/oversight/rey/060204.html [Verified 1 Novem-
ber 2011]
US General Accounting Office (2007) Wildland fire management: lack of
clear goals or a strategy hinders Federal Agencies’ efforts to contain the
costs of fighting fires. GAO-07-655. Available at http://www.gao.gov/
products/GAO-07-655 [Verified 2 July 2012]
J Int. J. Wildland Fire M. P. Thompson et al.

US General Accounting Office (2009) Wildland fire management: Federal
Agencies have taken important steps forward, but additional action is
needed to address remaining challenges. GAO-09-906T. Available at
http://www.gao.gov/products/GAO-09-906T [Verified 2 July 2012]
USDAForest Service (2011)National exclusive use airtanker service contract,
Section C-1A. USDA Forest Service. (Washington, DC) Available at
www.fs.fed.us/fire/contracting/airtankers/airtanker_contract.pdf [Veri-
fied 1 November 2011]
USDA Forest Service (2012) Large airtanker modernization strategy.
Available at http://www.fs.fed.us/fire/aviation/airtanker_modernization_
strategy.pdf [Verified 26 February 2012]
USDAForest Service andDOI (1995)National study of airtankers to support
initial attack and large fire suppression. Final Report Phase 1. Available
at http://www.fs.fed.us/fire/publications/aviation/nats1_report.pdf
[Verified 2 July 2012]
USDA Forest Service and DOI Bureau of Land Management (1996)
National study of large airtankers to support initial attack and large fire
suppression. Final Report Phase 2.
USDA Office of Inspector General (2009) Audit report: Forest Service’s
replacement plan for firefighting aerial resources. Report Number
08601–53-SF. Available at http://www.usda.gov/oig/webdocs/08601-
53-SF.pdf [Verified 1 November 2011]
Wei Y, Rideout DB, Hall TB (2011) Toward efficient management of large
fires: a mixed integer programming model and two iterative approaches.
Forest Science 57(5), 435–447.
Wildland Fire Lessons Learned Center (2007) Air operations on the fireline:
lessons learned. Scratchline 2007(21). Available at http://wildfirelessons.
net/documents/Scratchline_Issue21.pdf
www.publish.csiro.au/journals/ijwf
Analysing data availability and airtanker usage trends Int. J. Wildland Fire K