Embed Size (px)
Citation preview

IC
F A
irtig
htn
ess Stu
dy
Airtightness D
ata A
nalysis for Low
-R
ise and M
id
-Rise Resid
ential Buildings
Project 11872.000
To:
ICF Manufacturers Association
Ottawa, Ontario
Revised January 21, 2019 by
RDH Building Science Laboratories
167 Lexington Court #5
Waterloo ON N2J 4R9


11872_000 2019 01 21 ICF Airtightness.docx
Contents
Summary 1
1 Introduction 1
1.1 Insulating Concrete Form (ICF) Basics 1
1.2 Building Enclosure Control Functions 2
1.3 The Importance of Airflow Control 3
1.4 Airtightness Metrics 3
2 Air Barrier Systems in ICF Buildings 5
2.1 Air Impermeability of ICF Wall Systems 5
2.2 Air Barrier Continuity of ICF Wall Systems 5
2.3 Durability of Residential Air Barriers 8
2.4 Strength and Stiffness of Residential Air Barriers 9
2.5 Previous Studies of ICF Wall System Airtightness 10
3 Low-Rise ICF Residential Airtightness Data 12
3.1 Overview of Low-Rise ICF Residential Dataset 12
3.2 Low-Rise ICF Residential Case Study: Port Perry House 13
3.3 Comparison to Typical Wood Frames Houses 13
4 Mid-Rise ICF Residential Airtightness Data 20
4.1 Cedar Creek ICF Apartment 20
4.2 Comparison to Typical Mid-Rise Residential Buildings 20
5 Conclusions and Recommendations 22
5.1 Low-Rise ICF Housing Airtightness Insights 22
5.2 Mid-Rise ICF Housing Airtightness Insights 22
Appendices
Appendix A Study ICF Airtightness Dataset

Contents (continued)…
11872_000 2019 01 21 ICF Airtightness.docx
List of Figures
Figure 1.1 Diagram of Typical ICF Wall 1
Figure 1.2 Airflow/Air Leakage Rate 4
Figure 1.3 Air Change Rate 5
Figure 2.1 ICF Wall Section 6
Figure 2.2 Wood Framed Wall w/ Airtight Drywall Approach Air Barrier 7
Figure 2.3 Distribution of Air Leakage in Houses 8
Figure 2.4 Photo of Building Paper after 30 years Behind Wood Siding. 9
Figure 2.5 Poor House Wrap Installation 9
Figure 2.6 Wind Pumping of Loose Laid Sheet Air Barriers 10
Figure 3.1 Airtightness Data for ICF Houses from All Studies 12
Figure 3.2 Canadian Houses Airtightness vs Vintage 14
Figure 3.3 US Houses Airtightness vs Vintage 14
Figure 3.4 Canadian Housing Airtightness vs Location Plot 15
Figure 3.5 US Housing Airtightness vs Climate Zone 15
Figure 3.6 US Housing Airtightness vs Location Plot 16
Figure 3.7 Airtightness and Location of ICF Houses in the ICFMA-MIT
Dataset 16
Figure 3.8 Airtightness and ASHRAE Climate Zone of ICF Houses in the
ICFMA-MIT 17
Figure 3.9 Analysis of Building Forms Effects on ACH 18
Figure 3.10 Airtightness vs Conditioned Floor Area for ICF Houses: ICFMA,
ORNL & MIT Datasets 19
Figure 3.11 US and Canadian House Size Trends 19
Figure 4.1 RDH Study Mid Rise Residential Airtightness Data Sources 20
Figure 4.2 Airtightness vs Year of Construction w/ICF Data Point 21

11872.000 RDH Building Science Laboratories Page 1
Summary
This report provides a dataset and analysis of airtightness measurements for low-rise (1
to 3 storey) and mid-rise (4 to 6 storey) residential Insulating Concrete Form (ICF)
buildings provided by ICF Manufacturers Association (ICFMA) members and published
studies.
Published airtightness data indicates that typical Canadian houses are on average better
than 4 ACH50 and US houses better than 5 ACH50. The average airtightness of 49 ICF
houses collected from ICFMA for this study was found to be 1.26 ACH50. This is
significantly better than the performance expected for typical wood frame housing.
The potential for decay of air barrier systems in modern wood framed houses has not
been well studied to date. However, ICF walls are expected to have a long-term
airtightness performance benefit over loose-laid house wrap air barriers in that they are
rigid, strong, durable, and continuous in the field of the wall.
Several general insights on air tightness of houses are explored in this study and are
useful to the ICF industry for developing air tightness strategies for energy code
compliance in various climate zones within North American markets:
→ Houses in cold climates are expected to be more air tight than houses in hot
climates.
→ Local construction quality and approaches as well as local energy efficiency
programs appear to also significantly affect airtightness.
→ Attached houses are expected to have greater measured air leakage than
detached houses due to air leakage between units (Canadian codes suggest a 0.5
ACH50 penalty).
→ There is a significant reduction in ACH50 expected for larger buildings due to
form factor advantages within the calculation - linear regression analysis applied
in the ICF house samples in this study shows a 0.09 ACH50 improvement in
airtightness values for every additional 1000 sqft of conditioned floor area.
The airtightness of the one mid-rise residential ICF building received for this study with
published results had good airtightness, and the air leakage paths in the building were
similar to those reported for other mid/high rise multiunit residential building. This study
also showed that ICF walls are expected to have better and more reliable airtightness than
walls systems using loose laid house wrap as air barriers; however, more data is needed
to draw more specific insights.


11872.000 RDH Building Science Laboratories Page 1
1 Introduction
The purpose of this study is to generate an understanding of the airtightness of insulating
concrete form (ICF) low-rise and mid-rise residential buildings relative to typical North
American wood frame construction. This report presents a collection of measured data on
ICF low- and mid-rise residential buildings provided by ICFMA members and from other
published studies. The datasets are further analyzed for impact of factors such as
location/climate and building size on airtightness. Finally, the report concludes with a
discussion of the linkages between this study and the next task, reviewing energy codes
in the US and Canada.
1.1 Insulating Concrete Form (ICF) Basics
Insulating concrete form (ICF) is a system of concrete formwork made of rigid insulation
that stays in place after the concrete is poured. ICF systems typically consist of light-
weight expanded polystyrene (EPS) modular units that are designed to be dry stacked to
create the desired above or below grade wall; interior webs maintain the distance between
the inner and outer layers of EPS insulation. The ICF wall with reinforcement is filled with
concrete, creating a fully insulated monolithic cast-in-place concrete core. Figure 1.1
illustrates the components of a typical ICF wall.
Figure 1.1 Diagram of Typical ICF Wall
Fox Blocks Graphic

Page 2 RDH Building Science Laboratories 11872.000
1.2 Building Enclosure Control Functions
The building enclosure is a system of materials, components and assemblies that
physically separate the exterior and interior environments. It comprises various elements
including: roofs, above-grade walls, windows, doors, skylights, below-grade walls and
floors. In combination, these assemblies must control water, air, heat, water vapour, fire,
smoke and sound. The diagram below lists major enclosure control functions and
associated critical barriers.
In a typical ICF wall, liquid water (e.g. rain, snow melt, etc.) control is typically addressed
with cladding installed outboard of the ICF system. The outer surface of the ICF shell is
typically used as the water resistive barrier behind the cladding. Intersections, windows,
doors, and other penetrations must be drained, sealed, and/or detailed to prevent
the penetration of liquid water beyond these water control layers.
The continuous concrete as well as the interior and exterior rigid insulation board skins
all provide resistance to airflow in a typical ICF wall. Unlike conventional wood frame
construction, ICF walls do not rely on membranes and tapes for air barrier continuity in
the field of the wall area.
Resistance to heat flow in a typical ICF wall assembly is provided by the rigid insulation
shell. The continuous EPS layers on the interior and exterior of the concrete are
uninterrupted by framing and therefore provide the full R-value of the insulation. If
desired, additional insulation can be installed outboard of the ICF wall behind the exterior
cladding or within the ICF cavity with an EPS insulation insert.
The location of the thermal control layer(s) in conventional wood frame construction has
important implications for durability. If there is more insulation on the interior than the
exterior of the sheathing plane, discontinuities in the air control layer increases the risk of
air leakage vapour condensation. ICF wall assemblies are less susceptible to these
durability issues because both the concrete core and EPS shell provide sufficient vapor
diffusion resistance to control vapor driven from either direction. Furthermore, unlike
conventional wood frame construction, the materials of the ICF wall itself are not
susceptible to moisture related issues.

11872.000 RDH Building Science Laboratories Page 3
1.3 The Importance of Airflow Control
Building airflow can typically be characterized as either air leakage, natural ventilation or
mechanical ventilation. "Air leakage" is unintentional and uncontrolled airflow through
inadvertent openings in an enclosure.
The restriction of air leakage by the air barriers system is one of the most important
functions of the building enclosure. This is because air is a transport mechanism for
water, vapour, heat energy, sound, and airborne contaminants. Uncontrolled air leakage
can lead to moisture issues from condensation, discomfort, energy waste, and poor
indoor air quality.
Building codes acknowledge the importance of controlling unintended airflow by requiring
that building enclosures include an air barrier. Air barrier design requires careful
consideration of materials, components, transitions, and penetration details to provide a
durable and continuous air barrier across the entire building enclosure.
Airflow control in typical ICF buildings is the primary focus of this report.
1.4 Airtightness Metrics
The ability of the building enclosure to resist airflow is often quantified in terms of
various airtightness metrics. Airtightness testing is typically completed at the building
level using blower fans to pressurize and depressurize the whole building. The various
measured results of testing, including fan airflow and pressure difference across the
enclosure, are used to indicate the overall building airtightness characteristics and
performance level.
Unless otherwise specified, airtightness metrics refer to the performance of a building as
a whole. It is important to highlight that the reported airtightness values of low- and mid-
rise ICF buildings in this report reflect not only the performance of the ICF walls and
associated details but also the performance of other building enclosure assemblies (such
as floors and roofs) and the airtightness of mechanical system distribution and
penetrations. Common airtightness testing metrics are summarized below.
1.4.1 Airflow / Air Leakage Rate
The total airflow or air leakage rate is the volume of the air per unit time required to
maintain a given pressure difference across the test boundary. In airtightness testing, a
fan is used to draw air into or expel air from a building to maintain a specified level of
pressurization or depressurization. Since airflow into a building must equal airflow out of
the building, airflow through the fan represents the leakage airflow across the boundary.
This is determined from a power law equation for flow, Q (L/s or cfm), at a given pressure
difference (∆P):
𝑄∆𝑃 = 𝐶∆𝑃𝑛
The airflow must be given at a specific pressure difference (ΔP) for it to be meaningful and
is denoted as QΔP; 50 Pa and 75 P are commonly reported values. The flow coefficient, C,
and the flow exponent, n, are determined from airtightness testing and are unique to
each test instance. This is summarized in Figure 1.2 below.
Page 4 RDH Building Science Laboratories 11872.000
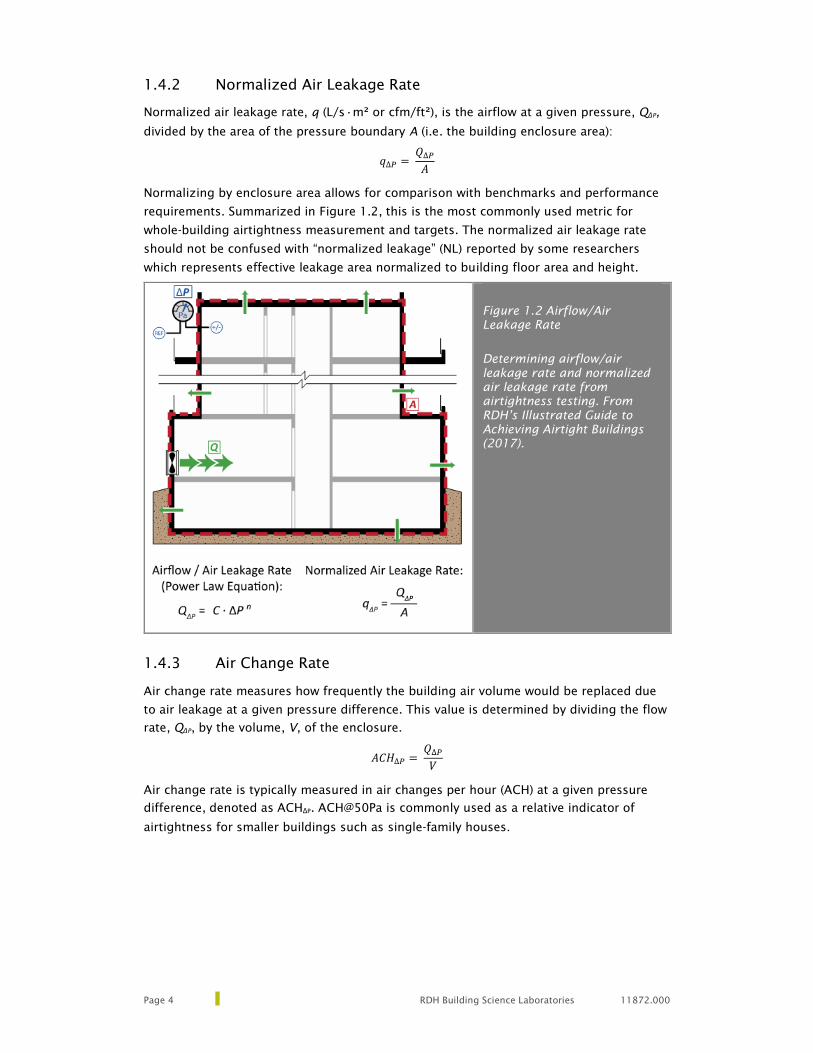
1.4.2 Normalized Air Leakage Rate
Normalized air leakage rate, q (L/s∙m² or cfm/ft²), is the airflow at a given pressure, QΔP,
divided by the area of the pressure boundary A (i.e. the building enclosure area):
𝑞∆𝑃 = 𝑄∆𝑃
𝐴
Normalizing by enclosure area allows for comparison with benchmarks and performance
requirements. Summarized in Figure 1.2, this is the most commonly used metric for
whole-building airtightness measurement and targets. The normalized air leakage rate
should not be confused with “normalized leakage” (NL) reported by some researchers
which represents effective leakage area normalized to building floor area and height.
Figure 1.2 Airflow/Air
Leakage Rate
Determining airflow/air
leakage rate and normalized
air leakage rate from
airtightness testing. From
RDH’s Illustrated Guide to
Achieving Airtight Buildings
(2017).
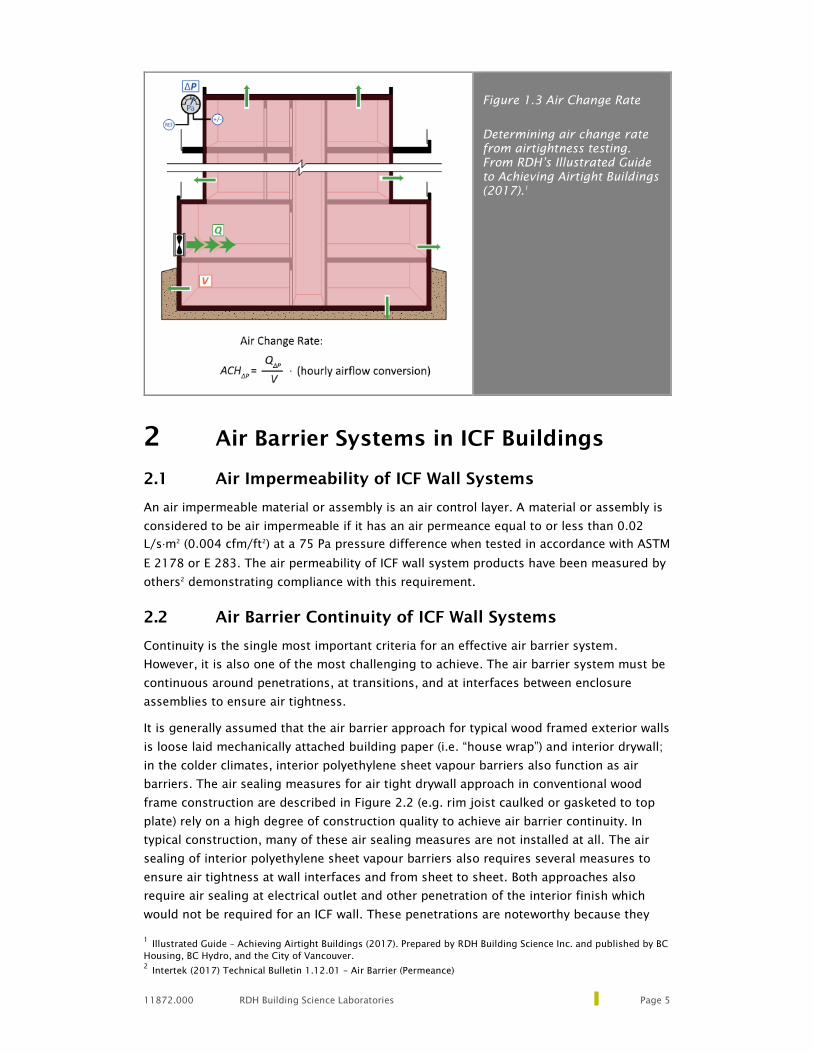
1.4.3 Air Change Rate
Air change rate measures how frequently the building air volume would be replaced due
to air leakage at a given pressure difference. This value is determined by dividing the flow
rate, QΔP, by the volume, V, of the enclosure.
𝐴𝐶𝐻∆𝑃 = 𝑄∆𝑃
𝑉
Air change rate is typically measured in air changes per hour (ACH) at a given pressure
difference, denoted as ACHΔP. ACH@50Pa is commonly used as a relative indicator of
airtightness for smaller buildings such as single-family houses.
11872.000 RDH Building Science Laboratories Page 5
Figure 1.3 Air Change Rate
Determining air change rate
from airtightness testing.
From RDH’s Illustrated Guide
to Achieving Airtight Buildings
(2017).1
2 Air Barrier Systems in ICF Buildings
2.1 Air Impermeability of ICF Wall Systems
An air impermeable material or assembly is an air control layer. A material or assembly is
considered to be air impermeable if it has an air permeance equal to or less than 0.02
L/s·m2
(0.004 cfm/ft2
) at a 75 Pa pressure difference when tested in accordance with ASTM
E 2178 or E 283. The air permeability of ICF wall system products have been measured by
others2
demonstrating compliance with this requirement.
2.2 Air Barrier Continuity of ICF Wall Systems
Continuity is the single most important criteria for an effective air barrier system.
However, it is also one of the most challenging to achieve. The air barrier system must be
continuous around penetrations, at transitions, and at interfaces between enclosure
assemblies to ensure air tightness.
It is generally assumed that the air barrier approach for typical wood framed exterior walls
is loose laid mechanically attached building paper (i.e. “house wrap”) and interior drywall;
in the colder climates, interior polyethylene sheet vapour barriers also function as air
barriers. The air sealing measures for air tight drywall approach in conventional wood
frame construction are described in Figure 2.2 (e.g. rim joist caulked or gasketed to top
plate) rely on a high degree of construction quality to achieve air barrier continuity. In
typical construction, many of these air sealing measures are not installed at all. The air
sealing of interior polyethylene sheet vapour barriers also requires several measures to
ensure air tightness at wall interfaces and from sheet to sheet. Both approaches also
require air sealing at electrical outlet and other penetration of the interior finish which
would not be required for an ICF wall. These penetrations are noteworthy because they
1
Illustrated Guide – Achieving Airtight Buildings (2017). Prepared by RDH Building Science Inc. and published by BC
Housing, BC Hydro, and the City of Vancouver.
2
Intertek (2017) Technical Bulletin 1.12.01 – Air Barrier (Permeance)

Page 6 RDH Building Science Laboratories 11872.000
can be anticipated to occur in the future as occupant install wall mounted items (e.g.
televisions, mirrors, floating shelfs, etc.).
In ICF walls, because there is no need to transition between air barrier materials at floor-
to-wall transitions as illustrated in Figure 2.1. These walls should consistently achieve a
high degree of air tightness in these key locations regardless of construction quality.
Holes made in drywall also do not penetrate the air barrier in ICF wall assemblies unless
they penetration the whole wall.
Another common air barrier approach for wood frame construction involves detailing the
loose laid mechanically attached building paper (i.e. “house wrap”) as the air barrier by
tape sealing laps in the sheets. This approach is designed to be continuous at the exterior
sheathing plane, bridging the wood framed floor-to-wall interfaces. While this addresses
some of the issues of interior polyethylene air/vapour barriers or airtight drywall
described above, it also introduces a different set of air barrier continuity issues that rely
on construction quality, such as the consistent taping or sealing of laps in the loose laid
sheets in the field of the wall. The continuous concrete core of the ICF wall assembly
eliminates the need to seal laps in sheet applied air barrier materials, resulting in a
consistently high degree of airtightness in the field of the wall regardless of construction
quality.
Figure 2.1 ICF Wall Section
The notes on the drawing
illustrate how the concrete
core serves at an effective air
barrier at wall to floor
transitions.
The concrete core of the ICF wall is continuous across floor-to-wall transitions. Typically, internal floors are hung with connectors through the EPS and into the concrete, maintaining a continuous layer of insulation. The concrete core of the ICF wall is continuous from foundation wall to above grade wall.

11872.000 RDH Building Science Laboratories Page 7
Figure 2.2 Wood Framed Wall
w/ Airtight Drywall Approach
Air Barrier
The notes indicate air sealing
measures needed to achieve a
high degree of air tightness
And while it is acknowledged that air barrier continuity at walls is only one component of
overall airtightness, it is one of the most important. As shown in Figure 2.3, wall
interfaces are estimated to be the single largest contributor to the total air leakage in
houses, accounting for approximately 35% overall. The inherent ability of ICF walls to
manage these problematic interfaces offers a significant airtightness advantage compared
to wood frame construction.

Page 8 RDH Building Science Laboratories 11872.000
Figure 2.3 Distribution of
Air Leakage in Houses
Distribution of air leakage
in houses3
It can also be seen in Figure 2.3 that windows and doors are another major source of air
leakage in houses. RDH conducted a study in 20144
that included air tightness testing of
several different window installation methods in ICF walls. It was found that all installation
methods resulted in air permeance equal to or less than 0.02 L/s·m2
(0.004 cfm/ft2
) at a
75 Pa pressure difference when tested in accordance with ASTM E 283. These results
demonstrate that effective air barrier detailing around windows and doors can be
successfully achieved in ICF construction.
2.3 Durability of Residential Air Barriers
The air barrier system must be designed to last for the entire service life of the building
(or at least the service life of the major materials or components to which it is integral).
The concrete layer within ICF wall systems is very durable and can be expected to
maintain its airtightness for the life of the building without degradation. It may be
necessary to regularly maintain sealants or other air barrier transition materials at ICF wall
penetrations and interfaces with other systems; these should be designed to be easily
accessible for this purpose.
The long-term durability of air barriers in wood frame construction has not been well
characterized. To capture the in-service performance of barriers in conventional wood
frame construction, Proskiw and Parehk (2004) conducted a study5
where 22 wood framed
houses in central Canada were repeatedly tested for airtightness during a 10 to 14-year
period following construction. The study included wood frame wall assemblies with
interior polyethylene air/vapour barriers and airtight drywall air barriers. Much of air
barrier performance loss observed in the study was associated with leakage at floor
drains, doors and windows, and mechanical and electrical penetrations and due to
adjacent excavations and renovations.
The Proskiw and Parehk study is the only long-term in-service air barrier performance
study found by RDH in a search of available published literature. As noted, their work
focussed on the long-term durability of interior polyethylene sheet air barriers and airtight
drywall air barriers only; it did not address the in-service performance of loose laid
3
ASHRAE Handbook of Fundamentals (2013)
4
RDH Building Engineering Ltd. (2014). ICF Wall Testing and Modelling – Lab Testing Report Prepared for BC
Housing House Owner Protection Office and BC Ready-Mixed Concrete Association.
5
Proskiw, G., & Parekh, A. (2004). Airtightness performance of wood frame houses over a 14 year
period. Proceedings of the thermal performance of exterior envelope of whole buildings IX, 5-9.
Wall
interfaces,
35%
Ceiling
details,
18%
HVAC,
18%
Windows and
doors, 15%
Fireplaces,
12%
Vents in
conditioned
spaces, 5%
Diffusion
through
walls, 1%

11872.000 RDH Building Science Laboratories Page 9
mechanically attached building paper when detailed as the air barrier. Others have made
field observations indicating degradation of a specific sheet applied housewrap product
installed behind wood siding (Figure 2.4). The observed degradation was found to be due
to the unforeseen effect of surfactants from the wood. It is understood by RDH that
current formulations of the product are different and are no longer susceptible to
degradation by wood surfactants. However, the current long-term performance of
housewraps and the tapes and adhesive that make them air tight is uncertain.
Figure 2.4 Photo of Building
Paper after 30 years Behind
Wood Siding.
Note the specific product,
Tyvek, was significantly
affected by surfactants in the
wood. It is understood that
current formulations of this
product are quite different
and address the surfactant
issue. (Wilson 2013)6
2.4 Strength and Stiffness of Residential Air Barriers
From construction to occupancy, the air barrier system must resist forces acting on it. The
design should account for mechanical forces such as those created by wind and stack
effect pressures as well as allow for dimensional changes in the structure caused by
thermal expansion and moisture absorption. Wood framed construction is more
vulnerable to such forces and, when loose laid sheet products are used as part of the air
barrier system, they rely on a combination of fasteners, tapes, sealants, strapping, and
exterior insulation to perform adequately. In contrast, ICF wall system are very strong and
stiff and not significantly affected by mechanical forces or dimension changes.
Figure 2.5 Poor House Wrap
Installation
The effectiveness of loose laid
house wrap as an air and
water barrier will depend on
how well joints are repaired
and taped prior to cladding
installation. 7
RDH conducted a study assembling whole building airtightness data for multi-unit
residential buildings (i.e. apartments, dormitories, etc.) in Washington State8
. The study
6
Wilson, A. (2013) “What’s New with Water Resistive Barriers”, Green Building Advisor Posting, June 27, 2013.
7
Fitzgerald-Redd, S. (2017) “Avoiding a Bad Wrap” Insulation Institute Blog. Retrieved from
http://information.insulationinstitute.org/blog/avoiding-a-bad-wrap.
8
Jones, D., Brown, B., & Thompson, T. (2014). Building Enclosure Airtightness Testing in Washington State-Lessons
Learned about Air Barrier Systems and Large Building Testing Procedures. ASHRAE Transactions, 120.

Page 10 RDH Building Science Laboratories 11872.000
found that buildings with loose laid sheet air barriers had an average of 20% to 30% worse
airtightness and about 3 times greater airtightness variability compared to buildings with
solid air barrier components similar to ICF. This is partly related to the ability of the
stronger and stiffer air barrier materials such as concrete to resist weathering from air
“pumping”.
Air pumping occurs when flow is generated by the deformation of a large membrane,
such as a roof membrane or loose laid sheet air barriers, under gusting and dynamic wind
pressures (Figure 2.6). Airtightness testing of buildings do not capture the influence of
this phenomenon of air leakage during building operation. Unlike wood frame
construction with sheet air barriers, ICF wall systems are not subject to wind pumping
effects.
Figure 2.6 Wind Pumping of
Loose Laid Sheet Air Barriers
Loose laid mechanically
attached sheet membrane air
barriers can pulse and flutter
in dynamic wind conditions,
thereby causing air “pumping”
2.5 Previous Studies of ICF Wall System Airtightness
In 1998, Oak Ridge National Lab (ORNL) published a study9
proposing an effective wall R-
value for ICF constructions including benefits for thermal mass impact and improved
airtightness inherent of the wall system. They assumed that the use of ICF walls reduced
overall house air leakage by 20%. This was based on a 1995 survey of blower door tests
for 7 ICF houses10
and an understanding that use of ICF would reduce the air leakage at
some common building transitions (e.g. sill plate to foundation interface, electrical
outlets, and plumbing penetrations).
9
Kosny, J., Christian, J. E., Desjarlais, A. O., Kossecka, E., & Berrenberg, L. (1998). Performance check between
whole building thermal performance criteria and exterior wall measured clear wall R-value, thermal bridging,
thermal mass, and airtightness/Discussion. ASHRAE Transactions, 104, 1379.
10
Thompson, G.L., (1995). “Airtightness Tests for American Polysteel Form Houses “ Contract No. SW1547AF,
Southwest Infrared Inc.

11872.000 RDH Building Science Laboratories Page 11
The ORNL study (1998) includes modelling which projects equivalent wall R-value impact
of thermal mass effect and improved airtightness effects for an R-12 ICF wall (38mm EPS
insulation board on each face). As summarized in Table 2.1 below, the estimated R-value
impacts for airtightness alone (i.e. thermal mass impacts not included) are large.
This study is referenced in current ICF manufacturer studies to justify reductions in air
leakage for these wall systems11
. However, the study was based on airtightness test
results for only 7 houses constructed more than 20 years ago. Given the limitations of the
ORNL study, it is recommended that the airtightness impacts of ICF be re-evaluated based
on the available data in a more current context.
TABLE 2.1 AIRTIGHTNESS R-VALUE IMPACTS FOR ICF WALLS REPORTED IN ORNL
STUDY [ FT2
°FHR/BTU (M2
K/W)]
LOCATION NOMINAL WALL
R-VALUE
ORNL STUDY
AIRTIGHTNESS
IMPACT
PROPOSED
WALL R-VALUE
INCLUDING
IMPACT OF
AIRTIGHTNESS
% DIFFERENCE
Atlanta
R12 (2.1 RSI)
R9.4 (1.7 RSI) R21.3 78%
Denver R7.6 (1.3 RSI) R19.6 64%
Miami R23.2 (4.1 RSI) R35.2 193%
Minneapolis R13.0 (2.3 RSI) R15 109%
Washington DC R8.3 (1.5 RSI) R20.3 69%
A more recent study out of MIT by Durschlag12
(referred to in this report as the “MIT
Study”) assessed airtightness testing data from 43 ICF houses. In this study, ICF houses
were compared to an analysis of the blower door test result database from Lawrence
Berkley National Laboratory (LBNL). Specifically, the 43 ICF houses, which have a median
construction year of 2007 and median size of 314 m2
(3,380 ft2
), were compared to a
subset of the LBNL database representing wood frame houses constructed in 2000 and
larger than 139 m2
(1,496 ft2
).
Based on this analysis, the ICF houses in the MIT study were found to be only marginally
more air tight than the conventional wood frame houses of similar vintage and size. The
author suggests that this is because wood frame houses are generally being built more
and more airtight. In other words, as the benchmark for wood frame airtightness
improves, the comparative performance margin gets smaller and smaller. The study also
investigated the variables influencing the range of airtightness among ICF houses and
concluded that the best predictors of airtightness were house volume and window area.
Again, limitations of this study such as the limited sample size and geographic
distribution, point to the need for further evaluation of ICF air tightness.
11
Gajda, J. (2001). Energy use of single-family houses with various exterior walls. CD026, Portland Cement
Association, Skokie, IL.
12
Durschlag, H (2012) Air Leakage of Insulated Concrete Form Houses, Massachusetts Institute of Technology.
Page 12 RDH Building Science Laboratories 11872.000
3 Low-Rise ICF Residential Airtightness
Data
Low-rise residential buildings include detached houses, attached houses (row houses,
townhouses, etc.), and multi-unit residential (apartment, dormitory, condominium, etc.)
buildings up to and including 3 storeys. Within this section the dataset is presented and
compared to published airtightness data from typical wood framed houses. This
presentation of the data is followed by analysis of location/climate, detached vs attached
construction, and house size impacts.
3.1 Overview of Low-Rise ICF Residential Dataset
Airtightness of 49 low-rise ICF houses were provided by ICFMA members. The collected
dataset and calculated ACH50 values are given in Appendix A. It is noted that the dataset
would need to be larger and measures taken to ensure random sampling to ensure the
findings are statistically significant. However, the data does provide valuable insights on
the airtightness levels of ICF buildings that are being achieved in the field to inform
strategies for meeting energy codes explored in further phases of the study. The findings
from this study will be strengthened as the ICFMA provide more airtightness testing
results to build this database.
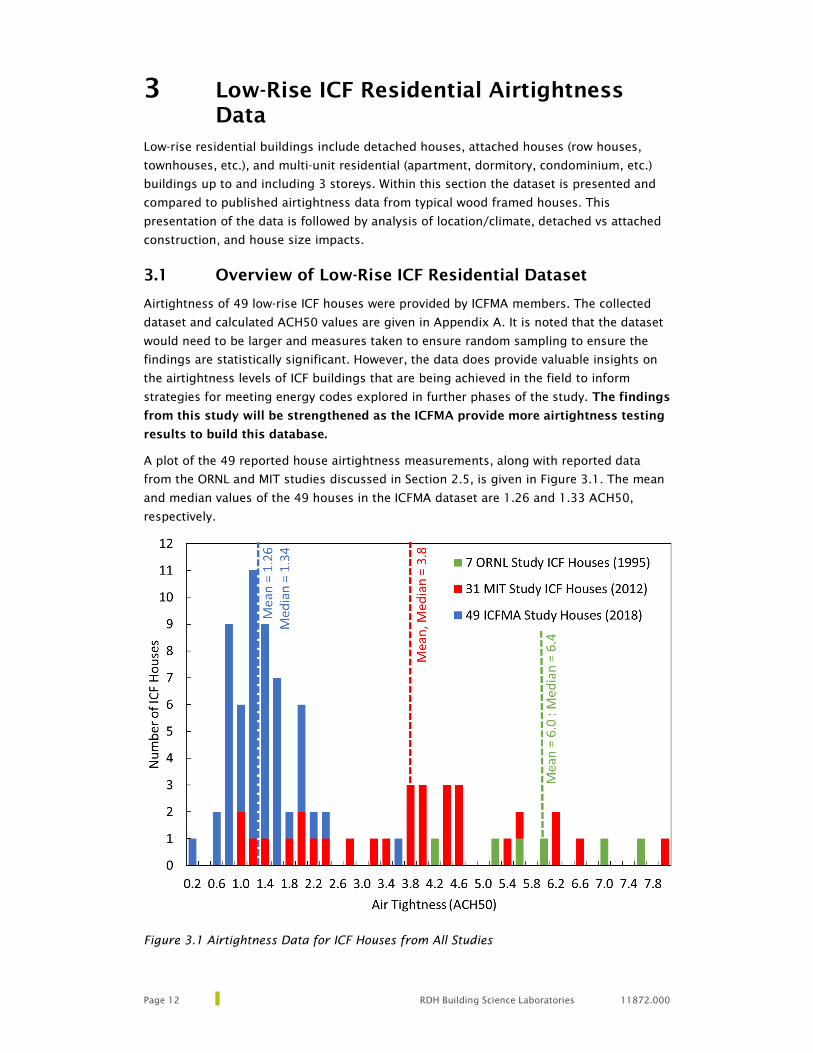
A plot of the 49 reported house airtightness measurements, along with reported data
from the ORNL and MIT studies discussed in Section 2.5, is given in Figure 3.1. The mean
and median values of the 49 houses in the ICFMA dataset are 1.26 and 1.33 ACH50,
respectively.
Figure 3.1 Airtightness Data for ICF Houses from All Studies

11872.000 RDH Building Science Laboratories Page 13
The plots show that the airtightness of the 49 ICF houses in the ICFMA dataset are much
more air tightness than those from the ORNL study. This is to be expected as the ORNL
study was based on ICF construction over 20 years ago; improvements in ICF construction
since this study would be expected to result in better airtightness.
The airtightness of the 49 houses in the ICFMA dataset are somewhat more airtight than
those from the MIT study. Houses in the MIT study are less than 10 years old and are
assumed to generally reflect current construction practices. These 31 houses are
therefore combined with the 49 houses from the ICFMA to create a larger ICF dataset for
analysis. This larger ICFMA-MIT dataset of 80 houses constructed in the last 10 years
results in a mean and median of 2.23 and 1.47 ACH50. These results will be used to
characterize the airtightness of ICF houses built today.
3.2 Low-Rise ICF Residential Case Study: Ontario House
RDH performed airtightness testing on a southern Ontario ICF house for Fox Block at the
same time as this study. The house had an airtightness of 0.81 ACH50, well below the
assumed an airtightness of 3 ACH50 in the Ontario Building Code. This performance is
also exceptional considering that it is a “regular” house and not being certified under
Energy Star or other energy efficiency rating program, demonstrating the ease of
achieving a high degree of air tightness with ICF construction.
The testing also provided insights on air leakage paths for ICF houses. The observed air
leakage points are listed below:
→ Kitchen hood (note that the general contractor indicated that the duct had a metal bi-
fold backdraft damper); bathroom exhaust fan (note that a plastic backdraft damper
is suspected to be making the seal in these ducts).
→ Closed cell spray foam sealed HRV duct penetration of foundation wall.
→ Patio door vents; edges of front door with poor weather stripping.
→ Low expansion spray foam filled gap between the bottom corner of the basement
window and the rough opening.
→ Basement cold room’s exposed ceiling under the front step.
→ Top corner of kitchen cabinets and electrical outlets near front door (assumed to
connect to leakage path through ceiling).
Please contact ICFMA for a copy of the full report.
3.3 Comparison to Typical Wood Frames Houses
3.3.1 Mean and Median Airtightness
Predominantly wood frame construction, low-rise residential is the most thoroughly
studied building type in North America with respect to airtightness due to ventilation
concerns, energy incentive programs, and because they represent a large portion of
building stock. It is generally assumed that the air barrier approach for typical wood
framed exterior walls is loose laid mechanically attached building paper (i.e. “house wrap”)
and interior drywall; in the colder climates, interior polyethylene sheet vapour barriers
also function as air barriers.

Page 14 RDH Building Science Laboratories 11872.000
A plot from a dataset of over 82,000 Canadian houses (Figure 3.2) compiled by Parekh et
al. shows median airtightness of 3.8 ACH50 for house built from 1991 to 2007 with 25th
and 75th
percentiles of 2.8 to 5.1 ACH50. Analysis of a US dataset of 147,000 existing
houses by LNBL (Figure 3.3) reveals a similar trend as the Canadian study of steadily
improving airtightness of house. It is assumed that most of the houses in both studies are
wood framed. Mean airtightness values of 4.8 ACH50 were estimated for houses built
from 2002 to 2012 houses in climate zones 6 and 7. These studies suggest that
Canadian houses are on average better than 4 ACH50 and US houses are better than
5 ACH50. This is roughly double the air leakage values reported for the 80 ICF
houses from the ICFMA dataset and MIT Study.
Figure 3.2 Canadian
Houses Airtightness vs
Vintage
Airtightness profiles for
Canadian housing from a
2007 study by Parekh et
al.13
Each bar represents a
range of values from the
25th
to 75th
percentile with
median value highlighted
(magenta).
Figure 3.3 US Houses
Airtightness vs Vintage
Adapted by RDH from
Figure 6 in Chan et al.
(2012) 14
Normalized leakage (NL)
based on regression
modeling of US dataset for
houses as a function of
year built (climate zone A-
6,7).
RDH conversions to ACH50
are made based on a one-
story (height = 3 m) house
with floor area = 150 m2
13
Parekh, A., Roux, L., & Gallant, P. (2007). Thermal and air leakage characteristics of Canadian housing. In 11th Annual
Canadian Conference on Building Science and Technology, Banff, Alberta
14
Chan, W. R., Joh, I., & Sherman, M. H. (2012). Analysis of air leakage measurements from residential diagnostics database
(No. LBNL-5967E). Ernest Orlando Lawrence Berkeley National Laboratory, Berkeley, CA (US).
0
2
4
6
8
10
12
0
0.1
0.2
0.3
0.4
0.5
0.6
0.7
0.8
pre-1
96
0
19
60-1
96
9
19
70-1
97
9
19
80-1989
19
90-1999
20
00-2
01
2
Eq
uivalen
t A
CH
50
Pred
icted
N
L
Year Built
(predictions for climate zone = A-6,7)

11872.000 RDH Building Science Laboratories Page 15
3.3.2 Impact of Location and Climate
Parekh et al. reported air tightness results for 3,200 recently constructed houses (1996 to
2005) across various Canadian provinces and territories. A plot from the study (Figure
3.4) indicates that houses in cold climates such as Saskatchewan (SK) and Manitoba (MB)
are more airtight (median between 2 and 2.5 ACH50) and with less variability in
airtightness (+/- 0.5 ACH50) than in the milder climates (BC, NB, NS, and PE). This is
consistent with the expectation that houses in colder climates are generally more air tight
than those in warmer climates, as noted in the previous section of this report. The poor
airtightness and high variability report for some cold regions (QC, NT, YK) could be due to
biases in the underlying dataset (i.e. data collection restricted to specific sub-sets of the
housing stock such as social housing or energy efficiency program participants) or
regional differences in construction approaches and/or quality.
Figure 3.4 Canadian Housing
Airtightness vs Location Plot
Airtightness of 3,200 recently
built housing (1996 to 2005) in
Canada from a 2007 study by
Parekh et al.15
Each bar represents a range of
values from the 25th
to 75th
percentile with median value
highlighted (yellow).
The general trend of tighter houses in colder climates is also seen in the previously
described LBNL study of US housing. Figure 3.5 shows an analysis of a subset of the study
data for houses built between 1980 and 1989 across different climate zones. Hot humid
climates like Miami (A1) have an estimated airtightness of 11 ACH50 compared to severe
cold climates like northern Alaska (AK8) estimated at approximately 4 ACH50. The climate
dependency is less clear for all other climates with results ranging from 7 to 10 ACH50.
Figure 3.5 US Housing
Airtightness vs Climate Zone
Adapted by RDH from Figure 6 in
Chan et al. (2012) 16
Normalized leakage (NL) based on
regression modeling of US dataset
for houses in different climate
zones (1980-89 constructions)
RDH conversions to ACH50 are
made based on a one-story (height
= 3 m) house with floor area =
150 m2
.
15
Parekh, A., Roux, L., & Gallant, P. (2007). Thermal and air leakage characteristics of Canadian housing. In 11th
Annual Canadian Conference on Building Science and Technology, Banff, Alberta
16
Chan, W. R., Joh, I., & Sherman, M. H. (2012). Analysis of air leakage measurements from residential diagnostics
database (No. LBNL-5967E). Ernest Orlando Lawrence Berkeley National Laboratory, Berkeley, CA (US).
0
2
4
6
8
10
12
0
0.1
0.2
0.3
0.4
0.5
0.6
0.7
0.8
Hum
id: A
-1
,2
A-3
A-4
A-5
A-6
,7
Dry: B-2
,3
B-4,5
B-6
Marine: C
-3
D-4
Alaska: A
K-7
AK
-8
Eq
uivalen
t A
CH
50
Pred
icted
N
L
IECC Climate Zone
(predictions for year built = 1980-89)

Page 16 RDH Building Science Laboratories 11872.000
Chan et al.’s analysis of newer houses (built since 2000) is shown in Figure 3.6. This study
shows a trend of more airtightness in Wisconsin (75th
percentile within 2 to 3 ACH50)
relative to California, Nevada, and Texas (75th
percentile within 3 to 5 ACH50). However,
data from Alaska showed a large range in performance (75th
percentile within 3 to 7
ACH50), including several very leaky new houses reaching over 10 ACH50. Similar to the
Canadian data, the US data could have been skewed by data gathering from specific sub-
sets of the housing stock (such as social housing or energy efficiency program
participants) or due to regional differences in construction approaches and/or quality.
Overall, this dataset suggests that the airtightness of a typical US house is between 3.7
ACH at 5.8 ACH50.
Figure 3.6 US Housing
Airtightness vs Location Plot
Adapted from Figure 1 in Chan
et al. (2013) 17
Normalized leakage (NL) based
on regression modeling of US
dataset for houses in different
states built after 2000. Each box
plot shows the median and
interquartile range, and whiskers
show 5th
and 95th
percentiles.
Conversions to ACH50 are made
based on a one-story (height = 3
m) house with floor area = 150
m2
.
An indication of a climate/location dependency trend is also seen in the ICFMA-MIT
dataset introduced in Section 3.1. The locations and climate zones of the 80 ICF houses
are plotted relative to airtightness in Figure 3.7.
Figure 3.7 Airtightness and Location of ICF Houses in the ICFMA-MIT Dataset
Mean shown as x, 25th and 75th
percentiles shown in boxed columns, minimum and
maximum values shown in error bars, and number of data points listed below. MIT data
shown as red triangles.
17
Chan, W. R., and M. H. Sherman. (2013) "Building Envelope & Duct Airtightness of New US Dwellings." Building XII,
Clearwater FL (US).
0
2
4
6
8
10
12
0
0.1
0.2
0.3
0.4
0.5
0.6
0.7
0.8
Eq
uivalen
t A
CH
50
NL
Built after 2000
All
26725
WI
58
CA
2591NV
452
TX
8010
AK
7308
4 2 6 2 6 1 3 2 27 12 80
2
4
6
8
10
12
AZ CT FL IL MI MS NY OH ON TN TX
Air T
ig
htn
ess (A
CH
50
)

11872.000 RDH Building Science Laboratories Page 17
Figure 3.8 Airtightness and ASHRAE Climate Zone of ICF Houses in the ICFMA-MIT
Mean shown as x, 25th percentiles shown in boxed columns, minimum and maximum
values shown in error bars. MIT data highlighted in red.
Based on these studies, location and climate appear to have an impact on airtightness of
both wood frame and ICF houses. Both wood frame and ICF houses in cold climates are
expected to be more airtight than houses in hot climates. However, other factors
such as local construction quality and approaches as well as local energy efficiency
programs appear to also significantly affect airtightness, making it difficult to
predict the extent of climate dependency.
3.3.3 Detached Versus Attached Houses
Studies have found as much as 60% of air leakage in attached wood framed houses across
the separating walls18
. The challenges in constructing air tight wood frame separating
walls is reflected in the additional 0.5 ACH50 air leakage allowance for detached
houses relative to attached houses in Canadian standards as summarized in Table 3.1.
TABLE 3.1 CODE ALLOWANCES FOR DETACHED VS ATTACHED HOUSES
Code Detached House Attached House
Ontario Building Code (SB12) 3.0 ACH50 3.5 ACH50
Energy Star (Canada) 2.5 ACH50 3.0 ACH50
Energy Star (US) Same for Detached and Attached
Poor air tightness of separating walls in attached houses and multi-unit residential
buildings results in noise and odour issues. The ease of achieving greater air tightness of
exterior ICF walls also applies to ICF separating walls. Hence, use of ICF separating walls
in attached houses is expected to lower measured unit airtightness and achieve
accompanying noise and odour control advantages. Note that the airtightness
measurement for the one attached ICF house in the ICFMA sample set was for the entire
structure and not individual units. ICFMA is encouraged to seek measurements from
attached houses to assess the advantages of ICF separating walls.
18
Diamond, R.C., M.P. Modera, and H.E. Feustel. 1986. Ventilation and occupant behaviour in two apartment buildings.
Proceedings of the 7th IEA Conference of the Air Infiltration and Ventilation Centre, Stratford-upon-Avon, U.K. Report LBL-21862. Lawrence Berkeley National Laboratory, Berkeley, CA.
15 17 19 210
1
2
3
4
5
6
7
8
9
10
CZ 2/3 CZ 4 CZ 5 CZ 6
Air T
ig
htn
ess (A
CH
50
)

Page 18 RDH Building Science Laboratories 11872.000
3.3.4 Impacts of House Size
In general, building form affects the ACH50 airtightness metric because of differing ratios
of interior volume (i.e. the volume of an “air change”) to enclosure area. To illustrate the
effect, a simple analysis calculating ACH50 for different building forms using the same air
leakage per unit area of building enclosure (i.e. the same normalized airflow rate or
normalized air leakage rate, NLR) is shown in Figure 3.9 below. For the same air leakage
per unit area of building enclosure, a three-storey building will have an ACH50 value that
is approximately 40% less than a one-storey building of the same floor plate. Because of
this relationship between volume and enclosure area, larger buildings are generally
expected to have significantly lower ACH50 values.
Trends in new residential construction show that houses are getting bigger (see Figure
3.11). Hence, the trend toward a larger house may inherently be leading to lower
ACH50 numbers regardless of actual enclosure airtightness improvements.
Simple rectangular and L shaped forms are also compared in Figure 3.9 to demonstrate
the influence of form complexity. In general, more complex building forms result in
greater enclosure area per volume. For the forms analyzed, the L-shaped form had a 25%
greater ACH50. It is also acknowledged that, in practice, more complex building form also
tends to result in more difficult air barrier installation, further contributing to a higher
ACH50.
Figure 3.9 Analysis of
Building Forms Effects on
ACH
Four hypothetical house
types based on one- and
three-storey rectangle or L-
shaped floor plans.
For the same normalized
air leakage rate (NLR),
houses with a larger
volume-to-surface area
ratio (i.e. larger buildings,
simple floorplate) will have
lower ACH50 compared to
houses with a lower
volume-to-surface area
ratio (i.e. smaller
buildings, more complex
floor plate).
0
1
2
3
4
5
6
7
8
9
1-Storey
Rectangle
1-Storey
L-Shape
3-Storey
Rectangle
3-Storey
L-Shape
AC
H5
0
ACH50 Based on NLR = 2 L/s/m2 @ 50Pa
(0.39 cfm/ft2 @ 50 Pa)
1-Storey
Rectangle
1-Storey
L-Shape
3-Storey
Rectangle
3-Storey
L-Shape

11872.000 RDH Building Science Laboratories Page 19
In Figure 3.10, the conditioned floor areas of the 49 ICF houses from the ICFMA dataset
were plotted relative to airtightness showing that airtightness tends to be lower for larger
houses. Linear regression analysis was applied to the data showing a 0.09 ACH50
improvement in airtightness values for every additional 100 m2
(1000 ft2
) of
conditioned floor area. The correlation is weak; thus, RDH recommends expanding the
dataset to improve the analysis. The lower ACH50 may be due to form factor impacts
and/or may be due to generally better construction quality and building components in
larger houses.
Figure 3.10
Airtightness vs
Conditioned Floor
Area for ICF Houses:
ICFMA, ORNL & MIT
Datasets
Method of least
squares linear
regression analysis
was applied to the
dataset (78 entries
with reported floor
area) resulting in a
0.09 ACH50
improvement in
airtightness with
every additional
1000 sqft of
household floor
area.
It is noted that the average house size in the ICFMA, MIT, and ORNL ICF datasets are
larger than the average North American house. A plot of typical house size trends is
shown in Figure 3.1 below, with the ICF datasets highlighted.
Figure 3.11 US and
Canadian House Size
Trends
Trends show new US
and Canadian
houses are getting
larger over time
(StatsCan and US
Census data).
This is likely because the data included in the studies reflects a high proportion of custom
houses which tend to be larger than average. As noted above, larger houses are likely to
have lower ACH50 airtightness values due to form factor (i.e. higher surface area to
volume ratios) and this should be considered when comparing the ACH50 of the ICFMA-
MIT dataset of 80 ICF buildings to the average for typical wood frame houses.
y = -9E-05x + 2.9317
R² = 0.0162
0
1
2
3
4
5
6
7
8
9
10
0 5,000 10,000 15,000 20,000 25,000
Air T
ig
htn
ess (A
CH
50
)
Conditioned Floor Area (sqft)
ICFMA Dataset (2018)
ORNL Study ICF Houses (1998)
MIT Study ICF Houses (2012)
0
500
1000
1500
2000
2500
3000
3500
4000
0
50
100
150
200
250
300
350
400
1975 1985 1995 2005 2015 2025
House Siz
e (ft2)
House Siz
e (m
2)
US Data Canada Data
ICFMA (2018)
MIT (2012)
ORNL (1998)
Page 20 RDH Building Science Laboratories 11872.000
4 Mid-Rise ICF Residential Airtightness
Data
Mid-rise residential buildings are multi-unit residential buildings (apartments, dormitories,
condominiums, etc.) between 4- and 6-storeys. ICF data to date is only available for one
mid-rise residential ICF building and is the focus of this section. The datapoint is
compared to values published for other mid-rise residential buildings. We encourage
ICFMA members to provide data on mid-rise residential building for the benefit of
this study.
4.1 Cedar Creek ICF Apartment
In 2005 Enermodal Engineering conducted blower door testing of the Cedar Creek
Apartment building in Waterloo, Ontario. The building is a 7 storey ICF multi-unit
residential building. The testing found that the building had a normalized air leakage rate
of 1.25 L/s m2
(0.25 cfm/ft2
) @75Pa. This building would meet air tightness requirement
of the U.S. Army Corps of Engineers (2012) and is 37% better than the default ASHRAE
90.1 performance path modelling value of (2.3 L/s m2
(0.40 cfm/ft2
) @75Pa.
The observed air leakage paths were around through-wall air conditioning units, sliding
glass doors, window/door rough openings, sliding windows, range hood/bathroom fans,
front vestibule pot lights, sprinkler risers in garbage room, the front office AC sleeve, a
garbage room light switch, and garbage room penetrating duct work. It was noted that
the building was not complete during testing: 20% of caulking had yet to be completed
and door hardware installation and commissioning of condensers was in progress. Hence,
it is likely the completed building’s air leakage rate would have been further reduced.
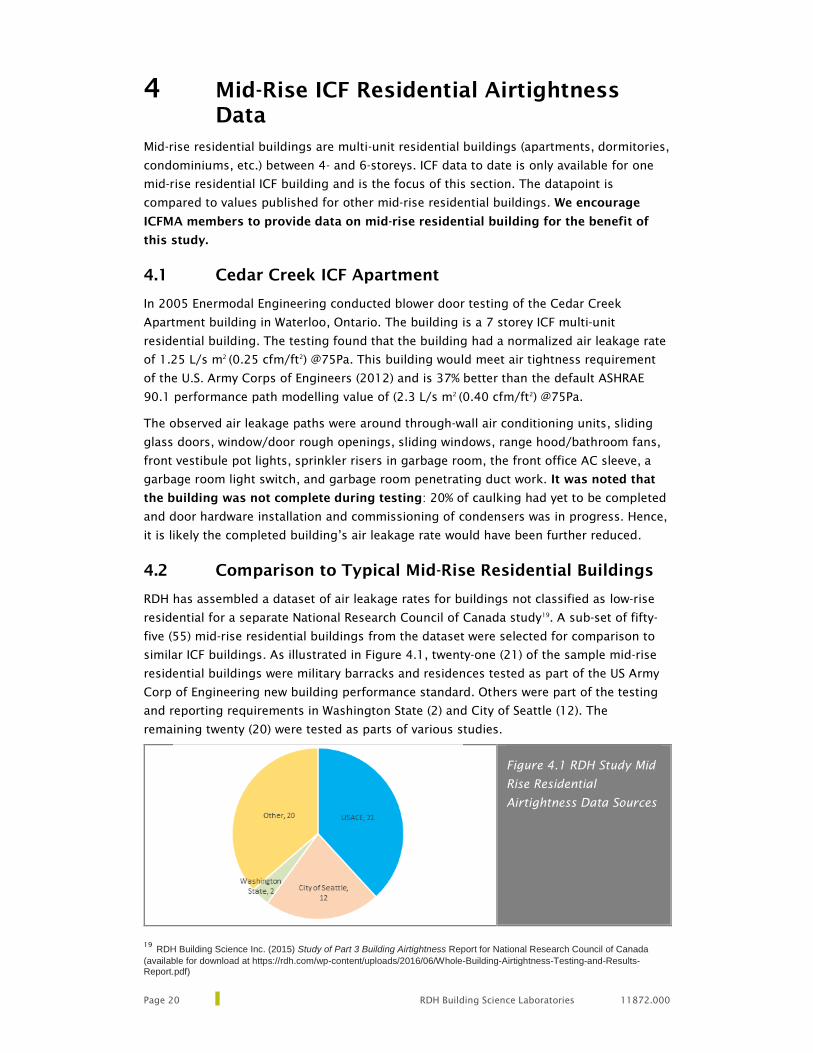
4.2 Comparison to Typical Mid-Rise Residential Buildings
RDH has assembled a dataset of air leakage rates for buildings not classified as low-rise
residential for a separate National Research Council of Canada study19
. A sub-set of fifty-
five (55) mid-rise residential buildings from the dataset were selected for comparison to
similar ICF buildings. As illustrated in Figure 4.1, twenty-one (21) of the sample mid-rise
residential buildings were military barracks and residences tested as part of the US Army
Corp of Engineering new building performance standard. Others were part of the testing
and reporting requirements in Washington State (2) and City of Seattle (12). The
remaining twenty (20) were tested as parts of various studies.
Figure 4.1 RDH Study Mid
Rise Residential
Airtightness Data Sources
19
RDH Building Science Inc. (2015) Study of Part 3 Building Airtightness Report for National Research Council of Canada
(available for download at https://rdh.com/wp-content/uploads/2016/06/Whole-Building-Airtightness-Testing-and-Results-Report.pdf)

11872.000 RDH Building Science Laboratories Page 21
The average airtightness of the 55 mid-rise residential buildings from the RDH dataset
was 2.1 L/s m2
(0.41 cfm/ft2
) @75Pa. Most of these buildings were tested under the
USACE with a performance compliance requirement of 1.27 L/s m2
(0.25 cfm/ft2
) @75Pa
and 2012 City of Seattle and 2012 Washington State Energy Code testing benchmark of
2.3 L/s m2
(0.40 cfm/ft2
) @75Pa. The airtightness values for the 55 mid-rise residential
buildings in this dataset are indicated in red in Figure 4.2 below. The mid-rise residential
buildings appear to generally fit the Airtightness vs Year of Construction trend for the
overall dataset.
Only one published data point was found in the literature for a mid-rise residential ICF
building. The datapoint is plotted in Figure 4.2 (black star) and aligns with findings from
low-rise residential data suggesting that ICF building have better-than-average
airtightness.
Figure 4.2 Airtightness vs Year of Construction w/ICF Data Point
Adapted from Jones et al. (2014) 20
to show mid-rise MURBS, indicated in red; also includes
new data from 2015 and Enermodal ICF building measurement shown as a black star.
20
Jones, D., Brown, B., & Thompson, T. (2014). Building Enclosure Airtightness Testing in Washington State-
Lessons Learned about Air Barrier Systems and Large Building Testing Procedures. ASHRAE Transactions, 120.
0.0
1.0
2.0
3.0
4.0
0
5
10
15
20
1950 1960 1970 1980 1990 2000 2010 2020
Air
tigh
tne
ss [
cfm
/ft²
@ 7
5 P
a]
Air
tigh
tne
ss [
L/(s
.m²)
@ 7
5 P
a]
Construction of Building [year]
Airtightness Vs Year of ConstructionAll Buildings Mid Rise Only
Sample of 179 Buildings

Page 22 RDH Building Science Laboratories 11872.000
5 Conclusions and Recommendations
5.1 Low-Rise ICF Housing Airtightness Insights
Based on analysis of published data, typical Canadian houses are on average better than 4
ACH50 and US houses better than 5 ACH50. In both markets, houses the airtightness of
new houses appear to be getting more air tight over time.
A 1995 and 2012 study involving seven and thirty-one ICF house found an average
airtightness of 6.39 and 3.82 ACH50, respectively. The ACH50 values for both studies
were estimated based on reported effective leakage area measurements and assumed
typical house dimensions. The average airtightness of 49 ICF houses collected from
ICFMA for this study was found to be 1.26 ACH50. Combining all ICF data results in an
average of 2.57 ACH50 and median of 1.56 ACH50.
→ The airtightness data of the ICF houses in the study showed much greater air
tightness than typical wood framed houses.
There are several general insights on air tightness of houses which have been
demonstrated in this study.
→ Houses in cold climates are expected to be more air tight than houses in hot climates,
→ Local construction quality and approaches as well as local energy efficiency programs
appear to also significantly affect airtightness.
→ Attached houses are expected to have greater measured air leakage than detached
houses due to air leakage between units (Canadian codes suggest a 0.5 ACH50
penalty).
→ Attached ICF houses using ICF for separating walls may have better measured
airtightness because the reductions in suite-to-suite air leakage can be more
easily achieved than for wood framed constructions.
→ There is a significant reduction in ACH50 expected for larger buildings due to form
factor advantages within the calculation.
→ Linear regression analysis was applied to the data for ICF houses showing a 0.09
ACH50 improvement in airtightness values for every additional 1,000 sqft of
conditioned floor area.
→ The potential for decay of air barrier systems in modern wood framed houses has not
been well studied to date.
→ ICF walls are expected to have long-term airtightness performance benefits over
loose-laid house wrap air barriers in that they are rigid, strong, durable, and
continuous in the field of the wall. This is expected to limit wind induced
billowing which may also affect in-service air leakage.
5.2 Mid-Rise ICF Housing Airtightness Insights
The airtightness of the one mid-rise residential ICF building with published results had
good airtightness and the air leakage paths in the building were similar to those reported
for other mid/high rise multi-unit residential building.

11872.000 RDH Building Science Laboratories Page 23
→ ICF walls are expected to have better and more reliable airtightness than walls
systems using loose laid house wraps are air barriers. More data is needed to draw
more specific insights.
There is a current movement by building codes across Canada and the US to require
blower door testing to verify air tightness in new construction, making air tightness
performance a key issue for compliance. The application of reliable air tightness
performance, the listed general performance insights, and the thermal performance of
ICF’s relative to energy code compliance will be explored in the next phase of this study.

LOCATION
ASHRAE
CLIMATE
ZONE
GFA VOLUME AIR TIGHTNESS
(ft2
) (ft3
) ACH50 REPORTED
AZ 4 3,460 34,600 1.58 ACH50 = 1.58
AZ 4 1,855 18,550 2.20 ACH50 = 2.20
AZ 4 8,000 80,000 1.49 ACH50 = 1.49
AZ 4 3,889 38,890 1.98 ACH50 = 1.98
FL 2 2,150 21,500 0.70 ACH50 = 0.70
IL 5 6,506 61,852 1.10 ACH50 = 1.10
IL 4 2,400 21,600 1.07 ACH50 = 1.07
IR N/A 3,703 32,242 1.10 ACH50 = 1.10
MI 5 4,456 40,528 1.44 ACH50 = 1.44
MI 5 4,809 47,780 1.34 ACH50 = 1.34
MI 5 5,521 52,452 1.23 ACH50 = 1.23
MI 5 1,819 17,172 3.49 Q50 = 998 cfm
MI 5 3,708 34,764 1.80 ACH50 = 1.80
MI 5 5,161 51,063 2.19 ACH50 = 2.19
NY 6 3,912 39,120 0.12 ACH50 = 0.12
NY 6 2,304 23,040 0.60 ACH50 = 0.60
NY 5 6,680 61,356 0.54 Q50 = 552 cfm
OH 5 6,552 64,267 0.97 ACH50 = 0.97
OH 5 5,542 49,270 1.95 Q50 = 1600 cfm
ON 6 4,096 39,936 0.81 ACH50 = 0.81
ON 6 2,134 21,861 1.51 ACH50 = 1.51
ON 6 1,748 18,327 1.98 ACH50 = 1.98
ON 6 1,545 25,905 1.35 ACH50 = 1.35
ON 6 2,150 40,851 1.34 ACH50 = 1.34
ON 6 2,456 40,797 1.63 ACH50 = 1.63
ON 6 1,750 29,737 1.43 ACH50 = 1.43
ON 6 2,823 25,404 1.33 ACH50 = 1.33
ON 6 2,823 25,404 0.98 ACH50 = 0.98
ON 6 1,600 16,000 0.94 ACH50 = 0.94
ON 6 2,000 20,000 0.60 ACH50 = 0.60
ON 6 9,737 87,633 1.03 ACH50 = 1.03
ON 6 3,663 32,964 0.75 ACH50 = 0.75
ON 6 1,800 18,000 0.76 ACH50 = 0.76
ON 6 8,054 72,489 0.55 ACH50 = 0.55
ON 6 7,090 63,808 1.35 ACH50 = 1.35
ON 6 1,200 12,000 0.60 ACH50 = 0.60
ON 6 1,700 17,000 0.76 ACH50 = 0.76
ON 6 2,800 28,000 1.56 ACH50 = 1.56
ON 6 10,473 94,255 1.00 ACH50 = 1.00
ON 5 7,077 63,690 0.73 ACH50 = 0.73
ON 5 4,184 37,656 1.37 ACH50 = 1.37
ON 5 3,959 35,633 1.35 ACH50 = 1.35
ON 5 23,216 208,946 1.50 ACH50 = 1.50
UK N/A 1,177 10,594 1.09 Q50/A = 0.92 m3
/h/m2
UK N/A 1,362 12,254 1.12 Q50/A = 0.97 m3
/h/m2
UK N/A 1,362 12,254 1.10 Q50/A = 0.95 m3
/h/m2
UK N/A 1,362 12,254 1.08 Q50/A = 0.93 m3
/h/m2
UK N/A 1,177 10,594 1.10 Q50/A = 0.93 m3
/h/m2
UK N/A 1,660 14,938 0.63 Q50/A = 0.56 m3
/h/m2
Estimated values are shown in italics
Ap
pen
dix A
Stu
dy IC
F A
irtig
htn
ess D
ataset