Embed Size (px)
Citation preview

Aircraft Microphysical Documentation from Cloud Base to Anvils of Hailstorm FeederClouds in Argentina
DANIEL ROSENFELD
The Hebrew University of Jerusalem, Jerusalem, Israel
WILLIAM L. WOODLEY
Woodley Weather Consultants, Littleton, Colorado
TERRENCE W. KRAUSS AND VIKTOR MAKITOV
Weather Modification, Inc., Fargo, North Dakota
(Manuscript received 27 February 2005, in final form 21 December 2005)
ABSTRACT
Documentation during January and February 2000 of the structure of severe convective storms in Men-doza, Argentina, with a cloud-physics jet aircraft penetrating the major feeder clouds from cloud base to the�45°C isotherm level is reported. Complementary radar, satellite, and radiosonde measurements are in-corporated into the study. The main research goal was the description of the microphysical evolution of theconvective feeders of the hailstorms from cloud base to the anvil in an attempt to gain insights into themicrophysical evolution of the clouds that are associated with the high frequency of large hail in the region.The aircraft penetrated preferentially the tops of young growing elements, which were typically the majorfeeders to severe hailstorms, producing hail that is large (�3 cm) in size. Cloud bases typically were at6°–14°C, with typical base updrafts of 4–7 m s�1. The cloud updrafts increased with height, exceeding25 m s�1 at heights �7 km and, on occasion, 40 m s�1 at heights �8 km. Thermal buoyancies of 5°–8°C weremeasured in the convective towers at heights of 8–10 km. The vertical wind shear was weak below 6 km butincreased strongly above that level as the west winds cleared the Andes barrier, which averages 6.1 km tothe west of Mendoza. The clouds had very little coalescence and contained no detectable precipitation-sizedparticles �100 �m at temperatures ��15°C. Nearly adiabatic cloud water with most cloud water still notconverted into precipitation-sized hydrometeors (�100 �m in diameter) was found in cloud filaments withinthe strongest updrafts up to the level of homogeneous freezing, reaching 4 g m�3 at �38°C in one cloudbefore vanishing abruptly at colder temperatures. Graupel �1 mm appeared at the tops of growing newtowers at temperatures ��27°C, in agreement with radar first-echo heights of about 8 km.
1. Introduction
The province of Mendoza in western Argentina(32°S, 68°W), which is known worldwide for its wineproduction, is one of the most hail-prone areas of theworld. Losses to agriculture as a result of hail are typi-cally 10% of the total annual agricultural production,and on average approximately 20% of the agriculturalarea receives some hail annually (information was ob-
tained online at http://www.contingencias.mendoza.gov.ar). Because of the economic losses in MendozaProvince from the damaging hail, especially those suf-fered by the high-value grape crop, seeding for hailsuppression has been conducted, with some interrup-tions, since 1985. The initial efforts employed Russiantechnology and silver iodide (AgI) rockets, guided bytracking radar, to seed the high-reflectivity cores of in-cipient hailstorms (Makitov 1999). From 1998 to 2004,it was replaced by an airborne hail suppression project,which was implemented by Weather Modification, Inc.,(WMI) of Fargo, North Dakota, for the Ministry ofEconomy of the government of Mendoza, Argentina.
Besides engaging in operational hail-suppression
Corresponding author address: Prof. Daniel Rosenfeld, Insti-tute of Earth Sciences, The Hebrew University of Jerusalem, Je-rusalem 91904, Israel.E-mail: [email protected]
SEPTEMBER 2006 R O S E N F E L D E T A L . 1261
© 2006 American Meteorological Society
JAM2403

seeding, WMI has invested some of its resources overthe years in research to increase understanding of hail-producing clouds and their response to seeding inter-vention. In Argentina this research involved documen-tation of the dynamical and microphysical structure ofthe natural and seeded hailstorms during January andFebruary of 2000, using aircraft, radar, and satellite ob-servations. The measurements provided unique in situcloud-physics data of feeder clouds to severe hail-storms, with coverage from base to the anvil levels. Thisstudy uses exclusively the data of the natural (notseeded) clouds to provide insights to the microphysicalevolution of the tops of the hailstorm convective ele-ments as they grow from cloud base to the anvil level.The objectives in the context of this goal were the docu-mentation of the vertical evolution of the cloud dropsize distribution, cloud liquid water contents (LWC),longevity of the supercooled water, the initiation ofprecipitation in both liquid and ice processes, and theglaciation temperature, below which no supercooledwater is available for the growth of hailstones. Becauseof the risk of hailstones in the mature cloud elements,the flight emphasis had to be on the tops of younggrowing elements, which were typically the major feed-ers to the severe hailstorms already in progress. Oneideally would like to ascend with a cloud parcel fromcloud base to the anvil level. However, this approach isnot practical because most cloud elements lose theiridentity and the storm complex appears to be built by asuccession of cloud towers that take over the newgrowth with height. The flight strategy was aimed atpenetrating the strongest visible well-defined feedersnear their top and attempting to keep up with thestrongest new growth while avoiding the hazard of largehail falling from above and keeping eye contact with asafe exit from the well-defined cloud tower at the pen-etration level.
As documented herein, unique measurements weremade by the WMI cloud-physics Learjet aircraft downto �45°C in the powerful updrafts of these storms,revealing thermal buoyancies up to 8°C, updrafts�40 m s�1, and occasional cloud volumes of nearlyadiabatic water contents to the level of homogeneousfreezing within the most intense clouds. Because of themicrophysically continental composition of the clouds(i.e., large concentration of small drops with slow co-alescence), these strong updrafts carried the conden-sates in the form of small liquid water cloud droplets(up to 4 g m�3) to near �38°C, which is the tempera-ture of homogeneous freezing. Comparable supercool-ing has been observed previously in microphysicallycontinental clouds in Texas by Rosenfeld and Woodley
(2000) and, to a lesser extent, in premonsoon smokyclouds in Thailand (Andreae et al. 2004).
Other than the measurements in Texas (Rosenfeldand Woodley 2000) and the Argentine observations tobe addressed here, little has been measured directly byaircraft previously in the upper portions (i.e., �8 km) ofsevere convective towers. The lone known exceptionwas the recent use by Heymsfield et al. (2005) of acloud-physics jet aircraft to penetrate an intense con-vective core in Florida having an updraft of 25 m s�1 attemperatures from �33° to �36°C to document homo-geneous ice nucleation in tropical convection and itsinfluence on cirrus anvil microphysics. The amount ofsupercooled water there peaked at only about 10%adiabatic water, in contrast to the peak of 50% in westTexas (Rosenfeld and Woodley 2000) to the recordmeasurement of nearly 100% adiabatic water in Argen-tina (this study), respectively. Cloud-physics jet aircrafthave been used also to make measurements in thunder-storm anvils (Knollenberg et al. 1982; Smith et al. 1994;Lawson et al. 1998).
At lower altitudes, the armored T-28, which had (thisaircraft has been decommissioned) a limited serviceceiling of less than 8 km, had been used to make ex-tensive measurements in hailstorms in the UnitedStates (Musil et al. 1986, 1991) and in Switzerland (Mu-sil and Smith 1986). In the study by Musil et al. (1986),the armored T-28 traversed a weak-echo region andfound a continuous updraft averaging 30 m s�1 over atrack of 14 km, with a maximum of 50 m s�1. The air-craft was carried from �9° to �30°C by the strongupdraft during the traverse. The convective core ap-peared to be undiluted, having a hot-wire-measured su-percooled liquid water content of 6 g m�3 and no ice.The maximum echo top was 16 km, and hail up to 4 cmwas encountered to the west of the weak-echo region,which was reported to have had droplet concentrationsof 600 cm�3 and mean droplet diameters �10 �m. [Theforward-scattering spectrometer probe (FSSP) appar-ently undermeasured the cloud droplets, probably be-cause of the icing of the probe, and the signal fadedgradually during the penetration.]
2. Climate of Mendoza
The western border of Mendoza is occupied by themain Andean cordillera, with a number of peaks above6400 m. Climatic conditions are semiarid, and the an-nual rainfall for the capital city Mendoza, lying 800 mabove sea level, is 200 mm. Regional water needs aremet by using runoff from snowmelt from the Andesrange. The moisture from the Pacific Ocean is blockedby the mountain range. Most of the summer precipita-
1262 J O U R N A L O F A P P L I E D M E T E O R O L O G Y A N D C L I M A T O L O G Y VOLUME 45

tion is produced by convective clouds feeding on tropi-cal and Atlantic Ocean moisture. A study of four hailseasons (i.e., from 15 October to 31 March, in 2000–03inclusive) revealed that 60% of the days (371 out of623) had thunderstorms, 18% had hailstorms, and 8%had hailstorms with stones �2 cm. Thus, the storms ofthe Mendoza region are often severe. The averagelifted index (LI) on days with thunderstorms deter-mined from radiosondes released daily at 1600 UTC(1300 local time) at the Cruz Negra radar site was�2.83, and the mean precipitable water was 2.1 cm.Strong instability, a source of moisture from the northand east, great depths of supercooled water, and strongshearing winds aloft provide the necessary (though notalways sufficient) ingredients for these hail-producingstorms. The Andes range obviously figures into thestorm equation, especially with respect to the initiationof the severe nocturnal convection. The mountains arebelieved to cause a capping inversion due to subsidenceflow on the east side of the range, which helps to sup-press the premature release of convective instability,but also are thought to provide a mountain–plain diur-nal circulation driven by strong surface radiation overthe foothills, causing low-level air to converge over theAndes Mountain crests during the daytime and a re-verse circulation during the night that creates surfaceconvergence zones and a lifting mechanism for trigger-ing thunderstorms during the evening over the plains.Validating this conjecture requires more research.
The bulk of the summer precipitation comes late inthe day and at night. The most frequent time of storminitiation is 1900 UTC (1600 local time). The peak instorm activity occurs near sunset (approximately 0000UTC, or 2100 local time), and storms lasting past localmidnight are a common occurrence. Storm propertieswere found to be a function of maximum cell-topheight. For echoes having maximum heights of 8.5 and16.5 km, the mean storm durations were 0.43 and 2.3 h,the mean radar-estimated precipitation fluxes were 167and 1900 m3 s�1, and the mean lifetime rain volumeswere 440 and 45 000 kton (1 kton � 103 m3), respec-tively.
3. The cloud-seeding program
a. The hail-suppression conceptual model
The cloud seeding is based on the conceptual modelof Alberta (Canada) and Colorado hailstorms thatevolved from the experiments and studies of Chis-holm (1970), Chisholm and Renick (1972), Marwitz(1972a,b,c), Barge and Bergwall (1976), Krauss andMarwitz (1984), and English (1986). Direct observa-tional evidence from the instrumented aircraft penetra-
tions of Colorado and Alberta storms in the 1970s andearly 1980s indicates that hail embryos grow within thetime-evolving “main” updraft of single-cell storms andwithin the updrafts of developing “feeder clouds” orcumulus towers that flank mature “multicell” and “su-percell” storms (see, e.g., Foote 1984; Krauss and Mar-witz 1984).
The growth to large hail is hypothesized to occurprimarily along the edges of the main storm updraftwhere the merging feeder clouds interact with the mainstorm updraft (Foote 1985; World Meteorological Or-ganization 1995). The mature hailstorm may consist ofcomplicated airflow patterns and particle trajectories;therefore, the cloud seeding cannot hope to affect allembryo sources but attempts to modify the primary hailformation process. In other words, the cloud seedingcannot attempt to eliminate all of the hail but can re-duce the size and amount of hail.
b. Time frame and layout
The operational seeding period is from 15 October to1 April. The project area covers the three Argentineagricultural oases of Mendoza–San Martin in the north,Tunuyan in the center, and San Rafael in the south. Amap of Mendoza Province, showing the target fertileagricultural zones (referred to as oases) and the pre-dominant storm generation zones and most frequentstorm tracks as determined from analysis of the CruzNegra radar data is shown in Fig. 1.
c. Resources
1) ATMOSPHERIC SOUNDINGS
A Vaisala, Inc., GPS RS80 radiosonde system wasoperated at the Cruz Negra radar site (33.447°S,68.967°W, elevation 915 m MSL). Radiosondes werelaunched daily at 1600 UTC (1300 local time), espe-cially for supporting the seeding operations. The modi-fied soundings for the two prime days selected for in-tensive analysis (i.e., 1 and 7 February 2000) are pro-vided in Figs. 2 and 3. In the soundings, the observedsurface temperature and dewpoint conditions weremodified and mixed throughout the subcloud layer tomatch the cloud-base height that was observed by theresearch aircraft.
The two soundings are similar in that the convectivecondensation level–predicted clouds’ bases are rela-tively high (3000 m MSL, approximately 2100 m AGL)and cool (near �10°C) and the winds are light at lowlevels and change to westerly above 600 hPa, reachingmore than 40 m s�1 at the upper levels. Both soundingsare unstable, with the sounding for 7 February 2004
SEPTEMBER 2006 R O S E N F E L D E T A L . 1263

being the more unstable of the two with an LI value of�6.6 and a CAPE of �2209 J kg�1. This instability inconjunction with the shearing winds makes both daysripe for the hail that was observed.
2) PROJECT RADAR SYSTEMS
The project radar is a WR-100 Enterprise ElectronicsCorporation (EEC) C-band radar system mounted on a
10-m tower at Cruz Negra. The radar was operated 24h day�1 during the operational period. A complete vol-ume scan was performed every 4.2 min.
A software package called Thunderstorm, Identifica-tion, Tracking, Analysis, and Nowcasting (TITAN) wasadded to the radar. TITAN is a software system thatingests radar data, converts it into Cartesian coordi-nates, identifies storms, tracks them, and displays thetracks and forecasts (Dixon and Wiener 1993).
FIG. 1. Map of Mendoza region showing the three fertile agricultural regions, called oases, and the predominant storm tracks andgenesis regions as determined from radar data collected at Cruz Negra.
1264 J O U R N A L O F A P P L I E D M E T E O R O L O G Y A N D C L I M A T O L O G Y VOLUME 45
Fig 1 live 4/C

4. Aircraft cloud-physics measurements
a. Aircraft
The WMI Learjet Model 35A was configured forcloud-physics measurements during January and Feb-ruary of 2000. In addition to its seeding capability of 408ejectable 20-g AgI flares, the Learjet was equipped withan FSSP-100 probe for sizing particles in the range of2–44 �m and an optical array probe (OAP)–2D cloud(2DC) probe for imaging particles in the range of 25–800 �m. In addition, the aircraft had a Droplet Mea-surement Technologies (DMT) hot-wire instrument tomeasure liquid water contents, temperature and dew-point probes, a Ball variometer for the inference ofcloud drafts, and a forward-looking camera with view-ing through the upper-left portion of the copilot’s wind-shield.
All data from the Learjet were recorded using a Sci-ence Engineering Associates (SEA) Model M300 dataacquisition system. Ground calibrations and compari-sons with radiosondes were conducted for checks ofaccuracy for state parameters. A Setra S270 static pres-sure transducer provided pressure altitude measure-ments. A Setra S239 differential pressure transducer
provided measurements of airspeed. Temperature wasobtained using a Rosemount Model 102 de-iced plati-num resistance–type total temperature sensor capableof measuring temperatures from �50° to �50°C, withan accuracy of �0.5°C and a response constant of 1 s.The dewpoint temperature was obtained using a Gen-eral Eastern GE11B optical dewpoint system. Accuracyis stated by the manufacturer to be �0.25°C, and theresponse time is quoted as 1°C s�1, limited by the maxi-mum mirror cooling rate. A DMT LWC-100 was usedto measure liquid water concentrations from 0 to 5 gm�3 with an accuracy of �0.2 g m�3 and a responsetime of 50 ms (spatial resolution of �2 m). The BallVariometer BV4.0 is a transducer that measures thevertical velocity of the aircraft up to 4000 ft min�1 (20m s�1). The BV4.0 is interfaced with the aircraft pitot–static system.
b. Measurements of the drop size distribution(DSD)
The DSD was measured using the FSSP-100 instru-ment, measuring drops in 15 size bins between 2 and 44�m. The instrument sizing calibration was validated to
FIG. 2. Atmospheric sounding taken at 1300 LT (LT UTC � 3 h) at the Cruz Negra radar site in Mendoza on 1 Feb 2000. Thetemperature and humidity trace for a parcel lifted adiabatically from the surface with a temperature of 30.5°C and dewpoint of 14.5°Cis also indicated, producing a cloud base near the observed values of 11°C at 2.8 km MSL.
SEPTEMBER 2006 R O S E N F E L D E T A L . 1265
Fig 2 live 4/C

be correct, using glass beads. Correction for activitydead time was applied. Even after this correction, theFSSP grossly underestimated the integrated LWC withrespect to the DMT hot-wire water. This can occur inpart as a result of the FSSP operating at true airspeeds(TAS) in excess of 160 m s�1, whereas the maximumoperating TAS of the FSSP is 100 m s�1. Beyond thatvelocity the relative slow response of the electronicstranslates the increased transit velocity of a particle intoa reduced particle size (Baumgardner and Spowart1990). The extent of the dependence of cloud drop sizeon TAS can be estimated a posteriori by relying on theassumption that cloud droplet effective diameter re-mains nearly constant at a fixed height above cloudbase (Freud et al. 2005). Suitable measurements ofcloud drops at the same altitude at sufficiently variableTAS were available from the flight of 1 February 2000.Data from narrow ranges of 2°C intervals of isothermheights were analyzed. One-second flight data were se-lected if 2DC probe counted less than 1 SHADOR(SHADOR is the term for any shadow of particle thatis greater than or equal to two 25-�m image elements)particle and the nominal droplet concentration wasgreater than 10 cm�3. Based on the result, shown in Fig.
4, 0.73 (TAS � 107) �m was added to the FSSP-measured drop diameters. The application of this dropsize correction increased the integrated FSSP water by30%–40%, but there was still a remaining underesti-mate of the LWC by a factor of about 10, as is evidentfrom Fig. 5.
The remaining discrepancy by a factor of 10 can beexplained by misalignment of the optics, which causes areduced sample volume. The consistency of the dataduring the flights rules out problems such as fogging orwetting of the optics. The DMT LWC was taken as themore believable reference, and the FSSP readings afteractivity correction of the drop concentration and TAScorrection of the drop diameter were multiplied by thelarge factor of 10 for the whole FSSP measurementcampaign of 27 January–8 February 2000. The relationas presented in Fig. 5 shows useful relations on whichthe FSSP can be adjusted. Although misalignment ofthe optics is suspected, why such a large adjustment ofthe FSSP values was needed to bring them into agree-ment with the DMT values is unknown, and it cannotbe traced back because the specific FSSP instrument isno longer available. Therefore, some ambiguity be-tween the drop size and concentrations remains. Ac-
FIG. 3. Atmospheric sounding taken at 1300 LT (LT UTC � 3 h) at the Cruz Negra radar site in Mendoza on 7 Feb 2000. Thetemperature and humidity trace for a parcel lifted adiabatically from the surface with a temperature of 32°C and dewpoint of 13.5°Cis also indicated, producing a cloud base near the observed values of 9.7°C at 3.1 km MSL.
1266 J O U R N A L O F A P P L I E D M E T E O R O L O G Y A N D C L I M A T O L O G Y VOLUME 45
Fig 3 live 4/C

cording to Fig. 4, the error in drop average effectivediameter is probably less than 2 �m, which translates toa factor of less than 1.5 in the average drop concentra-tions.
c. Evolution of the DSD with height
The DSD evolution was measured by penetrating themost vigorous cloud elements that could be found atany height, from cloud base to the �45°C isothermlevel. The clouds were typically the feeders of the mainconvective storms, often while merging with the mainstorm. On occasion, the cores of the main storms werepenetrated, as was evident from the strong updrafts(�40 m s�1) that were penetrated and by an eventualencounter with giant hail on 8 February 2000 thatforced the end of the measurement campaign.
A complete base-to-top microphysical documenta-tion of the clouds with both the FSSP and DMT hot-wire LWC was obtained for 1 and 7 February 2000. The2DC instrument was also operative on 1 February, butnot for later dates. Measurements were made also on27, 28, and 30 January but without complete verticaldocumentation. Clouds with occasional nearly adia-batic updrafts were measured on both 1 and 7 February,as was evident by the peak values of nearly adiabaticLWC measured to the level of homogeneous freezing at
�38°C (see Fig. 6), the strong updrafts, and the largethermal buoyancies (see section 5). The amount ofhighly supercooled water reaching the homogeneousfreezing level well exceeded those reported previouslyin west Texas (Rosenfeld and Woodley 2000).
The vertical evolution of cloud DSD in the intenseupdrafts of severe hailstorms that occurred on thesetwo days was obtained for the whole vertical span be-tween cloud base and the anvil level (Figs. 7a,b). Thecloud DSD had an extremely narrow spectrum widthnear cloud base. The spectra widened with height butdid not start producing a precipitation echo below 8 km.It was shown that single-particle optical counters likethe FSSP artificially broaden particle spectra (Baum-gardner and Spowart 1990). Therefore, true width ofthe distribution might be even narrower. To mitigate tothe extent possible the impact of droplet spectra broad-ening on the vertical evolution of the spectra, it is mostprudent to concentrate on the drop diameter of themaximum LWC in a volume-weighted cloud DSD. Thisis defined as the drop size modal LWC, or DL. Thisproperty was used previously to track the vertical evo-
FIG. 4. The dependence of cloud drop effective diameter on thetrue airspeed at two narrow height ranges, as measured in theconvective storms of 1 Feb 2000. Each point represents 1 s of flightpath.
FIG. 5. The relation between FSSP and DMT hot-wire-measured LWC, after the activity and TAS corrections were ap-plied to the FSSP data. Data from four days are presented. Thecomparison is done for all data points that had more than 14uncorrected cloud drops per cubic centimeter and less than 1 2DCcount per liter. Where 2DC is not available for the SHADORrejection criterion, data at T � �10°C were not included.
SEPTEMBER 2006 R O S E N F E L D E T A L . 1267
Fig 4 5 live 4/C

lution of the main peak of the DSD in convectiveclouds in a large variety of cloud conditions (Andreaeet al. 2004). To put our measurements in global context,the height dependence of DL was obtained from Fig. 7and was compared in Fig. 8 with similar measurementsthat have been made elsewhere with similar probes in awide range of microphysical regimes (Andreae et al.2004). Measurements of the vertical evolution of DL
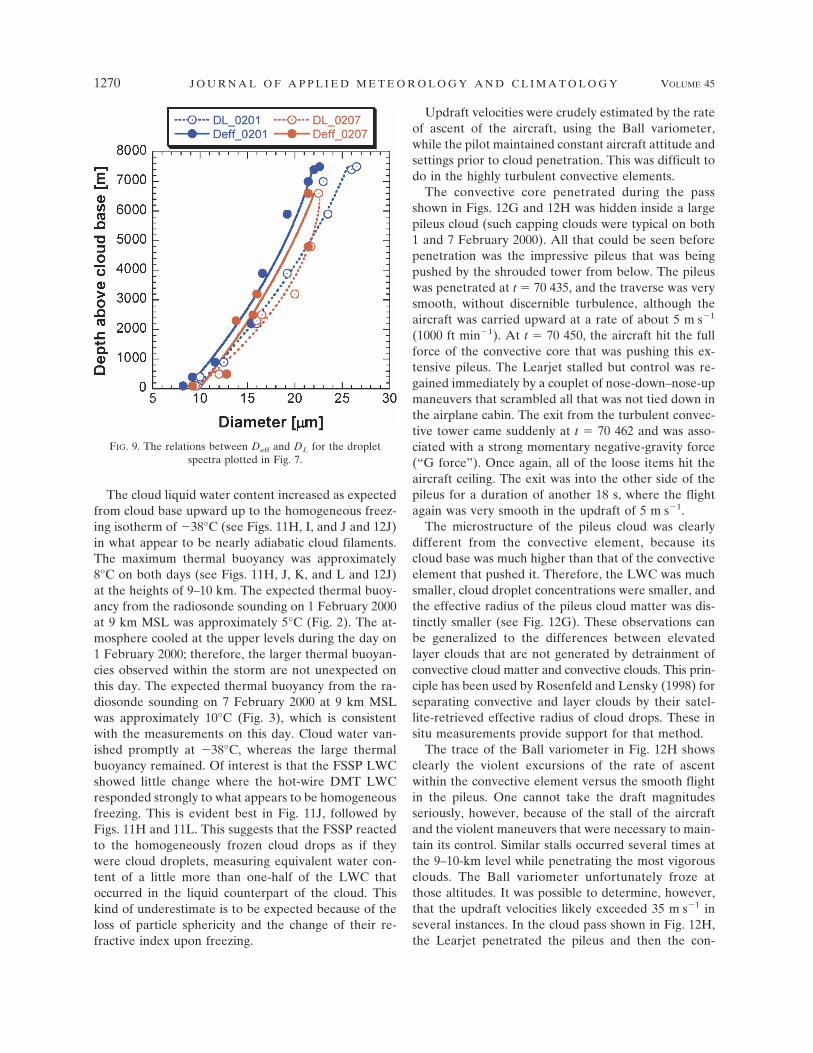
elsewhere showed that the onset of warm rain occurswhen DL exceeds the threshold of 24 �m. Warm raincan occur also at highly supercooled temperatures, butthe raindrops freeze readily and collect preferentiallythe larger cloud drops, as is evident in the monsoonclouds of Thailand (Fig. 8). The DSD in the Argentinehail clouds widened with height all the way to the ho-mogeneous freezing level but barely reached the 24-�mwarm rain threshold below the homogeneous freezinglevel. The relations between effective diameter Deff andDL (Fig. 9) show a similar indication from Deff reaching21–22 �m at these heights. Freud et al. (2005) haveshown, using a similar FSSP, that these Deff are thevalues above which significant coalescence and warmrain occurs. These results are robust, because Deff
shows much smaller variability (see Figs. 10–12) thanthe number concentrations and LWC (Tsonis et al.1987; Freud et al. 2005).
This result suggests that widening of the basic dropletspectrum by coalescence did not play an important role
in creating precipitation embryos in these Argentineclouds, except for the highest parts of the supercooledregions. However, it does not exclude the possibilitythat giant cloud condensation nuclei (CCN) could havestill created isolated raindrops that were too sparse tobe observed. According to Fig. 8, the coalescence at agiven depth above cloud base was as suppressed as inthe smoky clouds in the Amazon but was less sup-pressed than in the “pyro” clouds (i.e., clouds feedingdirectly on the heat and smoke of fires) there. It ap-pears that excessively large CCN concentrations havethe same effect on cloud microstructure and precipita-tion-forming processes as do strong updrafts in a mi-crophysically continental atmosphere. Indeed, thesmoky clouds in the Amazon produced hail up to 2 cmin diameter on the ground in the tropical rain forest(Andreae et al. 2004). It appears that the strength of theupdrafts and the concentrations of small CCN havesimilar effects on cloud microstructure, and the respec-tive contributions of the two factors to an observedcloud profile cannot be easily disentangled.
d. Documentation of individual cloud passes
Base-to-anvil sequences of cloud passes are pre-sented in Figs. 11 and 12 for the 1 and 7 February 2000cases of large (i.e., �3 cm) hail, respectively. The mostvigorous passes were selected for the vertical profilesshown in Figs. 11 and 12. The DSD spectra of the cloud
FIG. 6. Distribution of liquid water content as a function of height for the full two flights on (left) 1 and (right)7 Feb 2000. Each point is 1 s of flight path, measured by the DMT hot-wire instrument. Note the occasionaloccurrence of very large values up to just below the level of the �40°C isotherm, where the abrupt decreaseindicates the occurrence of homogeneous freezing. The tracked line represents the adiabatic water content. Someof the water contents at temperatures ��40°C may be due to time lags between the T and LWC sensors.
1268 J O U R N A L O F A P P L I E D M E T E O R O L O G Y A N D C L I M A T O L O G Y VOLUME 45

passes are displayed in Figs. 7a and 7b, respectively,labeled with the same panel lettering as found in Figs.11 and 12 (A, B, etc.).
This is the first time that such results have been re-ported. Therefore, the full vertical documentation ofcloud microstructure on the two days is provided forthe benefit of future research and especially for thevalidation of model simulations. The time reference onthe abscissa of each plot is in seconds referenced toUTC midnight (i.e., time t in seconds after UTC mid-night hour 3600 � minute 60 � seconds). Thepresented measurements are temperature (°C), DMThot-wire liquid water content (g m�3), adjusted FSSPliquid water content (g m�3), particle number concen-trations (2–44-�m nominal diameters) as measured bythe adjusted FSSP (cm�3, divided by 1000 to fit theright scale), Deff of the FSSP-measured particles (di-vided by 10 to fit the right scale), and rate of ascent asmeasured by the Ball variometer. Note that the timescale may change from panel to panel to accommodatethe individual cloud passes.
FIG. 7. Vertical evolution of the FSSP-measured cloud DSD fromcloud base to the height of homogeneous freezing in the feeders ofsevere hailstorms in Mendoza on (a) 1 and (b) 7 Feb 2000. The mostvigorous cloud element that was encountered at each altitude wasselected for this composite, as quantified mainly by the maximumamount of liquid water content. For minimizing the artifacts of hy-drometerors on the measured cloud DSD, only 1-s data with FSSPdroplet concentrations �500 cm�3 were averaged to form the dis-played spectra. Obviously, spectrum L in (a) is already of a glaciatedcloud, probably composed mainly of frozen cloud drops.
FIG. 8. The dependence of the drop size modal LWC DL onheight above cloud base and temperature, for Argentina hail-storms (red and orange), pyro clouds in the Amazon (black),smoky clouds in the Amazon (light green), smoky clouds in Thai-land (pink), monsoon smoke-free clouds in Thailand (blue), andpristine clouds in the Amazon (green). The lower and upper hori-zontal bars represent the 0° and �30°C isotherm cloud depths.The vertical line at DL 24 �m represents the warm rain thresh-old. The Argentina curves are from this study. The rest are fromAndreae et al. (2004).
SEPTEMBER 2006 R O S E N F E L D E T A L . 1269
Fig 7 8 live 4/C
The cloud liquid water content increased as expectedfrom cloud base upward up to the homogeneous freez-ing isotherm of �38°C (see Figs. 11H, I, and J and 12J)in what appear to be nearly adiabatic cloud filaments.The maximum thermal buoyancy was approximately8°C on both days (see Figs. 11H, J, K, and L and 12J)at the heights of 9–10 km. The expected thermal buoy-ancy from the radiosonde sounding on 1 February 2000at 9 km MSL was approximately 5°C (Fig. 2). The at-mosphere cooled at the upper levels during the day on1 February 2000; therefore, the larger thermal buoyan-cies observed within the storm are not unexpected onthis day. The expected thermal buoyancy from the ra-diosonde sounding on 7 February 2000 at 9 km MSLwas approximately 10°C (Fig. 3), which is consistentwith the measurements on this day. Cloud water van-ished promptly at �38°C, whereas the large thermalbuoyancy remained. Of interest is that the FSSP LWCshowed little change where the hot-wire DMT LWCresponded strongly to what appears to be homogeneousfreezing. This is evident best in Fig. 11J, followed byFigs. 11H and 11L. This suggests that the FSSP reactedto the homogeneously frozen cloud drops as if theywere cloud droplets, measuring equivalent water con-tent of a little more than one-half of the LWC thatoccurred in the liquid counterpart of the cloud. Thiskind of underestimate is to be expected because of theloss of particle sphericity and the change of their re-fractive index upon freezing.
Updraft velocities were crudely estimated by the rateof ascent of the aircraft, using the Ball variometer,while the pilot maintained constant aircraft attitude andsettings prior to cloud penetration. This was difficult todo in the highly turbulent convective elements.
The convective core penetrated during the passshown in Figs. 12G and 12H was hidden inside a largepileus cloud (such capping clouds were typical on both1 and 7 February 2000). All that could be seen beforepenetration was the impressive pileus that was beingpushed by the shrouded tower from below. The pileuswas penetrated at t 70 435, and the traverse was verysmooth, without discernible turbulence, although theaircraft was carried upward at a rate of about 5 m s�1
(1000 ft min�1). At t 70 450, the aircraft hit the fullforce of the convective core that was pushing this ex-tensive pileus. The Learjet stalled but control was re-gained immediately by a couplet of nose-down–nose-upmaneuvers that scrambled all that was not tied down inthe airplane cabin. The exit from the turbulent convec-tive tower came suddenly at t 70 462 and was asso-ciated with a strong momentary negative-gravity force(“G force”). Once again, all of the loose items hit theaircraft ceiling. The exit was into the other side of thepileus for a duration of another 18 s, where the flightagain was very smooth in the updraft of 5 m s�1.
The microstructure of the pileus cloud was clearlydifferent from the convective element, because itscloud base was much higher than that of the convectiveelement that pushed it. Therefore, the LWC was muchsmaller, cloud droplet concentrations were smaller, andthe effective radius of the pileus cloud matter was dis-tinctly smaller (see Fig. 12G). These observations canbe generalized to the differences between elevatedlayer clouds that are not generated by detrainment ofconvective cloud matter and convective clouds. This prin-ciple has been used by Rosenfeld and Lensky (1998) forseparating convective and layer clouds by their satel-lite-retrieved effective radius of cloud drops. These insitu measurements provide support for that method.
The trace of the Ball variometer in Fig. 12H showsclearly the violent excursions of the rate of ascentwithin the convective element versus the smooth flightin the pileus. One cannot take the draft magnitudesseriously, however, because of the stall of the aircraftand the violent maneuvers that were necessary to main-tain its control. Similar stalls occurred several times atthe 9–10-km level while penetrating the most vigorousclouds. The Ball variometer unfortunately froze atthose altitudes. It was possible to determine, however,that the updraft velocities likely exceeded 35 m s�1 inseveral instances. In the cloud pass shown in Fig. 12H,the Learjet penetrated the pileus and then the con-
FIG. 9. The relations between Deff and DL for the dropletspectra plotted in Fig. 7.
1270 J O U R N A L O F A P P L I E D M E T E O R O L O G Y A N D C L I M A T O L O G Y VOLUME 45
Fig 9 live 4/C

vective core. The aircraft stalled momentarily uponhitting the updraft, despite flying at a true airspeed of150 m s�1 and an angle of attack of 5.7°. According tothe illustration in Fig. 13, the updraft velocity deter-mines the angle of attack of the wing with respect to theairflow at the moment the aircraft hit the updraft. Astall occurs when the angle of attack increases beyond acritical value of 17°, at which the flow separates fromthe upper surface of the wing (in the Learjet a sensor ofthe angle of attack preempts the aerodynamic stall bymechanically lowering the nose of the aircraft when theangle of attack reaches 17°). According to Fig. 13, thevertical component of the airflow under these condi-tions is OB tan(∠COB), or 150 tan(11.3) 30 m s�1.This relative updraft estimate starts from the baselineof already existent rising motion outside the convectiveelement of about 5 m s�1, as evident by the existence ofthe pileus cloud. This brings the lower bound of theupdraft to about 35 m s�1. Stalls under similar aerody-namic conditions occurred several other times in vio-lent convective feeders of the hailstorms.
Indications of the vigor of the updrafts were obtainedalso by other means. During the cloud penetration inFig. 12J, the aircraft gained an altitude of 540 m during40 s while maintaining horizontal attitude. This gives amean updraft of 13.5 m s�1. During the 10-s period oft 68 321–68 331 the aircraft had an average rate ofascent of 31 m s�1. The peak value of 42.5 m s�1 oc-curred between t 68 322 and 68 324, which is coinci-
dent with the peak buoyancy (temperature) in thecloud (see Fig. 12J). This time is also the exact one atwhich the DMT hot-wire broke, probably as a result ofimpact with a hailstone. These updraft velocities arestill smaller than the 66 m s�1 estimated at the equilib-rium level of 11.7 km MSL from the simple relationshipWmax (2 CAPE)0.5 for an adiabatic parcel on 7February 2000. The equilibrium level is the tempera-ture at which the adiabatic parcel temperature is equalto the environmental temperature at the top of its as-cent. The sounding in Fig. 3 gives it as 11.7 km MSL on7 February and 11.4 km MSL on 1 February (Fig. 2).
The violent updrafts were driven by huge thermalbuoyancies of up to 8°C. The updrafts contained cloudfilaments of nearly adiabatic water to the level of ho-mogeneous freezing. To document the cloud propertiesin these updrafts just above the level of homogeneousfreezing, where the cloud was expected to consist ofhomogeneously frozen drops, the aircraft penetratedthe top of a vigorously growing cloud at an ambienttemperature of �45°C. LWC of up to 0.5 g m�3 wasfound in the cloud (Fig. 11L) at a maximum in-cloudtemperature of �37°C. The maximum hot-wire LWCmeasured in the most vigorous clouds colder than�38°C did not exceed 0.3 g m�3 because of the cloudice. Therefore, a reading of 0.5 g m�3 indicates that thiscloud contained some liquid water at �37°C. Ice hy-drometeors can grow very fast in these highly super-cooled water-laden clouds with such strong updrafts,
FIG. 10. The dependence of FSSP-measured cloud particle effective diameter on cloud temperature T for cloudpasses made on (left) 1 and (right) 7 Feb 2000. Each point represents 1 s of flight path, colored according to theDMT hot-wire liquid water content. All the measurements that include �100 FSSP adjusted counts are presented.
SEPTEMBER 2006 R O S E N F E L D E T A L . 1271
Fig 10 live 4/C

FIG. 11. Cross sections of convective elements of severe hailstorms or in their vicinity on 1 Feb 2000 over Mendozaas measured by the WMI Learjet. The penetrations are in vigorously growing convective elements from cloud baseto above the level of homogeneous freezing. The presented measurements are temperature (°C), DMT hot-wireliquid water content (g m�3), adjusted FSSP liquid water content (g m�3), particle number concentrations (2–44 �min diameter) as measured by the adjusted FSSP (cm�3, divided by 1000 to fit the right scale), and effective diameterDeff of the FSSP-measured particles, divided by 2 to fit the right scale. The abscissa is in seconds from 0000 UTC.Note that the time scale may change from panel to panel to accommodate the individual cloud passes.
1272 J O U R N A L O F A P P L I E D M E T E O R O L O G Y A N D C L I M A T O L O G Y VOLUME 45
Fig 11a-f live 4/C

FIG. 11. (Continued)
SEPTEMBER 2006 R O S E N F E L D E T A L . 1273
Fig 11g-l live 4/C

FIG. 12. Same as for Fig. 11, but for 7 Feb 2000. Panels (H) and (F) also show the rate of aircraft ascent, asmeasured by the Ball variometer. The hot-wire of the DMT LWC probe broke in the middle of the penetrationshown in (J). It was not operative in (C), (D), and (G). The 2DC was not operative on this day.
1274 J O U R N A L O F A P P L I E D M E T E O R O L O G Y A N D C L I M A T O L O G Y VOLUME 45
Fig 12a-f live 4/C

and it is not surprising that some of them producedgiant hailstones. To minimize the chances of flying intohailstones, the aircraft penetrated these violent convec-tive towers at not more than about 1000 m below theirtops. This fact means that the cloud tops were wellexposed to viewing from satellites and that the aircraftmeasurements are highly relevant to satellite measure-ments of the vertical evolution of cloud microstructureusing the method of Rosenfeld and Lensky (1998; alsoRosenfeld and Woodley 2003). Even with this flightprecaution, the aircraft still encountered small hail-stones and large graupel in the tops of the severe con-vective elements on 7 February 2000. These ice par-ticles broke the DMT LWC hot-wire, as evidenced bythe discontinued DMT LWC measurement in the pen-etration shown in Fig. 12J.
The vigorous updrafts at temperatures below thethreshold of homogeneous freezing appear to have
FIG. 12. (Continued)
FIG. 13. A schematic illustration of the airflow with respect tothe aircraft wing upon entering the updraft. The aircraft wing isrepresented by the thick line AO, moving horizontally from left toright. The horizontal component of the airflow with respect to thewing is represented by the arrow BO. The angle of attack invertically still air would then be given by BOA. Upon entering theupdraft, before the added forces had time to change the attitudeand flight path of the aircraft, the updraft can be represented as anaddition of vector CB, resulting in a net relative flow representedby vector CO. The angle of attack would then grow from BOA toCOA. A stall would occur when the updraft CB increases to theextent that angle COA grows beyond the critical angle.
SEPTEMBER 2006 R O S E N F E L D E T A L . 1275
Fig 12g-j live 4/C

been composed of mainly homogeneously frozen clouddrops, as suggested by the similarity of Deff for thewater and ice clouds at the same level (see Figs. 11J,L).However, when full heterogeneous glaciation occurredat warmer temperatures, the true Deff of the ice cloudincreased well beyond the true Deff of the water ormixed phase cloud at the same level (see Fig. 11F). Inice clouds with large nonspherical particles, the FSSPmeasures random noise that maximizes at the middlebins. This is manifested as a much larger indicated Deff
than that of the water clouds at the same level in theseparticular clouds. This is evident in the larger indicatedDeff of heterogeneously glaciated cloud relative to theDeff of a homogeneously frozen one. In specific terms,the heterogeneous glaciation occurring at the warmertemperatures takes place in a mixed-phase cloud,where the ice particles can continue growing by ac-cretion and by vapor deposition at the expense ofthe water cloud droplets. Therefore, in addition to theincreased Deff due to large ice particles, the dropletconcentrations should be lower in heterogeneously gla-ciating clouds, especially when glaciating at higher tem-peratures at which freezing of individual cloud dropletsis less probable. The FSSP LWC in glaciated cloudscorresponds to cloud ice water content, but the relationbetween this quantity and the true water value is un-derestimated by an unknown amount.
e. Development of precipitation-sized (�100 �m indiameter) hydrometeors
The 2DC imaging probe was used to examine theprecipitation-sized (�100 �m in diameter) hydromete-ors during each pass through the vigorous cloud towers.Virtually no precipitation particles were evident at al-titudes �8 km. At 150 m s�1, the sample volume of the2DC probe is approximately 7.3 L s�1. A few images athigher altitudes (colder temperatures) on 1 February2000 are provided in Fig. 14. The swath width in each ofthe six panels is 0.8 mm. The coded time provided ineach panel corresponds to the times on the abscissa ofthe panels in Fig. 11. An assortment of ice particles isevident in the images, ranging from �0.1 mm in diam-eter to 3 mm. The images in Figs. 14C–E at t from 74350 to 74 352, respectively, show a short image se-quence of passage through a small near-adiabatic cloudfilament just below the homogeneous freezing point, asshown in Fig. 11I. Small concentration of very smallgraupel appeared in the core, with larger graupel of afew millimeters at the fringes. Somewhat larger andmore numerous graupel were observed in another half-adiabatic LWC core at temperature T �36°C (t 74352 in Fig. 14E). Graupel of up to 3 mm appeared in
glaciated cores below (T �34°C, t 73 986 in Figs.14A and 11H) and above (T �45°C, t 74 461 inFigs. 14F and 11J) the homogeneous freezing isothermlevel. The importance of these observations is with thedocumentation of cloud parcels that maintained mostof their water up to the homogeneous freezing level.Such images under the conditions for which they wereobtained are unique in showing how precipitation isinitiated in these highly supercooled and microphysi-cally continental clouds, which form the very high “firstechoes” that are shown in the next section.
5. First-echo heights
The lack of aircraft-observed precipitation-sized hy-drometeors in detectable concentrations (e.g., 0.1 L�1
for 1-mm graupel) in the growing convective elementsimplies a first-echo height above that level. The radarfirst-echo tops, as observed on 1 and 7 February 2000,were around 8–9 km. A simple unambiguous exampleof first-echo height was done on 30 January 2000 on anisolated cumulus congestus cloud that formed 75 kmnortheast of the radar and was clearly visible to themeteorologist (T. Krauss) at the radar site. Accordingto Fig. 8, the cloud microstructure on that day was simi-lar to that of the more fully documented cases on 1 and7 February 2000. The radar first echo and a photographof the cloud are shown in Fig. 15. The striking feature isthat the cloud appeared to be vertically developed andvigorous but without a significant radar echo. Closeobservation showed that the cloud base was free ofprecipitation. The first echo of 20 dBZ appeared at analtitude of 9 km MSL. The radar echo intensifiedquickly to 51 dBZ in 15 min, as seen in the radar scanof 2300 UT. The cloud photograph for that time showsvisible signs of glaciation at the top, a darker cloudbase, and the first signs of precipitation. The fact thatthis relatively moderate and isolated cloud developedsuch a high first echo suggests that other factors in ad-dition to strong updrafts delayed the precipitation ini-tiation in the clouds. These additional factors can be therelatively high and cold cloud base (cloud-base tem-perature of 7.5°C at 3.2 km MSL) and the microphysi-cally continental aerosols, leading to nucleation of largeconcentrations of small droplets with a narrow spec-trum at cloud base. It is unfortunate that no CCN mea-surements were available.
The first echo shown in Fig. 15 is consistent also withthe plot of cloud buoyancies (Tc � Ta, where the sub-scripts c and a indicate cloud and ambient, respectively)obtained in vigorous Mendoza convective clouds onfour flight days (27 and 28 January and 1 and 7 Febru-ary) in 2000 (Fig. 16). The maximum supercooled liquid
1276 J O U R N A L O F A P P L I E D M E T E O R O L O G Y A N D C L I M A T O L O G Y VOLUME 45

water content (SLWC) and in-cloud temperature ofeach cloud pass are plotted. The diagonal line denotesthe line of zero buoyancy. The horizontal line is thehomogeneous freezing temperature of the cloud drop-lets. It is likely that the coldest first-echo temperatureswere produced in the clouds with greatest buoyanciesand updrafts. Such clouds are the most troublesomebecause they provide the smallest lead time betweenfirst echo and the existence of fully vertically developedcumulonimbus capable of producing hail, making it dif-ficult to issue timely warnings before the hail poten-tially begins. They are troublesome also because theseare the clouds with strongest updrafts and hence theclouds with the potential of producing the largest hailand the most damage.
6. Discussion
The authors are not aware of any publications docu-menting the microstructure of hailstorm clouds fromcloud base to �45°C. To be specific, the amount ofdocumented highly supercooled liquid cloud water andthe thermal buoyancies are the largest that the authorshave found in the published literature so far.
The combination of the following conditions ob-served in the measured clouds constitutes the potentialfor severe hailstorms:
1) microphysically continental cloud microstructure,having little coalescence and warm rain with the for-mation of only a few precipitation embryos at lowlevels,
FIG. 14. Images of cloud hydrometeors observed during penetrations of (B), (D), (E) very highly supercooled clouds, (C) mostlyglaciated clouds, and (A), (F) fully glaciated clouds on 1 Feb 2000 as shown in Fig. 11. The image slice width is 0.8 mm. The coded timeprovided in each panel corresponds to the times on the abscissa of the panels in Fig. 12. Note the existence of very few and small hy-drometeors in the near-adiabatic cloud segment of (D) and (E), where according to Fig. 11I T peaks at �36°C and LWC peaks at 3 g m�3.
SEPTEMBER 2006 R O S E N F E L D E T A L . 1277
Fig 14 live 4/C

FIG. 15. The formation of precipitation from a first echo in an isolated relatively small cloud on 30 Jan 2000, as documented by theradar and corresponding cloud photograph taken from the radar site. The cloud was centered near 75 km from the radar at an azimuthof 055°. For each radar scan the composite plan position indicator (PPI) of the greatest reflectivity at any height is indicated. The verticalcross section along the red line in each PPI is presented in the range–height indicator (RHI). The RHI frames are 18 km horizontallyby 10 km in the vertical direction. The RHI show that the first echo occurred at a height of about 9 km. Cloud base is at a height of3.2 km above sea level at a temperature of 7.5°C.
1278 J O U R N A L O F A P P L I E D M E T E O R O L O G Y A N D C L I M A T O L O G Y VOLUME 45
Fig 15 live 4/C

2) little loss of cloud water to warm rain and glaciation,leading to a very deep layer of supercooled cloud,containing nearly adiabatic water contents in ex-treme cases,
3) existence of large amounts of cloud liquid water inthe strong updrafts up to the �35°C isotherm withfilaments of undiluted and unfrozen updrafts reach-ing the level of homogeneous freezing near �38°C(this extends the zone of growth of large hailstonesupward to that highest possible level),
4) very strong updrafts in the highly supercooled parts(from �25° to �38°C) of the cloud of at least 40m s�1 [such an updraft can support a hailstone witha diameter of 6.0 cm at a temperature of about�25°C (Macklin 1977)], and
5) strong vertical wind shear to separate the updraftfrom the downdraft, leading to long-lived cell circu-lations and potential for recirculation of hydromete-ors, which has been shown to be a mechanism in-volved in the formation of large hail (Foote 1984,1985).
The combination of these conditions can create large(i.e., �3 cm) hail, which was observed from the storms
in which the measured clouds acted as feeders. Cloudelectrification is the result of collisions between graupeland ice crystals in supercooled clouds, with greatercharging at colder temperatures. The enhanced vigor ofthe storm results in a deeper mixed-phase zone andhence could result in greater charging as well as greatervertical transport of the separated charges. However,the observations that the very strong updrafts delay theonset of mixed-phase processes to the very high levelsor even prevent them altogether may lead to the sup-pression of lightning through a lack of graupel and icecrystal collisions within the cores of such updrafts.There is presently no objective measure of this effect,but lightning discharges were not visibly observed inthe vigorous, young, growing, cloud towers that werepenetrated during the Argentine cloud-physics cam-paign. Although it might be ascribed to chance in sucha short research effort, the lack of encounters withlightning during the 6 years of operational seeding ofsuch convective elements (R. Tilbury, the seeder pilotof the Learjet, 2004, personal communication) cannotreasonably be ascribed to chance. Similar observationsof weak electrical charging in the intense updraft coresof severe storms in the U.S. high plains was reported byLang et al. (2004), which suggests that the measuredclouds in this study possess properties of the core up-drafts of severe hailstorms. In contrast, occasional light-ning was encountered in the feeders of much less severeand less continental storms, such as in Israel winterthunderstorms over the east Mediterranean region, asexperienced by the first author (who also conducted theresearch flights in Argentina).
It is suggested that severe hailstorms in a microphysi-cally continental air mass have very low precipitationefficiency because much of the cloud water escapesthrough the anvil during homogeneous freezing or isevaporated because of the small sizes of the hydrom-eteors other than the low concentrations of the largehailstones.
7. Conclusions
The structures of severe convective storms at highaltitudes and low temperatures in Mendoza, Argentina,have been documented for the first time, using a cloud-physics jet aircraft and radar, satellite, and rawinsondeobservations. The main research goal was the descrip-tion of the microphysical evolution of the convectivefeeders to the storms from cloud base to the anvil cloudtops for obtaining insights to the microstructure ofthese hail-prone clouds. This was achieved by flying theaircraft preferentially through the young, growing, con-vective elements, which were typically the major feed-ers to severe hailstorms, producing large (i.e., �3 cm)
FIG. 16. Observed buoyancies in vigorous Mendoza convectiveclouds on 27 and 28 Jan and 1 and 7 Feb 2000. The maximumSLWC (g m�3) and in-cloud temperature of each cloud pass areplotted. The diagonal line denotes the line of zero buoyancy, i.e.,equal in-cloud and ambient temperatures. The horizontal line isthe homogeneous freezing temperature of the cloud droplets.Note that the SLWC generally increases for greater thermal buoy-ancy, which is given by the distance above the diagonal line, butonly at in-cloud temperatures higher than �38°C, as denoted bythe horizontal line. The contrast of SLWC at high thermal buoy-ancy above and below the �38°C line supports the suggestion ofhomogeneous freezing occurring near this temperature.
SEPTEMBER 2006 R O S E N F E L D E T A L . 1279

hail. Cloud bases ranged typically between 6° and 14°C,with typical base updrafts of 4–7 m s�1. The cloud up-drafts increased with height, exceeding 25 m s�1 atheights �7 km and occasionally 40 m s�1 at heights �8km. Such updraft speeds will support hailstones that areroughly 6 cm in diameter. Thermal buoyancies of 5°–8°C, which drove the extreme updrafts, were measuredin the convective towers at heights of 8–10 km. Thevertical wind shear was weak below 6 km but increasedstrongly above that level as the west winds cleared theAndes barrier, which averages 6.1 km to the west ofMendoza. The clouds had very little coalescence andcontained no discernible precipitation-sized particles�100 �m in diameter at T ��15°C. Nearly adiabaticcloud water with most cloud water still not convertedinto precipitation was maintained in some cloud por-tions within the strongest updrafts up to the level ofhomogeneous freezing, reaching 4 g m�3 at �38°C inone cloud before vanishing abruptly at colder tempera-tures. Graupel �1 mm appeared at the tops of growingnew towers at temperatures of less than �27°C, inagreement with radar first-echo heights of about 8 km.A few isolated frozen raindrops were also observedthere.
The complementary information obtained from ra-winsondes reinforced these findings. Calculations thatuse atmospheric soundings as input gave maximum up-draft speeds (51–66 m s�1) that exceeded those ob-served. First-echo tops were noted at 8–9 km, and thesewere followed by hail formation in as little as 15 min.The aircraft measurements documented intense super-cooling of the cloud water to near the point of homo-geneous nucleation, indicating a vast reservoir of super-cooled water available for the growth of large hail-stones.
Acknowledgments. We thank Mr. Pat Sweeney,president of WMI, for supporting this research effort.We are deeply grateful also to Mr. Roger Tilbury, whoskillfully and safely piloted the Learjet through the topsof the most vigorous convective cores of the violenthailstorms, resulting in this unique set of observations.Our thanks are also given to Mr. Tilbury for measuringand providing the angle-of-attack estimates necessaryfor calculating the peak updrafts in the clouds, whichexceeded 40 m s�1. This research was supportedthrough the contract between WMI and the Ministry ofEconomy of the government of Mendoza, Argentina.
REFERENCES
Andreae, M. O., D. Rosenfeld, P. Artaxo, A. A. Costa, G. P.Frank, K. M. Longo, and M. A. F. Silva-Dias, 2004: Smokingrain clouds over the Amazon. Science, 303, 1337–1342.
Barge, B. L., and F. Bergwall, 1976: Fine scale structure of con-vective storms associated with hail production. AtmosphericScience Division, Alberta Research Council, Edmonton,Rep. 76-2, 43 pp.
Baumgardner, D., and M. Spowart, 1990: Evaluation of the for-ward scattering spectrometer probe. Part III: Time responseand laser inhomogeneity limitations. J. Atmos. Oceanic Tech-nol., 7, 666–672.
Chisholm, A. J., 1970: Alberta hailstorms: A radar study andmodel. Ph.D. thesis, McGill University, 287 pp.
——, and J. H. Renick, 1972: The kinematics of multicell andsupercell Alberta hailstorms. Alberta Hail Studies: 1972, Re-search Council of Alberta Rep. 72-2, 24–31.
Dixon, M., and G. Wiener, 1993: TITAN: Thunderstorm Identi-fication, Tracking, Analysis, and Nowcasting—A radar-basedmethodology. J. Atmos. Oceanic Technol., 10, 785–797.
English, M., 1986: The testing of hail suppression hypotheses bythe Alberta Hail Project. Preprints, 10th Conf. on WeatherModification, Arlington, VA, Amer. Meteor. Soc., 72–76.
Foote, G. B., 1984: The study of hail growth utilizing observedstorm conditions. J. Climate Appl. Meteor., 23, 84–101.
——, 1985: Aspects of cumulonimbus classification relevant to thehail problem. J. Rech. Atmos., 19, 61–74.
Freud, E., D. Rosenfeld, M. O. Andreae, A. A. Costa, and P.Artaxo, 2005: Observed robust relations between CCN andvertical evolution of cloud drop size distributions in deepconvective clouds. Atmos. Chem. Phys. Discuss., 5, 10 155–10 195.
Heymsfield, A. J., L. M. Milosevich, C. Schmitt, A. Bansemar, C.Twohy, M. R. Poellot, A. Fridlind, and H. Gerber, 2005: Ho-mogeneous ice nucleation in subtropical and tropical convec-tion and its influence on cirrus anvil microphysics. J. Atmos.Sci., 62, 41–64.
Knollenberg, R. G., A. J. Dascher, and D. H. Huffman, 1982:Measurements of the aerosol and ice crystal populations intropical stratospheric cumulonimbus. Geophys. Res. Lett., 9,613–616.
Krauss, T. W., and J. D. Marwitz, 1984: Precipitation processeswithin an Alberta supercell hailstorm. J. Atmos. Sci., 41,1025–1034.
Lang, T. J., and Coauthors, 2004: The Severe Thunderstorm Elec-trification and Precipitation study. Bull. Amer. Meteor. Soc.,85, 1107–1125.
Lawson, R. P., L. J. Angus, and A. J. Heymsfield, 1998: Cloudparticle measurements in thunderstorm anvils and possibleweather threat in aviation. J. Aircr., 35, 113–121.
Macklin, W. C., 1977: The characteristics of natural hailstones andtheir interpretation. Hail: A Review of Hail Science and HailSuppression, Meteor. Monogr., No. 38, Amer. Meteor. Soc.,65–88.
Makitov, V., 1999: Organization and main results of the hail sup-pression program in the northern area of the province ofMendoza, Argentina. J. Weather Modif., 31, 76–86.
Marwitz, J. D., 1972a: The structure and motion of severe hail-storms. Part I: Supercell storms. J. Appl. Meteor., 11, 166–179.
——, 1972b: The structure and motion of severe hailstorms. PartII: Multicell storms. J. Appl. Meteor., 11, 180–188.
——, 1972c: The structure and motion of severe hailstorms. PartIII: Severely sheared storms. J. Appl. Meteor., 11, 189–201.
Musil, D. J., and P. L. Smith, 1986: Aircraft penetrations of Swisshailstorms: An update. J. Weather Modif., 18, 108–111.
——, A. J. Heymsfield, and P. L. Smith, 1986: Microphysical char-
1280 J O U R N A L O F A P P L I E D M E T E O R O L O G Y A N D C L I M A T O L O G Y VOLUME 45

acteristics of a well-developed weak-echo region in a highplains thunderstorm. J. Climate Appl. Meteor., 25, 1037–1051.
——, S. A. Christopher, R. A. Deola, and P. L. Smith, 1991: Someinterior observations of southeastern Montana hailstorms. J.Appl. Meteor., 30, 1596–1612.
Rosenfeld, D., and I. M. Lensky, 1998: Spaceborne sensed insightsinto precipitation formation processes in continental andmaritime clouds. Bull. Amer. Meteor. Soc., 79, 2457–2476.
——, and W. L. Woodley, 2000: Convective clouds with sustainedhighly supercooled liquid water down to �37.5°C. Nature,405, 440–442.
——, and ——, 2003: Closing the 50-year circle: From cloud seed-ing to space and back to climate change through precipitation
physics. Cloud Systems, Hurricanes, and the Tropical RainfallMeasuring Mission (TRMM): A Tribute to Dr. Joanne Simp-son, Meteor. Monogr., No. 51, Amer. Meteor. Soc., 59–80.
Smith, P. L., J. L. Stith, and D. A. Barrows, 1994: Observations ofmicrophysical evolution in a high plains thunderstorm anvil.Atmos. Res., 33, 25–35.
Tsonis, A. A., W. R. Leaitch, and M. D. Couture, 1987: The effectof calibration of the forward-scattering spectrometer probeon the sizing of cloud droplets. J. Atmos. Oceanic Technol., 4,518–526.
World Meteorological Organization, 1995: WMO meeting of ex-perts to review the present status of hail suppression. WMOTech. Doc. 764, 39 pp.
SEPTEMBER 2006 R O S E N F E L D E T A L . 1281