Embed Size (px)
Citation preview
Airborne Dust Liberation During Coal CrushingJOHN A. ORGANISCAK and STEVEN J. PAGE
National Institute for Occupational Safety and Health, Pittsburgh Research Laboratory, Pittsburgh, PA 15236
Airborne dust generation is one of the byproducts of coal mining, processing, and handling. The amount of airborne total dust (ATD, respirable size and larger) and airborne respirable dust (ARD) generated is of primary interest for designing the level of engineering controls needed for adequate dust abatement. Laboratory crushing experiments were conducted in a wind tunnel with a roll crusher to identify relationships among crushing parameters, product size, coal rank properties, and airborne dust generation. Through the first series of experiments, the effect of primary and secondary breakage processes on both product size and airborne dust generation was examined. Through a second series of experiments, the effect of coal rank properties on product size and airborne dust generation was studied using a uniform crushing process with secondary breakage.
Laboratory results indicate that secondary breakage of a particular coal notably increases the specific amount of ATD generated, while negligibly impacting the specific amount of ARD generated. A strong positive relationship was identified between the specific amounts of ATD and ARD generated during the primary breakage process (with minimal secondary breakage), but a negligible relationship was observed between the same two variables when secondary breakage was introduced into the crushing process. This indicates that most of the ATD and ARD is generated from the primary breakage, while secondary breakage has a more of an influence on generating additional amounts of larger sized ATD.
Additional experiments involving the uniform crushing of eight different bituminous coals showed that the coal rank, expressed as the inherent moist fuel ratio (MFR= fixed carbon -f- (volatile x inherent moisture)), had diverse relationships between the product size created and the amount of airborne dust generated. As bituminous coal rank or MFR increased, the amount of coal product fines < 250 nm increased while the mass percentage of ATD and ARD liberated from these < 250 |im product fines decreased. Air dry loss (ADL) moisture in the coal was found to be inversely related to the dust cloud electrostatic field, influencing dust liberation from the coal product fines. Since the MFR was directly related to the dust cloud electrostatic field, opposite the

ADL-electrostatic field relationship, the diverse relationships between the product size created and the amount of dust liberated from the < 250 (im product fines were explained. Finally, 12 to 14 times more ATD was generated as compared to the ARD generated during these experiments. These results should provide a fundamental basis for initial estimation of the airborne dust loading requirements of engineering control methods for coal crushing.
Keywords-. Coal crushing; Coal rank; Coal product size; Airborne dust liberation
INTRODUCTION
Airborne coal dust is a byproduct of coal breakage during mining, processing, and handling. Airborne dusts can pose both respiratory and environmental problems. In mines, prolonged exposure to airborne respirable coal dust is responsible for the prevalence of coal workers’ pneumoconiosis (CWP) in the United States. Health research studies have identified that the severity of CWP is directly related to the amount of respirable dust exposure and the coal rank [1-3]. More broadly, the U.S. Environmental Protection Agency (EPA) also reports general population respiratory health risks associated with inhalable particulate matter (PM) comprising solid particle and liquid droplets [4]. Furthermore, EPA cites that reduced visibility in parts of the United States is caused by PM, which can also cause damage to painted surfaces and building existence.
Airborne coal dust is also explosive, given the right particle size, concentration, and ignition source. Bureau of Mines studies have shown that ignitable airborne coal dust concentrations start on the order of 50g/m3 (0.05 oz./ft3) [5,6]. The most explosive coal dust size in air is below 75 nm (—200 mesh) [5,6]. Airborne coal dust concentration, minimum ignition temperature, and minimum ignition energy all decrease with increasing volatile matter of the coal. The ignition temperature was found to be also substantially lower for a non-air borne dust layer [5]. Thus coal dust also has potential safety hazards as well as health hazards associated with its generation.
Over the past few decades, air quality standards have been enacted by several federal regulatory agencies to reduce occupational lung disease risks from coal mining as well as public health and environmental risks from ambient air emissions. The Mine Safety and Health Administration’s (MSHA’s) permissible dust standard for

DUST LIBERATION DURING CRUSHING
coal mine workers is a shift average of 2.0 mg of airborne respirable coal mine dust per cubic meter of air (2.0 mg/m3 as defined by the Mining Research Establishment (MRE) Criteria) [7]. MSHA also does not permit explosive accumulations of coal dust in the air of or on surfaces in coal mines and surface facilities [8]. The U.S. EPA’s national ambient air quality standards include a 24-hour and annual PM2.5 standard (less than 2.5-^m diameter particles) of 65 (xg/m3 and 15|ig/m3, respectively, and a 24-hour and annual PMi0 standard (less than 10 nm diameter particles) of 150 jig/m3 and 50|xg/m3, respectively [9]. A significant investment in air pollution control measures is usually required for mining operations to meet these air quality standards.
Air pollution or engineering control measures for airborne dusts can be very efficient, but misapplication of these methods persists in the coal mining industry. A field study of thirteen US longwall mining operations showed a ten-fold range of airborne respirable dust levels at the mining face (1 to 10 mg/m3 at the tailgate), with variations in engineering control measures utilized [10]. A field study of eighteen coal preparation plants likewise showed more than a ten-fold range of airborne respirable dust levels inside these plants (from 1 to 11 mg/m3) [11,12]. Only one-third of these plants had dust levels below 5 mg/m3, with the others exceeding 7 mg/m3. The worst locations in many of the plants were found in tightly boxed-in and poorly ventilated areas on the first and second floor. Only three of the plants in this field study used dust collection devices besides ventilation; these devices included bag houses, wet scrubbers, and an electrostatic precipitator. Many of these devices have shown at least 85% dust capture efficiency On respirable-sized dusts in the field [11]. A key operational problem found with these devices in coal preparation plants is pipe and duct clogging from dust on the negative air pressure side of the devices. Thus, some of these dust control problems encountered in the coal mining industry can be attributable to a lack of fundamental knowledge about the amounts and characteristics of airborne dust generated from coal breakage.
Prior research studies on the relationship between coal rank and dust generation have shown differences between the amount of dust particles created in the product and the amount of dust that gets airborne. Many of these studies focused on studying the amount of fine dust particles created in the product from coal crushing and
grinding. Results from these studies conclusively showed that the amount of fine dust generated in the product is positively related to coal rank [13-15]. However, laboratory and field studies on airborne dust generation have shown the opposite relationship with regard to coal rank. Underground and laboratory studies conducted by the U.S. Bureau of Mines in the late 1980s and early 1990s and by the National Institute for Occupational Safety and Health [NIOSH] in the mid 1990s showed negative relationships between coal rank (low to high volatile bituminous coals studied) and airborne dust generation as compared to previously established positive coal rank and product fines relationship [16-18].
In order to identify the underlying factors involved in the diverse results observed between coal rank, product size characteristics, and airborne dust generation, NIOSH conducted additional laboratory coal crushing experiments. This research was conducted to identify the underlying causes of airborne dust liberation from the coal product. Two series of experiments were involved in this research. The first series of experiments involved crushing four feed sizes of Pittsburgh coal using two feed methods to develop a repeatable experimental procedure to be used on testing various bituminous coals. Once a procedure was established, the second series of experiments was performed on five bituminous coals to identify relationships between coals characterized by proximate analysis, specific energy of crushing, product size characteristics, dust cloud electrostatic field, and specific amounts of airborne total dust (ATD) and airborne respirable dust (ARD) generated. An earlier report by Organiscak and Page, 1998, describes the development of the crushing procedure, presents the results of roll crushing five different US bituminous coals, and discusses the coals’ air dry loss (ADL) constituent and electrostatic charge effect on airborne respirable dust (ARD) liberation from the coal product [19].
Since then, the experimental results obtained from crushing four feed sizes of Pittsburgh coal using two feed methods were further examined to determine the underlying causes of product size and airborne dust generation from primary and secondary breakage processes. Primary breakage is acknowledged as the process of coal being directly broken by either compression, shear, or impaction forces from the crusher apparatus, whereas secondary breakage is

DUST LIBERATION DURING CRUSHING
recognized as the process of coal being indirectly broken or ground upon itself (mastication). Also, three addition coals have been tested and the data further analyzed to develop relationships comparing the coal rank, median product size, product fines (<250|im or —60 mesh), percentage of airborne total dust liberated from the < 250 |xm product (PATD250), and percentage of airborne respirable dust liberated from the <250nm product (PARD250). The objective of this paper is to formulate a fundamental basis for identifying airborne dust loading requirements for engineering control methods used in coal mining, processing, and handling.
COAL CRUSHING EXPERIMENTS
Two series of coal crushing experiments were conducted to identify the underlying causes of airborne dust liberation from the coal product. A double-roll crusher was selected to study the breakage properties of medium-sized coal lumps (approximately 50 mm), because it minimizes the amount of over-grinding through a small size reduction ratio of 1.5 to 5:1 (ratio of average feed size to product size) [20]. The first series of experiments studied primary coal breakage with and without secondary breakage interjected into the crushing process. The second series of experiments studied the relationships among coal rank, product size, dust cloud electrostatic field, and airborne dust generation.
Test Facility
The experimental test facility comprised a roll crusher located in the intake end of a 1.2-m high by 0.6-m wide, wood-framed, plastic- sheath-enclosed wind tunnel 6.1m in length. A dust collector and exhaust fan were located at the discharge end of the tunnel. The crusher was a 1.1 kW compact double roll crusher (79.4-mm diameter rolls) operating at approximately 70rpm, with twenty-four 12.7-mm high, blunt chisel shaped teeth, staggered on each roll. An inductive current transformer (± 0 .1 A) was installed to monitor the crusher’s current usage. The crusher’s operating capacity was 227-1361 kg/hr of up to 101.6-mm feed size lumps of coal or rock material.

Dust sampling was conducted 3 m downstream of the crusher and approximately 2.4 m upstream of the tunnel transition to the dust collector and exhaust fan. Dust sampling was conducted with two Sierra 298 personal sampling impactors,1 each equipped with the standard inlet cowl and positioned at one-half the tunnel height from the floor and one-third the tunnel width from the wall. The impactor stages 1 through 6 (20 nm through 1.55 ^m cut point sizes) were used, with the minus 1.55 nm particles sizes collected on the final filter. An MIE Real-Time Aerosol Monitor (RAM-1) sampler continuously monitored the respirable fraction of dust from a 10-mm Dorr Oliver cyclone placed in the middle of the impactor sampling locations [21]. All the sampler inlets were faced into the airflow. Dust cloud electrostatic field measurements were made immediately downstream of the crusher (within 0.3 m) with a Monroe 245 electrostatic field meter, and stored on an analog data logger. Air velocities were determined from the time it took the dust to travel 3 m to the RAM-1 sampling location after crusher start-up. Preliminary crushing tests indicated that the lowest possible wind tunnel air velocity needed to maximize dust concentrations and mass collection was 0.10 m/s (45 m3/s air quantity). Lower velocities permitted dust to escape from the tunnel inlet, so wind tunnel airflow was targeted for 0.10 m/s for all the experiments. Wind tunnel air humidity was not controlled as part of this study, but experimental conditions measured were mostly between 60% to 90% relative humidity.
Primary and Secondary Breakage Experiments
Two breakage processes were studied during the first series of experiments to develop a reproducible crushing procedure for the second series of coal property experiments. A predominantly primary breakage process was modeled by trickle-feeding coal into the crusher (i.e., a separate vibrating feeder slowly trickles coal into the crusher). Secondary breakage was introduced into the primary breakage process by batch-feeding coal (i.e., gravity feeds the batch of coal from the crusher hopper). Both feed methods on several coal feed sizes were
1 Mention of any company name or product does not constitute endorsement by the National Institute for Occupational Safety and Health.

DUST LIBERATION DURING CRUSHING
studied in a series of crushing experiments conducted on 470 kg of Pittsburgh coal obtained from NIOSH’s Safety Research Coal Mine at the Pittsburgh Research Laboratory (PRL). A large batch of PRL coal lumps were jaw crushed, screened, and riffled (a sample splitting process) [22] into 32 representative test samples (14.7 kg by weight) of various feed sizes that would be tested under different feed methods. The sizes tested included 50.0 x 25.0-mm, 25.0 x 19.0-mm, 19.0 x 12.5-mm feed samples, and an equivalent-weight three-size mixture. The various test samples were randomly processed through the crusher for the two feed methods, yielding four runs for each test condition.
The crushing variables studied during these experiments included specific energy consumption, dust cloud electrostatic field, product size parameters, and specific airborne dust generated (total and respirable). The data collected from these experiments are shown in Table I. Energy consumption was determined from crusher current, voltage, and time. The dust cloud charge was determined by averaging the electrostatic field measurements over a time period equal to the crusher operating time plus 10 seconds. This allowed sufficient time for the generated dust cloud to travel beyond the field meter position. The crusher product was screened using U.S.A. Standard Testing Sieve sizes (ASTME.- 11 specification) of 1/2” (12.5 mm), #4 (4.75 mm), #7 (2.80mm), #16 (1.18mm), #30 (600nm), #40 (425nm), and #60 (250 nm). Schuhmann size function parameters [23] were determined by nonlinear least squares regression of the cumulative size distribution data. Airborne Total Dust (ATD) or float dust measured in our experiments included all the airborne particulate material collected on the 6 stages and the final filter of the Sierra 298 impactors operating at 2.0 liters/min (20 nm through 1.55 nm aerodynamic diameter cut point sizes). Using Stokes Law, coal dust particles greater than an aerodynamic diameter of 23 |xm were estimated to settle out before reaching the dust sampling location at the wind tunnel velocity of O.lOm/s [24]. Thus, the ATD collected by the impactors in these experiments would include dust sizes up to an aerodynamic diameter of about 23 |im. Airborne respirable dust (ARD) was determined by applying the former (1985) ACGIH definition of respirable dust to the mass sizes collected on the Sierra 298 impactors at the particular air sampling rate and time [25]. The former ACGIH definition of

Feed size Feed weight Feed method mm kgTrickle
Batch
Trickle
Batch
Trickle
Batch
Mix 14.71114.711 14.698 14.703
Mix 14.63414.674 14.65814.675
25.4 x 50.8 14.66214.61014.57614.615
25.4 x 50.8 14.62014.59814.64214.642
19.0 x 25.4 14.62714.65114.64014.643
19.0 x 25.4 14.64814.65314.63714.681

TABLE I Pittsburgh coal crushing data
Specificenergy
W’minlkg
Dust cloud electrostatic
field V/cm
xSchuhnumn constant “a”
mm1Schuhmarm
exponent “b”% Less than
250/jm
Specific airborne total dust
mglkg
Specific turbarne
resp. dust m /k g
2.42 129.2 15.06 1.29 1.56 194.3 4.062.74 102.8 15.39 1.27 1.51 199.4 6.632.44 123.6 15.24 1.29 1.36 257.1 10.471.96 120.0 14.99 1.28 1.65 224.2 6.475.05 139.2 14.89 0.88 1.23 273.5 7.435.03 99.2 15.03 0.88 1.72 162.8 4.755.40 124.8 15.28 0.87 2.58 289.9 8.165.55 114.2 15.10 0.87 2.60 313.7 7.224.26 107.0 14.16 1.16 1.84 278.7 9.836.36 144.8 14.25 1.13 1.91 198.1 4.614.22, 100.4 14.41 1.09 108 280.8 8.324.52 108.4 14.43 1.11 2.02 180.3 3.695.29 152.4 13.79 0.89 1.18 271.2 6.347.05 132.4 13.72 0.89 1.24 260.2 10.666.24 123.4 13.84 0.89 1.68 370.9 7.845.49 130.0 13.79 0.88 1.21 397.8 8.840.91 118.4 14.92 1.36 1.42 277.5 14.291.21 132.0 14.75 1.27 1.60 211.4 5.193.15 117.2 14.68 1.31 1.40 131.1 4.451.26 88.4 14.66 1.31 1.43 319.6 10.256.49 94.4 14.45 0.85 1.04 295.0 4.766.54 108.4 14.52 0.86 1.12 289.6 9.356.31 116.8 14.58 0.86 1.73 289.4 5.696.34 132.0 14.58 0.86 1.70 354.5 4.37
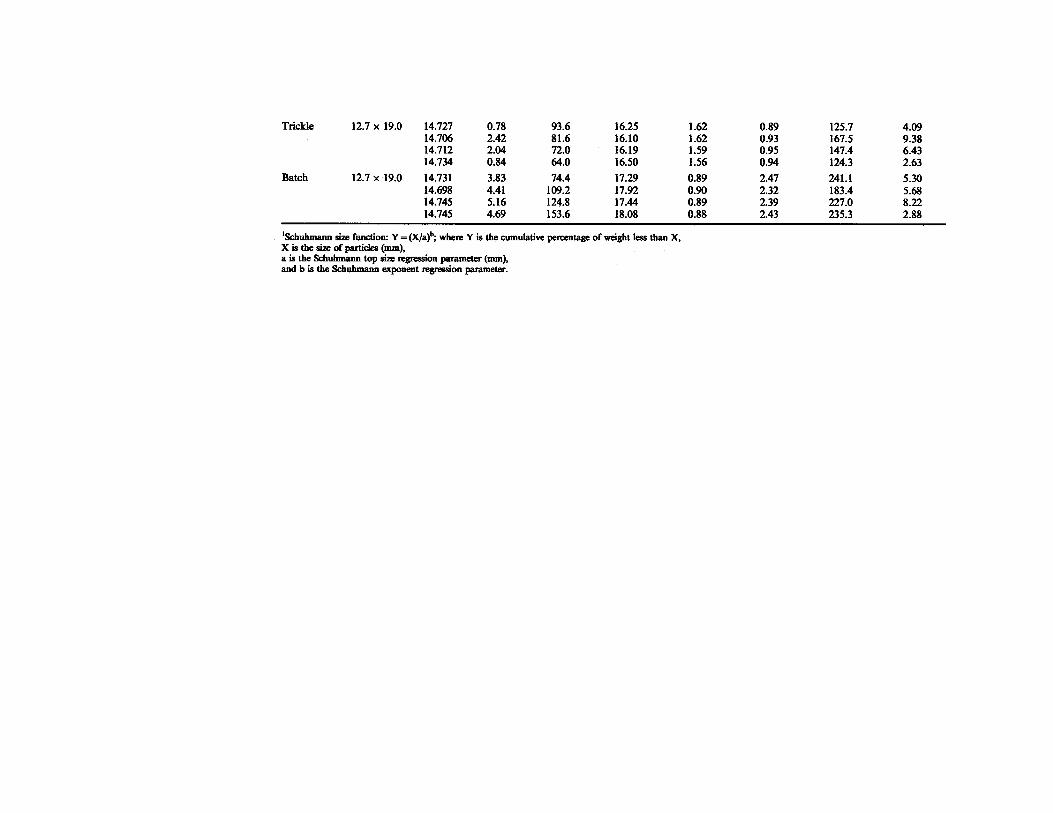
Trickle 12.7 x 19.0 14.727 0.78 93.6 16.25 1.62 0.89 125.7 4.0914.706 2.42 81.6 16.10 1.62 0.93 167.5 9.3814.712 2.04 72.0 16.19 1.59 0.95 147.4 6.4314.734 0.84 64.0 16.50 1.56 0.94 124.3 2.63
Batch 12.7 x 19.0 14.731 3.83 74.4 17.29 0.89 2.47 241.1 5.3014.698 4.41 109.2 17.92 0.90 2.32 183.4 5.6814.745 5.16 124.8 17.44 0.89 2.39 227.0 8.2214.745 4.69 153.6 18.08 0.88 2.43 235.3 2.88
!Schuhmann size function: Y=(X/a)b; where Y is the cumulative percentage of weight less than X, X is the size of particles (mm),a is the Schuhmann top size regression parameter (mm), and b is the Schuhmann exponent regression parameter.

respirable dust is a cumulative mass lognormal distribution with a mass median aerodynamic diameter (MMAD) of 3.5 nm (±0.3 |im ) and a geometric standard deviation (GSD) of 1.5 ( ± 0.1).
Initial analysis of testing precision shows that the batch-feed method for both the mixed-size and the 50.0 x 25.0-mm feed samples have lower amounts of measurement error for all of the crusher variables investigated as compared to the trickle-feed method and the other feed sizes tested [19]. The batch feed process is how roll crushers are typically used to maximize equipment capacity [24]. The lower Schuhmann exponent parameters observed for the batch- feed method ( < 1), as compared to the trickle-feed method ( > 1) (see Tab. I), indicate that more secondary breakage occurs during the batch-feed process than the trickle-feed process. Also, the less-than- one Schuhmann exponent parameters is characteristic of run-of-mine (ROM) coal size distributions, which parallel the parameters measured for the batch-feed crushing tests, indicating that secondary breakage is part of most mining and loading processes [19,26]. The mixed-size feed was preferred to the 50.0 x 25.0-mm feed because as bulk coal samples are processed (crushed and screened) to create the feed samples, more feed material can be obtained from a given amount of bulk coal. Additional statistical analysis of the data (Tab. II) was conducted to examine primary and secondary breakage effects on energy consumption, dust cloud electrostatic field, product size, and specific airborne dust generation (total and respirable).
Coal Property Experiments
For the second series of experiments, eight types of bituminous coals were roll crushed using a uniform batch-feed process of equivalent three-size mix of coal feed material. Five of the bituminous coals were collected from coal seams in the United States [19]. Bulk coal samples were collected over multiple shifts from three continuous miner sections located in WV, MD, and UT, a longwall located in CO, and at NIOSH’s PRL mine in PA. These coals ranged from a low-volatile, high-ash bituminous coal (higher rank) to a high-volatile, low-ash bituminous coal (lower rank). Three additional bituminous coals were collected from longwalls operating in coal seams in Poland under a

TABLE II Analysis of Pittsburgh coal crushing data using ANOVA
Main effects Interactions
Variables Breakage process Feed size breakage-feed Residual Totaldegrees o f freedom (d.f.’.) (Id /.) (3 d f ) (3 d.f) (24 df.) (31 d f )Median product sizeSum of Squares 32.44 23.29 1.16 0.26 57.15F-Ratio 1,000 719.4 35.90Significance 0.000 0.000 0.000Percentage of product < 250 junSum of Squares 0.827 0.503 4.85 2.04 8.23F-Ratio 9.71 1.96 18.98Significance 0.005 0.146 0.000Specific crusher energySum of Squares 70.00 24.08 13.04 11.75 118.9F-Ratio 142.98 16.40 8.88Significance 0.000 0.000 0.000Dust cloud electric fieldSum of Squares 1,593 3,555 2,005 8,428 15,582F-Ratio 4.54 3.37 1.90Significance 0.044 0.035 0.156Specific airborne total dustSum of Squares 40,454 47,482 2,720 65,386 156,043F-Ratio 14.85 5.81 0.333Significance 0.001 0.004 0.802Specific airborne respirable dustSum of Squares 0.300 18.08 18.78 183.2 220.4F-Ratio 0.044 0.789 0.820Significance 0.838 0.512 0.496
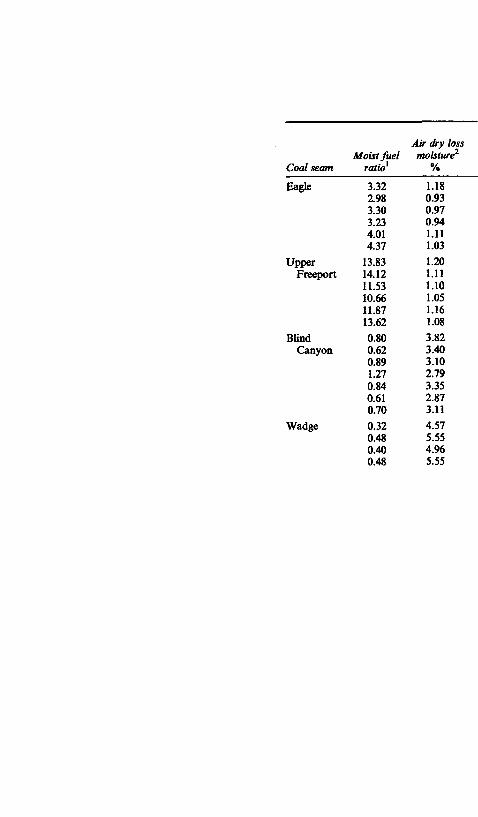
Air dry loss Moist fuel moisture1
Coed seam ratio1 %
Eagle 3.32 1.182.98 0.933.30 0.973.23 0.944.01 1.114.37 1.03
Upper 13.83 1.20Freeport 14.12 1.11
11.53 1.1010.66 1.0511.87 1.1613.62 1.08
Blind 0.80 3.82Canyon 0.62 3.40
0.89 3.101.27 2.790.84 3.350.61 2.870.70 3.11
Wadge 0.32 4.570.48 5.550.40 4.960.48 5.55
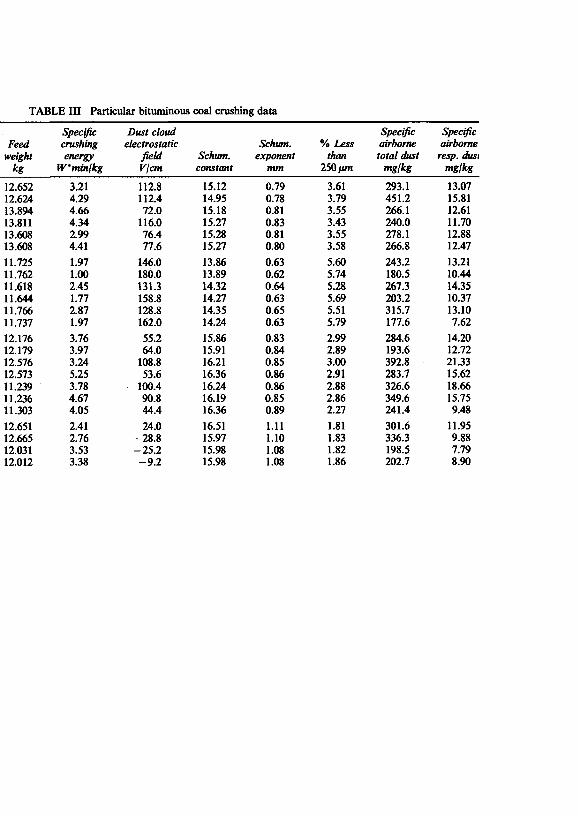
TABLE III Particular bituminous coal crushing data
Feedweight
kg
Specificcrushingenergy
Wminlkg
Dust cloud electrostatic
field Vjcm
Schum.constant
Schum.exponent
mm
% Less than
250/im
Specific airborne total dust
mg/kg
Specific airborne resp. dusi
mglkg
12.652 3.21 112.8 15.12 0.79 3.61 293.1 13.0712.624 4.29 112.4 14.95 0.78 3.79 451.2 15.8113.894 4.66 72.0 15.18 0.81 3.55 266.1 12.6113.811 4.34 116.0 15.27 0.83 3.43 240.0 11.7013.608 2.99 76.4 15.28 0.81 3.55 278.1 12.8813.608 4.41 77.6 15.27 0.80 3.58 266.8 12.4711.725 1.97 146.0 13.86 0.63 5.60 243.2 13.2111.762 1.00 180.0 13.89 0.62 5.74 180.5 10.4411.618 2.45 131.3 14.32 0.64 5.28 267.3 14.3511.644 1.77 158.8 14.27 0.63 5.69 203.2 10.3711.766 2.87 128.8 14.35 0.65 5.51 315.7 13.1011.737 1.97 162.0 14.24 0.63 5.79 177.6 7.6212.176 3.76 55.2 15.86 0.83 2.99 284.6 14.2012.179 3.97 64.0 15.91 0.84 2.89 193.6 12.7212.576 3.24 108.8 16.21 0.85 3.00 392.8 21.3312.573 5.25 53.6 16.36 0.86 2.91 283.7 15.6211.239 3.78 100.4 16.24 0.86 2.88 326.6 18.6611.236 4.67 90.8 16.19 0.85 2.86 349.6 15.7511.303 4.05 44.4 16.36 0.89 2.27 241.4 9.4812.651 2.41 24.0 16.51 1.11 1.81 301.6 11.9512.665 2.76 -28 .8 15.97 1.10 1.83 336.3 9.8812.031 3.53 -25 .2 15.98 1.08 1.82 198.5 7.7912.012 3.38 -9 .2 15.98 1.08 1.86 202.7 8.90
Pittsburgh 1.50 0.77 14.634 5.05 114.2 14.89 0.88 1.23 262.1 7.121.48 0.74 14.674 5.03 139.2 15.03 0.88 1.72 155.4 4.542.08 1.13 14.658 5.40 99.2 15.28 0.87 2.58 277.8 7.781.79 1.12 14.675 5.55 124.8 15.09 0.87 2.60 301.6 6.90
Polish 0.53 5.13 12.301 9.13 -12.8 15.90 1.02 1.33 371.0 26.49Coal A 0.51 5.85 12.271 7.12 -34.0 15.75 0.99 1.96 283.2 16.70
Polish 0.49 5.92 8.642 3.69 17.2 15.41 0.95 1.76 145.8 7.16Coal B 0.52 6.02 8.663 3.49 9.2 15.59 0.92 2.52 86.98 1.79
Polish 1.21 1.36 7.803 3.62 0.4 14.32 0.77 2.90 347.4 10.87Coal C 1.21 1.53 7.784 4.33 -1 .6 14.35 0.78 2.89 449.5 19.46
1 Determined from percentage of weight on an as-determined basis (weight percentages used without the ADL moisture). 2Reported as percentage of weight on an as-received basis.
joint research project with the United States [27]. These three coals were high-volatile bituminous coals with a wide range of moisture and ash contents.
These underground bulk coal samples were processed in the laboratory to obtain multiple test samples of each coal seam. Jaw crushing was conducted on the larger lumps to obtain equal mass portions of the various feed sizes for testing. Riffling was done to split the sized coal samples into equal representative portions, and these portions were mixed for the crusher feed samples. Next, all the coal feed test samples were weighed and stored in sealed cans. The U.S. coal samples were randomly tested first in the crushing facility, with the Polish coals randomly tested later, using the batch-feed process selected from the first series of experiments. The crushing variables studied during these experiments included specific energy consumption, dust cloud electrostatic field, product size parameters, and specific airborne dust generated (specific total and respirable). A small coal test sample was riffled from the crushed product after screening to determine the coal constituents by proximate analysis [28]. The proximate analyses were used to determine the coals’ inherent moist fuel ratio (MFR = fixed carbon 4- (volatile x inherent moisture)) on an as-determined basis and were used to determine the coals’ air dry loss moisture (ADL) on an as-received basis. The data collected from these experiments are shown in Table III.
EXPERIMENTAL RESULTS
The data from these experiments were studied using the Analysis of Variance (ANOVA) method, scatter plot examination, and regression analysis to determine the effects of primary and secondary breakage on the experimental variables measured. ANOVA was used to identify the significance of the breakage process and feed size on median product size, percentage of product less than 250 jun ( —60 mesh), specific crusher energy, dust cloud electrostatic field, specific airborne total dust, and specific airborne respirable dust. Scatter-plot examination was also used to analyze relationships among the experimental variables measured, particularly for subsets of data for each breakage process and coal seam characteristic data. Regression analysis was
DUST LIBERATION DURING CRUSHING
applied to determine the strength of the observed relationships. Regression relationships and parameters shown in this paper are significant at the 95 percent confidence level.
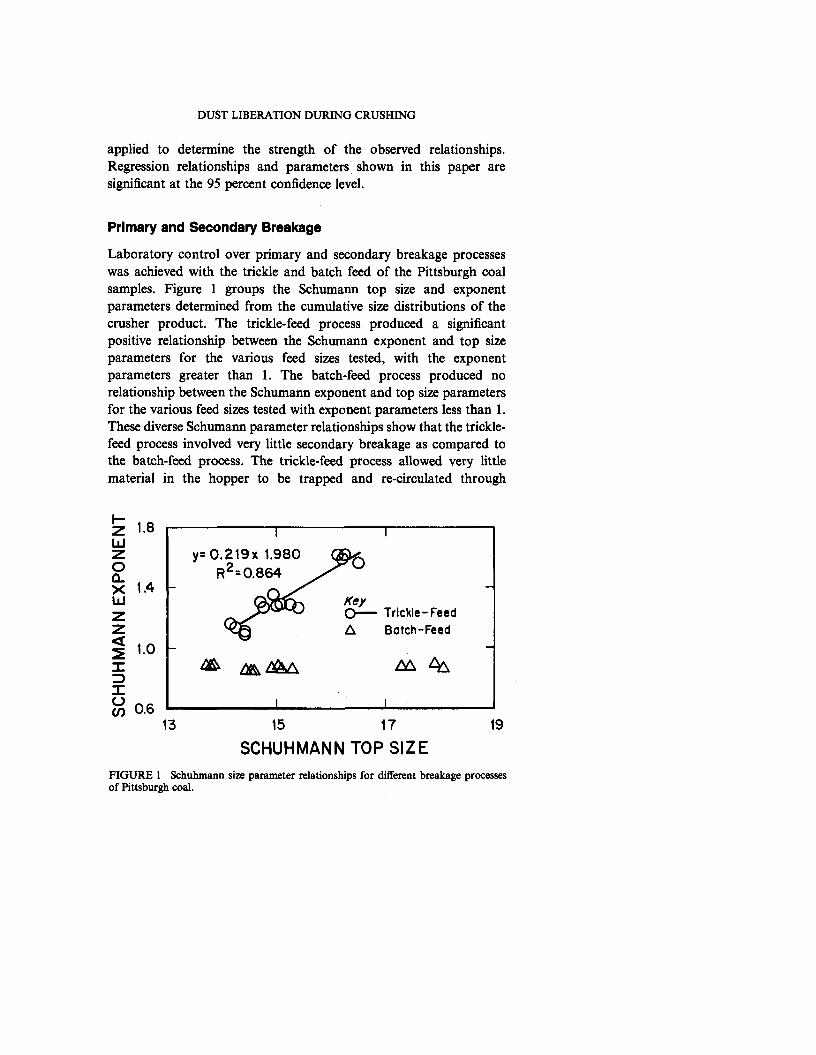
Primary and Secondary Breakage
Laboratory control over primary and secondary breakage processes was achieved with the trickle and batch feed of the Pittsburgh coal samples. Figure 1 groups the Schumann top size and exponent parameters determined from the cumulative size distributions of the crusher product. The trickle-feed process produced a significant positive relationship between the Schumann exponent and top size parameters for the various feed sizes tested, with the exponent parameters greater than 1. The batch-feed process produced no relationship between the Schumann exponent and top size parameters for the various feed sizes tested with exponent parameters less than 1. These diverse Schumann parameter relationships show that the trickle- feed process involved very little secondary breakage as compared to the batch-feed process. The trickle-feed process allowed very little material in the hopper to be trapped and re-circulated through
SCHUHMANNTOP SIZEFIGURE 1 Schuhmann size parameter relationships for different breakage processes of Pittsburgh coal.

the crusher rolls, whereas the batch-feed process incurred some intermediate product re-circulation of the feed material through the crusher rolls, yielding Schumann exponent parameters consistently less than 1 for all the feed sizes tested.
ANOVA showed that the median product size was significantly impacted by the breakage process and feed size. Results of ANOVA for the breakage process and feed size effects on the experimental variables measured are shown in Table II. The median product size (product size at which 50% of the mass is greater or less than) was significantly influenced by both breakage process and feed size. Figure 2A shows the relationships of these main effects on median product size. Smaller feed material produced larger median product sizes for each of the processes utilized, because the smaller feed material had to be re-broken a lesser number of times than the larger feed material before it passed through the rolls. The batch-feed process produced a smaller median product size for each feed size as compared to the trickle-feed process, because some of the product was recirculated with the feed material through the rolls and then re-broken.
The percentage of product less than 250 nm ( -6 0 mesh) was significantly influenced by the breakage process and the interaction of the breakage process and feed size (see ANOVA in Tab. II). The influence of the breakage processes and size interactions on product fines can be seen in the relationships comparing the breakage process, feed size, and the percentage of product less than 250 |im in Figure 2B. The trickle-feed process produced a positive relationship between the feed size and the percentage of product less than 250 nm while the batch feed-process produced a negative relationship between the feed size and percentage of product less than 250 nm.
A key influence in these different relationships is the feed size interaction during the breakage process [24]. During the trickle-feed process, smaller feed sizes are quickly crushed and passed through the crusher, minimizing feed re-circulation. This subjects less coal feed material to subsequent crusher breakage into smaller particles. Larger feed material in the trickle-feed process ride up on the rolls and has to be nipped several times before it passes through the rolls, creating more product fines less than 250 (xm for the larger feed material. During the batch-feed process, as smaller feed material is crushed, more feed lumps are re-circulated and ground into smaller particles,

DUST LIBERATION DURING CRUSHING
KeyO— Trickle-Feed A --------Botch-Feed
E
o inCMv i- o. o o o o <r a.
u
10 20 30 40
MEDIAN FEED SIZE, mmFIGURE 2 Feed size and breakage process effects on product size of Pittsburgh coal.
increasing the percentage of product fines less than 250 nm for the smaller feed size. Also, the weight of the feed in the batch-feed process limits the ability of the larger particles to ride up on the rolls, reducing product fines less than 250 nm for the larger feed size.
Breakage process and feed size also significantly affect the specific crusher energy and the dust cloud electrostatic field. ANOVA shows that specific energy is significantly affected by breakage process, feed size, and breakage-feed interactions. Figure 3A shows the negative

>-occi i i 5 *
5 -O goIx lQ.to
8A i n
o1 1 1
O y=-1.264x+14.111^ O R2= 0-766
-
8 -
1 i i i ^
o_1UJL i.
Op E
(OoGEHOUi-IUJ
160140120100806040
B
/= -3.203x2 + 43.887x^27.28R ,=0.383 __ L _ ____ i
8 9D50, mm
10
FIGURE 3 Specific energy and dust cloud electrostatic field relationships with median product size of Pittsburgh coal.
relationship between median product size and specific energy. Analogous to the laws of Bond, Kick and Rittinger [20], more specific energy is required to crush coal material into smaller product sizes. ANOVA also shows that dust cloud electric field is affected by the breakage process and feed size. Figure 3B shows the negative relationship between the median product size and dust cloud electrostatic field. The overall production of smaller median product sizes corresponds with the increase in dust cloud electrostatic field.
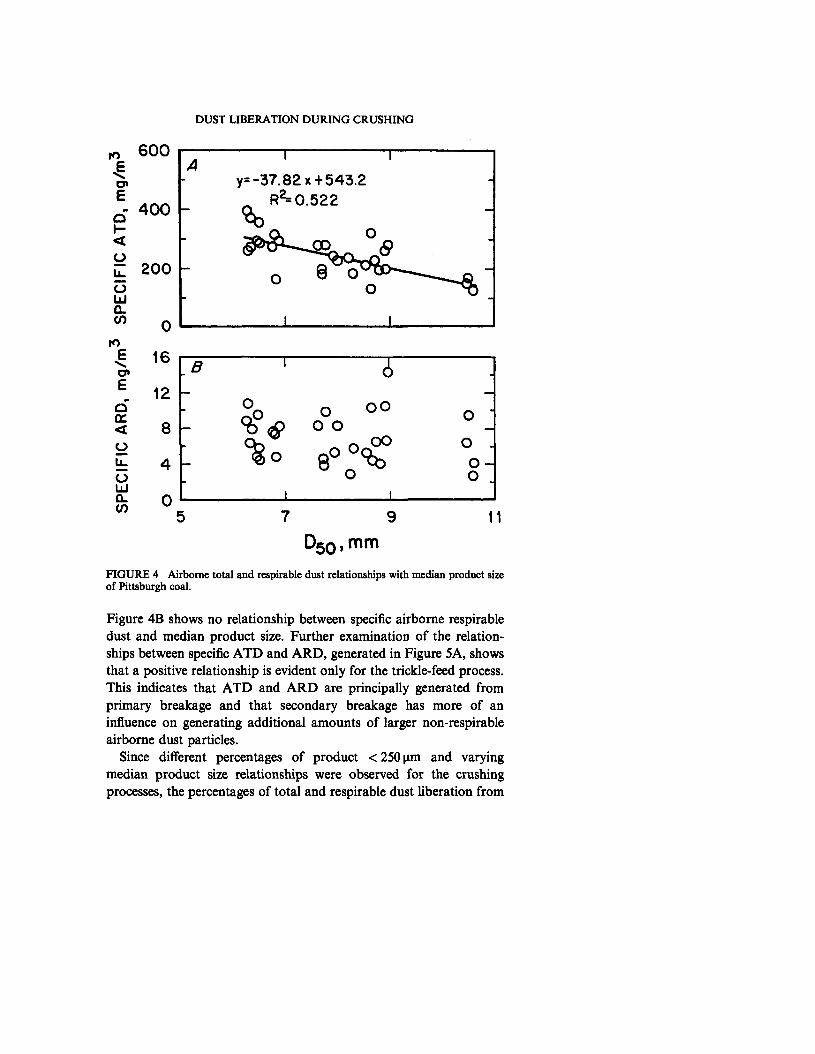
Airborne total dust (ATD) generation was significantly affected by the breakage process and feed size, while airborne respirable dust (ARD) generation was negligibly affected by these two experimental factors. ANOVA shows that only the specific ATD was significantly affected by the experimental factors. Figure 4A illustrates that specific ATD has a negative relationship with median product size, while
DUST LIBERATION DURING CRUSHING
O*E
ocn<o
olli0 .to
D50,mmFIGURE 4 Airborne total and respirable dust relationships with median product size of Pittsburgh coal.
Figure 4B shows no relationship between specific airborne respirable dust and median product size. Further examination of the relationships between specific ATD and ARD, generated in Figure 5A, shows that a positive relationship is evident only for the trickle-feed process. This indicates that ATD and ARD are principally generated from primary breakage and that secondary breakage has more of an influence on generating additional amounts of larger non-respirable airborne dust particles.
Since different percentages of product <250p.m and varying median product size relationships were observed for the crushing processes, the percentages of total and respirable dust liberation from

PA
TD25
0,
pet
SPEC
IFIC
A
TD,
mg/
kgKeyQ~ — Trickle ̂Feed A --------Batch-Feed
3.53.02.5
2.0
1.5
1.0
0.5
SPECIFIC ARD, mg/kg
^ ------------------------- 1--------------------------R y*26.4 0 5x+0.006A ^ R2s 0.572
Ay=12.092x + 0.008 _
R2=0.735
JL ±.05 .10
PARD250, pet.15
FIGURE 5 Relationship between the airborne total and respirable dust generated from the different breakage processes of Pittsburgh coal.

DUST LIBERATION DURING CRUSHING
the < 250 |xm product fines were further examined for both crushing processes. The relationships between the percentage of ATD and ARD liberated from the < 250 (a.m product fines (PATD250 and PARD250, respectively) for both breakage processes are shown in Figure 5B. This analysis improved the quantitative relationships between ATD and ARD generation during the experiments, showing that the amount of total dust liberation was 12 and 26 times higher than the respirable dust fraction for the trickle-feed and batch-feed process, respectively. Thus, the secondary breakage within the batch-feed process roughly doubled the rate of non-respirable airborne dust liberated from the< 250 |xm product fines.
Coal Properties
For the second series of experiments, eight types of bituminous coals were roll crushed using a uniform batch-feed process on a three-size equivalent weight mixture of coal feed. The results from these experiments are shown in Table III. This crushing procedure provided lower crusher parameter variations as measured in the first series of experiments [19], and is how roll crushers are typically used to maximize equipment capacity [24]. These different bituminous coals yielded distinguishable product size parameters, electrostatic field properties, percentage of product fines < 250 nm, specific ATD, and specific ARD (see Tab. III).
Higher rank bituminous coals broke into smaller-sized products than lower rank coals. The rank of the bituminous coals crushed are described by their inherent moist fuel ratio (MFR) [16,17]. Lower rank coals have lower MFRs and higher rank coals have higher MFRs. Figure 6 shows the median product size and percentage of product size < 250 nm relationships with respect to the coals’ MFR. The higher MFR (or rank) coals produce a smaller median product size (see Fig. 6A) and higher percentages of < 250 (im product fines (see Fig. 6B). Production of product fines for higher rank coals is consistent with other crushing and grinding research studies [13-15].
A uniform positive relationship was observed between the total and respirable portions of the airborne dust generated from crushing these coals. Figure 7A shows the specific ATD and ARD generated, while Figure 7B shows the ATD and ARD normalized to the amount of

oQ.
6=L
oIOCMV
Oooooca. 0 5 10 15
MFRFIGURE 6 Coal rank (expressed as MFR) and product size relationships.
< 250 |im liberated from the product fines (PATD250 and PARD250). These relationships demonstrate that the amount of ATD generated was between 12 and 14 times higher than the ARD, similar to the primary breakage relationships established in the first series of experiments. Thus, the primary breakage portion of the batch-feed process appeared to be the main influence on the ATD and ARD generated from crushing the same sizes of various coals.
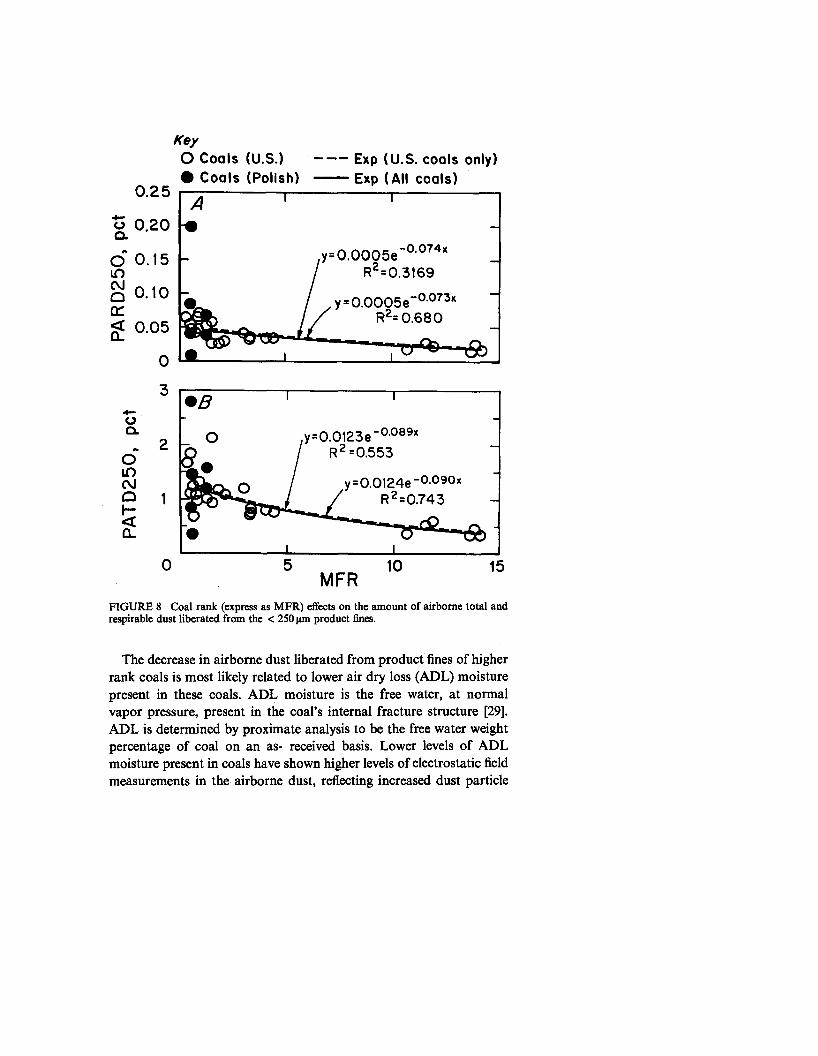
Although higher rank coals were crushed into a smaller product as compared to the lower rank coals, the percentage of airborne dust liberated from the < 250 |xm product fines is less for higher rank coals as compared to lower rank coals. Figure 8 shows the relationships

DUST LIBERATION DURING CRUSHING
cn
< 5 0 0cn£ 400
g 300 <O
200
OLxJCLCO
A V I 1 J 1o o
0
1
%jp^ 560—
° y * 12.18x +123.35“
-oi i
R2 = 0.541
I 1 1
10 15 20 25SPECIFIC ARD, mg/kg
T
0.05 0.10 0.15 0.20PARD250, pet
30
0.25
FIGURE 7 Relationships between airborne total and respirable portions of dust generated from different coals.
between PARD250, PATD250, and MFR. As MFR or coal rank increased, both PARD250 and PATD250 decreased. Parametric relationships are shown for all the data points (both U.S. and Polish coals, illustrated with a solid line) and for the U.S. data points (open points and dashed line). The parametric regression relationships between PARD250, PATD250, and MFR were very similar when including and excluding the Polish coals, but were more efficient for the U.S. coals only (which show increased R2). All these relationships and their parameters were found to be statistically significant at the 95 percent confidence level.
0.25
o 0.20Q.
o 0.15inC\Jo 0.10ce
2 0.05
KeyO Coals (U.S.)# Coals (Polish)
0
3
oa.
Oin<\Jah -<CL
------- Exp (U.S. coals only)--------Exp (All coals)
A "'1 1
-• -
y=0.0005e~°074*/ R2=0.3169
•L / y = O.OOOSe-0073*1 / R2= 0.680
• — 6b
• B 1.. 1
o /y=0.0123e“° ° 89x
£ •/ R2 =0.553
/ y=0.0124e"°090x/ / R2=0.743 —
•l. i
1 -
MFR10 15
FIGURE 8 Coal rank (express as MFR) effects on the amount of airborne total and respirable dust liberated from the < 250 jun product fines.
The decrease in airborne dust liberated from product fines of higher rank coals is most likely related to lower air dry loss (ADL) moisture present in these coals. ADL moisture is the free water, at normal vapor pressure, present in the coal’s internal fracture structure [29]. ADL is determined by proximate analysis to be the free water weight percentage of coal on an as- received basis. Lower levels of ADL moisture present in coals have shown higher levels of electrostatic field measurements in the airborne dust, reflecting increased dust particle

DUST LIBERATION DURING CRUSHING
agglomeration in the air and/or dust particle adhesion in the product [19,30]. Figure 9 shows the relationships between the electric field measurements of the airborne dust and the MFR and ADL properties of the coals tested. Although the higher MFR coals tested generally had lower ADL moisture contents and higher electrostatic field measurements, MFR and ADL are somewhat independent properties of coal because ADL moisture levels can be independently altered to change the electrostatic field properties of the dust [30]. A notable variation of ADL moisture for the lower MFR Polish coals tested illustrates this independence (see Fig. 9).
The larger dust variations observed for the Polish coals in the PARD250, PATD250, and MFR relationships were likely influenced by the larger variations in ADL moisture for these lower MFR coals. The additional influence of ADL moisture on airborne dust generation would be difficult to statistically model given the notable association
KeyO MFR (U.S.) AADL(U .S.) ----- Log (MFR)
E *M F R (Polish) AADL(Polish) ------Linear(ADL)
COAL PROPERTYFIGURE 9 Coal property effects on dust cloud electrostatic field.
between MFR and ADL moisture for most of the bituminous coals tested (see Fig. 9) [19]. However, coal MFR was observed to be a reasonable quantifying measure of rank, median product size, the amount of < 250 (im product fines, PARD250, and PATD250 during these experiments.
AIRBORNE COAL DUST GENERATION RATES
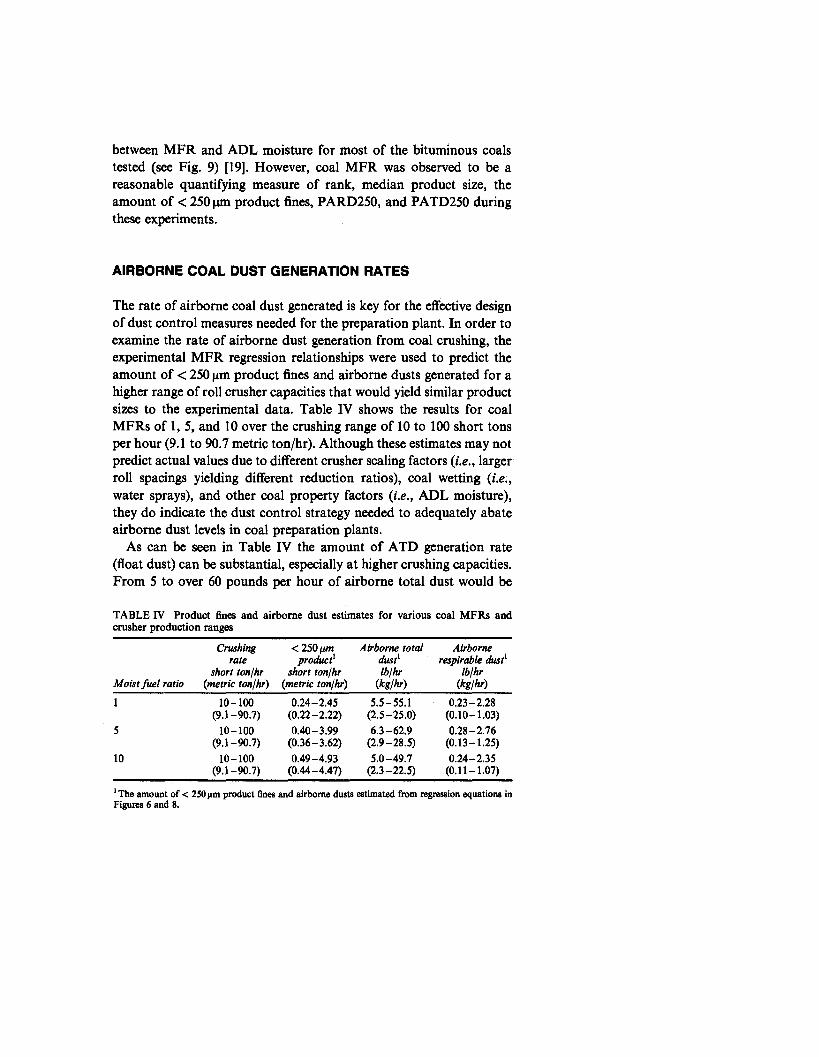
The rate of airborne coal dust generated is key for the effective design of dust control measures needed for the preparation plant. In order to examine the rate of airborne dust generation from coal crushing, the experimental MFR regression relationships were used to predict the amount of < 250 jim product fines and airborne dusts generated for a higher range of roll crusher capacities that would yield similar product sizes to the experimental data. Table IV shows the results for coal MFRs of 1, 5, and 10 over the crushing range of 10 to 100 short tons per hour (9.1 to 90.7 metric ton/hr). Although these estimates may not predict actual values due to different crusher scaling factors (i.e., larger roll spacings yielding different reduction ratios), coal wetting (i.e., water sprays), and other coal property factors (i.e., ADL moisture), they do indicate the dust control strategy needed to adequately abate airborne dust levels in coal preparation plants.
As can be seen in Table IV the amount of ATD generation rate (float dust) can be substantial, especially at higher crushing capacities. From 5 to over 60 pounds per hour of airborne total dust would be
TABLE IV Product fines and airborne dust estimates for various coal MFRs and crusher production ranges
Moist fuel ratio
Crushing rate
short ton/hr (metric ton/hr)
< 250 iim product1
short tort/hr (metric ton/hr)
Airborne total dust1 lb/hr
(kg/hr)
Airborne respirable dust1
lb/hr (kg/hr)
1 10-100 0.24-2.45 5.5-55.1 0.23-2.28(9.1-90.7) (0.22 -2.22) (2.5-25.0) (0.10-1.03)
5 10-100 0.40-3.99 6.3-62.9 0.28-2.76(9.1-90.7) (0.36-3.62) (2.9-28.5) (0.13-1.25)
10 10-100 0.49-4.93 5.0-49.7 0.24-2.35(9.1-90.7) (0.44 - 4.47) (2.3-22.5) (0.11-1.07)
1 The amount of < 250 nm product fines and airborne dusts estimated from regression equations in Figures 6 and 8.

DUST LIBERATION DURING CRUSHING
generated from crushing between 10 and 100 short tons of coal per hour, respectively. The respirable portion of these dust estimations is a small fraction of the ATD generated. Estimated ARD generation rates range from less than a pound to nearly 3 pounds per hour. Although the coal’s MFR somewhat impacted the airborne dust generation estimates, the coal breakage rates would likely be the largest factor impacting the capacity of the dust control system.
Figure 7 also shows the relationships between ATD and ARD for the eight coal seams crushed in the laboratory. These relationships indicate that the amount of ATD generated was between 12 and 14 times higher than the respirable portions of the dust. The airborne dust size distributions generated were similar for the various coals crushed. The lognormal MMAD of ATDs averaged 14.72 ± 0.60 nm, with a GSD of 2.22 ± 0.03 (at the 95% confidence level). Other studies have shown that airborne dust generated on the return side of a mining machine in underground coal mines has similar size distributions to those found in the laboratory, with MMADs in the mid-teen micrometer range [25,31]. A portion of the total airborne dust< 10 nm generated in the laboratory was also consistent for the various coals crushed, averaging 25.1 ± 1.6% of the dust mass. The respirable portions of these airborne dusts generated were defined as a lognormal distribution, with a MMAD of 3.5 (im and a GSD of 1.5. Therefore, the vast majority of the airborne dust generated from crushing was larger non-respirable float dust.
CONCLUSIONS AND RECOMMENDATIONS
Laboratory roll crushing experiments of a particular coal indicate that secondary breakage notably increases the specific ATD generated, while negligibly impacting the amount of specific ARD generated. A strong positive relationship was identified between the amounts of specific ATD and ARD dust generated during the primary breakage process (with minimal secondary breakage), but a negligible relationship was observed when secondary breakage was introduced into the crushing process. This indicates that most of the ATD and ARD is generated from the primary breakage, while secondary breakage has a stronger influence on increasing the amount of ATD generated.

Additional experiments involving the uniform crushing of eight different bituminous coals showed that the coal rank expressed as the inherent moist fuel ratio (MFR) had diverse relationships between the product size created and the amount of airborne dust generated. As bituminous coal rank or MFR increased, the amount of coal product fines < 250 jim increased while the mass percentage of ATD and ARD liberated from these < 250 |im product fines decreased. Air dry loss (ADL) moisture in the coal was found to be inversely related to the dust cloud electrostatic field, influencing dust liberation from the coal product fines. Since the MFR was directly related to the dust cloud electrostatic field, opposite the ADL relationship, the diverse relationships between the product size created and the amount of dust liberated from the <250|xm product fines were explained. Higher MFR coals used in these experiments tended to have lower ADL moisture content, thus the independent effects of coal MFR and ADL moisture could not be statistically modeled. However, strong relationships were established between coal MFR and the product size parameters, while moderate relationships were established between coal MFR and the percentage of ATD and ARD liberated from the< 250 |im product fines (PATD250 and PARD250).
These experiments also showed that ARD generation was a very small portion of the ATD generated. Between 12 and 14 times more ATD mass was generated as compared to the portion of ARD mass. Further examination of predicted amounts of airborne dusts generated from coal crushing between 10 and 100 short tons per hour (9.1 and 90.7 metric tons per hour) indicated that more than double the amount of ATD would be produced at 10 short tons per hour as compared to the amount of ARD that would be produced at 100 short tons per hour. These results indicate that a plant’s dust control system must be able to efficiently remove the larger-sized, ATD mass generated at much higher rates than the smaller ARD mass portions. To effectively handle these airborne dust loading rates, dust collection systems should be designed to selectively remove the larger-sized dusts at earlier phases within the system [32]. Also, since these dust control systems are handling combustible dusts with possible methane accumulations, safeguards must be included in their design for explosive prevention, explosive mitigation (venting) and fire suppression [8].

DUST LIBERATION DURING CRUSHING
Recommendations for designing effective dust control systems can be found in the Industrial Ventilation Handbook, 22nd edition[33], and the Dust Control Handbook for Minerals Processing[34], Safeguards for dust control systems and plant design can be found in the National Fire Codes: A Compilation of National Fire Protection Association (NFPA) Codes, Standards, Recommended Practices and Guides [35-37]. Hoods and ducts should be designed (sized) to achieve adequate air velocities to capture and transport the airborne dust through the system. Removing the coarser dusts earlier within the system should reduce the likelihood that the dust will settle out in the system’s ducts [11,34]. Settling chambers and cyclones work well for collection of coarser dusts (>10(xm diameter), while wet washers (spray towers, venturi scrubbers, flooded bed scrubbers), bag filters, and electrostatic precipitators are recommended for respirable sized dusts (< 10|xm diameter) [32-34]. Whole plant ventilation or localized area ventilation with power exhaustors can also help control dust levels inside the plant, but primary efforts should focus on controlling or capturing dust at the source [11].
References
[1] M . D. Attfield and N. S. Seixas, “Prevalence of Pneumoconiosis and its Relationship to Dust Exposure in a Cohort of U. S. Bituminous Coal Miners and Ex-miners”, Am. Ind. Med., 27, 137-151 (1995).
[2] M . D. Attfield and K. Morring, “An Investigation into the Relationship Between Coal Workers’ Pneumoconiosis and Dust Exposure in U. S. Coal Miners”, Am. Ind. Hyg. Assoc. J., 53(8), 486 - 492 (1992).
[3] J. F. Hurley and W. M. Maclaren, “Dust-Related Risks of Radiological Changes in Coal Miners over a 40-year Working Life: Report on work commissioned by NIOSH”, Edinburgh, Scotland: Institute of Occupational Medicine, Report No. TM/87/09, 1987.
[4] U.S. Environmental Protection Agency, “1997 National Air Quality: Status and Trends”, U. S. EPA, 1998. @http://www.epa.gov/oar/aqtmd97/brochure/ pml0.html.
[5] I. Hartmann, M. Jacobson and R. P. Williams, “Laboratory Explosibility of American Coals”, Bureau o f Mines Report o f Investigations 5052 (1954).
[6] I. Hartmann, “Studies on the Development and Control of Coal-Dust Explosions in Mines”, Bureau o f Mines Information Circular 7758 (1957).
[7] U.S. Code of Federal Regulations, “Title 30- Mineral Resources; Chapter I-M in e Safety and Health Administration, Dep. Labor; Subchapter O-Coal Mine Safety and Health; Part 70-Mandatory Health Standards-Underground Coal Mines and Part 71-Mandatory Health Standards-Surface Coal Mines and Surface Work Areas of Underground Coal Mines”, U. S. Gov. Printing Office, Office of Federal Regulations, July 1, 1999.

[8] U.S. Code of Federal Regulations, “Title 30-M ineral Resources; Chapter I-M ine Safety and Health Administration, Dep. Labor; Subchapter O-Coal Mine Safety and Health; Part 75-Mandatory Safety Standards-Underground Coal Mines and Part 77-Mandatory Safety Standards, Surface Coal Mines and Surface Work Areas of Underground Coal Mines”, U. S. Gov. Printing Office, Office of Federal Regulations, July 1, 1999.
[9] U.S. Environmental Protection Agency, “EPA’s Revised Particulate Matter Standards”, U. S. EPA, 1997. @ http://www.epa.gov/ttn/oarpg/naaqsfin/pmfact. html.
[10] J. F. Colinet, E. R. Spencer and R. A. Jankowski, “Status of Dust Control Technology on U. S. Longwalls”, Proceedings of the 6th International Mine Ventilation Congress, May 17-22, Pittsburgh, SME 1997, pp. 345-351.
[11] E. F. Divers and A. B. Cecala, “Dust Control in Coal Preparation and Mineral Processing Plants”, Bureau o f Mines Information Circular 9248 (1990).
[12] E. F. Divers and R. A. Jankowski, “Respirable Dust Control in Coal Preparation”, Mining Eng., 20, 1111-1114 (1988).
[13] R. Srikanth, R. Zhao and R. V. Ramani, “Relationships Between Coal Properties and Respirable Dust Generation”, Proceedings o f the 7th U. S. Mine Ventilation Symposium, June 5 -7 , Lexington, Kentucky, Pub. SME 1995, pp. 301-309.
[14] M. P. Moore and C. J. Bise, “The Relationship Between the Hardgrove Gindability Index and the Potential for Respirable Dust Generation”, Proceedings o f the Coed Mine Dust Conference, Generic Technology Center for Respirable Dust, October 8-10, Morgantown, 1984, pp. 250-255.
[15] E. Y. Baafi and R. V. Ramani, “Rank and Maceral Effects on Coal Dust”, Int. J. Rock Mech. and Min. Sci. (and Geomech Abstr.), 16, 107-115 (1979).
[16] J. A. Organiscak and J. F. Colinet, “Influence of Coal Properties and Dust-Control Parameters on Longwall Respirable-Dust Levels”, Mining Eng., 51(9), 41-48 (1999).
[17] S. J. Page, J. A. Organiscak and J. Quattro, “Coal Proximate Analysis Correlation with Airborne Respirable Dust”, Fuel, 72, 965 - 970 (1993).
[18] J. A. Organiscak, S. J. Page and R. A. Jankowski, “Relationship of Coal Seam Parameters and Airborne Respirable Dust at Longwalls”, Bureau o f Mines Report o f Investigations 9425 (1992).
[19] J. A. Organiscak and S. J. Page, “Investigation of Coal Properties and Airborne Respirable Dust Generation”, NIOSH Report o f Investigations 9645, DHHS (NIOSH) Pub. No. 98-160, 1998.
[20] A. B. Cummins and I. A. Given, SME Mining Engineering Handbook, 1st Edition,2 Volumes, AIME, New York, N.Y., 1973.
[21] K. L. Williams and R. J. Timko, “Performance Evaluation of a Real-Time Aerosol Monitor”, Bureau o f Mines Information Circular 8968 (1984).
[22] A. F. Taggart, Handbook o f Mineral Dressing, John Wiley, New York 1945, pp. 19-33 to 19-35.
[23] R. Schuhmann, “Principles of Comminution, I-Size Distribution and Standard Calculations”, AIME TP 1189, Mining Technology, July, pp. 1-11 (1940).
[24] A. M. Gaudin, Principles of Mineral Dressing, First Edition, McGraw-Hill Book Company, Inc., New York and London, 1939.
[25] J. D. Potts, M . J. McCawley and R. A. Jankowski, “Thoracic Dust Exposure on Longwall and Continuous Mining Section”, Appl. Occ. and Envir. Hyg., 5, 440 - 447(1990).
[26] R. V. Ramani, J. M. Mutmansky, R. Bhaskar and J. Qin, “Fundamental Studies on the Relationship Between Quartz Levels in the Host Material and the Respirable Dust Generated During Mining”, Bureau o f Mines Final Contract Report, Volume I: Experiments Results and Analysis (contract H0358031, PA State Univ.), BuMines OFR 36-88, NTIS PB 88-214325/AS, 1987.
DUST LIBERATION DURING CRUSHING 453
[27] J. A. Organiscak, J. F. Colinet and A. Koziel, “Longwall Operational Parameters and Dust Levels Measured in Poland’s Coal Mines”, Published in the Proceedings o f Longwall USA 1999 International Exhibition and Conference, Sept. 21-23, Pittsburgh, PA, Intertec Exhibitions 1999, pp. 172-184.
[28] American Society for Testing and Materials, “ASTM D3172-Standard Practice for Proximate Analysis of Coal and Coke”, Annual Book o f ASTM Standards: Volume05.05, pp. 288 - 297 (1996).
[29] J. W. Leonard, Coal Preparation, Fourth Edition, AIM E, New York, 1979.[30] S. J. Page, “Relationships Between Electrostatic Charging Characteristics,
Moisture Content, and Airborne Dust Generation for Subbituminous and Bituminous Coals”, Aerosol Science and Technology, 32, 249 - 267 (2000).
[31] C. Lee, “Statistical Analysis of the Size and Elemental Composition of Airborne Coal Mine Dust: a Thesis in Mining Engineering”, The Pennsylvania State University, 1986.
[32] G. Nonhebel, Processes for Air Pollution Control, Butterworth and Co., Ltd., 1972.[33] American Conference of Governmental Industrial Hygienists (ACGIH), Industrial
Ventilation: A Manual of Recommended Practice, 22nd Edition, ACGIH, 1995.[34] V. Mody and R. Jakhete, “Dust Control Handbook for Minerals Processing”,
Bureau o f Mines Contract Final Report (Contract J0235005, Martin Marietta Corp.), BuMines OFR 2-88, NTIS PB-88-159108 (1987).
[35] National Fire Protection Association, “NFPA 120-Standard for Coal Preparation Plants”, National Fire Codes: A compilation o f NFPA Codes, Standards, Recommended Practices and Guides, Vol. 5,1999 Edition, One Batterymarch Park, Quincy, MA, 02269-9101,1999.
[36] National Fire Protection Association, “NFPA 68-Guide for Venting of Deflagrations”, National Fire Codes: A compilation o f NFPA Codes, Standards, Recommended Practices and Guides, Vol. 10, 1998 Edition, One Batterymarch Park, Quincy, MA, 02269-9101, 1998.
[37] National Fire Protection Association, “NFPA 69-Standard on Explosion Prevention Systems”, National Fire Codes: A compilation o f NFPA Codes, Standards, Recommended Practices and Guides, Vol. 5,1997 Edition, One Batterymarch Park, Quincy, MA, 02269-9101, 1997.


![DUST IN HISTORIC LIBRARIES - Fastly › documents › dust-in...fires, deposited in earlier centuries, and other more recent airborne pollutants [ 2]. Pollutants from historic and](https://img.dokumen.tips/doc/110x75/5f10889a7e708231d449948a/dust-in-historic-libraries-fastly-a-documents-a-dust-in-fires-deposited.jpg)