Embed Size (px)
Citation preview

F AA-AM-71.40 /
AIR TRAFFIC APTITUDE TEST MEASURES OF MILITARY AND RAA CONTROLLER TRAINEES
Bart B. CObb, M.S. FAA Civil Aeromedical Institute
P.O,Box~ Oklahoma City, Oklahoma 73125
October 1971
Availability is UJilimited. Document ma.y be released to the National T<OOhnical Information Serviee, Springfield, Virginia ~2151, for sale to the public.
Prt!PtJretl for D.EPARTMEN,T OF TRANSPORTATION FEDERAL AVIATION ADMINlSTRATtON
Office of Aviation Medicine Washington, D.C. 20590

TECHNICAL REPORT STANDARD TITLE PAGE -·
1. Report No. 2 . Government Accession No. 3. Recipient's Catalog No.
FAA-AM-71-40 4. Title and Subtitle 5 . Report Date
AIR TRAFFIC APTITUDE TEST MEASURES OF October 1971 MILITARY AND FAA CONTROLLER TRAINEES 6. Performing Organization Code
7. Author( s} a. Performing Organization Report No.
Bart B. Cobb, M.S. 9. Performing Organization Name and Address 10 . Work Unit No .
FAA Civil Aeromedical Institute P. 0. Box 25082 11. Contract or Grant No .
Oklahoma City, Oklahoma 73125 13. Type of Report ond Period Covered
12. Sponsoring Agency Name and Address
Office of Aviation Medicine OAM Report Federal Aviation Administration 800 Independence Avenue, s.w. 14. Sponsoring Agency Code
Washington, D.C. 20591 15. Supplementary Notes
This research was conducted under Tasks No. AM-D-67-PSY-2, AM-B-69-PSY-2, AM-A-70-PSY-23 and AM-B-71-PSY-23.
16. Abstract
This study concerns the experimental use of seven commercially published aptitude tests at the Keesler AFB and Glynco NAS Air Traffic Control (ATC) Training Schools, the determination of relationships between the aptitude scores and training-course performance measures of Army, Air Force, Marine Corps, and Navy students, and an assessment of the potential with which such aptitude measures might be used to improve the military ATC selection programs. The seven tests were selected for the study on the basis of validation data obtained in previous research with ATC trainees of the Federal Aviation Administration (FAA). Results indicated that a composite score involving only four of the tests could have been used with con-siderable effectiveness to predict military ATC training performance. However, other findings illustrated that such tests would be of relatively little value for secondary screening purposes compared to a simple change in the military-screening-and-classification (MSC) standards; specifically precluding the selec-tion of Army, Navy, and Marine Corps personnel having MSC aptitude indexes below ll5 and of Air Force candidates having a General Index of less than 70. It was estimated that about two-thirds of the subjects in these upper MSC aptitude categories would be able to qualify on the u. s. Civil Service Commission's FAA-ATC Selection Test.
17. Key Words 18. Distribution Statement
Air Traffic Controllers Availability is unlimited. Document may Personnel Selection be released to National Technical Informa-Aptitude Measures tion Service, Springfield, Virginia 22151,
for sale to the public.
19. Security Classif. (of this report} 20. Security Classi f. (of this page} 21. No. of Pages 22. Price
Unclassified Unclassified ~0 $3.00
Form DOT F 1700.7 IB·69l

ACKNOWLEDGMENT
The author is indebted to Lieutenant Commander F. J. Gallagher (Glynco NAS), to Lieutenant Colonel F. E. Sayer (DOD-FAA ATC Training Command), to Mr. M. L. Jay and Mr. C. J. Williams (Keesler AFB), and to Mr. R. Klotz and Mr. R. F. Jordan (FAA AT representatives) for arranging the studies and for the collection of data at the Glynco and Keesler facilities. The assistance of Sharon Bowles, Carolyn Harshaw, Carolyn Lay, John Mathews, Mary Ann Nelson, and Alice ·weikel in analyzing the data is gratefully acknowledged.
AIR TRAFFIC APTITUDE TEST MEASURES OF MILITARY AND FAA CONTROLLER TRAINEES
I. Introduction.
The present report presents a summary and comparison of the results obtained in two similar, yet separate, studies. In each of the two investigations, aptitude tests were administered, on an experimental basis, to groups of men as they entered military Air Traffic Control (ATC) training. In both instances, the prime objective was to determine and compare the validities of the respective and combined test measures with the validities of military-screening-and-classification (MSC) aptitude test scores as predictors of performance in military ATC training schools. One of the studies involved the assessment of Navy and Marine Corps personnel in the A TC Training School at the Glynco Naval Air Station ( N AS), Georgia ; the other pertained to A TC trainees of the Air Force and Army who were examined as they entered a basic A TC training program at Keesler AFB, Mississippi. A report of the Glynco NAS study was published previously1 and the results obtained in the Keesler AFB study, though not heretofore published, were provided to the USAF Chief of Staff and to officials of the Federal Aviation Administration (FAA).
Inasmuch as the seven tests chosen for experimental use at both military training schools had been validated with civilian ATC trainees in previous research by the FAA's Civil Aeromedical Institute (CAMI), the availability of corresponding test performance data for the various groups presented an opportunity for a comparative study of the aptitude levels characterizing the Air Force, Army, Navy, Marine Corps, and FAA ATC trainee samples. Moreover, CAMI's previous research1 had included a regression analysis and development of an equation whereby a composite measure of performance on four of the seven commercial tests could be used to estimate an individual's score on a U.S. Civil Service Commission (CSC) battery of aptitude tests with which most applicants for FAA ATC train-
1
ing are currently screened. Since the FAA has traditionally selected the majority of its trainees from an applicant pool of former military controllers, a second major objective of the study was to estimate the military ATC trainees' performance on the operational screening battery. It was presumed that such information would be of considerable value to FAA officials in the development of future selection-and-qualification standards.
Plans for the earliest of the two investigations were first conceived in 1965 when representatives of the Glynco NAS visited CAMI for further indoctrination regarding the underlying research, development, and effectiveness of aptitude testing and other procedures used in . the screening and selection of applicants for FAA controller training. Naval officials subsequently discussed the possibility of being permitted the use of the operational battery of esc tests for experimental administration and validation at Glynco. Although a number of policy reasons precluded this approach, CAMI scientists suggested an alternate plan, subsequently accepted, involving seven commercially-published tests which had been validated in previous research with FAA trainees. After completion of the Glynco study, Keesler AFB officials asked that a parallel study be conducted on samples of Air Force and Army ATC trainees. Inasmuch as the research design, test battery, and procedures developed for both st~1dies were largely predicated upon the findings obtained in CAMI's research with FAA trainees, a brief review of that research2 4 and the FAA's selection and recruiting practices is deemed pertinent.
FAA S election and Recruiting History Eligibility for controller training with the
FAA has traditionally included consideration of an applicant's pre-employment experience, his educational background, the outcomes of an interview with management officials, and the results of a medical examination. Previous rele-

vant experience, particularly in military air traffic control, has always been heavily weighted in the selection process. Experience as a pilot and various types of work in communications and air surveillance have also been consistently viewed as important assets. In general, however, the selection programs prior to 1962 involved no formal assessment of mental abilities or aptitudes.
Beginning in July 1962 and for eighteen months thereafter, an aptitude index, reflecting performance on a esc battery of six tests, served as a major determinant in the selection of a limited number of trainees who possessed little or no pre-FAA ATC-related experience. The aptitude screening index was an outgrowth of extensive research conducted by CAMI. This research, which was begun in August 1960, included the administration of heterogeneous batteries of aptitude tests, on an experimental basis, to groups of newly-hired personnel as they arrived at the Aeronautical Center Academy for enrollment in either a nine-week basic-training course in Terminal Area Traffic Control (TATC) procedures or a somewhat similar course of the same duration in which the instruction and laboratory problems were oriented toward work at an Air Route Traffic Control Center ( ARTCC). Specialists in the latter are sometimes referred to as "Enroute" or "Center" controllers.
The CAMI experimental testing program ultimMely involved a total of 44 different tests, many of which were either commercially published instruments or aptitude assessment devices developed under contractual arrangement for the FAA. In fact, no OSO tests were included in the research prio1' to July 1961. At that time a series of multiple-regression analyses, accomplished in connection with follow-up studies of several hundred men/ 4 identified a total of eight tests (from a group of 27) with which a variety of summary measures having validity for prediction of ATC trainee performance might be derived. Seven of the eight were commercially published instruments and one, "Air Traffic Problems," was a contractually-developed test.
Although no single group was ever administered all eight tests, one class was examined with seven, and several successive classes were administered either six or five, of the eight instruments. \Vhen an average of the Academic and Laboratory Grades ("A+ L") was computed for each Academy trainee and employed as the criterion,
2
the validities of the composite measures, derived from the performance scores on five, six, or seven tests, were found to range from .35 to .54 (Pearson product-moment coefficients4
). More importantly, an analysis revealed that about 70 to 80 per cent of the cases classified as training-course failures were, in most instances, represented in the lower half of the distribution of scores derived with each respective group of tests. The attrition rates were averaging over 30 per cent despite the fact that most trainees were former military controllers.
The potential value of the tests for screening purposes was recognized and, when similar results were obtained with additional samples, the FAA and the Civil Service Commission agreed that aptitude-test measures should be employed, on a tentative basis, in the selection of some of the non-experienced applicants. However, commercially-published tests are not used because such instruments may be more susceptible to compromise than those subjected to rigid esc control procedures. Commission officials therefore examined their extensive file of esc tests and selected several instruments which, in terms of factor content, appeared to approximate a number of the validated commercial tests. Since the Air Traffic Problems Test (ATP) had been developed specifically for the FAA and was still completely controlled, it was officially adopted as a CSC test. In addition, CAMI researchers were provided a number of other esc tests which they were also asked to administer and evaluate.
Commencing in August 1961, all incoming classes of Academy ATC trainees were experimentally assessed with the entire group of tests extracted from the CSC files and with the ATP Test. The restricted time available for each testing session precluded an examination of each class with the complete and previously-validated battery of commercial tests. However, time beyond that required for the esc tests was available to permit administration of a portion of the commercial battery. A regression analysis of all data collected up to this point in time indicated that the Yalidity of the Commercial Seven-Test Composite could be approached with a summary measure based on only four of the seven. The four, which will be discussed later, were therefore used to supplement the esc tests in the next phase of research.

Follow-up studies o£ Academy trainees examined with the revised battery during the next ten months revealed that composite scores based on five o£ the CSC tests and ATP could be used effectively to predict training outcomes. Composite scores of 190 and higher were attained by approximately 55 per cent o£ all the examinees. 0£ these, about 70 per cent successfully completed their training course and were certificated as Air Traffic Control Specialists (ATCSs). In contrast, almost 75 per cent o£ those with scores o£ 189 and lower failed to graduate and were eliminated from further FAA training. These results approximated those obtained in earlier analyses (with other groups) £or the Commercial Seven-Test Composite. Three o£ the tests involved in the Six-Test CSC Composite were those which had been selected as "counterparts" o£ three commercial tests; these instruments provided measures o£ numerical, spatial, and non-verbal abstract-reasoning abilities. The new composite also included the ATP Test, an instrument known as "Letter Sequence" which also measured reasoning ability, and a test o£ following oral directions.
Although CAMI was requested to continue its experimental testing program and obtain additional validation data, the Civil Service Commission and the FAA agreed that the six CSC aptitude tests should be used to select one-third of the ATCS trainees from among those applicants who could not qualify on the basis o£ previous job-related experience. The procedure was officially implemented in May 1962. During the ensuing 17 months several thousand applicants were examined with the battery, but about half of them were unable to attain passing scores o£ 190 or higher. Moreover, at about the time the battery was adopted for limited use, budgetary limitation prompted a drastic reduction in the recruitment o£ ATC personnel. Consequently, the FAA continued to select an overwhelming majority of its trainees from among those having fully-qualifying amounts of pre-FAA experience. Only a few hundred of those who passed the esc aptitude screening battery were appointed to training and most of them possessed some, though not fully-qualifying, ATC-related experience.
CAMI continued to administer the CSC test battery, on an experimental basis, to all incoming classes of the Academy's basic-training courses.
3
The effectiveness o£ the CSC battery was conclusively demonstrated when an analysis involvin cr 893 cases revealed that 182 (or 67.1 per cent)
0
of 271 training-course failures were unable to attain composite scores o£ 190 or higher whereas only 222 (or 37.5 per cent) o£ the 622 pass cases did so.
These results prompted a revision in the selection standards. Beginning in January 1964, the esc battery was incorporated in the screening o£ all applicants-regardless o£ their pre-FAA experience. Aside from other factors, eligibility required a composite esc score of at least 210. Retention o£ a screening score o£ 190 was considered, but 210 was eventually adopted because it was contemplated that a further reduction in the number of trainee positions would be necessary pending an increase in Congressional appropriations. Personnel selected under these standards during the next £our years and nine months were insufficient to offset attritions within the air traffic management system. In the summer o£ 1968, however, the President announced that an expanded program of recruitment and training was necessary to preclude a critical shortage of ATC personnel. The program was implemented in October 1968.
Under the new standards, which are still in use, individuals with exceptional amounts and types of pre-FAA A TC experience, and particularly in radar-control work, can be granted an exemption o£ the aptitude requirement and also be hired at higher-than-normal pay grades. About one-fourth of those appointed to training smce November 1968 have established their eligibility in such a manner. Although there are some other standards whereby education and certain types o£ other experience may warrant waiver o£ the aptitude screening requirement, an overwhelming majority o£ the trainees are selected from among those applicants who have attained a score of 210 or higher on the esc battery and who, in most instances, also possess some ATC-related experience. Consequently, an applicant pool of former military air traffic controllers has continued to represent the prime source for the selection of FAA ATC trainees. Aside from other reasons, these recruiting practices have prompted the FAA to maintain an interest in the effectiveness o£ the ATC selectionand-training programs o£ the Air Force, Army, Navy, and Marine Corps.

II. Procedure.
Both the Glynco and Keesler studies were undertaken on a cooperative basis with officials of the respective military ATC training schools. It was mutually agreed that CAMI researchers would assume responsibility for: formulation of the test battery, supplies of test booklets, the design and accomplishment of all data analyses, and preparation of a report of findings. Glynco and Keesler representatives assumed responsibilities for the experimental administration and scoring of the aptitude tests and the collection of various types of correlative data such as military-screening-and-classification (MSC) test scores, chronological ages, and training-course performance data for all examinees.
Aptitude Tests
The selection of tests for validation at the two training facilities was predicated upon the findings which CAMI had obtained in previous research with FAA ATC trainees. As mentioned earlier, a total of eight non-CSC instruments (seven commercially-published tests and the Air Traffic Problems Test), had been identified as yielding a number of different and valid composite measures for prediction of FAA ATC performance criteria. Each composite scorewhether based on four, five, six or seven tests (no group had been given all eight tests)validated at a statistically significant level for prediction of the training measures. Inasmuch as the Air Traffic Problems Test (ATP) was subsequently designated as a esc test, existing policies precluded its release for experimental use with military trainees. It was assumed that the remaining sm·en tests would constitute an appropriate battery for experimental studies involving military ATC trainees.
Although the seven instruments of the experimental battery are referred to in the present report as "tests" they are actually parts, or subtests, of rather lengthy and comprehensive aptitude-measuring devices. Three of the seven are subtests of the Psychological Corporation's reputable Differential Aptitude Test (DAT), namely "DAT Space Relations," "DAT Numerical Ability," and "DAT Abstract Reasoning." One of these measures the ability of a subject to visualize objects and forms in two or three dimensions and one is a test of arithmetical or computational skill. The task in DAT Abstract
4
Reasoning is to determine, for each item, which of a series of choices (figures) properly carries out a principle of logical development exhibited by a sequence of figures; it provides a measure of non-verbal reasoning. The remaining four are subtests of the California Test Bureau's Test of Mental Maturity (CTMM, Advanced Form A Edition). In each item of CTMM Analogies, the subject must recognize the relationship between a pair of drawings (objects) in order to identify, by analogy, one of four choices as being similarly related to a third. CTMM Inference involves the comprehension of statements which present premises underlying the derivation of logical conclusions. The subtest designated as "CTMM Numerical Quantity-Arithmetic" measures ability to solve word-presented arithmetic problems, while CTMM Numerical QuantityCoins involves the mental manipulation of interrelated amounts of money and numbers of coins.
The six CSC tests used in supplement with four of the seven commercially-published instruments to obtain data for one of the two samples of FAA A TCS trainees involved in the present study were: CSC-51 Spatial Patterns; CSC-24 Computations; CSC-157 Abstract Reasoning; CSC-157 Letter Sequence; CSC-135 Following Oral Directions; and CSC-540 Air Traffic Problems. The six tests comprise the battery which has been used in the operational screening of most applicants for FAA ATCS training since January 1964. Of the six, Spatial Patterns, Computations and Abstract Reasoning are "counterparts" of the three commercial tests bearing similar titles. In each of the 25 items of the Letter Sequence Test, the examinee's task is to indicate ,..-hich of a series of letters properly carries out a principle of logical development exhibited by a sequence of letters. In "Following Oral Directions," the subject must make rapid and accurate decisions while he is orally presented a diversity of both irrelevant and pertinent information. The ATP Test presents a flight-data display (i .e., the altitudes and ETA's of several aircraft) and the examinee's task is to determine whether the aircraft may be permitted to make certain changes in altitude without violating a specified time-separation rule. Operationally, the esc battery is commonly referred to as "The CSC ATC Aptitude Screening Test" and the six elements as "subtests."

Samples
FAA Samples 1 and fZ. Two groups of FAA ATC trainees who participated in CAMI's previous validation research were selected for inclusion in the study. All trainees within each group had established their eligibility for selection and appointment to FAA training under standards which involved no aptitude screening. These 395 subjects represented all entrants into the Academy's Terminal-Area-Traffic-Control (TATC) Training Course during the period September 1960 through June 1962. It was assumed that the basic TATC training course was more like that provided at Glynco NAS and Keesler AFB than the Academy's ARTCC (or "Enroute") course. Of the 395 trainees, 212 entered training prior to July 1961 and were experimentally examined with a battery which included all seven commercial tests ultimately chosen for use at the Glynco and Keesler training facilities but no CSC instruments. This group was designated as Sample 1. The remaining 183 arrived at the Academy during the period August 1961 through June 1962. They were the only FAA T ATC trainees which CAMI had assessed with a battery which included not only the six esc tests but also four of the commerciallypublished instruments. This group was designated as Sample 2. CAMI's previous research had revealed a correlation of .81 between the Commercial Four-Test Composite scores of these subjects and their composite CSC measures. The sample is of considerable importance in the present study because the correlation coefficient of .81 provided the basis for development of an equation whereby the CSC 6-Test Composite Scores of the military trainees could be estimated from their performance on the four commercial tests.
Samples 3 and 4: Army and Air Force. Beginning in August 1968, the seven commerciallypublished tests were administered, on an experimental basis, to incoming classes of the Keesler AFB ATC Training School. In planning the study, it had been anticipated that performance data for 200 Army trainees and a similar number of Air Force students could be collected within about three months. However, the training course inputs were underestimated and it was necessary to conduct assessment sessions through December 1968 in order to obtain data for two groups of 169 each. The Army group was desig-
5
nated as Sample 3 and the Air Force group as Sample 4.
Samples 5 and 6: Navy and !If arine 0 orps. As mentioned earlier, CAMI researchers received the request to undertake the Keesler study following their report of findings for the Glynco study.1 A minor portion of the results presented in the Glynco report stemmed from multiple regression analyses which (for reasons explained in that report) were accomplished upon correlation coefficients (i.e. intercorrelations) based upon the combined data of the Navy and Marine trainees. Similar analyses on the data of the respective groups were not undertaken due to monetary considerations. Consequently there are a few instances in the present report where the data relate to the combined Navy and Marine Corps groups. In general, however, separateness of the data was maintained and the results are presented for the respective Glynco groups in the same manner as for each FAA, Army, and Air Force sample.
All but four of the 963 students who entered the Glynco NAS training course during March 1966 through February 1967 were administered the uniform battery of seven commercial tests on an experimental basis soon after enrollment. Of those examined, 642 were Navy personnel ; this group was designated as Sample 5. The remaining 317 were Marines who entered training during the earlier two-thirds of the indicated
· time period. These subjects comprised the sixth sample.
Table I indicates the number of subjects comprising each respective sample, the number who passed their respective training courses, the specific groups of tests they were experimentally administered, and the types of MSC scores available on each sample.
!If ilitary -Screening -and-Classification Test Scores
Three types of MSC scores were forwarded to CAMI for each Army trainee. One reflected performance on a test of verbal abilities ("V"), another pertained to a test of arithmetical reasoning ("A"), and the third, referred to as "MSC V +A," represented an average of the two. Data for each Air Force trainee included the AFQT (Armed Forces Qualification Test) score and four "aptitude indexes" derived from the Airman Classification Battery ( ACB). The

TABLE I • DESIGNATION OF APTITUDE TE ST SCORE S AVAilABLE FOR EACH SAMPLE OF THE STUDY
Sa"1J l e 1 Sample 2 Sampl e 3 Sample 4 Sampl e 5 Sa"1J le 6 FAA FAA Army Air Force Navy Marines
Nt=212 Nt=l83 Nt=l69 Nt=l69 Nt=642 Nt=317 N0 =193 Nf=l7 N0=143 Nf=40 N0-160 Nt=9 N0=161 NcB N0=55 2 Nt=77 N0-288 Nf=25
COHMERCIAL TE STS OAT Space Relations X X X X X X OAT Numerica l Ability X X X X X X OAT Ab s trac t Reasoning X X X X X X CTMM Analogi es X X X X X X C:T MM Inferenc e X X X X X CTHM N.Q. Coino X X X X X C:Tl'IM N.Q. Arithmetic X X X X X
CIVIL SERVICE C<liMISSION TEST S esc 51- Spatial Patterns y esc 24- Computations y esc 157- Abstract Reasoning y esc 157- Letter Sequence y esc 135- Oral Directions y esc 540- ATP !+II y
l' YPF. S OF COMPOSITE SCORES DERIVED Comr.wrc ia 1 7-t es t Compositp X X X X X Contnl·n· ia 1 4-tcst Comp os it e X X X X X X New 4-tcst Corm1ercial Comp. X X X X X rsr 6-tt•st Composite y
mLITARY (M SC ) SC ORE S ''V + A" Sco r e z AC~ - "Cl " Sco r<' t /3 (AR + VE + PA) Score z
_l.;CT + ARI Score z
(Xott·s : Th(' l owc r-<:asc lctt c r, "x", i ndi ca t es each commercia lly-publi shed test for which performance scores were ava il.lhll', whi lt• "X" rl•fcrs to composi t e scor es based o f spec ific group s of suc h t es t s . Similarly 1
11y" and "Y" refer to scores fCtr tht.· St•p.:tr.J.tc .J.nd l·ombinl•d CSC - ATC sub t e st s and "Z" denotes eac h MSC scor e used in sc reening for military ATC training.)
four are referred to as the "G I" (General), "MI" (Mechanical), "AI" (Administrative) and "EI" (Electronics) indices. The Navy provided an MSC index known as the "GOT+ ARI" for each of its trainees. In each instance, the score reflected performance on the Navy's General Classification Test (which is omnibus in factor content) and a test known as "Arithmetical Reasoning." A similar index, referred to as "¥3 ( AR + VE + P A)," was forwarded for each Marine. The latter represented an average of performance scores on Marine Corps tests of arithmetical reasoning, verbal ability, and perceptual ability.
The aptitude-evaluation procedures employed by the Navy, Marine Corps, and Army in the selection of personnel involved in this study were designed to yield a mean of 100 and an SD of 20 for a military population; for practical purposes, the procedures may therefore be considered as directly comparable. Inasmuch as the Air Force employs a different scale, extrapolative procedures are necessary when an aptitude index of a given magnitude is to be compared with an Army, Marine Corps, or Navy MSC index. Ac-
6
cording to Glynco officials, an MSC index of 110 constituted a recommended standard for selection of the Navy and Marine trainees. However, subsequent findings indicated this policy was adhered to in the selection of 316 (of the 317) Marines while the Navy selected 106 (about 16.5 percent) of its 642 trainees from lower-aptitude categories. The Army followed a similar standard and selected 161 of 169 men represented in Sample 3 from among those having MSC scores of 110 and higher. A "GI" (or "General Aptitude Index") of 65, which is roughly equivalent to an Army, Marine Corps, or Navy MSC score of 110, constituted the Air Force's recommended standard. About 85 percent of the 169 cases comprising Sample 4 met this standard; 25 did not.
The reasons why each branch of the military selected some trainees from the lower-aptitude categories are unknown. However, a number of mitigative factors may have been involved. For example, training-facility limitations, quotas, and priorities regarding the many different specialty areas frequently vary and, inasmuch as eve?'Y recruit must be classified and assigned to
some type of training, deviations from normallyprescribed standards are sometimes necessary. Moreover, the minimum MSC "screening score" recommended by each respective service for selection of ATC personnel should not be considered "low"; each is roughly equivalent to a percentile score of at least 65, and the vast majority of the military ATC trainees comprising the current samples were found to possess scores well above this level.
Criteria
The basic criterion variable against which all test measures were evaluated was the "Overall Training Course Grade Average." For the FAA groups, as well as the Glynco and Keesler trainees, this measure represented an arithmetical mean of two averages, one of which was based on all tests relating to the course lectures and academic materials, while the other was a comprehensive measure of laboratory performance. "Pass-Fail Status" ("P-F") for each respective training course was also employed as a uniform criterion but the correlations and other statistics based on this criterion were ultimately considered as rather meaningless for Samples 1, 3, and 4 because the attrition rates were so low.
However, CAMI researchers were able to formulate an additional criterion, referred to as the "Progress Index" ("PI"), for each Army and Air Force Trainee (Samples 3 and 4). The first step in the derivation of the PI involved a review of each individual training record. A negative weight of 4 (i.e., "-4") was assigned to the subject in each instance where the record indicated he was a "washback" or "holdover" to a succeeding class. Similarly, a weight of -3 was assigned for each "retake" of an exam or "block failure," a -2 for each occasion where the trainee was "counseled for slow proO'ress "
0 ' and -1 for each instance where the record indi-cated "remedial instruction" was necessary. If the subject was designated as an "honor graduate," a positive weight of 2 (i.e., +2) was assigned. The algebraic sum of all such assigned values was computed for each subject; the result was algebraically combined with a basic value of 100 to derive an adjusted score, and an average of the latter and the Overall Training Course Grade was then obtained which, in raw-score form, was presumed to reflect overall progress. For purposes of convenience, the raw scores were
7
then converted, on the basis of separate frequency distributions for the Army and Air Force groups, to stanines. Thus each subject's PI (or "Progress Index") is expressed on a 9-point scale, with 9 indicating that the subject was represented in the approximate upper four per cent of the original distribution. (Similarly, stanines of 8, 7, 6, 5, 4, 3, 2 and 1 roughly correspond to percentages of 7, 12, 17, 20, 17, 12, 7 and 4, respectively.)
F(l(Jtor Weights Used in Computing Composite Aptitude Measures
With the exception of the estimated performance scores for the esc battery, all composite aptitude measures for the subjects were derived through application of sets of factor weights developed in previous research2 3 with performance data of several hundred FAA ATC trainees, many of whom were "Enroute" trainees. In fact FAA ATC samples included in the present study represent only a minor portion of the total group. For each test, the inverse of the standard deviation of scores ( 1/ SD) obtained for the larger group was adopted as the basic factor weight. Decimals were omitted and the resulting sets of two-digit weights were applied in the present study to derive the Commercial 7-Test Composite Score and the Commercial 4-Test Composite Score for each subject. (The application of such weights is essentially equivalent to a summation of test performance scores rendered in standard -score form.) Earlier research/ including the cross-validation aspects of the Glynco investigation/ indicated that weights of this type were about as effective as beta weights (derived through regression analyses) for obtaining summary correlate measures.
Moreover, single-digit factor weights utilized in the Glynco study were also used in the present study to compute the New 4-Test Commercial Composite Score for each Army and Air Force ATC trainee. However, these merely represented a simple and proportionate reduction of the original set of two-digit weights to single-digit values. As stated earlier, the correlation of .81 between the Commercial 4-Test Composite Scores and the CSC 6-Test Composite Scores of the subjects comprising Sample 2 provided the basis for development of an equation whereby the scores of all other subjects on the complete esc battery were estimated directly from their Com-

mercial 4-Test Composite Scores. The CSC 6-Test Composite Scores for Sample 2 were obtained in the same manner as prescribed by the Civil Service Commission. In accordance with that procedure, the raw scores on four of the esc tests were unit-weighted whereas a factor weight of "2" was applied to Spatial Patterns, Abstract Reasoning, and Letter Sequence.
III. Results and Discussion.
Empirical Validities of the Aptitude Tests The validities of the various aptitude tests,
when used separately and in combination for prediction of Training Course Grade, Pass-Fail Status and/or the Progress Index ("PI") are presented in Table II. Similar data relating to the MSC scores are also shown. In every instance where Pass-Fail (P/F) Status served as the criterion, a point-biserial correlation coefficient was obtained; for the other criteria, Pearson product-moment correlation coefficients were computed.5 The same is true regarding the correlations presented in all succeeding tables unless otherwise specified.
Validities of Each Commercial Test
The validity coefficients established with the various samples for each of the commerciallypublished aptitude tests appear in the upper portion of Table II. An appreciable degree of variation is apparent in the validities of the respective tests from sample to sample. Yet, all coefficients except a few of those pertaining to CTMM Analogies and CTMM NQ Coins proved to be statistically significant and, within the context of the present study, most of them should be considered of substantial and practical value. The validities established with Sample 4 (Air Force) appear, in general, to be somewhat higher than those obtained with the other military groups. It may also be noted that the scores on the commercial tests tended to correlate more highly with Training Course Grade than with either the PI or P -F criterion. As mentioned earlier, however, the training course attritions represented only eight per cent of Samples 1 and 6 and 12.2 per cent of Sample 5; consequently, the point-biserial coefficients obtained with these samples cannot be considered very reliable.
Although the battery of tests administered to Sample 2 included only four of the commercially
8
published instruments, the correlations between Course Grade and three of the four tests were higher for this sample than for any other. The performance scores on each of the four tests by these 183 TATC trainees (among whom there were 40 training-course failures) also correlated at a substantial and statistically-significant level with the P-F criterion.
The author can offer no explanation as to why the commercial tests validated better with FAA Sample 2 than with Sample 1. A selection bias was not involved because the combined samples represented the total input for the TATC training course for a 19-month period. All other participants in the ATC research program conducted during this period were ARTCC trainees. Although not presented in this report, the validities obtained with the ARTCC groups for the seven commercial instruments were generally better than those established on Sample 1.
Comparison of Validities of CSC and Non-CSC Tests for Sample 92
Sample 2 comprised the total number of TATC trainees examined with the entire group of six CSC tests. The battery with which they were assessed also included four of the commercial tests. As may be noted in Table II, the validities of the six esc tests ranged from .23 to .55 for Course Grade and from .16 to .45 for the P-F criterion whereas those of the four non-CSC instruments ranged from .27 to .44 for Course Grade and .25 to .37 for Pass-Fail Status. If the coefficients in each array were averaged, the means would slightly favor the group of commercially-published tests.
Althou;:1 not presented in any table, intercorrelations of all CSC and non-CSC test measures for Sample 2 were computed. A correlation of .72 between DAT Space Relations and CSC Spatial Patterns was deemed sufficiently high to support the hypothesis that these two similarlynamed tests were also similar in factor content. A coefficient of .51 • was obtained between DAT Numerical Ability, and CSC-24 Computations; this was lower than had been anticipated and the latter correlated no higher than .28 with any of the other three commercial instruments. ·while DAT Abstract Reasoning was found to correlate only .48 with Part I (Abstract Reasoning) of CSC Booklet 157, it correlated .71 with Part II (Letter Sequence).
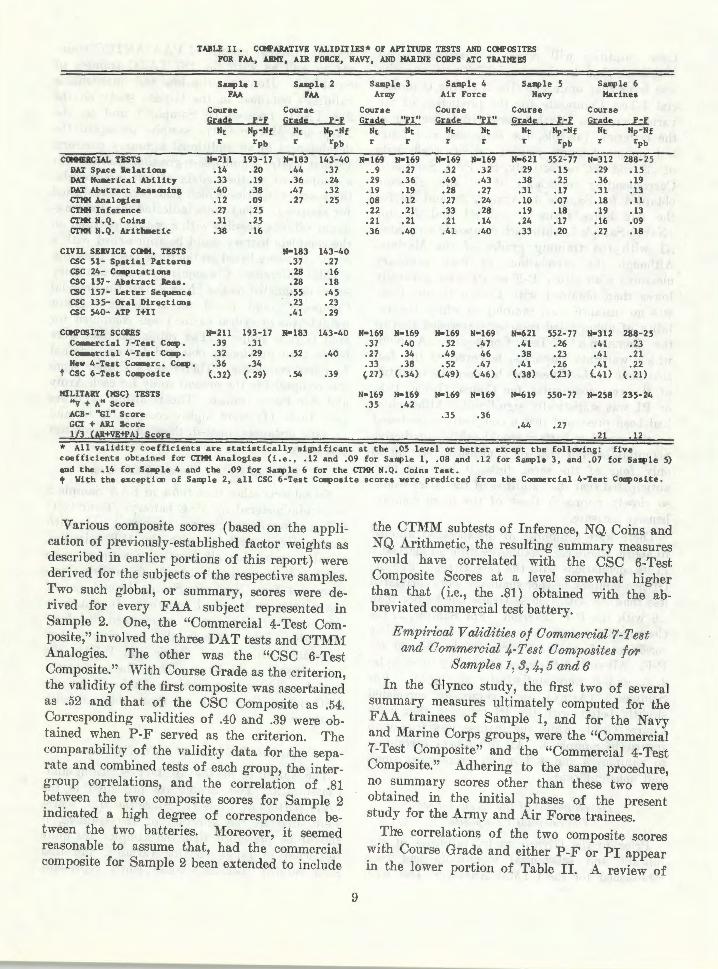
TABLE II. C<IIPA.IlATIVE VALIDITIES* OF APTITUDE TESTS AND C<IIPOSITES FOR FAA, ARMY, AIR FORCE, NAVY, AND MARINE CORPS ATC TRAINEES
Saq>le 1 Sample 2 Sample 3 Sample 4 Saq>le 5 Sample 6 FAA FAA Arrrry Air Force Navy Marines
Course Course Course Course Course Course !iu!!s: ~-F !iuds: P-F Grade "PI" Grade "PI" Grads: P-F !irade P-F
Nt Np-Nf Nt Np-Nf Nt Nt Nt Nt Nt Np-Nf Nt Np-Nf r rpb r rpb r r r r r rpb r rpb
CCIIMERCIAL TESTS N•211 193-17 N•l83 143-40 N•l69 N•l69 N•l69 N•l69 N•621 552" 77 N•312 288-25 DAT Space Relations .14 .20 .44 .37 , _9 .27 .32 .32 .29 .15 .29 .15 DAT Numerical Ability .33 .19 .36 .24 .29 .36 .49 .43 .38 .25 .36 . 19 DAT Ab~tract Reasoning .40 .38 .47 .32 .19 .19 .28 .27 .31 .17 .31 .13 CTMM Analogies .12 .09 .27 .25 .08 .12 .27 .24 .10 .07 .18 .ll CTMM Inference .27 .25 .22 .21 .33 . 28 .19 .18 .19 .13 CT191 N .Q. Coins .31 .25 .21 .21 .21 .14 .24 .17 .16 .09 CTMM N .Q. Arithmetic .38 .16 . 36 .40 .41 .40 .33 .20 .27 .18
CIVIL SERVICE COHK. TESTS N•l83 143-40 CSC 51- Spatial Patterns .37 .27 CSC 24- Computations .28 .16 CSC 157- Abstract Reas. .28 .18 CSC 157- Letter Sequence .55 .45 CSC 135- Oral Directions .23 .23 esc 540- ATP I+II .41 .29
C<I!POSITE SCCIIES N•2ll 193-17 N•l83 143-40 N•l69 N•l69 N•l69 N•l69 N•621 552-77 N•312 288-25 Commercial 7-Test Camp. .39 .31 .37 .40 . 52 .47 .41 .26 .41 .23 Commercial 4-Test Camp. .32 .29 .52 .40 .27 .34 .49 46 .38 .23 .41 .21 New 4-Test Commerc. Ca..,. .36 .34 .33 .38 .52 .47 .41 .26 .41 .22
t CSC 6-Test Ca..,osite (.32) (.29) . 54 .39 p7) (.34) (.49) (.46) <.38) l23) <.41) (. 21)
MILITARY (MSC) TESTS N•l69 N•l69 N•l69 N•l69 N•619 550-77 N•258 235-24 "V + A" Score .35 .42 ACB- "GI" Score .35 .3 6 GCT + ARI Score .44 .27 llJ {AR+VE-ti'Al Scors:; .21 .12
* All validity coefficients are statistically significant at the .05 level or better except the following: five coefficients obtained for CTMM Analogies (i.e., .12 and .09 for Sample 1, .08 and .12 for Sample 3, and .07 for Saq>le 5) and the .14 for Sample 4 and the .09 for Saq>le 6 for the CTMM N.Q. Coins Test. t With the exception of Sample 2, all CSC 6-Test Coq>osite scores were predicted from the Commercial 4-Test Composite.
Various composite scores (based on the application of previously-established factor weights as described in earlier portions of this report) were derived for the subjects of the respective samples. Two such global, or summary, scores were derived for every FAA subject represented in Sample 2. One, the "Commercial 4-Test Composite," involved the three DAT tests and CTMM Analogies. The other was the "CSC 6-Test Composite." ·with Course Grade as the criterion, the validity of the first composite was ascertained as .52 and that of the CSC Composite as .54. Corresponding validities of .40 and .39 were obtained when P-F served as the criterion. The comparability of the validity data for the separate and combined tests of each group, the intergroup correlations, and the correlation of .81 between the two composite scores for Sample 2 indicated a high degree of correspondence between the two batteries. Moreover, it seemed reasonable to assume that, had the commercial composite for Sample 2 been extended to include
9
the CTMM subtests of Inference, NQ Coins and NQ Arithmetic, the resulting summary measures would have correlated with the CSC 6-Test Composite Scores at a level somewhat higher than that (i.e., the .81) obtained with the abbreviated commercial test battery.
Empirical Validities of Comme?·cial7-Test and Commercial 4-Test Composites for
Samples I, 3, 4, 5 and 6
In the Glynco study, the first two of several summary measures ultimately computed for the FAA trainees of Sample 1, and for the Navy and Marine Corps groups, were the "Commercial 7-Test Composite" and the "Commercial 4-Test Composite." Adhering to the same procedure, no summary scores other than these two were obtained in the initial phases of the present study for the Army and Air Force trainees.
The correlations of the two composite scores with Course Grade and either P-F or PI appear in the lower portion of Table II. A review of
>:~
;
I

these validities will reveal a consistent trend indicating that the Commercial 7-Test Composite was somewhat more effective than the Commercial 4-Test Composite for the prediction of the various criteria. 'Vith Course Grade serving as the criterion variable, the seven-test and fourtest summary scores yielded validity coefficients of .39 and .32, respectively, for FAA Sample 1. Corresponding coefficients of .37 and .27 were obtained for Sample 3 (Army), .52 and .49 for the Air Force trainees, and .41 and .38 for (Navy) Sample 5, while each composite correlated .41 with the training grades of the Marines. Although the correlations of both summary measures with either P-F or PI were generally lower than obtained with Course Grade, there was no instance (i.e., sample) in which the validity of abbreviated composite exceeded that of the Commercial 7-Test Composite. A point which warrants emphasis, however, is the fact that none of the differences between the validities of the two composites for Course Grade, P-F, or PI was statistically significant. Although it had been presumed that a composite score based on the complete battery would exhibit predictive potential beyond that of a measure relating to only four of the seven tests, it had not been anticipated that the validities of the latter would so closely approach those of the more comprehensive measure.
There were a number of instances, as alluded to above, where each composite differed marKedly in its correlations with the two criteria. For the Glynco samples, neither summary score correlated less than .38 'vith Course Grade nor higher than .26 with the P-F criterion. For Sample, 2, the Commercial 4-Test Composite yielded a validity coefficient of .52 for Course Grade and .40 for P-F. All such differences pertaining to Samples 2, 5, and 6 were statistically significant. For Sample 3 (Army), each composite correlated slightly better with the PI criterion than with Course Grade while the inverse was true with regard to Sample 4. All differences pertaining to Samples 3 and 4, however, were quite small and nonsignificant.
Development of the "New 4-Test Commm·cial Composite"
Prior to the Glynco study, validities of significant and substantial magnitude had been established for the CTMM Analogies Test with
10
several different groups of FAA ARTCC trainees as well as with the 183 TATC trainees of Sample 2. However, the low and questionable validities obtained in the Glynco study on the 212 TATC trainees of Sample 1 and on the Navy and Marine Corps samples prompted the development of an additional summary measure. In that study, a multiple-regression analysis was accomplished on the matrix of test intercorrelations and validities which had been established for sample 1. The results indicated that the maximum validity possible with a composite based on the complete battery could be approached with a composite score based on the three DAT tests and CTMM Inference. Consequently, a new summary score, designated as the "New 4-Test Commercial Composite" and based on single-digit factor weights (as described earlier) was computed for each Glynco subject. The validation data were better than previously obtained for the original four-test composite. Therefore, a similar score was computed in the present study for each Army and Air Force trainee. The resulting validities (see Table II) were highly comparable to, and in some instances equaled, those of the seven-test composite.
Estimated CSC Composite Scores
No subjects other than those in FAA Sample 2 were administered the CSC battery. Their CSC 6-Test Composite Scores correlated .54 with Course Grade and .39 with the P-F criterion. Similar scores for all remaining subjects were estimated, or predicted, directly from their Commercial 4-Test Composite Scores through .use of the previously-described equation. Inasmuch as the predicted esc scores represented "perfect" correlates of the Commercial 4-Test Scores, they correlated with Course Grade and P-F in the same degree as the latter. Thus, the only meaningful validities presented in Table II for the CSC 6-Test Composite are those obtained with Sample 2.
Empirical Validities of li£SC Test Scores
The validities of the Military-Screening-andClassification Test Scores are presented in the lower portion of Table II. Since the MSC scores were used in the selection of the trainees, it should be presEmed that the samples are quite restricted in range on this variable, and that each validity coefficient consequently represents

a gross underestimate of the true validity. Moreover, unless complete independence (i.e., no relationship or correlation) exists between the MSC test scores and the commercial test performance measures, the validity coefficients for each of the latter should also be considered as attenuated. (Procedures for correction of attenuation effects were not employed, for either the MSC or commercial test scores.)
The Army "MSC V +A" score correlated .35 with Course Grade and .42 with the Proaress 0
Index. For the Air Force sample, correlations of .35 and .36 were obtained for the ACB-GI index versus Course Grade and PI. Similarly, the Navy's MSC score yielded validity coefficients of .44 and .27, whereas those of the Marine Corps' aptitude screening measure were .21 and .12. Inasmuch as an analysis revealed that the maj~rity of the Marines possessed exceptionallyhigh MSC scores, each of the latter coefficients should be regarded as grossly attenuated. However, it is also interesting to note that every experimentally-derived composite validated at considerably-higher levels than did the Marine Corps MSC score. Evidence to be presented later indicates moderate-to-low correlations existed between the MSC score and each of the experimental composites.
Of the various experimental composites, only that based on the entire group of seven tests yielded higher validities than obtained with the Army MSC score. In contrast, every commercial composite validated with Sample 4 at a sianificantly higher level than did the Air F~rce's ACB-GI Index. The experimental measures also yielded appreciable validities for the prediction of the training-course grade averages and the Pass-Fail status of the Navy trainees but, in every instance, at a lower (though not significantly-lower) level than the CGT + ARI score.
Based on the results of all such comparisons, one might suspect that performance measures on tests similar to those comprising the commercial battery (and particularly the three DAT tests and CTMM Inference) could be used in supplement with each type of MSC score to achieve a moderate degree of improvement in the selection process. As will be discussed later, however, several analyses indicated that, while the degree of improvement attainable with such a procedure
11
would indeed be slight, the adoption and use of a higher minimum MSC score (alone) would serve the purpose almost equally as well.
lJf ultiple R' s Versus Validities of 0 omposites
A series of multiple-regression analyses were accomplished on the correlational data obtained for Samples 1, 2, 3 and 4 and for the combined Samples 5 and 6. (Intercorrelations for the Navy and Marine trainees were available from the Glynco Study for the combined groups only.) For each of the five groups, the first analysis was aimed at determining the maximum possible validity attainable with the complete seven-test commercial battery for prediction of Course Grade and the respective "beta weight" for each test needed to obtain the indicated "R" (or optimum validity coefficient). Using the same criterion, two additional regression analyses were undertaken; one focused upon the three DAT tests and CTMM Analogies and the other upon the three DAT's and CTMM Inference. Inasmuch as simplified factor weights rather than regression-derived weights, had been used in computing each composite score, a comparison between each "R" and the corresponding validity coefficient for each composite should indicate the amount of loss or "shrinkage" resulting from use of the simplified weights. The data for such a comparative study are presented in Table III.
For Sample 1, the first analysis revealed that if the performance scores on the seven commerc~al tests had been weighted according to a spemfic set of values (as indicated by the regression analysis), the resulting summary score would have correlated .49 with Course Grade. In contrast, the Commercial 7-Test Composite Score based on the simplified factor weights yielded a validity coefficient of .39. For the same sample an "R" of .45 was established for the three DAT tests ~nd CTMM Analogies, whereas the validity coefficient for the Commercial 4-Test Composite Score was .32. An "R" of .45 was also obtained for the three DAT tests and CTMM Inference and this, too, was considered substantially above the .36 for the New 4-Test Composite Score. In every instance, however, the difference between the corresponding coefficients failed to be statistically significant. For each remaining sample, the validity of each composite score compared more favorably with the corresponding "R." In other words, even if the regression-derived factor
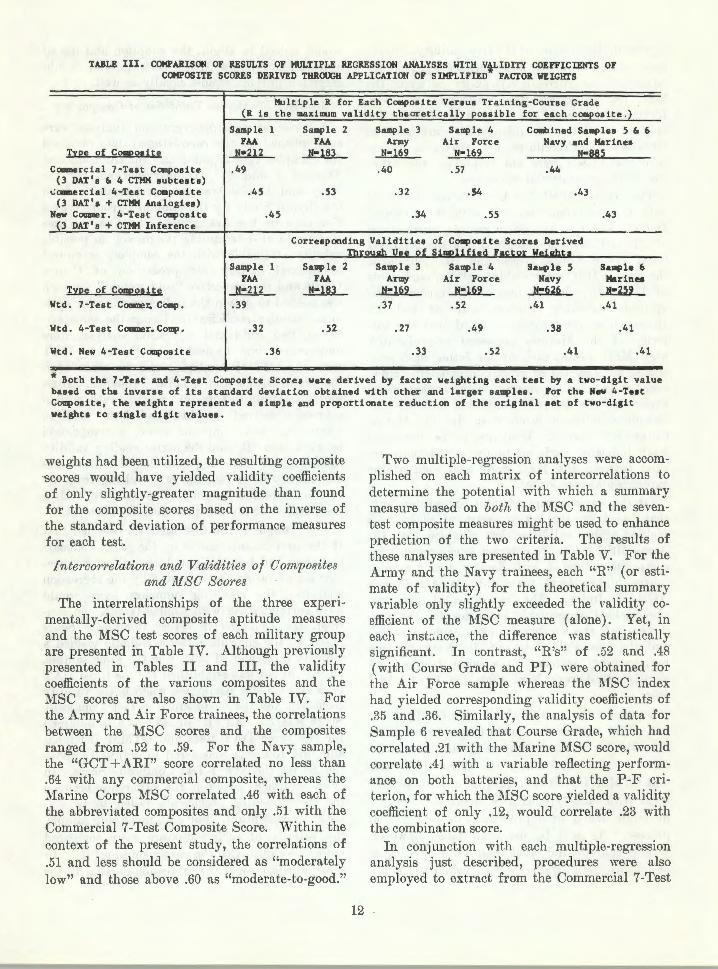
TABLE III . COMPARISON OF RESULTS OF MULTIPLE REGRESSION ANALYSES WITH V4LIDITY COEFFICIENTS OF COMPOSITE SCORES DERIVED THJlQIX;H APPLICATION OF SIMPLIFIED FACTOR WEIGHTS
Type of Compoaite
Commerc i al 7-Test Compoaite (3 DAT'a & 4 CTMH subteata)
~ommercial 4-Test Composite (3 OAT's + CTHH Analogies)
New Commer. 4-Test Composite 1_3 OAT's + CTMM Inference
Mu l t i ple R for Each Compos i te Versus Training-Course Grade (R i s the maxi mum validi ty t he oret ically poss i bl e for each composite . )
Sample 1 Sample 2 Samp le 3 Sample 4 Co.bined Samples 5 & 6 FAA FAA Army Ai r Force Navy and Mar i nes
N•212 N•l83 N•l69 N•l69 N•885
. 49
.45
.45
.40 . 57 .44
.53 .32 .54 .43
.34 .55
Correspondi ng Validi ties of Compoaite Scorea Derived !br ouib Uae of Simplified Factor Wei&bt•
.43
Sample FAA
N•212
Sample 2 Samp l e 3 Sample 4 Sa114> le 5 Sa~le 6 Marinu 1!=259
FAA Army Air Force Navy Type of Composite
Wtd. 7 -Test Commer. Camp. N•l83 N•l69 N•l69 N•626
. 39 . 37 .52 .41 . 41
Wtd. 4-Test Commer.Comp. .32 . 52 .27 . 49 .38 .41
Wtd . New 4-Test Composite .36 .33 . 52 .41 .41
* Both the 7-Test and 4-Test Composite Scores were der ived by fac t or weighting each t eat by a two-digit value baaed on the inverse of its standard devi ation obtained wi th ot her and larger aamp l ea. For the New 4-Teat Composite, the weights represented a s i mple and proport ionate r eduction of the original aet of two-digit weighta to single digit values.
weights had been utilized, the resulting composite scores would have yielded validity coefficients of only slightly-greater magnitude than found for the composite scores based on the inverse of the standard deviation of performance measures for each test.
I ntercorrelations and Validities of 0 omposites and 11/SC Scm·es
The interrelationships of the three experimentally-derived composite aptitude measures and the MSC test scores of each military group are presented in Table IV. Although previously presented in Tables II and III, the validity coefficients of the various composites and the MSC scores are also shown in Table IV. For the Army and Air Force trainees, the correlations between the MSC scores and the composites ranged from .52 to .59. For the Navy sample, the "GOT+ ARI" score correlated no less than .64 with any commercial composite, whereas the Marine Corps MSC correlated .46 with each of the abbreviated composites and only .51 with the Commercial 7-Test Composite Score. Within the context of the present study, the correlations of .51 and less should be considered as "moderately low" and those above .60 as "moderate-to-good."
12
Two multiple-regression analyses were accomplished on each matrix of intercorrelations to determine the potential with which a summary measure based on both the MSC and the seventest composite measures might be used to enhance prediction of the two criteria. The results of these analyses are presented in Table V. For the Army and the Navy trainees, each "R" (or estimate of validity) for the theoretical summary \'ariable only slightly exceeded the nlidity coefficient of the MSC measure (alone) . Yet, in each inst~,ace, the difference was statistically significant. In contrast, "R's" of .52 and .48 (with Course Grade and PI) were obtained for the Air Force sample whereas the :USC index had yielded corresponding Yalidity coefficients of .35 and .36. Similarly, the analysis of data for Sample 6 revealed that Course Grade, which had correlated .21 with the ~farine MSC score, would correlate .41 with a Yariable reflecting performance on both batteries, and that the P-F criterion, for which the ~ISO score yielded a validity coefficient of only .12, would correlate .23 with the combination score.
In conjunction with each multiple-regression analysis just described, procedures were also employed to extract from the Commercial 7-Test

-
TABLE IV. INTERCORRELATIONS AND VALIDITIES* OF COMPOSITE APTITUDE MEASURES FOR ARMY, AIR FORCE, NAVY AND MARINE CORPS TRAINEE GROUPS
4-Test New 4- MSC Course Course Pass CQ!!I! I Ts:11t Ss; . ~ G[adil "Pl" Fail
Mean N N N N N Np-Nf S.D. r r r r r rnh
Sample 3 - Army Commer. 7-test Coq~. 2881.2 169 169 169 169 169
425.8 ' ·22 .92 .~9 .31 .4Q Commer. 4-test Comp. 1613.7 169 169 169 169
269.0 .§8 .~2 .2z .34 New 4-test Comm. Sc. 300.3 169 169 169
41.§ .~~ .~3 .~§ HSC - ''V+A" Score 122.2 169 169
8 3 35 42 Course Grade 86.8 169
4.4 .R7
Sample 4 - Air Force Commer. 7-test Comp. 2842.1 169 169 169 169 169
444.2 .91 .91 .59 .52 :47 CODDer . 4-test Comp. 1553.6 169 169 169 169
2Z4.7 .92 .~6 .49 .46 New 4-test C~. Sc. 294.0 169 169 169
42.1 .58 .~2 .47 MSC - ACB "GI" Sc. 74.7 169 169
10.2 .J2 .36 Course Grade 87.1 169
4.5 .88 Saq~le 5 - Navy
Commer. 7-test Camp. 2859.2 642 642 640 621 552-77 442.~ .92 .9~ .Zl .41 .26
C011111er. 4-test Coq>. 1583.2 642 640 621 552-77
' 2§4.!t .91 .64 .38 .23
New 4-test Comm. Sc. 296.9 640 621 552-77 44.Z .64 .41 .26
MSC-GCT+ARI Score 119.4 619 550-77 10 1 44 .28
Course Grade 79.3 551-70 8.3 .64
Sample 6 - Marine Corps Commer. 7-test Comp. 3163.7 317 317 262 312 288-25
38211 .90 .90 ·21 .41 .23 Commer. 4-test Comp. 1730.0 317 262 312 288-25
24~.7 .88 .46 .41 .21 New 4-test Comm. Sc. 325.5 26.2 312 288-25
3§.0 .4~ .41 .22 MSC-l/3(AR+VE+PA) Sc. 127.7 258 235-24
~.~ .21 .12 Course Grade 80.7 288-24
6.8 .52
* All r's are statistically significant at .05 level or better.
13

TABLE V. MULTIPLE AND PARTIAL CORRELATIONS* ILLUSTRATING THE P<JrENTIAL OF A MEASURE SUCH AS THE COMMERCIAL 7-TEST COMPOSITE FOR IMPROVEMENT OF MILITARY ATC SELECTION PR<X;RAMS
Variables
Sa~le 3 - Army MSC "V+A" Score Comm. 7-Test Composite Combined 7-Test + MSC
Sample 4 - Air Force MSC "ACB GI" Index Comm. 7-Test Composite Combined 7-Test + MSC
Sa~ le 5 - Navy MSC "GCT+ARI" Score Comm. 7-Test Composite Combined 7-Test + MSC
Sample 6 - Marine Corps MSC "l/3(AR+VE+PA)" Conm. 7-Test Composite Combined 7-Test + MSC
Course Grade r
.35
.37
.35
.52
.44
.41
.21
.41
R
.40
.52
.46
.41
PI r
.42
.40
.36
.47
R
.4b
.48
P-F r
.28
.26
.12
.23
R
.29
.23
Criterion r with MSC Score Theoretically Held Constant
Course Grade
.22
.41
.15
.36
PI P-F
.21
.34
.09
.20
*All coefficients except the .09 are statistically significant at the .05 level or less.
Yariable that mriance associated with the ~1SC score and thus estimate the "residual Yalidity" of the experimental composite. In other words, the objective 'vas to assess the composite's predictive validity exclusiYe of that which it held in common with the 1\ISC score (i.e., its validity with the MSC scores theoretically nullified or held constant) . The resulting second -order correlations are shown in Table V. ·with Course Grade serving as the criterion, coefficients of .22, .41, .15 and .36 'vere obtained for Samples 3, 4, 5 and 6, respectively. With PI or P-F as the criterion, the composite yielded residual validities of .21 for FAA Sample 1, .34 for the Air Force, .09 for the Navy, and .20 for the Marines.
These data, together with the results of the multiple regression analyses, illustrate the potential with which the Commercial 7-Test Composite Score or a similar measure could be used in supplement with the MSC score to improve each military ATC-selection program. \Vhen
14
considered from a practical dewpoint, however, results as obtained with the Army and Navy groups would fail to warrant such a major revision in the selection procedures. In contrast, the findings relating to the Air Force trainees are impressin~ and indicate that, if circumstances had permitted, the aptitude screening and selection of ATC personnel could haYe taken a different form. HoweYer, the findings do not necessarily imply that additional tests would have been needed. The Airman Classification Battery (ACB), which was operational at the time this study was conducted, consisted of many different tests, covering a variety of aptitude factor areas and the "General Index" (GI) represented but one of four summary measures derived through differential weighting of the numerous subtests. It is reasonable to assume that literally all the variance inherent in the Commercial 7-Test Composite would have been attainable by combining the scores of the various

ACB subtests in some specific manner. In other words, had the ATC specialty been deemed so critical as to justify such action (with acceptance of concomitant adverse effects upon selection of personnel for other types of training), Air Force researchers could undoubtedly have formulated a "customized" global ACB measure surpassing the validity of the experimental seven-test composite.
Since the majority of the 169 Marines were known to have possessed relatively high MSC scores, rather low validity coefficients for the operational index had been expected (due to restriction-of-range effects). However, only three relatively factor-pure aptitude tests constituted the operational screening battery, whereas the experimental composite was based on seven instruments. Moreover, the seven-test composite measure correlated with .51 with the MSC score but yielded substantially higher validity coefficients than the latter (see Table V). The multiple and partial correlations further illustrate the superiority of the commercial composite. This superiority is most probably due to the greater diversity of aptitudes and abilities assessed with the experimental battery.
Range and Distribution of Training 0 onrse Grades
The bar diagrams of Figure 1 reflect the range and distribution of the training-course grades (i.e., the overall "A + L" grades) of the FAA, Army, Air Force, Navy and Marine ATC trainees. It may be noted that the means, medians, and .-ariances of the criterion Yariable are remarkably similar for the two groups trained at Keesler AFB. Although the distributions pertaining to the Navy and Marines appear to be much alike, the differences between the means and Yariances of the two groups proved to be statistically significant. However, even greater differences characterized the two FAA samples. In fact, the distribution of grades for Sample 1 resembles those of the Army and Air Force trainees much more than that of Sample 2, and the latter is more like that obtained for the Navy trainees.
It is difficult to ascertain ' the reasons for such disparities. It is improbable that the trainingperformance evaluation standards were entirely uniform from facility to facility but the differences between the FAA samples, and between
15
ATC Course
~
90
8>
80
70
"
60
Sampl e Type N o f Cases Mean Gr ade SO of Gr ades
1 2 FAA FAA 211 18 3
85.0 80.0 >.6 7 . 9
...
Ked ian
.,
3 4 ' 6 A< my USAF Navy Mar ines
169 169 623 312 86 .8 87.1 79. 3 80.7 4.4 4.> 8 .3 6. 8
F IG<:RE 1. ComparatiYe Itanges and Distributions of ATC Training Course Grades for FAA, Army, Air Force, Na vy and l\farine Corps ATC Trainees.
the Glynco groups, provide the basis for suspecting that other factors might have been involved. Nonetheless, the differences do not necessarily imply a lack of reliability in the criterion measure. The differential levels of performance, in terms of the most reliable criteria, may have stemmed from possible differences in the instructional materials, lectures, or laboratory problems presented to the various groups. Policies affecting motivation may have varied and it is also possible that the groups were unequal in terms of learning capacity.
Predicti ve Effectiveness of E xperimentril7-Test Composite V enns Each 11/SO Index
The effectiveness with which the Composite 7-Test Scores might be used to forecast performance in the military ATC training courses is illustrated in Figure 2. In deriving the data reflected in the four graphs, a frequency distribution was first prepared of the "Overall Training Grades for the combined Army and Air Force groups. Those cases comprising the approximate lower one-fifth (22.1 per cent) of the distribution were designated as "Marginal-Pass

50
40
30
20
10
100
80
60
40
20
• Sample 3
Marginal-Pan and/or Fail Cases
Army ATC Trainees N - 169
24
2149 2150 2350 2550 2750 2950 3150 3350 3550 6. < -2349 -2549-2749 -2949-3149 -3349 -3549 6. >
Score on Experimentally-Administered Battery of Seven Commercially-Published Teats
Sample 5 Navy ATC Trainees N - 628
92
61
80 76
62
2150 2350 2550 2750 2950 3150 3350 3550 6. < -2349 -2550-2749-2949 -3149 -3349 -3549 6. >
Score on Experimentally-Administered Battery of Seven Commercially-Published Tests
D Ss in Upper Four-Fifths of Distribution of Military ATC Training-Course Grades
Sample 4 Air Force ATC Trainees N - 169
2149 2150 2350 2550
36
23
15
6. < -2349 -2549 -2749 -2949 -3149-3349 -3549 6. > Score on Experimentally-Administered
Battery of Seven Commercially-Published Testa
Sample 6 Marine Corps ATC Traine~s N - 313
62
40
2
2149 2150 2350 2550 2750 2950 3150 3350 3550 6. < -2349 -2549 -2749 -2949 -3149-3349 -3549 6. >
Score on Experimentally-Administered Batt~ry of Seven Commercially-Published Testa
FIGURE 2. Potential of Commercial 7-Test Composite Score for Prediction of ATC-Training-Course Performance of U.S. Army and Air Force Students at Keesler AFB and of Navy and Marine Corps ATC Trainees at the Glynco NAS ATC School.
and/or Fail" and all others as representing the "upper four-fifths". Similarly, the groups trained at the Glynco facility were merged and all cases not represented in the upper 80 per cent of the distribution were appropriately designated either as "Fails" or as "Marginal Passes". The Composite 7-Test Scores were then plotted for the dichotomized groups and coarse grouping procedures were subsequently applied to obtain the data shown in Figure 2 for each of che samples.
An examination of Figure 2 will reveal that the "Marginal-Pass or Fail" subjects in Samples 3, 4, and 5 tended to experience considerably more difficulty with the experimental battery than did those who performed more satisfactorily in the training course. Although less accentuated, a similar trend characterized Sample 6. In other words, each graph suggests that tests such as represented in the experimental battery could have been used to improve substantially
16
the selection process. For example, approximately 40 to 50 per cent of the "Marginal-Pass or Fail" subjects in Samples 3, 4, and 5 failed to attain a composite score of at least 2550 on the experimental battery, whereas only 14 to 18 per cent of the upper-category students were unable to do so. Similarly, about 20 per cent of the Marines who failed or performed marginally in training scored less than 2550 on the battery, compared to 3.4 per cent of all other trainees in the sample.
However, any recommendation concerning the possible use of such tests for operational purposes would be contingent upon the degree to which the screening potential of each existing MSC aptitude test measure is being realized. Results bearing upon this issue are presented in Figure 3. In reviewing the results, it should first be noted that most of the Army, Navy, and Air Force students who marginally passed or failed their ATC course also tended to have low-to-moderate

50
40
30
20
LO
100
80
60
40
20
• S&IIPl• 3
Maraioal-Pau and/or Fail Caaea
ArwJ ATC Trainee• N - 169
Arrq MSC "Vff." Score
Suple 5 102 Navy ATC Traineaa N - 626 85 84
61
104 10 5 110 115 120 12 5 130 13 5 140 & < -109 -114 -119 -124 -129 -134 -139 6 >
Navy "GCTff.lll" Score
0 Sa in Upper Four-Fifthe of Diatribution of Military ATC Trainina-C~•• Gradea
S~le 4 Air Force ATC Trainee& N - 169
23
6<
36
Air Force ACB ''General" Aptitude Index
5&1111'1• 6 Marine Corpa ATC Trainee• N - 259
1 1 1
76
43
6>
104 105 110 115 120 125 130 135 140 6 < -109 -114 -119 -124 -129 -134 -139 & >
Marine Corpa "1/3(Ail+PIMVA)" Score
FIGURE 3. Comparison of Military-Screening-and-Classification (MSC) Scores of the U.S. Army, Air Force, Navy and Marine Corps as Predictors of Military ATC-Training-Course Performance.
MSC scores. In contrast, the data for Marines fail to reflect any significant relationship in this respect. For each sample except the latter, however, there is evidence indicating that the screening potential of the respective MSC aptitude measure has not been fully realized.
Adherence to the recommended standards (i.e., MSC scores of 110 for the Army and Navy and 65 for the Air Force) would have precluded selection of significant proportions of those who failed or performed rather poorly in training. Even greater effectiveness, however, could have been achieved by the Army and Navy if circumstances had permitted the adoption of, and adherence to, slightly higher selection standards. For example, within the Army group, 15 (38.4 per cent) of the 39 students who failed or marginally passed training possessed MSC scores of less than 115 compared to only 18 (13.8 per cent) of the 130 non-marginal students. A similar screening score by the Navy would have precluded the entry of 80 ( 57.6 per cent) of the
17
139 students who performed rather poorly in training and 118 (24.2 per cent) of the remaining 487. The Air Force deviated from its normal selection standard in the selection of 25 men who had MSC-GI scores of less than 65. Twelve of the 25 either failed or marginally passed the Keesler training course. The 12 represented exactly one-third of the lower performance group whereas the 13 represented only 9.8 per cent of those in the upper four-fifths of the grade distribution.
Virtually all of the Marines possessed MSC Scores of 110 or better and they tended to achieve somewhat higher training grades than their Navy classmates. Only 16.2 per cent of the Marines either failed or completed the course with only marginally-passing grades and almost half of these were men with MSC Scores of less than 125. It should also be noted that the MSC Scores are rather normally distributed. This finding warrants dismissal of the speculation that the difficulty index of the Marine Corps'

'
C~r. 7-Teet Cc:..,oeite Score
3600
3400
3200
3000
2800
2600
2400
2200
2000
1800
1600
Sa~~p1e
Type N Cases
-. --. -. -. -. -. -. -. -. -. -. -
Mean 7-Test Score SD of 7-Test Sc.
FIGURE 4. Comparative Ranges
Pgo
P75
f- Median
p25
~ '-' ~
~ P1o
Po2
1 3 4 5 6 PAA Army USAP Navy Marines 212 169 169 642 317
2710.9 2881.2 2842.1 2859.2 3163.7 503.0 425.8 444 . 5 442 . 5 382.1
and Distributions of Commercial 7-Test Composite Scores for FAA, Army, Air Force, Navy and Marine Corps ATC Trainees.
18

aptitude-assessment battery may have been too low.
On the basis of the data presented in Figures 2 and 3, it would seem that any effort by the Army, Air Force, Navy, or Marine Corps to improve the aptitude screening of personnel for ATC training might first be focused upon the effective utilization of the MSC scores. Only then 3hould additional tests, such as represented in the experimental battery, be considered for secondary screening purposes. However, the efficacy of any selection program-regardless of its nature and scope-will depend upon the appropriateness of the levels at which the screening standards are established and the degree to which circumstances permit adherence to those standards.
Relative Aptitude Levels of Diffe?'ent Samples The range and distribution of Commercial
7-Test Composite Scores for each military group and FAA Sample 1 are presented in Figure 4. (Sample 2 was administered only four of the seven commercial tests.) In comparing the aptitude levels of the various groups, the Army, Air Force, and Navy trainees were found to be relatively homogeneous; all differences between the means and variances of these groups were nonsignificant. Most of the Marines attained high scores on the experimental battery. In fact, the mean for this group was significantly higher than that obtained for any other.
Inasmuch as the majority of the Marines were selected from high MSC-score categories, it was expected that they would also tend to perform quite well on the experimental battery. However, there was no basis for anticipating that the mean commercial composite score of every military group would significantly exceed that of FAA Sample 1. Although recruited in 1960 and 1961, most of these FAA trainees were selected from among those applicants with experience as military controllers, and it was therefore assumed that they also represented a rather select group insofar as certain aptitudes were concerned. The finding that these former FAA TATC trainees had lower aptitude scores than the entrants into the military ATC training schools indicates that the screening of military personnel for ATC training had substantially improved during the intervening period.
19
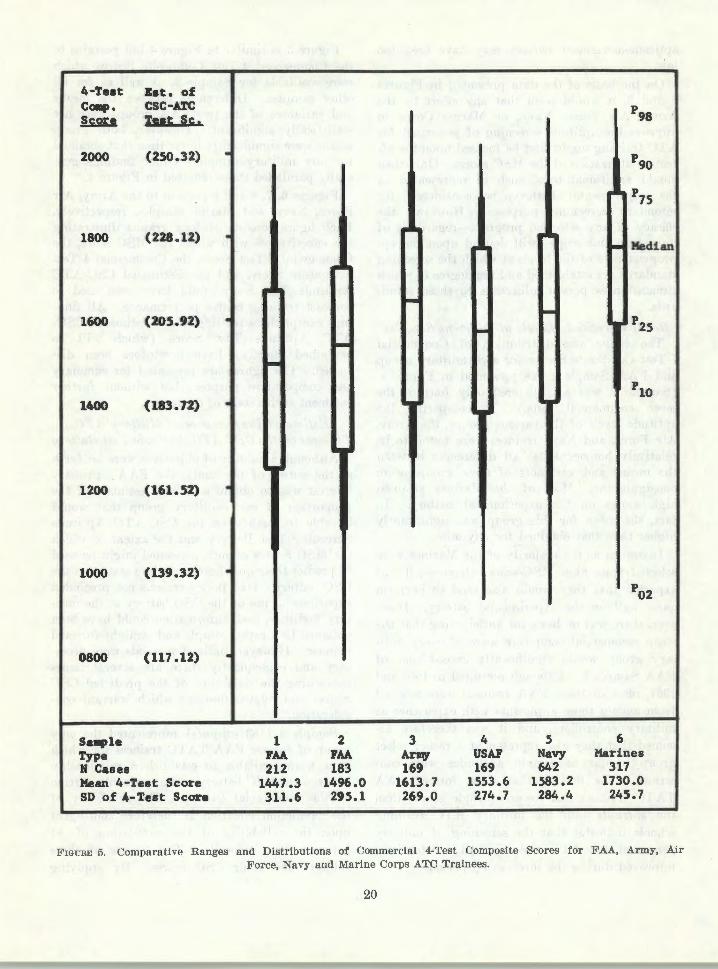
Figure 5 is similar to Figure 4 but pertains to the Commercial 4-Test Composite Scores which were available for Sample 2, as well as for all other samples. Differences between the means and variances of the two FAA groups were not statistically significant. However, both group means were significantly lower than that obtained for any military sample. Other findings generally paralleled those reflected in Figure 4.
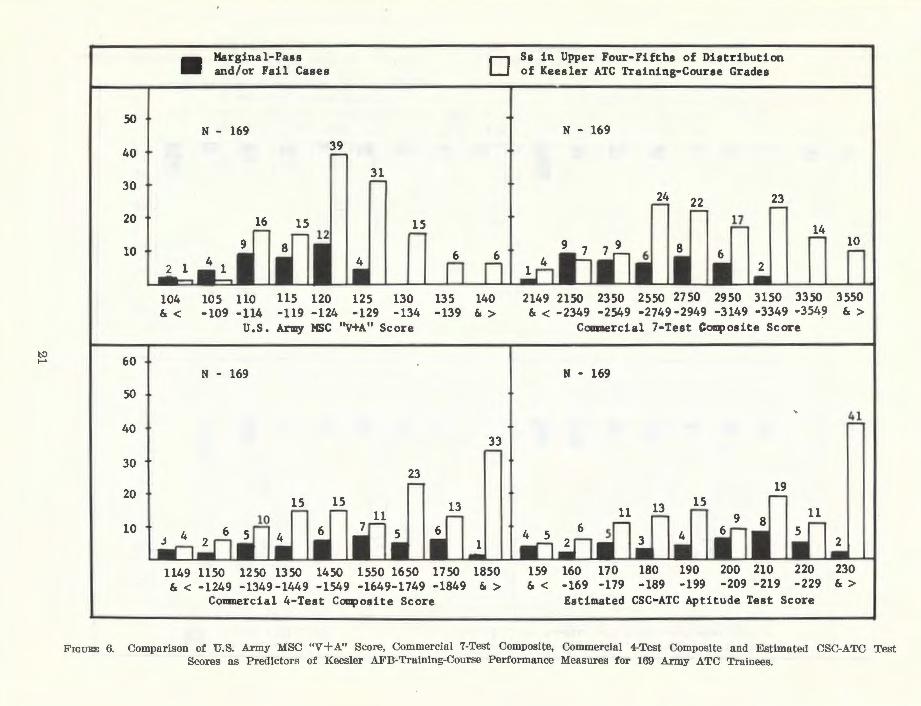
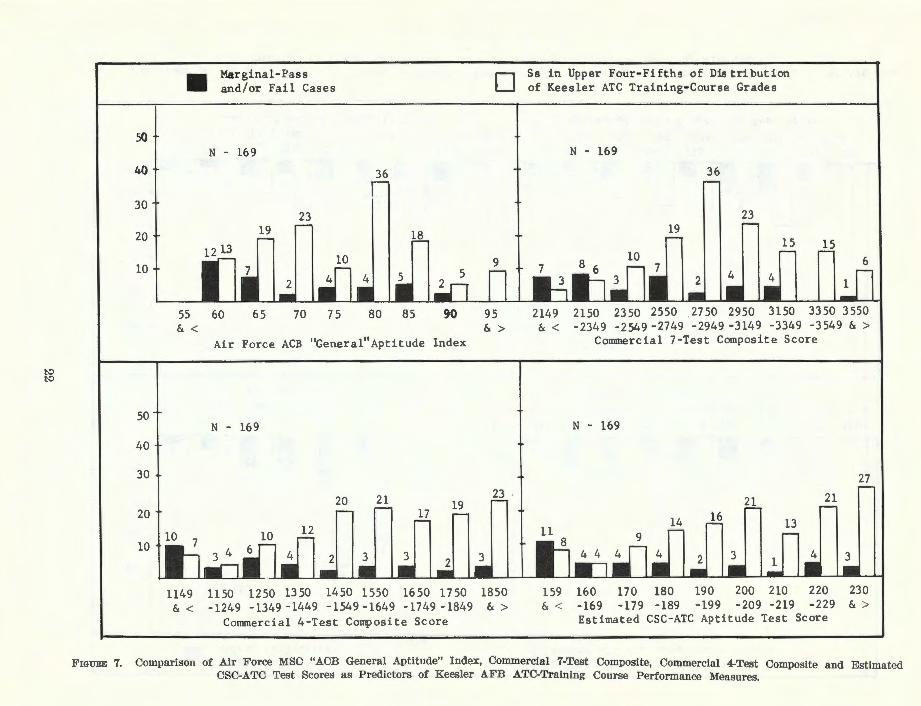
Figures 6, 7, 8 and 9 pertain to the Army, Air Force, Navy, and Marine samples, respectively. Each figure consists of four graphs illustrating the effectiveness with which the MSC score, the Commercial 7-Test Score, the Commercial 4-Test Composite Score, and the Estimated CSC-ATC Aptitude Test Score could have been used to forecast training course performance. All findings except those relating to the Estimated CSCATC Aptitude Test Score (which will be explained shortly) have heretofore been discussed. The figures are presented for summary and comparative purposes but without further comment at this stage of the report.
Estimated Performance of Military ATO Trainees on the OSO ATO Aptitude Test Battery
Although a number of objectives were set forth at the outset of the study, the FAA's primary interest was to obtain a reliable estimate of the proportion of each military group that would be able to qualify on the CSC-ATC Aptitude Screening Test Battery and the extent to which the MSC Scores of such personnel might be used to predict their qualification-failure status on the CSC battery. Had policy reasons not precluded experimental use of the esc battery at the military facilities, such information could have been obtained in a rather simple and straight-forward manner. However, indirect methods were necessary and consequently there are several issues concerning the reliability of the predicted esc Scores and related findings which warrant consideration.
Sample 2 (183 subjects) represented the only group of former FAA TATC trainees for which data were available to establish a relationship between the esc battery and any sizable portion of the commercial battery. The reliability of the prediction equation is therefore contingent upon the reliability of the correlation of .81 between the Composite 4-Test Scores of these subjects and their CSC scores. By applying
4-Teat Bat. of Ca.p. CSC-ATC p98 !s.2n Tett Sc.
2000 (250.32) . p90
p75 '
1800 (228.12) . t- Median
I I
~ 1- I
1600 ( 205.92) . I 1-
p25
~ i
I I-
' I
plO I I I
1400 (183 .• 7~) .. \
1200 (161.52) .
1000 (139.32) . P02
0800 (117 .12) .
Sall!p1e 1 2 3 4 5 6 Type PM PM Army USAF Navy Marines N Cases 212 183 169 169 642 317 Mean 4-Test Score 1447.3 1496.0 1613 . 7 1553.6 1583.2 1730.0 SD of 4-Test Score 311.6 295.1 269.0 274.7 284.4 245.7
FIGC:RE 5. Comparative Ranges and Distribu tions of Commercial 4-'L'est Composite Scores for FAA, Army, Air For ce, Navy and Marine Corps ATC Trainees.
20
to t-' I
50
40
30
20
10
6o I 50
40
30
20
10
• Marginal-Pass and/or Fail Cases
N - 169 39
16 15
104 105 110 115 120 &< -109 -114 -119 -124
31
15
125 130 -129 -134
U.S. Army MSC "V+A" Score
N - 169
23 ..-
D
135 140 -139 &>
I
I 33 rl
Sa in Upper Four-Fifths of Distribution of Keesler ATC Training-Course Grades
N - 169
24
2149 2150 2350 2550 27 50 2950 3150
14
3350 & < -2349 -2549 -2749-2949 -3149 -3349 ·3549
Commercial 7-Test Composite Score
N - 169
~
10
3550 &>
41
l~.;.rl· I~ Ill II Ill I• 1..:1 II ill~· liJ li Ill Ill Ill 1.; 1149 1150 1250 1350 1450 1550 1650 1750 1850 159 160 170 180 190 200 210 220 230 & < -1249 -1349-1449 -1549 -1649-1749 -1849 &> &< -169 -179 -189 -199 -209 -219 -229 &>
Commercial 4-Test Composite Score Estimated CSC•ATC Aptitude Test Score
FIGURE 6. Comparison of U.S. Army MSC "V +A" Score, Commercial 7-Test Composite, Commercial 4-Test Composite and Estimated CSC-ATC Test Scores as Predictors of Keesler AFB-Training-Course Performance Measures for 169 Army ATC Trainees.
to to
50
I 40
30
I 20
10
so
40
30
20
10
• Marginal-Pass and/or Fail Cases
N - 169
23 10 r-
55 60 65 70 75 & <
36
80 85 90
Air Force ACB "General" Aptitude Index
N - 169
D
95 & >
23
1149 1150 1250 1350 1450 1550 1650 1750 1850 & < -1249 -1349-1449 -1549-1649 -1749 -1849 & >
Commercial 4-Test Composite Score
Ss in Upper Four-Fifths of Dis tri but ion of Keesler ATC Training-Course Grades
N - 169
36
23
2149 2150 2350 2550 27 so 2950 3150 3350 3550 & < -2349 -2549 -2749 -2949 -3149 -3349 -3549 & >
Commercial 7-Test Composite Score
N - 169
159 160 & < -169
170 180 -179 -189
190 -199
200 210 -209 -219
27
220 230 -229 & >
Estimated CSC-ATC Aptitude Test Score
FIGURE 7. Comparison of Air Force MSC "ACB General Aptitude" Index, Commercial 7-Test Composite, Commercial 4-Test Composite and Estimated CSC-ATC Test Scores as Predictors of Keesler A.FB ATC-Training Course Performance Measures.
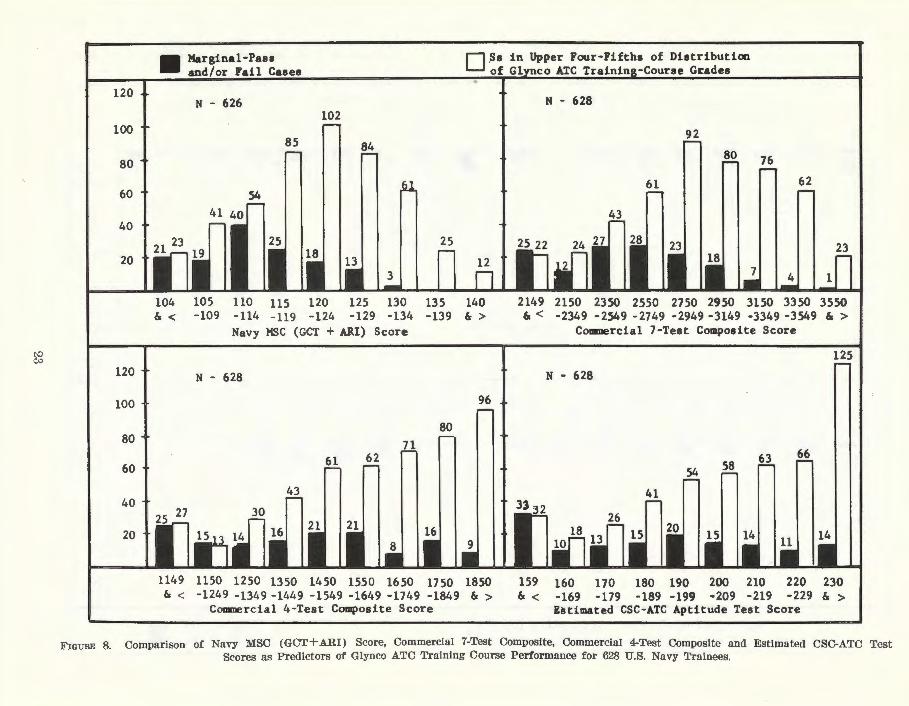
t-0 C>!>
120
100
80
60
40
20
120
100
80
60
40
20
• Marginal-Pass Fail Cases
E:)$s in Upper Four-Fifths of Distribution of Glvnco ATC Trainina-Course G~ades
N - 626 102
85 84
54
25
104 105 110 115 120 125 130 135 ls < -109 -114 -119 -124 -129 -134 -139 & >
Navy MSC (GCT + ARI) Score -N - 628
96 r
80
62
1149 1150 1250 1350 1450 1550 1650 1750 1850 & < -1249 -1349 -1449 -1549 -1649 -1749 -1849 & >
Commercial 4-Test Composite Score
N - 628
92
76
61 62
2150 2350 2550 2750 2950 3150 3350 3550 ls < -2349 -2549 -2749 -2949 -3149 -3349 -3549
Commercial 7-Test Composite Score
N - 628
159 160 170 180 190 200 210 220 230 ls < -169 -179 -189 -199 -209 -219 -229 ls >
Estimated CSC-ATC Aptitude Test Score
FIGURE 8. Comparison of Navy MSC (GCT+ ARI) Score, Commercial 7-Test Composite, Commercial 4-Test Composite and Estimated CSC-ATC Test Scores as Predictors of Glynco ATC Training Course Performance for 628 U.S. Navy Trainees.

to H"-
80
60
40
20
120
I I 100
80
60 l 40
20
• Marginal-Pass and/or Fail Cases
N - 259
1
D
76
104 105 110 115 120 125 130 135 140 & < -109 -114 -119 -124 -129 -134 -139 & >
Marine Corps MSC "1/3 (AR+PE+VA)" Score
N - 313 100
51 40 ':1"7 r
1149 1150 1250 1350 1450 1550 1650 1750 1850 & < -1249 -1349 -1449-1549 -1649 -1749 -1849 & >
Commercial 4-Test Composite Score
I
Ss in Upper Four-Fifths of Distribution of Glynco ATC Training-Course Grades
N - 313
54 62
2149. 2150 2350 2550 2750 2950 3150 3350 3550 & < -2349 -2549 -2749 -2949 -3149 -3349 -3549 & >
Commercial 7-Test Composite Score
N - 313
159 160 & < -169
170 -179
180 190 200 -189 -199 -209
210 -219
220 230 -229 & >
Estimated CSC-ATC Aptitude Test Score
FIGURE 9. Comparison of Marine Corps MSC "lh (AR+PE+VA)" Score, Commercial 7-Test Composite, Commercial 4-Test Composite and Estimated CSC-ATC Test Scores as Predictors of Glynco NAS Training Course Performance for Marine Corps ATC Trainees.
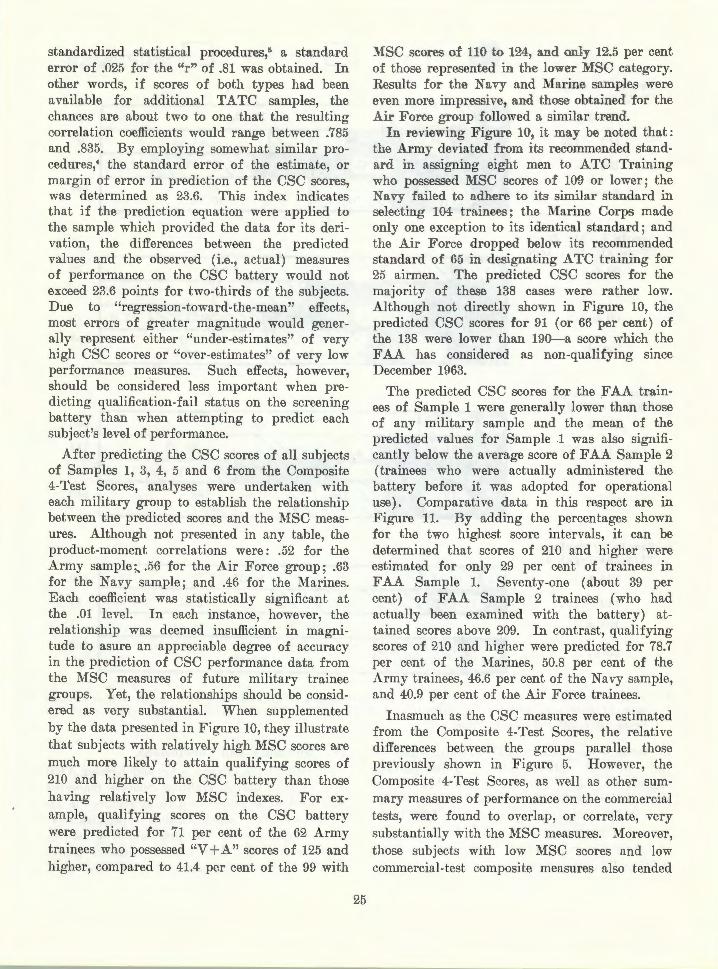
standardized statistical procedures,5 a standard error of .025 for the "r" of .81 was obtained. In other words, if scores of both types had been available for additional TATC samples, the chances are about two to one that the resulting correlation coefficients would range between .785 and .835. By employing somewhat similar procedures,4 the standard error of the estimate, or margin of error in prediction of the esc scores, was determined as 23.6. This index indicates that if the prediction equation were applied to the sample which provided the data for its derivation, the differences between the predicted values and the observed (i.e., actual) measures of performance on the esc battery would not exceed 23.6 points for two-thirds of the subjects. Due to "regression-toward-the-mean" effects, most errors of greater magnitude would generally represent either "under-estimates" of very high esc scores or "over-estimates" of very low performance measures. Such effects, however, should be considered less important when predicting qualification-fail status on the screening battery than when attempting to predict each subject's level of performance.
After predicting the CSC scores of all subjects of Samples 1, 3, 4, 5 and 6 from the Composite 4-Test Scores, analyses were undertaken with each military group to establish the relationship between the predicted scores and the MSC measures. Although not presented in any table, the product-moment correlations were: .52 for the Army sample;, .56 for the Air Force group; .63 for the Navy sample; and .46 for the Marines. Each coefficient was statistically significant at the .01 level. In each instance, however, the relationship was deemed insufficient in magnitude to asure an appreciable degree of accuracy in the prediction of esc performance data from the MSC measures of future military trainee groups. Yet, the relationships should be considered as very substantial. When supplemented by the data presented in Figure 10, they illustrate that subjects with relatively high MSC scores are much more likely to attain qualifying scores of 210 and higher on the esc battery than those having relatively low MSC indexes. For example, qualifying scores on the esc battery were predicted for 71 per cent of the 62 Army trainees who possessed "V +A" scores of 125 and higher, compared to 41.4 per cent of the 99 with
25
MSC scores of 110 to 124, and only 12.5 per cent of those represented in the lower MSC category. Results for the Navy and Marine samples were even more impressive, and those obtained for the Air Force group followed a similar trend.
In reviewing Figure 10, it may be noted that: the Army deviated from its recommended standard in assigning eight men to ATC Training who possessed MSC scores of 109 or lower; the Navy failed to adhere to its similar standard in selecting 104 trainees; the Marine Corps made only one exception to its identical standard; and the Air Force dropped below its recommended standard of 65 in designating ATC training for 25 airmen. The predicted CSC scores for the majority of these 138 cases were rather low. Although not directly shown in Figure 10, the predicted esc scores for 91 (or 66 per cent) of the 138 were lower than 190-a score which the FAA has considered as non -qualifying since December 1963.
The predicted CSC scores for the FAA trainees of Sample 1 were generally lower than those of any military sample and the mean of the predicted values for Sample 1 was also significantly below the average score of FAA Sample 2 (trainees who were actually administered the battery before it was adopted for operational use). Comparative data in this respect are in Figure 11. By adding the percentages shown for the two highest score intervals, it can be determined that scores of 210 and higher were estimated for only 29 per cent of trainees in FAA Sample 1. Seventy-one (about 39 per cent) of FAA Sample 2 trainees (who had actually been examined with the battery) attained scores above 209. In contrast, qualifying scores of 210 and higher were predicted for 78.7 per cent of the Marines, 50.8 per cent of the Army trainees, 46.6 per cent of the Navy sample, and 40.9 per cent of the Air Force trainees.
Inasmuch as the CSC measures were estimated from the Composite 4-Test Scores, the relative differences between the groups parallel those previously shown in Figure 5. However, the Composite 4-Test Scores, as well as other summary measures of performance on the commercial tests, were found to overlap, or correlate, very substantially with the MSC measures. Moreover, those subjects with low MSC scores and low commercial-test composite measures also tended
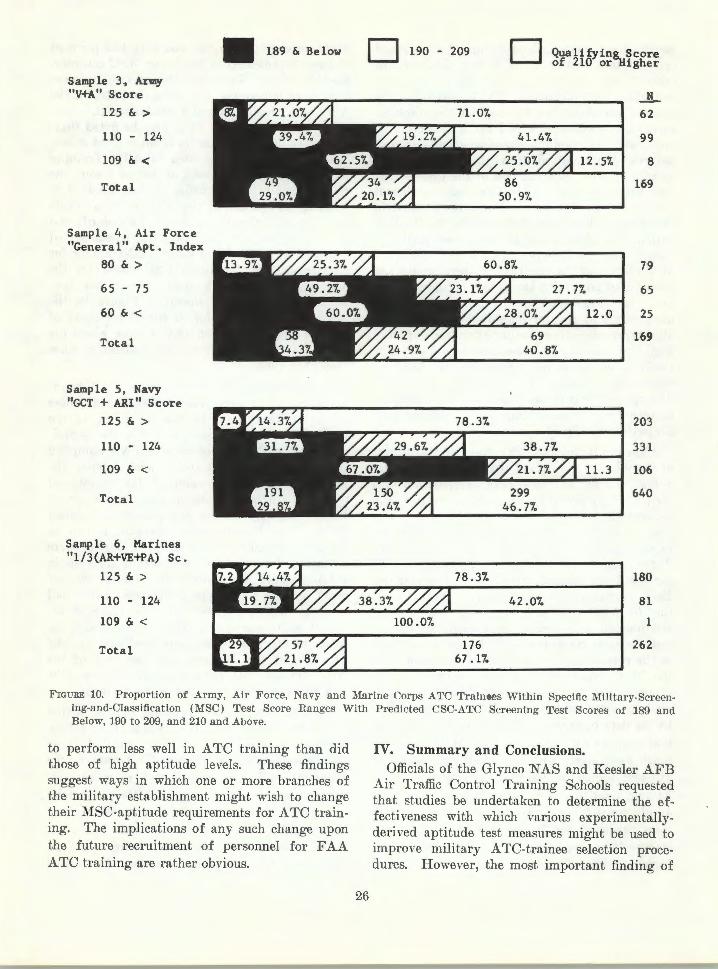
Sample 3 , Army "V+A" Score
125 & >
110 - 124
109 & <
Tota l
Samp l e 4, Ai r Force "General" Apt. Index
80 & >
65 - 75
60 & <
Total
Sample 5 , Navy " GCT + ARI" Score
125 & >
110 - 124
109 & <
Total
Sample 6, Mar i nes " l /3(AR+VE+PA) Sc .
125 & >
110 - 124
109 & <
Total
• 189 & Below 0 190 - 209
78.3'7.
176 67 . 1%
D
42 .0%
Ql.!alifying_Score of 210 orliigher
12.5%
11.3
...lL 62
99
8
169
79
65
25
169
203
331
106
640
180
81
1
262
FIGURE 10. Proportion of Army, Air Force, Navy and Marine Corps A'l'C 'l'rainaes Within Specifi c Military-Screening-and-Class ification (l\fSC) Test Score Ha nges With Predi cted CSC-ATC Screening Test Scores of 189 and Below, 190 to 209, and 210 and Above.
to perform less well in A TC training than did those of high aptitude levels. These findings suggest ways in which one or more branches of the military establishment might wish to change their MSC-aptitude requirements for ATC training. The implications of any such change upon the future recruitment of personnel for FAA ATC training are rather obvious.
26
I V. Summary and Conclusions. Officials of the Glynco N AS and Keesler AFB
Air Traffic Control Training Schools requested that studies be undertaken to determine the effectiveness with which various experimentallyderived aptitude test measures might be used to improve military ATC-trainee selection procedures. However, the most important finding of

189 & < ~ 190 - 209 ~ 210- 229 D 230&>
Sample ii and Type
Sample 1 FAA
Sample 2 FAA
Sample 3 Army
Sample 4 Air Force
Sample 5 Navy
Sample 6 Marines
134 42.8'7.
35 19.1%
43 25.47.
139 22.17.
210
183
169
169
628
313
FrGURE 11. Percentages of ATC Trainees Within Each Sample Having Actual or Predicted CSC-ATC Aptitude Screening Test Scores in Non-qualifying, Qualifying and High Ranges.
(Xote: The minimum qualifying score on the CSC-ATC Test is currently 210; 100 represents a former screening standard. The 183 FAA Ss comprising Sample 2 took both the CSC Test and four commercially-published aptitude tests. An equation, based on a correlation of .81 between the two composite measures, was used to estimate CSC Test performance for the Ss of an other samples.)
these studies was that the screening potential of existing military -screening-and -classification a ptitude-test scores could be more fully exploited to achieve that end. For reasons unknown, but perhaps due to recruiting demands, 16.5 per cent of the Navy trainees, 14.8 per cent of the Air Force subjects, about 5 per cent of the Army :mbjects, and one Marine were assigned to ATC training even though their l\fSC scores were belqw the normally-prescribed minimum (which was 110 on the different test batteries employed by the Army, Navy, and Marine Corps, and 65 in terms of the Air Force's ACB General Aptitude Index). About 42 per cent of the 138 men selected from these lower MSC-score categories
27
either failed or marginally passed their training courses compared to 18.2 per cent of the other 1085 military ATC trainees involved in the study. Moreover, other findings suggested that the recommended aptitude-screening standards could be raised by several points to increase their effectiveness. For example, MSC scores of less than 115 reflected the aptitude levels of 234 Army, Navy, and Marine trainees, and 51 airmen possessed a General Index of less than 70. Over 40 per cent of these 285 students either failed or marginally passed training whereas only 15 per cent of the remaining 938 did so.
Only two of the seven commercially-published tests which were experimentally administered at

the military ATC training schools consistently failed to correlate at statistically-significant levels with the training-performance measures of every group. Both were subtests of the California Test of Mental Maturity. One ("Analogies"), validated rather well with the Air Force group and FAA Sample 2, but only moderately with the Marines and negligibly with the remaining four samples. Scores on the other subtest ( CTMM Coins) yielded significant validities for the prediction of the Academic+ Laboratory (A+L) Grade Averages of every group but failed to correlate appreciably with the "PI" criterion measures of the Air Force trainees and the "Pass-Fail" status of the Marines. Despite those instances in which the two CTMM subtests yielded rather conservative validities, analyses revealed that composite scores based on the entire seven-test battery correlated with the A+ L Grades of every group at somewhat higher levels than any of the measures based on combinations of test scores. Yet, in every instance, the validity of the Commercial 7-Test Composite Score was closely approximated by that of a composite measure reflecting performance on DAT Space Relations, DAT Numerical Ability, DAT Abstract Reasoning, and CTMM Inference.
Composite scores of both types correlated with the training-course performance measures significantly better than did the Air Force's General Aptitude Index ("GI") and the Marine Corps' MSC score and at about the same level as the aptitude screening measures used by the Army and Navy. Despite the high degree of comparability between the validities of each experimental composite and the MSC scores of the Army and Navy subjects, the results of multiple correlational analyses indicated that the experimental measures for these trainees, as well as the Airmen and Marines, could have been used in combination with the MSC scores to attain some degree of improvement in the respective ATC selection programs. However, the benefits stemming from such a procedure would have been considerably less for the Army and Navy than for the Air Force and Marine Corps. Moreover, much of the improvement theoretically possible could have been attained through use of the MSC scores only. For example, the initial screenout, or disqualification, of every subject having either an MSC score of less than 115 or a GI under 70 would have rendered the commercial composite
28
measures virtually useless for secondary screening purposes.
It is understood that the MSC aptitude-test batteries currently used in the selection of military ATC personnel are much the same as those with which the subjects in this study were assessed. If so, an upward revision in the MSC test screening standards would, in the opinion of the author, represent a more practical approach toward improving selection procedures than would the use of additional tests. Although military classification-and-training officials must cope with the demands for high-aptitude personnel for a diversity of other specialties, the results obtained· in this study provide a sound basis for recommending that eligibility for ATC training require either an MSC score of at least 115 or a GI score no lower than 70. Should such a qualification standard be adopted, it would be advisable to undertake a number of followup studies in order to : (a) further validate the new procedure, (b) determine the appropriateness and feasibility of implementing even higher MSC aptitude-screening standards, (c) reevaluate the predictive potential of the various tests or subtests of each respective MSC battery, and (d) determine,, through multiple-regression analyses, whether the performance scores on the MSC subtests could be combined and factorweighted in a specific manner for derivation of a "special" ATC-selection index having greater validity than the conventional MSC summary scores. Succinctly, it may be concluded that tests similar to those used on an experimental basis in the present study would be of very limited value in improving the military-ATC screening process since the predictive potential of existing MSC measures, if fully exploited, could effect a substantial improvement.
Although in quest of further improving ATeselection methods, officials of the military training schools may also experience no small degree of satisfaction from the finding that both samples of FAA T A TC trainees performed at significantly lower mean levels on the experimental test battery than any military group. However, these differences are important in a number of respects. The subjects comprising each FAA sample were recruited during 1961 and 1962, prior to implementation of the CSC ATC Aptitude Screening Battery, under standards whereby an assessment of types and amounts of previous
job-related experience, particularly military ATC work, constituted the primary basis for selection. As participants in a CAMI research program aimed at developing improved selection procedures, they were administered a variety of aptitude tests, on an experimental basis only, upon entry into Academy training.
Although the batteries were purposely varied from time to time, the 183 FAA subjects designated as Sample 2 were assessed with ·a battery which included all subtests of the CSC ATC Test and four of the seven commercially-published tests subsequently chosen for validation at the Keesler and Glynco training facilities. The military subjects and the former TATC trainees of Sample 1 were experimentally examined with the entire group of seven commercial tests but were administered no part of the esc battery. However, a correlation of .81 between the Commercial 4-Test Composite Scores and the CSC ATC Test Scores of subjects in Sample 2 provided the basis for development of an equation which permitted the estimation of performance scores on the esc battery for all other subjects (from their Commercial 4-Test Composite Scor~s).
Only 71 of the 183 TATC trainees who were experimentally examined with the CSC ATC Test attained scores of 210 or higher. Had the CSC Test already been operational, only 38.8 per cent would have entered into training. Based on CSC Test performance measures predicted from their Commercial 4-Test Scores, only 29 per cent of the FAA subjects comprising Sample 1 would have been accepted for training. In contrast, it was estimated that 50.8 per cent of the Army trainees, 40.9 per cent of the Air Force subjects, 46.7 per cent of the Navy students, and 68.7 per cent of the Marines involved in the survey would pass the screening test with scores of 210 and higher. Inasmuch as the vast majority of the FAA subjects of both samples qualified for appointment to civilian-ATC training on the basis of their past experience in military air traffic control, the finding of such differences between the aptitude levels of the FAA and military groups suggests two general conclusions: (1) one or more of the older (pre-
29
1960) MSC programs (from which the men who subsequently entered the FAA were originally selected for military ATC training) must have used selection criteria or standards considerably different from those presently used, and (2) that significant improvements in the MSC methods or standards had been initiated by the time the Keesler and Glynco students who participated in the present study were selectively assigned to military ATC training.
On the basis of the results obtained in this investigation, the Army, Navy, Air Force, and MariJ:ie Corps have the capability, if desired or required, of upgrading their screening of ATC personnel without new or additional tests, by establishing higher minimum MSC requirements. Any changes in the military requirements will be of direct interest to the FAA since the agency will probably continue to select the majority of its controller trainees from among those applicants who have pre-FAA air traffic control experience and who also are able to qualify on an ATC-aptitude-test screening battery. At the present time, 210 is the minimum passing score on the FAA CSC-ATC Aptitude Screening Battery. Such a screening standard (roughly equivalent to an MSC of 125 ·and a General Index between 75 and 80) reflects a high degree of selectivity, such that numerous unpublished studies by CAMI have demonstrated that a downward revision in the aptitude-test screening standard of 10 to 15 score points (but no more than 20) is feasible and should be considered if the recruitment of personnel for FAA training ever reaches a critical stage. On the basis of the results obtained in this study and those of previous investigations, it seems reasonable to predict that approximately one-half of the military trainees selected under recent military ATC selection standards would be able to meet current FAA aptitude screening requirements; only about one-third of the FAA's applicant population prior to 1964 would have been able to do so. Moreover, if military cutoff scores are raised, for a;ny reason, from present levels to MSC scores of 115 and to General Index Scores of 70, approximately two-thirds of the military controllers who qualify at those levels will qualify on the FAA's aptitude screening battery.

20426
REFERENCES 1. Cobb, B. B.: A Comparative Study of Air Traffic
Trainee Aptitude-Test Measures Involving Navy, Marine Corps ood FAA Controllers. FAA Office of Aviation Medicine Report No. AM--68-14, 1968.
2. Cobb, B. B. : Problems in Air Traffic Management: II. Prediction of Success in Air Traffic Controller School Civil A€romedical Research Institute R.eport No. 62-.2., FAA, Oklahoma City, Oklahoma, 1962.
3. Cobb, B. B.: Problems in Air Traffic Management. V. Identification and Potential of Aptitude Test Measures for Selection of Tower Air Traffic Controller
30
Trainees. Civil Aeromedical Research Institute Report No. Al\f-65-19, FAA, Oklahoma City, Oklahoma, 1965.
4. Trites, D . K., and B. B. Cobb: CARl Research on Air Traffic Control Specialists: Age, Aptitude, and Experience as Predictors of Performance. Civil Aeromedical Reseal'ch Institute, Unnumbered Report, FAA, Oklahoma City, Oklahoma, 1964.
5. Guilford, J. P. : Fundamental Statistics in Psycholiogy and Education, York, Pennsylvania, Maple Press Company, 1956.