Embed Size (px)
Citation preview

Air-sea Gas Exchange and Bio-surfactants:
Low and High Wind Speed Extremes
A. Soloviev
in collaboration with
M. McGauley, S. Matt, M.Shivji, A. Tartar, N. Kurata, K. Vella, W. Perrie
B. Haus, D. Ortiz-Suslow, N. Laxague, A. Fujimura, B. Hamilton
Air-Sea Gas Flux Workshop
IFREMER, Brest, France, 24 September 2013

Outline
1. Low winds
- simulation of surfactant effects with CFD
- microlayer and surfactant associated bacteria
- sampling and DNA analysis of bacteria
2. Strong winds
- simulation of air-sea interface with CFD VOF
- direct disruption of the air-sea interface
- anticipated effect of surfactants
3. Conclusions
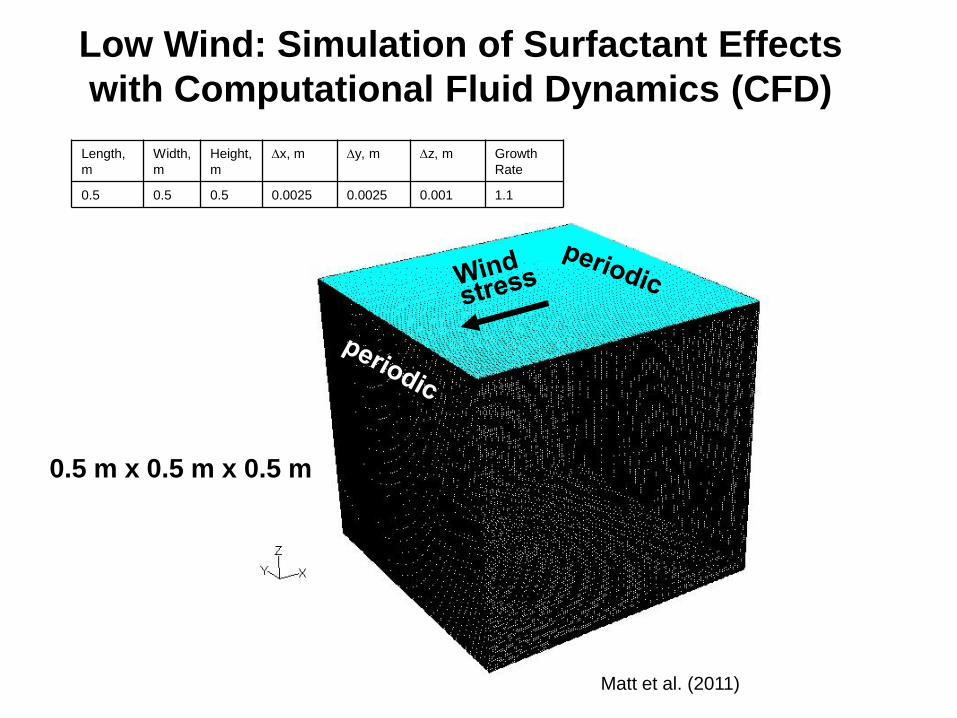
0.5 m x 0.5 m x 0.5 m
Low Wind: Simulation of Surfactant Effects
with Computational Fluid Dynamics (CFD)
Matt et al. (2011)
Length,
m
Width,
m
Height,
m
Dx, m Dy, m Dz, m Growth
Rate
0.5 0.5 0.5 0.0025 0.0025 0.001 1.1

Elastic Boundary Condition
/ / / /x wind C C x T T x
/ / / /y C C y T T y
– surface tension
C – surfactant concentration
T – water surface temperature
Surfactant Marangoni
stress Temperature Marangoni stress
Wind stress

No Surfactant - Top view: U at top (z = 0 cm)

With Surfactant - Top view: U at top (z = 0 cm)

z
y
x
convergence, accumulation of surfactants
divergence, less surfactants
film stress
Ux
Surfactants suppress coherent streaks and
turbulence in the near-surface layer of the ocean

CFD Model Validation at UM RSMAS ASIST Tank
Average velocity profiles (DPIV) from lab
experiment at ASIST
Average velocity profiles from CFD Fluent with
visco-elastic surface boundary condition
wind wind
Soloviev, Matt, Gilman, Hühnerfuss, Haus, Jeong,
Savelyev, and Donelan (2011)

CFD Simulation: Gas Concentration
Gas concentration (technical units)
CFD model:
Nighttime,
U10 = 4 ms-1
Sc = 10
In the presence of surfactant, gas transfer velocity reduced approximately by a factor of 2

Sea Surface Microlayer and Surfactants
Cunliffe et al. (2011)

Sampling of Bacteria in Sea Surface Microlayer
Sampling technique for the
sea surface microlayer
Sampling technique for
the subsurface water

Sampling of the sea surface microlayer bacteria
Microbial cells in the sea surface microlayer attach to the
membrane filter due to surface tension.

Sampling in and outside a slick RADARSAT 2
Photographic image of a slick in the
Straits of Florida.
Sampling locations in synthetic
aperture radar image (RADSRSAT 2).
Courtesy of Will Perrie.

Relative abundance of potential surfactant-associated genera in the sea surface microlayer and subsurface water. Sampling in slick and non-slick areas are shown on the synthetic aperture radar (SAR) image in previous slide. (After Kurata et al., 2013.)
Surfactant associated bacteria in and outside slick (DNA analysis)

Numerical Simulations
• In order to demonstrate the possibility of the direct disruption of
the air-sea interface under hurricane conditions, we used an
idealized 3D VOF-LES model set-up.
• A series of numerical experiments has been conducted using the
computational fluid dynamics software ANSYS/Fluent.
• Wind stress was applied at the upper boundary of the air layer,
ranging from no wind stress to hurricane force wind stress.

3D Simulation of Air-Water Interface in Hurricane Conditions: Volume Fraction –Side View
Fluent: VOF LES WALE. Domain size: 1 m X 0.5 m X 0.3 m
Wind stress 4 N m-2 (U10 =40 m/s)

Air-water interface under hurricane
force wind
The numerical experiment with an initially flat interface
illustrates the possibility of the direct disruption of the air-
water interface due to the KH type instability and formation of
the two-phase environment under hurricane force winds.
Elapsed time = 2 s
10
cm
Wind stress 4 N m-2 (U10 =50 m/s)
Soloviev, Fujimura, and
Matt (JGR, 2012)

“Projections” from the air-water interface initiate production of large spray particles in strong winds
T=2.00s
T=1.98 s
T=1.99 s
20 c
m
VOF-LES model

Large droplets production by breakdown of small “projections”
Kelvin-Helmholtz instability is a suitable model
for spray generation in strong winds
Lab experiment at ASIST in collaboration with Brian Haus, Dave Ortiz-Suslow,
Nathan Laxague
U10 = 40 ms-1
3 mm

Foam streaks on the sea surface in hurricane conditions can be a result of KH instability at the air-sea Interface
(a) Wind speed 28 m s-1
(b) Wind speed 46 m s-1
Black et al. (2006)
The white cap coverage increases
with wind though at very high wind
speeds remains at a constant 4%
level, while the foam streak
coverage increases toward full
saturation (Holthuijsen et al. 2012).
Holthuijsen et al
2012)

Kelvin-Helmholtz Instability in the Presence of Surfactant
3 mm
U10 = 40 ms-1
Lab experiment at ASIST in collaboration with Brian Haus,
Dave Ortiz-Suslow, Nathan Laxague, and Bryan Hamilton

Conclusions
• Under low winds, numerical simulations demonstrate significant decrease of the interfacial gas transfer velocity in the presence of surfactant
• Surfactant producing or degrading bacteria can be associated with surfactants. An improved method has been developed for sampling bacterial content of the sea surface microlayer using next generation sequencing (454 FLX GS) analysis
• Surfactants can be an important factor even under very high wind-speed conditions and should eventually be included in parameterizations for production of marine aerosols and air-sea gas exchange

Acknowledgements
This work has been supported by the NOPP project
“Advanced coupled atmosphere-wave-ocean modeling for
improving tropical cyclone prediction models” (PIs: Isaac
Ginis, URI and Shuyi Chen, UM) and by the Gulf of Mexico
Research Initiative (GoMRI) Consortium for Advanced
Research on the Transport of Hydrocarbons in the
Environment (PI: Tamay Özgökmen, UM).


Work in Progress

Model Verification with Lab Data - UM RSMAS
ASIST Facility (details in presentation by Prof.
Brian Haus)

Air-Water Interface: Numerical Simulation


Air-Oil Interface: Numerical Simulation

“Bumps” on the air-oil interface


Strong winds: Direct Disruption of the Air-Sea Interface?
• Air-sea interaction dramatically changes from moderate to very
high wind speed conditions (Donelan et al. 2004)
• We pursue the hypothesis that regime of the air-sea interaction
under very high wind speeds is associated with direct disruption
of the air-sea interface
• The disruption can be realized through the Kelvin-Helmholtz
(KH) type shear-layer instability

Local Perturbation of the KH Instability
P P P Ps
sl
+ -D = - > µ 2
aP P P Ur
+ -D = - µ
Acceleration of the air stream above a short wave induces a pressure drop:
The instability breaks up the interface if DP exceeds the combined restoring force of gravity and surface tension:
Hoepffner, Blumenthal, and Zaleski (2011)
s the surface tension, k the wavelength.
DP = P+- P- = ra U2 k L .
DP > (rwg + s k2)L ,
ra
rw

CFD Simulation: Temperature
Qo = -100 Wm-2
In the presence of surfactant, DT changed
from -0.15 K to -0.3 K
CFD model:
Nighttime,
U10 = 4 ms-1
Sc = 10

1. Following Cunliffe, Upstill-Goddard and Murrell (2011), we have implemented DNA analysis for characterizing sea surface bacterioneuston.
2. Genomic DNA of the bacterial samples was extracted directly from the filter membranes (stored in -80oC freezer)
3. The 16S ribosomal RNA gene was amplified with universal 16 rRNA primers 27F and1492R (Lane, 1991)
4. Nested PCR was performed using the barcoded universal primers.
5. To obtain statistically robust data sets, next generation sequencing (454 FLX GS) was utilized.
6. Taxonomic composition analysis using the Quantitative Insights Into Microbial Ecology software (QIIME)
Characterization of Microbial DNA

Air-Water Interface with Imposed Waves Under Hurricane Force Wind
Wind stress 4 N m-2
The numerical experiment with imposed short wavelets
demonstrates the tearing of wave crests, formation
of water sheets and spume ejected into the air.
Elapsed time = 0.5 s
Soloviev, Fujimura,
and Matt (JGR, 2012)

Merci beaucoup!