Embed Size (px)
Citation preview

UK plan for tackling roadside nitrogen dioxide concentrations Detailed plan July 2017

© Crown copyright 2017
You may re-use this information (excluding logos) free of charge in any format or medium, under the terms of the Open Government Licence v.3. To view this licence visit www.nationalarchives.gov.uk/doc/open-government-licence/version/3/ or email [email protected]
This publication is available at www.gov.uk/government/publications
Any enquiries regarding this publication should be sent to us at
Joint Air Quality Unit Area 2C Nobel House 17 Smith Square London SW1P 3JR Email: [email protected]
www.gov.uk/defra

Contents
1. Introduction ........................................................................................................................ 1
2. Impacts of air pollution ....................................................................................................... 3
3. Sources of nitrogen dioxide air pollution ........................................................................... 4
4. Objective .......................................................................................................................... 10
5. Roles and responsibilities ................................................................................................ 11
5.1. National government and devolved administrations ................................................ 11
5.2. Local authorities ........................................................................................................ 12
5.3. Mayor of London ....................................................................................................... 12
5.4. Vehicle manufacturers .............................................................................................. 13
5.5. Public transport providers ......................................................................................... 13
5.6. Businesses, industry and the public ......................................................................... 14
6. Defining the solution ........................................................................................................ 16
7. Implementing the solution................................................................................................ 18
7.1. Existing actions ......................................................................................................... 18
7.2. Summary of additional actions across the UK ......................................................... 19
7.3. Additional national actions ........................................................................................ 22
7.4. Additional actions in England ................................................................................... 29
7.5. Additional actions in Scotland ................................................................................... 44
7.6. Additional actions in Wales ....................................................................................... 45
7.7. Additional actions in Northern Ireland....................................................................... 49
8. Raising awareness .......................................................................................................... 54
9. Monitoring and evaluation ............................................................................................... 55
10. Glossary ......................................................................................................................... 56
Annex A – Wider Clean Air Strategy ................................................................................... 59
Annex B – National Productivity Investment Fund .............................................................. 60

Annex C – UK ambient air quality reporting zones ............................................................. 62
Annex D – Existing actions to reduce emissions of NOx from the current road vehicle fleet in problem locations now ..................................................................................................... 63
Low emission zones ......................................................................................................... 63
Investment in bus services .............................................................................................. 63
Investment in the national and local road network .......................................................... 64
Retrofit technology ........................................................................................................... 65
Driving style ...................................................................................................................... 66
Alternative fuels ................................................................................................................ 67
Annex E – Existing actions to accelerate road vehicle fleet turnover to cleaner vehicles to ensure that the problem remains addressed and does not move to other locations.......... 70
Promoting uptake of ultra low emission vehicles (ULEVs) .............................................. 70
Annex F – Existing measures to reduce emissions of NOx from other forms of transport such as rail, aviation and shipping ...................................................................................... 73
Rail investment ................................................................................................................. 73
Aviation ............................................................................................................................. 74
Ports and shipping ........................................................................................................... 74
Annex G – Existing measures to reduce emissions of NOx from industry and non-road mobile machinery ................................................................................................................. 76
Industrial emissions ......................................................................................................... 76
Medium Combustion Plants and generators ................................................................... 76
Non-road mobile machinery (NRMM) .............................................................................. 76
Annex H – Existing measures to reduce emissions of NOx from buildings, both commercial and domestic, and other stationary sources ....................................................................... 77
Buildings ........................................................................................................................... 77
Other stationary sources .................................................................................................. 77
Annex I – Land use and infrastructure planning ................................................................. 79
Annex J – Innovation, research and development of new technologies ............................ 80

Annex K – Local authorities with one or more roads with NO2 concentrations forecast above statutory limits based on modelling .......................................................................... 83
Annex L – Maps of urban centres with estimated roadside NO2 concentration projections for 2020 or 2021 .................................................................................................................. 88

1
1. Introduction 1. This document is the UK air quality plan for bringing nitrogen dioxide (NO2) air pollution
within statutory limits in the shortest possible time. It is accompanied by a Technical Report.
2. The UK government is committed to building a stronger economy and a fairer society. A cleaner, healthier environment benefits people and the economy. Clean air is essential for making sure the United Kingdom (UK) is a healthy and prosperous country for people to live and work.
3. Over recent decades, UK air quality has improved significantly thanks to concerted action at all levels. Total UK emissions of nitrogen oxides (NOx) fell by almost 70% between 1970 and 2015 and by over 19% between 2010 and 2015. Poor air quality is the largest environmental risk to public health in the UK and investing in cleaner air and doing even more to tackle air pollution are priorities for the UK government. That is why the UK has adopted tougher, legally binding ceilings for national emissions of air pollutants for 2020 and 2030 (Annex A).
4. The most immediate air quality challenge is tackling the problem of NO2 concentrations around roads - the only statutory air quality limit that the UK is currently failing to meet. The issue is particularly experienced in towns and cities which should be healthy places. The UK government is committed to taking action against poor air quality in urban areas. Combined with the wider actions to reduce other harmful air pollution emissions, this plan will help our towns and cities to become cleaner and help to grow the economy.
5. Alongside this plan, the UK government is determined to be at the forefront of vehicle innovation by making motoring cleaner. The link between improving air quality and reducing carbon emissions is particularly important and the UK government will continue to develop solutions which reduce NO2 and carbon.
6. Central to the UK government’s objective of tackling NO2 and carbon emissions is its ambition for Britain to lead the world in electric vehicle technology and use. The government will end the sale of all new conventional petrol and diesel cars and vans by 2040.
7. We are already committed to investing over £2.7 billion overall in air quality and cleaner transport. This includes:
• £1 billion – ultra low emission vehicles (ULEVs). This includes investing nearly £100 million in the UK’s charging infrastructure and funding the Plug In Car and Plug In Van Grant Schemes.
• £290 million – National Productivity Investment Fund. In the Autumn Statement 2016, a further £290 million was committed for reducing transport emissions which

2
includes £60 million for new buses and £40 million for bus retrofits, £50 million for a Plug In Taxi programme and £80 million for ULEV charging infrastructure (Annex B).
• £11 million – Air Quality Grant. We have awarded over £11 million under our Air Quality Grant scheme to help local authorities improve air quality.
• £89 million – Green Bus Fund. The UK government has invested a total of almost £89 million via the Green Bus Fund to help bus companies and local authorities in England to put over 1200 new low carbon buses on the roads.
• £27 million – Clean Bus Technology Fund and Clean Vehicle Technology Fund. Since 2013, government has awarded over £27 million to retrofit almost 3,000 of the oldest vehicles (mainly buses) including through the Clean Bus Technology Fund and the Clean Vehicle Technology Fund.
• £1.2 billion – Cycling and walking. In April 2017, the UK government published its Cycling and Walking Investment Strategy which identifies £1.2 billion which may be invested in cycling and walking from 2016-2021.
• £100 million – National road network. Through the Road Investment Strategy, the UK government has allocated a ring-fenced £100 million for an Air Quality Fund available through to 2021 for Highways England to help improve air quality on its network.
8. UK emissions of NOx from road transport fell by 17% between 2010 and 2015 and the UK is among the frontrunners in Europe in terms of electric vehicle manufacture and uptake: UK-manufactured Nissan Leafs accounted for almost 20% of battery electric car sales across Europe in 2016 and the UK had the second highest sales of battery electric vehicles and plug-in hybrids. The UK government has also allocated over £11 million to local authorities via its air quality grant scheme since 2011. This includes trials of innovative approaches and technologies (Annex J).
9. In the 2016 Autumn Statement, the UK government also committed an additional £4.7 billion to 2020-2021 for research and development. This includes a new Industrial Strategy Challenge Fund to support the development of innovative technologies such as electric vehicle batteries that have the potential to make the UK a world leader and transform the UK economy (Annexes B and J). This was followed up with the Industrial Strategy Green Paper,1 setting out ten key pillars including delivering affordable energy and clean growth, alongside investing in science, research and innovation, upgrading infrastructure, cultivating world-leading sectors, and driving growth across the country.
1 BEIS (2017) Developing a modern industrial strategy www.gov.uk/government/news/developing-a-modern-industrial-strategy

3
2. Impacts of air pollution 10. Air pollution impacts on public health, the natural environment, and the economy.
11. Poor air quality is the largest environmental risk to public health in the UK. It is known to have more severe effects on vulnerable groups, for example the elderly, children and people already suffering from pre-existing health conditions such as respiratory and cardiovascular conditions.2 Studies have suggested that the most deprived areas of Britain bear a disproportionate share of poor air quality.3
12. Air pollution also results in damage to the natural environment. NO2 contributes to acidification and eutrophication of soil and watercourses, which impacts on animal and plant life and biodiversity. It also contributes to local ozone production which has public health impacts and damages agricultural crops, forests and plants.4
13. Air pollution has social costs5 and risks the potential for economic growth. It also impacts upon people of working age which can have economic effects, for instance if they have to take days off work due to air pollution-related health problems. Poor air quality is estimated to have had a total cost of up to £2.7 billion through its impact on productivity in 2012.6
2 World Health Organization, ‘Review of evidence on health aspects of air pollution – REVIHAAP Project’, 2013 http://www.euro.who.int/__data/assets/pdf_file/0004/193108/REVIHAAP-Final-technical-report-final-version.pdf?ua=1
3 Mitchell, G., and others (2015) Who benefits from environmental policy? An environmental justice analysis of air quality change in Britain, 2001–2011. Environmental Research Letters. DOI: http://dx.doi.org/10.1088/1748-9326/10/10/105009
4 National Statistics (2016) Emissions of air pollutants in the UK, 1970 to 2015 www.gov.uk/government/statistics/emissions-of-air-pollutants
5 Defra (2015) ‘Valuing impacts on air quality: Updates in valuing changes in emissions of Oxides of Nitrogen (NOX) and concentrations of Nitrogen Dioxide (NO2)’ www.gov.uk/guidance/air-quality-economic-analysis
6 Defra (2015) Report: Valuing the impacts of air quality on productivity https://uk-air.defra.gov.uk/library/reports?report_id=832

4
3. Sources of nitrogen dioxide air pollution 14. Combustion of fossil fuels, for example in power generation, industrial processes,
domestic heating, and vehicles, gives rise to air pollutants including nitrogen oxides (NOx). NOx emissions include both primary NO2 and nitric oxide (NO) with the latter reacting in the atmosphere to produce secondary NO2 (Figure 1). Other reactions can lead to the generation of additional pollutants, for example harmful ozone produced by the action of sunlight on NOx and secondary particulate matter (PM) produced by reactions involving NOx.
15. Measures to tackle NOx can have beneficial effects in terms of reducing other air pollutants, such as particulate matter.
Figure 1: The relationship between NOx and NO2
16. The UK is divided into forty-three zones for air quality reporting purposes (Annex C) based on population size and clusters. The accompanying Technical Report provides information on climate, topography and population density.
17. Our legislation7 sets limit values8 for concentrations of NO2 in ambient air. These limit values reflect World Health Organization (WHO) air quality guidelines. In 2015, all but
7 The Air Quality Standards Regulations 2010; The Air Quality Standards (Scotland) Regulations 2010; The Air Quality Standards Regulations (Northern Ireland) 2010; The Air Quality Standards (Wales) Regulations 2010
8 Hourly mean limit value – 200 micrograms per cubic metre not to be exceeded more than 18 times a calendar year Annual mean limit value – 40 micrograms per cubic metre

5
two UK air quality reporting zones met the statutory hourly mean limit value for NO2 in 2015 and thirty-seven zones exceeded the statutory annual mean limit value for NO2 that year (Table 1).
18. It is important to note that a zone exceeding the statutory limits could be due to no more than one monitoring location or modelled road link within the entire zone. For example, in 2015 the lowest length of road in exceedance for any non-compliant zone was Swansea Urban Area with less than two miles of road.
Table 1: UK zones meeting statutory NO2 limit values in 20159
UK zones meeting statutory NO2 limit values in 2015
Meeting hourly mean limit value for NO2 (200μg/m³)
All forty-three UK zones except: Greater London Urban Area South Wales
Meeting annual mean limit value for NO2 (40μg/m³)
Brighton/Worthing/Littlehampton Blackpool Urban Area Preston Urban Area Highland Scottish Borders Northern Ireland
19. Although non-transport sources of NOx are considerable contributors (Figure 2), road transport is responsible for some 80% of NOx concentrations at roadside, with diesel vehicles the largest source in these local areas of greatest concern (Figure 3).10 This is due to both the significant growth in vehicle numbers, particularly light passenger and commercial diesel vehicles, and failures of the manufacturers of these vehicles to ensure that they replicated laboratory test-based emissions limits in real world driving conditions (see also Section 6). This failure has become apparent through improvements in real world testing.11 For heavy duty vehicles, the latest emissions
9 Defra (2016) Air pollution in the UK 2015 – Compliance assessment summary https://uk-air.defra.gov.uk/library/annualreport/index
10 Source apportionment for NOX is used as a proxy for the source apportionment of NO2. This is because it is not possible to calculate a precise source apportionment for annual average NO2 concentrations because ambient NO2 concentrations include contributions from both directly emitted primary NO2 and secondary NO2 formed in the atmosphere by the oxidation of NO.
11 DfT (2016) Vehicle Emissions Testing Programme report www.gov.uk/government/publications/vehicle-emissions-testing-programme-conclusions

6
standard gives vast improvements over its predecessor, delivering significantly lower real world emissions, as newer vehicles replace older ones in this class.
Figure 2: Annual UK emissions of NOx since 2000

7
Figure 3: UK national average NOx roadside concentration apportioned by source of NOx emissions, 2015
Source: PCM modelling provided by Ricardo Energy & Environment (2017)
Note: ‘Local road traffic’ in the large pie chart is the estimate of the proportion of local NOx roadside concentrations contributed by traffic on that road and is shown in greater detail in the smaller pie chart. ‘Road traffic background’ is the estimate of NOx concentrations contributed by traffic on other roads.
* Other (petrol) is made up of petrol vans and motorcycles.
HGVs = Heavy Goods Vehicles.
20. Total emissions of NOx from vehicles depend on a combination of both average emission per vehicle and the number of vehicles (Figure 4) with higher average emission per vehicle from older vehicles with lower Euro emission standards (Figure 5)12.
21. Between 2000 and 2016 in Great Britain: (i) the number of licensed cars increased from 24.4 million to 30.9 million; the percentage of diesel cars increased from 12.9% (3.2 million) to 39.1% (12.1 million). (ii) The number of licensed light goods vehicles (LGVs) increased from 2.4 million to 3.8 million; the percentage of diesel LGVs increased from 76.9% (1.8 million) to 96.2% (3.6 million).13
12 European Commission (2016) Air pollutants from road transport http://ec.europa.eu/environment/air/transport/road.htm
13 Source: National Statistics (2017) Vehicle licensing statistics www.gov.uk/government/collections/vehicles-statistics

8
Figure 4: Average emissions of NOx by vehicle type (grams/kilometre) and number of licensed vehicles in the UK in 2016
19,218
12,574
144
3,745
369 148 1670
5,000
10,000
15,000
20,000
25,000
0
1
2
3
4
5
6
7
Petrol Cars DieselCars
PetrolLGVs
DieselLGVs
Rigid HGV ArticulatedHGV
Buses &Coaches
Num
ber o
f lic
ense
d ve
hicl
es in
201
5 (th
ousa
nds)
Aver
age
NO
xem
issi
ons
(g/k
m tr
avel
led)
Type of vehicle
Average NOx emissions Number of licensed vehicles

9
Figure 5: Estimated emissions of real world emissions of NOx by Euro emission standard (grams/kilometre)
Note: NOx emissions figures are derived from COPERT speed emissions figures. These are estimates of real world emissions figures, based on the latest evidence from lab and real world tests
22. The UK situation is part of a wider problem with sixteen other European Union (EU) countries, alongside Norway and Serbia, recording NO2 concentrations above the annual mean limit value, at one or more monitoring sites in 2014.14
14 European Environment Agency (2016) Air quality in Europe – 2016 report. doi:10.2800/413142
10
4. Objective 23. Tackling poor air quality in all its forms is a priority for government. The UK currently
meets its international commitments for overall emissions of all air pollutants. The only statutory air quality limit that the UK is currently failing to meet is on NO2 concentrations.
24. The focus of this plan is on government’s most immediate air quality challenge: to reduce concentrations of NO2 around roads where levels are above legal limits. The aim is to achieve the statutory limit values for the whole of the UK within the shortest possible time. The objective of the UK government alongside the devolved administrations is to transform the UK’s most polluted towns and cities into clean and healthy urban spaces, supporting those most directly affected and ensuring that vehicle manufacturers play their part to improve the nation’s air quality.
25. While tackling NO2 concentrations is an important priority, government recognises the need to reduce harmful emissions of pollutants more widely. That is why the UK has adopted ambitious, legally-binding targets to reduce significantly overall emissions of NOx and four other damaging air pollutants for 2020 and 2030 (Annex A).
11
5. Roles and responsibilities
5.1. National government and devolved administrations 26. The UK government and the devolved administrations have policy responsibility for air
quality in England, Scotland, Wales and Northern Ireland respectively.
27. The UK government and the devolved administrations support local authorities and public transport providers via central guidance and access to various grant funding schemes described in this document. The UK government is also committed to supporting new technology and innovation though its industrial strategy.
28. In the event of air pollution episodes, a multi-agency response group is convened comprising representatives from Defra, the Department of Health, Public Health England, the Met Office and, where appropriate, the devolved administrations.
29. Annexes D and E provide further information on the roles and responsibilities of cross-Departmental units such as the Office for Low Emission Vehicles (OLEV) and government companies such as Highways England.
30. The UK government has requested Public Health England to review the evidence for effective interventions and provide practical recommendations for any actions not currently included in this plan which will significantly reduce harm from air pollution. In doing so the UK government has requested Public Health England to stratify any recommendations by their health and economic impacts.
5.1.1 The Committee on the Medical Effects of Air Pollutants
31. The Committee on the Medical Effects of Air Pollutants (COMEAP)15 is an expert committee of the Department of Health. COMEAP provides independent advice to UK government departments and agencies on how air pollution impacts on health.
5.1.2 The Air Quality Expert Group
32. The Air Quality Expert Group (AQEG)16 is an expert committee of the Department for Environment, Food and Rural Affairs (Defra) that provides independent scientific advice on air quality. It reports to Defra's Chief Scientific Adviser, Defra Ministers, Scottish Ministers, the Welsh Ministers, and the Department of Agriculture, Environment and
15 Committee on the Medical Effects of Air Pollutants (2017) www.gov.uk/government/groups/committee-on-the-medical-effects-of-air-pollutants-comeap
16 Air Quality Expert Group (2017) https://uk-air.defra.gov.uk/library/aqeg/

12
Rural Affairs in Northern Ireland. AQEG considers current knowledge on air pollution and provides advice on such things as levels, sources and characteristics of air pollutants in the UK.
5.2. Local authorities 33. High concentrations of air pollutants are found in certain places for a host of local
reasons. Local authorities know their areas best and are best placed to take the lead in rectifying the problem. Local authorities are required17 to review and assess local air quality, in accordance with the statutory Local Air Quality Management (LAQM) guidance. Where a local authority identifies areas exceeding statutory limits and there is relevant public exposure, it is required to declare the geographic extent of exceedance as an Air Quality Management Area (AQMA). It must then draw up an action plan detailing remedial measures to address the problem. The Mayor of London has additional statutory functions and responsibilities.
34. Local authorities in Great Britain also have powers to tackle local air pollution via the Clean Air Act 1993 and via the Road Traffic (Vehicle Emissions) (Fixed Penalty) (England) Regulations 2002 and equivalent legislation in Scotland and Wales. The latter includes enforcement powers for stationary idling offences.
35. The UK government’s Air Quality Grant scheme18 has provided funding to eligible local authorities to help improve air quality. The scheme has helped local authorities to make air quality improvements and to meet their statutory duties under the Environment Act 1995. It has awarded over £11 million in funding to a variety of projects since 2011. This has included projects to reduce NOx emissions from the current road vehicle fleet in problem areas and projects to accelerate road vehicle fleet turnover to cleaner vehicles.
5.3. Mayor of London 36. The Mayor of London is responsible for air quality in the capital and has reserve
powers under Part IV of the Environment Act 1995 to reflect this. Under the Act the Mayor may direct the boroughs in the Greater London area on how they should assess and prioritise action in their areas.19
17 Section 82, Part IV of the Environment Act 1995 or the Environment (Northern Ireland) Order 2002
18 Defra (2017) Air quality grant programme www.gov.uk/government/collections/air-quality-grant-programme
19 LAQM guidance published by the Mayor of London www.london.gov.uk/what-we-do/environment/pollution-and-air-quality/working-london-boroughs

13
37. In 2010, the Mayor published an Air Quality Strategy,20 a statutory requirement21 which commits the Greater London Authority and Transport for London to implement certain measures, most of which are now in place.
38. In June 2017, the Mayor of London published a consultation on a draft Transport Strategy,22 which includes the aim for London’s entire transport system to be zero emission by 2050. This would support the UK government’s wider aim for almost every car and van to be zero emission by the same date.
5.4. Vehicle manufacturers 39. Vehicles must meet EU-wide emission standards for a range of air pollutants - so-
called ‘Euro emission standards’.
40. Prior to the discovery in September 2015, that one car manufacturer – Volkswagen – had fitted software to its vehicles that distorted emissions test results for emissions of NOx, the UK government had already been working with the EU to develop new vehicle emissions tests and to encourage their early introduction. The UK government pushed hard to ensure that more stringent vehicle type approval testing including Real Driving Emissions (RDE) tests would apply to new models sold from 2017. Under the new RDE tests from September 2017, light passenger and commercial vehicle manufacturers will be required to ensure that real world NOx emissions for new models are increasingly aligned with lab-testing limits (see Section 7.3). This will entail using innovative technologies to bring forward new, cleaner vehicles that should deliver lower NOx emissions across a wider range of operating conditions.
41. Car manufacturers also have the opportunity to help consumers to understand how clean their vehicles are in terms of emissions of NOx, in the same way as they are required to do for emissions of carbon dioxide (CO2).23
5.5. Public transport providers 42. The UK government’s Clean Air Zone Framework for England24 includes ways in which
local authorities can support and encourage public transport.
20 Mayor of London (2010) Mayor's Air Quality Strategy www.london.gov.uk/WHAT-WE-DO/environment/environment-publications/mayors-air-quality-strategy
21 The Greater London Authority Act 1999
22 GLA (2017) Transport plan for fairer, greener, healthier & more prosperous city www.london.gov.uk/press-releases/mayoral/fairer-greener-healthier-more-prosperous-city
23 VCA (2017) Fuel Consumption Labelling www.dft.gov.uk/vca/fcb/fuel-consumption-labelling.asp

14
43. Bus services can be part of the solution to our air quality problems. Good local bus services encourage people to leave the car at home and use public transport to get to work, school, and to access local services. This in turn helps tackle congestion in our city and town centres and the increased emissions and air quality problems it brings. The latest Euro VI diesel buses can emit less NOx per vehicle than the latest diesel cars. Low emission buses, such as electric or biomethane powered ones, offer significant carbon dioxide savings and improved air quality. The UK government committed an additional £100 million in support for low emission buses in England and Wales, including hundreds of new low emission buses and retrofitting thousands of older buses.
44. The Bus Services Act 2017 which received Royal Assent on 27 April 2017 has introduced a range of new tools for local authorities to use to work with bus operators to improve services for passengers. All Mayoral Combined Authorities (Tees Valley; Greater Manchester; Liverpool City Region; West Midlands; Cambridge and Peterborough; and the West of England) have the power to franchise local bus services, with other types of local transport authority able to request the powers from government. Through both partnership and franchising, local authorities now have the means to work collaboratively with bus operators to think about how best to improve the local network to make it more attractive to passengers and raise the environmental standards of the buses used. This could include agreeing a package of improvements to introduce bus priority measures for example, reducing idling and journey times, or to introduce low emission vehicles along key routes. These interventions could range from small scale measures at key locations to a significantly enhanced network of fast, attractive local buses on priority routes, perhaps coupled with new park and ride opportunities, which displace car journeys into an urban area. The UK government strongly encourages local authorities and bus operators to work together to think carefully about how the powers in the Act could be used in their local area to help improve local air quality and reduce congestion in our towns and cities.
45. Regional coach operators additionally provide a number of daily services transporting millions of commuters to and from work each year. These services reduce commuter congestion and associated emissions.
46. The Clean Air Zone Framework also includes the use of existing licensing powers to introduce emission requirements for taxis and private hire vehicles.
5.6. Businesses, industry and the public 47. The UK government is clear that any action to improve air quality must not be done at
the expense of local businesses and residents. Therefore local authorities must work
24 Defra & DfT (2017) Clean Air Zone Framework for England www.gov.uk/government/publications/air-quality-clean-air-zone-framework-for-england

15
closely with local people to create an approach which works for them. Everyone has a role to play in helping to address NOx by considering how they can reduce emissions through their day-to-day activities, for example by choosing cleaner vehicles.
16
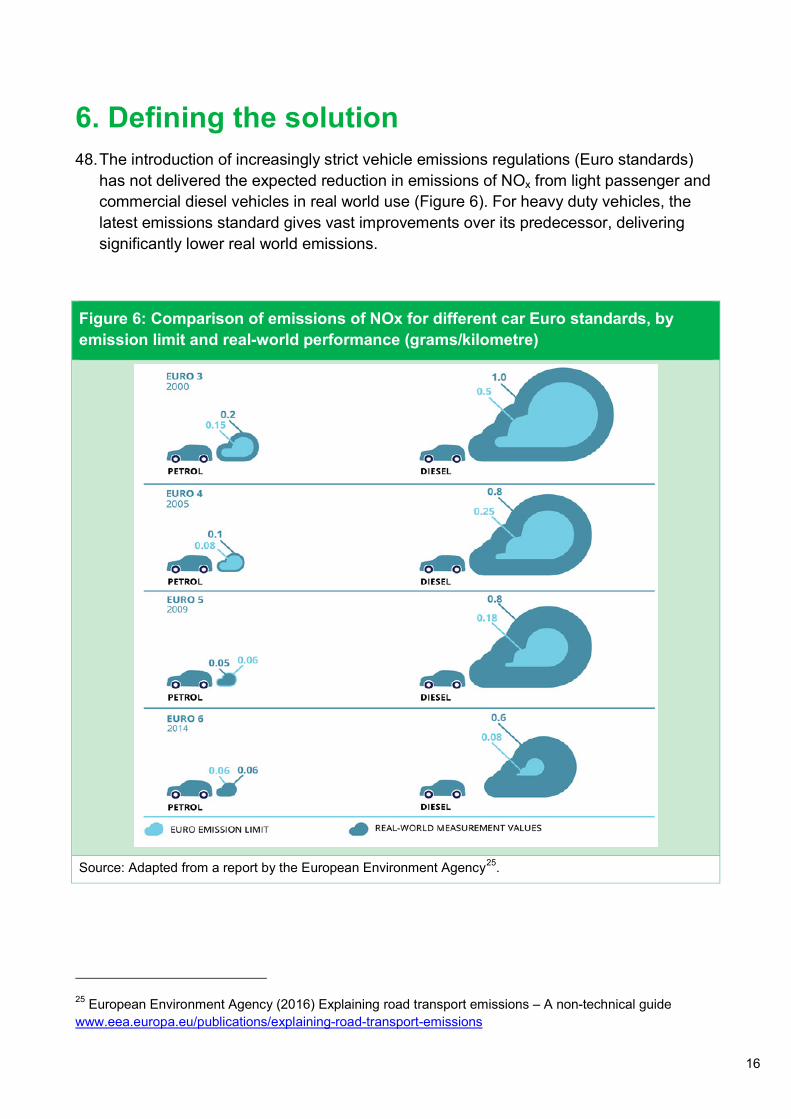
6. Defining the solution 48. The introduction of increasingly strict vehicle emissions regulations (Euro standards)
has not delivered the expected reduction in emissions of NOx from light passenger and commercial diesel vehicles in real world use (Figure 6). For heavy duty vehicles, the latest emissions standard gives vast improvements over its predecessor, delivering significantly lower real world emissions.
Figure 6: Comparison of emissions of NOx for different car Euro standards, by emission limit and real-world performance (grams/kilometre)
Source: Adapted from a report by the European Environment Agency25.
25 European Environment Agency (2016) Explaining road transport emissions – A non-technical guide www.eea.europa.eu/publications/explaining-road-transport-emissions

17
49. As a result, road transport is still by far the largest contributor to NO2 pollution in the local areas where the UK is exceeding limit values. Addressing road transport emissions therefore presents the most significant opportunity to tackle this specific exceedance problem. However road transport is a key part of almost everything that we do as individuals or businesses with social and economic impacts which are much wider than air quality. This means setting new policies and incentives to promote new technology and innovation, speeding up the move to cleaner vehicles and supporting the industrial strategy to deliver cleaner air for UK towns and cities. The solution involves effective and appropriately targeted actions to:
a. reduce emissions of NOx from the current road vehicle fleet in problem locations now, including through promoting public transport, cycling and walking; and
b. accelerate road vehicle fleet turnover to cleaner vehicles to ensure that the problem remains addressed and does not move to other locations.
50. As mentioned in Section 3, a significant proportion of background emissions of NOx come from other sources including other forms of transport, industry and buildings so the solution also involves effective and appropriately targeted actions to:
a. reduce emissions of NOx from other forms of transport such as rail, aviation and shipping;
b. reduce emissions of NOx from industry and non-road mobile machinery (NRMM); and
c. reduce emissions of NOx from buildings, both commercial and domestic, and other stationary sources.

18
7. Implementing the solution 51. This section includes the range of existing actions to tackle local NO2 exceedance and
reduce overall emissions of NOx from road transport and other sources.
52. It also includes the additional actions which, when combined with these existing actions, will help our towns and cities to become cleaner and help grow the economy, supporting those most directly affected and ensuring that vehicle manufacturers play their part.
53. The government is clear that we must maintain discipline on public spending. Additional measures to improve air quality announced through this Plan will therefore be funded through changes to the tax treatment for new diesel vehicles, or through reprioritisation within existing departmental budgets. Further details on changes to the tax regime will be announced later in the year.
7.1. Existing actions 54. Detailed information on the actions already being taken by government are set out in
the annexes to this plan, which are as follows:
• Annex A - Wider Clean Air Strategy
• Annex B - National Productivity Investment Fund
• Annex D - Actions to reduce emissions from the current fleet
• Annex E - Actions to accelerate road vehicle fleet turnover to cleaner vehicles
• Annex F - Actions to reduce emissions from other forms of transport
• Annex G - Actions to reduce emissions from industry
• Annex H - Actions to reduce emissions from buildings and other stationary sources; and
• Annex I - Land use and infrastructure planning
Further detail is available in the air quality plan for NO2 and supporting documents published in December 2015.26
55. Annex K provides details on some of the ongoing government-funded innovation, research and development of new technologies to support economic growth using cleaner transport.
26 Defra (2015) Air quality plan for nitrogen dioxide (NO2) in UK (2015) www.gov.uk/government/collections/air-quality-plan-for-nitrogen-dioxide-no2-in-uk-2015

19
7.2. Summary of additional actions across the UK 56. Table 2 provides a summary of the additional actions across the UK. These actions are
described in more detail in the following sections.
Table 2: Summary of additional actions across the UK
Action Lead Partners Timescale
Require local authorities to implement chosen measures to achieve statutory NO2 limit values within the shortest possible time
Defra/DfT Relevant local authorities in England
Work will begin immediately with the first Clean Air Zones or other equally effective measures in place as soon as possible
Consultation on proposal for a Clean Air Zone Framework for Wales
Welsh Government Within 12 months
Consultation on detailed proposals for the establishment and operation of Scotland’s first Low Emission Zone by 2018, along with the development of Scotland’s National Low Emission Framework
Scottish Government Consultation on proposals for first Low Emission Zone published end August 2017
Low Emission Zone by 2018
Highways England action to improve air quality on the Strategic Road Network in England including network of chargepoints and other innovative solutions
Highways England/DfT/Defra
Relevant local authorities in England
Work will begin immediately

20
Action Lead Partners Timescale
More stringent laboratory testing requirements for statutory type approval of new light duty vehicles
DfT VCA From September 2017
New Real Driving Emissions requirements for light passenger and commercial vehicles
DfT VCA The second and third of four planned legislative packages come into effect from September 2017
Lorry emissions technology checks at roadside
DVSA Starting August 2017
Additional funding to accelerate the uptake of low emission buses, including new buses and retrofitting older buses supported by a new accreditation scheme
DfT/Defra/OLEV LowCVP Further information on grant scheme design, timings and how to apply will be issued later in 2017
Additional funding to accelerate the uptake of electric taxis
OLEV/DfT Launched in March 2017
Additional funding to accelerate uptake of hydrogen vehicles and infrastructure
DfT The competition will be launched in Summer 2017
Automated and Electric Vehicles Bill
DfT/OLEV Subject to Parliamentary process

21
Action Lead Partners Timescale
Review of information to ensure wider environmental performance is apparent to consumers when considering purchasing cars including at the point of sale (car fuel efficiency label)
DfT/Defra/VCA LowCVP Within 12 months
Regulatory changes to support the take up of alternatively-fuelled light commercial vehicles (vans)
OLEV DfT Within 12 months subject to outcome of consultation
Exploring the appropriate tax treatment for diesel vehicles
HMT Within 12 months
Consider changes to the HGV Road User Levy
DfT HMT Within 12 months
Call for evidence on use of red diesel
HMT Outcome to be announced in 2017
Call for expressions of interest from local authorities for technical support to assist with development of Local Cycling and Walking Investment Plans as part of new £1.2 billion Cycling and Walking Investment Strategy
DfT Local authorities Programme launched 2017
22
Action Lead Partners Timescale
Updating government procurement policy
Defra/DfT Within 12 months
Call for evidence on a new Aviation Strategy
DfT Summer 2017
New emissions standards for non-road mobile machinery (NRMM)
DfT/BEIS VCA New emission standards mandatory for new engines being sold, for the first tranche of categories, from January 2019
New measures to tackle NOx emissions from Medium Combustion Plants (MCPs)
Defra, Welsh Government, Scottish Government, Department of Agriculture, Environment and Rural Affairs in Northern Ireland
By end 2018
New measures to tackle NOx emissions from generators
Defra, Welsh Government, Scottish Government, Department of Agriculture, Environment and Rural Affairs in Northern Ireland
By end 2018 (subject to outcome of consultation in Scotland and Northern Ireland)
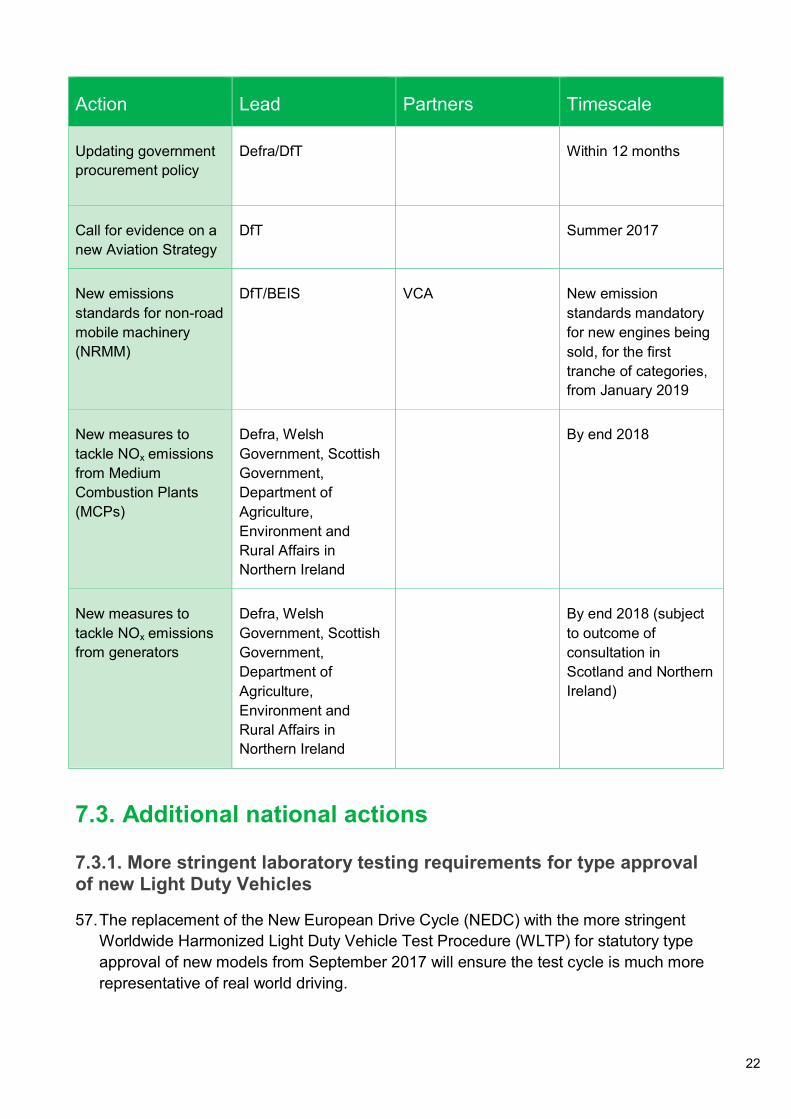
7.3. Additional national actions
7.3.1. More stringent laboratory testing requirements for type approval of new Light Duty Vehicles
57. The replacement of the New European Drive Cycle (NEDC) with the more stringent Worldwide Harmonized Light Duty Vehicle Test Procedure (WLTP) for statutory type approval of new models from September 2017 will ensure the test cycle is much more representative of real world driving.

23
7.3.2 New Real Driving Emissions requirements for light passenger and commercial vehicles
58. Under the new Real Driving Emissions (RDE) regulations for light passenger and commercial vehicles,27 vehicle manufacturers will be required to ensure that real world emissions of NOx for new models are controlled across a wide range of driving conditions. This is expected to reduce significantly the emissions gap between the regulated NOx emissions measured under controlled laboratory conditions and real world performance from September 2017. This will improve consumer confidence in manufacturers and, combined with the more stringent type approval testing of new models, deliver real improvements for air quality.
7.3.3 Support for low emission freight
59. The UK government is supporting the development and deployment of low emission commercial vehicles and refuelling infrastructure. In January 2017, the DfT, OLEV and Innovate UK announced twenty projects awarded £20 million through the Low Emission Freight and Logistics Trial.28 The aim of the competition is to demonstrate new technologies and to encourage the widespread introduction of low and zero emission vehicles to UK fleets. In the meantime, the UK government will continue its close working with the logistics industry on improving the efficiency of operations, drivers and vehicles to maximise the emissions savings that can be achieved in the short term.
60. In addition, the plug-in van grant, which provides up to £8,000 or 20% of the value of electric/plug-in hybrid vans, was extended in 2016 to encompass vans of category N1, N2 or N3.29 The first 200 N2 or N3 vehicles claimed will receive up to £20,000.30
61. Innovation in fuel technology can play an important role in reducing emissions from heavy goods vehicles. The UK government is providing £20 million to fund the development of advanced low carbon fuels which are derived from wastes and residues.
27 Package 1 (in force since April 2016) includes the RDE test procedure; Package 2 (in force since May 2016) includes introduction dates and NOx limits; Package 3 (in force July 2017) includes a change in the RDE test procedure to include ‘cold start’ emissions; Package 4 (proposed) will set out requirements for in-service conformity.
28 DfT (2017) Low emission freight and logistics trial competition winners announced www.gov.uk/government/news/low-emmission-freight-and-logistics-trial-competition-winners-announced
29 VCA (2017) Definition of vehicle categories www.dft.gov.uk/vca/vehicletype/definition-of-vehicle-categories.asp
30 OLEV (2016) Plug-in van grant: extension to larger vans www.gov.uk/government/publications/plug-in-van-grant-extension-to-larger-vans/plug-in-van-grant-extension-to-larger-vans

24
7.3.4 Lorry emissions technology checks at roadside
62. The latest emissions standard for Heavy Duty Vehicles, Euro VI, came into force in 2013-14 and introduced a number of significant changes over Euro V including more representative laboratory driving cycles and a new requirement to test off-cycle; the introduction of in-service emissions testing on the road; new requirements for measuring particle number emissions; and new methods for determining the fuel consumption and CO2 emissions. Research has shown that Euro VI gives vast improvements over its predecessor, delivering significantly lower real world emissions.31
63. From August 2017, Driver and Vehicle Standards Agency (DVSA) roadside checks of lorries will include emissions cheat devices.32 DVSA enforcement officers will give the driver and operator ten days to fix the emissions system if they find it has been tampered with. If the emissions system is not fixed within 10 days, DVSA will issue a fine and stop the vehicle being used on the road. DVSA enforcement staff can insist that a vehicle is taken off the road immediately if they find a driver or operator is repeatedly offending.
7.3.5. Additional funding to accelerate the uptake of low emission buses
64. The UK government has committed an additional £100 million in support for low emission buses in England and Wales including hundreds of new low emission buses and retrofitting of thousands of older buses. The £100 million forms part of the £290 million for reducing transport emissions, announced from the National Productivity Investment Fund at Autumn Statement 2016 (Annex B).
7.3.5.1. Additional funding for new low emission buses
65. Deployment of low emission and zero emission buses can enable improvements in local air quality and deliver carbon savings. In 2016, the UK government announced over a dozen local authorities and bus operators who were being awarded a share of £30 million under the Low Emission Bus Scheme to help purchase low or ultra low emission buses, speeding up the transition to an ultra low emission bus fleet and supporting the improvement of local air quality (Annexes D and E).
66. The UK government will issue further information on scheme design, timings and how to apply for the additional funding committed at Autumn Statement 2016 (£60 million).
31 TNO 2014 R10641, The Netherlands In-Service Emissions Testing Programme for Heavy Duty 2011-2013, Published 26 May 2014 www.tno.nl/media/3443/hdv_in_service_testing_tno_2014_r10641.pdf
32 DfT, DVSA & Defra (2017) Emissions cheat devices to be included in roadside checks of lorries www.gov.uk/government/news/lorry-emissions-checks-to-start-at-the-roadside

25
7.3.5.2 Additional funding for retrofitting older buses supported by a new accreditation scheme
67. Retrofitting refers to all or part of an engine being modified with pollution-reducing and/or fuel saving technologies. These include: exhaust gas treatment technologies, such as selective catalytic reduction technology, thermal management technology; fuel saving technologies such as hybridisation; and more extensive modification for fuel conversion to compressed/ liquefied natural gas, electric, hydrogen or liquefied petroleum gas. Some retrofitting technologies have the potential for significant reductions in emissions of NOx.
68. The UK government believes that the continued development, promotion and implementation of innovative retrofit technology will be an important element of reducing emissions of NOx and help bridge the gap in the journey towards zero emissions by 2050. The UK government expects local authorities to set a lead in cleaning up their own fleets and meeting local air quality objectives. It also expects local authorities to assess the benefits that retrofitting, in particular of public transport fleets in Clean Air Zones, could have on reducing local pollution levels.
69. The Low Carbon Vehicle Partnership will launch a Clean Vehicle Retrofit Accreditation Scheme (CVRAS) alongside this plan, for buses initially with other vehicle types to follow. The Accreditation Scheme will provide independent evidence that a vehicle retrofit technology will deliver the expected emissions reductions and air quality benefits. It will enable drivers, technology manufacturers, businesses and local authorities to be confident that accredited technologies provide the appropriate emissions reductions for entry to Clean Air Zones free of charge. The UK government will continue to explore the approach to enforcement as part of the implementation of Clean Air Zones to ensure that retrofitted vehicles can be recognised and that equipment is fitted and working appropriately.
70. The additional funding for retrofitting buses committed at Autumn Statement 2016 (£40 million) will support the development of Clean Air Zones and continue to drive forward the UK’s retrofit industry, identifying innovative new technologies to tackle emissions from a range of vehicles. The new grant funding scheme will be informed by an evaluation of previous retrofit grant schemes, carried out in partnership with the Low Carbon Vehicle Partnership. The UK government will maximise support for towns and cities with the greatest air quality compliance challenges and will issue further information on scheme design, timings and how to apply. Working with the Low Carbon Vehicle Partnership, the UK government will share lessons learned from evaluation of previous schemes to help stakeholders to understand the retrofit market.
7.3.6. Additional funding to accelerate the uptake of electric taxis
71. Alongside the opening of a new £325 million electric taxi factory in the Midlands in March 2017 supported by £16.1 million from the Regional Growth Fund, the

26
government announced33 a further £64 million of investment, including £50 million from the new National Productivity Investment Fund, to promote the uptake of electric taxis. This money will support two schemes:
a. A £50 million Plug-in Taxi Grant programme. This will provide up to £7,500 off the price of a new vehicle. Drivers who switch to the new electric cabs could also save around £2,800 in fuel costs a year.
b. £14 million of investment will deliver new dedicated chargepoints for electric taxis in the ten council areas which bid for funding.
72. These projects are expected to deliver around 400 rapid and 150 fast chargepoints which will enable the take-up of around 23,000 ULEV taxis nationally including supporting existing plug in private hire vehicles.
73. The £50 million Plug-in Taxi Grant programme funding forms part of the £290 million for reducing transport emissions, announced from the National Productivity Investment Fund at Autumn Statement 2016.
7.3.7. Additional funding to accelerate the uptake of hydrogen vehicles and infrastructure
74. In March 2017, the UK government announced34 a new £23 million fund to accelerate the take up of hydrogen vehicles and roll out more cutting-edge infrastructure. This announcement builds on the launch of the industrial strategy Green Paper in January 2017.
75. Hydrogen fuel providers will be able to bid for funding in partnership with organisations that utilise hydrogen vehicles to help build high-tech infrastructure, including fuel stations. The funding will boost the creation of hydrogen fuel infrastructure and uptake of hydrogen-powered vehicles. A competition will be launched in Summer 2017, and will invite proposals from public organisations, businesses and hydrogen operators. The UK government will provide match funding for successful bidders as part of its plans to cut carbon emissions, improve air quality and deliver economic opportunities for the UK.
33 DfT, OLEV & BEIS (2017) 1,000 jobs created at new £325 million factory for electric taxis www.gov.uk/government/news/1000-jobs-created-at-new-300-million-factory-for-electric-taxis
34 DfT (2017) £23 million boost for hydrogen-powered vehicles and infrastructure www.gov.uk/government/news/23-million-boost-for-hydrogen-powered-vehicles-and-infrastructure

27
7.3.8. Automated and Electric Vehicles Bill
76. As part of the UK government’s plan to build a stronger economy, the June 2017 Queen’s Speech includes the Automated and Electric Vehicles Bill so that the UK retains its position as a global leader in the market for electric vehicles.35
77. The Automated and Electric Vehicles Bill will:
a. allow the regulatory framework to keep pace with the fast evolving technology for electric cars, helping improve air quality; and
b. provide for the installation of charging points for electric and hydrogen vehicles.
78. The main elements include allowing the government to require the installation of charge points for electric vehicles at motorway service areas and large fuel retailers, and to require a set of common technical and operational standards. This will ensure that charge points are convenient to access and work seamlessly across the UK.
7.3.9. Review of information available to car buyers at the point of sale
79. Fuel consumption and CO2 emissions data is made available to consumers purchasing new cars. Vehicle dealers are required to display a label on every new car displayed for sale, and dealers also provide labels on used cars on a voluntary basis. The label shows the fuel consumption and CO2 emissions, as well as information on the appropriate Vehicle Excise Duty (VED) for the vehicle. The label is designed to provide advice to help consumers make an informed choice at the point of purchase. The new car fuel efficiency label was amended on 1 April 2017 as new VED rates and bands were introduced, and the used car label will be similarly amended as cars registered after this date enter the used market. The principle difference is that only zero emission cars will attract no VED. The Vehicle Certification Agency (VCA) also publishes an annual new car fuels efficiency guide and maintains a database for both cars and light vans.
80. The UK government is keen to enhance the information available to ensure the wider environmental performance of a car is clear to consumers at the point of sale. (Other sources of official test data will also cover light vans). Given the development of Clean Air Zones, information enabling consumers to understand quickly and easily whether or not a given vehicle would potentially incur a charge is particularly important. The UK government will work to include this information on fuel efficiency labels before the first Clean Air Zones are in operation. In addition, the UK government is undertaking a review of the vehicle label supported by the Low Carbon Vehicle Partnership (Low CVP). This will enable consideration of the most appropriate way to display the necessary information. All of this will help support wider work on engaging the public
35 Cabinet Office (2017) Queen’s Speech 2017: background briefing notes www.gov.uk/government/publications/queens-speech-2017-background-briefing-notes

28
about the environmental performance of vehicles and build understanding of Clean Air Zone requirements and how to comply with them.
7.3.10. Regulatory changes to support the take up of alternatively-fuelled light commercial vehicles
81. In 2017, the UK government intends to consult on the implementation of regulatory changes to support the take up of alternatively-fuelled light commercial vehicles (vans). Proposals include (i) increasing the weight limit of alternatively-fuelled vans that can be driven on a category B driving licence in the UK; (ii) exempting certain alternatively-fuelled vans from goods vehicle operator licensing requirements in Great Britain; and (iii) roadworthiness testing for electric vans in Great Britain. Vans spend much of their time completing driving routes around our towns and cities and over 96% of them are diesel powered. The UK government wants to support the continued contribution of vans to the economy whilst also reducing their environmental impact. One way of achieving this is to encourage the uptake of cleaner fuels in our delivery vehicle fleet.
7.3.11. Exploring the appropriate tax treatment for diesel vehicles
82. The UK government will continue to explore the appropriate tax treatment for diesel vehicles and will engage with stakeholders ahead of making any tax changes at Autumn Budget 2017.
7.3.12. Changes to HGV Road User Levy
83. Government will consider changes to the HGV Road User Levy so that it incentivises improved environmental performance, including air quality and carbon emissions.
7.3.13. Call for evidence on use of red diesel
84. The UK government launched a call for evidence on the use of red diesel36 between 20 March and 30 June 2017 in order to improve understanding of eligible industries and current use, particularly in urban areas. The outcome of the consultation will be published later in 2017.
7.3.14. Call for evidence on a new Aviation Strategy
85. The UK government will launch a call for evidence on a new Aviation Strategy in Summer 2017. Through the development of an Aviation Strategy, the UK government would like to explore whether it should be taking a more proactive role in tackling air pollution from aviation. In doing so it will seek to better understand the impact of
36 HMT (2017) Red diesel call for evidence https://www.gov.uk/government/consultations/red-diesel-call-for-evidence

29
aviation related emissions on air quality and will invite views on what more can be done to support airports in mitigating the impact on the health of communities.
7.3.15. New mandatory emissions standards for non-road mobile machinery
86. In January 2017, new legislation came into force with more stringent emission limits for major air pollutants from engines used in NRMM. It extends the scope of existing legislation to cover all sizes of petrol and diesel engines used in NRMM and it improves the legal framework. The new emission standards are mandatory for new engines being sold, for the first tranche of categories, from January 2019.
7.3.16. New measures to tackle emissions of NOx from Medium Combustion Plants (MCPs) and generators
87. Medium Combustion Plants (MCPs) are widely used to generate heat for large buildings (offices, hotels, hospitals, prisons) and industrial processes, as well as for power generation, and have been largely unregulated for emissions to air. In addition, there has been rapid growth in the use of generators with high NOx emissions in Great Britain which is expected to continue. Modelling indicates that such generators can lead to local breaches of the statutory hourly mean limit value for NO2. The UK and Welsh Governments consulted on new statutory measures to reduce emissions from MCPs and generators in 2016 with a view to introducing emission controls in England and Wales from the end of 2018, to improve air quality. The response to the consultation, published on 11 July 2017, sets out the controls which will be introduced into legislation by the end of 2017.37 Scotland and Northern Ireland consulted in 2016 and 2017 respectively on measures to reduce emissions from MCPs within the same timescale as England and Wales, and sought views on controlling emissions from generators.38 39
7.4. Additional actions in England 88. This section includes actions focussed only in England.
37 Defra (2016) Improving air quality: reducing emissions from medium combustion plants and generators www.gov.uk/government/consultations/improving-air-quality-reducing-emissions-from-medium-combustion-plants-and-generators
38 Scottish Government (2016) Consultation on reducing emissions from medium combustion plants http://www.gov.scot/Publications/2016/12/3481
39 DAERA (2017) Consultation on the transposition of the Medium Combustion Plant Directive (1-50 megawatts) including the regulation of thermal electricity generators www.daera-ni.gov.uk/consultations/consultation-medium-combustion-plant-directive

30
7.4.1. Local Authority led action plans
89. Unlike greenhouse gases, the risk from NO2 is focused in particular places: it is the build-up of pollution in a particular area that increases the concentration in the air and the associated risks. So intervention needs to be targeted to problem areas, mostly in cities and towns, where specific roads with air pollution problems have been identified. The effort to reduce NO2 also needs to be targeted on the sources that make the biggest contribution to the problem: road vehicles contribute about 80% of NO2 pollution at the roadside and growth in the number of diesel cars has exacerbated this problem.
90. Given the local nature of the problem, local action is needed to achieve improvements in air quality. As the UK improves air quality nationally, air quality hotspots are going to become even more localised and the importance of action at a local level will increase. Local knowledge is vital to finding air quality solutions that are suited to local areas and the communities and businesses affected. A leading role for local authorities is therefore essential.
91. But we also recognise the need for strong national leadership. We will set a clear national framework for the steps that local authorities need to take. We will provide direct financial support to enable local authorities to develop and implement their plans, and pursue national measures to reinforce their efforts. And we will require those local plans to be developed and implemented at pace so that air quality limits are achieved within the shortest possible time.
92. Annex K sets out all local authorities with roads shown by our national modelling to have NO2 levels above legal limits. Annex K also shows the projected levels of those roads in future years and when, in the absence of further action, they would be expected to come within legal limits.
93. Of those areas, the local authorities in Table 3 below representing the areas with the greatest problem with exceedances projecting beyond the next 3-4 years, will be required to develop local plans as set out below. Other areas will also be expected to take steps now to reduce emissions if there are measures they could take to bring forward the point where they meet legal limits.
94. The areas in Table 3 face varying challenges and the solutions will not all be the same. In some cases the problem is a single road that passes through, or around, a town centre. In others it is urban traffic that is causing the problem. Each authority will be required to undertake local assessments to consider the best option to achieve the statutory NO2 limit values within the shortest possible time. The UK government will expect other bodies, including upper tier local authorities and Highways England to work with these local authorities, where appropriate. The UK government will require local authorities to set out initial plans 8 months from now, by the end of March 2018. These will be followed by final plans by the end of December 2018. To assist them in meeting these timescales, the UK government will ensure local authorities can immediately draw on its implementation fund, as well as central government expertise.

31
Table 3: Local authorities with persistent exceedances required to undertake local action to consider the best option to achieve statutory NO2 limit values within the shortest possible time40
Basildon District Council
Coventry City Council
Leeds City Council Nottingham City Council
Southampton City Council
Bath and North East Somerset Council
Derby City Council Manchester City Council
Rochford District Council
Stockport Metropolitan Borough Council
Birmingham City Council
Fareham Borough Council
Middlesbrough Borough Council
Rotherham Metropolitan Borough Council
Surrey Heath District Council
Bolton Metropolitan Borough Council
Gateshead Metropolitan Borough Council
New Forest District Council
Rushmoor Borough Council
Tameside Metropolitan Borough Council
Bristol City Council Greater London Authority
Newcastle City Council
Salford Metropolitan Borough Council41
Trafford Metropolitan Borough Council42
Bury Metropolitan Borough Council
Guildford Borough Council
North Tyneside Council
Sheffield City Council
95. It is for local authorities to develop innovative local plans that will achieve statutory NO2 limit values within the shortest possible time. In the Technical Report being published alongside this document, the UK government has identified Clean Air Zones that include charging as the measure it is able to model nationally which will achieve
40 Halton Borough Council is also forecast to have persistent exceedances. However, these are expected to be addressed by the Mersey Gateway Bridge, which is due to open in Autumn 2017.
41 Salford Metropolitan Borough Council is not expected to have persistent exceedances, but we anticipate it would need to be included in a Clean Air Zone.
42 Trafford Metropolitan Borough Council is not expected to have persistent exceedances, but we anticipate it would need to be included in a Clean Air Zone.
32
statutory NO2 limit values in towns and cities in the shortest possible time. Given the potential impacts on individuals and businesses, when considering between equally effective alternatives to deliver compliance, the UK government believes that if a local authority can identify measures other than charging zones that are at least as effective at reducing NO2, those measures should be preferred as long as the local authority can demonstrate that this will deliver compliance as quickly as a charging Clean Air Zone.
96. Government will assess plans to ensure they deliver the necessary air quality compliance, are fair, cost effective and where possible deliver wider benefits. Government will provide feedback on Local Authorities’ initial plans and will decide whether or not to approve final plans. A plan will only be approved by government, and thus be considered for appropriate funding support, if it can show that:
a. It is likely to cause NO2 levels in the area to reach legal compliance within the shortest time possible (and provides a route to compliance which reduces exposure as quickly as possible);
b. The effects and impacts on local residents and businesses have been assessed, including on disadvantaged groups, and there are no unintended consequences;
c. Proposals that request UK government funding support demonstrate value for money; and
d. The local measures have been carefully analysed using detailed local evidence and local air quality modelling tools and analysis methods, improving on the analysis at national level.
97. Local authorities should consider a wide range of innovative options, exploring new technologies and seeking to support the UK government’s industrial strategy so that they can deliver reduced emissions in a way that best meets the needs of their communities and local businesses. Their plans could include measures such as:
a. changing road layouts at congestion and air pollution pinch points;
b. encouraging public and private uptake of ULEVs;
c. using innovative retrofitting technologies and new fuels; and
d. encouraging use of public transport.
98. The UK government is not proposing that councils should seek to impose higher parking charges on vehicles or specific types of vehicle. Since 2010, the UK government has implemented a series of policies to rein in over-zealous parking enforcement and has revoked Whitehall guidance which previously called for higher parking charges and restrictions on parking spaces. Higher charges would represent an unfair charge on local residents who do not have an off-street parking space, and would undermine local shopping centres.

33
99. Government will place legal duties on relevant local authorities requiring them to develop and implement a plan designed to deliver compliance in the shortest possible time, and will work closely with each of them to ensure that it does so. In particular, while local authorities are encouraged to consider alternative approaches, any alternative will need to deliver compliance as quickly as a Clean Air Zone if it is to be preferred for inclusion in the plan.
100. The government will set up a £255m Implementation Fund to support local authorities to prepare their plans and deliver targeted action to improve air quality. This funding will support the immediate work to conduct feasibility studies and develop and deliver local plans. Further details will be announced later in the year. However, £40 million will be made available immediately to support local authorities to take action to improve air quality as quickly as possible.
101. The government will establish a Clean Air Fund, which will allow local authorities to bid for additional money to support the implementation of measures to improve air quality. This could include interventions such as improvements to local bus fleets, support for concessionary travel and more sustainable modes of transport such as cycling, or infrastructure changes. These interventions could enable local authorities to avoid the imposition of restrictions on vehicles, such as charging zones. To ensure the Fund fits the specific needs of each local area there will be a competitive process through which local authorities bid for support. Further details will be announced later in the year.
7.4.1.1 Clean Air Zones
102. A Clean Air Zone defines an area where targeted action is taken to improve air quality and resources are prioritised and coordinated in a way that delivers improved health benefits and supports economic growth. They will also help the UK to meet its legally binding carbon targets as set out in the Climate Change Act.
103. Any local authority can already implement a Clean Air Zone to address a local air quality issue. Following a consultation in 2016, the UK government has published a Clean Air Zone Framework in England43 setting out the principles for the operation of Clean Air Zones in any cities which decide, or are required, to do so.
104. Clean Air Zones fall into two categories:
a. Non-charging Clean Air Zones – These are defined geographic areas used as a focus for action to improve air quality. This action can take a range of forms including, but not limited to, those set out in Section 2 of the Framework but does not include the use of charge based access restrictions.
43 Defra & DfT (2017) Clean Air Zone Framework for England www.gov.uk/government/publications/air-quality-clean-air-zone-framework-for-england

34
b. Charging Clean Air Zones – These are zones where, in addition to the above, vehicle owners are required to pay a charge to enter, or move within, a zone if they are driving a vehicle that does not meet the particular standard for their vehicle type in that zone. Clean Air Zone proposals are not required to include a charging zone, and local authorities may consider alternatives to charging such as access restrictions for certain types of vehicles.
105. The Framework is designed to provide a consistent approach to the introduction of Clean Air Zones by local authorities in order to help businesses and individuals and support cities to grow and transition to a low emission economy.
106. The Framework identifies the outcomes that Clean Air Zones are expected to deliver:
a. Immediate action to improve air quality and health by delivering the statutory NO2 limit values within the shortest possible time;
b. Supporting local growth and ambition (decoupling growth and pollution); and
c. Accelerating the transition to a low emission economy.
107. The Framework provides a range of non-charging measures which local authorities can use, for example:
a. Exploring innovative retrofitting technologies and new fuels;
b. Buying ULEVs and encouraging local transport operators to do the same;
c. Encouraging private uptake of ULEVs via ensuring adequate chargepoints;
d. Encouraging use of public transport, cycling, walking, park and ride schemes, car clubs and car sharing;
e. Improving road layouts and junctions to optimise traffic flow, for example by considering removal of road humps; and
f. Working with local businesses and neighbouring authorities to ensure a consistent approach.
108. Under the Framework, charging Clean Air Zones are sub-divided into classes A - D on the basis of the types of vehicles to which the charging schemes may apply (Table 4). More detailed descriptions of these categories and any exemptions are set out in the Framework. Any revenues collected by local authorities will be reinvested to support local transport policies, which could cover public health projects or better town and city planning, promoting cleaner air. Local Authorities may also consider placing absolute restrictions on the access of certain types of vehicles to the Zone at all, or at specified times. However, local authorities should bear in mind such access restrictions

35
and charging would only be necessary for a limited period and should be lifted once legal compliance is achieved and there is no risk of legal limits being breached again
Table 4: Charging Clean Air Zone classes which local authorities may choose to deploy
Charging Clean Air Zone class Vehicles potentially included44
A Buses, coaches, taxis and private hire vehicles
B Buses, coaches, heavy goods vehicles (HGVs) taxis and private hire vehicles
C Buses, coaches, HGVs, large vans, minibuses, small vans/ light commercials, taxis and private
hire vehicles
D Buses, coaches, HGVs, large vans, minibuses, small vans/ light commercials, taxis and private
hire vehicles, cars, motorcycles and mopeds
109. Vehicles which meet at least the minimum emission standard for the Clean Air Zone will be able to enter or move within the zone free of charge (Table 5). Fully electric or hydrogen fuel cell ULEVs will be able to enter or move within zones free of charge.
Table 5: Charging Clean Air Zone minimum emission standards
Vehicle type Clean Air Zone minimum emission standards
Buses and coaches Euro VI
Heavy goods vehicles Euro VI
Vans Euro 6 (diesel) or Euro 4 (Petrol)
Cars Euro 6 (diesel) or Euro 4 (Petrol)
Motorcycles and mopeds (optional) Euro 3
44 More detailed descriptions of these categories and any exemptions are set out in the Clean Air Zone Framework.

36
110. In 2016, the UK government consulted on draft secondary legislation which would enable the Secretary of State for Environment, Food and Rural Affairs to require local authorities in the five cities named in the UK Air Quality Plan for tackling nitrogen dioxide published in December 2015 - Birmingham, Leeds, Nottingham, Derby and Southampton - and, by notice, other authorities in England, to implement air quality charging schemes using their powers in the Transport Act 2000.
111. Following the publication of this plan, the UK government will take steps in order to ensure that Clean Air Zone timetables are still the earliest achievable. If local authorities adopt a charging scheme, the UK government modelling suggests that local authorities could achieve statutory NO2 limit values in most cases by 2021. We will require local authorities to develop local plans and implement them at pace so that air quality limits are achieved within the shortest possible time. We will now require local authorities to set out initial plans 8 months from now, by the end of March 2018. These will be followed by final plans by the end of December 2018.
112. The UK government continues to expect local authorities in the five cities named above to deliver their Clean Air Zones by the end of 2019, with a view to achieving statutory NO2 limit values within the shortest possible time, which the latest assessment indicates will be in 2020.
113. Over time, all roads will achieve statutory NO2 limit values due to the natural upgrade of the national vehicle fleet to cleaner models. Charging Clean Air Zones aim to accelerate this turnover and thus need to be maintained only for as long as the statutory NO2 limit values are exceeded. As soon as it is possible to do so while maintaining legal compliance, these Clean Air Zones can be removed.
114. Public Health England will provide systematic support to those local authorities which will develop Clean Air Zones under this plan. This will include: provision of evidence for actions to reduce air pollution; support in translating that evidence into the most effective options given local circumstances; support with engagement and consultation with local communities; and consultation with local authorities on the appropriate indicators of success in developing and implementing Clean Air Zones to enable local authorities to monitor their progress.
7.4.1.2 Other action to address air quality at a local level
115. Where local authorities do not consider that a (non-charging or charging) Clean Air Zone is appropriate, for example because the road in question largely takes traffic through, rather than into, an area, the UK government will encourage local authorities to consider a variety of actions to address air quality. These could include retrofitting certain vehicles; traffic flow management to reduce vehicle emissions where evidence suggests this approach would be effective on the road in question; rerouting some traffic or other local solutions. Where a solution has been identified which meets the

37
criteria set out in paragraph 95, the government will require and fund local authorities to deliver it.
7.4.1.3 Local authorities with ongoing air quality exceedances
116. As above, the UK government expects that implementation of Clean Air Zones will take up to three years. It will only require local authorities to develop plans where evidence suggests measures could be put in place to bring forward achievement of statutory NO2 limit values. However, it is conscious that some local authorities are forecast to have air quality exceedances which are close to, but below air quality limits in 2021. The government will consider further steps to ensure that air quality in these areas improves and to ensure that forecast levels remain compliant. These steps could include preferential access to funding and government support to access and build on best practice.
7.4.1.4 Government support to help mitigate the impact of air quality measures on individuals and businesses
117. As the maps in Annex L set out, exceedances are highly localised. Local authorities’ plans should reflect this, seeking to target measures to minimise their impact on local residents and businesses. Government will scrutinise the plans put forward by local authorities on this basis, seeking to ensure measures are highly tailored and proportionate.
118. Where, despite this, agreed plans contain measures that have a significant impact on individuals, the government will work with local authorities to consider mitigation options; and will issue a consultation in Autumn 2017 to aid development and assessment of options. The measures considered will include options to support motorists: in particular private car drivers on lower incomes or those who may have to switch to a cleaner vehicle. Options considered could also include retrofitting, subsidised car club membership, exemptions and discounts from any restrictions, permit schemes for vans or concessionary bus travel.
119. Following the consultation on the draft plan, it is clear that a number of issues remain with such mitigation options and in particular with scrappage schemes – analysis of previous schemes has shown poor value for the taxpayer and that they are open to a degree of fraud (see box). The government welcomes views from stakeholders in the forthcoming consultation on whether it is possible to overcome these issues, alongside any wider options that should be considered. All proposals considered for government support would need to demonstrate that support can be targeted to those who need it most and that any scheme could be delivered effectively with minimal risk of fraud or abuse. Proposals considered would also need to demonstrate that they offer clear value for taxpayer’s money. Finally, given all measures will be funded by relevant taxes on new diesel cars alongside existing departmental budgets, proposals put forward would need to be fair to the taxpayers who would fund any measures.

38
Scrappage: Challenges in designing and delivering a fair and cost effective scheme
The aim of a scrappage scheme would be to target support at those who are most likely to be most significantly impacted by measures to improve air quality. However, there are a number of challenges associated with designing a scrappage scheme which would need to be addressed in before the government would consider direct support, including:
• Ensuring a fair use of taxpayer funds: Scrappage schemes can be expensive, and evidence suggests that it could be a poor use of taxpayer money. For example, analysis of the UK’s 2009 scheme and other schemes abroad suggests that the main beneficiaries are people who were planning to purchase one anyway, so the impact of government funding was subsidising individuals to bring forward new purchases
• Ensuring any scheme is targeted toward those drivers most impacted: Any scheme would need to target drivers who are directly impacted by measure to improve air quality: for example, a Clean Air Zone. However, clearly distinguishing between those who should be supported from those who should not is complex and risks excluding those who would be impacted by local air quality measures.
• Ensuring a scheme helps those who most need it: Even when targeted, those who take up a scrappage scheme will usually be required to provide some funding of their own towards the new purchase. Evidence from previous schemes suggests that those who benefit are those who could otherwise afford to purchase a new car: with those who are unable to bridge the funding gap unable to take part.
• Ensuring a scheme is deliverable, and is not open to fraud and abuse: The more a scheme is targeted towards a specific set of drivers, the more scope there is for a scheme to be open to fraud and abuse.
• Avoiding market disruption: Developing a targeted scheme could weaken demand until any scheme was launched. If people hold onto old vehicles which they would otherwise have upgraded, or even purchase old vehicles in the hope of qualifying for the scheme, this would have a negative impact on air quality.
The government is open to ideas from stakeholders through the consultation later this year on whether these challenges can be overcome – these will then be considered alongside other mitigation options once the local authorities’ plans become clear.

39
7.4.2. Action by Highways England to improve air quality on the Strategic Road Network in England
120. Highways England is the government company charged with operating, maintaining and improving England’s motorways and major A roads (‘the Strategic Road Network’).
121. Through the Road Investment Strategy, the UK government has allocated a ring-fenced £100 million for an Air Quality Fund available through to 2021 for Highways England to help improve air quality on its network.45 This is to meet the dual vision of the Road Investment Strategy of not only protecting the environment but also improving it, including air quality.
122. Our modelling indicates that less than 1% of the English Strategic Road Network could exceed statutory limits for NO2. Measures to speed up fleet turnover to newer less polluting vehicles will also contribute to tackling pollution on the Strategic Road Network and additional bespoke solutions will be considered see if they can help to achieve statutory NO2 limit values within the shortest possible time.
123. Highways England will continue to support the uptake of ULEVs by working to ensure that 95% of the network will have a chargepoint every 20 miles and that where possible, these will be rapid chargepoints.
124. Highways England will also continue to explore and test innovative technologies and ideas for improving air quality, working with national and international partners, through its designated Air Quality Fund. Highways England is conducting extensive work to help understand the air quality challenges alongside the Strategic Road Network and is exploring a diverse range of ideas to help support improvements in air quality. This work includes:
a. The construction of over fifty air quality monitoring stations across the Strategic Road Network to provide real time air quality information and facilitate earlier action where issues emerge;
b. A programme of pilot studies to look at innovative approaches to understanding or addressing air quality in the context of the Strategic Road Network. This is considering matters such as how specific geographic conditions impact on air quality, what can be done to the physical road environment to reduce air pollution or limit its spread, and how driver behaviour might be influenced on their network to reduce emissions;
c. Working with national partners to understand the specific barriers that driving on the Strategic Road Network presents for the uptake of low emission vans and lorries, and developing innovative options to try to overcome these; and
45 DfT (2015) Road investment strategy: 2015 to 2020 www.gov.uk/government/collections/road-investment-strategy

40
d. Collaborating with international organisations working to improve air quality on motorway networks, to share knowledge about potential solutions as they develop.
125. Where the programme of work and pilot studies demonstrate effective solutions to help manage the air quality challenge, Highways England will continue to work in partnership with stakeholders to see how it can best deliver these solutions. Highways England continues to work in partnership with a range of stakeholders, including local authorities such as Cornwall Council, Transport for Greater Manchester and East Staffordshire Borough Council, to consider the diverse air quality challenge across the Strategic Road Network and is committed to helping find solutions in partnership.
126. The UK government has considered potential measures to address exceedances on the Strategic Road Network and identified that changes in the traffic management through changes to average speed, reducing congestion and improving flow could potentially deliver some improvements. However, it also recognises that there is considerable uncertainty on the real world impacts of such actions on emissions of NOX and concentrations of NO2. There is therefore, a need to collect data from further monitoring in real world conditions, for example at sites where variable speed limits are used already for traffic management purposes, to understand better the link between congestion and air quality. As explained above, Highways England is progressing this research so that as new evidence becomes available it can be used accordingly.
7.4.3 Cycling and Walking Investment Strategy
127. The Cycling and Walking Investment Strategy was published on 21 April 201746 and sets out the UK government’s plans for cycling and walking, with an ambition up to 2040 for “making cycling and walking the natural choice for short journeys or as part of a longer journey.” Underlining the ambition are four objectives to: increase cycling activity; walking activity; reduce the rate of cyclists killed or injured on England’s roads and to increase the percentage of children walking to school, by 2020. Further to this, by 2025, the strategy aims to double cycling; increase walking to 300 stages per person per year and has a target of increasing the percentage of children aged 5 to 10 that usually walk to school to 55%.
128. The Strategy identifies £1.2 billion which may be invested in cycling and walking from 2016-21, including over £300 million of dedicated funding during this Parliament and other funding drawn from Highways England, schemes already committed in the Local Growth Fund and a portion of the Integrated Transport Block based on previous trends. This also includes £64 million of government funding from the Access Fund and the Cycling and Walking to Work Fund to encourage more cycling and walking to access work, education and training. The funding will support local projects in England
46 DfT (2017) Cycling and walking investment strategy www.gov.uk/government/publications/cycling-and-walking-investment-strategy
41
from 2017 to 2020. Many of the decisions on the allocation of these funds will be made by the relevant local body, in line with the government’s devolution and localism agenda.
7.4.4 Local Cycling and Walking Investment Plans
129. Local Cycling and Walking Infrastructure Plans are an important part of the Cycling and Walking Investment Strategy and are a new, strategic approach to identifying cycling and walking improvements required at the local level. They enable a long-term approach to developing local cycling and walking networks, ideally over a 10 year period, and form a vital part of the UK government’s strategy to increase the number of trips made on foot or by cycle.
130. The UK government has published guidance on the preparation of Local Cycling and Walking Infrastructure Plans to help local bodies that are interested in increasing cycling and walking in their local areas. The guidance will enable local bodies to take a more strategic approach to improving conditions for cycling and walking in order to support increases in travel on foot and by cycling, by:
a. understanding existing and future travel patterns, and the barriers and enablers to increasing cycling and walking;
b. identifying and mapping a recommended cycling network and core walking zones that will become the primary focus for infrastructure improvements; and
c. creating a prioritised pipeline of enhancements to ensure infrastructure effectively supports growth in cycling and walking, and contributes towards meeting broader local goals.
131. In order to assist local authorities in the development of their Local Cycling and Walking Infrastructure Plans the UK government is providing a programme of technical and strategic support. An expression of interest process was launched alongside the publication of the Cycling and Walking Investment Strategy in April 2017 to identify local authorities seeking support.
7.4.5. Updating government procurement policy
132. Central government is determined to lead by example and is thus taking action to ensure its operations and purchasing power support reductions in NO2 and other pollutants. The Government Buying Standards (GBS)47 for vehicles set down minimum mandatory and best practice standards requirements for cars, vans, buses and trucks.
47 Defra (2012) Sustainable procurement: the Government Buying Standards (GBS) www.gov.uk/government/collections/sustainable-procurement-the-government-buying-standards-gbs

42
All central government departments and their related organisations must ensure that they meet the minimum mandatory GBS.
133. The current GBS is focused primarily on reducing emissions of CO2 but later this year the government will publish revised standards with the intention of encouraging the purchasing and leasing of the cleanest vehicles. The information note accompanying the revised standards will have a statement that central government must play its part in reducing emissions of harmful pollutants, contributing to statutory limit values. The revised standards will also address safety and fuel efficiency.
134. These actions will ensure that emissions of NOx are taken into account in procurement decisions and will aim to help procurers make an informed decision as to the size and type of vehicle required, reflecting the area in which the vehicle will be used (e.g. in an urban and/or residential area) and the type of usage.
135. The new standard will encourage procurers to choose ULEVs where appropriate. Central government departments can make their procurement more sustainable by specifying the best practice standard in tenders. The wider public sector, including local government, is also encouraged to use the GBS in tenders. The government will work with the Energy Savings Trust and with local authorities to promote the use of GBS throughout the wider public sector and beyond in order to encourage procurers to choose the cleanest vehicles.
136. The government’s ‘Greening Government Commitments 2016-2020’48 also require compliance with the GBS and commit to embedding them in departmental and centralised procurement contracts, within the context of the government’s overarching priorities of value for money and streamlining procurement processes.
137. The revised GBS will reward manufacturers who reduce the emissions of carbon and NOx from their vehicles, sending a clear message to the market that it is not only carbon emissions that need to be reduced but also vehicle pollutant emissions.
7.4.6. Measures in Greater London
138. The Greater London urban area currently has the highest NO2 exceedance in the UK. The size and complexity of the city means that the task of reducing NO2 concentrations is the most challenging in the country.
139. The Mayor of London is taking forward a package of measures to achieve the statutory NO2 limit values for London within the shortest possible time. The UK government’s analysis has concluded that the Greater London Urban Area zone will achieve compliance in 2025 through measures including:
48 Cabinet Office & Defra (2016) Greening Government Commitments www.gov.uk/government/collections/greening-government-commitments

43
a. The introduction of an Emissions Surcharge (‘T-Charge’) from 23 October 2017, which will help discourage older (pre-Euro 4) polluting vehicles from central London;49
b. Launching an Ultra Low Emission Zone (ULEZ) in April 2019, subject to consultation, and extending it London-wide for heavy vehicles (HGVs, buses and coaches) and to the North and South Circular roads for all vehicles;50
c. Twelve low emission bus zones deploying the greenest buses on the most polluted routes;
d. For buses, phasing out pure diesel buses, an £86.1 million scheme to retrofit around 5000 older buses by September 2020,51 and a commitment to purchase only hybrid or zero-emission double decker buses from 2018;
e. For taxis (black cabs) no new diesel taxis will be licensed from 1 January 2018, with an expectation of 9,000 zero emission capable taxis by 2020;52
f. Introducing five low emission neighbourhoods spanning eight boroughs;
g. Issuing alerts for very high and high pollution alerts at 2,500 bus countdown signs, 140 road side variable message signs, and at all Tube stations. Messages (for high alerts) include encouraging people to walk, cycle and use public transport and to switch their car engine off when stationary;
h. Putting a significant shift towards walking, cycling and public transport use at the heart of the forthcoming Mayor’s Transport Strategy;
i. Public realm improvements to reduce traffic on Oxford Street and across the West End; and
j. Setting emission requirements for non road mobile machinery through the planning system and developing tighter air quality planning requirements for Opportunity Area Planning Frameworks and Housing Zones.
49 TfL (2017) T Charge https://tfl.gov.uk/modes/driving/emissions-surcharge?cid=emissions-surcharge
50 GLA (2017) Mayor plans to introduce Ultra Low Emission Zone in April 2019 www.london.gov.uk/press-releases/mayoral/mayor-plans-to-introduce-ulez-in-april-2019
51 GLA (2017) Capital’s most polluting buses to be upgraded www.london.gov.uk/press-releases/mayoral/capitals-most-polluting-buses-to-be-upgraded
52 TfL (2017) Taxi and private hire requirements https://tfl.gov.uk/modes/driving/ultra-low-emission-zone/taxi-and-private-hire-requirements?intcmp=35073

44
140. In June 2017, the Mayor of London published a consultation on a draft Transport Strategy,53 which includes the aim for London’s entire transport system to be zero emission by 2050. This would support the UK government’s wider aim for almost every car and van to be zero emission by the same date.
7.5. Additional actions in Scotland 141. This section includes actions focussed only in Scotland.
142. In November 2015, the Scottish Government published ‘Cleaner Air for Scotland – The Road to a Healthier Future’ (CAFS) 54 Scotland’s first separate air quality strategy. CAFS sets out in detail how Scotland intends to deliver further air quality improvements over the coming years, including full compliance with Directive requirements in Scotland by 2020.
143. CAFS sets out a national approach to improving air quality. The strategy contains 40 key actions within six policy areas – transport, health, climate change, legislation, placemaking and communications. CAFS also introduces two important new policy initiatives, the National Modelling Framework (NMF) and the National Low Emission Framework (NLEF).
144. The NMF promotes a standard approach to evaluating and assessing air quality, providing evidence to support the actions and decision making process around land use and traffic management to improve local air quality. A pilot project to develop and test the methodology was undertaken in Aberdeen in 2015/16, involving both air quality and traffic data. The approach has now been expanded to collect similar data in Glasgow, Dundee and Edinburgh, and a follow up exercise in Aberdeen using the refined methodology. Once the models for the four main cities have been finalised, a more strategic regional approach will also be developed.
145. The outputs from the NMF will be used to inform the National Low Emission Framework. This is designed to enable local authorities to appraise, justify the business case for and implement a range of transport related policy interventions to improve local air quality. The draft National Low Emission Framework will be issued for consultation later in 2017.
146. The Scottish Government’s Programme for Government, published in September 2016, commits to establishing Scotland’s first Low Emission Zone by 2018. Plans for delivering this will proceed along with the development of Scotland’s National Low
53 GLA (2017) Transport plan for fairer, greener, healthier & more prosperous city www.london.gov.uk/press-releases/mayoral/fairer-greener-healthier-more-prosperous-city
54 Scottish Government (2015) Cleaner Air for Scotland - The Road to a Healthier Future http://www.gov.scot/Publications/2015/11/5671

45
Emission Framework. A consultation on detailed proposals for the establishment and operation of the first Low Emission Zone will be published at the end of August 2017.
147. In Scotland, £4 million is available in 2017/18 to support air quality action.
7.6. Additional actions in Wales 148. This section includes actions focused only in Wales.
149. The Welsh Government is firmly committed to improving air quality across Wales and it is clear Wales still faces a significant challenge in meeting NO2 limits in some urban areas.
150. The Welsh Ministers are responsible for meeting air quality limit values in Wales pursuant to the Air Quality Standards (Wales) Regulations 2010. However, Defra coordinates assessment and air quality plans for the UK as a whole. Based on Defra’s projections for the air quality plan for NO2 published in 2015, all zones in Wales were predicted to be compliant with limit values by 2020 (the earliest projected date) or earlier.
151. Evidence has emerged over recent years in relation to the real world emissions of NOx exceeding legal type approval emissions limits, on which modelling assumptions are based. This disparity has meant the projected reductions in emissions from the introduction of stricter European standards have not materialised to the degree expected, and the scale of projected non-compliance in Wales, and elsewhere in the UK, has changed significantly over time. UK-scale compliance projections produced this year, based on updated emission factors, now show predicted areas of non-compliance in Wales in 2020 and beyond, without further measures being taken.
152. The Well-being of Future Generations (Wales) Act 2015 (“the WFG Act”) details the ways in which specified public bodies must set their well-being objectives, and take steps to meet them, in accordance with the sustainable development principle. It also specifies how they must work together to maximise their contribution to achieving the vision for Wales set out in the national well-being goals.55 The public bodies currently bound by the legislation are required to plan and act for the long term and preventatively, considering what they can achieve collectively and through the involvement of the population they serve, and how they can better integrate their actions with those of other parties in pursuit of common purpose. Poor air quality has fundamental impacts on human health, affecting the quality and duration of peoples’ lives, the quality of their lived environments and the resilience of their communities. It also has implications for equality of access to a healthy living environment. Reducing
55 A prosperous Wales, a resilient Wales, a healthier Wales, a more equal Wales, a Wales of cohesive communities, a Wales of vibrant culture and thriving Welsh language, a globally responsible Wales.

46
levels of air pollution to within legislative limits in the soonest possible time will contribute, either directly or through associated impacts, to the Well-being Goals.
153. To focus the Welsh public sector’s attention on the problem of poor air quality, the Welsh Government has made average population exposure to NO2 one of the national indicators under the WFG Act.56
154. Complementing the WFG Act, the new Environment (Wales) Act 2016 sets out the ‘sustainable management of natural resources’ (SMNR). SMNR means using natural resources in a way and at a rate that promotes the achievement of the objective to maintain and enhance the resilience of ecosystems and the benefits they provide, and that, in doing so, meets the needs of present generations without compromising the ability of future generations to meet their needs. The definition of “natural resources” includes air. The Act sets out a framework for the delivery of SMNR, which includes a statutory evidence base: The State of Natural Resources Report, and a statutory Natural Resources Policy. Welsh Ministers have a statutory duty to prepare, publish and implement the Natural Resources Policy (NRP), which must set out their policies for contributing to achieving sustainable management of natural resources, along with the key priorities, risks and opportunities for SMNR in Wales. This should include what they consider should be done in relation to climate change and biodiversity. A Welsh Government consultation to inform the development of the NRP closed on 13 February 2017. Drawing on the statutory evidence base in the State of Natural Resources Report, the consultation listed poor air quality as one of the key challenges to be addressed.57
155. Defra’s new UK-wide assessment has indicated air quality issues for Wales where, without further action, non-compliance may exist in future years.
156. Within the next 12 months the Welsh Government will consult on the detail for a Clean Air Zone Framework for Wales. The Framework will set out how the Welsh Government will ensure the effective implementation of Clean Air Zones, where evidence demonstrates they will bring about compliance before other measures and in the shortest possible time. A National Clean Air Zone Framework for Wales will also provide an enduring impetus for actions to improve air quality over and above compliance thresholds.
157. The latest modelling undertaken by Defra identified areas across the UK that may need to implement a Clean Air Zone to achieve compliance in the shortest time. One area identified in Wales, for which, based on current projections, a zonal approach would accelerate compliance, is in Cardiff. The Welsh Government anticipates a Clean
56 Welsh Government (2017) Stats Wales https://statswales.gov.wales/Catalogue/Environment-and-Countryside/Air-Quality
57 Welsh Government (2016) Consultation to inform the development of the Natural Resources Policy https://consultations.gov.wales/consultations/natural-resources-policy-development

47
Air Zone, with vehicle access restrictions, could be implemented in Cardiff during 2021 or earlier if possible, thereby achieving compliance by 2022 or sooner. Implementation of a Clean Air Zone will be subject to further national and local assessment and ongoing work with the City of Cardiff Council to understand whether alternative local measures could achieve compliance more quickly. This further assessment will need to be based on local as well as national data modelling relating to both air quality and transport. The modelling will be followed by a thorough options assessment, local consultation, planning and implementation. The actions up to the point of implementation should complete during 2019.
158. The latest Defra modelling does not preclude the need for Clean Air Zones to bring forward compliance in other areas should evidence change in the future, or new areas of exceedance occur. Neither does it preclude local authorities choosing to implement Clean Air Zones in other areas, beyond where limits are currently exceeded, in order to help achieve wider exposure reduction and associated public health benefits. The Clean Air Zone framework for Wales will help to support local authorities in developing such proposals.
159. For the purposes of accelerating compliance, the Welsh Government will work with the City of Cardiff Council, and any future local authorities responsible for areas identified as requiring a Clean Air Zone. Where alternative local measures are suggested, to be effective they must be capable of achieving compliance within the same amount of time, or sooner, than a Clean Air Zone with access restrictions.
160. The Welsh Government recognises a Clean Air Zone is not appropriate for the purposes of accelerating compliance in all cases, for example outside of urban areas where no alternative routes are available. In such situations other action will be required. The Welsh Government will work with the local authorities responsible for these areas to identify specific local solutions on a case-by-case basis to achieve compliance in the shortest time.
161. The City of Cardiff Council’s Local Development Plan includes the target of 50% of all journeys to be made by sustainable transport by 2026. Cardiff’s Local Transport Plan, approved by the Welsh Government in May 2015, sets out the main transport infrastructure proposals which will support this significant modal shift. The Local Transport Plan recognises the need to improve air quality. Its programme prioritises: development of active travel networks to increase walking and cycling for local journeys: the provision of cycling infrastructure; the bus network; reduced speed limits; reducing congestion; improving transport efficiency and reliability; and bus based park and ride.
162. The Welsh Government will also continue to invest in measures designed to promote modal shift from and within road transport, including the following:
a. Taking forward the Cardiff Capital Region Metro project – an integrated public and active travel system for South Wales focused on joining up and improving

48
rail infrastructure, rail stations, park and ride schemes, bus routes and walking and cycling schemes;
b. Taking forward a North East Wales Metro concept;
c. Intelligent Transport Systems (ITS) and other innovative technical solutions to reduce congestion on our strategic road network;
d. Supporting modal shift for freight from road to rail and sea through grant support schemes;
e. Funding infrastructure and other projects that put in place the conditions to increase levels of walking and cycling in line with the aims of the Active Travel (Wales) Act 2013, including directing funding at local walking and cycling infrastructure improvements;
f. Improvements to the trunk road network in Wales designed to reduce congestion such as relief roads and bypasses;
g. The Bus Service Support Grant and providing enhanced grant for operators with fleets that reduce emissions;
h. Trialling free travel on the Traws Cymru bus route and evaluating the impact lower or no public transport fares have on modal shift;
i. Working with local authorities and bus operators to identify and resolve congestion and pinch points on the network that impact on bus reliability, with a view to developing a package of bus priority measures along key strategic corridors; and
j. Reviewing the case for investing in measures that promote the uptake of low carbon vehicles additional to those already available via UK government schemes, including additional support for low emission vehicle charging infrastructure and the case for establishing a separate, ‘Green Bus’ Fund for Wales (the UK government’s Low Emission Bus Fund (LEBS) extends to Wales – Section 7.3).
163. As Highway Authority for the Trunk Road and Motorway network in Wales, the Welsh Government is reviewing measures for the Welsh Government network to improve NO2 levels for locations where exceedances have been noted.
164. The Welsh Government actions set out below have been agreed following the 2016 public consultation on local air quality management (LAQM) in Wales: 58
58 Welsh Government (2016) Consultation: Local air quality and noise management in Wales https://consultations.gov.wales/consultations/air-quality-and-noise-management-wales

49
a. The process for local authorities to declare air quality management areas (AQMAs) once locations suffering from poor air quality are confirmed, has been streamlined. Welsh Government will also take steps to ensure an effective local air quality action plan is put in place promptly once an AQMA has been declared.
b. New guidance has been issued to local authorities under the Environment Act 1995, stressing the greater public health benefits likely to result from actions to reduce air pollution in an integrated fashion for the population as a whole. The new annual progress report for LAQM in Wales will require local authorities to report on the policies they have in place to reduce average levels of air pollution at dwellings across their area. Furthermore, local air quality action plans will in future be required to state how actions are being taken forward not solely with a view to achieving technical compliance with the national air quality objectives, but also with a view to maximising their contribution to reducing average levels of air pollution at dwellings across the local authority area.
c. Guidance will be issued for local Health Board Directors of Public Health, local authority Directors of Public Protection and Public Health Wales, encouraging collaboration to support the delivery of LAQM plans.
d. Action to improve local air quality will continue to be supported through the Environment and Sustainable Development Single Revenue Grant for Welsh local authorities.
e. The Well-being of Future Generations (Wales) Act 2015 will be amended to add air quality to the list of things to be taken into account by Public Services Boards when preparing assessments of local well-being.
f. National planning policy and guidance is being reviewed in relation to air quality, taking responses to the recent consultation on LAQM into account. The review is being carried out with the close involvement of local authorities and other stakeholders. Wales’ first National Development Framework will also take air quality into account.
g. Work will be taken forward with stakeholders to initiate an educational campaign on air quality for health professionals and the general public.
7.7. Additional actions in Northern Ireland 165. This section includes actions focussed only in Northern Ireland.
50
166. The Northern Ireland Executive Draft Programme for Government (PfG) 2016-2021,59 contains strategic outcomes which, taken together, set a clear direction of travel and enable continuous improvement on the essential components of societal wellbeing. They touch on every aspect of government, including the attainment of good health and education, economic success, and confident and peaceful communities. In addition to merely fulfilling its statutory obligations, the Northern Ireland Executive will in future be able to target those things that make real improvements to the quality of life for the citizen. The outcomes are supported by fourteen primary indicators which are clear statements for change. Two outcomes in particular are relevant to delivering improvements in Northern Ireland’s air quality:
a. PfG Outcome 2: We live and work sustainably – protecting the environment
b. PfG Outcome 13: We connect people and opportunities through our infrastructure
167. The Northern Ireland Executive has outlined below, the focus of the outcomes and the actions proposed in the PfG Delivery Plan to assist in the achievement of the outcomes.
PFG Outcome 2: We live and work sustainably – protecting the environment
168. This outcome reflects the importance the Northern Ireland Executive attaches to ensuring that its ambition for economic growth and social progress takes into account the impact on the environment and depletion of its finite resources, its natural capital. Northern Ireland benefits from the goods and services that its natural environment provides, including food, renewable energy, water purification, flood mitigation and places for recreation, education and inspiration. Ultimately, health and prosperity depend on its natural environment. Achieving economic growth at the cost of its degradation through over-exploitation or pollution is not sustainable.
169. This is recognised internationally through the Sustainable Development Goals (SDGs) contained in the ‘Transforming our world: the 2030 Agenda for Sustainable Development’. The new goals and targets came into effect on 1 January 2016 and are designed to guide the decisions taken over the period up to 2030. The outcomes and indicators in the Draft Programme for Government will support the SDGs.
Air Quality and Sustainable Transport
170. Northern Ireland’s geography and maritime position ensure it has a steady supply of good air; however NO2 pollution from road traffic is a significant problem whilst the proportion of journeys made by public transport and active travel is fairly stable over time. This is despite the fact that the majority of journeys people undertake are short in
59 The status of the Draft Programme for Government 2016 – 21 and associated Delivery Plans is draft at present. Its contents are conditional upon formal approval in due course.

51
distance and/or within areas or strategic corridors with access to public transport services. In 2015, 25% of all journeys made were by walking, cycling or public transport. This compares to 22% in 2014 and 25% ten years ago.
171. There are a number of factors underlying and impacting on the failure to shift this data-trend. The growth of the economy and population has increased the demand for transport, but increased prosperity has tended to result in an increase in travel by private vehicle. Achieving a shift from the car to bus or rail services for longer journeys and to walking or cycling for shorter journeys will reduce demand on the road network allowing it to work more efficiently; assist in the better movement of freight; reduce emissions and improve health by increasing levels of physical activity. Public transport also contributes to economic growth, competitiveness and supports social inclusion. Cycling and walking have significant health and social benefits for individuals
Actions:
172. The Northern Ireland Executive will improve air quality and increase sustainable transport through the following actions:
a. Revise Northern Ireland’s air quality policy and legislation and devise an Air Quality Action Plan.
b. Develop air quality planning guidance.
c. Promote the use of electric vehicles.
d. Ensure Local Development Plans and planning decisions take account of existing regional strategic planning and transport policies and guidelines to encourage the use of walking, cycling and public transport.
e. Invest in public transport, cycling and pedestrian infrastructure to encourage greater use of these modes.
f. Build a safe and accessible cycling infrastructure by delivering bicycle networks and a Strategic Plan for Greenways.
g. Establish Quality Bus Corridors and work with major employers to promote salary sacrifice and tax smart schemes for bike and public transport.
h. Engage employers, schools and hospitals to develop travel plans and enhance active travel and public transport linkages, including by integrating rural and accessible transport services with health and education passenger transport.
173. The Northern Ireland Executive will make Northern Ireland’s energy use more sustainable, reducing greenhouse gas emissions through the following actions:

52
a. Address the future of energy policy and strategy, including the increased use of renewable and sustainable sources, through the Strategic Energy Framework Continue to support businesses to improve energy efficiency.
b. Expand the natural gas network to the west and south-east of Northern Ireland to deliver affordable warmth and boiler replacement schemes.
PfG Outcome 13: We connect people and opportunities through our infrastructure
174. Investment in Northern Ireland’s infrastructure is vital to provide the physical and digital connectivity to allow it to compete on the global stage. That connectivity needs to be regionally balanced to ensure a level playing field of opportunity in terms of access to market and ability to establish and grow businesses. It also however needs to take account of the specific current and future economic needs of the region – that includes in infrastructure terms the need to invest in better access to major population and business centres through the strategic road network in the West, and the need to support economic and housing growth including through enhancements to the water and digital infrastructure. The key themes are maintaining and developing Northern Ireland’s infrastructure in line with wider economic and demographic changes so that its essential transport, water and telecommunications needs can be met going forward. Therefore the Northern Ireland Executive will invest both to enhance Northern Ireland’s road network to support economic growth and to expand the numbers of people using public transport and active travel for their daily needs.
Transport
175. In relation to transport, the evidence shows that continued growth in private vehicles will exacerbate congestion particularly in Northern Ireland’s urban centres and at key interfaces. It is clear that simply building more roads will not resolve the issues. Enhanced bus and rail services and greater take-up of those services will enable the transport network to be more efficient as well as reducing demand particularly at peak hours. In addition, there are wider societal benefits from public transport and also from increased use of cycling and walking as a means of transport in terms of health, air quality and quality of life benefits. That analysis underpins the identification of two transport indicators – those of improving transport connections measured by average journey times on key economic corridors and of increasing the usage of public transport and active travel.
Actions:
176. The Northern Ireland Executive will bring forward major works to improve travel times, ease congestion and support economic growth through the following actions:
a. Progression and delivery of strategic projects, including:
i. Upgrades of strategic road corridors.
ii. Belfast Rapid Transit (BRT).

53
iii. Belfast Transport Hub Develop and deliver, subject to budget availability, other measures to improve connectivity.
b. Develop, expand and modernise public transport to make it a more viable option.
c. Develop the Derry/Londonderry Transport Hub and enhance public transport between Northern Ireland’s population centres.
d. Develop in partnership with Translink, community transport and private operators' feeder services linking rural communities to regional public transport services.
e. Enhance the public transport infrastructure through investment in buses and trains, in track/platform upgrades and essential safety to maintain the rail network.
f. Encourage people to use alternative travel schemes.
g. Implement the Regional Strategic Plan for Greenways and urban Bicycle Network Plans.
h. Deliver an enhanced Active Schools Programme.
i. Measures to reduce local street congestion.

54
8. Raising awareness 177. Access to information is essential to enable the public to make informed choices to
help tackle the sources of, and to avoid exposure to, air pollution.
178. The UK government will continue to co-fund the Go Ultra Low60 campaign with industry. The campaign promotes the uptake of ULEVs by helping motorists and fleets to understand the benefits, cost savings and capabilities of the wide range of ULEVs on the market.
179. The UK government and the devolved administrations also publish near real-time air pollution monitoring and forecasting information,61 with social and other media used to communicate actual or forecast episodes of high pollution.
180. Local authorities, non-government organisations and other stakeholders play a key role in disseminating advice and guidance to those affected by poor air quality. The Local Government Association, Public Health England and Defra have issued air quality guidance for local Directors for Public Health.62
181. Examples of local SMS messaging services available to inform vulnerable people about air pollution levels in their area include airAlert63 and airTEXT64.
60 Go Ultra Low www.goultralow.com
61 England https://uk-air.defra.gov.uk/ ; Scotland www.scottishairquality.co.uk/ ; Northern Ireland www.airqualityni.co.uk/ ; Wales www.welshairquality.co.uk/
62 Local Government Association (2017) Air quality: a briefing for directors of public health www.local.gov.uk/air-quality-briefing-directors-public-health
63airAlert www.airalert.info
64 airTEXT www.airtext.info
55
9. Monitoring and evaluation 182. The UK government, the Scottish Government, the Department of Agriculture,
Environment and Rural Affairs in Northern Ireland and the Welsh Government will closely monitor the implementation of the plan and evaluate the progress on delivering its objective. This will involve continued formal reporting processes and ongoing engagement with local authorities, industry, and other relevant parties.
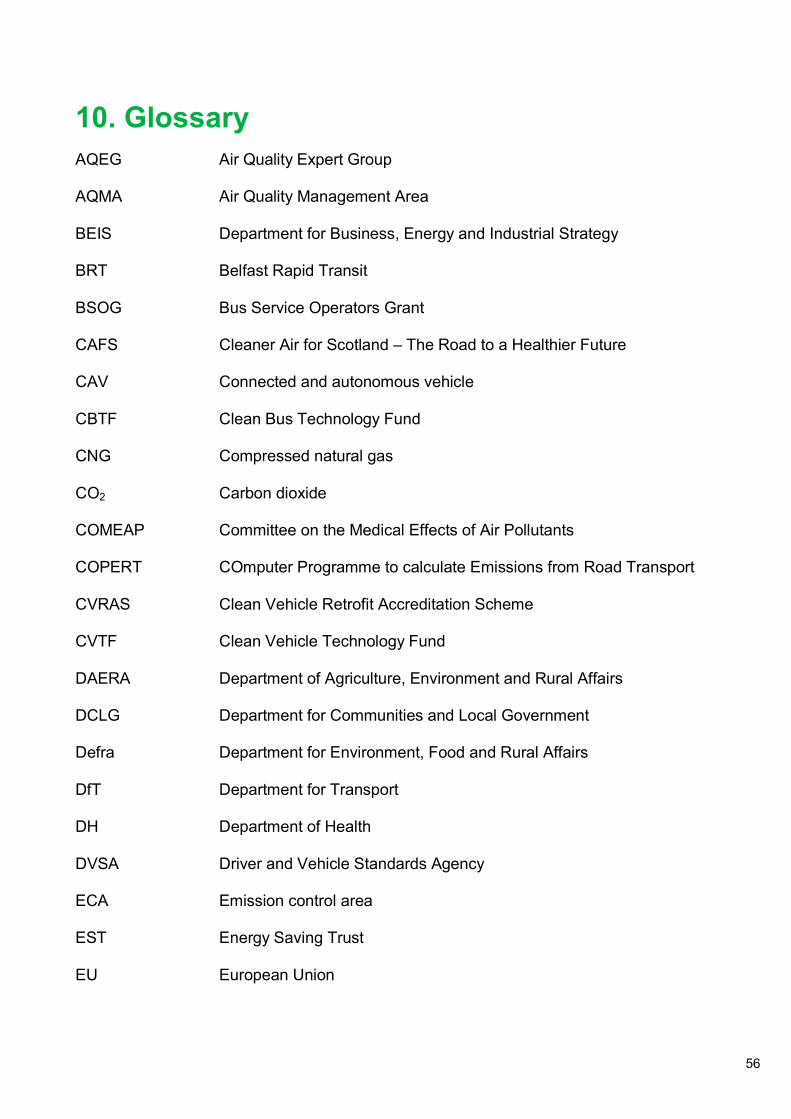
56
10. Glossary AQEG Air Quality Expert Group
AQMA Air Quality Management Area
BEIS Department for Business, Energy and Industrial Strategy
BRT Belfast Rapid Transit
BSOG Bus Service Operators Grant
CAFS Cleaner Air for Scotland – The Road to a Healthier Future
CAV Connected and autonomous vehicle
CBTF Clean Bus Technology Fund
CNG Compressed natural gas
CO2 Carbon dioxide
COMEAP Committee on the Medical Effects of Air Pollutants
COPERT COmputer Programme to calculate Emissions from Road Transport
CVRAS Clean Vehicle Retrofit Accreditation Scheme
CVTF Clean Vehicle Technology Fund
DAERA Department of Agriculture, Environment and Rural Affairs
DCLG Department for Communities and Local Government
Defra Department for Environment, Food and Rural Affairs
DfT Department for Transport
DH Department of Health
DVSA Driver and Vehicle Standards Agency
ECA Emission control area
EST Energy Saving Trust
EU European Union

57
Euro standards EU-wide standards for exhaust emissions of air pollutants. Current standards for new vehicles are: ‘Euro 6’ for light duty vehicles (cars and vans) and ‘Euro VI’ for heavy duty vehicles.
EV Electric vehicle
FCEV Hydrogen fuel cell electric vehicle
GHG Greenhouse gas
GLA Greater London Authority
HGV Heavy goods vehicle
HMRC Her Majesty’s Revenue and Customs
HMT Her Majesty’s Treasury
HRS Hydrogen refuelling stations
IMO International Maritime Organisation
ITS Intelligent Transport Systems
LAQM Local Air Quality Management
LCCT Low Carbon Truck Trial
LEBS Low Emission Bus Scheme
LEZ Low Emission Zone
LGA Local Government Association
LGV Light goods vehicle
Low CVP Low Carbon Vehicle Partnership, a membership organisation bringing together government, manufacturers, technology companies, environmental organisations and other key stakeholders.
LNG Liquefied natural gas
LPG Liquefied petroleum gas
MARPOL International Convention for the Prevention of Pollution from Ships
NEDC New European Drive Cycle
NMF National Modelling Framework (Scotland)
NLEF National Low Emission Framework (Scotland)
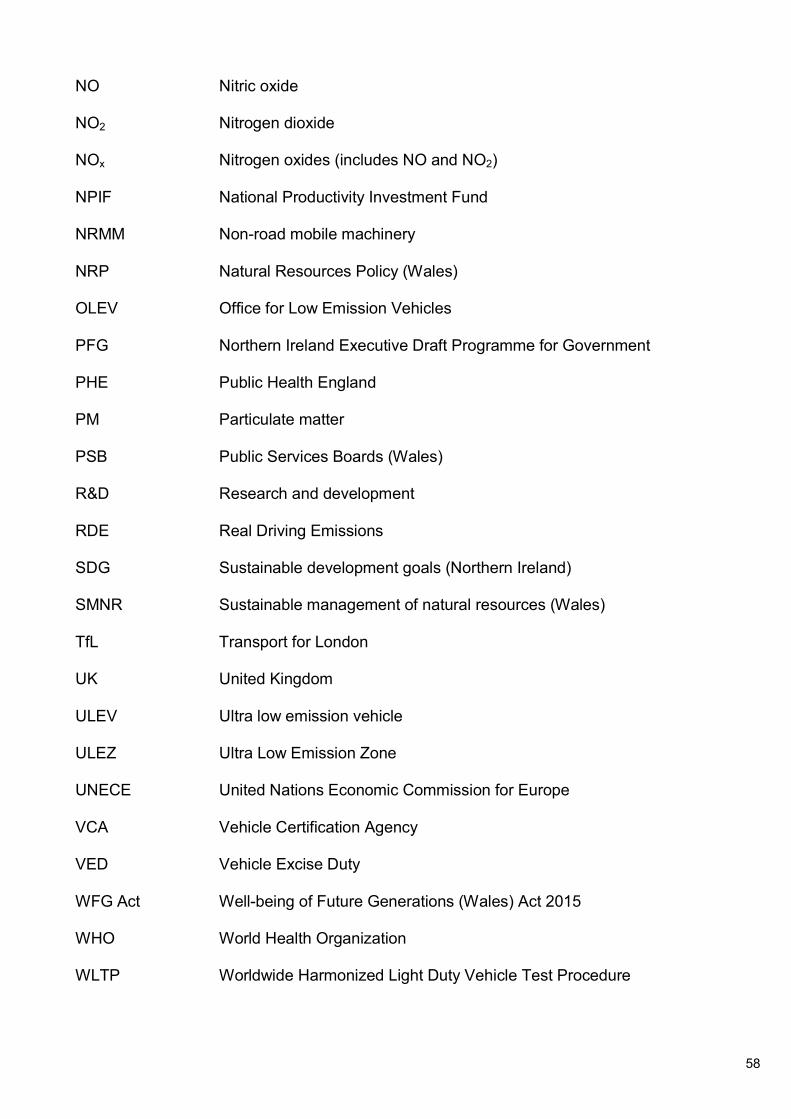
58
NO Nitric oxide
NO2 Nitrogen dioxide
NOx Nitrogen oxides (includes NO and NO2)
NPIF National Productivity Investment Fund
NRMM Non-road mobile machinery
NRP Natural Resources Policy (Wales)
OLEV Office for Low Emission Vehicles
PFG Northern Ireland Executive Draft Programme for Government
PHE Public Health England
PM Particulate matter
PSB Public Services Boards (Wales)
R&D Research and development
RDE Real Driving Emissions
SDG Sustainable development goals (Northern Ireland)
SMNR Sustainable management of natural resources (Wales)
TfL Transport for London
UK United Kingdom
ULEV Ultra low emission vehicle
ULEZ Ultra Low Emission Zone
UNECE United Nations Economic Commission for Europe
VCA Vehicle Certification Agency
VED Vehicle Excise Duty
WFG Act Well-being of Future Generations (Wales) Act 2015
WHO World Health Organization
WLTP Worldwide Harmonized Light Duty Vehicle Test Procedure

59
Annex A – Wider Clean Air Strategy 183. Air pollution is a mixture of particles and gases emitted into the atmosphere that can
have adverse effects on human health. Tackling poor air quality in all its forms is a UK government priority. The UK government has adopted ambitious, legally-binding targets to reduce significantly emissions of five damaging air pollutants for 2020 and 2030 – nitrogen oxides; particulate matter; sulphur dioxide; non-methane volatile organic compounds and ammonia. The focus of this plan is on the UK government’s most immediate air quality challenge: to reduce concentrations of NO2 around roads.
184. However, the UK government recognises that vehicles are not the only source of air pollution. Many everyday activities such as industrial activity, farming, heating homes and generating energy also have a detrimental effect on air quality. So, in addition to urgent action to tackle NO2 hotspots around roads, we also need to reduce harmful emissions of other air pollutants. These everyday activities cannot stop. They are an essential part of our daily lives and our economy. But there are cost-effective changes that we can all make to secure cleaner towns and cities and a clean, green economy.
185. We will publish a wider Clean Air Strategy in 2018 setting out how we will meet our international commitments to significantly reduce emissions of five damaging air pollutants by 2020, and 2030.

60
Annex B – National Productivity Investment Fund 186. In the 2016 Autumn Statement, 65 the UK government announced a new National
Productivity Investment Fund (NPIF) targeted at four areas that are critical for productivity, including transport and research and development (R&D). The NPIF provides for £23 billion of spending between 2017-18 and 2021-22 taking total spending on housing, economic infrastructure and R&D to £170 billion over five years.
187. The NPIF will provide additional support in order to tackle congestion on the roads and ensure the UK’s transport networks are fit for the future. It will also enhance the UK’s position as a world leader in science and innovation. By 2020-21, the NPIF will:
a. Provide an additional £1.1 billion in new funding to relieve congestion and deliver much-needed upgrades on local roads and public transport networks. On strategic roads, an extra £220 million will be invested to tackle key pinch-points;
b. Invest a further £290 million for reducing transport emissions. This includes £150 million in support for low emission buses and taxis and £80 million to support ULEV charging infrastructure; and
c. Provide an additional £4.7 billion for R&D, to fund both the Industrial Strategy Challenge Fund managed by Innovate UK and the research councils, and funding for innovation, applied science and research awarded by UK Research and Innovation.
188. The Spring Budget 201766 provided further detail of how NPIF funds will be invested in transport and R&D:
a. Local transport – NPIF allocations have already been made for 2017-18, supporting local projects like improvements in Blackpool town centre, improving the A483 corridor in Cheshire, major maintenance of the Leicester Outer Ring Road, and a new roundabout at Hales in Norfolk. £690 million more will be competitively allocated to local authorities, with £490 million made available by early Autumn 2017. Several of those local authorities included in Table 3 of this document have submitted bids, and will be assessed alongside other bids.
65 HMT (2016) Autumn Statement 2016 www.gov.uk/government/publications/autumn-statement-2016-documents
66 HMT (2017) Spring Budget 2017: documents www.gov.uk/government/publications/spring-budget-2017-documents

61
b. Strategic Road Network – The government has completed a strategic study on relieving congestion in the south-west sections of the M25 and will now develop options ahead of the next Road Investment Strategy. The Budget announced regional allocations of the £220 million NPIF investment for pinch points on the Strategic Road Network. DfT will announce details of individual schemes in 2017.
c. R&D - The new Industrial Strategy Challenge Fund will support collaborations between business and the UK’s science base. Initial investment of £270 million in 2017-18 will kick-start the development of innovative technologies that have the potential to transform the UK economy. There will be a focus on areas where a potential global market could be created or disrupted by new innovation and there is evidence that the UK has capabilities to meet market needs in terms of research strength and business capacity. The first wave of challenges funded from the Industrial Strategy Challenge Fund will include leading the world in the development, design and manufacture of batteries that will power the next generation of electric vehicles, helping to tackle air pollution.
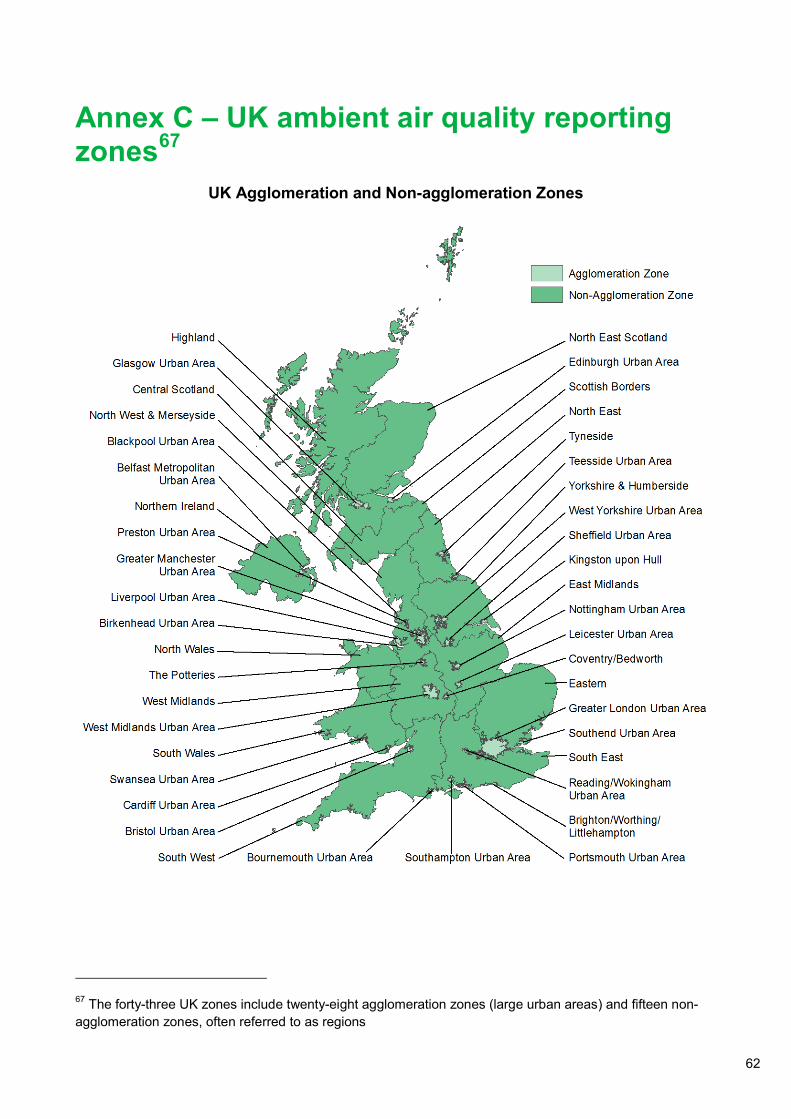
62
Annex C – UK ambient air quality reporting zones67
UK Agglomeration and Non-agglomeration Zones
67 The forty-three UK zones include twenty-eight agglomeration zones (large urban areas) and fifteen non-agglomeration zones, often referred to as regions

63
Annex D – Existing actions to reduce emissions of NOx from the current road vehicle fleet in problem locations now
Low emission zones 189. London has had a Low Emission Zone (LEZ) in place since 2008.68 Many local
authorities outside London are taking steps to encourage cleaner ways of travel and support the uptake of cleaner vehicles through the introduction of low emission zones; retrofit programmes; increasing the proportion of ULEVs in their fleets; providing infrastructure such as electric vehicle charging points; introducing park and ride schemes; and promoting cycling and walking. Other cities outside London which have put in place LEZs include Oxford, Norwich, and Brighton and Hove.69 70
Investment in bus services
Bus Service Operators Grant
190. In the 2015/16 financial year, the UK government invested over £250 million via the Bus Service Operators Grant (BSOG) to support bus services in England.71 Bus operators who run their services using low or ultra low emission buses receive a higher rate of payment than those using diesel-powered buses.
68 Transport for London https://tfl.gov.uk/modes/driving/low-emission-zone
69 Oxford City Council www.oxford.gov.uk/info/20216/air_quality_management/208/oxfords_low_emission_zone_lez
70 Brighton and Hove City Council www.brighton-hove.gov.uk/content/parking-and-travel/travel-transport-and-road-safety/low-emission-zone
71 DfT (2016) Bus Services: grants and funding www.gov.uk/government/collections/bus-services-grants-and-funding

64
Green Bus Fund
191. In addition, the UK government has invested a total of almost £89 million via the Green Bus Fund to help bus companies and local authorities in England to put over 1200 new low carbon buses on the roads.72
Low Emission Bus Scheme
192. The UK government has also funded the successor to the Green Bus Fund: the Low Emission Bus Scheme (LEBS)73 which aims to support the improvement of local air quality and to increase the uptake of low and ultra low emission buses, speeding up the transition to an ultra low emission bus fleet in England and Wales.
193. In the first round of LEBS in July 2016, funding of £30 million was awarded to thirteen successful bidders enabling them to add over 300 buses – including electric, hybrid, hydrogen and biomethane (natural gas) buses – to their fleets, and to install over £7 million worth of supporting infrastructure.
Investment in the national and local road network 194. Traffic speed and flow can impact on NOx emissions, which are typically higher
when an engine is under higher loads, such as during acceleration. Infrastructure schemes to tackle road congestion, which reduce stop-start traffic and thus acceleration events can also have air quality benefits.
195. In the 2016 Autumn Statement, the UK government announced new funding (Annex A) to relieve road congestion, including additional investment to tackle key pinch-points on the Strategic Road Network (motorways and major A roads) in England.
The Strategic Road Network in England
196. Highways England is the government company charged with operating, maintaining and improving England’s motorways and major A roads (‘the Strategic Road Network’).
197. Through the Road Investment Strategy,74 the UK government has allocated a ring-fenced £100 million for an Air Quality Fund available through to 2021 for Highways England to help improve air quality on its network. This is to meet the dual vision of the
72 DfT (2013) Details of the Green Bus Fund www.gov.uk/government/publications/details-of-the-green-bus-fund
73 OLEV (2015) Low Emission Bus Scheme www.gov.uk/government/publications/low-emission-bus-scheme
74 DfT (2015) Road investment strategy: 2015 to 2020 www.gov.uk/government/collections/road-investment-strategy

65
Road Investment Strategy of not only protecting the environment but also improving it, including air quality.
198. The UK government has also allocated a ring-fenced £250 million for a Cycling, Safety, and Integration Fund available through to 2021 for Highways England to improve safety, increase provision for cyclists on and near its network, and enhance access for a variety of users, including pedestrians, horse riders and the disabled. This includes £100 million to deliver improvements for cyclists at 200 locations on the network.
Other roads
199. Local authorities are responsible for roads outside the Strategic Road Network and many local authorities in England have put in place infrastructure schemes and other measures to tackle local congestion and improve air quality.
200. Defra’s air quality grant scheme provides funding to eligible local authorities to help improve air quality. The scheme has funded a variety of projects since it started in 1997, including traffic management measures.
201. Other measures to address air quality, both on local roads and on the Strategic Road Network, are described throughout this document.
Retrofit technology 202. Retrofitting refers to all or part of an engine being modified with pollution-reducing
and/or fuel saving technologies. There is a small but successful retrofit industry in the UK which mainly focuses on larger vehicles. Several thousand vehicles have already been retrofitted in recent years under Department for Transport (DfT) programmes. Since 2013, government has awarded over £27 million to retrofit almost 3,000 of the oldest vehicles (mainly buses) under the following three schemes:
a. £5 million was provided to Transport for London (TfL) to retrofit 900 buses;
b. The Clean Bus Technology Fund (CBTF) 75 which has provided £14.1 million (over 2013/14 and 2015/16) to support the retrofit of nearly 1,000 local buses; and
c. The Clean Vehicle Technology Fund (CVTF) 76 which has provided £8 million (in 2014/15) to local and transport authorities to retrofit over 1,200 vehicles using
75 DfT (2016) Clean Bus Technology Fund 2015 www.gov.uk/government/collections/clean-bus-technology-fund
76 DfT (2016) Clean Vehicle Technology Fund www.gov.uk/government/collections/clean-vehicle-technology-fund
66
innovative pollution reducing technologies in a range of vehicles (buses, taxis, vans, fire engines and ambulances).
Clean Bus Technology Fund
203. The most recent of these schemes was the CBTF 2015/16, where 18 local authorities were awarded funds to retrofit 439 buses with technology to reduce emissions of NOx by at least 50% and up to 90%. The buses were fitted with exhaust gas treatment systems called selective catalytic reduction (SCR) and, as part of the award, councils must continue to monitor the schemes and provide evidence of their effectiveness. Due to their high mileage and long operational life, introducing greener buses can significantly help air quality in town and city centres. The buses upgraded from this fund will complete more than a million journeys a year.
Clean Vehicle Technology Fund
204. The CVTF started to expand retrofit to other types of vehicles, including coaches and taxis, and supported innovative technologies including solar panels on ambulances in Yorkshire and conversion of taxis (black cabs) from diesel to Liquid Petroleum Gas in Birmingham. A prerequisite of the grant was for local authorities to undertake NOx monitoring to demonstrate the performance of the retrofit technology.
Evaluation of Clean Bus Technology Fund and Clean Vehicle Technology Fund projects
205. The government carried out a full evaluation of the projects under CBTF and CVTF in partnership with the Low Carbon Vehicle Partnership in order to develop an evidence base on retrofit options and understand further the successes and shortcomings of past schemes. The evaluation determined whether or not the retrofit technologies implemented achieved the expected NOx reductions, and helped identify any common delivery issues. The evaluation covered all technologies deployed so far. Working with the Low Carbon Vehicle Partnership, the UK government will use the lessons learned from the evaluation of previous schemes to inform the design of new schemes and to help stakeholders to understand the retrofit market.
Driving style 206. Excessive speed, maintaining high engine revolutions, and accelerating hard are all
known to increase fuel consumption and can affect emissions of NOx and PM. Currently, a £2.8 million programme is managed by the Energy Savings Trust (EST) to support businesses reduce their fuel use, though fleet choice and operation, and training drivers to improve their driving techniques. Fuel consumption is typically reduced by around 15% by the end of a single lesson, with longer term savings between 3% and 6%. Further work is being carried out to determine whether there is particular driving style that supports both fuel efficient driving and reduced NOx. Fuel
67
efficient driving is covered by the Driver and Vehicle Standards Agency’s National Standards for safe and responsible driving and the learning to drive syllabus but is not explicitly assessed in the practical driving test, i.e. it’s not a pass or fail element, although drivers may receive feedback. Many of the behaviours associated with safe driving (which is a pass/fail element) such as road awareness, anticipation and avoiding excessive speed will also support fuel efficient driving.
207. Around 10,000 drivers will receive subsidised efficient driver training in 2017 through the EST programme. Training is delivered in partnership with commercial driving trainer companies; nearly 600 DVSA-registered fleet trainers have been trained to date, with 15 providers participating in the scheme. In addition to fleet trainers, the scheme expanded this year to include training for Approved Driving Instructors who can incorporate the training in learner and other post-test learner lessons.
208. More ambitious targets including for private motorists as well as fleets could potentially begin during 2017 subject to demand and training capacity. Early work suggested that there is no great demand from private motorists. This and other means to support improved driving style, for example the uptake of new technology and how best to target information, will continue to be explored with key stakeholders including motor manufacturers, through a number of means, including the Driver and Vehicle Standards Agency’s 5-Year Strategy, Helping you stay safe on Britain’s Roads, which aims to help all drivers through a lifetime of safe driving and help them keep their vehicles safe to drive.
Alternative fuels 209. Alternative fuels such as natural gas, liquefied petroleum gas (LPG) and paraffinic
diesel may have the potential to reduce emissions of NOx from road transport vehicles. The type of energy used to power transport can also have a significant effect on greenhouse gas emissions. Both of these aspects should be taken into account when considering alternative fuels.
210. The environmental benefits of these fuels vary depending on the type of vehicle in which they are used and how that vehicle is used. For example, whilst the air quality benefits of switching from a Euro V truck to a new dedicated natural gas one may be significant, if the Euro V truck were converted to run on dual fuel (diesel/natural gas) the air quality benefit could be minimal (depending on the level of diesel substitution) and there would be substantial risk of methane slip77 which has considerable greenhouse gas (GHG) implications. Whilst emissions of NOx from Euro VI gas trucks were seen to be lower than their diesel comparators in recent DfT funded tests,78 in
77 ‘Methane slip’ means emissions of unburnt methane into the atmosphere
78 LowCVP (2017) LowCVP report on gas-powered vehicles emissions tests published www.lowcvp.org.uk/news,lowcvp-report-on-gaspowered-vehicles-emissions-tests-published_3557.htm

68
real terms the air quality benefit was small due to the impact of Euro VI reducing emissions of NOx in heavy diesel goods vehicles.
211. In addition there are some cases, such as paraffinic diesel, where the benefits are currently very uncertain and further research is underway (Annex K). Alternative fuels are used in only a small number of road vehicles currently. Increasing the use of specific alternative fuels in certain vehicles may have the potential to reduce emissions of NOx. Further advice on this will be published within the next year in a long term strategy for the UK’s transition to zero vehicle emissions.
212. Increased uptake of alternative fuels could be achieved by encouraging the purchase of manufacturer produced vehicles, by retro-fitting existing vehicles or, in the case of some ‘drop-in’ fuels, by increasing their use in existing vehicles.
213. Government support for alternative fuels is provided through reductions in Fuel Duty for gaseous fuels,79 through a range of grant trial programmes and (for low carbon fuels) through the Renewable Transport Fuels Obligation as well as through the actions to accelerate turnover to cleaner vehicles set out in Annex F.
214. DfT is gathering evidence on the energy sources that are currently in use or might be used in future to power road transport, and analysing these data to develop a coherent picture of their environmental and other impacts. The results will allow the government to consistently compare a wide range of potential road transport energy pathways over the period to 2050. This will bring together greenhouse gases (GHG) and air quality emissions across a range of alternative fuels and vehicle types.
Renewable Transport Fuel Obligation
215. The UK government’s Renewable Transport Fuel Obligation80 has encouraged around £1 billion of private investment in UK biofuel production facilities and provides the equivalent carbon savings to taking over one million cars off the road each year.
216. Earlier this year the government consulted on improvements to the obligation to provide a positive investment outlook in the UK. The proposals set a clear framework to at least 2030; focus on encouraging advanced fuels from waste; and propose limits on fuels made from crops. Suppliers can choose to introduce E10 as a cost effective means to meet their obligations as it is already allowed by the fuel standard for petrol
79 HMRC (2016) Fuel Duty www.gov.uk/guidance/fuel-duty
80 DfT (2017) Renewable Transport Fuels Obligation (RTFO) order www.gov.uk/government/collections/renewable-transport-fuels-obligation-rtfo-orders

69
(EN228).81 Government will work with industry to ensure any roll out is carefully planned and consumers have the information they require.
Compressed natural gas (CNG) or Liquefied natural gas (LNG)
217. Natural gas (methane) comes in two main forms as a transport fuel, either as compressed natural gas (CNG) or further pressurised and cooled to form liquefied natural gas (LNG). The use of natural gas in road transport in the UK has been limited to specific markets or niche applications, mainly on larger vehicle types such as buses (Annexes E and F – Low Emission Bus Scheme) and HGVs. Natural gas is a significant change from existing transport fuels in that it requires new dedicated infrastructure for refuelling, and retrofitting of existing vehicles or the purchase of new ones.
Low Carbon Truck Trial
218. The government has provided over £11 million via the Low Carbon Truck Trial (LCTT) to part-fund around 370 alternatively-fuelled commercial vehicles, with most using a gas or dual fuel system (diesel and gas) plus gas refuelling sites. The trial has been successful in delivering new and upgraded refuelling infrastructure and has provided evidence to understand better the greenhouse gas and air pollution impacts associated with gas and duel-fuelled (diesel and gas) HGVs.82 83
219. CNG and LNG demonstrate improvements in HGV NOx emissions compared to older Euro V (and earlier) vehicles, however the improvements are less significant compared to newer Euro VI HGVs.
Liquefied petroleum gas (LPG)
220. LPG is produced both from oil and gas extraction and as a by-product of fossil fuel refining. LPG is a well-established niche automotive fuel in a number of EU countries but is currently used in only a very small proportion of cars, vans and taxis in the UK. LPG is used in petrol engines so it is not well suited to use in heavy duty diesel vehicles such as buses and HGVs.
221. The government has funded a Birmingham City Council project to convert taxis (black cabs) to LPG via the Clean Vehicle Technology Fund. Taxis (black cabs) are
81 Fuel standard EN228 allows up to 10% ethanol (known as E10)
82 DfT (2017) Emissions testing of gas-powered commercial vehicles www.gov.uk/government/publications/emissions-testing-of-gas-powered-commercial-vehicles
83 DfT (2017) Low carbon truck and refuelling infrastructure demonstration trial: final report www.gov.uk/government/publications/low-carbon-truck-and-refuelling-infrastructure-demonstration-trial-final-report

70
significant contributors to poor air quality in inner city Birmingham and other air quality hotspots. Data from this project will be used to ascertain whether or not the proposed benefits materialise in real world driving conditions.
Annex E – Existing actions to accelerate road vehicle fleet turnover to cleaner vehicles to ensure that the problem remains addressed and does not move to other locations
Promoting uptake of ultra low emission vehicles (ULEVs) 222. The Office for Low Emission Vehicles (OLEV) works across government to support
the early market for ULEVs. The UK government’s ambition is for Britain to lead the world in electric vehicle technology and use. The UK government’s aim for almost every car and van to be a zero emission vehicle by 2050 with a commitment to invest £600 million by 2020 to support this. The UK government announced a further £270 million of funding in the 2016 Autumn Statement. This will contribute to economic growth and will help reduce greenhouse gas emissions and air pollution on our roads.
223. The number of new ULEV registrations has increased significantly since 2010. During 2016, 41,819 new ULEVs were registered for the first time, up 40% from 29,965 during 2015. This amounted to 1.3% of all new vehicle registrations - up from 0.9% one year previously and 0.5% two years before. Almost all of these registrations are of vehicles eligible for the plug-in car and van grants. Low emission vehicles also benefit from reduced or zero Vehicle Excise Duty, and preferential Company Car Tax rates if they are liable. The growth in ULEVs is being influenced by new models coming into the market, and increasingly, more competitive pricing.84
224. The UK government’s 2016 Autumn Statement included an additional £80 million for ULEV charging infrastructure, £50 million for ULEV taxis, and funding to provide hundreds of new low emission buses, including electric and hydrogen ones (Annex B). The government is also funding research and development into electric vehicle batteries and a range of other ULEV technologies (Annex K).
84 National Statistics (2017) Vehicle licensing statistics www.gov.uk/government/collections/vehicles-statistics

71
Plug-in Car, Motorcycle, Van and Taxi Grants
225. OLEV provides funding for Plug-in Car, Motorcycle (introduced in 201685) and Van (extended and expanded in 201686) Grants to assist consumers and businesses with the cost of new ULEV cars, vans and motorcycles.87 The Plug-in Grant schemes offer up to £4,500 of the cost of a new ULEV car; up to £8,000 of the cost of a new ULEV van; and up to £1,500 of the cost of a new ULEV motorcycle. In 2017, OLEV launched a new £50 million Plug-in Taxi Grant offering up to £7,500 of the cost of a new ULEV taxi (Section 7).
Charging infrastructure
226. The UK now has more than 11,500 public chargepoints for plug-in vehicles, including Europe’s largest network of rapid chargepoints. OLEV continues to provide a range of support to grow the network further and to make it easy and convenient to own and use a plug-in vehicle.88
227. The Electric Vehicle Homecharge Scheme provides grants of up to £500 to help with the costs of installing a chargepoint for motorists with off-street parking. Evidence shows drivers do most of their charging at home.
228. In December 2016 the On-Street Residential Charging Scheme was launched, giving local authorities access to grant funding and guidance to support the installation of charging infrastructure for drivers without access to off-street parking.
229. A new Workplace Charging Scheme was also launched in November 2016. This provides support towards the purchase and installation of electric vehicle (EV) chargepoints in carparks, for eligible businesses, charities and public sector organisations. Charging at work provides another option for EV drivers without access to home charging, and facilitates longer EV commutes for those that do.
230. In addition to improving existing tax incentives for ULEVs in company car tax and salary sacrifice schemes, the government announced additional tax incentives for
85 OLEV (2016) £35 million boost for ultra low emission vehicles www.gov.uk/government/news/35-million-boost-for-ultra-low-emission-vehicles
86 OLEV (2016) £4 million boost to help businesses switch vans and trucks to electric www.gov.uk/government/news/4-million-boost-to-help-businesses-switch-vans-and-trucks-to-electric
87 OLEV (2017) Plug-in car and van grants www.gov.uk/plug-in-car-van-grants
88 OLEV (2016) Grant schemes for electric vehicle charging infrastructure www.gov.uk/government/collections/government-grants-for-low-emission-vehicles
72
companies investing in chargepoints for electric vehicles in the 2016 Autumn Statement.89
231. To help support the use of electric and hybrid vehicles on the Strategic Road Network (motorways and major A roads) Highways England is rolling-out a network of ULEV charging infrastructure to ensure that 95% of its network will have a charge point every 20 miles. Wherever possible these will be rapid chargepoints that can charge most ULEVs in less than 30 minutes.
Local measures
232. To encourage local action to accelerate uptake of ULEVs, OLEV is providing funding of £35 million through the Go Ultra Low City Scheme. This aims to help four cities (Bristol and the West of England, London, Milton Keynes, and Nottingham) become national and global exemplars with significantly increased uptake of ULEVs, through innovative measures such as rapid chargepoint hubs and a range of local incentives, e.g. free or reduced parking for ULEVs as set out in the Clean Air Zone Framework for England. The scheme is also providing £5 million of development funding for specific initiatives in Dundee, Oxford, York and the North East.
Hydrogen fuel cells
233. Government is currently providing £4.8 million through the Hydrogen for Transport Advancement Programme to support the creation of a geographically focussed network of 12 hydrogen refuelling stations (HRS). Hydrogen fuel cell electric vehicles (FCEVs) have the potential to play a significant role, alongside battery electric vehicles. The majority of these stations are now completed and publicly accessible. A £2 million funding programme for fleets to become early adopters of FCEVs is now underway with winning bids announced in October 2016.90 This is supporting deployment of 50 vehicles in both public and private sector fleets, including local councils, emergency authorities and car hire firms. The deployment of the vehicles will help raise awareness of the technology, evaluate fleet user experience and support the utilisation of HRS.
Low Emission Bus Scheme
234. Information on the Low Emission Bus Scheme is available in Annex D.
89 Gov.uk (2016) Capital allowances: first-year allowance for electric charge-points www.gov.uk/government/publications/capital-allowances-first-year-allowance-for-electric-charge-points/capital-allowances-first-year-allowance-for-electric-charge-points
90 OLEV (2016) Government launches £2 million competition to promote roll-out of hydrogen-fuelled fleet vehicles www.gov.uk/government/news/government-launches-2-million-competition-to-promote-roll-out-of-hydrogen-fuelled-fleet-vehicles
73
Low Emission Freight and Logistics trial
235. In January 2017, the DfT, OLEV and Innovate UK announced twenty projects awarded over £20 million through the Low Emission Freight and Logistics trial.91 The aim of the competition is to demonstrate new technologies and to encourage the widespread introduction of low and zero emission vehicles to UK fleets. It will bring over 300 low emission vehicles on to UK roads from mid-2017. As part of the competition the government will also be assessing the emissions of the vehicles and will produce a public report which assesses the benefits of the different technologies.
Annex F – Existing measures to reduce emissions of NOx from other forms of transport such as rail, aviation and shipping
Rail investment 236. Emissions from the rail sector are relatively low and the UK is committed to
reducing them further. All new diesel locomotives and railcars are fitted with engines that meet non-road mobile machinery (NRMM) emissions standards. Recent train operating franchises that the Department for Transport has negotiated have included commitments to replace older diesel units with new units compliant with the latest standards.
237. Electric trains typically provide faster and more reliable journeys than diesels. They are also better for the environment being zero emission at point of use as well as quieter and more carbon efficient. Around one third of rail lines are already electrified including most of the intercity routes and the commuting lines coming into London. As a result around 60% of passenger journeys are on electric trains.
238. Further rail electrification is under way. Approximately 100 miles of the Great Western Main Line has been electrified over the last 8 years. It is a programme unprecedented in scale and challenge that is building on ageing assets in constant use. The programme of railway upgrades, including the electrification of the Great Western Main Line, will continue to be subject to ongoing assessment and investment decisions so that passengers and taxpayers get maximum value.
239. The new fleet of bi-mode Intercity Express trains that will operate on the Great Western Main Line and other routes will deliver air quality benefits compared to the
91 DfT (2017) Low emission freight and logistics trial competition winners announced www.gov.uk/government/news/low-emmission-freight-and-logistics-trial-competition-winners-announced

74
diesel trains they replace. They will be able to use electrified infrastructure where it’s available and switch to low-emission diesel power on non-electrified tracks.
Aviation 240. Emissions at airports are a small proportion of overall UK emissions, with aircraft
contributing 1% of UK NOx emissions. Road transport sources are the main contributor of emissions around airports so airport surface access strategies are important in tackling air quality around airports, as well as all other measures to reduce emissions from road vehicles travelling to and from airports.
241. UK government policy on aviation-related air quality is to seek improved international standards to reduce emissions from aircraft and to encourage the aviation industry to put in place measures to reduce emissions for which it is responsible. Industry is working together to reduce airport-related emissions through measures including operating aircraft more efficiently, introducing efficient new technology, using landing charges to incentivise cleaner aircraft, reducing vehicle emissions within the airport boundary and sustainable surface access.92
Ports and shipping
Ports
242. Connecting ships and other vessels to on shore electricity supply at ports and marinas can help reductions in pollutant emissions through alleviating the need for on board energy generation.
243. The UK government has encouraged ports to design new developments so that the necessary equipment could be installed without undue cost and disruption, should it be decided in future to install shore-side electricity. For port development, especially for nationally significant infrastructure projects as defined in the Planning Act 2008, the National Policy Statement for Ports93 provides that proposed developments should at least make reasonable advance provision for shore-side supply or explain why this would not be economically and environmentally worthwhile.
244. There are opportunities for existing development to explore the opportunities for shore-side electricity supply connections and further reduce emissions at port side. A
92Sustainable Aviation: UK Aviation and Air Quality www.sustainableaviation.co.uk/wp-content/uploads/2017/01/SA-A4_UK-Aviation-and-Air-Quality_Report1.pdf
93 DfT (2012) National policy statement for ports www.gov.uk/government/publications/national-policy-statement-for-ports

75
technical standard for onshore electricity supply connections has been agreed.94 This should provide confidence for those investing in these facilities that there is a common standard across the industry. The UK government will continue to encourage ports and shipping companies to examine the opportunities available, particularly in areas identified as having poor air quality.
Shipping
245. The International Convention for the Prevention of Pollution from Ships (MARPOL)95 regulates pollution from ships, and the overwhelming majority of states, including the UK, are parties to it.
246. MARPOL’s Annex VI sets out a staged progression of more stringent limits for sulphur oxides and NOx emissions, both inside and outside waters designated by the International Maritime Organisation (IMO) as an emission control area (ECA). The UK government has supported the introduction of a NOx ECA for the North Sea (including the English Channel) and in October 2016, the IMO decided to apply this designation to the North Sea and the Baltic Sea. The NOx ECA will impose strict Tier III NOx limits from 2021 onwards, which in time will see a 75-80 % reduction in NOx emissions from ships operating in these waters.
247. The UK government is also looking to reduce ship emissions near densely populated conurbations. Working with maritime stakeholders, the intention is to identify the barriers faced by shipowners and ports to installing and using ‘green technologies’, and consider possible solutions. The UK government is also working to improve its evidence base in terms of ship emissions and will also be working with local authorities to ensure they have relevant information to help them assess the cumulative impact of all local emissions.
94 OLEV (2016) Consultation on alternative fuels infrastructure www.gov.uk/government/consultations/transposition-of-directive-201494eu-on-alternative-fuels-infrastructure
95 IMO (1973) International Convention for the Prevention of Pollution from Ships www.imo.org/en/About/Conventions/ListOfConventions/Pages/International-Convention-for-the-Prevention-of-Pollution-from-Ships-%28MARPOL%29.aspx

76
Annex G – Existing measures to reduce emissions of NOx from industry and non-road mobile machinery
Industrial emissions 248. Significant strides have been made in reducing industrial emissions in the UK.
Emissions from power stations and industrial combustion plants have reduced significantly, reflecting a long-term trend away from the use of coal and oil in favour of natural gas and renewable energy sources. The 16% decrease in total NOx emissions between 2012 and 2015 occurred due to the closure of a number of coal-fired power stations.
Medium Combustion Plants and generators 249. Section 7 provides further information on the additional UK measures proposed to
tackle NOx emissions from Medium Combustion Plants and generators.
Non-road mobile machinery (NRMM) 250. Engines in mobile equipment not directly related to the transportation of passengers
or goods, such as excavators and bulldozers used in construction, are covered by regulations for NRMM. Engines for sale must be approved to demonstrate compliance with pollutant emission standards, including NOx. Section 7 provides further information on the latest developments of these standards.

77
Annex H – Existing measures to reduce emissions of NOx from buildings, both commercial and domestic, and other stationary sources
Buildings 251. Emissions from commercial (non-industrial) and domestic building represent a small
proportion of overall UK NOx emissions. Over the last decade, the UK has introduced a range of energy efficiency measures for buildings and homes to reduce their use of fossil fuels including the Building Regulations, which set stringent standards for the insulating performance of newly constructed buildings. They also set standards for replacing thermal elements, such as windows, and standards for when a thermal element is renovated (e.g. loft insulation when re-roofing).
252. Each year in England about 1.2 million new boilers are installed in homes. The Building Regulations sets high efficiency standards for new boilers, which means that in normal circumstances when a boiler is replaced, it will be replaced with a condensing boiler. Modern condensing boilers typically produce far less NOx than older boilers. Statutory guidance for Part L of the Building Regulations also sets standards for minimum controls when a heating system is installed, which should further reduce fuel consumption and emissions including NOx. In December 2016, Government consulted on whether to strengthen these standards further.96
Other stationary sources
Smoke Control Areas
253. The Clean Air Act 1993 enables local authorities throughout England, Scotland and Wales to designate Smoke Control Areas, in which smoke emissions are prohibited unless using an exempted appliance or authorised fuel.97
254. In 2015 new laws on ecodesign requirements for solid fuel boilers and solid fuel local space heaters came into force introducing emission criteria for a number of
96 BEIS (2016) Consultation on Heat in Buildings - The Future of Heat www.gov.uk/government/consultations/heat-in-buildings-the-future-of-heat
97 Gov.uk (2016) Smoke control areas: the rules www.gov.uk/smoke-control-area-rules

78
pollutants including NOx by at least 2020 and 2022 respectively. The Stove Industry Alliance has launched the Ecodesign Ready Scheme98 to meet the new emissions standards ahead of the statutory deadline.
98 Stove Industry Alliance: Ecodesign Ready stoves and Air Quality http://www.stoveindustryalliance.com/ecodesign-ready-stoves-and-air-quality/

79
Annex I – Land use and infrastructure planning 255. The National Planning Policy Framework99 sets out national planning policies and
principles for England. To support the Framework, Planning Practice Guidance on air quality100 provides guiding principles on how planning decisions should take account of the impact of new development on air quality.
256. The National Policy Statement for National Networks101 presented under the Planning Act 2008, sets out:
a. the need for development of road, rail and strategic rail freight interchange projects on the national networks; and
b. the policy against which decisions on major road and rail projects will be made.
The Statement sets out how decisions must take account of impacts on air quality.
257. The Scottish Government’s ‘Cleaner Air for Scotland – The Road to a Healthier Future’ sets out a national approach to improving air quality, including through placemaking: the way in which towns and cities are planned, designed and managed (See Section 7.5).
258. The Welsh Government’s ‘Planning Policy Wales’102 sets out land use planning policies with regard to air quality.
259. The Northern Ireland Executive’s Draft Programme for Government 2016-2021 includes outcomes relevant to delivering improvements in Northern Ireland’s air quality (See Section 7.7).
99 DCLG (2012) National Planning Policy Framework www.gov.uk/government/publications/national-planning-policy-framework--2 100 DCLG (2014) Planning Practice Guidance on Air Quality http://planningguidance.communities.gov.uk/blog/guidance/air-quality/
101 DfT (2014) National policy statement for national networks www.gov.uk/government/publications/national-policy-statement-for-national-networks
102 Welsh Government (2017) Planning Policy Wales (Edition 9, November 2016) http://gov.wales/topics/planning/policy/ppw/?lang=en

80
Annex J – Innovation, research and development of new technologies 260. The government is working in partnership with industry to deliver a long-term
Industrial Strategy103 to support economic growth. This includes investment in new technologies such as low carbon propulsion where the UK has the capacity to become a world leader. Innovate UK, a Non Departmental Public Body sponsored by the Department for Business, Energy and Industrial Strategy (BEIS) leads on working with stakeholders to drive science and technology innovations to grow the UK economy.
The Advanced Propulsion Centre
261. As part of the Industrial Strategy, the government is co-funding the £1 billion Advanced Propulsion Centre UK,104 a ten year commitment between government and the automotive industry formed in 2013, to help companies to develop the next generation of low carbon propulsion technologies.
New low emission vehicle systems
262. In September 2016, OLEV, BEIS and Innovate UK announced105 up to £24 million of competition funding for business projects to develop new vehicle technologies that deliver low emissions. Funding is available for three types of project:
a. Feasibility studies into technology that can achieve significant emissions savings in road vehicles;
b. Proof of concept for technologies that can achieve significant emissions savings in road vehicles; and
c. Collaborative research and development on projects that can achieve significant emissions savings in road vehicles and can produce results within one year.
263. The UK government announced the seven successful applicants in April 2017 within a package of over £109 million of government funding, alongside significant
103 BEIS (2014) Industrial strategy explained www.gov.uk/government/publications/industrial-strategy-explained
104 The Advanced Propulsion Centre UK www.apcuk.co.uk/
105 Innovate UK (2016) New low emission vehicle systems: apply for business funding www.gov.uk/government/news/new-low-emission-vehicle-systems-apply-for-business-funding

81
industry funding, to help develop the next generation of driverless and low-carbon vehicles as part of the Industrial Strategy and the UK Government’s Plan for Britain.106
Alternative fuels
264. Paraffinic diesel fuels are liquid fuels that can be synthetically manufactured from feedstock such as natural gas (gas-to-liquid), biomass (biomass-to-liquid), coal (coal-to-liquid) or from hydro-treating vegetable oil. The DfT is undertaking a testing programme to explore the potential air quality benefits of using paraffinic diesel in different vehicle types/ Euro standards. Potential side-effects of this fuel will also be examined.
Batteries
265. Development of batteries to produce more power and store more energy focusses on new battery chemistries, materials for electrodes and electrolyte formulations, supported by advancements in battery control electronics. OLEV funding delivered through Innovate UK is supporting a range of R&D projects aimed at driving forward UK-based technology for alternative battery chemistries. These may offer benefits over the existing Lithium-ion chemistries, such as superior energy density and lower cost.
266. In 2015, OLEV identified a gap in the UK battery technology supply chain and capability, which was the design and manufacture of battery packs from cell level. A consortium led by Warwick Manufacturing Group won £10 million of dedicated funding to develop an automotive battery production scale-up facility in the UK.107 For the first time, the project brings together in the UK the very best expertise in each area of battery production to design a flexible, scalable, modular battery architecture and aggregate demand at the component level. This allows product development to achieve standards of quality, safety and robustness more typical of high volume production.
267. The government announced new challenge funding for electric vehicle battery development in the Spring Budget 2017 (Annex B) and later announced in July 2017, the launch of a £246 million Faraday Challenge to boost expertise in battery technology.108
106 DfT & BEIS (2017) Over £109 million of funding for driverless and low carbon projects www.gov.uk/government/news/over-109-million-of-funding-for-driverless-and-low-carbon-projects
107 BEIS (2015) Low carbon vehicles get government backing at annual sector show www.gov.uk/government/news/low-carbon-vehicles-get-government-backing-at-annual-sector-show
108 Innovate UK & BEIS (2017) Business Secretary to establish UK as world leader in battery technology as part of modern Industrial Strategy www.gov.uk/government/news/business-secretary-to-establish-uk-as-world-leader-in-battery-technology-as-part-of-modern-industrial-strategy
82
Trials of innovative approaches and technologies
268. The UK government is also supporting the trialling of a range of innovative approaches and technologies through the Air Quality Grant, including a Cornwall County Council project involving hydrogen-based technologies; a Derby City Council project to retrofit HGVs with emissions reduction technology; and a Leeds City Council project involving research into real-world emissions from road transport refrigeration equipment and possible mitigations.109
109 Defra & DfT (2017) Air Quality Grant programme 2016 to 2017 www.gov.uk/government/news/air-quality-grant-programme

83
Annex K – Local authorities with one or more roads with NO2 concentrations forecast above statutory limits based on modelling 269. Table 1 below sets out the UK government’s best available forecast of UK local
authorities with one or more roads with concentrations of NO2 above statutory limits and for how long these exceedances would last if no additional measures were taken. The table excludes any roads managed directly by Highways England (Strategic Road Network) Transport Scotland, Welsh Government and Transport Northern Ireland.
270. The UK government will require local authorities outside of London in England to implement plans to address these exceedances within the shortest possible time as set out in Section 7.4.1. The UK government is engaging with local authorities so as to help establish how quickly measures could be implemented in their areas.
271. In the Technical Report being published alongside this document, the UK government has identified Clean Air Zones that include charging as the measure it is able to model nationally which will achieve statutory NO2 limit values in towns and cities in the shortest possible time. Given the potential impacts on individuals and businesses, when considering between equally effective alternatives to deliver compliance, the UK government believes that if a local authority can identify measures other than charging zones that are at least as effective at reducing NO2, and are at the same or lower cost, those measures should be preferred as long as the local authority can demonstrate that this will deliver compliance as quickly as a charging Clean Air Zone.
272. Table 1 sets out the modelling assumptions made in the technical report as to the benchmark for addressing those exceedances within the shortest possible time. Those authorities modelled to have exceedances persisting for 3 – 4 years will be required to undertake local assessments to consider the best option to achieve the statutory NO2 limit values within the shortest possible time. They face varying challenges, and the solutions will not all be the same. In some cases the problem is a single road that passes through, or around, a town centre. In others it is urban traffic that is causing the problem.
273. Actions to tackle exceedances in London are the responsibility of the Mayor of London and are set out in Section 7.4.6. Actions to tackle exceedances in Scotland, Wales and Northern Ireland are set out in Sections 7.5, 7.6 and 7.7 respectively and are the responsibilities of the relevant devolved administrations.
274. This table, updated since the consultation, presents the latest modelling results (using current emissions and traffic data). Government has had initial discussions with local authorities affected. A small number have put forward evidence which suggests that actual concentrations will be lower than those forecast below due to planned road

84
schemes that will reduce traffic on the affected roads. This includes Halton Borough Council (Gateway Mersey Project) and Wakefield Metropolitan District Council (Eastern Relief Road) both due to be completed in 2017. The UK government is also aware of planned road schemes in Fareham (Stubbington By-Pass) and Plymouth (Forder Valley Link Road).
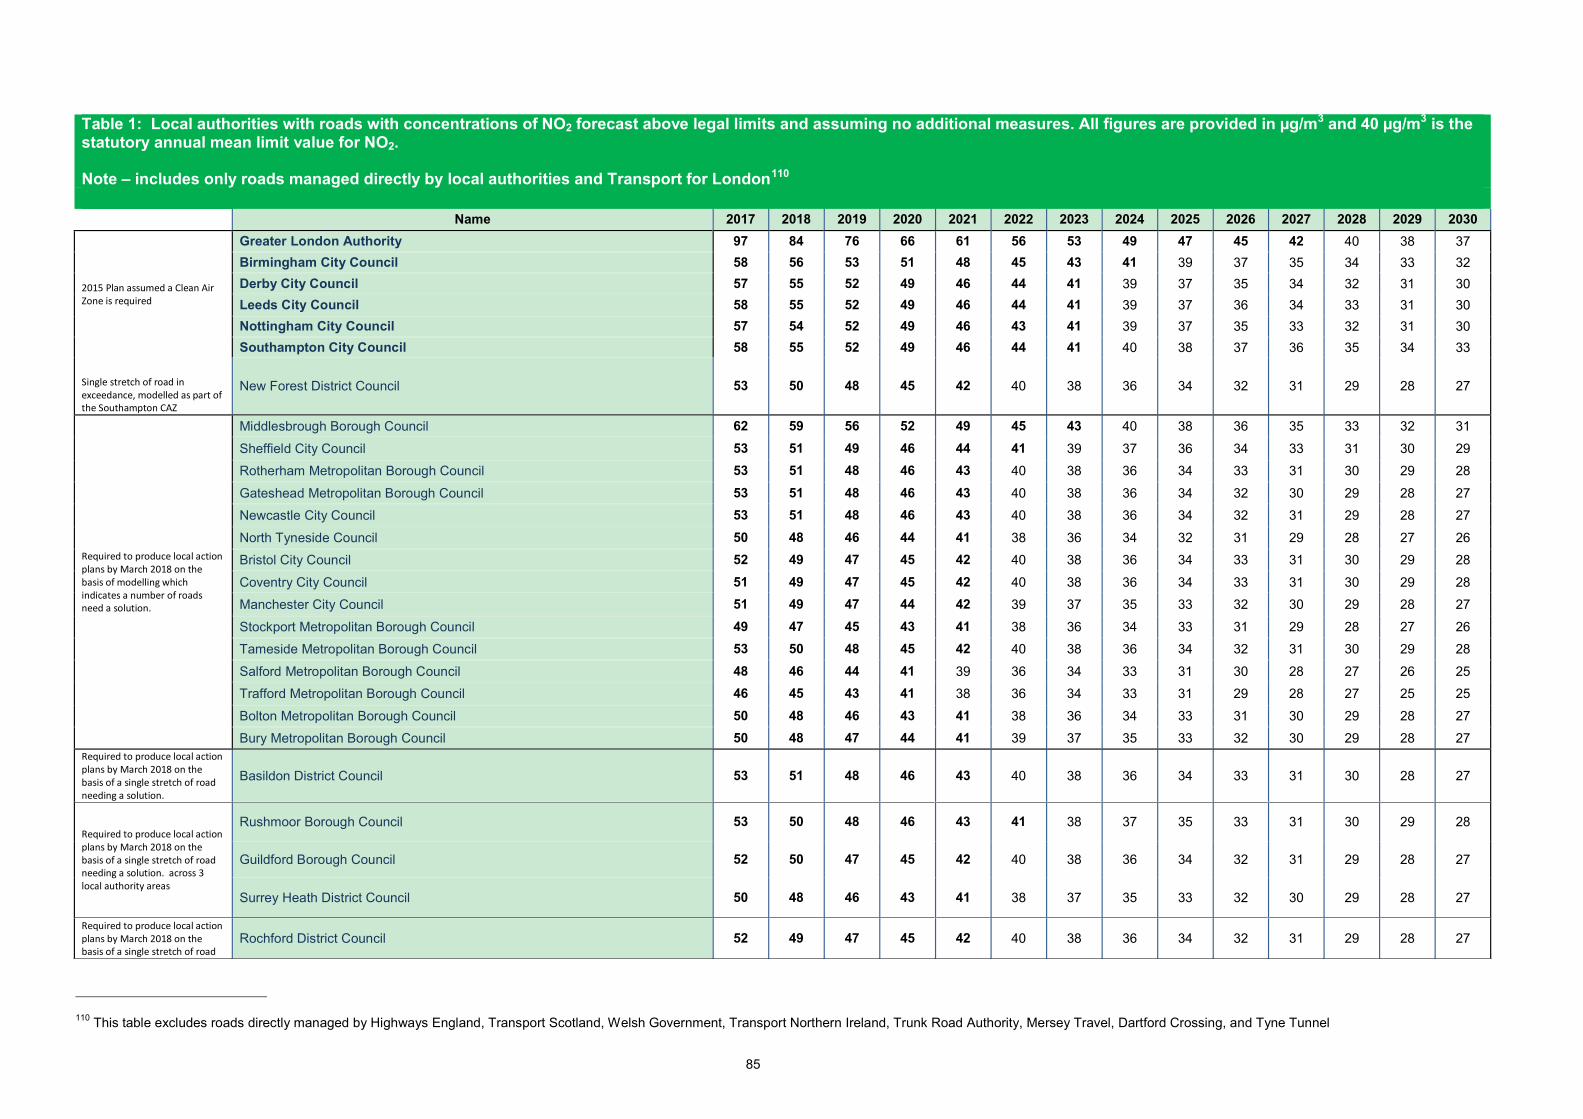
85
Table 1: Local authorities with roads with concentrations of NO2 forecast above legal limits and assuming no additional measures. All figures are provided in µg/m3 and 40 µg/m3 is the statutory annual mean limit value for NO2. Note – includes only roads managed directly by local authorities and Transport for London110
Name 2017 2018 2019 2020 2021 2022 2023 2024 2025 2026 2027 2028 2029 2030
2015 Plan assumed a Clean Air Zone is required
Greater London Authority 97 84 76 66 61 56 53 49 47 45 42 40 38 37 Birmingham City Council 58 56 53 51 48 45 43 41 39 37 35 34 33 32 Derby City Council 57 55 52 49 46 44 41 39 37 35 34 32 31 30 Leeds City Council 58 55 52 49 46 44 41 39 37 36 34 33 31 30 Nottingham City Council 57 54 52 49 46 43 41 39 37 35 33 32 31 30 Southampton City Council 58 55 52 49 46 44 41 40 38 37 36 35 34 33
Single stretch of road in exceedance, modelled as part of the Southampton CAZ
New Forest District Council 53 50 48 45 42 40 38 36 34 32 31 29 28 27
Required to produce local action plans by March 2018 on the basis of modelling which indicates a number of roads need a solution.
Middlesbrough Borough Council 62 59 56 52 49 45 43 40 38 36 35 33 32 31
Sheffield City Council 53 51 49 46 44 41 39 37 36 34 33 31 30 29
Rotherham Metropolitan Borough Council 53 51 48 46 43 40 38 36 34 33 31 30 29 28
Gateshead Metropolitan Borough Council 53 51 48 46 43 40 38 36 34 32 30 29 28 27
Newcastle City Council 53 51 48 46 43 40 38 36 34 32 31 29 28 27
North Tyneside Council 50 48 46 44 41 38 36 34 32 31 29 28 27 26
Bristol City Council 52 49 47 45 42 40 38 36 34 33 31 30 29 28
Coventry City Council 51 49 47 45 42 40 38 36 34 33 31 30 29 28
Manchester City Council 51 49 47 44 42 39 37 35 33 32 30 29 28 27
Stockport Metropolitan Borough Council 49 47 45 43 41 38 36 34 33 31 29 28 27 26
Tameside Metropolitan Borough Council 53 50 48 45 42 40 38 36 34 32 31 30 29 28
Salford Metropolitan Borough Council 48 46 44 41 39 36 34 33 31 30 28 27 26 25
Trafford Metropolitan Borough Council 46 45 43 41 38 36 34 33 31 29 28 27 25 25
Bolton Metropolitan Borough Council 50 48 46 43 41 38 36 34 33 31 30 29 28 27
Bury Metropolitan Borough Council 50 48 47 44 41 39 37 35 33 32 30 29 28 27 Required to produce local action plans by March 2018 on the basis of a single stretch of road needing a solution.
Basildon District Council 53 51 48 46 43 40 38 36 34 33 31 30 28 27
Required to produce local action plans by March 2018 on the basis of a single stretch of road needing a solution. across 3 local authority areas
Rushmoor Borough Council 53 50 48 46 43 41 38 37 35 33 31 30 29 28
Guildford Borough Council 52 50 47 45 42 40 38 36 34 32 31 29 28 27
Surrey Heath District Council 50 48 46 43 41 38 37 35 33 32 30 29 28 27
Required to produce local action plans by March 2018 on the basis of a single stretch of road
Rochford District Council 52 49 47 45 42 40 38 36 34 32 31 29 28 27
110 This table excludes roads directly managed by Highways England, Transport Scotland, Welsh Government, Transport Northern Ireland, Trunk Road Authority, Mersey Travel, Dartford Crossing, and Tyne Tunnel

86
needing a solution.
Required to produce local action plans by March 2018 on the basis of a single stretch of road needing a solution. (rounded down to 40)
Bath & North East Somerset Council 50 48 45 43 40 37 35 33 32 30 28 27 26 25
Required to produce local action plans by March 2018 on the basis of a single stretch of road needing a solution. (rounded down to 40)
Fareham Borough Council 48 46 45 42 40 38 36 34 33 31 30 28 27 26
Exceedance will be resolved by Mersey Gateway Bridge. No feasibility study
Halton Borough Council 59 55 52 49 45 42 40 38 36 34 33 31 30 29
Not required to conduct a feasibility study
Portsmouth City Council 47 45 44 42 40 38 36 34 33 32 30 29 28 27 Wakefield Metropolitan District Council 49 46 44 42 40 37 35 34 32 30 29 28 27 26 Bournemouth Borough Council 46 45 43 41 39 37 35 33 31 30 28 27 26 25 Bradford City Council 47 45 43 41 39 37 35 33 32 30 29 28 27 26 Plymouth City Council 47 45 43 41 39 36 35 33 31 29 28 27 25 25 Solihull Metropolitan Borough Council 50 47 45 42 39 37 34 33 31 29 28 27 26 25 Wolverhampton City Council 49 46 43 41 39 37 35 33 32 30 29 28 27 27 Bolsover District Council 48 45 43 40 38 35 33 32 30 29 27 26 25 25 Leicester City Council 45 44 42 40 38 36 35 33 32 31 30 29 28 28 Liverpool City Council 46 44 42 40 38 36 34 32 30 29 28 26 26 25 Newcastle-under-Lyme Borough Council 46 44 42 40 38 36 34 32 30 29 28 26 25 24 Oldham Metropolitan Borough Council 47 45 43 41 38 36 34 33 31 30 28 27 26 25 Sandwell Metropolitan Borough Council 47 44 42 40 38 35 34 32 31 29 28 27 26 26 Stoke-on-Trent City Council 47 45 43 41 38 36 34 33 31 30 28 27 26 25 Walsall Metropolitan Borough Council 50 47 44 41 38 36 34 33 31 30 29 28 27 26 Poole Borough Council 45 43 41 39 37 35 34 32 31 30 28 27 26 25 Burnley Borough Council 45 43 41 39 37 35 33 31 30 28 27 26 25 24 Peterborough Council 44 42 41 39 37 35 33 32 30 29 27 26 25 24 Reading Borough Council 44 43 41 39 37 35 34 32 31 30 29 28 27 26 Sefton Metropolitan Borough Council 46 43 42 39 37 35 33 31 29 28 26 26 25 24 South Gloucestershire District Council 45 43 41 39 37 35 33 31 30 28 27 26 25 24 Basingstoke and Deane Borough Council 45 43 41 39 36 34 33 31 29 28 27 26 25 24 Blaby District Council 44 42 40 38 36 34 32 30 29 28 26 25 24 23 Calderdale Metropolitan Borough Council 45 43 40 38 36 34 32 30 29 27 26 25 24 23 Cheltenham Borough Council 43 41 40 38 36 34 32 31 29 28 26 25 24 23 Dudley Metropolitan Borough Council 45 43 41 38 36 34 32 31 29 28 27 26 25 24 Kirklees Metropolitan Council 44 42 40 38 36 33 32 30 29 27 26 25 24 24 South Tyneside Metropolitan Borough Council 43 41 40 38 36 33 32 30 28 27 26 25 24 23 Southend Borough Council 44 42 40 38 36 34 32 31 29 28 27 26 25 24 Ashfield District Council 44 42 40 37 35 33 31 30 28 27 26 24 24 23 Broxbourne Borough Council 44 41 39 37 35 33 31 30 28 27 25 24 23 23 Chelmsford Borough Council 42 40 39 37 35 33 32 30 29 27 26 25 24 23 Doncaster Metropolitan Borough Council 42 40 38 36 35 33 31 30 28 27 26 25 24 23 Havant Borough Council 42 40 39 37 35 33 31 30 28 27 26 25 24 23

87
North East Lincolnshire Council 41 40 38 36 35 33 32 30 29 28 27 27 26 25 Sunderland City Council 43 41 40 37 35 33 31 30 28 27 25 24 23 23 Warrington Borough Council 42 40 39 37 35 33 32 30 29 28 27 26 25 24 Broxtowe Borough Council 41 39 38 36 34 32 31 29 28 27 26 25 24 23 Luton Borough Council 42 40 38 36 34 32 30 29 27 26 25 24 23 23 Oxford City Council 44 42 39 36 34 32 30 29 28 26 25 24 23 22 South Ribble Borough Council 42 40 38 36 34 32 31 29 27 26 25 24 23 22 Knowsley Metropolitan Borough Council 41 39 37 35 33 31 30 28 27 25 24 23 22 22 Northampton Borough Council 41 39 38 36 33 32 30 29 27 26 25 25 24 23 Rochdale Metropolitan Borough Council 41 39 37 35 33 31 30 28 27 25 24 23 22 21 Dartford Borough Council 41 38 37 34 32 30 28 27 26 24 23 22 22 21
Devolved Administrations have policy responsibility
Aberdeen City Council 46 44 42 40 38 36 34 33 32 31 30 29 29 28 Edinburgh City Council 46 44 42 40 37 35 33 31 30 28 27 26 24 24 Glasgow City Council 58 55 52 50 46 43 41 39 37 35 33 32 31 30 South Lanarkshire Council 42 40 39 37 34 32 30 29 27 25 24 23 22 21 Caerphilly County Borough Council 65 62 59 56 53 50 47 44 42 40 38 36 35 33 Cardiff County Council 56 54 51 49 45 43 40 38 36 34 32 31 29 28

88
Annex L – Maps of urban centres with estimated roadside NO2 concentration projections for 2020 or 2021111 275. These are maps of urban centres with roadside NO2 concentration projections for
2020 or 2021 estimated by national modelling. 2020 projections are provided for the five cities and London, whilst 2021 projections are shown for new cities. Roads shown in red are estimated to exceed the statutory limit of 40 micrograms per cubic metre (µg/m3) whereas those in orange are marginally compliant (38-40 µg/m3). These maps relate to areas where modelling suggests more than one road section will have a persistent exceedance.
276. These maps illustrate the highly localised nature of NO2 exceedances. In the Technical Report being published alongside this document, the UK government has identified Clean Air Zones that include charging as the measure it is able to model nationally which will achieve statutory NO2 limit values in towns and cities in the shortest possible time. In practice local plans may be able to identify measures that are targeted on non-compliant roads, and which can achieve compliance in the shortest possible time, but with a lower impact on urban areas than would result from charging Clean Air Zones.
111 See individual map legends for details

89

90

91

92

93

94

95
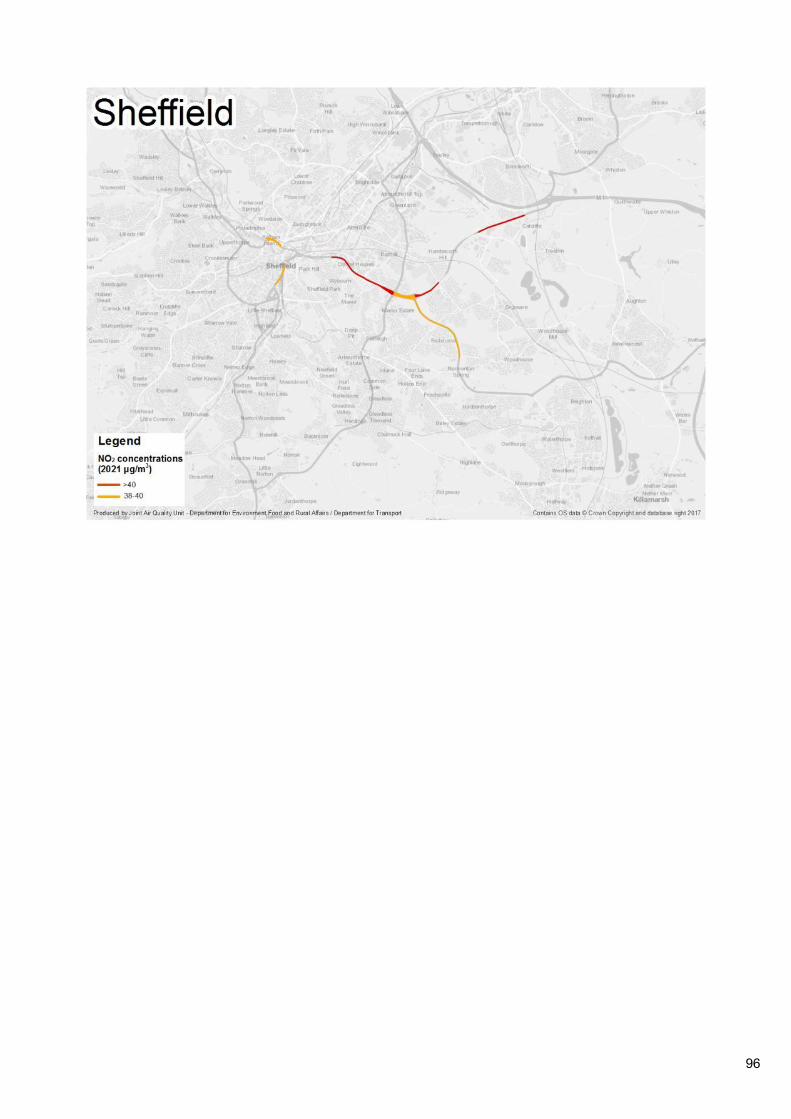
96

97

98