Embed Size (px)
Citation preview

Air Quality Modeling Technical Support Document for the
NOx SIP Call
U.S. Environmental Protection AgencyOffice of Air and Radiation
September 23, 1998

i
TABLE OF CONTENTS
I. Scope and Content of this Document . . . . . . . . . . . . . . . . . . . . . . . . . . . . . . . . . . . . 1
II. Technical Approach . . . . . . . . . . . . . . . . . . . . . . . . . . . . . . . . . . . . . . . . . . . . . . . . . 3II.A. Description of Models . . . . . . . . . . . . . . . . . . . . . . . . . . . . . . . . . . . . . . . . 3
II.A.1. UAM-V and CAMx . . . . . . . . . . . . . . . . . . . . . . . . . . . . . . . . . . . . 3II.A.2. CAMx Source Apportionment Technique . . . . . . . . . . . . . . . . . . . 4
II.B. Episodes . . . . . . . . . . . . . . . . . . . . . . . . . . . . . . . . . . . . . . . . . . . . . . . . . . 5II.C. Model Setup . . . . . . . . . . . . . . . . . . . . . . . . . . . . . . . . . . . . . . . . . . . . . . . 7II.D. Base Year Emissions . . . . . . . . . . . . . . . . . . . . . . . . . . . . . . . . . . . . . . . . 7II.E. Model Performance . . . . . . . . . . . . . . . . . . . . . . . . . . . . . . . . . . . . . . . . . . 8
II.E.1. UAM-V . . . . . . . . . . . . . . . . . . . . . . . . . . . . . . . . . . . . . . . . . . . . . 8II.E.2. CAMx . . . . . . . . . . . . . . . . . . . . . . . . . . . . . . . . . . . . . . . . . . . . . . 9 II.E.3. State-by-State vs. Source Apportionment Modeling . . . . . . . . . 11
III. Building Blocks for Analysis of Model Results . . . . . . . . . . . . . . . . . . . . . . . . . . . 11III.A. 2007 Base Case . . . . . . . . . . . . . . . . . . . . . . . . . . . . . . . . . . . . . . . . . . . 11III.B. Receptor Areas . . . . . . . . . . . . . . . . . . . . . . . . . . . . . . . . . . . . . . . . . . . . 14III.C. Metrics . . . . . . . . . . . . . . . . . . . . . . . . . . . . . . . . . . . . . . . . . . . . . . . . . . 16
IV. Evaluation of Contributions . . . . . . . . . . . . . . . . . . . . . . . . . . . . . . . . . . . . . . . . . 18IV. A. State-by-State Model Runs . . . . . . . . . . . . . . . . . . . . . . . . . . . . . . . . . . 18
IV.A.1. UAM-V State-by-State Modeling . . . . . . . . . . . . . . . . . . . . . . . . 18IV.A.2. UAM-V Metrics . . . . . . . . . . . . . . . . . . . . . . . . . . . . . . . . . . . . . 19IV.A.3. CAMx State-by-State Source Apportionment Modeling . . . . . . 21IV.A.4. CAMx Metrics . . . . . . . . . . . . . . . . . . . . . . . . . . . . . . . . . . . . . . 21
IV.B. Methodology for Evaluating Contributions . . . . . . . . . . . . . . . . . . . . . . . 23 IV.B.1. Extent of the Ozone Problem in the Downwind Area . . . . . . . . 25IV.B.2. Nature of Contributions . . . . . . . . . . . . . . . . . . . . . . . . . . . . . . . 28IV.B.3. Approach to Determining Significant Contributions . . . . . . . . . 29IV.B.4 Example Analysis of Contributions . . . . . . . . . . . . . . . . . . . . . . 31
IV.C. Results of Evaluation of Contributions . . . . . . . . . . . . . . . . . . . . . . . . . . 41IV.C.4. Examples of Contributions From Upwind States to 1-Hour
Downwind Nonattainment . . . . . . . . . . . . . . . . . . . . . . . . . . . . . . 46IV.C.5. Examples of Contributions From Upwind States to 8-Hour
Downwind Nonattainment . . . . . . . . . . . . . . . . . . . . . . . . . . . . . . 52
V. Impacts of Alternative Strategies . . . . . . . . . . . . . . . . . . . . . . . . . . . . . . . . . . . . . . 58V.A. Alternative Scenarios . . . . . . . . . . . . . . . . . . . . . . . . . . . . . . . . . . . . . . . 58V.B. Modeling Results . . . . . . . . . . . . . . . . . . . . . . . . . . . . . . . . . . . . . . . . . . . 64
V.B.1. Impacts of Alternative Controls . . . . . . . . . . . . . . . . . . . . . . . . . 65V.B.2 Impacts of Upwind Controls on Downwind Nonattainment . . . . . 70V.B.3 Summary of Findings . . . . . . . . . . . . . . . . . . . . . . . . . . . . . . . . . 74
REFERENCES . . . . . . . . . . . . . . . . . . . . . . . . . . . . . . . . . . . . . . . . . . . . . . . . . . . . . . 76
ERRATA . . . . . . . . . . . . . . . . . . . . . . . . . . . . . . . . . . . . . . . . . . . . . . . . . . . . . . . . . . . 78

ii
LIST OF TABLES
Table III.A-1 . 2007 SIP Call Base Case Controls. . . . . . . . . . . . . . . . . . . . . . . . . . . . 12Table III.A-2. Comparison of Base Year and Base Case Emissions. (Tons of NOx per
day) . . . . . . . . . . . . . . . . . . . . . . . . . . . . . . . . . . . . . . . . . . . . . . . . . . . . . . . . . 13Table III.B-1. 1-Hour Nonattainment Areas Evaluated . . . . . . . . . . . . . . . . . . . . . . . . 15Table IV.B-1. Extent of 1-Hour Nonattainment Problem . . . . . . . . . . . . . . . . . . . . . . 26Table IV.B-2. Extent of 8-Hour Nonattainment Problem . . . . . . . . . . . . . . . . . . . . . . 27Table IV.B-3. Metrics Associated with Each Contribution Factor . . . . . . . . . . . . . . . . 29Table IV.B-4. Percent Contribution from Upwind States to 1-Hour Nonattainment in
New York City . . . . . . . . . . . . . . . . . . . . . . . . . . . . . . . . . . . . . . . . . . . . . . . . . 34Table IV.B-5. Contributions to 1-Hour Nonattainment in New York City: UAM-V Metrics
. . . . . . . . . . . . . . . . . . . . . . . . . . . . . . . . . . . . . . . . . . . . . . . . . . . . . . . . . . . . . 35Table IV.B-6. Contributions to 1-Hour Nonattainment in New York City: CAMx Metrics36Table IV.C-1. Downwind States for Which Upwind States Contain Sources that
Contribute Significantly to 1-Hr Nonattainment . . . . . . . . . . . . . . . . . . . . . . . . 42Table IV.C-2. Upwind States that Contain Sources that Contribute Significantly to 1-Hr
Nonattainment in Downwind States . . . . . . . . . . . . . . . . . . . . . . . . . . . . . . . . . 43Table IV.C-3. Downwind States to Which Sources in Upwind States Contribute
Significantly for the 8-hour Standard . . . . . . . . . . . . . . . . . . . . . . . . . . . . . . . . 44Table IV.C-4. Upwind States that Contain Sources that Contribute Significantly to 8-
hour Nonattainment in Downwind States . . . . . . . . . . . . . . . . . . . . . . . . . . . . . 45Table V.A-1. Emissions Scenarios Modeled . . . . . . . . . . . . . . . . . . . . . . . . . . . . . . . 59Table V.A-2. Comparison of Point Source Emissions for Different Control Scenarios
. . . . . . . . . . . . . . . . . . . . . . . . . . . . . . . . . . . . . . . . . . . . . . . . . . . . . . . . . . . . . 61Table V.A-3. Comparison of Total Emissions for Different Control Scenarios . . . . . . 62Table V.A-4. Summary of NOx Emissions Reductions . . . . . . . . . . . . . . . . . . . . . . . 63Table V.B-1. UAM-V Air Quality Metrics . . . . . . . . . . . . . . . . . . . . . . . . . . . . . . . . . . 64Table V.B-2. Results for Metric 1: Number of Exceedences . . . . . . . . . . . . . . . . . . . 66Table V.B-3. Results for Metric 3: Total “ppb” Reduced . . . . . . . . . . . . . . . . . . . . . . 66Table V.B-4. Results for Transport Runs . . . . . . . . . . . . . . . . . . . . . . . . . . . . . . . . . . 72

iii
LIST OF APPENDICES1
APPENDIX AFIGURES
APPENDIX BEQUATIONS FOR UAM-V METRICS
APPENDIX C1-HOUR UPWIND/DOWNWIND LINKAGES
APPENDIX D8-HOUR UPWIND/DOWNWIND LINKAGES
APPENDIX E1-HOUR AND 8-HOUR PERCENT CONTRIBUTION TABLES
APPENDIX FEVALUATION OF CONTRIBUTIONS -- TABLES OF METRICS1-HOUR UAM-V: UPWIND STATES TO DOWNWIND STATES
APPENDIX GEVALUATION OF CONTRIBUTIONS -- TABLES OF METRICS1-HOUR CAMX: UPWIND STATES TO DOWNWIND STATES
APPENDIX HEVALUATION OF CONTRIBUTIONS -- TABLES OF METRICS1-HOUR UAM-V: UPWIND STATES TO DOWNWIND NONATTAINMENTAREAS
APPENDIX IEVALUATION OF CONTRIBUTIONS -- TABLES OF METRICS1-HOUR CAMX: UPWIND STATES TO DOWNWIND NONATTAINMENTAREAS
APPENDIX JEVALUATION OF CONTRIBUTIONS -- TABLES OF METRICS8-HOUR UAM-V: UPWIND STATES TO DOWNWIND STATES
APPENDIX KEVALUATION OF CONTRIBUTIONS -- TABLES OF METRICS8-HOUR CAMX: UPWIND STATES TO DOWNWIND STATES
APPENDIX LNOx CONTROL STRATEGIES -- TABLES OF METRICS
APPENDIX MTRANSPORT SCENARIOS -- TABLES OF METRICS
1. Note: (a) there is no electronic version of Appendix A and (b) the cover pages for Appendices B - Mare included at the end of the electronic version of this document and the actual data for these appendicesare in separate electronic files.

1 Even though the actual finding of significant contribution applies only to the portion of a State’semissions for which EPA has identified highly cost-effective controls, for ease of discussion, theterm "significant" (or like terms) is used in this document to characterize the emissions of eachupwind State that make a large and/or frequent contribution to nonattainment in downwind areas.
1
I. Scope and Content of this Document
In the development of the NOx SIP Call, EPA performed a number of air qualityanalyses to support the multi-factor approach to identify amounts of NOx emissions thatcontribute significantly to nonattainment in downwind areas. These analyses includesubregional and State-by-State modeling to (a) quantify the air quality contributions fromemissions in upwind States to both 1-hour and 8-hour nonattainment, as well as 8-hourmaintenance, in downwind areas, and (b) determine whether these contributions aresignificant.1 In addition, modeling analyses were performed to assess the benefits ofalternative regional NOx control strategies and, in particular, to confirm that theemissions considered to significantly contribute, taken as a whole, have a meaningfulimpact on nonattainment in downwind areas. All of the emissions data and modelpredictions from the model runs described in this document can be obtainedelectronically from the EPA Regional Modeling Center ftp site(ftp://www.epa.gov/pub/scram001/modelingcenter/).
This report was prepared to document the technical procedures and findings forthe State-by-State modeling of contributions and the air quality assessment ofalternative NOx controls. The EPA’s analyses and findings from the subregionalmodeling are described in the November 7, 1997 NOx SIP Call Notice of ProposedRulemaking. Also, an initial assessment of the proposed Statewide NOx budgets wasprovided in the May 11, 1998 Supplemental Notice of Proposed Rulemaking.
The Technical Support Document is structured in the following way. Section IIcontains an overview of the air quality modeling systems, episodes, and emissionsinventories used for these analyses. In Section III there is a discussion of (a) the 2007Base Case scenario which serves as the baseline for both the evaluation ofcontributions and the assessment of strategies, (b) the development of 1-hour and 8-hour “nonattainment” receptor areas which are used for defining downwind ozoneproblem areas, and (c) an overview of the “metrics” (i.e., measures of ozone) used toanalyze and interpret modeling results. The evaluation of the significance of upwind todownwind contributions is provided in Section IV. This includes a description of the

2
State-by-State modeling scenarios, source areas, and metrics, as well as themethodology used for evaluating the significance of individual upwind to downwindlinkages and the findings for this evaluation. Finally, Section V describes the strategyscenarios, metrics, analysis of results, and the findings for the assessment of alternativeregional NOx strategies.

2 Variable Grid Urban Airshed Model
3 Comprehensive Air Quality Model with Extensions
3
II. Technical Approach
II.A. Description of Models
The EPA performed air quality modeling to (a) confirm the proposed approach fordetermining significant contribution, and (b) evaluate the relative benefits of regionalNOx strategies. The additional modeling for the assessment of contributions consistedof State-by-State zero-out modeling using UAM-V2 and State-by-State sourceapportionment modeling using the CAMx3 Anthropogenic Precursor CulpabilityAssessment (APCA) technique. The modeling for the assessment of regional strategiesconsisted of a series of model runs using UAM-V. These models are described below.
II.A.1. UAM-V and CAMx
The UAM-V and CAMx models are both three-dimensional photochemical airquality grid models designed for integrated assessment of photochemical air pollutionover regional and urban scales. The basis of the two models is a set of species masscontinuity equations to represent the relevant processes that affect photochemical airquality, including both the biogenic and anthropogenic emissions of NOx and VOC, thespatial and temporal variations of winds, atmospheric stability and the level of mixing, thechemical reactions involving VOC, NOx, and other important species, the diurnalvariations of solar insolation and temperature, the loss of ozone and ozone precursors bydry and wet deposition, and the ambient background of ozone, VOC, NOx, and otherimportant species.
Both the UAM-V and CAMx models are suitable for evaluating the air qualityeffects of emission control scenarios because they accounts for spatial and temporalvariations as well as differences in the reactivity of emissions. This is achieved by firstreplicating historical ozone episodes to establish a base year simulation. Model inputs areprepared from observed meteorological data, emissions data, and air quality data for theepisode days. The model is then applied with these inputs, and the results are evaluatedto determine model performance. Once the model results have been evaluated and

4
determined to perform within prescribed levels, the same base year meteorological inputsfor each episode are combined with modified or projected emission inventories to simulatea projected future base case and alternative emission strategies.
The UAM-V model used in the NOx SIP call modeling analysis is an updatedversion (Version 1.24). It incorporates the Carbon-Bond IV (CB-IV) chemical mechanism(Gery et al., 1989) with updated isoprene and radical-radical reactions (Whitten et al.,1996). Features of the UAM-V modeling system include variable vertical grid structure,two-way nested grid, plume-in-grid treatment, etc. A detailed description of the UAM-Vmodeling system is provided in the user’s guide (SAI, 1995).
The EPA used CAMx Version 1.13 which has incorporated the updated CB4-IVmechanism for the NOx SIP call applications. The major differences between the CAMxand the UAM-V include the treatment of plume-in-grid, the numerical methods for solvingchemistry and vertical diffusion, and the calculations of species dry deposition (ENVIRON,1997a). However, as described in the model performance subsection below, EPA andseveral modeling comparison studies (STI, 1997b; AGL, 1998) have found that the CAMxgives comparable results to the UAM-V. A key feature of the CAMx is that it has includeda source apportionment technique to assess the contributions of multiple source regionsand categories to specific receptor areas (ENVIRON, 1997b). A detailed description of theCAMx modeling system is given in the user’s guide (ENVIRON, 1997a).
II.A.2. CAMx Source Apportionment Technique
The EPA used the CAMx source apportionment technique as part of the modelinganalysis to evaluate the downwind contributions of emissions in upwind States. Thesource apportionment technique in the CAMx was developed to provide modelers with ameans of estimating the contributions of many different source areas/categories to ozoneformation in one single model run. This is achieved by using multiple tracer species totrack the fate of ozone precursor emission (VOC & NOx) and the ozone formation causedby these emissions within a CAMx simulation. The methodology is designed so that allozone and precursor concentrations are attributed to the selected sourceareas/categories at all times. Thus, for all receptor locations and times, the ozone, VOC,and NOx concentrations predicted by the CAMx are attributed to the sourceareas/categories. In the CAMx source apportionment modeling for the NOx SIP callanalysis, the source groupings are based on a single State or multiple States and the

4 The full July 1988 episode extended from July 1 through July 15. However, the OTAGstrategies were simulated for the July 1-11, 1988 period.
5
receptor groupings is based on either a single State or an ozone nonattainment area asdescribed in Sections III and IV. The EPA used the Anthropogenic Precursor CulpabilityAssessment (APCA) as the source apportionment technique for the NOx SIP callmodeling. The key feature of APCA is that it allocates the ozone production to themanmade precursor emissions either through reactions among various manmadesources and/or through reactions between manmade emissions and biogenic emissions.A technical detail of the CAMx source apportionment technique and APCA is given in theENVIRON’s report (ENVIRON, 1997c).
II.B. Episodes
For purposes of evaluating air quality impacts, EPA modeled all of the episodesthat were used by OTAG. These episodes, and the reasons for selecting them, asdescribed in the OTAG Final Report (OTAG, 1997), are as follows:
July 1–11, 19884
C Surface ozone concentrations indicated a large area of high ozone concentrationsacross the Midwest, Northeast, and Southeast regions.
C Synoptic weather conditions showed a large area of high pressure building overthe northern Great Lakes on July 1 and moving gradually east so that much of theeastern United States was covered by high pressure for the next 6 or 7 days.Temperatures exceeded 90/F for several days in the Midwest, Northeast, andSoutheast regions. These conditions allowed pollutant concentrations to build up tohigh levels. (Although warm temperatures persisted for the remainder of theepisode, spotty showers associated with a weak stationary front across theMidwest and Northeast regions kept ozone levels down in portions of the easternUnited States.)
C Progression of high ozone concentrations and synoptic weather conditionssuggested interstate and interregional transport.
July 13–21, 1991C Surface ozone concentrations indicated a large area of high ozone concentrations
across the Midwest and Northeast regions.

6
C Synoptic weather conditions showed a large area of high pressure building overthe central plains on July 13 and moving gradually east so that much of the easternUnited States was covered by high pressure for the next 6 or 7 days.Temperatures exceeded 90/F for several days in the Midwest and Northeastregions. These conditions allowed pollutant concentrations to build up to highlevels.
C Progression of high ozone concentrations and synoptic weather conditionssuggested interstate and interregional transport.
July 20–30, 1993
C Surface ozone concentrations indicated a large area of high ozone concentrationsacross the Southeast region.
C Synoptic weather conditions showed a stationary front separating the north (theMidwest and Northeast regions) and the south. The Southeast and Southwestregions were covered by a hot, tropical air mass. Temperatures exceeded 100/Fevery day in the Southeast region. Combined with light wind speeds, theseconditions allowed pollutant concentrations to build up to high levels. A cold frontstarted to move across the central United States during the middle of the episode.The tropical air mass was pulled up ahead of this front, leading to high ozoneconcentrations for a day or two in the southern portion of the Midwest andNortheast regions.
C Progression of high ozone concentrations and synoptic weather conditionssuggested interstate and intraregional transport and, to some degree, interregionaltransport, in the Southeast region.
July 7–18, 1995C Surface ozone concentrations indicated a large area of high ozone concentrations
across the Midwest, Northeast, and Southeast regions.C Synoptic weather conditions showed an area of high pressure building over the
northern plains on July 7 and moving gradually east so that much of the easternUnited States was covered by high pressure for the next 6 to 7 days.Temperatures exceeded 100/F for several days in the Midwest and Northeastregions. These conditions allowed pollutant concentrations to build up to highlevels.
C Progression of high ozone concentrations and synoptic weather conditions

5 The OTAG 1995 emissions are based on the 1990 base year emissions projected to 1995considering growth and Clean Air Act controls between 1990 and 1995.
7
suggested interstate and interregional transport.
Each episode included a 2–3 day "ramp-up" period to initialize the model. The ramp-updays were July 1-3, 1988, July 13-15, 1991, July 20-21, 1993, and July 7-9, 1995.Predictions for the ramp-up periods were not used in any portion of this analysis.
II.C. Model Setup
The EPA used the OTAG modeling domain. This domain is shown in Figure A-1 inAppendix A and includes portions or all of 37 states and the District of Columbia and partsof three Canadian provinces, Ontario, Quebec, and New Brunswick. The EPA also usedthe OTAG configurations for:
C Initial conditions/boundary conditions;C Meteorological data;C Grid configurations;C Fine grid/coarse grid definition; andC Vertical layer structure.
These elements of the modeling are described in the OTAG Final Report (OTAG, 1997).
II.D. Base Year Emissions
For the modeling performed in support of the SIP call, EPA relied heavily on the1995 emissions projections developed during the OTAG process.5 The Base Year wascomprised of a combination of 1995 and 1996, and was intended to be used asrepresentative of the 1994-1996 time period, rather than a specific year. For highway,nonroad, and stationary area sources, the OTAG 1995 emissions were used. For non-electricity generating unit (EGU) point sources, the OTAG 1995 emissions were used,with some small changes to reflect corrections to Source Classification Codes (SCC) forcertain sources. For the EGU sector, a complete set of 1996 base year data weredeveloped, using EPA’s Acid Rain Data Base as a starting point. The development of theEGU and non-EGU point source data is described in the March 23, 1998, technical

8
support document titled "Development of Modeling Inventory and Budgets for the OzoneTransport SIP Call" (EPA, 1998a).
The models used require gridded, hourly, speciated emissions of ozoneprecursors (VOC, NOx, and CO). The starting point for this is a typical summer weekdayinventory, a typical summer Saturday inventory, and a typical summer Sunday inventoryfor nonroad, stationary area, and point sources and day specific inventories for highwaysources. For highway, nonroad, stationary area, and non-EGU point sources, theseinventories were derived using the same temporal allocation factors that OTAG used. Forthe EGU sector, a slightly different approach was used. Seasonal emissions wereobtained from continuous emissions monitoring (CEM) data and other sources, asdescribed in the Inventory Development TSD (EPA, 1998a). Seasonal emissions wereconverted to typical July day emissions using the July share of total summer generation. This approach is described in a December 1996 report titled “Forecast of Average DailyNOx Emissions in July by Electric Generation Units Using OTAG 2007 Base Case andthe Integrated Planning Model (IPM)” (EPA, 1996). The typical summer weekday,Saturday, and Sunday inventories were derived using EMS-95 with revised temporalallocation factors developed by LADCO based on the CEM data. The revisions to EMS-95 developed by LADCO are available on the Regional Modeling Center ftp site(ftp://www.epa.gov/pub/scram001/modelingcenter/emissions/ems95_program_files/).
II.E. Model Performance
II.E.1. UAM-V
As part of OTAG, an objective evaluation of model predictions was conducted foreach of the four OTAG episodes in order to determine the performance of the modelingsystem for representing regional ozone concentration levels. This evaluation focused ona number of statistical metrics comparing predicted ozone to ground-level ozonemeasurements (STI, 1997a). The results indicate generally good agreement betweensimulated and observed values. Most importantly, areas of predicted high ozonecorrespond to areas of observed high ozone. However, a few relatively minor concernswere found, such as:
< a tendency to underestimate concentrations in the North and overestimateconcentrations in the South;
< concentrations at night are somewhat underestimated relative to daytime

9
predictions;< low observed concentrations tend to be overestimated and higher observed
values tend to be underestimated; and< concentrations at the start of the episode tend to be underestimated with a
tendency for concentrations at the end of the episode to be overestimated.
The success of the model for predicting pollutant concentrations aloft is alsoimportant from a transport perspective. During the day, when the atmosphere is "wellmixed," ground-level ozone values can serve as a good measure of both local formationand transport. However, at night, ozone is depleted in a very shallow layer near theground due to deposition and nighttime chemical reactions. Thus, during the overnightand early morning, ground-level measurements and predictions do not adequately reflectpollutant transport. Aircraft-measured pollutant data and model predictions during theseperiods indicate moderate to high levels of ozone aloft which can then mix down duringthe day and further elevate ground-level concentrations. A limited amount of measureddata aloft are available from non-OTAG field studies for several of the days in the 1991and 1995 episodes. In general, the model tends to underestimate ozone aloft. Thissuggests that the model may somewhat underestimate the amount of ozone transportaloft, especially overnight into the early morning hours. Thus, the contribution of upwindsource regions to ozone levels in downwind areas may actually be greater than estimatedby the model.
II.E.2. CAMx
The CAMx has been used as a modeling tool in a number of regional modelinganalyses. In several modeling comparative studies, the model performance of the CAMxhas been evaluated against the observations together with that of the UAM-V (STI,1997b; AGL, 1998). In general, these comparative studies have found that theperformance of the CAMx for ozone was similar to the performance of the UAM-V model. As part of the NOx SIP call modeling analysis, EPA has also compared the two models interms of the predictions of ozone and its precursors for the 1995 episode with the BaseYear emissions. The discussion of these model comparison studies between the CAMxand UAM-V are given below.
STI (1997b) reported a comparison study of model performance based on the July

10
16-21, 1991 and July 10-18, 1995 OTAG episodes. STI concluded that the performanceof the CAMx for ozone in general was similar to the performance of the UAM-V model inboth OTAG episodes. Minor differences exist between the model predictions in specificsubregions and for specific days. Overall, the STI’s report (STI, 1997b) showed that forthe 1995 episode, the differences between the predictions of the two models are largerthan those for the 1991 episode. The CAMx performed slightly better on average in 1995since it had lower mean normalized error than UAM-V; however, the UAM-V modelperformed slightly better on predicting the 1-hour ozone maxima in the 1995 episode.
AGL (1998) presented a summary of model performance evaluation fromapplications of the UAM-V and CAMx models using the July 1991 and July 1995 OTAGdata sets. Both that ground-level ozone and ozone aloft predicted by the two models werecompared to the observed surface and aircraft data. AGL concluded that the comparativeevaluations in both OTAG and SIP modeling studies reveal that the CAMx modelperformance and responsiveness to emissions change scenarios are generally equivalentto that of UAM-V. In the comparison work based on the NARSTO-NE and LMOS aircraftdata, AGL found that both the UAM-V and CAMx models tend to underestimate theaverage aloft ozone concentration. The implication is that the two models may somewhatunderestimate the amount of ozone transport aloft.
As part of the SIP call modeling analysis, EPA’s comparison of the CAMx andUAM-V models includes the model predictions of ozone and its precursors for the July1995 episode with the Base Year emissions as discussed in Section II.D. The standardOTAG statistical measures, as described in STI’s report (STI, 1997a) were used toevaluate the model performance for the entire domain and four OTAG subregions. In thecomparison of the model performance, EPA’s findings are in general consistent with thefindings by the two comparative studies described above (STI, 1997b; AGL, 1998).Overall, the UAM-V and CAMx show comparable model performance against theobserved data. Other than the findings given by the two reports above, EPA found thatboth models tend to underpredict the mean ozone concentration above 80 and 120 ppb.In addition, CAMx tends to predict higher ozone than the UAM-V, especially in the highozone hours, by 2 to 5 ppb domainwide. Another finding is that on domainwide average,the UAM-V tends to predict lower nitric acid (HNO3) and NOx but higher formaldehyde(FORM) and VOC than the CAMx.

11
II.E.3. State-by-State vs. Source Apportionment Modeling
The model performance comparisons discussed above show that the UAM-V andCAMx models are technically equivalent based on various statistical measures. However,it is also important to consider that the zero-out modeling is different from the sourceapportionment modeling for evaluating upwind contributions to downwind receptors. Thisis due to the fact that the source apportionment technique directly estimates thecontributions of upwind sources to receptor areas, while the zero-out modeling indirectlyquantifies the contributions by the differences of two model runs (i.e., Base Case vs. zero-out). This will lead to some differences in magnitude and frequency of contributions forindividual upwind to downwind linkages. In general, EPA found that the sourceapportionment modeling tends to show greater magnitude of contributions than the zero-out modeling for individual linkages. EPA acknowledged that both modeling techniqueshave their usefulness, but they also have their limitations. However, currently there is notechnical evidence showing that one technique is clearly superior to the other forevaluating contributions to ozone from various emission sources.
III. Building Blocks for Analysis of Model Results
III.A. 2007 Base Case
The 1995 (1996) Base Year inventory was projected to 2007 and certain controlswere applied, resulting in the 2007 Base Case inventory. The Base Case emissionsreflect Clean Air Act mandated controls as well as certain Federal measures that EPA haspromulgated or expects to promulgate. The control measures included in the Base Casefor each source sector are listed in Table III.A-1. For highway, nonroad, and stationaryarea sources, the OTAG projections were used. These projections reflect “level 0"controls for highway and “level 1" controls for stationary area and nonroad. For non-EGUpoint sources, the methods for projecting the inventory from 1995 to 2007 are described inthe March 23, 1998 Inventory Development TSD (EPA, 1998a). The emissions for EGUswere obtained from simulations of IPM which projected 1996 electric generation to 2007based on economic assumptions, unit specific capacity, and the requirements in Title Iand Title IV of the CAA. A description of the IPM Base Case simulation is contained in theregulatory Impact Analysis (RIA) for the NOx SIP Call (EPA, 1998b). Table III.A-2compares the Base Year NOx and VOC emissions to the Base Case emissions. Acrossthe entire modeling domain, the 2007 Base Case NOx emissions are 1% less than the

12
1995 (1996) Base Year emissions and the Base Case VOC emissions are 19% less thanthe Base Year.
Table III.A-1 . 2007 SIP Call Base Case Controls.
Utilities - Title IV Controls [ phase 1 & 2 ]- 250 Ton PSD and NSPS- RACT & NSR in non-waived NAAs
Non-Utility Point - NOx RACT on major sources in non-waived NAAs- 250 Ton PSD and NSPS- NSR in non-waived NAAs- CTG & Non-CTG VOC RACT at major sources in NAAs & OTR- New Source LAER
Stationary Area - Two Phases of VOC Consumer and Commercial Products & One Phase ofArchitectural Coatings controls- VOC Stage 1 & 2 Petroleum Distribution Controls in NAAs- VOC Autobody, Degreasing & Dry Cleaning controls in NAAs
Nonroad Mobile - Fed Phase II Small Eng. Stds- Fed Marine Eng. Stds.- Fed Nonroad Heavy-Duty (>=50 hp) Engine Stds - Phase 1- Fed RFG II (statutory and opt-in areas)- 9.0 RVP maximum elsewhere in OTAG domain- Fed Locomotive Stds (not including rebuilds)- Fed Nonroad Diesel Engine Stds - Phases 2 & 3
Highway Vehicles - National LEV- Fed RFG II (statutory and opt-in areas)- 9.0 RVP maximum elsewhere in OTAG domain- High Enhanced I/M (serious and above NAAs)- Low Enhanced I/M for rest of OTR- Basic I/M (mandated NAAs)- Clean Fuel Fleets (mandated NAAs)- On-board vapor recovery- HDV 2 gm std
Rate of ProgressRequirements
- Effectively, ROP through 1999

13
Table III.A-2. Comparison of Base Year and Base Case Emissions. (Tons of NOxper day).
NOx VOC
State 1995/1996Base Year
2007 BaseCase
PercentChange
1995/1996 BaseYear
2007 BaseCase
PercentChange
Alabama 1749.12 1670.4 -5% 1256.48 1069.88 -15%Arkansas 703.4 784.95 12% 696.61 642.35 -8%Connecticut 415.53 335.08 -19% 539.73 362.92 -33%Delaware 190.11 216.63 14% 173.13 112.00 -35%District of Columbia 44.56 47.78 7% 46.54 29.47 -37%Florida 2294.59 2581.56 13% 2059.30 2159.75 5%Georgia 1787.42 1678.92 -6% 1611.14 1271.17 -21%Illinois 2807.16 2420.66 -14% 2855.25 2207.15 -23%Indiana 2326.04 2374.66 2% 1818.65 1357.78 -25%Iowa 772.27 810.77 5% 838.79 727.87 -13%Kansas 1037.63 1052.92 1% 836.72 741.28 -11%Kentucky 2003.94 1874.05 -6% 1289.56 1056.28 -18%Louisiana 2291.12 2199.24 -4% 1331.13 1018.33 -23%Maine 207.59 214.72 3% 267.98 210.30 -22%Maryland 893.95 799.94 -11% 723.70 481.74 -33%Massachusetts 708.98 653.42 -8% 912.08 614.90 -33%Michigan 1784.23 1880.21 5% 1718.90 1517.21 -12%Minnesota 842.88 872.94 4% 1283.74 1099.10 -14%Mississippi 1002.78 1049.08 5% 1015.30 925.80 -9%Missouri 1359.43 1273.04 -6% 1345.80 1187.32 -12%Nebraska 406.52 380.28 -6% 463.58 406.71 -12%New Hampshire 212.05 233.79 10% 185.15 115.21 -38%New Jersey 959.94 829.64 -14% 1237.31 918.04 -26%New York 1723.79 1506.19 -13% 2256.26 1371.90 -39%North Carolina 2025.65 1629.55 -20% 1851.78 1488.56 -20%North Dakota 46.78 53.29 14% 61.41 58.62 -5%Ohio 3287.34 2803.99 -15% 2312.06 1624.64 -30%Oklahoma 1135.57 1327.88 17% 859.70 808.52 -6%Pennsylvania 2466.91 2404.91 -3% 1887.25 1318.95 -30%Rhode Island 99.97 87.12 -13% 153.19 100.34 -34%South Carolina 1118.96 1224.89 9% 1072.81 1013.32 -6%South Dakota 124 136.75 10% 168.69 156.91 -7%Tennessee 2303.89 2086.41 -9% 1941.06 1778.17 -8%Texas 4522.62 4283.65 -5% 3777.24 2667.47 -29%Vermont 75.29 78.05 4% 98.40 70.77 -28%Virginia 1529.68 1599.42 5% 1540.16 1366.85 -11%West Virginia 1461.35 1128.77 -23% 621.81 418.38 -33%Wisconsin 1010.97 1008.43 0% 1121.05 854.88 -24%Total 49365.42 48915.89 -1% 46224.44 37337.84 -19%

6 For the purposes of the evaluation of contributions, EPA is using the phrase “designatedcounties” to refer to those counties for which the 1-hour standard still applies. Therefore, EPAused these counties in the evaluation of significant contribution to downwind nonattainment areasfor the 1-hour NAAQS.
14
The Base Case was used as a baseline for the SIP call air quality modeling. Forthe UAM-V modeling, the Base Case serves as a point of reference to which the zero-outand strategy runs were compared. In the source apportionment modeling, the Base Casewas used to quantify the downwind impacts of upwind source areas by tracking theformation, chemical transformation, depletion, and transport of ozone formed from BaseCase emissions.
III.B. Receptor Areas
The EPA analyzed the modeling results using several types of nonattainmentreceptors. Nonattainment receptors for the 1-hour analysis include those grid cells that(a) are associated with counties designated as nonattainment for the 1-hour NAAQS6 and(b) have 1-hour Base Case model predictions >=125 ppb. These grid cells are referred toas "designated plus modeled" nonattainment receptors. Table III.B-1 lists the 1-hournonattainment areas that were considered in this analysis, along with the State(s) in whichthe nonattainment area is located. The counties designated nonattainment for the 1-hourNAAQS are shown in Figure A-2 in Appendix A. Grid cells were linked to a specificnonattainment area if any part of the grid cell covered any portion of a county in anonattainment area. In cases where a grid cell covered two or more nonattainment areas,the grid was tied to the nonattainment area that contained the largest portion of the areaof the grid cell. For intrastate nonattainment areas that were close to the border of anadjacent State, grids which would have been tied to the nonattainment area using thepreceding rule were excluded if the largest portion of the grid was in an adjacent State. The grids that were used as “designated plus modeled” receptor areas are shown inFigures A-3a and A-3b in Appendix A. Using these receptors, the metrics were calculatedfor each 1-hour nonattainment area as well as for each State. To calculate the metrics byState, all of the 1-hour nonattainment receptors in that State were pooled together. Onlythose grids that were within the State boundaries were included. Where a grid coveredmore than one State, that grid was tied to the State that contained the largest portion ofthe area of the grid cell.

7 Washington, DC is used to refer to the entire nontattainment area. In some tables, thenonattainment area is also referred to as "Metro DC." The District of Columbia is used to refer tothe District itself, not including the Maryland and Virginia portions of the metropolitan area.
15
Table III.B-1. 1-Hour Nonattainment Areas Evaluated.
Nonattainment Area State(s)
Atlanta Georgia
Baltimore Maryland
Birmingham Alabama
Boston/Portsmouth1 Massachusetts, New Hampshire
Chicago/Milwaukee2 Illinois, Indiana, Wisconsin
Cincinnati Kentucky, Ohio
Greater Connecticut Connecticut
Louisville Indiana, Kentucky
Memphis Mississippi, Tennessee
New York City Connecticut, New Jersey, New York
Philadelphia Delaware, Maryland, New Jersey, Pennsylvania
Pittsburgh Pennsylvania
Portland Maine
Rhode Island Rhode Island
Southwestern Michigan3 Michigan
St. Louis Illinois, Missouri
Washington, DC7 District of Columbia, Maryland, Virginia
Western Massachusetts Massachusetts
1. For the purposes of this analysis EPA has combined the Greater Boston nonattainment area whichincludes portions of Massachusetts and New Hampshire, with the Portsmouth, New Hampshirenonattainment area into a single downwind nonattainment receptor area.2. For the purposes of this analysis EPA has combined the 1-hour nonattainment counties that are along theshoreline of Lake Michigan in the States of Illinois, Indiana, and Wisconsin into a single downwindnonattainment receptor area.3. For the purposes of this analysis EPA has combined the 1-hour nonattainment counties that are along theshoreline of Lake Michigan in the State of Michigan into a single downwind nonattainment receptor area.
In addition to the nonattainment areas listed in Table III.B-1, EPA also evaluatedthe contributions of upwind States to ozone concentrations over Lake Michigan becausemodeled air quality over the lake can be indicative, under certain weather conditions, of air

16
quality in portions of the States surrounding the lake. High measured ozoneconcentrations in portions of Illinois, Indiana, Michigan, and Wisconsin near the shorelineof Lake Michigan are often associated with weather conditions which cause ozoneprecursor pollutants to be blown offshore over the lake during the morning, where theycan form high ozone concentrations which then return onshore during "lake breeze" windflows in the afternoon. Because the size of the grid cells used in the OTAG modeling isrelatively large compared to the spatial scale of the lake breeze, the high ozoneconcentrations predicted over the lake may not be blown back onshore in the model. Since high concentrations do, in reality, impact air quality along the shoreline of one ormore of these States, the EPA believes that it is appropriate to use predictedcontributions to ozone over Lake Michigan as a surrogate for contributions to any one ofthe surrounding States (i.e., Illinois, Indiana, Michigan, and Wisconsin).
For the 8-hour analysis, nonattainment receptors are those grid cells that (a) areassociated with counties currently violating the 8-hour NAAQS (based on 1994-1996data) and (b) have 8-hour Base Case model predictions >=85 ppb. These grid cells arereferred to as "violating plus modeled" nonattainment receptors. The counties that areviolating the 8-hour standard are shown in Figure A-4 in Appendix A. Grids were linked tospecific States in the same way as for the 1-hour NAAQS. The grids that were used as“violating plus modeled” receptors are shown in Figures A-5a and A-5b in Appendix A. The metrics for the 8-hour contribution analyses were calculated on a State-by-Statebasis by pooling together the "violating plus modeled" receptors in a State.
III.C. Metrics
The EPA selected several metrics in order to evaluate downwind contributionsfrom emissions in upwind States. The metrics were designed to provide information onthe three fundamental factors for evaluating whether emissions in an upwind State makelarge and/or frequent contributions to downwind nonattainment. These factors are (a) themagnitude of the contribution, (b) the frequency of the contribution, and (c) the relativeamount of the contribution. The magnitude of contribution factor refers to the actualamount of “ppbs” of ozone contributed by emissions in the upwind State to nonattainmentin the downwind area. The frequency of the contribution refers to how often thecontributions occur and how extensive the contributions are in terms of the number ofgrids in the downwind area that are affected by emissions in the upwind State. The

17
relative amount of the contribution is used to compare the total “ppb” contributed by theupwind State to the total “ppb” of nonattainment in the downwind area.
As indicated in Section II above, two modeling techniques (i.e., UAM-V zero-outand CAMx source apportionment) were used for the State-by-State evaluation ofcontributions. The EPA developed metrics for both modeling techniques for each of thethree factors. However, because of the differences between the two techniques, asdescribed in Section II, some of the metrics used for the UAM-V modeling and the CAMxmodeling are different. The specific UAM-V and CAMx metrics and how they relate to thethree factors used for the evaluation of contributions are described below in Section IV.B.
The UAM-V metrics developed as part of the evaluation of contributions are alsorelevant to the assessment of alternative regional NOx control strategies. As noted inSection II of this document, EPA performed the strategy assessment modeling usingUAM-V only. A description of how EPA used these metrics to evaluate alternative NOxcontrol strategies is contained in Section V of this document.

18
IV. Evaluation of Contributions
This section documents the State-by-State air quality modeling performed by EPAto determine whether emissions in specific upwind States make a significant contributionto downwind nonattainment. The UAM-V and CAMx model runs and the metricscalculated from the predictions of each model run which were used to quantify thecontributions are described in Section IV.A. A description of the methodology forevaluating individual upwind State-to-downwind area linkages is provided in Section IV.B.along with an example of the evaluation for the New York City nonattainment area. Section IV.C provides the results of the analysis.
IV. A. State-by-State Model Runs
The EPA performed State-by-State zero-out modeling using UAM-V and State-by-State source apportionment modeling using the CAMx APCA technique to quantify thecontributions of emissions in upwind States on nonattainment downwind. Each modelingtechnique (i.e., zero-out and source apportionment) provides a different technicalapproach to quantifying the downwind impact of emissions in upwind States. The zero-out modeling analysis provides an estimate of downwind impacts by comparing the modelpredictions from a Base Case run to the predictions from a run in which the Base Casemanmade emissions are removed from a specific State. In contrast, the sourceapportionment modeling quantifies downwind impacts by tracking formation, chemicaltransformation, depletion, and transport of ozone formed from emissions in an upwindsource area and the impacts that ozone has on nonattainment in downwind areas.
The UAM-V and CAMx State-by-State model runs are described below along withthe metrics calculated using the predictions of each of these modeling technique. Themethodology for using these metrics in the evaluation of contributions is described inSection IV.B.
IV.A.1. UAM-V State-by-State Modeling
In the UAM-V zero-out model runs all manmade emissions in a given upwind Statewere removed from the Base Case scenario. Each zero-out scenario was run for all 4episodes and the ozone predictions in downwind States were then compared to thosefrom the Base Case run in order to quantify the downwind impacts of emissions from the

19
upwind State (i.e., the State in which the manmade emissions were removed). The EPAperformed zero-out runs for the following set of States:
< Alabama, Georgia, Illinois, Indiana, Kentucky, Massachusetts, Michigan,Missouri, North Carolina, Ohio, South Carolina, Tennessee, Virginia, WestVirginia, and Wisconsin.
IV.A.2. UAM-V Metrics
The EPA quantified the contributions predicted by the UAM-V State-by-Statemodeling using the four metrics described below.
UAM-V Metric 1: Exceedences. This metric is the total number of predictedconcentrations exceeding the NAAQS (i.e. 1-hour values >=125 ppb and 8-hour values>=85 ppb) within the downwind area. In calculating this metric, EPA summed the numberof occurrences of values above the applicable standard (i.e., 1-hour or 8-hour) for allnonattainment receptors within the downwind area. For example, in Downwind Area #1there are five 1-hour "designated plus modeled" nonattainment receptors. For thisdownwind area, the Base Case value for Metric 1 is calculated by first counting thenumber of days, across all four episodes, that had 1-hour daily maximum values >=125ppb at each of the five receptors. The result is the total number of exceedences at eachreceptor over all days in all four episodes. Finally, the total number of exceedences ateach receptor is summed across all five receptors to produce the total number ofexceedences in Downwind Area #1, which is the value for Metric 1 for this area.
UAM-V Metric 2: Ozone Reduced -- ppb. This metric shows the magnitude andfrequency of the "ppb" impacts from each upwind State on ozone concentrations in eachdownwind area. These impacts are quantified by calculating the difference in ozoneconcentrations between the zero-out run and the Base Case. The results are thentabulated in terms of the number of "impacts" within six concentration ranges: >=2 to 5ppb, >=5 to 10, >=10 to 15, >=15 to 20, >=20 to 25, and > =25 ppb. The impacts for 1-hour daily maximum values and 8-hour daily maximum values are determined by tallyingthe total "number of days and grid cells" >=125 ppb or >=85 ppb that receive contributionswithin the concentration ranges. In the analysis of contributions, as described below, thedata from Metric 2 are used in conjunction with Metric 1 to determine the percent of theexceedences in the downwind area that receive contributions of > 2 ppb, > 5 ppb, > 10,

20
ppb, etc. The maximum "ppb" impact within the downwind area is also calculated as partof Metric 2.
Metric 3: Total ppb Reduced. This metric quantifies the total ppb contributed in thedownwind area from an upwind State, not including that portion of the contribution thatoccurs below the level of the NAAQS. For 1-hour concentrations, Metric 3 is calculatedby taking the difference between the Base Case predictions in each nonattainmentreceptor and either (a) the corresponding value in the zero-out run, or (b) 125 ppb,whichever is greater (i.e., 125 ppb or the prediction in the zero-out run). The Base Casevs zero-out differences are summed over all days and across all nonattainment receptorsin the downwind area. The calculation of this metric is illustrated by the followingexample. If the Base Case 1-hour daily maximum ozone prediction is 150 ppb and thecorresponding value from the zero-out run is 130 ppb, then the difference used in thismetric is 20 ppb. However, if the value from the zero-out run is 115 ppb, then thedifference used in this metric is 25 ppb (i.e., 150 ppb - 125 ppb, because 115 ppb is lessthan 125 ppb). The equation used for calculating this metric is provided in Appendix B.
To analyze the contributions using Metric 3, the values of this metric are comparedto the total amount of ozone above the NAAQS (i.e., 125 ppb, 1-hour or 85 ppb, 8-hour) inthe Base Case. This baseline measure of the "total amount of nonattainment" (i.e., thetotal "ppb" of ozone that is above the NAAQS) is calculated by summing the "ppb" valuesin the Base Case that are above the level of the NAAQS. The total contribution from anupwind State to a particular downwind area calculated by Metric 3 is expressed in relationto the amount that the downwind area is in nonattainment. For example, if Upwind State#1 contributes a total of 50 ppb >=125 ppb to Downwind Area #2 and the total Base Caseozone >=125 ppb in Downwind Area #2 is 500 ppb, then the contribution from UpwindState #1 (i.e., 50 ppb) to Downwind Area #2 is equivalent to 10 percent of Downwind Area#2's nonattainment problem (i.e., 50 ppb divided by 500 ppb, times 100). The equationused to calculate the baseline for this metric is given in Appendix B.
Metric 4: "Population-Weighted Total ppb Reduced." This metric is similar to the"Total ppb Reduced" metric except that the calculated contributions are weighted by (i.e.,multiplied by) population. In calculating this metric, the "ppb" contributions are determinedfor each nonattainment receptor, then summed across all nonattainment receptors in aparticular downwind area. During this calculation, the population in the nonattainmentreceptor is multiplied by the total contribution in that receptor (i.e., grid cell) and then this

21
value is added to the corresponding values for the other receptors in the downwind area. The equation used to calculate this metric is provided in Appendix B.
The Population-Weighted Total ppb > NAAQS in the 2007 Base Case serves as abaseline for evaluating the "Population-weighted Total ppb Reduced." This metric issimilar to the "Total ppb > NAAQS" except that the amount above the NAAQS is weightedby the population in the grid cell. The equation used to calculate the baseline metric isprovided in Appendix B.
IV.A.3. CAMx State-by-State Source Apportionment Modeling
In the CAMx modeling, the source apportionment technique was used to calculatethe contributions from upwind States to ozone concentrations above the NAAQS indownwind areas. Due to computational constraints, it was not possible for EPA to treateach State in the OTAG region as a separate source area. Several of the smaller Statesin the Northeast were grouped together as were seven States in the far western portion ofthe region. The following States were treated as individual source areas:
< Alabama, Florida, Georgia, Illinois, Indiana, Iowa, Kentucky, Louisiana,Maine, Massachusetts, Michigan, Mississippi, Missouri, New Jersey, NewYork, North Carolina, Ohio, Pennsylvania, South Carolina, Tennessee,Texas, Virginia, West Virginia, and Wisconsin.
The following States were grouped together:
< Connecticut and Rhode Island were combined; Maryland, Delaware and theDistrict of Columbia were combined; New Hampshire and Vermont werecombined; and Arkansas was combined with the portions of Oklahoma,Kansas, Minnesota, Nebraska, North Dakota, and South Dakota that liewithin the OTAG region.
A map showing these source areas is provided Figure A-6 in Appendix A.
IV.A.4. CAMx Metrics
The contributions from each of the CAMx source areas to downwind

8 The CAMx metrics calculated with 1-hour and 8-hour daily maximum concentrations areprovided in the docket. These data indicate contributions similar to (i.e., generally within 1 ppb or1 percent) those based on the hourly data for nearly all of the linkages. To the extent that thereare any differences, these differences are not large enough to alter EPA's findings for any of thelinkages.
22
nonattainment were evaluated using the four metrics described below. CAMx sourceapportionment technique calculates a "ppb" contribution from each source area to hourlyozone in each receptor grid cell. For this analysis, EPA only included contributions toconcentrations above the level of the 1-hour and 8-hour NAAQS. The following approachto treating 1-hour and 8-hour concentrations in calculating the four metrics was based onrecommendations to EPA by Environ, the developers of CAMx. For 1-hourconcentrations the metrics were calculated based on contributions to all hourly predictions>=125 ppb. For 8-hour concentrations, the metrics were calculated using every 8-hourperiod in a day with an average concentration >=85 ppb. In order to provide a link to theway 1-hour and 8-hour concentrations were treated for the zero-out runs, EPA alsocalculated the CAMx metrics for 1-hour daily maximum values >=125 ppb and 8-hourdaily maximum values >=85 ppb.8
Metric 1: Exceedences. This metric is calculated by tabulating the total number ofpredicted concentrations exceeding the NAAQS (i.e. 1-hour values >=125 ppb and 8-hourvalues >=85 ppb) within each downwind area.
Metric 2: Ozone Contributed -- ppb. This metric is calculated by tabulating the numberof "ppb" contributions from upwind States to downwind nonattainment receptors.Contributions are tabulated in terms of the frequency of impacts calculated by the sourceapportionment technique for six concentration ranges: >=2 to 5 ppb, >=5 to 10, >=10 to15, >=15 to 20, >=20 to 25, and >=25 ppb. In the analysis of contributions, the data fromMetric 2 are used in conjunction with Metric 1 to determine the percent of theexceedences in the downwind area that receive contributions of > 2 ppb, 5 ppb, >10 ppb,etc. The maximum 1-hour and 8-hour ozone contributed by each upwind source areas toa downwind nonattainment receptor area is also calculated as part of Metric 2.
Metric 3: Highest Daily Average Contribution. This metric is the highest daily averageozone "ppb" contribution from each upwind source area to each downwind nonattainmentreceptor area over all days modeled in all four episodes. The following exampleillustrates how this metric is calculated for 1-hour ozone concentrations. Similar

23
procedures are followed for calculating this metric for 8-hour concentrations. First, thehourly "ppb" contributions from a particular upwind source area to each nonattainmentreceptor in a downwind area are summed across all receptors in the downwind area. Thistotal daily contribution is then divided by the number of hours and grid cells >=125 ppb inthe downwind area to determine the daily average "ppb" contribution. This calculation isperformed on a day by day basis for each day in the 4 episodes. After the averagecontributions are calculated for each day, the highest daily average value across allepisodes is selected for analysis. In addition, the highest daily average contribution isexpressed as a percent of the downwind area's average ozone >=125 ppb. That is, thehighest daily average "ppb" contribution is divided by the average of the ozoneconcentrations >=125 ppb on that day (i.e., the day on which the highest average ppbcontribution occurred). For example, if the highest daily average contribution from anupwind State to nonattainment downwind is 15 ppb and the average of the hourly ozonevalues >=125 ppb on this day in the downwind area is 150 ppb, then the 15 ppbcontribution, expressed as a percent, is 10 percent.
Metric 4: Percent of Total Manmade Ozone Contribution. This metric represents thetotal contribution from emissions in an upwind State relative to the total ozone for all hoursabove the NAAQS in the downwind area. This metric, which is referred to as the"average contribution," is calculated for each episode as well as for all four episodescombined. The following example is used to illustrate how this metric is calculated for asingle episode for a particular downwind area. In step 1, all predicted Base Case hourlyvalues >=125 ppb in the downwind area are summed over all nonattainment receptorsand all days in an episode. In step 2, the "ppb" contributions from a source area to thisdownwind area are summed over all nonattainment receptors in the downwind area andall days in the episode to yield a total ppb contribution. The total contribution calculated inStep 2 is then divided by the total ozone >=125 ppb in the downwind area to produce thefraction of ozone >=125 ppb in the downwind area that is due to emissions from theupwind source area. This fraction is multiplied by 100 to express the result as a percent.
IV.B. Methodology for Evaluating Contributions
The results of the State-by-State UAM-V and CAMx modeling were analyzed inorder to determine which upwind States contribute significantly to nonattainment inspecific downwind areas for both the 1-hour and 8-hour NAAQS. Both UAM-V and CAMxmodeling results area available for fifteen States (i.e., Alabama, Georgia, Illinois, Indiana,

9 2007 Base Case NOx emission densities (tons/day-sq.mi.x100): Connecticut, 5933; Delaware,7461; District of Columbia, 63130; Maryland, 6421; Rhode Island, 5379.
24
Kentucky, Massachusetts, Michigan, Missouri, North Carolina, Ohio, South Carolina,Tennessee, Virginia, West Virginia, and Wisconsin). For an additional eight States (i.e.,Connecticut, Delaware, the District of Columbia, Maryland, New Jersey, New York,Pennsylvania, and Rhode Island), only CAMx modeling is available. Also, as notedpreviously, Connecticut and Rhode Island were combined as a single source area, andMaryland, the District of Columbia, and Delaware were also combined as a single sourcearea. Because the NOx emissions and/or NOx emissions density9 is large in eachjurisdiction within both of these combined source areas, EPA believes that the downwindcontributions from these combined source areas can be attributed to each jurisdictionwithin the source area.
The overall methodology used by EPA for evaluating the significance of individualupwind-to-downwind linkages includes three components. The first component, asdescribed in Section IV.B.1, is a review of the extent of the nonattainment problem in thedownwind area using ambient design values and model predictions of future ozoneconcentrations after the application of (a) Clean Air Act controls, (b) additional local NOxreductions, and (c) regional NOx reductions (local plus upwind). The second component,as described in Section IV.B.2., is an analysis of the overall nature of the contributions tononattainment in the downwind area which includes a comparison of the contribution fromlocal emissions versus the contributions from emissions in upwind States. The thirdcomponent is the interpretation of the three contribution factors (i.e., magnitude,frequency, and relative amount of contribution) using the UAM-V and CAMx metrics todetermine which linkages are significant and which ones are not. Section IV.B.3. includesa description of the approach followed by EPA to make this determination. SectionIV.B.4. provides an example analysis of EPA’s methodology for evaluating contributions to1-hour nonattainment in the New York City nonattainment area to illustrate eachcomponent in this process. The results of EPA’s evaluation for each upwind-to-downwindlinkage is summarized in Section IV.C. along with one of the significant 1-hour and 8-hourlinkages for each upwind State as examples of this evaluation. The detailed results for alllinkages are provided in Appendix C for 1-hour nonattainment and Appendix D for 8-hournonattainment.

25
IV.B.1. Extent of the Ozone Problem in the Downwind Area
For each downwind area, EPA examined the extent of the downwindnonattainment problem using several pieces of information, including ambient designvalues and estimates of future air quality using model predictions. The ambient designvalues for the 1-hour and 8-hour standards were used to indicate the severity of thecurrent ozone problem in each downwind area. The 1-hour and 8-hour design valueswere calculated using 1994-1996 ambient air quality monitoring data. The 1-hour valueswere determined by calculating the 4th highest 1-hour daily maximum concentration overthe three year period at each monitor in each county in the nonattainment area, thenselecting the highest value from among all counties in the nonattainment area torepresent the 1-hour design value for that area. The 8-hour design values weredetermined by calculating the average 4th highest 8-hour daily maximum concentrationover the three year period at each monitor in each county in each State, then selecting thehighest value in the State to represent the 8-hour design value for that State. The 1-hourdesign values are shown in Table IV.B-1 and the 8-hour design values are shown in TableIV.B-2.
In addition to current air quality, EPA considered the extent of the future ozoneproblem in each area using air quality modeling results for three scenarios. Thesescenarios were (a) the 2007 Base Case which includes Clean Air Act controls andadditional Federal control measures, (b) the application of additional local NOx controls,and (c) the application of regional NOx controls (i.e., local plus upwind controls). Thelocal control cases are the "downwind" control runs in the transport assessment describedin Section V, below. The regional control case is the 0.15 trading case that is alsodescribed in Section V. The values in these tables represent totals across all days in the4 episodes, excluding ramp-up days. The extent of the future ozone problem isexpressed in terms of (a) the percent of days across all episodes during which at least 1grid cell in the downwind area is predicted to have an exceedence in the Base Case and(b) the percent of Base Case exceedences which remain above the NAAQS after theapplication of NOx reductions in the two control scenarios. Table IV.B-1 contains the datafor the 1-hour NAAQS and Table IV.B-2 contains the data for the 8-hour NAAQS.

26
Table IV.B-1. Extent of 1-Hour Nonattainment Problem
Nonattainment Area
1994-1996Ambient
Design Value
Percent of BaseCase Days with
PredictedExceedences
Percent of ResidualExceedences After
Local Controls1
Percent of ResidualExceedences AfterRegional Controls
(0.15t)2
Atlanta 147 55% 70% 64%Baltimore 151 48% 75% 52%Birmingham 132 52% NA 61%Boston 130 35% 82% 73%Chicago/Milwaukee 146 3% 88% 88%Cincinnati 128 10% NA 67%Connecticut 149 29% 82% 65%Lake Michigan -- 29% 71% 64%Louisville 132 19% NA 46%Memphis 128 39% NA 52%Metro DC 134 48% 88% 75%New York City 144 39% 84% 73%Philadelphia 139 39% 62% 50%Pittsburgh 133 3% 40% 0%Portland, ME 126 10% NA 33%Rhode Island 133 13% 84% 37%Southwest Michigan 142 6% NA 27%St. Louis 136 10% NA 36%W. Massachusetts 129 10% 57% 43%
1. The percent of residual exceedences is the number of exceedences in the local control case divided bythe number of exceedences in the Base Case. For Chicago/Milwaukee and Lake Michigan, the local controlcase is 0.15nt applied to Illinois, Indiana, and Wisconsin; for Atlanta, it is 0.15nt applied to Georgia; for theNortheast nonattainment areas it is 0.15nt applied to Delaware, the District of Columbia, Connecticut,Maryland, Massachusetts, New Jersey, New York, Pennsylvania and Rhode Island. NA means that a localcontrol case was not performed for that area.2. The percent of residual exceedences is the number of exceedences in the 0.15t case divided by thenumber of exceedences in the Base Case.

27
Table IV.B-2. Extent of 8-Hour Nonattainment Problem
State
1994-1996Ambient
Design Value
Percent of BaseCase Days with
PredictedExceedences
Percent of ResidualExceedences After
Local Controls1
Percent of ResidualExceedences AfterRegional Controls
(0.15t)2
Alabama 96 74% NA 61%Arkansas 93 32% NA 70%Connecticut 101 55% 94% 85%District of Columbia 93 35% 100% 91%Delaware 98 65% 77% 46%Florida 85 29% NA 97%Georgia 105 71% 85% 73%Illinois 91 61% 76% 57%Indiana 102 68% 71% 34%Kentucky 95 81% NA 33%Louisiana 94 39% NA 96%Massachusetts 96 65% 90% 83%Maryland 105 90% 88% 67%Maine 94 35% NA 76%Michigan 101 42% NA 47%Missouri 104 55% NA 50%Mississippi 88 32% NA 87%North Carolina 94 77% NA 39%New Hampshire 94 39% NA 92%New Jersey 103 81% 83% 67%New York 97 71% 93% 86%Ohio 100 71% NA 28%Oklahoma 91 35% NA 96%Pennsylvania 103 81% 68% 27%Rhode Island 94 29% 90% 65%South Carolina 88 58% NA 48%Tennessee 99 84% NA 56%Texas 116 52% NA 98%Virginia 93 77% NA 58%Wisconsin 97 13% 74% 56%West Virginia 92 68% NA 27%
1. The percent of residual exceedences is the number of exceedences in the local control case divided bythe number of exceedences in the Base Case. For Illinois, Indiana and Wisconsin, the local control case is0.15nt applied to Illinois, Indiana, and Wisconsin; For Georgia, it is 0.15nt applied to Georgia; For theNortheast States it is 0.15nt applied to Delaware, the District of Columbia, Connecticut, Maryland,Massachusetts, New Jersey, New York, Pennsylvania and Rhode Island. NA means that a local controlcase was not performed For that area.2. The percent of residual exceedences is the number of exceedences in the 0.15t case divided by thenumber of exceedences in the Base Case.

10 Although there may be residual nonattainment in some portions of these States, air qualitymodeling based on OTAG run 5 , which is similar to the regional strategy, indicate that thestrategy will likely result in attainment of the 8-hour NAAQS in the vast majority of areas currentlymonitoring violations of the 8-hour NAAQS.
28
The data in Table IV.B-1 indicate a residual 1-hour nonattainment problem in eachof these areas in 2007 after the application of Clean Air Act controls plus other Federalmeasures in the Base Case. For example, for eight of the areas listed (i.e., Atlanta,Baltimore, Birmingham, Boston, Memphis, New York City, Washington, DC, andPhiladelphia), the modeling indicates that more than a third of the days modeled have anexceedence within the area. In addition, for those areas which were covered by one ofthe "downwind" control scenarios, the modeling indicates that there would beexceedences after additional NOx controls are applied locally. Also, even though theregional NOx strategy is predicted to provide substantial reductions in the number ofexceedences in all areas, there may still be residual 1-hour nonattainment in some areas. Concerning 8-hour ozone levels, 31 of the 37 States in the OTAG domain have ambientdesign values >= 85 ppb, as indicated in Table IV.B-2. Of these 31 States, 21 arepredicted to have one third or more of the exceedences eliminated by the regional NOxstrategy. However, even with the reductions in nonattainment resulting from this strategy,there may be some areas within these States that still show a residual 8-hour problem.10
IV.B.2. Nature of Contributions
The second component of the evaluation examines the relative amount ofcontribution from local emissions versus the amount from emissions in upwind States. For this analysis, EPA used the data from CAMx Metric 4 (i.e., the average percentcontribution to nonattainment in the downwind area). Specifically, the four-episodeaverage percent contributions from (a) "local" emissions (i.e., emissions from the State orStates in which the downwind area is located), (b) all upwind emissions combined (i.e.,the sum of the contributions from manmade emissions in all upwind States, combined),and (c) individual upwind States was tabulated. In addition to the four-episode averagecontribution, EPA also examined the highest single-episode average contribution fromeach upwind State. This information was used to determine whether upwind emissionsare an important part of the downwind areas' nonattainment problem. In general, the dataindicate that, although a substantial portion of the 1-hour nonattainment problem in manyof the downwind areas is due to local emissions, a substantial portion of the

29
nonattainment problem is also due to emissions from upwind States. For example, in 11of the areas 45 percent or more of the total manmade ozone >= 125 ppb comes from thecollective contribution from emissions in upwind States. In addition, for most upwind-State-to-downwind-area linkages there is no single upwind State that makes up all of theupwind contribution. Rather, the total contribution for all upwind States combined iscomprised of individual contributions from a number of upwind States that are relativelysimilar in magnitude such that there is no "bright line" which distinguishes between thecontributions from most of the individual upwind States.
IV.B.3. Approach to Determining Significant Contributions
As described above in Section III.C., EPA determined whether each individualupwind State significantly contributes to nonattainment in a particular downwind areausing the UAM-V and CAMx metrics to evaluate three aspects, or factors of thecontribution. These factors include the magnitude, frequency, and relative amount of thecontribution. The specific UAM-V and CAMx metrics which correspond to each of thefactors are identified in Table IV.B-3. As indicated in the table, there is at least onemetric from each modeling technique that corresponds to each of the three factors.
Table IV.B-3. Metrics Associated with Each Contribution Factor.
Factor: UAM-V CAMx
Magnitude ofContribution
Maximum "ppb" contribution(Metric 2)
Maximum "ppb" Contribution(Metric 2); andHighest Daily AverageContribution (Metric 3)
Frequency ofContribution
Number and percent of exceedences withcontributions in various concentration ranges(Metric 1 and 2)
Number and percent ofexceedences with contributionsin various concentration ranges(Metric 1 and 2)
Relative Amount ofContribution
Total "ppb" contribution relative to the total"ppb" that the downwind area is above theNAAQS (Metric 3); andTotal population-weighted "ppb" contributionrelative to the total population-weighted "ppb"that the downwind area is above the NAAQS(Metric 3)
Four-episode average percentcontribution from the upwindState to nonattainment in thedownwind area (Metric 4); and Highest single-episode averagepercent contribution from theupwind State to nonattainment inthe downwind area (Metric 4)
It should be noted that the relative contributions of individual upwind States to a particulardownwind area add up to 100 percent for the CAMx 4-episode average percent

11 Also, OTAG selected 2 ppb as a minimum value for evaluating it’s modeling results.
30
contribution. However, this is not the case for the CAMx highest single-episode averagepercent contribution since the value from one upwind State can occur in a differentepisode than the value from another upwind State to the same downwind area. Inaddition, it should be noted that UAM-V Metrics 3 and 4 are used in combination toexpress the total contribution above the NAAQS relative to the total amount that thedownwind area is above the NAAQS. The values for each of these metrics also do notadd up to 100 percent when considering the contributions from multiple upwind States toan individual downwind area.
The EPA compiled the UAM-V and CAMx metrics by downwind area in order toevaluate the contributions to downwind nonattainment. The data on 1-hour and 8-hourcontributions were compiled and analyzed separately. These data are provided inAppendix F through Appendix K for each upwind-to-downwind linkage. The contributiondata were reviewed to determine how large of a contribution a particular upwind Statemakes to nonattainment in each downwind area in terms of both the magnitude of thecontribution, and the relative amount of the total contribution. The data were alsoexamined to determine how frequently the contributions occur.
The first step in evaluating this information was to screen out linkages for which thecontributions were very low. This initial screening was based on a maximum "ppb"contribution of < 2 ppb from either UAM-V or CAMx and/or a four-episode averagepercent contribution < 1 percent, based on CAMx Metric 4. Any upwind State that did notpass both of these screening criteria for a particular downwind area was considered not tomake a significant contribution to that downwind area. These criteria were chosenbecause they appear to distinguish between contributions which may be significant andthose that definitely are not11. However, the screening criteria were not used as the basisfor finding that a particular linkage was significant. The finding of significance for linkagesthat passed the initial screening criteria was based on EPA’s technical assessment of thevalues for the three factors. Each upwind State that had large and/or frequentcontributions to the downwind area, based on these factors, is considered as contributingsignificantly to nonattainment in the downwind area. The EPA believes that each of thefactors provides an independent legitimate measure of contribution. However there hadto be at least two different factors that indicate large and/or frequent contributions in orderfor the linkage to be significant. In this regard, the finding of a significant contribution for

12 The regional strategy modeling is described in Section V, below.
31
an individual linkage was not based on any single factor.
For many of the individual linkages the factors yield a consistent result (i.e., eitherlarge and/or frequent contributions or small and/or infrequent contributions). In somecases, however, not all of the factors are consistent. For upwind-downwind linkages inwhich some of the factors indicate high and/or frequent contributions while other factorsdo not, EPA considered the overall number and magnitude of those factors that indicatelarge and/or frequent contributions compared to those factors that do not. Based on anassessment of all the factors in such cases, EPA determined that the upwind Statecontributes significantly to nonattainment in the downwind area if, on balance, the factorsindicate large and/or frequent contributions from the upwind State to the downwind area.
IV.B.4 Example Analysis of Contributions
The evaluation of the contributions to 1-hour nonattainment in New York City ispresented as an example to illustrate the process EPA followed in determining whichupwind States significantly contribute to downwind nonattainment. The first component ofthe analysis includes a description of the extent of the 1-hour nonattainment problem inNew York City based on ambient measurements and model predictions of the benefits ofClean Air Act controls in the 2007 Base Case, as well as the benefits of NOx controls inthe Northeast only and throughout the 23 jurisdictions.12 The second part of the analysisincludes a discussion of the relative contributions of local versus upwind emissions andthe evaluation of the significance of individual upwind States to 1-hour nonattainment inNew York City using all of the UAM-V and CAMx metrics.
IV.B.4.a. Extent of 1-Hour Nonattainment in New York City
The New York City nonattainment area, which consists of portions of New York,New Jersey, and Connecticut, is designated as a severe nonattainment area under the 1-hour NAAQS. The ambient 1-hour design value in New York City, based on 1994 through1996 monitoring data is 144 ppb. During the four OTAG episodes, 39 percent of the daysare predicted to have 1-hour exceedences in 2007 after the implementation of all Clear AirAct controls and Federal measures. The addition of regional NOx controls applied in theNortheast, including New York will reduce the predicted number of exceedences (i.e., 1-

13 Based on CAMx Metric 1.
32
hour daily maximum values >=125 ppb) by 16 percent. Extending these controlsthroughout the rest of the upwind States provides an overall reduction in exceedences of27 percent from the Base Case. However, even with these benefits, the modelingindicates that there may still be a residual 1-hour nonattainment problem in New York Cityafter the application of regional NOx controls.
IV.B.4.b. Upwind Contributions to 1-Hour Nonattainment in New York City
In the assessment of contributions to New York City, EPA examined the localversus upwind contributions to 1-hour nonattainment in this area, as shown in Table IV.B-4. On average, across all four episodes, 45 percent of the nonattainment problem in NewYork City is due to emissions from States upwind of New York, New Jersey, andConnecticut13. However, no single State stands out as contributing most of the totalupwind contribution. The biggest single contributor is Pennsylvania (18%) followed byMaryland/Washington, DC/Delaware (5%). The total contribution from all NortheastStates is 23%. An similar amount (22%) of the total contribution is due to emissions inthose States outside the Northeast. The data in Table IV.B-4 indicate that 19% of the22% is fairly evenly divided among ten States, whose contributions range from 1% (6States) to 4% (Ohio and Virginia). The remaining 3% (1.e., 19% vs 22%) is from Statesthat each contribute less than 1%, on average. The highest single-episode contributionsfrom States upwind of the Northeast range from 1% (Tennessee) to 8% (Virginia). Ingeneral, the contribution data in Table IV.B-4 indicate that a substantial amount of NewYork City’s nonattainment problem is due to the collective contribution from emissions in anumber of upwind States both within and outside the Northeast.
The extent of New York City's nonattainment problem and the nature of thecontributions from upwind States were considered in determining whether the values ofthe metrics indicate large and/or frequent contributions for individual upwind States. Specifically, the additional controls beyond the local and upwind NOx reductions whichare part of the regional NOx strategy may be needed to solve New York City's 1-hournonattainment problem. Also, the total contribution from all upwind States is large andthere is no single State or small number of States which comprise this total upwindportion. In this regard, the contributions to New York City from some States may notappear to be individually "high" amounts. However, (as described below) thesecontributions, when considered together with the contributions from other States (i.e., the

14 For New York City, each of the "Group 2" States were found to make a significant contribution. However, this was not the case for all of the Group 2 linkages in other nonattainment areas. Forexample, the contribution from Kentucky to Philadelphia and the contribution from Tennessee toBaltimore were Group 2 situations in which EPA determined that the contributions were notsignificant.
33
collective contribution) produce a large total contribution to nonattainment in New YorkCity.
The EPA evaluated the magnitude, frequency, and relative amount of contributionfrom emissions in individual upwind States to determine which States contributesignificantly to 1-hour nonattainment in New York City. The UAM-V and CAMx metricswhich quantify each upwind States’ contribution to New York City for each of the threefactors are provided Table IV.B-5 and IV.B-6 and described below. Examination of thevalues for these metrics indicates that the upwind States can be divided into three generalgroups, based on the magnitude, frequency, and relative amount of contribution. The firstgroup contains those upwind States for which the UAM-V and CAMx metrics all clearlyindicate a significant contribution to 1-hour nonattainment in New York City. The secondgroup contains those States for which the CAMx and UAM-V metrics are not quite asconsistent, but overall the metrics indicate a significant contribution to 1-hournonattainment in New York City14. The third group contains those States for which theCAMx and UAM-V metrics clearly indicate that the impacts do not make a significantcontribution to New York City.

34
Table IV.B-4. Percent Contribution from Upwind States to 1-Hour Nonattainment inNew York City.
Downwind Area:
New York City
Percent of Total ManmadeEmissions Over 4 Episodes1
Highest Single-Episode PercentContribution2
Amount due to "Local"Emissions3
55 NA4
Total Amount from all "Upwind"States
45 NA
Contributions from IndividualUpwind States
PA 18 19
MD/DC/DE 5 6
OH 4 6
VA 4 8
WV 3 7
IL 2 3
IN 1 2
KY 1 3
MI 1 4
MO 1 2
NC 1 2
TN 1 1
Total Amount from All OtherStates, combined
3 NA
1. These values are based on CAMx Metric 3 calculated across all 4 episodes.2. These values are based on CAMX Metric 3 calculated for each episode individually. These values do notadd up to 100 percent.3. Total contribution from the State(s) in which the Nonattainment area is located.4. Not applicable.

35
Table IV.B-5. Contributions to 1-Hour Nonattainment in New York City: UAM-V Metrics
Downwind Nonattainment Area: New York City UAM-V State Zero Out ModelingContributions to 1-Hr Designated + Modeled Receptors
Base case: Total Number of Exceedences (grids-days) = 418Upwind State
Percent totalppb reduced>= 125 ppb
Percentpop-wgt totalppb
Number ofexceedencesreduced >= 2ppb
Percentexceedencesreduced >= 2ppb
Number ofexceedencesreduced >= 5ppb
Percentexceedencesreduced >= 5ppb
Number ofexceedencesreduced >= 10ppb
Percentexceedencesreduced >= 10ppb
max 1-hrcontributionppb
AL 0% 1% 0 0% 0 0% 0 0% 0.4 GA 0% 1% 0 0% 0 0% 0 0% 0.4 IL 3% 5% 12 3% 0 0% 0 0% 2.9 IN 3% 4% 15 4% 0 0% 0 0% 2.7 KY 2% 2% 16 4% 0 0% 0 0% 2.6 MA 0% 0% 0 0% 0 0% 0 0% 0 MI 3% 5% 14 3% 0 0% 0 0% 3.2 MO 1% 1% 0 0% 0 0% 0 0% 0.7 NC 3% 4% 7 2% 0 0% 0 0% 3.6 OH 8% 8% 117 28% 1 0% 0 0% 5.4 SC 1% 1% 0 0% 0 0% 0 0% 1.1 TN 1% 1% 0 0% 0 0% 0 0% 0.5 VA 11% 12% 161 39% 36 9% 0 0% 10 WI 1% 2% 0 0% 0 0% 0 0% 1.4 WV 9% 10% 117 28% 38 9% 3 1% 11.3

36
Table IV.B-6. Contributions to 1-Hour Nonattainment in New York City: CAMx MetricsDownwind Nonattainment Area : New_York_City ; CAMX Source Apportionment Modeling Contributions to 1-Hr Designated + Modeled Receptors
Base Case: Total Number of Exceedences (grids-hours) = 1924Upwind State: Average
percentcontribution(4-episode)
Highest dailyaverage(ppb)
Highest dailyaverage (%)
Number ofexceedencesreduced >= 2ppb
Percentexceedencesreduced >= 2ppb
Number ofexceedencesreduced >= 5ppb
Percentexceedencesreduced >= 5ppb
Number ofexceedencesreduced >= 10ppb
Percentexceedencesreduced >= 10ppb
Max 1-hrcontribution (ppb)
AL 0% 1 1% 0 0% 0 0% 0 0% 1.6CT/RI 1% 2 2% 211 10% 117 6% 52 2% 30.2FL 0% 2 2% 95 4% 0 0% 0 0% 3.9GA 0% 1 1% 2 0% 0 0% 0 0% 2.8IA 0% 1 1% 0 0% 0 0% 0 0% 1.9IL 2% 6 5% 718 37% 392 20% 0 0% 8.8IN 1% 4 3% 667 34% 71 3% 0 0% 6.4KY 1% 7 5% 314 16% 227 11% 0 0% 9.7LA 0% 0 0% 0 0% 0 0% 0 0% 1.6MA 0% 0 0% 0 0% 0 0% 0 0% 0.1MD/DC/DE 5% 15 12% 1310 68% 734 38% 275 14% 50.5ME 0% 0 0% 0 0% 0 0% 0 0% 0MI 1% 5 4% 782 40% 26 1% 0 0% 7.6MO 1% 3 2% 164 8% 0 0% 0 0% 3.4MS 0% 0 0% 0 0% 0 0% 0 0% 0.7NC 1% 6 5% 469 24% 124 6% 3 0% 11.1NH/VT 0% 0 0% 0 0% 0 0% 0 0% 0NJ 38% 56 43% 1924 100% 1923 99% 1921 99% 82.0NY 16% 42 33% 1454 75% 1285 66% 1134 58% 67.7OH 4% 9 7% 1223 63% 938 48% 136 7% 14.9PA 18% 25 19% 1917 99% 1885 97% 1763 91% 53.0SC 0% 2 2% 96 4% 0 0% 0 0% 2.9TN 1% 2 2% 250 12% 0 0% 0 0% 4.6TX 0% 2 2% 1 0% 0 0% 0 0% 2.1VA 4% 11 9% 1059 55% 696 36% 214 11% 25.1WI 0% 2 2% 143 7% 0 0% 0 0% 3.2WV 3% 10 8% 971 50% 532 27% 133 6% 14.6West 0% 4 3% 18 0% 0 0% 0 0% 4.7Canada 1% 6 5% 434 22% 312 16% 0 0% 9.1

37
Group 1 Upwind States:
The CAMx and UAM-V metrics all clearly indicate that emissions fromMaryland/Washington, DC/Delaware, Ohio, Pennsylvania, Virginia, and West Virginiamake large and/or frequent contributions to 1-hour nonattainment in New York City. ForPennsylvania the magnitude of contribution, as indicated by the highest daily averagecontribution (CAMx Metric 3), is 25 ppb and the relative amount of contribution is 18percent (CAMx Metric 4). For the other upwind areas, the magnitude of the contributionsrange from 9 ppb to 15 ppb (CAMx Metric 3, highest daily average contributions) withcontributions in the range of 5 ppb to 10 ppb -- from Ohio, Virginia, and West Virginia(UAM-V Metric 2, maximum "ppb" contribution ). In terms of the frequency of thecontribution, 7% to 11% of the total number of grid-hours >=125 ppb in New York Cityreceive contributions of 10 ppb from each of these States (CAMx Metric 1 and 2). Also,the relative amounts of the contribution are in the range of 6% to 8% (CAMx Metric 4,highest single-episode average percent contribution) and the total contribution from eachof three States (i.e., Ohio, Virginia, and West Virginia) is large compared to the totalamount of nonattainment, ranging from 8% to 11% (UAM-V Metric 3).
Group 2 Upwind States:
The CAMx and UAM-V metrics are somewhat less consistent on the extent ofcontributions from each of 5 States: Kentucky, Illinois, Indiana, Michigan, and NorthCarolina. None of the metrics for either model indicate extremely low or extremely highcontributions. Rather, for these States most of the metrics indicate relatively highcontributions while a few metrics indicate relatively low contributions. The rationale usedby EPA for evaluating the contributions from these States involved comparing andcontrasting each piece of data for these States on an individual "upwind State-by-upwindState" basis and as a group (i.e., for all 5 States, together) in order to weigh the relativemagnitude and frequency of the contributions for making a determination of significance.
UAM-V Metrics -- For each of these 5 States the "weakest" factor is the magnitudecontribution (UAM-V Metric 2) in that the highest contributions are in the range of 2 to 5ppb. The other UAM-V Metrics, however, indicate that the contributions from each Stateare of a larger frequency and relative amount. Specifically, four of these States(Kentucky, Indiana, Illinois, and Michigan) each contribute 2 to 5 ppb to as many as 3% to4% of the exceedences in New York City (UAM-V Metrics 1 and 2). While North Carolina

38
contributes to somewhat fewer exceedences (2%), this slight weakness is out-weighed bythe relative amount of contribution (UAM-V Metrics 3 and 4) which indicate that the totalcontribution from North Carolina alone is equivalent to 3% of the total "ppb" >=125 ppband 4% of the population-weighted "ppb" >=125 ppb in New York City. For Indiana,Illinois, and Michigan the relative amount of contribution (UAM-V Metrics 3 and 4) are alsorelatively high and range from 3% to 5%. The relative amount of contribution fromKentucky is somewhat weaker at 2%.
CAMx Metrics -- For Illinois, all of the CAMx metrics indicate relatively large and/orfrequent contributions, as described below. For Kentucky, Indiana, Michigan, and NorthCarolina the magnitude of contribution is large, as indicated by the maximum contributionwhich ranges from 6 ppb (Indiana) to 11 ppb (North Carolina). Also, the highest dailyaverage contribution from Kentucky, Michigan, and North Carolina are all in range of 5ppb to 7 ppb. In terms of the frequency of contribution, Indiana and North Carolinacontribute in the range of 5 ppb to 10 ppb to 3% and 6% of the exceedences,respectively, in New York City. For Kentucky, Indiana, Michigan, and North Carolina therelative amounts of contribution is somewhat mixed in that 4-episode average contributionis only 1%, but the highest single-episode average percent contributions are higher at 2%from both Indiana and North Carolina, 3 percent from Kentucky, and 4% from Michigan(CAMx Metric 4).
Overall contributions considering UAM-V and CAMx Metrics -- Considering the CAMxand UAM-V metrics, as described below, the majority of the contribution factors indicatethat, overall, each of the Group 2 States contributes significantly to 1-hour nonattainmentin New York City.
Kentucky -- Metrics indicating relatively high and/or frequent contributions:
- Magnitude of Contribution: the maximum contribution from CAMx is 9 ppb(CAMx Metric 2) and highest daily average contribution is 7 ppb (CAMx Metric 3);- Frequency of Contribution: 4 percent of the exceedences receive contributionsof more than 2 ppb (UAM-V Metrics 1 and 2); and- Relative Amount of Contribution: the highest single-episode averagecontribution is 3% (CAMx Metric 4).

39
Metrics indicating relatively low and/or infrequent contributions:- Magnitude of Contribution: the maximum contribution from UAM-V is 2 ppb;and- Relative Amount of Contribution: the 4-episode average percent contribution is1% (CAMx Metric 4).
Indiana -- Metrics indicating relatively high and/or frequent contributions:
- Magnitude of Contribution: the maximum "ppb" contribution is 6 ppb (CAMxMetric 2);- Frequency of Contribution: 4 percent of the exceedences receive contributionsof more than 2 ppb (UAM-V Metrics 1 and 2) ; and- Relative Amount of Contribution: the total "ppb" contribution is equivalent to3% of total amount of nonattainment (UAM-V Metric 3).
Metrics indicating relatively low and/or infrequent contributions:- Magnitude of Contribution: the maximum contribution from is 2 ppb (UAM-VMetric 2); and- Relative Amount of Contribution: the 4-episode average percent contribution is1% (CAMx Metric 4).
Illinois --Metrics indicating relatively high and/or frequent contributions:
- Magnitude of Contribution: the maximum contribution is 8 ppb (CAMx Metric 2);the highest daily average contribution is 6 ppb;- Frequency of Contribution: 3 percent of the exceedences receive contributionsof more than 2 ppb; and- Relative Amount of Contribution: the highest single-episode averagecontribution is 3 percent (CAMx Metric 4); the total "ppb" contribution is equivalentto 3% of total amount of nonattainment.
Metrics indicating relatively low and/or infrequent contributions:- Magnitude of Contribution: the maximum contribution from UAM-V is 2 ppb.

40
Michigan --Metrics indicating relatively high and/or frequent contributions:
- Magnitude of Contribution: the maximum contribution is 7 ppb (CAMx Metric 2);the highest daily average contribution is 5 ppb (CAMx Metric 3); - Frequency of Contribution: 3 percent of the exceedences receive contributionsof more than 2 ppb (UAM-V Metrics 1 and 2); and- Relative Amount of Contribution: the highest single-episode averagecontribution is 4% (CAMx Metric 4); the total "ppb" contribution is equivalent to 3%of the total amount of nonattainment.
Metrics indicating relatively low and/or infrequent contributions:- Magnitude of Contribution: the maximum contribution from UAM-V is 2 ppb;- Frequency of Contribution: 1 percent of the exceedences receive contributionsof 5 ppb or more (CAMx Metrics 1 and 2); and- Relative Amount of Contribution: the 4-episode average percent contribution is1% (CAMx Metric 4)
North Carolina --Metrics indicating relatively high and/or frequent contributions:
- Magnitude of Contribution: the maximum contribution is 11 ppb (CAMx Metric2); the highest daily average contribution is 6 ppb (CAMx Metric 3);- Frequency of Contribution: 6 percent of exceedences receive contributions of 5ppb or more (CAMx Metrics 1 and 2); and- Relative Amount of Contribution: the total "ppb" contribution is equivalent to3% of total amount of nonattainment.
Metrics indicating relatively low and/or infrequent contributions:- Relative Amount of Contribution: the 4-episode average percent contribution is1% (CAMx Metric 4).
Group 3 Upwind States:
The CAMx and UAM-V metrics clearly indicate that the emissions from the followingStates do not make large and/or frequent contributions to 1-hour nonattainment in NewYork City: Alabama, Georgia, Massachusetts, Missouri, South Carolina, Tennessee, andWisconsin. The rationale for this conclusion is as follows:
- Magnitude of Contribution: all of these upwind States individually contribute

41
less than 2 ppb to 1-hour daily maximum exceedences in New York City (UAM-VMetric 2); the highest daily average contribution was 1 ppb or less from Alabama,Georgia, and Massachusetts, and 2 ppb from South Carolina, Tennessee, andWisconsin (CAMx Metric 3); and- Relative Amount of Contribution: the 4-episode average contributions fromAlabama, Georgia, Massachusetts, South Carolina, and Wisconsin are less than1% (CAMx Metric 4); the total contributions from Missouri and Tennessee are eachequivalent to 1 percent of the total amount of nonattainment in New York City(UAM-V Metric 3).
Based on the preceding evaluation, EPA believes that emissions in each of thefollowing twelve jurisdictions contribute significantly to 1-hour nonattainment in New YorkCity: the District of Columbia, Delaware, Illinois, Indiana, Kentucky, Maryland, Michigan,North Carolina, Ohio, Pennsylvania, Virginia, and West Virginia.
IV.C. Results of Evaluation of Contributions
The EPA applied the evaluation methodology described in Section IV.b.3 to eachupwind-downwind linkage to determine which States contribute significantly tononattainment in specific downwind areas. The linkages which EPA found to besignificant are listed in Tables IV.C-1 and IV.C-2 for the 1-hour NAAQS and Table IV.C-3and Table IV.C-4 for the 8-hour NAAQS. The information on the 1-hour contributionlinkages are presented by upwind State in Table IV.C-1 and by downwind State in TableIV.C-2. In Table IV.C-1 the upwind States are each listed in the first column and thedownwind States to which each upwind State contributes significantly are listed in thesecond column. In Table IV.C-2, the same information is presented by downwind State. In this table, each downwind State is listed in the first column and the upwind States thatcontribute to that downwind State, either as a result of the upwind-State-to-downwind-State linkages or the upwind-State-to-downwind-nonattainment-area linkages, are listed inthe second column. The 8-hour contribution linkages are presented by upwind State inTable IV.C-3 and by downwind State in Table IV.C-4.

42
Table IV.C-1. Downwind States for Which Upwind States Contain Sources thatContribute Significantly to 1-Hr Nonattainment.1
Upwind State Downwind States
Alabama GA, IL*, IN*, MI*, TN, WI*Connecticut ME, MA, NHDelaware CT, ME, MA, NH*, NJ, NY, PA, RI, VADistrict of Columbia CT, ME, MA, NH*, NJ, NY, PA, RI, VAGeorgia AL, TNIllinois CT*, IN, MD, NJ*, NY, MI, MO, WI*Indiana CT*, DE*, DC*, IL*, KY, MD, NJ*, NY, MI, OH, VA*, WI*Kentucky AL, CT*, DC*, GA, IL*, IN, MD, MI*,NJ, NY, MO, OH, VA, WI*Maryland CT, ME, MA, NH*, NJ, NY, PA, RI, VAMassachusetts ME, NHMichigan CT, DC*, MD, NJ, NY, VA*Missouri IL, IN, MI, WI*New Jersey CT, ME, MA, NH, NY, PA, RINew York CT, ME, MA, NH, NJ, RINorth Carolina CT*, DC*, GA, KY, MD*, NJ, NY, OH, PA, VA*Ohio CT, DE, DC*, KY, MD, MA, NH*, NJ, NY, PA, RI, VAPennsylvania CT, DE, DC, ME, MD, MA, NH, NJ, NY, RI, VARhode Island ME, MA, NHSouth Carolina AL, GA, TNTennessee AL, GA, IL*, IN, KY, MI*, OH, WI*Virginia CT, DE, DC, KY*, MD, MA, NH*, NJ, NY, PA, RIWest Virginia CT, DE, DC, MD, MA, NJ, NY, PA, RI, VAWisconsin IL*, IN*, MI*
1. Downwind States marked with an asterisk (*) are included because they are part of an interstatenonattainment area that receives a contribution from the upwind State. New Hampshire is included becauseit is part of the combined Boston/Portsmouth area; Connecticut and New Jersey are included because theyare part of the New York City area; Kentucky is included because it is part of the Cincinnati area; Delaware isincluded because it is part of the Philadelphia area; Illinois is included because it is part of the St. Louis area;Illinois, Indiana, Michigan, and Wisconsin are included because they are part of the Lake Michigan area; andMaryland, Virginia, and the District of Columbia are included because they are part of the Washington, DCarea.

43
Table IV.C-2. Upwind States that Contain Sources that Contribute Significantly to1-Hr Nonattainment in Downwind States.1
Downwind State Upwind States
Alabama GA, KY, SC, TNConnecticut DE, DC, IL*, IN*, KY*, MD, MI*, NJ, NY, NC*, OH, PA, VA, WV Delaware IN*, OH, PA, VA, WVDistrict of Columbia IN*, KY*, MI*, NC*, OH*, PA, VA, WVGeorgia AL, KY, NC, SC, TNIllinois AL*, IN*, KY*, MO, TN*, WI*Indiana AL*, IL, KY, MO, TN, WI*Kentucky IN, NC, OH, TN, VA*Maine CT, DE, DC, MD, MA, NJ, NY, PA, RIMaryland IL, IN, KY, MI, NC, OH, PA, VA, WVMassachusetts CT, DE, DC, MD, NJ, NY, OH, PA, RI, VA, WVMichigan AL*, IL, IN, KY*, MO, TN*, WI*Missouri IL, KYNew Hampshire CT, DC*, DE*, MD*, MA, NJ, NY, OH*, PA, RI, VA*New Jersey DE, DC, IL*, IN*, KY, MD, MI, NY, NC, OH, PA, VA, WVNew York DE, DC, IL, IN, KY, MD, MI, NJ, NC, OH, PA, VA, WVOhio IN, KY, TN, NCPennsylvania DE, DC, MD, NJ, NC, OH, VA, WVRhode Island DE, DC, MD, NJ, NY, OH, PA, VA, WVTennessee AL, GA, SCVirginia DE, DC, IN*, KY, MD, MI*, NC*, OH, PA, WVWisconsin AL*, IL*, IN*, KY*, MO*, TN*
1. Upwind States marked with an asterisk (*) are considered to significantly contribute to the downwind Statebecause they contribute to an interstate nonattainment area that includes part of the downwind State. NewHampshire is included in the Boston/Portsmouth area; Connecticut and New Jersey are included in the NewYork City area; Kentucky is included in the Cincinnati area; Delaware is included in the Philadelphia area;Illinois is included in the St. Louis area; Illinois, Indiana, Michigan, and Wisconsin are included in the LakeMichigan area; and Maryland, Virginia, and the District of Columbia are included in the Washington, DC area.

44
Table IV.C-3. Downwind States to Which Sources in Upwind States ContributeSignificantly for the 8-hour Standard.
Upwind State Downwind States
Alabama GA, IL, IN, KY, MI, MO, NC, OH, PA, SC, TN, VAConnecticut ME, MA, NH, RIDelaware CT, ME, MA, NH, NJ, NY, PA, RI, VADistrict of Columbia CT, ME, MD, MA, NH, NJ, NY, PA, RI, VAGeorgia AL, IL, IN, KY, MI, MO, NC, SC, TN, VAIllinois AL, CT, DC, DE, IN, KY, MD, MI, MO, NJ, NY, OH, PA, RI, TN, WV, WIIndiana DE, IL, KY, MD, MI, MO, NJ, NY, OH, PA, TN, VA, WV, WIKentucky AL, DC, DE, GA, IL, IN, MD, MI, MO, NJ, NY, NC, OH, PA, SC, TN,
VA, WV, WIMaryland CT, DE, DC, ME, MA, NH, NJ, NY, PA, RI, VAMassachusetts ME, NHMichigan CT, DC, DE, MD, MA, NJ, NY, OH, PA, WVMissouri IL, IN, KY, MI, OH, PA, TN, WINew Jersey CT, ME, MA, NH, NY, PA, RINew York CT, ME, MA, NH, NJ, PA, RINorth Carolina AL, CT, DE, GA, IN, KY, ME, MD, MA, NJ, NY, OH, PA, RI, SC, TN,
VA, WVOhio CT, DC, DE, IN, KY, MD, MA, MI, NJ, NY, NC, PA, RI, TN, VA, WVPennsylvania CT, DC, DE, ME, MD, MA, NH, NJ, NY, OH, RI, VARhode Island ME, MA, NHSouth Carolina AL, GA, IN, KY, NC, TN, VATennessee AL, DC, DE, GA, IL, IN, KY, MD, MI, MO, NC, OH, PA, SC, VA, WV,
WIVirginia CT, DE, DC, ME, MD, MA, NJ, NY, NC, OH, PA, RI, SC, WVWest Virginia CT, DC, DE, IN, KY, MD, MA, NJ, NY, NC, OH, PA, RI, SC, TN, VAWisconsin MI

45
Table IV.C-4. Upwind States that Contain Sources that Contribute Significantly to8-hour Nonattainment in Downwind States.
Downwind State Upwind States
Alabama GA, IL, KY, NC, SC, TN
Connecticut DE, DC, IL, MD, MI, NJ, NY, NC, OH, PA, VA, WV
District of Columbia IL, KY, MD, MI, OH, PA, TN, VA, WV
Delaware IL, IN, KY, MI, NC, OH, PA, TN, VA, WV
Georgia AL, KY, NC, SC, TN
Illinois AL, GA, IN, KY, MO, TN
Indiana AL, GA, IL, KY, MO, NC, OH, SC, TN, WV
Kentucky AL, GA, IL, IN, MO, NC, OH, SC, TN, WV
Maine CT, DE, DC, MD, MA, NJ, NY, NC, PA, RI, VA
Maryland DC, IL, IN, KY, MI, NC, OH, PA, TN, VA, WV
Massachusetts CT, DE, DC, MD, MI, NJ, NY, NC, OH, PA, RI, VA, WV
Michigan AL, GA, IL, IN, KY, MO, OH, TN, WI
Missouri AL, GA, IL, IN, KY, TN
New Hampshire CT, DE, DC, MD, MA, NJ, NY, PA, RI
New Jersey DE, DC, IL, IN, KY, MD, MI, NC, NY, OH, PA, VA, WV
New York DE, DC, IL, IN, KY, MD, MI, NC, NJ, OH, PA, VA, WV
North Carolina AL, GA, KY, OH, SC, TN, VA, WV
Ohio AL, IL, IN, KY, MI, MO, NC, PA, TN, VA, WV
Pennsylvania AL, DE, DC, IL, IN, KY, MD, MI, MO, NJ, NY, NC, OH, TN, VA, WV
Rhode Island CT, DE, DC, IL, MD, NJ, NY, NC, OH, PA, VA, WV
South Carolina AL, GA, KY, NC, TN, VA, WV
Tennessee AL, GA, IL, IN, KY, MO, NC, OH, SC, WV
Virginia AL, DE, DC, GA, IN, KY, MD, NC, OH, PA, SC, TN, WV
West Virginia IL, IN, KY, MI, NC, OH, TN, VA
Wisconsin IL, IN, KY, MO, TN

46
IV.C.4. Examples of Contributions From Upwind States to 1-Hour DownwindNonattainment
Examples of the types of contributions which link individual upwind States todownwind areas are provided below for the 1-hour NAAQS for the 23 upwind jurisdictions. The detailed upwind-to-downwind linkages for the 1-hour NAAQS are provided inAppendix C.
-- Alabama’s Contribution to 1-Hour Nonattainment in AtlantaC Magnitude of Contribution: The maximum contribution is 39 ppb (CAMx Metric
2); the highest daily average contribution is 31 ppb (CAMx Metric 3).C Frequency of Contribution: Alabama contributes at least 10 ppb to 12% of the 1-
hr exceedences (UAM-V Metrics 1 and 2).C Relative Amount: The total contribution from Alabama is equivalent to 14% of the
total amount >=125 ppb in Atlanta (UAM-V Metric 3); Alabama contributes 8% ofthe total manmade ppb >= 125 ppb in Atlanta (CAMx Metric 4; 4-episode averagepercent contribution).
-- Connecticut/Rhode Island’s Contribution to 1-Hour Nonattainment in WesternMassachusettsC Magnitude of Contribution: The maximum contribution is 61 ppb (CAMx Metric
2); the highest daily average contribution is 50 ppb (CAMx Metric 3).C Frequency of Contribution: Connecticut/Rhode Island contribute at least 10 ppb
to 100% of the 1-hr exceedences (CAMx Metrics 1 and 2).C Relative Amount: Connecticut/Rhode Island contribute 35% of the total manmade
ppb >= 125 ppb in Western Massachusetts (CAMx Metric 4; 4-episode averagepercent contribution).
-- Georgia’s Contribution to 1-Hour Nonattainment in BirminghamC Magnitude of Contribution: The maximum contribution is 51 ppb (CAMx Metric
2); the highest daily average contribution is 24 ppb (CAMx Metric 3).C Frequency of Contribution: Georgia contributes at least 10 ppb to 11% of the 1-
hr exceedences (UAM-V Metrics 1 and 2).C Relative Amount: The total contribution from Georgia is equivalent to 12% of the
total amount >=125 ppb in Birmingham (UAM-V Metric 3); Georgia contributes 3%

47
of the total manmade ppb >= 125 ppb in Birmingham (CAMx Metric 4; 4-episodeaverage percent contribution).
-- Illinois’s Contribution to 1-Hour Nonattainment in New York CityC Magnitude of Contribution: The maximum contribution is 8 ppb (CAMx Metric 2);
the highest daily average contribution is 6 ppb (CAMx Metric 3).C Frequency of Contribution: Illinois contributes at least 5 ppb to 20% of the 1-hr
exceedences (CAMx Metrics 1 and 2).C Relative Amount: The total contribution from Illinois is equivalent to 3% of the total
amount >=125 ppb in New York City (UAM-V Metric 3); Illinois contributes 3% ofthe total manmade ppb >= 125 ppb in New York City (CAMx Metric 4; singlehighest episode percent contribution).
-- Indiana’s Contribution to 1-Hour Nonattainment in BaltimoreC Magnitude of Contribution: The maximum contribution is 8 ppb (CAMx Metric 2);
the highest daily average contribution is 6 ppb (CAMx Metric 3).C Frequency of Contribution: Indiana contributes at least 5 ppb to 26% of the 1-hr
exceedences (CAMx Metrics 1 and 2).C Relative Amount: The total contribution from Indiana is equivalent to 4% of the
total amount >=125 ppb in Baltimore (UAM-V Metric 3); Indiana contributes 3% ofthe total manmade ppb >= 125 ppb in New York City (CAMx Metric 4; singlehighest episode percent contribution).
-- Kentucky’s Contribution to 1-Hour Nonattainment in BaltimoreC Magnitude of Contribution: The maximum contribution is 9 ppb (CAMx Metric 2);
the highest daily average contribution is 8 ppb (CAMx Metric 3).C Frequency of Contribution: Kentucky contributes at least 5 ppb to 24% of the 1-
hr exceedences (CAMx Metrics 1 and 2).C Relative Amount: The total contribution from Kentucky is equivalent to 3% of the
total amount >=125 ppb in Baltimore (UAM-V Metric 3); Kentucky contributes 5%of the total manmade ppb >= 125 ppb in Baltimore (CAMx Metric 4; single highestepisode percent contribution).

48
-- Maryland/District of Columbia/Delaware’s Contribution to 1-Hour Nonattainmentin New York CityC Magnitude of Contribution: The maximum contribution is 50 ppb (CAMx Metric
2); the highest daily average contribution is 15 ppb (CAMx Metric 3).C Frequency of Contribution: Maryland/District of Columbia/Delaware contribute at
least 10 ppb to 14% of the 1-hr exceedences and at least 5 ppb to 38% of the 1-hrexceedences (CAMx Metrics 1 and 2).
C Relative Amount: Maryland/District of Columbia/Delaware contribute 5% of thetotal manmade ppb >= 125 ppb in New York City (CAMx Metric 4; 4-episodeaverage percent contribution).
-- Massachusetts’ Contribution to 1-Hour Nonattainment in Portland, MEC Magnitude of Contribution: The maximum contribution is 79 ppb (CAMx Metric
2); the highest daily average contribution is 67 ppb (CAMx Metric 3).C Frequency of Contribution: Massachusetts contributes at least 10 ppb to 100%
of the 1-hr exceedences (UAM-V Metrics 1 and 2).C Relative Amount: The total contribution from Massachusetts is equivalent to
100% of the total amount >=125 ppb in Portland, ME (UAM-V Metric 3);Massachusetts contributes 56% of the total manmade ppb >= 125 ppb in Portland,ME (CAMx Metric 4; 4-episode average percent contribution).
-- Michigan’s Contribution to 1-Hour Nonattainment in BaltimoreC Magnitude of Contribution: The maximum contribution is 9 ppb (CAMx Metric 2);
the highest daily average contribution is 8 ppb (CAMx Metric 3).C Frequency of Contribution: Michigan contributes at least 5 ppb to 7% of the 1-hr
exceedences (CAMx Metrics 1 and 2).C Relative Amount: The total contribution from Michigan is equivalent to 5% of the
total amount >=125 ppb in Baltimore (UAM-V Metric 3); Michigan contributes 5% ofthe total manmade ppb >= 125 ppb in Baltimore (CAMx Metric 4; single highestepisode percent contribution).
-- Missouri’s Contribution to 1-Hour Nonattainment over Lake MichiganC Magnitude of Contribution: The maximum contribution is 19 ppb (CAMx Metric
2); the highest daily average contribution is 12 ppb (CAMx Metric 3).C Frequency of Contribution: Missouri contributes at least 10 ppb to 66% of the 1-

49
hr exceedences (CAMx Metrics 1 and 2).C Relative Amount: The total contribution from Missouri is equivalent to 22% of the
total amount >=125 ppb over Lake Michigan (UAM-V Metric 3); Missouricontributes 9% of the total manmade ppb >= 125 ppb over Lake Michigan (CAMxMetric 4; 4-episode average percent contribution).
-- New Jersey’s Contribution to 1-Hour Nonattainment in Western MassachusettsC Magnitude of Contribution: The maximum contribution is 30 ppb (CAMx Metric
2); the highest daily average contribution is 23 ppb (CAMx Metric 3).C Frequency of Contribution: New Jersey contributes at least 10 ppb to 100% of
the 1-hr exceedences (CAMx Metrics 1 and 2).C Relative Amount: New Jersey contributes 16% of the total manmade ppb >= 125
ppb in Western Massachusetts (CAMx Metric 4; 4-episode average percentcontribution).
-- New York’s Contribution to 1-Hour Nonattainment in Western MassachusettsC Magnitude of Contribution: The maximum contribution is 25 ppb (CAMx Metric
2); the highest daily average contribution is 23 ppb (CAMx Metric 3).C Frequency of Contribution: New York contributes at least 10 ppb to 100% of the
1-hr exceedences (CAMx Metrics 1 and 2).C Relative Amount: New York contributes 18% of the total manmade ppb >= 125
ppb in Western Massachusetts (CAMx Metric 4; 4-episode average percentcontribution).
-- North Carolina’s Contribution to 1-Hour Nonattainment in PhiladelphiaC Magnitude of Contribution: The maximum contribution is 10 ppb (CAMx Metric
2); the highest daily average contribution is 9 ppb (CAMx Metric 3).C Frequency of Contribution: North Carolina contributes at least 2 ppb to 4% of the
1-hr exceedences (UAM-V Metrics 1 and 2).C Relative Amount: The total contribution from North Carolina is equivalent to 4% of
the total amount >=125 ppb in Philadelphia (UAM-V Metric 3); North Carolinacontributes 2% of the total manmade ppb >= 125 ppb in Philadelphia (CAMx Metric4; single highest episode percent contribution).

50
-- Ohio’s Contribution to 1-Hour Nonattainment in BaltimoreC Magnitude of Contribution: The maximum contribution is 13 ppb (CAMx Metric
2); the highest daily average contribution is 12 ppb (CAMx Metric 3).C Frequency of Contribution: Ohio contributes at least 5 ppb to 51% of the 1-hr
exceedences (CAMx Metrics 1 and 2).C Relative Amount: The total contribution from Ohio is equivalent to 11% of the total
amount >=125 ppb in Baltimore (UAM-V Metric 3); Ohio contributes 4% of the totalmanmade ppb >= 125 ppb in Baltimore (CAMx Metric 4; 4-episode averagepercent contribution).
-- Pennsylvania’s Contribution to 1-Hour Nonattainment in Greater ConnecticutC Magnitude of Contribution: The maximum contribution is 28 ppb (CAMx Metric
2); the highest daily average contribution is 23 ppb (CAMx Metric 3).C Frequency of Contribution: Pennsylvania contributes at least 10 ppb to 60% of
the 1-hr exceedences and at least 5 ppb to 98% of the 1-hr exceedences (CAMxMetrics 1 and 2).
C Relative Amount: Pennsylvania contributes 10% of the total manmade ppb >=125 ppb in Greater Connecticut (CAMx Metric 4; 4-episode average percentcontribution).
-- South Carolina’s Contribution to 1-Hour Nonattainment in AtlantaC Magnitude of Contribution: The maximum contribution is 24 ppb (CAMx Metric
2); the highest daily average contribution is 23 ppb (CAMx Metric 3).C Frequency of Contribution: South Carolina contributes at least 5 ppb to 6% of
the 1-hr exceedences (UAM-V Metrics 1 and 2).C Relative Amount: The total contribution from South Carolina is equivalent to 4% of
the total amount >=125 ppb in Atlanta (UAM-V Metric 3); South Carolinacontributes 2% of the total manmade ppb >= 125 ppb in Atlanta (CAMx Metric 4;single highest episode percent contribution).
-- Tennessee’s Contribution to 1-Hour Nonattainment over Lake MichiganC Magnitude of Contribution: The maximum contribution is 12 ppb (CAMx Metric
2); the highest daily average contribution is 11 ppb (CAMx Metric 3).C Frequency of Contribution: Tennessee contributes at least 5 ppb to 14% of the
1-hr exceedences (UAM-V Metrics 1 and 2).

51
C Relative Amount: The total contribution from Tennessee is equivalent to 6% ofthe total amount >=125 ppb over Lake Michigan (UAM-V Metric 3); Tennesseecontributes 10% of the total manmade ppb >= 125 ppb over Lake Michigan (CAMxMetric 4; single highest episode percent contribution).
-- Virginia’s Contribution to 1-Hour Nonattainment in New York CityC Magnitude of Contribution: The maximum contribution is 25 ppb (CAMx Metric
2); the highest daily average contribution is 11 ppb (CAMx Metric 3).C Frequency of Contribution: Virginia contributes at least 10 ppb to 11% of the 1-hr
exceedences and at least 5 ppb to 36% of the 1-hr exceedences (CAMx Metrics 1and 2).
C Relative Amount: The total contribution from Virginia is equivalent to 11% of thetotal amount >=125 ppb in New York City (UAM-V Metric 3); Virginia contributes4% of the total manmade ppb >= 125 ppb in New York City (CAMx Metric 4; 4-episode average percent contribution).
-- West Virginia’s Contribution to 1-Hour Nonattainment in New York CityC Magnitude of Contribution: The maximum contribution is 14 ppb (CAMx Metric
2); the highest daily average contribution is 10 ppb (CAMx Metric 3).C Frequency of Contribution: West Virginia contributes at least 5 ppb to 9% of the
1-hr exceedences and at least 2 ppb to 28% of the 1-hr exceedences (UAM-VMetrics 1 and 2).
C Relative Amount: The total contribution from West Virginia is equivalent to 9% ofthe total amount >=125 ppb in New York City (UAM-V Metric 3); West Virginiacontributes 7% of the total manmade ppb >= 125 ppb in New York City (CAMxMetric 4; single highest episode percent contribution).
-- Wisconsin’s Contribution to 1-Hour Nonattainment over Lake MichiganC Magnitude of Contribution: The maximum contribution is 43 ppb (CAMx Metric
2); the highest daily average contribution is 8 ppb (CAMx Metric 3).C Frequency of Contribution: Wisconsin contributes at least 10 ppb to 11% of the
1-hr exceedences (CAMx Metrics 1 and 2).C Relative Amount: Wisconsin contributes 4% of the total manmade ppb >= 125
ppb over Lake Michigan (CAMx Metric 4; 4-episode average percent contribution).

52
IV.C.5. Examples of Contributions From Upwind States to 8-Hour DownwindNonattainment
Examples of the types of contributions which link individual upwind States todownwind areas are provided below for the 8-hour NAAQS for the 23 upwind jurisdictions. The detailed upwind-to-downwind linkages for the 8-hour NAAQS are provided inAppendix D.
-- Alabama’s Contribution to 8-Hour Nonattainment in KentuckyC Magnitude of Contribution: The maximum contribution is 25 ppb (CAMx Metric
2); the highest daily average contribution is 16 ppb (CAMx Metric 3).C Frequency of Contribution: Alabama contributes at least 10 ppb to 10% of the 8-
hr exceedences and at least 5 ppb to 25% of the 8-hr exceedences (CAMx Metrics1 and 2).
C Relative Amount: The total contribution from Alabama is equivalent to 7% of thetotal amount >=85 ppb in Kentucky (UAM-V Metric 3); Alabama contributes 5% ofthe total manmade ppb >= 85 ppb in Kentucky (CAMx Metric 4; 4-episode averagepercent contribution).
-- Connecticut/Rhode Island’s Contribution to 8-Hour Nonattainment in NewHampshireC Magnitude of Contribution: The maximum contribution is 25 ppb (CAMx Metric
2); the highest daily average contribution is 13 ppb (CAMx Metric 3).C Frequency of Contribution: Connecticut/Rhode Island contribute at least 10 ppb
to 27% of the 8-hr exceedences (CAMx Metrics 1 and 2).C Relative Amount: Connecticut/Rhode Island contribute 9% of the total manmade
ppb >= 85 ppb in New Hampshire (CAMx Metric 4; 4-episode average percentcontribution).
-- Georgia’s Contribution to 8-Hour Nonattainment in IndianaC Magnitude of Contribution: The maximum contribution is 16 ppb (CAMx Metric
2); the highest daily average contribution is 9 ppb (CAMx Metric 3).C Frequency of Contribution: Georgia contributes at least 5 ppb to 12% of the 8-hr
exceedences (CAMx Metrics 1 and 2).C Relative Amount: The total contribution from Georgia is equivalent to 8% of the

53
total amount >=85 ppb in Indiana (UAM-V Metric 3); Georgia contributes 4% of thetotal manmade ppb >= 85 ppb in Indiana (CAMx Metric 4; 4-episode averagepercent contribution).
-- Illinois’s Contribution to 8-Hour Nonattainment in PennsylvaniaC Magnitude of Contribution: The maximum contribution is 16 ppb (CAMx Metric
2); the highest daily average contribution is 7 ppb (CAMx Metric 3).C Frequency of Contribution: Illinois contributes at least 5 ppb to 18% of the 8-hr
exceedences (CAMx Metrics 1 and 2).C Relative Amount: The total contribution from Illinois is equivalent to 7% of the total
amount >=85 ppb in Pennsylvania (UAM-V Metric 3); Illinois contributes 3% of thetotal manmade ppb >= 85 ppb in Pennsylvania (CAMx Metric 4; 4-episode averagepercent contribution).
-- Indiana’s Contribution to 8-Hour Nonattainment in West VirginiaC Magnitude of Contribution: The maximum contribution is 17 ppb (CAMx Metric
2); the highest daily average contribution is 13 ppb (CAMx Metric 3).C Frequency of Contribution: Indiana contributes at least 5 ppb to 8% of the 8-hr
exceedences and at least 2 ppb to 46% of the 8-hr exceedences (UAM-V Metrics 1and 2).
C Relative Amount: The total contribution from Indiana is equivalent to 16% of thetotal amount >=85 ppb in West Virginia (UAM-V Metric 3); Indiana contributes 5%of the total manmade ppb >= 85 ppb in New York City (CAMx Metric 4; 4-episodeaverage percent contribution).
-- Kentucky’s Contribution to 8-Hour Nonattainment in PennsylvaniaC Magnitude of Contribution: The maximum contribution is 20 ppb (CAMx Metric
2); the highest daily average contribution is 10 ppb (CAMx Metric 3).C Frequency of Contribution: Kentucky contributes at least 10 ppb to 11% of the 8-
hr exceedences and at least 5 ppb to 32% of the 8-hr exceedences (CAMx Metrics1 and 2).
C Relative Amount: The total contribution from Kentucky is equivalent to 13% of thetotal amount >=85 ppb in Pennsylvania (UAM-V Metric 3); Kentucky contributes5% of the total manmade ppb >= 85 ppb in Pennsylvania (CAMx Metric 4; 4-episode average percent contribution).

54
-- Maryland/District of Columbia/Delaware’s Contribution to 8-Hour Nonattainmentin MassachusettsC Magnitude of Contribution: The maximum contribution is 17 ppb (CAMx Metric
2); the highest daily average contribution is 10 ppb (CAMx Metric 3).C Frequency of Contribution: Maryland/District of Columbia/Delaware contribute at
least 10 ppb to 5% of the 8-hr exceedences and at least 5 ppb to 34% of the 8-hrexceedences (CAMx Metrics 1 and 2).
C Relative Amount: Maryland/District of Columbia/Delaware contribute 5% of thetotal manmade ppb >= 85 ppb in Massachusetts (CAMx Metric 4; 4-episodeaverage percent contribution).
-- Massachusetts’ Contribution to 8-Hour Nonattainment in MaineC Magnitude of Contribution: The maximum contribution is 66 ppb (CAMx Metric
2); the highest daily average contribution is 47 ppb (CAMx Metric 3).C Frequency of Contribution: Massachusetts contributes at least 10 ppb to 82% of
the 8-hr exceedences (UAM-V Metrics 1 and 2).C Relative Amount: The total contribution from Massachusetts is equivalent to 95%
of the total amount >=85 ppb in Maine (UAM-V Metric 3); Massachusettscontributes 33% of the total manmade ppb >= 85 ppb in Maine (CAMx Metric 4; 4-episode average percent contribution).
-- Michigan’s Contribution to 8-Hour Nonattainment in PennsylvaniaC Magnitude of Contribution: The maximum contribution is 30 ppb (CAMx Metric
2); the highest daily average contribution is 8 ppb (CAMx Metric 3).C Frequency of Contribution: Michigan contributes at least 5 ppb to 10% of the 8-
hr exceedences (CAMx Metrics 1 and 2).C Relative Amount: The total contribution from Michigan is equivalent to 7% of the
total amount >=85 ppb in Pennsylvania (UAM-V Metric 3); Michigan contributes 3%of the total manmade ppb >= 85 ppb in Pennsylvania (CAMx Metric 4; singlehighest episode percent contribution).
-- Missouri’s Contribution to 8-Hour Nonattainment in MichiganC Magnitude of Contribution: The maximum contribution is 18 ppb (CAMx Metric
2); the highest daily average contribution is 11 ppb (CAMx Metric 3).

55
C Frequency of Contribution: Missouri contributes at least 5 ppb to 21% of the 8-hrexceedences and at least 2 ppb to 57% of the 8-hr exceedences (UAM-V Metrics 1and 2).
C Relative Amount: The total contribution from Missouri is equivalent to 22% of thetotal amount >=85 ppb in Michigan (UAM-V Metric 3); Missouri contributes 7% ofthe total manmade ppb >= 85 ppb in Michigan (CAMx Metric 4; 4-episode averagepercent contribution).
-- New Jersey’s Contribution to 8-Hour Nonattainment in MassachusettsC Magnitude of Contribution: The maximum contribution is 38 ppb (CAMx Metric
2); the highest daily average contribution is 20 ppb (CAMx Metric 3).C Frequency of Contribution: New Jersey contributes at least 10 ppb to 59% of the
8-hr exceedences (CAMx Metrics 1 and 2).C Relative Amount: New Jersey contributes 16% of the total manmade ppb >= 85
ppb in Massachusetts (CAMx Metric 4; 4-episode average percent contribution).
-- New York’s Contribution to 8-Hour Nonattainment in MassachusettsC Magnitude of Contribution: The maximum contribution is 33 ppb (CAMx Metric
2); the highest daily average contribution is 26 ppb (CAMx Metric 3).C Frequency of Contribution: New York contributes at least 10 ppb to 84% of the
8-hr exceedences (CAMx Metrics 1 and 2).C Relative Amount: New York contributes 20% of the total manmade ppb >= 85 ppb
in Massachusetts (CAMx Metric 4; 4-episode average percent contribution).
-- North Carolina’s Contribution to 8-Hour Nonattainment in MarylandC Magnitude of Contribution: The maximum contribution is 31 ppb (CAMx Metric
2); the highest daily average contribution is 15 ppb (CAMx Metric 3).C Frequency of Contribution: North Carolina contributes at least 10 ppb to 4% of
the 8-hr exceedences (UAM-V Metrics 1 and 2).C Relative Amount: The total contribution from North Carolina is equivalent to 5% of
the total amount >=85 ppb in Maryland (UAM-V Metric 3); North Carolinacontributes 3% of the total manmade ppb >= 85 ppb in Maryland (CAMx Metric 4;4-episode average percent contribution).

56
-- Ohio’s Contribution to 8-Hour Nonattainment in New JerseyC Magnitude of Contribution: The maximum contribution is 16 ppb (CAMx Metric
2); the highest daily average contribution is 11 ppb (CAMx Metric 3).C Frequency of Contribution: Ohio contributes at least 10 ppb to 11% of the 8-hr
exceedences and at least 5 ppb to 39% of the 8-hr exceedences (CAMx Metrics 1and 2).
C Relative Amount: The total contribution from Ohio is equivalent to 10% of the totalamount >=85 ppb in New Jersey (UAM-V Metric 3); Ohio contributes 6% of thetotal manmade ppb >= 85 ppb in New Jersey (CAMx Metric 4; 4-episode averagepercent contribution).
-- Pennsylvania’s Contribution to 8-Hour Nonattainment in MassachusettsC Magnitude of Contribution: The maximum contribution is 28 ppb (CAMx Metric
2); the highest daily average contribution is 17 ppb (CAMx Metric 3).C Frequency of Contribution: Pennsylvania contributes at least 10 ppb to 39% of
the 8-hr exceedences and at least 5 ppb to 73% of the 8-hr exceedences (CAMxMetrics 1 and 2).
C Relative Amount: Pennsylvania contributes 11% of the total manmade ppb >= 85ppb in Massachusetts (CAMx Metric 4; 4-episode average percent contribution).
-- South Carolina’s Contribution to 8-Hour Nonattainment in TennesseeC Magnitude of Contribution: The maximum contribution is 21 ppb (CAMx Metric
2); the highest daily average contribution is 12 ppb (CAMx Metric 3).C Frequency of Contribution: South Carolina contributes at least 10 ppb to 7% of
the 8-hr exceedences (CAMx Metrics 1 and 2).C Relative Amount: The total contribution from South Carolina is equivalent to 4% of
the total amount >=85 ppb in Tennessee (UAM-V Metric 3); South Carolinacontributes 3% of the total manmade ppb >= 85 ppb in Tennessee (CAMx Metric 4;4-episode average percent contribution).
-- Tennessee’s Contribution to 8-Hour Nonattainment in OhioC Magnitude of Contribution: The maximum contribution is 27 ppb (CAMx Metric
2); the highest daily average contribution is 13 ppb (CAMx Metric 3).C Frequency of Contribution: Tennessee contributes at least 5 ppb to 14% of the
8-hr exceedences (UAM-V Metrics 1 and 2).

57
C Relative Amount: The total contribution from Tennessee is equivalent to 18% ofthe total amount >=85 ppb in Ohio (UAM-V Metric 3); Tennessee contributes 7% ofthe total manmade ppb >= 85 ppb in Ohio (CAMx Metric 4; 4-episode averagepercent contribution).
-- Virginia’s Contribution to 8-Hour Nonattainment in New JerseyC Magnitude of Contribution: The maximum contribution is 37 ppb (CAMx Metric
2); the highest daily average contribution is 20 ppb (CAMx Metric 3).C Frequency of Contribution: Virginia contributes at least 10 ppb to 9% of the 8-hr
exceedences and at least 5 ppb to 22% of the 8-hr exceedences (UAM-V Metrics 1and 2).
C Relative Amount: The total contribution from Virginia is equivalent to 19% of thetotal amount >=85 ppb in New Jersey (UAM-V Metric 3); Virginia contributes 9% ofthe total manmade ppb >= 85 ppb in New Jersey (CAMx Metric 4; 4-episodeaverage percent contribution).
-- West Virginia’s Contribution to 8-Hour Nonattainment in New JerseyC Magnitude of Contribution: The maximum contribution is 16 ppb (CAMx Metric
2); the highest daily average contribution is 9 ppb (CAMx Metric 3).C Frequency of Contribution: West Virginia contributes at least 10 ppb to 5% of the
8-hr exceedences and at least 5 ppb to 23% of the 8-hr exceedences (UAM-VMetrics 1 and 2).
C Relative Amount: The total contribution from West Virginia is equivalent to 18% ofthe total amount >=85 ppb in New Jersey (UAM-V Metric 3); West Virginiacontributes 5% of the total manmade ppb >= 85 ppb in New Jersey (CAMx Metric4; 4-episode average percent contribution).
-- Wisconsin’s Contribution to 8-Hour Nonattainment in MichiganC Magnitude of Contribution: The maximum contribution is 33 ppb (CAMx Metric
2); the highest daily average contribution is 12 ppb (CAMx Metric 3).C Frequency of Contribution: Wisconsin contributes at least 10 ppb to 11% of the
8-hr exceedences (CAMx Metrics 1 and 2).C Relative Amount: The total contribution from Wisconsin is equivalent to 5% of the
total amount >=85 ppb in Michigan (UAM-V Metric 3); Wisconsin contributes 5% ofthe total manmade ppb >= 85 ppb in Michigan (CAMx Metric 4; 4-episode averagepercent contribution).

58
V. Impacts of Alternative Strategies
V.A. Alternative Scenarios
EPA has performed modeling of various alternative utility and non-utility controloptions. Further, EPA has modeled the benefits in selected "downwind" areas of thebudgets applied in "upwind" States. The results of EPA’s modeling analysis aresummarized below.
As part of EPA's assessment, ten emissions scenarios were modeled, as listed inTable V.A-1. The first four scenarios (i.e. "0.25", "0.20", "0.15t", and "0.12") weredesigned to evaluate alternative utility and non-utility controls applied uniformly in all 23jurisdictions. For each of these four scenarios, utility emissions were determinedassuming a "traditional trading" program across all 23 jurisdictions. The 0.15t scenarioreflects the SIP Call proposal for both non-utility and utility sources. Note that non-utilitycontrols were modeled at the level of the proposal for all scenarios except for the 0.25scenario for which less stringent controls were assumed.
The EPA modeled two “regionality” runs: "Reg-1" and "Reg-2", which weredesigned to examine whether ozone benefits equivalent to the 0.15t scenario could beachieved with geographic variations in control levels within a range of 0.20 to 0.12lb/MMBtu. In both of these scenarios, trading was restricted to occur among those Stateswith the same assumed emissions limit.
The EPA also modeled a 0.15 non-trading scenario, "0.15nt" which wasconstructed with utility emissions that meet each State's budget without interstate trading. In developing the utility emissions for this scenario, intrastate trading among sources in aState was allowed to occur. The benefits of the 0.15nt scenario compared to those fromthe 0.15t scenario were examined to determine whether a trading program would affectthe overall benefits of the proposal.

59
Table V.A-1. Emissions Scenarios Modeled.
Base Case 2007 SIP Call Base Case1
Point Sources: Clean Air Act ControlsArea Sources: OTAG “Level 1" ControlsHighway Vehicles: OTAG “Level 0" Controls
ControlScenarios
Utilities(Electric Generation Units – EGUs)
Non-Utility Point Sources
0.25 0.25 lb/mmBTU, interstate trading 60% reduction for large sources2
0.20 0.20 lb/mmBTU, interstate trading 70% reduction for large sources,RACT for medium sources2
0.15t 0.15 lb/mmBTU, interstate trading 70% reduction for large sources,RACT for medium sources
0.12 0.12 lb/mmBTU, interstate trading. 70% reduction for large sources,RACT for medium sources
Reg-13 0.20 lb/mmBTU in the SE and MW, 0.15lb/mmBTU in the NE and "adjacent" States;interstate trading within zones having the sameemissions limit
70% reduction for large sources,RACT for medium sources
Reg-23 0.20 lb/mmBTU in the SE, 0.15 lb/mmBTU in theMW and "adjacent" States and 0.12 lb/mmBTU inthe NE; interstate trading within zones having thesame emissions limit
70% reduction for large sources,RACT for medium sources
0.15nt 0.15 lb/mmBTU, non-trading 70% reduction for large sources,RACT for medium sources
DownwindScenarios forAnalysis of"Transport"
(1) 0.15nt utility and non-utility controls in the Northeast4; 2007 Base Case emissionselsewhere.(2) 0.15nt utility and non-utility controls in Georgia; 2007 Base Case emissionselsewhere.(3) 0.15nt utility and non-utility controls in Illinois, Indiana, and Wisconsin; 2007 BaseCase emissions elsewhere.
1. See Table III.A-1 for a listing of Base Case control measures.2. Reductions are from 2007 “uncontrolled” emissions. Non-utility sources >250MMBtu/hr are considered as"large"; sources <250MMBtu/hr, but >1tpd are considered as "medium".3. For the regionality scenarios, the Southeast (SE) includes Alabama, Georgia, North Carolina SouthCarolina, and Tennessee; the Midwest(MW) includes Illinois, Indiana, Kentucky, Michigan, Missouri andWisconsin; the Northeast(NE) includes Connecticut, Delaware, District of Columbia, Maryland,Massachusetts, New Jersey, New York, Pennsylvania, and Rhode Island; the "adjacent" States include Ohio,Virginia and West Virginia.4. The definition of “Northeast” for the Transport Scenario is the same as in footnote 3.
The last three "downwind" scenarios in Table V.A-1 were designed to evaluate thedownwind benefits resulting from reductions in transport due to the budgets in upwindStates. Each of these scenarios constitutes a separate modeling run that applies the0.15nt emissions in a different downwind area. For example, in the "nt15NE" scenario,

60
the 0.15nt emissions were applied in those Northeast States subject to the SIP Call. BaseCase emissions were applied in the remainder of the OTAG region. The predictions foreach of these three modeling runs were compared to the Base Case to estimate theimpacts of the budgets applied within the downwind area. The predictions from thesethree runs were then compared to the 0.15nt scenario to estimate the additional benefitsin each downwind area due to reductions in transport resulting from the budgets applied inupwind States.
Base Case emissions were derived as described in Section II.A of this document. Stationary area, highway, and mobile emissions were held constant at the Base Caselevels for all modeling runs. The non-EGU sector emissions were derived by applying thespecified levels of controls to large and medium sources in the Base Year inventory. Theutility emissions estimates for each of the control scenarios in Table V.A-1 were derivedusing the IPM. A description of the IPM simulations for the control scenarios is containedin the RIA for the NOx SIP Call (EPA, 1998b). Table V.A-2 summarizes the point sourceemissions for the Base Case and the uniform and regionality scenarios. The totalmanmade emissions for these scenarios are summarized in Table V.A-3. The percentreduction in point source and total NOx emissions for each scenario compared to theBase Case is shown in Table V.A-4.

61
Table V.A-2. Comparison of Point Source Emissions for Different ControlScenarios
NOx (Tons/Day) - EMS-95 OutputState Name 2007 Base 0.25t 0.20t 0.15t 0.12t REG-1 REG-2 0.15nt
Alabama 875.93 559.65 449.32 431.21 353.19 450.13 450.13 381.88Arkansas 254.39 257.41 257.25 258.38 260.77 257.58 258.24 258.17Connecticut 85.88 56.24 54.04 49.64 45.44 49.64 45.55 67.21Delaware 80.64 66.82 51.53 43.47 42.99 43.37 41.39 55.45DC 2.06 2.09 1.74 1.76 1.80 1.77 1.76 4.15Florida 1023.28 1048.03 1051.57 1055.35 1073.78 1,052.55 1,053.09 1056.34Georgia 869.61 532.68 441.13 374.29 295.44 441.19 448.22 336.84Illinois 1346.93 808.95 670.44 566.43 498.48 657.66 568.87 555.92Indiana 1339.81 786.17 656.61 540.96 446.35 687.07 502.62 573.19Iowa 334.74 356.68 356.68 357.32 358.91 357.23 357.23 357.23Kansas 474.11 508.96 515.22 511.19 515.94 512.79 509.77 508.69Kentucky 913.39 508.37 429.42 360.34 301.97 439.25 351.56 363.00Louisiana 1052.65 1067.89 1065.14 1070.03 1082.58 1,065.07 1,069.49 1068.90Maine 65.31 86.09 86.10 87.46 88.39 87.40 88.15 86.22Maryland 342.65 237.13 177.45 160.01 139.07 154.58 137.26 152.16Massachusetts 196.59 169.68 147.32 121.77 120.94 121.77 121.60 153.38Michigan 1005.55 687.53 531.12 476.77 420.61 531.00 484.26 438.18Minnesota 332.10 339.23 339.23 339.91 342.09 339.89 339.56 339.20Mississippi 361.61 397.14 400.57 400.45 416.68 400.33 399.41 399.55Missouri 686.99 391.23 315.73 237.46 169.02 325.12 244.88 255.15Nebraska 145.03 153.08 153.08 153.30 154.32 153.47 153.27 153.27New Hampshire 36.74 41.37 41.37 46.31 49.69 46.15 48.92 41.61New Jersey 308.09 219.67 197.18 171.17 165.04 169.37 163.28 161.05New York 430.85 341.20 297.67 276.86 259.57 281.07 265.61 328.14North Carolina 885.76 608.51 516.83 396.62 360.95 519.13 526.52 382.91North Dakota 0.57 0.59 0.59 0.61 0.68 0.61 0.61 0.61Ohio 1566.09 939.59 733.83 553.76 502.52 546.40 553.73 588.05Oklahoma 456.97 469.74 466.71 470.92 477.48 466.57 470.64 469.78Pennsylvania 1484.80 981.49 851.55 665.46 634.11 761.88 630.54 661.64Rhode Island 10.05 9.98 9.98 9.98 9.29 9.98 9.98 10.03South Carolina 516.85 357.00 300.17 268.81 236.23 307.56 326.44 279.23South Dakota 40.64 55.81 55.81 55.93 56.93 55.89 55.89 52.95Tennessee 980.95 612.58 416.40 412.72 386.95 412.95 418.64 431.05Texas 2317.37 2319.84 2319.34 2320.43 2328.74 2,319.30 2,320.21 2319.86Vermont 1.20 2.31 2.30 3.49 4.31 3.48 4.13 2.36Virginia 509.50 345.64 271.58 233.77 205.85 228.21 238.92 246.56West Virginia 1147.39 662.58 574.81 391.92 333.16 386.81 385.35 270.82Wisconsin 513.72 321.72 256.38 213.25 208.30 256.33 212.41 249.12
Domain Total 22,996.79 17,310.67 15,463.19 14,089.51 13,348.56 14,900.55 14,258.13 14,059.85

62
Table V.A-3. Comparison of Total Emissions for Different Control ScenariosNOx (Tons/Day) - EMS-95 Output
State Name 2007 Base 0.25t 0.20t 0.15t 0.12t REG-1 REG-2 0.15nt
Alabama 1597.86 1281.58 1171.25 1153.14 1075.12 1,172.06 1,172.06 1103.81Arkansas 720.10 723.12 722.96 724.09 726.48 723.29 723.95 723.88Connecticut 306.25 276.61 274.41 270.01 265.81 270.01 265.92 287.58Delaware 175.14 161.32 146.03 137.97 137.49 137.87 135.89 149.95DC 44.27 44.30 43.95 43.97 44.01 43.98 43.97 46.36Florida 2249.89 2274.64 2278.18 2281.96 2300.39 2,279.16 2,279.70 2282.95Georgia 1666.99 1330.06 1238.51 1171.67 1092.82 1,238.57 1,245.60 1134.22Illinois 2354.57 1816.59 1678.08 1574.07 1506.12 1,665.30 1,576.51 1563.56Indiana 2192.61 1638.97 1509.41 1393.76 1299.15 1,539.87 1,355.42 1425.99Iowa 738.53 760.47 760.47 761.11 762.70 761.02 761.02 761.02Kansas 1041.88 1076.73 1082.99 1078.96 1083.71 1,080.56 1,077.54 1076.46Kentucky 1691.27 1286.25 1207.30 1138.22 1079.85 1,217.13 1,129.44 1140.88Louisiana 2044.37 2059.61 2056.86 2061.75 2074.30 2,056.79 2,061.21 2060.62Maine 212.44 233.22 233.23 234.59 235.52 234.53 235.28 233.35Maryland 734.15 628.63 568.95 551.51 530.57 546.08 528.76 543.66Massachusetts 562.78 535.87 513.51 487.96 487.13 487.96 487.79 519.57Michigan 1949.25 1631.23 1474.82 1420.47 1364.31 1,474.70 1,427.96 1381.88Minnesota 851.96 859.09 859.09 859.77 861.95 859.75 859.42 859.06Mississippi 961.60 997.13 1000.56 1000.44 1016.67 1,000.32 999.40 999.54Missouri 1257.13 961.37 885.87 807.60 739.16 895.26 815.02 825.29Nebraska 385.11 393.16 393.16 393.38 394.40 393.55 393.35 393.35New Hampshire 158.32 162.95 162.95 167.89 171.27 167.73 170.50 163.19New Jersey 818.56 730.14 707.65 681.64 675.51 679.84 673.75 671.52New York 1413.83 1324.18 1280.65 1259.84 1242.55 1,264.05 1,248.59 1311.12North Carolina 1598.95 1321.70 1230.02 1109.81 1074.14 1,232.32 1,239.71 1096.10North Dakota 53.27 53.29 53.29 53.31 53.38 53.31 53.31 53.31Ohio 2655.81 2029.31 1823.55 1643.48 1592.24 1,636.12 1,643.45 1677.77Oklahoma 1255.26 1268.03 1265.00 1269.21 1275.77 1,264.86 1,268.93 1268.07Pennsylvania 2327.75 1824.44 1694.50 1508.41 1477.06 1,604.83 1,473.49 1504.59Rhode Island 67.92 67.85 67.85 67.85 67.16 67.85 67.85 67.90South Carolina 1019.05 859.20 802.37 771.01 738.43 809.76 828.64 781.43South Dakota 120.58 135.75 135.75 135.87 136.87 135.83 135.83 132.89Tennessee 1893.76 1525.39 1329.21 1325.53 1299.76 1,325.76 1,331.45 1343.86Texas 4005.14 4007.61 4007.11 4008.20 4016.51 4,007.07 4,007.98 4007.63Vermont 72.83 73.94 73.93 75.12 75.94 75.11 75.76 73.99Virginia 1433.66 1269.80 1195.74 1157.93 1130.01 1,152.37 1,163.08 1170.72West Virginia 1402.51 917.70 829.93 647.04 588.28 641.93 640.47 525.94Wisconsin 990.20 798.20 732.86 689.73 684.78 732.81 688.89 725.60
Domain Total 45,025.55 39,339.43 37,491.95 36,118.27 35,377.32 36,929.31 36,286.89 36,088.61

63
Table V.A-4. Summary of NOx Emissions Reductions.
Percent Reduction in Point Source NOx EmissionsFrom 2007 SIP Call Base Case
Region1 0.25 0.20 0.15t 0.12 Reg-1 Reg-2 0.15nt
Northeast 29% 39% 49% 52% 46% 49% 46%
Midwest 40% 51% 59% 65% 50% 59% 58%
Southeast 35% 49% 54% 61% 48% 54% 56%
AdjacentStates
40% 51% 63% 68% 64% 63% 66%
SIP Call2 37% 48% 57% 62% 52% 57% 57%
Percent Reduction in Total NOx EmissionsFrom 2007 SIP Call Base Case
Region1 0.25 0.20 0.15t 0.12 Reg-1 Reg-2 0.15nt
Northeast 13% 18% 22% 24% 21% 24% 21%
Midwest 22% 28% 33% 36% 28% 33% 32%
Southeast 19% 26% 29% 32% 26% 25% 30%
AdjacentStates
23% 30% 37% 40% 38% 37% 39%
SIP Call2 20% 26% 30% 33% 28% 30% 30%
1. The Northeast includes Connecticut, Delaware, District of Columbia, Maryland, Massachusetts, NewJersey, New York, Pennsylvania, and Rhode Island; the Midwest includes Illinois, Indiana, Kentucky,Michigan, Missouri Ohio, West Virginia, and Wisconsin; the Southeast includes Alabama, Georgia, NorthCarolina South Carolina, Tennessee and Virginia; the "Adjacent States' include Ohio, Virginia, and WestVirginia.2. “SIP Call” includes the total percent reduction over all 23 jurisdictions subject to budgets as part of thisnotice.

64
V.B. Modeling Results
The EPA applied UAM-V for each of the four OTAG episodes to simulate ozoneconcentrations for the Base Case and each scenario. The results for the uniformregionwide scenarios are presented first. This is followed by the results for the tworegionality control options and the 0.15nt scenario. The results for the assessment ofoverall "downwind" benefits of the budgets applied in "upwind" States is presented last.
The analysis of model predictions focused on hourly values, 1-hour daily maximumvalues, and 8-hour daily maximum values predicted for all 4 episodes. Each of the controlscenarios was evaluated using the four UAM-V metrics described in Section IV.A.2. of thisdocument and summarized in Table V.B-1. Note that the model predictions used incalculating the metrics were restricted to those 1-hour values >=125 ppb and 8-hourvalues >=85 ppb. Model predictions less than these concentrations were not included inthe analysis.
Table V.B-1. UAM-V Air Quality Metrics.
Metric 1: Exceedences The number of values above the concentration level ofNAAQS
Metric 2: Ozone Reduced–ppb The magnitude and frequency of the “ppb” reductions inozone
Metric 3: Total ppb Reduced The total “ppb” reduced by a given scenario, not includingthat portion of the reduction that occurs below the level of theNAAQS
Metric 4: Population-Weighted Totalppb Reduced
The same as Metric 3, except that the ozone reductions areweighted by the population in the grid cell in which thereductions occur.
In general, the four metrics lead to similar overall conclusions. The results for thefull set of receptor areas (i.e., "designated plus modeled" for the 1-hour NAAQS and"violating plus modeled" and "modeled only" for the 8-hour NAAQS) are provided in thedocket for the NOx SIP Call rulemaking for all four metrics. In this document, Metrics 1and 3 are presented to illustrate the results. For the 1-hour NAAQS, the metrics arepresented for 1-hour daily maximum ozone concentrations using the “designated plusmodeled” receptors. For the 8-hour NAAQS, the metrics are presented for both 8-hourdaily maximum concentrations using the "violating plus modeled" receptors.

65
V.B.1. Impacts of Alternative Controls
The impacts on ozone concentrations of the 0.15t scenario and each of thealternative scenarios are provided by region in Tables V.B-2 and V.B-3 for Metrics 1 and3, respectively. The complete set of data for individual States and 1-hour nonattainmentareas based on the 1-hour and 8-hour daily maximum values is provided Appendix L. Table V.B-2 shows the percent reduction in the number of exceedences across all fourepisodes between each control scenario and the Base Case. This percentage iscalculated by taking the difference between the Base Case and control caseexceedences and dividing by the Base Case exceedences. Table V.B-3 shows thepercent reduction in total ozone above the NAAQS provided by each scenario, comparedto the total ozone above the NAAQS in the Base Case. The values in this table werecalculated by dividing the Total “ppb” Reduced in the control scenario by the Total “ppb”above the NAAQS in the Base Case. These values represent the percent of total ozoneabove the NAAQS in the Base Case that is reduced by the control scenario.
The results indicate that the 0.15t scenario provides substantial reductions in both1-hour and 8-hour ozone concentrations in all three regions. In the Midwest the 0.15tscenario provides a 38 percent reduction in 1-hour exceedences and a 45 percentreduction in "total ozone" >=125 ppb. For several individual 1-hour nonattainment areasin this region, the reduction in exceedences due to the 0.15t controls is 36 percent overLake Michigan, 73 percent in Southwest Michigan, and 54 percent in Louisville. Thecorresponding reduction in "total ozone" >=125 ppb is 44 percent over Lake Michigan, 81percent in Southwest Michigan, and 64 percent in Louisville. The regionwide Midwestreductions in 8-hour exceedences and "total ozone" >=85 ppb are 45 percent and 50percent, respectively. For several specific States in this region the reduction inexceedences is 66 percent in Indiana, 73 percent in West Virginia, and 43 percent inIllinois. The corresponding reduction in “total ozone” >=85 ppb is 68 percent in Indiana,76 percent in West Virginia, and 52 percent in Illinois.

66
Table V.B-2. Results for Metric 1: Number of Exceedences.
Percent Reduction in the Number of Exceedences1-hour Daily Maximum >=125 ppb
0.25 0.20 0.15t 0.12 Reg-1 Reg-2 0.15nt
Midwest 25% 32% 38% 43% 32% 38% 38%
Southeast 23% 33% 34% 40% 33% 33% 36%
Northeast 24% 31% 36% 39% 35% 38% 36%
SIP Call Total 24% 31% 36% 40% 34% 37% 37%
Percent Reduction in the Number of Exceedences8-hour Daily Maximum >=85 ppb
0.25 0.20 0.15t 0.12 Reg-1 Reg-2 0.15nt
Midwest 35% 44% 50% 54% 45% 50% 49%
Southeast 30% 40% 46% 51% 42% 42% 48%
Northeast 26% 34% 41% 44% 39% 43% 41%
SIP Call Total 30% 39% 45% 49% 42% 45% 45%
Table V.B-3. Results for Metric 3: Total “ppb” Reduced.1
Total “ppb” Reduced Compared to the Total “ppb” Above NAAQS in Base Case1-hour Daily Maximum >=125 ppb
0.25 0.20 0.15t 0.12 Reg-1 Reg-2 0.15nt
Midwest 31% 39% 45% 49% 39% 45% 44%
Southeast 27% 37% 39% 44% 37% 37% 41%
Northeast 25% 32% 37% 40% 36% 39% 37%
SIP Call Total 27% 35% 40% 43% 37% 40% 40%
Total “ppb” Reduced Compared to the Total “ppb” Above NAAQS in Base Case8-hour Daily Maximum >=85 ppb
0.25 0.20 0.15t 0.12 Reg-1 Reg-2 0.15nt
Midwest 35% 42% 48% 52% 43% 48% 47%
Southeast 33% 44% 49% 53% 45% 45% 50%
Northeast 28% 37% 43% 46% 42% 45% 43%
SIP Call Total 31% 40% 46% 50% 43% 46% 46%1. The values in this table were calculated by dividing the total "ppb" reduced in the control scenario by thetotal "ppb" above the NAAQS in the Base Case. These values represent the percent of total ozone abovethe NAAQS in the Base Case that is reduced by the control scenario.

67
In the Southeast, 1-hour exceedences are reduced by 39 percent and the "totalozone" >=125 ppb by 34 percent. Considering individual nonattainment areas in theSoutheast, the 0.15t scenario provides a 36 percent reduction in 1-hour exceedences inAtlanta and a 39% reduction in exceedences in Birmingham. The reduction in "totalozone" >=125 ppb is 41 percent in Atlanta and 54 percent in Birmingham. The overallregionwide ozone benefits across the Southeast are also large for the 8-hour NAAQS. The number of 8-hour exceedences regionwide is reduced by 46 percent with the 0.15tscenario and the “total ozone” >= 85 ppb is reduced by 49 percent. Exceedences arereduced by 27 percent in Georgia and 61 percent in North Carolina. The correspondingreduction in “total ozone” >= 85 ppb is 33 percent in Georgia and 69 percent in NorthCarolina.
In the Northeast, 0.15t provides a 37 percent reduction in 1-hour exceedences anda 34 percent reduction in "total ozone" >=125 pp. For individual nonattainment areas inthe Northeast, the reductions in both Metrics 1 and 3 range from approximately 25percent in Washington, DC up to 100 percent in Pittsburgh. For the serious and severe 1-hour nonattainment areas along the Northeast Corridor from Baltimore to Boston, the 1-hour reductions vary from city to city, but are generally in the range of 25 percent to 55percent. For example, in the 0.15t scenario, 1-hour exceedences are reduced by 50percent in Philadelphia, 48 percent in Baltimore, and 27 percent in New York City. Thecorresponding reduction in “total ozone” >= 125 ppb are 56 percent in Philadelphia, 43percent in Baltimore, and 32 percent in New York City. The regionwide reductions in 8-hour exceedences and "total ozone" >=85 ppb in the Northeast are above 40 percent. Looking at specific States, exceedences are reduced by 33 percent in Maryland, 73percent in Pennsylvania, and 14 percent in New York. The corresponding reduction in“total ozone” >= 85 ppb is 42 percent in Maryland, 76 percent in Pennsylvania, and 23percent in New York.
In general, results from these scenarios demonstrate that the larger the reductionin NOx emissions, the greater the overall ozone benefit. As indicated in Table V.B-2 andV.B-3, the 0.25 and 0.20 scenarios generally do not provide the same level of reductionas the 0.15t scenario in any of the three regions, whereas the 0.12 scenario providesadditional ozone benefits beyond 0.15t. Also, the results indicate that even with the moststringent control option considered, nonattainment problems requiring additional localcontrols may continue in some areas currently violating the NAAQS.

68
Concerning the two "regionality" runs, the relative amount of ozone reductionprovided by each of these scenarios versus the uniform scenarios is comparable to therelative difference in the amount of emissions reductions (see Table V.A-4). For example,the total emissions reduction across the 23 jurisdictions provided by Reg-1 (28 percent) isbetween the amount provided by the 0.20 (26 percent) and the 0.15t (30 percent) uniformscenarios. Similarly, the ozone benefits from Reg-1 lie between those of the 0.20 and0.15t uniform scenarios. The total emissions reduction from Reg-2 is the same as thereduction from 0.15t (30 percent) and the overall ozone benefits with Reg-2, for the 23jurisdictions as a whole, are the same as those from the 0.15t uniform scenario. Theemission reduction and ozone benefits for the 0.15t and Reg-2 scenarios are not thesame for individual States. In general, the differences in the benefits correspond to thedifferences in emissions on a regional basis.
In the Midwest, the benefits from Reg-1 are less than the benefits from the 0.15tuniform regionwide scenario for both 1-hour and 8-hour concentrations, which would beexpected from the difference in emissions. For example, there is a 38 percent reductionin 1-hour exceedences with 0.15t in the Midwest compared to a 32 percent reduction withReg-1. Looking at specific nonattainment areas, there is a 54 percent reduction with 0.15tin Louisville compared to 43 percent with Reg-1 and a 36 percent reduction with 0.15t inLake Michigan compared to 31 percent with Reg-1. The reductions in 8-hourexceedences with 0.15t and Reg-1 are 45 percent and 41 percent, respectively. Thereduction in exceedences is 43 percent with 0.15t and 39 percent for Reg-1 in Illinois, 66percent with 0.15t and 57 percent with Reg-1 in Indiana, and 44 percent with 0.15t and 31percent with Reg-1 in Wisconsin. The benefits in the Midwest of 0.15t compared to Reg-1are somewhat greater with metric 3. For this metric, the reduction in "total ozone" >=125ppb is 45 percent with 0.15t and 39 percent with Reg-1. The differences in individualnonattainment areas are comparable. The data in Table V.B-3 for Metric 3 indicatesimilar results for the 8-hour NAAQS. In the Midwest, the 1-hour and 8-hour air qualitybenefits for Reg-2 are comparable to 0.15t as are the emissions reductions, as indicatedby the data in Table V.B-2 and V.B-3.
In the Southeast, the 1-hour ozone reductions with 0.15t regionwide are 1-2percent greater than those with Reg-1 for both metrics The 8-hour ozone reductions are3-4 percent greater with 0.15t. This is fairly consistent across the nonattainment areasand States in the region. As seen in Tables V.B-2 and V.B-3, the results of Reg-2compared to 0.15t are the same as those from Reg-1 for 1-hour and 8-hourconcentrations.

69
In the Northeast, the total emissions reduction with the Reg-1 scenario is about thesame as the reduction with 0.15t, which is expected since the regionwide emission limit inthe Northeast in Reg-1 is 0.15lb/mmBtu and the emissions reductions from these twoscenarios are generally comparable. Although the emission limits are the same the netemissions reductions in individual States are not, due to differences in the effects oftrading between these two scenarios (the emissions reductions in Pennsylvania are 4percent greater with 0.15t than in the Reg-1 scenario). The 1-hour ozone benefits of the0.15t scenario are 1-2 percent greater than Reg-1 in the Northeast. The 8-hour benefitsare 3 percent greater than Reg-1. The increase in benefits appear to be the result of theapplication of the 0.15 lb/mmBtu limit to sources outside the Northeast and adjacentStates.
For Reg-2, the emissions reductions in individual States are less than 1 percentdifferent from the reductions with the 0.12 uniform regionwide scenario. However, the airquality benefits in the Northeast with 0.12t regionwide are 1 to 2 percent greater than withReg-2 using both metrics. Reductions in several individual nonattainment areas andStates are as high as 4 percent. This additional ozone reduction in the Northeast appearsto be the result of the 5 percent additional reduction in total NOx emissions (between Reg-2 and 0.12t) in upwind States subject to the SIP Call.
The impact on ozone reductions of a trading program versus meeting the budgetsin each State can be seen by comparing the results for the 0.15t and 0.15nt scenarios. The data in Tables V.B-2 and V.B-3 indicate that there is no overall loss of ozone benefitsfor either 1-hour or 8-hour concentrations across the 23 jurisdictions due to trading. On aregional basis, the benefits of trading and non-trading at the 0.15 control level areessentially the same in the Northeast and Midwest and slightly less with trading in theSoutheast.
The modeling runs discussed here also shed light on the issue of local“disbenefits” of the regional controls. Of the four metrics examined by EPA, Metrics 3 and4 (i.e., "Total ppb Reduced" and "Population-Weighted Total ppb Reduced") are mostappropriate for identifying any net disbenefits because the ozone decreases and anyincreases disbenefits) are considered in calculating each of these metrics. The metricswill have negative values for situations in which the total disbenefits are greater than the

70
total benefits. The EPA examined the 1-hour estimates for these metrics for each 1-hournonattainment area and the 8-hour estimates by State to identify any areas in which themodeling indicated a net disbenefit. The results indicate that the only net disbenefitpredicted in any of the scenarios were in Cincinnati for the 1-hour NAAQS. However,these disbenefits occurred only in the 0.25 and 0.20 scenarios. In the 0.15t scenario,there is net a 32 percent benefit in Cincinnati with Metric 3 and a net benefit of 23 percentwith Metric 4. There were no net Statewide 8-hour disbenefits in any of the scenariosexamined by EPA.
V.B.2 Impacts of Upwind Controls on Downwind Nonattainment
The impacts of the budgets applied in "upwind" States on "downwind" ozone in (a)the Northeast, (b) Georgia, and (c) Illinois-Indiana-Wisconsin, were evaluated using the0.15nt scenario along with the three "downwind" transport assessment scenarios listed inTable V.A-1. In each of these scenarios, EPA modeled the 0.15nt option in one of theareas with the Base Case emissions applied in the rest of the OTAG region. The resultsof the "downwind" control runs were compared to the Base Case in order to assess thebenefits of the controls applied within those areas (i.e., the "downwind" areas). Similarly,the predictions for the 0.15nt regionwide run were compared to the Base Case toestimate the benefits in each area of the "downwind plus upwind" controls. Emissionsfrom the intrastate trading scenario rather than the interstate trading scenario were usedfor the analysis of upwind controls in order to avoid any potentially confounding effects ofsmall changes in the downwind emissions between the downwind control scenario andthe downwind plus upwind control scenario due to interstate trading. The benefits of the"upwind" controls were examined in two ways. In the first way, the benefits of the"downwind" controls relative to the Base are compared to the benefits of the "downwindplus upwind" controls relative to the Base. The difference between these relativereductions can be interpreted as the reduction associated with "upwind" controls. Forexample, if the reduction in 1-hour exceedences due to "downwind" controls is 20 percentand the reduction due to "downwind plus upwind" controls is 35 percent, then the benefitof the "upwind" controls alone (compared to the Base Case) is 15 percent. Similarly, if"downwind" controls provide a 25 percent reduction in "total ozone" >=125 ppb comparedto the "total ozone" >=125 ppb in the Base Case and the "downwind plus upwind" controlsprovide a 50 percent reduction, then the amount of reduction due to "upwind" controlsalone is 25 percent.

71
A second way to analyze the benefits of "upwind" controls using the number ofexceedences (i.e., Metric 1) is to compare the number of exceedences in the "upwind plusdownwind" scenario to the number of "residual" exceedences remaining after theapplication of the "downwind" controls. In this way, the model predictions in the "upwind"controls case serve as the baseline and the benefits of "upwind" controls can be thoughtof as being "incremental additional reductions" beyond the reductions provided by the"downwind" controls alone. The benefits of "upwind" controls are calculated as thedifference between the "downwind plus upwind" exceedences and the "downwind"exceedences, divided by the "downwind" exceedences and expressed as a percent. Thesecond way of analyzing the "upwind" benefits using Metric 3, Total "ppb" Reduced, is todetermine the relative portion of the total "downwind plus upwind" reduction that is due tothe "upwind" controls. The "ppb" amount of reduction from "upwind" controls is thenexpressed as a percent of the total "downwind plus upwind" reduction. For example, if thetotal ppb reduced (across all days and receptors in a particular "downwind" area) due tothe "downwind plus upwind" controls is 1000 ppb and the portion due to "upwind" controlsis 200 ppb, then the "upwind" controls provide 20 percent of the total reduction in ozone inthe "downwind" area.
The results for the transport analysis for Metrics 1 and 3 are provided in Table V.B-4. These data indicate that there are substantial benefits in "downwind" areas resultingfrom the budgets applied in "upwind" States. Specifically, the scenario with 0.15 appliedthroughout the Northeast only (i.e., "downwind" controls), provides approximately a 20percent overall reduction in both 1-hour exceedences and "total ozone" >=125 ppb. Bycomparison, the "upwind plus downwind" application of 0.15 results provides an overallreduction in this region of approximately 35 percent and 37 percent, respectively for thesetwo metrics. The additional incremental reduction in the number of "residual" 1-hour and8-hour exceedences (i.e., the number of exceedences that remain after the application ofthe downwind controls) due to "upwind" controls is 19 percent and 27 percent,respectively. The results for Metric 3 indicate that "upwind" controls provide 40 percent ofthe 1-hour total ("downwind plus upwind") ppb reduction and 48 percent of the 8-hour totalppb reduction in the Northeast.

72
Table V.B-4. Results for Transport Runs.
Percent Reduction in Exceedences1
1-Hr Daily Max 8-Hr Daily Max
DW2 DW + UW2 UW2 DW DW + UW UW
Northeast 21% 36% 19% 18% 40% 27%
Lake MI 29% 36% 9% 11% 17% 7%
IL/IN/WI 35% 50% 23% 27% 57% 41%
Atlanta 30% 39% 12% NA3 NA NA
Georgia4 30% 39% 12% 15% 27% 14%
Total “ppb” Reduced Compared to Total “ppb” Above NAAQS in Base Case
1-Hr Daily Max 8-Hr Daily Max
DW5 DW + UW5 UW5 DW DW + UW UW
Northeast 22% 37% 40% 23% 43% 48%
Lake MI 39% 44% 12% 20% 28% 27%
IL/IN/WI 17% 33% 49% 32% 62% 48%
Atlanta 37% 43% 14% NA NA NA
Georgia 37% 43% 14% 25% 35% 28%
1. The percent reduction provided by “downwind” and by “downwind + upwind” controls are both calculatedby comparing the number of exceedences in each scenario back to the Base Case. The reduction providedby “upwind” controls was calculated by comparing the number of exceedences after “downwind + upwind”controls to the number of exceedences remaining after “downwind” controls only. That is, the upwindreductions indicate the additional incremental benefits after the controls are applied "downwind".2. "DW" denotes the reductions due to the "downwind" controls; "DW + UW" denotes the reductions due tocontrols applied regionwide in "downwind plus upwind" areas; and "UW" denotes the incremental additionalreduction in exceedences.3. NA: The metrics for the 8-hour NAAQS were not calculated for individual 1-hour nonattainment areas.4. The 1-hour results for Georgia are the same as for Atlanta because Atlanta is the only 1-hournonattainment area in that State.5. The “DW” and “DW + UW” values in the bottom portion of the table were calculated by dividing the Total“ppb” Reduced in the control scenario by the Total “ppb” above the NAAQS in the Base Case. These valuesrepresent the percent of total ozone above the NAAQS in the Base Case that is reduced by the controlscenario; "UW" in the bottom part of the table denotes the portion of the total "upwind plus downwind"reduction that is due to the "upwind" controls.

73
The results for individual 1-hour nonattainment areas and individual States for the 8-hourNAAQS in the Northeast are provided in Appendix M. As an example of the 1-hourbenefits in these areas, the additional incremental reductions in 1-hour exceedences dueto "upwind" controls include a 28 percent reduction in Baltimore, a 20 percent reduction inPhiladelphia, a 15 percent reduction in New York City, and a 23 percent reduction inGreater Connecticut. The relative portion of the total "ppb" reduction in 1-hour ozoneconcentrations due to "upwind" controls is 48 percent in Baltimore, 29 percent inPhiladelphia, 38 percent in New York City, and 47 percent in Connecticut.
The impacts of "upwind" controls on nonattainment in Georgia were examinedusing the scenario with the 0.15nt controls applied in Georgia versus the Base Casescenario and the scenario with 0.15nt applied regionwide. The results, as shown in TableV.B-4, indicate that the "downwind" application of 0.15 in Georgia is predicted to reducethe number of 1-hour exceedences in Atlanta by 30 percent and the "total ozone" >=125ppb by 37 percent. With the "downwind plus upwind" controls, the reduction inexceedences increases to 39 percent with a 43 percent reduction in "total ozone" >=125ppb. The "upwind" controls are estimated to provide an additional incremental 12 percentreduction in residual 1-hour exceedences in Atlanta after the application of downwindcontrols in Georgia. Also, in Atlanta, 14 percent of the 1-hour total "ppb" reduced by the"downwind plus upwind" regionwide scenario is due to the controls applied in "upwind"States. For the 8-hour NAAQS, the "downwind" controls provide a 15 percent reduction in8-hour exceedences and a 25 percent reduction 8-hour "total ozone" >=85 ppb within theState of Georgia. With "downwind plus upwind" controls, there is a 27 percent reductionin the number of 8-hour exceedences and a 35 percent reduction in "total ozone" >=85ppb. The "upwind" controls provide a 14 percent incremental additional reduction in 8-hour exceedences in Georgia and the portion of the total "ppb" reduced that is due to"upwind" controls is 28 percent.
To assess the benefits in Illinois-Indiana-Wisconsin due to "upwind" controls, EPAexamined the data for the Lake Michigan receptor area and for the three States,combined. The discussion of results focuses on the Lake Michigan receptor area. Thedata for this area and the three States are provided in Table V.B-4. For the LakeMichigan receptor area, there is a 29 percent reduction in 1-hour exceedences due to"downwind" controls and reduction in "total ozone" >=125 ppb of 39 percent. With the"downwind plus upwind" controls the benefits increase to a 36 percent reduction in 1-hourexceedences and the 44 percent reduction in "total ozone" >=125 ppb. The incremental
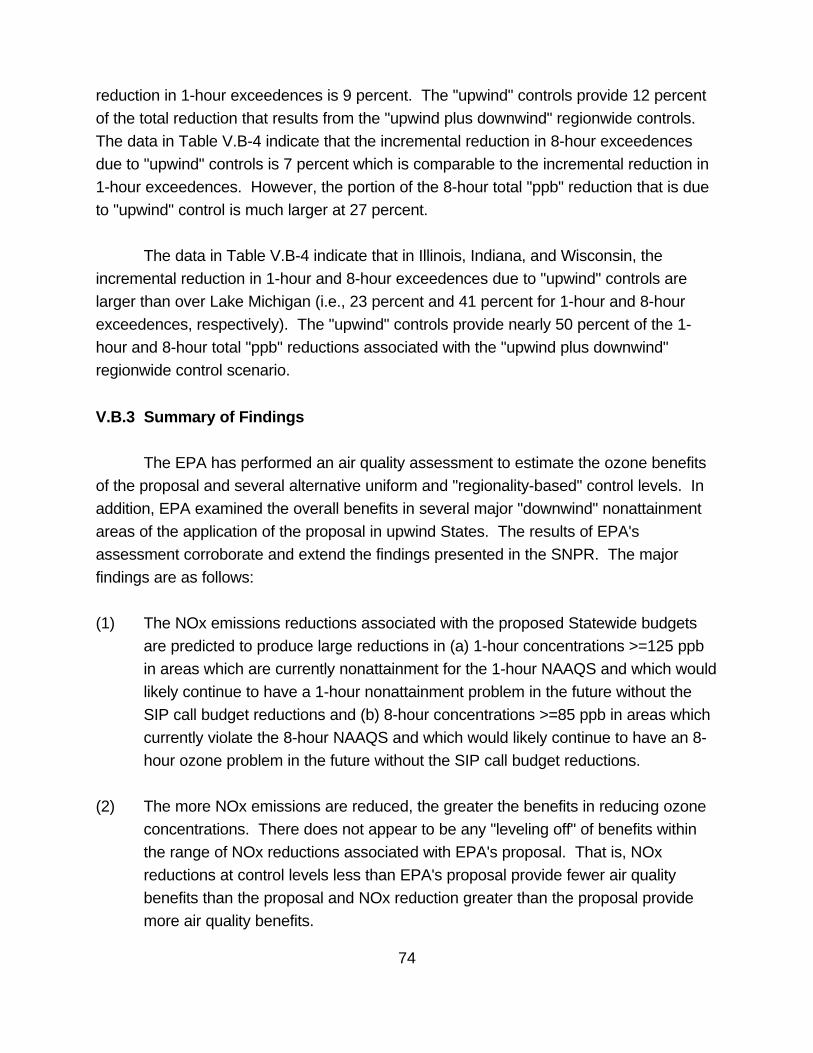
74
reduction in 1-hour exceedences is 9 percent. The "upwind" controls provide 12 percentof the total reduction that results from the "upwind plus downwind" regionwide controls. The data in Table V.B-4 indicate that the incremental reduction in 8-hour exceedencesdue to "upwind" controls is 7 percent which is comparable to the incremental reduction in1-hour exceedences. However, the portion of the 8-hour total "ppb" reduction that is dueto "upwind" control is much larger at 27 percent.
The data in Table V.B-4 indicate that in Illinois, Indiana, and Wisconsin, theincremental reduction in 1-hour and 8-hour exceedences due to "upwind" controls arelarger than over Lake Michigan (i.e., 23 percent and 41 percent for 1-hour and 8-hourexceedences, respectively). The "upwind" controls provide nearly 50 percent of the 1-hour and 8-hour total "ppb" reductions associated with the "upwind plus downwind"regionwide control scenario.
V.B.3 Summary of Findings
The EPA has performed an air quality assessment to estimate the ozone benefitsof the proposal and several alternative uniform and "regionality-based" control levels. Inaddition, EPA examined the overall benefits in several major "downwind" nonattainmentareas of the application of the proposal in upwind States. The results of EPA'sassessment corroborate and extend the findings presented in the SNPR. The majorfindings are as follows:
(1) The NOx emissions reductions associated with the proposed Statewide budgetsare predicted to produce large reductions in (a) 1-hour concentrations >=125 ppbin areas which are currently nonattainment for the 1-hour NAAQS and which wouldlikely continue to have a 1-hour nonattainment problem in the future without theSIP call budget reductions and (b) 8-hour concentrations >=85 ppb in areas whichcurrently violate the 8-hour NAAQS and which would likely continue to have an 8-hour ozone problem in the future without the SIP call budget reductions.
(2) The more NOx emissions are reduced, the greater the benefits in reducing ozoneconcentrations. There does not appear to be any "leveling off" of benefits withinthe range of NOx reductions associated with EPA's proposal. That is, NOxreductions at control levels less than EPA's proposal provide fewer air qualitybenefits than the proposal and NOx reduction greater than the proposal providemore air quality benefits.

75
(3) Any disbenefits due to the NOx reductions associated with the budgets areexpected to be very limited compared to the extent of the benefits expected fromthese budgets.
(4) There are likely to be benefits in major nonattainment areas due to the "downwind"application of controls in the proposed budgets. Reductions in ozone transportassociated with the collective application of the budgets in "upwind" States areexpected to provide substantial ozone benefits in "downwind" areas, beyond whatis provided by the budgets applied in these areas. Together, the "downwind"reductions and transport reductions from "upwind" controls will provide significantprogress toward attainment in major nonattainment areas within the OTAG region. However, even with the most stringent control option considered, nonattainmentproblems requiring additional local control measures may continue in some areascurrently violating the NAAQS.

76
REFERENCES
Alpine Geophysics, LLC (AGL), 1998. "Modeled Effects of Indiana Point Source NOxEmissions Reductions on Local and Regional 1-HR and 8-HR Ground Level OzoneConcentrations in 1995 and 2007 Using Two OTAG Oxidant Episodes," January 1998,Covington, KY 41017.
ENVIRON International, 1997a. "User’s Guide to the Ozone Tool : Ozone SourceApportionment Technology for UAM-IV,", March 1997, Novato, CA 94945.
ENVIRON International, 1997b. "User’s Guide to the Comprehensive Air Quality Modelwith Extensions (CAMx)," April 1997, Novato, CA 94945.
ENVIRON International, 1997c. "Assessment of the Contribution of Emissions fromNorthern OTAG States on Elevated Ozone Concentrations," December 1997, Novato, CA94945.
EPA, 1996. U.S. Environmental Protection Agency, “Forecast of Average Daily NOxEmissions in July by Electric Generation Units Using OTAG 2007 Base Case and theIntegrated Planning Model (IPM),” December 1996.
EPA, 1998a. U.S. Environmental Protection Agency, "Development of ModelingInventory and Budgets for the Ozone Transport SIP Call," Docket A-96-56, V-E-06, March23, 1998.
EPA, 1998b. U.S. Environmental Protection Agency, "Regulatory Impact Analysis of theNOx SIP Call," Docket A-96-56, VI-B-09, September 1998.
Gery, M.W., G.Z. Whitten, J.P. Killus and M.C. Dodge, 1989. " A photochemical KineticsMechanism for Urban and Regional Scale Computer Modeling," J. Geophysical Research,94, 12925-12956, 1989.
OTAG, 1997. Ozone Transport Assessment Group "Technical Supporting Document,"June, 1997.
Sonoma Technology, Inc. (STI), 1997a. "Evaluation of the UAM-V Model Performance in

77
OTAG Simulations, Phase I: Summary of Performance Against Surface Observations,"January 1997, STI-996120-1605-FR, Santa Rosa, CA 95403.
Sonoma Technology, Inc.(STI), 1997b. "Comparison of CAMx and UAM-V ModelPerformance for Two Ozone episodes in the Eastern United States," June 1997, STI-996203-1733-FR, Santa Rosa, CA 95403.
System Application International (SAI), 1995. "User’s Guide to the Variable Grid UrbanAirshed Model (UAM-V)," April 1995, San Rafael, CA 94903.
Whitten G.Z., H.P. Deuel, C.S. Burton and J.L. Haney, 1996. "Overview of theImplementation of an Updated Isoprene Chemistry Mechanism in CB4/UAM-V," 1996,Report of System Application International San Rafael, CA 94903.

78
ERRATA
The following items were discovered and corrected on September 28, 1998,
(1) Table IV.B-1. Extent of 1-Hour Nonattainment Problem and section IV.B.4a. Extent of1-Hour Nonattainment in New York City -- the 1-hour design value for New York City wasis 144 ppb which was incorrectly typed as 149 ppb.
(2) Table IV.B-6. Contributions to 1-Hour Nonattainment in New York City: CAMx Metrics-- the right column in the table (i.e., Max 1-hour contribution) was inadvertantly notincluded in the table.
(3) Section IV.B.4.b. Upwind Contributions to 1-Hour Nonattainment in New York City, (a) under the description of the Group 1 Upwind States: -- the discussion for UAM-V Metrics 2 and 3 were clarified to indicate that the results for these metrics areapplicable to Ohio, Virginia, and West Virginia;
(b) under the description of the Group 2 Upwind States: -- the CAMx frequency ofcontribution from Indiana to New York City was incorrectly typed as 4%, instead of3%;
(c) under the description of the "Overall contributions considering UAM-V andCAMx Metrics" for the contributions from Michigan to New York City, the followingfactor was inadvertantly excluded from the list of "Metrics indicating relatively highand/or frequent contributions:"
- Frequency of Contribution: 3 percent of the exceedences receivecontributions of more than 2 ppb (UAM-V Metrics 1 and 2)
(d) under the description of the "Overall contributions considering UAM-V andCAMx Metrics" for the contributions from North Carolina to New York City, thefollowing factor listed in the text was found to contain a numerical error and wastherefore removed from the list of factors under the heading "Metrics indicatingrelatively low and/or infrequent contributions." The incorrect item which wasremoved is:
- Magnitude of Contribution: the maximum contribution from UAM-V is 2 ppb

79
(4) In the description of Metric 2 for both UAM-V and CAMx, the concentration range cut-offs were described incorrectly as ">". The correct concentration range cut-offs are ">=". For example, the correct ranges are >= 2 to 5 ppb, >= 5 to 10 ppb, etc.


A-1
APPENDIX AFIGURES

A-2
Figure A-1. OTAG Modeling Domain
Figure A-2. Counties Designated Nonattainment for the 1-HourNAAQS.

A-3
Figure A-3a. UAM-V 1-Hour “Designated plus Modeled”Nonattainment Receptors.
Figure A-3b. CAMx 1-Hour “Designated plus Modeled”Nonattainment Receptors.

A-4
Figure A-4. Counties with 1994-1996 Ambient 4th Highest 8-HourOzone Design Values $ 85ppb
Figure A-5a. UAM-V 8-Hour “Violating plus Modeling”Nonattainment Receptors.

A-5
Figure A-5b. CAMx 8-Hour “Violating plus Modeled” NonattainmentReceptors.
Figure A-6. CAMx Source Areas.

APPENDIX BEQUATIONS FOR UAM-V METRICS

B-1
UAM-V Metric 3: Total ppb Reduced. This metric quantifies the total ppb contributedin the downwind area from an upwind State, not including that portion of the contributionthat occurs below the level of the NAAQS. For 1-hour concentrations, Metric 3 iscalculated by taking the difference between the Base Case predictions in eachnonattainment receptor and either (a) the corresponding value in the zero-out run, or (b)125 ppb, whichever is greater (i.e., 125 ppb or the prediction in the zero-out run). TheBase Case vs zero-out differences are summed over all time periods (i.e., hourly ordaily) and across all nonattainment receptors in the downwind area. The calculation ofthis metric is illustrated by the following example. If the Base Case 1-hour dailymaximum ozone prediction is 150 ppb and the corresponding value from the zero-outrun is 130 ppb, then the difference used in this metric is 20 ppb. However, if the valuefrom the zero-out run is 115 ppb, then the difference used in this metric is 25 ppb (i.e.,150 ppb - 125 ppb, because 115 ppb is less than 125 ppb). The following equation wasused for calculating this metric:
SumGrid Cells { SumDays [ (O3)Base - max[ (125 or 85), (O3)Zero-out ] ] }
To analyze the contributions using Metric 3, the values of this metric arecompared to the total amount of ozone above the NAAQS (i.e., 125 ppb, 1-hour or 85ppb, 8-hour) in the Base Case. This baseline measure of the "total amount ofnonattainment" (i.e., the total "ppb" of ozone that is above the NAAQS) is calculated bysumming the "ppb" values in the Base Case that are above the level of the NAAQS. The total contribution from an upwind State to a particular downwind area calculated byMetric 3 is expressed in relation to the amount that the downwind area is innonattainment. For example, if Upwind State #1 contributes a total of 50 ppb >=125ppb to Downwind Area #2 and the total Base Case ozone >=125 ppb in Downwind Area#2 is 500 ppb, then the contribution from Upwind State #1 (i.e., 50 ppb) to DownwindArea #2 is equivalent to 10 percent of Downwind Area #2's nonattainment problem (i.e.,50 ppb divided by 500 ppb, times 100). The following equation was used to calculatethe baseline for this metric:
SumGrid Cells { SumDays [ (O3)Base - (125 or 85) ] }

1 All "non-ramp up" days. For OTAG, the first few days of each episode were excluded fromanalysis because of the influence of "initial conditions" from the start of the model simulation.
B-2
UAM-V Metric 4: "Population-Weighted Total ppb Reduced." This metric is similarto the "Total ppb Reduced" metric except that the calculated contributions are weightedby (i.e., multiplied by) population. In calculating this metric, the "ppb" contributions aredetermined for each nonattainment receptor, then summed across all nonattainmentreceptors in a particular downwind area. During this calculation, the population in thenonattainment receptor is multiplied by the total contribution in that receptor (i.e., gridcell) and then this value is added to the corresponding values for the other receptors inthe downwind area. The following equation was used to calculate this metric:
SumGrid Cells { PopGrid Cell x { SumDays [ (O3)Base - max[ (125 or 85), (O3)Zero-out ] ] } }
The Population-Weighted Total ppb > NAAQS in the 2007 Base Case serves asa baseline for evaluating the "Population-weighted Total ppb Reduced." This metric issimilar to the "Total ppb > NAAQS" except that the amount above the NAAQS isweighted by the population in the grid cell. The following equation was used to calculatethe baseline metric:
SumGrid Cells { PopGrid Cell x { SumDays [ (O3)Base - (125 or 85) ] } }
Definition of Terms for Metrics 3 and 4:
(O3)Base -- ozone prediction in a grid cell for the 2007 Base Case
(O3)Zero-out -- ozone prediction in a grid cell for the zero-out scenario
max[ (125 or 85), (O3)Zero-out ]-- for calculations of this metric for the 1-Hr NAAQS, this is the higher of(a) 125 ppb or (b) the zero-out scenario ozone prediction-- for calculations of this metric for the 8-Hr NAAQS, this is the higher of(a) 85 ppb or (b) the zero-out scenario ozone prediction
SumDays[ ] -- perform the calculations within the brackets for each day, for a singlegrid cell, then sum the results across all days1
SumGrid Cells { }-- perform the calculations within the brackets for each grid cell, then sumthe results for all applicable receptor grid cells
PopGrid Cell -- 1990 population in the grid cell

APPENDIX C1-HOUR UPWIND/DOWNWIND LINKAGES1
________________________________1. Note that the Metric 2 data on the maximum "ppb" contributions are rounded to thenearest "ppb" in the presentation of contributions in this Appendix.


C-1
States which Contribute Significantly to 1-hr Nonattainment Areas
-- BirminghamGeorgia’s Contribution to Birmingham UAM-V zero-out modeling:C Georgia contributes at least 10 ppb to 11% of the 1-hr exceedences in Birmingham; the maximum
1-hr contribution from Georgia is 17 ppb;C The total contribution from Georgia is equivalent to 12% of the total ppb >= 125 ppb in
Birmingham. CAMx modeling:C Georgia contributes at least 10 ppb to 16% of the 1-hr exceedences in Birmingham; the maximum
1-hr contribution from Georgia is 51 ppb;C Georgia contributes 3% of the total manmade ppb >= 125 ppb in Birmingham;C The highest daily average 1-hr contribution from Georgia to Birmingham is 24 ppb; which is 18%
of the average 1-hr ozone concentration >= 125 ppb in Birmingham on that day.Kentucky’s Contribution to Birmingham UAM-V zero-out modeling:C Kentucky contributes at least 2 ppb to 5% of the 1-hr exceedences in Birmingham; the maximum
1-hr contribution from Kentucky is 3 ppb;C The total contribution from Kentucky is equivalent to 2% of the total ppb >= 125 ppb in
Birmingham. CAMx modeling:C Kentucky contributes at least 5 ppb to 21% of the 1-hr exceedences in Birmingham; the maximum
1-hr contribution from Kentucky is 10 ppb;C Kentucky contributes 2% of the total manmade ppb >= 125 ppb in Birmingham;C The highest daily average 1-hr contribution from Kentucky to Birmingham is 7 ppb; which is 5% of
the average 1-hr ozone concentration >= 125 ppb in Birmingham on that day.South Carolina’s Contribution to Birmingham UAM-V zero-out modeling:C South Carolina contributes at least 10 ppb to 2% of the 1-hr exceedences in Birmingham; the
maximum 1-hr contribution from South Carolina is 11 ppb;C The total contribution from South Carolina is equivalent to 2% of the total ppb >= 125 ppb in
Birmingham. CAMx modeling:C South Carolina contributes at least 10 ppb to 2% of the 1-hr exceedences in Birmingham; the
maximum 1-hr contribution from South Carolina is 21 ppb;C The highest daily average 1-hr contribution from South Carolina to Birmingham is 18 ppb; which is
14% of the average 1-hr ozone concentration >= 125 ppb in Birmingham on that day.Tennessee’s Contribution to Birmingham UAM-V zero-out modeling:C Tennessee contributes at least 5 ppb to 20% of the 1-hr exceedences in Birmingham; the
maximum 1-hr contribution from Tennessee is 14 ppb;C The total contribution from Tennessee is equivalent to 14% of the total ppb >= 125 ppb in
Birmingham. CAMx modeling:C Tennessee contributes at least 10 ppb to 29% of the 1-hr exceedences in Birmingham; the
maximum 1-hr contribution from Tennessee is 26 ppb;C Tennessee contributes 5% of the total manmade ppb >= 125 ppb in Birmingham;C The highest daily average 1-hr contribution from Tennessee to Birmingham is 17 ppb; which is
12% of the average 1-hr ozone concentration >= 125 ppb in Birmingham on that day.-- Greater Connecticut Maryland/DC/Delaware’s Contribution to Greater Connecticut CAMx modeling:C Maryland/DC/Delaware contributes at least 5 ppb to 29% of the 1-hr exceedences in Greater

C-2
Connecticut; the maximum 1-hr contribution from Maryland/DC/Delaware is 12 ppb;C Maryland/DC/Delaware contributes 3% of the total manmade ppb >= 125 ppb in Greater
Connecticut;C The highest daily average 1-hr contribution from Maryland/DC/Delaware to Greater Connecticut is
7 ppb; which is 6% of the average 1-hr ozone concentration >= 125 ppb in Connecticut on thatday.
New Jersey’s Contribution to Greater Connecticut CAMx modeling:C New Jersey contributes at least 10 ppb to 99% of the 1-hr exceedences in Greater Connecticut;
the maximum 1-hr contribution from New Jersey is 62 ppb;C New Jersey contributes 26% of the total manmade ppb >= 125 ppb in Greater Connecticut;C The highest daily average 1-hr contribution from New Jersey to Greater Connecticut is 45 ppb;
which is 35% of the average 1-hr ozone concentration >= 125 ppb in Greater Connecticut on thatday.
New York’s Contribution to Greater Connecticut CAMx modeling:C New York contributes at least 10 ppb to 99% of the 1-hr exceedences in Greater Connecticut; the
maximum 1-hr contribution from New York is 65 ppb;C New York contributes 26% of the total manmade ppb >= 125 ppb in Greater Connecticut;C The highest daily average 1-hr contribution from New York to Greater Connecticut is 37 ppb;
which is 27% of the average 1-hr ozone concentration >= 125 ppb in Greater Connecticut on thatday.
Ohio’s Contribution to Greater Connecticut UAM-V zero-out modeling:C Ohio contributes at least 2 ppb to 20% of the 1-hr exceedences in Greater Connecticut; the
maximum 1-hr contribution from Ohio is 4 ppb;C The total contribution from Ohio is equivalent to 6% of the total ppb >= 125 ppb in Greater
Connecticut. CAMx modeling:C Ohio contributes at least 5 ppb to 18% of the 1-hr exceedences in Greater Connecticut; the
maximum 1-hr contribution from Ohio is 14 ppb;C Ohio contributes 2% of the total manmade ppb >= 125 ppb in Greater Connecticut;C The highest daily average 1-hr contribution from Ohio to Greater Connecticut is 10 ppb; which is
8% of the average 1-hr ozone concentration >= 125 ppb in Greater Connecticut on that day.Pennsylvania’s Contribution to Greater Connecticut CAMx modeling:C Pennsylvania contributes at least 10 ppb to 60% of the 1-hr exceedences in Greater Connecticut;
the maximum 1-hr contribution from Pennsylvania is 29 ppb;C Pennsylvania contributes 10% of the total manmade ppb >= 125 ppb in Greater Connecticut;C The highest daily average 1-hr contribution from Pennsylvania to Greater Connecticut is 23 ppb;
which is 18% of the average 1-hr ozone concentration >= 125 ppb in Greater Connecticut on thatday.
Virginia’s Contribution to Greater Connecticut UAM-V zero-out modeling:C Virginia contributes at least 2 ppb to 29% of the 1-hr exceedences in Greater Connecticut; the
maximum 1-hr contribution from Virginia is 6 ppb;C The total contribution from Virginia is equivalent to 9% of the total ppb >= 125 ppb in Greater
Connecticut. CAMx modeling:C Virginia contributes at least 5 ppb to 36% of the 1-hr exceedences in Greater Connecticut; the
maximum 1-hr contribution from Virginia is 15 ppb;C Virginia contributes 4% of the total manmade ppb >= 125 ppb in Greater Connecticut;C The highest daily average 1-hr contribution from Virginia to Greater Connecticut is 9 ppb; which is
7% of the average 1-hr ozone concentration >= 125 ppb in Greater Connecticut on that day.

C-3
West Virginia’s Contribution to Greater Connecticut UAM-V zero-out modeling:C West Virginia contributes at least 5 ppb to 9% of the 1-hr exceedences in Greater Connecticut; the
maximum 1-hr contribution from West Virginia is 7 ppb;C The total contribution from West Virginia is equivalent to 10% of the total ppb >= 125 ppb in
Greater Connecticut. CAMx modeling:C West Virginia contributes at least 5 ppb to 23% of the 1-hr exceedences in Greater Connecticut;
the maximum 1-hr contribution from West Virginia is 11 ppb;C West Virginia contributes 2% of the total manmade ppb >= 125 ppb in Greater Connecticut;C The highest daily average 1-hr contribution from West Virginia to Greater Connecticut is 10 ppb;
which is 7% of the average 1-hr ozone concentration >= 125 ppb in Greater Connecticut on thatday.
-- Washington, DCIndiana’s Contribution to Washington, DC UAM-V zero-out modeling:C Indiana contributes at least 2 ppb to 4% of the 1-hr exceedences in Washington, DC; the
maximum 1-hr contribution from Indiana is 4 ppb;C The total contribution from Indiana is equivalent to 2% of the total ppb >= 125 ppb in Washington,
DC. CAMx modeling:C Indiana contributes at least 5 ppb to 13% of the 1-hr exceedences in Washington, DC; the
maximum 1-hr contribution from Indiana is 9 ppb;C The highest daily average 1-hr contribution from Indiana to Washington, DC is 7 ppb; which is 6%
of the average 1-hr ozone concentration >= 125 ppb in Washington, DC on that day.Kentucky’s Contribution to Washington, DC UAM-V zero-out modeling:C Kentucky contributes at least 2 ppb to 6% of the 1-hr exceedences in Washington, DC; the
maximum 1-hr contribution from Indiana is 5 ppb;C The total contribution from Kentucky is equivalent to 2% to the population-weighted total ppb >=
125 ppb in Washington, DC. CAMx modeling:C Kentucky contributes at least 5 ppb to 13% of the 1-hr exceedences in Washington, DC; the
maximum 1-hr contribution from Kentucky is 12 ppb;C The highest daily average 1-hr contribution from Kentucky to Washington, DC is 7 ppb; which is
5% of the average 1-hr ozone concentration >= 125 ppb in Washington, DC on that day.Michigan’s Contribution to Washington, DC UAM-V zero-out modeling:C Michigan contributes at least 2 ppb to 4% of the 1-hr exceedences in Washington, DC; the
maximum 1-hr contribution from Michigan is 7 ppb;C The total contribution from Michigan is equivalent to 2% of the total ppb >= 125 ppb in
Washington, DC. CAMx modeling:C Michigan contributes at least 5 ppb to 5% of the 1-hr exceedences in Washington, DC; the
maximum 1-hr contribution from Michigan is 8 ppb;C Michigan contributes 2% of the total manmade ppb >= 125 ppb in Washington, DC;C The highest daily average 1-hr contribution from Michigan to Washington, DC is 8 ppb; which is
7% of the average 1-hr ozone concentration >= 125 ppb in Washington, DC on that day. North Carolina’s Contribution to Washington, DC UAM-V zero-out modeling:C North Carolina contributes at least 10 ppb to 1% of the 1-hr exceedences in Washington, DC; the
maximum 1-hr contribution from North Carolina is 12 ppb;C The total contribution from North Carolina is equivalent to 2% of the total ppb >= 125 ppb in
Washington, DC.

C-4
CAMx modeling:C North Carolina contributes at least 5 ppb to 1% of the 1-hr exceedences in Washington, DC; the
maximum 1-hr contribution from North Carolina is 20 ppb;C North Carolina contributes 2% of the total manmade ppb >= 125 ppb in Washington, DC;C The highest daily average 1-hr contribution from North Carolina to Washington, DC is 9 ppb;
which is 7% of the average 1-hr ozone concentration >= 125 ppb in Washington, DC on that day.Pennsylvania’s Contribution to Washington, DC CAMx modeling:C Pennsylvania contributes at least 5 ppb to 81% of the 1-hr exceedences in Washington, DC; the
maximum 1-hr contribution from Pennsylvania is 57 ppb;C Pennsylvania contributes 8% of the total manmade ppb >= 125 ppb in Washington, DC;C The highest daily average 1-hr contribution from Pennsylvania to Washington, DC is 16 ppb;
which is 11% of the average 1-hr ozone concentration >= 125 ppb in Washington, DC on that day. Ohio’s Contribution to Washington, DC UAM-V zero-out modeling:C Ohio contributes at least 2 ppb to 17% of the 1-hr exceedences in Washington, DC; the maximum
1-hr contribution from Ohio is 5 ppb;C The total contribution from Ohio is equivalent to 4% of the total ppb >= 125 ppb in Washington,
DC. CAMx modeling:C Ohio contributes at least 5 ppb to 30% of the 1-hr exceedences in Washington, DC; the maximum
1-hr contribution from Ohio is 11 ppb;C Ohio contributes 3% of the total manmade ppb >= 125 ppb in Washington, DC;C The highest daily average 1-hr contribution from Ohio to Washington, DC is 10 ppb; which is 8%
of the average 1-hr ozone concentration >= 125 ppb in Washington, DC on that day.West Virginia’s Contribution to Washington, DC UAM-V zero-out modeling:C West Virginia contributes at least 5 ppb to 13% of the 1-hr exceedences in Washington, DC; the
maximum 1-hr contribution from West Virginia is 16 ppb;C The total contribution from West Virginia is equivalent to 7% of the total ppb >= 125 ppb in
Washington, DC. CAMx modeling:C West Virginia contributes at least 5 ppb to 19% of the 1-hr exceedences in Washington, DC; the
maximum 1-hr contribution from West Virginia is 20 ppb;C West Virginia contributes 2% of the total manmade ppb >= 125 ppb in Washington, DC;C The highest daily average 1-hr contribution from West Virginia to Washington, DC is 19 ppb;
which is 15% of the average 1-hr ozone concentration >= 125 ppb in Washington, DC on that day.-- AtlantaAlabama’s Contribution to Atlanta UAM-V zero-out modeling:C Alabama contributes at least 10 ppb to 12% of the 1-hr exceedences in Atlanta; the maximum 1-hr
contribution from Alabama is 29 ppb;C The total contribution from Alabama is equivalent to 14% of the total ppb >= 125 ppb in Atlanta. CAMx modeling:C Alabama contributes at least 10 ppb to 34% of the 1-hr exceedences in Atlanta; the maximum 1-hr
contribution from Alabama is 39 ppb;C Alabama contributes 8% of the total manmade ppb >= 125 ppb in Atlanta;C The highest daily average 1-hr contribution from Alabama to Atlanta is 31 ppb; which is 23% of the
average 1-hr ozone concentration >= 125 ppb in Atlanta on that day.Kentucky’s Contribution to Atlanta UAM-V zero-out modeling:C Kentucky contributes at least 5 ppb to 3% of the 1-hr exceedences in Atlanta; the maximum 1-hr
contribution from Kentucky is 11 ppb;C The total contribution from Kentucky is equivalent to 2% of the total ppb >= 125 ppb in Atlanta.

C-5
CAMx modeling:C Kentucky contributes at least 5 ppb to 7% of the 1-hr exceedences in Atlanta; the maximum 1-hr
contribution from Kentucky is 14 ppb;C The highest daily average 1-hr contribution from Kentucky to Atlanta is 11 ppb; which is 8% of the
average 1-hr ozone concentration >= 125 ppb in Atlanta on that day.North Carolina’s Contribution to Atlanta UAM-V zero-out modeling:C North Carolina contributes at least 2 ppb to 5% of the 1-hr exceedences in Atlanta; the maximum
1-hr contribution from North Carolina is 4 ppb; CAMx modeling:C North Carolina contributes at least 2 ppb to 14% of the 1-hr exceedences in Atlanta; the maximum
1-hr contribution from North Carolina is 8 ppb;C The highest daily average 1-hr contribution from North Carolina to Atlanta is 7 ppb; which is 5% of
the average 1-hr ozone concentration >= 125 ppb in Atlanta on that day.South Carolina’s Contribution to Atlanta UAM-V zero-out modeling:C South Carolina contributes at least 10 ppb to 5% of the 1-hr exceedences in Atlanta; the maximum
1-hr contribution from South Carolina is 16 ppb;C The total contribution from South Carolina is equivalent to 4% of the total ppb >= 125 ppb in
Atlanta. CAMx modeling:C South Carolina contributes at least 5 ppb to 11% of the 1-hr exceedences in Atlanta; the maximum
1-hr contribution from South Carolina is 25 ppb;C The highest daily average 1-hr contribution from South Carolina to Atlanta is 23 ppb; which is 18%
of the average 1-hr ozone concentration >= 125 ppb in Atlanta on that day.Tennessee’s Contribution to Atlanta UAM-V zero-out modeling:C Tennessee contributes at least 5 ppb to 11% of the 1-hr exceedences in Atlanta; the maximum 1-
hr contribution from Tennessee is 11 ppb;C The total contribution from Tennessee is equivalent to 8% of the total ppb >= 125 ppb in Atlanta. CAMx modeling:C Tennessee contributes at least 5 ppb to 42% of the 1-hr exceedences in Atlanta; the maximum 1-
hr contribution from Tennessee is 20 ppb;C Tennessee contributes 4% of the total manmade ppb >= 125 ppb in Atlanta;C The highest daily average 1-hr contribution from Tennessee to Atlanta is 11 ppb; which is 8% of
the average 1-hr ozone concentration >= 125 ppb in Atlanta on that day.-- Chicago/MilwaukeeMissouri’s Contribution to Chicago/Milwaukee UAM-V zero-out modeling:C Missouri contributes at least 2 ppb to 88% of the 1-hr exceedences in Chicago/Milwaukee; the
maximum 1-hr contribution from Missouri is 4 ppb;C The total contribution from Missouri is equivalent to 15% of the total ppb >= 125 ppb in
Chicago/Milwaukee. CAMx modeling:C Missouri contributes at least 5 ppb to 100% of the 1-hr exceedences in Chicago/Milwaukee; the
maximum 1-hr contribution from Missouri is 11 ppb;C Missouri contributes 8% of the total manmade ppb >= 125 ppb in Chicago/Milwaukee;C The highest daily average 1-hr contribution from Missouri to Chicago/Milwaukee is 9 ppb; which is
7% of the average 1-hr ozone concentration >= 125 ppb in Chicago/Milwaukee on that day.-- LouisvilleTennessee’s Contribution to Louisville UAM-V zero-out modeling:C Tennessee contributes at least 10 ppb to 22% of the 1-hr exceedences in Louisville; the maximum
1-hr contribution from Tennessee is 15 ppb;

C-6
C The total contribution from Tennessee is equivalent to 37% of the total ppb >= 125 ppb inLouisville.
CAMx modeling:C Tennessee contributes at least 10 ppb to 48% of the 1-hr exceedences in Louisville; the maximum
1-hr contribution from Tennessee is 38 ppb;C Tennessee contributes 14% of the total manmade ppb >= 125 ppb in Louisville;C The highest daily average 1-hr contribution from Tennessee to Louisville is 34 ppb; which is 25%
of the average 1-hr ozone concentration >= 125 ppb in Louisville on that day.-- Lake MichiganAs noted in the TSD, the EPA included the contributions over Lake Michigan in this analysis since highconcentrations over the Lake can impact coastal areas of Illinois, Indiana, Michigan, and Wisconsin.Alabama’s Contribution to ozone over Lake Michigan UAM-V zero-out modeling:C Alabama contributes at least 2 ppb to 3% of the 1-hr exceedences in Lake Michigan; the
maximum 1-hr contribution from Alabama is 4 ppb; CAMx modeling:C Alabama contributes at least 5 ppb to 8% of the 1-hr exceedences in Lake Michigan; the
maximum 1-hr contribution from Alabama is 10 ppb;C The highest daily average 1-hr contribution from Alabama to Lake Michigan is 8 ppb; which is 6%
of the average 1-hr ozone concentration >= 125 ppb in Lake Michigan on that day.Illinois’s Contribution to ozone over Lake Michigan UAM-V zero-out modeling:C Illinois contributes at least 10 ppb to 100% of the 1-hr exceedences in Lake Michigan; the
maximum 1-hr contribution from Illinois is 111 ppb;C The total contribution from Illinois is equivalent to 100% of the total ppb >= 125 ppb in Lake
Michigan. CAMx modeling:C Illinois contributes at least 10 ppb to 100% of the 1-hr exceedences in Lake Michigan; the
maximum 1-hr contribution from Illinois is 120 ppb;C Illinois contributes 59% of the total manmade ppb >= 125 ppb in Lake Michigan;C The highest daily average 1-hr contribution from Illinois to Lake Michigan is 68 ppb; which is 50%
of the average 1-hr ozone concentration >= 125 ppb in Lake Michigan on that day.Indiana’s Contribution to ozone over Lake Michigan UAM-V zero-out modeling:C Indiana contributes at least 10 ppb to 14% of the 1-hr exceedences in Lake Michigan; the
maximum 1-hr contribution from Indiana is 40 ppb;C The total contribution from Indiana is equivalent to 13% of the total ppb >= 125 ppb in Lake
Michigan. CAMx modeling C Indiana contributes at least 10 ppb to 37% of the 1-hr exceedences in Lake Michigan; the
maximum 1-hr contribution from Indiana is 56 ppb;C Indiana contributes 9% of the total manmade ppb >= 125 ppb in Lake Michigan;C The highest daily average 1-hr contribution from Indiana to Lake Michigan is 24 ppb; which is 19%
of the average 1-hr ozone concentration >= 125 ppb in Lake Michigan on that day.Kentucky’s Contribution to ozone over Lake Michigan UAM-V zero-out modeling:C Kentucky contributes at least 5 ppb to 2% of the 1-hr exceedences in Lake Michigan; the
maximum 1-hr contribution from Kentucky is 7 ppb;C The total contribution from Kentucky is equivalent to 2% of the total ppb >= 125 ppb in Lake
Michigan. CAMx modeling:C Kentucky contributes at least 5 ppb to 6% of the 1-hr exceedences in Lake Michigan; the
maximum 1-hr contribution from Kentucky is 15 ppb;C The highest daily average 1-hr contribution from Kentucky to Lake Michigan is 14 ppb; which is

C-7
11% of the average 1-hr ozone concentration >= 125 ppb in Lake Michigan on that day.Missouri’s Contribution to ozone over Lake Michigan UAM-V zero-out modeling:C Missouri contributes at least 5 ppb to 23% of the 1-hr exceedences in Lake Michigan; the
maximum 1-hr contribution from Missouri is 8 ppb;C The total contribution from Missouri is equivalent to 22% of the total ppb >= 125 ppb in Lake
Michigan. CAMx modeling:C Missouri contributes at least 10 ppb to 67% of the 1-hr exceedences in Lake Michigan; the
maximum 1-hr contribution from Missouri is 19 ppb;C Missouri contributes 9% of the total manmade ppb >= 125 ppb in Lake Michigan;C The highest daily average 1-hr contribution from Missouri to Lake Michigan is 12 ppb; which is 8%
of the average 1-hr ozone concentration >= 125 ppb in Lake Michigan on that day.Tennessee’s Contribution to ozone over Lake Michigan UAM-V zero-out modeling:C Tennessee contributes at least 5 ppb to 14% of the 1-hr exceedences in Lake Michigan; the
maximum 1-hr contribution from Tennessee is 8 ppb;C The total contribution from Tennessee is equivalent to 6% of the total ppb >= 125 ppb in Lake
Michigan. CAMx modeling:C Tennessee contributes at least 5 ppb to 14% of the 1-hr exceedences in Lake Michigan; the
maximum 1-hr contribution from Tennessee is 13 ppb;C Tennessee contributes 2% of the total manmade ppb >= 125 ppb in Lake Michigan;C The highest daily average 1-hr contribution from Tennessee to Lake Michigan is 11 ppb; which is
8% of the average 1-hr ozone concentration >= 125 ppb in Lake Michigan on that dayWisconsin’s Contribution to ozone over Lake Michigan UAM-V zero-out modeling:C Wisconsin contributes at least 2 ppb to 4% of the 1-hr exceedences and at least 5 ppb to 1% of
the 1-hr exceedences in Lake Michigan; the maximum 1-hr contribution from Wisconsin is 10 ppb; CAMx modeling:C Wisconsin contributes at least 5 ppb to 28% of the 1-hr exceedences in Lake Michigan; the
maximum 1-hr contribution from Wisconsin is 43 ppb;C Wisconsin contributes 4% of the total manmade ppb >= 125 ppb in Lake Michigan;C The highest daily average 1-hr contribution from Wisconsin to Lake Michigan is 8 ppb; which is
6% of the average 1-hr ozone concentration >= 125 ppb in Lake Michigan on that day.-- Baltimore Illinois’s Contribution to Baltimore UAM-V zero-out modeling:C Illinois contributes at least 2 ppb to 3% of the 1-hr exceedences in Baltimore; the maximum 1-hr
contribution from Illinois is 2 ppb;C The total contribution from Illinois is equivalent to 3% of the total ppb >= 125 ppb in Baltimore. CAMx modeling:C Illinois contributes at least 5 ppb to 7% of the 1-hr exceedences in Baltimore; the maximum 1-hr
contribution from Illinois is 7 ppb;C Illinois contributes 2% to the total manmade ppb >= 125 ppb in Baltimore;C The highest daily average 1-hr contribution from Illinois to Baltimore is 6 ppb; which is 5% of the
average 1-hr ozone concentration >= 125 ppb in Baltimore on that day.Indiana’s Contribution to Baltimore UAM-V zero-out modeling:C Indiana contributes at least 2 ppb to 10% of the 1-hr exceedences in Baltimore; the maximum 1-hr
contribution from Indiana is 4 ppb;C The total contribution from Indiana is equivalent to 4% of the total ppb >= 125 ppb in Baltimore. CAMx modeling:C Indiana contributes at least 5 ppb to 27% of the 1-hr exceedences in Baltimore; the maximum 1-hr

C-8
contribution from Indiana is 9 ppb;C Indiana contributes 2% of the total manmade ppb >= 125 ppb in Baltimore;C The highest daily average 1-hr contribution from Indiana to Baltimore is 6 ppb; which is 5% of the
average 1-hr ozone concentration >= 125 ppb in Baltimore on that day.Kentucky’s Contribution to Baltimore UAM-V zero-out modeling:C Kentucky contributes at least 2 ppb to 7% of the 1-hr exceedences in Baltimore; the maximum 1-
hr contribution from Kentucky is 4 ppb;C The total contribution from Kentucky is equivalent to 3% to the population-weighted total ppb >=
125 ppb in Baltimore. CAMx modeling:C Kentucky contributes at least 5 ppb to 24% of the 1-hr exceedences in Baltimore; the maximum 1-
hr contribution from Kentucky is 9 ppb;C Kentucky contributes 2% of the total manmade ppb >= 125 ppb in Baltimore;C The highest daily average 1-hr contribution from Kentucky to Baltimore is 8 ppb; which is 6% of
the average 1-hr ozone concentration >= 125 ppb in Baltimore on that day.Michigan’s Contribution to Baltimore UAM-V zero-out modeling:C Michigan contributes at least 2 ppb to 14% of the 1-hr exceedences in Baltimore; the maximum 1-
hr contribution from Michigan is 5 ppb;C The total contribution from Michigan is equivalent to 5% of the total ppb >= 125 ppb in Baltimore. CAMx modeling:C Michigan contributes at least 2 ppb to 47% of the 1-hr exceedences in Baltimore; the maximum 1-
hr contribution from Michigan is 10 ppb;C Michigan contributes 2% of the total manmade ppb >= 125 ppb in Baltimore;C The highest daily average 1-hr contribution from Michigan to Baltimore is 8 ppb; which is 6% of
the average 1-hr ozone concentration >= 125 ppb in Baltimore on that day. Ohio’s Contribution to Baltimore UAM-V zero-out modeling:C Ohio contributes at least 2 ppb to 49% of the 1-hr exceedences in Baltimore; the maximum 1-hr
contribution from Ohio is 7 ppb;C The total contribution from Ohio is equivalent to 11% of the total ppb >= 125 ppb in Baltimore. CAMx modeling:C Ohio contributes at least 5 ppb to 52% of the 1-hr exceedences in Baltimore; the maximum 1-hr
contribution from Ohio is 14 ppb;C Ohio contributes 4% of the total manmade ppb >= 125 ppb in Baltimore;C The highest daily average 1-hr contribution from Ohio to Baltimore is 12 ppb; which is 10% of the
average 1-hr ozone concentration >= 125 ppb in Baltimore on that day.Pennsylvania’s Contribution to Baltimore CAMx modeling:C Pennsylvania contributes at least 10 ppb to 34% of the 1-hr exceedences in Baltimore; the
maximum 1-hr contribution from Pennsylvania is 87 ppb;C Pennsylvania contributes 7% of the total manmade ppb >= 125 ppb in Baltimore;C The highest daily average 1-hr contribution from Pennsylvania to Baltimore is 26 ppb; which is
19% of the average 1-hr ozone concentration >= 125 ppb in Baltimore on that day.Virginia’s Contribution to Baltimore UAM-V zero-out modeling:C Virginia contributes at least 10 ppb to 64% of the 1-hr exceedences in Baltimore; the maximum 1-
hr contribution from Virginia is 66 ppb;C The total contribution from Virginia is equivalent to 66% of the total ppb >= 125 ppb in Baltimore. CAMx modeling:C Virginia contributes at least 10 ppb to 88% of the 1-hr exceedences in Baltimore; the maximum 1-
hr contribution from Virginia is 104 ppb;C Virginia contributes 24% of the total manmade ppb >= 125 ppb in Baltimore;

C-9
C The highest daily average 1-hr contribution from West Virginia to Baltimore is 39 ppb; which is30% of the average 1-hr ozone concentration >= 125 ppb in Baltimore on that day.
West Virginia’s Contribution to Baltimore UAM-V zero-out modeling:C West Virginia contributes at least 5 ppb to 23% of the 1-hr exceedences in Baltimore; the
maximum 1-hr contribution from West Virginia is 16 ppb;C The total contribution from West Virginia is equivalent to 15% of the total ppb >= 125 ppb in
Baltimore. CAMx modeling:C West Virginia contributes at least 5 ppb to 50% of the 1-hr exceedences in Baltimore; the
maximum 1-hr contribution from West Virginia is 20 ppb;C West Virginia contributes 4% of the total manmade ppb >= 125 ppb in Baltimore;C The highest daily average 1-hr contribution from West Virginia to Baltimore is 17 ppb; which is
13% of the average 1-hr ozone concentration >= 125 ppb in Baltimore on that day.-- Portland, MaineConnecticut/Rhode Island’s Contribution to Portland CAMx modeling:C Connecticut/Rhode Island contribute at least 5 ppb to 76% of the 1-hr exceedences in Portland;
the maximum 1-hr contribution from Connecticut/Rhode Island is 11 ppb;C Connecticut/Rhode Island contribute 6% of the total manmade ppb >= 125 ppb in Portland;C The highest daily average 1-hr contribution from Connecticut/Rhode Island to Portland is 7 ppb;
which is 6% of the average 1-hr ozone concentration >= 125 ppb in Portland on that day. Maryland/DC/Delaware’s Contribution to Portland CAMx modeling:C Maryland/DC/Delaware contribute at least 5 ppb to 22% of the 1-hr exceedences in Portland; the
maximum 1-hr contribution from Maryland/DC/Delaware is 7 ppb;C Maryland/DC/Delaware contribute 3% of the total manmade ppb >= 125 ppb in Portland. Massachusetts’s Contribution to Portland UAM-V zero-out modeling:C Massachusetts contributes at least 10 ppb to 100% of the 1-hr exceedences in Portland; the
maximum 1-hr contribution from Massachusetts is 53 ppb;C The total contribution from Massachusetts is equivalent to 100% of the total ppb >= 125 ppb in
Portland. CAMx modeling:C Massachusetts contributes at least 10 ppb to 100% of the 1-hr exceedences in Portland; the
maximum 1-hr contribution from Massachusetts is 79 ppb;C Massachusetts contributes 56% of the total manmade ppb >= 125 ppb in Portland;C The highest daily average 1-hr contribution from Massachusetts to Portland is 67 ppb; which is
51% of the average 1-hr ozone concentration >= 125 ppb in Portland on that day.New Jersey’s Contribution to Portland CAMx modeling:C New Jersey contributes at least 5 ppb to 39% of the 1-hr exceedences in Portland; the maximum
1-hr contribution from New Jersey is 9 ppb;C New Jersey contributes 4% of the total manmade ppb >= 125 ppb in Portland;C The highest daily average 1-hr contribution from New Jersey to Portland is 9 ppb; which is 7% of
the average 1-hr ozone concentration >= 125 ppb in Portland on that day.New York’s Contribution to Portland CAMx modeling:C New York contributes at least 10 ppb to 39% of the 1-hr exceedences in Portland; the maximum
1-hr contribution from New York is 16 ppb;C New York contributes 6% of the total manmade ppb >= 125 ppb in Portland;C The highest daily average 1-hr contribution from New York to Portland is 14 ppb; which is 11% of
the average 1-hr ozone concentration >= 125 ppb in Portland on that day.Pennsylvania’s Contribution to Portland

C-10
CAMx modeling:C Pennsylvania contributes at least 5 ppb to 61% of the 1-hr exceedences in Portland; the maximum
1-hr contribution from Pennsylvania is 10 ppb;C Pennsylvania contributes 5% of the total manmade ppb >= 125 ppb in Portland;C The highest daily average 1-hr contribution from Pennsylvania to Portland is 10 ppb; which is 8%
of the average 1-hr ozone concentration >= 125 ppb in Portland on that day.-- BostonConnecticut/Rhode Island’s Contribution to Boston CAMx modeling:C Connecticut/Rhode Island contribute at least 10 ppb to 35% of the 1-hr exceedences in Boston;
the maximum 1-hr contribution from Connecticut/Rhode Island is 43 ppb;C Connecticut/Rhode Island contribute 8% of the total manmade ppb >= 125 ppb in Boston;C The highest daily average 1-hr contribution from Connecticut/Rhode Island to Boston is 15 ppb;
which is 11% of the average 1-hr ozone concentration >= 125 ppb in Boston on that day. Maryland/DC/Delaware’s Contribution to Boston CAMx modeling:C Maryland/DC/Delaware contribute at least 2 ppb to 71% of the 1-hr exceedences in Boston; the
maximum 1-hr contribution from Maryland/DC/Delaware is 9 ppb;C Maryland/DC/Delaware contribute 2% of the total manmade ppb >= 125 ppb in Boston;C The highest daily average 1-hr contribution from Maryland/DC/Delaware to Boston is 5 ppb; which
is 4% of the average 1-hr ozone concentration >= 125 ppb in Boston on that day. New Jersey’s Contribution to Boston CAMx modeling:C New Jersey contributes at least 5 ppb to 52% of the 1-hr exceedences in Boston; the maximum 1-
hr contribution from New Jersey is 42 ppb;C New Jersey contributes 7% of the total manmade ppb >= 125 ppb in Boston;C The highest daily average 1-hr contribution from New Jersey to Boston is 25 ppb; which is 19% of
the average 1-hr ozone concentration >= 125 ppb in Boston on that day.New York’s Contribution to Boston CAMx modeling:C New York contributes at least 10 ppb to 49% of the 1-hr exceedences in Boston; the maximum 1-
hr contribution from New York is 34 ppb;C New York contributes 9% of the total manmade ppb >= 125 ppb in Boston;C The highest daily average 1-hr contribution from New York to Boston is 21 ppb; which is 16% of
the average 1-hr ozone concentration >= 125 ppb in Boston on that day.Ohio’s Contribution to Boston UAM-V zero-out modeling:C Ohio contributes at least 2 ppb to 12% of the 1-hr exceedences in Boston; the maximum 1-hr
contribution from Ohio is 3 ppb;C The total contribution from Ohio is equivalent to 5% of the total ppb >= 125 ppb in Boston. CAMx modeling:C Ohio contributes at least 5 ppb to 15% of the 1-hr exceedences in Boston; the maximum 1-hr
contribution from Ohio is 8 ppb;C Ohio contributes 2% of the total manmade ppb >= 125 ppb in Boston;C The highest daily average 1-hr contribution from Ohio to Boston is 7 ppb; which is 5% of the
average 1-hr ozone concentration >= 125 ppb in Boston on that day.Pennsylvania’s Contribution to Boston CAMx modeling:C Pennsylvania contributes at least 10 ppb to 25% of the 1-hr exceedences in Boston; the maximum
1-hr contribution from Pennsylvania is 18 ppb;C Pennsylvania contributes 5% of the total manmade ppb >= 125 ppb in Boston;C The highest daily average 1-hr contribution from Pennsylvania to Boston is 13 ppb; which is 10%
of the average 1-hr ozone concentration >= 125 ppb in Boston on that day. Virginia’s Contribution to Boston

C-11
UAM-V zero-out modeling:C Virginia contributes at least 2 ppb to 10% of the 1-hr exceedences in Boston; the maximum 1-hr
contribution from Virginia is 7 ppb;C The total contribution from Virginia is equivalent to 5% of the total ppb >= 125 ppb in Boston. CAMx modeling:C Virginia contributes at least 5 ppb to 15% of the 1-hr exceedences in Boston; the maximum 1-hr
contribution from Virginia is 20 ppb;C Virginia contributes 2% of the total manmade ppb >= 125 ppb in Boston;C The highest daily average 1-hr contribution from Virginia to Boston is 10 ppb; which is 7% of the
average 1-hr ozone concentration >= 125 ppb in Boston on that day.--Western MassachusettsConnecticut/Rhode Island’s Contribution to Western Massachusetts CAMx modeling:C Connecticut/Rhode Island contribute at least 10 ppb to 23% of the 1-hr exceedences in Western
Massachusetts; the maximum 1-hr contribution from Connecticut/Rhode Island is 61 ppb;C Connecticut/Rhode Island contribute 35% of the total manmade ppb >= 125 ppb in Western
Massachusetts;C The highest daily average 1-hr contribution from Connecticut/Rhode Island to Western
Massachusetts is 50 ppb; which is 39% of the average 1-hr ozone concentration >= 125 ppb inWestern Massachusetts on that day.
Maryland/DC/Delaware’s Contribution to Western Massachusetts CAMx modeling:C Maryland/DC/Delaware contribute at least 2 ppb to 100% of the 1-hr exceedences in Western
Massachusetts; the maximum 1-hr contribution from Maryland/DC/Delaware is 5 ppb;C Maryland/DC/Delaware contribute 3% of the total manmade ppb >= 125 ppb in Western
Massachusetts.New Jersey’s Contribution to Western Massachusetts CAMx modeling:C New Jersey contributes at least 10 ppb to 100% of the 1-hr exceedences in Western
Massachusetts; the maximum 1-hr contribution from New Jersey is 30 ppb;C New Jersey contributes 16% of the total manmade ppb >= 125 ppb in Western Massachusetts;C The highest daily average 1-hr contribution from New Jersey to Western Massachusetts is 23 ppb;
which is 17% of the average 1-hr ozone concentration >= 125 ppb in Western Massachusetts onthat day.
New York’s Contribution to Western Massachusetts CAMx modeling:C New York contributes at least 10 ppb to 100% of the 1-hr exceedences in Western
Massachusetts; the maximum 1-hr contribution from New York is 26 ppb;C New York contributes 18% of the total manmade ppb >= 125 ppb in Western Massachusetts;C The highest daily average 1-hr contribution from New York to Western Massachusetts is 23 ppb;
which is 18% of the average 1-hr ozone concentration >= 125 ppb in Western Massachusetts onthat day.
Pennsylvania’s Contribution to Western Massachusetts CAMx modeling:C Pennsylvania contributes at least 5 ppb to 91% of the 1-hr exceedences in Western
Massachusetts; the maximum 1-hr contribution from Pennsylvania is 14 ppb;C Pennsylvania contributes 7% of the total manmade ppb >= 125 ppb in Western Massachusetts;C The highest daily average 1-hr contribution from Pennsylvania to Western Massachusetts is 12
ppb; which is 10% of the average 1-hr ozone concentration >= 125 ppb in Western Massachusettson that day.
West Virginia’s Contribution to Western Massachusetts UAM-V zero-out modeling:C West Virginia contributes at least 2 ppb to 21% of the 1-hr exceedences in Western
Massachusetts; the maximum 1-hr contribution from West Virginia is 4 ppb;

C-12
C The total contribution from West Virginia is equivalent to 12% of the total ppb >= 125 ppb inWestern Massachusetts.
CAMx modeling:C West Virginia contributes at least 5 ppb to 36% of the 1-hr exceedences in Western
Massachusetts; the maximum 1-hr contribution from West Virginia is 7 ppb;C West Virginia contributes 2% of the total manmade ppb >= 125 ppb in Western Massachusetts;C The highest daily average 1-hr contribution from West Virginia to Western Massachusetts is 7
ppb; which is 5% of the average 1-hr ozone concentration >= 125 ppb in Western Massachusettson that day.
-- Southwestern MichiganIllinois’s Contribution to Southwestern Michigan UAM-V zero-out modeling:C Illinois contributes at least 10 ppb to 100% of the 1-hr exceedences in Southwestern Michigan; the
maximum 1-hr contribution from Illinois is 60 ppb;C The total contribution from Illinois is equivalent to 100% of the total ppb >= 125 ppb in
Southwestern Michigan. CAMx modeling:C Illinois contributes at least 10 ppb to 100% of the 1-hr exceedences in Southwestern Michigan; the
maximum 1-hr contribution from Illinois is 78 ppb;C Illinois contributes 54% of the total manmade ppb >= 125 ppb in Southwestern Michigan;C The highest daily average 1-hr contribution from Illinois to Southwestern Michigan is 57 ppb;
which is 43% of the average 1-hr ozone concentration >= 125 ppb in Southwestern Michigan onthat day.
Indiana’s Contribution to Southwestern Michigan UAM-V zero-out modeling:C Indiana contributes at least 10 ppb to 18% of the 1-hr exceedences in Southwestern Michigan; the
maximum 1-hr contribution from Indiana is 21 ppb;C The total contribution from Indiana is equivalent to 25% of the total ppb >= 125 ppb in
Southwestern Michigan. CAMx modeling:C Indiana contributes at least 10 ppb to 38% of the 1-hr exceedences in Southwestern Michigan; the
maximum 1-hr contribution from Indiana is 33 ppb;C Indiana contributes 10% of the total manmade ppb >= 125 ppb in Southwestern Michigan;C The highest daily average 1-hr contribution from Indiana to Southwestern Michigan is 14 ppb;
which is 11% of the average 1-hr ozone concentration >= 125 ppb in Southwestern Michigan onthat day.
Missouri’s Contribution to Southwestern Michigan UAM-V zero-out modeling:C Missouri contributes at least 5 ppb to 73% of the 1-hr exceedences in Southwestern Michigan; the
maximum 1-hr contribution from Missouri is 6 ppb;C The total contribution from Missouri is equivalent to 64% of the total ppb >= 125 ppb in
Southwestern Michigan. CAMx modeling:C Missouri contributes at least 10 ppb to 94% of the 1-hr exceedences in Southwestern Michigan;
the maximum 1-hr contribution from Missouri is 16 ppb;C Missouri contributes 12% of the total manmade ppb >= 125 ppb in Southwestern Michigan;C The highest daily average 1-hr contribution from Missouri to Southwestern Michigan is 12 ppb;
which is 9% of the average 1-hr ozone concentration >= 125 ppb in Southwestern Michigan onthat day.
-- St. LouisKentucky’s Contribution to St. Louis UAM-V zero-out modeling:C Kentucky contributes at least 2 ppb to 36% of the 1-hr exceedences in St. Louis; the maximum 1-
hr contribution from Kentucky is 4 ppb;

C-13
C The total contribution from Kentucky is equivalent to 16% of the total ppb >= 125 ppb in St. Louis. CAMx modeling:C Kentucky contributes at least 5 ppb to 14% of the 1-hr exceedences in St. Louis; the maximum 1-
hr contribution from Kentucky is 5 ppb;C The highest daily average 1-hr contribution from Kentucky to St. Louis is 5 ppb; which is 4% of the
average 1-hr ozone concentration >= 125 ppb in St. Louis on that day.-- New York City CAMx modeling:C Maryland/DC/Delaware contribute at least 10 ppb to 14% of the 1-hr exceedences in New York
City; the maximum 1-hr contribution from Maryland/DC/Delaware is 51 ppb;C Maryland/DC/Delaware contribute 5% of the total manmade ppb >= 125 ppb in New York City;C The highest daily average 1-hr contribution from Maryland/DC/Delaware to New York City is 15
ppb; which is 12% of the average 1-hr ozone concentration >= 125 ppb in New York City on thatday.
Illinois’s Contribution to New York City UAM-V zero-out modeling:C Illinois contributes at least 2 ppb to 3% of the 1-hr exceedences in New York City; the maximum 1-
hr contribution from Michigan is 3 ppb;C The total contribution from Illinois is equivalent to 3% of the total ppb >= 125 ppb in New York
City. CAMx modeling:C Illinois contributes at least 5 ppb to 20% of the 1-hr exceedences in New York City; the maximum
1-hr contribution from Illinois is 9 ppb;C Illinois contributes 2% of the total manmade ppb >= 125 ppb in New York City;C The highest daily average 1-hr contribution from Illinois to New York City is 6 ppb; which is 5% of
the average 1-hr ozone concentration >= 125 ppb in New York City on that day.Indiana’s Contribution to New York City UAM-V zero-out modeling:C Indiana contributes at least 2 ppb to 4% of the 1-hr exceedences in New York City; the maximum
1-hr contribution from Indiana is 3 ppb;C The total contribution from Indiana is equivalent to 3% of the total ppb >= 125 ppb in New York
City. CAMx modeling:C Indiana contributes at least 5 ppb to 4% of the 1-hr exceedences in New York City; the maximum
1-hr contribution from Indiana is 6 ppb. Kentucky’s Contribution to New York City UAM-V zero-out modeling:C Kentucky contributes at least 2 ppb to 4% of the 1-hr exceedences in New York City; the
maximum 1-hr contribution from Kentucky is 3 ppb;C The total contribution from Kentucky is equivalent to 2% of the total ppb >= 125 ppb in New York
City. CAMx modeling:C Kentucky contributes at least 5 ppb to 12% of the 1-hr exceedences in New York City; the
maximum 1-hr contribution from Kentucky is 10 ppb;C The highest daily average 1-hr contribution from Kentucky to New York City is 7 ppb; which is 5%
of the average 1-hr ozone concentration >= 125 ppb in New York City on that day.Michigan’s Contribution to New York City UAM-V zero-out modeling:C Michigan contributes at least 2 ppb to 3% of the 1-hr exceedences in New York City; the
maximum 1-hr contribution from Michigan is 3 ppb;C The total contribution from Michigan is equivalent to 3% of the total ppb >= 125 ppb in New York
City. CAMx modeling:C Michigan contributes at least 2 ppb to 41% of the 1-hr exceedences in New York City; the

C-14
maximum 1-hr contribution from Michigan is 8 ppb;C The highest daily average 1-hr contribution from Michigan to New York City is 5 ppb; which is 4%
of the average 1-hr ozone concentration >= 125 ppb in New York City on that day.North Carolina’s Contribution to New York City UAM-V zero-out modeling:C North Carolina contributes at least 2 ppb to 4% of the 1-hr exceedences in New York City; the
maximum 1-hr contribution from North Carolina is 4 ppb;C The total contribution from North Carolina is equivalent to 3% of the total ppb >= 125 ppb in New
York City. CAMx modeling:C North Carolina contributes at least 5 ppb to 6% of the 1-hr exceedences in New York City; the
maximum 1-hr contribution from North Carolina is 11 ppb;C The highest daily average 1-hr contribution from North Carolina to New York City is 6 ppb; which
is 5% of the average 1-hr ozone concentration >= 125 ppb in New York City on that day.Ohio’s Contribution to New York City UAM-V zero-out modeling:C Ohio contributes at least 2 ppb to 28% of the 1-hr exceedences in New York City; the maximum 1-
hr contribution from Ohio is 5 ppb;C The total contribution from Ohio is equivalent to 8% of the total ppb >= 125 ppb in New York City. CAMx modeling:C Ohio contributes at least 5 ppb to 49% of the 1-hr exceedences in New York City; the maximum 1-
hr contribution from Ohio is 15 ppb;C Ohio contributes 4% of the total manmade ppb >= 125 ppb in New York City;C The highest daily average 1-hr contribution from Ohio to New York City is 9 ppb; which is 7% of
the average 1-hr ozone concentration >= 125 ppb in New York City on that day.Pennsylvania’s Contribution to New York City CAMx modeling:C Pennsylvania contributes at least 10 ppb to 91% of the 1-hr exceedences in New York City; the
maximum 1-hr contribution from Pennsylvania is 53 ppb;C Pennsylvania contributes 18% of the total manmade ppb >= 125 ppb in New York City;C The highest daily average 1-hr contribution from Pennsylvania to New York City is 25 ppb; which
is 19% of the average 1-hr ozone concentration >= 125 ppb in New York City on that day. Virginia’s Contribution to New York City UAM-V zero-out modeling:C Virginia contributes at least 5 ppb to 9% of the 1-hr exceedences in New York City; the maximum
1-hr contribution from Virginia is 10 ppb;C The total contribution from Virginia is equivalent to 11% of the total ppb >= 125 ppb in New York
City. CAMx modeling:C Virginia contributes at least 10 ppb to 11% of the 1-hr exceedences in New York City; the
maximum 1-hr contribution from Virginia is 25 ppb;C Virginia contributes 4% of the total manmade ppb >= 125 ppb in New York City;C The highest daily average 1-hr contribution from Virginia to New York City is 11 ppb; which is 9%
of the average 1-hr ozone concentration >= 125 ppb in New York City on that day.West Virginia’s Contribution to New York City UAM-V zero-out modeling:C West Virginia contributes at least 5 ppb to 9% of the 1-hr exceedences in New York City; the
maximum 1-hr contribution from West Virginia is 11 ppb;C The total contribution from West Virginia is equivalent to 9% of the total ppb >= 125 ppb in New
York City. CAMx modeling:C West Virginia contributes at least 10 ppb to 7% of the 1-hr exceedences in New York City; the
maximum 1-hr contribution from West Virginia is 15 ppb;C West Virginia contributes 3% of the total manmade ppb >= 125 ppb in New York City;

C-15
C The highest daily average 1-hr contribution from West Virginia to New York City is 10 ppb; whichis 8% of the average 1-hr ozone concentration >= 125 ppb in New York City on that day.
-- CincinnatiIndiana’s Contribution to Cincinnati UAM-V zero-out modeling:C Indiana contributes at least 5 ppb to 17% of the 1-hr exceedences in Cincinnati; the maximum 1-hr
contribution from Indiana is 10 ppb;C The total contribution from Indiana is equivalent to 6% to the population-weighted total ppb >= 125
ppb in Cincinnati. CAMx modeling:C Indiana contributes at least 10 ppb to 61% of the 1-hr exceedences in Cincinnati; the maximum 1-
hr contribution from Indiana is 23 ppb;C Indiana contributes 11% of the total manmade ppb >= 125 ppb in Cincinnati;C The highest daily average 1-hr contribution from Indiana to Cincinnati is 19 ppb; which is 15% of
the average 1-hr ozone concentration >= 125 ppb in Cincinnati on that day.North Carolina’s Contribution to Cincinnati UAM-V zero-out modeling:C North Carolina contributes at least 2 ppb to 67% of the 1-hr exceedences in Cincinnati; the
maximum 1-hr contribution from North Carolina is 44 ppb;C The total contribution from North Carolina is equivalent to 17% of the total ppb >= 125 ppb in
Cincinnati. CAMx modeling:C North Carolina contributes at least 5 ppb to 17% of the 1-hr exceedences in Cincinnati; the
maximum 1-hr contribution from North Carolina is 6 ppb;C North Carolina contributes 2% of the total manmade ppb >= 125 ppb in Cincinnati;C The highest daily average 1-hr contribution from North Carolina to Cincinnati is 5 ppb; which is 4%
of the average 1-hr ozone concentration >= 125 ppb in Cincinnati on that day.Tennessee’s Contribution to Cincinnati UAM-V zero-out modeling:C Tennessee contributes at least 5 ppb to 17% of the 1-hr exceedences in Cincinnati; the maximum
1-hr contribution from Tennessee is 9 ppb;C The total contribution from Tennessee is equivalent to 20% of the total ppb >= 125 ppb in
Cincinnati. CAMx modeling:C Tennessee contributes at least 5 ppb to 52% of the 1-hr exceedences in Cincinnati; the maximum
1-hr contribution from Tennessee is 27 ppb;C Tennessee contributes 8% of the total manmade ppb >= 125 ppb in Cincinnati;C The highest daily average 1-hr contribution from Tennessee to Cincinnati is 25 ppb; which is 19%
of the average 1-hr ozone concentration >= 125 ppb in Cincinnati on that day.-- PhiladelphiaNorth Carolina’s Contribution to Philadelphia UAM-V zero-out modeling:C North Carolina contributes at least 2 ppb to 4% of the 1-hr exceedences in Philadelphia; the
maximum 1-hr contribution from North Carolina is 4 ppb;C The total contribution from North Carolina is equivalent to 4% of the total ppb >= 125 ppb in
Philadelphia. CAMx modeling:C North Carolina contributes at least 2 ppb to 18% of the 1-hr exceedences in Philadelphia; the
maximum 1-hr contribution from North Carolina is 11 ppb;C The highest daily average 1-hr contribution from North Carolina to Philadelphia is 9 ppb; which is
7% of the average 1-hr ozone concentration >= 125 ppb in Philadelphia on that day. Ohio’s Contribution to Philadelphia UAM-V zero-out modeling:C Ohio contributes at least 2 ppb to 36% of the 1-hr exceedences in Philadelphia; the maximum 1-hr

C-16
contribution from Ohio is 5 ppb;C The total contribution from Ohio is equivalent to 13% of the total ppb >= 125 ppb in Philadelphia. CAMx modeling:C Ohio contributes at least 5 ppb to 63% of the 1-hr exceedences in Philadelphia; the maximum 1-hr
contribution from Ohio is 13 ppb;C Ohio contributes 5% of the total manmade ppb >= 125 ppb in Philadelphia;C The highest daily average 1-hr contribution from Ohio to Philadelphia is 10 ppb; which is 8% of the
average 1-hr ozone concentration >= 125 ppb in Philadelphia on that day.Virginia’s Contributions to Philadelphia UAM-V zero-out modeling:C Virginia contributes at least 5 ppb to 41% of the 1-hr exceedences in Philadelphia; the maximum
1-hr contribution from Virginia is 24 ppb;C The total contribution from Virginia is equivalent to 32% of the total ppb >= 125 ppb in
Philadelphia. CAMx modeling:C Virginia contributes at least 10 ppb to 36% of the 1-hr exceedences in Philadelphia; the maximum
1-hr contribution from Virginia is 38 ppb;C Virginia contributes 7% of the total manmade ppb >= 125 ppb in Philadelphia;C The highest daily average 1-hr contribution from Virginia to Philadelphia is 28 ppb; which is 21%
of the average 1-hr ozone concentration >= 125 ppb in Philadelphia on that day.West Virginia’s Contribution to Philadelphia UAM-V zero-out modeling:C West Virginia contributes at least 5 ppb to 19% of the 1-hr exceedences in Philadelphia; the
maximum 1-hr contribution from West Virginia is 10 ppb;C The total contribution from West Virginia is equivalent to 19% of the total ppb >= 125 ppb in
Philadelphia. CAMx modeling:C West Virginia contributes at least 5 ppb to 65% of the 1-hr exceedences in Philadelphia; the
maximum 1-hr contribution from West Virginia is 19 ppb;C West Virginia contributes 5% of the total manmade ppb >= 125 ppb in Philadelphia;C The highest daily average 1-hr contribution from West Virginia to Philadelphia is 13 ppb; which is
10% of the average 1-hr ozone concentration >= 125 ppb in Philadelphia on that day.-- PittsburghNorth Carolina’s Contribution to Pittsburgh: UAM-V zero-out modeling:C North Carolina contributes at least 2 ppb to 100% of the 1-hr exceedences in Pittsburgh; the
maximum 1-hr contribution from North Carolina is 3 ppb;C The total contribution from North Carolina is equivalent to 57% of the total ppb >= 125 ppb in
Pittsburgh. CAMx modeling:C North Carolina contributes at least 5 ppb to 44% of the 1-hr exceedences in Pittsburgh; the
maximum 1-hr contribution from North Carolina is 5 ppb;C North Carolina contributes 4% of the total manmade ppb >= 125 ppb in Pittsburgh;C The highest daily average 1-hr contribution from North Carolina to Pittsburgh is 4 ppb; which is 5%
of the average 1-hr ozone concentration >= 125 ppb in Pittsburgh on that day. Ohio’s Contribution to Pittsburgh: UAM-V zero-out modeling:C Ohio contributes at least 2 ppb to 60% of the 1-hr exceedences in Pittsburgh; the maximum 1-hr
contribution from Ohio is 3 ppb;C The total contribution from Ohio is equivalent to 64% of the total ppb >= 125 ppb in Pittsburgh. CAMx modeling:C Ohio contributes at least 10 ppb to 100% of the 1-hr exceedences in Pittsburgh; the maximum 1-
hr contribution from Ohio is 25 ppb;C Ohio contributes 18% of the total manmade ppb >= 125 ppb in Pittsburgh;

C-17
C The highest daily average 1-hr contribution from Ohio to Pittsburgh is 20 ppb; which is 16% of theaverage 1-hr ozone concentration >= 125 ppb in Pittsburgh on that day.
West Virginia’s Contribution to Pittsburgh: UAM-V zero-out modeling:C West Virginia contributes at least 10 ppb to 100% of the 1-hr exceedences in Pittsburgh; the
maximum 1-hr contribution from West Virginia is 40 ppb;C The total contribution from West Virginia is equivalent to 100% of the total ppb >= 125 ppb in
Pittsburgh. CAMx modeling:C West Virginia contributes at least 10 ppb to 100% of the 1-hr exceedences in Pittsburgh; the
maximum 1-hr contribution from West Virginia is 36 ppb;C West Virginia contributes 28% of the total manmade ppb >= 125 ppb in Pittsburgh;C The highest daily average 1-hr contribution from West Virginia to Pittsburgh is 31 ppb; which is
24% of the average 1-hr ozone concentration >= 125 ppb in Pittsburgh on that day.-- Rhode IslandMaryland/DC/Delaware’s Contribution to Rhode Island CAMx modeling:C Maryland/DC/Delaware contribute at least 2 ppb to 75% of the 1-hr exceedences in Rhode Island;
the maximum 1-hr contribution from Maryland/DC/Delaware is 7 ppb;C Maryland/DC/Delaware contribute 3% of the total manmade ppb >= 125 ppb in Rhode Island;C The highest daily average 1-hr contribution from Maryland/DC/Delaware to Rhode Island is 7 ppb;
which is 5% of the average 1-hr ozone concentration >= 125 ppb in Rhode Island on that day. New Jersey’s Contribution to Rhode Island CAMx modeling:C New Jersey contributes at least 10 ppb to 100% of the 1-hr exceedences in Rhode Island; the
maximum 1-hr contribution from New Jersey is 48 ppb;C New Jersey contributes 30% of the total manmade ppb >= 125 ppb in Rhode Island;C The highest daily average 1-hr contribution from New Jersey to Rhode Island is 38 ppb; which is
29% of the average 1-hr ozone concentration >= 125 ppb in Rhode Island on that day.New York’s Contribution to Rhode Island CAMx modeling:C New York contributes at least 10 ppb to 100% of the 1-hr exceedences in Rhode Island; the
maximum 1-hr contribution from New York is 45 ppb;C New York contributes 24% of the total manmade ppb >= 125 ppb in Rhode Island;C The highest daily average 1-hr contribution from New York to Rhode Island is 37 ppb; which is
26% of the average 1-hr ozone concentration >= 125 ppb in Rhode Island on that day.Ohio’s Contribution to Rhode Island UAM-V zero-out modeling:C Ohio contributes at least 2 ppb to 42% of the 1-hr exceedences in Rhode Island; the maximum 1-
hr contribution from Ohio is 4 ppb;C The total contribution from Ohio is equivalent to 16% of the total ppb >= 125 ppb in Rhode Island. CAMx modeling:C Ohio contributes at least 5 ppb to 81% of the 1-hr exceedences in Rhode Island; the maximum 1-
hr contribution from Ohio is 10 ppb;C Ohio contributes 6% of the total manmade ppb >= 125 ppb in Rhode Island;C The highest daily average 1-hr contribution from Ohio to Rhode Island is 8 ppb; which is 6% of the
average 1-hr ozone concentration >= 125 ppb in Rhode Island on that day.Pennsylvania’s Contribution Rhode Island CAMx modeling:C Pennsylvania contributes at least 10 ppb to 100% of the 1-hr exceedences in Rhode Island; the
maximum 1-hr contribution from Pennsylvania is 22 ppb;C Pennsylvania contributes 12% of the total manmade ppb >= 125 ppb in Rhode Island;C The highest daily average 1-hr contribution from Pennsylvania to Rhode Island is 20 ppb; which is
16% of the average 1-hr ozone concentration >= 125 ppb in Rhode Island on that day.

C-18
Virginia’s Contribution to Rhode Island UAM-V zero-out modeling:C Virginia contributes at least 2 ppb to 37% of the 1-hr exceedences in Rhode Island; the maximum
1-hr contribution from Virginia is 8 ppb;C The total contribution from Virginia is equivalent to 17% of the total ppb >= 125 ppb in Rhode
Island. CAMx modeling:C Virginia contributes at least 5 ppb to 69% of the 1-hr exceedences in Rhode Island; the maximum
1-hr contribution from Virginia is 18 ppb;C Virginia contributes 7% of the total manmade ppb >= 125 ppb in Rhode Island;C The highest daily average 1-hr contribution from Virginia to Rhode Island is 13 ppb; which is 10%
of the average 1-hr ozone concentration >= 125 ppb in Rhode Island on that day.West Virginia’s Contribution to Rhode Island UAM-V zero-out modeling:C West Virginia contributes at least 2 ppb to 37% of the 1-hr exceedences in Rhode Island; the
maximum 1-hr contribution from West Virginia is 5 ppb;C The total contribution from West Virginia is equivalent to 15% of the total ppb >= 125 ppb in
Rhode Island. CAMx modeling:C West Virginia contributes at least 5 ppb to 40% of the 1-hr exceedences in Rhode Island; the
maximum 1-hr contribution from West Virginia is 8 ppb;C West Virginia contributes 4% of the total manmade ppb >= 125 ppb in Rhode Island;C The highest daily average 1-hr contribution from West Virginia to Rhode Island is 6 ppb; which is
4% of the average 1-hr ozone concentration >= 125 ppb in Rhode Island on that day.-- MemphisAlabama’s Contribution to Memphis UAM-V zero-out modeling:C Alabama contributes at least 5 ppb to 17% of the 1-hr exceedences in Memphis; the maximum 1-
hr contribution from Alabama is 7 ppb;C The total contribution from Alabama is equivalent to 21% of the total ppb >= 125 ppb in Memphis. CAMx modeling:C Alabama contributes at least 10 ppb to 31% of the 1-hr exceedences in Memphis; the maximum 1-
hr contribution from Alabama is 20 ppb;C Alabama contributes 6% of the total manmade ppb >= 125 ppb in Memphis;C The highest daily average 1-hr contribution from Alabama to Memphis is 18 ppb; which is 13% of
the average 1-hr ozone concentration >= 125 ppb in Memphis on that day.Georgia’s Contribution to Memphis UAM-V zero-out modeling:C Georgia contributes at least 5 ppb to 17% of the 1-hr exceedences in Memphis; the maximum 1-hr
contribution from Georgia is 8 ppb;C The total contribution from Georgia is equivalent to 18% of the total ppb >= 125 ppb in Memphis. CAMx modeling:C Georgia contributes at least 10 ppb to 31% of the 1-hr exceedences in Memphis; the maximum 1-
hr contribution from Georgia is 18 ppb;C Georgia contributes 5% of the total manmade ppb >= 125 ppb in Memphis;C The highest daily average 1-hr contribution from Georgia to Memphis is 17 ppb; which is 13% of
the average 1-hr ozone concentration >= 125 ppb in Memphis on that day.South Carolina’s Contribution to Memphis UAM-V zero-out modeling:C South Carolina contributes at least 2 ppb to 9% of the 1-hr exceedences in Memphis; the
maximum 1-hr contribution from South Carolina is 3 ppb;C The total contribution from South Carolina is equivalent to 7% of the total ppb >= 125 ppb in
Memphis. CAMx modeling:

C-19
C South Carolina contributes at least 5 ppb to 31% of the 1-hr exceedences in Memphis; themaximum 1-hr contribution from South Carolina is 7 ppb;
C South Carolina contributes 2% of the total manmade ppb >= 125 ppb in Memphis;C The highest daily average 1-hr contribution from South Carolina to Memphis is 6 ppb; which is 4%
of the average 1-hr ozone concentration >= 125 ppb in Memphis on that day.

C-20
States Not Making a Significant Contribution for the 1-Hr NAAQS
Philadelphia Nonattainment Area -- 1-Hr • Alabama, Georgia, Illinois, Massachusetts, Michigan, Missouri, South Carolina, Tennessee, and
Wisconsin have no contributions more than 2 ppb to 1-hr exceedences in Philadelphia in theUAM-V zero-out modeling and/or contribute 1% or less to the total manmade ppb >= 85 ppb inPhiladelphia in the CAMx modeling;
• Connecticut/Rhode Island and New York contribute less than 1% to the total manmade ppb >=125 ppb and have no contributions more than 2 ppb to 1-hr exceedences in Philadelphia in theCAMx modeling;
• Indiana contributes less than 2% to the 1-hr exceedences in the range of 2-5 ppb and contributesa maximum of 2 ppb or less in Philadelphia in the UAM-V zero-out modeling;
• Kentucky contributes less than 1% to the 1-hr exceedences in the range of 2-5 ppb in Philadelphiain the UAM-V zero-out modeling and contributes 1% or less to the total manmade ppb >= 125 ppbin Philadelphia in the CAMx modeling.
Pittsburgh Nonattainment Area -- 1-Hr • Alabama, Georgia, Illinois, Indiana,Kentucky, Massachusetts, Michigan,Missouri, South Carolina, Tennessee,Virginia, and Wisconsin have nocontributions more than 2 ppb to 1-hrexceedences in Pittsburgh in the UAM-Vzero-out modeling and/or contribute 1%or less to the total manmade ppb >= 125ppb in Pittsburgh in the CAMx modeling;
• Connecticut/Rhode Island, New York, New Jersey, and Maryland/D.C./Delaware have nocontributions more than 2 ppb to 1-hr exceedences in Pittsburgh in the CAMx modeling.
New York City Nonattainment Area -- 1-Hr • Alabama, Georgia, Massachusetts, Missouri,South Carolina, Tennessee, and Wisconsin haveno contributions more than 2 ppb to 1-hrexceedences in New York City in the UAM-Vzero-out modeling and/or contribute 1% or lessto the total manmade ppb >= 125 ppb in NewYork City in the CAMx modeling.
Greater Connecticut Nonattainment Area -- 1-Hr • Alabama, Georgia, Illinois, Indiana,Kentucky, Massachusetts, Michigan,Missouri, South Carolina, Tennessee,and Wisconsin have no contributionsmore than 2 ppb to 1-hr exceedences inGreater Connecticut in the UAM-V zero-out modeling and/or contribute 1% orless to the total manmade ppb >= 125ppb in Greater Connecticut in the CAMxmodeling;
• North Carolina contributes less than 1% to the 1-hr exceedences in the range of 2-5 ppb inGreater Connecticut in the UAM-V zero-out modeling and contribute 1% or less to the totalmanmade ppb >= 125 ppb in Greater Connecticut in the CAMx modeling.
Rhode Island Nonattainment Area -- 1-Hr • Alabama, Georgia, Illinois,Indiana, Kentucky,Massachusetts, Michigan,

C-21
Missouri, North Carolina, SouthCarolina, Tennessee, andWisconsin have no contributionsmore than 2 ppb to 1-hrexceedences in Rhode Island inthe UAM-V zero-out modelingand/or contribute 1% or less tothe total manmade ppb >= 125ppb in Rhode Island in theCAMx modeling.
Boston Nonattainment Area -- 1-Hr • Alabama, Georgia, Illinois, Indiana, Kentucky, Missouri,North Carolina, South Carolina, Tennessee, andWisconsin have no contributions more than 2 ppb to 1-hrexceedences in Boston in the UAM-V zero-out modelingand/or contribute 1% or less to the total manmade ppb>= 125 ppb in Boston in the CAMx modeling;
• Michigan contributes 1% or less to the 1-hr exceedences in the range of 2-5 ppb in Boston in theUAM-V zero-out modeling contribute 1% or less to the total manmade ppb >= 125 ppb in Bostonin the CAMx modeling;
• West Virginia contributes 1% or less to the population-weighted total ppb >= 125 ppb in Boston inthe UAM-V zero-out modeling and 1% or less to the total manmade ppb >= 125 ppb in Boston inthe CAMx modeling.
Western Massachusetts Nonattainment Area -- 1-Hr • Alabama, Georgia,Illinois, Indiana,Kentucky, Michigan,Missouri, NorthCarolina, Ohio, SouthCarolina, Tennessee,Virginia, and Wisconsinhave no contributionsmore than 2 ppb to 1-hrexceedences inWestern Massachusettsin the UAM-V zero-outmodeling and/orcontribute 1% or less tothe total manmade ppb>= 125 ppb in WesternMassachusetts in theCAMx modeling.
Portland, Maine Nonattainment Area -- 1-Hr • Alabama, Georgia,Illinois, Indiana,Kentucky, Michigan,Missouri, NorthCarolina, Ohio, SouthCarolina, Tennessee,Virginia, West Virginiaand Wisconsin have nocontributions more than2 ppb to 1-hrexceedences in

C-22
Portland, Maine in theUAM-V zero-outmodeling and/orcontribute 1% or less tothe total manmade ppb>= 125 ppb in Portland,Maine in the CAMxmodeling.
Washington, DC Nonattainment Area -- 1-Hr • Alabama, Georgia, Massachusetts, Missouri,South Carolina, Tennessee, and Wisconsin haveno contributions more than 2 ppb to 1-hrexceedences in Washington, DC in the UAM-Vzero-out modeling and/or contribute 1% or lessto the total manmade ppb >= 125 ppb inWashington, DC in the CAMx modeling;
• Connecticut/Rhode Island and New Jersey have no contributions more than 2 ppb to 1-hrexceedences and contribute 1% or less to the total manmade ppb >= 125 ppb in Washington, DCin the CAMx modeling;
• Illinois contributes less than 1% to the 1-hr exceedences in the range of 2-5 ppb in Washington,DC in the UAM-V zero-out modeling and contributes 1% or less to the total manmade ppb >= 125ppb in Washington, DC in the CAMx modeling;
• New York contributes 1% or less to the total manmade ppb >= 125 ppb and has 2 ppb or lesshighest daily average contribution to the ozone concentration >= 125 ppb in Washington, DC inthe CAMx modeling.
Baltimore Nonattainment Area -- 1-Hr • Georgia, North Carolina, South Carolina,Massachusetts, Missouri, and Wisconsin haveno contributions more than 2 ppb to 1-hrexceedences in Baltimore in the UAM-V zero-outmodeling and contribute 1% or less to the totalmanmade ppb >= 125 ppb in Baltimore in theCAMx modeling;
• Alabama and Tennessee contribute less than 1% to the 1-hr exceedences in the range of 2-5 ppbin Baltimore in the UAM-V zero-out modeling and contribute 1% or less to the total manmade ppb>= 125 ppb in Baltimore in the CAMx modeling;
• Connecticut/Rhode Island, New York, and New Jersey contribute less than 1% to the totalmanmade ppb >= 125 ppb and has 2 ppb or less highest daily average contribution to the ozoneconcentration >= 125 ppb in Baltimore in the CAMx modeling.
Atlanta Nonattainment Area -- 1-Hr • Indiana, Massachusetts, Michigan, Missouri, Ohio,Virginia West Virginia, and Wisconsin have nocontributions more than 2 ppb to 1-hr exceedences inAtlanta in the UAM-V zero-out modeling and/orcontribute 1% or less to the total manmade ppb >= 125ppb in Atlanta in the CAMx modeling;
• Connecticut/Rhode Island, Maryland/D.C./Delaware New York, New Jersey, and Pennsylvaniahave no contributions more than 2 ppb to 1-hr exceedences in Atlanta and contribute 1% or lessto the total manmade ppb >= 125 ppb in Atlanta in the CAMx modeling;
• Illinois contributes 1% or less to the 1-hr exceedences in the range of 2-5 ppb in Atlanta in theUAM-V zero-out modeling and contributes less than 1% to the total manmade ppb >= 125 ppb inAtlanta in the CAMx modeling.

C-23
Birmingham Nonattainment Area -- 1-Hr • Illinois, Indiana, Massachusetts,Michigan, Missouri, North Carolina,Ohio, Virginia, West Virginia, andWisconsin have no contributions morethan 2 ppb to 1-hr exceedences inBirmingham in the UAM-V zero-outmodeling and/or contribute 1% or less tothe total manmade ppb >= 125 ppb inBirmingham in the CAMx modeling;
• Connecticut/Rhode Island, Maryland/D.C./Delaware, New York, New Jersey, and Pennsylvaniahave no contributions more than 2 ppb to 1-hr exceedences in Birmingham in the CAMx modelingand contribute 1% or less to the total manmade ppb >= 125 ppb in Birmingham in the CAMxmodeling.
Memphis Nonattainment Area -- 1-Hr • Indiana, Kentucky, Massachusetts, Michigan, NorthCarolina, Ohio, Virginia, West Virginia, and Wisconsinhave no contributions more than 2 ppb to 1-hrexceedences in Memphis in the UAM-V zero-outmodeling and/or contribute less than 1% to the totalmanmade ppb >= 125 ppb in Memphis in the CAMxmodeling;
• Connecticut/Rhode Island, Maryland/D.C./Delaware, New York, New Jersey, and Pennsylvaniahave no contributions more than 2 ppb to 1-hr exceedences in Memphis in the CAMx modelingand contribute 1% or less to the total manmade ppb >= 125 ppb in Memphis in the CAMxmodeling;
• Illinois and Missouri contribute less than 1% to the total manmade ppb >= 125 ppb in Memphis inthe CAMx modeling.
Louisville Nonattainment Area -- 1-Hr • Alabama, Georgia, Illinois, Massachusetts,Michigan, Missouri, Ohio, West Virginia, andWisconsin have no contributions more than 2ppb to 1-hr exceedences in Louisville in theUAM-V zero-out modeling and/or contribute lessthan 1% to the total manmade ppb >= 125 ppb inMemphis in the CAMx modeling;
• Connecticut/Rhode Island, Maryland/D.C./Delaware, New York, New Jersey, and Pennsylvaniahave no contributions more than 2 ppb to 1-hr exceedences in Louisville in the CAMx modelingand contribute 1% or less to the total manmade ppb >= 125 ppb in Louisville in the CAMxmodeling;
• North Carolina, South Carolina, and Virginia each contributes only one value of the 1-hrexceedences in the range of 2-5 ppb in Louisville in the UAM-V zero-out modeling and has lessthan 5 ppb of the maximum 1-hr contributions to the ozone concentration >= 125 ppb in Louisvillein the CAMx modeling.
St. Louis Nonattainment Area -- 1-Hr •
Alabama,Georgia, NorthCarolina,SouthCarolin

C-24
a,Tennessee,Virginia,Michigan,Wisconsin,Indiana,Massachusetts,Ohio,andWestVirginiahave nocontributionsmorethan 2ppb to1-hrexceedencesin St.Louis intheUAM-Vzero-outmodelingand/orcontribute lessthan1% tothe totalmanmade ppb>= 125ppb inSt.Louis intheCAMxmodeling;
• Connecticut/Rhode Island, Maryland/D.C./Delaware, New York, New Jersey, and Pennsylvaniahave no contributions more than 2 ppb to 1-hr exceedences in St. Louis in the CAMx modelingand contribute 1% or less to the total manmade ppb >= 125 ppb in St. Louis in the CAMxmodeling.
Cincinnati Nonattainment Area -- 1-Hr • Alabama, Georgia, Illinois, Massachusetts,

C-25
Michigan, Missouri, South Carolina, WestVirginia, and Wisconsin have no contributionsmore than 2 ppb to 1-hr exceedences inCincinnati in the UAM-V zero-out modelingand/or contribute less than 1% to the totalmanmade ppb >= 125 ppb in Cincinnati in theCAMx modeling;
• Connecticut/Rhode Island, Maryland/D.C./Delaware, New York, New Jersey, and Pennsylvaniahave no contributions more than 2 ppb to 1-hr exceedences in Cincinnati in the CAMx modelingand contribute 1% or less to the total manmade ppb >= 125 ppb in Cincinnati in the CAMxmodeling;
• Virginia has no contributions more than 5 ppb to 1-hr exceedences in Cincinnati in the CAMxmodeling and contributes 3% or less to the highest daily average contribution to the ozoneconcentration >= 125 ppb in Cincinnati in the CAMx modeling.
Southwestern Michigan Nonattainment Area -- 1-Hr • Alabama, Georgia, Kentucky,Massachusetts, North Carolina, Ohio,South Carolina, Tennessee, Virginia,West Virginia, and Wisconsin have nocontributions more than 2 ppb to 1-hrexceedences in Southwestern Michiganin the UAM-V zero-out modeling and/orcontribute less than 1% to the totalmanmade ppb >= 125 ppb inSouthwestern Michigan in the CAMxmodeling;
• Connecticut/Rhode Island, Maryland/D.C./Delaware, New York, New Jersey, and Pennsylvaniahave no contributions more than 2 ppb to 1-hr exceedences in Southwestern Michigan in theCAMx modeling and contribute 1% or less to the total manmade ppb >= 125 ppb in SouthwesternMichigan in the CAMx modeling.
Chicago-Milwaukee Nonattainment Area -- 1-Hr • Alabama, Georgia, Kentucky, Michigan,Massachusetts, North Carolina, Ohio,South Carolina, Tennessee, Virginia,and West Virginia have no contributionsmore than 2 ppb to 1-hr exceedences inChicago-Milwaukee in the UAM-V zero-out modeling and/or contribute less than1% to the total manmade ppb >= 125ppb in Chicago-Milwaukee in the CAMxmodeling;
• Connecticut/Rhode Island, Maryland/D.C./Delaware, New York, New Jersey, and Pennsylvaniahave no contributions more than 2 ppb to 1-hr exceedences in Chicago-Milwaukee in the CAMxmodeling and contribute 1% or less to the total manmade ppb >= 125 ppb in Chicago-Milwaukeein the CAMx modeling.
Lake Michigan Nonattainment Area -- 1-Hr • North Carolina, South Carolina, Michigan,Massachusetts, Ohio, Virginia, and West Virginiahave no contributions more than 2 ppb to 1-hrexceedences in Lake Michigan in the UAM-Vzero-out modeling and/or contribute less than1% to the total manmade ppb >= 125 ppb inLake Michigan in the CAMx modeling;
• Connecticut/Rhode Island, Maryland/D.C./Delaware, New York, New Jersey, and Pennsylvania

C-26
have no contributions more than 2 ppb to 1-hr exceedences in Lake Michigan in the CAMxmodeling and contribute 1% or less to the total manmade ppb >= 125 ppb in Lake Michigan in theCAMx modeling;
C Georgia contributes less than 1% to the 1-hr exceedences in the range of 2-5 ppb in LakeMichigan in the UAM-V zero-out modeling and contribute 1% or less to the total manmade ppb >=125 ppb in Lake Michigan in the CAMx modeling.

APPENDIX D8-HOUR UPWIND/DOWNWIND LINKAGES1
_______________________________1. Note that the Metric 2 data on the maximum "ppb" contributions are rounded to thenearest "ppb" in the presentation of contributions in this Appendix.

D-1
States which Contribute Significantly to 8-hr Nonattainment
-- AlabamaGeorgia’s Contribution to Alabama: UAM-V zero-out modeling (8-Hr daily maximum):C Georgia contributes at least 10 ppb to 27% of the 8-hr exceedences in Alabama; the maximum 8-
hr contribution from Georgia is 65 ppb;C The total contribution from Georgia is equivalent to 23% of the total ppb >= 85 ppb in Alabama. CAMx modeling:C Georgia contributes at least 10 ppb to 28% of the 8-hr exceedences in Alabama; the maximum 8-
hr contribution from Georgia is 71 ppb;C Georgia contributes 10% of the total manmade ppb >= 85 ppb in Alabama;C The highest daily average 8-hr contribution from Georgia to Alabama is 30 ppb; which is 31% of
the average 8-hr ozone concentration >= 85 ppb in Alabama on that day.Illinois’s Contribution to Alabama: UAM-V zero-out modeling:C Illinois contributes at least 2 ppb to 3% of the 8-hr exceedences in Alabama; the maximum 8-hr
contribution from Illinois is 5 ppb. CAMx modeling:C Illinois contributes at least 2 ppb to 5% of the 8-hr exceedences in Alabama; the maximum 8-hr
contribution from Illinois is 9 ppb;C The highest daily average 8-hr contribution from Illinois to Alabama is 5 ppb; which is 5% of the
average 8-hr ozone concentration >= 85 ppb in Alabama on that day.Kentucky’s Contribution to Alabama: UAM-V zero-out modeling:C Kentucky contributes at least 2 ppb to 11% of the 8-hr exceedences in Alabama; the maximum 8-
hr contribution from Kentucky is 5 ppb;C The total contribution from Kentucky is equivalent to 3% of the total ppb >= 85 ppb in Alabama. CAMx modeling:C Kentucky contributes at least 5 ppb to 11% of the 8-hr exceedences in Alabama; the maximum 8-
hr contribution from Kentucky is 10 ppb;C Kentucky contributes 2% of the total manmade ppb >= 85 ppb in Alabama;C The highest daily average 8-hr contribution from Kentucky to Alabama is 5 ppb; which is 5% of the
average 8-hr ozone concentration >= 85 ppb in Alabama on that day.North Carolina’s Contribution to Alabama: UAM-V zero-out modeling:C North Carolina contributes at least 2 ppb to 5% of the 8-hr exceedences in Alabama; the
maximum 8-hr contribution from North Carolina is 8 ppb;C The total contribution from North Carolina is equivalent to 2% of the total ppb >= 85 ppb in
Alabama. CAMx modeling:C North Carolina contributes at least 5 ppb to 6% of the 8-hr exceedences in Alabama; the
maximum 8-hr contribution from North Carolina is 14 ppb;C The highest daily average 8-hr contribution from North Carolina to Alabama is 5 ppb; which is 5%
of the average 8-hr ozone concentration >= 85 ppb in Alabama on that day.South Carolina’s Contribution to Alabama: UAM-V zero-out modeling:C South Carolina contributes at least 5 ppb to 12% of the 8-hr exceedences in Alabama; the
maximum 8-hr contribution from South Carolina is 22 ppb;C The total contribution from South Carolina is equivalent to 8% of the total ppb >= 85 ppb in
Alabama. CAMx modeling:C South Carolina contributes at least 5 ppb to 16% of the 8-hr exceedences in Alabama; the
maximum 8-hr contribution from South Carolina is 29 ppb;

D-2
C South Carolina contributes 3% of the total manmade ppb >= 85 ppb in Alabama;C The highest daily average 8-hr contribution from South Carolina to Alabama is 15 ppb; which is
15% of the average 8-hr ozone concentration >= 85 ppb in Alabama on that day.Tennessee’s Contribution to Alabama: UAM-V zero-out modeling:C Tennessee contributes at least 5 ppb to 25% of the 8-hr exceedences in Alabama; the maximum
8-hr contribution from Tennessee is 28 ppb;C The total contribution from Tennessee is equivalent to 13% of the total ppb >= 85 ppb in Alabama. CAMx modeling:C Tennessee contributes at least 10 ppb to 21% of the 8-hr exceedences in Alabama; the maximum
8-hr contribution from Tennessee is 39 ppb;C Tennessee contributes 7% of the total manmade ppb >= 85 ppb in Alabama;C The highest daily average 8-hr contribution from Tennessee to Alabama is 14 ppb; which is 13%
of the average 8-hr ozone concentration >= 85 ppb in Alabama on that day. -- ConnecticutIllinois’s Contribution to Connecticut: UAM-V zero-out modeling:C Illinois contributes at least 2 ppb to 3% of the 8-hr exceedences in Connecticut; the maximum 8-hr
contribution from Illinois is 4 ppb;C The total contribution from Illinois is equivalent to 2% of the total ppb >= 85 ppb in Connecticut. CAMx modeling:C Illinois contributes at least 5 ppb to 5% of the 8-hr exceedences in Connecticut; the maximum 8-hr
contribution from Illinois is 9 ppb;C Illinois contributes 3% of the total manmade ppb >= 85 ppb in Connecticut in one episode;C The highest daily average 8-hr contribution from Illinois to Connecticut is 6 ppb; which is 5% of the
average 8-hr ozone concentration >= 85 ppb in Connecticut on that day.Maryland/DC/Delaware’s Contribution to Connecticut: CAMx modeling:C Maryland/DC/Delaware contribute at least 5 ppb to 46% of the 8-hr exceedences in Connecticut;
the maximum 8-hr contribution from Maryland/DC/Delaware is 18 ppb;C Maryland/DC/Delaware contribute 6% of the total manmade ppb >= 85 ppb in Connecticut;C The highest daily average 8-hr contribution from Maryland/DC/Delaware to Connecticut is 9 ppb;
which is 10% of the average 8-hr ozone concentration >= 85 ppb in Connecticut on that day.Michigan’s Contribution to Connecticut: UAM-V zero-out modeling:C Michigan contributes at least 2 ppb to 4% of the 8-hr exceedences in Connecticut; the maximum
8-hr contribution from Michigan is 4 ppb;C The total contribution from Michigan is equivalent to 2% of the total ppb >= 85 ppb in Connecticut. CAMx modeling:C Michigan contributes at least 2 ppb to 30% of the 8-hr exceedences in Connecticut; the maximum
8-hr contribution from Michigan is 7 ppb;C Michigan contributes 2% of the total manmade ppb >= 85 ppb in Connecticut;C The highest daily average 8-hr contribution from Michigan to Connecticut is 4 ppb; which is 5% of
the average 8-hr ozone concentration >= 85 ppb in Connecticut on that day.New Jersey’s Contribution to Connecticut: CAMx modeling:C New Jersey contributes at least 10 ppb to 81% of the 8-hr exceedences in Connecticut; the
maximum 8-hr contribution from New Jersey is 54 ppb;C New Jersey contributes 23% of the total manmade ppb >= 85 ppb in Connecticut;C The highest daily average 8-hr contribution from New Jersey to Connecticut is 30 ppb; which is
29% of the average 8-hr ozone concentration >= 85 ppb in Connecticut on that day.New York’s Contribution to Connecticut: CAMx modeling:C New York contributes at least 10 ppb to 88% of the 8-hr exceedences in Connecticut; the

D-3
maximum 8-hr contribution from New York is 51 ppb;C New York contributes 24% of the total manmade ppb >= 85 ppb in Connecticut;C The highest daily average 8-hr contribution from New York to Connecticut is 39 ppb; which is 45%
of the average 8-hr ozone concentration >= 85 ppb in Connecticut on that day.North Carolina’s Contribution to Connecticut: UAM-V zero-out modeling:C North Carolina contributes at least 2 ppb to 3% of the 8-hr exceedences in Connecticut; the
maximum 8-hr contribution from North Carolina is 4 ppb;C The total contribution from North Carolina is equivalent to 2% of the total ppb >= 85 ppb in
Connecticut. CAMx modeling:C North Carolina contributes at least 5 ppb to 8% of the 8-hr exceedences in Connecticut; the
maximum 8-hr contribution from North Carolina is 13 ppb;C North Carolina contributes 2% of the total manmade ppb >= 85 ppb in Connecticut;C The highest daily average 8-hr contribution from North Carolina to Connecticut is 6 ppb; which is
6% of the average 8-hr ozone concentration >= 85 ppb in Connecticut on that day.Ohio’s Contribution to Connecticut: UAM-V zero-out modeling:C Ohio contributes at least 2 ppb to 21% of the 8-hr exceedences in Connecticut; the maximum 8-hr
contribution from Ohio is 7 ppb;C The total contribution from Ohio is equivalent to 5% of the total ppb >= 85 ppb in Connecticut. CAMx modeling:C Ohio contributes at least 5 ppb to 21% of the 8-hr exceedences in Connecticut; the maximum 8-hr
contribution from Ohio is 15 ppb;C Ohio contributes 3% of the total manmade ppb >= 85 ppb in Connecticut;C The highest daily average 8-hr contribution from Ohio to Connecticut is 9 ppb; which is 9% of the
average 8-hr ozone concentration >= 85 ppb in Connecticut on that day.Pennsylvania’s Contribution to Connecticut: CAMx modeling:C Pennsylvania contributes at least 10 ppb to 56% of the 8-hr exceedences in Connecticut; the
maximum 8-hr contribution from Pennsylvania is 38 ppb;C Pennsylvania contributes 14% of the total manmade ppb >= 85 ppb in Connecticut;C The highest daily average 8-hr contribution from Pennsylvania to Connecticut is 28 ppb; which is
29% of the average 8-hr ozone concentration >= 85 ppb in Connecticut on that day.Virginia’s Contribution to Connecticut: UAM-V zero-out modeling:C Virginia contributes at least 2 ppb to 24% of the 8-hr exceedences in Connecticut; the maximum
8-hr contribution from Virginia is 9 ppb;C The total contribution from Virginia is equivalent to 6% of the total ppb >= 85 ppb in Connecticut. CAMx modeling:C Virginia contributes at least 5 ppb to 28% of the 8-hr exceedences in Connecticut; the maximum
8-hr contribution from Virginia is 21 ppb;C Virginia contributes 4% of the total manmade ppb >= 85 ppb in Connecticut;C The highest daily average 8-hr contribution from Virginia to Connecticut is 9 ppb; which is 9% of
the average 8-hr ozone concentration >= 85 ppb in Connecticut on that day.West Virginia’s Contribution to Connecticut: UAM-V zero-out modeling:C West Virginia contributes at least 2 ppb to 22% of the 8-hr exceedences in Connecticut; the
maximum 8-hr contribution from West Virginia is 7 ppb;C The total contribution from West Virginia is equivalent to 5% of the total ppb >= 85 ppb in
Connecticut. CAMx modeling:C West Virginia contributes at least 5 ppb to 16% of the 8-hr exceedences in Connecticut; the
maximum 8-hr contribution from West Virginia is 12 ppb;

D-4
C West Virginia contributes 2% of the total manmade ppb >= 85 ppb in Connecticut;C The highest daily average 8-hr contribution from West Virginia to Connecticut is 7 ppb; which is
7% of the average 8-hr ozone concentration >= 85 ppb in Connecticut on that day.-- District of ColumbiaIllinois’s Contribution to DC: UAM-V zero-out modeling:C Illinois contributes at least 2 ppb to 9% of the 8-hr exceedences in DC; the maximum 8-hr
contribution from Illinois is 3 ppb;C The total contribution from Illinois is equivalent to 3% of the total ppb >= 85 ppb in DC. CAMx modeling:C Illinois contributes at least 2 ppb to 39% of the 8-hr exceedences in DC; the maximum 8-hr
contribution from Illinois is 6 ppb;C Illinois contributes 2% of the total manmade ppb >= 85 ppb in DC;C The highest daily average 8-hr contribution from Illinois to DC is 5 ppb; which is 6% of the average
8-hr ozone concentration >= 85 ppb in DC on that day.Kentucky’s Contribution to DC: UAM-V zero-out modeling:C Kentucky contributes at least 2 ppb to 27% of the 8-hr exceedences in DC; the maximum 8-hr
contribution from Kentucky is 4 ppb;C The total contribution from Kentucky is equivalent to 6% of the total ppb >= 85 ppb in DC. CAMx modeling:C Kentucky contributes at least 5 ppb to 24% of the 8-hr exceedences in DC; the maximum 8-hr
contribution from Kentucky is 9 ppb;C Kentucky contributes 3% of the total manmade ppb >= 85 ppb in DC;C The highest daily average 8-hr contribution from Kentucky to DC is 8 ppb; which is 9% of the
average 8-hr ozone concentration >= 85 ppb in DC on that day.Michigan’s Contribution to DC: UAM-V zero-out modeling:C Michigan contributes at least 2 ppb to 18% of the 8-hr exceedences in DC; the maximum 8-hr
contribution from Michigan is 3 ppb;C The total contribution from Michigan is equivalent to 3% of the total ppb >= 85 ppb in DC. CAMx modeling:C Michigan contributes at least 2 ppb to 30% of the 8-hr exceedences in DC; the maximum 8-hr
contribution from Michigan is 7 ppb;C Michigan contributes 2% of the total manmade ppb >= 85 ppb in DC;C The highest daily average 8-hr contribution from Michigan to DC is 7 ppb; which is 8% of the
average 8-hr ozone concentration >= 85 ppb in DC on that day.Ohio’s Contribution to DC: UAM-V zero-out modeling:C Ohio contributes at least 2 ppb to 45% of the 8-hr exceedences in DC; the maximum 8-hr
contribution from Ohio is 5 ppb;C The total contribution from Ohio is equivalent to 11% of the total ppb >= 85 ppb in DC. CAMx modeling:C Ohio contributes at least 5 ppb to 46% of the 8-hr exceedences in DC; the maximum 8-hr
contribution from Ohio is 10 ppb;C Ohio contributes 5% of the total manmade ppb >= 85 ppb in DC;C The highest daily average 8-hr contribution from Ohio to DC is 10 ppb; which is 12% of the
average 8-hr ozone concentration >= 85 ppb in DC on that day.Pennsylvania’s Contribution to DC: CAMx modeling:C Pennsylvania contributes at least 10 ppb to 55% of the 8-hr exceedences in DC; the maximum 8-
hr contribution from Pennsylvania is 14 ppb;C Pennsylvania contributes 6% of the total manmade ppb >= 85 ppb in DC;C The highest daily average 8-hr contribution from Pennsylvania to DC is 10 ppb; which is 11% of

D-5
the average 8-hr ozone concentration >= 85 ppb in DC on that day.Tennessee’s Contribution to DC: UAM-V zero-out modeling:C Tennessee contributes at least 2 ppb to 9% of the 8-hr exceedences in DC; the maximum 8-hr
contribution from Tennessee is 2 ppb;C The total contribution from Tennessee is equivalent to 3% of the total ppb >= 85 ppb in DC. CAMx modeling:C Tennessee contributes at least 2 ppb to 34% of the 8-hr exceedences in DC; the maximum 8-hr
contribution from Tennessee is 7 ppb;C Tennessee contributes 2% of the total manmade ppb >= 85 ppb in DC;C The highest daily average 8-hr contribution from Tennessee to DC is 7 ppb; which is 7% of the
average 8-hr ozone concentration >= 85 ppb in DC on that day.Virginia’s Contribution to DC: UAM-V zero-out modeling:C Virginia contributes at least 10 ppb to 73% of the 8-hr exceedences in DC; the maximum 8-hr
contribution from Virginia is 54 ppb;C The total contribution from Virginia is equivalent to 59% of the total ppb >= 85 ppb in DC. CAMx modeling:C Virginia contributes at least 10 ppb to 100% of the 8-hr exceedences in DC; the maximum 8-hr
contribution from West Virginia is 88 ppb;C Virginia contributes 47% of the total manmade ppb >= 85 ppb in DC;C The highest daily average 8-hr contribution from Virginia to DC is 60 ppb; which is 62% of the
average 8-hr ozone concentration >= 85 ppb in DC on that day.West Virginia’s Contribution to DC: UAM-V zero-out modeling:C West Virginia contributes at least 5 ppb to 45% of the 8-hr exceedences in DC; the maximum 8-hr
contribution from West Virginia is 18 ppb;C The total contribution from West Virginia is equivalent to 20% of the total ppb >= 85 ppb in DC. CAMx modeling:C West Virginia contributes at least 5 ppb to 41% of the 8-hr exceedences in DC; the maximum 8-hr
contribution from West Virginia is 23 ppb;C West Virginia contributes 6% of the total manmade ppb >= 85 ppb in DC;C The highest daily average 8-hr contribution from West Virginia to DC is 21 ppb; which is 23% of
the average 8-hr ozone concentration >= 85 ppb in DC on that day.-- DelawareIllinois’s Contribution to Delaware: UAM-V zero-out modeling:C Illinois contributes at least 2 ppb to 6% of the 8-hr exceedences in Delaware; the maximum 8-hr
contribution from Illinois is 3 ppb;C The total contribution from Illinois is equivalent to 6% of the total ppb >= 85 ppb in Delaware. CAMx modeling:C Illinois contributes at least 2 ppb to 47% of the 8-hr exceedences in Delaware; the maximum 8-hr
contribution from Illinois is 7 ppb;C Illinois contributes 2% of the total manmade ppb >= 85 ppb in Delaware;C The highest daily average 8-hr contribution from Illinois to Delaware is 5 ppb; which is 5% of the
average 8-hr ozone concentration >= 85 ppb in Delaware on that day.Indiana’s Contribution to Delaware: UAM-V zero-out modeling:C Indiana contributes at least 2 ppb to 9% of the 8-hr exceedences in Delaware; the maximum 8-hr
contribution from Indiana is 3 ppb;C The total contribution from Indiana is equivalent to 7% of the total ppb >= 85 ppb in Delaware. CAMx modeling:C Indiana contributes at least 2 ppb to 39% of the 8-hr exceedences in Delaware; the maximum 8-hr
contribution from Indiana is 6 ppb;

D-6
C Indiana contributes 3% of the total manmade ppb >= 85 ppb in Delaware;C The highest daily average 8-hr contribution from Indiana to Delaware is 5 ppb; which is 5% of the
average 8-hr ozone concentration >= 85 ppb in Delaware on that day.Kentucky’s Contribution to Delaware: UAM-V zero-out modeling:C Kentucky contributes at least 2 ppb to 12% of the 8-hr exceedences in Delaware; the maximum 8-
hr contribution from Kentucky is 4 ppb;C The total contribution from Kentucky is equivalent to 7% of the total ppb >= 85 ppb in Delaware. CAMx modeling:C Kentucky contributes at least 5 ppb to 17% of the 8-hr exceedences in Delaware; the maximum 8-
hr contribution from Kentucky is 9 ppb;C Kentucky contributes 3% of the total manmade ppb >= 85 ppb in Delaware;C The highest daily average 8-hr contribution from Kentucky to Delaware is 7 ppb; which is 7% of
the average 8-hr ozone concentration >= 85 ppb in Delaware on that day.Michigan’s Contribution to Delaware: UAM-V zero-out modeling:C Michigan contributes at least 2 ppb to 11% of the 8-hr exceedences in Delaware; the maximum 8-
hr contribution from Michigan is 7 ppb;C The total contribution from Michigan is equivalent to 5% of the total ppb >= 85 ppb in Delaware. CAMx modeling:C Michigan contributes at least 2 ppb to 41% of the 8-hr exceedences in Delaware; the maximum 8-
hr contribution from Michigan is 9 ppb;C Michigan contributes 2% of the total manmade ppb >= 85 ppb in Delaware;C The highest daily average 8-hr contribution from Michigan to Delaware is 7 ppb; which is 7% of
the average 8-hr ozone concentration >= 85 ppb in Delaware on that day.North Carolina’s Contribution to Delaware: UAM-V zero-out modeling:C North Carolina contributes at least 5 ppb to 7% of the 8-hr exceedences in Delaware; the
maximum 8-hr contribution from North Carolina is 22 ppb;C The total contribution from North Carolina is equivalent to 8% of the total ppb >= 85 ppb in
Delaware. CAMx modeling:C North Carolina contributes at least 5 ppb to 18% of the 8-hr exceedences in Delaware; the
maximum 8-hr contribution from North Carolina is 28 ppb;C North Carolina contributes 4% of the total manmade ppb >= 85 ppb in Delaware;C The highest daily average 8-hr contribution from North Carolina to Delaware is 18 ppb; which is
19% of the average 8-hr ozone concentration >= 85 ppb in Delaware on that day.Ohio’s Contribution to Delaware: UAM-V zero-out modeling:C Ohio contributes at least 2 ppb to 51% of the 8-hr exceedences in Delaware; the maximum 8-hr
contribution from Ohio is 6 ppb;C The total contribution from Ohio is equivalent to 19% of the total ppb >= 85 ppb in Delaware. CAMx modeling:C Ohio contributes at least 5 ppb to 48% of the 8-hr exceedences in Delaware; the maximum 8-hr
contribution from Ohio is 14 ppb;C Ohio contributes 6% of the total manmade ppb >= 85 ppb in Delaware;C The highest daily average 8-hr contribution from Ohio to Delaware is 9 ppb; which is 10% of the
average 8-hr ozone concentration >= 85 ppb in Delaware on that day.Pennsylvania’s Contribution to Delaware: CAMx modeling:C Pennsylvania contributes at least 10 ppb to 17% of the 8-hr exceedences in Delaware; the
maximum 8-hr contribution from Pennsylvania is 32 ppb;C Pennsylvania contributes 7% of the total manmade ppb >= 85 ppb in Delaware;C The highest daily average 8-hr contribution from Pennsylvania to Delaware is 20 ppb; which is

D-7
23% of the average 8-hr ozone concentration >= 85 ppb in Delaware on that day.Tennessee’s Contribution to Delaware: UAM-V zero-out modeling:C Tennessee contributes at least 2 ppb to 6% of the 8-hr exceedences in Delaware; the maximum
8-hr contribution from Tennessee is 3 ppb;C The total contribution from Tennessee is equivalent to 4% of the total ppb >= 85 ppb in Delaware. CAMx modeling:C Tennessee contributes at least 2 ppb to 33% of the 8-hr exceedences in Delaware; the maximum
8-hr contribution from Tennessee is 7 ppb;C Tennessee contributes 2% of the total manmade ppb >= 85 ppb in Delaware;C The highest daily average 8-hr contribution from Tennessee to Delaware is 6 ppb; which is 6% of
the average 8-hr ozone concentration >= 85 ppb in Delaware on that day.Virginia’s Contribution to Delaware: UAM-V zero-out modeling:C Virginia contributes at least 10 ppb to 40% of the 8-hr exceedences in Delaware; the maximum 8-
hr contribution from Virginia is 34 ppb;C The total contribution from Virginia is equivalent to 60% of the total ppb >= 85 ppb in Delaware. CAMx modeling:C Virginia contributes at least 10 ppb to 76% of the 8-hr exceedences in Delaware; the maximum 8-
hr contribution from Virginia is 60 ppb;C Virginia contributes 23% of the total manmade ppb >= 85 ppb in Delaware;C The highest daily average 8-hr contribution from Virginia to Delaware is 35 ppb; which is 37% of
the average 8-hr ozone concentration >= 85 ppb in Delaware on that day.West Virginia’s Contribution to Delaware: UAM-V zero-out modeling:C West Virginia contributes at least 5 ppb to 35% of the 8-hr exceedences in Delaware; the
maximum 8-hr contribution from West Virginia is 15 ppb;C The total contribution from West Virginia is equivalent to 33% of the total ppb >= 85 ppb in
Delaware. CAMx modeling:C West Virginia contributes at least 5 ppb to 45% of the 8-hr exceedences in Delaware; the
maximum 8-hr contribution from West Virginia is 17 ppb;C West Virginia contributes 6% of the total manmade ppb >= 85 ppb in Delaware;C The highest daily average 8-hr contribution from West Virginia to Delaware is 12 ppb; which is
12% of the average 8-hr ozone concentration >= 85 ppb in Delaware on that day.-- GeorgiaAlabama’s Contribution to Georgia: UAM-V zero-out modeling:C Alabama contributes at least 5 ppb to 33% of the 8-hr exceedences in Georgia; the maximum 8-hr
contribution from Alabama is 33 ppb;C The total contribution from Alabama is equivalent to 15% of the total ppb >= 85 ppb in Georgia. CAMx modeling:C Alabama contributes at least 10 ppb to 44% of the 8-hr exceedences in Georgia; the maximum 8-
hr contribution from Alabama is 44 ppb;C Alabama contributes 11% of the total manmade ppb >= 85 ppb in Georgia;C The highest daily average 8-hr contribution from Alabama to Georgia is 27 ppb; which is 26% of
the average 8-hr ozone concentration >= 85 ppb in Georgia on that day.Kentucky’s Contribution to Georgia: UAM-V zero-out modeling:C Kentucky contributes at least 5 ppb to 5% of the 8-hr exceedences in Georgia; the maximum 8-hr
contribution from Kentucky is 15 ppb;C The total contribution from Kentucky is equivalent to 3% of the total ppb >= 85 ppb in Georgia. CAMx modeling:C Kentucky contributes at least 2 ppb to 17% of the 8-hr exceedences in Georgia; the maximum 8-hr

D-8
contribution from Kentucky is 14 ppb;C The highest daily average 8-hr contribution from Kentucky to Georgia is 9 ppb; which is 9% of the
average 8-hr ozone concentration >= 85 ppb in Georgia on that day.North Carolina’s Contribution to Georgia: UAM-V zero-out modeling:C North Carolina contributes at least 5 ppb to 2% of the 8-hr exceedences in Georgia; the maximum
8-hr contribution from North Carolina is 7 ppb;C The total contribution from North Carolina is equivalent to 2% of the total ppb >= 85 ppb in
Georgia. CAMx modeling:C North Carolina contributes at least 5 ppb to 8% of the 8-hr exceedences in Georgia; the maximum
8-hr contribution from North Carolina is 15 ppb;C The highest daily average 8-hr contribution from North Carolina to Georgia is 7 ppb; which is 8%
of the average 8-hr ozone concentration >= 85 ppb in Georgia on that day.South Carolina’s Contribution to Georgia: UAM-V zero-out modeling:C South Carolina contributes at least 10 ppb to 13% of the 8-hr exceedences in Georgia; the
maximum 8-hr contribution from South Carolina is 41 ppb;C The total contribution from South Carolina is equivalent to 8% of the total ppb >= 85 ppb in
Georgia. CAMx modeling:C South Carolina contributes at least 5 ppb to 20% of the 8-hr exceedences in Georgia; the
maximum 8-hr contribution from South Carolina is 47 ppb;C South Carolina contributes 4% of the total manmade ppb >= 85 ppb in Georgia;C The highest daily average 8-hr contribution from South Carolina to Georgia is 24 ppb; which is
26% of the average 8-hr ozone concentration >= 85 ppb in Georgia on that day.Tennessee’s Contribution to Georgia: UAM-V zero-out modeling:C Tennessee contributes at least 5 ppb to 18% of the 8-hr exceedences in Georgia; the maximum 8-
hr contribution from Tennessee is 15 ppb;C The total contribution from Tennessee is equivalent to 9% of the total ppb >= 85 ppb in Georgia. CAMx modeling:C Tennessee contributes at least 5 ppb to 38% of the 8-hr exceedences in Georgia; the maximum 8-
hr contribution from Tennessee is 28 ppb;C Tennessee contributes 6% of the total manmade ppb >= 85 ppb in Georgia;C The highest daily average 8-hr contribution from Tennessee to Georgia is 18 ppb; which is 19% of
the average 8-hr ozone concentration >= 85 ppb in Georgia on that day.-- IllinoisAlabama’s Contribution to Illinois: UAM-V zero-out modeling:C Alabama contributes at least 2 ppb to 10% of the 8-hr exceedences in Illinois; the maximum 8-hr
contribution from Alabama is 5 ppb;C The total contribution from Alabama is equivalent to 4% of the total ppb >= 85 ppb in Illinois. CAMx modeling:C Alabama contributes at least 5 ppb to 21% of the 8-hr exceedences in Illinois; the maximum 8-hr
contribution from Alabama is 16 ppb;C Alabama contributes 4% of the total manmade ppb >= 85 ppb in Illinois;C The highest daily average 8-hr contribution from Alabama to Illinois is 8 ppb; which is 9% of the
average 8-hr ozone concentration >= 85 ppb in Illinois on that day.Georgia’s Contribution to Illinois: UAM-V zero-out modeling:C Georgia contributes at least 2 ppb to 8% of the 8-hr exceedences in Illinois; the maximum 8-hr
contribution from Georgia is 3 ppb;C The total contribution from Georgia is equivalent to 4% of the total ppb >= 85 ppb in Illinois.

D-9
CAMx modeling:C Georgia contributes at least 5 ppb to 13% of the 8-hr exceedences in Illinois; the maximum 8-hr
contribution from Georgia is 11 ppb;C Georgia contributes 3% of the total manmade ppb >= 85 ppb in Illinois;C The highest daily average 8-hr contribution from Georgia to Illinois is 6 ppb; which is 6% of the
average 8-hr ozone concentration >= 85 ppb in Illinois on that day.Indiana’s Contribution to Illinois: UAM-V zero-out modeling:C Indiana contributes at least 5 ppb to 9% of the 8-hr exceedences in Illinois; the maximum 8-hr
contribution from Indiana is 31 ppb;C The total contribution from Indiana is equivalent to 7% of the total ppb >= 85 ppb in Illinois. CAMx modeling:C Indiana contributes at least 5 ppb to 7% of the 8-hr exceedences in Illinois; the maximum 8-hr
contribution from Indiana is 15 ppb;C Indiana contributes 2% of the total manmade ppb >= 85 ppb in Illinois;C The highest daily average 8-hr contribution from Indiana to Illinois is 13 ppb; which is 15% of the
average 8-hr ozone concentration >= 85 ppb in Illinois on that day.Kentucky’s Contribution to Illinois: UAM-V zero-out modeling:C Kentucky contributes at least 5 ppb to 8% of the 8-hr exceedences in Illinois; the maximum 8-hr
contribution from Kentucky is 8 ppb;C The total contribution from Kentucky is equivalent to 7% of the total ppb >= 85 ppb in Illinois. CAMx modeling:C Kentucky contributes at least 5 ppb to 12% of the 8-hr exceedences in Illinois; the maximum 8-hr
contribution from Kentucky is 16 ppb;C Kentucky contributes 3% of the total manmade ppb >= 85 ppb in Illinois;C The highest daily average 8-hr contribution from Kentucky to Illinois is 8 ppb; which is 9% of the
average 8-hr ozone concentration >= 85 ppb in Illinois on that day.Missouri’s Contribution to Illinois: UAM-V zero-out modeling:C Missouri contributes at least 10 ppb to 52% of the 8-hr exceedences in Illinois; the maximum 8-hr
contribution from Missouri is 71 ppb;C The total contribution from Missouri is equivalent to 66% of the total ppb >= 85 ppb in Illinois. CAMx modeling:C Missouri contributes at least 10 ppb to 76% of the 8-hr exceedences in Illinois; the maximum 8-hr
contribution from Missouri is 73 ppb;C Missouri contributes 38% of the total manmade ppb >= 85 ppb in Illinois;C The highest daily average 8-hr contribution from Missouri to Illinois is 60 ppb; which is 62% of the
average 8-hr ozone concentration >= 85 ppb in Illinois on that day.Tennessee’s Contribution to Illinois: UAM-V zero-out modeling:C Tennessee contributes at least 2 ppb to 14% of the 8-hr exceedences in Illinois; the maximum 8-
hr contribution from Tennessee is 24 ppb;C The total contribution from Tennessee is equivalent to 7% of the total ppb >= 85 ppb in Illinois. CAMx modeling:C Tennessee contributes at least 5 ppb to 29% of the 8-hr exceedences in Illinois; the maximum 8-
hr contribution from Tennessee is 29 ppb;C Tennessee contributes 7% of the total manmade ppb >= 85 ppb in Illinois;C The highest daily average 8-hr contribution from Tennessee to Illinois is 25 ppb; which is 27% of
the average 8-hr ozone concentration >= 85 ppb in Illinois on that day.-- IndianaAlabama’s Contribution to Indiana: UAM-V zero-out modeling:C Alabama contributes at least 2 ppb to 15% of the 8-hr exceedences in Indiana; the maximum 8-hr

D-10
contribution from Alabama is 11 ppb;C The total contribution from Alabama is equivalent to 8% of the total ppb >= 85 ppb in Indiana. CAMx modeling:C Alabama contributes at least 2 ppb to 25% of the 8-hr exceedences in Indiana; the maximum 8-hr
contribution from Alabama is 21 ppb;C Alabama contributes 4% of the total manmade ppb >= 85 ppb in Indiana;C The highest daily average 8-hr contribution from Alabama to Indiana is 10 ppb; which is 11% of
the average 8-hr ozone concentration >= 85 ppb in Indiana on that day.Georgia’s Contribution to Indiana: UAM-V zero-out modeling:C Georgia contributes at least 2 ppb to 14% of the 8-hr exceedences in Indiana; the maximum 8-hr
contribution from Georgia is 12 ppb;C The total contribution from Georgia is equivalent to 8% of the total ppb >= 85 ppb in Indiana. CAMx modeling:C Georgia contributes at least 2 ppb to 53% of the 8-hr exceedences in Indiana; the maximum 8-hr
contribution from Georgia is 17 ppb;C Georgia contributes 4% of the total manmade ppb >= 85 ppb in Indiana;C The highest daily average 8-hr contribution from Georgia to Indiana is 9 ppb; which is 11% of the
average 8-hr ozone concentration >= 85 ppb in Indiana on that day.Illinois’s Contribution to Indiana: UAM-V zero-out modeling:C Illinois contributes at least 5 ppb to 13% of the 8-hr exceedences in Indiana; the maximum 8-hr
contribution from Illinois is 41 ppb;C The total contribution from Illinois is equivalent to 19% of the total ppb >= 85 ppb in Indiana. CAMx modeling:C Illinois contributes at least 5 ppb to 26% of the 8-hr exceedences in Indiana; the maximum 8-hr
contribution from Illinois is 44 ppb;C Illinois contributes 5% of the total manmade ppb >= 85 ppb in Indiana;C The highest daily average 8-hr contribution from Illinois to Indiana is 11 ppb; which is 12% of the
average 8-hr ozone concentration >= 85 ppb in Indiana on that day.Kentucky’s Contribution to Indiana: UAM-V zero-out modeling:C Kentucky contributes at least 10 ppb to 45% of the 8-hr exceedences in Indiana; the maximum 8-
hr contribution from Kentucky is 64 ppb;C The total contribution from Kentucky is equivalent to 70% of the total ppb >= 85 ppb in Indiana. CAMx modeling:C Kentucky contributes at least 10 ppb to 71% of the 8-hr exceedences in Indiana; the maximum 8-
hr contribution from Kentucky is 65 ppb;C Kentucky contributes 27% of the total manmade ppb >= 85 ppb in Indiana;C The highest daily average 8-hr contribution from Kentucky to Indiana is 47 ppb; which is 53% of
the average 8-hr ozone concentration >= 85 ppb in Indiana on that day.Missouri’s Contribution to Indiana: UAM-V zero-out modeling:C Missouri contributes at least 2 ppb to 12% of the 8-hr exceedences in Indiana; the maximum 8-hr
contribution from Missouri is 9 ppb;C The total contribution from Missouri is equivalent to 5% of the total ppb >= 85 ppb in Indiana. CAMx modeling:C Missouri contributes at least 5 ppb to 10% of the 8-hr exceedences in Indiana; the maximum 8-hr
contribution from Missouri is 15 ppb;C Missouri contributes 2% of the total manmade ppb >= 85 ppb in Indiana;C The highest daily average 8-hr contribution from Missouri to Indiana is 9 ppb; which is 10% of the
average 8-hr ozone concentration >= 85 ppb in Indiana on that day. North Carolina’s Contribution to Indiana: UAM-V zero-out modeling:

D-11
C North Carolina contributes at least 2 ppb to 10% of the 8-hr exceedences in Indiana; the maximum8-hr contribution from North Carolina is 5 ppb;
C The total contribution from North Carolina is equivalent to 8% of the total ppb >= 85 ppb inIndiana.
CAMx modeling:C North Carolina contributes at least 2 ppb to 32% of the 8-hr exceedences in Indiana; the maximum
8-hr contribution from North Carolina is 8 ppb;C North Carolina contributes 2% of the total manmade ppb >= 85 ppb in Indiana.Ohio’s Contribution to Indiana: UAM-V zero-out modeling:C Ohio contributes at least 2 ppb to 8% of the 8-hr exceedences in Indiana; the maximum 8-hr
contribution from Ohio is 14 ppb;C The total contribution from Ohio is equivalent to 5% of the total ppb >= 85 ppb in Indiana. CAMx modeling:C Ohio contributes at least 5 ppb to 7% of the 8-hr exceedences in Indiana; the maximum 8-hr
contribution from Ohio is 28 ppb;C Ohio contributes 2% of the total manmade ppb >= 85 ppb in Indiana;C The highest daily average 8-hr contribution from Ohio to Indiana is 12 ppb; which is 13% of the
average 8-hr ozone concentration >= 85 ppb in Indiana on that day.South Carolina’s Contribution to Indiana: UAM-V zero-out modeling:C South Carolina contributes at least 2 ppb to 4% of the 8-hr exceedences in Indiana; the maximum
8-hr contribution from South Carolina is 6 ppb;C The total contribution from South Carolina is equivalent to 6% of the total ppb >= 85 ppb in
Indiana. CAMx modeling:C South Carolina contributes at least 2 ppb to 25% of the 8-hr exceedences in Indiana; the
maximum 8-hr contribution from South Carolina is 7 ppb;C South Carolina contributes 2% of the total manmade ppb >= 85 ppb in Indiana.Tennessee’s Contribution to Indiana: UAM-V zero-out modeling:C Tennessee contributes at least 5 ppb to 32% of the 8-hr exceedences in Indiana; the maximum 8-
hr contribution from Tennessee is 33 ppb;C The total contribution from Tennessee is equivalent to 38% of the total ppb >= 85 ppb in Indiana. CAMx modeling:C Tennessee contributes at least 5 ppb to 72% of the 8-hr exceedences in Indiana; the maximum 8-
hr contribution from Tennessee is 52 ppb;C Tennessee contributes 15% of the total manmade ppb >= 85 ppb in Indiana;C The highest daily average 8-hr contribution from Tennessee to Indiana is 18 ppb; which is 20% of
the average 8-hr ozone concentration >= 85 ppb in Indiana on that day.West Virginia’s Contribution to Indiana: UAM-V zero-out modeling:C West Virginia contributes at least 2 ppb to 11% of the 8-hr exceedences in Indiana; the maximum
8-hr contribution from West Virginia is 8 ppb;C The total contribution from West Virginia is equivalent to 6% of the total ppb >= 85 ppb in Indiana. CAMx modeling:C West Virginia contributes at least 2 ppb to 14% of the 8-hr exceedences in Indiana; the maximum
8-hr contribution from West Virginia is 8 ppb;C The highest daily average 8-hr contribution from West Virginia to Indiana is 8 ppb; which is 8% of
the average 8-hr ozone concentration >= 85 ppb in Indiana on that day.-- KentuckyAlabama’s Contribution to Kentucky: UAM-V zero-out modeling:C Alabama contributes at least 5 ppb to 8% of the 8-hr exceedences in Kentucky; the maximum 8-hr

D-12
contribution from Alabama is 20 ppb;C The total contribution from Alabama is equivalent to 7% of the total ppb >= 85 ppb in Kentucky. CAMx modeling:C Alabama contributes at least 5 ppb to 25% of the 8-hr exceedences in Kentucky; the maximum 8-
hr contribution from Alabama is 26 ppb;C Alabama contributes 5% of the total manmade ppb >= 85 ppb in Kentucky;C The highest daily average 8-hr contribution from Alabama to Kentucky is 16 ppb; which is 18% of
the average 8-hr ozone concentration >= 85 ppb in Kentucky on that day.Georgia’s Contribution to Kentucky: UAM-V zero-out modeling:C Georgia contributes at least 2 ppb to 11% of the 8-hr exceedences in Kentucky; the maximum 8-hr
contribution from Georgia is 9 ppb;C The total contribution from Georgia is equivalent to 6% of the total ppb >= 85 ppb in Kentucky. CAMx modeling:C Georgia contributes at least 5 ppb to 17% of the 8-hr exceedences in Kentucky; the maximum 8-hr
contribution from Georgia is 20 ppb;C Georgia contributes 4% of the total manmade ppb >= 85 ppb in Kentucky;C The highest daily average 8-hr contribution from Georgia to Kentucky is 14 ppb; which is 16% of
the average 8-hr ozone concentration >= 85 ppb in Kentucky on that day.Illinois’s Contribution to Kentucky: UAM-V zero-out modeling:C Illinois contributes at least 5 ppb to 6% of the 8-hr exceedences in Kentucky; the maximum 8-hr
contribution from Illinois is 18 ppb;C The total contribution from Illinois is equivalent to 7% of the total ppb >= 85 ppb in Kentucky. CAMx modeling:C Illinois contributes at least 5 ppb to 10% of the 8-hr exceedences in Kentucky; the maximum 8-hr
contribution from Illinois is 16 ppb;C Illinois contributes 2% of the total manmade ppb >= 85 ppb in Kentucky;C The highest daily average 8-hr contribution from Illinois to Kentucky is 10 ppb; which is 11% of the
average 8-hr ozone concentration >= 85 ppb in Kentucky on that day.Indiana’s Contribution to Kentucky: UAM-V zero-out modeling:C Indiana contributes at least 10 ppb to 28% of the 8-hr exceedences in Kentucky; the maximum 8-
hr contribution from Indiana is 31 ppb;C The total contribution from Indiana is equivalent to 40% of the total ppb >= 85 ppb in Kentucky. CAMx modeling:C Indiana contributes at least 10 ppb to 36% of the 8-hr exceedences in Kentucky; the maximum 8-
hr contribution from Indiana is 40 ppb;C Indiana contributes 12% of the total manmade ppb >= 85 ppb in Kentucky;C The highest daily average 8-hr contribution from Indiana to Kentucky is 18 ppb; which is 18% of
the average 8-hr ozone concentration >= 85 ppb in Kentucky on that day.Missouri’s Contribution to Kentucky: UAM-V zero-out modeling:C Missouri contributes at least 2 ppb to 8% of the 8-hr exceedences in Kentucky; the maximum 8-hr
contribution from Missouri is 7 ppb;C The total contribution from Missouri is equivalent to 4% of the total ppb >= 85 ppb in Kentucky. CAMx modeling:C Missouri contributes at least 5 ppb to 9% of the 8-hr exceedences in Kentucky; the maximum 8-hr
contribution from Missouri is 11 ppb;C The highest daily average 8-hr contribution from Missouri to Kentucky is 8 ppb; which is 9% of the
average 8-hr ozone concentration >= 85 ppb in Kentucky on that day.North Carolina’s Contribution to Kentucky: UAM-V zero-out modeling:C North Carolina contributes at least 2 ppb to 11% of the 8-hr exceedences in Kentucky; the

D-13
maximum 8-hr contribution from North Carolina is 9 ppb;C The total contribution from North Carolina is equivalent to 6% of the total ppb >= 85 ppb in
Kentucky. CAMx modeling:C North Carolina contributes at least 2 ppb to 44% of the 8-hr exceedences in Kentucky; the
maximum 8-hr contribution from North Carolina is 12 ppb;C North Carolina contributes 2% of the total manmade ppb >= 85 ppb in Kentucky;C The highest daily average 8-hr contribution from North Carolina to Kentucky is 5 ppb; which is 6%
of the average 8-hr ozone concentration >= 85 ppb in Kentucky on that day.Ohio’s Contribution to Kentucky: UAM-V zero-out modeling:C Ohio contributes at least 10 ppb to 9% of the 8-hr exceedences in Kentucky; the maximum 8-hr
contribution from Ohio is 40 ppb;C The total contribution from Ohio is equivalent to 11% of the total ppb >= 85 ppb in Kentucky. CAMx modeling:C Ohio contributes at least 5 ppb to 14% of the 8-hr exceedences in Kentucky; the maximum 8-hr
contribution from Ohio is 61 ppb;C Ohio contributes 5% of the total manmade ppb >= 85 ppb in Kentucky;C The highest daily average 8-hr contribution from Ohio to Kentucky is 12 ppb; which is 13% of the
average 8-hr ozone concentration >= 85 ppb in Kentucky on that day.South Carolina’s Contribution to Kentucky: UAM-V zero-out modeling:C South Carolina contributes at least 2 ppb to 2% of the 8-hr exceedences in Kentucky; the
maximum 8-hr contribution from South Carolina is 4 ppb;C The total contribution from South Carolina is equivalent to 3% of the total ppb >= 85 ppb in
Kentucky. CAMx modeling:C South Carolina contributes at least 2 ppb to 25% of the 8-hr exceedences in Kentucky; the
maximum 8-hr contribution from South Carolina is 7 ppb;C South Carolina contributes 2% of the total manmade ppb >= 85 ppb in Kentucky.Tennessee’s Contribution to Kentucky: UAM-V zero-out modeling:C Tennessee contributes at least 10 ppb to 26% of the 8-hr exceedences in Kentucky; the maximum
8-hr contribution from Tennessee is 68 ppb;C The total contribution from Tennessee is equivalent to 35% of the total ppb >= 85 ppb in Kentucky. CAMx modeling:C Tennessee contributes at least 10 ppb to 49% of the 8-hr exceedences in Kentucky; the maximum
8-hr contribution from Tennessee is 91 ppb;C Tennessee contributes 20% of the total manmade ppb >= 85 ppb in Kentucky;C The highest daily average 8-hr contribution from Tennessee to Kentucky is 52 ppb; which is 59%
of the average 8-hr ozone concentration >= 85 ppb in Kentucky on that day.West Virginia’s Contribution to Kentucky: UAM-V zero-out modeling:C West Virginia contributes at least 5 ppb to 4% of the 8-hr exceedences in Kentucky; the maximum
8-hr contribution from West Virginia is 52 ppb;C The total contribution from West Virginia is equivalent to 5% of the total ppb >= 85 ppb in
Kentucky. CAMx modeling:C West Virginia contributes at least 2 ppb to 9% of the 8-hr exceedences in Kentucky; the maximum
8-hr contribution from West Virginia is 31 ppb;C The highest daily average 8-hr contribution from West Virginia to Kentucky is 5 ppb; which is 5%
of the average 8-hr ozone concentration >= 85 ppb in Kentucky on that day.-- MaineConnecticut/Rhode Island’s Contribution to Maine:

D-14
CAMx modeling:C Connecticut/Rhode Island contribute at least 5 ppb to 50% of the 8-hr exceedences in Maine; the
maximum 8-hr contribution from Connecticut/Rhode Island is 19 ppb;C Connecticut/Rhode Island contribute 7% of the total manmade ppb >= 85 ppb in Maine;C The highest daily average 8-hr contribution from Connecticut/Rhode Island to Maine is 7 ppb;
which is 8% of the average 8-hr ozone concentration >= 85 ppb in Maine on that day.Maryland/DC/Delaware’s Contribution to Maine: CAMx modeling:C Maryland/DC/Delaware contribute at least 2 ppb to 56% of the 8-hr exceedences in Maine; the
maximum 8-hr contribution from Maryland/DC/Delaware is 7 ppb;C Maryland/DC/Delaware contribute 3% of the total manmade ppb >= 85 ppb in Maine.Massachusetts’s Contribution to Maine: UAM-V zero-out modeling:C Massachusetts contributes at least 10 ppb to 82% of the 8-hr exceedences in Maine; the
maximum 8-hr contribution from Massachusetts is 51 ppb;C The total contribution from Massachusetts is equivalent to 95% of the total ppb >= 85 ppb in
Maine. CAMx modeling:C Massachusetts contributes at least 10 ppb to 84% of the 8-hr exceedences in Maine; the
maximum 8-hr contribution from Massachusetts is 67 ppb;C Massachusetts contributes 33% of the total manmade ppb >= 85 ppb in Maine;C The highest daily average 8-hr contribution from Massachusetts to Maine is 47 ppb; which is 54%
of the average 8-hr ozone concentration >= 85 ppb in Maine on that day.New Jersey’s Contribution to Maine: CAMx modeling:C New Jersey contributes at least 5 ppb to 48% of the 8-hr exceedences in Maine; the maximum 8-
hr contribution from New Jersey is 21 ppb;C New Jersey contributes 7% of the total manmade ppb >= 85 ppb in Maine;C The highest daily average 8-hr contribution from New Jersey to Maine is 10 ppb; which is 10% of
the average 8-hr ozone concentration >= 85 ppb in Maine on that day.New York’s Contribution to Maine: CAMx modeling:C New York contributes at least 10 ppb to 38% of the 8-hr exceedences in Maine; the maximum 8-hr
contribution from New York is 20 ppb;C New York contributes 11% of the total manmade ppb >= 85 ppb in Maine;C The highest daily average 8-hr contribution from New York to Maine is 12 ppb; which is 13% of the
average 8-hr ozone concentration >= 85 ppb in Maine on that day.North Carolina’s Contribution to Maine: UAM-V zero-out modeling:C North Carolina contributes at least 2 ppb to 5% of the 8-hr exceedences in Maine; the maximum
8-hr contribution from North Carolina is 3 ppb;C The total contribution from North Carolina is equivalent to 3% of the total ppb >= 85 ppb in Maine. CAMx modeling:C North Carolina contributes at least 2 ppb to 8% of the 8-hr exceedences in Maine; the maximum
8-hr contribution from North Carolina is 9 ppb.Pennsylvania’s Contribution to Maine: CAMx modeling:C Pennsylvania contributes at least 5 ppb to 44% of the 8-hr exceedences in Maine; the maximum
8-hr contribution from Pennsylvania is 14 ppb;C Pennsylvania contributes 6% of the total manmade ppb >= 85 ppb in Maine;C The highest daily average 8-hr contribution from Pennsylvania to Maine is 8 ppb; which is 9% of
the average 8-hr ozone concentration >= 85 ppb in Maine on that day.Virginia’s Contribution to Maine: UAM-V zero-out modeling:

D-15
C Virginia contributes at least 2 ppb to 16% of the 8-hr exceedences in Maine; the maximum 8-hrcontribution from Virginia is 6 ppb;
C The total contribution from Virginia is equivalent to 8% of the total ppb >= 85 ppb in Maine. CAMx modeling:C Virginia contributes at least 2 ppb to 28% of the 8-hr exceedences in Maine; the maximum 8-hr
contribution from Virginia is 17 ppb;C Virginia contributes 3% of the total manmade ppb >= 85 ppb in Maine;C The highest daily average 8-hr contribution from Virginia to Maine is 6 ppb; which is 7% of the
average 8-hr ozone concentration >= 85 ppb in Maine on that day.-- MarylandIllinois’s Contribution to Maryland: UAM-V zero-out modeling:C Illinois contributes at least 2 ppb to 2% of the 8-hr exceedences in Maryland; the maximum 8-hr
contribution from Illinois is 3 ppb;C The total contribution from Illinois is equivalent to 3% of the total ppb >= 85 ppb in Maryland. CAMx modeling:C Illinois contributes at least 2 ppb to 31% of the 8-hr exceedences in Maryland; the maximum 8-hr
contribution from Illinois is 7 ppb;C Illinois contributes 2% of the total manmade ppb >= 85 ppb in Maryland;C The highest daily average 8-hr contribution from Illinois to Maryland is 6 ppb; which is 5% of the
average 8-hr ozone concentration >= 85 ppb in Maryland on that day.Indiana’s Contribution to Maryland: UAM-V zero-out modeling:C Indiana contributes at least 2 ppb to 8% of the 8-hr exceedences in Maryland; the maximum 8-hr
contribution from Indiana is 5 ppb;C The total contribution from Indiana is equivalent to 4% of the total ppb >= 85 ppb in Maryland. CAMx modeling:C Indiana contributes at least 5 ppb to 8% of the 8-hr exceedences in Maryland; the maximum 8-hr
contribution from Indiana is 11 ppb;C Indiana contributes 2% of the total manmade ppb >= 85 ppb in Maryland;C The highest daily average 8-hr contribution from Indiana to Maryland is 6 ppb; which is 5% of the
average 8-hr ozone concentration >= 85 ppb in Maryland on that day.Kentucky’s Contribution to Maryland: UAM-V zero-out modeling:C Kentucky contributes at least 2 ppb to 13% of the 8-hr exceedences in Maryland; the maximum 8-
hr contribution from Kentucky is 6 ppb;C The total contribution from Kentucky is equivalent to 4% of the total ppb >= 85 ppb in Maryland. CAMx modeling:C Kentucky contributes at least 5 ppb to 18% of the 8-hr exceedences in Maryland; the maximum 8-
hr contribution from Kentucky is 13 ppb;C Kentucky contributes 3% of the total manmade ppb >= 85 ppb in Maryland;C The highest daily average 8-hr contribution from Kentucky to Maryland is 7 ppb; which is 7% of
the average 8-hr ozone concentration >= 85 ppb in Maryland on that day.Michigan’s Contribution to Maryland: UAM-V zero-out modeling:C Michigan contributes at least 2 ppb to 12% of the 8-hr exceedences in Maryland; the maximum 8-
hr contribution from Michigan is 7 ppb;C The total contribution from Michigan is equivalent to 4% of the total ppb >= 85 ppb in Maryland. CAMx modeling:C Michigan contributes at least 2 ppb to 29% of the 8-hr exceedences in Maryland; the maximum 8-
hr contribution from Michigan is 10 ppb;C Michigan contributes 2% of the total manmade ppb >= 85 ppb in Maryland;C The highest daily average 8-hr contribution from Michigan to Maryland is 6 ppb; which is 6% of the
average 8-hr ozone concentration >= 85 ppb in Maryland on that day.

D-16
North Carolina’s Contribution to Maryland: UAM-V zero-out modeling:C North Carolina contributes at least 5 ppb to 7% of the 8-hr exceedences in Maryland; the
maximum 8-hr contribution from North Carolina is 27 ppb;C The total contribution from North Carolina is equivalent to 5% of the total ppb >= 85 ppb in
Maryland. CAMx modeling:C North Carolina contributes at least 5 ppb to 13% of the 8-hr exceedences in Maryland; the
maximum 8-hr contribution from North Carolina is 32 ppb;C North Carolina contributes 3% of the total manmade ppb >= 85 ppb in Maryland;C The highest daily average 8-hr contribution from North Carolina to Maryland is 15 ppb; which is
17% of the average 8-hr ozone concentration >= 85 ppb in Maryland on that day.Ohio’s Contribution to Maryland: UAM-V zero-out modeling:C Ohio contributes at least 5 ppb to 10% of the 8-hr exceedences in Maryland; the maximum 8-hr
contribution from Ohio is 8 ppb;C The total contribution from Ohio is equivalent to 10% of the total ppb >= 85 ppb in Maryland. CAMx modeling:C Ohio contributes at least 5 ppb to 42% of the 8-hr exceedences in Maryland; the maximum 8-hr
contribution from Ohio is 14 ppb;C Ohio contributes 5% of the total manmade ppb >= 85 ppb in Maryland;C The highest daily average 8-hr contribution from Ohio to Maryland is 9 ppb; which is 10% of the
average 8-hr ozone concentration >= 85 ppb in Maryland on that day.Pennsylvania’s Contribution to Maryland: CAMx modeling:C Pennsylvania contributes at least 5 ppb to 45% of the 8-hr exceedences in Maryland; the
maximum 8-hr contribution from Pennsylvania is 56 ppb;C Pennsylvania contributes 7% of the total manmade ppb >= 85 ppb in Maryland;C The highest daily average 8-hr contribution from Pennsylvania to Maryland is 15 ppb; which is
14% of the average 8-hr ozone concentration >= 85 ppb in Maryland on that day.Tennessee’s Contribution to Maryland: UAM-V zero-out modeling:C Tennessee contributes at least 2 ppb to 4% of the 8-hr exceedences in Maryland; the maximum 8-
hr contribution from Tennessee is 3 ppb;C The total contribution from Tennessee is equivalent to 2 of the total ppb >= 85 ppb in Maryland. CAMx modeling:C Tennessee contributes at least 2 ppb to 28% of the 8-hr exceedences in Maryland; the maximum
8-hr contribution from Tennessee is 8 ppb;C Tennessee contributes 2% of the total manmade ppb >= 85 ppb in Maryland;C The highest daily average 8-hr contribution from Tennessee to Maryland is 6 ppb; which is 6% of
the average 8-hr ozone concentration >= 85 ppb in Maryland on that day.Virginia’s Contribution to Maryland: UAM-V zero-out modeling:C Virginia contributes at least 10 ppb to 57% of the 8-hr exceedences in Maryland; the maximum 8-
hr contribution from Virginia is 63 ppb;C The total contribution from Virginia is equivalent to 57% of the total ppb >= 85 ppb in Maryland. CAMx modeling:C Virginia contributes at least 10 ppb to 81% of the 8-hr exceedences in Maryland; the maximum 8-
hr contribution from Virginia is 84 ppb;C Virginia contributes 30% of the total manmade ppb >= 85 ppb in Maryland;C The highest daily average 8-hr contribution from Virginia to Maryland is 40 ppb; which is 42% of
the average 8-hr ozone concentration >= 85 ppb in Maryland on that day.West Virginia’s Contribution to Maryland: UAM-V zero-out modeling:

D-17
C West Virginia contributes at least 5 ppb to 32% of the 8-hr exceedences in Maryland; themaximum 8-hr contribution from West Virginia is 23 ppb;
C The total contribution from West Virginia is equivalent to 17% of the total ppb >= 85 ppb inMaryland.
CAMx modeling:C West Virginia contributes at least 5 ppb to 40% of the 8-hr exceedences in Maryland; the
maximum 8-hr contribution from West Virginia is 26 ppb;C West Virginia contributes 6% of the total manmade ppb >= 85 ppb in Maryland;C The highest daily average 8-hr contribution from West Virginia to Maryland is 15 ppb; which is
15% of the average 8-hr ozone concentration >= 85 ppb in Maryland on that day.-- MassachusettsConnecticut/Rhode Island’s Contribution to Massachusetts: CAMx modeling:C Connecticut/Rhode Island contribute at least 10 ppb to 48% of the 8-hr exceedences in
Massachusetts; the maximum 8-hr contribution from Connecticut/Rhode Island is 59 ppb;C Connecticut/Rhode Island contribute 15% of the total manmade ppb >= 85 ppb in Massachusetts;C The highest daily average 8-hr contribution from Connecticut/Rhode Island to Massachusetts is 38
ppb; which is 43% of the average 8-hr ozone concentration >= 85 ppb in Massachusetts on thatday.
Maryland/DC/Delaware’s Contribution to Massachusetts: CAMx modeling:C Maryland/DC/Delaware contribute at least 5 ppb to 34% of the 8-hr exceedences in
Massachusetts; the maximum 8-hr contribution from Maryland/DC/Delaware is 17 ppb;C Maryland/DC/Delaware contribute 5% of the total manmade ppb >= 85 ppb in Massachusetts;C The highest daily average 8-hr contribution from Maryland/DC/Delaware to Massachusetts is 10
ppb; which is 12% of the average 8-hr ozone concentration >= 85 ppb in Massachusetts on thatday.
Michigan’s Contribution to Massachusetts: UAM-V zero-out modeling:C Michigan contributes at least 2 ppb to 4% of the 8-hr exceedences in Massachusetts; the
maximum 8-hr contribution from Michigan is 5 ppb;C The total contribution from Michigan is equivalent to 3% of the total ppb >= 85 ppb in
Massachusetts. CAMx modeling:C Michigan contributes at least 2 ppb to 33% of the 8-hr exceedences in Massachusetts; the
maximum 8-hr contribution from Michigan is 8 ppb;C Michigan contributes 2% of the total manmade ppb >= 85 ppb in Massachusetts;C The highest daily average 8-hr contribution from Michigan to Massachusetts is 5 ppb; which is 6%
of the average 8-hr ozone concentration >= 85 ppb in Massachusetts on that day.New Jersey’s Contribution to Massachusetts: CAMx modeling:C New Jersey contributes at least 10 ppb to 59% of the 8-hr exceedences in Massachusetts; the
maximum 8-hr contribution from New Jersey is 39 ppb;C The total contribution from New Jersey contributes 16% of the total manmade ppb >= 85 ppb in
Massachusetts.New York’s Contribution to Massachusetts: CAMx modeling:C New York contributes at least 10 ppb to 58% of the 8-hr exceedences in Massachusetts; the
maximum 8-hr contribution from New York is 41 ppb;C New York contributes 15% of the total manmade ppb >= 85 ppb in Massachusetts;C The highest daily average 8-hr contribution from New York to Massachusetts is 19 ppb; which is
20% of the average 8-hr ozone concentration >= 85 ppb in Massachusetts on that day.North Carolina’s Contribution to Massachusetts: UAM-V zero-out modeling:

D-18
C North Carolina contributes at least 2 ppb to 2% of the 8-hr exceedences in Massachusetts; themaximum 8-hr contribution from North Carolina is 7 ppb;
C The total contribution from North Carolina is equivalent to 2% of the total ppb >= 85 ppb inMassachusetts
CAMx modeling:C North Carolina contributes at least 5 ppb to 9% of the 8-hr exceedences in Massachusetts; the
maximum 8-hr contribution from North Carolina is 15 ppb;C North Carolina contributes 2% of the total manmade ppb >= 85 ppb in Massachusetts.Ohio’s Contribution to Massachusetts: UAM-V zero-out modeling:C Ohio contributes at least 2 ppb to 6% of the 8-hr exceedences in Massachusetts; the maximum 8-
hr contribution from Ohio is 4 ppb;C The total contribution from Ohio is equivalent to 4% of the total ppb >= 85 ppb in Massachusetts. CAMx modeling:C Ohio contributes at least 5 ppb to 14% of the 8-hr exceedences in Massachusetts; the maximum
8-hr contribution from Ohio is 10 ppb;C Ohio contributes 2% of the total manmade ppb >= 85 ppb in Massachusetts;C The highest daily average 8-hr contribution from Ohio to Massachusetts is 6 ppb; which is 6% of
the average 8-hr ozone concentration >= 85 ppb in Massachusetts on that day.Pennsylvania’s Contribution to Massachusetts: CAMx modeling:C Pennsylvania contributes at least 10 ppb to 39% of the 8-hr exceedences in Massachusetts; the
maximum 8-hr contribution from Pennsylvania is 29 ppb;C Pennsylvania contributes 11% of the total manmade ppb >= 85 ppb in Massachusetts;C The highest daily average 8-hr contribution from Pennsylvania to Massachusetts is 17 ppb; which
is 19% of the average 8-hr ozone concentration >= 85 ppb in Massachusetts on that day.Virginia’s Contribution to Massachusetts: UAM-V zero-out modeling:C Virginia contributes at least 5 ppb to 5% of the 8-hr exceedences in Massachusetts; the maximum
8-hr contribution from Virginia is 13 ppb;C The total contribution from Virginia is equivalent to 6% of the total ppb >= 85 ppb in
Massachusetts. CAMx modeling:C Virginia contributes at least 5 ppb to 23% of the 8-hr exceedences in Massachusetts; the
maximum 8-hr contribution from Virginia is 27 ppb;C Virginia contributes 5% of the total manmade ppb >= 85 ppb in Massachusetts;C The highest daily average 8-hr contribution from Virginia to Massachusetts is 11 ppb; which is
10% of the average 8-hr ozone concentration >= 85 ppb in Massachusetts on that day.West Virginia’s Contribution to Massachusetts: UAM-V zero-out modeling:C West Virginia contributes at least 2 ppb to 18% of the 8-hr exceedences in Massachusetts; the
maximum 8-hr contribution from West Virginia is 6 ppb;C The total contribution from West Virginia is equivalent to 4% of the total ppb >= 85 ppb in
Massachusetts. CAMx modeling:C West Virginia contributes at least 2 ppb to 29% of the 8-hr exceedences in Massachusetts; the
maximum 8-hr contribution from West Virginia is 7 ppb;C West Virginia contributes 2% of the total manmade ppb >= 85 ppb in Massachusetts;C The highest daily average 8-hr contribution from West Virginia to Massachusetts is 5 ppb; which is
5% of the average 8-hr ozone concentration >= 85 ppb in Massachusetts on that day.-- MichiganAlabama’s Contribution to Michigan: UAM-V zero-out modeling:C Alabama contributes at least 2 ppb to 10% of the 8-hr exceedences in Michigan; the maximum 8-

D-19
hr contribution from Alabama is 5 ppb;C The total contribution from Alabama is equivalent to 5 of the total ppb >= 85 ppb in Michigan. CAMx modeling:C Alabama contributes at least 2 ppb to 42% of the 8-hr exceedences in Michigan; the maximum 8-
hr contribution from Alabama is 9 ppb;C Alabama contributes 3% of the total manmade ppb >= 85 ppb in Michigan;C The highest daily average 8-hr contribution from Alabama to Michigan is 5 ppb; which is 6% of the
average 8-hr ozone concentration >= 85 ppb in Michigan on that day.Georgia’s Contribution to Michigan: UAM-V zero-out modeling:C Georgia contributes at least 2 ppb to 7% of the 8-hr exceedences in Michigan; the maximum 8-hr
contribution from Georgia is 3 ppb;C The total contribution from Georgia is equivalent to 4% of the total ppb >= 85 ppb in Michigan. CAMx modeling:C Georgia contributes at least 2 ppb to 39% of the 8-hr exceedences in Michigan; the maximum 8-hr
contribution from Georgia is 6 ppb;C Georgia contributes 2% of the total manmade ppb >= 85 ppb in Michigan.Illinois’s Contribution to Michigan: UAM-V zero-out modeling:C Illinois contributes at least 10 ppb to 63% of the 8-hr exceedences in Michigan; the maximum 8-hr
contribution from Illinois is 61 ppb;C The total contribution from Illinois is equivalent to 78% of the total ppb >= 85 ppb in Michigan. CAMx modeling:C Illinois contributes at least 10 ppb to 80% of the 8-hr exceedences in Michigan; the maximum 8-hr
contribution from Illinois is 90 ppb;C Illinois contributes 31% of the total manmade ppb >= 85 ppb in Michigan;C The highest daily average 8-hr contribution from Illinois to Michigan is 32 ppb; which is 35% of the
average 8-hr ozone concentration >= 85 ppb in Michigan on that day.Indiana’s Contribution to Michigan: UAM-V zero-out modeling:C Indiana contributes at least 10 ppb to 34% of the 8-hr exceedences in Michigan; the maximum 8-
hr contribution from Indiana is 36 ppb;C The total contribution from Indiana is equivalent to 43% of the total ppb >= 85 ppb in Michigan. CAMx modeling:C Indiana contributes at least 10 ppb to 51% of the 8-hr exceedences in Michigan; the maximum 8-
hr contribution from Indiana is 51 ppb;C Indiana contributes 18% of the total manmade ppb >= 85 ppb in Michigan;C The highest daily average 8-hr contribution from Indiana to Michigan is 29 ppb; which is 34% of
the average 8-hr ozone concentration >= 85 ppb in Michigan on that day.Kentucky’s Contribution to Michigan: UAM-V zero-out modeling:C Kentucky contributes at least 2 ppb to 24% of the 8-hr exceedences in Michigan; the maximum 8-
hr contribution from Kentucky is 8 ppb;C The total contribution from Kentucky is equivalent to 10% of the total ppb >= 85 ppb in Michigan. CAMx modeling:C Kentucky contributes at least 5 ppb to 26% of the 8-hr exceedences in Michigan; the maximum 8-
hr contribution from Kentucky is 14 ppb;C Kentucky contributes 5% of the total manmade ppb >= 85 ppb in Michigan;C The highest daily average 8-hr contribution from Kentucky to Michigan is 6 ppb; which is 6% of the
average 8-hr ozone concentration >= 85 ppb in Michigan on that day.Missouri’s Contribution to Michigan: UAM-V zero-out modeling:C Missouri contributes at least 5 ppb to 21% of the 8-hr exceedences in Michigan; the maximum 8-
hr contribution from Missouri is 9 ppb;

D-20
C The total contribution from Missouri is equivalent to 22% of the total ppb >= 85 ppb in Michigan. CAMx modeling:C Missouri contributes at least 5 ppb to 50% of the 8-hr exceedences in Michigan; the maximum 8-
hr contribution from Missouri is 18 ppb;C Missouri contributes 7% of the total manmade ppb >= 85 ppb in Michigan;C The highest daily average 8-hr contribution from Missouri to Michigan is 11 ppb; which is 12% of
the average 8-hr ozone concentration >= 85 ppb in Michigan on that day.Ohio’s Contribution to Michigan: UAM-V zero-out modeling:C Ohio contributes at least 2 ppb to 16% of the 8-hr exceedences in Michigan; the maximum 8-hr
contribution from Ohio is 23 ppb;C The total contribution from Ohio is equivalent to 6% of the total ppb >= 85 ppb in Michigan. CAMx modeling:C Ohio contributes at least 5 ppb to 15% of the 8-hr exceedences in Michigan; the maximum 8-hr
contribution from Ohio is 31 ppb;C Ohio contributes 3% of the total manmade ppb >= 85 ppb in Michigan;C The highest daily average 8-hr contribution from Ohio to Michigan is 15 ppb; which is 17% of the
average 8-hr ozone concentration >= 85 ppb in Michigan on that day.Tennessee’s Contribution to Michigan: UAM-V zero-out modeling:C Tennessee contributes at least 2 ppb to 26% of the 8-hr exceedences in Michigan; the maximum
8-hr contribution from Tennessee is 8 ppb;C The total contribution from Tennessee is equivalent to 10% of the total ppb >= 85 ppb in Michigan. CAMx modeling:C Tennessee contributes at least 5 ppb to 35% of the 8-hr exceedences in Michigan; the maximum
8-hr contribution from Tennessee is 13 ppb;C Tennessee contributes 5% of the total manmade ppb >= 85 ppb in Michigan;C The highest daily average 8-hr contribution from Tennessee to Michigan is 7 ppb; which is 8% of
the average 8-hr ozone concentration >= 85 ppb in Michigan on that day.Wisconsin’s Contribution to Michigan: UAM-V zero-out modeling:C Wisconsin contributes at least 2 ppb to 8% of the 8-hr exceedences in Michigan; the maximum 8-
hr contribution from Wisconsin is 16 ppb;C The total contribution from Wisconsin is equivalent to 5% of the total ppb >= 85 ppb in Michigan. CAMx modeling:C Wisconsin contributes at least 10 ppb to 11% of the 8-hr exceedences in Michigan; the maximum
8-hr contribution from Wisconsin is 34 ppb;C Wisconsin contributes 5% of the total manmade ppb >= 85 ppb in Michigan;C The highest daily average 8-hr contribution from Wisconsin to Michigan is 12 ppb; which is 13% of
the average 8-hr ozone concentration >= 85 ppb in Michigan on that day.-- MissouriAlabama’s Contribution to Missouri: UAM-V zero-out modeling:C Alabama contributes at least 5 ppb to 8% of the 8-hr exceedences in Missouri; the maximum 8-hr
contribution from Alabama is 10 ppb;C The total contribution from Alabama is equivalent to 10% of the total ppb >= 85 ppb in Missouri. CAMx modeling:C Alabama contributes at least 5 ppb to 40% of the 8-hr exceedences in Missouri; the maximum 8-hr
contribution from Alabama is 16 ppb;C Alabama contributes 6% of the total manmade ppb >= 85 ppb in Missouri;C The highest daily average 8-hr contribution from Alabama to Missouri is 14 ppb; which is 16% of
the average 8-hr ozone concentration >= 85 ppb in Missouri on that day.Georgia’s Contribution to Missouri: UAM-V zero-out modeling:

D-21
C Georgia contributes at least 2 ppb to 13% of the 8-hr exceedences in Missouri; the maximum 8-hrcontribution from Georgia is 3 ppb;
C The total contribution from Georgia is equivalent to 6% of the total ppb >= 85 ppb in Missouri. CAMx modeling:C Georgia contributes at least 2 ppb to 40% of the 8-hr exceedences in Missouri; the maximum 8-hr
contribution from Georgia is 6 ppb;C Georgia contributes 2% of the total manmade ppb >= 85 ppb in Missouri;C The highest daily average 8-hr contribution from Georgia to Missouri is 5 ppb; which is 6% of the
average 8-hr ozone concentration >= 85 ppb in Missouri on that day.Illinois’s Contribution to Missouri: UAM-V zero-out modeling:C Illinois contributes at least 5 ppb to 40% of the 8-hr exceedences in Missouri; the maximum 8-hr
contribution from Illinois is 16 ppb;C The total contribution from Illinois is equivalent to 28% of the total ppb >= 85 ppb in Missouri. CAMx modeling:C Illinois contributes at least 10 ppb to 21% of the 8-hr exceedences in Missouri; the maximum 8-hr
contribution from Illinois is 23 ppb;C Illinois contributes 8% of the total manmade ppb >= 85 ppb in Missouri;C The highest daily average 8-hr contribution from Illinois to Missouri is 20 ppb; which is 23% of the
average 8-hr ozone concentration >= 85 ppb in Missouri on that day.Indiana’s Contribution to Missouri: UAM-V zero-out modeling:C Indiana contributes at least 5 ppb to 6% of the 8-hr exceedences in Missouri; the maximum 8-hr
contribution from Indiana is 9 ppb;C The total contribution from Indiana is equivalent to 6% of the total ppb >= 85 ppb in Missouri. CAMx modeling:C Indiana contributes at least 5 ppb to 9% of the 8-hr exceedences in Missouri; the maximum 8-hr
contribution from Indiana is 14 ppb;C Indiana contributes 2% of the total manmade ppb >= 85 ppb in Missouri;C The highest daily average 8-hr contribution from Indiana to Missouri is 12 ppb; which is 14% of the
average 8-hr ozone concentration >= 85 ppb in Missouri on that day.Kentucky’s Contribution to Missouri: UAM-V zero-out modeling:C Kentucky contributes at least 2 ppb to 31% of the 8-hr exceedences in Missouri; the maximum 8-
hr contribution from Kentucky is 5 ppb;C The total contribution from Kentucky is equivalent to 11% of the total ppb >= 85 ppb in Missouri. CAMx modeling:C Kentucky contributes at least 5 ppb to 18% of the 8-hr exceedences in Missouri; the maximum 8-
hr contribution from Kentucky is 9 ppb;C Kentucky contributes 3% of the total manmade ppb >= 85 ppb in Missouri;C The highest daily average 8-hr contribution from Kentucky to Missouri is 6 ppb; which is 7% of the
average 8-hr ozone concentration >= 85 ppb in Missouri on that day.Tennessee’s Contribution to Missouri: UAM-V zero-out modeling:C Tennessee contributes at least 10 ppb to 13% of the 8-hr exceedences in Missouri; the maximum
8-hr contribution from Tennessee is 19 ppb;C The total contribution from Tennessee is equivalent to 21% of the total ppb >= 85 ppb in Missouri. CAMx modeling:C Tennessee contributes at least 10 ppb to 30% of the 8-hr exceedences in Missouri; the maximum
8-hr contribution from Tennessee is 30 ppb;C Tennessee contributes 12% of the total manmade ppb >= 85 ppb in Missouri;C The highest daily average 8-hr contribution from Tennessee to Missouri is 24 ppb; which is 25% of
the average 8-hr ozone concentration >= 85 ppb in Missouri on that day.-- New Hampshire

D-22
Connecticut/Rhode Island’s Contribution to New Hampshire: CAMx modeling:C Connecticut/Rhode Island contribute at least 5 ppb to 62% of the 8-hr exceedences and at least
10 ppb to 28% of the 8-hr exceedences in New Hampshire; the maximum 8-hr contribution fromConnecticut/Rhode Island is 25 ppb;
C Connecticut/Rhode Island contribute 9% of the total manmade ppb >= 85 ppb in New Hampshire;C The highest daily average 8-hr contribution from Connecticut/Rhode Island to New Hampshire is
13 ppb; which is 14% of the average 8-hr ozone concentration >= 85 ppb in New Hampshire onthat day.
Maryland/DC/Delaware’s Contribution to New Hampshire: CAMx modeling:C Maryland/DC/Delaware contribute at least 2 ppb to 50% of the 8-hr exceedences in New
Hampshire; the maximum 8-hr contribution from Maryland/DC/Delaware is 5 ppb;C Maryland/DC/Delaware contribute 3% of the total manmade ppb >= 85 ppb in New Hampshire;C The highest daily average 8-hr contribution from Maryland/DC/Delaware to New Hampshire is 4
ppb; which is 5% of the average 8-hr ozone concentration >= 85 ppb in New Hampshire on thatday.
Massachusetts’s Contribution to New Hampshire UAM-V zero-out modeling:C Massachusetts contributes at least 10 ppb to 75% of the 8-hr exceedences in New Hampshire; the
maximum 8-hr contribution from Massachusetts is 68 ppb;C The total contribution from Massachusetts is equivalent to 87% of the total ppb >= 85 ppb in New
Hampshire. CAMx modeling:C Massachusetts contributes at least 10 ppb to 73% of the 8-hr exceedences in New Hampshire; the
maximum 8-hr contribution from Massachusetts is 84 ppb;C Massachusetts contributes 30% of the total manmade ppb >= 85 ppb in New Hampshire;C The highest daily average 8-hr contribution from Massachusetts to New Hampshire is 47 ppb;
which is 52% of the average 8-hr ozone concentration >= 85 ppb in New Hampshire on that day.New Jersey’s Contribution to New Hampshire: CAMx modeling:C New Jersey contributes at least 5 ppb to 45% of the 8-hr exceedences and at least 10 ppb to 23%
of the 8-hr exceedences in New Hampshire; the maximum 8-hr contribution from New Jersey is 26ppb;
C The total contribution from New Jersey contributes 9% of the total manmade ppb >= 85 ppb inNew Hampshire.
New York’s Contribution to New Hampshire: CAMx modeling:C New York contributes at least 10 ppb to 48% of the 8-hr exceedences in New Hampshire; the
maximum 8-hr contribution from New York is 21 ppb;C New York contributes 12% of the total manmade ppb >= 85 ppb in New Hampshire;C The highest daily average 8-hr contribution from New York to New Hampshire is 13 ppb; which is
14% of the average 8-hr ozone concentration >= 85 ppb in New Hampshire on that day.Pennsylvania’s Contribution to New Hampshire: CAMx modeling:C Pennsylvania contributes at least 5 ppb to 36% of the 8-hr exceedences and at least 10 ppb to
21% of the 8-hr exceedences in New Hampshire; the maximum 8-hr contribution fromPennsylvania is 18 ppb;
C Pennsylvania contributes 6% of the total manmade ppb >= 85 ppb in New Hampshire;C The highest daily average 8-hr contribution from Pennsylvania to New Hampshire is 10 ppb; which
is 11% of the average 8-hr ozone concentration >= 85 ppb in New Hampshire on that day.-- New JerseyIllinois’s Contribution to New Jersey: UAM-V zero-out modeling:

D-23
C Illinois contributes at least 2 ppb to 3% of the 8-hr exceedences in New Jersey; the maximum 8-hrcontribution from Illinois is 3 ppb;
C The total contribution from Illinois is equivalent to 3% of the total ppb >= 85 ppb in New Jersey. CAMx modeling:C Illinois contributes least 2 ppb to 37% of the 8-hr exceedences and at least 5 ppb to 10% of the 8-
hr exceedences in New Jersey; the maximum 8-hr contribution from Illinois is 8 ppb;C Illinois contributes 2% of the total manmade ppb >= 85 ppb in New Jersey;C The highest daily average 8-hr contribution from Illinois to New Jersey is 5 ppb; which is 5% of the
average 8-hr ozone concentration >= 85 ppb in New Jersey on that day.Indiana’s Contribution to New Jersey: UAM-V zero-out modeling:C Indiana contributes at least 2 ppb to 4% of the 8-hr exceedences in New Jersey; the maximum 8-
hr contribution from Indiana is 3 ppb;C The total contribution from Indiana is equivalent to 3% of the total ppb >= 85 ppb in New Jersey. CAMx modeling:C Indiana contributes least 2 ppb to 34% of the 8-hr exceedences in New Jersey; the maximum 8-hr
contribution from Indiana is 8 ppb;C Indiana contributes 2% of the total manmade ppb >= 85 ppb in New Jersey.Kentucky’s Contribution to New Jersey: UAM-V zero-out modeling:C Kentucky contributes at least 2 ppb to 7% of the 8-hr exceedences in New Jersey; the maximum
8-hr contribution from Kentucky is 4 ppb;C The total contribution from Kentucky is equivalent to 3% of the total ppb >= 85 ppb in New Jersey. CAMx modeling:C Kentucky contributes least 2 ppb to 31% of the 8-hr exceedences and at least 5 ppb to 8% of the
8-hr exceedences in New Jersey; the maximum 8-hr contribution from Kentucky is 10 ppb;C Kentucky contributes 2% of the total manmade ppb >= 85 ppb in New Jersey;C The highest daily average 8-hr contribution from Kentucky to New Jersey is 7 ppb; which is 8% of
the average 8-hr ozone concentration >= 85 ppb in New Jersey on that day.Maryland/DC/Delaware’s Contribution to New Jersey: CAMx modeling:C Maryland/DC/Delaware contribute at least 10 ppb to 60% of the 8-hr exceedences in New Jersey;
the maximum 8-hr contribution from Maryland/DC/Delaware is 71 ppb;C Maryland/DC/Delaware contribute 20% of the total manmade ppb >= 85 ppb in New Jersey;C The highest daily average 8-hr contribution from Maryland/DC/Delaware to New Jersey is 31 ppb;
which is 36% of the average 8-hr ozone concentration >= 85 ppb in New Jersey on that day.Michigan’s Contribution to New Jersey: UAM-V zero-out modeling:C Michigan contributes at least 2 ppb to 11% of the 8-hr exceedences in New Jersey; the maximum
8-hr contribution from Michigan is 7 ppb;C The total contribution from Michigan is equivalent to 4% of the total ppb >= 85 ppb in New Jersey. CAMx modeling:C Michigan contributes least 2 ppb to 35% of the 8-hr exceedences and at least 5 ppb to 9% of the
8-hr exceedences in New Jersey; the maximum 8-hr contribution from Michigan is 10 ppb;C Michigan contributes 2% of the total manmade ppb >= 85 ppb in New Jersey;C The highest daily average 8-hr contribution from Michigan to New Jersey is 7 ppb; which is 7% of
the average 8-hr ozone concentration >= 85 ppb in New Jersey on that day.North Carolina’s Contribution to New Jersey: UAM-V zero-out modeling:C North Carolina contributes at least 2 ppb to 9% of the 8-hr exceedences and at least 5 ppb to 3%
of the 8-hr exceedences in New Jersey; the maximum 8-hr contribution from North Carolina is 18ppb;
C The total contribution from North Carolina is equivalent to 4% of the total ppb >= 85 ppb in NewJersey.

D-24
CAMx modeling:C North Carolina contributes least 2 ppb to 11% of the 8-hr exceedences and at least 5 ppb to 4% of
the 8-hr exceedences in New Jersey; the maximum 8-hr contribution from North Carolina is 25ppb;
C North Carolina contributes 3% of the total manmade ppb >= 85 ppb in New Jersey;C The highest daily average 8-hr contribution from North Carolina to New Jersey is 7 ppb; which is
7% of the average 8-hr ozone concentration >= 85 ppb in New Jersey on that day.New York’s Contribution to New Jersey: CAMx modeling:C New York contributes at least 2 ppb to 7% of the 8-hr exceedences in New Jersey; the maximum
8-hr contribution from New York is 24 ppb;C The highest daily average 8-hr contribution from New York to New Jersey is 22 ppb; which is 25%
of the average 8-hr ozone concentration >= 85 ppb in New Jersey on that day.Ohio’s Contribution to New Jersey: UAM-V zero-out modeling:C Ohio contributes at least 2 ppb to 38% of the 8-hr exceedences and at least 5 ppb to 5% of the 8-
hr exceedences in New Jersey; the maximum 8-hr contribution from Ohio is 9 ppb;C The total contribution from Ohio is equivalent to 10% of the total ppb >= 85 ppb in New Jersey. CAMx modeling:C Ohio contributes least 2 ppb to 39% of the 8-hr exceedences and at least 5 ppb to 11% of the 8-hr
exceedences in New Jersey; the maximum 8-hr contribution from Ohio is 17 ppb;C Ohio contributes 6% of the total manmade ppb >= 85 ppb in New Jersey;C The highest daily average 8-hr contribution from Ohio to New Jersey is 11 ppb; which is 12% of
the average 8-hr ozone concentration >= 85 ppb in New Jersey on that day.Pennsylvania’s Contribution to New Jersey: CAMx modeling:C Pennsylvania contributes at least 10 ppb to 71% of the 8-hr exceedences in New Jersey; the
maximum 8-hr contribution from Pennsylvania is 62 ppb;C Pennsylvania contributes 26% of the total manmade ppb >= 85 ppb in New Jersey;C The highest daily average 8-hr contribution from Pennsylvania to New Jersey is 31 ppb; which is
31% of the average 8-hr ozone concentration >= 85 ppb in New Jersey on that day.Virginia’s Contribution to New Jersey: UAM-V zero-out modeling:C Virginia contributes at least 5 ppb to 22% of the 8-hr exceedences in New Jersey; the maximum 8-
hr contribution from Virginia is 32 ppb;C The total contribution from Virginia is equivalent to 19% of the total ppb >= 85 ppb in New Jersey. CAMx modeling:C Virginia contributes least 10 ppb to 27% of the 8-hr exceedences in New Jersey; the maximum 8-
hr contribution from Virginia is 38 ppb;C Virginia contributes 9% of the total manmade ppb >= 85 ppb in New Jersey;C The highest daily average 8-hr contribution from Virginia to New Jersey is 20 ppb; which is 21% of
the average 8-hr ozone concentration >= 85 ppb in New Jersey on that day. West Virginia’s Contribution to New Jersey: UAM-V zero-out modeling:C West Virginia contributes at least 5 ppb to 23% of the 8-hr exceedences and at least 10 ppb to 5%
of the 8-hr exceedences in New Jersey; the maximum 8-hr contribution from West Virginia is 15ppb;
C The total contribution from West Virginia is equivalent to 18% of the total ppb >= 85 ppb in NewJersey.
CAMx modeling:C West Virginia contributes least 5 ppb to 37% of the 8-hr exceedences and at least 10 ppb to 11%
of the 8-hr exceedences in New Jersey; the maximum 8-hr contribution from West Virginia is 16ppb;
C West Virginia contributes 5% of the total manmade ppb >= 85 ppb in New Jersey;

D-25
C The highest daily average 8-hr contribution from West Virginia to New Jersey is 9 ppb; which is9% of the average 8-hr ozone concentration >= 85 ppb in New Jersey on that day.
-- New YorkIllinois’s Contribution to New York UAM-V zero-out modeling:C Illinois contributes at least 2 ppb to 9% of the 8-hr exceedences in New York; the maximum 8-hr
contribution from Illinois is 7 ppb;C The total contribution from Illinois is equivalent to 2% of the total ppb >= 85 ppb in New York. CAMx modeling:C Illinois contributes at least 2 ppb to 24% of the 8-hr exceedences in New York; the maximum 8-hr
contribution from Illinois is 11 ppb;C Illinois contributes 2% of the total manmade ppb >= 85 ppb in New York;C The highest daily average 8-hr contribution from Illinois to New York is 4 ppb; which is 5% of the
average 8-hr ozone concentration >= 85 ppb in New York on that day.Indiana’s Contribution to New York UAM-V zero-out modeling:C Indiana contributes at least 2 ppb to 7% of the 8-hr exceedences in New York; the maximum 8-hr
contribution from Indiana is 6 ppb.C The total contribution from Indiana is equivalent to 2% of the total ppb >= 85 ppb in New York. CAMx modeling:C Indiana contributes at least 2 ppb to 22% of the 8-hr exceedences in New York; the maximum 8-hr
contribution from Indiana is 11 ppb;C Indiana contributes 2% of the total manmade ppb >= 85 ppb in New York;C The highest daily average 8-hr contribution from Indiana to New York is 4 ppb; which is 4% of the
average 8-hr ozone concentration >= 85 ppb in New York on that day.Kentucky’s Contribution to New York UAM-V zero-out modeling:C Kentucky contributes at least 2 ppb to 3% of the 8-hr exceedences in New York; the maximum 8-
hr contribution from Kentucky is 4 ppb;C The total contribution from Kentucky is equivalent to 2% to the population-weighted total ppb >=
85 ppb in New York. CAMx modeling:C Kentucky contributes at least 2 ppb to 16% of the 8-hr exceedences and at least 5 ppb to 7% of
the 8-hr exceedences in New York; the maximum 8-hr contribution from Kentucky is 12 ppb;C The highest daily average 8-hr contribution from Kentucky to New York is 6 ppb; which is 6% of
the average 8-hr ozone concentration >= 85 ppb in New York on that day.Maryland/DC/Delaware’s Contribution to New York: CAMx modeling:C Maryland/DC/Delaware contribute at least 5 ppb to 49% of the 8-hr exceedences and at least 10
ppb to 20% of the 8-hr exceedences in New York; the maximum 8-hr contribution fromMaryland/DC/Delaware is 27 ppb;
C Maryland/DC/Delaware contribute 7% of the total manmade ppb >= 85 ppb in New York;C The highest daily average 8-hr contribution from Maryland/DC/Delaware to New York is 14 ppb;
which is 15% of the average 8-hr ozone concentration >= 85 ppb in New York on that day.Michigan’s Contribution to New York UAM-V zero-out modeling:C Michigan contributes at least 2 ppb to 11% of the 8-hr exceedences in New York; the maximum 8-
hr contribution from Michigan is 10 ppb;C The total contribution from Michigan is equivalent to 3% of the total ppb >= 85 ppb in New York. CAMx modeling:C Michigan contributes at least 2 ppb to 38% of the 8-hr exceedences in New York; the maximum 8-
hr contribution from Michigan is 19 ppb;C Michigan contributes 2% of the total manmade ppb >= 85 ppb in New York;C The highest daily average 8-hr contribution from Michigan to New York is 5 ppb; which is 6% of

D-26
the average 8-hr ozone concentration >= 85 ppb in New York on that day.New Jersey’s Contribution to New York: CAMx modeling:C New Jersey contributes at least 10 ppb to 82% of the 8-hr exceedences in New York; the
maximum 8-hr contribution from New Jersey is 64 ppb;C New Jersey contributes 31% of the total manmade ppb >= 85 ppb in New York;C The highest daily average 8-hr contribution from New Jersey to New York is 37 ppb; which is 40%
of the average 8-hr ozone concentration >= 85 ppb in New York on that day.North Carolina’s Contribution to New York UAM-V zero-out modeling:C North Carolina contributes at least 2 ppb to 3% of the 8-hr exceedences in New York; the
maximum 8-hr contribution from North Carolina is 5 ppb;C The total contribution from North Carolina is equivalent to 2% of the total ppb >= 85 ppb in New
York. CAMx modeling:C North Carolina contributes at least 2 ppb to 24% of the 8-hr exceedences in New York; the
maximum 8-hr contribution from North Carolina is 16 ppb;C North Carolina contributes 2% of the total manmade ppb >= 85 ppb in New York;C The highest daily average 8-hr contribution from North Carolina to New York is 7 ppb; which is 7%
of the average 8-hr ozone concentration >= 85 ppb in New York on that day.Ohio’s Contribution to New York UAM-V zero-out modeling:C Ohio contributes at least 2 ppb to 21% of the 8-hr exceedences and at least 5 ppb to 4% of the 8-
hr exceedences in New York; the maximum 8-hr contribution from Ohio is 8 ppb;C The total contribution from Ohio is equivalent to 5% of the total ppb >= 85 ppb in New York. CAMx modeling:C Ohio contributes at least 5 ppb to 22% of the 8-hr exceedences and at least 10 ppb to 5% of the
8-hr exceedences in New York; the maximum 8-hr contribution from Ohio is 18 ppb;C Ohio contributes 4% of the total manmade ppb >= 85 ppb in New York;C The highest daily average 8-hr contribution from Ohio to New York is 8 ppb; which is 8% of the
average 8-hr ozone concentration >= 85 ppb in New York on that day.Pennsylvania’s Contribution to New York CAMx modeling:C Pennsylvania contributes at least 10 ppb to 69% of the 8-hr exceedences in New York; the
maximum 8-hr contribution from Pennsylvania is 55 ppb;C Pennsylvania contributes 18% of the total manmade ppb >= 85 ppb in New York;C The highest daily average 8-hr contribution from Pennsylvania to New York is 22 ppb; which is
23% of the average 8-hr ozone concentration >= 85 ppb in New York on that day.Virginia’s Contribution to New York UAM-V zero-out modeling:C Virginia contributes at least 5 ppb to 10% of the 8-hr exceedences in New York; the maximum 8-hr
contribution from Virginia is 10 ppb;C The total contribution from Virginia is equivalent to 8% of the total ppb >= 85 ppb in New York. CAMx modeling:C Virginia contributes at least 5 ppb to 38% of the 8-hr exceedences in New York; the maximum 8-hr
contribution from Virginia is 28 ppb;C Virginia contributes 5% of the total manmade ppb >= 85 ppb in New York;C The highest daily average 8-hr contribution from Virginia to New York is 10 ppb; which is 10% of
the average 8-hr ozone concentration >= 85 ppb in New York on that day.West Virginia’s Contribution to New York UAM-V zero-out modeling:C West Virginia contributes at least 5 ppb to 11% of the 8-hr exceedences in New York; the
maximum 8-hr contribution from West Virginia is 12 ppb;C The total contribution from West Virginia is equivalent to 7% of the total ppb >= 85 ppb in New

D-27
York. CAMx modeling:C West Virginia contributes at least 5 ppb to 17% of the 8-hr exceedences in New York; the
maximum 8-hr contribution from West Virginia is 14 ppb;C West Virginia contributes 3% of the total manmade ppb >= 85 ppb in New York;C The highest daily average 8-hr contribution from West Virginia to New York is 7 ppb; which is 7%
of the average 8-hr ozone concentration >= 85 ppb in New York on that day.-- North CarolinaAlabama’s Contribution to North Carolina: UAM-V zero-out modeling:C Alabama contributes at least 2 ppb to 7% of the 8-hr exceedences and at least 5 ppb to 3% of the
8-hr exceedences in North Carolina; the maximum 8-hr contribution from Alabama is 10 ppb;C The total contribution from Alabama is equivalent to 3% of the total ppb >= 85 ppb in North
Carolina. CAMx modeling:C Alabama contributes least 5 ppb to 8% of the 8-hr exceedences in North Carolina; the maximum
8-hr contribution from Alabama is 29 ppb;C The highest daily average 8-hr contribution from Alabama to North Carolina is 6 ppb; which is 7%
of the average 8-hr ozone concentration >= 85 ppb in North Carolina on that day.Georgia’s Contribution to North Carolina: UAM-V zero-out modeling:C Georgia contributes at least 5 ppb to 8% of the 8-hr exceedences and at least 10 ppb to 4% of the
8-hr exceedences in North Carolina; the maximum 8-hr contribution from Georgia is 19 ppb;C The total contribution from Georgia is equivalent to 6% of the total ppb >= 85 ppb in North
Carolina. CAMx modeling:C Georgia contributes least 10 ppb to 9% of the 8-hr exceedences in North Carolina; the maximum
8-hr contribution from Georgia is 49 ppb;C Georgia contributes 3% of the total manmade ppb >= 85 ppb in North Carolina;C The highest daily average 8-hr contribution from Georgia to North Carolina is 17 ppb; which is
18% of the average 8-hr ozone concentration >= 85 ppb in North Carolina on that day.Kentucky’s Contribution to North Carolina: UAM-V zero-out modeling:C Kentucky contributes at least 2 ppb to 21% of the 8-hr exceedences and at least 5 ppb to 5% of
the 8-hr exceedences in North Carolina; the maximum 8-hr contribution from Kentucky is 14 ppb;C The total contribution from Kentucky is equivalent to 8% of the total ppb >= 85 ppb in North
Carolina. CAMx modeling:C Kentucky contributes least 5 ppb to 24% of the 8-hr exceedences and at least 10 ppb to 7% of
the 8-hr exceedences in North Carolina; the maximum 8-hr contribution from Kentucky is 22 ppb;C Kentucky contributes 4% of the total manmade ppb >= 85 ppb in North Carolina;C The highest daily average 8-hr contribution from Kentucky to North Carolina is 9 ppb; which is 9%
of the average 8-hr ozone concentration >= 85 ppb in North Carolina on that day.Ohio’s Contribution to North Carolina: UAM-V zero-out modeling:C Ohio contributes at least 2 ppb to 16% of the 8-hr exceedences and at least 5 ppb to 5% of the 8-
hr exceedences in North Carolina; the maximum 8-hr contribution from Ohio is 12 ppb;C The total contribution from Ohio is equivalent to 7% of the total ppb >= 85 ppb in North Carolina. CAMx modeling:C Ohio contributes least 5 ppb to 17% of the 8-hr exceedences and at least 10 ppb to 7% of the 8-hr
exceedences in North Carolina; the maximum 8-hr contribution from Ohio is 29 ppb;C Ohio contributes 4% of the total manmade ppb >= 85 ppb in North Carolina;C The highest daily average 8-hr contribution from Ohio to North Carolina is 9 ppb; which is 10% of
the average 8-hr ozone concentration >= 85 ppb in North Carolina on that day.

D-28
South Carolina’s Contribution to North Carolina: UAM-V zero-out modeling:C South Carolina contributes at least 10 ppb to 14% of the 8-hr exceedences in North Carolina; the
maximum 8-hr contribution from South Carolina is 38 ppb;C The total contribution from South Carolina is equivalent to 21% of the total ppb >= 85 ppb in North
Carolina. CAMx modeling:C South Carolina contributes least 10 ppb to 25% of the 8-hr exceedences in North Carolina; the
maximum 8-hr contribution from South Carolina is 50 ppb;C South Carolina contributes 9% of the total manmade ppb >= 85 ppb in North Carolina;C The highest daily average 8-hr contribution from South Carolina to North Carolina is 17 ppb; which
is 18% of the average 8-hr ozone concentration >= 85 ppb in North Carolina on that day.Tennessee’s Contribution to North Carolina: UAM-V zero-out modeling:C Tennessee contributes at least 5 ppb to 14% of the 8-hr exceedences and at least 10 ppb to 6%
of the 8-hr exceedences in North Carolina; the maximum 8-hr contribution from Tennessee is 58ppb;
C The total contribution from Tennessee is equivalent to 11% of the total ppb >= 85 ppb in NorthCarolina.
CAMx modeling:C Tennessee contributes at least 5 ppb to 25% of the 8-hr exceedences and at least 10 ppb to 6%
of the 8-hr exceedences in North Carolina; the maximum 8-hr contribution from Tennessee is 54ppb;
C Tennessee contributes 6% of the total manmade ppb >= 85 ppb in North Carolina;C The highest daily average 8-hr contribution from Tennessee to North Carolina is 14 ppb; which is
15% of the average 8-hr ozone concentration >= 85 ppb in North Carolina on that day.Virginia’s Contribution to North Carolina: UAM-V zero-out modeling:C Virginia contributes at least 5 ppb to 21% of the 8-hr exceedences and at least 10 ppb to 6% of
the 8-hr exceedences in North Carolina; the maximum 8-hr contribution from Virginia is 34 ppb;C The total contribution from Virginia is equivalent to 22% of the total ppb >= 85 ppb in North
Carolina. CAMx modeling:C Virginia contributes least 5 ppb to 33% of the 8-hr exceedences and at least 10 ppb to 11% of the
8-hr exceedences in North Carolina; the maximum 8-hr contribution from Virginia is 35 ppb;C Virginia contributes 6% of the total manmade ppb >= 85 ppb in North Carolina;C The highest daily average 8-hr contribution from Virginia to North Carolina is 15 ppb; which is 14%
of the average 8-hr ozone concentration >= 85 ppb in North Carolina on that day.West Virginia’s Contribution to North Carolina: UAM-V zero-out modeling:C West Virginia contributes at least 5 ppb to 15% of the 8-hr exceedences and at least 10 ppb to 4%
of the 8-hr exceedences in North Carolina; the maximum 8-hr contribution from West Virginia is 27ppb;
C The total contribution from West Virginia is equivalent to 15% of the total ppb >= 85 ppb in NorthCarolina.
CAMx modeling:C West Virginia contributes least 5 ppb to 16% of the 8-hr exceedences in North Carolina; the
maximum 8-hr contribution from West Virginia is 16 ppb;C West Virginia contributes 3% of the total manmade ppb >= 85 ppb in North Carolina;C The highest daily average 8-hr contribution from West Virginia to North Carolina is 5 ppb; which is
5% of the average 8-hr ozone concentration >= 85 ppb in North Carolina on that day.-- OhioAlabama’s Contribution to Ohio: UAM-V zero-out modeling:

D-29
C Alabama contributes at least 5 ppb to 7% of the 8-hr exceedences in Ohio; the maximum 8-hrcontribution from Alabama is 14 ppb;
C The total contribution from Alabama is equivalent to 8% of the total ppb >= 85 ppb in Ohio. CAMx modeling:C Alabama contributes at least 5 ppb to 11% of the 8-hr exceedences and at least 10 ppb to 8% of
the 8-hr exceedences in Ohio; the maximum 8-hr contribution from Alabama is 22 ppb;C Alabama contributes 3% of the total manmade ppb >= 85 ppb in Ohio;C The highest daily average 8-hr contribution from Alabama to Ohio is 11 ppb; which is 12% of the
average 8-hr ozone concentration >= 85 ppb in Ohio on that day.Illinois’s Contribution to Ohio: UAM-V zero-out modeling:C Illinois contributes at least 5 ppb to 10% of the 8-hr exceedences in Ohio; the maximum 8-hr
contribution from Illinois is 11 ppb;C The total contribution from Illinois is equivalent to 12% of the total ppb >= 85 ppb in Ohio. CAMx modeling:C Illinois contributes at least 5 ppb to 27% of the 8-hr exceedences and at least 10 ppb to 9% of the
8-hr exceedences in Ohio; the maximum 8-hr contribution from Illinois is 18 ppb;C Illinois contributes 4% of the total manmade ppb >= 85 ppb in Ohio;C The highest daily average 8-hr contribution from Illinois to Ohio is 10 ppb; which is 11% of the
average 8-hr ozone concentration >= 85 ppb in Ohio on that day.Indiana’s Contribution to Ohio: UAM-V zero-out modeling:C Indiana contributes at least 5 ppb to 33% of the 8-hr exceedences and at least 10 ppb to 11% of
the 8-hr exceedences in Ohio; the maximum 8-hr contribution from Indiana is 21 ppb;C The total contribution from Indiana is equivalent to 32% of the total ppb >= 85 ppb in Ohio. CAMx modeling:C Indiana contributes at least 10 ppb to 34% of the 8-hr exceedences in Ohio; the maximum 8-hr
contribution from Indiana is 31 ppb;C Indiana contributes 11% of the total manmade ppb >= 85 ppb in Ohio;C The highest daily average 8-hr contribution from Indiana to Ohio is 17 ppb; which is 19% of the
average 8-hr ozone concentration >= 85 ppb in Ohio on that day.Kentucky’s Contribution to Ohio: UAM-V zero-out modeling:C Kentucky contributes at least 10 ppb to 31% of the 8-hr exceedences in Ohio; the maximum 8-hr
contribution from Kentucky is 51 ppb;C The total contribution from Kentucky is equivalent to 50% of the total ppb >= 85 ppb in Ohio. CAMx modeling:C Kentucky contributes at least 10 ppb to 43% of the 8-hr exceedences in Ohio; the maximum 8-hr
contribution from Kentucky is 52 ppb;C Kentucky contributes 15% of the total manmade ppb >= 85 ppb in Ohio;C The highest daily average 8-hr contribution from Kentucky to Ohio is 25 ppb; which is 27% of the
average 8-hr ozone concentration >= 85 ppb in Ohio on that day.Michigan’s Contribution to Ohio: UAM-V zero-out modeling:C Michigan contributes at least 10 ppb to 16% of the 8-hr exceedences in Ohio; the maximum 8-hr
contribution from Michigan is 45 ppb;C The total contribution from Michigan is equivalent to 24% of the total ppb >= 85 ppb in Ohio. CAMx modeling:C Michigan contributes at least 10 ppb to 19% of the 8-hr exceedences in Ohio; the maximum 8-hr
contribution from Michigan is 42 ppb;C Michigan contributes 6% of the total manmade ppb >= 85 ppb in Ohio;C The highest daily average 8-hr contribution from Michigan to Ohio is 19 ppb; which is 21% of the
average 8-hr ozone concentration >= 85 ppb in Ohio on that day.Missouri’s Contribution to Ohio:

D-30
UAM-V zero-out modeling:C Missouri contributes at least 2 ppb to 4% of the 8-hr exceedences in Ohio; the maximum 8-hr
contribution from Missouri is 5 ppb;C The total contribution from Missouri is equivalent to 2% of the total ppb >= 85 ppb in Ohio. CAMx modeling:C Missouri contributes at least 2 ppb to 12% of the 8-hr exceedences and at least 5 ppb to 2% of the
8-hr exceedences in Ohio; the maximum 8-hr contribution from Missouri is 14 ppb;C The highest daily average 8-hr contribution from Missouri to Ohio is 6 ppb; which is 6% of the
average 8-hr ozone concentration >= 85 ppb in Ohio on that day.North Carolina’s Contribution to Ohio: UAM-V zero-out modeling:C North Carolina contributes at least 2 ppb to 7% of the 8-hr exceedences in Ohio; the maximum 8-
hr contribution from North Carolina is 7 ppb;C The total contribution from North Carolina is equivalent to 7% of the total ppb >= 85 ppb in Ohio. CAMx modeling:C North Carolina contributes at least 2 ppb to 28% of the 8-hr exceedences and at least 5 ppb to 3%
of the 8-hr exceedences in Ohio; the maximum 8-hr contribution from North Carolina is 9 ppb;C North Carolina contributes 2% of the total manmade ppb >= 85 ppb in Ohio.Pennsylvania’s Contribution to Ohio: CAMx modeling:C Pennsylvania contributes at least 2 ppb to 5% of the 8-hr exceedences and at least 5 ppb to 3%
of the 8-hr exceedences in Ohio; the maximum 8-hr contribution from Pennsylvania is 32 ppb;C The highest daily average 8-hr contribution from Pennsylvania to Ohio is 8 ppb; which is 8% of the
average 8-hr ozone concentration >= 85 ppb in Ohio on that day.Tennessee’s Contribution to Ohio: UAM-V zero-out modeling:C Tennessee contributes at least 5 ppb to 14% of the 8-hr exceedences in Ohio; the maximum 8-hr
contribution from Tennessee is 11 ppb;C The total contribution from Tennessee is equivalent to 18% of the total ppb >= 85 ppb in Ohio. CAMx modeling:C Tennessee contributes at least 5 ppb to 36% of the 8-hr exceedences and at least 10 ppb to 19%
of the 8-hr exceedences in Ohio; the maximum 8-hr contribution from Tennessee is 27 ppb;C Tennessee contributes 7% of the total manmade ppb >= 85 ppb in Ohio;C The highest daily average 8-hr contribution from Tennessee to Ohio is 13 ppb; which is 14% of the
average 8-hr ozone concentration >= 85 ppb in Ohio on that day.Virginia’s Contribution to Ohio: UAM-V zero-out modeling:C Virginia contributes at least 2 ppb to 6% of the 8-hr exceedences in Ohio; the maximum 8-hr
contribution from Virginia is 8 ppb;C The total contribution from Virginia is equivalent to 7% of the total ppb >= 85 ppb in Ohio. CAMx modeling:C Virginia contributes at least 2 ppb to 21% of the 8-hr exceedences in Ohio; the maximum 8-hr
contribution from Virginia is 14 ppb;C The highest daily average 8-hr contribution from Virginia to Ohio is 5 ppb; which is 6% of the
average 8-hr ozone concentration >= 85 ppb in Ohio on that day.West Virginia’s Contribution to Ohio: UAM-V zero-out modeling:C West Virginia contributes at least 5 ppb to 30% of the 8-hr exceedences and at least 10 ppb to
16% of the 8-hr exceedences in Ohio; the maximum 8-hr contribution from West Virginia is 53ppb;
C The total contribution from West Virginia is equivalent to 30% of the total ppb >= 85 ppb in Ohio. CAMx modeling:C West Virginia contributes at least 5 ppb to 27% of the 8-hr exceedences and at least 10 ppb to
13% of the 8-hr exceedences in Ohio; the maximum 8-hr contribution from West Virginia is 68

D-31
ppb;C West Virginia contributes 8% of the total manmade ppb >= 85 ppb in Ohio;C The highest daily average 8-hr contribution from West Virginia to Ohio is 30 ppb; which is 33% of
the average 8-hr ozone concentration >= 85 ppb in Ohio on that day.-- PennsylvaniaAlabama’s Contribution to Pennsylvania: UAM-V zero-out modeling:C Alabama contributes at least 2 ppb to 4% of the 8-hr exceedences in Pennsylvania; the maximum
8-hr contribution from Alabama is 5 ppb;C The total contribution from Alabama is equivalent to 2% of the total ppb >= 85 ppb in
Pennsylvania. CAMx modeling:C Alabama contributes at least 2 ppb to 14% of the 8-hr exceedences and at least 5 ppb to 5% of
the 8-hr exceedences in Pennsylvania; the maximum 8-hr contribution from Alabama is 12 ppb;C The highest daily average 8-hr contribution from Alabama to Pennsylvania is 7 ppb; which is 8%
of the average 8-hr ozone concentration >= 85 ppb in Pennsylvania on that day.Illinois’s Contribution to Pennsylvania: UAM-V zero-out modeling:C Illinois contributes at least 2 ppb to 14% of the 8-hr exceedences and at least 5 ppb to 2% of the
8-hr exceedences in Pennsylvania; the maximum 8-hr contribution from Illinois is 10 ppb;C The total contribution from Illinois is equivalent to 7% of the total ppb >= 85 ppb in Pennsylvania. CAMx modeling:C Illinois contributes at least 2 ppb to 35% of the 8-hr exceedences and at least 5 ppb to 18% of the
8-hr exceedences in Pennsylvania; the maximum 8-hr contribution from Illinois is 16 ppb;C Illinois contributes 3% of the total manmade ppb >= 85 ppb in Pennsylvania;C The highest daily average 8-hr contribution from Illinois to Pennsylvania is 7 ppb; which is 7% of
the average 8-hr ozone concentration >= 85 ppb in Pennsylvania on that day.Indiana’s Contribution to Pennsylvania: UAM-V zero-out modeling:C Indiana contributes at least 2 ppb to 19% of the 8-hr exceedences and at least 5 ppb to 6% of the
8-hr exceedences in Pennsylvania; the maximum 8-hr contribution from Indiana is 10 ppb;C The total contribution from Indiana is equivalent to 10% of the total ppb >= 85 ppb in
Pennsylvania. CAMx modeling:C Indiana contributes at least 5 ppb to 23% of the 8-hr exceedences and at least 10 ppb to 5% of
the 8-hr exceedences in Pennsylvania; the maximum 8-hr contribution from Indiana is 14 ppb;C Indiana contributes 4% of the total manmade ppb >= 85 ppb in Pennsylvania;C The highest daily average 8-hr contribution from Indiana to Pennsylvania is 9 ppb; which is 11% of
the average 8-hr ozone concentration >= 85 ppb in Pennsylvania on that day.Kentucky’s Contribution to Pennsylvania: UAM-V zero-out modeling:C Kentucky contributes at least 2 ppb to 28% of the 8-hr exceedences and at least 5 ppb to 9% of
the 8-hr exceedences in Pennsylvania; the maximum 8-hr contribution from Kentucky is 12 ppb;C The total contribution from Kentucky is equivalent to 13% of the total ppb >= 85 ppb in
Pennsylvania. CAMx modeling:C Kentucky contributes at least 5 ppb to 33% of the 8-hr exceedences and at least 10 ppb to 11% of
the 8-hr exceedences in Pennsylvania; the maximum 8-hr contribution from Kentucky is 20 ppb;C Kentucky contributes 5% of the total manmade ppb >= 85 ppb in Pennsylvania;C The highest daily average 8-hr contribution from Kentucky to Pennsylvania is 10 ppb; which is
11% of the average 8-hr ozone concentration >= 85 ppb in Pennsylvania on that day.Maryland/DC/Delaware’s Contribution to Pennsylvania: CAMx modeling:C Maryland/DC/Delaware contribute at least 10 ppb to 17% of the 8-hr exceedences in

D-32
Pennsylvania; the maximum 8-hr contribution from Maryland/DC/Delaware is 50 ppb;C Maryland/DC/Delaware contribute 6% of the total manmade ppb >= 85 ppb in Pennsylvania;C The highest daily average 8-hr contribution from Maryland/DC/Delaware to Pennsylvania is 27
ppb; which is 30% of the average 8-hr ozone concentration >= 85 ppb in Pennsylvania on thatday.
Michigan’s Contribution to Pennsylvania: UAM-V zero-out modeling:C Michigan contributes at least 2 ppb to 13% of the 8-hr exceedences and at least 5 ppb to 4% of
the 8-hr exceedences in Pennsylvania; the maximum 8-hr contribution from Michigan is 24 ppb;C The total contribution from Michigan is equivalent to 7% of the total ppb >= 85 ppb in
Pennsylvania. CAMx modeling:C Michigan contributes at least 2 ppb to 23% of the 8-hr exceedences and at least 5 ppb to 11% of
the 8-hr exceedences in Pennsylvania; the maximum 8-hr contribution from Michigan is 30 ppb;C Michigan contributes 2% of the total manmade ppb >= 85 ppb in Pennsylvania;C The highest daily average 8-hr contribution from Michigan to Pennsylvania is 8 ppb; which is 9%
of the average 8-hr ozone concentration >= 85 ppb in Pennsylvania on that day.Missouri’s Contribution to Pennsylvania: UAM-V zero-out modeling:C Missouri contributes at least 2 ppb to 3% of the 8-hr exceedences in Pennsylvania; the maximum
8-hr contribution from Missouri is 4 ppb;C The total contribution from Missouri is equivalent to 2% of the total ppb >= 85 ppb in
Pennsylvania. CAMx modeling:C Missouri contributes at least 2 ppb to 18% of the 8-hr exceedences in Pennsylvania; the maximum
8-hr contribution from Missouri is 8 ppb;C The highest daily average 8-hr contribution from Missouri to Pennsylvania is 4 ppb; which is 5% of
the average 8-hr ozone concentration >= 85 ppb in Pennsylvania on that day.New Jersey’s Contribution to Pennsylvania: CAMx modeling:C New Jersey contributes at least 2 ppb to 5% of the 8-hr exceedences in Pennsylvania; the
maximum 8-hr contribution from New Jersey is 40 ppb;C The highest daily average 8-hr contribution from New Jersey to Pennsylvania is 17 ppb; which is
19% of the average 8-hr ozone concentration >= 85 ppb in Pennsylvania on that day.New York’s Contribution to Pennsylvania: CAMx modeling:C New York contributes at least 2 ppb to 8% of the 8-hr exceedences in Pennsylvania; the maximum
8-hr contribution from New York is 11 ppb;C The highest daily average 8-hr contribution from New York to Pennsylvania is 5 ppb; which is 6%
of the average 8-hr ozone concentration >= 85 ppb in Pennsylvania on that day.North Carolina’s Contribution to Pennsylvania: UAM-V zero-out modeling:C North Carolina contributes at least 2 ppb to 11% of the 8-hr exceedences in Pennsylvania; the
maximum 8-hr contribution from North Carolina is 5 ppb;C The total contribution from North Carolina is equivalent to 8% of the total ppb >= 85 ppb in
Pennsylvania. CAMx modeling:C North Carolina contributes at least 2 ppb to 28% of the 8-hr exceedences and at least 5 ppb to 4%
of the 8-hr exceedences in Pennsylvania; the maximum 8-hr contribution from North Carolina is 11ppb;
C North Carolina contributes 2% of the total manmade ppb >= 85 ppb in Pennsylvania;C The highest daily average 8-hr contribution from North Carolina to Pennsylvania is 11 ppb; which
is 13% of the average 8-hr ozone concentration >= 85 ppb in Pennsylvania on that day.Ohio’s Contribution to Pennsylvania:

D-33
UAM-V zero-out modeling:C Ohio contributes at least 5 ppb to 34% of the 8-hr exceedences and at least 10 ppb to 11% of the
8-hr exceedences in Pennsylvania; the maximum 8-hr contribution from Ohio is 48 ppb;C The total contribution from Ohio is equivalent to 33% of the total ppb >= 85 ppb in Pennsylvania. CAMx modeling:C Ohio contributes at least 10 ppb to 48% of the 8-hr exceedences in Pennsylvania; the maximum
8-hr contribution from Ohio is 55 ppb;C Ohio contributes 15% of the total manmade ppb >= 85 ppb in Pennsylvania;C The highest daily average 8-hr contribution from Ohio to Pennsylvania is 18 ppb; which is 20% of
the average 8-hr ozone concentration >= 85 ppb in Pennsylvania on that day.Tennessee’s Contribution to Pennsylvania: UAM-V zero-out modeling:C Tennessee contributes at least 2 ppb to 4% of the 8-hr exceedences in Pennsylvania; the
maximum 8-hr contribution from Tennessee is 4 ppb;C The total contribution from Tennessee is equivalent to 5% of the total ppb >= 85 ppb in
Pennsylvania. CAMx modeling:C Tennessee contributes at least 2 ppb to 40% of the 8-hr exceedences in Pennsylvania; the
maximum 8-hr contribution from Tennessee is 13 ppb;C Tennessee contributes 2% of the total manmade ppb >= 85 ppb in Pennsylvania;C The highest daily average 8-hr contribution from Tennessee to Pennsylvania is 5 ppb; which is 5%
of the average 8-hr ozone concentration >= 85 ppb in Pennsylvania on that day.Virginia’s Contribution to Pennsylvania: UAM-V zero-out modeling:C Virginia contributes at least 5 ppb to 12% of the 8-hr exceedences and at least 10 ppb to 5% of
the 8-hr exceedences in Pennsylvania; the maximum 8-hr contribution from Virginia is 23 ppb;C The total contribution from Virginia is equivalent to 19% of the total ppb >= 85 ppb in
Pennsylvania. CAMx modeling:C Virginia contributes at least 5 ppb to 24% of the 8-hr exceedences and at least 10 ppb to 10% of
the 8-hr exceedences in Pennsylvania; the maximum 8-hr contribution from Virginia is 34 ppb;C Virginia contributes 5% of the total manmade ppb >= 85 ppb in Pennsylvania;C The highest daily average 8-hr contribution from Virginia to Pennsylvania is 14 ppb; which is 16%
of the average 8-hr ozone concentration >= 85 ppb in Pennsylvania on that day.West Virginia’s Contribution to Pennsylvania: UAM-V zero-out modeling:C West Virginia contributes at least 10 ppb to 30% of the 8-hr exceedences in Pennsylvania; the
maximum 8-hr contribution from West Virginia is 45 ppb;C The total contribution from West Virginia is equivalent to 47% of the total ppb >= 85 ppb in
Pennsylvania. CAMx modeling:C West Virginia contributes at least 10 ppb to 31% of the 8-hr exceedences in Pennsylvania; the
maximum 8-hr contribution from West Virginia is 63 ppb;C West Virginia contributes 12% of the total manmade ppb >= 85 ppb in Pennsylvania;C The highest daily average 8-hr contribution from West Virginia to Pennsylvania is 26 ppb; which is
28% of the average 8-hr ozone concentration >= 85 ppb in Pennsylvania on that day.-- Rhode IslandIllinois’s Contribution to Rhode Island: UAM-V zero-out modeling:C Illinois contributes at least 2 ppb to 3% of the 8-hr exceedences in Rhode Island; the maximum 8-
hr contribution from Illinois is 3 ppb;C The total contribution from Illinois is equivalent to 4% of the total ppb >= 85 ppb in Rhode Island. CAMx modeling:C Illinois contributes at least 2 ppb to 18% of the 8-hr exceedences and at least 5 ppb to 2% of the

D-34
8-hr exceedences in Rhode Island; the maximum 8-hr contribution from Illinois is 6 ppb;C Illinois contributes 3% of the total manmade ppb >= 85 ppb in Rhode Island in one episode;C The highest daily average 8-hr contribution from Illinois to Rhode Island is 5 ppb; which is 4% of
the average 8-hr ozone concentration >= 85 ppb in Rhode Island on that day.Maryland/DC/Delaware’s Contribution to Rhode Island: CAMx modeling:C Maryland/DC/Delaware contribute at least 5 ppb to 34% of the 8-hr exceedences in Rhode Island;
the maximum 8-hr contribution from Maryland/DC/Delaware is 15 ppb;C Maryland/DC/Delaware contribute 5% of the total manmade ppb >= 85 ppb in Rhode Island;C The highest daily average 8-hr contribution from Maryland/DC/Delaware to Rhode Island is 9 ppb;
which is 11% of the average 8-hr ozone concentration >= 85 ppb in Rhode Island on that day.New Jersey’s Contribution to Rhode Island: CAMx modeling:C New Jersey contributes at least 10 ppb to 61% of the 8-hr exceedences in Rhode Island; the
maximum 8-hr contribution from New Jersey is 36 ppb;C New Jersey contributes 17% of the total manmade ppb >= 85 ppb in Rhode Island;C The highest daily average 8-hr contribution from New Jersey to Rhode Island is 19 ppb; which is
20% of the average 8-hr ozone concentration >= 85 ppb in Rhode Island on that day.New York’s Contribution to Rhode Island: CAMx modeling:C New York contributes at least 10 ppb to 84% of the 8-hr exceedences in Rhode Island; the
maximum 8-hr contribution from New York is 34 ppb;C New York contributes 20% of the total manmade ppb >= 85 ppb in Rhode Island;C The highest daily average 8-hr contribution from New York to Rhode Island is 25 ppb; which is
27% of the average 8-hr ozone concentration >= 85 ppb in Rhode Island on that day.North Carolina’s Contribution to Rhode Island: UAM-V zero-out modeling:C North Carolina contributes at least 2 ppb to 3% of the 8-hr exceedences in Rhode Island; the
maximum 8-hr contribution from North Carolina is 3 ppb;C The total contribution from North Carolina is equivalent to 3% of the total ppb >= 85 ppb in Rhode
Island. CAMx modeling:C North Carolina contributes at least 2 ppb to 14% of the 8-hr exceedences and at least 5 ppb to 8%
of the 8-hr exceedences in Rhode Island; the maximum 8-hr contribution from North Carolina is 10ppb;
C North Carolina contributes 2% of the total manmade ppb >= 85 ppb in Rhode Island;C The highest daily average 8-hr contribution from North Carolina to Rhode Island is 6 ppb; which is
7% of the average 8-hr ozone concentration >= 85 ppb in Rhode Island on that day.Ohio’s Contribution to Rhode Island: UAM-V zero-out modeling:C Ohio contributes at least 2 ppb to 33% of the 8-hr exceedences in Rhode Island; the maximum 8-
hr contribution from Ohio is 4 ppb;C The total contribution from Ohio is equivalent to 14% of the total ppb >= 85 ppb in Rhode Island. CAMx modeling:C Ohio contributes at least 5 ppb to 29% of the 8-hr exceedences in Rhode Island; the maximum 8-
hr contribution from Ohio is 11 ppb;C Ohio contributes 4% of the total manmade ppb >= 85 ppb in Rhode Island;C The highest daily average 8-hr contribution from Ohio to Rhode Island is 9 ppb; which is 9% of the
average 8-hr ozone concentration >= 85 ppb in Rhode Island on that day.Pennsylvania’s Contribution to Rhode Island: CAMx modeling:C Pennsylvania contributes at least at least 5 ppb to 82% of the 8-hr exceedences and at least 10
ppb to 39% of the 8-hr exceedences in Rhode Island; the maximum 8-hr contribution fromPennsylvania is 24 ppb;

D-35
C Pennsylvania contributes 12% of the total manmade ppb >= 85 ppb in Rhode Island;C The highest daily average 8-hr contribution from Pennsylvania to Rhode Island is 21 ppb; which is
23% of the average 8-hr ozone concentration >= 85 ppb in Rhode Island on that day.Virginia’s Contribution to Rhode Island: UAM-V zero-out modeling:C Virginia contributes at least 2 ppb to 22% of the 8-hr exceedences in Rhode Island; the maximum
8-hr contribution from Virginia is 6 ppb;C The total contribution from Virginia is equivalent to 11% of the total ppb >= 85 ppb in Rhode
Island. CAMx modeling:C Virginia contributes at least 5 ppb to 24% of the 8-hr exceedences and at least 10 ppb to 7% of
the 8-hr exceedences in Rhode Island; the maximum 8-hr contribution from Virginia is 19 ppb;C Virginia contributes 4% of the total manmade ppb >= 85 ppb in Rhode Island;C The highest daily average 8-hr contribution from Virginia to Rhode Island is 11 ppb; which is 12%
of the average 8-hr ozone concentration >= 85 ppb in Rhode Island on that day.West Virginia’s Contribution to Rhode Island: UAM-V zero-out modeling:C West Virginia contributes at least 2 ppb to 38% of the 8-hr exceedences in Rhode Island; the
maximum 8-hr contribution from West Virginia is 4 ppb;C The total contribution from West Virginia is equivalent to 13% of the total ppb >= 85 ppb in Rhode
Island. CAMx modeling:C West Virginia contributes at least 5 ppb to 16% of the 8-hr exceedences in Rhode Island; the
maximum 8-hr contribution from West Virginia is 7 ppb;C West Virginia contributes 2% of the total manmade ppb >= 85 ppb in Rhode Island;C The highest daily average 8-hr contribution from West Virginia to Rhode Island is 6 ppb; which is
7% of the average 8-hr ozone concentration >= 85 ppb in Rhode Island on that day.-- South CarolinaAlabama’s Contribution to South Carolina: UAM-V zero-out modeling:C Alabama contributes at least 2 ppb to 14% of the 8-hr exceedences in South Carolina; the
maximum 8-hr contribution from Alabama is 6 ppb;C The total contribution from Alabama is equivalent to 5% of the total ppb >= 85 ppb in South
Carolina. CAMx modeling:C Alabama contributes at least 5 ppb to 22% of the 8-hr exceedences and at least 10 ppb to 5% of
the 8-hr exceedences in South Carolina; the maximum 8-hr contribution from Alabama is 20 ppb;C Alabama contributes 4% of the total manmade ppb >= 85 ppb in South Carolina;C The highest daily average 8-hr contribution from Alabama to South Carolina is 10 ppb; which is
11% of the average 8-hr ozone concentration >= 85 ppb in South Carolina on that day.Georgia’s Contribution to South Carolina: UAM-V zero-out modeling:C Georgia contributes at least 10 ppb to 19% of the 8-hr exceedences in South Carolina; the
maximum 8-hr contribution from Georgia is 29 ppb;C The total contribution from Georgia is equivalent to 19% of the total ppb >= 85 ppb in South
Carolina. CAMx modeling:C Georgia contributes at least 5 ppb to 51% of the 8-hr exceedences and at least 10 ppb to 13% of
the 8-hr exceedences in South Carolina; the maximum 8-hr contribution from Georgia is 61 ppb;C Georgia contributes 15% of the total manmade ppb >= 85 ppb in South Carolina;C The highest daily average 8-hr contribution from Georgia to South Carolina is 33 ppb; which is
36% of the average 8-hr ozone concentration >= 85 ppb in South Carolina on that day.Kentucky’s Contribution to South Carolina: UAM-V zero-out modeling:

D-36
C Kentucky contributes at least 2 ppb to 15% of the 8-hr exceedences in South Carolina; themaximum 8-hr contribution from Kentucky is 5 ppb;
C The total contribution from Kentucky is equivalent to 7% of the total ppb >= 85 ppb in SouthCarolina.
CAMx modeling:C Kentucky contributes at least 2 ppb to 46% of the 8-hr exceedences and at least 5 ppb to 9% of
the 8-hr exceedences in South Carolina; the maximum 8-hr contribution from Kentucky is 10 ppb;C Kentucky contributes 3% of the total manmade ppb >= 85 ppb in South Carolina;C The highest daily average 8-hr contribution from Kentucky to South Carolina is 9 ppb; which is
10% of the average 8-hr ozone concentration >= 85 ppb in South Carolina on that day.North Carolina’s Contribution to South Carolina: UAM-V zero-out modeling:C North Carolina contributes at least 5 ppb to 49% of the 8-hr exceedences and at least 10 ppb to
31% of the 8-hr exceedences in South Carolina; the maximum 8-hr contribution from NorthCarolina is 44 ppb;
C The total contribution from North Carolina is equivalent to 43% of the total ppb >= 85 ppb in SouthCarolina.
CAMx modeling:C North Carolina contributes at least 10 ppb to 39% of the 8-hr exceedences in South Carolina; the
maximum 8-hr contribution from North Carolina is 45 ppb;C North Carolina contributes 13% of the total manmade ppb >= 85 ppb in South Carolina;C The highest daily average 8-hr contribution from North Carolina to South Carolina is 33 ppb; which
is 37% of the average 8-hr ozone concentration >= 85 ppb in South Carolina on that day.Tennessee’s Contribution to South Carolina: UAM-V zero-out modeling:C Tennessee contributes at least 5 ppb to 35% of the 8-hr exceedences and at least 10 ppb to 16%
of the 8-hr exceedences in South Carolina; the maximum 8-hr contribution from Tennessee is 25ppb;
C The total contribution from Tennessee is equivalent to 27% of the total ppb >= 85 ppb in SouthCarolina.
CAMx modeling:C Tennessee contributes at least 5 ppb to 54% of the 8-hr exceedences and at least 10 ppb to 37%
of the 8-hr exceedences in South Carolina; the maximum 8-hr contribution from Tennessee is 26ppb;
C Tennessee contributes 10% of the total manmade ppb >= 85 ppb in South Carolina;C The highest daily average 8-hr contribution from Tennessee to South Carolina is 14 ppb; which is
15% of the average 8-hr ozone concentration >= 85 ppb in South Carolina on that day.Virginia’s Contribution to South Carolina: UAM-V zero-out modeling:C Virginia contributes at least 2 ppb to 9% of the 8-hr exceedences in South Carolina; the maximum
8-hr contribution from Virginia is 4 ppb;C The total contribution from Virginia is equivalent to 6% of the total ppb >= 85 ppb in South
Carolina. CAMx modeling:C Virginia contributes at least 2 ppb to 22% of the 8-hr exceedences in South Carolina; the
maximum 8-hr contribution from Virginia is 6 ppb;C The highest daily average 8-hr contribution from Virginia to South Carolina is 4 ppb; which is 4%
of the average 8-hr ozone concentration >= 85 ppb in South Carolina on that day.West Virginia’s Contribution to South Carolina: UAM-V zero-out modeling:C West Virginia contributes at least 2 ppb to 11% of the 8-hr exceedences in South Carolina; the
maximum 8-hr contribution from West Virginia is 5 ppb;C The total contribution from West Virginia is equivalent to 7% of the total ppb >= 85 ppb in South
Carolina.

D-37
CAMx modeling:C West Virginia contributes at least 2 ppb to 23% of the 8-hr exceedences in South Carolina; the
maximum 8-hr contribution from West Virginia is 6 ppb.-- TennesseeAlabama’s Contribution to Tennessee: UAM-V zero-out modeling:C Alabama contributes at least 5 ppb to 12% of the 8-hr exceedences in Tennessee; the maximum
8-hr contribution from Alabama is 52 ppb;C The total contribution from Alabama is equivalent to 10% of the total ppb >= 85 ppb in Tennessee. CAMx modeling:C Alabama contributes at least 10 ppb to 20% of the 8-hr exceedences and at least 10 ppb to 8% of
the 8-hr exceedences in Tennessee; the maximum 8-hr contribution from Alabama is 76 ppb;C Alabama contributes 7% of the total manmade ppb >= 85 ppb in Tennessee;C The highest daily average 8-hr contribution from Alabama to Tennessee is 21 ppb; which is 24%
of the average 8-hr ozone concentration >= 85 ppb in Tennessee on that day.Georgia’s Contribution to Tennessee: UAM-V zero-out modeling:C Georgia contributes at least 5 ppb to 11% of the 8-hr exceedences in Tennessee; the maximum 8-
hr contribution from Georgia is 23 ppb;C The total contribution from Georgia is equivalent to 9% of the total ppb >= 85 ppb in Tennessee. CAMx modeling:C Georgia contributes at least 5 ppb to 25% of the 8-hr exceedences in Tennessee; the maximum 8-
hr contribution from Georgia is 45 ppb;C Georgia contributes 5% of the total manmade ppb >= 85 ppb in Tennessee;C The highest daily average 8-hr contribution from Georgia to Tennessee is 16 ppb; which is 16% of
the average 8-hr ozone concentration >= 85 ppb in Tennessee on that day.Illinois’s Contribution to Tennessee: UAM-V zero-out modeling:C Illinois contributes at least 2 ppb to 7% of the 8-hr exceedences in Tennessee; the maximum 8-hr
contribution from Illinois is 5 ppb;C The total contribution from Illinois is equivalent to 3% of the total ppb >= 85 ppb in Tennessee. CAMx modeling:C Illinois contributes at least 2 ppb to 11% of the 8-hr exceedences and at least 5 ppb to 5% of the
8-hr exceedences in Tennessee; the maximum 8-hr contribution from Illinois is 17 ppb;C The highest daily average 8-hr contribution from Illinois to Tennessee is 8 ppb; which is 8% of the
average 8-hr ozone concentration >= 85 ppb in Tennessee on that day.Indiana’s Contribution to Tennessee: UAM-V zero-out modeling:C Indiana contributes at least 2 ppb to 7% of the 8-hr exceedences and at least 5 ppb to 2% of the
8-hr exceedences in Tennessee; the maximum 8-hr contribution from Indiana is 10 ppb;C The total contribution from Indiana is equivalent to 3% of the total ppb >= 85 ppb in Tennessee. CAMx modeling:C Indiana contributes at least 5 ppb to 5% of the 8-hr exceedences in Tennessee; the maximum 8-hr
contribution from Indiana is 13 ppb;C The highest daily average 8-hr contribution from Indiana to Tennessee is 6 ppb; which is 7% of
the average 8-hr ozone concentration >= 85 ppb in Tennessee on that day.Kentucky’s Contribution to Tennessee: UAM-V zero-out modeling:C Kentucky contributes at least 5 ppb to 23% of the 8-hr exceedences in Tennessee; the maximum
8-hr contribution from Kentucky is 27 ppb;C The total contribution from Kentucky is equivalent to 19% of the total ppb >= 85 ppb in Tennessee. CAMx modeling:C Kentucky contributes at least 10 ppb to 26% of the 8-hr exceedences in Tennessee; the maximum
8-hr contribution from Kentucky is 52 ppb;

D-38
C Kentucky contributes 8% of the total manmade ppb >= 85 ppb in Tennessee;C The highest daily average 8-hr contribution from Kentucky to Tennessee is 16 ppb; which is 15%
of the average 8-hr ozone concentration >= 85 ppb in Tennessee on that day.Missouri’s Contribution to Tennessee: UAM-V zero-out modeling:C Missouri contributes at least 2 ppb to 4% of the 8-hr exceedences in Tennessee; the maximum 8-
hr contribution from Missouri is 5 ppb;C The total contribution from Missouri is equivalent to 2% of the total ppb >= 85 ppb in Tennessee. CAMx modeling:C Missouri contributes at least 2 ppb to 15% of the 8-hr exceedences and at least 5 ppb to 3% of the
8-hr exceedences in Tennessee; the maximum 8-hr contribution from Missouri is 11 ppb;C The highest daily average 8-hr contribution from Missouri to Tennessee is 6 ppb; which is 6% of
the average 8-hr ozone concentration >= 85 ppb in Tennessee on that day.North Carolina’s Contribution to Tennessee: UAM-V zero-out modeling:C North Carolina contributes at least 2 ppb to 14% of the 8-hr exceedences in Tennessee; the
maximum 8-hr contribution from North Carolina is 16 ppb;C The total contribution from North Carolina is equivalent to 6% of the total ppb >= 85 ppb in
Tennessee. CAMx modeling:C North Carolina contributes at least 5 ppb to 14% of the 8-hr exceedences in Tennessee; the
maximum 8-hr contribution from North Carolina is 34 ppb;C North Carolina contributes 3% of the total manmade ppb >= 85 ppb in Tennessee.C The highest daily average 8-hr contribution from North Carolina to Tennessee is 12 ppb; which is
13% of the average 8-hr ozone concentration >= 85 ppb in Tennessee on that day.Ohio’s Contribution to Tennessee: UAM-V zero-out modeling:C Ohio contributes at least 5 ppb to 5% of the 8-hr exceedences in Tennessee; the maximum 8-hr
contribution from Ohio is 16 ppb;C The total contribution from Ohio is equivalent to 5% of the total ppb >= 85 ppb in Tennessee. CAMx modeling:C Ohio contributes at least 5 ppb to 9% of the 8-hr exceedences in Tennessee; the maximum 8-hr
contribution from Ohio is 34 ppb;C Ohio contributes 3% of the total manmade ppb >= 85 ppb in Tennessee.C The highest daily average 8-hr contribution from Ohio to Tennessee is 8 ppb; which is 8% of the
average 8-hr ozone concentration >= 85 ppb in Tennessee on that day.South Carolina’s Contribution to Tennessee: UAM-V zero-out modeling:C South Carolina contributes at least 2 ppb to 10% of the 8-hr exceedences in Tennessee; the
maximum 8-hr contribution from South Carolina is 14 ppb;C The total contribution from South Carolina is equivalent to 4% of the total ppb >= 85 ppb in
Tennessee. CAMx modeling:C South Carolina contributes at least 5 ppb to 13% of the 8-hr exceedences in Tennessee; the
maximum 8-hr contribution from South Carolina is 21 ppb;C South Carolina contributes 3% of the total manmade ppb >= 85 ppb in Tennessee.C The highest daily average 8-hr contribution from South Carolina to Tennessee is 12 ppb; which is
12% of the average 8-hr ozone concentration >= 85 ppb in Tennessee on that day.West Virginia’s Contribution to Tennessee: UAM-V zero-out modeling:C West Virginia contributes at least 5 ppb to 4% of the 8-hr exceedences in Tennessee; the
maximum 8-hr contribution from West Virginia is 43 ppb;C The total contribution from West Virginia is equivalent to 5% of the total ppb >= 85 ppb in
Tennessee.

D-39
CAMx modeling:C West Virginia contributes at least 2 ppb to 11% of the 8-hr exceedences and at least 5 ppb to 4%
of the 8-hr exceedences in Tennessee; the maximum 8-hr contribution from West Virginia is 20ppb;
-- VirginiaAlabama’s Contribution to Virginia: UAM-V zero-out modeling:C Alabama contributes at least 2 ppb to 5% of the 8-hr exceedences in Virginia; the maximum 8-hr
contribution from Alabama is 6 ppb; CAMx modeling:C Alabama contributes at least 5 ppb to 8% of the 8-hr exceedences in Virginia; the maximum 8-hr
contribution from Alabama is 11 ppb;C The highest daily average 8-hr contribution from Alabama to Virginia is 8 ppb; which is 9% of the
average 8-hr ozone concentration >= 85 ppb in Virginia on that day.Georgia’s Contribution to Virginia: UAM-V zero-out modeling:C Georgia contributes at least 2 ppb to 6% of the 8-hr exceedences in Virginia; the maximum 8-hr
contribution from Georgia is 5 ppb; CAMx modeling:C Georgia contributes at least 5 ppb to 9% of the 8-hr exceedences in Virginia; the maximum 8-hr
contribution from Georgia is 14 ppb;C The highest daily average 8-hr contribution from Georgia to Virginia is 8 ppb; which is 8% of the
average 8-hr ozone concentration >= 85 ppb in Virginia on that day.Indiana’s Contribution to Virginia: UAM-V zero-out modeling:C Indiana contributes at least 2 ppb to 3% of the 8-hr exceedences in Virginia; the maximum 8-hr
contribution from Indiana is 3 ppb;C The total contribution from Indiana is equivalent to 2% of the total ppb >= 85 ppb in Virginia. CAMx modeling:C Indiana contributes at least 2 ppb to 23% of the 8-hr exceedences and at least 5 ppb to 7% of the
8-hr exceedences in Virginia; the maximum 8-hr contribution from Indiana is 10 ppb;C Indiana contributes 2% of the total manmade ppb >= 85 ppb in Virginia;C The highest daily average 8-hr contribution from Indiana to Virginia is 5 ppb; which is 5% of the
average 8-hr ozone concentration >= 85 ppb in Virginia on that day.Kentucky’s Contribution to Virginia: UAM-V zero-out modeling:C Kentucky contributes at least 2 ppb to 15% of the 8-hr exceedences in Virginia; the maximum 8-hr
contribution from Kentucky is 8 ppb;C The total contribution from Kentucky is equivalent to 4% of the total ppb >= 85 ppb in Virginia. CAMx modeling:C Kentucky contributes at least 5 ppb to 14% of the 8-hr exceedences in Virginia; the maximum 8-hr
contribution from Kentucky is 21 ppb;C Kentucky contributes 3% of the total manmade ppb >= 85 ppb in Virginia;C The highest daily average 8-hr contribution from Kentucky to Virginia is 7 ppb; which is 7% of the
average 8-hr ozone concentration >= 85 ppb in Virginia on that day.Maryland/DC/Delaware’s Contribution to Virginia: CAMx modeling:C Maryland/DC/Delaware contribute at least 5 ppb to 45% of the 8-hr exceedences in Virginia; the
maximum 8-hr contribution from Maryland/DC/Delaware is 60 ppb;C Maryland/DC/Delaware contribute 11% of the total manmade ppb >= 85 ppb in Virginia;C The highest daily average 8-hr contribution from Maryland/DC/Delaware to Virginia is 19 ppb;
which is 21% of the average 8-hr ozone concentration >= 85 ppb in Virginia on that day.North Carolina’s Contribution to Virginia: UAM-V zero-out modeling:

D-40
C North Carolina contributes at least 5 ppb to 19% of the 8-hr exceedences in Virginia; themaximum 8-hr contribution from North Carolina is 45 ppb;
C The total contribution from North Carolina is equivalent to 12% of the total ppb >= 85 ppb inVirginia.
CAMx modeling:C North Carolina contributes at least 5 ppb to 28% of the 8-hr exceedences in Virginia; the
maximum 8-hr contribution from North Carolina is 52 ppb;C North Carolina contributes 8% of the total manmade ppb >= 85 ppb in Virginia;C The highest daily average 8-hr contribution from North Carolina to Virginia is 41 ppb; which is 45%
of the average 8-hr ozone concentration >= 85 ppb in Virginia on that day.Ohio’s Contribution to Virginia: UAM-V zero-out modeling:C Ohio contributes at least 2 ppb to 19% of the 8-hr exceedences in Virginia; the maximum 8-hr
contribution from Ohio is 6 ppb;C The total contribution from Ohio is equivalent to 5% of the total ppb >= 85 ppb in Virginia. CAMx modeling:C Ohio contributes at least 5 ppb to 24% of the 8-hr exceedences in Virginia; the maximum 8-hr
contribution from Ohio is 11 ppb;C Ohio contributes 3% of the total manmade ppb >= 85 ppb in Virginia;C The highest daily average 8-hr contribution from Ohio to Virginia is 8 ppb; which is 8% of the
average 8-hr ozone concentration >= 85 ppb in Virginia on that day.Pennsylvania’s Contribution to Virginia: CAMx modeling:C Pennsylvania contributes at least 5 ppb to 45% of the 8-hr exceedences in Virginia; the maximum
8-hr contribution from Pennsylvania is 26 ppb;C Pennsylvania contributes 5% of the total manmade ppb >= 85 ppb in Virginia;C The highest daily average 8-hr contribution from Pennsylvania to Virginia is 9 ppb; which is 8% of
the average 8-hr ozone concentration >= 85 ppb in Virginia on that day. South Carolina’s Contribution to Virginia: UAM-V zero-out modeling:C South Carolina contributes at least 2 ppb to 6% of the 8-hr exceedences in Virginia; the maximum
8-hr contribution from South Carolina is 4 ppb; CAMx modeling:C South Carolina contributes at least 2 ppb to 12% of the 8-hr exceedences and at least 5 ppb to
6% of the 8-hr exceedences in Virginia; the maximum 8-hr contribution from South Carolina is 11ppb;
C The highest daily average 8-hr contribution from South Carolina to Virginia is 4 ppb; which is 4%of the average 8-hr ozone concentration >= 85 ppb in Virginia on that day.
Tennessee’s Contribution to Virginia: UAM-V zero-out modeling:C Tennessee contributes at least 2 ppb to 7% of the 8-hr exceedences in Virginia; the maximum 8-
hr contribution from Tennessee is 5 ppb;C The total contribution from Tennessee is equivalent to 2% of the total ppb >= 85 ppb in Virginia. CAMx modeling:C Tennessee contributes at least 5 ppb to 12% of the 8-hr exceedences in Virginia; the maximum 8-
hr contribution from Tennessee is 11 ppb;C Tennessee contributes 2% of the total manmade ppb >= 85 ppb in Virginia;C The highest daily average 8-hr contribution from Tennessee to Virginia is 7 ppb; which is 7% of
the average 8-hr ozone concentration >= 85 ppb in Virginia on that day.West Virginia’s Contribution to Virginia: UAM-V zero-out modeling:C West Virginia contributes at least 5 ppb to 23% of the 8-hr exceedences in Virginia; the maximum
8-hr contribution from West Virginia is 31 ppb;C The total contribution from West Virginia is equivalent to 13% of the total ppb >= 85 ppb in

D-41
Virginia. CAMx modeling:C West Virginia contributes at least 5 ppb to 28% of the 8-hr exceedences in Virginia; the maximum
8-hr contribution from West Virginia is 25 ppb;C West Virginia contributes 4% of the total manmade ppb >= 85 ppb in Virginia;C The highest daily average 8-hr contribution from West Virginia to Virginia is 13 ppb; which is 15%
of the average 8-hr ozone concentration >= 85 ppb in Virginia on that day.
-- West VirginiaIllinois’s Contribution to West Virginia: UAM-V zero-out modeling:C Illinois contributes at least 2 ppb to 25% of the 8-hr exceedences in West Virginia; the maximum
8-hr contribution from Illinois is 9 ppb;C The total contribution from Illinois is equivalent to 9% of the total ppb >= 85 ppb in West Virginia. CAMx modeling:C Illinois contributes at least 5 ppb to 18% of the 8-hr exceedences in West Virginia; the maximum
8-hr contribution from Illinois is 11 ppb;C Illinois contributes 3% of the total manmade ppb >= 85 ppb in West Virginia;C The highest daily average 8-hr contribution from Illinois to West Virginia is 9 ppb; which is 10% of
the average 8-hr ozone concentration >= 85 ppb in West Virginia on that day.Indiana’s Contribution to West Virginia: UAM-V zero-out modeling:C Indiana contributes at least 2 ppb to 46% of the 8-hr exceedences and at least 5 ppb to 8% of the
8-hr exceedences in West Virginia; the maximum 8-hr contribution from Indiana is 10 ppb;C The total contribution from Indiana is equivalent to 16% of the total ppb >= 85 ppb in West
Virginia. CAMx modeling:C Indiana contributes at least 5 ppb to 42% of the 8-hr exceedences in West Virginia; the maximum
8-hr contribution from Indiana is 18 ppb;C Indiana contributes 5% of the total manmade ppb >= 85 ppb in West Virginia;C The highest daily average 8-hr contribution from Indiana to West Virginia is 13 ppb; which is 14%
of the average 8-hr ozone concentration >= 85 ppb in West Virginia on that day.Kentucky’s Contribution to West Virginia: UAM-V zero-out modeling:C Kentucky contributes at least 10 ppb to 40% of the 8-hr exceedences in West Virginia; the
maximum 8-hr contribution from Kentucky is 40 ppb;C The total contribution from Kentucky is equivalent to 41% of the total ppb >= 85 ppb in West
Virginia. CAMx modeling:C Kentucky contributes at least 5 ppb to 69% of the 8-hr exceedences in West Virginia; the
maximum 8-hr contribution from Kentucky is 64 ppb;C Kentucky contributes 20% of the total manmade ppb >= 85 ppb in West Virginia;C The highest daily average 8-hr contribution from Kentucky to West Virginia is 29 ppb; which is
30% of the average 8-hr ozone concentration >= 85 ppb in West Virginia on that day.Michigan’s Contribution to West Virginia: UAM-V zero-out modeling:C Michigan contributes at least 2 ppb to 20% of the 8-hr exceedences in West Virginia; the
maximum 8-hr contribution from Michigan is 12 ppb;C The total contribution from Michigan is equivalent to 9% of the total ppb >= 85 ppb in West
Virginia. CAMx modeling:C Michigan contributes at least 5 ppb to 17% of the 8-hr exceedences in West Virginia; the
maximum 8-hr contribution from Michigan is 18 ppb;C Michigan contributes 3% of the total manmade ppb >= 85 ppb in West Virginia.

D-42
C The highest daily average 8-hr contribution from Michigan to West Virginia is 12 ppb; which is12% of the average 8-hr ozone concentration >= 85 ppb in West Virginia on that day.
North Carolina’s Contribution to West Virginia: UAM-V zero-out modeling:C North Carolina contributes at least 2 ppb to 7% of the 8-hr exceedences in West Virginia; the
maximum 8-hr contribution from North Carolina is 6 ppb;C The total contribution from North Carolina is equivalent to 4% of the total ppb >= 85 ppb in West
Virginia. CAMx modeling:C North Carolina contributes at least 2 ppb to 29% of the 8-hr exceedences and at least 5 ppb to 9%
of the 8-hr exceedences in West Virginia; the maximum 8-hr contribution from North Carolina is 11ppb;
C North Carolina contributes 2% of the total manmade ppb >= 85 ppb in West Virginia.C The highest daily average 8-hr contribution from North Carolina to West Virginia is 9 ppb; which is
10% of the average 8-hr ozone concentration >= 85 ppb in West Virginia on that day.Ohio’s Contribution to West Virginia: UAM-V zero-out modeling:C Ohio contributes at least 10 ppb to 40% of the 8-hr exceedences in West Virginia; the maximum 8-
hr contribution from Ohio is 39 ppb;C The total contribution from Ohio is equivalent to 54% of the total ppb >= 85 ppb in West Virginia. CAMx modeling:C Ohio contributes at least 10 ppb to 76% of the 8-hr exceedences in West Virginia; the maximum 8-
hr contribution from Ohio is 52 ppb;C Ohio contributes 26% of the total manmade ppb >= 85 ppb in West Virginia.C The highest daily average 8-hr contribution from Ohio to West Virginia is 36 ppb; which is 37% of
the average 8-hr ozone concentration >= 85 ppb in West Virginia on that day.Tennessee’s Contribution to West Virginia: UAM-V zero-out modeling:C Tennessee contributes at least 2 ppb to 15% of the 8-hr exceedences in West Virginia; the
maximum 8-hr contribution from Tennessee is 9 ppb;C The total contribution from Tennessee is equivalent to 7% of the total ppb >= 85 ppb in West
Virginia. CAMx modeling:C Tennessee contributes at least 5 ppb to 21% of the 8-hr exceedences in West Virginia; the
maximum 8-hr contribution from Tennessee is 18 ppb;C Tennessee contributes 4% of the total manmade ppb >= 85 ppb in West Virginia.C The highest daily average 8-hr contribution from Tennessee to West Virginia is 13 ppb; which is
14% of the average 8-hr ozone concentration >= 85 ppb in West Virginia on that day.Virginia’s Contribution to West Virginia: UAM-V zero-out modeling:C Virginia contributes at least 2 ppb to 10% of the 8-hr exceedences in West Virginia; the maximum
8-hr contribution from Virginia is 7 ppb;C The total contribution from Virginia is equivalent to 5% of the total ppb >= 85 ppb in West Virginia. CAMx modeling:C Virginia contributes at least 5 ppb to 10% of the 8-hr exceedences in West Virginia; the maximum
8-hr contribution from Virginia is 13 ppb;C Virginia contributes 2% of the total manmade ppb >= 85 ppb in West Virginia.C The highest daily average 8-hr contribution from Virginia to West Virginia is 9 ppb; which is 10% of
the average 8-hr ozone concentration >= 85 ppb in West Virginia on that day.-- WisconsinIllinois’s Contribution to Wisconsin: UAM-V zero-out modeling:C Illinois contributes at least 10 ppb to 94% of the 8-hr exceedences in Wisconsin; the maximum 8-
hr contribution from Illinois is 44 ppb;

D-43
C The total contribution from Illinois is equivalent to 100% of the total ppb >= 85 ppb in Wisconsin. CAMx modeling:C Illinois contributes at least 10 ppb to 99% of the 8-hr exceedences in Wisconsin; the maximum 8-
hr contribution from Illinois is 46 ppb;C Illinois contributes 42% of the total manmade ppb >= 85 ppb in Wisconsin;C The highest daily average 8-hr contribution from Illinois to Wisconsin is 44 ppb; which is 50% of
the average 8-hr ozone concentration >= 85 ppb in Wisconsin on that Indiana’s Contribution to Wisconsin: UAM-V zero-out modeling:C Indiana contributes at least 5 ppb to 11% of the 8-hr exceedences in Wisconsin; the maximum 8-
hr contribution from Indiana is 8 ppb;C The total contribution from Indiana is equivalent to 11% of the total ppb >= 85 ppb in Wisconsin. CAMx modeling:C Indiana contributes at least 10 ppb to 15% of the 8-hr exceedences in Wisconsin; the maximum 8-
hr contribution from Indiana is 13 ppb;C Indiana contributes 4% of the total manmade ppb >= 85 ppb in Wisconsin;C The highest daily average 8-hr contribution from Indiana to Wisconsin is 12 ppb; which is 14% of
the average 8-hr ozone concentration >= 85 ppb in Wisconsin on that day.Kentucky’s Contribution to Wisconsin: UAM-V zero-out modeling:C Kentucky contributes at least 5 ppb to 7% of the 8-hr exceedences in Wisconsin; the maximum 8-
hr contribution from Kentucky is 6 ppb;C The total contribution from Kentucky is equivalent to 10% of the total ppb >= 85 ppb in Wisconsin. CAMx modeling:C Kentucky contributes at least 10 ppb to 15% of the 8-hr exceedences in Wisconsin; the maximum
8-hr contribution from Kentucky is 13 ppb;C Kentucky contributes 3% of the total manmade ppb >= 85 ppb in Wisconsin;C The highest daily average 8-hr contribution from Kentucky to Wisconsin is 11 ppb; which is 13% of
the average 8-hr ozone concentration >= 85 ppb in Wisconsin on that day.Missouri’s Contribution to Wisconsin: UAM-V zero-out modeling:C Missouri contributes at least 2 ppb to 57% of the 8-hr exceedences in Wisconsin; the maximum 8-
hr contribution from Missouri is 7 ppb;C The total contribution from Missouri is equivalent to 36% of the total ppb >= 85 ppb in Wisconsin. CAMx modeling:C Missouri contributes at least 5 ppb to 77% of the 8-hr exceedences in Wisconsin; the maximum 8-
hr contribution from Missouri is 18 ppb;C Missouri contributes 12% of the total manmade ppb >= 85 ppb in Wisconsin;C The highest daily average 8-hr contribution from Missouri to Wisconsin is 17 ppb; which is 20% of
the average 8-hr ozone concentration >= 85 ppb in Wisconsin on that day.Tennessee’s Contribution to Wisconsin: UAM-V zero-out modeling:C Tennessee contributes at least 2 ppb to 13% of the 8-hr exceedences in Wisconsin; the maximum
8-hr contribution from Tennessee is 3 ppb;C The total contribution from Tennessee is equivalent to 9% of the total ppb >= 85 ppb in Wisconsin. CAMx modeling:C Tennessee contributes at least 2 ppb to 16% of the 8-hr exceedences in Wisconsin; the maximum
8-hr contribution from Tennessee is 7 ppb;C Tennessee contributes 2% of the total manmade ppb >= 85 ppb in Wisconsin;C The highest daily average 8-hr contribution from Tennessee to Wisconsin is 7 ppb; which is 8% of
the average 8-hr ozone concentration >= 85 ppb in Wisconsin on that day.
States Not Making a Significant Contribution for the 8-Hr NAAQS

D-44
Alabama -– 8 hr • Indiana, Massachusetts, Michigan, Virginia, and West Virginia have no contributions more than 2
ppb to 8-hr exceedences in Alabama in the UAM-V zero-out modeling and/or contribute 1% orless to the total manmade ppb >= 85 ppb in Alabama in the CAMx modeling;
• Connecticut/Rhode Island, Maryland/D.C./Delaware, New Jersey, New York, and Pennsylvaniacontribute less than 1% to the total manmade ppb >= 85 ppb and have no contributions more than2 ppb to 8-hr exceedences in Alabama in the CAMx modeling;
• Missouri contributes 1% or less to the total ppb reduced and population weighted total ppbreduced >= 85 ppb in Alabama in the UAM-V zero-out modeling and contribute 1% or less to thetotal manmade ppb >= 85 ppb in Alabama in the CAMx modeling;
• Ohio contributes less than 1% to the 8-hr exceedences in the range of 2-5 ppb in Alabama in theUAM-V zero-out modeling and contribute 1% or less to the total manmade ppb >= 85 ppb inAlabama in the CAMx modeling.
Connecticut -– 8 hr • Alabama, Georgia, Kentucky, Missouri, South Carolina, Tennessee, andWisconsin have no contributions more than 2 ppb to 8-hr exceedences inConnecticut in the UAM-V zero-out modeling and/or contribute 1% or lessto the total manmade ppb >= 85 ppb in Connecticut in the CAMxmodeling;
• Indiana and Massachusetts contribute 1% or less to the 8-hr exceedences in the range of 2-5 ppbin Connecticut in the UAM-V zero-out modeling and contribute 1% or less to the total manmadeppb >= 85 ppb in Connecticut in the CAMx modeling.
District of Columbia -– 8 hr • Georgia, Indiana, Massachusetts, Missouri, North Carolina,South Carolina, and Wisconsin have no contributions more than2 ppb to 8-hr exceedences in the District of Columbia in theUAM-V zero-out modeling and/or contribute 1% or less to thetotal manmade ppb >= 85 ppb in the District of Columbia in theCAMx modeling;
• Alabama contributes only one value of the 8-hr exceedences in the range of 2-5 ppb and 1% tothe total ppb >= 85 ppb in the District of Columbia in the UAM-V zero-out modeling and contribute1% or less to the total manmade ppb >= 85 ppb in the District of Columbia in the CAMx modeling;
• Connecticut/Rhode Island, New Jersey and New York contribute less than 1% to the totalmanmade ppb >= 85 ppb and have no contributions more than 2 ppb to 8-hr exceedences in theDistrict of Columbia in the CAMx modeling.
Delaware -– 8 hr • Alabama, Georgia, Massachusetts, Missouri, SouthCarolina, and Wisconsin have no contributions more than2 ppb to 8-hr exceedences in Delaware in the UAM-Vzero-out modeling and/or contribute 1% or less to thetotal manmade ppb >= 85 ppb in Delaware in the CAMxmodeling;
• Connecticut/Rhode Island, New Jersey and New York contribute less than 1% to the totalmanmade ppb >= 85 ppb and/or have no contributions more than 2 ppb to 8-hr exceedences inDelaware in the CAMx modeling.
Georgia -– 8 hr • Indiana, Massachusetts, Michigan, Ohio,Virginia, West Virginia, and Wisconsin have nocontributions more than 2 ppb to 8-hrexceedences in Georgia in the UAM-V zero-outmodeling and/or contribute 1% or less to the totalmanmade ppb >= 85 ppb in Georgia in theCAMx modeling;
• Illinois and Missouri contribute 1% or less to the total ppb >= 85 ppb in Georgia in the UAM-V

D-45
zero-out modeling and contribute less than 1% to the total manmade ppb >= 85 ppb in Georgia inthe CAMx modeling;
• Connecticut/Rhode Island, New Jersey, New York, and Pennsylvania contribute less than 1% tothe total manmade ppb >= 85 ppb and have no contributions more than 2 ppb to 8-hrexceedences in Georgia in the CAMx modeling.
Illinois -– 8 hr • Massachusetts, North Carolina, South Carolina, Virginia, andWisconsin have no contributions more than 2 ppb to 8-hrexceedences in Illinois in the UAM-V zero-out modeling and/orcontribute 1% or less to the total manmade ppb >= 85 ppb inIllinois in the CAMx modeling;
• Michigan, Ohio and West Virgiania contribute less than 1% to the 8-hr exceedences in the rangeof 2-5 ppb in Illinois in the UAM-V zero-out modeling and contribute 1% or less to the totalmanmade ppb >= 85 ppb in Illinois in the CAMx modeling;
• Connecticut/Rhode Island, Maryland/D.C./Delaware, New Jersey, and New York contribute lessthan 1% to the total manmade ppb >= 85 ppb and have no contributions more than 2 ppb to 8-hrexceedences in Illinois in the CAMx modeling.
Indiana -– 8 hr • Massachusetts and Wisconsin have no contributions more than 2ppb to 8-hr exceedences in Indiana in the UAM-V zero-outmodeling and/or contribute 1% or less to the total manmade ppb>= 85 ppb in Indiana in the CAMx modeling;
• Michigan contributes less than 1% to the 8-hr exceedences in the range of 2-5 ppb in Indiana inthe UAM-V zero-out modeling and contribute less than 1% to the total manmade ppb >= 85 ppb inIndiana in the CAMx modeling;
• Connecticut/Rhode Island, Maryland/D.C./Delaware, New Jersey, New York, and Pennsylvaniacontribute less than 1% to the total manmade ppb >= 85 ppb and have no contributions more than2 ppb to 8-hr exceedences in Indiana in the CAMx modeling;
• Virginia contributes 1% or less to the total manmade ppb >= 85 ppb in Indiana and have 3 ppb orless of the highest daily average contribuiton to 8-hr ozone concentration >= 85 ppb in Indiana inthe CAMx modeling.
Kentucky -– 8 hr • Massachusetts and Wisconsin have no contributions more than 2ppb to 8-hr exceedences in Kentucky in the UAM-V zero-outmodeling and/or contribute 1% or less to the total manmade ppb>= 85 ppb in Kentucky in the CAMx modeling;
• Michigan contributes less than 1% to the total manmade ppb >= 85 ppb in Kentucky and have 2ppb or less of the highest daily average contribuiton to 8-hr ozone concentration >= 85 ppb in theCAMx modeling;
• Virginia contributes less than 1% to the 8-hr exceedences in the range of 2-5 ppb in Kentucky inthe UAM-V zero-out modeling and contribute 1% or less to the total manmade ppb >= 85 ppb inKentucky in the CAMx modeling;
• Connecticut/Rhode Island, Maryland/D.C./Delaware, New Jersey, New York, and Pennsylvaniacontribute less than 1% to the total manmade ppb >= 85 ppb and have no contributions more than2 ppb to 8-hr exceedences in Kentucky in the CAMx modeling.
Massachusetts -– 8 hr • Alabama, Georgia, Kentucky, Missouri, Tennessee, andWisconsin have no contributions more than 2 ppb to 8-hrexceedences in Massachusetts in the UAM-V zero-out modelingand/or contribute 1% or less to the total manmade ppb >= 85 ppbin Massachusetts in the CAMx modeling;
• Illinois contributes 1% or less to the 8-hr exceedences in the range of 2-5 ppb in Massachusetts inthe UAM-V zero-out modeling and contribute 1% or less to the total manmade ppb >= 85 ppb in

D-46
Massachusetts in the CAMx modeling.
Maryland -– 8 hr • Massachusetts, Missouri, and Wisconsin have no contributions more than2 ppb to 8-hr exceedences in Maryland in the UAM-V zero-out modelingand/or contribute 1% or less to the total manmade ppb >= 85 ppb inMaryland in the CAMx modeling;
• Alabama and South Carolina contribute 1% or less to the total ppb and the population-weightedtotal ppb >= 85 ppb in Maryland in the UAM-V zero-out modeling and contribute 1% or less to thetotal manmade ppb >= 85 ppb in Maryland in the CAMx modeling;
• Connecticut/Rhode Island, New Jersey, and New York contribute less than 1% to the totalmanmade ppb >= 85 ppb and have no contributions more than 2 ppb to 8-hr exceedences inMaryland in the CAMx modeling.
Maine -– 8 hr • Alabama, Georgia, Illinois, Indiana, kentucky, Missouri, Ohio, South Carolina,Tennessee, West Virginia, and Wisconsin have no contributions more than 2 ppbto 8-hr exceedences in Maine in the UAM-V zero-out modeling and/or contribute1% or less to the total manmade ppb >= 85 ppb in Maine in the CAMx modeling;
• Michigan contributes 1% or less to the 8-hr exceedences in the range of 2-5 ppb in Maine in theUAM-V zero-out modeling and contributes less than 5 ppb of the maximum 8-hr contribution to 8-hr ozone concentration >= 85 ppb in Maine in the CAMx modeling.
Michigan -– 8 hr • Massachusetts, North Carolina, South Carolina, and Virginiahave no contributions more than 2 ppb to 8-hr exceedences inMichigan in the UAM-V zero-out modeling and/or contribute 1%or less to the total manmade ppb >= 85 ppb in Michigan in theCAMx modeling;
• West Virginia contributes 1% or less to the 8-hr exceedences in the range of 2-5 ppb in Michiganin the UAM-V zero-out modeling and contribute 1% or less to the total manmade ppb >= 85 ppb inMichigan in the CAMx modeling;
• Connecticut/Rhode Island, Maryland/D.C./Delaware, New Jersey, New York, and Pennsylvaniacontribute less than 1% to the total manmade ppb >= 85 ppb and have no contributions more than2 ppb to 8-hr exceedences in Michigan in the CAMx modeling.
Missouri -– 8 hr • Massachusetts, Michigan, North Carolina, Ohio, South Carolina, Virginia,and Wisconsin have no contributions more than 2 ppb to 8-hrexceedences in Missouri in the UAM-V zero-out modeling and/orcontribute 1% or less to the total manmade ppb >= 85 ppb in Missouri inthe CAMx modeling;
• West Virginia contributes 1% or less to the 8-hr exceedences in the range of 2-5 ppb in Missouri inthe UAM-V zero-out modeling and has no contributions more than 2 ppb to 8-hr exceedences inMissouri in the CAMx modeling;
• Connecticut/Rhode Island, Maryland/D.C./Delaware, New Jersey, New York, and Pennsylvaniacontribute less than 1% to the total manmade ppb >= 85 ppb and have no contributions more than2 ppb to 8-hr exceedences in Missouri in the CAMx modeling.
North Carolina -– 8 hr • Massachusetts and Wisconsin have no contributions more than 2ppb to 8-hr exceedences in North Carolina in the UAM-V zero-outmodeling and/or contribute 1% or less to the total manmade ppb>= 85 ppb in North Carolina in the CAMx modeling;
• Illinois and Missouri contribute less than 1% to the 8-hr exceedences in the range of 2-5 ppb inNorth Carolina in the UAM-V zero-out modeling and contribute 1% or less to the total manmadeppb >= 85 ppb in North Carolina in the CAMx modeling;
• Indiana and Michigan contribute 1% or less to the total manmade ppb >= 85 ppb in North Carolinaand have 3 ppb or less of the highest daily average contribuiton to 8-hr ozone concentration >= 85

D-47
ppb in the CAMx modeling;• Connecticut/Rhode Island, Maryland/D.C./Delaware, New Jersey, New York, and Pennsylvania
contribute less than 1% to the total manmade ppb >= 85 ppb and have no contributions more than2 ppb to 8-hr exceedences in North Carolina in the CAMx modeling.
New Hampshire -– 8 hr • Alabama, Georgia, Illinois, Indiana, Kentucky, Michigan,Missouri, North Carolina, Ohio, South Carolina,Tennessee, Virginia, and Wisconsin have nocontributions more than 2 ppb to 8-hr exceedences inNew Hampshire in the UAM-V zero-out modeling and/orcontribute 1% or less to the total manmade ppb >= 85ppb in New Hampshire in the CAMx modeling;
• West Virginia contribute only 1% to the total ppb and the population-weighted total ppb >= 85 ppbin New Hampshire in the UAM-V zero-out modeling and contribute 1% or less to the totalmanmade ppb >= 85 ppb in New Hampshire in the CAMx modeling.
New Jersey -– 8 hr • Alabama, Georgia, Massachusetts, Missouri and Wisconsin have nocontributions more than 2 ppb to 8-hr exceedences in New Jersey in theUAM-V zero-out modeling and/or contribute 1% or less to the totalmanmade ppb >= 85 ppb in New Jersey in the CAMx modeling;
• South Carolina and Tennessee contribute contribute less than 1% to the 8-hr exceedences in therange of 2-5 ppb in New Jersey and only 1% to the total ppb and the population-weighted totalppb >= 85 ppb in New Jersey in the UAM-V zero-out modeling and contribute 1% or less to thetotal manmade ppb >= 85 ppb in New Jersey in the CAMx modeling.
New York -– 8 hr • Alabama, Georgia, Massachusetts, Missouri and South Carolinahave no contributions more than 2 ppb to 8-hr exceedences inNew York in the UAM-V zero-out modeling and/or contribute 1%or less to the total manmade ppb >= 85 ppb in New York in theCAMx modeling;
• Wisconsin contribute contribute only 1% to the total ppb and the population-weighted total ppb >=85 ppb in New York in the UAM-V zero-out modeling and contribute 1% or less to the totalmanmade ppb >= 85 ppb in New York in the CAMx modeling;
• Tennessee contribute contribute less than 1% to the 8-hr exceedences in the range of 2-5 ppb inNew York in the UAM-V zero-out modeling and contribute 1% or less to the total manmade ppb >=85 ppb in New York in the CAMx modeling.
Ohio -– 8 hr • Georgia and Massachusetts have no contributions more than 2 ppb to 8-hr exceedences in Ohio in the UAM-V zero-out modeling and/orcontribute 1% or less to the total manmade ppb >= 85 ppb in Ohio in theCAMx modeling;
• South Carolina and Wisconsin contribute less than 1% to the 8-hr exceedences in the range of 2-5ppb in Ohio in the UAM-V zero-out modeling and contribute 1% or less to the total manmade ppb>= 85 ppb in Ohio in the CAMx modeling;
• Connecticut/Rhode Island, Maryland/D.C./Delaware, New Jersey and New York contribute lessthan 1% to the total manmade ppb >= 85 ppb and have no contributions more than 2 ppb to 8-hrexceedences in Ohio in the CAMx modeling.
Pennsylvania -– 8 hr • Georgia, Massachusetts, and South Carolina have nocontributions more than 2 ppb to 8-hr exceedences inPennsylvania in the UAM-V zero-out modeling and/or contribute1% or less to the total manmade ppb >= 85 ppb in Pennsylvaniain the CAMx modeling;
• Wisconsin contribute less than 1% to the 8-hr exceedences in the range of 2-5 ppb in

D-48
Pennsylvania in the UAM-V zero-out modeling and contribute 1% or less to the total manmadeppb >= 85 ppb in Pennsylvania in the CAMx modeling;
• Connecticut/Rhode Island contribute less than 1% to the total manmade ppb >= 85 ppb and hasno contribution more than 2 ppb to 8-hr exceedences in Pennsylvania in the CAMx modeling.
Rhode Island -– 8 hr • Alabama, Georgia, Indiana, Kentucky, Massachusetts, Michigan,Missouri, South Carolina, Tennessee, and Wisconsin have nocontributions more than 2 ppb to 8-hr exceedences in Rhode Island in theUAM-V zero-out modeling and/or contribute 1% or less to the totalmanmade ppb >= 85 ppb in Rhode Island in the CAMx modeling;
South Carolina -– 8 hr • Illinois, Massachusetts, Michigan, Missouri andWisconsin have no contributions more than 2 ppb to 8-hrexceedences in South Carolina in the UAM-V zero-outmodeling and/or contribute 1% or less to the totalmanmade ppb >= 85 ppb in South Carolina in the CAMxmodeling;
• Indiana and Ohio contribute less than 1% to the 8-hr exceedences in the range of 2-5 ppb inSouth Carolina in the UAM-V zero-out modeling and contribute 1% or less to the total manmadeppb >= 85 ppb in South Carolina in the CAMx modeling;
• Connecticut/Rhode Island, Maryland/D.C./Delaware, New Jersey, New York, and Pennsylvaniacontribute less than 1% to the total manmade ppb >= 85 ppb and have no contributions more than2 ppb to 8-hr exceedences in South Carolina in the CAMx modeling.
Tennessee -– 8 hr • Massachusetts and Wisconsin have no contributionsmore than 2 ppb to 8-hr exceedences in Tennessee inthe UAM-V zero-out modeling and/or contribute 1% orless to the total manmade ppb >= 85 ppb in Tennesseein the CAMx modeling;
• Michigan contributes less than 1% to the 8-hr exceedences in the range of 2-5 ppb in Tennesseein the UAM-V zero-out modeling and contribute less than 1% to the total manmade ppb >= 85 ppbin Tennessee in the CAMx modeling;
• Connecticut/Rhode Island, Maryland/D.C./Delaware, New Jersey, New York, and Pennsylvaniacontribute less than 1% to the total manmade ppb >= 85 ppb and have no contributions more than2 ppb to 8-hr exceedences in Tennessee in the CAMx modeling;
• Virginia contributes 1% or less to the total manmade ppb >= 85 ppb and has 2 ppb or less of thehighest daily average contribuiton to 8-hr ozone concentration >= 85 ppb in Tennessee in theCAMx modeling.
Virginia -– 8 hr • Missouri, Massachusetts and Wisconsin have nocontributions more than 2 ppb to 8-hr exceedences inVirginia in the UAM-V zero-out modeling and/orcontribute 1% or less to the total manmade ppb >= 85ppb in Virginia in the CAMx modeling;
• Illinois contributes less than 1% to the 8-hr exceedences in the range of 2-5 ppb in Virginia in theUAM-V zero-out modeling and contribute less than 1% to the total manmade ppb >= 85 ppb inVirginia in the CAMx modeling;
• Michigan contributes 1% or less to the total manmade ppb >= 85 ppb in Virginia and have 3 ppbor less of the highest daily average contribuiton to 8-hr ozone concentration >= 85 ppb in Virginiain the CAMx modeling;
• Connecticut/Rhode Island, New Jersey, and New York contribute 1% or less to the total manmadeppb >= 85 ppb in Virginia and contribute 3 ppb or less of the maximum 8-hr contribution to 8-hrozone concentration >= 85 ppb in Virginia in the CAMx modeling.

D-49
Wisconsin -– 8 hr • Alabama, Georgia, Massachusetts, Michigan,North Carolina, Ohio, South Carolina, Virginiaand West Virginia have no contributions morethan 2 ppb to 8-hr exceedences in Wisconsin inthe UAM-V zero-out modeling and/or contribute1% or less to the total manmade ppb >= 85 ppbin Wisconsin in the CAMx modeling;
• Connecticut/Rhode Island, Maryland/D.C./Delaware, New Jersey, and New York contribute 1% orless to the total manmade ppb >= 85 ppb in Wisconsin and contribute less than 1 ppb of themaximum 8-hr contribution to 8-hr ozone concentration >= 85 ppb in Wisconsin in the CAMxmodeling.
West Virginia -– 8 hr • Georgia, Missouri, Massachusetts, South Carolina, andWisconsin have no contributions more than 2 ppb to 8-hrexceedences in West Virginia in the UAM-V zero-outmodeling and/or contribute 1% or less to the totalmanmade ppb >= 85 ppb in West Virginia in the CAMxmodeling;
• Alabama contributes 1% or less to the total ppb and the population-weighted total ppb >= 85 ppbin New York and contribute 1% or less to the exceedences of ozone >= 85 ppb in the UAM-Vzero-out modeling;
• Connecticut/Rhode Island, Maryland/D.C./Delaware, New Jersey, and New York contribute 1% orless to the total manmade ppb >= 85 ppb in West Virginia and contribute 3 ppb or less of thehighest daily average contribution to 8-hr ozone concentration >= 85 ppb in West Virginia in theCAMx modeling.

APPENDIX E1-HOUR AND 8-HOUR PERCENT CONTRIBUTION TABLES

E-1
Table E-1. Percent Contribution from Upwind States to 1-Hour Nonattainment in Atlanta.
Downwind Area:
Atlanta
Percent of Total ManmadeEmissions Over 4 Episodes1
Highest Single-Episode PercentContribution2
Amount due to "Local"Emissions3
79 NA4
Total Amount from all "Upwind"States
21 NA
Contributions from IndividualUpwind States
AL 8 15
TN 4 4
MS 2 3
KY 1 2
LA 1 2
NC 1 2
SC 1 2
TX 1 2
Total Amount from All OtherStates, combined
2 NA
1. These values are based on CAMx Metric 3 calculated across all 4 episodes.2. These values are based on CAMX Metric 3 calculated for episode individually. These values do notadd up to 100 percent.3. Total contribution from the area listed.4. Not applicable.

E-2
Table E-2. Percent Contribution from Upwind States to 1-Hour Nonattainment in Baltimore.
Downwind Area:
Baltimore
Percent of Total ManmadeEmissions Over 4 Episodes1
Highest Single-Episode PercentContribution2
Amount due to "Local"Emissions3
44 NA4
Total Amount from all "Upwind"States
56 NA
Contributions from IndividualUpwind States
VA 24 35
PA 7 8
OH 4 7
WV 4 15
IL 2 3
IN 2 3
KY 2 5
MI 2 5
NC 2 2
GA 1 1
TN 1 4
Total Amount from All OtherStates, combined
5 NA
1. These values are based on CAMx Metric 3 calculated across all 4 episodes.2. These values are based on CAMX Metric 3 calculated for episode individually. These values do notadd up to 100 percent.3. Total contribution from the area listed.4. Not applicable.

E-3
Table E-3. Percent Contribution from Upwind States to 1-Hour Nonattainment in Birmingham.
Downwind Area:
Birmingham
Percent of Total ManmadeEmissions Over 4 Episodes1
Highest Single-Episode PercentContribution2
Amount due to "Local"Emissions3
79 NA4
Total Amount from all "Upwind"States
21 NA
Contributions from IndividualUpwind States
TN 5 6
MS 4 6
GA 3 10
KY 2 2
LA 2 2
IN 1 1
SC 1 3
TX 1 1
Total Amount from All OtherStates, combined
2 NA
1. These values are based on CAMx Metric 3 calculated across all 4 episodes.2. These values are based on CAMX Metric 3 calculated for episode individually. These values do notadd up to 100 percent.3. Total contribution from the area listed.4. Not applicable.

E-4
Table E-4. Percent Contribution from Upwind States to 1-Hour Nonattainment in Boston.
Downwind Area:
Boston
Percent of Total ManmadeEmissions Over 4 Episodes1
Highest Single-Episode PercentContribution2
Amount due to "Local"Emissions3
55 NA4
Total Amount from all "Upwind"States
45 NA
Contributions from IndividualUpwind States
NY 9 13
CT/RI 8 9
NJ 7 17
PA 5 9
MD/DC/DE 2 3
OH 2 5
VA 2 8
IN 1 2
KY 1 2
MI 1 1
NC 1 2
WV 1 3
Total Amount from All OtherStates, combined
5 NA
1. These values are based on CAMx Metric 3 calculated across all 4 episodes.2. These values are based on CAMX Metric 3 calculated for episode individually. These values do notadd up to 100 percent.3. Total contribution from the area listed.4. Not applicable.

E-5
Table E-5. Percent Contribution from Upwind States to 1-Hour Nonattainment in Chicago/Milwaukee.
Downwind Area:
Chicago/Milwaukee
Percent of Total ManmadeEmissions Over 4 Episodes1
Highest Single-Episode PercentContribution2
Amount due to "Local"Emissions3
79 NA4
Total Amount from all "Upwind"States
21 NA
Contributions from IndividualUpwind States
MO 8 8
WI 3 3
AL 1 1
MS 1 1
TN 1 1
Total Amount from All OtherStates, combined
7 NA
1. These values are based on CAMx Metric 3 calculated across all 4 episodes.2. These values are based on CAMX Metric 3 calculated for episode individually. These values do notadd up to 100 percent.3. Total contribution from the area listed.4. Not applicable.

E-6
Table E-6. Percent Contribution from Upwind States to 1-Hour Nonattainment in Cincinnati.
Downwind Area:
Cincinnati
Percent of Total ManmadeEmissions Over 4 Episodes1
Highest Single-Episode PercentContribution2
Amount due to "Local"Emissions3
61 NA4
Total Amount from all "Upwind"States
39 NA
Contributions from IndividualUpwind States
IN 11 18
TN 8 23
AL 6 8
LA 2 3
MS 2 3
NC 2 5
VA 2 3
FL 1 1
GA 1 2
PA 1 1
SC 1 2
WV 1 4
Total Amount from All OtherStates, combined
1 NA
1. These values are based on CAMx Metric 3 calculated across all 4 episodes.2. These values are based on CAMX Metric 3 calculated for episode individually. These values do notadd up to 100 percent.3. Total contribution from the area listed.4. Not applicable.

E-7
Table E-7. Percent Contribution from Upwind States to 1-Hour Nonattainment in Greater Connecticut.
Downwind Area:
Greater Connecticut
Percent of Total ManmadeEmissions Over 4 Episodes1
Highest Single-Episode PercentContribution2
Amount due to "Local"Emissions3
17 NA4
Total Amount from all "Upwind"States
83 NA
Contributions from IndividualUpwind States
NJ 26 29
NY 26 27
PA 10 14
VA 4 7
MD/DC/DE 3 3
OH 2 9
WV 2 6
IL 1 2
IN 1 2
MI 1 2
NC 1 4
Total Amount from All OtherStates, combined
6 NA
1. These values are based on CAMx Metric 3 calculated across all 4 episodes.2. These values are based on CAMX Metric 3 calculated for episode individually. These values do notadd up to 100 percent.3. Total contribution from the area listed.4. Not applicable.

E-8
Table E-8. Percent Contribution from Upwind States to 1-Hour Nonattainment in Lake Michigan.
Downwind Area:
Lake Michigan
Percent of Total ManmadeEmissions Over 4 Episodes1
Highest Single-Episode PercentContribution2
Amount due to "Local"Emissions3
NA4 NA
Total Amount from all "Upwind"States
100 NA
Contributions from IndividualUpwind States
IL 59 59
IN 9 10
MO 9 10
WI 4 5
TN 2 10
AL 1 7
GA 1 5
KY 1 5
MS 1 2
TX 1 2
Total Amount from All OtherStates, combined
12 NA
1. These values are based on CAMx Metric 3 calculated across all 4 episodes.2. These values are based on CAMX Metric 3 calculated for episode individually. These values do notadd up to 100 percent.3. Total contribution from the area listed.4. Not applicable.
Table E-9. Percent Contribution from Upwind States to 1-Hour Nonattainment in Louisville.

E-9
Downwind Area:
Louisville
Percent of Total ManmadeEmissions Over 4 Episodes1
Highest Single-Episode PercentContribution2
Amount due to "Local"Emissions3
75 NA4
Total Amount from all "Upwind"States
25 NA
Contributions from IndividualUpwind States
TN 14 24
AL 2 3
GA 2 2
NC 2 3
IL 1 1
OH 1 1
SC 1 2
VA 1 1
Total Amount from All OtherStates, combined
1 NA
1. These values are based on CAMx Metric 3 calculated across all 4 episodes.2. These values are based on CAMX Metric 3 calculated for episode individually. These values do notadd up to 100 percent.3. Total contribution from the area listed.4. Not applicable.

E-10
Table E-10. Percent Contribution from Upwind States to 1-Hour Nonattainment in Memphis.
Downwind Area:
Memphis
Percent of Total ManmadeEmissions Over 4 Episodes1
Highest Single-Episode PercentContribution2
Amount due to "Local"Emissions3
52 NA4
Total Amount from all "Upwind"States
48 NA
Contributions from IndividualUpwind States
AL 6 14
GA 5 13
LA 4 6
TX 4 8
SC 2 5
FL 1 4
NC 1 4
Total Amount from All OtherStates, combined
25 NA
1. These values are based on CAMx Metric 3 calculated across all 4 episodes.2. These values are based on CAMX Metric 3 calculated for episode individually. These values do notadd up to 100 percent.3. Total contribution from the area listed.4. Not applicable.

E-11
Table E-11. Percent Contribution from Upwind States to 1-Hour Nonattainment in New York City.
Downwind Area:
New York City
Percent of Total ManmadeEmissions Over 4 Episodes1
Highest Single-Episode PercentContribution2
Amount due to "Local"Emissions3
55 NA4
Total Amount from all "Upwind"States
45 NA
Contributions from IndividualUpwind States
PA 18 19
MD/DC/DE 5 6
OH 4 6
VA 4 8
WV 3 7
IL 2 3
IN 1 2
KY 1 3
MI 1 4
MO 1 2
NC 1 2
TN 1 1
Total Amount from All OtherStates, combined
3 NA
1. These values are based on CAMx Metric 3 calculated across all 4 episodes.2. These values are based on CAMX Metric 3 calculated for episode individually. These values do notadd up to 100 percent.3. Total contribution from the area listed.4. Not applicable.

E-12
Table E-12. Percent Contribution from Upwind States to 1-Hour Nonattainment in Philadelphia.
Downwind Area:
Philadelphia
Percent of Total ManmadeEmissions Over 4 Episodes1
Highest Single-Episode PercentContribution2
Amount due to "Local"Emissions3
68 NA4
Total Amount from all "Upwind"States
32 NA
Contributions from IndividualUpwind States
VA 7 22
OH 5 8
WV 5 10
IL 3 3
IN 2 3
AL 1 1
GA 1 1
KY 1 3
MI 1 2
MO 1 1
NC 1 2
TN 1 2
Total Amount from All OtherStates, combined
3 NA
1. These values are based on CAMx Metric 3 calculated across all 4 episodes.2. These values are based on CAMX Metric 3 calculated for episode individually. These values do notadd up to 100 percent.3. Total contribution from the area listed.4. Not applicable.

E-13
Table E-13. Percent Contribution from Upwind States to 1-Hour Nonattainment in Pittsburgh.
Downwind Area:
Pittsburgh
Percent of Total ManmadeEmissions Over 4 Episodes1
Highest Single-Episode PercentContribution2
Amount due to "Local"Emissions3
43 NA4
Total Amount from all "Upwind"States
57 NA
Contributions from IndividualUpwind States
WV 28 28
OH 18 18
NC 4 4
VA 3 3
SC 1 1
Total Amount from All OtherStates, combined
3 NA
1. These values are based on CAMx Metric 3 calculated across all 4 episodes.2. These values are based on CAMX Metric 3 calculated for episode individually. These values do notadd up to 100 percent.3. Total contribution from the area listed.4. Not applicable.

E-14
Table E-14. Percent Contribution from Upwind States to 1-Hour Nonattainment in Portland, ME.
Downwind Area:
Portland, ME
Percent of Total ManmadeEmissions Over 4 Episodes1
Highest Single-Episode PercentContribution2
Amount due to "Local"Emissions3
2 NA4
Total Amount from all "Upwind"States
98 NA
Contributions from IndividualUpwind States
MA 56 58
NY 6 12
CT/RI 6 6
NH/VT 5 7
PA 5 7
NJ 4 6
MD/DC/DE 3 4
VA 3 5
NC 2 3
OH 2 3
IN 1 1
MI 1 1
WV 1 2
Total Amount from All OtherStates, combined
5 NA
1. These values are based on CAMx Metric 3 calculated across all 4 episodes.2. These values are based on CAMX Metric 3 calculated for episode individually. These values do notadd up to 100 percent.3. Total contribution from the area listed.4. Not applicable.

E-15
Table E-15. Percent Contribution from Upwind States to 1-Hour Nonattainment in Rhode Island.
Downwind Area:
Rhode Island
Percent of Total ManmadeEmissions Over 4 Episodes1
Highest Single-Episode PercentContribution2
Amount due to "Local"Emissions3
5 NA4
Total Amount from all "Upwind"States
95 NA
Contributions from IndividualUpwind States
NJ 30 30
NY 24 28
PA 12 19
VA 7 9
OH 6 6
WV 4 5
MD/DC/DE 3 3
IN 2 3
KY 2 4
NC 2 2
IL 1 5
MI 1 4
Total Amount from All OtherStates, combined
1 NA
1. These values are based on CAMx Metric 3 calculated across all 4 episodes.2. These values are based on CAMX Metric 3 calculated for episode individually. These values do notadd up to 100 percent.3. Total contribution from the area listed.4. Not applicable.

E-16
Table E-16. Percent Contribution from Upwind States to 1-Hour Nonattainment in Southwestern Michigan.
Downwind Area:
Southwestern Michigan
Percent of Total ManmadeEmissions Over 4 Episodes1
Highest Single-Episode PercentContribution2
Amount due to "Local"Emissions3
1 NA4
Total Amount from all "Upwind"States
99 NA
Contributions from IndividualUpwind States
IL 54 54
MO 12 12
IN 10 10
TX 3 3
WI 3 3
KY 1 1
Total Amount from All OtherStates, combined
16 NA
1. These values are based on CAMx Metric 3 calculated across all 4 episodes.2. These values are based on CAMX Metric 3 calculated for episode individually. These values do notadd up to 100 percent.3. Total contribution from the area listed.4. Not applicable.

E-17
Table E-17 Percent Contribution from Upwind States to 1-Hour Nonattainment in St. Louis.
Downwind Area:
St. Louis
Percent of Total ManmadeEmissions Over 4 Episodes1
Highest Single-Episode PercentContribution2
Amount due to "Local"Emissions3
83 NA4
Total Amount from all "Upwind"States
17 NA
Contributions from IndividualUpwind States
AL 4 5
TN 3 3
GA 2 3
SC 2 2
IN 1 5
KY 1 5
NC 1 2
OH 1 3
Total Amount from All OtherStates, combined
2 NA
1. These values are based on CAMx Metric 3 calculated across all 4 episodes.2. These values are based on CAMX Metric 3 calculated for episode individually. These values do notadd up to 100 percent.3. Total contribution from the area listed.4. Not applicable.

E-18
Table E-18. Percent Contribution from Upwind States to 1-Hour Nonattainment in Washington, DC.
Downwind Area:
Washington, DC
Percent of Total ManmadeEmissions Over 4 Episodes1
Highest Single-Episode PercentContribution2
Amount due to "Local"Emissions3
76 NA4
Total Amount from all "Upwind"States
24 NA
Contributions from IndividualUpwind States
PA 8 10
OH 3 7
MI 2 2
NC 2 2
WV 2 17
IL 1 3
IN 1 5
KY 1 5
NY 1 1
TN 1 4
Total Amount from All OtherStates, combined
2 NA
1. These values are based on CAMx Metric 3 calculated across all 4 episodes.2. These values are based on CAMX Metric 3 calculated for episode individually. These values do notadd up to 100 percent.3. Total contribution from the area listed.4. Not applicable.

E-19
Table E-19. Percent Contribution from Upwind States to 1-Hour Nonattainment in WesternMassachusetts.
Downwind Area:
Western Massachusetts
Percent of Total ManmadeEmissions Over 4 Episodes1
Highest Single-Episode PercentContribution2
Amount due to "Local"Emissions3
6 NA4
Total Amount from all "Upwind"States
94 NA
Contributions from IndividualUpwind States
CT/RI 35 41
NY 18 20
NJ 16 20
PA 7 11
VA 4 6
MD/DC/DE 3 3
WV 2 6
MI 1 2
NC 1 3
OH 1 3
Total Amount from All OtherStates, combined
6 NA
1. These values are based on CAMx Metric 3 calculated across all 4 episodes.2. These values are based on CAMX Metric 3 calculated for episode individually. These values do notadd up to 100 percent.3. Total contribution from the area listed.4. Not applicable.

E-20
Table E-20. Percent Contribution from Upwind States to 8-Hour Nonattainment in Alabama.
Downwind Area:
Alabama
Percent of Total ManmadeEmissions Over 4 Episodes1
Highest Single-Episode PercentContribution2
Amount due to "Local"Emissions3
65 76
Total Amount from all "Upwind"States
35 NA4
Contributions from IndividualUpwind States
GA 10 18
TN 7 8
MS 4 8
SC 3 6
KY 2 2
LA 2 4
FL 1 2
IL 1 1
MO 1 1
NC 1 3
TX 1 2
Total Amount from All OtherStates, combined
2 NA
1. These values are based on CAMx Metric 3 calculated across all 4 episodes.2. These values are based on CAMX Metric 3 calculated for episode individually. These values do notadd up to 100 percent.3. Total contribution from the State listed.4. Not applicable.

E-21
Table E-21. Percent Contribution from Upwind States to 8-Hour Nonattainment in Connecticut.
Downwind Area:
Connecticut
Percent of Total ManmadeEmissions Over 4 Episodes1
Highest Single-Episode PercentContribution2
Amount due to "Local"Emissions3
12 35
Total Amount from all "Upwind"States
88 NA4
Contributions from IndividualUpwind States
NY 24 33
NJ 23 24
PA 14 19
MD/DC/DE 6 7
VA 4 7
OH 3 8
MI 2 5
NC 2 4
WV 2 5
IL 1 3
IN 1 2
KY 1 1
MO 1 2
WI 1 1
Total Amount from All OtherStates, combined
15 NA
1. These values are based on CAMx Metric 3 calculated across all 4 episodes.2. These values are based on CAMX Metric 3 calculated for episode individually. These values do notadd up to 100 percent.3. Total contribution from the State listed.4. Not applicable.

E-22
Table E-22. Percent Contribution from Upwind States to 8-Hour Nonattainment in District of Columbia.
Downwind Area:
District of Columbia
Percent of Total ManmadeEmissions Over 4 Episodes1
Highest Single-Episode PercentContribution2
Amount due to "Local"Emissions3
17 22
Total Amount from all "Upwind"States
83 NA4
Contributions from IndividualUpwind States
VA 47 53
PA 6 10
WV 6 19
OH 5 10
KY 3 7
IL 2 4
IN 2 4
MI 2 10
TN 2 6
AL 1 5
GA 1 2
MO 1 3
NC 1 2
NY 1 1
Total Amount from All OtherStates, combined
3 NA
1. These values are based on CAMx Metric 3 calculated across all 4 episodes.2. These values are based on CAMX Metric 3 calculated for episode individually. These values do notadd up to 100 percent.3. Total contribution from the State listed.4. Not applicable.

E-23
Table E-23. Percent Contribution from Upwind States to 8-Hour Nonattainment in Delaware.
Downwind Area:
Delaware
Percent of Total ManmadeEmissions Over 4 Episodes1
Highest Single-Episode PercentContribution2
Amount due to "Local"Emissions3
34 44
Total Amount from all "Upwind"States
66 NA4
Contributions from IndividualUpwind States
VA 23 28
PA 7 9
OH 6 8
WV 6 11
NC 4 6
IN 3 5
KY 3 6
IL 2 3
MI 2 3
TN 2 4
AL 1 2
GA 1 2
MO 1 2
SC 1 1
WI 1 1
Total Amount from All OtherStates, combined
3 NA
1. These values are based on CAMx Metric 3 calculated across all 4 episodes.2. These values are based on CAMX Metric 3 calculated for episode individually. These values do notadd up to 100 percent.3. Total contribution from the State listed.4. Not applicable.

E-24
Table E-24. Percent Contribution from Upwind States to 8-Hour Nonattainment in Georgia.
Downwind Area:
Georgia
Percent of Total ManmadeEmissions Over 4 Episodes1
Highest Single-Episode PercentContribution2
Amount due to "Local"Emissions3
67 86
Total Amount from all "Upwind"States
33 NA4
Contributions from IndividualUpwind States
AL 11 17
TN 6 8
SC 4 9
LA 2 3
MS 2 4
FL 1 2
KY 1 3
NC 1 3
TX 1 2
Total Amount from All OtherStates, combined
4 NA
1. These values are based on CAMx Metric 3 calculated across all 4 episodes.2. These values are based on CAMX Metric 3 calculated for episode individually. These values do notadd up to 100 percent.3. Total contribution from the State listed.4. Not applicable.

E-25
Table E-25. Percent Contribution from Upwind States to 8-Hour Nonattainment in Illinois.
Downwind Area:
Illinois
Percent of Total ManmadeEmissions Over 4 Episodes1
Highest Single-Episode PercentContribution2
Amount due to "Local"Emissions3
26 33
Total Amount from all "Upwind"States
74 NA4
Contributions from IndividualUpwind States
MO 38 60
TN 7 13
AL 4 18
GA 3 6
KY 3 6
IN 2 3
MS 2 5
TX 2 17
LA 1 4
NC 1 2
OH 1 1
SC 1 2
Total Amount from All OtherStates, combined
9 NA
1. These values are based on CAMx Metric 3 calculated across all 4 episodes.2. These values are based on CAMX Metric 3 calculated for episode individually. These values do notadd up to 100 percent.3. Total contribution from the State listed.4. Not applicable.

E-26
Table E-26. Percent Contribution from Upwind States to 8-Hour Nonattainment in Indiana.
Downwind Area:
Indiana
Percent of Total ManmadeEmissions Over 4 Episodes1
Highest Single-Episode PercentContribution2
Amount due to "Local"Emissions3
27 35
Total Amount from all "Upwind"States
73 NA4
Contributions from IndividualUpwind States
KY 27 35
TN 15 22
IL 5 9
AL 4 6
GA 4 6
LA 2 6
MO 2 5
MS 2 6
NC 2 4
OH 2 3
SC 2 3
FL 1 2
VA 1 1
WV 1 2
Total Amount from All OtherStates, combined
3 NA
1. These values are based on CAMx Metric 3 calculated across all 4 episodes.2. These values are based on CAMX Metric 3 calculated for episode individually. These values do notadd up to 100 percent.3. Total contribution from the State listed.4. Not applicable.

E-27
Table E-27. Percent Contribution from Upwind States to 8-Hour Nonattainment in Kentucky.
Downwind Area:
Kentucky
Percent of Total ManmadeEmissions Over 4 Episodes1
Highest Single-Episode PercentContribution2
Amount due to "Local"Emissions3
39 45
Total Amount from all "Upwind"States
61 NA4
Contributions from IndividualUpwind States
TN 20 35
IN 12 16
AL 5 12
OH 5 9
GA 4 6
IL 2 8
NC 2 4
SC 2 2
LA 1 5
MO 1 7
MS 1 3
TX 1 8
VA 1 1
WV 1 3
Total Amount from All OtherStates, combined
3 NA
1. These values are based on CAMx Metric 3 calculated across all 4 episodes.2. These values are based on CAMX Metric 3 calculated for episode individually. These values do notadd up to 100 percent.3. Total contribution from the State listed.4. Not applicable.

E-28
Table E-28. Percent Contribution from Upwind States to 8-Hour Nonattainment in Maine.
Downwind Area:
Maine
Percent of Total ManmadeEmissions Over 4 Episodes1
Highest Single-Episode PercentContribution2
Amount due to "Local"Emissions3
7 8
Total Amount from all "Upwind"States
93 NA4
Contributions from IndividualUpwind States
MA 33 42
NH/VT 11 11
NY 11 12
CT/RI 7 8
NJ 7 8
PA 6 8
MD/DC/DE 3 3
VA 3 6
MI 2 3
IN 1 2
NC 1 3
OH 1 4
Total Amount from All OtherStates, combined
7 NA
1. These values are based on CAMx Metric 3 calculated across all 4 episodes.2. These values are based on CAMX Metric 3 calculated for episode individually. These values do notadd up to 100 percent.3. Total contribution from the State listed.4. Not applicable.

E-29
Table E-29. Percent Contribution from Upwind States to 8-Hour Nonattainment in Maryland.
Downwind Area:
Maryland
Percent of Total ManmadeEmissions Over 4 Episodes1
Highest Single-Episode PercentContribution2
Amount due to "Local"Emissions3
32 37
Total Amount from all "Upwind"States
68 NA4
Contributions from IndividualUpwind States
VA 30 32
PA 7 9
WV 6 11
OH 5 8
KY 3 5
NC 3 5
IL 2 3
IN 2 3
MI 2 4
TN 2 4
AL 1 3
GA 1 2
MO 1 1
NY 1 1
SC 1 1
WI 1 1
Total Amount from All OtherStates, combined
0 NA
1. These values are based on CAMx Metric 3 calculated across all 4 episodes.2. These values are based on CAMX Metric 3 calculated for episode individually. These values do notadd up to 100 percent.3. Total contribution from the State listed.4. Not applicable.

E-30
Table E-30. Percent Contribution from Upwind States to 8-Hour Nonattainment in Massachusetts.
Downwind Area:
Massachusetts
Percent of Total ManmadeEmissions Over 4 Episodes1
Highest Single-Episode PercentContribution2
Amount due to "Local"Emissions3
14 19
Total Amount from all "Upwind"States
86 NA4
Contributions from IndividualUpwind States
NJ 16 21
CT/RI 15 56
NY 15 17
PA 11 15
MD/DC/DE 5 7
VA 5 10
MI 2 8
NC 2 4
OH 2 6
WV 2 5
IL 1 4
IN 1 2
KY 1 1
NH/VT 1 1
Total Amount from All OtherStates, combined
7 NA
1. These values are based on CAMx Metric 3 calculated across all 4 episodes.2. These values are based on CAMX Metric 3 calculated for episode individually. These values do notadd up to 100 percent.3. Total contribution from the State listed.4. Not applicable.

E-31
Table E-31. Percent Contribution from Upwind States to 8-Hour Nonattainment in Michigan
Downwind Area:
Michigan
Percent of Total ManmadeEmissions Over 4 Episodes1
Highest Single-Episode PercentContribution2
Amount due to "Local"Emissions3
7 9
Total Amount from all "Upwind"States
93 NA4
Contributions from IndividualUpwind States
IL 31 35
IN 18 27
MO 7 13
KY 5 9
TN 5 9
WI 5 5
AL 3 5
OH 3 5
GA 2 4
IA 1 1
LA 1 2
MS 1 3
NC 1 2
SC 1 2
TX 1 11
WV 1 2
Total Amount from All OtherStates, combined
7 NA
1. These values are based on CAMx Metric 3 calculated across all 4 episodes.2. These values are based on CAMX Metric 3 calculated for episode individually. These values do notadd up to 100 percent.3. Total contribution from the State listed.4. Not applicable.

E-32
Table E-32. Percent Contribution from Upwind States to 8-Hour Nonattainment in Missouri.
Downwind Area:
Missouri
Percent of Total ManmadeEmissions Over 4 Episodes1
Highest Single-Episode PercentContribution2
Amount due to "Local"Emissions3
35 69
Total Amount from all "Upwind"States
65 NA4
Contributions from IndividualUpwind States
TN 12 21
IL 8 13
TX 7 15
AL 6 9
KY 3 5
GA 2 4
IN 2 2
LA 2 4
MS 2 3
NC 1 1
OH 1 1
SC 1 1
Total Amount from All OtherStates, combined
18 NA
1. These values are based on CAMx Metric 3 calculated across all 4 episodes.2. These values are based on CAMX Metric 3 calculated for episode individually. These values do notadd up to 100 percent.3. Total contribution from the State listed.4. Not applicable.

E-33
Table E-33. Percent Contribution from Upwind States to 8-Hour Nonattainment in New Hampshire.
Downwind Area:
New Hampshire
Percent of Total ManmadeEmissions Over 4 Episodes1
Highest Single-Episode PercentContribution2
Amount due to "Local"Emissions3
18 20
Total Amount from all "Upwind"States
82 NA4
Contributions from IndividualUpwind States
MA 30 49
NY 12 12
CT/RI 9 14
NJ 9 9
PA 6 11
MD/DC/DE 3 3
MI 2 3
VA 2 4
OH 1 5
Total Amount from All OtherStates, combined
8 NA
1. These values are based on CAMx Metric 3 calculated across all 4 episodes.2. These values are based on CAMX Metric 3 calculated for episode individually. These values do notadd up to 100 percent.3. Total contribution from the State listed.4. Not applicable.

E-34
Table E-34. Percent Contribution from Upwind States to 8-Hour Nonattainment in New Jersey.
Downwind Area:
New Jersey
Percent of Total ManmadeEmissions Over 4 Episodes1
Highest Single-Episode PercentContribution2
Amount due to "Local"Emissions3
15 21
Total Amount from all "Upwind"States
85 NA4
Contributions from IndividualUpwind States
PA 26 32
MD/DC/DE 20 22
VA 9 11
OH 6 7
WV 5 8
NC 3 4
IL 2 3
IN 2 4
KY 2 4
MI 2 4
AL 1 1
GA 1 1
MO 1 2
NY 1 1
TN 1 2
WI 1 1
Total Amount from All OtherStates, combined
2 NA
1. These values are based on CAMx Metric 3 calculated across all 4 episodes.2. These values are based on CAMX Metric 3 calculated for episode individually. These values do notadd up to 100 percent.3. Total contribution from the State listed.4. Not applicable.

E-35
Table E-35. Percent Contribution from Upwind States to 8-Hour Nonattainment in New York.
Downwind Area:
New York
Percent of Total ManmadeEmissions Over 4 Episodes1
Highest Single-Episode PercentContribution2
Amount due to "Local"Emissions3
14 32
Total Amount from all "Upwind"Emissions
86 NA4
Contributions from IndividualUpwind States
NJ 31 36
PA 18 21
MD/DC/DE 7 8
VA 5 7
OH 4 7
WV 3 5
IL 2 3
IN 2 3
MI 2 4
NC 2 4
CT/RI 1 2
KY 1 2
MO 1 2
TN 1 1
WI 1 1
Total Amount from All Other States,combined
5 NA
1. These values are based on CAMx Metric 3 calculated across all 4 episodes.2. These values are based on CAMX Metric 3 calculated for episode individually. These values do notadd up to 100 percent.3. Total contribution from the State listed.4. Not applicable.

E-36
Table E-36. Percent Contribution from Upwind States to 8-Hour Nonattainment in North Carolina.
Downwind Area:
North Carolina
Percent of Total ManmadeEmissions Over 4 Episodes1
Highest Single-Episode PercentContribution2
Amount due to "Local"Emissions3
55 68
Total Amount from all "Upwind"States
45 NA4
Contributions from IndividualUpwind States
SC 9 10
TN 6 11
VA 6 9
KY 4 5
OH 4 6
GA 3 6
WV 3 3
PA 2 3
AL 1 8
IL 1 1
IN 1 2
MD/DC/DE 1 1
MI 1 2
TX 1 2
Total Amount from All OtherStates, combined
2 NA
1. These values are based on CAMx Metric 3 calculated across all 4 episodes.2. These values are based on CAMX Metric 3 calculated for episode individually. These values do notadd up to 100 percent.3. Total contribution from the State listed.4. Not applicable.

E-37
Table E-37. Percent Contribution from Upwind States to 8-Hour Nonattainment in Ohio.
Downwind Area:
Ohio
Percent of Total ManmadeEmissions Over 4 Episodes1
Highest Single-Episode PercentContribution2
Amount due to "Local"Emissions3
33 36
Total Amount from all "Upwind"States
67 NA4
Contributions from IndividualUpwind States
KY 15 27
IN 11 18
WV 8 12
TN 7 13
MI 6 11
IL 4 8
AL 3 9
GA 2 3
NC 2 3
FL 1 2
LA 1 3
MO 1 3
MS 1 3
PA 1 2
SC 1 2
VA 1 2
Total Amount from All OtherStates, combined
2 NA
1. These values are based on CAMx Metric 3 calculated across all 4 episodes.2. These values are based on CAMX Metric 3 calculated for episode individually. These values do notadd up to 100 percent.3. Total contribution from the State listed.4. Not applicable.

E-38
Table E-38. Percent Contribution from Upwind States to 8-Hour Nonattainment in Pennsylvania.
Downwind Area:
Pennsylvania
Percent of Total ManmadeEmissions Over 4 Episodes1
Highest Single-Episode PercentContribution2
Amount due to "Local" Emissions3 35 45
Total Amount from all "Upwind"States
65 NA4
Contributions from IndividualUpwind States
OH 15 21
WV 12 16
MD/DC/DE 6 8
KY 5 10
VA 5 6
IN 4 9
IL 3 6
MI 2 3
NC 2 3
TN 2 4
AL 1 3
GA 1 1
LA 1 2
MO 1 3
MS 1 1
NJ 1 9
NY 1 3
SC 1 1
Total Amount from All OtherStates, combined
1 NA
1. These values are based on CAMx Metric 3 calculated across all 4 episodes.2. These values are based on CAMX Metric 3 calculated for episode individually. These values do notadd up to 100 percent.3. Total contribution from the State listed.4. Not applicable.Table E-39. Percent Contribution from Upwind States to 8-Hour Nonattainment in Rhode Island.

E-39
Downwind Area:
Rhode Island
Percent of Total ManmadeEmissions Over 4 Episodes1
Highest Single-Episode PercentContribution2
Amount due to "Local"Emissions3
22 44
Total Amount from all "Upwind"States
78 NA4
Contributions from IndividualUpwind States
NY 20 26
NJ 17 20
PA 12 16
MD/DC/DE 5 7
OH 4 10
VA 4 7
MI 2 5
NC 2 3
WV 2 6
IL 1 3
IN 1 3
KY 1 1
MO 1 2
WI 1 1
Total Amount from All OtherStates, combined
15 NA
1. These values are based on CAMx Metric 3 calculated across all 4 episodes.2. These values are based on CAMX Metric 3 calculated for episode individually. These values do notadd up to 100 percent.3. Total contribution from the State listed.4. Not applicable.

E-40
Table E-40. Percent Contribution from Upwind States to 8-Hour Nonattainment in South Carolina.
Downwind Area:
South Carolina
Percent of Total ManmadeEmissions Over 4 Episodes1
Highest Single-Episode PercentContribution2
Amount due to "Local"Emissions3
45 53
Total Amount from all "Upwind"States
55 NA4
Contributions from IndividualUpwind States
GA 15 16
NC 13 31
TN 10 12
AL 4 4
KY 3 5
LA 1 1
MS 1 1
OH 1 3
TX 1 2
VA 1 3
WV 1 3
Total Amount from All OtherStates, combined
4 NA
1. These values are based on CAMx Metric 3 calculated across all 4 episodes.2. These values are based on CAMX Metric 3 calculated for episode individually. These values do notadd up to 100 percent.3. Total contribution from the State listed.4. Not applicable.

E-41
Table E-41. Percent Contribution from Upwind States to 8-Hour Nonattainment in Tennessee
Downwind Area:
Tennessee
Percent of Total ManmadeEmissions Over 4 Episodes1
Highest Single-Episode PercentContribution2
Amount due to "Local"Emissions3
54 58
Total Amount from all "Upwind"States
46 NA4
Contributions from IndividualUpwind States
KY 8 15
AL 7 22
GA 5 11
NC 3 5
OH 3 7
SC 3 18
TX 3 6
IL 1 2
IN 1 2
LA 1 5
MO 1 2
VA 1 2
WV 1 3
Total Amount from All OtherStates, combined
13 NA
1. These values are based on CAMx Metric 3 calculated across all 4 episodes.2. These values are based on CAMX Metric 3 calculated for episode individually. These values do notadd up to 100 percent.3. Total contribution from the State listed.4. Not applicable.

E-42
Table E-42. Percent Contribution from Upwind States to 8-Hour Nonattainment in Virginia.
Downwind Area:
Virginia
Percent of Total ManmadeEmissions Over 4 Episodes1
Highest Single-Episode PercentContribution2
Amount due to "Local"Emissions3
52 66
Total Amount from all "Upwind"States
48 NA4
Contributions from IndividualUpwind States
MD/DC/DE 11 20
NC 8 17
PA 5 6
WV 4 8
KY 3 3
OH 3 6
IN 2 3
TN 2 3
AL 1 3
GA 1 2
IL 1 2
MI 1 2
NJ 1 1
NY 1 2
SC 1 1
Total Amount from All OtherStates, combined
3 NA
1. These values are based on CAMx Metric 3 calculated across all 4 episodes.2. These values are based on CAMX Metric 3 calculated for episode individually. These values do notadd up to 100 percent.3. Total contribution from the State listed.4. Not applicable.

E-43
Table E-43. Percent Contribution from Upwind States to 8-Hour Nonattainment in West Virginia.
Downwind Area:
West Virginia
Percent of Total ManmadeEmissions Over 4 Episodes1
Highest Single-Episode PercentContribution2
Amount due to "Local"Emissions3
26 33
Total Amount from all "Upwind"States
74 NA4
Contributions from IndividualUpwind States
OH 26 30
KY 20 29
IN 5 8
TN 4 11
IL 3 8
MI 3 5
NC 2 3
VA 2 3
AL 1 6
GA 1 2
MO 1 4
PA 1 1
SC 1 1
TX 1 5
Total Amount from All OtherStates, combined
5 NA
1. These values are based on CAMx Metric 3 calculated across all 4 episodes.2. These values are based on CAMX Metric 3 calculated for episode individually. These values do notadd up to 100 percent.3. Total contribution from the State listed.4. Not applicable.

E-44
Table E-44. Percent Contribution from Upwind States to 8-Hour Nonattainment in Wisconsin.
Downwind Area:
Wisconsin
Percent of Total ManmadeEmissions Over 4 Episodes1
Highest Single-Episode PercentContribution2
Amount due to "Local"Emissions3
13 17
Total Amount from all "Upwind"States
87 NA4
Contributions from IndividualUpwind States
IL 42 56
MO 12 16
IN 4 18
IA 3 4
KY 3 17
TX 3 9
TN 2 6
GA 1 2
LA 1 6
OH 1 6
Total Amount from All OtherStates, combined
15 NA
1. These values are based on CAMx Metric 3 calculated across all 4 episodes.2. These values are based on CAMX Metric 3 calculated for episode individually. These values do notadd up to 100 percent.3. Total contribution from the State listed.4. Not applicable.

APPENDIX FEVALUATION OF CONTRIBUTIONS -- TABLES OF METRICS1-HOUR UAM-V: UPWIND STATES TO DOWNWIND STATES

F-1
The tables in this Appendix contain information on the UAM-V metrics used for theevaluation of contributions. Tables are provided only for those downwind States whichcontain grid cells with expected exceedences in the Base Case. The headings in thetable relate to the metrics as follows:
Percent total ppb reduced >= 125 ppb Metric 3Percent pop-wgt total ppb reduced >= 125 ppb Metric 4Number of exceedences reduced >= 2 ppb Metrics 1 & 2Percent exceedences reduced >= 2 ppb Metrics 1 & 2Number of exceedences reduced >= 5 ppb Metrics 1 & 2Percent exceedences reduced >= 5 ppb Metrics 1 & 2Number of exceedences reduced >= 10 ppb Metrics 1 & 2Percent exceedences reduced >= 10 ppb Metrics 1 & 2max 1-hr contribution, ppb Metric 2
(Note: Some of the maximum contribution values may appear to be inconsistent with thenumber of exceedences above a certain cut-point. For example, a contribution of9.999........ is interpreted as being less that 10 ppb for the purpose of counting thenumber of exceedence reduced; however, this value is rounded to 10 ppb in thepresentation of maximum "ppb" contribution in these tables.)

F-2
Downwind State: Alabama UAM-V State Zero-Out ModelingContributions to 1-Hr Designated + Modeled Receptors
Base case: Total Number of Exceedences (grids-days) = 88Upwind State
Percent totalppb reduced>= 125 ppb
Percentpop-wgt totalppb
Number ofexceedencesreduced >= 2ppb
Percentexceedencesreduced >= 2ppb
Number ofexceedencesreduced >= 5ppb
Percentexceedencesreduced >= 5ppb
Number ofexceedencesreduced >=10 ppb
Percentexceedencesreduced >=10 ppb
max 1-hrcontributionppb
AL 100% 100% 88 100% 88 100% 88 100% 140.8 GA 12% 14% 25 28% 16 18% 10 11% 17 IL 0% 0% 0 0% 0 0% 0 0% 0.4 IN 1% 1% 0 0% 0 0% 0 0% 1.2 KY 2% 2% 4 5% 0 0% 0 0% 3 MA 0% 0% 0 0% 0 0% 0 0% 0 MI 0% 0% 0 0% 0 0% 0 0% 0 MO 0% 0% 0 0% 0 0% 0 0% 0.5 NC 1% 1% 0 0% 0 0% 0 0% 0.7 OH 0% 0% 0 0% 0 0% 0 0% 0.2 SC 2% 2% 3 3% 2 2% 2 2% 10.5 TN 14% 11% 33 38% 18 20% 5 6% 13.6 VA 0% 0% 0 0% 0 0% 0 0% 0.2 WI 0% 0% 0 0% 0 0% 0 0% 0.1 WV 0% 0% 0 0% 0 0% 0 0% 0.3

F-3
Downwind State: Connecticut UAM-V State Zero-Out ModelingContributions to 1-Hr Designated + Modeled Receptors
Base case: Total Number of Exceedences (grids-days) = 186Upwind State
Percent totalppb reduced>= 125 ppb
Percentpop-wgt totalppb
Number ofexceedencesreduced >= 2ppb
Percentexceedencesreduced >= 2ppb
Number ofexceedencesreduced >= 5ppb
Percentexceedencesreduced >= 5ppb
Number ofexceedencesreduced >=10 ppb
Percentexceedencesreduced >=10 ppb
max 1-hrcontributionppb
AL 0% 0% 0 0% 0 0% 0 0% 0.3 GA 0% 0% 0 0% 0 0% 0 0% 0.3 IL 2% 2% 0 0% 0 0% 0 0% 2 IN 2% 2% 0 0% 0 0% 0 0% 1.7 KY 0% 0% 0 0% 0 0% 0 0% 0.7 MA 0% 0% 0 0% 0 0% 0 0% 1.1 MI 3% 3% 5 3% 0 0% 0 0% 2.7 MO 1% 0% 0 0% 0 0% 0 0% 0.4 NC 2% 3% 1 1% 0 0% 0 0% 2.1 OH 5% 4% 38 20% 0 0% 0 0% 5 SC 1% 1% 0 0% 0 0% 0 0% 1 TN 0% 0% 0 0% 0 0% 0 0% 0.4 VA 9% 9% 64 34% 2 1% 0 0% 5.7 WI 1% 1% 0 0% 0 0% 0 0% 1.1 WV 8% 7% 45 24% 16 9% 0 0% 8

F-4
Downwind State: Delaware UAM-V State Zero-Out ModelingContributions to 1-Hr Designated + Modeled Receptors
Base case: Total Number of Exceedences (grids-days) = 7Upwind State
Percent totalppb reduced>= 125 ppb
Percentpop-wgt totalppb
Number ofexceedencesreduced >= 2ppb
Percentexceedencesreduced >= 2ppb
Number ofexceedencesreduced >= 5ppb
Percentexceedencesreduced >= 5ppb
Number ofexceedencesreduced >=10 ppb
Percentexceedencesreduced >=10 ppb
max 1-hrcontributionppb
AL 1% 0% 0 0% 0 0% 0 0% 0.1 GA 1% 0% 0 0% 0 0% 0 0% 0.2 IL 5% 11% 0 0% 0 0% 0 0% 1.1 IN 5% 11% 0 0% 0 0% 0 0% 1.8 KY 2% 0% 0 0% 0 0% 0 0% 0.8 MA 0% 0% 0 0% 0 0% 0 0% 0 MI 3% 0% 0 0% 0 0% 0 0% 0.6 MO 0% 0% 0 0% 0 0% 0 0% 0.1 NC 1% 0% 0 0% 0 0% 0 0% 0.3 OH 15% 33% 4 57% 0 0% 0 0% 4.1 SC 1% 0% 0 0% 0 0% 0 0% 0.1 TN 2% 0% 0 0% 0 0% 0 0% 0.5 VA 59% 67% 7 100% 7 100% 5 71% 24.1 WI 0% 0% 0 0% 0 0% 0 0% 0 WV 24% 44% 7 100% 1 14% 0 0% 6.5

F-5
Downwind State: District of Columbia UAM-V State Zero-Out ModelingContributions to 1-Hr Designated + Modeled Receptors
Base case: Total Number of Exceedences (grids-days) = 3Upwind State
Percent totalppb reduced>= 125 ppb
Percentpop-wgt totalppb
Number ofexceedencesreduced >= 2ppb
Percentexceedencesreduced >= 2ppb
Number ofexceedencesreduced >= 5ppb
Percentexceedencesreduced >= 5ppb
Number ofexceedencesreduced >=10 ppb
Percentexceedencesreduced >=10 ppb
max 1-hrcontributionppb
AL 0% 0% 0 0% 0 0% 0 0% 0.1 GA 0% 0% 0 0% 0 0% 0 0% 0.2 IL 1% 1% 0 0% 0 0% 0 0% 0.4 IN 2% 2% 0 0% 0 0% 0 0% 1.8 KY 1% 1% 0 0% 0 0% 0 0% 1.2 MA 0% 0% 0 0% 0 0% 0 0% 0 MI 1% 1% 0 0% 0 0% 0 0% 0.7 MO 0% 0% 0 0% 0 0% 0 0% 0 NC 2% 2% 0 0% 0 0% 0 0% 1.1 OH 2% 2% 0 0% 0 0% 0 0% 2 SC 0% 0% 0 0% 0 0% 0 0% 0.1 TN 0% 0% 0 0% 0 0% 0 0% 0.3 VA 66% 66% 2 67% 2 67% 2 67% 69.3 WI 0% 0% 0 0% 0 0% 0 0% 0.1 WV 7% 7% 1 33% 1 33% 0 0% 5.7

F-6
Downwind State: Georgia UAM-V State Zero-Out ModelingContributions to 1-Hr Designated + Modeled Receptors
Base case: Total Number of Exceedences (grids-days) = 218Upwind State
Percent totalppb reduced>= 125 ppb
Percentpop-wgt totalppb
Number ofexceedencesreduced >= 2ppb
Percentexceedencesreduced >= 2ppb
Number ofexceedencesreduced >= 5ppb
Percentexceedencesreduced >= 5ppb
Number ofexceedencesreduced >=10 ppb
Percentexceedencesreduced >=10 ppb
max 1-hrcontributionppb
AL 14% 10% 97 44% 66 30% 27 12% 29.4 GA 100% 100% 218 100% 218 100% 218 100% 191.2 IL 0% 0% 3 1% 0 0% 0 0% 2.3 IN 0% 0% 0 0% 0 0% 0 0% 1 KY 2% 2% 16 7% 7 3% 3 1% 11.4 MA 0% 0% 0 0% 0 0% 0 0% 0 MI 0% 0% 0 0% 0 0% 0 0% 0 MO 0% 0% 0 0% 0 0% 0 0% 1.7 NC 1% 1% 11 5% 0 0% 0 0% 4.1 OH 0% 0% 0 0% 0 0% 0 0% 0.6 SC 4% 3% 32 15% 13 6% 10 5% 16 TN 8% 6% 77 35% 23 11% 1 0% 11.4 VA 0% 0% 0 0% 0 0% 0 0% 0.6 WI 0% 0% 0 0% 0 0% 0 0% 0.1 WV 0% 0% 0 0% 0 0% 0 0% 1.2

F-7
Downwind State: Illinois UAM-V State Zero-Out ModelingContributions to 1-Hr Designated + Modeled Receptors
Base case: Total Number of Exceedences (grids-days) = 13Upwind State
Percent totalppb reduced>= 125 ppb
Percentpop-wgt totalppb
Number ofexceedencesreduced >= 2ppb
Percentexceedencesreduced >= 2ppb
Number ofexceedencesreduced >= 5ppb
Percentexceedencesreduced >= 5ppb
Number ofexceedencesreduced >=10 ppb
Percentexceedencesreduced >=10 ppb
max 1-hrcontributionppb
AL 2% 1% 0 0% 0 0% 0 0% 1.8 GA 2% 1% 0 0% 0 0% 0 0% 1.4 IL 100% 100% 13 100% 13 100% 13 100% 100.6 IN 3% 1% 0 0% 0 0% 0 0% 1.9 KY 3% 1% 2 15% 0 0% 0 0% 3.6 MA 0% 0% 0 0% 0 0% 0 0% 0 MI 1% 0% 0 0% 0 0% 0 0% 0.6 MO 27% 14% 12 92% 7 54% 7 54% 61.7 NC 1% 0% 0 0% 0 0% 0 0% 1.1 OH 1% 0% 0 0% 0 0% 0 0% 1.2 SC 1% 0% 0 0% 0 0% 0 0% 0.9 TN 2% 1% 0 0% 0 0% 0 0% 1.5 VA 0% 0% 0 0% 0 0% 0 0% 0.1 WI 0% 0% 0 0% 0 0% 0 0% 0.1 WV 0% 0% 0 0% 0 0% 0 0% 0.1

F-8
Downwind State: Indiana UAM-V State Zero-Out ModelingContributions to 1-Hr Designated + Modeled Receptors
Base case: Total Number of Exceedences (grids-days) = 7Upwind State
Percent totalppb reduced>= 125 ppb
Percentpop-wgt totalppb
Number ofexceedencesreduced >= 2ppb
Percentexceedencesreduced >= 2ppb
Number ofexceedencesreduced >= 5ppb
Percentexceedencesreduced >= 5ppb
Number ofexceedencesreduced >=10 ppb
Percentexceedencesreduced >=10 ppb
max 1-hrcontributionppb
AL 3% 0% 0 0% 0 0% 0 0% 0.4 GA 3% 14% 0 0% 0 0% 0 0% 0.6 IL 42% 14% 2 29% 2 29% 2 29% 40.8 IN 87% 100% 7 100% 5 71% 5 71% 52.3 KY 65% 100% 5 71% 5 71% 4 57% 67 MA 0% 0% 0 0% 0 0% 0 0% 0 MI 0% 0% 0 0% 0 0% 0 0% 0 MO 23% 0% 2 29% 0 0% 0 0% 3.7 NC 23% 57% 1 14% 0 0% 0 0% 4.9 OH 0% 0% 0 0% 0 0% 0 0% 0.2 SC 13% 29% 1 14% 0 0% 0 0% 3.2 TN 35% 43% 3 43% 2 29% 2 29% 13.7 VA 13% 14% 1 14% 0 0% 0 0% 2.4 WI 0% 0% 0 0% 0 0% 0 0% 0 WV 3% 14% 0 0% 0 0% 0 0% 0.6

F-9
Downwind State: Kentucky UAM-V State Zero-Out ModelingContributions to 1-Hr Designated + Modeled Receptors
Base case: Total Number of Exceedences (grids-days) = 36Upwind State
Percent totalppb reduced>= 125 ppb
Percentpop-wgt totalppb
Number ofexceedencesreduced >= 2ppb
Percentexceedencesreduced >= 2ppb
Number ofexceedencesreduced >= 5ppb
Percentexceedencesreduced >= 5ppb
Number ofexceedencesreduced >=10 ppb
Percentexceedencesreduced >=10 ppb
max 1-hrcontributionppb
AL 3% 6% 0 0% 0 0% 0 0% 1.4 GA 5% 8% 0 0% 0 0% 0 0% 1.4 IL 4% 6% 0 0% 0 0% 0 0% 1.5 IN 58% 48% 30 83% 30 83% 24 67% 26.4 KY 100% 100% 36 100% 36 100% 36 100% 77 MA 0% 0% 0 0% 0 0% 0 0% 0 MI 0% 0% 0 0% 0 0% 0 0% 0.1 MO 1% 1% 0 0% 0 0% 0 0% 0.4 NC 9% 14% 3 8% 0 0% 0 0% 3.2 OH 2% 8% 2 6% 2 6% 2 6% 27.4 SC 5% 7% 0 0% 0 0% 0 0% 1.6 TN 37% 46% 19 53% 14 39% 6 17% 14.8 VA 5% 8% 0 0% 0 0% 0 0% 1.9 WI 0% 0% 0 0% 0 0% 0 0% 0 WV 2% 4% 0 0% 0 0% 0 0% 1.6

F-10
Downwind State: Louisiana UAM-V State Zero-Out ModelingContributions to 1-Hr Designated + Modeled Receptors
Base case: Total Number of Exceedences (grids-days) = 11Upwind State
Percent totalppb reduced>= 125 ppb
Percentpop-wgt totalppb
Number ofexceedencesreduced >= 2ppb
Percentexceedencesreduced >= 2ppb
Number ofexceedencesreduced >= 5ppb
Percentexceedencesreduced >= 5ppb
Number ofexceedencesreduced >=10 ppb
Percentexceedencesreduced >=10 ppb
max 1-hrcontributionppb
AL 10% 0% 0 0% 0 0% 0 0% 1.9 GA 0% 0% 0 0% 0 0% 0 0% 0.1 IL 3% 0% 0 0% 0 0% 0 0% 0.7 IN 0% 0% 0 0% 0 0% 0 0% 0.2 KY 2% 0% 0 0% 0 0% 0 0% 0.4 MA 0% 0% 0 0% 0 0% 0 0% 0 MI 0% 0% 0 0% 0 0% 0 0% 0 MO 9% 0% 0 0% 0 0% 0 0% 1.1 NC 0% 0% 0 0% 0 0% 0 0% 0 OH 0% 0% 0 0% 0 0% 0 0% 0 SC 0% 0% 0 0% 0 0% 0 0% 0 TN 12% 0% 1 9% 0 0% 0 0% 2.5 VA 0% 0% 0 0% 0 0% 0 0% 0 WI 0% 0% 0 0% 0 0% 0 0% 0 WV 0% 0% 0 0% 0 0% 0 0% 0

F-11
Downwind State: Maine UAM-V State Zero-Out ModelingContributions to 1-Hr Designated + Modeled Receptors
Base case: Total Number of Exceedences (grids-days) = 6Upwind State
Percent totalppb reduced>= 125 ppb
Percentpop-wgt totalppb
Number ofexceedencesreduced >= 2ppb
Percentexceedencesreduced >= 2ppb
Number ofexceedencesreduced >= 5ppb
Percentexceedencesreduced >= 5ppb
Number ofexceedencesreduced >=10 ppb
Percentexceedencesreduced >=10 ppb
max 1-hrcontributionppb
AL 0% 0% 0 0% 0 0% 0 0% 0 GA 0% 0% 0 0% 0 0% 0 0% 0 IL 3% 0% 0 0% 0 0% 0 0% 0.3 IN 6% 0% 0 0% 0 0% 0 0% 0.5 KY 0% 0% 0 0% 0 0% 0 0% 0.1 MA 100% 100% 6 100% 6 100% 6 100% 53.2 MI 6% 0% 0 0% 0 0% 0 0% 0.8 MO 0% 0% 0 0% 0 0% 0 0% 0 NC 6% 0% 0 0% 0 0% 0 0% 0.7 OH 13% 0% 0 0% 0 0% 0 0% 1 SC 0% 0% 0 0% 0 0% 0 0% 0 TN 0% 0% 0 0% 0 0% 0 0% 0 VA 9% 0% 0 0% 0 0% 0 0% 0.9 WI 0% 0% 0 0% 0 0% 0 0% 0 WV 9% 0% 0 0% 0 0% 0 0% 1

F-12
Downwind State: Maryland UAM-V State Zero-Out ModelingContributions to 1-Hr Designated + Modeled Receptors
Base case: Total Number of Exceedences (grids-days) = 246Upwind State
Percent totalppb reduced>= 125 ppb
Percentpop-wgt totalppb
Number ofexceedencesreduced >= 2ppb
Percentexceedencesreduced >= 2ppb
Number ofexceedencesreduced >= 5ppb
Percentexceedencesreduced >= 5ppb
Number ofexceedencesreduced >=10 ppb
Percentexceedencesreduced >=10 ppb
max 1-hrcontributionppb
AL 1% 0% 1 0% 0 0% 0 0% 2.6 GA 1% 0% 0 0% 0 0% 0 0% 1 IL 3% 2% 6 2% 0 0% 0 0% 2.6 IN 4% 3% 22 9% 0 0% 0 0% 4.1 KY 3% 3% 18 7% 0 0% 0 0% 4.3 MA 0% 0% 0 0% 0 0% 0 0% 0 MI 5% 3% 30 12% 6 2% 0 0% 6.8 MO 1% 0% 0 0% 0 0% 0 0% 1 NC 2% 2% 1 0% 1 0% 1 0% 12.3 OH 11% 8% 110 45% 7 3% 0 0% 6.8 SC 0% 0% 0 0% 0 0% 0 0% 1.3 TN 2% 1% 1 0% 0 0% 0 0% 2.4 VA 68% 69% 229 93% 198 80% 170 69% 76.9 WI 1% 1% 0 0% 0 0% 0 0% 1.8 WV 15% 14% 110 45% 58 24% 16 7% 16.4

F-13
Downwind State: Massachusetts UAM-V State Zero-Out ModelingContributions to 1-Hr Designated + Modeled Receptors
Base case: Total Number of Exceedences (grids-days) = 110Upwind State
Percent totalppb reduced>= 125 ppb
Percentpop-wgt totalppb
Number ofexceedencesreduced >= 2ppb
Percentexceedencesreduced >= 2ppb
Number ofexceedencesreduced >= 5ppb
Percentexceedencesreduced >= 5ppb
Number ofexceedencesreduced >=10 ppb
Percentexceedencesreduced >=10 ppb
max 1-hrcontributionppb
AL 0% 0% 0 0% 0 0% 0 0% 0.2 GA 0% 0% 0 0% 0 0% 0 0% 0.1 IL 1% 0% 0 0% 0 0% 0 0% 0.7 IN 2% 1% 0 0% 0 0% 0 0% 1.7 KY 1% 0% 0 0% 0 0% 0 0% 1.7 MA 81% 93% 78 71% 77 70% 75 68% 113 MI 3% 2% 1 1% 0 0% 0 0% 2.4 MO 0% 0% 0 0% 0 0% 0 0% 0.4 NC 1% 1% 0 0% 0 0% 0 0% 1.8 OH 5% 2% 13 12% 0 0% 0 0% 2.8 SC 0% 0% 0 0% 0 0% 0 0% 0.2 TN 0% 0% 0 0% 0 0% 0 0% 0.4 VA 6% 4% 11 10% 4 4% 0 0% 7.4 WI 1% 1% 0 0% 0 0% 0 0% 1 WV 5% 1% 7 6% 0 0% 0 0% 4.3

F-14
Downwind State: Michigan UAM-V State Zero-Out ModelingContributions to 1-Hr Designated + Modeled Receptors
Base case: Total Number of Exceedences (grids-days) = 16Upwind State
Percent totalppb reduced>= 125 ppb
Percentpop-wgt totalppb
Number ofexceedencesreduced >= 2ppb
Percentexceedencesreduced >= 2ppb
Number ofexceedencesreduced >= 5ppb
Percentexceedencesreduced >= 5ppb
Number ofexceedencesreduced >=10 ppb
Percentexceedencesreduced >=10 ppb
max 1-hrcontributionppb
AL 0% 0% 0 0% 0 0% 0 0% 0 GA 0% 0% 0 0% 0 0% 0 0% 0 IL 100% 100% 16 100% 16 100% 16 100% 60.1 IN 25% 15% 8 50% 7 44% 4 25% 21.2 KY 1% 0% 0 0% 0 0% 0 0% 0.3 MA 0% 0% 0 0% 0 0% 0 0% 0 MI -9% -37% 0 0% 0 0% 0 0% 1 MO 64% 77% 16 100% 13 81% 0 0% 5.8 NC 0% 0% 0 0% 0 0% 0 0% 0 OH 0% 0% 0 0% 0 0% 0 0% 0 SC 0% 0% 0 0% 0 0% 0 0% 0 TN 0% 0% 0 0% 0 0% 0 0% 0.1 VA 0% 0% 0 0% 0 0% 0 0% 0 WI 0% 0% 0 0% 0 0% 0 0% 0 WV 0% 0% 0 0% 0 0% 0 0% 0

F-15
Downwind State: Missouri UAM-V State Zero-Out ModelingContributions to 1-Hr Designated + Modeled Receptors
Base case: Total Number of Exceedences (grids-days) = 4Upwind State
Percent totalppb reduced>= 125 ppb
Percentpop-wgt totalppb
Number ofexceedencesreduced >= 2ppb
Percentexceedencesreduced >= 2ppb
Number ofexceedencesreduced >= 5ppb
Percentexceedencesreduced >= 5ppb
Number ofexceedencesreduced >=10 ppb
Percentexceedencesreduced >=10 ppb
max 1-hrcontributionppb
AL 16% 16% 0 0% 0 0% 0 0% 1.9 GA 12% 12% 0 0% 0 0% 0 0% 1.5 IL -39% -23% 1 25% 0 0% 0 0% 2.4 IN 8% 7% 0 0% 0 0% 0 0% 1.5 KY 16% 15% 2 50% 0 0% 0 0% 3.5 MA 0% 0% 0 0% 0 0% 0 0% 0 MI 4% 3% 0 0% 0 0% 0 0% 0.5 MO 100% 100% 4 100% 4 100% 4 100% 74.3 NC 8% 7% 0 0% 0 0% 0 0% 0.8 OH 8% 4% 0 0% 0 0% 0 0% 1 SC 8% 7% 0 0% 0 0% 0 0% 0.9 TN 12% 12% 0 0% 0 0% 0 0% 1.1 VA 0% 0% 0 0% 0 0% 0 0% 0.1 WI 0% 0% 0 0% 0 0% 0 0% 0 WV 0% 1% 0 0% 0 0% 0 0% 0.1

F-16
Downwind State: Mississippi UAM-V State Zero-Out ModelingContributions to 1-Hr Designated + Modeled Receptors
Base case: Total Number of Exceedences (grids-days) = 1Upwind State
Percent totalppb reduced>= 125 ppb
Percentpop-wgt totalppb
Number ofexceedencesreduced >= 2ppb
Percentexceedencesreduced >= 2ppb
Number ofexceedencesreduced >= 5ppb
Percentexceedencesreduced >= 5ppb
Number ofexceedencesreduced >=10 ppb
Percentexceedencesreduced >=10 ppb
max 1-hrcontributionppb
AL 0% 0% 0 0% 0 0% 0 0% 0 GA 0% 0% 0 0% 0 0% 0 0% 0 IL 0% 0% 0 0% 0 0% 0 0% 0.3 IN 0% 0% 0 0% 0 0% 0 0% 0 KY 0% 0% 0 0% 0 0% 0 0% 0 MA 0% 0% 0 0% 0 0% 0 0% 0 MI 0% 0% 0 0% 0 0% 0 0% 0 MO 0% 0% 1 100% 0 0% 0 0% 2.6 NC 0% 0% 0 0% 0 0% 0 0% 0 OH 0% 0% 0 0% 0 0% 0 0% 0 SC 0% 0% 0 0% 0 0% 0 0% 0 TN 0% 0% 1 100% 1 100% 1 100% 63.9 VA 0% 0% 0 0% 0 0% 0 0% 0 WI 0% 0% 0 0% 0 0% 0 0% 0 WV 0% 0% 0 0% 0 0% 0 0% 0

F-17
Downwind State: New Hampshire UAM-V State Zero-Out ModelingContributions to 1-Hr Designated + Modeled Receptors
Base case: Total Number of Exceedences (grids-days) = 17Upwind State
Percent totalppb reduced>= 125 ppb
Percentpop-wgt totalppb
Number ofexceedencesreduced >= 2ppb
Percentexceedencesreduced >= 2ppb
Number ofexceedencesreduced >= 5ppb
Percentexceedencesreduced >= 5ppb
Number ofexceedencesreduced >=10 ppb
Percentexceedencesreduced >=10 ppb
max 1-hrcontributionppb
AL 0% 0% 0 0% 0 0% 0 0% 0 GA 0% 0% 0 0% 0 0% 0 0% 0 IL 1% 0% 0 0% 0 0% 0 0% 0.2 IN 2% 2% 0 0% 0 0% 0 0% 0.7 KY 1% 0% 0 0% 0 0% 0 0% 0.2 MA 100% 100% 17 100% 17 100% 17 100% 69.2 MI 2% 2% 0 0% 0 0% 0 0% 0.8 MO 0% 0% 0 0% 0 0% 0 0% 0 NC 1% 0% 0 0% 0 0% 0 0% 0.4 OH 3% 2% 0 0% 0 0% 0 0% 1.2 SC 0% 0% 0 0% 0 0% 0 0% 0 TN 0% 0% 0 0% 0 0% 0 0% 0 VA 2% 2% 0 0% 0 0% 0 0% 0.5 WI 0% 0% 0 0% 0 0% 0 0% 0 WV 2% 2% 0 0% 0 0% 0 0% 0.8

F-18
Downwind State: New Jersey UAM-V State Zero-Out ModelingContributions to 1-Hr Designated + Modeled Receptors
Base case: Total Number of Exceedences (grids-days) = 168Upwind State
Percent totalppb reduced>= 125 ppb
Percentpop-wgt totalppb
Number ofexceedencesreduced >= 2ppb
Percentexceedencesreduced >= 2ppb
Number ofexceedencesreduced >= 5ppb
Percentexceedencesreduced >= 5ppb
Number ofexceedencesreduced >=10 ppb
Percentexceedencesreduced >=10 ppb
max 1-hrcontributionppb
AL 1% 1% 0 0% 0 0% 0 0% 0.4 GA 1% 2% 0 0% 0 0% 0 0% 0.4 IL 6% 7% 1 1% 0 0% 0 0% 2.5 IN 4% 4% 2 1% 0 0% 0 0% 2.4 KY 2% 1% 6 4% 0 0% 0 0% 2.8 MA 0% 0% 0 0% 0 0% 0 0% 0 MI 5% 7% 2 1% 1 1% 0 0% 5.8 MO 1% 2% 0 0% 0 0% 0 0% 0.7 NC 4% 7% 9 5% 0 0% 0 0% 4.4 OH 12% 9% 56 33% 0 0% 0 0% 4.4 SC 1% 3% 0 0% 0 0% 0 0% 1.1 TN 2% 2% 0 0% 0 0% 0 0% 0.6 VA 18% 19% 66 39% 33 20% 7 4% 19.3 WI 1% 3% 0 0% 0 0% 0 0% 1.4 WV 17% 10% 85 51% 22 13% 0 0% 9.6

F-19
Downwind State: New York UAM-V State Zero-Out ModelingContributions to 1-Hr Designated + Modeled Receptors
Base case: Total Number of Exceedences (grids-days) = 270Upwind State
Percent totalppb reduced>= 125 ppb
Percentpop-wgt totalppb
Number ofexceedencesreduced >= 2ppb
Percentexceedencesreduced >= 2ppb
Number ofexceedencesreduced >= 5ppb
Percentexceedencesreduced >= 5ppb
Number ofexceedencesreduced >=10 ppb
Percentexceedencesreduced >=10 ppb
max 1-hrcontributionppb
AL 0% 1% 0 0% 0 0% 0 0% 0.4 GA 0% 1% 0 0% 0 0% 0 0% 0.4 IL 3% 5% 11 4% 0 0% 0 0% 2.9 IN 3% 4% 14 5% 0 0% 0 0% 2.7 KY 2% 2% 11 4% 0 0% 0 0% 2.6 MA 0% 0% 0 0% 0 0% 0 0% 0 MI 3% 4% 9 3% 0 0% 0 0% 3.2 MO 1% 1% 0 0% 0 0% 0 0% 0.7 NC 3% 3% 2 1% 0 0% 0 0% 3.3 OH 9% 9% 83 31% 1 0% 0 0% 5.4 SC 1% 1% 0 0% 0 0% 0 0% 1.1 TN 1% 1% 0 0% 0 0% 0 0% 0.5 VA 11% 10% 101 37% 25 9% 0 0% 10 WI 1% 2% 0 0% 0 0% 0 0% 1.3 WV 10% 12% 80 30% 30 11% 3 1% 11.3

F-20
Downwind State: Ohio UAM-V State Zero-Out ModelingContributions to 1-Hr Designated + Modeled Receptors
Base case: Total Number of Exceedences (grids-days) = 8Upwind State
Percent totalppb reduced>= 125 ppb
Percentpop-wgt totalppb
Number ofexceedencesreduced >= 2ppb
Percentexceedencesreduced >= 2ppb
Number ofexceedencesreduced >= 5ppb
Percentexceedencesreduced >= 5ppb
Number ofexceedencesreduced >=10 ppb
Percentexceedencesreduced >=10 ppb
max 1-hrcontributionppb
AL 0% 0% 0 0% 0 0% 0 0% 0 GA 0% 0% 0 0% 0 0% 0 0% 0 IL 0% 0% 0 0% 0 0% 0 0% 0 IN 2% -11% 4 50% 0 0% 0 0% 4 KY 85% 86% 8 100% 8 100% 7 88% 54.3 MA 0% 0% 0 0% 0 0% 0 0% 0 MI 0% 0% 0 0% 0 0% 0 0% 0.1 MO 0% 0% 0 0% 0 0% 0 0% 0 NC 13% 25% 5 63% 0 0% 0 0% 3.8 OH 91% 92% 7 88% 7 88% 7 88% 53.1 SC 1% 3% 0 0% 0 0% 0 0% 1.2 TN 16% 29% 5 63% 1 13% 0 0% 5.5 VA 16% 28% 6 75% 0 0% 0 0% 5 WI 0% 0% 0 0% 0 0% 0 0% 0 WV 3% 6% 0 0% 0 0% 0 0% 1.6

F-21
Downwind State: Pennsylvania UAM-V State Zero-Out ModelingContributions to 1-Hr Designated + Modeled Receptors
Base case: Total Number of Exceedences (grids-days) = 43Upwind State
Percent totalppb reduced>= 125 ppb
Percentpop-wgt totalppb
Number ofexceedencesreduced >= 2ppb
Percentexceedencesreduced >= 2ppb
Number ofexceedencesreduced >= 5ppb
Percentexceedencesreduced >= 5ppb
Number ofexceedencesreduced >=10 ppb
Percentexceedencesreduced >=10 ppb
max 1-hrcontributionppb
AL 0% 0% 0 0% 0 0% 0 0% 0.2 GA 0% 1% 0 0% 0 0% 0 0% 0.5 IL 2% 6% 0 0% 0 0% 0 0% 1.6 IN 2% 4% 1 2% 0 0% 0 0% 2.2 KY 0% 0% 0 0% 0 0% 0 0% 0.8 MA 0% 0% 0 0% 0 0% 0 0% 0 MI 2% 2% 0 0% 0 0% 0 0% 1.6 MO 0% 1% 0 0% 0 0% 0 0% 0.3 NC 8% 6% 6 14% 0 0% 0 0% 3.7 OH 7% 12% 6 14% 0 0% 0 0% 4.8 SC 1% 1% 0 0% 0 0% 0 0% 1 TN 1% 1% 0 0% 0 0% 0 0% 0.4 VA 36% 28% 31 72% 15 35% 1 2% 16.3 WI 0% 0% 0 0% 0 0% 0 0% 0.1 WV 10% 18% 11 26% 6 14% 5 12% 40.4

F-22
Downwind State: Rhode Island UAM-V State Zero-Out ModelingContributions to 1-Hr Designated + Modeled Receptors
Base case: Total Number of Exceedences (grids-days) = 19Upwind State
Percent totalppb reduced>= 125 ppb
Percentpop-wgt totalppb
Number ofexceedencesreduced >= 2ppb
Percentexceedencesreduced >= 2ppb
Number ofexceedencesreduced >= 5ppb
Percentexceedencesreduced >= 5ppb
Number ofexceedencesreduced >=10 ppb
Percentexceedencesreduced >=10 ppb
max 1-hrcontributionppb
AL 0% 0% 0 0% 0 0% 0 0% 0.1 GA 0% 0% 0 0% 0 0% 0 0% 0.1 IL 5% 5% 0 0% 0 0% 0 0% 1.3 IN 5% 5% 0 0% 0 0% 0 0% 1.8 KY 2% 0% 0 0% 0 0% 0 0% 1.4 MA 0% 0% 0 0% 0 0% 0 0% 0.7 MI 2% 5% 0 0% 0 0% 0 0% 0.8 MO 1% 0% 0 0% 0 0% 0 0% 0.3 NC 3% 5% 0 0% 0 0% 0 0% 0.9 OH 16% 20% 8 42% 0 0% 0 0% 3.5 SC 0% 0% 0 0% 0 0% 0 0% 0.1 TN 0% 0% 0 0% 0 0% 0 0% 0.2 VA 17% 20% 7 37% 1 5% 0 0% 7.8 WI 0% 0% 0 0% 0 0% 0 0% 0.1 WV 15% 20% 7 37% 0 0% 0 0% 4.5

F-23
Downwind State: Tennessee UAM-V State Zero-Out ModelingContributions to 1-Hr Designated + Modeled Receptors
Base case: Total Number of Exceedences (grids-days) = 22Upwind State
Percent totalppb reduced>= 125 ppb
Percentpop-wgt totalppb
Number ofexceedencesreduced >= 2ppb
Percentexceedencesreduced >= 2ppb
Number ofexceedencesreduced >= 5ppb
Percentexceedencesreduced >= 5ppb
Number ofexceedencesreduced >=10 ppb
Percentexceedencesreduced >=10 ppb
max 1-hrcontributionppb
AL 21% 21% 8 36% 4 18% 0 0% 7.3 GA 18% 21% 4 18% 4 18% 0 0% 8.3 IL 4% 16% 1 5% 1 5% 0 0% 5.2 IN 1% 0% 0 0% 0 0% 0 0% 0.1 KY 4% 8% 0 0% 0 0% 0 0% 1.1 MA 0% 0% 0 0% 0 0% 0 0% 0 MI 0% 0% 0 0% 0 0% 0 0% 0 MO 3% 13% 1 5% 0 0% 0 0% 4.3 NC 3% 3% 0 0% 0 0% 0 0% 1.2 OH 0% 0% 0 0% 0 0% 0 0% 0.3 SC 7% 5% 2 9% 0 0% 0 0% 3.1 TN 100% 100% 22 100% 22 100% 22 100% 100.4 VA 1% 0% 0 0% 0 0% 0 0% 0.1 WI 0% 0% 0 0% 0 0% 0 0% 0.1 WV 0% 0% 0 0% 0 0% 0 0% 0.4

F-24
Downwind State: Texas UAM-V State Zero-Out ModelingContributions to 1-Hr Designated + Modeled Receptors
Base case: Total Number of Exceedences (grids-days) = 87Upwind State
Percent totalppb reduced>= 125 ppb
Percentpop-wgt totalppb
Number ofexceedencesreduced >= 2ppb
Percentexceedencesreduced >= 2ppb
Number ofexceedencesreduced >= 5ppb
Percentexceedencesreduced >= 5ppb
Number ofexceedencesreduced >=10 ppb
Percentexceedencesreduced >=10 ppb
max 1-hrcontributionppb
AL 0% 0% 0 0% 0 0% 0 0% 0.6 GA 0% 0% 0 0% 0 0% 0 0% 0 IL 0% 0% 0 0% 0 0% 0 0% 0.2 IN 0% 0% 0 0% 0 0% 0 0% 0 KY 0% 0% 0 0% 0 0% 0 0% 0 MA 0% 0% 0 0% 0 0% 0 0% 0 MI 0% 0% 0 0% 0 0% 0 0% 0 MO 1% 0% 0 0% 0 0% 0 0% 0.4 NC 0% 0% 0 0% 0 0% 0 0% 0 OH 0% 0% 0 0% 0 0% 0 0% 0 SC 0% 0% 0 0% 0 0% 0 0% 0 TN 0% 0% 0 0% 0 0% 0 0% 0.2 VA 0% 0% 0 0% 0 0% 0 0% 0 WI 0% 0% 0 0% 0 0% 0 0% 0 WV 0% 0% 0 0% 0 0% 0 0% 0

F-25
Downwind State: Virginia UAM-V State Zero-Out ModelingContributions to 1-Hr Designated + Modeled Receptors
Base case: Total Number of Exceedences (grids-days) = 69Upwind State
Percent totalppb reduced>= 125 ppb
Percentpop-wgt totalppb
Number ofexceedencesreduced >= 2ppb
Percentexceedencesreduced >= 2ppb
Number ofexceedencesreduced >= 5ppb
Percentexceedencesreduced >= 5ppb
Number ofexceedencesreduced >=10 ppb
Percentexceedencesreduced >=10 ppb
max 1-hrcontributionppb
AL 0% 0% 0 0% 0 0% 0 0% 0.2 GA 0% 0% 0 0% 0 0% 0 0% 0.3 IL 1% 1% 0 0% 0 0% 0 0% 1.5 IN 1% 2% 0 0% 0 0% 0 0% 1.8 KY 1% 2% 2 3% 0 0% 0 0% 4.7 MA 0% 0% 0 0% 0 0% 0 0% 0 MI 1% 2% 0 0% 0 0% 0 0% 1.8 MO 0% 0% 0 0% 0 0% 0 0% 0.6 NC 2% 2% 0 0% 0 0% 0 0% 1.4 OH 2% 3% 5 7% 0 0% 0 0% 3.5 SC 0% 0% 0 0% 0 0% 0 0% 0.1 TN 0% 0% 0 0% 0 0% 0 0% 0.8 VA 86% 69% 67 97% 66 96% 65 94% 101 WI 0% 0% 0 0% 0 0% 0 0% 0.3 WV 4% 7% 9 13% 4 6% 2 3% 12.7

APPENDIX GEVALUATION OF CONTRIBUTIONS -- TABLES OF METRICS1-HOUR CAMX: UPWIND STATES TO DOWNWIND STATES

G-1
The tables in this Appendix contain information on the CAMx metrics used for theevaluation of contributions. Tables are provided only for those downwind States whichcontain grid cells with expected exceedences in the Base Case. For example,Mississippi is not included in this Appendix because there were no predictedexceedences in the Base Case using CAMx, but it is included in Appendix F becausethere were predicted exceedences using UAM-V. The headings in the table relate to themetrics as follows:
Average percent contribution (4-episode) Metric 4Highest daily average contribution (ppb) Metric 3Highest daily average contribution (%) Metric 3Number of exceedences reduced >= 2 ppb Metrics 1 & 2Percent exceedences reduced >= 2 ppb Metrics 1 & 2Number of exceedences reduced >= 5 ppb Metrics 1 & 2Percent exceedences reduced >= 5 ppb Metrics 1 & 2Number of exceedences reduced >= 10 ppb Metrics 1 & 2Percent exceedences reduced >= 10 ppb Metrics 1 & 2Max 1-hr contribution ppb Metric 2
(Note: Some of the maximum contribution values may appear to be inconsistent with thenumber of exceedences above a certain cut-point. For example, a contribution of9.999........ is interpreted as being less that 10 ppb for the purpose of counting thenumber of exceedence reduced; however, this value is rounded to 10 ppb in thepresentation of maximum "ppb" contribution in these tables.)

G-2
Downwind State : Alabama ; CAMX Source Apportionment Modeling Contributions to 1-Hr Designated + Modeled Receptors
Base Case: Total Number of Exceedences (grid-hours) = 876Upwind State: Average
percentcontribution(4-episode)
Highest dailyaverage (ppb)
Highest dailyaverage (%)
Number ofexceedencesreduced >= 2ppb
Percentexceedencesreduced >= 2ppb
Number ofexceedencesreduced >= 5ppb
Percentexceedencesreduced >= 5ppb
Number ofexceedencesreduced >=10 ppb
Percentexceedencesreduced >=10 ppb
Max 1hrcontribution(ppb)
AL 79% 117 85% 876 100% 876 100% 876 100% 149.9CT/RI 0% 0 0% 0 0% 0 0% 0 0% 0.1FL 0% 3 2% 137 15% 0 0% 0 0% 3.7GA 3% 24 18% 236 26% 231 26% 141 16% 51.1IA 0% 0 0% 0 0% 0 0% 0 0% 0.2IL 0% 1 1% 1 0% 0 0% 0 0% 2IN 1% 3 2% 107 12% 0 0% 0 0% 4KY 2% 7 5% 247 28% 186 21% 0 0% 9.8LA 2% 9 7% 344 39% 119 13% 0 0% 9.2MA 0% 0 0% 0 0% 0 0% 0 0% 0.1MD/DC/DE 0% 0 0% 0 0% 0 0% 0 0% 0.1ME 0% 0 0% 0 0% 0 0% 0 0% 0MI 0% 0 0% 0 0% 0 0% 0 0% 0.2MO 0% 2 2% 25 2% 0 0% 0 0% 2.8MS 4% 12 9% 471 53% 381 43% 263 30% 14.2NC 0% 3 3% 118 13% 0 0% 0 0% 4NH/VT 0% 0 0% 0 0% 0 0% 0 0% 0.1NJ 0% 0 0% 0 0% 0 0% 0 0% 0.3NY 0% 0 0% 0 0% 0 0% 0 0% 0.4OH 0% 1 0% 0 0% 0 0% 0 0% 1.6PA 0% 0 0% 0 0% 0 0% 0 0% 0.3SC 1% 18 14% 147 16% 58 6% 15 1% 20.9TN 5% 17 12% 396 45% 354 40% 260 29% 25.9TX 1% 3 2% 145 16% 0 0% 0 0% 3.5VA 0% 0 0% 0 0% 0 0% 0 0% 0.6WI 0% 0 0% 0 0% 0 0% 0 0% 0.2WV 0% 0 0% 0 0% 0 0% 0 0% 0.6West 1% 7 6% 112 12% 67 7% 0 0% 8.1Canada 0% 0 0% 0 0% 0 0% 0 0% 0.2

G-3
Downwind State : Connecticut ; CAMX Source Apportionment Modeling Contributions to 1-Hr Designated + Modeled Receptors
Base Case: Total Number of Exceedences (grid-hours) = 844Upwind State: Average
percentcontribution(4-episode)
Highest dailyaverage (ppb)
Highest dailyaverage (%)
Number ofexceedencesreduced >= 2ppb
Percentexceedencesreduced >= 2ppb
Number ofexceedencesreduced >= 5ppb
Percentexceedencesreduced >= 5ppb
Number ofexceedencesreduced >=10 ppb
Percentexceedencesreduced >=10 ppb
Max 1hrcontribution(ppb)
AL 0% 1 1% 0 0% 0 0% 0 0% 1.6CT/RI 13% 38 30% 625 74% 526 62% 408 48% 64.9FL 0% 2 1% 72 8% 0 0% 0 0% 3.9GA 0% 1 1% 0 0% 0 0% 0 0% 1.2IA 0% 1 1% 0 0% 0 0% 0 0% 1.4IL 1% 5 4% 211 25% 144 17% 0 0% 7.7IN 1% 3 2% 175 20% 0 0% 0 0% 3.9KY 0% 2 1% 1 0% 0 0% 0 0% 2.1LA 0% 0 0% 0 0% 0 0% 0 0% 0.8MA 0% 0 0% 0 0% 0 0% 0 0% 1.9MD/DC/DE 3% 13 10% 617 73% 255 30% 27 3% 13ME 0% 0 0% 0 0% 0 0% 0 0% 0MI 1% 5 4% 320 37% 13 1% 0 0% 5.9MO 1% 2 2% 102 12% 0 0% 0 0% 3.5MS 0% 0 0% 0 0% 0 0% 0 0% 0.5NC 1% 5 4% 185 21% 93 11% 0 0% 9.5NH/VT 0% 0 0% 0 0% 0 0% 0 0% 0.3NJ 29% 45 35% 844 100% 844 100% 839 99% 65NY 26% 39 28% 844 100% 844 100% 838 99% 64.5OH 2% 11 8% 297 35% 170 20% 50 5% 14.9PA 11% 23 18% 844 100% 827 97% 548 64% 35.6SC 0% 2 1% 71 8% 0 0% 0 0% 3TN 0% 2 1% 0 0% 0 0% 0 0% 1.9TX 0% 0 0% 0 0% 0 0% 0 0% 0.2VA 4% 10 7% 532 63% 317 37% 67 7% 14.9WI 0% 2 1% 55 6% 0 0% 0 0% 2.7WV 2% 10 8% 266 31% 160 18% 18 2% 12West 0% 1 1% 0 0% 0 0% 0 0% 1.3Canada 2% 7 5% 381 45% 248 29% 0 0% 9.1

G-4
Downwind State : Delaware ; CAMX Source Apportionment Modeling Contributions to 1-Hr Designated + Modeled Receptors
Base Case: Total Number of Exceedences (grid-hours) = 67Upwind State: Average
percentcontribution(4-episode)
Highest dailyaverage (ppb)
Highest dailyaverage (%)
Number ofexceedencesreduced >= 2ppb
Percentexceedencesreduced >= 2ppb
Number ofexceedencesreduced >= 5ppb
Percentexceedencesreduced >= 5ppb
Number ofexceedencesreduced >=10 ppb
Percentexceedencesreduced >=10 ppb
Max 1hrcontribution(ppb)
AL 1% 1 1% 0 0% 0 0% 0 0% 1CT/RI 0% 0 0% 0 0% 0 0% 0 0% 0FL 0% 0 0% 0 0% 0 0% 0 0% 0.1GA 1% 1 1% 0 0% 0 0% 0 0% 1.2IA 0% 0 0% 0 0% 0 0% 0 0% 0.2IL 4% 4 3% 67 100% 14 20% 0 0% 6.2IN 3% 4 3% 50 74% 28 41% 0 0% 6.2KY 2% 2 2% 37 55% 0 0% 0 0% 4.8LA 0% 0 0% 0 0% 0 0% 0 0% 0MA 0% 0 0% 0 0% 0 0% 0 0% 0MD/DC/DE 54% 63 45% 67 100% 67 100% 67 100% 99.6ME 0% 0 0% 0 0% 0 0% 0 0% 0MI 2% 2 2% 38 56% 0 0% 0 0% 3.4MO 1% 1 0% 0 0% 0 0% 0 0% 1.3MS 0% 0 0% 0 0% 0 0% 0 0% 0.1NC 1% 1 1% 14 20% 0 0% 0 0% 3.5NH/VT 0% 0 0% 0 0% 0 0% 0 0% 0NJ 0% 0 0% 0 0% 0 0% 0 0% 0.7NY 0% 0 0% 0 0% 0 0% 0 0% 0.3OH 6% 7 5% 67 100% 50 74% 0 0% 9.7PA 4% 5 4% 34 50% 16 23% 10 14% 32.4SC 0% 1 0% 0 0% 0 0% 0 0% 0.8TN 2% 2 2% 42 62% 0 0% 0 0% 2.9TX 0% 0 0% 0 0% 0 0% 0 0% 0VA 13% 15 11% 66 98% 58 86% 50 74% 26.6WI 0% 0 0% 0 0% 0 0% 0 0% 0.7WV 7% 8 6% 67 100% 59 88% 12 17% 11.2West 0% 0 0% 0 0% 0 0% 0 0% 0.2Canada 0% 0 0% 0 0% 0 0% 0 0% 0.8

G-5
Downwind State : District of Columbia ; CAMX Source Apportionment Modeling Contributions to 1-Hr Designated + Modeled Receptors
Base Case: Total Number of Exceedences (grid-hours) = 13Upwind State: Average
percentcontribution(4-episode)
Highest dailyaverage (ppb)
Highest dailyaverage (%)
Number ofexceedencesreduced >= 2ppb
Percentexceedencesreduced >= 2ppb
Number ofexceedencesreduced >= 5ppb
Percentexceedencesreduced >= 5ppb
Number ofexceedencesreduced >=10 ppb
Percentexceedencesreduced >=10 ppb
Max 1hrcontribution(ppb)
AL 0% 1 0% 0 0% 0 0% 0 0% 0.8CT/RI 0% 0 0% 0 0% 0 0% 0 0% 0.1FL 0% 0 0% 0 0% 0 0% 0 0% 0.1GA 0% 1 1% 0 0% 0 0% 0 0% 1.2IA 0% 0 0% 0 0% 0 0% 0 0% 0IL 1% 3 2% 6 46% 0 0% 0 0% 3.2IN 2% 6 4% 6 46% 4 30% 0 0% 8.3KY 2% 6 4% 6 46% 3 23% 0 0% 8.9LA 0% 0 0% 0 0% 0 0% 0 0% 0MA 0% 0 0% 0 0% 0 0% 0 0% 0MD/DC/DE 29% 73 50% 12 92% 10 76% 8 61% 80.6ME 0% 0 0% 0 0% 0 0% 0 0% 0MI 1% 3 2% 5 38% 0 0% 0 0% 3.7MO 0% 0 0% 0 0% 0 0% 0 0% 0.3MS 0% 0 0% 0 0% 0 0% 0 0% 0.1NC 2% 5 3% 11 84% 2 15% 0 0% 6.1NH/VT 0% 0 0% 0 0% 0 0% 0 0% 0NJ 0% 1 1% 0 0% 0 0% 0 0% 0.8NY 1% 2 1% 0 0% 0 0% 0 0% 1.8OH 3% 8 6% 6 46% 6 46% 0 0% 9.6PA 6% 17 12% 7 53% 7 53% 5 38% 18.6SC 0% 1 0% 0 0% 0 0% 0 0% 0.8TN 1% 3 2% 4 30% 0 0% 0 0% 3.3TX 0% 0 0% 0 0% 0 0% 0 0% 0VA 45% 87 57% 13 100% 13 100% 13 100% 106.6WI 0% 0 0% 0 0% 0 0% 0 0% 0.2WV 4% 8 5% 9 69% 6 46% 0 0% 9.9West 0% 0 0% 0 0% 0 0% 0 0% 0Canada 1% 2 2% 2 15% 0 0% 0 0% 2.3

G-6
Downwind State : Georgia ; CAMX Source Apportionment Modeling Contributions to 1-Hr Designated + Modeled Receptors
Base Case: Total Number of Exceedences (grid-hours) = 2046Upwind State: Average
percentcontribution(4-episode)
Highest dailyaverage (ppb)
Highest dailyaverage (%)
Number ofexceedencesreduced >= 2ppb
Percentexceedencesreduced >= 2ppb
Number ofexceedencesreduced >= 5ppb
Percentexceedencesreduced >= 5ppb
Number ofexceedencesreduced >=10 ppb
Percentexceedencesreduced >=10 ppb
Max 1hrcontribution(ppb)
AL 8% 31 23% 1427 69% 1051 51% 880 43% 39CT/RI 0% 0 0% 0 0% 0 0% 0 0% 0.1FL 0% 3 2% 28 1% 0 0% 0 0% 3GA 79% 127 82% 2046 100% 2046 100% 2046 100% 201.8IA 0% 0 0% 0 0% 0 0% 0 0% 0.2IL 0% 2 2% 67 3% 0 0% 0 0% 2.3IN 0% 2 1% 56 2% 0 0% 0 0% 2.7KY 1% 11 8% 511 24% 147 7% 58 2% 13.7LA 1% 8 6% 669 32% 192 9% 0 0% 8.3MA 0% 0 0% 0 0% 0 0% 0 0% 0.1MD/DC/DE 0% 0 0% 0 0% 0 0% 0 0% 0.6ME 0% 0 0% 0 0% 0 0% 0 0% 0MI 0% 0 0% 0 0% 0 0% 0 0% 1.1MO 0% 3 2% 112 5% 0 0% 0 0% 3.6MS 2% 9 6% 808 39% 456 22% 23 1% 10.7NC 1% 7 5% 285 13% 26 1% 0 0% 7.6NH/VT 0% 0 0% 0 0% 0 0% 0 0% 0NJ 0% 0 0% 0 0% 0 0% 0 0% 0.5NY 0% 1 0% 0 0% 0 0% 0 0% 0.7OH 0% 2 1% 86 4% 3 0% 0 0% 5.5PA 0% 1 1% 0 0% 0 0% 0 0% 1.3SC 1% 23 18% 627 30% 230 11% 23 1% 24.9TN 4% 11 8% 1470 71% 860 42% 259 12% 20.4TX 1% 5 4% 443 21% 13 0% 0 0% 5.7VA 0% 1 1% 0 0% 0 0% 0 0% 1.5WI 0% 0 0% 0 0% 0 0% 0 0% 0.4WV 0% 1 1% 0 0% 0 0% 0 0% 1.6West 1% 6 5% 241 11% 46 2% 0 0% 7.2Canada 0% 0 0% 0 0% 0 0% 0 0% 0.3

G-7
Downwind State : Illinois ; CAMX Source Apportionment Modeling Contributions to 1-Hr Designated + Modeled Receptors
Base Case: Total Number of Exceedences (grid-hours) = 25Upwind State: Average
percentcontribution(4-episode)
Highest dailyaverage (ppb)
Highest dailyaverage (%)
Number ofexceedencesreduced >= 2ppb
Percentexceedencesreduced >= 2ppb
Number ofexceedencesreduced >= 5ppb
Percentexceedencesreduced >= 5ppb
Number ofexceedencesreduced >=10 ppb
Percentexceedencesreduced >=10 ppb
Max 1hrcontribution(ppb)
AL 2% 5 4% 8 32% 8 32% 0 0% 5.6CT/RI 0% 0 0% 0 0% 0 0% 0 0% 0FL 0% 0 0% 0 0% 0 0% 0 0% 0GA 1% 3 2% 8 32% 0 0% 0 0% 3.2IA 0% 0 0% 0 0% 0 0% 0 0% 0.2IL 59% 84 61% 25 100% 25 100% 25 100% 98.6IN 4% 6 5% 12 48% 8 32% 5 20% 16.6KY 0% 0 0% 0 0% 0 0% 0 0% 0.4LA 0% 0 0% 0 0% 0 0% 0 0% 0.3MA 0% 0 0% 0 0% 0 0% 0 0% 0MD/DC/DE 0% 0 0% 0 0% 0 0% 0 0% 0.3ME 0% 0 0% 0 0% 0 0% 0 0% 0MI 0% 0 0% 0 0% 0 0% 0 0% 0MO 23% 59 46% 25 100% 25 100% 9 36% 70.5MS 1% 2 1% 0 0% 0 0% 0 0% 1.7NC 1% 2 1% 0 0% 0 0% 0 0% 2NH/VT 0% 0 0% 0 0% 0 0% 0 0% 0NJ 0% 0 0% 0 0% 0 0% 0 0% 0.2NY 0% 0 0% 0 0% 0 0% 0 0% 0.2OH 0% 0 0% 0 0% 0 0% 0 0% 0PA 0% 0 0% 0 0% 0 0% 0 0% 0.5SC 1% 2 2% 8 32% 0 0% 0 0% 2.2TN 2% 3 3% 8 32% 0 0% 0 0% 3.6TX 0% 0 0% 0 0% 0 0% 0 0% 0.2VA 0% 0 0% 0 0% 0 0% 0 0% 0.4WI 2% 4 3% 12 48% 5 20% 0 0% 7.3WV 0% 0 0% 0 0% 0 0% 0 0% 0.1West 3% 5 4% 17 68% 13 52% 0 0% 5.6Canada 0% 0 0% 0 0% 0 0% 0 0% 0.1

G-8
Downwind State : Indiana ; CAMX Source Apportionment Modeling Contributions to 1-Hr Designated + Modeled Receptors
Base Case: Total Number of Exceedences (grid-hours) = 17Upwind State: Average
percentcontribution(4-episode)
Highest dailyaverage (ppb)
Highest dailyaverage (%)
Number ofexceedencesreduced >= 2ppb
Percentexceedencesreduced >= 2ppb
Number ofexceedencesreduced >= 5ppb
Percentexceedencesreduced >= 5ppb
Number ofexceedencesreduced >=10 ppb
Percentexceedencesreduced >=10 ppb
Max 1hrcontribution(ppb)
AL 2% 3 2% 13 76% 0 0% 0 0% 3.9CT/RI 0% 0 0% 0 0% 0 0% 0 0% 0FL 0% 0 0% 0 0% 0 0% 0 0% 0GA 1% 2 2% 2 11% 0 0% 0 0% 2.4IA 0% 0 0% 0 0% 0 0% 0 0% 0.2IL 4% 30 24% 4 23% 2 11% 2 11% 30.3IN 24% 49 38% 17 100% 17 100% 17 100% 51.2KY 39% 50 38% 15 88% 15 88% 15 88% 59LA 0% 0 0% 0 0% 0 0% 0 0% 0.1MA 0% 0 0% 0 0% 0 0% 0 0% 0MD/DC/DE 0% 0 0% 0 0% 0 0% 0 0% 0.3ME 0% 0 0% 0 0% 0 0% 0 0% 0MI 0% 0 0% 0 0% 0 0% 0 0% 0.3MO 2% 11 9% 2 11% 2 11% 2 11% 11.3MS 0% 2 1% 0 0% 0 0% 0 0% 1.9NC 1% 3 3% 2 11% 0 0% 0 0% 3.4NH/VT 0% 0 0% 0 0% 0 0% 0 0% 0NJ 0% 0 0% 0 0% 0 0% 0 0% 0.1NY 0% 0 0% 0 0% 0 0% 0 0% 0.1OH 0% 0 0% 0 0% 0 0% 0 0% 0.4PA 0% 1 1% 0 0% 0 0% 0 0% 0.7SC 0% 2 2% 2 11% 0 0% 0 0% 2.1TN 24% 33 25% 15 88% 15 88% 13 76% 36.8TX 0% 0 0% 0 0% 0 0% 0 0% 0.1VA 0% 1 1% 0 0% 0 0% 0 0% 1.4WI 0% 2 2% 2 11% 0 0% 0 0% 2.5WV 0% 0 0% 0 0% 0 0% 0 0% 0.5West 1% 6 5% 2 11% 2 11% 0 0% 5.9Canada 0% 0 0% 0 0% 0 0% 0 0% 0.2

G-9
Downwind State : Kentucky ; CAMX Source Apportionment Modeling Contributions to 1-Hr Designated + Modeled Receptors
Base Case: Total Number of Exceedences (grid-hours) = 157Upwind State: Average
percentcontribution(4-episode)
Highest dailyaverage (ppb)
Highest dailyaverage (%)
Number ofexceedencesreduced >= 2ppb
Percentexceedencesreduced >= 2ppb
Number ofexceedencesreduced >= 5ppb
Percentexceedencesreduced >= 5ppb
Number ofexceedencesreduced >=10 ppb
Percentexceedencesreduced >=10 ppb
Max 1hrcontribution(ppb)
AL 2% 6 4% 60 38% 30 19% 0 0% 6.7CT/RI 0% 0 0% 0 0% 0 0% 0 0% 0FL 0% 0 0% 0 0% 0 0% 0 0% 0.1GA 2% 4 3% 53 33% 4 2% 0 0% 5.6IA 0% 0 0% 0 0% 0 0% 0 0% 0.2IL 1% 2 2% 13 8% 0 0% 0 0% 3.4IN 16% 30 23% 150 95% 134 85% 110 70% 39.5KY 59% 72 55% 157 100% 157 100% 157 100% 86.8LA 0% 0 0% 0 0% 0 0% 0 0% 0MA 0% 0 0% 0 0% 0 0% 0 0% 0MD/DC/DE 0% 0 0% 0 0% 0 0% 0 0% 0.4ME 0% 0 0% 0 0% 0 0% 0 0% 0MI 0% 0 0% 0 0% 0 0% 0 0% 0.1MO 0% 1 0% 0 0% 0 0% 0 0% 0.9MS 0% 0 0% 0 0% 0 0% 0 0% 0.2NC 2% 5 4% 85 54% 1 0% 0 0% 5.2NH/VT 0% 0 0% 0 0% 0 0% 0 0% 0NJ 0% 0 0% 0 0% 0 0% 0 0% 0.1NY 0% 0 0% 0 0% 0 0% 0 0% 0.2OH 1% 67 51% 17 10% 2 1% 2 1% 69.1PA 0% 1 1% 0 0% 0 0% 0 0% 1.3SC 2% 3 2% 70 44% 0 0% 0 0% 3.1TN 13% 34 24% 157 100% 119 75% 72 45% 37.5TX 0% 0 0% 0 0% 0 0% 0 0% 0VA 1% 3 2% 2 1% 0 0% 0 0% 3WI 0% 0 0% 0 0% 0 0% 0 0% 0.1WV 0% 4 3% 2 1% 0 0% 0 0% 4.4West 0% 1 0% 0 0% 0 0% 0 0% 0.8Canada 0% 0 0% 0 0% 0 0% 0 0% 0.2

G-10
Downwind State : Louisiana ; CAMX Source Apportionment Modeling Contributions to 1-Hr Designated + Modeled Receptors
Base Case: Total Number of Exceedences (grid-hours) = 59Upwind State: Average
percentcontribution(4-episode)
Highest dailyaverage (ppb)
Highest dailyaverage (%)
Number ofexceedencesreduced >= 2ppb
Percentexceedencesreduced >= 2ppb
Number ofexceedencesreduced >= 5ppb
Percentexceedencesreduced >= 5ppb
Number ofexceedencesreduced >=10 ppb
Percentexceedencesreduced >=10 ppb
Max 1hrcontribution(ppb)
AL 1% 7 6% 7 11% 7 11% 0 0% 8.2CT/RI 0% NA NA 0 0% 0 0% 0 0% 0FL 0% 0 0% 0 0% 0 0% 0 0% 0.1GA 0% 2 1% 1 1% 0 0% 0 0% 2.2IA 0% 0 0% 0 0% 0 0% 0 0% 0.6IL 0% 2 1% 0 0% 0 0% 0 0% 1.8IN 0% 2 1% 0 0% 0 0% 0 0% 1.8KY 0% 3 3% 7 11% 0 0% 0 0% 3.4LA 70% 79 60% 59 100% 59 100% 59 100% 90.7MA 0% NA NA 0 0% 0 0% 0 0% 0MD/DC/DE 0% NA NA 0 0% 0 0% 0 0% 0ME 0% NA NA 0 0% 0 0% 0 0% 0MI 0% 0 0% 0 0% 0 0% 0 0% 0.1MO 2% 2 2% 44 74% 0 0% 0 0% 3.3MS 14% 19 15% 59 100% 59 100% 59 100% 22NC 0% 0 0% 0 0% 0 0% 0 0% 0.1NH/VT 0% NA NA 0 0% 0 0% 0 0% 0NJ 0% NA NA 0 0% 0 0% 0 0% 0NY 0% NA NA 0 0% 0 0% 0 0% 0OH 0% 0 0% 0 0% 0 0% 0 0% 0.1PA 0% NA NA 0 0% 0 0% 0 0% 0SC 0% 0 0% 0 0% 0 0% 0 0% 0.1TN 1% 5 4% 7 11% 7 11% 0 0% 5.4TX 3% 4 3% 50 84% 24 40% 0 0% 7.4VA 0% 0 0% 0 0% 0 0% 0 0% 0WI 0% 0 0% 0 0% 0 0% 0 0% 0.2WV 0% 0 0% 0 0% 0 0% 0 0% 0West 6% 7 5% 52 88% 52 88% 0 0% 7.8Canada 0% 0 0% 0 0% 0 0% 0 0% 0

G-11
Downwind State : Maine ; CAMX Source Apportionment Modeling Contributions to 1-Hr Designated + Modeled Receptors
Base Case: Total Number of Exceedences (grid-hours) = 50Upwind State: Average
percentcontribution(4-episode)
Highest dailyaverage (ppb)
Highest dailyaverage (%)
Number ofexceedencesreduced >= 2ppb
Percentexceedencesreduced >= 2ppb
Number ofexceedencesreduced >= 5ppb
Percentexceedencesreduced >= 5ppb
Number ofexceedencesreduced >=10 ppb
Percentexceedencesreduced >=10 ppb
Max 1hrcontribution(ppb)
AL 0% 0 0% 0 0% 0 0% 0 0% 0.1CT/RI 6% 7 6% 50 100% 38 76% 2 4% 10.8FL 0% 0 0% 0 0% 0 0% 0 0% 0.8GA 0% 0 0% 0 0% 0 0% 0 0% 0.3IA 0% 0 0% 0 0% 0 0% 0 0% 0.2IL 0% 1 0% 0 0% 0 0% 0 0% 0.9IN 1% 1 1% 0 0% 0 0% 0 0% 1.6KY 0% 1 0% 0 0% 0 0% 0 0% 0.6LA 0% 0 0% 0 0% 0 0% 0 0% 0MA 56% 67 51% 50 100% 50 100% 50 100% 79MD/DC/DE 3% 4 3% 49 98% 11 22% 0 0% 6.6ME 2% 3 2% 21 42% 5 10% 0 0% 9.6MI 1% 3 2% 1 2% 0 0% 0 0% 3MO 0% 0 0% 0 0% 0 0% 0 0% 0.1MS 0% 0 0% 0 0% 0 0% 0 0% 0NC 2% 3 2% 23 46% 2 4% 0 0% 5.4NH/VT 4% 8 6% 37 74% 19 38% 5 10% 17.5NJ 4% 9 7% 41 82% 20 40% 0 0% 8.6NY 6% 14 11% 47 94% 20 40% 19 38% 16OH 2% 4 3% 30 60% 0 0% 0 0% 4.2PA 5% 10 8% 50 100% 31 62% 1 2% 10.3SC 0% 1 0% 0 0% 0 0% 0 0% 1.9TN 0% 0 0% 0 0% 0 0% 0 0% 0.1TX 0% 0 0% 0 0% 0 0% 0 0% 0VA 3% 6 4% 29 58% 17 34% 2 4% 12.1WI 0% 0 0% 0 0% 0 0% 0 0% 0.2WV 1% 2 2% 25 50% 0 0% 0 0% 2.5West 0% 0 0% 0 0% 0 0% 0 0% 0.3Canada 2% 5 4% 20 40% 14 28% 0 0% 6

G-12
Downwind State : Maryland ; CAMX Source Apportionment Modeling Contributions to 1-Hr Designated + Modeled Receptors
Base Case: Total Number of Exceedences (grid-hours) = 1507Upwind State: Average
percentcontribution(4-episode)
Highest dailyaverage (ppb)
Highest dailyaverage (%)
Number ofexceedencesreduced >= 2ppb
Percentexceedencesreduced >= 2ppb
Number ofexceedencesreduced >= 5ppb
Percentexceedencesreduced >= 5ppb
Number ofexceedencesreduced >=10 ppb
Percentexceedencesreduced >=10 ppb
Max 1hrcontribution(ppb)
AL 0% 6 4% 9 0% 6 0% 0 0% 7.9CT/RI 0% 0 0% 0 0% 0 0% 0 0% 0.1FL 0% 2 2% 8 0% 0 0% 0 0% 2.5GA 1% 3 2% 26 1% 0 0% 0 0% 3.8IA 0% 1 1% 0 0% 0 0% 0 0% 1.2IL 2% 6 5% 824 54% 94 6% 0 0% 6.7IN 2% 6 5% 598 39% 387 25% 0 0% 8.8KY 2% 8 6% 596 39% 320 21% 2 0% 10.2LA 0% 1 1% 0 0% 0 0% 0 0% 1.3MA 0% 0 0% 0 0% 0 0% 0 0% 0.1MD/DC/DE 42% 65 50% 1501 99% 1489 98% 1462 97% 126.4ME 0% 0 0% 0 0% 0 0% 0 0% 0MI 2% 8 6% 696 46% 99 6% 0 0% 9.5MO 0% 4 3% 65 4% 0 0% 0 0% 3.8MS 0% 1 1% 0 0% 0 0% 0 0% 0.9NC 2% 11 9% 553 36% 199 13% 97 6% 20.2NH/VT 0% 0 0% 0 0% 0 0% 0 0% 0NJ 0% 1 1% 0 0% 0 0% 0 0% 1.5NY 1% 2 2% 155 10% 0 0% 0 0% 2.4OH 4% 12 10% 1051 69% 769 51% 72 4% 13.5PA 7% 21 15% 907 60% 795 52% 471 31% 86.5SC 0% 1 1% 21 1% 0 0% 0 0% 4.4TN 1% 7 6% 580 38% 9 0% 0 0% 7.4TX 0% 3 2% 19 1% 0 0% 0 0% 3.1VA 28% 43 33% 1497 99% 1445 95% 1356 89% 116.2WI 0% 3 2% 18 1% 0 0% 0 0% 3.2WV 4% 17 13% 858 56% 658 43% 168 11% 20.3West 0% 5 4% 60 3% 2 0% 0 0% 5Canada 1% 2 2% 82 5% 0 0% 0 0% 2.8

G-13
Downwind State : Massachusetts ; CAMX Source Apportionment Modeling Contributions to 1-Hr Designated + Modeled Receptors
Base Case: Total Number of Exceedences (grid-hours) = 476Upwind State: Average
percentcontribution(4-episode)
Highest dailyaverage (ppb)
Highest dailyaverage (%)
Number ofexceedencesreduced >= 2ppb
Percentexceedencesreduced >= 2ppb
Number ofexceedencesreduced >= 5ppb
Percentexceedencesreduced >= 5ppb
Number ofexceedencesreduced >=10 ppb
Percentexceedencesreduced >=10 ppb
Max 1hrcontribution(ppb)
AL 0% 1 1% 0 0% 0 0% 0 0% 1.4CT/RI 9% 15 11% 438 92% 367 77% 194 40% 61.4FL 0% 0 0% 0 0% 0 0% 0 0% 1.3GA 0% 1 0% 0 0% 0 0% 0 0% 0.9IA 0% 1 1% 10 2% 0 0% 0 0% 2.3IL 1% 3 3% 26 5% 2 0% 0 0% 5.9IN 1% 4 3% 51 10% 4 0% 0 0% 5.3KY 1% 6 4% 38 7% 27 5% 0 0% 6.7LA 0% 0 0% 0 0% 0 0% 0 0% 0.3MA 50% 81 61% 412 86% 408 85% 406 85% 118.6MD/DC/DE 2% 5 4% 338 71% 59 12% 0 0% 9.4ME 0% 0 0% 0 0% 0 0% 0 0% 0.3MI 1% 4 3% 129 27% 15 3% 0 0% 6.1MO 0% 2 1% 18 3% 0 0% 0 0% 3MS 0% 1 0% 0 0% 0 0% 0 0% 0.7NC 1% 3 2% 68 14% 6 1% 0 0% 7.1NH/VT 2% 9 6% 116 24% 78 16% 31 6% 43NJ 7% 25 19% 388 81% 259 54% 121 25% 42.1NY 10% 21 16% 464 97% 370 77% 239 50% 34OH 2% 7 5% 169 35% 77 16% 0 0% 8.2PA 6% 13 10% 408 85% 245 51% 135 28% 17.9SC 0% 1 1% 2 0% 0 0% 0 0% 4TN 0% 2 1% 10 2% 0 0% 0 0% 2.4TX 0% 0 0% 0 0% 0 0% 0 0% 0.4VA 2% 10 7% 225 47% 81 17% 27 5% 19.9WI 0% 2 2% 84 17% 0 0% 0 0% 2.9WV 1% 4 3% 145 30% 20 4% 0 0% 7.1West 0% 2 2% 43 9% 0 0% 0 0% 2.8Canada 2% 6 4% 248 52% 112 23% 3 0% 10.6

G-14
Downwind State : Michigan ; CAMX Source Apportionment Modeling Contributions to 1-Hr Designated + Modeled Receptors
Base Case: Total Number of Exceedences (grid-hours) = 159Upwind State: Average
percentcontribution(4-episode)
Highest dailyaverage (ppb)
Highest dailyaverage (%)
Number ofexceedencesreduced >= 2ppb
Percentexceedencesreduced >= 2ppb
Number ofexceedencesreduced >= 5ppb
Percentexceedencesreduced >= 5ppb
Number ofexceedencesreduced >=10 ppb
Percentexceedencesreduced >=10 ppb
Max 1hrcontribution(ppb)
AL 0% 0 0% 0 0% 0 0% 0 0% 0CT/RI 0% NA NA 0 0% 0 0% 0 0% 0FL 0% NA NA 0 0% 0 0% 0 0% 0GA 0% NA NA 0 0% 0 0% 0 0% 0IA 0% 1 0% 0 0% 0 0% 0 0% 1.3IL 54% 57 43% 159 100% 159 100% 159 100% 78.1IN 11% 16 12% 134 84% 92 57% 69 43% 32.7KY 0% 2 1% 7 4% 0 0% 0 0% 2.5LA 0% 0 0% 0 0% 0 0% 0 0% 0MA 0% NA NA 0 0% 0 0% 0 0% 0MD/DC/DE 0% NA NA 0 0% 0 0% 0 0% 0ME 0% NA NA 0 0% 0 0% 0 0% 0MI 1% 1 1% 21 13% 4 2% 0 0% 5.9MO 12% 12 9% 159 100% 159 100% 151 94% 16.4MS 0% 0 0% 0 0% 0 0% 0 0% 0.1NC 0% NA NA 0 0% 0 0% 0 0% 0NH/VT 0% NA NA 0 0% 0 0% 0 0% 0NJ 0% NA NA 0 0% 0 0% 0 0% 0NY 0% NA NA 0 0% 0 0% 0 0% 0OH 0% NA NA 0 0% 0 0% 0 0% 0PA 0% NA NA 0 0% 0 0% 0 0% 0SC 0% NA NA 0 0% 0 0% 0 0% 0TN 0% 0 0% 0 0% 0 0% 0 0% 0.7TX 3% 4 3% 107 67% 0 0% 0 0% 4.4VA 0% NA NA 0 0% 0 0% 0 0% 0WI 2% 5 4% 38 23% 21 13% 11 6% 18.3WV 0% NA NA 0 0% 0 0% 0 0% 0West 16% 18 14% 159 100% 159 100% 152 95% 20.4Canada 0% NA NA 0 0% 0 0% 0 0% 0

G-15
Downwind State : Missouri ; CAMX Source Apportionment Modeling Contributions to 1-Hr Designated + Modeled Receptors
Base Case: Total Number of Exceedences (grid-hours) = 6Upwind State: Average
percentcontribution(4-episode)
Highest dailyaverage (ppb)
Highest dailyaverage (%)
Number ofexceedencesreduced >= 2ppb
Percentexceedencesreduced >= 2ppb
Number ofexceedencesreduced >= 5ppb
Percentexceedencesreduced >= 5ppb
Number ofexceedencesreduced >=10 ppb
Percentexceedencesreduced >=10 ppb
Max 1hrcontribution(ppb)
AL 3% 6 4% 3 50% 3 50% 0 0% 5.8CT/RI 0% 0 0% 0 0% 0 0% 0 0% 0FL 0% 0 0% 0 0% 0 0% 0 0% 0GA 1% 3 2% 3 50% 0 0% 0 0% 3.1IA 0% 0 0% 0 0% 0 0% 0 0% 0IL 7% 9 7% 6 100% 4 66% 0 0% 8.9IN 3% 6 4% 3 50% 3 50% 0 0% 5.9KY 3% 5 4% 3 50% 2 33% 0 0% 5.1LA 0% 0 0% 0 0% 0 0% 0 0% 0MA 0% 0 0% 0 0% 0 0% 0 0% 0MD/DC/DE 0% 0 0% 0 0% 0 0% 0 0% 0.3ME 0% 0 0% 0 0% 0 0% 0 0% 0MI 1% 1 1% 0 0% 0 0% 0 0% 1.3MO 77% 81 64% 6 100% 6 100% 6 100% 82.6MS 0% 1 0% 0 0% 0 0% 0 0% 0.6NC 1% 2 1% 0 0% 0 0% 0 0% 1.8NH/VT 0% 0 0% 0 0% 0 0% 0 0% 0NJ 0% 0 0% 0 0% 0 0% 0 0% 0.2NY 0% 0 0% 0 0% 0 0% 0 0% 0.2OH 1% 3 2% 3 50% 0 0% 0 0% 2.7PA 0% 0 0% 0 0% 0 0% 0 0% 0.5SC 1% 2 2% 3 50% 0 0% 0 0% 2.2TN 2% 3 2% 3 50% 0 0% 0 0% 3.2TX 0% 0 0% 0 0% 0 0% 0 0% 0VA 0% 0 0% 0 0% 0 0% 0 0% 0.4WI 0% 0 0% 0 0% 0 0% 0 0% 0WV 0% 0 0% 0 0% 0 0% 0 0% 0.1West 0% 1 0% 0 0% 0 0% 0 0% 0.6Canada 0% 0 0% 0 0% 0 0% 0 0% 0.2

G-16
Downwind State : New Hampshire ; CAMX Source Apportionment Modeling Contributions to 1-Hr Designated + Modeled Receptors
Base Case: Total Number of Exceedences (grid-hours) = 74Upwind State: Average
percentcontribution(4-episode)
Highest dailyaverage (ppb)
Highest dailyaverage (%)
Number ofexceedencesreduced >= 2ppb
Percentexceedencesreduced >= 2ppb
Number ofexceedencesreduced >= 5ppb
Percentexceedencesreduced >= 5ppb
Number ofexceedencesreduced >=10 ppb
Percentexceedencesreduced >=10 ppb
Max 1hrcontribution(ppb)
AL 0% 0 0% 0 0% 0 0% 0 0% 0.1CT/RI 7% 9 6% 74 100% 64 86% 17 22% 17.2FL 0% 0 0% 0 0% 0 0% 0 0% 0.6GA 0% 0 0% 0 0% 0 0% 0 0% 0.2IA 0% 0 0% 0 0% 0 0% 0 0% 0.2IL 0% 1 0% 0 0% 0 0% 0 0% 1IN 0% 1 1% 0 0% 0 0% 0 0% 1.9KY 0% 1 0% 0 0% 0 0% 0 0% 0.8LA 0% 0 0% 0 0% 0 0% 0 0% 0MA 53% 73 54% 74 100% 74 100% 74 100% 86.2MD/DC/DE 2% 4 3% 59 79% 2 2% 0 0% 5.4ME 1% 2 1% 17 22% 4 5% 0 0% 8.9MI 1% 3 2% 4 5% 0 0% 0 0% 3.5MO 0% 0 0% 0 0% 0 0% 0 0% 0.1MS 0% 0 0% 0 0% 0 0% 0 0% 0NC 1% 2 2% 10 13% 0 0% 0 0% 3.9NH/VT 12% 50 39% 63 85% 48 64% 32 43% 79.4NJ 4% 8 6% 62 83% 41 55% 0 0% 8.9NY 8% 14 11% 72 97% 49 66% 43 58% 17.2OH 1% 4 3% 21 28% 0 0% 0 0% 4.7PA 4% 10 8% 74 100% 25 33% 3 4% 10.7SC 0% 0 0% 0 0% 0 0% 0 0% 1.4TN 0% 0 0% 0 0% 0 0% 0 0% 0.1TX 0% 0 0% 0 0% 0 0% 0 0% 0VA 2% 4 3% 17 22% 6 8% 0 0% 8.9WI 0% 0 0% 0 0% 0 0% 0 0% 0.2WV 1% 2 2% 17 22% 0 0% 0 0% 2.9West 0% 0 0% 0 0% 0 0% 0 0% 0.3Canada 3% 5 4% 52 70% 28 37% 0 0% 6.2

G-17
Downwind State : New Jersey ; CAMX Source Apportionment Modeling Contributions to 1-Hr Designated + Modeled Receptors
Base Case: Total Number of Exceedences (grid-hours) = 862Upwind State: Average
percentcontribution(4-episode)
Highest dailyaverage (ppb)
Highest dailyaverage (%)
Number ofexceedencesreduced >= 2ppb
Percentexceedencesreduced >= 2ppb
Number ofexceedencesreduced >= 5ppb
Percentexceedencesreduced >= 5ppb
Number ofexceedencesreduced >=10 ppb
Percentexceedencesreduced >=10 ppb
Max 1hrcontribution(ppb)
AL 1% 1 1% 0 0% 0 0% 0 0% 1.6CT/RI 0% 0 0% 0 0% 0 0% 0 0% 0FL 0% 3 2% 24 2% 0 0% 0 0% 3.7GA 1% 1 1% 2 0% 0 0% 0 0% 2.8IA 0% 2 1% 0 0% 0 0% 0 0% 1.7IL 3% 6 5% 560 64% 288 33% 0 0% 7.5IN 2% 3 3% 344 39% 34 3% 0 0% 6.4KY 1% 8 6% 145 16% 20 2% 0 0% 9.7LA 0% 1 1% 0 0% 0 0% 0 0% 1.6MA 0% 0 0% 0 0% 0 0% 0 0% 0MD/DC/DE 17% 26 19% 773 89% 647 75% 480 55% 82.3ME 0% 0 0% 0 0% 0 0% 0 0% 0MI 2% 6 5% 472 54% 6 0% 0 0% 7.6MO 1% 3 2% 22 2% 0 0% 0 0% 2.8MS 0% 1 0% 0 0% 0 0% 0 0% 0.7NC 1% 8 6% 86 9% 28 3% 3 0% 11.1NH/VT 0% 0 0% 0 0% 0 0% 0 0% 0NJ 30% 59 44% 806 93% 770 89% 746 86% 80.1NY 1% 5 4% 153 17% 51 5% 12 1% 16.9OH 4% 9 7% 622 72% 471 54% 44 5% 13.1PA 25% 38 29% 810 93% 739 85% 705 81% 71SC 0% 2 2% 17 1% 0 0% 0 0% 2.3TN 1% 3 2% 237 27% 0 0% 0 0% 4.6TX 0% 0 0% 0 0% 0 0% 0 0% 0.4VA 4% 14 11% 559 64% 334 38% 132 15% 25.1WI 0% 2 2% 47 5% 0 0% 0 0% 3.2WV 4% 12 10% 574 66% 463 53% 105 12% 14.6West 0% 4 3% 2 0% 0 0% 0 0% 4.4Canada 1% 6 4% 145 16% 82 9% 0 0% 8

G-18
Downwind State : New York ; CAMX Source Apportionment Modeling Contributions to 1-Hr Designated + Modeled Receptors
Base Case: Total Number of Exceedences (grid-hours) = 1224Upwind State: Average
percentcontribution(4-episode)
Highest dailyaverage (ppb)
Highest dailyaverage (%)
Number ofexceedencesreduced >= 2ppb
Percentexceedencesreduced >= 2ppb
Number ofexceedencesreduced >= 5ppb
Percentexceedencesreduced >= 5ppb
Number ofexceedencesreduced >=10 ppb
Percentexceedencesreduced >=10 ppb
Max 1hrcontribution(ppb)
AL 0% 1 1% 0 0% 0 0% 0 0% 1.6CT/RI 0% 2 1% 86 7% 36 2% 13 1% 15.8FL 0% 2 2% 31 2% 0 0% 0 0% 3.8GA 0% 1 1% 0 0% 0 0% 0 0% 1.8IA 0% 1 1% 0 0% 0 0% 0 0% 1.9IL 2% 6 5% 408 33% 216 17% 0 0% 8.8IN 2% 4 3% 478 39% 65 5% 0 0% 6.1KY 2% 7 5% 263 21% 207 16% 0 0% 8.8LA 0% 0 0% 0 0% 0 0% 0 0% 1.2MA 0% 0 0% 0 0% 0 0% 0 0% 0MD/DC/DE 3% 12 9% 752 61% 366 29% 82 6% 28.3ME 0% 0 0% 0 0% 0 0% 0 0% 0MI 1% 5 4% 432 35% 17 1% 0 0% 6.5MO 1% 3 2% 93 7% 0 0% 0 0% 3.4MS 0% 0 0% 0 0% 0 0% 0 0% 0.5NC 1% 6 4% 329 26% 49 4% 1 0% 10NH/VT 0% 0 0% 0 0% 0 0% 0 0% 0NJ 38% 56 43% 1224 100% 1224 100% 1224 100% 82NY 18% 42 33% 1051 85% 962 78% 851 69% 67.7OH 5% 9 7% 893 72% 689 56% 114 9% 14.6PA 17% 25 19% 1224 100% 1224 100% 1178 96% 49.1SC 0% 2 2% 34 2% 0 0% 0 0% 2.7TN 1% 2 2% 167 13% 0 0% 0 0% 4.6TX 0% 2 2% 1 0% 0 0% 0 0% 2.1VA 3% 10 8% 638 52% 420 34% 119 9% 19.4WI 0% 2 1% 74 6% 0 0% 0 0% 3.2WV 3% 10 8% 674 55% 340 27% 96 7% 14.6West 0% 4 3% 16 1% 0 0% 0 0% 4.7Canada 1% 6 4% 221 18% 165 13% 0 0% 8.8

G-19
Downwind State : Ohio ; CAMX Source Apportionment Modeling Contributions to 1-Hr Designated + Modeled Receptors
Base Case: Total Number of Exceedences (grid-hours) = 30Upwind State: Average
percentcontribution(4-episode)
Highest dailyaverage (ppb)
Highest dailyaverage (%)
Number ofexceedencesreduced >= 2ppb
Percentexceedencesreduced >= 2ppb
Number ofexceedencesreduced >= 5ppb
Percentexceedencesreduced >= 5ppb
Number ofexceedencesreduced >=10 ppb
Percentexceedencesreduced >=10 ppb
Max 1hrcontribution(ppb)
AL 7% 20 16% 12 40% 12 40% 12 40% 20.9CT/RI 0% 0 0% 0 0% 0 0% 0 0% 0FL 1% 2 2% 5 16% 0 0% 0 0% 2.6GA 1% 4 3% 12 40% 0 0% 0 0% 3.7IA 0% 0 0% 0 0% 0 0% 0 0% 0.3IL 0% 4 3% 2 6% 0 0% 0 0% 3.9IN 11% 22 17% 30 100% 28 93% 18 60% 22.7KY 22% 27 21% 30 100% 30 100% 30 100% 30.5LA 2% 6 5% 12 40% 9 30% 0 0% 7.7MA 0% 0 0% 0 0% 0 0% 0 0% 0MD/DC/DE 0% 0 0% 0 0% 0 0% 0 0% 0.3ME 0% NA NA 0 0% 0 0% 0 0% 0MI 0% 0 0% 0 0% 0 0% 0 0% 0.2MO 0% 2 1% 0 0% 0 0% 0 0% 1.6MS 2% 7 5% 12 40% 12 40% 0 0% 8.1NC 2% 5 4% 16 53% 5 16% 0 0% 5.6NH/VT 0% NA NA 0 0% 0 0% 0 0% 0NJ 0% 0 0% 0 0% 0 0% 0 0% 0NY 0% 0 0% 0 0% 0 0% 0 0% 0.3OH 39% 67 52% 30 100% 30 100% 30 100% 68.6PA 1% 1 1% 0 0% 0 0% 0 0% 1.3SC 1% 3 2% 3 10% 0 0% 0 0% 2.5TN 6% 21 16% 30 100% 14 46% 5 16% 20.8TX 0% 1 0% 0 0% 0 0% 0 0% 0.6VA 2% 4 3% 16 53% 0 0% 0 0% 4.7WI 0% 0 0% 0 0% 0 0% 0 0% 0WV 1% 4 3% 4 13% 0 0% 0 0% 4.5West 0% 1 1% 0 0% 0 0% 0 0% 1.3Canada 0% 1 1% 0 0% 0 0% 0 0% 1

G-20
Downwind State : Pennsylvania ; CAMX Source Apportionment Modeling Contributions to 1-Hr Designated + Modeled Receptors
Base Case: Total Number of Exceedences (grid-hours) = 157Upwind State: Average
percentcontribution(4-episode)
Highest dailyaverage (ppb)
Highest dailyaverage (%)
Number ofexceedencesreduced >= 2ppb
Percentexceedencesreduced >= 2ppb
Number ofexceedencesreduced >= 5ppb
Percentexceedencesreduced >= 5ppb
Number ofexceedencesreduced >=10 ppb
Percentexceedencesreduced >=10 ppb
Max 1hrcontribution(ppb)
AL 0% 1 1% 0 0% 0 0% 0 0% 1.2CT/RI 0% 0 0% 0 0% 0 0% 0 0% 0FL 0% 0 0% 0 0% 0 0% 0 0% 0.1GA 0% 1 1% 0 0% 0 0% 0 0% 1.3IA 0% 0 0% 0 0% 0 0% 0 0% 0.5IL 1% 6 5% 32 20% 32 20% 0 0% 7.2IN 1% 4 3% 33 21% 14 8% 0 0% 6.7KY 0% 4 3% 16 10% 0 0% 0 0% 4.3LA 0% 0 0% 0 0% 0 0% 0 0% 0MA 0% 0 0% 0 0% 0 0% 0 0% 0MD/DC/DE 12% 54 42% 121 77% 99 63% 92 58% 57.7ME 0% 0 0% 0 0% 0 0% 0 0% 0MI 1% 3 3% 14 8% 0 0% 0 0% 3.6MO 0% 2 1% 0 0% 0 0% 0 0% 1.9MS 0% 0 0% 0 0% 0 0% 0 0% 0.2NC 2% 5 4% 101 64% 11 7% 0 0% 5.3NH/VT 0% 0 0% 0 0% 0 0% 0 0% 0NJ 12% 21 17% 108 68% 102 64% 83 52% 38.9NY 1% 3 3% 10 6% 0 0% 0 0% 3.5OH 5% 18 14% 64 40% 64 40% 31 19% 25.4PA 48% 58 44% 151 96% 150 95% 150 95% 98.2SC 0% 1 1% 0 0% 0 0% 0 0% 1.4TN 1% 3 2% 27 17% 0 0% 0 0% 3.3TX 0% 0 0% 0 0% 0 0% 0 0% 0.1VA 8% 25 19% 125 79% 99 63% 82 52% 28.8WI 0% 0 0% 0 0% 0 0% 0 0% 0.6WV 6% 27 21% 79 50% 51 32% 25 15% 36West 0% 2 1% 0 0% 0 0% 0 0% 1.7Canada 1% 5 4% 3 1% 2 1% 0 0% 5.5

G-21
Downwind State : Rhode Island ; CAMX Source Apportionment Modeling Contributions to 1-Hr Designated + Modeled Receptors
Base Case: Total Number of Exceedences (grid-hours) = 48Upwind State: Average
percentcontribution(4-episode)
Highest dailyaverage (ppb)
Highest dailyaverage (%)
Number ofexceedencesreduced >= 2ppb
Percentexceedencesreduced >= 2ppb
Number ofexceedencesreduced >= 5ppb
Percentexceedencesreduced >= 5ppb
Number ofexceedencesreduced >=10 ppb
Percentexceedencesreduced >=10 ppb
Max 1hrcontribution(ppb)
AL 0% 1 1% 0 0% 0 0% 0 0% 1.2CT/RI 5% 7 6% 35 72% 25 52% 10 20% 14.3FL 0% 0 0% 0 0% 0 0% 0 0% 0.6GA 0% 1 1% 0 0% 0 0% 0 0% 1IA 0% 1 1% 0 0% 0 0% 0 0% 0.9IL 1% 5 4% 3 6% 3 6% 0 0% 5.6IN 2% 4 3% 13 27% 0 0% 0 0% 4.7KY 2% 6 5% 11 22% 11 22% 0 0% 6.8LA 0% 0 0% 0 0% 0 0% 0 0% 0.1MA 0% 0 0% 0 0% 0 0% 0 0% 0.2MD/DC/DE 3% 7 5% 36 75% 6 12% 0 0% 7.4ME 0% 0 0% 0 0% 0 0% 0 0% 0MI 1% 5 4% 3 6% 0 0% 0 0% 4.8MO 0% 2 2% 2 4% 0 0% 0 0% 2MS 0% 0 0% 0 0% 0 0% 0 0% 0.3NC 2% 2 2% 21 43% 0 0% 0 0% 4.4NH/VT 0% 0 0% 0 0% 0 0% 0 0% 0NJ 30% 38 29% 48 100% 48 100% 48 100% 47.7NY 24% 37 26% 48 100% 48 100% 48 100% 44.7OH 6% 8 6% 48 100% 39 81% 1 2% 10.3PA 12% 20 16% 48 100% 48 100% 48 100% 22.4SC 0% 1 0% 0 0% 0 0% 0 0% 0.6TN 0% 2 1% 4 8% 0 0% 0 0% 2.5TX 0% 0 0% 0 0% 0 0% 0 0% 0.1VA 7% 13 10% 34 70% 33 68% 20 41% 18.1WI 0% 1 1% 0 0% 0 0% 0 0% 1.2WV 4% 6 4% 44 91% 19 39% 0 0% 8.1West 0% 1 0% 0 0% 0 0% 0 0% 0.7Canada 0% 1 1% 0 0% 0 0% 0 0% 1

G-22
Downwind State : Tennessee ; CAMX Source Apportionment Modeling Contributions to 1-Hr Designated + Modeled Receptors
Base Case: Total Number of Exceedences (grid-hours) = 61Upwind State: Average
percentcontribution(4-episode)
Highest dailyaverage (ppb)
Highest dailyaverage (%)
Number ofexceedencesreduced >= 2ppb
Percentexceedencesreduced >= 2ppb
Number ofexceedencesreduced >= 5ppb
Percentexceedencesreduced >= 5ppb
Number ofexceedencesreduced >=10 ppb
Percentexceedencesreduced >=10 ppb
Max 1hrcontribution(ppb)
AL 6% 18 13% 32 52% 20 32% 19 31% 19.5CT/RI 0% NA NA 0 0% 0 0% 0 0% 0FL 1% 5 4% 3 4% 0 0% 0 0% 4.8GA 5% 17 13% 22 36% 19 31% 19 31% 18.3IA 0% 0 0% 0 0% 0 0% 0 0% 0.5IL 0% 5 4% 2 3% 2 3% 0 0% 5.3IN 0% 1 0% 0 0% 0 0% 0 0% 0.7KY 0% 3 3% 2 3% 0 0% 0 0% 3.4LA 4% 7 5% 37 60% 36 59% 0 0% 8.2MA 0% NA NA 0 0% 0 0% 0 0% 0MD/DC/DE 0% 0 0% 0 0% 0 0% 0 0% 0ME 0% NA NA 0 0% 0 0% 0 0% 0MI 0% 0 0% 0 0% 0 0% 0 0% 0.1MO 0% 2 1% 0 0% 0 0% 0 0% 1.7MS 5% 10 8% 56 91% 37 60% 6 9% 12.8NC 1% 4 3% 3 4% 0 0% 0 0% 4.2NH/VT 0% NA NA 0 0% 0 0% 0 0% 0NJ 0% NA NA 0 0% 0 0% 0 0% 0NY 0% 0 0% 0 0% 0 0% 0 0% 0OH 0% 1 0% 0 0% 0 0% 0 0% 0.6PA 0% 0 0% 0 0% 0 0% 0 0% 0.3SC 2% 6 4% 22 36% 19 31% 0 0% 6.7TN 47% 62 48% 61 100% 61 100% 61 100% 69.3TX 4% 10 8% 37 60% 34 55% 11 18% 11.2VA 0% 1 1% 0 0% 0 0% 0 0% 0.7WI 0% 0 0% 0 0% 0 0% 0 0% 0.2WV 0% 1 0% 0 0% 0 0% 0 0% 0.6West 25% 36 29% 61 100% 61 100% 53 86% 43.4Canada 0% 0 0% 0 0% 0 0% 0 0% 0.1

G-23
Downwind State : Texas ; CAMX Source Apportionment Modeling Contributions to 1-Hr Designated + Modeled Receptors
Base Case: Total Number of Exceedences (grid-hours) = 431Upwind State: Average
percentcontribution(4-episode)
Highest dailyaverage (ppb)
Highest dailyaverage (%)
Number ofexceedencesreduced >= 2ppb
Percentexceedencesreduced >= 2ppb
Number ofexceedencesreduced >= 5ppb
Percentexceedencesreduced >= 5ppb
Number ofexceedencesreduced >=10 ppb
Percentexceedencesreduced >=10 ppb
Max 1hrcontribution(ppb)
AL 0% 1 0% 0 0% 0 0% 0 0% 0.7CT/RI 0% NA NA 0 0% 0 0% 0 0% 0FL 0% 3 2% 19 4% 0 0% 0 0% 2.8GA 0% 0 0% 0 0% 0 0% 0 0% 0.3IA 0% 0 0% 0 0% 0 0% 0 0% 0.2IL 0% 0 0% 0 0% 0 0% 0 0% 0.6IN 0% 0 0% 0 0% 0 0% 0 0% 0.1KY 0% 0 0% 0 0% 0 0% 0 0% 0.1LA 4% 8 7% 355 82% 182 42% 27 6% 12.1MA 0% NA NA 0 0% 0 0% 0 0% 0MD/DC/DE 0% NA NA 0 0% 0 0% 0 0% 0ME 0% NA NA 0 0% 0 0% 0 0% 0MI 0% 0 0% 0 0% 0 0% 0 0% 0MO 0% 0 0% 0 0% 0 0% 0 0% 1MS 0% 1 1% 0 0% 0 0% 0 0% 1.1NC 0% 0 0% 0 0% 0 0% 0 0% 0.1NH/VT 0% NA NA 0 0% 0 0% 0 0% 0NJ 0% NA NA 0 0% 0 0% 0 0% 0NY 0% NA NA 0 0% 0 0% 0 0% 0OH 0% 0 0% 0 0% 0 0% 0 0% 0PA 0% 0 0% 0 0% 0 0% 0 0% 0SC 0% 0 0% 0 0% 0 0% 0 0% 0.1TN 0% 0 0% 0 0% 0 0% 0 0% 0.4TX 93% 113 84% 431 100% 431 100% 431 100% 152.2VA 0% 0 0% 0 0% 0 0% 0 0% 0WI 0% 0 0% 0 0% 0 0% 0 0% 0.1WV 0% 0 0% 0 0% 0 0% 0 0% 0West 2% 4 3% 270 62% 71 16% 0 0% 6.9Canada 0% NA NA 0 0% 0 0% 0 0% 0

G-24
Downwind State : Virginia ; CAMX Source Apportionment Modeling Contributions to 1-Hr Designated + Modeled Receptors
Base Case: Total Number of Exceedences (grid-hours) = 417Upwind State: Average
percentcontribution(4-episode)
Highest dailyaverage (ppb)
Highest dailyaverage (%)
Number ofexceedencesreduced >= 2ppb
Percentexceedencesreduced >= 2ppb
Number ofexceedencesreduced >= 5ppb
Percentexceedencesreduced >= 5ppb
Number ofexceedencesreduced >=10 ppb
Percentexceedencesreduced >=10 ppb
Max 1hrcontribution(ppb)
AL 0% 1 1% 0 0% 0 0% 0 0% 1.3CT/RI 0% 0 0% 0 0% 0 0% 0 0% 0.1FL 0% 0 0% 0 0% 0 0% 0 0% 0.1GA 0% 1 1% 0 0% 0 0% 0 0% 1.5IA 0% 0 0% 0 0% 0 0% 0 0% 0.5IL 1% 3 3% 92 22% 7 1% 0 0% 5.5IN 1% 7 5% 56 13% 35 8% 0 0% 9.1KY 1% 8 6% 39 9% 31 7% 14 3% 11.7LA 0% 0 0% 0 0% 0 0% 0 0% 0MA 0% 0 0% 0 0% 0 0% 0 0% 0.1MD/DC/DE 28% 48 31% 415 99% 411 98% 393 94% 76.5ME 0% 0 0% 0 0% 0 0% 0 0% 0MI 1% 4 3% 122 29% 14 3% 0 0% 5.4MO 0% 4 3% 17 4% 0 0% 0 0% 4MS 0% 0 0% 0 0% 0 0% 0 0% 0.2NC 2% 6 5% 175 41% 22 5% 6 1% 12.7NH/VT 0% 0 0% 0 0% 0 0% 0 0% 0NJ 0% 1 1% 0 0% 0 0% 0 0% 1.3NY 1% 2 2% 6 1% 0 0% 0 0% 2.1OH 2% 9 6% 110 26% 70 16% 3 0% 10.5PA 9% 16 11% 378 90% 376 90% 202 48% 37.7SC 0% 1 1% 0 0% 0 0% 0 0% 1.2TN 0% 3 2% 34 8% 0 0% 0 0% 4.2TX 0% 1 0% 0 0% 0 0% 0 0% 0.7VA 50% 77 53% 417 100% 417 100% 414 99% 123.3WI 0% 1 1% 0 0% 0 0% 0 0% 1.4WV 2% 8 6% 194 46% 76 18% 4 0% 10.8West 0% 5 4% 17 4% 0 0% 0 0% 4.9Canada 1% 2 1% 78 18% 0 0% 0 0% 3.1

APPENDIX HEVALUATION OF CONTRIBUTIONS -- TABLES OF METRICS
1-HOUR UAM-V: UPWIND STATES TO DOWNWIND NONATTAINMENT AREAS

H-1
The tables in this Appendix contain information on the UAM-V metrics used for theevaluation of contributions. Tables are provided only for those nonattainment areaswith predicted exceedences in the Base Case. The headings in the table relate to themetrics as follows:
Percent total ppb reduced >= 125 ppb Metric 3Percent pop-wgt total ppb reduced >= 125 ppb Metric 4Number of exceedences reduced >= 2 ppb Metrics 1 & 2Percent exceedences reduced >= 2 ppb Metrics 1 & 2Number of exceedences reduced >= 5 ppb Metrics 1 & 2Percent exceedences reduced >= 5 ppb Metrics 1 & 2Number of exceedences reduced >= 10 ppb Metrics 1 & 2Percent exceedences reduced >= 10 ppb Metrics 1 & 2max 1-hr contribution, ppb Metric 2
(Note: Some of the maximum contribution values may appear to be inconsistent with thenumber of exceedences above a certain cut-point. For example, a contribution of9.999........ is interpreted as being less that 10 ppb for the purpose of counting thenumber of exceedence reduced; however, this value is rounded to 10 ppb in thepresentation of maximum "ppb" contribution in these tables.)

H-2
Downwind Nonattainment Area: Atlanta UAM-V State Zero Out ModelingContributions to 1-Hr Designated + Modeled Receptors
Base case: Total Number of Exceedences (grids-days) = 218Upwind State
Percent totalppb reduced>= 125 ppb
Percentpop-wgt totalppb
Number ofexceedencesreduced >= 2ppb
Percentexceedencesreduced >= 2ppb
Number ofexceedencesreduced >= 5ppb
Percentexceedencesreduced >= 5ppb
Number ofexceedencesreduced >=10 ppb
Percentexceedencesreduced >=10 ppb
max 1-hrcontributionppb
AL 14% 10% 97 44% 66 30% 27 12% 29.4 GA 100% 100% 218 100% 218 100% 218 100% 191.2 IL 0% 0% 3 1% 0 0% 0 0% 2.3 IN 0% 0% 0 0% 0 0% 0 0% 1 KY 2% 2% 16 7% 7 3% 3 1% 11.4 MA 0% 0% 0 0% 0 0% 0 0% 0 MI 0% 0% 0 0% 0 0% 0 0% 0 MO 0% 0% 0 0% 0 0% 0 0% 1.7 NC 1% 1% 11 5% 0 0% 0 0% 4.1 OH 0% 0% 0 0% 0 0% 0 0% 0.6 SC 4% 3% 32 15% 13 6% 10 5% 16 TN 8% 6% 77 35% 23 11% 1 0% 11.4 VA 0% 0% 0 0% 0 0% 0 0% 0.6 WI 0% 0% 0 0% 0 0% 0 0% 0.1 WV 0% 0% 0 0% 0 0% 0 0% 1.2

H-3
Downwind Nonattainment Area: Baltimore UAM-V State Zero Out ModelingContributions to 1-Hr Designated + Modeled Receptors
Base case: Total Number of Exceedences (grids-days) = 175Upwind State
Percent totalppb reduced>= 125 ppb
Percentpop-wgt totalppb
Number ofexceedencesreduced >= 2ppb
Percentexceedencesreduced >= 2ppb
Number ofexceedencesreduced >= 5ppb
Percentexceedencesreduced >= 5ppb
Number ofexceedencesreduced >=10 ppb
Percentexceedencesreduced >=10 ppb
max 1-hrcontributionppb
AL 0% 0% 1 1% 0 0% 0 0% 2.6 GA 1% 0% 0 0% 0 0% 0 0% 0.9 IL 3% 2% 5 3% 0 0% 0 0% 2.2 IN 4% 3% 17 10% 0 0% 0 0% 4.1 KY 3% 3% 12 7% 0 0% 0 0% 3.5 MA 0% 0% 0 0% 0 0% 0 0% 0 MI 5% 2% 24 14% 4 2% 0 0% 5.3 MO 1% 0% 0 0% 0 0% 0 0% 0.9 NC 2% 2% 0 0% 0 0% 0 0% 1.4 OH 11% 8% 85 49% 6 3% 0 0% 6.8 SC 0% 0% 0 0% 0 0% 0 0% 0.4 TN 2% 1% 1 1% 0 0% 0 0% 2.4 VA 66% 64% 160 91% 137 78% 112 64% 65.6 WI 1% 1% 0 0% 0 0% 0 0% 1.5 WV 15% 13% 84 48% 41 23% 11 6% 15.7

H-4
Downwind Nonattainment Area: Baton Rouge UAM-V State Zero Out ModelingContributions to 1-Hr Designated + Modeled Receptors
Base case: Total Number of Exceedences (grids-days) = 11Upwind State
Percent totalppb reduced>= 125 ppb
Percentpop-wgt totalppb
Number ofexceedencesreduced >= 2ppb
Percentexceedencesreduced >= 2ppb
Number ofexceedencesreduced >= 5ppb
Percentexceedencesreduced >= 5ppb
Number ofexceedencesreduced >=10 ppb
Percentexceedencesreduced >=10 ppb
max 1-hrcontributionppb
AL 10% 0% 0 0% 0 0% 0 0% 1.9 GA 0% 0% 0 0% 0 0% 0 0% 0.1 IL 3% 0% 0 0% 0 0% 0 0% 0.7 IN 0% 0% 0 0% 0 0% 0 0% 0.2 KY 2% 0% 0 0% 0 0% 0 0% 0.4 MA 0% 0% 0 0% 0 0% 0 0% 0 MI 0% 0% 0 0% 0 0% 0 0% 0 MO 9% 0% 0 0% 0 0% 0 0% 1.1 NC 0% 0% 0 0% 0 0% 0 0% 0 OH 0% 0% 0 0% 0 0% 0 0% 0 SC 0% 0% 0 0% 0 0% 0 0% 0 TN 12% 0% 1 9% 0 0% 0 0% 2.5 VA 0% 0% 0 0% 0 0% 0 0% 0 WI 0% 0% 0 0% 0 0% 0 0% 0 WV 0% 0% 0 0% 0 0% 0 0% 0

H-5
Downwind Nonattainment Area: Birmingham UAM-V State Zero Out ModelingContributions to 1-Hr Designated + Modeled Receptors
Base case: Total Number of Exceedences (grids-days) = 88Upwind State
Percent totalppb reduced>= 125 ppb
Percentpop-wgt totalppb
Number ofexceedencesreduced >= 2ppb
Percentexceedencesreduced >= 2ppb
Number ofexceedencesreduced >= 5ppb
Percentexceedencesreduced >= 5ppb
Number ofexceedencesreduced >=10 ppb
Percentexceedencesreduced >=10 ppb
max 1-hrcontributionppb
AL 100% 100% 88 100% 88 100% 88 100% 140.8 GA 12% 14% 25 28% 16 18% 10 11% 17 IL 0% 0% 0 0% 0 0% 0 0% 0.4 IN 1% 1% 0 0% 0 0% 0 0% 1.2 KY 2% 2% 4 5% 0 0% 0 0% 3 MA 0% 0% 0 0% 0 0% 0 0% 0 MI 0% 0% 0 0% 0 0% 0 0% 0 MO 0% 0% 0 0% 0 0% 0 0% 0.5 NC 1% 1% 0 0% 0 0% 0 0% 0.7 OH 0% 0% 0 0% 0 0% 0 0% 0.2 SC 2% 2% 3 3% 2 2% 2 2% 10.5 TN 14% 11% 33 38% 18 20% 5 6% 13.6 VA 0% 0% 0 0% 0 0% 0 0% 0.2 WI 0% 0% 0 0% 0 0% 0 0% 0.1 WV 0% 0% 0 0% 0 0% 0 0% 0.3

H-6
Downwind Nonattainment Area: Boston UAM-V State Zero Out ModelingContributions to 1-Hr Designated + Modeled Receptors
Base case: Total Number of Exceedences (grids-days) = 113Upwind State
Percent totalppb reduced>= 125 ppb
Percentpop-wgt totalppb
Number ofexceedencesreduced >= 2ppb
Percentexceedencesreduced >= 2ppb
Number ofexceedencesreduced >= 5ppb
Percentexceedencesreduced >= 5ppb
Number ofexceedencesreduced >=10 ppb
Percentexceedencesreduced >=10 ppb
max 1-hrcontributionppb
AL 0% 0% 0 0% 0 0% 0 0% 0.2 GA 0% 0% 0 0% 0 0% 0 0% 0.1 IL 1% 0% 0 0% 0 0% 0 0% 0.7 IN 2% 1% 0 0% 0 0% 0 0% 1.7 KY 1% 0% 0 0% 0 0% 0 0% 1.7 MA 89% 98% 94 83% 93 82% 91 81% 113 MI 2% 2% 1 1% 0 0% 0 0% 2.4 MO 0% 0% 0 0% 0 0% 0 0% 0.4 NC 1% 1% 0 0% 0 0% 0 0% 1.8 OH 5% 2% 13 12% 0 0% 0 0% 2.8 SC 0% 0% 0 0% 0 0% 0 0% 0.2 TN 0% 0% 0 0% 0 0% 0 0% 0.4 VA 5% 3% 11 10% 4 4% 0 0% 7.4 WI 1% 1% 0 0% 0 0% 0 0% 1 WV 4% 1% 4 4% 0 0% 0 0% 3.9

H-7
Downwind Nonattainment Area: Chicago-Milwaukee UAM-V State Zero Out ModelingContributions to 1-Hr Designated + Modeled Receptors
Base case: Total Number of Exceedences (grids-days) = 8Upwind State
Percent totalppb reduced>= 125 ppb
Percentpop-wgt totalppb
Number ofexceedencesreduced >= 2ppb
Percentexceedencesreduced >= 2ppb
Number ofexceedencesreduced >= 5ppb
Percentexceedencesreduced >= 5ppb
Number ofexceedencesreduced >=10 ppb
Percentexceedencesreduced >=10 ppb
max 1-hrcontributionppb
AL 1% 0% 0 0% 0 0% 0 0% 0.1 GA 0% 0% 0 0% 0 0% 0 0% 0 IL 100% 100% 8 100% 8 100% 8 100% 100.6 IN 7% 1% 2 25% 1 13% 1 13% 27.8 KY 0% 0% 0 0% 0 0% 0 0% 0 MA 0% 0% 0 0% 0 0% 0 0% 0 MI 0% 0% 0 0% 0 0% 0 0% 0 MO 15% 11% 7 88% 0 0% 0 0% 4.3 NC 0% 0% 0 0% 0 0% 0 0% 0 OH 0% 0% 0 0% 0 0% 0 0% 0 SC 0% 0% 0 0% 0 0% 0 0% 0 TN 1% 0% 0 0% 0 0% 0 0% 0.2 VA 0% 0% 0 0% 0 0% 0 0% 0 WI 0% 0% 0 0% 0 0% 0 0% 0.1 WV 0% 0% 0 0% 0 0% 0 0% 0

H-8
Downwind Nonattainment Area: Cincinnati UAM-V State Zero Out ModelingContributions to 1-Hr Designated + Modeled Receptors
Base case: Total Number of Exceedences (grids-days) = 12Upwind State
Percent totalppb reduced>= 125 ppb
Percentpop-wgt totalppb
Number ofexceedencesreduced >= 2ppb
Percentexceedencesreduced >= 2ppb
Number ofexceedencesreduced >= 5ppb
Percentexceedencesreduced >= 5ppb
Number ofexceedencesreduced >=10 ppb
Percentexceedencesreduced >=10 ppb
max 1-hrcontributionppb
AL 0% 0% 0 0% 0 0% 0 0% 0.1 GA 1% 1% 0 0% 0 0% 0 0% 0.2 IL 1% 0% 0 0% 0 0% 0 0% 0.5 IN 6% -4% 6 50% 2 17% 0 0% 9.8 KY 87% 91% 12 100% 12 100% 11 92% 57.3 MA 0% 0% 0 0% 0 0% 0 0% 0 MI 1% 0% 0 0% 0 0% 0 0% 0.1 MO 0% 0% 0 0% 0 0% 0 0% 0.4 NC 17% 29% 8 67% 0 0% 0 0% 3.8 OH 83% 83% 9 75% 9 75% 9 75% 53.1 SC 3% 7% 0 0% 0 0% 0 0% 1.6 TN 20% 33% 9 75% 2 17% 0 0% 9.1 VA 17% 28% 6 50% 0 0% 0 0% 5 WI 0% 0% 0 0% 0 0% 0 0% 0 WV 4% 9% 0 0% 0 0% 0 0% 1.6

H-9
Downwind Nonattainment Area: Dallas UAM-V State Zero Out ModelingContributions to 1-Hr Designated + Modeled Receptors
Base case: Total Number of Exceedences (grids-days) = 6Upwind State
Percent totalppb reduced>= 125 ppb
Percentpop-wgt totalppb
Number ofexceedencesreduced >= 2ppb
Percentexceedencesreduced >= 2ppb
Number ofexceedencesreduced >= 5ppb
Percentexceedencesreduced >= 5ppb
Number ofexceedencesreduced >=10 ppb
Percentexceedencesreduced >=10 ppb
max 1-hrcontributionppb
AL 0% 0% 0 0% 0 0% 0 0% 0 GA 0% 0% 0 0% 0 0% 0 0% 0 IL 0% 0% 0 0% 0 0% 0 0% 0 IN 0% 0% 0 0% 0 0% 0 0% 0 KY 0% 0% 0 0% 0 0% 0 0% 0 MA 0% 0% 0 0% 0 0% 0 0% 0 MI 0% 0% 0 0% 0 0% 0 0% 0 MO 0% 0% 0 0% 0 0% 0 0% 0.2 NC 0% 0% 0 0% 0 0% 0 0% 0 OH 0% 0% 0 0% 0 0% 0 0% 0 SC 0% 0% 0 0% 0 0% 0 0% 0 TN 0% 0% 0 0% 0 0% 0 0% 0 VA 0% 0% 0 0% 0 0% 0 0% 0 WI 0% 0% 0 0% 0 0% 0 0% 0 WV 0% 0% 0 0% 0 0% 0 0% 0

H-10
Downwind Nonattainment Area: Greater Connecticut UAM-V State Zero Out ModelingContributions to 1-Hr Designated + Modeled Receptors
Base case: Total Number of Exceedences (grids-days) = 127Upwind State
Percent totalppb reduced>= 125 ppb
Percentpop-wgt totalppb
Number ofexceedencesreduced >= 2ppb
Percentexceedencesreduced >= 2ppb
Number ofexceedencesreduced >= 5ppb
Percentexceedencesreduced >= 5ppb
Number ofexceedencesreduced >=10 ppb
Percentexceedencesreduced >=10 ppb
max 1-hrcontributionppb
AL 0% 0% 0 0% 0 0% 0 0% 0.2 GA 0% 0% 0 0% 0 0% 0 0% 0.2 IL 2% 2% 0 0% 0 0% 0 0% 1.8 IN 2% 1% 0 0% 0 0% 0 0% 1.5 KY 0% 0% 0 0% 0 0% 0 0% 0.7 MA 0% 0% 0 0% 0 0% 0 0% 1.1 MI 3% 3% 0 0% 0 0% 0 0% 1.2 MO 0% 0% 0 0% 0 0% 0 0% 0.4 NC 2% 3% 1 1% 0 0% 0 0% 2.1 OH 6% 4% 26 20% 0 0% 0 0% 4.2 SC 1% 1% 0 0% 0 0% 0 0% 1 TN 0% 0% 0 0% 0 0% 0 0% 0.3 VA 9% 9% 37 29% 1 1% 0 0% 5.7 WI 1% 0% 0 0% 0 0% 0 0% 0.9 WV 10% 9% 40 31% 12 9% 0 0% 6.6

H-11
Downwind Nonattainment Area: Houston UAM-V State Zero Out ModelingContributions to 1-Hr Designated + Modeled Receptors
Base case: Total Number of Exceedences (grids-days) = 81Upwind State
Percent totalppb reduced>= 125 ppb
Percentpop-wgt totalppb
Number ofexceedencesreduced >= 2ppb
Percentexceedencesreduced >= 2ppb
Number ofexceedencesreduced >= 5ppb
Percentexceedencesreduced >= 5ppb
Number ofexceedencesreduced >=10 ppb
Percentexceedencesreduced >=10 ppb
max 1-hrcontributionppb
AL 0% 0% 0 0% 0 0% 0 0% 0.6 GA 0% 0% 0 0% 0 0% 0 0% 0 IL 0% 0% 0 0% 0 0% 0 0% 0.2 IN 0% 0% 0 0% 0 0% 0 0% 0 KY 0% 0% 0 0% 0 0% 0 0% 0 MA 0% 0% 0 0% 0 0% 0 0% 0 MI 0% 0% 0 0% 0 0% 0 0% 0 MO 1% 0% 0 0% 0 0% 0 0% 0.4 NC 0% 0% 0 0% 0 0% 0 0% 0 OH 0% 0% 0 0% 0 0% 0 0% 0 SC 0% 0% 0 0% 0 0% 0 0% 0 TN 0% 0% 0 0% 0 0% 0 0% 0.2 VA 0% 0% 0 0% 0 0% 0 0% 0 WI 0% 0% 0 0% 0 0% 0 0% 0 WV 0% 0% 0 0% 0 0% 0 0% 0

H-12
Downwind Nonattainment Area: Lake Michigan UAM-V State Zero Out ModelingContributions to 1-Hr Designated + Modeled Receptors
Base case: Total Number of Exceedences (grids-days) = 408Upwind State
Percent totalppb reduced>= 125 ppb
Percentpop-wgt totalppb
Number ofexceedencesreduced >= 2ppb
Percentexceedencesreduced >= 2ppb
Number ofexceedencesreduced >= 5ppb
Percentexceedencesreduced >= 5ppb
Number ofexceedencesreduced >=10 ppb
Percentexceedencesreduced >=10 ppb
max 1-hrcontributionppb
AL 1% 0% 14 3% 0 0% 0 0% 4 GA 1% 0% 2 0% 0 0% 0 0% 2.1 IL 100% 0% 408 100% 408 100% 408 100% 111 IN 13% 0% 136 33% 90 22% 59 14% 39.8 KY 2% 0% 17 4% 10 2% 0 0% 6.5 MA 0% 0% 0 0% 0 0% 0 0% 0 MI 0% 0% 0 0% 0 0% 0 0% 0.7 MO 22% 0% 373 91% 95 23% 0 0% 7.7 NC 1% 0% 0 0% 0 0% 0 0% 1.4 OH 0% 0% 0 0% 0 0% 0 0% 1.4 SC 1% 0% 0 0% 0 0% 0 0% 1.4 TN 6% 0% 84 21% 59 14% 0 0% 7.7 VA 0% 0% 0 0% 0 0% 0 0% 0.7 WI 1% 0% 18 4% 5 1% 1 0% 10 WV 0% 0% 0 0% 0 0% 0 0% 1.8

H-13
Downwind Nonattainment Area: Louisville UAM-V State Zero Out ModelingContributions to 1-Hr Designated + Modeled Receptors
Base case: Total Number of Exceedences (grids-days) = 37Upwind State
Percent totalppb reduced>= 125 ppb
Percentpop-wgt totalppb
Number ofexceedencesreduced >= 2ppb
Percentexceedencesreduced >= 2ppb
Number ofexceedencesreduced >= 5ppb
Percentexceedencesreduced >= 5ppb
Number ofexceedencesreduced >=10 ppb
Percentexceedencesreduced >=10 ppb
max 1-hrcontributionppb
AL 4% 7% 0 0% 0 0% 0 0% 1.4 GA 5% 8% 0 0% 0 0% 0 0% 1.4 IL 4% 8% 0 0% 0 0% 0 0% 1.5 IN 62% 56% 33 89% 32 86% 28 76% 52.3 KY 100% 100% 37 100% 37 100% 36 97% 77 MA 0% 0% 0 0% 0 0% 0 0% 0 MI 0% 0% 0 0% 0 0% 0 0% 0 MO 1% 1% 0 0% 0 0% 0 0% 0.3 NC 8% 11% 1 3% 0 0% 0 0% 4.9 OH 0% 0% 0 0% 0 0% 0 0% 0.2 SC 5% 7% 1 3% 0 0% 0 0% 3.2 TN 37% 45% 18 49% 15 41% 8 22% 14.8 VA 4% 4% 1 3% 0 0% 0 0% 2.4 WI 0% 0% 0 0% 0 0% 0 0% 0 WV 2% 2% 0 0% 0 0% 0 0% 0.6

H-14
Downwind Nonattainment Area: Memphis UAM-V State Zero Out ModelingContributions to 1-Hr Designated + Modeled Receptors
Base case: Total Number of Exceedences (grids-days) = 23Upwind State
Percent totalppb reduced>= 125 ppb
Percentpop-wgt totalppb
Number ofexceedencesreduced >= 2ppb
Percentexceedencesreduced >= 2ppb
Number ofexceedencesreduced >= 5ppb
Percentexceedencesreduced >= 5ppb
Number ofexceedencesreduced >=10 ppb
Percentexceedencesreduced >=10 ppb
max 1-hrcontributionppb
AL 21% 21% 8 35% 4 17% 0 0% 7.3 GA 18% 21% 4 17% 4 17% 0 0% 8.3 IL 4% 16% 1 4% 1 4% 0 0% 5.2 IN 1% 0% 0 0% 0 0% 0 0% 0.1 KY 4% 8% 0 0% 0 0% 0 0% 1.1 MA 0% 0% 0 0% 0 0% 0 0% 0 MI 0% 0% 0 0% 0 0% 0 0% 0 MO 3% 13% 2 9% 0 0% 0 0% 4.3 NC 3% 3% 0 0% 0 0% 0 0% 1.2 OH 0% 0% 0 0% 0 0% 0 0% 0.3 SC 7% 5% 2 9% 0 0% 0 0% 3.1 TN 100% 100% 23 100% 23 100% 23 100% 100.4 VA 1% 0% 0 0% 0 0% 0 0% 0.1 WI 0% 0% 0 0% 0 0% 0 0% 0.1 WV 0% 0% 0 0% 0 0% 0 0% 0.4

H-15
Downwind Nonattainment Area: Metro DC UAM-V State Zero Out ModelingContributions to 1-Hr Designated + Modeled Receptors
Base case: Total Number of Exceedences (grids-days) = 134Upwind State
Percent totalppb reduced>= 125 ppb
Percentpop-wgt totalppb
Number ofexceedencesreduced >= 2ppb
Percentexceedencesreduced >= 2ppb
Number ofexceedencesreduced >= 5ppb
Percentexceedencesreduced >= 5ppb
Number ofexceedencesreduced >=10 ppb
Percentexceedencesreduced >=10 ppb
max 1-hrcontributionppb
AL 0% 0% 0 0% 0 0% 0 0% 1.9 GA 0% 0% 0 0% 0 0% 0 0% 1 IL 2% 1% 1 1% 0 0% 0 0% 2.6 IN 2% 2% 5 4% 0 0% 0 0% 4.1 KY 1% 2% 8 6% 0 0% 0 0% 4.7 MA 0% 0% 0 0% 0 0% 0 0% 0 MI 2% 3% 6 4% 2 1% 0 0% 6.8 MO 0% 0% 0 0% 0 0% 0 0% 1 NC 2% 2% 1 1% 1 1% 1 1% 12.3 OH 4% 5% 23 17% 1 1% 0 0% 5.4 SC 0% 0% 0 0% 0 0% 0 0% 1.3 TN 1% 1% 0 0% 0 0% 0 0% 1.9 VA 83% 72% 129 96% 120 90% 117 87% 101 WI 0% 1% 0 0% 0 0% 0 0% 1.8 WV 7% 10% 27 20% 17 13% 7 5% 16.4

H-16
Downwind Nonattainment Area: New York City UAM-V State Zero Out ModelingContributions to 1-Hr Designated + Modeled Receptors
Base case: Total Number of Exceedences (grids-days) = 418Upwind State
Percent totalppb reduced>= 125 ppb
Percentpop-wgt totalppb
Number ofexceedencesreduced >= 2ppb
Percentexceedencesreduced >= 2ppb
Number ofexceedencesreduced >= 5ppb
Percentexceedencesreduced >= 5ppb
Number ofexceedencesreduced >=10 ppb
Percentexceedencesreduced >=10 ppb
max 1-hrcontributionppb
AL 0% 1% 0 0% 0 0% 0 0% 0.4 GA 0% 1% 0 0% 0 0% 0 0% 0.4 IL 3% 5% 12 3% 0 0% 0 0% 2.9 IN 3% 4% 15 4% 0 0% 0 0% 2.7 KY 2% 2% 16 4% 0 0% 0 0% 2.6 MA 0% 0% 0 0% 0 0% 0 0% 0 MI 3% 5% 14 3% 0 0% 0 0% 3.2 MO 1% 1% 0 0% 0 0% 0 0% 0.7 NC 3% 4% 7 2% 0 0% 0 0% 3.6 OH 8% 8% 117 28% 1 0% 0 0% 5.4 SC 1% 1% 0 0% 0 0% 0 0% 1.1 TN 1% 1% 0 0% 0 0% 0 0% 0.5 VA 11% 12% 161 39% 36 9% 0 0% 10 WI 1% 2% 0 0% 0 0% 0 0% 1.4 WV 9% 10% 117 28% 38 9% 3 1% 11.3

H-17
Downwind Nonattainment Area: Philadelphia UAM-V State Zero Out ModelingContributions to 1-Hr Designated + Modeled Receptors
Base case: Total Number of Exceedences (grids-days) = 133Upwind State
Percent totalppb reduced>= 125 ppb
Percentpop-wgt totalppb
Number ofexceedencesreduced >= 2ppb
Percentexceedencesreduced >= 2ppb
Number ofexceedencesreduced >= 5ppb
Percentexceedencesreduced >= 5ppb
Number ofexceedencesreduced >=10 ppb
Percentexceedencesreduced >=10 ppb
max 1-hrcontributionppb
AL 0% 1% 0 0% 0 0% 0 0% 0.3 GA 1% 1% 0 0% 0 0% 0 0% 0.5 IL 5% 7% 0 0% 0 0% 0 0% 1.8 IN 4% 4% 2 2% 0 0% 0 0% 2.4 KY 2% 1% 1 1% 0 0% 0 0% 2.8 MA 0% 0% 0 0% 0 0% 0 0% 0 MI 3% 4% 2 2% 1 1% 0 0% 5.8 MO 1% 1% 0 0% 0 0% 0 0% 0.7 NC 4% 5% 5 4% 0 0% 0 0% 4.4 OH 13% 13% 48 36% 0 0% 0 0% 4.8 SC 1% 1% 0 0% 0 0% 0 0% 1 TN 2% 2% 0 0% 0 0% 0 0% 0.6 VA 32% 26% 80 60% 54 41% 21 16% 24.1 WI 0% 1% 0 0% 0 0% 0 0% 1 WV 19% 18% 75 56% 25 19% 0 0% 9.6

H-18
Downwind Nonattainment Area: Pittsburgh UAM-V State Zero Out ModelingContributions to 1-Hr Designated + Modeled Receptors
Base case: Total Number of Exceedences (grids-days) = 5Upwind State
Percent totalppb reduced>= 125 ppb
Percentpop-wgt totalppb
Number ofexceedencesreduced >= 2ppb
Percentexceedencesreduced >= 2ppb
Number ofexceedencesreduced >= 5ppb
Percentexceedencesreduced >= 5ppb
Number ofexceedencesreduced >=10 ppb
Percentexceedencesreduced >=10 ppb
max 1-hrcontributionppb
AL 0% 0% 0 0% 0 0% 0 0% 0 GA 0% 0% 0 0% 0 0% 0 0% 0 IL 0% 0% 0 0% 0 0% 0 0% 0 IN 0% 0% 0 0% 0 0% 0 0% 0 KY 0% 0% 0 0% 0 0% 0 0% 0 MA 0% 0% 0 0% 0 0% 0 0% 0 MI 7% 5% 0 0% 0 0% 0 0% 0.1 MO 0% 0% 0 0% 0 0% 0 0% 0 NC 57% 36% 5 100% 0 0% 0 0% 2.6 OH 64% 55% 3 60% 0 0% 0 0% 3.3 SC 21% 9% 0 0% 0 0% 0 0% 0.6 TN 0% 0% 0 0% 0 0% 0 0% 0 VA 43% 32% 0 0% 0 0% 0 0% 2 WI 0% 0% 0 0% 0 0% 0 0% 0 WV 100% 100% 5 100% 5 100% 5 100% 40.4

H-19
Downwind Nonattainment Area: Portland ME UAM-V State Zero Out ModelingContributions to 1-Hr Designated + Modeled Receptors
Base case: Total Number of Exceedences (grids-days) = 6Upwind State
Percent totalppb reduced>= 125 ppb
Percentpop-wgt totalppb
Number ofexceedencesreduced >= 2ppb
Percentexceedencesreduced >= 2ppb
Number ofexceedencesreduced >= 5ppb
Percentexceedencesreduced >= 5ppb
Number ofexceedencesreduced >=10 ppb
Percentexceedencesreduced >=10 ppb
max 1-hrcontributionppb
AL 0% 0% 0 0% 0 0% 0 0% 0 GA 0% 0% 0 0% 0 0% 0 0% 0 IL 3% 0% 0 0% 0 0% 0 0% 0.3 IN 6% 0% 0 0% 0 0% 0 0% 0.5 KY 0% 0% 0 0% 0 0% 0 0% 0.1 MA 100% 100% 6 100% 6 100% 6 100% 53.2 MI 6% 0% 0 0% 0 0% 0 0% 0.8 MO 0% 0% 0 0% 0 0% 0 0% 0 NC 6% 0% 0 0% 0 0% 0 0% 0.7 OH 13% 0% 0 0% 0 0% 0 0% 1 SC 0% 0% 0 0% 0 0% 0 0% 0 TN 0% 0% 0 0% 0 0% 0 0% 0 VA 9% 0% 0 0% 0 0% 0 0% 0.9 WI 0% 0% 0 0% 0 0% 0 0% 0 WV 9% 0% 0 0% 0 0% 0 0% 1

H-20
Downwind Nonattainment Area: Rhode Island UAM-V State Zero Out ModelingContributions to 1-Hr Designated + Modeled Receptors
Base case: Total Number of Exceedences (grids-days) = 19Upwind State
Percent totalppb reduced>= 125 ppb
Percentpop-wgt totalppb
Number ofexceedencesreduced >= 2ppb
Percentexceedencesreduced >= 2ppb
Number ofexceedencesreduced >= 5ppb
Percentexceedencesreduced >= 5ppb
Number ofexceedencesreduced >=10 ppb
Percentexceedencesreduced >=10 ppb
max 1-hrcontributionppb
AL 0% 0% 0 0% 0 0% 0 0% 0.1 GA 0% 0% 0 0% 0 0% 0 0% 0.1 IL 5% 5% 0 0% 0 0% 0 0% 1.3 IN 5% 5% 0 0% 0 0% 0 0% 1.8 KY 2% 0% 0 0% 0 0% 0 0% 1.4 MA 0% 0% 0 0% 0 0% 0 0% 0.7 MI 2% 5% 0 0% 0 0% 0 0% 0.8 MO 1% 0% 0 0% 0 0% 0 0% 0.3 NC 3% 5% 0 0% 0 0% 0 0% 0.9 OH 16% 20% 8 42% 0 0% 0 0% 3.5 SC 0% 0% 0 0% 0 0% 0 0% 0.1 TN 0% 0% 0 0% 0 0% 0 0% 0.2 VA 17% 20% 7 37% 1 5% 0 0% 7.8 WI 0% 0% 0 0% 0 0% 0 0% 0.1 WV 15% 20% 7 37% 0 0% 0 0% 4.5

H-21
Downwind Nonattainment Area: St Louis UAM-V State Zero Out ModelingContributions to 1-Hr Designated + Modeled Receptors
Base case: Total Number of Exceedences (grids-days) = 11Upwind State
Percent totalppb reduced>= 125 ppb
Percentpop-wgt totalppb
Number ofexceedencesreduced >= 2ppb
Percentexceedencesreduced >= 2ppb
Number ofexceedencesreduced >= 5ppb
Percentexceedencesreduced >= 5ppb
Number ofexceedencesreduced >=10 ppb
Percentexceedencesreduced >=10 ppb
max 1-hrcontributionppb
AL 13% 15% 0 0% 0 0% 0 0% 1.9 GA 11% 11% 0 0% 0 0% 0 0% 1.5 IL 36% -4% 8 73% 7 64% 7 64% 46.9 IN 9% 8% 0 0% 0 0% 0 0% 1.8 KY 16% 14% 4 36% 0 0% 0 0% 3.6 MA 0% 0% 0 0% 0 0% 0 0% 0 MI 4% 3% 0 0% 0 0% 0 0% 0.6 MO 100% 100% 11 100% 11 100% 11 100% 74.3 NC 7% 8% 0 0% 0 0% 0 0% 1.1 OH 7% 5% 0 0% 0 0% 0 0% 1.2 SC 7% 8% 0 0% 0 0% 0 0% 0.9 TN 11% 11% 0 0% 0 0% 0 0% 1.5 VA 0% 1% 0 0% 0 0% 0 0% 0.1 WI 0% 0% 0 0% 0 0% 0 0% 0 WV 2% 1% 0 0% 0 0% 0 0% 0.1

H-22
Downwind Nonattainment Area: SW Michigan UAM-V State Zero Out ModelingContributions to 1-Hr Designated + Modeled Receptors
Base case: Total Number of Exceedences (grids-days) = 22Upwind State
Percent totalppb reduced>= 125 ppb
Percentpop-wgt totalppb
Number ofexceedencesreduced >= 2ppb
Percentexceedencesreduced >= 2ppb
Number ofexceedencesreduced >= 5ppb
Percentexceedencesreduced >= 5ppb
Number ofexceedencesreduced >=10 ppb
Percentexceedencesreduced >=10 ppb
max 1-hrcontributionppb
AL 0% 0% 0 0% 0 0% 0 0% 0 GA 0% 0% 0 0% 0 0% 0 0% 0 IL 100% 100% 22 100% 22 100% 22 100% 60.1 IN 25% 15% 11 50% 7 32% 4 18% 21.2 KY 1% 0% 0 0% 0 0% 0 0% 0.3 MA 0% 0% 0 0% 0 0% 0 0% 0 MI -6% -37% 0 0% 0 0% 0 0% 1 MO 64% 77% 22 100% 16 73% 0 0% 5.8 NC 0% 0% 0 0% 0 0% 0 0% 0 OH 0% 0% 0 0% 0 0% 0 0% 0 SC 0% 0% 0 0% 0 0% 0 0% 0 TN 1% 0% 0 0% 0 0% 0 0% 0.1 VA 0% 0% 0 0% 0 0% 0 0% 0 WI 1% 0% 0 0% 0 0% 0 0% 1 WV 0% 0% 0 0% 0 0% 0 0% 0

H-23
Downwind Nonattainment Area: Western Massachusetts UAM-V State Zero Out ModelingContributions to 1-Hr Designated + Modeled Receptors
Base case: Total Number of Exceedences (grids-days) = 14Upwind State
Percent totalppb reduced>= 125 ppb
Percentpop-wgt totalppb
Number ofexceedencesreduced >= 2ppb
Percentexceedencesreduced >= 2ppb
Number ofexceedencesreduced >= 5ppb
Percentexceedencesreduced >= 5ppb
Number ofexceedencesreduced >=10 ppb
Percentexceedencesreduced >=10 ppb
max 1-hrcontributionppb
AL 0% 0% 0 0% 0 0% 0 0% 0 GA 0% 0% 0 0% 0 0% 0 0% 0.1 IL 1% 0% 0 0% 0 0% 0 0% 0.1 IN 1% 0% 0 0% 0 0% 0 0% 0.1 KY 1% 0% 0 0% 0 0% 0 0% 0.2 MA -30% -15% 1 7% 1 7% 1 7% 21.7 MI 13% 11% 0 0% 0 0% 0 0% 1.5 MO 0% 0% 0 0% 0 0% 0 0% 0 NC 4% 2% 0 0% 0 0% 0 0% 0.7 OH 4% 2% 0 0% 0 0% 0 0% 0.8 SC 1% 0% 0 0% 0 0% 0 0% 0.2 TN 0% 0% 0 0% 0 0% 0 0% 0 VA 12% 7% 0 0% 0 0% 0 0% 1.4 WI 0% 0% 0 0% 0 0% 0 0% 0.1 WV 12% 2% 3 21% 0 0% 0 0% 4.3

APPENDIX IEVALUATION OF CONTRIBUTIONS -- TABLES OF METRICS
1-HOUR CAMX: UPWIND STATES TO DOWNWIND NONATTAINMENT AREAS

I-1
The tables in this Appendix contain information on the CAMx metrics used for theevaluation of contributions. Tables are provided only for those nonattainment areaswith predicted exceedences in the Base Case. The headings in the table relate to themetrics as follows:
Average percent contribution (4-episode) Metric 4Highest daily average contribution (ppb) Metric 3Highest daily average contribution (%) Metric 3Number of exceedences reduced >= 2 ppb Metrics 1 & 2Percent exceedences reduced >= 2 ppb Metrics 1 & 2Number of exceedences reduced >= 5 ppb Metrics 1 & 2Percent exceedences reduced >= 5 ppb Metrics 1 & 2Number of exceedences reduced >= 10 ppb Metrics 1 & 2Percent exceedences reduced >= 10 ppb Metrics 1 & 2Max 1-hr contribution, ppb Metric 2
(Note: Some of the maximum contribution values may appear to be inconsistent with thenumber of exceedences above a certain cut-point. For example, a contribution of9.999........ is interpreted as being less that 10 ppb for the purpose of counting thenumber of exceedence reduced; however, this value is rounded to 10 ppb in thepresentation of maximum "ppb" contribution in these tables.)

I-2
Downwind Nonattainment Area : Atlanta ; CAMX Source Apportionment Modeling Contributions to 1-Hr Designated + Modeled Receptors
Base Case: Total Number of Exceedences (grids-hours) = 2046Upwind State: Average
percentcontribution(4-episode)
Highest dailyaverage (ppb)
Highest dailyaverage (%)
Number ofexceedencesreduced >= 2ppb
Percentexceedencesreduced >= 2ppb
Number ofexceedencesreduced >= 5ppb
Percentexceedencesreduced >= 5ppb
Number ofexceedencesreduced >=10 ppb
Percentexceedencesreduced >=10 ppb
Max 1-hrcontribution(ppb)
AL 8% 31 23% 1427 69% 1051 51% 880 43% 39CT/RI 0% 0 0% 0 0% 0 0% 0 0% 0.1FL 0% 3 2% 28 1% 0 0% 0 0% 3GA 79% 127 82% 2046 100% 2046 100% 2046 100% 201.8IA 0% 0 0% 0 0% 0 0% 0 0% 0.2IL 0% 2 2% 67 3% 0 0% 0 0% 2.3IN 0% 2 1% 56 2% 0 0% 0 0% 2.7KY 1% 11 8% 511 24% 147 7% 58 2% 13.7LA 1% 8 6% 669 32% 192 9% 0 0% 8.3MA 0% 0 0% 0 0% 0 0% 0 0% 0.1MD/DC/DE 0% 0 0% 0 0% 0 0% 0 0% 0.6ME 0% 0 0% 0 0% 0 0% 0 0% 0MI 0% 0 0% 0 0% 0 0% 0 0% 1.1MO 0% 3 2% 112 5% 0 0% 0 0% 3.6MS 2% 9 6% 808 39% 456 22% 23 1% 10.7NC 1% 7 5% 285 13% 26 1% 0 0% 7.6NH/VT 0% 0 0% 0 0% 0 0% 0 0% 0NJ 0% 0 0% 0 0% 0 0% 0 0% 0.5NY 0% 1 0% 0 0% 0 0% 0 0% 0.7OH 0% 2 1% 86 4% 3 0% 0 0% 5.5PA 0% 1 1% 0 0% 0 0% 0 0% 1.3SC 1% 23 18% 627 30% 230 11% 23 1% 24.9TN 4% 11 8% 1470 71% 860 42% 259 12% 20.4TX 1% 5 4% 443 21% 13 0% 0 0% 5.7VA 0% 1 1% 0 0% 0 0% 0 0% 1.5WI 0% 0 0% 0 0% 0 0% 0 0% 0.4WV 0% 1 1% 0 0% 0 0% 0 0% 1.6West 1% 6 5% 241 11% 46 2% 0 0% 7.2Canada 0% 0 0% 0 0% 0 0% 0 0% 0.3

I-3
Downwind Nonattainment Area : Baltimore ; CAMX Source Apportionment Modeling Contributions to 1-Hr Designated + Modeled Receptors
Base Case: Total Number of Exceedences (grids-hours) = 979Upwind State: Average
percentcontribution(4-episode)
Highest dailyaverage (ppb)
Highest dailyaverage (%)
Number ofexceedencesreduced >= 2ppb
Percentexceedencesreduced >= 2ppb
Number ofexceedencesreduced >= 5ppb
Percentexceedencesreduced >= 5ppb
Number ofexceedencesreduced >=10 ppb
Percentexceedencesreduced >=10 ppb
Max 1-hrcontribution(ppb)
AL 0% 6 4% 9 0% 6 0% 0 0% 7.9CT/RI 0% 0 0% 0 0% 0 0% 0 0% 0.1FL 0% 2 2% 8 0% 0 0% 0 0% 2.5GA 1% 3 2% 9 0% 0 0% 0 0% 2.8IA 0% 1 1% 0 0% 0 0% 0 0% 1.2IL 2% 6 5% 556 56% 65 6% 0 0% 6.7IN 2% 6 5% 425 43% 262 26% 0 0% 8.8KY 2% 8 6% 436 44% 238 24% 0 0% 9.2LA 0% 1 1% 0 0% 0 0% 0 0% 1.3MA 0% 0 0% 0 0% 0 0% 0 0% 0.1MD/DC/DE 44% 71 56% 979 100% 976 99% 968 98% 126.4ME 0% 0 0% 0 0% 0 0% 0 0% 0MI 2% 8 6% 460 46% 73 7% 0 0% 9.5MO 0% 3 3% 56 5% 0 0% 0 0% 3.8MS 0% 1 1% 0 0% 0 0% 0 0% 0.9NC 2% 11 9% 390 39% 126 12% 40 4% 14.5NH/VT 0% 0 0% 0 0% 0 0% 0 0% 0NJ 0% 1 1% 0 0% 0 0% 0 0% 1.5NY 0% 2 2% 115 11% 0 0% 0 0% 2.4OH 4% 12 10% 720 73% 507 51% 62 6% 13.5PA 7% 26 19% 529 54% 449 45% 342 34% 86.5SC 0% 1 1% 0 0% 0 0% 0 0% 1.3TN 1% 7 6% 427 43% 9 0% 0 0% 7.4TX 0% 3 2% 15 1% 0 0% 0 0% 2.8VA 24% 39 30% 969 98% 927 94% 862 88% 104.3WI 0% 3 2% 13 1% 0 0% 0 0% 3.2WV 4% 17 13% 580 59% 489 49% 130 13% 20.2West 0% 4 3% 51 5% 2 0% 0 0% 5Canada 1% 3 2% 42 4% 0 0% 0 0% 2.8

I-4
Downwind Nonattainment Area : Baton_Rouge ; CAMX Source Apportionment Modeling Contributions to 1-Hr Designated + Modeled Receptors
Base Case: Total Number of Exceedences (grids-hours) = 59Upwind State: Average
percentcontribution(4-episode)
Highest dailyaverage (ppb)
Highest dailyaverage (%)
Number ofexceedencesreduced >= 2ppb
Percentexceedencesreduced >= 2ppb
Number ofexceedencesreduced >= 5ppb
Percentexceedencesreduced >= 5ppb
Number ofexceedencesreduced >=10 ppb
Percentexceedencesreduced >=10 ppb
Max 1-hrcontribution(ppb)
AL 1% 7 6% 7 11% 7 11% 0 0% 8.2CT/RI 0% NA NA 0 0% 0 0% 0 0% 0FL 0% 0 0% 0 0% 0 0% 0 0% 0.1GA 0% 2 1% 1 1% 0 0% 0 0% 2.2IA 0% 0 0% 0 0% 0 0% 0 0% 0.6IL 0% 2 1% 0 0% 0 0% 0 0% 1.8IN 0% 2 1% 0 0% 0 0% 0 0% 1.8KY 0% 3 3% 7 11% 0 0% 0 0% 3.4LA 70% 79 60% 59 100% 59 100% 59 100% 90.7MA 0% NA NA 0 0% 0 0% 0 0% 0MD/DC/DE 0% NA NA 0 0% 0 0% 0 0% 0ME 0% NA NA 0 0% 0 0% 0 0% 0MI 0% 0 0% 0 0% 0 0% 0 0% 0.1MO 2% 2 2% 44 74% 0 0% 0 0% 3.3MS 14% 19 15% 59 100% 59 100% 59 100% 22NC 0% 0 0% 0 0% 0 0% 0 0% 0.1NH/VT 0% NA NA 0 0% 0 0% 0 0% 0NJ 0% NA NA 0 0% 0 0% 0 0% 0NY 0% NA NA 0 0% 0 0% 0 0% 0OH 0% 0 0% 0 0% 0 0% 0 0% 0.1PA 0% NA NA 0 0% 0 0% 0 0% 0SC 0% 0 0% 0 0% 0 0% 0 0% 0.1TN 1% 5 4% 7 11% 7 11% 0 0% 5.4TX 3% 4 3% 50 84% 24 40% 0 0% 7.4VA 0% 0 0% 0 0% 0 0% 0 0% 0WI 0% 0 0% 0 0% 0 0% 0 0% 0.2WV 0% 0 0% 0 0% 0 0% 0 0% 0West 6% 7 5% 52 88% 52 88% 0 0% 7.8Canada 0% 0 0% 0 0% 0 0% 0 0% 0

I-5
Downwind Nonattainment Area : Birmingham ; CAMX Source Apportionment Modeling Contributions to 1-Hr Designated + Modeled Receptors
Base Case: Total Number of Exceedences (grids-hours) = 876Upwind State: Average
percentcontribution(4-episode)
Highest dailyaverage (ppb)
Highest dailyaverage (%)
Number ofexceedencesreduced >= 2ppb
Percentexceedencesreduced >= 2ppb
Number ofexceedencesreduced >= 5ppb
Percentexceedencesreduced >= 5ppb
Number ofexceedencesreduced >=10 ppb
Percentexceedencesreduced >=10 ppb
Max 1-hrcontribution(ppb)
AL 79% 117 85% 876 100% 876 100% 876 100% 149.9CT/RI 0% 0 0% 0 0% 0 0% 0 0% 0.1FL 0% 3 2% 137 15% 0 0% 0 0% 3.7GA 3% 24 18% 236 26% 231 26% 141 16% 51.1IA 0% 0 0% 0 0% 0 0% 0 0% 0.2IL 0% 1 1% 1 0% 0 0% 0 0% 2IN 1% 3 2% 107 12% 0 0% 0 0% 4KY 2% 7 5% 247 28% 186 21% 0 0% 9.8LA 2% 9 7% 344 39% 119 13% 0 0% 9.2MA 0% 0 0% 0 0% 0 0% 0 0% 0.1MD/DC/DE 0% 0 0% 0 0% 0 0% 0 0% 0.1ME 0% 0 0% 0 0% 0 0% 0 0% 0MI 0% 0 0% 0 0% 0 0% 0 0% 0.2MO 0% 2 2% 25 2% 0 0% 0 0% 2.8MS 4% 12 9% 471 53% 381 43% 263 30% 14.2NC 0% 3 3% 118 13% 0 0% 0 0% 4NH/VT 0% 0 0% 0 0% 0 0% 0 0% 0.1NJ 0% 0 0% 0 0% 0 0% 0 0% 0.3NY 0% 0 0% 0 0% 0 0% 0 0% 0.4OH 0% 1 0% 0 0% 0 0% 0 0% 1.6PA 0% 0 0% 0 0% 0 0% 0 0% 0.3SC 1% 18 14% 147 16% 58 6% 15 1% 20.9TN 5% 17 12% 396 45% 354 40% 260 29% 25.9TX 1% 3 2% 145 16% 0 0% 0 0% 3.5VA 0% 0 0% 0 0% 0 0% 0 0% 0.6WI 0% 0 0% 0 0% 0 0% 0 0% 0.2WV 0% 0 0% 0 0% 0 0% 0 0% 0.6West 1% 7 6% 112 12% 67 7% 0 0% 8.1Canada 0% 0 0% 0 0% 0 0% 0 0% 0.2

I-6
Downwind Nonattainment Area : Boston ; CAMX Source Apportionment Modeling Contributions to 1-Hr Designated + Modeled Receptors
Base Case: Total Number of Exceedences (grids-hours) = 527Upwind State: Average
percentcontribution(4-episode)
Highest dailyaverage (ppb)
Highest dailyaverage (%)
Number ofexceedencesreduced >= 2ppb
Percentexceedencesreduced >= 2ppb
Number ofexceedencesreduced >= 5ppb
Percentexceedencesreduced >= 5ppb
Number ofexceedencesreduced >=10 ppb
Percentexceedencesreduced >=10 ppb
Max 1-hrcontribution(ppb)
AL 0% 1 1% 0 0% 0 0% 0 0% 1.4CT/RI 8% 15 11% 489 92% 408 77% 189 35% 42.8FL 0% 0 0% 0 0% 0 0% 0 0% 1.3GA 0% 1 0% 0 0% 0 0% 0 0% 0.9IA 0% 1 1% 10 1% 0 0% 0 0% 2.3IL 0% 3 3% 26 4% 2 0% 0 0% 5.9IN 1% 4 3% 51 9% 4 0% 0 0% 5.3KY 1% 6 4% 38 7% 27 5% 0 0% 6.7LA 0% 0 0% 0 0% 0 0% 0 0% 0.3MA 52% 78 59% 477 90% 475 90% 475 90% 118.6MD/DC/DE 2% 5 4% 375 71% 60 11% 0 0% 9.4ME 0% 0 0% 16 3% 3 0% 0 0% 6.3MI 1% 4 3% 123 23% 15 2% 0 0% 6.1MO 0% 2 1% 18 3% 0 0% 0 0% 3MS 0% 1 0% 0 0% 0 0% 0 0% 0.7NC 1% 3 2% 70 13% 6 1% 0 0% 7.1NH/VT 3% 13 9% 178 33% 125 23% 62 11% 79.4NJ 7% 25 19% 427 81% 278 52% 99 18% 42.1NY 9% 21 16% 513 97% 396 75% 259 49% 34OH 2% 7 5% 182 34% 77 14% 0 0% 8.2PA 5% 13 10% 459 87% 250 47% 131 24% 17.9SC 0% 1 0% 2 0% 0 0% 0 0% 4TN 0% 2 1% 10 1% 0 0% 0 0% 2.4TX 0% 0 0% 0 0% 0 0% 0 0% 0.4VA 2% 10 7% 221 41% 79 14% 27 5% 19.9WI 0% 2 2% 84 15% 0 0% 0 0% 2.9WV 1% 4 3% 154 29% 12 2% 0 0% 6.7West 0% 2 2% 43 8% 0 0% 0 0% 2.8Canada 2% 6 4% 287 54% 127 24% 3 0% 10.6

I-7
Downwind Nonattainment Area : Chicago-Milwaukee ; CAMX Source Apportionment Modeling Contributions to 1-Hr Designated + Modeled Receptors
Base Case: Total Number of Exceedences (grids-hours) = 19Upwind State: Average
percentcontribution(4-episode)
Highest dailyaverage (ppb)
Highest dailyaverage (%)
Number ofexceedencesreduced >= 2ppb
Percentexceedencesreduced >= 2ppb
Number ofexceedencesreduced >= 5ppb
Percentexceedencesreduced >= 5ppb
Number ofexceedencesreduced >=10 ppb
Percentexceedencesreduced >=10 ppb
Max 1-hrcontribution(ppb)
AL 1% 1 1% 0 0% 0 0% 0 0% 1.1CT/RI 0% NA NA 0 0% 0 0% 0 0% 0FL 0% 0 0% 0 0% 0 0% 0 0% 0GA 0% 0 0% 0 0% 0 0% 0 0% 0.3IA 0% 0 0% 0 0% 0 0% 0 0% 0.2IL 70% 78 57% 19 100% 19 100% 19 100% 98.6IN 9% 10 7% 14 73% 10 52% 7 36% 42.3KY 0% 0 0% 0 0% 0 0% 0 0% 0.5LA 0% 0 0% 0 0% 0 0% 0 0% 0.3MA 0% NA NA 0 0% 0 0% 0 0% 0MD/DC/DE 0% NA NA 0 0% 0 0% 0 0% 0ME 0% NA NA 0 0% 0 0% 0 0% 0MI 0% 0 0% 0 0% 0 0% 0 0% 0.3MO 8% 9 7% 19 100% 19 100% 3 15% 11.3MS 1% 2 1% 0 0% 0 0% 0 0% 1.9NC 0% 0 0% 0 0% 0 0% 0 0% 0NH/VT 0% NA NA 0 0% 0 0% 0 0% 0NJ 0% NA NA 0 0% 0 0% 0 0% 0NY 0% NA NA 0 0% 0 0% 0 0% 0OH 0% 0 0% 0 0% 0 0% 0 0% 0PA 0% NA NA 0 0% 0 0% 0 0% 0SC 0% 0 0% 0 0% 0 0% 0 0% 0TN 1% 2 1% 0 0% 0 0% 0 0% 2TX 0% 0 0% 0 0% 0 0% 0 0% 0.2VA 0% 0 0% 0 0% 0 0% 0 0% 0WI 3% 3 3% 14 73% 5 26% 0 0% 7.3WV 0% NA NA 0 0% 0 0% 0 0% 0West 5% 5 4% 19 100% 15 78% 0 0% 5.9Canada 0% NA NA 0 0% 0 0% 0 0% 0

I-8
Downwind Nonattainment Area : Cincinnati ; CAMX Source Apportionment Modeling Contributions to 1-Hr Designated + Modeled Receptors
Base Case: Total Number of Exceedences (grids-hours) = 36Upwind State: Average
percentcontribution(4-episode)
Highest dailyaverage (ppb)
Highest dailyaverage (%)
Number ofexceedencesreduced >= 2ppb
Percentexceedencesreduced >= 2ppb
Number ofexceedencesreduced >= 5ppb
Percentexceedencesreduced >= 5ppb
Number ofexceedencesreduced >=10 ppb
Percentexceedencesreduced >=10 ppb
Max 1-hrcontribution(ppb)
AL 6% 20 16% 12 33% 12 33% 12 33% 20.9CT/RI 0% 0 0% 0 0% 0 0% 0 0% 0FL 1% 2 2% 5 13% 0 0% 0 0% 2.6GA 1% 4 3% 12 33% 0 0% 0 0% 3.7IA 0% 0 0% 0 0% 0 0% 0 0% 0.3IL 0% 2 2% 2 5% 0 0% 0 0% 3.9IN 11% 19 15% 36 100% 34 94% 22 61% 22.7KY 25% 48 37% 36 100% 36 100% 36 100% 61.6LA 2% 6 5% 12 33% 9 25% 0 0% 7.7MA 0% 0 0% 0 0% 0 0% 0 0% 0MD/DC/DE 0% 0 0% 0 0% 0 0% 0 0% 0.3ME 0% NA NA 0 0% 0 0% 0 0% 0MI 0% 0 0% 0 0% 0 0% 0 0% 0.2MO 0% 1 1% 0 0% 0 0% 0 0% 1.6MS 2% 7 5% 12 33% 12 33% 0 0% 8.1NC 2% 5 4% 18 50% 6 16% 0 0% 5.6NH/VT 0% NA NA 0 0% 0 0% 0 0% 0NJ 0% 0 0% 0 0% 0 0% 0 0% 0NY 0% 0 0% 0 0% 0 0% 0 0% 0.3OH 36% 67 52% 32 88% 32 88% 32 88% 69.1PA 1% 1 1% 0 0% 0 0% 0 0% 1.3SC 1% 2 2% 5 13% 0 0% 0 0% 2.5TN 8% 25 19% 36 100% 19 52% 9 25% 27.1TX 0% 1 0% 0 0% 0 0% 0 0% 0.6VA 2% 4 3% 18 50% 0 0% 0 0% 4.7WI 0% 0 0% 0 0% 0 0% 0 0% 0WV 1% 4 3% 6 16% 0 0% 0 0% 4.5West 0% 1 1% 0 0% 0 0% 0 0% 1.3Canada 0% 1 1% 0 0% 0 0% 0 0% 1

I-9
Downwind Nonattainment Area : Dallas ; CAMX Source Apportionment Modeling Contributions to 1-Hr Designated + Modeled Receptors
Base Case: Total Number of Exceedences (grids-hours) = 19Upwind State: Average
percentcontribution(4-episode)
Highest dailyaverage (ppb)
Highest dailyaverage (%)
Number ofexceedencesreduced >= 2ppb
Percentexceedencesreduced >= 2ppb
Number ofexceedencesreduced >= 5ppb
Percentexceedencesreduced >= 5ppb
Number ofexceedencesreduced >=10 ppb
Percentexceedencesreduced >=10 ppb
Max 1-hrcontribution(ppb)
AL 1% 1 0% 0 0% 0 0% 0 0% 0.7CT/RI 0% NA NA 0 0% 0 0% 0 0% 0FL 2% 3 2% 19 100% 0 0% 0 0% 2.8GA 0% 0 0% 0 0% 0 0% 0 0% 0.3IA 0% 0 0% 0 0% 0 0% 0 0% 0IL 0% 0 0% 0 0% 0 0% 0 0% 0IN 0% 0 0% 0 0% 0 0% 0 0% 0KY 0% 0 0% 0 0% 0 0% 0 0% 0LA 4% 4 3% 19 100% 0 0% 0 0% 4.5MA 0% NA NA 0 0% 0 0% 0 0% 0MD/DC/DE 0% NA NA 0 0% 0 0% 0 0% 0ME 0% NA NA 0 0% 0 0% 0 0% 0MI 0% 0 0% 0 0% 0 0% 0 0% 0MO 0% 0 0% 0 0% 0 0% 0 0% 0.1MS 1% 1 1% 0 0% 0 0% 0 0% 0.8NC 0% 0 0% 0 0% 0 0% 0 0% 0.1NH/VT 0% NA NA 0 0% 0 0% 0 0% 0NJ 0% NA NA 0 0% 0 0% 0 0% 0NY 0% NA NA 0 0% 0 0% 0 0% 0OH 0% 0 0% 0 0% 0 0% 0 0% 0PA 0% 0 0% 0 0% 0 0% 0 0% 0SC 0% 0 0% 0 0% 0 0% 0 0% 0.1TN 0% 0 0% 0 0% 0 0% 0 0% 0.1TX 91% 105 79% 19 100% 19 100% 19 100% 114.8VA 0% 0 0% 0 0% 0 0% 0 0% 0WI 0% 0 0% 0 0% 0 0% 0 0% 0WV 0% 0 0% 0 0% 0 0% 0 0% 0West 2% 2 1% 8 42% 0 0% 0 0% 2.4Canada 0% NA NA 0 0% 0 0% 0 0% 0

I-10
Downwind Nonattainment Area : Greater Connecticut ; CAMX Source Apportionment Modeling Contributions to 1-Hr Designated + Modeled Receptors
Base Case: Total Number of Exceedences (grids-hours) = 572Upwind State: Average
percentcontribution(4-episode)
Highest dailyaverage (ppb)
Highest dailyaverage (%)
Number ofexceedencesreduced >= 2ppb
Percentexceedencesreduced >= 2ppb
Number ofexceedencesreduced >= 5ppb
Percentexceedencesreduced >= 5ppb
Number ofexceedencesreduced >=10 ppb
Percentexceedencesreduced >=10 ppb
Max 1-hrcontribution(ppb)
AL 0% 1 1% 0 0% 0 0% 0 0% 1.6CT/RI 17% 45 35% 500 87% 445 77% 369 64% 64.9FL 0% 2 1% 26 4% 0 0% 0 0% 2.9GA 0% 1 1% 0 0% 0 0% 0 0% 1.1IA 0% 1 0% 0 0% 0 0% 0 0% 1.4IL 1% 5 4% 127 22% 81 14% 0 0% 7.6IN 1% 3 2% 113 19% 0 0% 0 0% 3.1KY 0% 2 1% 1 0% 0 0% 0 0% 2.1LA 0% 0 0% 0 0% 0 0% 0 0% 0.5MA 0% 0 0% 0 0% 0 0% 0 0% 1.9MD/DC/DE 3% 7 6% 419 73% 164 28% 15 2% 12ME 0% 0 0% 0 0% 0 0% 0 0% 0MI 1% 4 3% 195 34% 10 1% 0 0% 5.9MO 0% 2 2% 52 9% 0 0% 0 0% 3.5MS 0% 0 0% 0 0% 0 0% 0 0% 0.5NC 1% 5 4% 112 19% 40 6% 0 0% 7.3NH/VT 0% 0 0% 0 0% 0 0% 0 0% 0.3NJ 26% 45 35% 572 100% 572 100% 567 99% 62.3NY 26% 37 27% 572 100% 572 100% 567 99% 64.5OH 2% 10 8% 222 38% 104 18% 42 7% 13.6PA 10% 23 18% 572 100% 561 98% 345 60% 28.6SC 0% 2 1% 22 3% 0 0% 0 0% 3TN 0% 2 1% 0 0% 0 0% 0 0% 1.6TX 0% 0 0% 0 0% 0 0% 0 0% 0.2VA 4% 9 7% 375 65% 204 35% 33 5% 14.9WI 0% 2 1% 16 2% 0 0% 0 0% 2.3WV 2% 10 7% 192 33% 131 22% 10 1% 10.8West 0% 1 1% 0 0% 0 0% 0 0% 1.3Canada 2% 7 5% 259 45% 176 30% 0 0% 8.9

I-11
Downwind Nonattainment Area : Houston ; CAMX Source Apportionment Modeling Contributions to 1-Hr Designated + Modeled Receptors
Base Case: Total Number of Exceedences (grids-hours) = 412Upwind State: Average
percentcontribution(4-episode)
Highest dailyaverage (ppb)
Highest dailyaverage (%)
Number ofexceedencesreduced >= 2ppb
Percentexceedencesreduced >= 2ppb
Number ofexceedencesreduced >= 5ppb
Percentexceedencesreduced >= 5ppb
Number ofexceedencesreduced >=10 ppb
Percentexceedencesreduced >=10 ppb
Max 1-hrcontribution(ppb)
AL 0% 0 0% 0 0% 0 0% 0 0% 0.5CT/RI 0% NA NA 0 0% 0 0% 0 0% 0FL 0% 0 0% 0 0% 0 0% 0 0% 0GA 0% 0 0% 0 0% 0 0% 0 0% 0.1IA 0% 0 0% 0 0% 0 0% 0 0% 0.2IL 0% 0 0% 0 0% 0 0% 0 0% 0.6IN 0% 0 0% 0 0% 0 0% 0 0% 0.1KY 0% 0 0% 0 0% 0 0% 0 0% 0.1LA 4% 8 7% 336 81% 182 44% 27 6% 12.1MA 0% NA NA 0 0% 0 0% 0 0% 0MD/DC/DE 0% NA NA 0 0% 0 0% 0 0% 0ME 0% NA NA 0 0% 0 0% 0 0% 0MI 0% 0 0% 0 0% 0 0% 0 0% 0MO 0% 0 0% 0 0% 0 0% 0 0% 1MS 0% 1 1% 0 0% 0 0% 0 0% 1.1NC 0% 0 0% 0 0% 0 0% 0 0% 0NH/VT 0% NA NA 0 0% 0 0% 0 0% 0NJ 0% NA NA 0 0% 0 0% 0 0% 0NY 0% NA NA 0 0% 0 0% 0 0% 0OH 0% 0 0% 0 0% 0 0% 0 0% 0PA 0% NA NA 0 0% 0 0% 0 0% 0SC 0% 0 0% 0 0% 0 0% 0 0% 0TN 0% 0 0% 0 0% 0 0% 0 0% 0.4TX 93% 113 84% 412 100% 412 100% 412 100% 152.2VA 0% 0 0% 0 0% 0 0% 0 0% 0WI 0% 0 0% 0 0% 0 0% 0 0% 0.1WV 0% 0 0% 0 0% 0 0% 0 0% 0West 2% 4 3% 262 63% 71 17% 0 0% 6.9Canada 0% NA NA 0 0% 0 0% 0 0% 0

I-12
Downwind Nonattainment Area : Lake_Michigan ; CAMX Source Apportionment Modeling Contributions to 1-Hr Designated + Modeled Receptors
Base Case: Total Number of Exceedences (grids-hours) = 2146Upwind State: Average
percentcontribution(4-episode)
Highest dailyaverage (ppb)
Highest dailyaverage (%)
Number ofexceedencesreduced >= 2ppb
Percentexceedencesreduced >= 2ppb
Number ofexceedencesreduced >= 5ppb
Percentexceedencesreduced >= 5ppb
Number ofexceedencesreduced >=10 ppb
Percentexceedencesreduced >=10 ppb
Max 1-hrcontribution(ppb)
AL 1% 8 6% 408 19% 177 8% 0 0% 9.9CT/RI 0% 0 0% 0 0% 0 0% 0 0% 0FL 0% 2 2% 89 4% 0 0% 0 0% 2.9GA 1% 5 4% 379 17% 76 3% 0 0% 5.8IA 0% 0 0% 1 0% 0 0% 0 0% 2IL 59% 68 50% 2146 100% 2146 100% 2146 100% 119.6IN 9% 24 19% 1749 81% 1242 57% 802 37% 55.5KY 1% 14 11% 549 25% 119 5% 13 0% 14.8LA 0% 6 5% 123 5% 8 0% 0 0% 6.6MA 0% NA NA 0 0% 0 0% 0 0% 0MD/DC/DE 0% 0 0% 0 0% 0 0% 0 0% 0.1ME 0% NA NA 0 0% 0 0% 0 0% 0MI 0% 0 0% 4 0% 0 0% 0 0% 2.4MO 9% 12 8% 2017 93% 1985 92% 1435 66% 19MS 1% 3 2% 287 13% 0 0% 0 0% 3.9NC 0% 2 2% 77 3% 0 0% 0 0% 2.6NH/VT 0% NA NA 0 0% 0 0% 0 0% 0NJ 0% 0 0% 0 0% 0 0% 0 0% 0NY 0% 0 0% 0 0% 0 0% 0 0% 0OH 0% 5 4% 13 0% 13 0% 0 0% 5.6PA 0% 0 0% 0 0% 0 0% 0 0% 0.4SC 0% 2 2% 129 6% 0 0% 0 0% 2.7TN 2% 11 8% 346 16% 304 14% 105 4% 12.7TX 1% 8 6% 816 38% 9 0% 0 0% 9VA 0% 1 1% 0 0% 0 0% 0 0% 1.3WI 4% 8 6% 1159 54% 612 28% 242 11% 43.1WV 0% 2 2% 8 0% 0 0% 0 0% 2West 11% 17 12% 1993 92% 1864 86% 1414 65% 21.8Canada 0% 0 0% 0 0% 0 0% 0 0% 0.2

I-13
Downwind Nonattainment Area : Louisville ; CAMX Source Apportionment Modeling Contributions to 1-Hr Designated + Modeled Receptors
Base Case: Total Number of Exceedences (grids-hours) = 166Upwind State: Average
percentcontribution(4-episode)
Highest dailyaverage (ppb)
Highest dailyaverage (%)
Number ofexceedencesreduced >= 2ppb
Percentexceedencesreduced >= 2ppb
Number ofexceedencesreduced >= 5ppb
Percentexceedencesreduced >= 5ppb
Number ofexceedencesreduced >=10 ppb
Percentexceedencesreduced >=10 ppb
Max 1-hrcontribution(ppb)
AL 2% 6 4% 73 43% 30 18% 0 0% 6.7CT/RI 0% 0 0% 0 0% 0 0% 0 0% 0FL 0% 0 0% 0 0% 0 0% 0 0% 0.1GA 2% 4 3% 55 33% 4 2% 0 0% 5.6IA 0% 0 0% 0 0% 0 0% 0 0% 0.2IL 1% 2 2% 15 9% 0 0% 0 0% 3.8IN 17% 31 24% 159 95% 143 86% 121 72% 51.2KY 58% 72 55% 166 100% 166 100% 166 100% 86.8LA 0% 0 0% 0 0% 0 0% 0 0% 0MA 0% 0 0% 0 0% 0 0% 0 0% 0MD/DC/DE 0% 0 0% 0 0% 0 0% 0 0% 0.4ME 0% 0 0% 0 0% 0 0% 0 0% 0MI 0% 0 0% 0 0% 0 0% 0 0% 0.1MO 0% 1 0% 0 0% 0 0% 0 0% 0.7MS 0% 0 0% 0 0% 0 0% 0 0% 0.2NC 2% 4 3% 85 51% 0 0% 0 0% 4.9NH/VT 0% 0 0% 0 0% 0 0% 0 0% 0NJ 0% 0 0% 0 0% 0 0% 0 0% 0.1NY 0% 0 0% 0 0% 0 0% 0 0% 0.2OH 1% 1 1% 15 9% 0 0% 0 0% 2.9PA 0% 1 1% 0 0% 0 0% 0 0% 0.9SC 1% 3 2% 70 42% 0 0% 0 0% 3.1TN 14% 34 25% 166 100% 129 77% 81 48% 37.5TX 0% 0 0% 0 0% 0 0% 0 0% 0VA 1% 2 1% 0 0% 0 0% 0 0% 2WI 0% 0 0% 0 0% 0 0% 0 0% 0.1WV 0% 1 1% 0 0% 0 0% 0 0% 1.4West 0% 0 0% 0 0% 0 0% 0 0% 0.6Canada 0% 0 0% 0 0% 0 0% 0 0% 0.2

I-14
Downwind Nonattainment Area : Memphis ; CAMX Source Apportionment Modeling Contributions to 1-Hr Designated + Modeled Receptors
Base Case: Total Number of Exceedences (grids-hours) = 61Upwind State: Average
percentcontribution(4-episode)
Highest dailyaverage (ppb)
Highest dailyaverage (%)
Number ofexceedencesreduced >= 2ppb
Percentexceedencesreduced >= 2ppb
Number ofexceedencesreduced >= 5ppb
Percentexceedencesreduced >= 5ppb
Number ofexceedencesreduced >=10 ppb
Percentexceedencesreduced >=10 ppb
Max 1-hrcontribution(ppb)
AL 6% 18 13% 32 52% 20 32% 19 31% 19.5CT/RI 0% NA NA 0 0% 0 0% 0 0% 0FL 1% 5 4% 3 4% 0 0% 0 0% 4.8GA 5% 17 13% 22 36% 19 31% 19 31% 18.3IA 0% 0 0% 0 0% 0 0% 0 0% 0.5IL 0% 5 4% 2 3% 2 3% 0 0% 5.3IN 0% 1 0% 0 0% 0 0% 0 0% 0.7KY 0% 3 3% 2 3% 0 0% 0 0% 3.4LA 4% 7 5% 37 60% 36 59% 0 0% 8.2MA 0% NA NA 0 0% 0 0% 0 0% 0MD/DC/DE 0% 0 0% 0 0% 0 0% 0 0% 0ME 0% NA NA 0 0% 0 0% 0 0% 0MI 0% 0 0% 0 0% 0 0% 0 0% 0.1MO 0% 2 1% 0 0% 0 0% 0 0% 1.7MS 5% 10 8% 56 91% 37 60% 6 9% 12.8NC 1% 4 3% 3 4% 0 0% 0 0% 4.2NH/VT 0% NA NA 0 0% 0 0% 0 0% 0NJ 0% NA NA 0 0% 0 0% 0 0% 0NY 0% 0 0% 0 0% 0 0% 0 0% 0OH 0% 1 0% 0 0% 0 0% 0 0% 0.6PA 0% 0 0% 0 0% 0 0% 0 0% 0.3SC 2% 6 4% 22 36% 19 31% 0 0% 6.7TN 47% 62 48% 61 100% 61 100% 61 100% 69.3TX 4% 10 8% 37 60% 34 55% 11 18% 11.2VA 0% 1 1% 0 0% 0 0% 0 0% 0.7WI 0% 0 0% 0 0% 0 0% 0 0% 0.2WV 0% 1 0% 0 0% 0 0% 0 0% 0.6West 25% 36 29% 61 100% 61 100% 53 86% 43.4Canada 0% 0 0% 0 0% 0 0% 0 0% 0.1

I-15
Downwind Nonattainment Area : Metro_DC ; CAMX Source Apportionment Modeling Contributions to 1-Hr Designated + Modeled Receptors
Base Case: Total Number of Exceedences (grids-hours) = 874Upwind State: Average
percentcontribution(4-episode)
Highest dailyaverage (ppb)
Highest dailyaverage (%)
Number ofexceedencesreduced >= 2ppb
Percentexceedencesreduced >= 2ppb
Number ofexceedencesreduced >= 5ppb
Percentexceedencesreduced >= 5ppb
Number ofexceedencesreduced >=10 ppb
Percentexceedencesreduced >=10 ppb
Max 1-hrcontribution(ppb)
AL 0% 1 1% 0 0% 0 0% 0 0% 1.4CT/RI 0% 0 0% 0 0% 0 0% 0 0% 0.1FL 0% 2 1% 0 0% 0 0% 0 0% 1.8GA 0% 1 1% 17 1% 0 0% 0 0% 3.8IA 0% 1 1% 0 0% 0 0% 0 0% 1IL 1% 6 5% 293 33% 20 2% 0 0% 6.6IN 1% 7 6% 165 18% 115 13% 0 0% 9.1KY 1% 7 5% 143 16% 112 12% 16 1% 11.7LA 0% 1 1% 0 0% 0 0% 0 0% 1.2MA 0% 0 0% 0 0% 0 0% 0 0% 0.1MD/DC/DE 31% 55 37% 865 98% 850 97% 811 92% 100.2ME 0% 0 0% 0 0% 0 0% 0 0% 0MI 2% 8 7% 342 39% 40 4% 0 0% 8.3MO 0% 4 3% 26 2% 0 0% 0 0% 4MS 0% 1 0% 0 0% 0 0% 0 0% 0.7NC 2% 9 7% 326 37% 97 11% 63 7% 20.2NH/VT 0% 0 0% 0 0% 0 0% 0 0% 0NJ 0% 1 1% 0 0% 0 0% 0 0% 1.5NY 1% 2 2% 44 5% 0 0% 0 0% 2.3OH 3% 10 8% 365 41% 265 30% 11 1% 11.4PA 8% 16 11% 726 83% 712 81% 330 37% 56.7SC 0% 1 1% 21 2% 0 0% 0 0% 4.4TN 1% 4 4% 124 14% 0 0% 0 0% 4.4TX 0% 3 2% 4 0% 0 0% 0 0% 3.1VA 45% 70 49% 874 100% 871 99% 860 98% 123.3WI 0% 3 2% 5 0% 0 0% 0 0% 3.1WV 2% 19 15% 399 45% 170 19% 19 2% 20.3West 0% 5 4% 26 2% 0 0% 0 0% 4.9Canada 1% 2 2% 118 13% 0 0% 0 0% 3.1

I-16
Downwind Nonattainment Area : New_York_City ; CAMX Source Apportionment Modeling Contributions to 1-Hr Designated + Modeled Receptors
Base Case: Total Number of Exceedences (grids-hours) = 1924Upwind State: Average
percentcontribution(4-episode)
Highest dailyaverage (ppb)
Highest dailyaverage (%)
Number ofexceedencesreduced >= 2ppb
Percentexceedencesreduced >= 2ppb
Number ofexceedencesreduced >= 5ppb
Percentexceedencesreduced >= 5ppb
Number ofexceedencesreduced >=10 ppb
Percentexceedencesreduced >=10 ppb
Max 1-hrcontribution(ppb)
AL 0% 1 1% 0 0% 0 0% 0 0% 1.6CT/RI 1% 2 2% 211 10% 117 6% 52 2% 30.2FL 0% 2 2% 95 4% 0 0% 0 0% 3.9GA 0% 1 1% 2 0% 0 0% 0 0% 2.8IA 0% 1 1% 0 0% 0 0% 0 0% 1.9IL 2% 6 5% 718 37% 392 20% 0 0% 8.8IN 1% 4 3% 667 34% 71 3% 0 0% 6.4KY 1% 7 5% 314 16% 227 11% 0 0% 9.7LA 0% 0 0% 0 0% 0 0% 0 0% 1.6MA 0% 0 0% 0 0% 0 0% 0 0% 0.1MD/DC/DE 5% 15 12% 1310 68% 734 38% 275 14% 50.5ME 0% 0 0% 0 0% 0 0% 0 0% 0MI 1% 5 4% 782 40% 26 1% 0 0% 7.6MO 1% 3 2% 164 8% 0 0% 0 0% 3.4MS 0% 0 0% 0 0% 0 0% 0 0% 0.7NC 1% 6 5% 469 24% 124 6% 3 0% 11.1NH/VT 0% 0 0% 0 0% 0 0% 0 0% 0NJ 38% 56 43% 1924 100% 1923 99% 1921 99% 82NY 16% 42 33% 1454 75% 1285 66% 1134 58% 67.7OH 4% 9 7% 1223 63% 938 48% 136 7% 14.9PA 18% 25 19% 1917 99% 1885 97% 1763 91% 53SC 0% 2 2% 96 4% 0 0% 0 0% 2.9TN 1% 2 2% 250 12% 0 0% 0 0% 4.6TX 0% 2 2% 1 0% 0 0% 0 0% 2.1VA 4% 11 9% 1059 55% 696 36% 214 11% 25.1WI 0% 2 2% 143 7% 0 0% 0 0% 3.2WV 3% 10 8% 971 50% 532 27% 133 6% 14.6West 0% 4 3% 18 0% 0 0% 0 0% 4.7Canada 1% 6 5% 434 22% 312 16% 0 0% 9.1
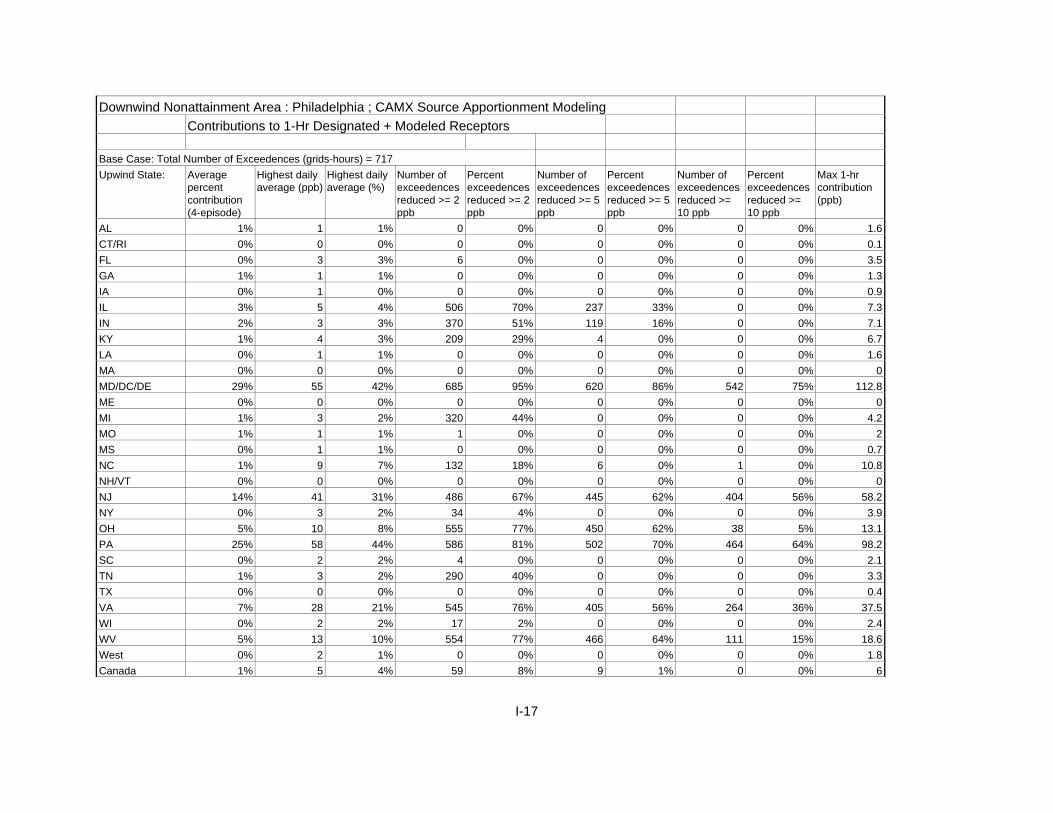
I-17
Downwind Nonattainment Area : Philadelphia ; CAMX Source Apportionment Modeling Contributions to 1-Hr Designated + Modeled Receptors
Base Case: Total Number of Exceedences (grids-hours) = 717Upwind State: Average
percentcontribution(4-episode)
Highest dailyaverage (ppb)
Highest dailyaverage (%)
Number ofexceedencesreduced >= 2ppb
Percentexceedencesreduced >= 2ppb
Number ofexceedencesreduced >= 5ppb
Percentexceedencesreduced >= 5ppb
Number ofexceedencesreduced >=10 ppb
Percentexceedencesreduced >=10 ppb
Max 1-hrcontribution(ppb)
AL 1% 1 1% 0 0% 0 0% 0 0% 1.6CT/RI 0% 0 0% 0 0% 0 0% 0 0% 0.1FL 0% 3 3% 6 0% 0 0% 0 0% 3.5GA 1% 1 1% 0 0% 0 0% 0 0% 1.3IA 0% 1 0% 0 0% 0 0% 0 0% 0.9IL 3% 5 4% 506 70% 237 33% 0 0% 7.3IN 2% 3 3% 370 51% 119 16% 0 0% 7.1KY 1% 4 3% 209 29% 4 0% 0 0% 6.7LA 0% 1 1% 0 0% 0 0% 0 0% 1.6MA 0% 0 0% 0 0% 0 0% 0 0% 0MD/DC/DE 29% 55 42% 685 95% 620 86% 542 75% 112.8ME 0% 0 0% 0 0% 0 0% 0 0% 0MI 1% 3 2% 320 44% 0 0% 0 0% 4.2MO 1% 1 1% 1 0% 0 0% 0 0% 2MS 0% 1 1% 0 0% 0 0% 0 0% 0.7NC 1% 9 7% 132 18% 6 0% 1 0% 10.8NH/VT 0% 0 0% 0 0% 0 0% 0 0% 0NJ 14% 41 31% 486 67% 445 62% 404 56% 58.2NY 0% 3 2% 34 4% 0 0% 0 0% 3.9OH 5% 10 8% 555 77% 450 62% 38 5% 13.1PA 25% 58 44% 586 81% 502 70% 464 64% 98.2SC 0% 2 2% 4 0% 0 0% 0 0% 2.1TN 1% 3 2% 290 40% 0 0% 0 0% 3.3TX 0% 0 0% 0 0% 0 0% 0 0% 0.4VA 7% 28 21% 545 76% 405 56% 264 36% 37.5WI 0% 2 2% 17 2% 0 0% 0 0% 2.4WV 5% 13 10% 554 77% 466 64% 111 15% 18.6West 0% 2 1% 0 0% 0 0% 0 0% 1.8Canada 1% 5 4% 59 8% 9 1% 0 0% 6

I-18
Downwind Nonattainment Area : Pittsburgh ; CAMX Source Apportionment Modeling Contributions to 1-Hr Designated + Modeled Receptors
Base Case: Total Number of Exceedences (grids-hours) = 25Upwind State: Average
percentcontribution(4-episode)
Highest dailyaverage (ppb)
Highest dailyaverage (%)
Number ofexceedencesreduced >= 2ppb
Percentexceedencesreduced >= 2ppb
Number ofexceedencesreduced >= 5ppb
Percentexceedencesreduced >= 5ppb
Number ofexceedencesreduced >=10 ppb
Percentexceedencesreduced >=10 ppb
Max 1-hrcontribution(ppb)
AL 0% 0 0% 0 0% 0 0% 0 0% 0CT/RI 0% NA NA 0 0% 0 0% 0 0% 0FL 0% NA NA 0 0% 0 0% 0 0% 0GA 0% 0 0% 0 0% 0 0% 0 0% 0IA 0% NA NA 0 0% 0 0% 0 0% 0IL 0% NA NA 0 0% 0 0% 0 0% 0IN 0% 0 0% 0 0% 0 0% 0 0% 0KY 0% 0 0% 0 0% 0 0% 0 0% 0.1LA 0% NA NA 0 0% 0 0% 0 0% 0MA 0% NA NA 0 0% 0 0% 0 0% 0MD/DC/DE 0% 0 0% 0 0% 0 0% 0 0% 0.7ME 0% NA NA 0 0% 0 0% 0 0% 0MI 0% 0 0% 0 0% 0 0% 0 0% 0.3MO 0% NA NA 0 0% 0 0% 0 0% 0MS 0% NA NA 0 0% 0 0% 0 0% 0NC 4% 5 4% 25 100% 11 44% 0 0% 5.3NH/VT 0% NA NA 0 0% 0 0% 0 0% 0NJ 0% 0 0% 0 0% 0 0% 0 0% 0NY 0% 0 0% 0 0% 0 0% 0 0% 0.2OH 18% 20 16% 25 100% 25 100% 25 100% 25.4PA 43% 48 38% 25 100% 25 100% 25 100% 64.7SC 1% 1 1% 0 0% 0 0% 0 0% 1.4TN 0% 0 0% 0 0% 0 0% 0 0% 0.1TX 0% NA NA 0 0% 0 0% 0 0% 0VA 3% 4 3% 25 100% 0 0% 0 0% 4.4WI 0% 0 0% 0 0% 0 0% 0 0% 0WV 28% 31 24% 25 100% 25 100% 25 100% 36West 0% 0 0% 0 0% 0 0% 0 0% 0Canada 0% 0 0% 0 0% 0 0% 0 0% 0.6

I-19
Downwind Nonattainment Area : Portland_ME ; CAMX Source Apportionment Modeling Contributions to 1-Hr Designated + Modeled Receptors
Base Case: Total Number of Exceedences (grids-hours) = 51Upwind State: Average
percentcontribution(4-episode)
Highest dailyaverage (ppb)
Highest dailyaverage (%)
Number ofexceedencesreduced >= 2ppb
Percentexceedencesreduced >= 2ppb
Number ofexceedencesreduced >= 5ppb
Percentexceedencesreduced >= 5ppb
Number ofexceedencesreduced >=10 ppb
Percentexceedencesreduced >=10 ppb
Max 1-hrcontribution(ppb)
AL 0% 0 0% 0 0% 0 0% 0 0% 0.1CT/RI 6% 7 6% 51 100% 39 76% 2 3% 10.8FL 0% 0 0% 0 0% 0 0% 0 0% 0.8GA 0% 0 0% 0 0% 0 0% 0 0% 0.3IA 0% 0 0% 0 0% 0 0% 0 0% 0.2IL 0% 1 0% 0 0% 0 0% 0 0% 0.9IN 1% 1 1% 0 0% 0 0% 0 0% 1.6KY 0% 1 0% 0 0% 0 0% 0 0% 0.6LA 0% 0 0% 0 0% 0 0% 0 0% 0MA 56% 67 51% 51 100% 51 100% 51 100% 79MD/DC/DE 3% 4 3% 49 96% 11 21% 0 0% 6.6ME 2% 3 3% 22 43% 6 11% 0 0% 9.6MI 1% 3 2% 1 1% 0 0% 0 0% 3MO 0% 0 0% 0 0% 0 0% 0 0% 0.1MS 0% 0 0% 0 0% 0 0% 0 0% 0NC 2% 3 2% 23 45% 2 3% 0 0% 5.4NH/VT 5% 9 7% 38 74% 20 39% 6 11% 27.9NJ 4% 9 7% 42 82% 20 39% 0 0% 8.6NY 6% 14 11% 48 94% 21 41% 20 39% 16OH 2% 4 3% 30 58% 0 0% 0 0% 4.2PA 5% 10 8% 51 100% 31 60% 1 1% 10.3SC 0% 1 0% 0 0% 0 0% 0 0% 1.9TN 0% 0 0% 0 0% 0 0% 0 0% 0.1TX 0% 0 0% 0 0% 0 0% 0 0% 0VA 3% 6 4% 29 56% 17 33% 2 3% 12.1WI 0% 0 0% 0 0% 0 0% 0 0% 0.2WV 1% 2 2% 25 49% 0 0% 0 0% 2.5West 0% 0 0% 0 0% 0 0% 0 0% 0.3Canada 2% 5 4% 21 41% 15 29% 0 0% 6

I-20
Downwind Nonattainment Area : Rhode_Island ; CAMX Source Apportionment Modeling Contributions to 1-Hr Designated + Modeled Receptors
Base Case: Total Number of Exceedences (grids-hours) = 48Upwind State: Average
percentcontribution(4-episode)
Highest dailyaverage (ppb)
Highest dailyaverage (%)
Number ofexceedencesreduced >= 2ppb
Percentexceedencesreduced >= 2ppb
Number ofexceedencesreduced >= 5ppb
Percentexceedencesreduced >= 5ppb
Number ofexceedencesreduced >=10 ppb
Percentexceedencesreduced >=10 ppb
Max 1-hrcontribution(ppb)
AL 0% 1 1% 0 0% 0 0% 0 0% 1.2CT/RI 5% 7 6% 35 72% 25 52% 10 20% 14.3FL 0% 0 0% 0 0% 0 0% 0 0% 0.6GA 0% 1 1% 0 0% 0 0% 0 0% 1IA 0% 1 1% 0 0% 0 0% 0 0% 0.9IL 1% 5 4% 3 6% 3 6% 0 0% 5.6IN 2% 4 3% 13 27% 0 0% 0 0% 4.7KY 2% 6 5% 11 22% 11 22% 0 0% 6.8LA 0% 0 0% 0 0% 0 0% 0 0% 0.1MA 0% 0 0% 0 0% 0 0% 0 0% 0.2MD/DC/DE 3% 7 5% 36 75% 6 12% 0 0% 7.4ME 0% 0 0% 0 0% 0 0% 0 0% 0MI 1% 5 4% 3 6% 0 0% 0 0% 4.8MO 0% 2 2% 2 4% 0 0% 0 0% 2MS 0% 0 0% 0 0% 0 0% 0 0% 0.3NC 2% 2 2% 21 43% 0 0% 0 0% 4.4NH/VT 0% 0 0% 0 0% 0 0% 0 0% 0NJ 30% 38 29% 48 100% 48 100% 48 100% 47.7NY 24% 37 26% 48 100% 48 100% 48 100% 44.7OH 6% 8 6% 48 100% 39 81% 1 2% 10.3PA 12% 20 16% 48 100% 48 100% 48 100% 22.4SC 0% 1 0% 0 0% 0 0% 0 0% 0.6TN 0% 2 1% 4 8% 0 0% 0 0% 2.5TX 0% 0 0% 0 0% 0 0% 0 0% 0.1VA 7% 13 10% 34 70% 33 68% 20 41% 18.1WI 0% 1 1% 0 0% 0 0% 0 0% 1.2WV 4% 6 4% 44 91% 19 39% 0 0% 8.1West 0% 1 0% 0 0% 0 0% 0 0% 0.7Canada 0% 1 1% 0 0% 0 0% 0 0% 1

I-21
Downwind Nonattainment Area : St_Louis ; CAMX Source Apportionment Modeling Contributions to 1-Hr Designated + Modeled Receptors
Base Case: Total Number of Exceedences (grids-hours) = 14Upwind State: Average
percentcontribution(4-episode)
Highest dailyaverage (ppb)
Highest dailyaverage (%)
Number ofexceedencesreduced >= 2ppb
Percentexceedencesreduced >= 2ppb
Number ofexceedencesreduced >= 5ppb
Percentexceedencesreduced >= 5ppb
Number ofexceedencesreduced >=10 ppb
Percentexceedencesreduced >=10 ppb
Max 1-hrcontribution(ppb)
AL 4% 5 4% 11 78% 11 78% 0 0% 5.8CT/RI 0% 0 0% 0 0% 0 0% 0 0% 0FL 0% 0 0% 0 0% 0 0% 0 0% 0GA 2% 3 2% 11 78% 0 0% 0 0% 3.2IA 0% 0 0% 0 0% 0 0% 0 0% 0IL 18% 21 16% 14 100% 12 85% 8 57% 39IN 1% 6 4% 3 21% 3 21% 0 0% 5.9KY 1% 5 4% 3 21% 2 14% 0 0% 5.1LA 0% 0 0% 0 0% 0 0% 0 0% 0MA 0% 0 0% 0 0% 0 0% 0 0% 0MD/DC/DE 0% 0 0% 0 0% 0 0% 0 0% 0.3ME 0% 0 0% 0 0% 0 0% 0 0% 0MI 0% 1 1% 0 0% 0 0% 0 0% 1.3MO 65% 81 64% 14 100% 14 100% 14 100% 82.6MS 0% 1 0% 0 0% 0 0% 0 0% 0.6NC 1% 2 1% 0 0% 0 0% 0 0% 2NH/VT 0% 0 0% 0 0% 0 0% 0 0% 0NJ 0% 0 0% 0 0% 0 0% 0 0% 0.2NY 0% 0 0% 0 0% 0 0% 0 0% 0.2OH 1% 3 2% 3 21% 0 0% 0 0% 2.7PA 0% 0 0% 0 0% 0 0% 0 0% 0.5SC 2% 2 2% 11 78% 0 0% 0 0% 2.2TN 3% 3 3% 11 78% 0 0% 0 0% 3.6TX 0% 0 0% 0 0% 0 0% 0 0% 0VA 0% 0 0% 0 0% 0 0% 0 0% 0.4WI 0% 0 0% 0 0% 0 0% 0 0% 0WV 0% 0 0% 0 0% 0 0% 0 0% 0.1West 0% 0 0% 0 0% 0 0% 0 0% 0.6Canada 0% 0 0% 0 0% 0 0% 0 0% 0.2

I-22
Downwind Nonattainment Area : SW_Michigan ; CAMX Source Apportionment Modeling Contributions to 1-Hr Designated + Modeled Receptors
Base Case: Total Number of Exceedences (grids-hours) = 195Upwind State: Average
percentcontribution(4-episode)
Highest dailyaverage (ppb)
Highest dailyaverage (%)
Number ofexceedencesreduced >= 2ppb
Percentexceedencesreduced >= 2ppb
Number ofexceedencesreduced >= 5ppb
Percentexceedencesreduced >= 5ppb
Number ofexceedencesreduced >=10 ppb
Percentexceedencesreduced >=10 ppb
Max 1-hrcontribution(ppb)
AL 0% 0 0% 0 0% 0 0% 0 0% 0CT/RI 0% NA NA 0 0% 0 0% 0 0% 0FL 0% NA NA 0 0% 0 0% 0 0% 0GA 0% NA NA 0 0% 0 0% 0 0% 0IA 0% 1 0% 0 0% 0 0% 0 0% 1.7IL 54% 57 43% 195 100% 195 100% 195 100% 78.1IN 10% 14 11% 154 78% 112 57% 75 38% 32.7KY 1% 2 1% 17 8% 0 0% 0 0% 3.3LA 0% 0 0% 0 0% 0 0% 0 0% 0.1MA 0% NA NA 0 0% 0 0% 0 0% 0MD/DC/DE 0% NA NA 0 0% 0 0% 0 0% 0ME 0% NA NA 0 0% 0 0% 0 0% 0MI 1% 1 1% 21 10% 4 2% 0 0% 5.9MO 12% 12 9% 195 100% 195 100% 184 94% 16.4MS 0% 0 0% 0 0% 0 0% 0 0% 0.1NC 0% NA NA 0 0% 0 0% 0 0% 0NH/VT 0% NA NA 0 0% 0 0% 0 0% 0NJ 0% NA NA 0 0% 0 0% 0 0% 0NY 0% NA NA 0 0% 0 0% 0 0% 0OH 0% NA NA 0 0% 0 0% 0 0% 0PA 0% NA NA 0 0% 0 0% 0 0% 0SC 0% NA NA 0 0% 0 0% 0 0% 0TN 0% 0 0% 0 0% 0 0% 0 0% 0.7TX 3% 4 3% 123 63% 0 0% 0 0% 4.8VA 0% NA NA 0 0% 0 0% 0 0% 0WI 3% 4 3% 66 33% 34 17% 16 8% 18.3WV 0% NA NA 0 0% 0 0% 0 0% 0West 16% 18 14% 195 100% 195 100% 185 94% 21Canada 0% NA NA 0 0% 0 0% 0 0% 0

I-23
Downwind Nonattainment Area : Western_Massachusetts ; CAMX Source Apportionment Modeling Contributions to 1-Hr Designated + Modeled Receptors
Base Case: Total Number of Exceedences (grids-hours) = 22Upwind State: Average
percentcontribution(4-episode)
Highest dailyaverage (ppb)
Highest dailyaverage (%)
Number ofexceedencesreduced >= 2ppb
Percentexceedencesreduced >= 2ppb
Number ofexceedencesreduced >= 5ppb
Percentexceedencesreduced >= 5ppb
Number ofexceedencesreduced >=10 ppb
Percentexceedencesreduced >=10 ppb
Max 1-hrcontribution(ppb)
AL 0% 0 0% 0 0% 0 0% 0 0% 0.1CT/RI 35% 50 39% 22 100% 22 100% 22 100% 61.4FL 0% 1 1% 0 0% 0 0% 0 0% 1.3GA 0% 0 0% 0 0% 0 0% 0 0% 0.4IA 0% 0 0% 0 0% 0 0% 0 0% 0IL 0% 0 0% 0 0% 0 0% 0 0% 0.2IN 0% 0 0% 0 0% 0 0% 0 0% 0.4KY 0% 1 1% 0 0% 0 0% 0 0% 1.3LA 0% 0 0% 0 0% 0 0% 0 0% 0.1MA 6% 44 34% 8 36% 6 27% 4 18% 46.3MD/DC/DE 3% 4 3% 22 100% 1 4% 0 0% 5.1ME 0% 0 0% 0 0% 0 0% 0 0% 0MI 1% 3 2% 10 45% 0 0% 0 0% 3.5MO 0% 0 0% 0 0% 0 0% 0 0% 0MS 0% 0 0% 0 0% 0 0% 0 0% 0.1NC 1% 4 3% 8 36% 0 0% 0 0% 4.3NH/VT 0% 0 0% 0 0% 0 0% 0 0% 0.6NJ 16% 23 17% 22 100% 22 100% 22 100% 30.3NY 18% 23 18% 22 100% 22 100% 22 100% 25.7OH 1% 3 2% 8 36% 0 0% 0 0% 4.1PA 7% 12 10% 22 100% 20 90% 7 31% 14.3SC 0% 1 1% 0 0% 0 0% 0 0% 1.4TN 0% 0 0% 0 0% 0 0% 0 0% 0.2TX 0% 0 0% 0 0% 0 0% 0 0% 0VA 4% 7 5% 21 95% 8 36% 0 0% 8.2WI 0% 0 0% 0 0% 0 0% 0 0% 0.2WV 2% 7 5% 8 36% 8 36% 0 0% 7.1West 0% 0 0% 0 0% 0 0% 0 0% 0.1Canada 4% 7 6% 12 54% 12 54% 0 0% 9

APPENDIX JEVALUATION OF CONTRIBUTIONS -- TABLES OF METRICS8-HOUR UAM-V: UPWIND STATES TO DOWNWIND STATES

J-1
The tables in this Appendix contain information on the UAM-V metrics used for theevaluation of contributions. Tables are provided only for those States with exceedencesin the Base Case. The headings in the table relate to the metrics as follows:
Percent total ppb reduced >= 85 ppb Metric 3Percent pop-wgt total ppb reduced >= 85 ppb Metric 4Number of exceedences reduced >= 2 ppb Metrics 1 & 2Percent exceedences reduced >= 2 ppb Metrics 1 & 2Number of exceedences reduced >= 5 ppb Metrics 1 & 2Percent exceedences reduced >= 5 ppb Metrics 1 & 2Number of exceedences reduced >= 10 ppb Metrics 1 & 2Percent exceedences reduced >= 10 ppb Metrics 1 & 2max 8-hr contribution, ppb Metric 2
(Note: Some of the maximum contribution values may appear to be inconsistent with thenumber of exceedences above a certain cut-point. For example, a contribution of9.999........ is interpreted as being less that 10 ppb for the purpose of counting thenumber of exceedence reduced; however, this value is rounded to 10 ppb in thepresentation of maximum "ppb" contribution in these tables.)
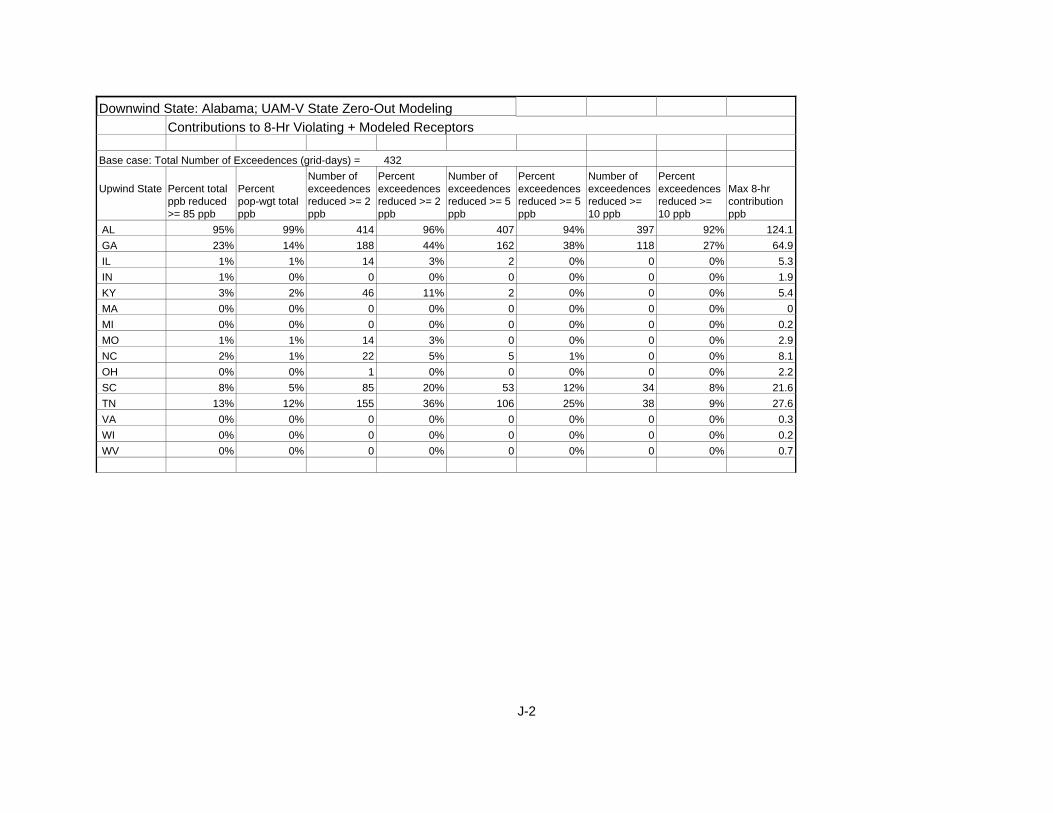
J-2
Downwind State: Alabama; UAM-V State Zero-Out ModelingContributions to 8-Hr Violating + Modeled Receptors
Base case: Total Number of Exceedences (grid-days) = 432
Upwind State
Percent totalppb reduced>= 85 ppb
Percentpop-wgt totalppb
Number ofexceedencesreduced >= 2ppb
Percentexceedencesreduced >= 2ppb
Number ofexceedencesreduced >= 5ppb
Percentexceedencesreduced >= 5ppb
Number ofexceedencesreduced >=10 ppb
Percentexceedencesreduced >=10 ppb
Max 8-hrcontributionppb
AL 95% 99% 414 96% 407 94% 397 92% 124.1 GA 23% 14% 188 44% 162 38% 118 27% 64.9 IL 1% 1% 14 3% 2 0% 0 0% 5.3 IN 1% 0% 0 0% 0 0% 0 0% 1.9 KY 3% 2% 46 11% 2 0% 0 0% 5.4 MA 0% 0% 0 0% 0 0% 0 0% 0 MI 0% 0% 0 0% 0 0% 0 0% 0.2 MO 1% 1% 14 3% 0 0% 0 0% 2.9 NC 2% 1% 22 5% 5 1% 0 0% 8.1 OH 0% 0% 1 0% 0 0% 0 0% 2.2 SC 8% 5% 85 20% 53 12% 34 8% 21.6 TN 13% 12% 155 36% 106 25% 38 9% 27.6 VA 0% 0% 0 0% 0 0% 0 0% 0.3 WI 0% 0% 0 0% 0 0% 0 0% 0.2 WV 0% 0% 0 0% 0 0% 0 0% 0.7

J-3
Downwind State: Arkansas; UAM-V State Zero-Out ModelingContributions to 8-Hr Violating + Modeled Receptors
Base case: Total Number of Exceedences (grid-days) = 47
Upwind State
Percent totalppb reduced>= 85 ppb
Percentpop-wgt totalppb
Number ofexceedencesreduced >= 2ppb
Percentexceedencesreduced >= 2ppb
Number ofexceedencesreduced >= 5ppb
Percentexceedencesreduced >= 5ppb
Number ofexceedencesreduced >=10 ppb
Percentexceedencesreduced >=10 ppb
Max 8-hrcontributionppb
AL 7% 6% 14 30% 1 2% 0 0% 5.6 GA 6% 6% 8 17% 4 9% 0 0% 7.2 IL 4% 6% 5 11% 0 0% 0 0% 4.1 IN 0% 0% 0 0% 0 0% 0 0% 0.4 KY 3% 3% 1 2% 0 0% 0 0% 3.6 MA 0% 0% 0 0% 0 0% 0 0% 0 MI 0% 0% 0 0% 0 0% 0 0% 0.9 MO 4% 9% 5 11% 3 6% 0 0% 6.5 NC 6% 9% 10 21% 2 4% 0 0% 5.2 OH 0% 0% 0 0% 0 0% 0 0% 1.3 SC 5% 6% 10 21% 0 0% 0 0% 3.5 TN 100% 100% 47 100% 47 100% 47 100% 84.2 VA 0% 0% 0 0% 0 0% 0 0% 0.6 WI 0% 0% 0 0% 0 0% 0 0% 0 WV 0% 0% 0 0% 0 0% 0 0% 0.6

J-4
Downwind State: Connecticut; UAM-V State Zero-Out ModelingContributions to 8-Hr Violating + Modeled Receptors
Base case: Total Number of Exceedences (grid-days) = 617
Upwind State
Percent totalppb reduced>= 85 ppb
Percentpop-wgt totalppb
Number ofexceedencesreduced >= 2ppb
Percentexceedencesreduced >= 2ppb
Number ofexceedencesreduced >= 5ppb
Percentexceedencesreduced >= 5ppb
Number ofexceedencesreduced >=10 ppb
Percentexceedencesreduced >=10 ppb
Max 8-hrcontributionppb
AL 0% 0% 0 0% 0 0% 0 0% 0.5 GA 0% 0% 0 0% 0 0% 0 0% 0.3 IL 2% 1% 21 3% 0 0% 0 0% 3.7 IN 1% 1% 7 1% 0 0% 0 0% 3.6 KY 0% 0% 0 0% 0 0% 0 0% 1.8 MA 0% 0% 1 0% 0 0% 0 0% 3.4 MI 2% 2% 22 4% 0 0% 0 0% 4.2 MO 1% 0% 0 0% 0 0% 0 0% 1.6 NC 2% 1% 19 3% 0 0% 0 0% 3.5 OH 5% 4% 127 21% 11 2% 0 0% 6.5 SC 0% 0% 0 0% 0 0% 0 0% 1.3 TN 0% 0% 0 0% 0 0% 0 0% 0.7 VA 6% 6% 147 24% 16 3% 0 0% 8.9 WI 1% 1% 0 0% 0 0% 0 0% 1.2 WV 5% 5% 137 22% 22 4% 0 0% 6.9

J-5
Downwind State: Delaware; UAM-V State Zero-Out ModelingContributions to 8-Hr Violating + Modeled Receptors
Base case: Total Number of Exceedences (grid-days) = 361
Upwind State
Percent totalppb reduced>= 85 ppb
Percentpop-wgt totalppb
Number ofexceedencesreduced >= 2ppb
Percentexceedencesreduced >= 2ppb
Number ofexceedencesreduced >= 5ppb
Percentexceedencesreduced >= 5ppb
Number ofexceedencesreduced >=10 ppb
Percentexceedencesreduced >=10 ppb
Max 8-hrcontributionppb
AL 1% 1% 0 0% 0 0% 0 0% 1 GA 1% 1% 0 0% 0 0% 0 0% 1.2 IL 6% 4% 20 6% 0 0% 0 0% 2.9 IN 7% 4% 32 9% 0 0% 0 0% 3.2 KY 7% 5% 43 12% 0 0% 0 0% 4.1 MA 0% 0% 0 0% 0 0% 0 0% 0.1 MI 5% 6% 39 11% 4 1% 0 0% 7.4 MO 2% 1% 0 0% 0 0% 0 0% 0.9 NC 8% 7% 60 17% 27 7% 7 2% 21.6 OH 19% 15% 183 51% 21 6% 0 0% 6.2 SC 1% 1% 0 0% 0 0% 0 0% 1.2 TN 4% 3% 22 6% 0 0% 0 0% 2.7 VA 60% 54% 282 78% 221 61% 144 40% 33.6 WI 1% 1% 0 0% 0 0% 0 0% 1.1 WV 33% 29% 239 66% 125 35% 26 7% 15.1

J-6
Downwind State: District of Columbia; UAM-V State Zero-Out ModelingContributions to 8-Hr Violating + Modeled Receptors
Base case: Total Number of Exceedences (grid-days) = 11
Upwind State
Percent totalppb reduced>= 85 ppb
Percentpop-wgt totalppb
Number ofexceedencesreduced >= 2ppb
Percentexceedencesreduced >= 2ppb
Number ofexceedencesreduced >= 5ppb
Percentexceedencesreduced >= 5ppb
Number ofexceedencesreduced >=10 ppb
Percentexceedencesreduced >=10 ppb
Max 8-hrcontributionppb
AL 1% 1% 1 9% 0 0% 0 0% 2.8 GA 1% 1% 0 0% 0 0% 0 0% 0.9 IL 3% 3% 1 9% 0 0% 0 0% 2.5 IN 3% 3% 0 0% 0 0% 0 0% 1.8 KY 6% 6% 3 27% 0 0% 0 0% 4 MA 0% 0% 0 0% 0 0% 0 0% 0 MI 3% 3% 2 18% 0 0% 0 0% 3.2 MO 1% 1% 0 0% 0 0% 0 0% 1.1 NC 2% 2% 0 0% 0 0% 0 0% 1.1 OH 11% 11% 5 45% 2 18% 0 0% 5.4 SC 0% 0% 0 0% 0 0% 0 0% 0.4 TN 3% 3% 1 9% 0 0% 0 0% 2.1 VA 59% 59% 9 82% 8 73% 8 73% 54.2 WI 1% 1% 0 0% 0 0% 0 0% 1.6 WV 20% 20% 5 45% 5 45% 2 18% 18

J-7
Downwind State: Florida; UAM-V State Zero-Out ModelingContributions to 8-Hr Violating + Modeled Receptors
Base case: Total Number of Exceedences (grid-days) = 63
Upwind State
Percent totalppb reduced>= 85 ppb
Percentpop-wgt totalppb
Number ofexceedencesreduced >= 2ppb
Percentexceedencesreduced >= 2ppb
Number ofexceedencesreduced >= 5ppb
Percentexceedencesreduced >= 5ppb
Number ofexceedencesreduced >=10 ppb
Percentexceedencesreduced >=10 ppb
Max 8-hrcontributionppb
AL 71% 54% 60 95% 47 75% 29 46% 37.8 GA 3% 2% 0 0% 0 0% 0 0% 1.4 IL 0% 0% 0 0% 0 0% 0 0% 0 IN 0% 0% 0 0% 0 0% 0 0% 0 KY 0% 0% 0 0% 0 0% 0 0% 0 MA 0% 0% 0 0% 0 0% 0 0% 0 MI 0% 0% 0 0% 0 0% 0 0% 0 MO 1% 1% 0 0% 0 0% 0 0% 0.5 NC 0% 0% 0 0% 0 0% 0 0% 0.1 OH 0% 0% 0 0% 0 0% 0 0% 0 SC 0% 0% 0 0% 0 0% 0 0% 0.1 TN 1% 1% 0 0% 0 0% 0 0% 0.8 VA 0% 0% 0 0% 0 0% 0 0% 0 WI 0% 0% 0 0% 0 0% 0 0% 0 WV 0% 0% 0 0% 0 0% 0 0% 0.1

J-8
Downwind State: Georgia; UAM-V State Zero-Out ModelingContributions to 8-Hr Violating + Modeled Receptors
Base case: Total Number of Exceedences (grid-days) = 504
Upwind State
Percent totalppb reduced>= 85 ppb
Percentpop-wgt totalppb
Number ofexceedencesreduced >= 2ppb
Percentexceedencesreduced >= 2ppb
Number ofexceedencesreduced >= 5ppb
Percentexceedencesreduced >= 5ppb
Number ofexceedencesreduced >=10 ppb
Percentexceedencesreduced >=10 ppb
Max 8-hrcontributionppb
AL 15% 11% 248 49% 168 33% 77 15% 32.6 GA 100% 100% 504 100% 504 100% 500 99% 166.3 IL 1% 1% 14 3% 0 0% 0 0% 2.9 IN 0% 0% 0 0% 0 0% 0 0% 2 KY 3% 2% 51 10% 25 5% 12 2% 14.9 MA 0% 0% 0 0% 0 0% 0 0% 0 MI 0% 0% 0 0% 0 0% 0 0% 0 MO 1% 1% 1 0% 0 0% 0 0% 2.1 NC 2% 2% 45 9% 10 2% 0 0% 6.6 OH 0% 0% 0 0% 0 0% 0 0% 0.6 SC 8% 6% 129 26% 72 14% 67 13% 41.4 TN 9% 7% 203 40% 91 18% 25 5% 14.6 VA 0% 0% 0 0% 0 0% 0 0% 0.8 WI 0% 0% 0 0% 0 0% 0 0% 0.1 WV 0% 0% 0 0% 0 0% 0 0% 1.1

J-9
Downwind State: Illinois; UAM-V State Zero-Out ModelingContributions to 8-Hr Violating + Modeled Receptors
Base case: Total Number of Exceedences (grid-days) = 251
Upwind State
Percent totalppb reduced>= 85 ppb
Percentpop-wgt totalppb
Number ofexceedencesreduced >= 2ppb
Percentexceedencesreduced >= 2ppb
Number ofexceedencesreduced >= 5ppb
Percentexceedencesreduced >= 5ppb
Number ofexceedencesreduced >=10 ppb
Percentexceedencesreduced >=10 ppb
Max 8-hrcontributionppb
AL 4% 2% 24 10% 0 0% 0 0% 4.6 GA 4% 3% 19 8% 0 0% 0 0% 3.2 IL 92% 97% 247 98% 241 96% 226 90% 82.1 IN 7% 8% 35 14% 23 9% 7 3% 30.6 KY 7% 7% 35 14% 21 8% 0 0% 8.4 MA 0% 0% 0 0% 0 0% 0 0% 0 MI 1% 0% 1 0% 0 0% 0 0% 2 MO 66% 36% 216 86% 178 71% 130 52% 71.1 NC 2% 1% 0 0% 0 0% 0 0% 1.3 OH 2% 2% 2 1% 1 0% 0 0% 5.6 SC 2% 1% 0 0% 0 0% 0 0% 1.3 TN 7% 4% 36 14% 11 4% 6 2% 23.6 VA 0% 0% 0 0% 0 0% 0 0% 0.6 WI 0% 0% 0 0% 0 0% 0 0% 0.3 WV 2% 2% 1 0% 0 0% 0 0% 2

J-10
Downwind State: Indiana; UAM-V State Zero-Out ModelingContributions to 8-Hr Violating + Modeled Receptors
Base case: Total Number of Exceedences (grid-days) = 522
Upwind State
Percent totalppb reduced>= 85 ppb
Percentpop-wgt totalppb
Number ofexceedencesreduced >= 2ppb
Percentexceedencesreduced >= 2ppb
Number ofexceedencesreduced >= 5ppb
Percentexceedencesreduced >= 5ppb
Number ofexceedencesreduced >=10 ppb
Percentexceedencesreduced >=10 ppb
Max 8-hrcontributionppb
AL 8% 7% 76 15% 14 3% 2 0% 10.9 GA 8% 9% 73 14% 7 1% 4 1% 11.7 IL 19% 16% 160 31% 69 13% 37 7% 40.5 IN 73% 75% 468 90% 428 82% 380 73% 49.1 KY 70% 64% 445 85% 357 68% 233 45% 64.4 MA 0% 0% 0 0% 0 0% 0 0% 0 MI 1% 1% 1 0% 0 0% 0 0% 2.1 MO 5% 5% 65 12% 19 4% 0 0% 9 NC 8% 9% 52 10% 0 0% 0 0% 4.8 OH 5% 4% 42 8% 5 1% 3 1% 13.7 SC 6% 7% 20 4% 2 0% 0 0% 5.5 TN 38% 36% 339 65% 168 32% 77 15% 33.3 VA 4% 4% 10 2% 0 0% 0 0% 3.5 WI 0% 0% 0 0% 0 0% 0 0% 0.9 WV 6% 6% 58 11% 6 1% 0 0% 7.9

J-11
Downwind State: Kentucky; UAM-V State Zero-Out ModelingContributions to 8-Hr Violating + Modeled Receptors
Base case: Total Number of Exceedences (grid-days) = 766
Upwind State
Percent totalppb reduced>= 85 ppb
Percentpop-wgt totalppb
Number ofexceedencesreduced >= 2ppb
Percentexceedencesreduced >= 2ppb
Number ofexceedencesreduced >= 5ppb
Percentexceedencesreduced >= 5ppb
Number ofexceedencesreduced >=10 ppb
Percentexceedencesreduced >=10 ppb
Max 8-hrcontributionppb
AL 7% 6% 115 15% 64 8% 22 3% 19.8 GA 6% 5% 86 11% 10 1% 0 0% 8.9 IL 7% 7% 125 16% 43 6% 5 1% 18.4 IN 40% 44% 484 63% 376 49% 214 28% 30.9 KY 90% 88% 744 97% 703 92% 618 81% 67.6 MA 0% 0% 0 0% 0 0% 0 0% 0 MI 1% 1% 15 2% 15 2% 4 1% 12.5 MO 4% 3% 64 8% 14 2% 0 0% 7 NC 6% 7% 88 11% 10 1% 0 0% 9.2 OH 11% 11% 133 17% 105 14% 70 9% 39.8 SC 3% 3% 13 2% 0 0% 0 0% 4.3 TN 35% 35% 431 56% 304 40% 198 26% 67.8 VA 2% 3% 7 1% 0 0% 0 0% 3.8 WI 0% 0% 0 0% 0 0% 0 0% 1.1 WV 5% 4% 62 8% 29 4% 18 2% 52.3

J-12
Downwind State: Louisiana; UAM-V State Zero-Out ModelingContributions to 8-Hr Violating + Modeled Receptors
Base case: Total Number of Exceedences (grid-days) = 504
Upwind State
Percent totalppb reduced>= 85 ppb
Percentpop-wgt totalppb
Number ofexceedencesreduced >= 2ppb
Percentexceedencesreduced >= 2ppb
Number ofexceedencesreduced >= 5ppb
Percentexceedencesreduced >= 5ppb
Number ofexceedencesreduced >=10 ppb
Percentexceedencesreduced >=10 ppb
Max 8-hrcontributionppb
AL 14% 13% 133 26% 85 17% 45 9% 28.8 GA 2% 2% 24 5% 0 0% 0 0% 2.8 IL 1% 1% 0 0% 0 0% 0 0% 1.4 IN 1% 1% 0 0% 0 0% 0 0% 1.4 KY 1% 1% 0 0% 0 0% 0 0% 1.6 MA 0% 0% 0 0% 0 0% 0 0% 0 MI 0% 0% 0 0% 0 0% 0 0% 0.1 MO 2% 2% 0 0% 0 0% 0 0% 1.7 NC 0% 0% 0 0% 0 0% 0 0% 0.1 OH 0% 0% 0 0% 0 0% 0 0% 0 SC 0% 0% 0 0% 0 0% 0 0% 0.1 TN 5% 6% 57 11% 2 0% 0 0% 5.3 VA 0% 0% 0 0% 0 0% 0 0% 0.1 WI 0% 0% 0 0% 0 0% 0 0% 0.2 WV 0% 0% 0 0% 0 0% 0 0% 0.1

J-13
Downwind State: Maine; UAM-V State Zero-Out ModelingContributions to 8-Hr Violating + Modeled Receptors
Base case: Total Number of Exceedences (grid-days) = 236
Upwind State
Percent totalppb reduced>= 85 ppb
Percentpop-wgt totalppb
Number ofexceedencesreduced >= 2ppb
Percentexceedencesreduced >= 2ppb
Number ofexceedencesreduced >= 5ppb
Percentexceedencesreduced >= 5ppb
Number ofexceedencesreduced >=10 ppb
Percentexceedencesreduced >=10 ppb
Max 8-hrcontributionppb
AL 0% 0% 0 0% 0 0% 0 0% 0.1 GA 0% 0% 0 0% 0 0% 0 0% 0.1 IL 1% 1% 0 0% 0 0% 0 0% 1.1 IN 2% 1% 0 0% 0 0% 0 0% 1.1 KY 0% 0% 0 0% 0 0% 0 0% 0.3 MA 95% 94% 229 97% 217 92% 193 82% 50.5 MI 5% 4% 1 0% 0 0% 0 0% 2.8 MO 0% 0% 0 0% 0 0% 0 0% 0.4 NC 3% 2% 11 5% 0 0% 0 0% 3.4 OH 4% 3% 0 0% 0 0% 0 0% 1.8 SC 1% 1% 0 0% 0 0% 0 0% 1.1 TN 0% 0% 0 0% 0 0% 0 0% 0.1 VA 8% 6% 37 16% 6 3% 0 0% 5.5 WI 1% 0% 0 0% 0 0% 0 0% 0.8 WV 2% 2% 0 0% 0 0% 0 0% 1.2

J-14
Downwind State: Maryland; UAM-V State Zero-Out ModelingContributions to 8-Hr Violating + Modeled Receptors
Base case: Total Number of Exceedences (grid-days) = 1221
Upwind State
Percent totalppb reduced>= 85 ppb
Percentpop-wgt totalppb
Number ofexceedencesreduced >= 2ppb
Percentexceedencesreduced >= 2ppb
Number ofexceedencesreduced >= 5ppb
Percentexceedencesreduced >= 5ppb
Number ofexceedencesreduced >=10 ppb
Percentexceedencesreduced >=10 ppb
Max 8-hrcontributionppb
AL 1% 0% 13 1% 0 0% 0 0% 3 GA 1% 0% 1 0% 0 0% 0 0% 2.4 IL 3% 2% 26 2% 0 0% 0 0% 2.5 IN 4% 2% 101 8% 0 0% 0 0% 4.9 KY 4% 3% 153 13% 8 1% 0 0% 6.3 MA 0% 0% 0 0% 0 0% 0 0% 0.2 MI 4% 3% 142 12% 22 2% 0 0% 7.1 MO 1% 0% 0 0% 0 0% 0 0% 1.1 NC 5% 4% 157 13% 90 7% 46 4% 26.9 OH 10% 8% 508 42% 126 10% 0 0% 8 SC 1% 0% 9 1% 2 0% 0 0% 5.6 TN 2% 1% 43 4% 0 0% 0 0% 3.3 VA 57% 52% 991 81% 878 72% 694 57% 62.6 WI 1% 1% 0 0% 0 0% 0 0% 1.5 WV 17% 14% 579 47% 391 32% 133 11% 23.1

J-15
Downwind State: Massachusetts; UAM-V State Zero-Out ModelingContributions to 8-Hr Violating + Modeled Receptors
Base case: Total Number of Exceedences (grid-days) = 584
Upwind State
Percent totalppb reduced>= 85 ppb
Percentpop-wgt totalppb
Number ofexceedencesreduced >= 2ppb
Percentexceedencesreduced >= 2ppb
Number ofexceedencesreduced >= 5ppb
Percentexceedencesreduced >= 5ppb
Number ofexceedencesreduced >=10 ppb
Percentexceedencesreduced >=10 ppb
Max 8-hrcontributionppb
AL 0% 0% 0 0% 0 0% 0 0% 0.5 GA 0% 0% 0 0% 0 0% 0 0% 0.8 IL 1% 1% 8 1% 0 0% 0 0% 3.5 IN 1% 1% 1 0% 0 0% 0 0% 2.8 KY 1% 0% 0 0% 0 0% 0 0% 1.2 MA 53% 71% 344 59% 303 52% 257 44% 93.3 MI 3% 3% 21 4% 2 0% 0 0% 5.1 MO 0% 0% 0 0% 0 0% 0 0% 1.4 NC 2% 1% 9 2% 1 0% 0 0% 7.2 OH 4% 2% 35 6% 0 0% 0 0% 3.5 SC 0% 0% 2 0% 0 0% 0 0% 2.2 TN 0% 0% 0 0% 0 0% 0 0% 0.4 VA 6% 4% 79 14% 28 5% 2 0% 13.1 WI 1% 1% 0 0% 0 0% 0 0% 1.2 WV 4% 3% 108 18% 4 1% 0 0% 5.8

J-16
Downwind State: Michigan; UAM-V State Zero-Out ModelingContributions to 8-Hr Violating + Modeled Receptors
Base case: Total Number of Exceedences (grid-days) = 583
Upwind State
Percent totalppb reduced>= 85 ppb
Percentpop-wgt totalppb
Number ofexceedencesreduced >= 2ppb
Percentexceedencesreduced >= 2ppb
Number ofexceedencesreduced >= 5ppb
Percentexceedencesreduced >= 5ppb
Number ofexceedencesreduced >=10 ppb
Percentexceedencesreduced >=10 ppb
Max 8-hrcontributionppb
AL 5% 5% 60 10% 0 0% 0 0% 4.5 GA 4% 4% 43 7% 0 0% 0 0% 2.9 IL 78% 50% 499 86% 476 82% 367 63% 61.4 IN 43% 44% 396 68% 281 48% 201 34% 36 KY 10% 13% 141 24% 37 6% 0 0% 8.1 MA 0% 0% 0 0% 0 0% 0 0% 0 MI 23% 67% 213 37% 157 27% 135 23% 76 MO 22% 13% 335 57% 120 21% 0 0% 9.2 NC 2% 2% 0 0% 0 0% 0 0% 1.6 OH 6% 13% 91 16% 24 4% 20 3% 23.4 SC 2% 2% 0 0% 0 0% 0 0% 1.4 TN 10% 10% 151 26% 31 5% 0 0% 7.8 VA 1% 1% 0 0% 0 0% 0 0% 0.8 WI 5% 1% 47 8% 20 3% 8 1% 15.6 WV 3% 4% 3 1% 0 0% 0 0% 2.2

J-17
Downwind State: Missouri; UAM-V State Zero-Out ModelingContributions to 8-Hr Violating + Modeled Receptors
Base case: Total Number of Exceedences (grid-days) = 78
Upwind State
Percent totalppb reduced>= 85 ppb
Percentpop-wgt totalppb
Number ofexceedencesreduced >= 2ppb
Percentexceedencesreduced >= 2ppb
Number ofexceedencesreduced >= 5ppb
Percentexceedencesreduced >= 5ppb
Number ofexceedencesreduced >=10 ppb
Percentexceedencesreduced >=10 ppb
Max 8-hrcontributionppb
AL 10% 9% 16 21% 6 8% 1 1% 10.1 GA 6% 6% 10 13% 0 0% 0 0% 2.9 IL 28% 22% 45 58% 31 40% 8 10% 16.3 IN 6% 5% 6 8% 5 6% 0 0% 8.6 KY 11% 10% 24 31% 0 0% 0 0% 4.5 MA 0% 0% 0 0% 0 0% 0 0% 0 MI 1% 1% 0 0% 0 0% 0 0% 0.9 MO 98% 99% 77 99% 77 99% 73 94% 76.8 NC 3% 3% 0 0% 0 0% 0 0% 1.3 OH 3% 3% 1 1% 0 0% 0 0% 2.2 SC 2% 2% 0 0% 0 0% 0 0% 1.3 TN 21% 15% 21 27% 14 18% 10 13% 19.2 VA 1% 1% 0 0% 0 0% 0 0% 0.4 WI 0% 0% 0 0% 0 0% 0 0% 0 WV 2% 1% 0 0% 0 0% 0 0% 0.6

J-18
Downwind State: Mississippi; UAM-V State Zero-Out ModelingContributions to 8-Hr Violating + Modeled Receptors
Base case: Total Number of Exceedences (grid-days) = 63
Upwind State
Percent totalppb reduced>= 85 ppb
Percentpop-wgt totalppb
Number ofexceedencesreduced >= 2ppb
Percentexceedencesreduced >= 2ppb
Number ofexceedencesreduced >= 5ppb
Percentexceedencesreduced >= 5ppb
Number ofexceedencesreduced >=10 ppb
Percentexceedencesreduced >=10 ppb
Max 8-hrcontributionppb
AL 30% 24% 25 40% 21 33% 14 22% 25.8 GA 4% 3% 6 10% 0 0% 0 0% 2.8 IL 4% 5% 3 5% 0 0% 0 0% 4.2 IN 1% 0% 0 0% 0 0% 0 0% 0.3 KY 1% 0% 1 2% 0 0% 0 0% 3 MA 0% 0% 0 0% 0 0% 0 0% 0 MI 0% 0% 0 0% 0 0% 0 0% 0.7 MO 12% 16% 15 24% 2 3% 0 0% 5.3 NC 2% 5% 3 5% 1 2% 0 0% 5.2 OH 0% 0% 0 0% 0 0% 0 0% 1.1 SC 1% 3% 0 0% 0 0% 0 0% 1.8 TN 50% 59% 23 37% 23 37% 23 37% 53.6 VA 0% 0% 0 0% 0 0% 0 0% 0.6 WI 0% 0% 0 0% 0 0% 0 0% 0 WV 0% 0% 0 0% 0 0% 0 0% 0.5

J-19
Downwind State: New Hampshire; UAM-V State Zero-Out ModelingContributions to 8-Hr Violating + Modeled Receptors
Base case: Total Number of Exceedences (grid-days) = 131
Upwind State
Percent totalppb reduced>= 85 ppb
Percentpop-wgt totalppb
Number ofexceedencesreduced >= 2ppb
Percentexceedencesreduced >= 2ppb
Number ofexceedencesreduced >= 5ppb
Percentexceedencesreduced >= 5ppb
Number ofexceedencesreduced >=10 ppb
Percentexceedencesreduced >=10 ppb
Max 8-hrcontributionppb
AL 0% 0% 0 0% 0 0% 0 0% 0.2 GA 0% 0% 0 0% 0 0% 0 0% 0.1 IL 1% 1% 0 0% 0 0% 0 0% 0.8 IN 1% 1% 0 0% 0 0% 0 0% 0.7 KY 0% 0% 0 0% 0 0% 0 0% 0.5 MA 87% 85% 115 88% 115 88% 98 75% 68.1 MI 3% 3% 0 0% 0 0% 0 0% 1.8 MO 0% 0% 0 0% 0 0% 0 0% 0.7 NC 0% 0% 0 0% 0 0% 0 0% 0.7 OH 1% 1% 0 0% 0 0% 0 0% 1.6 SC 0% 0% 0 0% 0 0% 0 0% 0.2 TN 0% 0% 0 0% 0 0% 0 0% 0.2 VA 2% 2% 0 0% 0 0% 0 0% 1.4 WI 1% 0% 0 0% 0 0% 0 0% 1.2 WV 1% 1% 3 2% 0 0% 0 0% 2.3

J-20
Downwind State: New Jersey; UAM-V State Zero-Out ModelingContributions to 8-Hr Violating + Modeled Receptors
Base case: Total Number of Exceedences (grid-days) = 1215
Upwind State
Percent totalppb reduced>= 85 ppb
Percentpop-wgt totalppb
Number ofexceedencesreduced >= 2ppb
Percentexceedencesreduced >= 2ppb
Number ofexceedencesreduced >= 5ppb
Percentexceedencesreduced >= 5ppb
Number ofexceedencesreduced >=10 ppb
Percentexceedencesreduced >=10 ppb
Max 8-hrcontributionppb
AL 0% 0% 0 0% 0 0% 0 0% 0.5 GA 0% 0% 0 0% 0 0% 0 0% 0.9 IL 3% 3% 32 3% 0 0% 0 0% 3.1 IN 3% 3% 49 4% 0 0% 0 0% 3.4 KY 3% 2% 82 7% 0 0% 0 0% 3.8 MA 0% 0% 0 0% 0 0% 0 0% 0.2 MI 4% 4% 139 11% 21 2% 0 0% 7.3 MO 1% 1% 0 0% 0 0% 0 0% 0.9 NC 4% 3% 110 9% 38 3% 9 1% 18 OH 10% 9% 458 38% 60 5% 0 0% 8.6 SC 1% 1% 1 0% 0 0% 0 0% 2.2 TN 1% 1% 13 1% 0 0% 0 0% 2.5 VA 19% 14% 614 51% 271 22% 105 9% 32.3 WI 1% 1% 0 0% 0 0% 0 0% 1.6 WV 18% 17% 602 50% 285 23% 64 5% 15

J-21
Downwind State: New York; UAM-V State Zero-Out ModelingContributions to 8-Hr Violating + Modeled Receptors
Base case: Total Number of Exceedences (grid-days) = 770
Upwind State
Percent totalppb reduced>= 85 ppb
Percentpop-wgt totalppb
Number ofexceedencesreduced >= 2ppb
Percentexceedencesreduced >= 2ppb
Number ofexceedencesreduced >= 5ppb
Percentexceedencesreduced >= 5ppb
Number ofexceedencesreduced >=10 ppb
Percentexceedencesreduced >=10 ppb
Max 8-hrcontributionppb
AL 0% 0% 0 0% 0 0% 0 0% 0.9 GA 0% 0% 0 0% 0 0% 0 0% 0.7 IL 2% 2% 69 9% 16 2% 0 0% 7.4 IN 2% 3% 54 7% 5 1% 0 0% 6.4 KY 1% 2% 23 3% 0 0% 0 0% 4 MA 0% 0% 0 0% 0 0% 0 0% 0.2 MI 3% 3% 84 11% 19 2% 0 0% 9.9 MO 1% 1% 0 0% 0 0% 0 0% 1.6 NC 2% 3% 26 3% 0 0% 0 0% 5 OH 5% 9% 158 21% 32 4% 0 0% 7.8 SC 0% 1% 0 0% 0 0% 0 0% 1.4 TN 0% 1% 2 0% 0 0% 0 0% 2.9 VA 8% 10% 259 34% 77 10% 1 0% 10 WI 1% 1% 23 3% 0 0% 0 0% 3.3 WV 7% 12% 200 26% 82 11% 7 1% 12

J-22
Downwind State: North Carolina; UAM-V State Zero-Out ModelingContributions to 8-Hr Violating + Modeled Receptors
Base case: Total Number of Exceedences (grid-days) = 989
Upwind State
Percent totalppb reduced>= 85 ppb
Percentpop-wgt totalppb
Number ofexceedencesreduced >= 2ppb
Percentexceedencesreduced >= 2ppb
Number ofexceedencesreduced >= 5ppb
Percentexceedencesreduced >= 5ppb
Number ofexceedencesreduced >=10 ppb
Percentexceedencesreduced >=10 ppb
Max 8-hrcontributionppb
AL 3% 2% 65 7% 32 3% 1 0% 10.2 GA 6% 6% 118 12% 76 8% 41 4% 18.5 IL 1% 1% 2 0% 0 0% 0 0% 4.3 IN 3% 2% 16 2% 0 0% 0 0% 3.9 KY 8% 6% 212 21% 53 5% 3 0% 13.5 MA 0% 0% 0 0% 0 0% 0 0% 0 MI 2% 1% 32 3% 0 0% 0 0% 3.5 MO 1% 1% 8 1% 0 0% 0 0% 2.6 NC 97% 99% 962 97% 952 96% 937 95% 108.7 OH 7% 4% 155 16% 47 5% 6 1% 11.7 SC 21% 22% 391 40% 249 25% 138 14% 38.2 TN 11% 7% 209 21% 142 14% 65 7% 57.7 VA 22% 16% 532 54% 203 21% 64 6% 33.7 WI 0% 0% 0 0% 0 0% 0 0% 0.4 WV 15% 9% 334 34% 151 15% 36 4% 27.2

J-23
Downwind State: Ohio; UAM-V State Zero-Out ModelingContributions to 8-Hr Violating + Modeled Receptors
Base case: Total Number of Exceedences (grid-days) = 1336
Upwind State
Percent totalppb reduced>= 85 ppb
Percentpop-wgt totalppb
Number ofexceedencesreduced >= 2ppb
Percentexceedencesreduced >= 2ppb
Number ofexceedencesreduced >= 5ppb
Percentexceedencesreduced >= 5ppb
Number ofexceedencesreduced >=10 ppb
Percentexceedencesreduced >=10 ppb
Max 8-hrcontributionppb
AL 8% 8% 122 9% 88 7% 22 2% 14.2 GA 4% 3% 0 0% 0 0% 0 0% 1.8 IL 12% 12% 296 22% 130 10% 3 0% 10.9 IN 32% 31% 750 56% 440 33% 151 11% 21.1 KY 50% 52% 902 68% 668 50% 420 31% 51.1 MA 0% 0% 0 0% 0 0% 0 0% 0 MI 24% 21% 272 20% 243 18% 213 16% 45 MO 2% 3% 48 4% 2 0% 0 0% 5.2 NC 7% 6% 89 7% 4 0% 0 0% 6.6 OH 77% 63% 1221 91% 1158 87% 924 69% 56.3 SC 3% 3% 9 1% 0 0% 0 0% 3 TN 18% 18% 346 26% 193 14% 4 0% 11.3 VA 7% 5% 80 6% 12 1% 0 0% 8.1 WI 1% 1% 13 1% 0 0% 0 0% 4.7 WV 30% 24% 500 37% 396 30% 215 16% 52.6

J-24
Downwind State: Oklahoma; UAM-V State Zero-Out ModelingContributions to 8-Hr Violating + Modeled Receptors
Base case: Total Number of Exceedences (grid-days) = 53
Upwind State
Percent totalppb reduced>= 85 ppb
Percentpop-wgt totalppb
Number ofexceedencesreduced >= 2ppb
Percentexceedencesreduced >= 2ppb
Number ofexceedencesreduced >= 5ppb
Percentexceedencesreduced >= 5ppb
Number ofexceedencesreduced >=10 ppb
Percentexceedencesreduced >=10 ppb
Max 8-hrcontributionppb
AL 5% 2% 10 19% 0 0% 0 0% 3.7 GA 2% 1% 0 0% 0 0% 0 0% 1.3 IL 0% 0% 0 0% 0 0% 0 0% 0.2 IN 0% 0% 0 0% 0 0% 0 0% 0.1 KY 0% 0% 0 0% 0 0% 0 0% 0.2 MA 0% 0% 0 0% 0 0% 0 0% 0 MI 0% 0% 0 0% 0 0% 0 0% 0 MO 2% 2% 1 2% 0 0% 0 0% 2.5 NC 0% 0% 0 0% 0 0% 0 0% 0.4 OH 0% 0% 0 0% 0 0% 0 0% 0 SC 1% 0% 0 0% 0 0% 0 0% 0.5 TN 1% 1% 0 0% 0 0% 0 0% 1.1 VA 0% 0% 0 0% 0 0% 0 0% 0.1 WI 0% 0% 0 0% 0 0% 0 0% 0 WV 0% 0% 0 0% 0 0% 0 0% 0.1

J-25
Downwind State: Pennsylvania; UAM-V State Zero-Out ModelingContributions to 8-Hr Violating + Modeled Receptors
Base case: Total Number of Exceedences (grid-days) = 2042
Upwind State
Percent totalppb reduced>= 85 ppb
Percentpop-wgt totalppb
Number ofexceedencesreduced >= 2ppb
Percentexceedencesreduced >= 2ppb
Number ofexceedencesreduced >= 5ppb
Percentexceedencesreduced >= 5ppb
Number ofexceedencesreduced >=10 ppb
Percentexceedencesreduced >=10 ppb
Max 8-hrcontributionppb
AL 2% 1% 73 4% 0 0% 0 0% 4.9 GA 1% 1% 0 0% 0 0% 0 0% 1 IL 7% 5% 284 14% 46 2% 1 0% 10.2 IN 10% 7% 394 19% 118 6% 1 0% 10.1 KY 13% 9% 568 28% 191 9% 10 0% 11.7 MA 0% 0% 0 0% 0 0% 0 0% 0 MI 7% 6% 263 13% 88 4% 25 1% 23.6 MO 2% 2% 58 3% 0 0% 0 0% 3.9 NC 8% 6% 218 11% 4 0% 0 0% 5.2 OH 33% 22% 1267 62% 687 34% 229 11% 47.6 SC 1% 1% 0 0% 0 0% 0 0% 1.4 TN 5% 3% 88 4% 0 0% 0 0% 3.8 VA 19% 22% 607 30% 249 12% 100 5% 22.9 WI 1% 1% 7 0% 1 0% 0 0% 5.4 WV 47% 34% 1401 69% 1081 53% 622 30% 45.3

J-26
Downwind State: Rhode Island; UAM-V State Zero-Out ModelingContributions to 8-Hr Violating + Modeled Receptors
Base case: Total Number of Exceedences (grid-days) = 60
Upwind State
Percent totalppb reduced>= 85 ppb
Percentpop-wgt totalppb
Number ofexceedencesreduced >= 2ppb
Percentexceedencesreduced >= 2ppb
Number ofexceedencesreduced >= 5ppb
Percentexceedencesreduced >= 5ppb
Number ofexceedencesreduced >=10 ppb
Percentexceedencesreduced >=10 ppb
Max 8-hrcontributionppb
AL 0% 1% 0 0% 0 0% 0 0% 0.3 GA 0% 1% 0 0% 0 0% 0 0% 0.2 IL 4% 4% 2 3% 0 0% 0 0% 2.6 IN 3% 4% 0 0% 0 0% 0 0% 1.1 KY 1% 1% 0 0% 0 0% 0 0% 0.5 MA 0% -3% 2 3% 1 2% 0 0% 5.2 MI 3% 4% 0 0% 0 0% 0 0% 1.8 MO 1% 1% 0 0% 0 0% 0 0% 0.9 NC 3% 5% 2 3% 0 0% 0 0% 2.9 OH 14% 15% 20 33% 0 0% 0 0% 4.1 SC 1% 1% 0 0% 0 0% 0 0% 0.8 TN 0% 1% 0 0% 0 0% 0 0% 0.2 VA 11% 15% 13 22% 2 3% 0 0% 5.8 WI 1% 1% 0 0% 0 0% 0 0% 0.6 WV 13% 15% 23 38% 0 0% 0 0% 3.8

J-27
Downwind State: South Carolina; UAM-V State Zero-Out ModelingContributions to 8-Hr Violating + Modeled Receptors
Base case: Total Number of Exceedences (grid-days) = 237
Upwind State
Percent totalppb reduced>= 85 ppb
Percentpop-wgt totalppb
Number ofexceedencesreduced >= 2ppb
Percentexceedencesreduced >= 2ppb
Number ofexceedencesreduced >= 5ppb
Percentexceedencesreduced >= 5ppb
Number ofexceedencesreduced >=10 ppb
Percentexceedencesreduced >=10 ppb
Max 8-hrcontributionppb
AL 5% 3% 34 14% 1 0% 0 0% 5.4 GA 19% 14% 82 35% 55 23% 45 19% 29 IL 1% 1% 0 0% 0 0% 0 0% 1.7 IN 1% 1% 3 1% 0 0% 0 0% 3.5 KY 7% 6% 36 15% 0 0% 0 0% 4.9 MA 0% 0% 0 0% 0 0% 0 0% 0 MI 0% 0% 0 0% 0 0% 0 0% 0.1 MO 1% 1% 0 0% 0 0% 0 0% 1.7 NC 43% 35% 173 73% 117 49% 74 31% 43.8 OH 2% 2% 1 0% 0 0% 0 0% 2.2 SC 99% 99% 236 100% 233 98% 219 92% 81.2 TN 27% 21% 101 43% 82 35% 38 16% 24.9 VA 6% 5% 22 9% 0 0% 0 0% 3.9 WI 0% 0% 0 0% 0 0% 0 0% 0.2 WV 7% 6% 27 11% 1 0% 0 0% 5.2

J-28
Downwind State: Tennessee; UAM-V State Zero-Out ModelingContributions to 8-Hr Violating + Modeled Receptors
Base case: Total Number of Exceedences (grid-days) = 761
Upwind State
Percent totalppb reduced>= 85 ppb
Percentpop-wgt totalppb
Number ofexceedencesreduced >= 2ppb
Percentexceedencesreduced >= 2ppb
Number ofexceedencesreduced >= 5ppb
Percentexceedencesreduced >= 5ppb
Number ofexceedencesreduced >=10 ppb
Percentexceedencesreduced >=10 ppb
Max 8-hrcontributionppb
AL 10% 11% 175 23% 90 12% 42 6% 51.5 GA 9% 10% 157 21% 84 11% 29 4% 22.6 IL 3% 3% 53 7% 1 0% 0 0% 5.3 IN 3% 3% 57 7% 18 2% 1 0% 10.3 KY 19% 16% 291 38% 175 23% 92 12% 26.5 MA 0% 0% 0 0% 0 0% 0 0% 0 MI 1% 0% 5 1% 0 0% 0 0% 3.1 MO 2% 2% 28 4% 1 0% 0 0% 5 NC 6% 6% 109 14% 41 5% 8 1% 15.5 OH 5% 3% 54 7% 41 5% 18 2% 15.6 SC 4% 5% 75 10% 21 3% 7 1% 13.5 TN 98% 99% 756 99% 750 99% 736 97% 92.2 VA 4% 3% 54 7% 25 3% 5 1% 22.2 WI 0% 0% 0 0% 0 0% 0 0% 0.7 WV 5% 3% 64 8% 34 4% 21 3% 43.3

J-29
Downwind State: Texas; UAM-V State Zero-Out ModelingContributions to 8-Hr Violating + Modeled Receptors
Base case: Total Number of Exceedences (grid-days) = 616
Upwind State
Percent totalppb reduced>= 85 ppb
Percentpop-wgt totalppb
Number ofexceedencesreduced >= 2ppb
Percentexceedencesreduced >= 2ppb
Number ofexceedencesreduced >= 5ppb
Percentexceedencesreduced >= 5ppb
Number ofexceedencesreduced >=10 ppb
Percentexceedencesreduced >=10 ppb
Max 8-hrcontributionppb
AL 2% 1% 54 9% 0 0% 0 0% 4.1 GA 1% 1% 28 5% 0 0% 0 0% 2.9 IL 0% 0% 0 0% 0 0% 0 0% 0.9 IN 0% 0% 0 0% 0 0% 0 0% 0.3 KY 0% 0% 0 0% 0 0% 0 0% 0.3 MA 0% 0% 0 0% 0 0% 0 0% 0 MI 0% 0% 0 0% 0 0% 0 0% 0 MO 1% 1% 0 0% 0 0% 0 0% 0.9 NC 0% 0% 0 0% 0 0% 0 0% 0.2 OH 0% 0% 0 0% 0 0% 0 0% 0 SC 0% 0% 0 0% 0 0% 0 0% 0.4 TN 1% 0% 0 0% 0 0% 0 0% 1.6 VA 0% 0% 0 0% 0 0% 0 0% 0 WI 0% 0% 0 0% 0 0% 0 0% 0.1 WV 0% 0% 0 0% 0 0% 0 0% 0

J-30
Downwind State: Virginia; UAM-V State Zero-Out ModelingContributions to 8-Hr Violating + Modeled Receptors
Base case: Total Number of Exceedences (grid-days) = 427
Upwind State
Percent totalppb reduced>= 85 ppb
Percentpop-wgt totalppb
Number ofexceedencesreduced >= 2ppb
Percentexceedencesreduced >= 2ppb
Number ofexceedencesreduced >= 5ppb
Percentexceedencesreduced >= 5ppb
Number ofexceedencesreduced >=10 ppb
Percentexceedencesreduced >=10 ppb
Max 8-hrcontributionppb
AL 1% 1% 20 5% 1 0% 0 0% 6 GA 1% 1% 27 6% 0 0% 0 0% 4.9 IL 1% 2% 2 0% 0 0% 0 0% 2.5 IN 2% 2% 11 3% 0 0% 0 0% 2.9 KY 4% 4% 65 15% 7 2% 0 0% 7.7 MA 0% 0% 0 0% 0 0% 0 0% 0.1 MI 2% 2% 13 3% 0 0% 0 0% 4.7 MO 0% 0% 0 0% 0 0% 0 0% 0.9 NC 12% 6% 117 27% 83 19% 50 12% 44.6 OH 5% 6% 81 19% 3 1% 0 0% 6.2 SC 1% 1% 26 6% 0 0% 0 0% 4.1 TN 2% 2% 31 7% 3 1% 0 0% 5.3 VA 91% 80% 422 99% 416 97% 405 95% 98.8 WI 1% 1% 0 0% 0 0% 0 0% 1.5 WV 13% 13% 197 46% 100 23% 36 8% 30.7

J-31
Downwind State: West Virginia; UAM-V State Zero-Out ModelingContributions to 8-Hr Violating + Modeled Receptors
Base case: Total Number of Exceedences (grid-days) = 147
Upwind State
Percent totalppb reduced>= 85 ppb
Percentpop-wgt totalppb
Number ofexceedencesreduced >= 2ppb
Percentexceedencesreduced >= 2ppb
Number ofexceedencesreduced >= 5ppb
Percentexceedencesreduced >= 5ppb
Number ofexceedencesreduced >=10 ppb
Percentexceedencesreduced >=10 ppb
Max 8-hrcontributionppb
AL 1% 1% 2 1% 2 1% 2 1% 17.7 GA 1% 1% 0 0% 0 0% 0 0% 1.5 IL 9% 7% 37 25% 7 5% 0 0% 8.9 IN 16% 12% 67 46% 12 8% 0 0% 9.5 KY 41% 37% 85 58% 72 49% 59 40% 39.7 MA 0% 0% 0 0% 0 0% 0 0% 0 MI 9% 6% 30 20% 17 12% 2 1% 12.4 MO 2% 1% 0 0% 0 0% 0 0% 1.8 NC 4% 4% 11 7% 1 1% 0 0% 6.4 OH 54% 39% 125 85% 93 63% 60 41% 38.5 SC 1% 1% 0 0% 0 0% 0 0% 1.7 TN 7% 6% 22 15% 2 1% 0 0% 8.7 VA 5% 4% 14 10% 1 1% 0 0% 7.4 WI 0% 0% 0 0% 0 0% 0 0% 1 WV 87% 91% 135 92% 127 86% 101 69% 69.6

J-32
Downwind State: Wisconsin; UAM-V State Zero-Out ModelingContributions to 8-Hr Violating + Modeled Receptors
Base case: Total Number of Exceedences (grid-days) = 54
Upwind State
Percent totalppb reduced>= 85 ppb
Percentpop-wgt totalppb
Number ofexceedencesreduced >= 2ppb
Percentexceedencesreduced >= 2ppb
Number ofexceedencesreduced >= 5ppb
Percentexceedencesreduced >= 5ppb
Number ofexceedencesreduced >=10 ppb
Percentexceedencesreduced >=10 ppb
Max 8-hrcontributionppb
AL 0% 0% 0 0% 0 0% 0 0% 0.2 GA 1% 2% 0 0% 0 0% 0 0% 0.4 IL 100% 100% 54 100% 54 100% 51 94% 44.2 IN 11% 18% 6 11% 6 11% 0 0% 8.1 KY 10% 15% 6 11% 4 7% 0 0% 5.5 MA 0% 0% 0 0% 0 0% 0 0% 0 MI 1% 1% 0 0% 0 0% 0 0% 0.8 MO 36% 32% 31 57% 1 2% 0 0% 7.4 NC 1% 1% 0 0% 0 0% 0 0% 0.3 OH 2% 4% 0 0% 0 0% 0 0% 1.1 SC 1% 1% 0 0% 0 0% 0 0% 0.2 TN 9% 5% 7 13% 0 0% 0 0% 3.3 VA 0% 0% 0 0% 0 0% 0 0% 0.1 WI 31% -39% 29 54% 22 41% 20 37% 26.7 WV 3% 5% 0 0% 0 0% 0 0% 1.5

APPENDIX KEVALUATION OF CONTRIBUTIONS -- TABLES OF METRICS8-HOUR CAMX: UPWIND STATES TO DOWNWIND STATES

K-1
The tables in this Appendix contain information on the CAMx metrics used for theevaluation of contributions. Tables are provided only for those States with predictedexceedences in the Base Case. The headings in the table relate to the metrics asfollows:
Average percent contribution (4-episode) Metric 4Highest daily average contribution (ppb) Metric 3Highest daily average contribution (%) Metric 3Number of exceedences reduced >= 2 ppb Metrics 1 & 2Percent exceedences reduced >= 2 ppb Metrics 1 & 2Number of exceedences reduced >= 5 ppb Metrics 1 & 2Percent exceedences reduced >= 5 ppb Metrics 1 & 2Number of exceedences reduced >= 10 ppb Metrics 1 & 2Percent exceedences reduced >= 10 ppb Metrics 1 & 2max 8-hr contribution, ppb Metric 2
(Note: Some of the maximum contribution values may appear to be inconsistent with thenumber of exceedences above a certain cut-point. For example, a contribution of9.999........ is interpreted as being less that 10 ppb for the purpose of counting thenumber of exceedence reduced; however, this value is rounded to 10 ppb in thepresentation of maximum "ppb" contribution in these tables.)

K-2
Downwind State : Alabama ; CAMX Source Apportionment Modeling Contributions to 8-hr Violating Counties + Modeled Receptors
Base Case: Total Number of Exceedences (grids-8hrs) = 6894Upwind State: Average
percentcontribution(4-episode)
Highest dailyaverage (ppb)
Highest dailyaverage (%)
Number ofexceedencesreduced >= 2ppb
Percentexceedencesreduced >= 2ppb
Number ofexceedencesreduced >= 5ppb
Percentexceedencesreduced >= 5ppb
Number ofexceedencesreduced >=10 ppb
Percentexceedencesreduced >=10 ppb
Max 8hrcontribution(ppb)
AL 65% 82 79% 6863 99% 6765 98% 6621 96% 128.9CT/RI 0% 0 0% 0 0% 0 0% 0 0% 0.1FL 1% 7 8% 1232 17% 2 0% 0 0% 7.2GA 10% 30 31% 2929 42% 2563 37% 1932 28% 71.1IA 0% 0 0% 0 0% 0 0% 0 0% 0.8IL 1% 5 5% 368 5% 158 2% 0 0% 8.6IN 0% 2 2% 311 4% 4 0% 0 0% 5.8KY 2% 5 5% 1527 22% 766 11% 0 0% 9.8LA 2% 22 25% 1994 28% 694 10% 24 0% 28MA 0% 0 0% 0 0% 0 0% 0 0% 0.1MD/DC/DE 0% 0 0% 0 0% 0 0% 0 0% 0.3ME 0% 0 0% 0 0% 0 0% 0 0% 0MI 0% 0 0% 0 0% 0 0% 0 0% 1.3MO 1% 5 5% 563 8% 151 2% 0 0% 7.5MS 4% 12 11% 2864 41% 2111 30% 792 11% 16.5NC 1% 5 5% 1252 18% 420 6% 100 1% 14NH/VT 0% 0 0% 0 0% 0 0% 0 0% 0.1NJ 0% 0 0% 0 0% 0 0% 0 0% 0.5NY 0% 0 0% 0 0% 0 0% 0 0% 0.5OH 0% 1 1% 92 1% 24 0% 0 0% 6.4PA 0% 0 0% 0 0% 0 0% 0 0% 0.7SC 3% 15 15% 2046 29% 1120 16% 615 8% 28.7TN 7% 14 13% 3548 51% 2761 40% 1479 21% 38.8TX 1% 6 7% 929 13% 269 3% 0 0% 8.1VA 0% 1 1% 0 0% 0 0% 0 0% 1WI 0% 0 0% 0 0% 0 0% 0 0% 0.6WV 0% 0 0% 0 0% 0 0% 0 0% 0.7West 2% 8 9% 1572 22% 1072 15% 43 0% 11.3Canada 0% 0 0% 0 0% 0 0% 0 0% 0.2

K-3
Downwind State : Arkansas ; CAMX Source Apportionment Modeling Contributions to 8-hr Violating Counties + Modeled Receptors
Base Case: Total Number of Exceedences (grids-8hrs) = 193Upwind State: Average
percentcontribution(4-episode)
Highest dailyaverage (ppb)
Highest dailyaverage (%)
Number ofexceedencesreduced >= 2ppb
Percentexceedencesreduced >= 2ppb
Number ofexceedencesreduced >= 5ppb
Percentexceedencesreduced >= 5ppb
Number ofexceedencesreduced >=10 ppb
Percentexceedencesreduced >=10 ppb
Max 8hrcontribution(ppb)
AL 3% 14 16% 74 38% 21 10% 13 6% 14.7CT/RI 0% NA NA 0 0% 0 0% 0 0% 0FL 1% 3 3% 44 22% 0 0% 0 0% 4.3GA 3% 15 17% 79 40% 17 8% 13 6% 17.4IA 1% 3 3% 28 14% 0 0% 0 0% 2.8IL 2% 5 6% 58 30% 29 15% 0 0% 6.2IN 0% 1 1% 0 0% 0 0% 0 0% 1.2KY 2% 7 8% 41 21% 7 3% 0 0% 8.5LA 0% 13 15% 4 2% 4 2% 4 2% 15.4MA 0% NA NA 0 0% 0 0% 0 0% 0MD/DC/DE 0% 0 0% 0 0% 0 0% 0 0% 0ME 0% NA NA 0 0% 0 0% 0 0% 0MI 0% 2 2% 0 0% 0 0% 0 0% 1.9MO 2% 9 9% 39 20% 28 14% 0 0% 9.5MS 5% 23 27% 127 65% 60 31% 5 2% 24.7NC 5% 8 8% 107 55% 72 37% 0 0% 9NH/VT 0% NA NA 0 0% 0 0% 0 0% 0NJ 0% NA NA 0 0% 0 0% 0 0% 0NY 0% 0 0% 0 0% 0 0% 0 0% 0OH 1% 4 5% 7 3% 0 0% 0 0% 4.4PA 0% 0 0% 0 0% 0 0% 0 0% 0.3SC 3% 5 6% 124 64% 5 2% 0 0% 5.3TN 45% 40 45% 193 100% 189 97% 188 97% 54.6TX 0% 0 0% 0 0% 0 0% 0 0% 0.3VA 1% 1 1% 0 0% 0 0% 0 0% 1.3WI 0% 0 0% 0 0% 0 0% 0 0% 0.1WV 1% 1 1% 0 0% 0 0% 0 0% 1.5West 24% 24 26% 193 100% 193 100% 186 96% 29.3Canada 0% 0 0% 0 0% 0 0% 0 0% 0.3

K-4
Downwind State : Connecticut ; CAMX Source Apportionment Modeling Contributions to 8-hr Violating Counties + Modeled Receptors
Base Case: Total Number of Exceedences (grids-8hrs) = 7379Upwind State: Average
percentcontribution(4-episode)
Highest dailyaverage (ppb)
Highest dailyaverage (%)
Number ofexceedencesreduced >= 2ppb
Percentexceedencesreduced >= 2ppb
Number ofexceedencesreduced >= 5ppb
Percentexceedencesreduced >= 5ppb
Number ofexceedencesreduced >=10 ppb
Percentexceedencesreduced >=10 ppb
Max 8hrcontribution(ppb)
AL 0% 1 1% 0 0% 0 0% 0 0% 1.8CT/RI 12% 27 28% 5055 68% 4022 54% 2951 39% 52.4FL 0% 2 2% 366 4% 0 0% 0 0% 4.3GA 0% 1 1% 0 0% 0 0% 0 0% 1.3IA 0% 1 1% 0 0% 0 0% 0 0% 1.9IL 1% 6 5% 949 12% 397 5% 0 0% 8.9IN 1% 5 5% 1108 15% 147 1% 0 0% 5.9KY 1% 6 6% 378 5% 185 2% 0 0% 7.4LA 0% 0 0% 0 0% 0 0% 0 0% 1MA 0% 0 0% 18 0% 0 0% 0 0% 2.6MD/DC/DE 6% 9 10% 5195 70% 3458 46% 748 10% 18.4ME 0% 0 0% 0 0% 0 0% 0 0% 0MI 2% 4 5% 2184 29% 192 2% 0 0% 6.7MO 1% 2 2% 522 7% 0 0% 0 0% 4.1MS 0% 1 1% 0 0% 0 0% 0 0% 0.7NC 2% 6 6% 1147 15% 569 7% 46 0% 12.9NH/VT 0% 0 0% 0 0% 0 0% 0 0% 0.7NJ 23% 30 26% 7192 97% 6876 93% 5978 81% 53.9NY 24% 39 45% 7346 99% 7214 97% 6501 88% 50.6OH 3% 9 9% 2730 36% 1538 20% 515 6% 14.9PA 14% 28 29% 7062 95% 6500 88% 4147 56% 38.3SC 0% 2 1% 345 4% 0 0% 0 0% 4.1TN 0% 4 5% 153 2% 8 0% 0 0% 5.4TX 0% 1 1% 0 0% 0 0% 0 0% 1.7VA 5% 9 9% 4886 66% 2104 28% 452 6% 20.7WI 1% 2 2% 479 6% 0 0% 0 0% 3WV 2% 7 7% 2317 31% 1170 15% 33 0% 11.8West 0% 2 3% 175 2% 2 0% 0 0% 5.1Canada 2% 6 7% 2723 36% 952 12% 0 0% 9.8

K-5
Downwind State : Delaware ; CAMX Source Apportionment Modeling Contributions to 8-hr Violating Counties + Modeled Receptors
Base Case: Total Number of Exceedences (grids-8hrs) = 4035Upwind State: Average
percentcontribution(4-episode)
Highest dailyaverage (ppb)
Highest dailyaverage (%)
Number ofexceedencesreduced >= 2ppb
Percentexceedencesreduced >= 2ppb
Number ofexceedencesreduced >= 5ppb
Percentexceedencesreduced >= 5ppb
Number ofexceedencesreduced >=10 ppb
Percentexceedencesreduced >=10 ppb
Max 8hrcontribution(ppb)
AL 1% 5 6% 272 6% 61 1% 0 0% 6.6CT/RI 0% 0 1% 0 0% 0 0% 0 0% 0.5FL 0% 2 3% 142 3% 0 0% 0 0% 2.9GA 1% 2 2% 314 7% 0 0% 0 0% 3.9IA 0% 1 1% 0 0% 0 0% 0 0% 1.6IL 3% 5 5% 1951 48% 223 5% 0 0% 6.5IN 2% 5 5% 1532 37% 276 6% 0 0% 6.1KY 3% 7 7% 1639 40% 659 16% 0 0% 8.8LA 0% 2 2% 3 0% 0 0% 0 0% 2MA 0% 0 0% 0 0% 0 0% 0 0% 0.5MD/DC/DE 34% 38 43% 4022 99% 3912 96% 3729 92% 88.5ME 0% 0 0% 0 0% 0 0% 0 0% 0.1MI 2% 7 7% 1688 41% 301 7% 0 0% 8.8MO 1% 2 2% 478 11% 0 0% 0 0% 3.7MS 0% 1 1% 0 0% 0 0% 0 0% 1.1NC 4% 18 19% 1344 33% 757 18% 443 10% 27.5NH/VT 0% 0 0% 0 0% 0 0% 0 0% 0.1NJ 0% 27 31% 14 0% 2 0% 2 0% 28NY 0% 7 8% 23 0% 2 0% 0 0% 7.3OH 6% 9 10% 3120 77% 1899 47% 135 3% 13.7PA 7% 20 23% 2567 63% 1708 42% 713 17% 32.4SC 1% 2 2% 103 2% 0 0% 0 0% 4.8TN 2% 6 6% 1279 31% 254 6% 0 0% 7.4TX 0% 2 2% 193 4% 0 0% 0 0% 2.7VA 23% 35 37% 3832 94% 3549 87% 3085 76% 60.2WI 1% 2 2% 56 1% 0 0% 0 0% 2.3WV 6% 12 12% 2754 68% 1806 44% 428 10% 17.2West 1% 3 3% 757 18% 27 0% 0 0% 5.6Canada 1% 3 3% 257 6% 0 0% 0 0% 3.1

K-6
Downwind State : District of Columbia ; CAMX Source Apportionment Modeling Contributions to 8-hr Violating Counties + Modeled Receptors
Base Case: Total Number of Exceedences (grids-8hrs) = 99Upwind State: Average
percentcontribution(4-episode)
Highest dailyaverage (ppb)
Highest dailyaverage (%)
Number ofexceedencesreduced >= 2ppb
Percentexceedencesreduced >= 2ppb
Number ofexceedencesreduced >= 5ppb
Percentexceedencesreduced >= 5ppb
Number ofexceedencesreduced >=10 ppb
Percentexceedencesreduced >=10 ppb
Max 8hrcontribution(ppb)
AL 1% 9 9% 6 6% 6 6% 0 0% 9.7CT/RI 0% 0 0% 0 0% 0 0% 0 0% 0.1FL 0% 2 2% 6 6% 0 0% 0 0% 2.4GA 1% 3 3% 6 6% 0 0% 0 0% 2.7IA 0% 1 1% 0 0% 0 0% 0 0% 0.9IL 2% 5 6% 39 39% 6 6% 0 0% 6.1IN 2% 6 6% 32 32% 10 10% 0 0% 7.6KY 3% 8 9% 37 37% 24 24% 0 0% 9LA 0% 2 2% 2 2% 0 0% 0 0% 2.3MA 0% 0 0% 0 0% 0 0% 0 0% 0.1MD/DC/DE 17% 39 34% 82 82% 73 73% 59 59% 49.5ME 0% 0 0% 0 0% 0 0% 0 0% 0MI 2% 7 8% 30 30% 5 5% 0 0% 6.6MO 1% 3 3% 18 18% 0 0% 0 0% 3.7MS 0% 1 1% 0 0% 0 0% 0 0% 2NC 1% 3 4% 17 17% 4 4% 0 0% 5.3NH/VT 0% 0 0% 0 0% 0 0% 0 0% 0.1NJ 0% 2 2% 0 0% 0 0% 0 0% 1.7NY 1% 2 2% 4 4% 0 0% 0 0% 2.1OH 5% 10 12% 63 63% 46 46% 3 3% 10.3PA 6% 10 11% 69 69% 55 55% 16 16% 14.2SC 0% 1 1% 0 0% 0 0% 0 0% 1TN 2% 7 7% 34 34% 6 6% 0 0% 6.8TX 0% 1 1% 0 0% 0 0% 0 0% 0.9VA 47% 60 62% 99 100% 99 100% 99 100% 87.9WI 0% 3 3% 6 6% 0 0% 0 0% 3.1WV 6% 21 23% 57 57% 41 41% 14 14% 22.9West 1% 4 4% 20 20% 0 0% 0 0% 4.5Canada 1% 3 3% 4 4% 0 0% 0 0% 3.2

K-7
Downwind State : Florida ; CAMX Source Apportionment Modeling Contributions to 8-hr Violating Counties + Modeled Receptors
Base Case: Total Number of Exceedences (grids-8hrs) = 740Upwind State: Average
percentcontribution(4-episode)
Highest dailyaverage (ppb)
Highest dailyaverage (%)
Number ofexceedencesreduced >= 2ppb
Percentexceedencesreduced >= 2ppb
Number ofexceedencesreduced >= 5ppb
Percentexceedencesreduced >= 5ppb
Number ofexceedencesreduced >=10 ppb
Percentexceedencesreduced >=10 ppb
Max 8hrcontribution(ppb)
AL 46% 42 47% 740 100% 740 100% 727 98% 59.6CT/RI 0% NA NA 0 0% 0 0% 0 0% 0FL 8% 32 37% 479 64% 273 36% 134 18% 38.5GA 1% 4 4% 57 7% 6 0% 0 0% 5.9IA 0% 0 0% 0 0% 0 0% 0 0% 0.2IL 0% 0 0% 0 0% 0 0% 0 0% 0.5IN 0% 0 0% 0 0% 0 0% 0 0% 0.2KY 0% 0 0% 0 0% 0 0% 0 0% 0.4LA 16% 29 33% 740 100% 665 89% 479 64% 34.2MA 0% NA NA 0 0% 0 0% 0 0% 0MD/DC/DE 0% 0 0% 0 0% 0 0% 0 0% 0ME 0% NA NA 0 0% 0 0% 0 0% 0MI 0% 0 0% 0 0% 0 0% 0 0% 0MO 0% 1 2% 7 0% 0 0% 0 0% 2.2MS 22% 30 31% 740 100% 724 97% 562 75% 37.6NC 0% 0 0% 0 0% 0 0% 0 0% 0.2NH/VT 0% NA NA 0 0% 0 0% 0 0% 0NJ 0% 0 0% 0 0% 0 0% 0 0% 0NY 0% 0 0% 0 0% 0 0% 0 0% 0OH 0% 0 0% 0 0% 0 0% 0 0% 0.1PA 0% 0 0% 0 0% 0 0% 0 0% 0SC 0% 0 0% 0 0% 0 0% 0 0% 0.2TN 1% 2 2% 0 0% 0 0% 0 0% 1.9TX 3% 7 8% 230 31% 138 18% 14 1% 12.5VA 0% 0 0% 0 0% 0 0% 0 0% 0.1WI 0% 0 0% 0 0% 0 0% 0 0% 0WV 0% 0 0% 0 0% 0 0% 0 0% 0.1West 2% 6 7% 228 30% 89 12% 0 0% 7.7Canada 0% 0 0% 0 0% 0 0% 0 0% 0

K-8
Downwind State : Georgia ; CAMX Source Apportionment Modeling Contributions to 8-hr Violating Counties + Modeled Receptors
Base Case: Total Number of Exceedences (grids-8hrs) = 8043Upwind State: Average
percentcontribution(4-episode)
Highest dailyaverage (ppb)
Highest dailyaverage (%)
Number ofexceedencesreduced >= 2ppb
Percentexceedencesreduced >= 2ppb
Number ofexceedencesreduced >= 5ppb
Percentexceedencesreduced >= 5ppb
Number ofexceedencesreduced >=10 ppb
Percentexceedencesreduced >=10 ppb
Max 8hrcontribution(ppb)
AL 11% 27 26% 6191 76% 4930 61% 3568 44% 43.6CT/RI 0% 0 0% 0 0% 0 0% 0 0% 0.1FL 1% 3 3% 662 8% 49 0% 0 0% 8.9GA 67% 96 78% 8043 100% 8043 100% 8043 100% 178.4IA 0% 0 0% 0 0% 0 0% 0 0% 0.5IL 0% 2 2% 191 2% 0 0% 0 0% 3.3IN 0% 1 1% 141 1% 0 0% 0 0% 4.7KY 1% 9 9% 1378 17% 433 5% 177 2% 13.8LA 2% 10 10% 2916 36% 733 9% 86 1% 11MA 0% 0 0% 0 0% 0 0% 0 0% 0.1MD/DC/DE 0% 0 0% 0 0% 0 0% 0 0% 0.5ME 0% 0 0% 0 0% 0 0% 0 0% 0MI 0% 0 0% 0 0% 0 0% 0 0% 0.5MO 0% 3 3% 520 6% 0 0% 0 0% 4.2MS 2% 7 7% 3064 38% 1578 19% 7 0% 10.3NC 1% 7 8% 1784 22% 664 8% 62 0% 14.5NH/VT 0% 0 0% 0 0% 0 0% 0 0% 0NJ 0% 0 0% 0 0% 0 0% 0 0% 0.5NY 0% 0 0% 0 0% 0 0% 0 0% 0.6OH 0% 1 1% 36 0% 0 0% 0 0% 3.1PA 0% 1 1% 0 0% 0 0% 0 0% 1.1SC 4% 24 26% 3004 37% 1675 20% 733 9% 47.2TN 6% 18 19% 5307 65% 3096 38% 1046 13% 28.4TX 1% 4 4% 1197 14% 123 1% 0 0% 5.6VA 0% 1 1% 0 0% 0 0% 0 0% 1.5WI 0% 0 0% 0 0% 0 0% 0 0% 0.3WV 0% 1 1% 0 0% 0 0% 0 0% 1.8West 1% 5 5% 966 12% 407 5% 0 0% 6.9Canada 0% 0 0% 0 0% 0 0% 0 0% 0.3

K-9
Downwind State : Illinois ; CAMX Source Apportionment Modeling Contributions to 8-hr Violating Counties + Modeled Receptors
Base Case: Total Number of Exceedences (grids-8hrs) = 2333Upwind State: Average
percentcontribution(4-episode)
Highest dailyaverage (ppb)
Highest dailyaverage (%)
Number ofexceedencesreduced >= 2ppb
Percentexceedencesreduced >= 2ppb
Number ofexceedencesreduced >= 5ppb
Percentexceedencesreduced >= 5ppb
Number ofexceedencesreduced >=10 ppb
Percentexceedencesreduced >=10 ppb
Max 8hrcontribution(ppb)
AL 4% 8 9% 912 39% 483 20% 133 5% 16.1CT/RI 0% 0 0% 0 0% 0 0% 0 0% 0FL 0% 1 2% 29 1% 0 0% 0 0% 2.8GA 3% 6 6% 981 42% 294 12% 27 1% 10.9IA 0% 1 1% 2 0% 0 0% 0 0% 4.6IL 26% 32 37% 2239 95% 2048 87% 1715 73% 63IN 2% 13 15% 240 10% 169 7% 109 4% 15.3KY 3% 8 9% 584 25% 278 11% 135 5% 15.8LA 1% 8 9% 221 9% 166 7% 38 1% 12.8MA 0% 0 0% 0 0% 0 0% 0 0% 0MD/DC/DE 0% 0 0% 0 0% 0 0% 0 0% 0.3ME 0% 0 0% 0 0% 0 0% 0 0% 0MI 0% 1 1% 0 0% 0 0% 0 0% 1.4MO 38% 60 62% 2064 88% 2008 86% 1788 76% 72.8MS 2% 10 12% 502 21% 159 6% 70 3% 17.1NC 1% 3 3% 239 10% 0 0% 0 0% 3.4NH/VT 0% 0 0% 0 0% 0 0% 0 0% 0NJ 0% 0 0% 0 0% 0 0% 0 0% 0.2NY 0% 0 0% 0 0% 0 0% 0 0% 0.2OH 1% 3 4% 168 7% 0 0% 0 0% 4.4PA 0% 0 0% 0 0% 0 0% 0 0% 0.4SC 1% 2 2% 210 9% 0 0% 0 0% 2.7TN 7% 25 27% 1379 59% 678 29% 322 13% 28.9TX 2% 12 14% 222 9% 155 6% 128 5% 16.2VA 0% 1 1% 0 0% 0 0% 0 0% 1WI 0% 1 1% 23 0% 0 0% 0 0% 3WV 0% 1 1% 0 0% 0 0% 0 0% 1.7West 9% 15 16% 1396 59% 1172 50% 552 23% 19.9Canada 0% 0 0% 0 0% 0 0% 0 0% 0.2

K-10
Downwind State : Indiana ; CAMX Source Apportionment Modeling Contributions to 8-hr Violating Counties + Modeled Receptors
Base Case: Total Number of Exceedences (grids-8hrs) = 4994Upwind State: Average
percentcontribution(4-episode)
Highest dailyaverage (ppb)
Highest dailyaverage (%)
Number ofexceedencesreduced >= 2ppb
Percentexceedencesreduced >= 2ppb
Number ofexceedencesreduced >= 5ppb
Percentexceedencesreduced >= 5ppb
Number ofexceedencesreduced >=10 ppb
Percentexceedencesreduced >=10 ppb
Max 8hrcontribution(ppb)
AL 4% 10 11% 1888 37% 1226 24% 272 5% 20.7CT/RI 0% 0 0% 0 0% 0 0% 0 0% 0FL 1% 2 3% 312 6% 11 0% 0 0% 5.3GA 4% 9 11% 2635 52% 606 12% 102 2% 16.5IA 0% 1 1% 0 0% 0 0% 0 0% 1.2IL 5% 11 12% 2244 44% 1310 26% 549 10% 43.9IN 27% 26 28% 4747 95% 4401 88% 3895 77% 48.8KY 27% 47 53% 4681 93% 4356 87% 3569 71% 64.9LA 2% 15 17% 663 13% 490 9% 328 6% 21.5MA 0% 0 0% 0 0% 0 0% 0 0% 0MD/DC/DE 0% 0 0% 0 0% 0 0% 0 0% 0.4ME 0% 0 0% 0 0% 0 0% 0 0% 0MI 0% 1 2% 35 0% 10 0% 0 0% 6.8MO 2% 9 10% 743 14% 475 9% 186 3% 15.2MS 2% 11 13% 711 14% 576 11% 420 8% 16.8NC 2% 4 4% 1611 32% 171 3% 0 0% 8NH/VT 0% 0 0% 0 0% 0 0% 0 0% 0NJ 0% 0 0% 0 0% 0 0% 0 0% 0.3NY 0% 0 0% 0 0% 0 0% 0 0% 0.3OH 2% 12 13% 799 15% 359 7% 72 1% 27.6PA 0% 1 1% 0 0% 0 0% 0 0% 1.5SC 2% 3 3% 1235 24% 13 0% 0 0% 6.5TN 15% 18 20% 4322 86% 3636 72% 1802 36% 52.3TX 0% 7 8% 180 3% 40 0% 2 0% 10.6VA 1% 3 3% 219 4% 12 0% 0 0% 5.4WI 0% 0 0% 0 0% 0 0% 0 0% 1.2WV 1% 7 8% 699 13% 21 0% 0 0% 7.7West 2% 8 8% 553 11% 433 8% 192 3% 15.8Canada 0% 2 2% 0 0% 0 0% 0 0% 1.6

K-11
Downwind State : Kentucky ; CAMX Source Apportionment Modeling Contributions to 8-hr Violating Counties + Modeled Receptors
Base Case: Total Number of Exceedences (grids-8hrs) = 9321Upwind State: Average
percentcontribution(4-episode)
Highest dailyaverage (ppb)
Highest dailyaverage (%)
Number ofexceedencesreduced >= 2ppb
Percentexceedencesreduced >= 2ppb
Number ofexceedencesreduced >= 5ppb
Percentexceedencesreduced >= 5ppb
Number ofexceedencesreduced >=10 ppb
Percentexceedencesreduced >=10 ppb
Max 8hrcontribution(ppb)
AL 5% 16 18% 3632 38% 2366 25% 996 10% 25.7CT/RI 0% 0 0% 0 0% 0 0% 0 0% 0.1FL 0% 5 5% 379 4% 125 1% 0 0% 5.9GA 4% 14 16% 3613 38% 1603 17% 390 4% 19.5IA 0% 1 1% 0 0% 0 0% 0 0% 1.6IL 2% 10 11% 2280 24% 918 9% 199 2% 15.7IN 12% 18 18% 6143 65% 4975 53% 3448 36% 40.4KY 39% 49 58% 9118 97% 8874 95% 8465 90% 74LA 1% 12 13% 640 6% 200 2% 145 1% 21.3MA 0% 0 0% 0 0% 0 0% 0 0% 0.1MD/DC/DE 0% 0 0% 0 0% 0 0% 0 0% 0.5ME 0% 0 0% 0 0% 0 0% 0 0% 0MI 0% 2 2% 177 1% 139 1% 113 1% 16.7MO 1% 8 9% 1197 12% 802 8% 42 0% 11.3MS 1% 6 7% 912 9% 195 2% 5 0% 11.3NC 2% 5 6% 4108 44% 382 4% 14 0% 12.4NH/VT 0% 0 0% 0 0% 0 0% 0 0% 0NJ 0% 0 0% 0 0% 0 0% 0 0% 0.4NY 0% 0 0% 0 0% 0 0% 0 0% 0.3OH 5% 12 13% 1828 19% 1317 14% 1080 11% 61.2PA 0% 1 1% 0 0% 0 0% 0 0% 1.7SC 2% 3 3% 2286 24% 126 1% 0 0% 6.9TN 20% 52 59% 7753 83% 6109 65% 4604 49% 90.8TX 1% 9 10% 1276 13% 636 6% 81 0% 13VA 1% 2 3% 421 4% 4 0% 0 0% 6.2WI 0% 1 1% 0 0% 0 0% 0 0% 1.4WV 1% 5 5% 898 9% 242 2% 33 0% 30.7West 2% 8 9% 1774 19% 857 9% 54 0% 16.6Canada 0% 1 1% 0 0% 0 0% 0 0% 1.6

K-12
Downwind State : Louisiana ; CAMX Source Apportionment Modeling Contributions to 8-hr Violating Counties + Modeled Receptors
Base Case: Total Number of Exceedences (grids-8hrs) = 6297Upwind State: Average
percentcontribution(4-episode)
Highest dailyaverage (ppb)
Highest dailyaverage (%)
Number ofexceedencesreduced >= 2ppb
Percentexceedencesreduced >= 2ppb
Number ofexceedencesreduced >= 5ppb
Percentexceedencesreduced >= 5ppb
Number ofexceedencesreduced >=10 ppb
Percentexceedencesreduced >=10 ppb
Max 8hrcontribution(ppb)
AL 5% 13 14% 2743 43% 1809 28% 1046 16% 28.7CT/RI 0% 0 0% 0 0% 0 0% 0 0% 0FL 1% 6 6% 955 15% 524 8% 47 0% 13.5GA 1% 3 3% 817 12% 5 0% 0 0% 5.3IA 0% 0 0% 0 0% 0 0% 0 0% 0.7IL 1% 1 2% 272 4% 0 0% 0 0% 3.4IN 0% 1 1% 95 1% 0 0% 0 0% 2.7KY 1% 2 2% 678 10% 0 0% 0 0% 4.3LA 61% 69 74% 6297 100% 6297 100% 6278 99% 84.1MA 0% NA NA 0 0% 0 0% 0 0% 0MD/DC/DE 0% 0 0% 0 0% 0 0% 0 0% 0ME 0% NA NA 0 0% 0 0% 0 0% 0MI 0% 0 0% 0 0% 0 0% 0 0% 0.4MO 2% 2 2% 1025 16% 0 0% 0 0% 3.8MS 14% 14 15% 5858 93% 4962 78% 3515 55% 40.4NC 0% 0 0% 0 0% 0 0% 0 0% 0.4NH/VT 0% NA NA 0 0% 0 0% 0 0% 0NJ 0% 0 0% 0 0% 0 0% 0 0% 0NY 0% 0 0% 0 0% 0 0% 0 0% 0OH 0% 0 0% 0 0% 0 0% 0 0% 0.3PA 0% 0 0% 0 0% 0 0% 0 0% 0SC 0% 0 0% 0 0% 0 0% 0 0% 0.5TN 2% 4 4% 2087 33% 447 7% 0 0% 9TX 7% 20 23% 3959 62% 2381 37% 1200 19% 38.4VA 0% 0 0% 0 0% 0 0% 0 0% 0.1WI 0% 0 0% 0 0% 0 0% 0 0% 0.4WV 0% 0 0% 0 0% 0 0% 0 0% 0.1West 5% 6 6% 4998 79% 1460 23% 12 0% 10.9Canada 0% 0 0% 0 0% 0 0% 0 0% 0

K-13
Downwind State : Maine ; CAMX Source Apportionment Modeling Contributions to 8-hr Violating Counties + Modeled Receptors
Base Case: Total Number of Exceedences (grids-8hrs) = 4063Upwind State: Average
percentcontribution(4-episode)
Highest dailyaverage (ppb)
Highest dailyaverage (%)
Number ofexceedencesreduced >= 2ppb
Percentexceedencesreduced >= 2ppb
Number ofexceedencesreduced >= 5ppb
Percentexceedencesreduced >= 5ppb
Number ofexceedencesreduced >=10 ppb
Percentexceedencesreduced >=10 ppb
Max 8hrcontribution(ppb)
AL 0% 1 1% 0 0% 0 0% 0 0% 1.2CT/RI 7% 7 8% 3458 85% 2022 49% 547 13% 19.4FL 0% 1 1% 1 0% 0 0% 0 0% 2GA 0% 1 1% 0 0% 0 0% 0 0% 0.7IA 0% 1 2% 0 0% 0 0% 0 0% 1.9IL 0% 3 3% 118 2% 0 0% 0 0% 3.2IN 1% 3 3% 159 3% 0 0% 0 0% 3.2KY 0% 1 1% 0 0% 0 0% 0 0% 0.9LA 0% 0 0% 0 0% 0 0% 0 0% 0.3MA 33% 47 54% 4019 98% 3776 92% 3424 84% 66.6MD/DC/DE 3% 3 4% 2248 55% 83 2% 0 0% 6.6ME 7% 14 16% 2456 60% 1547 38% 786 19% 39MI 2% 4 5% 1579 38% 0 0% 0 0% 4.7MO 0% 2 2% 17 0% 0 0% 0 0% 2.6MS 0% 1 1% 0 0% 0 0% 0 0% 0.6NC 1% 3 3% 337 8% 74 1% 0 0% 8.7NH/VT 11% 20 22% 3292 81% 2447 60% 1326 32% 46.4NJ 7% 10 10% 3087 75% 1948 47% 753 18% 21NY 11% 12 13% 4060 99% 2919 71% 1545 38% 19.9OH 1% 5 5% 722 17% 17 0% 0 0% 5.8PA 6% 8 9% 3097 76% 1785 43% 297 7% 13.9SC 0% 1 1% 49 1% 0 0% 0 0% 3TN 0% 1 1% 0 0% 0 0% 0 0% 0.7TX 0% 0 0% 0 0% 0 0% 0 0% 0.4VA 3% 6 7% 1128 27% 278 6% 96 2% 17.4WI 0% 2 2% 55 1% 0 0% 0 0% 2.5WV 0% 2 2% 184 4% 0 0% 0 0% 3.2West 0% 2 3% 69 1% 0 0% 0 0% 2.7Canada 5% 9 10% 3198 78% 1987 48% 1 0% 10.1

K-14
Downwind State : Maryland ; CAMX Source Apportionment Modeling Contributions to 8-hr Violating Counties + Modeled Receptors
Base Case: Total Number of Exceedences (grids-8hrs) = 12635Upwind State: Average
percentcontribution(4-episode)
Highest dailyaverage (ppb)
Highest dailyaverage (%)
Number ofexceedencesreduced >= 2ppb
Percentexceedencesreduced >= 2ppb
Number ofexceedencesreduced >= 5ppb
Percentexceedencesreduced >= 5ppb
Number ofexceedencesreduced >=10 ppb
Percentexceedencesreduced >=10 ppb
Max 8hrcontribution(ppb)
AL 1% 7 8% 711 5% 433 3% 3 0% 10.2CT/RI 0% 0 0% 0 0% 0 0% 0 0% 0.5FL 0% 2 2% 613 4% 0 0% 0 0% 2.9GA 1% 2 3% 822 6% 11 0% 0 0% 6.7IA 0% 1 1% 0 0% 0 0% 0 0% 1.4IL 2% 5 5% 3981 31% 469 3% 0 0% 6.5IN 2% 6 5% 3984 31% 991 7% 16 0% 11.2KY 3% 7 7% 4424 35% 2159 17% 100 0% 12.9LA 0% 2 2% 74 0% 0 0% 0 0% 3.1MA 0% 0 0% 0 0% 0 0% 0 0% 0.7MD/DC/DE 32% 37 43% 12135 96% 11563 91% 10507 83% 100.2ME 0% 0 0% 0 0% 0 0% 0 0% 0.1MI 2% 6 6% 3656 28% 882 6% 0 0% 9.8MO 1% 3 3% 1179 9% 3 0% 0 0% 5.1MS 0% 1 1% 18 0% 0 0% 0 0% 2.9NC 3% 15 17% 3470 27% 1728 13% 1032 8% 31.5NH/VT 0% 0 0% 0 0% 0 0% 0 0% 0.2NJ 0% 2 3% 55 0% 0 0% 0 0% 2.9NY 1% 2 2% 306 2% 0 0% 0 0% 2.9OH 5% 9 10% 8141 64% 5232 41% 776 6% 13.7PA 7% 15 14% 7974 63% 5705 45% 2390 18% 56.3SC 0% 2 2% 405 3% 137 1% 11 0% 11.2TN 2% 6 6% 3479 27% 647 5% 0 0% 7.5TX 0% 2 2% 244 1% 0 0% 0 0% 2.9VA 30% 40 42% 11998 94% 11246 89% 10285 81% 83.6WI 1% 2 2% 552 4% 0 0% 0 0% 3.3WV 6% 15 15% 7364 58% 4991 39% 1667 13% 25.7West 1% 4 4% 1697 13% 185 1% 0 0% 6.7Canada 1% 4 4% 1015 8% 0 0% 0 0% 4.3

K-15
Downwind State : Massachusetts ; CAMX Source Apportionment Modeling Contributions to 8-hr Violating Counties + Modeled Receptors
Base Case: Total Number of Exceedences (grids-8hrs) = 7692Upwind State: Average
percentcontribution(4-episode)
Highest dailyaverage (ppb)
Highest dailyaverage (%)
Number ofexceedencesreduced >= 2ppb
Percentexceedencesreduced >= 2ppb
Number ofexceedencesreduced >= 5ppb
Percentexceedencesreduced >= 5ppb
Number ofexceedencesreduced >=10 ppb
Percentexceedencesreduced >=10 ppb
Max 8hrcontribution(ppb)
AL 0% 1 1% 0 0% 0 0% 0 0% 1.8CT/RI 15% 38 43% 6240 81% 5086 66% 3704 48% 59.1FL 0% 1 1% 160 2% 0 0% 0 0% 3.1GA 0% 1 1% 63 0% 0 0% 0 0% 2.8IA 0% 1 1% 7 0% 0 0% 0 0% 2IL 1% 4 4% 711 9% 101 1% 0 0% 7.5IN 1% 4 4% 434 5% 16 0% 0 0% 5.5KY 1% 5 5% 341 4% 101 1% 0 0% 6.1LA 0% 1 1% 0 0% 0 0% 0 0% 1.6MA 15% 47 52% 4150 53% 3438 44% 2738 35% 87.6MD/DC/DE 5% 10 12% 6081 79% 2633 34% 457 5% 17.2ME 0% 0 0% 0 0% 0 0% 0 0% 1MI 2% 5 6% 2520 32% 328 4% 0 0% 8.1MO 0% 2 2% 329 4% 0 0% 0 0% 4.3MS 0% 0 0% 0 0% 0 0% 0 0% 0.7NC 2% 4 4% 1706 22% 699 9% 76 0% 14.7NH/VT 1% 3 3% 461 5% 190 2% 64 0% 43.3NJ 16% 20 22% 7099 92% 6261 81% 4562 59% 38.6NY 15% 21 20% 7413 96% 6581 85% 4490 58% 41OH 2% 6 6% 2447 31% 1073 13% 0 0% 9.5PA 11% 17 19% 7143 92% 5681 73% 3056 39% 28.8SC 0% 2 2% 199 2% 2 0% 0 0% 5.3TN 0% 2 2% 24 0% 0 0% 0 0% 2.8TX 0% 1 2% 0 0% 0 0% 0 0% 1.6VA 5% 11 10% 5015 65% 1808 23% 869 11% 26.8WI 0% 2 2% 563 7% 0 0% 0 0% 2.6WV 2% 5 5% 2284 29% 726 9% 0 0% 7.4West 0% 2 3% 325 4% 0 0% 0 0% 2.9Canada 3% 5 5% 3687 47% 1586 20% 8 0% 12.1

K-16
Downwind State : Michigan ; CAMX Source Apportionment Modeling Contributions to 8-hr Violating Counties + Modeled Receptors
Base Case: Total Number of Exceedences (grids-8hrs) = 8753Upwind State: Average
percentcontribution(4-episode)
Highest dailyaverage (ppb)
Highest dailyaverage (%)
Number ofexceedencesreduced >= 2ppb
Percentexceedencesreduced >= 2ppb
Number ofexceedencesreduced >= 5ppb
Percentexceedencesreduced >= 5ppb
Number ofexceedencesreduced >=10 ppb
Percentexceedencesreduced >=10 ppb
Max 8hrcontribution(ppb)
AL 3% 5 6% 3648 41% 1557 17% 0 0% 9.3CT/RI 0% 0 0% 0 0% 0 0% 0 0% 0FL 0% 1 1% 322 3% 0 0% 0 0% 3.4GA 2% 4 4% 3451 39% 595 6% 0 0% 6.3IA 1% 6 7% 650 7% 113 1% 0 0% 8.5IL 31% 32 35% 8108 92% 7812 89% 7006 80% 90.4IN 18% 29 34% 7321 83% 5865 67% 4524 51% 51.1KY 5% 9 9% 4469 51% 2281 26% 964 11% 14LA 1% 6 6% 612 6% 169 1% 3 0% 10.2MA 0% 0 0% 0 0% 0 0% 0 0% 0MD/DC/DE 0% 0 0% 0 0% 0 0% 0 0% 0.2ME 0% 0 0% 0 0% 0 0% 0 0% 0MI 7% 12 13% 3588 40% 2059 23% 1117 12% 55.3MO 7% 11 12% 5653 64% 4375 49% 1577 18% 18.2MS 1% 4 4% 1086 12% 131 1% 8 0% 10.7NC 1% 2 2% 265 3% 0 0% 0 0% 2.5NH/VT 0% 0 0% 0 0% 0 0% 0 0% 0NJ 0% 0 0% 0 0% 0 0% 0 0% 0.1NY 0% 0 0% 0 0% 0 0% 0 0% 0.1OH 3% 15 17% 1659 18% 1337 15% 418 4% 31.3PA 0% 0 0% 0 0% 0 0% 0 0% 0.8SC 1% 2 2% 388 4% 0 0% 0 0% 2.7TN 5% 7 8% 4293 49% 3037 34% 346 3% 13TX 1% 9 10% 1723 19% 230 2% 24 0% 11.5VA 0% 1 1% 0 0% 0 0% 0 0% 1.3WI 5% 12 13% 2593 29% 1663 18% 1024 11% 33.5WV 1% 1 1% 220 2% 0 0% 0 0% 3.9West 7% 13 13% 4437 50% 3678 42% 2131 24% 20.1Canada 0% 0 0% 15 0% 0 0% 0 0% 4.2

K-17
Downwind State : Mississippi ; CAMX Source Apportionment Modeling Contributions to 8-hr Violating Counties + Modeled Receptors
Base Case: Total Number of Exceedences (grids-8hrs) = 904Upwind State: Average
percentcontribution(4-episode)
Highest dailyaverage (ppb)
Highest dailyaverage (%)
Number ofexceedencesreduced >= 2ppb
Percentexceedencesreduced >= 2ppb
Number ofexceedencesreduced >= 5ppb
Percentexceedencesreduced >= 5ppb
Number ofexceedencesreduced >=10 ppb
Percentexceedencesreduced >=10 ppb
Max 8hrcontribution(ppb)
AL 10% 19 20% 553 61% 425 47% 306 33% 29.3CT/RI 0% NA NA 0 0% 0 0% 0 0% 0FL 2% 5 6% 116 12% 88 9% 48 5% 15.3GA 2% 4 4% 250 27% 98 10% 0 0% 8.5IA 0% 2 2% 15 1% 0 0% 0 0% 2.6IL 1% 1 2% 16 1% 11 1% 0 0% 7.9IN 0% 1 1% 0 0% 0 0% 0 0% 0.9KY 1% 3 3% 7 0% 5 0% 0 0% 6.8LA 41% 60 71% 774 85% 772 85% 731 80% 74.5MA 0% NA NA 0 0% 0 0% 0 0% 0MD/DC/DE 0% 0 0% 0 0% 0 0% 0 0% 0ME 0% NA NA 0 0% 0 0% 0 0% 0MI 0% 1 1% 0 0% 0 0% 0 0% 1.8MO 2% 9 10% 270 29% 60 6% 5 0% 10.6MS 21% 25 28% 903 99% 843 93% 598 66% 44.8NC 0% 2 2% 29 3% 29 3% 0 0% 9.6NH/VT 0% NA NA 0 0% 0 0% 0 0% 0NJ 0% 0 0% 0 0% 0 0% 0 0% 0NY 0% 0 0% 0 0% 0 0% 0 0% 0OH 0% 1 1% 7 0% 0 0% 0 0% 4.1PA 0% 0 0% 0 0% 0 0% 0 0% 0.4SC 0% 1 1% 35 3% 0 0% 0 0% 4.8TN 8% 29 32% 453 50% 212 23% 132 14% 44.9TX 4% 7 7% 485 53% 156 17% 25 2% 12.1VA 0% 0 0% 0 0% 0 0% 0 0% 1.4WI 0% 0 0% 0 0% 0 0% 0 0% 0.1WV 0% 0 0% 0 0% 0 0% 0 0% 1.3West 7% 21 24% 592 65% 331 36% 104 11% 37.1Canada 0% 0 0% 0 0% 0 0% 0 0% 0.3

K-18
Downwind State : Missouri ; CAMX Source Apportionment Modeling Contributions to 8-hr Violating Counties + Modeled Receptors
Base Case: Total Number of Exceedences (grids-8hrs) = 415Upwind State: Average
percentcontribution(4-episode)
Highest dailyaverage (ppb)
Highest dailyaverage (%)
Number ofexceedencesreduced >= 2ppb
Percentexceedencesreduced >= 2ppb
Number ofexceedencesreduced >= 5ppb
Percentexceedencesreduced >= 5ppb
Number ofexceedencesreduced >=10 ppb
Percentexceedencesreduced >=10 ppb
Max 8hrcontribution(ppb)
AL 6% 14 16% 221 53% 166 40% 41 9% 15.9CT/RI 0% 0 0% 0 0% 0 0% 0 0% 0FL 0% 1 1% 0 0% 0 0% 0 0% 1.2GA 2% 5 6% 164 39% 20 4% 0 0% 5.5IA 0% 1 1% 0 0% 0 0% 0 0% 0.8IL 8% 20 23% 220 53% 171 41% 87 20% 22.7IN 2% 12 14% 45 10% 37 8% 24 5% 14KY 3% 6 7% 174 41% 74 17% 0 0% 9.3LA 2% 10 11% 49 11% 42 10% 1 0% 10MA 0% 0 0% 0 0% 0 0% 0 0% 0MD/DC/DE 0% 0 0% 0 0% 0 0% 0 0% 0.4ME 0% 0 0% 0 0% 0 0% 0 0% 0MI 0% 1 1% 0 0% 0 0% 0 0% 1.2MO 35% 54 60% 415 100% 415 100% 366 88% 60.5MS 2% 6 7% 83 20% 26 6% 0 0% 6.9NC 1% 2 2% 21 5% 0 0% 0 0% 3.4NH/VT 0% 0 0% 0 0% 0 0% 0 0% 0NJ 0% 0 0% 0 0% 0 0% 0 0% 0.2NY 0% 0 0% 0 0% 0 0% 0 0% 0.2OH 1% 3 4% 45 10% 0 0% 0 0% 3.9PA 0% 0 1% 0 0% 0 0% 0 0% 0.5SC 1% 3 3% 31 7% 0 0% 0 0% 2.8TN 12% 24 25% 245 59% 177 42% 127 30% 29.6TX 7% 13 15% 157 37% 153 36% 106 25% 21.4VA 0% 1 1% 0 0% 0 0% 0 0% 0.9WI 0% 0 0% 0 0% 0 0% 0 0% 0WV 0% 1 1% 0 0% 0 0% 0 0% 0.9West 19% 42 45% 199 47% 177 42% 162 39% 48.6Canada 0% 0 0% 0 0% 0 0% 0 0% 0.2

K-19
Downwind State : New Hampshire ; CAMX Source Apportionment Modeling Contributions to 8-hr Violating Counties + Modeled Receptors
Base Case: Total Number of Exceedences (grids-8hrs) = 1280Upwind State: Average
percentcontribution(4-episode)
Highest dailyaverage (ppb)
Highest dailyaverage (%)
Number ofexceedencesreduced >= 2ppb
Percentexceedencesreduced >= 2ppb
Number ofexceedencesreduced >= 5ppb
Percentexceedencesreduced >= 5ppb
Number ofexceedencesreduced >=10 ppb
Percentexceedencesreduced >=10 ppb
Max 8hrcontribution(ppb)
AL 0% 1 1% 0 0% 0 0% 0 0% 1.4CT/RI 9% 13 14% 1080 84% 801 62% 354 27% 25.4FL 0% 1 1% 0 0% 0 0% 0 0% 2GA 0% 0 1% 0 0% 0 0% 0 0% 0.8IA 0% 1 1% 0 0% 0 0% 0 0% 2IL 0% 2 2% 33 2% 0 0% 0 0% 3.7IN 0% 2 2% 24 1% 0 0% 0 0% 2.5KY 0% 1 1% 0 0% 0 0% 0 0% 1.3LA 0% 0 0% 0 0% 0 0% 0 0% 0.3MA 30% 47 52% 1172 91% 1065 83% 947 73% 83.7MD/DC/DE 3% 4 5% 643 50% 6 0% 0 0% 5.2ME 0% 1 1% 20 1% 6 0% 0 0% 6.4MI 2% 3 3% 409 31% 0 0% 0 0% 4.9MO 0% 1 2% 37 2% 0 0% 0 0% 3MS 0% 0 0% 0 0% 0 0% 0 0% 0.7NC 0% 3 3% 61 4% 3 0% 0 0% 5.5NH/VT 18% 35 35% 1017 79% 858 67% 646 50% 68.5NJ 9% 15 16% 943 73% 588 45% 302 23% 25.8NY 12% 13 14% 1280 100% 986 77% 611 47% 20.9OH 1% 5 5% 127 9% 42 3% 0 0% 6.5PA 6% 10 11% 906 70% 455 35% 269 21% 17.6SC 0% 1 1% 0 0% 0 0% 0 0% 1.5TN 0% 1 1% 0 0% 0 0% 0 0% 0.7TX 0% 0 0% 0 0% 0 0% 0 0% 0.4VA 2% 5 5% 296 23% 37 2% 0 0% 8.2WI 0% 2 2% 56 4% 0 0% 0 0% 2.6WV 0% 4 4% 113 8% 0 0% 0 0% 4.8West 0% 2 2% 50 3% 0 0% 0 0% 2.7Canada 5% 7 7% 909 71% 507 39% 0 0% 9.4

K-20
Downwind State : New Jersey ; CAMX Source Apportionment Modeling Contributions to 8-hr Violating Counties + Modeled Receptors
Base Case: Total Number of Exceedences (grids-8hrs) = 11565Upwind State: Average
percentcontribution(4-episode)
Highest dailyaverage (ppb)
Highest dailyaverage (%)
Number ofexceedencesreduced >= 2ppb
Percentexceedencesreduced >= 2ppb
Number ofexceedencesreduced >= 5ppb
Percentexceedencesreduced >= 5ppb
Number ofexceedencesreduced >=10 ppb
Percentexceedencesreduced >=10 ppb
Max 8hrcontribution(ppb)
AL 1% 3 3% 154 1% 2 0% 0 0% 5.3CT/RI 0% 3 4% 5 0% 0 0% 0 0% 4.2FL 0% 2 2% 239 2% 0 0% 0 0% 4.6GA 1% 2 2% 99 0% 0 0% 0 0% 3IA 0% 1 1% 3 0% 0 0% 0 0% 2IL 2% 5 5% 4296 37% 1163 10% 0 0% 7.5IN 2% 4 4% 3814 32% 306 2% 0 0% 8.4KY 2% 7 8% 3539 30% 963 8% 0 0% 9.5LA 0% 1 1% 0 0% 0 0% 0 0% 1.9MA 0% 1 1% 0 0% 0 0% 0 0% 0.8MD/DC/DE 20% 31 36% 9547 82% 8442 72% 6946 60% 70.8ME 0% 0 0% 0 0% 0 0% 0 0% 0.1MI 2% 7 7% 4023 34% 1004 8% 0 0% 9.7MO 1% 3 3% 1442 12% 0 0% 0 0% 3.4MS 0% 1 1% 0 0% 0 0% 0 0% 1.1NC 3% 7 7% 2802 24% 1251 10% 489 4% 24.7NH/VT 0% 0 1% 0 0% 0 0% 0 0% 0.7NJ 15% 41 48% 7967 68% 6589 56% 5153 44% 58.4NY 1% 22 25% 767 6% 7 0% 5 0% 24.4OH 6% 11 12% 7265 62% 4522 39% 1287 11% 16.5PA 26% 33 37% 10518 90% 9655 83% 8251 71% 61.8SC 0% 2 2% 133 1% 1 0% 0 0% 5.3TN 1% 6 6% 2148 18% 437 3% 0 0% 7.1TX 0% 2 2% 248 2% 0 0% 0 0% 2.4VA 9% 20 21% 8300 71% 6213 53% 3191 27% 37.9WI 1% 2 2% 273 2% 0 0% 0 0% 3.8WV 5% 9 9% 6464 55% 4269 36% 1279 11% 16.2West 1% 4 4% 1753 15% 209 1% 0 0% 6.5Canada 1% 4 4% 1735 15% 222 1% 0 0% 6.9

K-21
Downwind State : New York ; CAMX Source Apportionment Modeling Contributions to 8-hr Violating Counties + Modeled Receptors
Base Case: Total Number of Exceedences (grids-8hrs) = 8737Upwind State: Average
percentcontribution(4-episode)
Highest dailyaverage (ppb)
Highest dailyaverage (%)
Number ofexceedencesreduced >= 2ppb
Percentexceedencesreduced >= 2ppb
Number ofexceedencesreduced >= 5ppb
Percentexceedencesreduced >= 5ppb
Number ofexceedencesreduced >=10 ppb
Percentexceedencesreduced >=10 ppb
Max 8hrcontribution(ppb)
AL 0% 1 1% 93 1% 0 0% 0 0% 2.8CT/RI 1% 3 3% 493 5% 201 2% 71 0% 19.9FL 0% 2 2% 158 1% 0 0% 0 0% 4.8GA 0% 1 1% 0 0% 0 0% 0 0% 1.9IA 0% 1 2% 164 1% 0 0% 0 0% 3.6IL 2% 4 5% 2038 23% 817 9% 31 0% 11.1IN 1% 4 4% 1880 21% 389 4% 10 0% 11.4KY 1% 6 6% 1368 15% 628 7% 7 0% 12.4LA 0% 1 0% 0 0% 0 0% 0 0% 1.5MA 0% 1 1% 1 0% 0 0% 0 0% 2.2MD/DC/DE 7% 14 15% 5980 68% 4314 49% 1739 19% 26.7ME 0% 0 0% 0 0% 0 0% 0 0% 0.2MI 2% 5 6% 3294 37% 732 8% 258 2% 18.8MO 1% 3 4% 1100 12% 38 0% 0 0% 6.7MS 0% 1 1% 0 0% 0 0% 0 0% 1.1NC 2% 7 7% 2138 24% 657 7% 180 2% 15.8NH/VT 0% 0 0% 0 0% 0 0% 0 0% 0.8NJ 30% 44 50% 7789 89% 7596 86% 7215 82% 64.3NY 14% 32 33% 6684 76% 5250 60% 3828 43% 54.3OH 4% 8 8% 4007 45% 1918 21% 413 4% 17.9PA 18% 22 23% 7806 89% 7473 85% 6029 69% 54.9SC 0% 1 1% 185 2% 1 0% 0 0% 5.4TN 1% 4 3% 628 7% 13 0% 0 0% 5.6TX 0% 2 2% 60 0% 0 0% 0 0% 2.5VA 6% 10 10% 5464 62% 3373 38% 1071 12% 28.4WI 1% 4 5% 715 8% 52 0% 0 0% 6.1WV 3% 7 7% 2861 32% 1481 16% 272 3% 14.1West 1% 8 9% 953 10% 165 1% 4 0% 10.4Canada 5% 35 40% 2915 33% 1526 17% 790 9% 51.5

K-22
Downwind State : North Carolina ; CAMX Source Apportionment Modeling Contributions to 8-hr Violating Counties + Modeled Receptors
Base Case: Total Number of Exceedences (grids-8hrs) = 13399Upwind State: Average
percentcontribution(4-episode)
Highest dailyaverage (ppb)
Highest dailyaverage (%)
Number ofexceedencesreduced >= 2ppb
Percentexceedencesreduced >= 2ppb
Number ofexceedencesreduced >= 5ppb
Percentexceedencesreduced >= 5ppb
Number ofexceedencesreduced >=10 ppb
Percentexceedencesreduced >=10 ppb
Max 8hrcontribution(ppb)
AL 1% 6 7% 1377 10% 1028 7% 215 1% 28.6CT/RI 0% 0 0% 0 0% 0 0% 0 0% 0.1FL 0% 2 3% 617 4% 85 0% 0 0% 6GA 3% 17 18% 2902 21% 1932 14% 1295 9% 48.6IA 0% 0 0% 0 0% 0 0% 0 0% 0.9IL 1% 2 2% 1386 10% 67 0% 0 0% 8.1IN 1% 2 2% 2306 17% 106 0% 0 0% 6.4KY 4% 9 9% 6510 48% 3213 23% 907 6% 22LA 0% 3 3% 455 3% 45 0% 0 0% 6.7MA 0% 0 0% 0 0% 0 0% 0 0% 0.1MD/DC/DE 1% 2 2% 991 7% 2 0% 0 0% 5.1ME 0% 0 0% 0 0% 0 0% 0 0% 0MI 1% 3 3% 906 6% 288 2% 0 0% 7.8MO 0% 2 2% 589 4% 73 0% 0 0% 5.9MS 0% 2 2% 343 2% 1 0% 0 0% 5NC 55% 64 63% 12939 96% 12675 94% 12469 93% 121.6NH/VT 0% 0 0% 0 0% 0 0% 0 0% 0.1NJ 0% 1 1% 0 0% 0 0% 0 0% 1.5NY 0% 1 1% 0 0% 0 0% 0 0% 1.3OH 4% 9 10% 5043 37% 2288 17% 1044 7% 28.9PA 2% 3 3% 3105 23% 461 3% 0 0% 6.8SC 9% 17 18% 7700 57% 5506 41% 3469 25% 49.9TN 6% 14 15% 5827 43% 3357 25% 1436 10% 53.7TX 1% 4 4% 1306 9% 235 1% 0 0% 6.7VA 6% 15 14% 9136 68% 4523 33% 1620 12% 34.9WI 0% 0 0% 0 0% 0 0% 0 0% 0.9WV 3% 5 5% 5664 42% 2203 16% 183 1% 15.8West 1% 4 5% 1428 10% 333 2% 0 0% 7.1Canada 0% 1 1% 0 0% 0 0% 0 0% 1.3

K-23
Downwind State : Ohio ; CAMX Source Apportionment Modeling Contributions to 8-hr Violating Counties + Modeled Receptors
Base Case: Total Number of Exceedences (grids-8hrs) = 14091Upwind State: Average
percentcontribution(4-episode)
Highest dailyaverage (ppb)
Highest dailyaverage (%)
Number ofexceedencesreduced >= 2ppb
Percentexceedencesreduced >= 2ppb
Number ofexceedencesreduced >= 5ppb
Percentexceedencesreduced >= 5ppb
Number ofexceedencesreduced >=10 ppb
Percentexceedencesreduced >=10 ppb
Max 8hrcontribution(ppb)
AL 3% 11 12% 4287 30% 1583 11% 1166 8% 21.9CT/RI 0% 0 0% 0 0% 0 0% 0 0% 0FL 1% 3 3% 1379 9% 0 0% 0 0% 3.8GA 2% 3 3% 4535 32% 22 0% 0 0% 5.4IA 0% 1 1% 31 0% 0 0% 0 0% 2.9IL 4% 10 11% 5750 40% 3756 26% 1324 9% 18IN 11% 17 19% 9951 70% 8344 59% 4909 34% 31KY 15% 25 27% 12430 88% 10223 72% 6113 43% 52.8LA 1% 12 13% 990 7% 569 4% 227 1% 13.9MA 0% 0 0% 0 0% 0 0% 0 0% 0MD/DC/DE 0% 0 0% 0 0% 0 0% 0 0% 1.4ME 0% 0 0% 0 0% 0 0% 0 0% 0MI 6% 19 21% 3394 24% 3047 21% 2737 19% 42.2MO 1% 6 6% 1695 12% 293 2% 46 0% 14.4MS 1% 9 10% 1180 8% 535 3% 0 0% 9.7NC 2% 3 3% 3988 28% 380 2% 0 0% 9NH/VT 0% 0 0% 0 0% 0 0% 0 0% 0NJ 0% 0 0% 0 0% 0 0% 0 0% 0.2NY 0% 0 0% 0 0% 0 0% 0 0% 0.6OH 33% 44 51% 13407 95% 12707 90% 11664 82% 72PA 1% 8 8% 811 5% 431 3% 135 0% 31.9SC 1% 1 2% 713 5% 0 0% 0 0% 4.6TN 7% 13 14% 9384 66% 5177 36% 2749 19% 27TX 0% 8 9% 392 2% 80 0% 0 0% 9.6VA 1% 5 6% 2917 20% 273 1% 61 0% 13.9WI 0% 2 2% 389 2% 60 0% 0 0% 6.7WV 8% 30 33% 5389 38% 3917 27% 2678 19% 67.8West 1% 5 6% 1419 10% 347 2% 10 0% 10.6Canada 1% 2 2% 1237 8% 212 1% 12 0% 11.2

K-24
Downwind State : Oklahoma ; CAMX Source Apportionment Modeling Contributions to 8-hr Violating Counties + Modeled Receptors
Base Case: Total Number of Exceedences (grids-8hrs) = 294Upwind State: Average
percentcontribution(4-episode)
Highest dailyaverage (ppb)
Highest dailyaverage (%)
Number ofexceedencesreduced >= 2ppb
Percentexceedencesreduced >= 2ppb
Number ofexceedencesreduced >= 5ppb
Percentexceedencesreduced >= 5ppb
Number ofexceedencesreduced >=10 ppb
Percentexceedencesreduced >=10 ppb
Max 8hrcontribution(ppb)
AL 3% 7 8% 74 25% 54 18% 0 0% 7.8CT/RI 0% NA NA 0 0% 0 0% 0 0% 0FL 1% 4 5% 96 32% 0 0% 0 0% 4.2GA 1% 4 4% 33 11% 0 0% 0 0% 3.6IA 0% 0 0% 0 0% 0 0% 0 0% 0.2IL 0% 0 1% 0 0% 0 0% 0 0% 0.7IN 0% 0 0% 0 0% 0 0% 0 0% 0.3KY 0% 0 1% 0 0% 0 0% 0 0% 0.5LA 7% 13 16% 189 64% 140 47% 62 21% 13.3MA 0% NA NA 0 0% 0 0% 0 0% 0MD/DC/DE 0% 0 0% 0 0% 0 0% 0 0% 0ME 0% NA NA 0 0% 0 0% 0 0% 0MI 0% 0 0% 0 0% 0 0% 0 0% 0.1MO 1% 1 2% 0 0% 0 0% 0 0% 1.7MS 3% 7 8% 100 34% 54 18% 0 0% 8.2NC 0% 1 1% 0 0% 0 0% 0 0% 0.5NH/VT 0% NA NA 0 0% 0 0% 0 0% 0NJ 0% NA NA 0 0% 0 0% 0 0% 0NY 0% 0 0% 0 0% 0 0% 0 0% 0OH 0% 0 0% 0 0% 0 0% 0 0% 0.1PA 0% 0 0% 0 0% 0 0% 0 0% 0SC 0% 1 1% 0 0% 0 0% 0 0% 1TN 1% 2 2% 52 17% 0 0% 0 0% 2.8TX 19% 29 33% 294 100% 289 98% 186 63% 29.8VA 0% 0 0% 0 0% 0 0% 0 0% 0.1WI 0% 0 0% 0 0% 0 0% 0 0% 0WV 0% 0 0% 0 0% 0 0% 0 0% 0West 63% 59 63% 294 100% 294 100% 294 100% 73.2Canada 0% 0 0% 0 0% 0 0% 0 0% 0

K-25
Downwind State : Pennsylvania ; CAMX Source Apportionment Modeling Contributions to 8-hr Violating Counties + Modeled Receptors
Base Case: Total Number of Exceedences (grids-8hrs) = 24806Upwind State: Average
percentcontribution(4-episode)
Highest dailyaverage (ppb)
Highest dailyaverage (%)
Number ofexceedencesreduced >= 2ppb
Percentexceedencesreduced >= 2ppb
Number ofexceedencesreduced >= 5ppb
Percentexceedencesreduced >= 5ppb
Number ofexceedencesreduced >=10 ppb
Percentexceedencesreduced >=10 ppb
Max 8hrcontribution(ppb)
AL 1% 7 8% 3557 14% 1325 5% 300 1% 12CT/RI 0% 0 0% 0 0% 0 0% 0 0% 1.3FL 0% 1 1% 484 1% 0 0% 0 0% 3.3GA 1% 2 2% 2468 9% 0 0% 0 0% 3.7IA 0% 1 1% 40 0% 0 0% 0 0% 2.6IL 3% 7 7% 8713 35% 4472 18% 554 2% 16.3IN 4% 8 9% 12013 48% 5809 23% 1270 5% 14.1KY 5% 10 11% 12785 51% 8127 32% 2779 11% 20LA 1% 9 10% 1130 4% 856 3% 221 0% 11.7MA 0% 0 0% 0 0% 0 0% 0 0% 0.1MD/DC/DE 6% 31 37% 7971 32% 5993 24% 4241 17% 49.7ME 0% 0 0% 0 0% 0 0% 0 0% 0MI 2% 8 9% 5761 23% 2681 10% 588 2% 30.1MO 1% 4 5% 4457 17% 697 2% 0 0% 8.2MS 1% 6 7% 1242 5% 595 2% 37 0% 11.2NC 2% 11 13% 6864 27% 1056 4% 3 0% 11.3NH/VT 0% 0 0% 0 0% 0 0% 0 0% 0NJ 1% 17 19% 1348 5% 666 2% 315 1% 39.8NY 1% 5 6% 2071 8% 237 0% 8 0% 11.3OH 15% 18 20% 20038 80% 17449 70% 12009 48% 55.3PA 35% 59 69% 22584 91% 21494 86% 19948 80% 92SC 1% 1 1% 4 0% 0 0% 0 0% 2.1TN 2% 5 5% 9829 39% 2078 8% 48 0% 12.9TX 0% 3 3% 236 0% 0 0% 0 0% 4.7VA 5% 14 16% 11072 44% 6097 24% 2644 10% 33.8WI 0% 2 2% 543 2% 36 0% 0 0% 7.4WV 12% 26 28% 16850 67% 12987 52% 7776 31% 63.3West 1% 5 6% 3575 14% 1128 4% 0 0% 8.8Canada 1% 3 4% 3583 14% 566 2% 24 0% 12.7

K-26
Downwind State : Rhode Island ; CAMX Source Apportionment Modeling Contributions to 8-hr Violating Counties + Modeled Receptors
Base Case: Total Number of Exceedences (grids-8hrs) = 947Upwind State: Average
percentcontribution(4-episode)
Highest dailyaverage (ppb)
Highest dailyaverage (%)
Number ofexceedencesreduced >= 2ppb
Percentexceedencesreduced >= 2ppb
Number ofexceedencesreduced >= 5ppb
Percentexceedencesreduced >= 5ppb
Number ofexceedencesreduced >=10 ppb
Percentexceedencesreduced >=10 ppb
Max 8hrcontribution(ppb)
AL 0% 1 1% 0 0% 0 0% 0 0% 1.5CT/RI 22% 30 34% 883 93% 826 87% 729 76% 35.9FL 0% 1 1% 17 1% 0 0% 0 0% 3.1GA 0% 1 1% 0 0% 0 0% 0 0% 1IA 0% 1 1% 0 0% 0 0% 0 0% 1.6IL 1% 5 4% 147 15% 21 2% 0 0% 6.2IN 1% 3 3% 149 15% 17 1% 0 0% 5.6KY 1% 3 3% 23 2% 19 2% 0 0% 5.6LA 0% 0 0% 0 0% 0 0% 0 0% 0.6MA 0% 1 2% 12 1% 0 0% 0 0% 2.5MD/DC/DE 5% 9 11% 587 61% 325 34% 45 4% 15.2ME 0% 0 0% 0 0% 0 0% 0 0% 0MI 2% 3 4% 183 19% 23 2% 0 0% 5.9MO 1% 2 2% 75 7% 0 0% 0 0% 3.3MS 0% 0 0% 0 0% 0 0% 0 0% 0.6NC 2% 6 7% 138 14% 75 7% 1 0% 10.4NH/VT 0% 0 0% 0 0% 0 0% 0 0% 0.9NJ 16% 18 19% 917 96% 814 85% 579 61% 36.4NY 20% 26 24% 940 99% 922 97% 799 84% 33.9OH 4% 9 9% 427 45% 281 29% 18 1% 10.6PA 12% 21 23% 898 94% 772 81% 373 39% 24.3SC 0% 1 1% 32 3% 0 0% 0 0% 3.3TN 0% 1 1% 12 1% 0 0% 0 0% 3.2TX 0% 1 1% 0 0% 0 0% 0 0% 1.3VA 5% 11 12% 550 58% 237 25% 69 7% 18.6WI 1% 2 2% 64 6% 0 0% 0 0% 2.5WV 3% 6 7% 364 38% 151 15% 0 0% 7.4West 1% 2 2% 7 0% 0 0% 0 0% 2.1Canada 3% 6 6% 368 38% 130 13% 0 0% 7.3

K-27
Downwind State : South Carolina ; CAMX Source Apportionment Modeling Contributions to 8-hr Violating Counties + Modeled Receptors
Base Case: Total Number of Exceedences (grids-8hrs) = 2465Upwind State: Average
percentcontribution(4-episode)
Highest dailyaverage (ppb)
Highest dailyaverage (%)
Number ofexceedencesreduced >= 2ppb
Percentexceedencesreduced >= 2ppb
Number ofexceedencesreduced >= 5ppb
Percentexceedencesreduced >= 5ppb
Number ofexceedencesreduced >=10 ppb
Percentexceedencesreduced >=10 ppb
Max 8hrcontribution(ppb)
AL 4% 10 11% 1021 41% 552 22% 118 4% 19.6CT/RI 0% 0 0% 0 0% 0 0% 0 0% 0.1FL 0% 3 4% 57 2% 0 0% 0 0% 3.5GA 15% 33 36% 1858 75% 1263 51% 798 32% 61.1IA 0% 0 0% 0 0% 0 0% 0 0% 0.2IL 0% 2 2% 97 3% 0 0% 0 0% 4IN 0% 2 2% 31 1% 0 0% 0 0% 2.5KY 3% 9 10% 1127 45% 230 9% 7 0% 10.2LA 1% 7 8% 229 9% 11 0% 0 0% 8.3MA 0% 0 0% 0 0% 0 0% 0 0% 0.1MD/DC/DE 0% 0 1% 0 0% 0 0% 0 0% 0.7ME 0% 0 0% 0 0% 0 0% 0 0% 0MI 0% 0 0% 0 0% 0 0% 0 0% 1.1MO 0% 2 3% 104 4% 0 0% 0 0% 3.2MS 1% 4 5% 286 11% 0 0% 0 0% 5NC 13% 33 37% 1875 76% 1501 60% 962 39% 44.5NH/VT 0% 0 0% 0 0% 0 0% 0 0% 0NJ 0% 1 1% 0 0% 0 0% 0 0% 0.6NY 0% 1 1% 0 0% 0 0% 0 0% 0.6OH 1% 4 5% 530 21% 65 2% 5 0% 12.8PA 0% 2 2% 3 0% 0 0% 0 0% 2SC 45% 62 70% 2355 95% 2316 93% 2283 92% 79.6TN 10% 14 15% 1639 66% 1351 54% 920 37% 25.9TX 1% 4 4% 533 21% 43 1% 0 0% 5.3VA 1% 4 4% 550 22% 8 0% 0 0% 5.5WI 0% 0 0% 0 0% 0 0% 0 0% 0.4WV 1% 4 4% 560 22% 30 1% 0 0% 6.2West 1% 4 4% 444 18% 78 3% 0 0% 6.8Canada 0% 0 0% 0 0% 0 0% 0 0% 0.4

K-28
Downwind State : Tennessee ; CAMX Source Apportionment Modeling Contributions to 8-hr Violating Counties + Modeled Receptors
Base Case: Total Number of Exceedences (grids-8hrs) = 9244Upwind State: Average
percentcontribution(4-episode)
Highest dailyaverage (ppb)
Highest dailyaverage (%)
Number ofexceedencesreduced >= 2ppb
Percentexceedencesreduced >= 2ppb
Number ofexceedencesreduced >= 5ppb
Percentexceedencesreduced >= 5ppb
Number ofexceedencesreduced >=10 ppb
Percentexceedencesreduced >=10 ppb
Max 8hrcontribution(ppb)
AL 7% 21 24% 3529 38% 2506 27% 1872 20% 76.3CT/RI 0% 0 0% 0 0% 0 0% 0 0% 0.1FL 0% 4 5% 264 2% 21 0% 0 0% 5.3GA 5% 16 16% 3711 40% 2330 25% 1529 16% 44.7IA 0% 1 1% 21 0% 0 0% 0 0% 3IL 1% 8 8% 998 10% 493 5% 63 0% 16.7IN 1% 6 7% 1109 11% 499 5% 65 0% 12.9KY 8% 16 15% 5265 56% 3721 40% 2482 26% 51.5LA 1% 8 10% 1772 19% 798 8% 32 0% 13.2MA 0% 0 0% 0 0% 0 0% 0 0% 0.1MD/DC/DE 0% 0 0% 0 0% 0 0% 0 0% 0.7ME 0% 0 0% 0 0% 0 0% 0 0% 0MI 0% 1 1% 204 2% 39 0% 0 0% 7MO 1% 6 6% 1410 15% 303 3% 5 0% 10.7MS 2% 21 24% 2013 21% 828 8% 167 1% 33.7NC 3% 12 13% 3805 41% 1359 14% 323 3% 33.9NH/VT 0% 0 0% 0 0% 0 0% 0 0% 0NJ 0% 1 1% 0 0% 0 0% 0 0% 0.8NY 0% 0 1% 0 0% 0 0% 0 0% 0.6OH 3% 8 8% 1469 15% 900 9% 648 7% 33.5PA 0% 1 1% 36 0% 0 0% 0 0% 2.4SC 3% 12 12% 2171 23% 1179 12% 701 7% 21.3TN 54% 49 54% 9244 100% 9204 99% 9061 98% 120TX 3% 6 7% 2812 30% 2032 21% 103 1% 12.6VA 1% 2 2% 588 6% 203 2% 85 0% 22.3WI 0% 0 0% 0 0% 0 0% 0 0% 1.4WV 1% 3 3% 1003 10% 428 4% 218 2% 20.3West 5% 26 28% 3795 41% 2724 29% 1226 13% 36.2Canada 0% 0 0% 0 0% 0 0% 0 0% 1.1

K-29
Downwind State : Texas ; CAMX Source Apportionment Modeling Contributions to 8-hr Violating Counties + Modeled Receptors
Base Case: Total Number of Exceedences (grids-8hrs) = 4867Upwind State: Average
percentcontribution(4-episode)
Highest dailyaverage (ppb)
Highest dailyaverage (%)
Number ofexceedencesreduced >= 2ppb
Percentexceedencesreduced >= 2ppb
Number ofexceedencesreduced >= 5ppb
Percentexceedencesreduced >= 5ppb
Number ofexceedencesreduced >=10 ppb
Percentexceedencesreduced >=10 ppb
Max 8hrcontribution(ppb)
AL 1% 6 6% 538 11% 293 6% 0 0% 9.3CT/RI 0% NA NA 0 0% 0 0% 0 0% 0FL 0% 5 6% 391 8% 15 0% 0 0% 5.7GA 0% 3 4% 468 9% 0 0% 0 0% 4IA 0% 0 0% 0 0% 0 0% 0 0% 0.4IL 0% 0 1% 0 0% 0 0% 0 0% 1.5IN 0% 0 0% 0 0% 0 0% 0 0% 0.7KY 0% 0 0% 0 0% 0 0% 0 0% 0.8LA 7% 15 17% 3215 66% 1809 37% 1045 21% 25.9MA 0% NA NA 0 0% 0 0% 0 0% 0MD/DC/DE 0% 0 0% 0 0% 0 0% 0 0% 0ME 0% NA NA 0 0% 0 0% 0 0% 0MI 0% 0 0% 0 0% 0 0% 0 0% 0.1MO 1% 1 1% 37 0% 0 0% 0 0% 2.4MS 1% 5 6% 663 13% 281 5% 0 0% 9.8NC 0% 0 0% 0 0% 0 0% 0 0% 0.4NH/VT 0% NA NA 0 0% 0 0% 0 0% 0NJ 0% NA NA 0 0% 0 0% 0 0% 0NY 0% NA NA 0 0% 0 0% 0 0% 0OH 0% 0 0% 0 0% 0 0% 0 0% 0.1PA 0% 0 0% 0 0% 0 0% 0 0% 0SC 0% 0 0% 0 0% 0 0% 0 0% 0.7TN 0% 1 1% 9 0% 0 0% 0 0% 2.2TX 84% 70 73% 4867 100% 4867 100% 4867 100% 129.3VA 0% 0 0% 0 0% 0 0% 0 0% 0.1WI 0% 0 0% 0 0% 0 0% 0 0% 0.2WV 0% 0 0% 0 0% 0 0% 0 0% 0West 4% 4 4% 3029 62% 783 16% 0 0% 9.4Canada 0% 0 0% 0 0% 0 0% 0 0% 0

K-30
Downwind State : Virginia ; CAMX Source Apportionment Modeling Contributions to 8-hr Violating Counties + Modeled Receptors
Base Case: Total Number of Exceedences (grids-8hrs) = 3828Upwind State: Average
percentcontribution(4-episode)
Highest dailyaverage (ppb)
Highest dailyaverage (%)
Number ofexceedencesreduced >= 2ppb
Percentexceedencesreduced >= 2ppb
Number ofexceedencesreduced >= 5ppb
Percentexceedencesreduced >= 5ppb
Number ofexceedencesreduced >=10 ppb
Percentexceedencesreduced >=10 ppb
Max 8hrcontribution(ppb)
AL 1% 8 9% 410 10% 271 7% 42 1% 11CT/RI 0% 0 0% 0 0% 0 0% 0 0% 0.3FL 0% 2 3% 51 1% 0 0% 0 0% 2.4GA 1% 8 8% 482 12% 343 8% 144 3% 14.1IA 0% 0 0% 0 0% 0 0% 0 0% 1.1IL 1% 3 3% 707 18% 80 2% 0 0% 6.8IN 2% 5 5% 892 23% 252 6% 0 0% 9.7KY 3% 7 7% 1238 32% 525 13% 169 4% 21LA 0% 2 2% 16 0% 0 0% 0 0% 2.4MA 0% 0 0% 0 0% 0 0% 0 0% 0.2MD/DC/DE 11% 24 26% 2312 60% 1743 45% 1243 32% 60.2ME 0% 0 0% 0 0% 0 0% 0 0% 0MI 1% 3 3% 739 19% 115 3% 0 0% 7.2MO 0% 2 2% 141 3% 0 0% 0 0% 4.2MS 0% 1 1% 0 0% 0 0% 0 0% 2NC 8% 41 45% 1681 43% 1105 28% 794 20% 52NH/VT 0% 0 0% 0 0% 0 0% 0 0% 0.1NJ 1% 2 3% 29 0% 0 0% 0 0% 3NY 1% 2 2% 142 3% 0 0% 0 0% 2.5OH 3% 8 8% 1826 47% 919 24% 23 0% 11.2PA 5% 8 8% 2401 62% 1733 45% 314 8% 26.3SC 1% 4 4% 443 11% 250 6% 26 0% 10.9TN 2% 7 7% 1062 27% 446 11% 30 0% 10.9TX 0% 2 2% 49 1% 0 0% 0 0% 3.3VA 52% 55 63% 3828 100% 3828 100% 3812 99% 104.9WI 0% 2 2% 18 0% 0 0% 0 0% 3.4WV 4% 13 15% 1804 47% 1075 28% 170 4% 24.9West 0% 3 2% 215 5% 0 0% 0 0% 4.8Canada 1% 3 3% 173 4% 0 0% 0 0% 4.1

K-31
Downwind State : West Virginia ; CAMX Source Apportionment Modeling Contributions to 8-hr Violating Counties + Modeled Receptors
Base Case: Total Number of Exceedences (grids-8hrs) = 2087Upwind State: Average
percentcontribution(4-episode)
Highest dailyaverage (ppb)
Highest dailyaverage (%)
Number ofexceedencesreduced >= 2ppb
Percentexceedencesreduced >= 2ppb
Number ofexceedencesreduced >= 5ppb
Percentexceedencesreduced >= 5ppb
Number ofexceedencesreduced >=10 ppb
Percentexceedencesreduced >=10 ppb
Max 8hrcontribution(ppb)
AL 1% 10 12% 295 14% 79 3% 44 2% 18.8CT/RI 0% 0 0% 0 0% 0 0% 0 0% 0FL 0% 3 3% 112 5% 0 0% 0 0% 4.2GA 1% 3 4% 262 12% 0 0% 0 0% 4.9IA 0% 0 0% 0 0% 0 0% 0 0% 1.1IL 3% 9 10% 653 31% 376 18% 38 1% 11.2IN 5% 13 14% 1224 58% 875 41% 133 6% 17.9KY 20% 29 30% 1792 85% 1447 69% 1135 54% 64.2LA 0% 9 10% 50 2% 33 1% 22 1% 12.1MA 0% 0 0% 0 0% 0 0% 0 0% 0MD/DC/DE 0% 1 1% 0 0% 0 0% 0 0% 1.7ME 0% 0 0% 0 0% 0 0% 0 0% 0MI 3% 12 12% 432 20% 363 17% 241 11% 17.6MO 1% 5 6% 297 14% 30 1% 0 0% 6.2MS 0% 4 4% 79 3% 11 0% 0 0% 5.7NC 2% 9 10% 596 28% 189 9% 20 0% 11.2NH/VT 0% 0 0% 0 0% 0 0% 0 0% 0NJ 0% 0 0% 0 0% 0 0% 0 0% 0.1NY 0% 0 0% 0 0% 0 0% 0 0% 0.6OH 26% 36 37% 2015 96% 1853 88% 1590 76% 52.1PA 1% 2 3% 76 3% 16 0% 2 0% 12SC 1% 2 2% 44 2% 1 0% 0 0% 5TN 4% 13 14% 833 39% 446 21% 256 12% 17.6TX 1% 5 6% 225 10% 141 6% 0 0% 6.3VA 2% 9 10% 571 27% 209 10% 16 0% 13.3WI 0% 2 2% 16 0% 0 0% 0 0% 2.6WV 26% 55 60% 1894 90% 1717 82% 1403 67% 71.7West 1% 4 4% 318 15% 21 1% 0 0% 6.4Canada 1% 2 2% 122 5% 0 0% 0 0% 3.2

K-32
Downwind State : Wisconsin ; CAMX Source Apportionment Modeling Contributions to 8-hr Violating Counties + Modeled Receptors
Base Case: Total Number of Exceedences (grids-8hrs) = 175Upwind State: Average
percentcontribution(4-episode)
Highest dailyaverage (ppb)
Highest dailyaverage (%)
Number ofexceedencesreduced >= 2ppb
Percentexceedencesreduced >= 2ppb
Number ofexceedencesreduced >= 5ppb
Percentexceedencesreduced >= 5ppb
Number ofexceedencesreduced >=10 ppb
Percentexceedencesreduced >=10 ppb
Max 8hrcontribution(ppb)
AL 0% 6 7% 1 0% 1 0% 0 0% 5.9CT/RI 0% NA NA 0 0% 0 0% 0 0% 0FL 0% 0 0% 0 0% 0 0% 0 0% 0.4GA 1% 4 4% 5 2% 0 0% 0 0% 3.5IA 3% 4 5% 48 27% 14 8% 0 0% 7.5IL 42% 44 50% 175 100% 175 100% 174 99% 46.3IN 4% 12 14% 42 24% 27 15% 27 15% 12.9KY 3% 11 13% 28 16% 27 15% 27 15% 12.5LA 1% 4 4% 25 14% 0 0% 0 0% 4.2MA 0% NA NA 0 0% 0 0% 0 0% 0MD/DC/DE 0% 0 0% 0 0% 0 0% 0 0% 0ME 0% NA NA 0 0% 0 0% 0 0% 0MI 0% 0 0% 0 0% 0 0% 0 0% 0.4MO 12% 17 20% 148 84% 134 76% 49 28% 17.5MS 0% 1 1% 0 0% 0 0% 0 0% 1.5NC 0% 1 1% 0 0% 0 0% 0 0% 1.2NH/VT 0% NA NA 0 0% 0 0% 0 0% 0NJ 0% 0 0% 0 0% 0 0% 0 0% 0NY 0% 0 0% 0 0% 0 0% 0 0% 0OH 1% 4 4% 27 15% 0 0% 0 0% 4.4PA 0% 0 0% 0 0% 0 0% 0 0% 0.2SC 0% 1 2% 0 0% 0 0% 0 0% 1.5TN 2% 7 8% 28 16% 1 0% 0 0% 6.6TX 3% 6 7% 66 37% 24 13% 0 0% 7.6VA 0% 1 1% 0 0% 0 0% 0 0% 0.5WI 13% 19 21% 115 65% 73 41% 49 28% 30.1WV 0% 1 2% 0 0% 0 0% 0 0% 1.5West 14% 18 21% 143 81% 108 61% 51 29% 19.9Canada 0% 0 0% 0 0% 0 0% 0 0% 0.1

APPENDIX LNOx CONTROL STRATEGIES -- TABLES OF METRICS

The electronic copies of the data contained in Appendix L are in the form of MicrosoftExcel files. The names of these files are listed below.
Metric 1 for 1-hour daily maximum values for nonattainment areasFile: app-l1.xls
Metric 2 for 1-hour daily maximum values for nonattainment areasFile: app-l2.xls
Metrics 3 and 4 for 1-hour daily maximum values for nonattainment areasFile: app-l3.xls
Metric 1 for 1-hour daily maximum values by State using designated countiesFile: app-l4.xls
Metric 2 for 1-hour daily maximum values by State using designated countiesFile: app-l5.xls
Metrics 3 and 4 for 1-hour daily maximum values by State using designated countiesFile: app-l6.xls
Metric 1 for 8-hour daily maximum values by State using violating countiesFile: app-l7.xls
Metric 2 for 8-hour daily maximum values by State using violating countiesFile: app-l8.xls
Metrics 3 and 4 for 8-hour daily maximum values by State using violating countiesFile: app-l9.xls

APPENDIX MTRANSPORT SCENARIOS -- TABLES OF METRICS

The electronic copies of the data contained in Appendix M are in the form of MicrosoftExcel files. The names of these files are listed below.
Metrics 1 and 3 for Northeast "transport" analysisFile: app-m1.xls
Metrics 1 and 3 for the Illinois, Indiana, Wisconsin "transport" analysisFile: app-m2.xls
Metrics 1 and 3 for the Georgia "transport" analysisFile: app-m3.xls


![Toward Technical Debt Aware Software Modeling · ed code were measured with SonarQube [7]. The SonarQube operationalization of the SQALE quality model [27] calculates technical debt](https://img.dokumen.tips/doc/110x75/5f08d2857e708231d423e390/toward-technical-debt-aware-software-modeling-ed-code-were-measured-with-sonarqube.jpg)