Embed Size (px)
Citation preview

Air Quality in Kuala Lumpur Urban Environment
Mohd Talib Latif, Liew Juneng, Murnira Othman, Nor Hafizah Baharudin, Azliyana Azhari, Diana Abdul Halim, Jenny Stocker, Kate Johnson, Nor Azura Sulong, Fatimah Ahamad, Mohd Shahrul Mohd Nadzir, Kemal Maulana
Alhasa, Haris Hafizal, Ahmad Fariz Mohamad

Presentation Outline
• Continuous Air Quality Monitoring System (CAQMS)
• Atmospheric Dispersion Modelling System (ADMS)
• Low Cost Air Quality Sensor
• PM2.5 and Its Composition
• Haze Episode
• Study on VOCs (BTEX) in ambient air
• Conclusion

New Air Quality Monitoring Station (2017-
Pakar Scieno TW Sdn Bhd
(2017 – Present)

Continuous Air Quality Monitoring System, CQMS in the Klang Valley (2017-)

Haze Episode

Land use changes for Kuala Lumpur Extended Mega Urban Regions
(KLEMUR)
Land use Activity
Area (KM2)
2002 2015
Water bodies 177 94
Vegetation 9721 9334
Built-up Lands 2075 2554

PM10 (µg/m3) CO (ppb) SO2 (ppb)
NO (ppb)NO2 (ppb)O3 (ppb)

Atmospheric Dispersion Modelling System (ADMS)

Emission rate for point source pollution for Kuala Lumpur Urban Environment

Emission rate for road source pollution in grid for Kuala Lumpur Urban Environment

Model Verification PM10
O3
NO2
NOx Comparisons between
modelled and observed
concentrations of air
pollutants
Model perform good
agreement
2 Stations in Kuala Lumpur:
- Cheras
- Batu Muda
1 Station in near to KL:
- Petaling Jaya

Air Quality Maps
• Daily PM10 concentrations
FORECASTING APPLICATIONS
• March 2014 PM10 concentrations
© OpenStreetMap (and) contributors, CC-
BY-SA
Legend
PM10_March2014
71
72 - 75
76 - 80
81 - 85
86 - 95
96 - 110
© OpenStreetMap (and) contributors, CC-BY-SA
© OpenStreetMap (and) contributors, CC-
BY-SA
Legend
PM10_March2014
71
72 - 75
76 - 80
81 - 85
86 - 95
96 - 110
POLICY APPLICATIONS

Air Quality Maps
• Daily NO2 concentrations • Daily O3 concentrations

Low Cost Sensor

Low Cost Air Quality Sensor

Hardware Development
Parameters Sensors Range Detection limit
correlation Resolution Accuracy
PM1, PM2.5 & PM10
Alphasense OPC
0-1200 µgm-3 1 µgm-3 r=0.75 1 µgm-3 ~<± 5 µgm-
3
Nitrogen Dioxide
Alphasense EC
0- 5 ppb 2 ppb r=0.82 1 ppb ~<± 5 ppb
Carbon Monoxide
Alphasense EC
0-30 ppm 0.02 ppm r=0.88 0.02 ppm ~± 5 ppb
Sulphur Dioxide
Alphasense EC
0-200 ppb 0.2 ppb r=0.88 1 ppb ~<± 5 ppb
Ozone Alphasense EC
0-200 ppb 2 ppb r=0.82 1 ppb ~<± 5 ppb
Technical specification

PM2.5PM10 NO2
O3 CO
r=0.75 r=0.81
r=0.84 r=0.72 r=0.90
SO2
r=0.78
Sensor Calibration – Comparison with PSTW-DOE Instrument

Air Quality Dashboard
https://www.innosens.com.my/dashboard/main.php 13th October, 2019

PM2.5 Monitoring

Average PM2.5 Concentration
USEPA Standard
WHO Guideline
Sulong et al., 2017, Sci Total Environ)

Biomass Burning Episode

PM2.5: Inorganic Composition

Atmospheric Chemistry and Air Pollution Research Group
PM2.5: Organic Composition

Fujii et al. 2015, Atmos Chem Phys
PM2.5: Organic Composition

0.0
0.5
1.0
1.5
2.0
2.5
3.0
3.5
4.0
SW INT I NE INT II HAZE
Co
nce
ntr
atio
n (
ng
m-3
)
Seasons
BgP
DhA
ICP
BaP
BkF
BbF
CYR
BaA
PYR
FLT
ANT
NAP = Napthalene; ACY =
Acenapthelyne; ACP =
Acenapthene; FLR = flourene;
PHE = Phenanthrene; ANT =
Anthracene; FLT =
Fluoranthene; PYR = Pyrene;
BaA = Benzo[a]anthracene;
CYR = Chrysene; BbF =
Benzo[b]fluoranthene; BkF =
Benzo[k]fluoranthene; BaP =
Benzo[a]pyrene; IcP =
Indeno[1,2,3cd]pyrene; DhA =
Dibenzo[a,h]anthracene; BgP
= Benzo[g,h,i]perylene
Sulong et al., 2018, Chemosphere
USEPA Priority Pollutants 16 PAHs

Diagnostic Ratio
Sulong et al., 2018, Chemosphere

Sulong et al., 2018, Chemosphere

BTEX Monitoring

BTEX Continuous Monitoring
AMA Online Gas Chromatography GC 5000 BTX (AMA Instruments, Germany)
• Suitable for continuous monitoring of VOCs in ambient air in the range C4-C12.
• Capable of monitoring aromatic hydrocarbons i.e. BTEXs
• Using single-tube sample enrichment technology (sorbent tube)
Enrichmenttube
Capillary Column
FIDMFC
Gas Inlet
ComputerEnrichmenttube
Capillary Column
FIDMFC
Gas Inlet
Computer
A system setup for automatic sampling, enrichment and GC analysis.

BTEX Active Sampling
Sorbent tube – Tenax® GR (US EPA TO-17)
Flow rate – 50 mL min-1
Thermal Desorption System (TDS Unity-1 and Ultra Series 2 (Markes, UK) couple to Gas Chromatography (GC)- Mass Spectrometer (MS)(Agilent, USA)
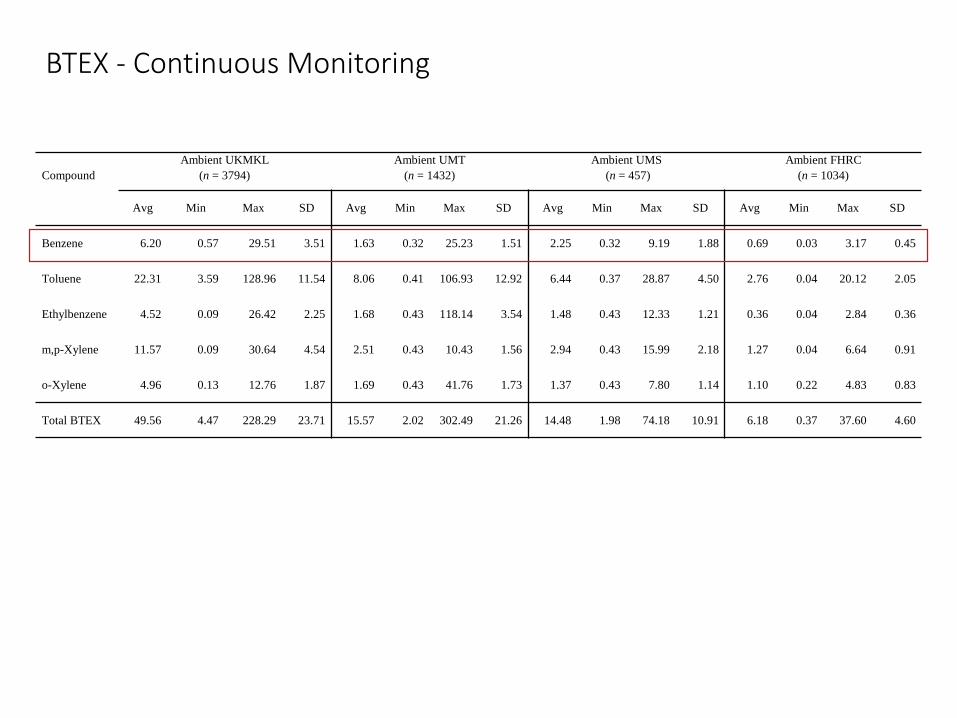
BTEX - Continuous Monitoring
Compound
Ambient UKMKL
(n = 3794)
Ambient UMT
(n = 1432)
Ambient UMS
(n = 457)
Ambient FHRC
(n = 1034)
Avg Min Max SD Avg Min Max SD Avg Min Max SD Avg Min Max SD
Benzene 6.20 0.57 29.51 3.51 1.63 0.32 25.23 1.51 2.25 0.32 9.19 1.88 0.69 0.03 3.17 0.45
Toluene 22.31 3.59 128.96 11.54 8.06 0.41 106.93 12.92 6.44 0.37 28.87 4.50 2.76 0.04 20.12 2.05
Ethylbenzene 4.52 0.09 26.42 2.25 1.68 0.43 118.14 3.54 1.48 0.43 12.33 1.21 0.36 0.04 2.84 0.36
m,p-Xylene 11.57 0.09 30.64 4.54 2.51 0.43 10.43 1.56 2.94 0.43 15.99 2.18 1.27 0.04 6.64 0.91
o-Xylene 4.96 0.13 12.76 1.87 1.69 0.43 41.76 1.73 1.37 0.43 7.80 1.14 1.10 0.22 4.83 0.83
Total BTEX 49.56 4.47 228.29 23.71 15.57 2.02 302.49 21.26 14.48 1.98 74.18 10.91 6.18 0.37 37.60 4.60

Compound
Ambient UKMKL
(n = 13)
Ambient UMT
(n = 12)
Ambient UMS
(n = 8)
Ambient FHRC
(n = 14)
Avg Min Max SD Avg Min Max SD Avg Min Max SD Avg Min Max SD
Benzene 7.48 2.98 12.86 5.51 1.93 0.35 4.02 1.52 1.20 0.10 3.87 1.30 0.38 0.06 1.30 0.44
Toluene 28.10 17.68 45.93 17.43 9.27 4.60 16.63 4.00 9.27 5.87 15.96 4.22 4.63 2.24 5.64 1.08
Ethylbenzene 9.60 5.73 19.50 4.44 2.41 1.38 3.49 0.73 2.20 1.42 3.53 0.82 1.33 0.82 1.59 0.30
m,p-Xylene 13.87 5.86 35.91 10.25 2.28 0.60 5.08 1.77 1.81 0.47 3.88 1.38 0.39 0.13 0.60 0.17
o-Xylene 9.43 5.51 16.66 4.61 11.24 8.18 13.52 2.07 9.60 7.92 12.06 1.55 7.28 4.09 8.44 1.68
Total BTEX 68.48 37.76 130.95 42.24 27.13 15.11 42.74 10.09 24.08 15.78 39.30 9.27 14.01 7.34 15.57 3.67
BTEX –Active Sampling

Compound
Roadside
(n=11)
Petrol Station
(n=8)
Airport
(n=6)
Industrial
(n=13)
Avg Min Max SD Avg Min Max SD Avg Min Max SD Avg Min Max SD
Benzene16.03 6.59 32.89 10.20 10.68 3.61 18.98 5.77 2.00 0.29 2.82 0.89 9.82 7.76 11.41 2.22
Toluene104.57 64.62 163.66 51.54 31.36 15.73 54.64 16.15 7.89 4.52 9.38 1.79 8.37 3.89 19.88 4.71
Ethylbenzene19.98 6.29 42.93 12.96 5.21 3.23 7.49 1.51 2.24 1.21 2.54 0.52 2.67 1.72 4.74 0.99
m,p-Xylene37.85 10.72 88.06 28.03 5.68 1.85 11.71 3.88 0.65 0.30 1.21 0.30 3.70 0.47 14.17 1.64
o-Xylene14.68 5.17 29.45 11.84 20.15 16.75 24.93 3.10 12.53 7.28 14.77 2.67 7.54 6.16 10.29 3.57
Total BTEX 193.11 93.39 356.99 114.57 73.08 41.18 117.76 30.41 25.30 13.59 30.72 6.17 32.10 20.00 60.49 13.13
BTEX –Active Sampling – Hotspot site

0
5
10
15
00
:00
01
:00
02
:00
03
:00
04
:00
05
:00
06
:00
07
:00
08
:00
09
:00
10
:00
11
:00
12
:00
13
:00
14
:00
15
:00
16
:00
17
:00
18
:00
19
:00
20
:00
21
:00
22
:00
23
:00
Be
nze
ne
(µ
g/
m3)
Benzene UKMKL UMT UMS FHRC
0
10
20
30
40
00
:00
01
:00
02
:00
03
:00
04
:00
05
:00
06
:00
07
:00
08
:00
09
:00
10
:00
11
:00
12
:00
13
:00
14
:00
15
:00
16
:00
17
:00
18
:00
19
:00
20
:00
21
:00
22
:00
23
:00
To
lue
ne
(µ
g/
m3)
Toluene
0
2
4
6
8
00
:00
01
:00
02
:00
03
:00
04
:00
05
:00
06
:00
07
:00
08
:00
09
:00
10
:00
11
:00
12
:00
13
:00
14
:00
15
:00
16
:00
17
:00
18
:00
19
:00
20
:00
21
:00
22
:00
23
:00
Eth
ylb
en
zen
e (
µg
/m
3)
Ethylbenzene
0
5
10
15
20
00
:00
01
:00
02
:00
03
:00
04
:00
05
:00
06
:00
07
:00
08
:00
09
:00
10
:00
11
:00
12
:00
13
:00
14
:00
15
:00
16
:00
17
:00
18
:00
19
:00
20
:00
21
:00
22
:00
23
:00
m,p
-Xy
len
e (
µg
/m
3)
m,p-Xylene
0
2
4
6
8
00
:00
01
:00
02
:00
03
:00
04
:00
05
:00
06
:00
07
:00
08
:00
09
:00
10
:00
11
:00
12
:00
13
:00
14
:00
15
:00
16
:00
17
:00
18
:00
19
:00
20
:00
21
:00
22
:00
23
:00
o-X
yle
ne
(µ
g/
m3)
Hour
o-XyleneBTEX – Diurnal Concentration

a
Reference Study site Method Benzene Toluene Ethylbenzene m,p-Xylene o-Xylene
This study
UKMKL Kuala Lumpur Continuous sampling 6.20 22.31 4.52 11.57 4.96
UKMKLa Kuala Lumpur Active sampling 7.48 28.1 9.6 13.87 9.43
Kim Oanh et al. (2013) Bangkok,
Thailand
(Roadside)
Active sampling 5.2-11 13-33 2.1-4.4 3.4-12
Phuc and Kim Oanh
(2018)
Hanoi, Vietnam
(Ambient)
Continuous sampling 9 12 4 6 5
Hanoi, Vietnam
(Road side)
Active sampling 25-32 37-44 9-13 22-30 10-12
Giang and Kim Oanh
(2014)
Ho Chi Minh,
Vietnam
(Ambient)
Continuous sampling 6-53 14-170 3-24 5-59 2-21
Srivastava (2005) Delhi, India
(Ambient)
Active sampling 300 34 34 1 1
Masih et al. (2016) Northern India
(Ambient)
Active sampling 15.9 28.2 3.8 2.8
Zhang et al. (2012) Beijing, China
(Ambient)
Active sampling 4.95 9.71 3.23 5.36 2.41
Liu et al. (2013) Beijing, China
(Ambient)
Active sampling 2.68 5.88 1.99 3.31 1.9
Hu et al. (2018) Hufei, China
(Roadside)
Active sampling 10.58 13.29 11.01 9.84 0.96
Hoque et al. 2008 Delhi, India
(Ambient)
Diffusive sampling 48 85 7 30 15
Dehghani et al. 2018 Shiraz, Iran
(Ambient)
Active sampling 26.15 12.97 7.5 19.34 23.38
Hajizadeh et al. (2018) Shiraz, Iran
(Ambient)
Active sampling 21 38 14 41

CDI (mg/kg/day)
BTEX UKMKL UMT UMS FHRC
Benzene 0.0017 0.0004 0.0006 0.0002
Toluene 0.0061 0.0022 0.0018 0.0008
Ethylbenzene 0.0012 0.0005 0.0004 0.0001
m,p-Xylene 0.0032 0.0007 0.0008 0.0003
o-Xylene 0.0014 0.0005 0.0004 0.0003
HQ
BTEX UKMKL UMT UMS FHRC
Benzene 0.1979 0.0520 0.0718 0.0220
Toluene 0.0043 0.0016 0.0013 0.0005
Ethylbenzene 0.0043 0.0016 0.0014 0.0003
m,p-Xylene 0.1089 0.0236 0.0277 0.0120
o-Xylene 0.0467 0.0159 0.0129 0.0104
Hazard Index 0.3621 0.0947 0.1151 0.0452
Hazard Index

Life Time Cancer Risk
CDI (mg/kg/day)
BTEX UKMKL UMT UMS FHRC
Benzene 5.80×10⁻⁴ 1.52×10⁻⁴ 2.11×10⁻⁴ 6.46×10⁻⁵
Ethylbenzene 4.23×10⁻⁴ 1.57 × 10⁻⁴ 1.38×10⁻⁴ 3.37×10⁻⁵
LTCR
UKMKL UMT UMS FHRC
Benzene 1.59×10⁻⁵ 4.16×10⁻⁶ 5.75×10⁻⁶ 1.77×10⁻⁶
Ethylbenzene 1.63×10⁻⁶ 6.05×10⁻⁷ 5.33×10⁻⁷ 1.30×10⁻⁷

Conclusion
• PM2.5 and surface ozone are two major air pollutants in Kuala Lumpur urban environment
• Motor vehicles are the main sources of air pollutants
• Haze episode influences the concentration and composition of PM2.5 that effect the human health.
• BTEX especially from motor vehicles can contribute to the long term carcinogenic effect to population in Kuala Lumpur

THANK YOU
http://www.ukm.my/talib/