Embed Size (px)
Citation preview

Dewhurst Gas Exploration Pilot Expansion Environmental Impact Statement (EIS)
PR117516; Rev 0 / 30 October 2013
Appendix 5
Air Quality Impact Assessment

DEWHURST PILOT EXPANSION AIR QUALITY IMPACT ASSESSMENT
REPORT NO. 13258
VERSION C
OCTOBER 2013
PREPARED FOR
RPS AUSTRALIA ASIA PACIFIC
LEVEL 9, 17 YORK STREET
SYDNEY NSW 2000
AUSTRALIA

DEWHURST PILOT EXPANSION
AIR QUALITY IMPACT ASSESSMENT REPORT NO. 13258 VERSION C
DOCUMENT CONTROL
Version Status Date Prepared By Reviewed By
A Draft 26 August 2013 Phil Henschke John Wassermann
A Draft 2 September 2013 John Wassermann John Wassermann
B Draft 2 October 2013 Phil Henschke John Wassermann
B Final 17 October 2013 John Wassermann John Wassermann
C Final 26 October 2013 John Wassermann John Wassermann
C Final 30 October 2013 John Wassermann John Wassermann
Note
All materials specified by Wilkinson Murray Pty Limited have been selected solely on the basis of acoustic performance.
Any other properties of these materials, such as fire rating, chemical properties etc. should be checked with the
suppliers or other specialised bodies for fitness for a given purpose. The information contained in this document
produced by Wilkinson Murray is solely for the use of the client identified on the front page of this report. Our client
becomes the owner of this document upon full payment of our Tax Invoice for its provision. This document must not
be used for any purposes other than those of the document’s owner. Wilkinson Murray undertakes no duty to or
accepts any responsibility to any third party who may rely upon this document.
Quality Assurance
We are committed to and have implemented AS/NZS ISO 9001:2008 “Quality Management Systems –
Requirements”. This management system has been externally certified and Licence No. QEC 13457
has been issued.
Celebrating 50 Years in 2012
Wilkinson Murray is an independent firm established in 1962, originally as Carr & Wilkinson.
In 1976 Barry Murray joined founding partner Roger Wilkinson and the firm adopted the name which
remains today. From a successful operation in Australia, Wilkinson Murray expanded its reach into
Asia by opening a Hong Kong office early in 2006. 2010 saw the introduction of our Queensland office
and 2011 the introduction of our Orange office to service a growing client base in these regions. From
these offices, Wilkinson Murray services the entire Asia-Pacific region.

DEWHURST PILOT EXPANSION
AIR QUALITY IMPACT ASSESSMENT REPORT NO. 13258 VERSION C
TABLE OF CONTENTS
Page
GLOSSARY OF TERMS
1 INTRODUCTION 1
2 PROJECT BACKGROUND 2
3 LOCAL SETTING 4
4 AIR QUALITY ASSESSMENT CRITERIA 7
5 EXISTING ENVIRONMENT 8
5.1 Local Climate 8
5.2 Local Meteorology 9
5.3 Local Air Quality 12 5.3.1 Particulate Matter 12 5.3.2 Nitrogen dioxide 13 5.3.3 Carbon Monoxide 13
6 APPROACH TO ASSESSMENT 14
6.1 Emission Estimation 14 6.1.1 Construction 14 6.1.2 Operation phase 15 6.1.3 NOx to NO2 conversion 16
6.2 Modelling methodology 16
7 ANALYSIS OF MODELLING RESULTS 17
7.1 Construction Impacts 17
7.2 Operational impacts from Dewhurst 14 and Dewhurst 28 Flares 26 7.2.1 Consideration of Potential Cumulative Impacts 32
8 MITIGATION MEASURES 33
9 CONCLUSIONS 34
10 REFERENCES 35
APPENDIX A – EMISSION INVENTORY
APPENDIX B – SAMPLE OF AUSPLUME OUTPUT FILE

DEWHURST PILOT EXPANSION
AIR QUALITY IMPACT ASSESSMENT REPORT NO. 13258 VERSION C
GLOSSARY OF TERMS
Air Pollutant – Any substance in air that could, in high enough concentration, harm man, other animals,
vegetation, or material. Pollutants may include almost any natural or artificial composition of airborne
matter capable of being airborne.
Air Pollution – The presence of contaminants or pollutant substances in the air that interfere with human
health or welfare, or produce other harmful environmental effects.
Carbon Monoxide (CO) – A colourless, odourless, poisonous gas, produced by incomplete burning of
carbon-based fuels, including gasoline, oil and wood. Carbon monoxide is also produced from incomplete
combustion of many natural and synthetic products. For instance, cigarette smoke contains carbon
monoxide. When carbon monoxide gets into the body, the carbon monoxide combines with chemicals in
the blood and prevents the blood from bringing oxygen to cells, tissues and organs. The body's parts need
oxygen for energy, so high-level exposures to carbon monoxide can cause serious health effects, with
death possible from massive exposures.
Concentration – The relative amount of a substance mixed with another substance. Examples are 5 ppm
of carbon monoxide in air and 1 mg/l of iron in water.
Emission – Release of pollutants into the air from a source. We say sources emit pollutants.
Emission Factor – The relationship between the amount of pollution produced and the amount of raw
material processed. For example, an emission factor for a blast furnace making iron would be the number of pounds of particulates per ton of raw materials.
Emission Inventory – A listing, by source, of the amount of air pollutants discharged into the
atmosphere of a community; used to establish emission standards.
Flow Rate – The rate, expressed in gallons -or litres-per-hour, at which a fluid escapes from a hole or
fissure in a tank. Such measurements are also made of liquid waste, effluent, and surface water
movement.
Fugitive Emissions – Emissions not caught by a capture system.
Nitric Oxide (NO) – A gas formed by combustion under high temperature and high pressure in an
internal combustion engine. NO is converted by sunlight and photochemical processes in ambient air to nitrogen oxide. NO is a precursor of ground-level ozone pollution, or smog.
Nitrogen Dioxide (NO2) – The result of nitric oxide combining with oxygen in the atmosphere; major
component of photochemical smog.
Nitrogen Oxides (NOx) – A criteria air pollutant. Nitrogen oxides are produced from burning fuels,
including gasoline and coal. Nitrogen oxides are smog formers, which react with volatile organic compounds to form smog. Nitrogen oxides are also major components of acid rain.
Particulates; Particulate Matter (PM10) – PM10 is a measure of particles in the atmosphere with a
diameter of less than 10 or equal to a nominal 10 micrometers. A criteria air pollutant. Particulate matter
includes dust, soot and other tiny bits of solid materials that are released into and move around in the air.
Particulates are produced by many sources, including burning of diesel fuels by trucks and buses,
incineration of garbage, mixing and application of fertilizers and pesticides, road construction, industrial
processes such as steel making, mining operations, agricultural burning (field and slash burning), and
operation of fireplaces and woodstoves. Particulate pollution can cause eye, nose and throat irritation and
other health problems.

DEWHURST PILOT EXPANSION
AIR QUALITY IMPACT ASSESSMENT REPORT NO. 13258 VERSION C
Parts Per Billion (ppb)/Parts Per Million (ppm) – Units commonly used to express contamination
ratios, as in establishing the maximum permissible amount of a contaminant in water, land, or air.
Point Source – A stationary location or fixed facility from which pollutants are discharged; any single
identifiable source of pollution; e.g. a pipe, ditch, ship, ore pit, factory smokestack.
Source – Any place or object from which pollutants are released.
Stack – A chimney, smokestack, or vertical pipe that discharges used air.

DEWHURST PILOT EXPANSION PAGE 1
AIR QUALITY IMPACT ASSESSMENT REPORT NO. 13258 VERSION C
1 INTRODUCTION
Santos NSW (Eastern) Pty Ltd (a wholly owned subsidiary of Santos Limited) (Santos) is seeking
consent for the expansion of operations at two petroleum exploration pilots, referred to as Dewhurst
13-18H and Dewhurst 26-31. Works at Dewhurst 13-18H involves redrilling three existing wells to
convert single horizontal wells to triple-stacked horizontal wells, while works at Dewhurst 26-31
involve the construction of two additional wells on new lease areas.
Wilkinson Murray Pty Limited (WM) has been commissioned by RPS Australia to conduct an air quality
assessment of the proposed activity.
Director General Requirements have been issued for the proposed activity and required the following
with regards to air quality:
“Air Quality - including a quantitative assessment of potential:
- construction and operational impacts, with a particular focus on dust emissions
including PM10 emissions and the dust generation from transport;
- risk associated with potential discharges of fugitive and point source emissions for all
stages of the proposal, including risk of environmental harm and risk to human health
and amenity;
- cumulative impacts associated with existing emission sources as well as any currently
approved developments or proposed future developments;
- flaring and/or venting; and
- monitoring and management measures, including real-time air quality monitoring;”

DEWHURST PILOT EXPANSION PAGE 2
AIR QUALITY IMPACT ASSESSMENT REPORT NO. 13258 VERSION C
2 PROJECT BACKGROUND
The proposed activity involves the expansion of operations at the Dewhurst 13-18H and Dewhurst 26-
31 pilots, and operation of both pilots for up to three years. Works at Dewhurst 13-18H involve re-
entering three existing wells to convert single horizontal wells to triple-stacked horizontal wells. Works
at Dewhurst 26-31 involve the construction of two additional wells on new lease areas to expand the
proposed pilot from four to six wells.
The Dewhurst 13-18H Pilot is an existing pilot well set that comprises three vertical wells (Dewhurst
13, 14 and 15) and three single horizontal wells (16H, 17H and 18H). The NSW Department of
Primary Industries (DPI) approved construction, drilling and operation of Dewhurst 13, 14, 15, 16H,
17H and 18H on 21 July 2009 following an REF assessment under Part 5 of the EP&A Act. The wells
operated for a short period in 2011.
Dewhurst 26-29 is a proposed four well pilot which was approved by the NSW Department of Trade
and Investment, Regional Infrastructure and Services (DTIRIS) on 16 August 2013 following a REF
assessment under Part 5 of the EP&A Act. Dewhurst 26-29 is scheduled to be drilled in Q3 2013.
More specifically, the proposed activity includes:
Site preparation
• establishing two 10 metre wide service corridors between Beehive Road and the Dewhurst 30
and 31 lease areas (including clearing of approximately 0.2 hectares of vegetation)
• constructing access roads within the two service corridors at Dewhurst 30 and 31
• establishing the Dewhurst 30 and Dewhurst 31 lease areas each up to approximately one
hectare in size (including approximately two hectares of vegetation clearing)
• removing the existing water gathering system and electrical cable connecting Dewhurst 13,
14 and Dewhurst 15 wells
• preparing the sites and establishing necessary equipment, temporary structures and facilities
on the existing well leases Dewhurst 16H, 17H and 18H and on the new lease areas
Dewhurst 30 and 31 to enable drilling.
Drilling
• drilling an additional two horizontals from existing casing within Dewhurst 16H, 17H and 18H
to convert each well from a single horizontal to a triple-stacked horizontal well targeting the
Bohena, Namoi and Rutley coal seams
• drilling one vertical (Dewhurst 30) and one triple-stacked horizontal (Dewhurst 31) well to
target coal seams within the Maules Creek Formation.
Surface and subsurface facility construction
• preparing the site on the existing well lease Dewhurst 14 to enable installation of a gas flare
and water balance tank
• constructing a new gas and water gathering system connecting all the wells within the
Dewhurst 13-18H Pilot to the existing Dewhurst 14 well lease area (including clearing of
approximately 0.24 hectares of disturbed vegetation)
• extending the existing water and gas gathering system for Dewhurst 26-29 within the service
corridors to Dewhurst 30 and 31
• installing surface and sub-surface infrastructure within the lease areas to connect the wells to

DEWHURST PILOT EXPANSION PAGE 3
AIR QUALITY IMPACT ASSESSMENT REPORT NO. 13258 VERSION C
the Dewhurst 13-18H and Dewhurst 26-31 gas and water gathering system
• installing a gas flare and water balance tank at the existing Dewhurst 14 lease area and a gas
flare at the Dewhurst 28 lease area.
Operation
• operating the Dewhurst 13-18H Pilot and Dewhurst 26-31 Pilot for up to three years from the
commencement of operations at each pilot respectively
• managing the water and gas produced during operation
• undertaking occasional maintenance of the pilots.
Post operation
• on completion of operations, suspending the wells and ancillary infrastructure or
decommissioning them and rehabilitating the well leases.
Flaring of methane gas has the potential to generate air pollutants which can result in adverse affects
on nearby sensitive receptors. This report focuses on the emissions and potential impacts associated
with the construction and operation of the pilot wells at both sites, and flaring as part of the
Dewhurst 13-18H pilot and Dewhurst 26-31 Pilot
Potential air emissions associated with works from the proposed activity would include dust generated
during establishment of the well lease, emissions from vehicle movements to and from the site and
emissions associated with the operation of the flare and wells on the site.
It should be noted that there may be flaring of gas during drilling, although this will be highly
unlikely. There will be a flare and vent tank on site during construction for emergency use only.
Given the improbable nature of this occurrence this has not been assessed.
Additionally there may be fugitive emissions of gas. Fugitive emissions are likely to be very small. To
safeguard against fugitive emissions there will be sensors at transitional points across the well head
and pipe network that will detect changes in pressure levels and trigger investigation and repair in the
event of a leak.
Air emissions generated by the proposed development would include particulate matter, carbon
monoxide, oxides of nitrogen and minor contributions of other pollutants. These pollutants generally
dissipate with distance from the source and are therefore unlikely to affect nearest sensitive receptors
given the separation distances to these receptors, as discussed in the following chapter.

DEWHURST PILOT EXPANSION PAGE 4
AIR QUALITY IMPACT ASSESSMENT REPORT NO. 13258 VERSION C
3 LOCAL SETTING
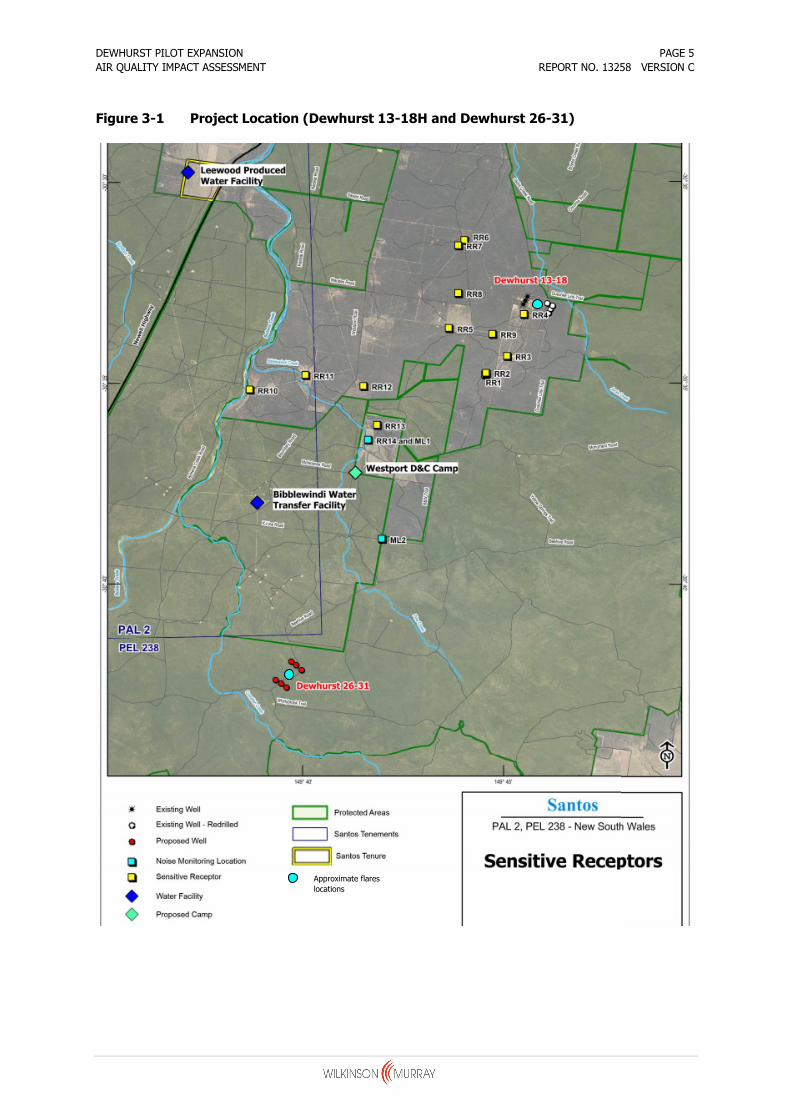
The proposed activity is located between approximately 25km and 44km south of Narrabri and 32km
west-northwest of Boggabri in the Pilliga Forest of NSW (see Figure 3-1). The surrounding land use
consists of predominately forested land (State forest) with some existing coal seam gas (CSG)
infrastructure and grazing land at Dewhurst 13-18H Pilot. In the wider vicinity, the land use is
generally composed of rural activities.
A number of residential properties have been identified located in the vicinity of the proposed flare
location (see Figure 3-1). These properties have been selected to represent sensitive receptors for
this assessment and are most likely to be affected by the potential impacts from the proposed
activity. RR4 (the closest residence) is currently under lease to Santos till December 2015. Due to
the surrounding State forests, the sensitive receivers identified for Dewhurst 13-18H are also the
nearest for Dewhurst 26-31.
DEWHURST PILOT EXPANSION PAGE 5
AIR QUALITY IMPACT ASSESSMENT REPORT NO. 13258 VERSION C
Figure 3-1 Project Location (Dewhurst 13-18H and Dewhurst 26-31)
Approximate flares
locations

DEWHURST PILOT EXPANSION PAGE 6
AIR QUALITY IMPACT ASSESSMENT REPORT NO. 13258 VERSION C
Figure 3-2 presents a three-dimensional representation of the topography in the vicinity of the
proposed activity. The terrain is gently undulating to the east and south of the proposed activity, and
becomes generally flatter to the northwest.
Figure 3-2 Topography surrounding Project Location
Project location

DEWHURST PILOT EXPANSION PAGE 7
AIR QUALITY IMPACT ASSESSMENT REPORT NO. 13258 VERSION C
4 AIR QUALITY ASSESSMENT CRITERIA
Air quality criteria are benchmarks set to protect the general health and amenity of the community in
relation to air quality. This section identifies the relevant air quality criteria that are applicable to the
proposed activity. The air quality goals that are relevant to this study are sourced from the NSW EPA
document "Approved Methods for the Modelling and Assessment of Air Pollutants in NSW" (NSW
DEC, 2005).
Emissions of carbon monoxide (CO) and nitrogen dioxide (NO2) can be expected from the combustion
and flaring of the CSG.
CO enters the bloodstream and reduces oxygen delivery to the body's organs and tissues, and can
impair health due to prolonged exposure at high levels. CO is an odourless gas formed from the
partial oxidation of carbon-containing compounds, commonly as a result of incomplete or inefficient
combustion of fuels containing carbon. CO in the atmosphere is relatively unstable and reacts with
oxygen to form carbon dioxide and ozone.
NO2 can irritate the lungs and lower resistance to respiratory infections such as influenza. NO2 belongs
to a family of reactive gases called nitrogen oxides (NOx). These gases form when fuel is burned at
high temperatures, mainly from motor vehicles, power stations and industrial boilers.
The air quality goals for the relevant criteria pollutants relate to the total pollutant burden in the air
and not just the pollutants from the proposed activity, as such, consideration of background pollutant
levels is required when using these goals to assess potential impacts. Table 4-1 shows the impact
criteria applied in this assessment.
Table 4-1 NSW EPA Air Quality Impact Assessment Criteria
Pollutant Averaging Period Impact Criterion
Total suspended particulates (TSP) Annual Total 90µg/m³
Annual Total 30µg/m³ Particulate matter ≤10micrometers (PM10)
24-hour Incremental 50µg/m³
Annual Total 2g/m²/month Deposited dust (DD)
Annual Incremental 4g/m²/month
Nitrogen dioxide (NO2) 1-hour Total 246µg/m³
15-minute Total 100mg/m³
1-hour Total 30mg/m³ Carbon monoxide (CO)
8-hour Total 10mg/m³
Source: NSW DEC, 2005

DEWHURST PILOT EXPANSION PAGE 8
AIR QUALITY IMPACT ASSESSMENT REPORT NO. 13258 VERSION C
5 EXISTING ENVIRONMENT
5.1 Local Climate
Long-term climatic data from the Bureau of Meteorology (BoM) weather station at Narrabri West Post
Office (Site No. 053030) is used to characterise the local climate in the area of study.
Table 5-1 and Figure 3-1 present a summary of data from Narrabri West Post Office (Narrabri)
collected approximately from 1962 to present.
The data indicates that January is the hottest month with mean maximum temperature of 33.8ºC and
July is the coldest month with mean minimum temperature of 3.7ºC.
Humidity levels exhibit variability and seasonal flux across the year. Mean 9am humidity levels range
from 57% in October to 84% in June at Narrabri. Mean 3pm humidity levels vary from 37% in
October and December to 52% in June.
Rainfall generally peaks during the summer months and declines during winter. The data indicates
that January is the wettest month with an average rainfall of 84.2mm over 3.7 days at Narrabri. April
is the driest month at Narrabri with average rainfalls of 38.6mm over 2.3 days.
Wind speeds at these stations indicate that the colder months tend to have a greater spread between
the 9am and 3pm conditions compared to the warmer months. At Narrabri, mean 9am wind speeds
range from 11.7km/h in July to 18.8km/h in December and mean 3pm wind speeds range from
15.4km/h in May to 19.7km/h in September.
Table 5-1 Monthly Climate Statistics Summary – Narrabri West Post Office
Parameter Jan Feb Mar Apr May Jun Jul Aug Sep Oct Nov Dec
Temperature
Mean max. temperature (ºC) 33.8 33.2 31.2 27.3 22.5 18.7 18.0 19.8 23.4 27.1 30.1 33.0
Mean min. temperature (ºC) 19.3 19.1 16.4 11.9 8.3 5.2 3.7 4.6 7.6 11.7 14.8 17.7
Rainfall
Rainfall (mm) 84.2 63.6 57.0 38.6 48.0 48.1 46.8 40.7 42.1 52.5 61.2 77.8
Mean No. of rain days (≥1mm) 6.0 5.4 4.9 3.8 4.5 5.6 5.4 5.2 5.0 5.9 6.3 6.8
9am conditions
Mean temperature (ºC) 25.1 24.0 22.6 18.8 13.5 9.6 8.3 10.9 15.8 20.1 22.0 24.6
Mean relative humidity (%) 61 65 64 66 78 84 82 73 65 57 59 59
Mean wind speed (km/h) 17.1 17.6 17.1 14.7 12.9 12.6 11.7 13.1 16.3 18.5 18.3 18.8
3pm conditions
Mean temperature (ºC) 32.7 32.2 30.3 26.4 21.4 17.9 17.1 19.0 22.6 26.0 29.0 31.9
Mean relative humidity (%) 38 40 39 42 49 52 50 42 39 37 39 37
Mean wind speed (km/h) 16.9 17.1 17.4 16.4 15.4 16.8 17.3 18.5 19.7 19.2 19.2 19.0

DEWHURST PILOT EXPANSION PAGE 9
AIR QUALITY IMPACT ASSESSMENT REPORT NO. 13258 VERSION C
Figure 5-1 Monthly Climate Statistics Summary – Narrabri West Post Office
5.2 Local Meteorology
Suitable local site representative meteorological data for the proposed activity area and its wider
surroundings were not available at the time of writing this report. To generate the representative
local meteorological data required for this assessment, the meteorological component of The Air
Pollution Model (TAPM) was used in accordance with the applicable EPA guidelines (NSW DEC,
2005).
TAPM is an incompressible, non-hydrostatic, primitive equation prognostic model with a terrain-
following vertical coordinate for three-dimensional simulations. It predicts the flows important to
local scale air pollution, such as sea breezes and terrain induced flows, against a background of larger
scale meteorology provided by synoptic analyses.
The TAPM modelling incorporated data assimilation of observations from the BoM weather station at
Narrabri Airport (Site No. 054038) which provides the best contemporary hourly data available in the
region. The 2008 calendar year was selected for dispersion modelling based on a long-term
meteorological analysis for the area which indicated that conditions during 2008 most represented the
long-term conditions of the area.

DEWHURST PILOT EXPANSION PAGE 10
AIR QUALITY IMPACT ASSESSMENT REPORT NO. 13258 VERSION C
Figure 5-2 presents the annual and seasonal windroses (generated from TAPM output) for the
proposed activity location. On an annual basis, winds from the southeast and east-southeast are
most frequent with a spread of winds from the other directions.
The summer wind distribution pattern indicates the winds from the east-southeast are most
predominant with a portion of winds from the southeast. Autumn shares a similar wind distribution to
the annual windrose with winds from the southeast quadrant most common. In winter, winds tend to
mainly occur from the southeast and range to the west-southwest. During spring, winds are varied
and predominantly occur from east-southeast and north with a lesser portion of winds from the
north-northeast and southeast.
Table 5-2 presents a summary of the stability class distribution from the TAPM generated data. This
distribution (Class A to Class F) is a measure of the turbulence of the atmosphere with Class A
associated with highly unstable or turbulent conditions and Class F related to stable conditions,
typically at night. The relatively high frequency of Class E and Class F combined (40.1%) suggests
that emissions will disperse slowly for a fair portion of time.
Table 5-2 Stability Class Distribution (TAPM 2008)
Stability Class Frequency of Stability
Class Occurrence (%)
A 3.0
B 11.7
C 15.7
D 29.5
E 12.2
F 27.9

DEWHURST PILOT EXPANSION PAGE 11
AIR QUALITY IMPACT ASSESSMENT REPORT NO. 13258 VERSION C
Figure 5-2 Annual & Seasonal Windroses for Dewhurst
NNNNENNE
NENE
ENEENE
EE
ESEESE
SESE
SSESSESS
SSWSSW
SWSW
WSWWSW
WW
WNWWNW
NWNW
NNWNNW
4% 8% 12%
NNNNENNE
NENE
ENEENE
EE
ESEESE
SESE
SSESSESS
SSWSSW
SWSW
WSWWSW
WW
WNWWNW
NWNW
NNWNNW
4% 8% 12% 16% 20%
NNNNENNE
NENE
ENEENE
EE
ESEESE
SESE
SSESSESS
SSWSSW
SWSW
WSWWSW
WW
WNWWNW
NWNW
NNWNNW
10% 20% 30%
NNNNENNE
NENE
ENEENE
EE
ESEESE
SESE
SSESSESS
SSWSSW
SWSW
WSWWSW
WW
WNWWNW
NWNW
NNWNNW
5% 10% 15% 20% 25%
NNNNENNE
NENE
ENEENE
EE
ESEESE
SESE
SSESSESS
SSWSSW
SWSW
WSWWSW
WW
WNWWNW
NWNW
NNWNNW
4% 8% 12% 16% 20%Wind speed (m/s)
>0 - 1.5
>1.5 - 3
>3 - 4.5
>4.5 - 6
>6 - 7.5
>7.5
Annual and seasonal windroses forDewhurst (TAPM 2008)
SpringWinter
AutumnSummer
Annual

DEWHURST PILOT EXPANSION PAGE 12
AIR QUALITY IMPACT ASSESSMENT REPORT NO. 13258 VERSION C
5.3 Local Air Quality
5.3.1 Particulate Matter
Suitable site-specific air quality monitoring data are not available to quantify the existing ambient
levels at the site. Background ambient monitoring data obtained from the Tamworth NSW EPA
monitoring site that measures PM10 concentration using a Tapered Element Oscillating Microbalance
(TEOM) were analysed and used to characterise the ambient air quality.
The location of this monitoring site is approximately 132km southeast of the proposed activity. Due
to the presence of human activity, including residential areas, traffic, major highways and industry,
the Tamworth monitoring location is likely to experience higher levels of pollutants than the areas in
the vicinity of the site, which is largely rural and undeveloped. Therefore the use of the Tamworth
data to represent local air quality is likely to be conservative as it may overestimate the likely levels of
air pollutants.
A summary of the annual average PM10 monitoring data collected during 2010-2012 at the Tamworth
monitoring site is presented in Table 5-3. The monitoring data show the annual average PM10
concentrations at this monitoring site are below the 30µg/m³ criterion. As a conservative measure
the maximum annual average value of 15.9µg/m³ is applied to represent background levels for the
proposed activity.
Table 5-3 Summary of Annual PM10 Concentrations from Tamworth NSW EPA
Monitoring Site (µg/m³)
Year PM10 Concentration
2010 12.0
2011 13.1
2012 15.9
There are no readily available site specific TSP and deposited dust monitoring data for the proposed
activity. The NSW EPA monitoring site does not measure these components; however estimates of
the background levels for the site are required to assess the impacts per the criteria presented in
Section 4.
Estimates of the annual average background total suspended particulates (TSP) concentrations can
be determined from a relationship with measured PM10 concentrations. This relationship assumes that
40% of the TSP is PM10, and was developed as part of a review of ambient monitoring data collected
by co-located TSP and PM10 monitors in Hunter Valley (NSW Minerals Council, 2000).
Applying this relationship to the annual average PM10 concentration of 15.9µg/m³ from the Tamworth
monitor estimates an annual average TSP concentration of the order of 39.7µg/m³.
To estimate annual average dust deposition levels, a similar process to the method used to estimate
TSP concentrations is applied. This approach assumes that a TSP concentration of 90µg/m3 will have
an equivalent dust deposition value of 4g/m²/month.
This relationship indicates a background annual average dust deposition of 1.8g/m²/month for the
area surrounding the proposed activity.

DEWHURST PILOT EXPANSION PAGE 13
AIR QUALITY IMPACT ASSESSMENT REPORT NO. 13258 VERSION C
5.3.2 Nitrogen dioxide
Suitable site-specific NO2 data was not available to quantify the existing ambient levels at the site.
Background ambient NO2 data obtained from the closest suitable site at Muswellbrook NSW EPA
monitoring site (approximately 215km from Narrabri). Due to the presence of human activity,
including residential areas, traffic, major highways and industry, the Muswellbrook monitoring location
is likely to experience higher levels of NO2 pollutants than the areas in the vicinity of the site, which is
largely rural and undeveloped. Therefore the use of the Muswellbrook data to represent local ambient
NO2 levels is likely to be conservative as it may overestimate the likely levels of air pollutants.
Figure 5-3 presents the maximum daily 1-hour average NO2 concentrations from the Muswellbrook
NSW EPA monitoring sites from November 2011 to July 2013. The reviewed monitoring data indicate
that there were no exceedances of the NSW EPA 1-hour average goal of 246µg/m³ during this period
at the monitor.
The data in Figure 5-3 indicate that levels of NO2 are relatively low compared to the criterion level
and show a seasonal fluctuation.
Figure 5-3 Daily 1-hour Maximum NO2 Concentrations – Muswellbrook
The maximum 1-hour background NO2 levels measured at Muswellbrook during November 2011 to
July 2013 is 86.48µg/m³ (1 hour average); with the average being 40 µg/m³ (1 hour average).
5.3.3 Carbon Monoxide
Suitable site-specific CO data was not available to quantify the existing ambient levels at the site. The
NSW EPA monitoring sites at Tamworth or Muswellbrook do not record ambient concentrations of CO.
Combustion activities are the cause of CO emissions and spatially there is very little such activity in
the area apart from power generation, motor vehicles and wood heaters. Therefore, ambient
concentrations of CO are expected to be low (ie <0.02 µg/m³ (8hour average)) which is consistent
with NO2 monitoring results.

DEWHURST PILOT EXPANSION PAGE 14
AIR QUALITY IMPACT ASSESSMENT REPORT NO. 13258 VERSION C
6 APPROACH TO ASSESSMENT
6.1 Emission Estimation
6.1.1 Construction
For the construction phase of the proposed activity, minor works would be required including; the
levelling of the drill pad, the installation of additional surface facilities and equipment, excavation of a
cellar pit, drilling and surface clearing.
During the construction phase of the proposed activity, air emissions generated would generally
comprise of particulate matter associated with the earthworks. Other emissions would occur from the
exhaust of plant equipment required for the construction phase, these emissions are generally
considered to be too low to generate any significant pollutant concentrations in the vicinity of the
proposed activity and have not been assessed further in this study.
The activities associated with the vehicle travel on unsealed surfaces, drilling, excavation and wind
erosion are identified as the significant sources of particulate matter generation. Dust emission
estimates from the construction operations have been made using emission factors developed both
locally and by the US EPA.
Table 6-1 and Table 6-2 presents the estimated TSP emissions for the construction phase
associated with the Dewhurst 30/31 and Dewhurst 13-18H, respectively. Further details regarding
each of the emissions estimation techniques applied to estimate the TSP emissions are provided in
Appendix A.
Table 6-1 Estimated Emissions for Construction Operations – Dewhurst 30/31
Activity TSP emissions (kg/year)
Travel to site 5,043
Travel between Dewhurst 30 and Dewhurst 31 470
Excavating material 2
Drilling 4
Wind erosion of exposed areas 12,334
Total 17,854
Table 6-2 Estimated Emissions for Construction Operations – Dewhurst 13-18H
Activity TSP emissions (kg/year)
Travel to site 4,827
Travel between Dewhurst 13-18H and
Dewhurst 30/31 588
Excavating material 3
Drilling 5
Wind erosion of exposed areas 7,604
Total 13,027

DEWHURST PILOT EXPANSION PAGE 15
AIR QUALITY IMPACT ASSESSMENT REPORT NO. 13258 VERSION C
These estimated emissions consider that the construction phase would occur for a full year, whereas
it is proposed to take approximately 5-6 months. The impact due to these activities is difficult to
accurately quantify due to the short sporadic periods of dust generating activity that may occur over
the construction time frame. The sources are considered temporary in nature and would be confined
to the construction period.
Given that the activities would occur for a limited period, it is unlikely that there would be any
significant or prolonged impact off-site.
It should also be noted that as a conservative approach, no consideration of dust controls have been
applied to the estimation of dust emissions during activities. The Project includes a limited period of
construction activity and would have limited capacity to influence air quality to any significant degree.
6.1.2 Operation phase
For the operation phase, air emissions associated with the flare operation were calculated based on
the flare exhaust flow rate and estimated stack concentrations.
It is noted that in addition to CO and NO2 formation, a small amount of particulate matter (<10µg
diameter, referred to as PM10) may be generated from the combustion operation. Considering the
surrounding activities in the local area, it is unlikely that the proposed flare operation will make any
significant contribution to an increase in the PM10 level in the surrounding areas during operation and
therefore has not been investigated in this assessment.
Typically, NOx emissions emitted from flares consist for the larger part (>95%) of nitrogen monoxide
(NO) and for a small part (<5%) of NO2. After emission from the stack, NO is converted to NO2
through oxidation with atmospheric ozone (O3) (Janssen et al, 1988). The rate of this reaction is
governed by the level of ozone in the air, air dispersion and other meteorological factors such as
temperature. The reaction are complicated and most pronounced in urban areas with high ozone and
other levels of pollution which do not generally arise in this situation.
The modelled stack parameters and emission rate of the Dewhurst 14 and Dewhurst 28 flare units
included in the modelling is presented in Table 6-3 and Table 6-4, respectively.
Table 6-3 Stack Parameters & Estimated Emissions for the Dewhurst 14 Flare
Parameter Value Units
Stack height 4.5 m
Stack diameter 0.3 m
Exit velocity 21.93 m/s
Exit temperature 750 ºC
Gas flow rate* 5.81 Am3/s
Gas flow rate** 1.55 Nm3/s
NO2 emission rate 0.008 g/s
CO emission rate 0.19 g/s
* A - Actual **N - Nominal 0 ºC

DEWHURST PILOT EXPANSION PAGE 16
AIR QUALITY IMPACT ASSESSMENT REPORT NO. 13258 VERSION C
Table 6-4 Stack Parameters & Estimated Emissions for the Dewhurst 28 Flare
Parameter Value Units
Stack height 4 m
Stack diameter 0.3 m
Exit velocity 13.16 m/s
Exit temperature 750 ºC
Gas flow rate* 3.48 Am3/s
Gas flow rate** 0.93 Nm3/s
NO2 emission rate 0.0048 g/s
CO emission rate 0.12 g/s
* A - Actual **N - Nominal 0 ºC
6.1.3 NOx to NO2 conversion
For this assessment, the NOx to NO2 was estimated using an empirical equation for estimating the
oxidation rate of NO in power plant plumes as outlined in the Approved Methods for the Modelling
and Assessment of Air Pollutants in NSW (NSW DEC, 2005) and developed by Janssen et al.
(1988). This method consists of calculating the ratio of NO2 to NOx as determined by the
atmospheric conditions and distance from the maximum recorded level to the source.
As per this method, a Level 1 assessment was carried out adding maximum prediction and maximum
background concentrations to predict the total impact of NO2. The predicted maximum impacts were
recorded approximately 0.26km from the source during summer. Using this distance the ratio of NO2
to NOx at receptors due to the flare operations was calculated to be approximately 3%.
6.2 Modelling methodology
The AUSPLUME dispersion model in conjunction with a TAPM generated meteorological data file
(described in Section 5.2) provides predictions of the ground level concentrations of pollutants
based on the emission estimation provided in Section 6.1.
Sources modelled for the operational scenario were modelled as point sources. Appendix B provides
a sample of AUSPLUME output file.

DEWHURST PILOT EXPANSION PAGE 17
AIR QUALITY IMPACT ASSESSMENT REPORT NO. 13258 VERSION C
7 ANALYSIS OF MODELLING RESULTS
7.1 Construction Impacts
This section presents the predicted impacts on air quality arising from dust emissions generated
during the construction process for each relevant dust metric. Figure 7-1 to Figure 7-4 and Figure
7-5 to Figure 7-8 presents isopleths of the spatial distribution of predicted incremental impacts over
the modelling domain for maximum 24-hour average PM10, annual average PM10, TSP and deposited
dust levels for construction activities occurring at Dewhurst 13-18H and Dewhurst 30/31, respectively.
Table 7-1 presents the predicted incremental and total impacts at each of the sensitive receptor
locations due to construction activities.
Table 7-1 Predicted Incremental & Total Concentrations at Sensitive Receptors –
Construction Activities
PM10
(µg/m³)
TSP
(µg/m³)
DD
(g/m²/month)
PM10
(µg/m³)
TSP
(µg/m³)
DD
(g/m²/month)
Incremental Impact Total Impact
24-hour
Average
Annual
Average
Annual
Average
Annual
Average
Annual
Average
Annual
Average
Annual
Average
Air Quality Impact Criteria
Receptor ID
50 - - 2 30 90 4
RR1 0.15 0.01 0.02 <0.01 15.91 39.72 1.80
RR2 0.15 0.02 0.02 0.01 15.92 39.72 1.81
RR3 0.23 0.02 0.03 0.01 15.92 39.73 1.81
RR4 1.65 0.13 0.20 0.12 16.03 39.90 1.92
RR5 0.25 0.04 0.06 0.02 15.94 39.76 1.82
RR6 0.25 0.04 0.05 0.02 15.94 39.75 1.82
RR7 0.25 0.05 0.06 0.03 15.95 39.76 1.83
RR8 0.21 0.04 0.05 0.02 15.94 39.75 1.82
RR9 0.32 0.05 0.05 0.02 15.94 39.75 1.82
RR10 0.04 <0.01 <0.01 <0.01 15.90 39.70 1.80
RR11 0.05 0.01 0.01 <0.01 15.91 39.71 1.80
RR12 0.06 0.01 0.01 <0.01 15.91 39.71 1.80
RR13 0.05 0.01 0.01 <0.01 15.91 39.71 1.80
RR14 0.05 0.01 0.01 <0.01 15.91 39.71 1.80
The predicted results show minimal incremental impacts during the construction period at the
sensitive receptors. Therefore, it is unlikely that the existing PM10, TSP or dust deposition levels at
any sensitive receptor will significantly change during this time.
The estimated background levels in Section 5.3 were added to the predicted incremental levels to
assess potential total impacts at the sensitive receptors. The predicted total results for PM10, TSP and
dust deposition are also below the relevant NSW EPA criteria at the sensitive receptors.

DEWHURST PILOT EXPANSION PAGE 18
AIR QUALITY IMPACT ASSESSMENT REPORT NO. 13258 VERSION C
The predicted dust levels at the sensitive receptors due to activities occurring at Dewhurst 30/31
indicate negligible levels of impact (see Figure 7-5 to Figure 7-8). This is largely due to the low
level of dust generation due to construction activities and the large spatial displacement between the
construction activities and the sensitive receptors.
Additionally the impact on the nearby sensitive receptors is likely to be lower than predicted due to
the vegetation between the site and receptors. Studies have shown that significant vegetation
barriers can reduce dust emissions by up to 30% (Warren, 1973). The modelling completed for this
assessment has not taken into account any mitigation from the vegetation buffer.
Figure 7-1 Predicted Maximum 24-hour Average Incremental PM10 Concentrations
(µg/m³) – Dewhurst 13-18H
0.1
0.2
0.5
1
1

DEWHURST PILOT EXPANSION PAGE 19
AIR QUALITY IMPACT ASSESSMENT REPORT NO. 13258 VERSION C
Figure 7-2 Predicted Annual Average Incremental PM10 Concentrations (µg/m³) –
Dewhurst 13-18H
0.01
0.01
0.01
0.02
0.03
0.05

DEWHURST PILOT EXPANSION PAGE 20
AIR QUALITY IMPACT ASSESSMENT REPORT NO. 13258 VERSION C
Figure 7-3 Predicted Annual Average Incremental TSP Concentrations (µg/m³)–
Dewhurst 13-18H
RR1
RR2
RR3
RR4RR5
RR6
RR7
RR8
RR9
RR10
RR11
RR12
RR13
RR14
0.01
0.01
0.01
0.01
0.02
0.02
0.05
0.05
0.05
0.05
0.1
0.10.2
0.5
1
752000 754000 756000 758000 760000 762000 764000 766000 768000 770000 772000 774000 776000
MGA Coordinates Zone 55 (m)
6606000
6608000
6610000
6612000
6614000
6616000
6618000
6620000
6622000
6624000
6626000
Pilot well locationsFlare locationSensitive receptors

DEWHURST PILOT EXPANSION PAGE 21
AIR QUALITY IMPACT ASSESSMENT REPORT NO. 13258 VERSION C
Figure 7-4 Predicted Annual Average Incremental Dust Deposition Levels
(g/m²/month) – Dewhurst 13-18H
0.01
0.01
0.01
0.02
0.02
0.05
0.05
0.1

DEWHURST PILOT EXPANSION PAGE 22
AIR QUALITY IMPACT ASSESSMENT REPORT NO. 13258 VERSION C
Figure 7-5 Predicted Maximum 24-hour Average Incremental PM10 Concentrations
(µg/m³) – Dewhurst 30/31
0.1
0.1
0.1
0.1
0.1
0.2
1

DEWHURST PILOT EXPANSION PAGE 23
AIR QUALITY IMPACT ASSESSMENT REPORT NO. 13258 VERSION C
Figure 7-6 Predicted Annual Average Incremental PM10 Concentrations (µg/m³) –
Dewhurst 30/31
0.02
0.02
0.02
0.02
0.02
0.02
0.04
0.04
0.04
0.06 0.1
0.2

DEWHURST PILOT EXPANSION PAGE 24
AIR QUALITY IMPACT ASSESSMENT REPORT NO. 13258 VERSION C
Figure 7-7 Predicted Annual Average Incremental TSP Concentrations (µg/m³)–
Dewhurst 30/31
0.02
0.02
0.02
0. 02
0.02
0.02
0.02
0.04
0.04
0.040.04
0.04
0.06
0.06
0.1
0.2

DEWHURST PILOT EXPANSION PAGE 25
AIR QUALITY IMPACT ASSESSMENT REPORT NO. 13258 VERSION C
Figure 7-8 Predicted Annual Average Incremental Dust Deposition Levels
(g/m²/month) – Dewhurst 30/31
0.010.05
0.05

DEWHURST PILOT EXPANSION PAGE 26
AIR QUALITY IMPACT ASSESSMENT REPORT NO. 13258 VERSION C
7.2 Operational impacts from Dewhurst 14 and Dewhurst 28 Flares
The spatial distribution of the dispersion model predictions for NO2 and CO are presented as contour
plots in Figure 7-9 to Figure 7-12 for the operation of the flares at Dewhurst 14 and Dewhurst 28.
Each of the sensitive receptors was assessed individually as discrete receptors with the results
presented in tabular form for the privately owned receptors.
Analysis of the predicted NO2 and CO impacts presented in Figure 7-9 to Figure 7-12 shows
minimal impact at all sensitive receptors.
Table 7-2 presents the predicted incremental NO2 and CO impacts from the proposed flare
operations at Dewhurst 14 at the surrounding sensitive receptors. It can be observed from Table 7-2
that predicted incremental impacts from the proposed operation are low.
With the addition of the maximum 1-hour background NO2 levels measured at Muswellbrook during
November 2011 to July 2013 of 86.48µg/m³, the total predicted impact at the sensitive receptors
would remain below the respective criterion level.
It is noted that site specific CO monitoring is not available for this assessment. However comparison
of the predicted incremental CO concentrations with the NSW EPA criteria for CO shows that the
proposed activity contribution would be significantly below the criteria. It is unlikely that existing
background levels of CO would be approaching the criteria levels, which would result in any
exceedance.
Therefore the maximum impacts due to the proposed Dewhurst 14 flare operation would not exceed
the NSW EPA criteria for NO2 and CO in surrounding areas, even at the nearest sensitive receiver
(RR4), located within one kilometre of the flare.

DEWHURST PILOT EXPANSION PAGE 27
AIR QUALITY IMPACT ASSESSMENT REPORT NO. 13258 VERSION C
Table 7-2 Predicted Incremental Concentrations at Sensitive Receptors – Operation
of the Dewhurst 14 Flare and 28 Flare
NO2 CO
1-hour
Average
15-
minute
Average
1-hour
Average
8-hour
Average
Receptor
ID
Air Quality Impact Criteria (µg/m³)
# 246 100 30 10
RR1 0.0987 0.00309 0.00234 0.00155
RR2 0.1015 0.00318 0.00241 0.00159
RR3 0.1408 0.00441 0.00334 0.00221
RR4 0.2426 0.00760 0.00576 0.00380
RR5 0.0884 0.00277 0.00210 0.00138
RR6 0.0776 0.00243 0.00184 0.00122
RR7 0.0846 0.00265 0.00201 0.00133
RR8 0.1051 0.00329 0.00250 0.00165
RR9 0.1553 0.00487 0.00369 0.00243
RR10 0.0287 0.00090 0.00068 0.00045
RR11 0.0366 0.00115 0.00087 0.00057
RR12 0.0373 0.00117 0.00089 0.00058
RR13 0.0326 0.00102 0.00077 0.00051
RR14 0.0305 0.00095 0.00072 0.00048

DEWHURST PILOT EXPANSION PAGE 28
AIR QUALITY IMPACT ASSESSMENT REPORT NO. 13258 VERSION C
Figure 7-9 Predicted Incremental 1-hour Average NO2 Concentrations (µg/m³) from
operation of the Dewhurst 14 and Dewhurst 28 Flares
0.04
0.04
0.04
0.04
0.04
0.04
0.04
0.06
0.06
0.06
0.06
0.06
0.08
0.08
0.08
0.08
0.08
0.1
0.1
0.1
0.14
0.14
0.2
0.2
0.24
0.24
.

DEWHURST PILOT EXPANSION PAGE 29
AIR QUALITY IMPACT ASSESSMENT REPORT NO. 13258 VERSION C
Figure 7-10 Predicted Incremental 15-minute Average CO Concentrations (mg/m³)
from operation of the Dewhurst 14 and Dewhurst 28 Flares.
0.001
0.001
0.001
0.001
0.001
0.001
0.0015
0.0015
0.0015
0.0015
0.0015
0.0015
0.0015
0.0015
0.002
0.002
0.002
0.002
0.003
0.003
0.003
0.004
0.006

DEWHURST PILOT EXPANSION PAGE 30
AIR QUALITY IMPACT ASSESSMENT REPORT NO. 13258 VERSION C
Figure 7-11 Predicted Incremental 1-hour Average CO Concentrations (mg/m³) from
operation of the Dewhurst 14 and Dewhurst 28 Flares.
0.0005
0.0005
0.0005
0.0005
0.0005
0. 0005
0.001
0.001
0.001
0.001
0.001
0.001
0.0010.0015
0.0015
0.0015
0.0015
0.002
0.002
0.002
0.003
0.004
0.005
0.005

DEWHURST PILOT EXPANSION PAGE 31
AIR QUALITY IMPACT ASSESSMENT REPORT NO. 13258 VERSION C
Figure 7-12 Predicted Incremental 8-hour Average CO Concentrations (mg/m³) from
operation of the Dewhurst 14 and Dewhurst 28 Flares.
0.0005
0.0005
0.0005
0.0005
0.0005
0.0005
0.0005
0.001
0.001
0.001
0.001
0.0015
0.0015
0.0015
0.002
0.003

DEWHURST PILOT EXPANSION PAGE 32
AIR QUALITY IMPACT ASSESSMENT REPORT NO. 13258 VERSION C
7.2.1 Consideration of Potential Cumulative Impacts
Analysis of the predicted incremental NO2 and CO impacts for the proposed activity shows minimal
impact at all sensitive receptors due to low incremental pollutant levels from the proposed flares.
It is noted that in the vicinity of the proposed activity there are potentially other sources of NO2 and
CO emissions originating from on-site plant equipment, site vehicles, small generators and other
flaring operations. These sources are unlikely to generate significant amounts of NO2 and CO and
would be located away from the nearby sensitive receptors to allow sufficient dilution.
Cumulative emissions from flaring and Wilga Park Power Station are insignificant. The reasons for the
insignificant cumulative impact are due to the fact that the sources of air emission relating to the
proposed activity i.e. Dewhurst 14 and Dewhurst 28 flares have:
• low incremental pollutant levels from the proposed flares; and
• there are large distances between all the different sources.
The other operating flares would emit at similar rates to the proposed flare. Based on the predicted
very low incremental levels for the proposed flare, very large distances between the flares and
sensitive receivers, and the conservative nature of the assessment approach, it would be unlikely for
any potential cumulative impacts to occur at the sensitive receptors. For example:
• Wilga Park Power Station is approximately 38 km north of Dewhurst 28 and 23 km northwest
of Dewhurst 14;
• the Bibblewindi flare is approximately 8 km northwest of Dewhurst 28 and approximately 13
km southwest of Dewhurst 14; and
• the proposed Tintsfield flare is approximately 35 km north of Dewhurst flare and
approximately 23 km northwest of Dewhurst 14 flare.

DEWHURST PILOT EXPANSION PAGE 33
AIR QUALITY IMPACT ASSESSMENT REPORT NO. 13258 VERSION C
8 MITIGATION MEASURES
The site activities will generate dust, therefore it is prudent to take reasonable and practicable
measures to prevent or minimise dust emissions into the surrounding environment.
The primary dust sources identified from the proposed activity are:
• Wind-blown dust from exposed areas; and
• Dust generated by construction and operational activities.
Table 8-1 summarises the following procedures proposed to minimise dust emissions from the
primary dust sources.
Table 8-1 Dust Mitigation Measures
Source Control Procedure
Exposed areas
• Restrict ground disturbance to the minimum area practically possible.
• Rehabilitate exposed areas as soon as practicable.
• Dust will be suppressed as required by spraying water along the access tracks
and lease areas
Vehicle activities • Limit vehicle speeds.
• Covering loose, dust generating material loads, travelling to and from the site.

DEWHURST PILOT EXPANSION PAGE 34
AIR QUALITY IMPACT ASSESSMENT REPORT NO. 13258 VERSION C
9 CONCLUSIONS
This assessment has examined the potential air quality impacts of the proposed construction activities
at the Dewhurst 13-18H and Dewhurst 26-31 pilots, and operating a gas flares at Dewhurst 14 and
Dewhurst 28 lease area.
The study predicts that the additional air quality impacts arising from the proposed Project would be
minor at the surrounding sensitive receptors.
The predicted change in air quality is unlikely to be detectable and the results show that levels would
be well below the relevant criteria for the pollutants assessed.

DEWHURST PILOT EXPANSION PAGE 35
AIR QUALITY IMPACT ASSESSMENT REPORT NO. 13258 VERSION C
10 REFERENCES
Bureau of Meteorology (2013)
Climatic Averages Australia, Bureau of Meteorology website
[http://www.bom.gov.au/climate/averages]
Janssen, L. H. J. M., van Wakeren, J. H. A., van Duuren, H. and Elshout, A. J. (1988)
"A Classification of NO oxidation rates in power plant plumes based on atmospheric
conditions". Atmospheric Environment, Volume 22, Number 1, 43-53.
NSW DEC (2005)
“Approved Methods for the Modelling and Assessment of Air Pollutants in NSW”, August
2005
NSW Minerals Council (2000)
“Technical Paper – Particulate Matter and Mining Interim Report”.
SPCC (1983)
"Air Pollution from Coal Mining and Related Developments", State Pollution Control
Commission.
US EPA (1985 and updates)
“Compilation of Air Pollutant Emission Factors”, AP-42, Fourth Edition United States
Environmental Protection Agency, Office of Air and Radiation Office of Air Quality Planning
and Standards, Research Triangle Park, North Carolina 27711. Note this reference is now a
web-based document.
Warren, J. L. (1973)
“Green Space for Air Pollution Control”. Technical Report N.50. School of Forest Resources,
North Carolina State University, Rayleigh. July 1973.

APPENDIX A
EMISSION INVENTORY

DEWHURST PILOT EXPANSION APPENDIX A-1
AIR QUALITY IMPACT ASSESSMENT REPORT NO. 13258 VERSION C
Construction Operations
Hauling on unpaved roads
Emissions from unpaved roads are dependent on the silt content of the road and the gross
weight of the vehicles. TSP emissions for this activity have assumed that a no control of dust
emissions from this activity as a conservative measure. The following equation developed by US
EPA (USEPA, 1985 and updates) estimates the amount TSP emissions from the activity.
Where:
S = Silt content = 10%
M = Vehicle gross weight = 30 tonnes
Material extraction
Emissions from this activity are dependent on wind speed and the moisture content of the
material. The following equation developed by US EPA (USEPA, 1985 and updates)
estimates the amount TSP emissions from the activity.
Where
k = Particulate size specific factor for batch loading operations (kTSP = 0.74)
U = Wind speed (m/s)
M = Moisture content of loading material = 2%
Drilling
TSP emissions from the drilling operations are estimated using emission factors developed by
US EPA (USEPA, 1985 and updates). An emission factor of 0.59kg/hole for the drilling
operation is applied. This emission factor is applicable for equipment with no dust suppression.
Wind erosion
Emissions from stockpiles and exposed areas occur due to wind erosion. The emission factor
developed by State Pollution Control Commission (SPCC) (SPCC, 1983) allows an estimation of
the total TSP generated due to wind erosion. An emission factor of 0.4 kg/ha/hour was applied
in estimating the TSP emissions due to the wind erosion and has assumed that no control of
dust emission from these operations would be applied.

DEWHURST PILOT EXPANSION APPENDIX A-2
AIR QUALITY IMPACT ASSESSMENT REPORT NO. 13258 VERSION C
DEWHURST 30/31
ACTIVITYTSP emission
(kg/y)Intensity Units Emission Factor Units
Variable
1Units
Variable
2Units
Variable
3Units
Variable
6Units
Travel to site 1,382 386 trips/year 3.6 kg/VKT 30.0 km/return trip 10.0 % silt content 30 Ave GMV (tonnes) % Control
Travel to site 129 36 trips/year 3.6 kg/VKT 1.6 km/return trip 10.0 % silt content 30 Ave GMV (tonnes) % Control
Excavating material 1 324 tonnes/year 0.002 kg/t 1.54 average of (wind speed/2.2)^1.3 in m/s 2 moisture content in %
Drilling 1 2 holes/year 0.59 kg/hole % Control
Wind erosion of exposed areas 3,379 3.5 ha 0.40 kg/ha/hour 2,400 hours % Control
Total TSP emissions (kg/yr) 4,892
DEWHUSRT 13-18H
ACTIVITYTSP emission
(kg/y)Intensity Units Emission Factor Units
Variable
1Units
Variable
2Units
Variable
3Units
Variable
6Units
Travel to site 1,058 296 trips/year 3.6 kg/VKT 40.0 km/return trip 10.0 % silt content 30 Ave GMV (tonnes) % Control
Travel to site 129 36 trips/year 3.6 kg/VKT 46.0 km/return trip 10.0 % silt content 30 Ave GMV (tonnes) % Control
Excavating material 1 324 tonnes/year 0.002 kg/t 1.54 average of (wind speed/2.2)^1.3 in m/s 2 moisture content in %
Drilling 1 2 holes/year 0.59 kg/hole % Control
Wind erosion of exposed areas 1,667 2.2 ha 0.40 kg/ha/hour 1,920 hours % Control
Total TSP emissions (kg/yr) 2,855

APPENDIX B
SAMPLE OF AUSPLUME OUTPUT FILE

DEWHURST PILOT EXPANSION APPENDIX B-1
AIR QUALITY IMPACT ASSESSMENT REPORT NO. 13258 VERSION C
1 ____________________________________________
Dust
____________________________________________
Concentration or deposition Concentration
Emission rate units grams/second
Concentration units microgram/m3
Units conversion factor 1.00E+06
Constant background concentration 0.00E+00
Terrain effects Egan method
Plume depletion due to dry removal mechanisms included.
Smooth stability class changes? No
Other stability class adjustments ("urban modes") None
Ignore building wake effects? Yes
Decay coefficient (unless overridden by met. file) 0.000
Anemometer height 10 m
Roughness height at the wind vane site 0.500 m
DISPERSION CURVES
Horizontal dispersion curves for sources <100m high Pasquill-Gifford
Vertical dispersion curves for sources <100m high Pasquill-Gifford
Horizontal dispersion curves for sources >100m high Briggs Rural
Vertical dispersion curves for sources >100m high Briggs Rural
Enhance horizontal plume spreads for buoyancy? Yes
Enhance vertical plume spreads for buoyancy? Yes
Adjust horizontal P-G formulae for roughness height? Yes
Adjust vertical P-G formulae for roughness height? Yes
Roughness height 0.400m
Adjustment for wind directional shear None
PLUME RISE OPTIONS
Gradual plume rise? Yes
Stack-tip downwash included? Yes
Building downwash algorithm: Schulman-Scire method.
Entrainment coeff. for neutral & stable lapse rates 0.60,0.60
Partial penetration of elevated inversions? No
Disregard temp. gradients in the hourly met. file? No
and in the absence of boundary-layer potential temperature gradients
given by the hourly met. file, a value from the following table
(in K/m) is used:
Wind Speed Stability Class
Category A B C D E F
________________________________________________________
1 0.000 0.000 0.000 0.000 0.020 0.035
2 0.000 0.000 0.000 0.000 0.020 0.035
3 0.000 0.000 0.000 0.000 0.020 0.035
4 0.000 0.000 0.000 0.000 0.020 0.035
5 0.000 0.000 0.000 0.000 0.020 0.035
6 0.000 0.000 0.000 0.000 0.020 0.035
WIND SPEED CATEGORIES
Boundaries between categories (in m/s) are: 1.54, 3.09, 5.14, 8.23, 10.80
WIND PROFILE EXPONENTS: "Irwin Rural" values (unless overridden by met. file)
AVERAGING TIMES
24 hours
average over all hours
_____________________________________________________________________________

DEWHURST PILOT EXPANSION APPENDIX B-2
AIR QUALITY IMPACT ASSESSMENT REPORT NO. 13258 VERSION C
AUSPLUME Input File : Dust concentration
SOURCE GROUPS
Group No. Members
________________________________________________________________
1 1 2 3 4 5 6 7
8 9 10 11 12 13 14
15 16 17 18 19
2 20 21 22 23 24 25 26
27 28 29 30 31 32 33
34 35 36 37 38
3 39 40 41 42 43 44 45
46 47 48 49 50 51 52
53 54 55 56 57
1 ____________________________________________
AUSPLUME Input File : Dust concentration
SOURCE CHARACTERISTICS
VOLUME SOURCE: 1
X(m) Y(m) Ground Elevation Height Hor. spread Vert. spread
754450 6619746 256m 2m 10m 2m
(Constant) emission rate = 1.00E+00 grams/second
Hourly multiplicative factors will be used with
this emission factor.
Particle Particle Particle
Mass Size Density
fraction (micron) (g/cm3)
_____________________________
1.0000 1.0 2.50
VOLUME SOURCE: 2
X(m) Y(m) Ground Elevation Height Hor. spread Vert. spread
755053 6618712 255m 2m 10m 2m
(Constant) emission rate = 1.00E+00 grams/second
Hourly multiplicative factors will be used with
this emission factor.
Particle Particle Particle
Mass Size Density
fraction (micron) (g/cm3)
_____________________________
1.0000 1.0 2.50
VOLUME SOURCE: 3
X(m) Y(m) Ground Elevation Height Hor. spread Vert. spread
755196 6617708 255m 2m 10m 2m
(Constant) emission rate = 1.00E+00 grams/second
Hourly multiplicative factors will be used with
this emission factor.
Particle Particle Particle
Mass Size Density
fraction (micron) (g/cm3)
_____________________________
1.0000 1.0 2.50 ~~~~~~