Embed Size (px)
Citation preview
Air Pressure and Winds
•Why does the winds blow? •How can one tell its direction by looking at weather chart?
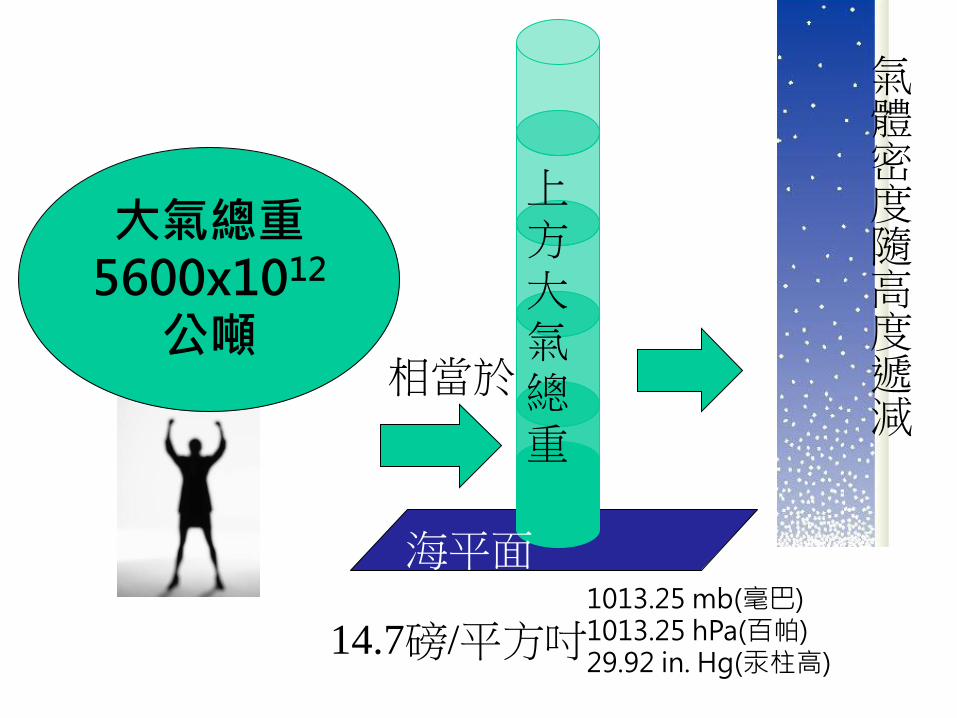
大氣總重5600x1012
公噸
上方大氣
總重
相當於
海平面
14.7磅/平方吋 1013.25 mb(毫巴) 1013.25 hPa(百帕) 29.92 in. Hg(汞柱高)
氣體密度隨高度遞減
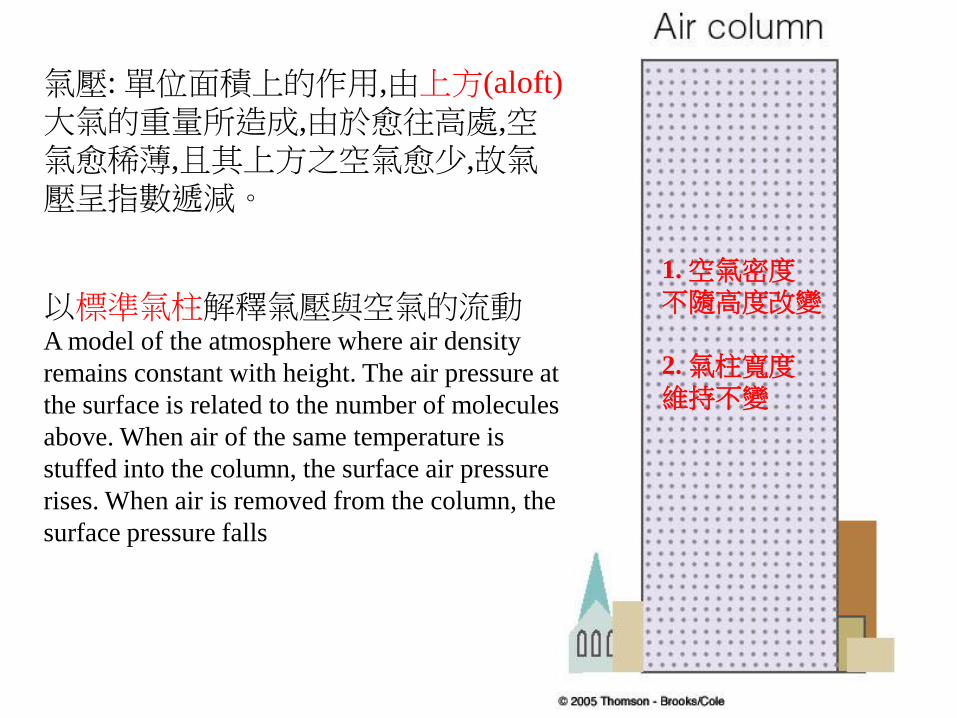
氣壓: 單位面積上的作用,由上方(aloft)
大氣的重量所造成,由於愈往高處,空氣愈稀薄,且其上方之空氣愈少,故氣壓呈指數遞減。
以標準氣柱解釋氣壓與空氣的流動 A model of the atmosphere where air density
remains constant with height. The air pressure at
the surface is related to the number of molecules
above. When air of the same temperature is
stuffed into the column, the surface air pressure
rises. When air is removed from the column, the
surface pressure falls
1. 空氣密度
不隨高度改變
2. 氣柱寬度
維持不變
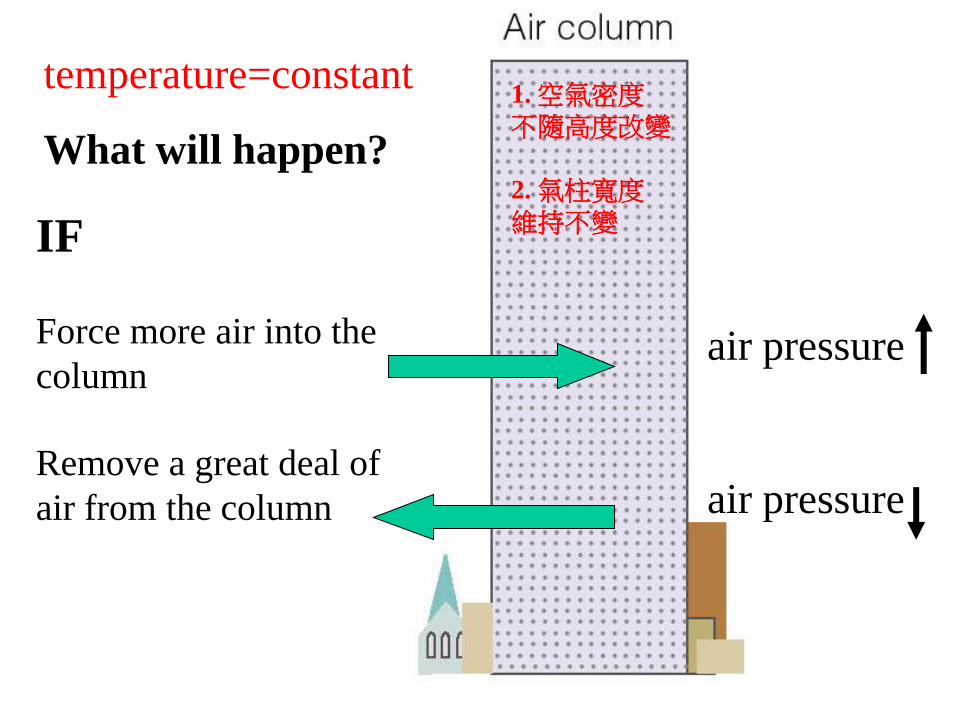
IF
Force more air into the
column
Remove a great deal of
air from the column
What will happen?
temperature=constant 1. 空氣密度
不隨高度改變
2. 氣柱寬度
維持不變
air pressure
air pressure
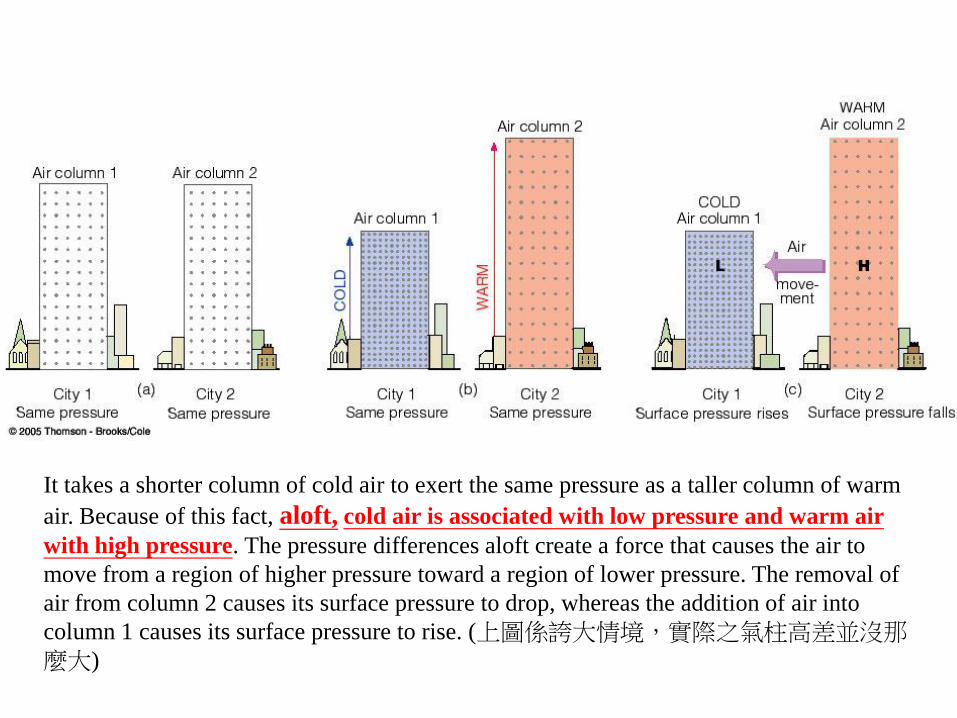
It takes a shorter column of cold air to exert the same pressure as a taller column of warm
air. Because of this fact, aloft, cold air is associated with low pressure and warm air
with high pressure. The pressure differences aloft create a force that causes the air to
move from a region of higher pressure toward a region of lower pressure. The removal of
air from column 2 causes its surface pressure to drop, whereas the addition of air into
column 1 causes its surface pressure to rise. (上圖係誇大情境,實際之氣柱高差並沒那麼大)
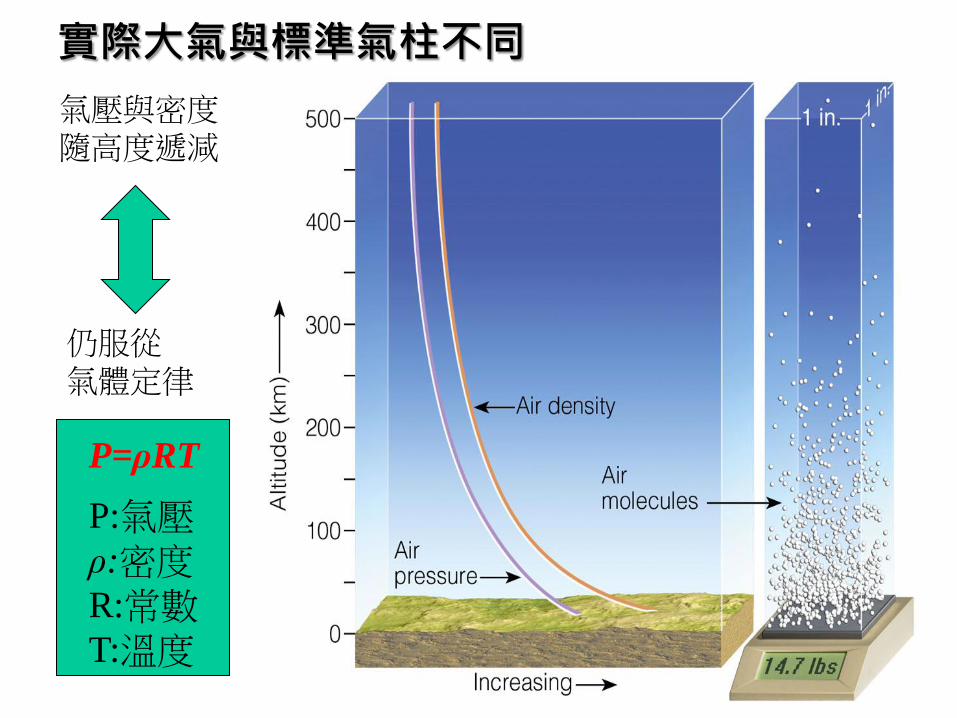
P=ρRT
P:氣壓
ρ:密度
R:常數
T:溫度
氣壓與密度
隨高度遞減
仍服從
氣體定律
實際大氣與標準氣柱不同

地面高壓較地面低壓之大氣密度高的前提為:兩地溫度相同
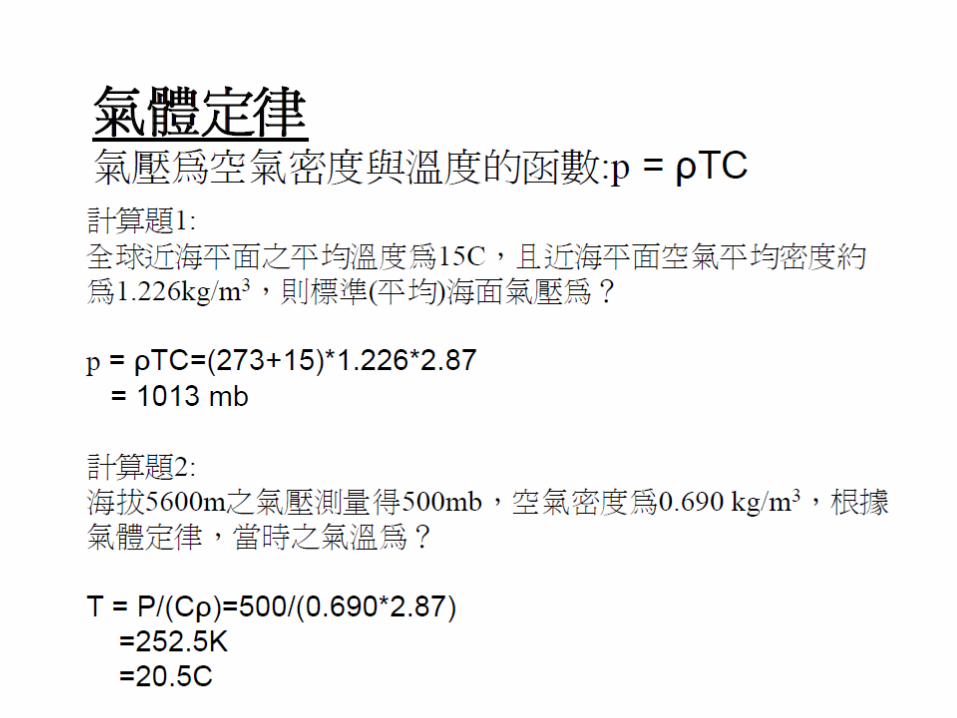
氣體定律 氣壓為空氣密度與溫度的函數
P ~ T x ρ
氣溫為常數時
ρ ~ P
氣壓高,空氣密度高
氣壓為常數時
ρ ~ 1/T
溫度高,空氣密度低
故
冷空氣較熱空氣密度高的前提為: 兩氣柱所在之高度相同
1 2
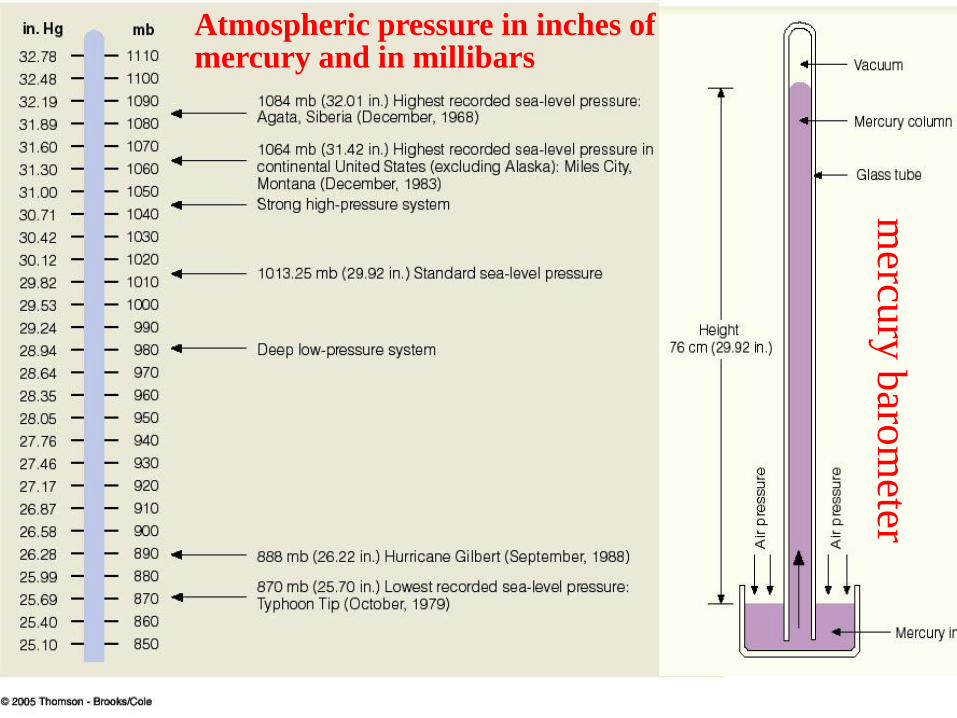
Atmospheric pressure in inches of mercury and in millibars
mercu
ry b
arom
eter
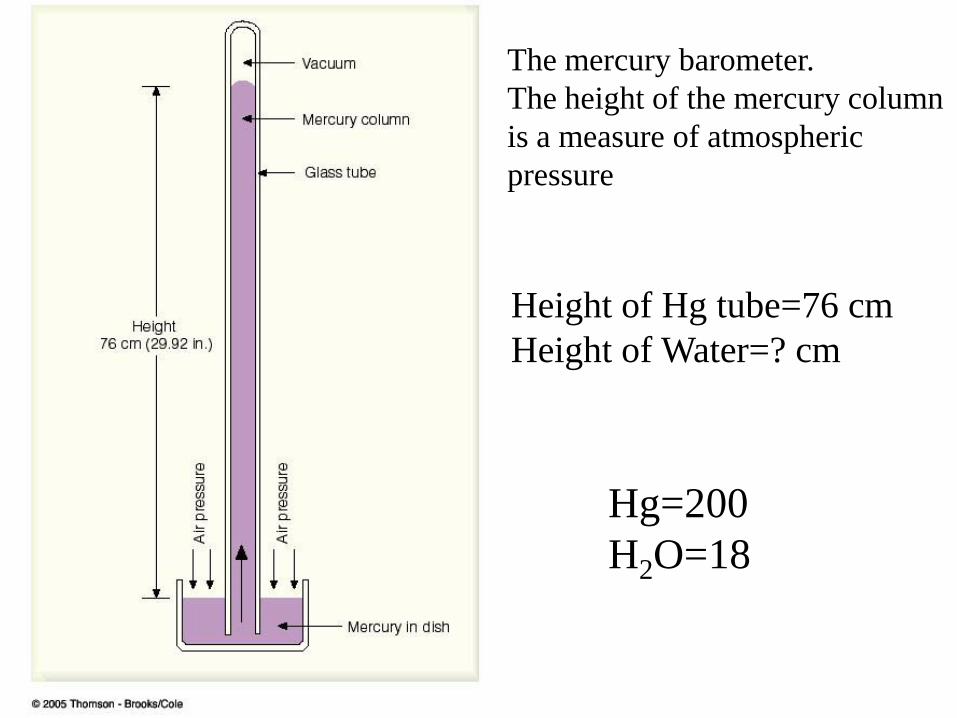
The mercury barometer.
The height of the mercury column
is a measure of atmospheric
pressure
Hg=200
H2O=18
Height of Hg tube=76 cm
Height of Water=? cm

The aneroid barometer (空盒or膜盒氣壓表)
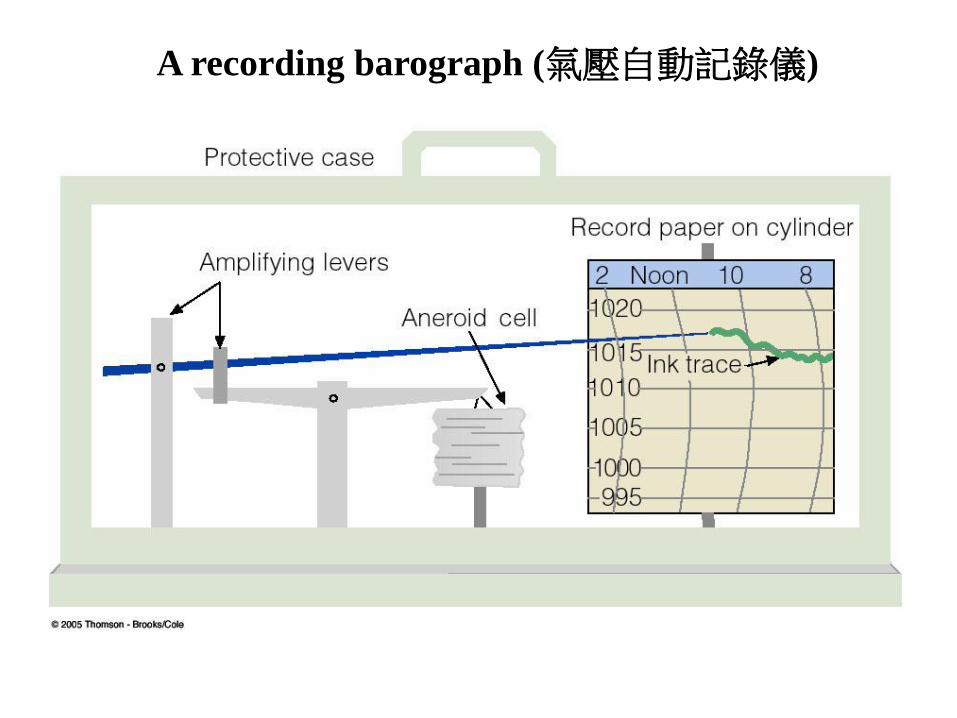
A recording barograph (氣壓自動記錄儀)
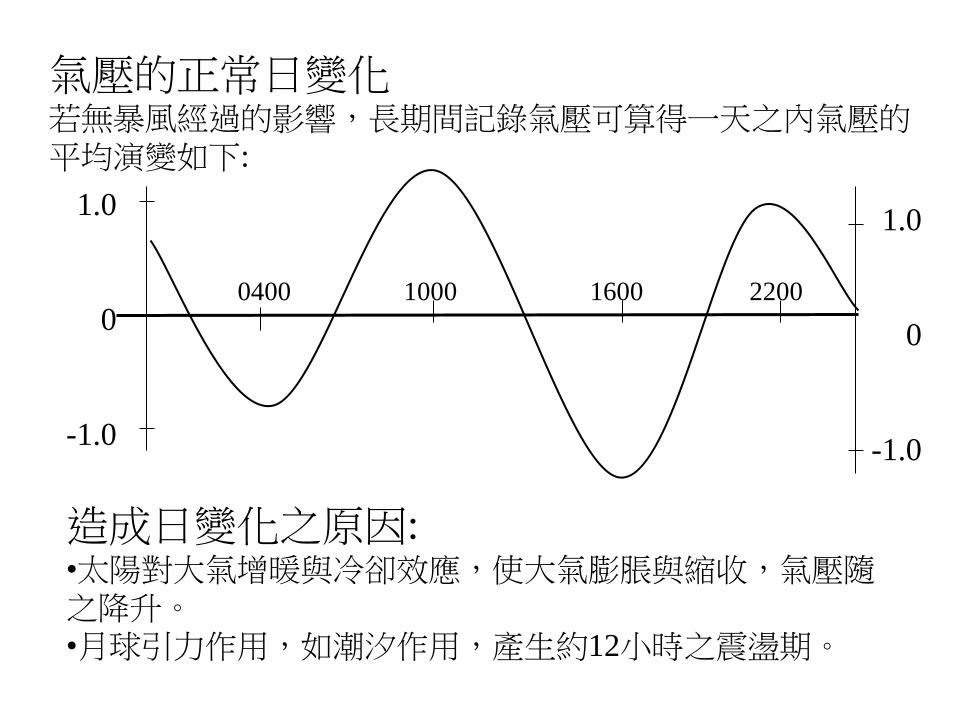
氣壓的正常日變化 若無暴風經過的影響,長期間記錄氣壓可算得一天之內氣壓的平均演變如下:
1.0
0
-1.0
1.0
0
-1.0
0400 1000 1600 2200
造成日變化之原因: •太陽對大氣增暖與冷卻效應,使大氣膨脹與縮收,氣壓隨之降升。
•月球引力作用,如潮汐作用,產生約12小時之震盪期。

Station pressure 測站氣壓讀數的必須進行高度修正,將氣壓換算為同一高度平面之氣壓,才有意義。

Surface map showing areas of high and low pressure. The solid lines are isobars drawn at 4-mb intervals. The arrows represent wind direction—the direction from which the wind is blowing. Notice that the wind blows across the isobars
Isobar等壓線
anticyclone
(反氣旋)
cyclone
(氣旋)
Surface Air Chart

The upper-level (500-mb) map for the same day as the surface map. Solid lines on the map are contour lines in meters above sea level. Dashed red lines are isotherms in °C. Arrows show wind direction. Notice that, on this upper-air map, the wind blows parallel to the contour lines.
(
高壓脊)
(
低壓槽)
(
低壓槽)
Upper Air Chart

Because of the changes in air density, a surface of constant pressure (the shaded gray area) rises in warm, less-dense air and lowers in cold, more-dense air. These changes in elevation of a constant pressure (500-mb) surface show up as contour lines on a constant pressure (isobaric) 500-mb map.
constant pressure (500mb) map
500 mb 等壓面


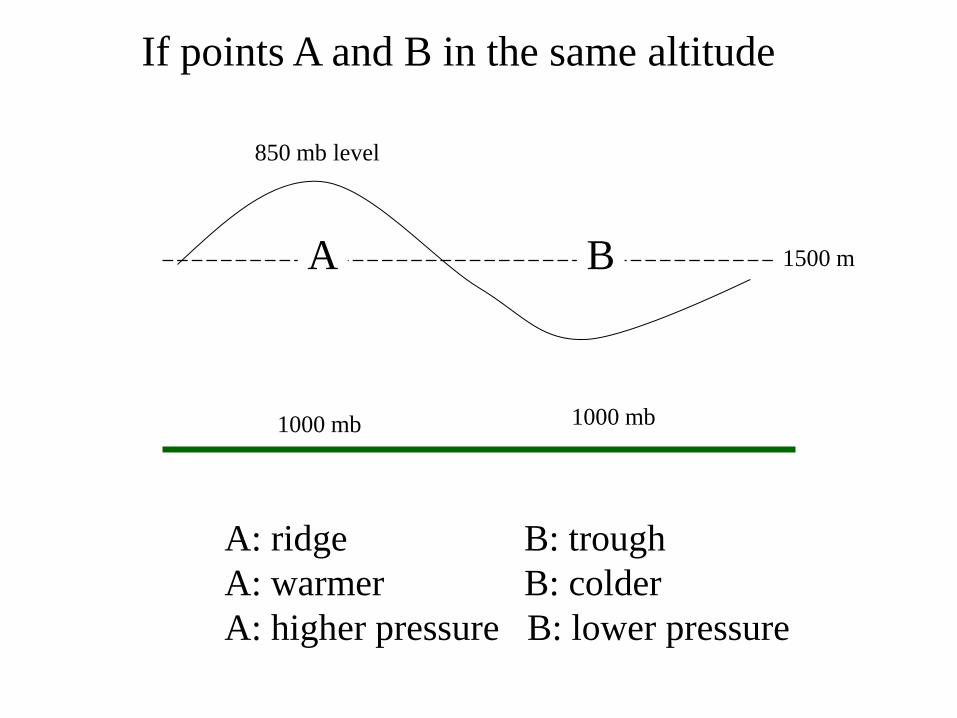
1500 m
850 mb level
1000 mb 1000 mb
A B
A: ridge B: trough
A: warmer B: colder
A: higher pressure B: lower pressure
If points A and B in the same altitude
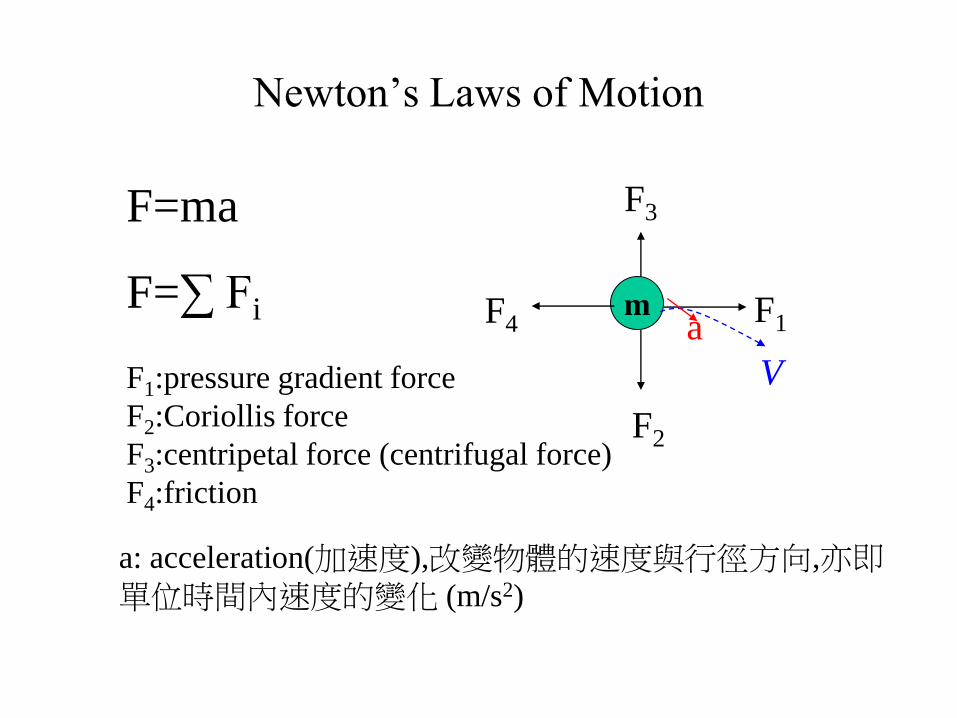
Newton’s Laws of Motion
F=ma
F=∑ Fi
F1:pressure gradient force
F2:Coriollis force
F3:centripetal force (centrifugal force)
F4:friction
m F1
F2
F3
F4
V
a: acceleration(加速度),改變物體的速度與行徑方向,亦即單位時間內速度的變化 (m/s2)
a

The higher water level creates higher
fluid pressure at the bottom of tank A
and a net force directed toward the
lower fluid pressure at the bottom of
tank B. This net force causes water to
move from higher pressure toward
lower pressure
The pressure gradient between point 1 and point 2
is 4 mb per 100 km. The net force directed from
higher toward lower pressure is the pressure
gradient force
pressure gradient force (PGF)

The closer the spacing of the isobars, the greater the pressure gradient. The
greater the pressure gradient, the stronger the pressure gradient force (PGF).
The stronger the PGF, the greater the wind speed. The red arrows represent
the relative magnitude of the force, which is always directed from higher
toward lower pressure.
wind velocity ~ PGF
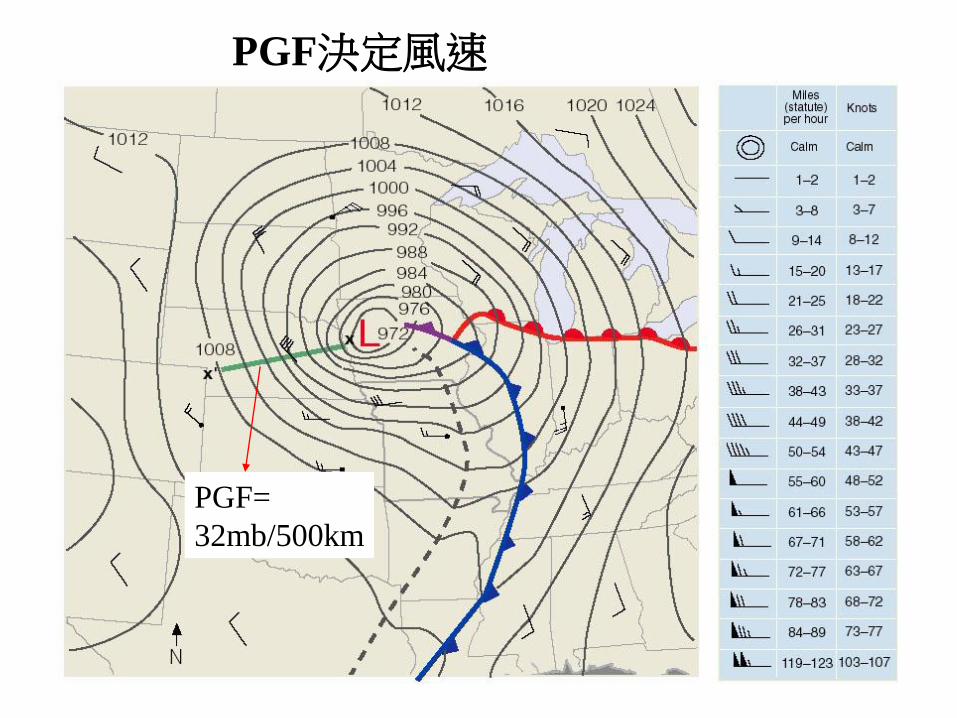
PGF決定風速
PGF=
32mb/500km

Coriolis Force (科氏力) 因地球自轉而產生的虛表力或視似力(apparent force),所有自由移動物體,如海流、飛機、彈道、空氣分子等,直線行徑方向皆因其下方之地球自轉作用而產生行徑方向的偏向。

科氏力大小
F = 2 ν ω sinφ ν : 速度 ω: 地球自轉角速度 φ : 緯度
科氏力作用方向與行徑方向垂
直,不影響行徑速度。在北半球產生朝行徑方向右側之偏向
力; 南半球則左側偏向。
科氏力作用方向

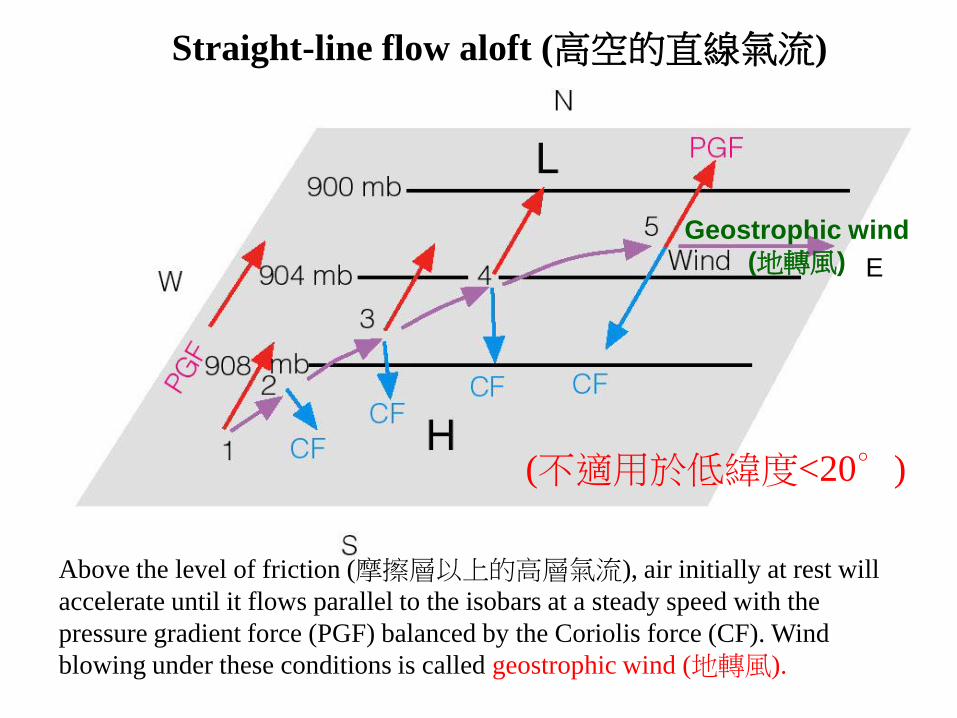
Above the level of friction (摩擦層以上的高層氣流), air initially at rest will
accelerate until it flows parallel to the isobars at a steady speed with the
pressure gradient force (PGF) balanced by the Coriolis force (CF). Wind
blowing under these conditions is called geostrophic wind (地轉風).
Geostrophic wind
(地轉風) E
Straight-line flow aloft (高空的直線氣流)
(不適用於低緯度<20∘)


The isobars and contours on an upper-level chart are like the banks along a
flowing stream. When they are widely spaced, the flow is weak; when they are
narrowly spaced, the flow is stronger. The increase in winds on the chart
results in a stronger Coriolis force (CF), which balances a larger pressure
gradient force (PGF).
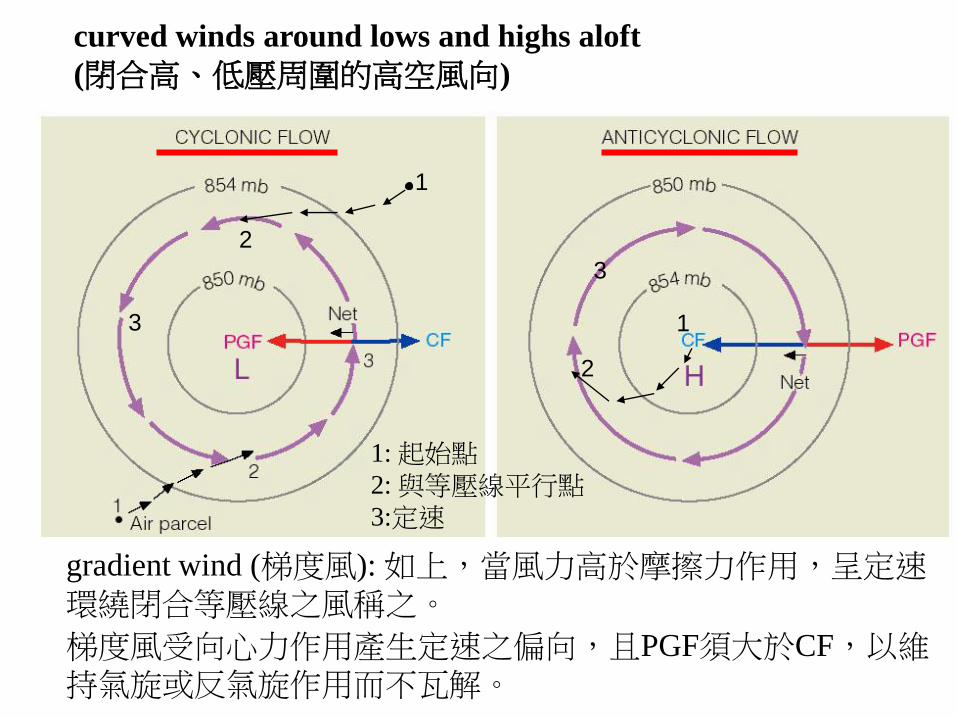
curved winds around lows and highs aloft
(閉合高、低壓周圍的高空風向)
1
2
1
2
1: 起始點
2: 與等壓線平行點
3:定速
3
3
gradient wind (梯度風): 如上,當風力高於摩擦力作用,呈定速環繞閉合等壓線之風稱之。
梯度風受向心力作用產生定速之偏向,且PGF須大於CF,以維持氣旋或反氣旋作用而不瓦解。

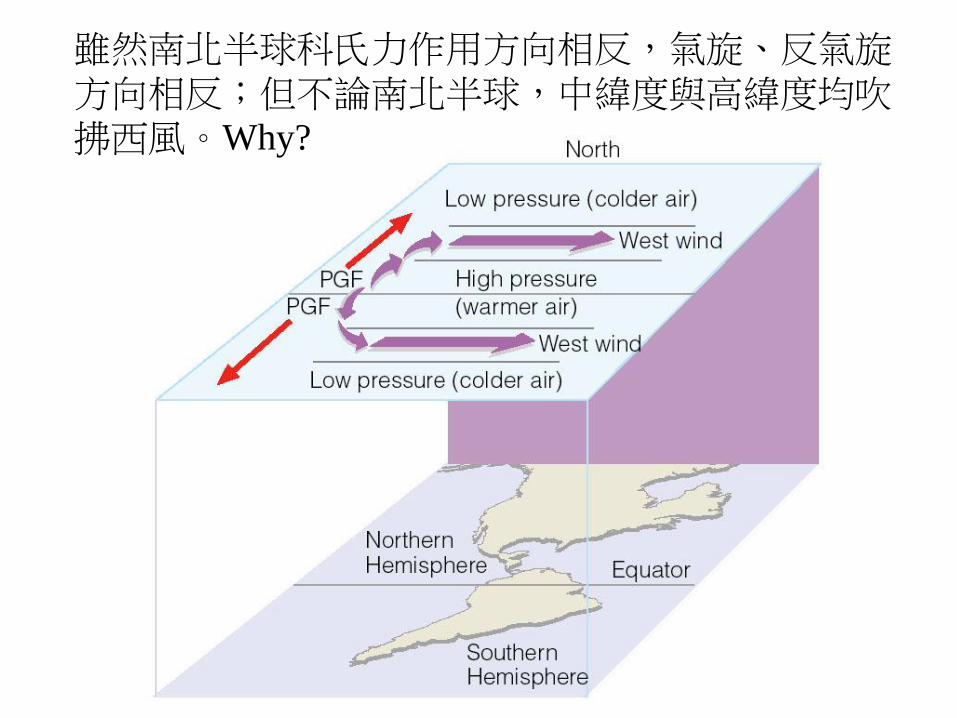
雖然南北半球科氏力作用方向相反,氣旋、反氣旋方向相反;但不論南北半球,中緯度與高緯度均吹拂西風。Why?
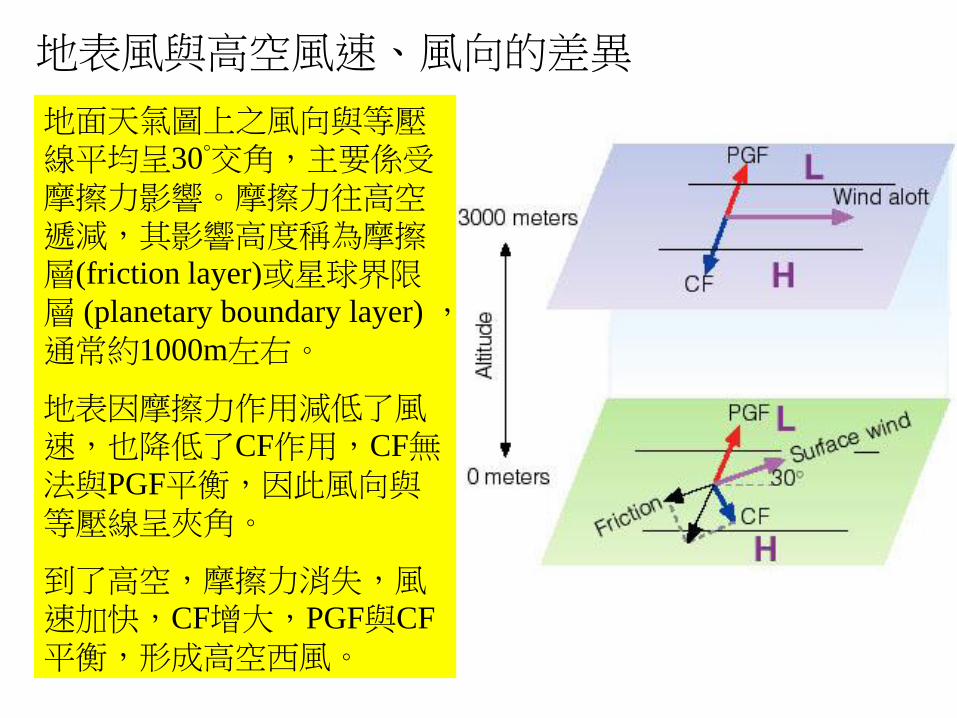
地表風與高空風速、風向的差異
地面天氣圖上之風向與等壓線平均呈30°交角,主要係受摩擦力影響。摩擦力往高空遞減,其影響高度稱為摩擦層(friction layer)或星球界限層 (planetary boundary layer) ,通常約1000m左右。
地表因摩擦力作用減低了風速,也降低了CF作用,CF無法與PGF平衡,因此風向與等壓線呈夾角。
到了高空,摩擦力消失,風速加快,CF增大,PGF與CF
平衡,形成高空西風。

北半球地表風與高層氣流風向
3000 m
0 m
alti
tud
e
Winds blowing counterclockwise
and into a low
Winds flow clockwise and out of
a high
the winds blow parallel to the lines, usually in a wavy west-
to-east pattern
aloft
ground

500mb氣壓等
高線與風向
地面等壓線與風向

南半球地表風與高層氣流風向
Cyclone (氣旋)
Anti-cyclone (反氣旋)

Buys-Ballot’s Law
北半球,背向受風,低壓在左側;
南半球,背向受風,低壓在右側。
若暨無風向風速測值,亦無高空等壓線圖,也可由觀測高空雲的移動判斷風向與等壓線分布。

低壓形成的上升氣流與高壓形成的下降氣流,比此系統中水平方向的氣流小很多,通常垂直氣流每秒僅數公分而已,一天移動不到1哩。Why?
高低氣層之PGF受重力牽制,
產生流體靜力平衡(hydrostatic
equilibrium),大部分時間大氣都處於近乎流體靜力平衡,即使氣流上昇與沉降多為定速。但在雷雨、龍捲風系統中,則垂直方向則有可觀的加速度,
但與整個大氣的垂直高度相比,
距離仍是相對小的。
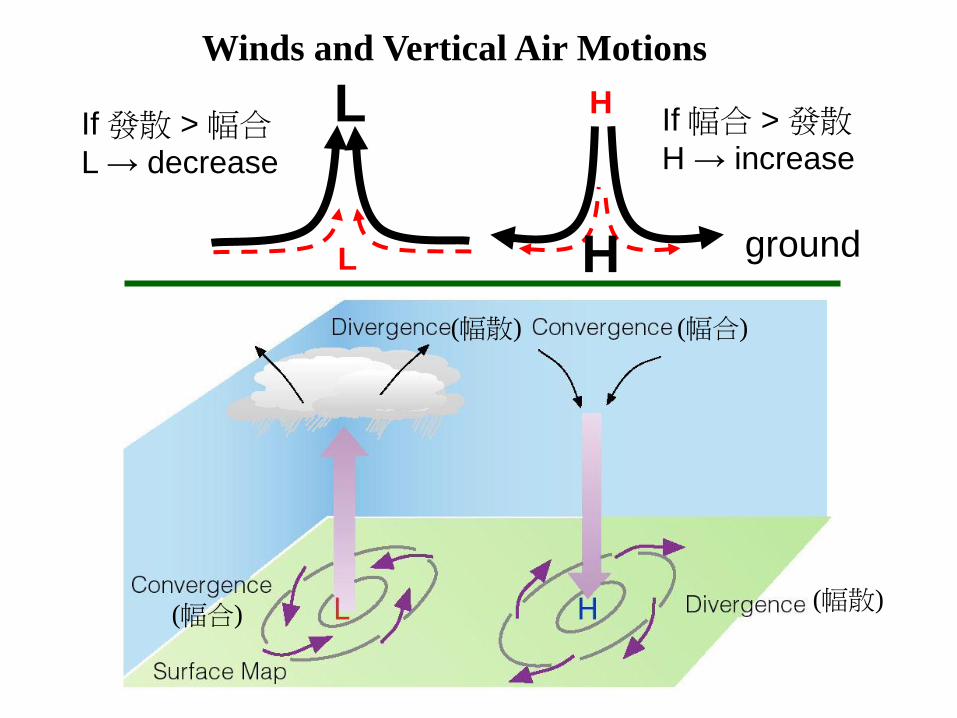
Winds and Vertical Air Motions
ground
If 發散 > 幅合
L → decrease
L
(幅散)
(幅散)
(幅合)
(幅合)
L If 幅合 > 發散
H → increase
H
H

福島輻射塵(非常不利)
Convergence
(導入地面氣流)

福島輻射塵(逐漸解除)
Divergence (帶入高空氣流)