Embed Size (px)
Citation preview
7/28/2019 Air Pollution Effects
http://slidepdf.com/reader/full/air-pollution-effects 1/22
The Health Eects of Air PollutionSeparating Science and Propaganda
JO EL S CH WAR T Z
MAY 2006
P O L I C Y R E P O R T
7/28/2019 Air Pollution Effects
http://slidepdf.com/reader/full/air-pollution-effects 2/22
the health effects of air pollut ion | separating science and propaganda
p o l i c y r e p o r t
The Health Efects
of Air Pollution Separating Science and
Propaganda
JoelSchwartz
M ay 2006
Table of Contents
2 Executive Summary
3 Introduction
3 Does Air Pollution Cause Asthma?
6 Does Air Pollution Exacerbate Pre-Existing Lung Disease?
7 Long-Term Eects of Air Pollution
10 Does Air Pollution Kill?
12 Regulatory Costs and Americans’ Health
13 Getting Real on Air Pollution and Health
15 Notes
The views expressed in this report are solely those of the author and do not necessarily reect those of the sta or board of the John Locke Foundation. For more information,call 919-828-3876 or visit www.JohnLocke.org ©2006 by John Locke Foundation.
7/28/2019 Air Pollution Effects
http://slidepdf.com/reader/full/air-pollution-effects 3/22
J o h n l o c k e f o u n d a t i o n
the health effects of air pollut ion | separating science and propaganda
executive Summary Americans are alarmed about air pollution,and no wonder. Most of the informationthey receive about air pollution is alarm-
ing. Activist groups issue reports with scary titles such as Danger in the Air ; Death, Disease and Dirty Power ; or Children at Risk. Newsstories on air pollution often feature alarm-ing headlines, such as the recent Observer story “Trac is Choking Charlotte’s air.”
These portrayals of air pollution, andthe fear they instill, might be warranted if they accurately reected the health risks of current, historically low air pollution levels.
But they do not. Through cherry-pick-ing, exaggeration, and sometimes outrightfabrication, environmental activists havecreated public fear of air pollution out of allproportion to the actual risks suggested by the underlying health studies. Regulators,journalists, and even health professionalsalso frequently paint a misleadingly pessi-mistic portrait of air pollution’s health toll.
Air pollutants of all kinds in NorthCarolina and the United States in general
are at their lowest levels since nationwidemeasurements began back in the 1970s. The weight of the evidence from a widerange of health studies suggests that theselow levels of air pollution are at worst a minor health concern.
Asthma provides a signal example of how conventional wisdom on air pollutionand health is often the opposite of real-ity. Asthma prevalence has doubled in theUnited States at the same time that air pol-lution of all kinds has sharply declined. Airpollution is therefore not a plausible causeof rising asthma. A government-sponsoredstudy that followed thousands of childrenin California during the 1990s reportedthat higher ozone, particulate matter, andother air pollutants were associated with a lower risk of developing asthma. Countiesin North Carolina with higher ozone levelshave lower asthma hospitalization rates.
Despite the evidence, activists continueto create false scares about air pollutionand asthma. For example, according to theCarolinas Clean Air Coalition, “1/ 3-1/ 2 of
all asthma in North Carolina is due to airpollution.”
The California study of children andasthma also showed that even air pollutionin southern California, which is by far thehighest in the country, is having little orno eect on children’s lung development. The study reported that even living in areasthat exceed federal ozone standards morethan 100 days per year had no eect on
children’s lung capacity.Fine particulate matter (PM2.5) atlevels more than twice the federal standard was associated with only a 1 to 2 percentdecrease in lung capacity. Even the worstPM2.5 pollution in North Carolina barely exceeds the federal standard. Thus, neitherozone nor PM2.5 is harming lung develop-ment of North Carolina’s children. Despitethis evidence, CCAC wants to maintaina climate of fear, no matter how unwar-
ranted. In a recent op-ed, CCAC claimed“children who grow up in areas as pollutedas the Charlotte region are losing up to 20percent of their lung function – perma-nently.”
Attaining federal ozone and PM2.5 stan-dards will cost tens to hundreds of billionsof dollars per year, nationwide. These costsare ultimately paid by people in the formof higher prices, lower wages, and reducedchoices. We all have many needs and aspira-
tions and insucient resources with whichto fulll them. Spending more on air qualitymeans less money to spend on everything else that’s important to us, including healthcare, housing, food, and education, as wellas measures that address larger and morecertain health and safety risks. We are giv -ing up much to fund our massive air pollu-tion regulatory system, and getting little inreturn.
7/28/2019 Air Pollution Effects
http://slidepdf.com/reader/full/air-pollution-effects 4/22
the health effects of air pollut ion | separating science and propaganda
p o l i c y r e p o r t
introduction Americans are alarmed about air pollution,and no wonder. Most of the informationthey receive about air pollution is alarm-
ing. Activist groups issue reports with scary titles such as Danger in the Air ; Death, Disease and Dirty Power ; or Children at Risk.1 Airpollution regulators declare “code orange”and “code red” alerts on days when air pol-lution is predicted to exceed federal healthstandards. News stories on air pollutionoften feature alarming headlines, such asthe recent Charlotte Observer story “Tracis Choking Charlotte’s air.2
These portrayals of air pollution, andthe fear they instill, might be warranted if they accurately reected the health risks of current, historically low air pollution levels.But they do not. Through cherry-pick-ing, exaggeration, and sometimes outrightfabrication, environmental activists havecreated public fear of air pollution out of allproportion to the actual risks suggested by the underlying health studies. Regulators,journalists, and even health professionals
also frequently paint a misleadingly pessi-mistic portrait of air pollution’s health toll.
As this paper will show, air pollutionaects far fewer people, far less often, and with far less severity than environmentalistsand other trusted sources have led peopleto believe. It isn’t that air pollution can’tbe harmful. But as toxicologists like to say,“the dose makes the poison.”
Air pollutants of all kinds in North Car-olina and the United States in general areat their lowest levels since measurementsnationwide began back in the 1970s. The weight of the evidence from a wide range of health studies suggests that these low levelsof air pollution are at worst a minor healthconcern.
doeSair PollutioncauSeaSthma? Asthma provides a signal example of how conventional wisdom on air pollution and
health is often the opposite of reality. Ac-cording to the Centers for Disease Control,the prevalence of asthma in the U.S. rose75 percent from 1980 to 1996, and nearly
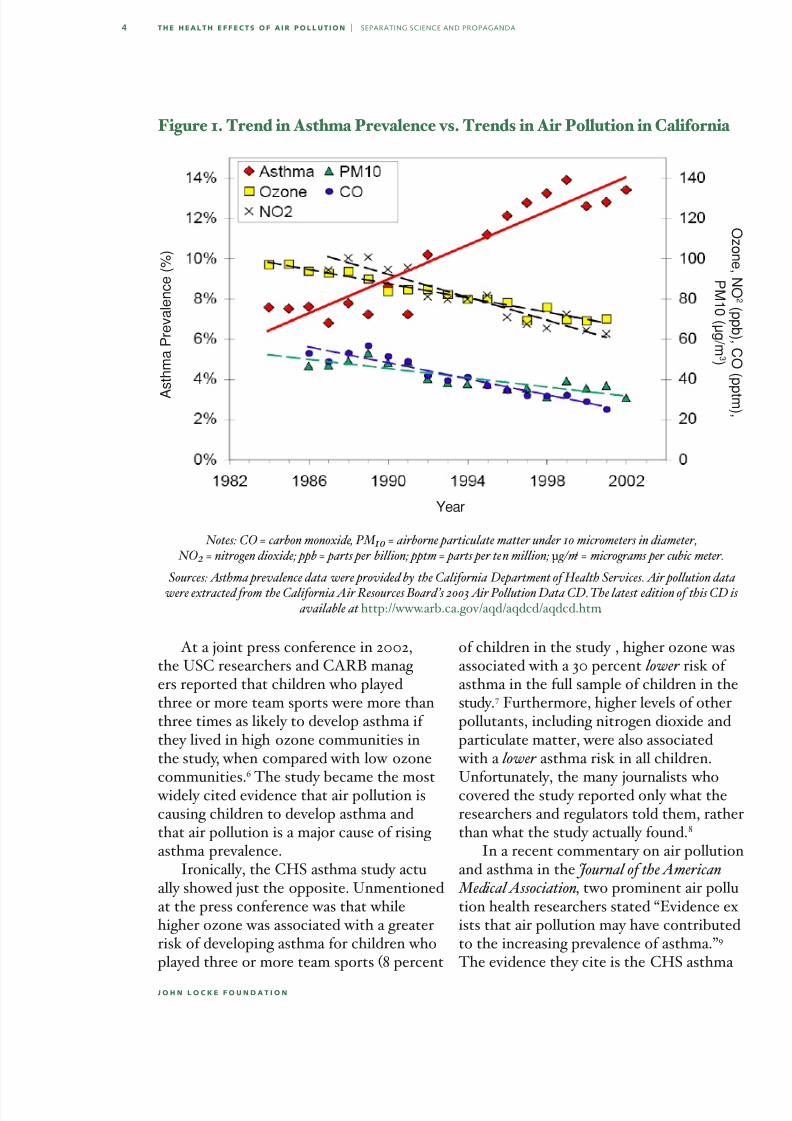
doubled for children. Prevalence may haveleveled o since then.3 Could air pollutionbe the cause? Not likely. Asthma prevalencerose at the same time that air pollution of all kinds declined. North Carolina does nothave long-term measurements of asthma prevalence, but many other states do. Fig-ure 1 (next page) displays trends in asthma and various air pollutants for California. The trends are similar for all other pol-
lutants measured by California regulators,including ne particulate matter (PM2.5)4 ,benzene, 1-3-butadiene, benzo(a)pyrene,
perchloroethylene, xylene, lead, and many
more.5 In all cases air pollution has been de-clining while asthma has been rising. Data from other states tell the same story — de-clining air pollution, rising asthma.
Despite the implausibility of air pollu-tion as a cause of asthma, regulators andhealth experts have even turned a study that found air pollution to be associated with a lower overall risk of developing asth-ma into a key piece of evidence in supportof an air pollution-asthma link. Beginning
in 1993 the California Air Resources Board(CARB) funded the Children’s HealthStudy (CHS). Performed by researchersfrom the University of Southern California (USC), the CHS tracked several thousandCalifornia children living in 12 communi-ties with widely varying air pollution levels,including areas of southern California withthe highest air pollution levels in the coun-try.
Air pollutants of all kinds in North Carolina are at their lowest levels since measurements began
back in the 1970s. The weight of the evidence suggests that these low levels of air pollution are
at worst a minor health concern.
7/28/2019 Air Pollution Effects
http://slidepdf.com/reader/full/air-pollution-effects 5/22
J o h n l o c k e f o u n d a t i o n
the health effects of air pollut ion | separating science and propaganda
At a joint press conference in 2002,the USC researchers and CARB manag -ers reported that children who playedthree or more team sports were more thanthree times as likely to develop asthma if they lived in high-ozone communities inthe study, when compared with low-ozone
communities.
6
The study became the most widely cited evidence that air pollution iscausing children to develop asthma andthat air pollution is a major cause of rising asthma prevalence.
Ironically, the CHS asthma study actu-ally showed just the opposite. Unmentionedat the press conference was that whilehigher ozone was associated with a greaterrisk of developing asthma for children whoplayed three or more team sports (8 percent
of children in the study), higher ozone wasassociated with a 30 percent lower risk of asthma in the full sample of children in thestudy.7 Furthermore, higher levels of otherpollutants, including nitrogen dioxide andparticulate matter, were also associated with a lower asthma risk in all children.
Unfortunately, the many journalists whocovered the study reported only what theresearchers and regulators told them, ratherthan what the study actually found.8
In a recent commentary on air pollutionand asthma in the Journal of the American Medical Association, two prominent air pollu-tion health researchers stated “Evidence ex-ists that air pollution may have contributedto the increasing prevalence of asthma.”9 The evidence they cite is the CHS asthma
Notes: CO = carbon monoxide, PM 10 = airborne particulate matter under 10 micrometers in diameter, NO 2 = nitrogen dioxide; ppb = parts per billion; pptm = parts per ten million; µg/m 3 = micrograms per cubic meter.
Sources: Asthma prevalence data were provided by the California Department of Health Services. Air pollution data
were extracted from the California Air Resources Board ’s 2003 Air Pollution Data CD. The latest edition of this CD is available at http://www.arb.ca.gov/aqd/aqdcd/aqdcd.htm.
Figure 1. Trend in Asthma Prevalence vs. Trends in Air Pollution in California
A
s t h m a P r e v a l e n c e ( % )
Year
Oz on e ,N O2
( p p b ) , C O ( p
p t m ) ,
P M1 0 ( µ g / m 3 )
7/28/2019 Air Pollution Effects
http://slidepdf.com/reader/full/air-pollution-effects 6/22
the health effects of air pollut ion | separating science and propaganda
p o l i c y r e p o r t
study—the one that found that higher airpollution was associated with a lower riskof developing asthma.
And these researchers aren’t the only ones to misinterpret the results of the
CHS asthma study. For example, on theday the study was released, a professor atthe State University of New York at Stony Brook, who has since become the AmericanLung Association’s (ALA) medical direc-tor, claimed “This is not just a SouthernCalifornia problem. There are communitiesacross the nation that have high ozone.”10
He was wrong on both counts. TheCHS asthma study was based on ozone lev -els from 1994-97 in 12 California communi-
ties. The change in asthma risk (higher riskfor children playing 3 or more team sports;lower risk for everyone else) was observedonly in the four communities with thehighest ozone (relative to the four lowest-
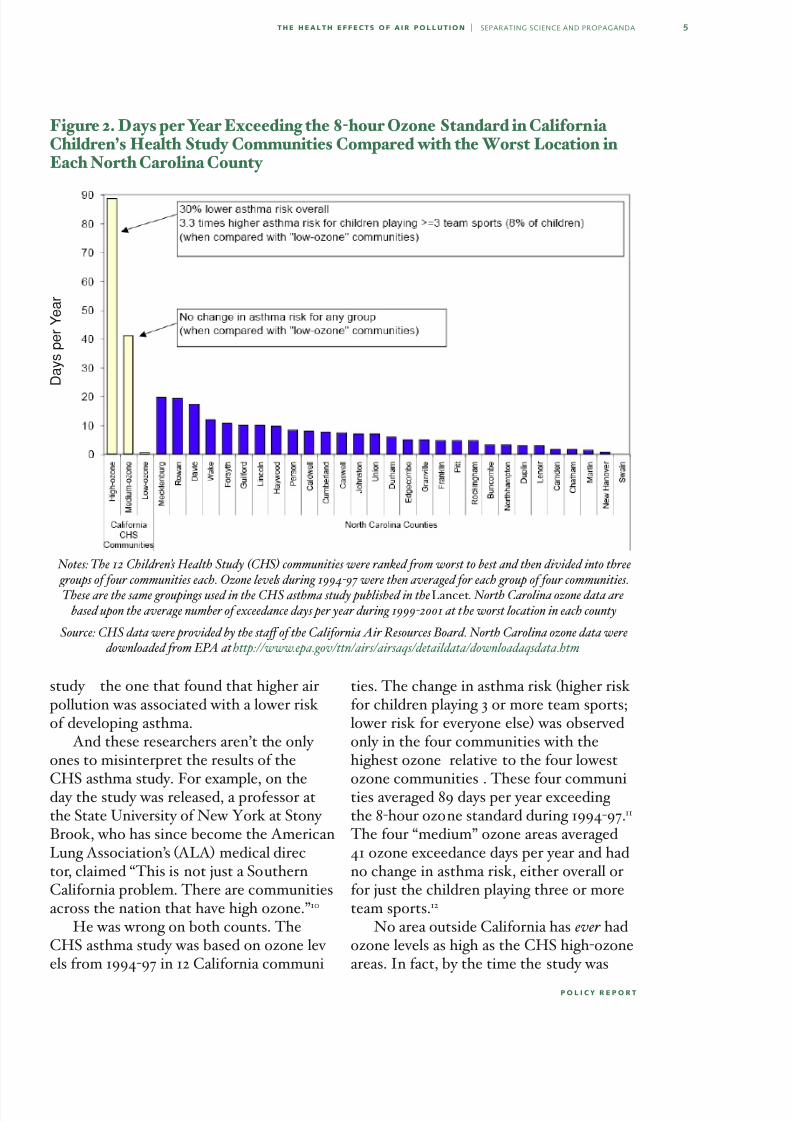
ozone communities). These four communi-ties averaged 89 days per year exceeding the 8-hour ozone standard during 1994-97.11 The four “medium” ozone areas averaged41 ozone exceedance days per year and hadno change in asthma risk, either overall orfor just the children playing three or moreteam sports.12
No area outside California has ever hadozone levels as high as the CHS high-ozoneareas. In fact, by the time the study was
Figure 2. Days per Year Exceeding the 8-hour Ozone Standard in California Children’s Health Study Communities Compared with the Worst Location in Each North Carolina County
Notes: The 12 Children’s Health Study (CHS) communities were ranked from worst to best and then divided into three groups of four communities each. Ozone levels during 1994-97 were then averaged for each group of four communities.These are the same groupings used in the CHS asthma study published in the Lancet. North Carolina ozone data are
based upon the average number of exceedance days per year during 1999-2001 at the worst location in each county
Source: CHS data were provided by the sta of the California Air Resources Board. North Carolina ozone data were downloaded from EPA at http://www.epa.gov/ttn/airs/airsaqs/detaildata/downloadaqsdata.htm.
D a y s p e r Y e a r
7/28/2019 Air Pollution Effects
http://slidepdf.com/reader/full/air-pollution-effects 7/22
J o h n l o c k e f o u n d a t i o n
the health effects of air pollut ion | separating science and propaganda
released in February 2002, it no longer ap-plied even in the southern California areas where it was performed. During 1999-2001,the four “high-ozone” CHS areas averaged
40 8-hour exceedance days per year—thesame as the “medium-ozone” areas, for which there was no change in asthma risk.
Figure 2 (preceding page) comparesozone levels in the 12 CHS communitiesduring 1994-97 with ozone levels NorthCarolina counties during 1999-2001 (thethree most-recent years before the study was released early in 2002). For Califor-nia, the graph shows the average number
of ozone exceedance days per year for theeach of the three groups of communities
ated the impression that air pollution is a major cause of asthma.
For example, according to the CarolinasClean Air Coalition (CCAC), a Charlotte-
based environmental group, “1/ 3-1/ 2 of allasthma in North Carolina is due to airpollution.”15 The CCAC provides no sourcefor this ridiculous claim. The CCAC alsoclaims “children with increased ozone ex-posure have 3.3 times the risk of developingasthma.”16
In other words, the CCAC takes a re-sult from the Children’s Health Study thatapplies to 8 percent of children living in
areas that average 89 8-hour ozone exceed-ance days per year, and applies it to allchildren in North Carolina — a state whereno area averages more than about 20 8-hourexceedances days per year. The CCAC alsocompletely missed the fact that the Chil-dren’s Health Study actually reported thathigher ozone was overall associated witha lower risk of developing asthma. This isjust one among many egregious examples ofactivists providing false information about
the relationship between air pollution andasthma.17
doeSair PollutionexacerbatePre-exiStinglungdiSeaSe?While air pollution is not plausible as a cause of asthma, air pollution can exacer-bate pre-existing respiratory diseases. Yeteven here, the eects of air pollution havebeen overstated in popular accounts whencompared with the weight of the evidence.For example, EPA estimates that evensubstantial ozone reductions will result intiny health improvements. In a recent studypublished in the journal Environmental Health Perspectives, EPA scientists estimatedthat reducing nationwide ozone from levelsduring 2002, which had by far the highestozone levels of the last six years, down tothe federal 8-hour standard would reduceasthma emergency room visits by 0.04
Air pollution is not a plausible cause of asthma. Nevertheless, many media and activist reports and even some prominent medical researchers havecreated the impression that air pollution is a major cause of asthma.
(high, medium, and low ozone). For eachNorth Carolina county, the graph shows
the number of 8-hour ozone exceedancedays per year at the worst location in thecounty. Note that even the worst areas of North Carolina don’t come close to eventhe medium-ozone areas of the CHS, muchless the high-ozone areas.13
ALA’s medical director wasn’t the only one providing false information about theCHS asthma study. At the press confer-ence releasing the study’s results, the USCresearchers who performed the study andthe CARB regulators who sponsored it alsoclaimed the study’s results apply to pollu-tion levels all around the United States.
Air pollution — at least the wide rangeof air pollutants that regulators measureand control, and that environmentalistssound alarms about — is not a plausiblecause of asthma.14 Nevertheless, many media and activist reports and even someprominent medical researchers have cre-
7/28/2019 Air Pollution Effects
http://slidepdf.com/reader/full/air-pollution-effects 8/22
the health effects of air pollut ion | separating science and propaganda
p o l i c y r e p o r t
percent, respiratory hospital admissions by 0.07 percent, and premature mortality by 0.03 percent.18
The California Air Resources Board
(CARB) recently adopted an ozone stan-dard for California that is much tougherthan the federal standard, requiring ozoneto be reduced to near or even below back- ground levels across the state.19 Despitethe fact that parts of California have muchhigher ozone levels than the rest of thecountry, CARB predicts that reducing ozone will result in little health improve-ment. For example, based on CARB’s
estimates, going from ozone levels during 2001-2003 down to attainment of CARB’sstandard — in eect an elimination of allhuman-caused ozone in the state — wouldreduce emergency room visits for asthma by 0.35 percent, respiratory-related hospitaladmissions by 0.23 percent, and prematuremortality by 0.05 percent.20
Even these benets are exaggerated,because CARB ignored contrary evidence when generating its benet estimates. For
example, researchers from Kaiser Perma-nente studied the relationship between airpollution and emergency room visits andhospitalizations in California’s CentralValley, and reported that higher ozone wasassociated with a statistically signicant decrease in serious health eects, such ashospital admissions.21 CARB omitted thisstudy from its estimate of the ostensiblebenets of a tougher ozone standard.22 CARB must have been aware of the study,because CARB funded and published it. This selective use of evidence creates theimpression that air pollution’s eects arelarger and more certain than suggested by the overall weight of the evidence.23
The pattern of hospital visits for asthma also suggests ozone can’t be a signicantfactor in respiratory exacerbations. Emer- gency room visits and hospitalizations forasthma are lowest during July and August,
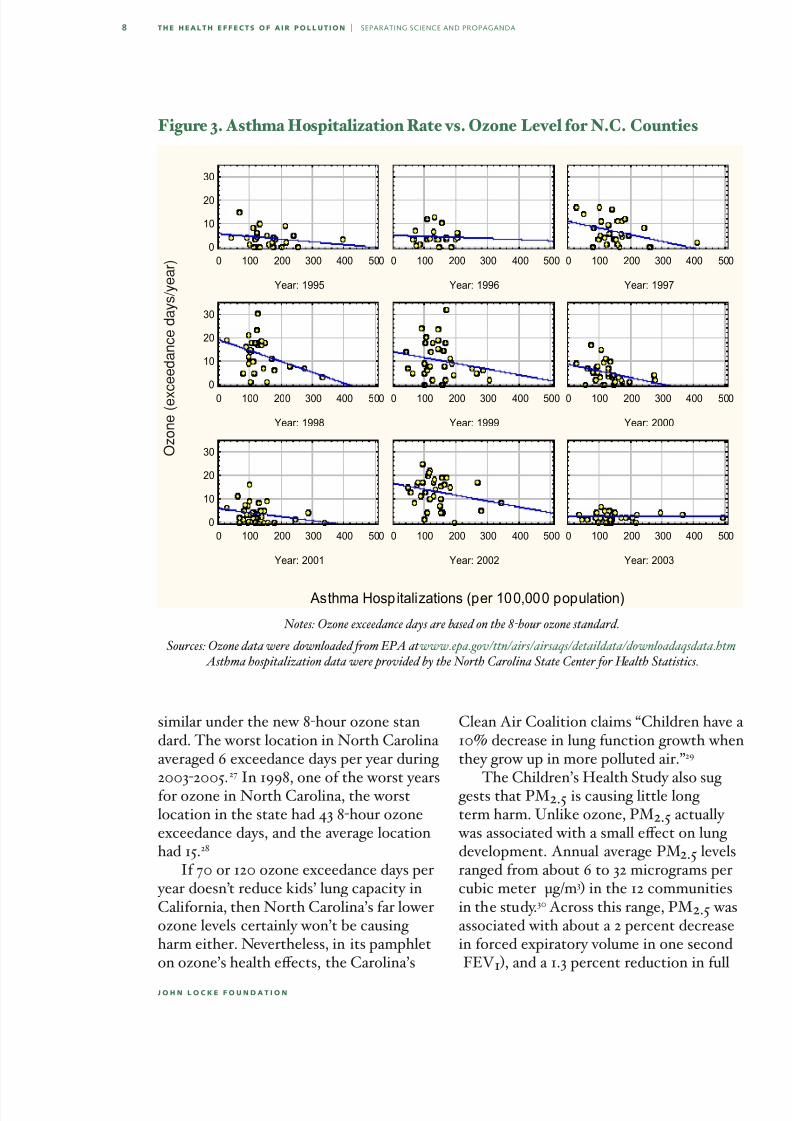
when ozone levels are at their highest.24 Forexample, in North Carolina, counties withthe lowest ozone levels have the highest rateof asthma hospitalizations. This is shown in
Figure 3. Each graph represents an individ-ual year and each point represents a NorthCarolina county. The vertical axis gives thenumber of 8-hour ozone exceedance daysin that year. For counties with more thanone ozone monitoring site, the ozone valueis an average of all sites in the county. Thehorizontal axis gives the number of asthma hospitalizations per 100,000 people. Thelines through the data points are linear
regression lines. Note that counties withthe lowest ozone have the highest asthma hospitalization rates.
long-termeffectS ofair Pollution The estimates above address only short-term eects of ozone. But the Children’sHealth Study suggests that ozone is having little eect on long-term health as well.In addition to asthma, the CHS assessedthe relationship between air pollution and
growth in children’s lung-function.25 Afterfollowing more than 1,700 children fromage 10 to 18 (years 1993 to 2001), the study reported that there was no associationbetween ozone and lung-function growth.This is despite the fact that the 12 com-munities in the study ranged from zero tomore than 120 8-hour ozone exceedancedays per year, and zero to more than 701-hour ozone exceedance days26 per yearduring the study period.
No area outside California has any - where near this frequency of elevatedozone, even for a single year, much less forseveral years running. For example, no area of North Carolina has ever had more than16 1-hour ozone exceedance days in a year — that was Charlotte back in 1978. Since1990, most of the state has had zero 1-hourozone exceedance days per year and nosite has ever had more than 5. The story is
7/28/2019 Air Pollution Effects
http://slidepdf.com/reader/full/air-pollution-effects 9/22
J o h n l o c k e f o u n d a t i o n
the health effects of air pollut ion | separating science and propaganda
similar under the new 8-hour ozone stan-dard. The worst location in North Carolina averaged 6 exceedance days per year during
2003-2005.
27
In 1998, one of the worst yearsfor ozone in North Carolina, the worstlocation in the state had 43 8-hour ozoneexceedance days, and the average locationhad 15.28
If 70 or 120 ozone exceedance days per year doesn’t reduce kids’ lung capacity inCalifornia, then North Carolina’s far lowerozone levels certainly won’t be causing harm either. Nevertheless, in its pamphleton ozone’s health eects, the Carolina’s
Clean Air Coalition claims “Children have a10% decrease in lung function growth whenthey grow up in more polluted air.”29
The Children’s Health Study also sug - gests that PM2.5 is causing little long-term harm. Unlike ozone, PM2.5 actually was associated with a small eect on lung development. Annual-average PM2.5 levelsranged from about 6 to 32 micrograms percubic meter (μg/m3 ) in the 12 communitiesin the study.30 Across this range, PM2.5 wasassociated with about a 2 percent decreasein forced expiratory volume in one second(FEV1 ), and a 1.3 percent reduction in full
Figure 3. Asthma Hospitalization Rate vs. Ozone Level for N.C. Counties
Notes: Ozone exceedance days are based on the 8-hour ozone standard.
Sources: Ozone data were downloaded from EPA at www.epa.gov/ttn/airs/airsaqs/detaildata/downloadaqsdata.htm. Asthma hospitalization data were provided by the North Carolina State Center for Health Statistics.
Asthma Hospitalizations (per 100,000 population)
Year: 1995
0 100 200 300 400 500
0
10
20
30
Year: 1996
0 100 200 300 400 500
Year: 1997
0 100 200 300 400 500
Year: 1998
0 100 200 300 400 500
0
10
20
30
Year: 1999
0 100 200 300 400 500
Year: 2000
0 100 200 300 400 500
Year: 2001
0 100 200 300 400 500
0
10
20
30
Year: 2002
0 100 200 300 400 500
Year: 2003
0 100 200 300 400 500
O z o n e ( e x c e e d a n c e d a y s / y e a r )
7/28/2019 Air Pollution Effects
http://slidepdf.com/reader/full/air-pollution-effects 10/22
the health effects of air pollut ion | separating science and propaganda
p o l i c y r e p o r t
vital capacity (FVC). Both tests are stan-dard tests of lung function.31
But even this drastically inates theapparent importance of the results, because
no location outside of the CHS communi-ties has PM2.5 levels anywhere near 32 μg/ m3. In fact, even the worst area in the U.S.averaged 25 μg/m3 for 2002-2004. Therealso didn’t appear to be any decrease in lung function until average PM2.5 levels exceed-ed about 15 μg/m3, which is the current levelof the federal annual PM2.5 standard.32 But87 percent of the nation’s monitoring loca -tions are already below 15 μg/m3. The worst
location in North Carolina averaged 15.4μg/m3 for 2002-04 and only two locations were above 15 μg/m3.
It is also worth noting that the childrenin the CHS were already 10 years old whenthey entered the study, and had thereforebeen breathing the even-higher air pollut-ant levels extant during the 1980s in south-ern California. For example, the Riversidearea averaged nearly 50 μg/m3 PM2.5 dur-ing the early 1980s.33 If it was these higher
1980s pollution levels that caused thelung-function declines, then the harm fromcurrent air pollution levels is even smallerthan the already tiny eect reported in theCHS lung-function study.
Thus, taking the CHS results at face value, ozone is having no eect on chil-dren’s lung development anywhere in theU.S. PM2.5 is having no eect in the vastmajority of the U.S., including North Caro-lina. Even in areas that have the highestPM2.5 levels in the country, the eect onlung function is at worst about a one per-cent decrease.
Despite nding little eect of air pol-lution on children’s lung growth, the USCresearchers’ press release on the study created the appearance of serious harm.Titled “Smog May Cause Lifelong Lung Decits,” the press release asserted “By age18, the lungs of many children who grow up
in smoggy areas are underdeveloped and will likely never recover.”34 The NationalInstitutes of Health also misled the publicabout the study’s ndings and relevance. In
the NIH press release, the director of theNational Institute of Environmental HealthSciences claimed the study “shows thatcurrent levels of air pollution have adverseeects on lung development in children...”35
Both press releases created the impres-sion that air pollution was associated withlarge decreases in lung function. In fact,the decrease was small, even in the mostpolluted areas. Furthermore, by referring
to “smoggy areas” and “current levels of airpollution” the press releases created thefalse impression that the study is relevant
Taking the Children’s Health Study results at face value, ozone is having no eect on children’s
lung development anywhere in the U.S. PM 2.5 is having no eect in the vast majority of the U.S.,
including North Carolina.
for many areas of the United States. But in
fact, even the tiny decreases in lung func-tion apply only to a few areas in California with uniquely high air pollution levels. Andeven in those few areas, the study applies topollution levels from at least a decade ago,and not to present pollution levels, whichare much lower than levels during the study.
Activists likewise create a misleading impression of widespread, serious harmfrom current levels of air pollution. Forexample, in a recent Charlotte Observer col-umn, Nancy Bryant of the Carolinas Clean Air Coalition claimed “Medical studiesshow that children who grow up in areas aspolluted as the Charlotte region are los-ing up to 20 percent of their lung function – permanently.”36
I asked Ms. Bryant if she could pro- vide the research evidence to back up thisclaim.37 She sent me the NIH press releasediscussed above.
7/28/2019 Air Pollution Effects
http://slidepdf.com/reader/full/air-pollution-effects 11/22
0
J o h n l o c k e f o u n d a t i o n
the health effects of air pollut ion | separating science and propaganda
doeSair PollutionKill?Death is by far the most serious among po-tential harms from air pollution, and thereis no question that high levels of air pollu-
tion can kill. About 4,000 Londoners diedduring the infamous ve-day “London Fog”episode of December 1952, when soot andsulfur dioxide soared to levels tens of times greater than the highest levels experiencedin developed countries today, and visibility dropped to less than 20 feet.38
The question today is whether current,far lower levels of air pollution can also bedeadly. EPA’s PM2.5 standards are based on
the assumption that PM2.5 at current levelsis killing tens of thousands of Americanseach year, due to both long-term exposuresand the acute eects of daily PM uctua -tions.39
researchers’ statistical model, rather than a real cause-eect relationship.
Reanalysis of the ACS data has alsoshown that considering additional factors
in the statistical analysis of the data canmake the apparent PM2.5 eect disappear.For example, when migration rates into andout of cities was added to the statisticalmodel relating PM2.5 and premature death,the apparent eect of PM2.5 declined by two-thirds and became statistically insig-nicant.42
Cities that lost population during the1980s — Midwest “rust belt” cities that
were in economic decline — also hadhigher average PM2.5 levels. People who work and have the wherewithal to migrateare healthier than the average person. These people left Midwest cities in dis-proportionate numbers, seeking jobs inmore economically dynamic parts of thecountry. The people who remained behind were less healthy on average, and there-fore more likely to die. Thus, the apparenteect of PM2.5 was actually “caused” by
healthier people moving away from areas ofthe country that were in economic decline,rather than from a change in any individu-al’s health status due to PM exposure. TheHarvard Six Cities study, another cohortstudy cited in support of PM-mortality claims, suers from similar problems.43
Regulators and environmentalists havealso ignored another major study thatreported no association between long-termPM2.5 levels and mortality in a cohort of
50,000 male veterans with high blood pres-sure—a group that should have been more susceptible than the average person to any pollution-related health eects.44
Studies of the short-term health eectsof daily uctuations in air pollution levelslikewise suer from a number of dicultiesthat create the appearance of an associa-tion between low-level air pollution andmortality where none may in fact exist.
The apparent eect of PM 2.5 was actually“caused” by healthier people moving away from
areas of the country that were in economic decline, rather than from a change in any individual’s health status due to PM exposure.
EPA based its annual PM2.5 standardmainly on the American Cancer Society (ACS) cohort study. The ACS study fol-lowed more than 500,000 Americans indozens of cities from 1982 to 1998.40 Intheir most recent report, the ACS research-ers concluded that each 10 μg/m3 increasein long-term PM2.5 levels is associated witha 4 percent increase in risk of death.41
However, inspection of the detailed re-
sults of the ACS study suggest that PM isn’tincreasing people’s risk of death. For ex -ample, the ACS study reported that PM2.5 apparently kills men, but not women; those with no more than a high school degree,but not those with at least some college;and those who said they were moderately active, but not the very active or the sed-entary. These results are biologically im-plausible and suggests problems with the
7/28/2019 Air Pollution Effects
http://slidepdf.com/reader/full/air-pollution-effects 12/22
the health effects of air pollut ion | separating science and propaganda
p o l i c y r e p o r t
One key problem is publication bias — thetendency for researchers and journal edi-tors to selectively publish studies that ndan air pollution-health association rather
than studies that fail to nd such an asso-ciation.45 Furthermore, in published studiesthere is a tendency to screen several waysof analyzing the data, but then report theanalyses that result in the largest and moststatistically signicant associations be-tween air pollution and health — an eectknown as model-selection bias. As a recentreview of air pollution epidemiology studiesconcluded,
Estimation of very weak associationsin the presence of measurement errorand strong confounding is inherently challenging. In this situation, prudentepidemiologists should recognizethat residual bias can dominate theirresults. Because the possible mecha-nisms of action and their latenciesare uncertain, the biologically correctmodels are unknown. This model
selection problem is exacerbated by the common practice of screening multiple analyses and then selec-tively reporting only a few importantresults.46
Studies of the eect of publication biashave shown that it can reduce the appar-ent association between daily air pollu-tion levels and mortality by as much as 70percent.47 After accounting for model-selec-tion bias, a recent study concluded that theair pollution-mortality association drops tozero.48
Studies of the mortality risk of airpollution are not like drug trials, where volunteers are randomly assigned to treat-ment and control groups in order to isolatethe real eects of the prospective drug.Instead, ethics and practicality requirethat researchers use non-random observa-
tional data and try to statistically tease outthe putative eects of air pollution fromall other confounding factors that couldaect health. As shown above, the results
of these statistical studies must be taken with a large grain of salt. Experience withhormone replacement therapy provides ad-ditional evidence of how relying on obser- vational epidemiology studies can lead toseriously mistaken conclusions.
Based on observational epidemiologicalstudies of hormone replacement therapy (HRT), researchers concluded that notbeing on HRT increases a woman’s risk of
heart disease by a factor of 2.
49
An inu-ential meta-analysis of these studies, pub-lished in 1991, helped make HRT one of the most prescribed therapies in the UnitedStates.50 But more recently, randomized
Studies of the eect of publication bias have shown that it can reduce the apparent association
between daily air pollution levels and mortalityby as much as 70 percent.
controlled trials, which eliminate the possi-bility of confounding by unobserved factorsthat aect health, showed that HRT doesnot reduce heart disease risk and mighteven increase risk.
Thus, in the HRT case, even a 100percent increase in risk based on epidemio-logical studies turned out to be spuriousonce all confounding eects were genu-inely controlled for by doing a randomized,controlled trial. The putative risks that airpollution studies are attempting to pickout are tiny by comparison — at most a few tenths of a percent in the short-termstudies and a few percent in the long-termstudies. Furthermore, the eects of airpollution need to be separated out from a much larger array of potential confounding factors than in the case of the HRT stud-ies. Indeed, a number or epidemiologistshave suggested that epidemiological studies
7/28/2019 Air Pollution Effects
http://slidepdf.com/reader/full/air-pollution-effects 13/22
J o h n l o c k e f o u n d a t i o n
the health effects of air pollut ion | separating science and propaganda
are inherently unreliable for assessing theexistence of such small risks.51
Given the unreliability of epidemiologi-cal studies in cases where the magnitude of
the potential risk is small, it is also impor-tant to note that controlled toxicologicalstudies with animals and human volunteersdo not nd evidence that air pollution cancause disease or death at concentrationsanywhere near as low as the levels found inambient air in the United States.52 A recentreview of particulate matter concluded,
It remains the case that no form of
ambient PM — other than viruses,bacteria, and biochemical antigens— has been shown, experimentally orclinically, to cause disease or death atconcentrations remotely close to USambient levels. This lack of dem-onstration is not for lack of trying:hundreds of researchers, in the USand elsewhere, have for years beenexperimenting with various forms of pollution-derived PM, and none has
found clear evidence of signicantdisease or death at relevant airborneconcentrations.53
Despite the conclusion above, in De-cember 2005 the Journal of the American Medical Association published the resultsof a study that claimed even relatively low current levels of PM2.5 might be increasing Americans’ risk of heart disease. The study exposed mice to 85 μg/m3 of PM2.5 drawn
from ambient air for 6 hours per day for 6months, or about one-fourth of a typicalmouse life-span.54 Mice fed a high-fat diethad more signs of heart disease if exposedto PM2.5, when compared with an unex-posed control group.
The study caused a minor media sen-sation, with both journalists and healthexperts claiming the study provides proof that particulate pollution is a signicant
risk factor in human heart disease.55 But what none of the reporters or health ex-perts mentioned is that the mice in thestudy had been genetically engineered to
have blood cholesterol levels 5 to 6 times greater than normal mice, and 14 timesnormal when fed a high-fat diet.56
These are stupendous cholesterol levels.For comparison, doctors consider a personto have medically high cholesterol if hischolesterol level is more than 20 percent greater than the U.S. male average of 200milligrams per deciliter. Only about one-in-50 American men has a cholesterol level
more than 50 percent above the U.S. aver-age. And only about one-in-500 has choles-terol greater than twice the U.S. average.57 Indeed, the very reason for using theseunrealistic mice to study PM2.5, is thatPM2.5 does not kill regular mice or otheranimals even at PM concentrations many times greater than even the highest levelsfound in the United States.
r egulatory coStS andamericanS’
health None of the discussion above would mat-ter if we could reduce air pollution for free.But reducing air pollution is costly. Attain-ing the federal 8-hour ozone and annualPM2.5 standards will cost tens to hundredsof billions of dollars per year.58 These costsare ultimately paid by people in the formof higher prices, lower wages, and reducedchoices.59 We all have many needs andaspirations and insucient resources with which to fulll them. Spending more on airquality means spending less on other thingsthat improve our health, safety, and welfare.
Higher incomes are associated withimproved health, because people spenda portion of each additional dollar of in-come on things that directly or indirectly improve health and safety, such as bettermedical care, more crashworthy cars, andmore nutritious food.60 People made poorer
7/28/2019 Air Pollution Effects
http://slidepdf.com/reader/full/air-pollution-effects 14/22
7/28/2019 Air Pollution Effects
http://slidepdf.com/reader/full/air-pollution-effects 15/22
J o h n l o c k e f o u n d a t i o n
the health effects of air pollut ion | separating science and propaganda
port for counterproductive regulations.Regulators, environmentalists, and
scientists no doubt appear to be more cred-ible sources of objective information when
compared with, say, politicians or industry lobbyists. But, like other interest groups,the goals of these groups often do not coin-cide with the interests of the vast majority of Americans. Environmental groups wantto increase support for ever more stringentregulations, maintain and enhance theircontrol over other people’s lives, and bring
be published and to receive press cover-age than studies that do not. Regulatory agencies, whose existence depends on theperception that air pollution is a serious
health problem, are also major funders of the research intended to demonstrate theseriousness of the problem. Researchers who report larger health eects are prob-ably also more likely to attract additionalresearch funding. Scientists who choosea career in air pollution health researchare probably more likely to hold an envi-ronmentalist ideology and to believe thatair pollution is a serious problem. Indeed,
many environmental health researchershave explicitly associated themselves withenvironmental groups and causes.63
Journalists should be acting as a checkon air pollution misinformation, but they are not. Media outlets face their ownpressures to sensationalize stories. It is a journalistic truism that good news doesn’tsell newspapers or attract viewers. “Air-plane lands safely” is not news; “Airplanecrashes” is. So it is not surprising that most
news coverage of air quality — like envi-ronmental news generally — accentuatesthe negative and downplays the positive.Yet if journalists continue to be unable orunwilling to improve environmental report-ing, Americans are likely to remain misin-formed and unnecessarily afraid.
Most public information on air pollution and
health comes from environmental activists, regula�tors, and health researchers. Most of their claims of harm from air pollution are great exaggerations or even outright fabrications.
in the donations that support their activ-ism. While regulators want to show thesuccess of their eorts to reduce air pol-lution, they also want to justify the needto preserve or expand their powers andbudgets. Maintaining a climate of crisis and
pessimism meets these institutional goals,but at the expense of encouraging people toexaggerate the risks they face.
Scientic and medical research nomi-nally has more checks and balances, butenvironmental health research suers fromits own set of pressures. Studies that reportharm from air pollution are more likely to
7/28/2019 Air Pollution Effects
http://slidepdf.com/reader/full/air-pollution-effects 16/22
the health effects of air pollut ion | separating science and propaganda
p o l i c y r e p o r t
noteS
1. Clean Air Task Force, Death, Disease and Dirty Power: Mortality and Health Damage Due to Air Pollution from Power Plants (Boston: October
2000), http://www.cleartheair.org/fact/mortality/ mortalitylowres.pdf ; Physicians for SocialResponsibility, Children at Risk: How Air Pollution from Power Plants Threatens the Health of America’sChildren (Boston: May 2002), http://www.cleartheair.org/fact/children/children_at_risk.pdf ; PIRG, Danger in the Air (Washington, DC: August 2003).
2. B. Henderson, “Trac Is Choking Charlotte’s Air,” Charlotte Observer , August 7, 2005.
3. Asthma prevalence trends are estimated fromthe Centers for Disease Control’s (CDC) annualNational Health Interview Survey (NHIS). The
CDC changed its asthma survey questions in 1997,preventing comparison with data collected up to1996. Between 1997 and 2000, the CDC stoppedasking people whether they currently had asthma.However, in 1997 CDC began asking people whohad ever been diagnosed with asthma whether they had had an attack in the past 12 months. In 2001,CDC began once again to ask people whetherthey currently had asthma, but with a slightly dierent question than pre-1997 surveys. Basedon these data, the prevalence of asthma attacksleveled o from 1997-2003, while the prevalenceof asthma declined from 2001-2003. AmericanLung Association, Trends in Asthma Morbidity and Mortality (Washington, DC: May 2005), http://www.lungusa.org/atf/cf/%7B7A8D42C2-FCCA-4604-8ADE-7F5D5E762256%7D/ASTHMA1.PDF; D.M. Mannino, D. M. Noma, L. J. Akinbami et al.,“Surveillance for Asthma — United States, 1980-1999,” Morbidity and Mortality Weekly Report 51 (SS01)(2002): 1-13.
4. PM2.5 is shorthand for airborne soot and dustup to 2.5 micrometers in diameter. One micrometeris one-millionth of a meter, or one-25,000th of aninch.
5. Trends in these and other pollutants weredetermined from monitoring data extracted fromthe California Air Resources Board’s 2005 AirPollution Data CD. The latest edition of the CDavailable at http://www.arb.ca.gov/aqd/aqdcd/aqdcd.htm.
6. For CARB’s press release, see California AirResources Board, “Study Links Air Pollution and
Asthma,” January 31, 2002, http://www.arb.ca.gov/ newsrel/nr013102.htm.
7. This result is discussed in the peer-reviewed
journal article the researchers published on thestudy. R. McConnell, K. T. Berhane, F. Gillilandet al., “Asthma in Exercising Children Exposed toOzone: A Cohort Study,” Lancet 359 (2002): 386-91.
8. See, for example, W. Booth, “Study: PollutionMay Cause Asthma; Illness Aects 9 Million U.S.Children,” Washington Post , February 1, 2002, A1;C. Bowman, “Asthma’s Toll: A New Study LinksChildren’s Sports Activities in Smoggy Areas to theIllness.,” Sacramento Bee, February 1, 2002, A1; M.Enge, “Study Links Pollution to Asthma in Children;
Active Kids in Smoggy Areas at More Risk,Researchers Say,” San Jose Mercury News, February 1,2002, 21A; T. Freemantle, “Asthma Risk for ChildrenSoars with High Ozone Levels - Study,” HoustonChronicle, February 1, 2002, A1.
9. G. D. Thurston and D. V. Bates, “Air Pollution asan Underappreciated Cause of Asthma Symptoms,” Journal of the American Medical Association 290 (2003):1915-7.
10. Dr. Norman Edelman, quoted in S. Borenstein,“Air Pollution Is a Cause of Asthma, Study Contends,” Philadelphia Inquirer , February 1, 2002,
A04.
11. The 8-hour ozone standard is the current federalstandard for ozone. The standard is exceeded on a
given day if ozone during any consecutive 8-hourperiod averages more than 0.085 parts per million(ppm).
12. These asthma risk change are relative for thefour “low-ozone” communities, which averaged 0.68-hour exceedance days per year.
13. Ozone levels were higher in North Carolina in 2002, but not by much. Rowan County hadthe worst ozone in the state in 2002, with 288-hour ozone exceedance days — still well below CHS “medium” ozone areas, which average 40exceedance days. During the last three years, NorthCarolina has experienced its lowest ozone levelsever, with even the worst location in the state
averaging only six ozone exceedance days per year.14. More recently, the CHS researchers have slicedthe data in a dierent way to argue that air pollutionis a large risk factor for asthma. For a critique of thismore recent study, see J. Schwartz, “Asthma and AirPollution,” Tech Central Station, September 26, 2005,http://www.tcsdaily.com/article.aspx?id=092605E .
The original study is J. Gauderman, E. Avol, F.Lurmann et al., “Childhood Asthma and Exposureto Trac and Nitrogen Dioxide,” Epidemiology 16(2005).
15. Carolinas Clean Air Coalition, Impacts of Ozone
7/28/2019 Air Pollution Effects
http://slidepdf.com/reader/full/air-pollution-effects 17/22
J o h n l o c k e f o u n d a t i o n
the health effects of air pollut ion | separating science and propaganda
on Our Health (Charlotte, NC: undated), http:// 003af56.netsolhost.com/air_basics_ozone_impact.htm.
16. As with all of the health claims on its web
site, the CCAC does not cite any sources for thisclaim, but it clearly comes from the California CHSasthma study.
17. Among many other examples, see, for example, Fresno Bee, “Asthma in the Valley; More Research IsNeeded into a Disease That Runs Rampant Here,” Fresno Bee, October 4, 2004; NRDC, “EPA Set toLaunch New Study on Causes of Asthma,” October31, 2002, www.nrdc.org/bushrecord/health_air.asp#1157; Sacramento Bee, “Smog and Asthma: TheLink — and Threat — Are Real,” Sacramento Bee,May 6, 2003, B6; R. Sanchez, “In Calif., A Crackling Controversy over Smog; Illnesses Drive Push toBan Fireplaces,” Washington Post , February 16, 2003,
A1; D. S. Stanley, “Stop the Spread of Asthma by Cleaning up Our Air,” Fresno Bee, August 7, 2004, B9;Surface Transportation Policy Project, Clearing the Air (Washington, DC: August 2003).
18. This analysis assumes that there are no healthbenets from further reductions of ozone oncethe standard is achieved. However, attaining theozone standard requires reducing ozone below thestandard on the worst day at the worst locationin a given region. Within any given region, ozonedoes not exceed the standard on most days in most
locations. Nevertheless, the measures necessary toattain the standard on the worst day at the worstlocation would also reduce ozone on other days andother locations. As a result, most of the reductionin ozone exposure occurs on days and locations in
which ozone already complies with the standard. If benets continue to accrue when ozone is reducedbelow the federal 8-hour standard, then the benetsof attaining the federal 8-hour standard wouldbe several times greater — about an 0.2 percentreduction in asthma ER visits, an 0.35 percentreduction in respiratory hospital admissions, andan 0.15 percent reduction in premature deaths.B. J. Hubbell, A. Hallberg, D. R. McCubbin et al.,“Health-Related Benets of Attaining the 8-HrOzone Standard,” Environmental Health Perspectives 113 (2005): 73-82.
19. California Air Resources Board, Review of theCalifornia Ambient Air Quality Standard for Ozone (Sacramento: March 2005), http://www.arb.ca.gov/ research/aaqs/ozone-rs/ozone-nal/ozone-nal.htm.
20. J. Schwartz, Rethinking the California Air Resources Board’s Ozone Standards (Washington, DC: AmericanEnterprise Institute, September 2005), http://www.
aei.org/doclib/20050912_Schwartzwhitepaper.pdf . This assumes that benets continue to accrueonly until ozone levels are reduced down to the0.070 ppm standard. If benets continue to accruefor ozone levels below the standard, then the
percentage reduction in total health eects wouldbe about 1.8 percent for asthma ER visits and 1.2percent for respiratory hospital admissions and 0.3percent for premature deaths.
21. S. F. van den Eeden, C. P. Quesenberry, J. Shanet al., Particulate Air Pollution and Morbidity in theCalifornia Central Valley: A High Particulate Pollution Region (Sacramento: CARB, July 2002).
22. California Air Resources Board, Hospitalizations and Emergency Room Visits Increase Following High Particulate Matter Episodes, Study Finds (Sacramento:February 24, 2003), http://www.arb.ca.gov/newsrel/ nr022403.htm.
23. For additional examples, see Schwartz, Rethinking the California Air Resources Board’s OzoneStandards.
24. For data on asthma emergency room visitsand hospitalizations by month, see, for example,Spokane Regional Health District, Asthma inSpokane County (Spokane, Washington: April2002), http://www.srhd.org/information/pubs/ pdf/factsheets/AsthmaInSpokaneCounty.pdf ; J.Stockman, N. Shaikh, J. von Behren et al., CaliforniaCounty Asthma Hospitalization Chart Book, Data from1998-2000 (Sacramento: California Departmentof Health Services, September 2003), http://www.ehib.org/cma/papers/Hosp_Cht_Book_2003.pdf ;Texas Department of Health, Asthma Prevalence, Hospitalizations and Mortality — Texas, 1999-2001 (Austin: November 21, 2003), http://www.tdh.state.tx.us/cphpr/asthma/asthma.pdf ; K. Tippy andN. Sonnenfeld, Asthma Status Report, Maine 2002 (Augusta, ME: Maine Bureau of Health, November25, 2002); K. R. Wilcox and J. Hogan, An Analysisof Childhood Asthma Hospitalizations and Deathsin Michigan, 1989-1993 (Lansing, MI: Michigan
Department of Community Health, undated),http://www.michigan.gov/documents/Childhood_ Asthma_6549_7.pdf .
25. W. J. Gauderman, E. Avol, F. Gilliland et al.,“The Eect of Air Pollution on Lung Developmentfrom 10 to 18 Years of Age,” New England Journal of Medicine 351 (2004): 1057-67.
26. In 2004, EPA replaced the old 1-hour ozonestandard with the signicantly more stringent 8-hour standard.
27. The location is China Grove, in Rowan County.
7/28/2019 Air Pollution Effects
http://slidepdf.com/reader/full/air-pollution-effects 18/22
the health effects of air pollut ion | separating science and propaganda
p o l i c y r e p o r t
28. In that year, the worst location was a rural sitein Mecklenburg County. Rockwell, the second worstsite in the state in 1998, had 27 exceedance days.
29. Carolinas Clean Air Coalition, Impacts of Ozone
on Our Health.30. The actual range in the study was 5 to 28 μg/m3.However, PM2.5 was measured using a dierentmethod from the one EPA began requiring in 1999to determine compliance with the federal PM2.5 standard. The CHS measured two-week-averagePM2.5 levels. This understates PM2.5 levels, becauseit allows some “semi-volatile” species to evaporate,both because of the long collection time andbecause the lters are at ambient temperature. Thenew federal method measures daily-average PM2.5 and keeps the lters cooled to prevent evaporation.Because I compare the CHS PM
2.5levels with
PM2.5 levels measured around the country using thenew EPA method, I’ve corrected the CHS PM2.5 measurements to make them equivalent to theEPA method. For details on the correction, see N.Motallebi, J. Taylor, B. E. Croes et al., “ParticulateMatter in California: Part 1 — Intercomparison of Several PM2.5, PM10-2.5, and PM10 Monitoring Networks,” Journal of the Air & Waste Management Association 53 (2003): 1509-16.
31. This percentage change is not explicitly mentioned in the journal article on the study.However, it can be calculated from information
in the article. First, note from Table 3 that PM2.5 was associated with a 79.7 milliliter (ml) reductionin FEV1 between the least and most pollutedcommunity. Then from Table 2, note that at 18 yearsof age, average FEV1 was 3,332 ml for girls and 4,464ml for boys. Given that there were 876 girls and883 boys in the study (see p. 1,059, column 1), the
weighted average FEV1 for the study population was3,900 ml. The percentage decline is then 79.7/3,900= 0.02 or 2 percent. Gauderman, Avol, Gilliland et al.,“The Eect of Air Pollution on Lung Developmentfrom 10 to 18 Years of Age.”
32. See Figure 3, ibid.33. Once again, this is corrected for the low bias of dichotomous samplers relative to the newer FRMsamplers. Motallebi, Taylor, Croes et al., “ParticulateMatter in California: Part 1 — Intercomparison of Several PM2.5, PM10-2.5, and PM10 Monitoring Networks.”
34. A. D. Rado, Smog May Cause Lifelong Lung Decits (Los Angeles: University of Southern California,September 8, 2004), http://www.usc.edu/uscnews/ stories/10495.html.
35. Dr. Kenneth Olden, quoted in NationalInstitutes of Health, “New Research Shows AirPollution Can Reduce Children’s Lung Function,”September 9, 2004, http://www.nih.gov/news/pr/ sep2004/niehs-08a.htm.
36. N. Bryant, “What Air Quality Problem?”Charlotte Observer , September 1, 2005, http://www.charlotte.com/mld/charlotte/news/opinion/12530112.htm?BMIDS=13194.
37. E-mail from Joel Schwartz to Nancy Bryant,September 7, 2004. On le with the author.
38. I. M. Goklany, Clearing the Air: The Real Storyof the War on Air Pollution (Washington, DC: Cato,1999).
39. Natural Resources Defense Council, Breath-Taking: Premature Mortality Due to Particulate Air
Pollution in 239 American Cities (Washington, DC:May 1996), http://www.nrdc.org/air/pollution/bt/ btinx.asp; R. Wilson and J. Spengler, Particles in Our Air: Concentrations and Health Eects (Cambridge,MA: Harvard University Press, 1996)..
40. C. A. Pope, 3rd, M. J. Thun, M. M. Namboodiriet al., “Particulate Air Pollution as a Predictor of Mortality in a Prospective Study of U.S. Adults,” American Journal of Respiratory and Critical Care Medicine 151 (1995): 669-74.
41. C. A. Pope, 3rd, R. T. Burnett, M. J. Thun et al., “Lung Cancer, Cardiopulmonary Mortality,and Long-Term Exposure to Fine Particulate AirPollution,” Journal of the American Medical Association 287 (2002): 1132-41.
42. D. Krewski, R. T. Burnett, M. S. Goldberg et al., Reanalysis of the Harvard Six Cities Study and the American Cancer Society Study of Particulate Air Pollution and Mortality (Cambridge, MA: HealthEects Institute, July 2000).
43. F. W. Lipfert, “Estimating Air Pollution-Mortality Risks from Cross-Sectional Studies:Prospective vs. Ecologic Study Designs,” Health andRegulatory Issues, Proceedings of the InternationalSpecialty Conference, Air and Waste Management
Association, 1995; F. W. Lipfert, “Commentary on the HEI Reanalysis of the Harvard Six CitiesStudy and the American Cancer Society Study of Particulate Air Pollution and Mortality,” Journal of Toxicology and Environmental Health, Part A 66 (2003):1705-14; J. Schwartz, Particulate Air Pollution: Weighing the Risks (Washington, DC: Competitive EnterpriseInstitute, April 2003), http://www.cei.org/pdf/3452.pdf .
44. F. W. Lipfert, H. M. Perry, J. P. Miller et al., “The
7/28/2019 Air Pollution Effects
http://slidepdf.com/reader/full/air-pollution-effects 19/22
J o h n l o c k e f o u n d a t i o n
the health effects of air pollut ion | separating science and propaganda
Washington University-EPRI Veterans’ CohortMortality Study,” Inhalation Toxicology 12 (suppl. 4)(2000): 41-73.
45. Publication bias is a well-documented problem
in a range of disciplines. See, for example, V. M.Montori, M. Smieja and G. H. Guyatt, “PublicationBias: A Brief Review for Clinicians,” Mayo Clinic Proceedings 75 (2000): 1284-8; A. Thornton and P.Lee, “Publication Bias in Meta-Analysis: Its Causesand Consequences,” Journal of Clinical Epidemiology 53 (2000): 207-16. For more on publication bias inair pollution epidemiology studies, see H. Anderson,R. Atkinson, J. Peacock et al., Meta-Analysis of Time-Series Studies and Panel Studies of Particulate Matter (PM) and Ozone (World Health Organization, 2004),
www.euro.who.int/document/e82792.pdf ; S. H.Moolgavkar, “A Review and Critique of the EPA’s
Rationale for a Fine Particle Standard,” RegulatoryToxicology and Pharmacology 42 (2005): 123-44.
46. T. Lumley and L. Sheppard, “Time Series Analyses of Air Pollution and Health: Straining atGnats and Swallowing Camels?” Epidemiology 14(2003): 13-4.
47. M. Bell, J. Samet and F. Dominici, Ozone and Mortality: A Meta-Analysis of Time-Series Studies and Comparison to a Multi-City Study (the National Morbidity, Mortality, and Air Pollution Study) (Baltimore: Johns Hopkins School of PublicHealth, July 19, 2004), http://www.bepress.com/cgi/
viewcontent.cgi?article=1057&context=jhubiostat.
48. G. Koop and L. Tole, “Measuring the HealthEects of Air Pollution: To What Extent Can WeReally Say That People Are Dying from Bad Air?” Journal of Environmental Economics and Management 47(2004): 30-54.
49. This discussion of the implications of HRTstudies for air pollution epidemiology is summarizedfrom Moolgavkar, “A Review and Critique of theEPA’s Rationale for a Fine Particle Standard.”
50. M. J. Stampfer and G. A. Colditz, “Estrogen
Replacement Therapy and Coronary Heart Disease: A Quantitative Assessment of the EpidemiologicEvidence,” Preventive Medicine 20 (1991): 47-63. Citedibid .
51. G. Taubes, “Epidemiology Faces Its Limits,”Science 269 (1995): 164-69.
52. L. Green, E. Crouch, M. Ames et al., “What’sWrong with the National Ambient Air Quality Standard (NAAQS) for Fine Particulate Matter(PM2.5 )?” Regulatory Toxicology and Pharmacology 35 (2002): 327; L. C. Green and S. R. Armstrong,
“Particulate Matter in Ambient Air and Mortality:Toxicologic Perspectives,” Regulatory Toxicology and Pharmacolog y 38 (2003): 326-35; Moolgavkar, “AReview and Critique of the EPA’s Rationale for a Fine Particle Standard.”
53. Green and Armstrong, “Particulate Matterin Ambient Air and Mortality: ToxicologicPerspectives.”
54. Q. Sun, A. Wang, X. Jin et al., “Long-Term Air Pollution Exposure and Acceleration of Atherosclerosis and Vascular Inammation in an Animal Model,” Journal of the American Medical Association 294 (2005): 3003-10.
55. Newspapers carrying articles on the study included the Los Angeles Times, Houston Chronicle, Philadelphia Inquirer, and several others. The
National Institutes of Health also put out a pressrelease highlighting the study (http://www.nih. gov/news/pr/dec2005/niehs-22.htm). For a moredetailed critique, showing why the study is irrelevantfor human (or mouse) PM2.5 risks and how thescientists involved misrepresented the study’sresults, see J. Schwartz, “Of Mice and Men,” TechCentral Station, April 17, 2006, http://www.tcsdaily.com/article.aspx?id=041706E.
56. A few of the news stories mentioned that thestudy used “specially bred mice prone to heartdisease.” But this is a great understatement, becauseit creates the impression that the mice weresimilar to humans who have a high heart diseaserisk, and therefore that the study is relevant forhuman beings. In reality, the mice were genetically engineered to have cholesterol far beyond even thehighest levels that would ever occur in humans or in“natural” mice.
57. Based on National Health and NutritionExamination Survey (NHANES) data on 4,090adult men collected from 1999-2002. Data weredownloaded from http://www.cdc.gov/nchs/nhanes.htm.
58. S. E. Dudley, National Ambient Air QualityStandard for Ozone (Arlington, VA: MercatusCenter, George Mason University, March 12 1997),http://www.mercatus.org/pdf/materials/125.pdf ; S.Huebner and K. Chilton, EPA’s Case for New Ozone and Particulate Standards: Would Americans Get Their Money’s Worth? (St. Louis: Center for the Study of American Business, Washington University in St. Louis, June 1997), csab.wustl.edu/csab/ CSAB%20pubs-pdf%20les/Policy%20Studies/ PS139%20Huebner-Chilton.pdf ; R. Lutter, Is EPA’s Ozone Standard Feasible? (Washington, DC:
7/28/2019 Air Pollution Effects
http://slidepdf.com/reader/full/air-pollution-effects 20/22
the health effects of air pollut ion | separating science and propaganda
p o l i c y r e p o r t
AEI-Brookings Joint Center for Regulatory Studies, December 1999), www.aei.brookings.org/ publications/reganalyses/reg_analysis_99_06.pdf .
59. A. P. Bartel and L. G. Thomas, “Predation
through Regulation: The Wage and Prot Eects of the Occupational Safety and Health Administrationand the Environmental Protection Agency,” Journal of Law and Economics 30 (1987): 239; D.Schoenbrod, “Protecting the Environment in theSpirit of the Common Law,” in The Common Law and the Environment: Rethinking the Statutory Basis for Modern Environmental Law, ed. R. E. Meinersand A. P. Morriss (Lanham, MD: Rowman &Littleeld, 2000); A. Wildavsky, Searching for Safety(New Brunswick, NJ: Transaction Publishers, 1988).
The costs of environmental regulations are alsoregressive, falling more heavily on the poorest. See
F. B. Cross, “When Environmental RegulationsKill: The Role of Health/Health Analysis,” Ecology Law Quarterly 22 (1995): 729; H. D. Robinson, “WhoPays for Industrial Pollution Abatement?” Review of Economics and Statistics 67 (1985): 702-06.
60. R. Lutter, J. Morrall, III and W. Viscusi, “TheCost-Per-Life-Saved Cuto for Safety-Enhancing
Regulations,” Economic Inquiry 37 (1999): 599-608; W.K. Viscusi, “The Value of Risks to Life and Health,” Journal of Economic Literature 31 (1993): 1912-46;Wildavsky, Searching for Safety.
61. Lutter, Morrall and Viscusi, “The Cost-Per-Life-Saved Cuto for Safety-Enhancing Regulations.”The value is adjusted from 1997 to 2004 dollarsbased on the CPI.
62. T. O. Tengs, M. E. Adams, J. S. Pliskin et al.,“Five-Hundred Life-Saving Interventions and TheirCost-Eectiveness,” Risk Analysis 15 (1995): 369-90.
Tengs et al. estimated the cost at $42,000 in 1993dollars. I’ve adjusted the value in the text to 2004dollars.
63. See, for example, Clean Air Task Force, Children at Risk (Boston, 2002); Natural Resources Defense
Council, Heat Advisory (Washington, DC: 2004); American Lung Association, “American Lung Association Calls on EPA to Strengthen ParticlePollution Protections for All Americans,” March 8,2006; American Lung Association, “100+ ScientistsEndorse Stringent New PM Standards,” December5, 2005, http://www.cleanairstandards.org/article/ articleview/404/1/41.
7/28/2019 Air Pollution Effects
http://slidepdf.com/reader/full/air-pollution-effects 21/22
0
J o h n l o c k e f o u n d a t i o n
the health effects of air pollut ion | separating science and propaganda
about theauthor Joel Schwartz is a visiting scholar at the American Enterprise Institute and the author
of the AEI study “No Way Back: Why Air Pollution Will Continue to Decline.”Mr. Schwartz formerly directed the Reason Public Policy Institute’s Air Quality Proj-
ect and has also published studies on chemical risks and extended producer responsibility.Prior to joining Reason, he was Executive Ocer of the California Inspection and Main-tenance Review Committee, a government agency charged with evaluating California’s vehicle emissions inspection program and making recommendations to the legislature andGovernor on program improvements. He has also worked at the RAND Corporation, theSouth Coast Air Quality Management District, and the Coalition for Clean Air.
Mr. Schwartz received his bachelor’s degree in chemistry from Cornell University andhis master’s degree in planetary science from the California Institute of Technology. Helives and works in Sacramento, California.
about the JohnlocKefoundationThe John Locke Foundation is a nonprot, nonpartisan policy institute based in
Raleigh. Its mission is to develop and promote solutions to the state’s most critical chal-lenges. The Locke Foundation seeks to transform state and local government through the
principles of competition, innovation, personal freedom, and personal responsibility inorder to strike a better balance between the public sector and private institutions of fam-ily, faith, community, and enterprise.
To pursue these goals, the Locke Foundation operates a number of programs andservices to provide information and observations to legislators, policymakers, businessexecutives, citizen activists, civic and community leaders, and the news media. Theseservices and programs include the foundation’s monthly newspaper, Carolina Journal; itsdaily news service, CarolinaJournal.com; its weekly e-newsletter, Carolina Journal Weekly Report; its quarterly newsletter, The Locke Letter; and regular events, conferences, andresearch reports on important topics facing state and local governments.
The Foundation is a 501(c)(3) public charity, tax-exempt education foundation and is
funded solely from voluntary contributions from individuals, corporations, and charitablefoundations. It was founded in 1990. For more information, visit www.JohnLocke.org.
7/28/2019 Air Pollution Effects
http://slidepdf.com/reader/full/air-pollution-effects 22/22
“To prejudge other men’s notions before we have looked into themis not to show their darkness
but to put out our own eyes.” john locke (6–)
Autr, Two Treatises of Government adFundamental Constitutions of Carolina
200 West Morgan St.,
Raleigh, NC 27601
V: 919-828-3876
F 919 821 5117