Embed Size (px)
Citation preview
AIR PASSENGER MARKET ANALYSIS MAY 2015 KEY POINTS
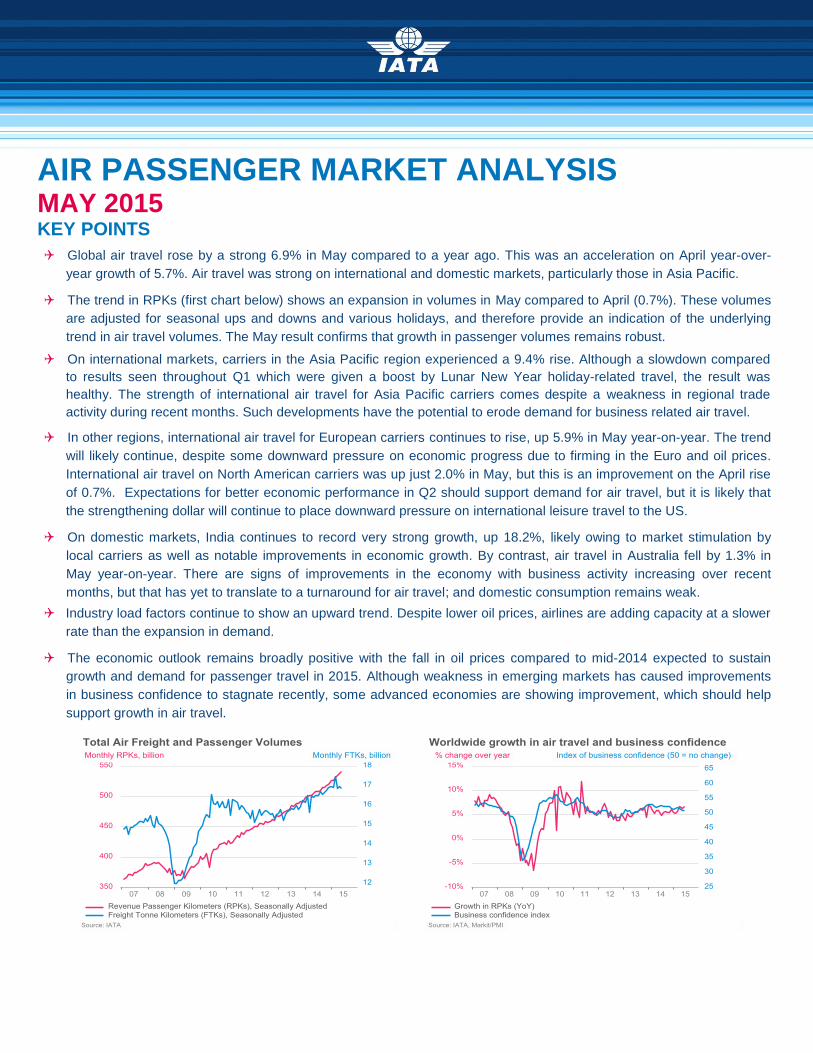
Global air travel rose by a strong 6.9% in May compared to a year ago. This was an acceleration on April year-over-
year growth of 5.7%. Air travel was strong on international and domestic markets, particularly those in Asia Pacific.
The trend in RPKs (first chart below) shows an expansion in volumes in May compared to April (0.7%). These volumes
are adjusted for seasonal ups and downs and various holidays, and therefore provide an indication of the underlying
trend in air travel volumes. The May result confirms that growth in passenger volumes remains robust.
On international markets, carriers in the Asia Pacific region experienced a 9.4% rise. Although a slowdown compared
to results seen throughout Q1 which were given a boost by Lunar New Year holiday-related travel, the result was
healthy. The strength of international air travel for Asia Pacific carriers comes despite a weakness in regional trade
activity during recent months. Such developments have the potential to erode demand for business related air travel.
In other regions, international air travel for European carriers continues to rise, up 5.9% in May year-on-year. The trend
will likely continue, despite some downward pressure on economic progress due to firming in the Euro and oil prices.
International air travel on North American carriers was up just 2.0% in May, but this is an improvement on the April rise
of 0.7%. Expectations for better economic performance in Q2 should support demand for air travel, but it is likely that
the strengthening dollar will continue to place downward pressure on international leisure travel to the US.
On domestic markets, India continues to record very strong growth, up 18.2%, likely owing to market stimulation by
local carriers as well as notable improvements in economic growth. By contrast, air travel in Australia fell by 1.3% in
May year-on-year. There are signs of improvements in the economy with business activity increasing over recent
months, but that has yet to translate to a turnaround for air travel; and domestic consumption remains weak.
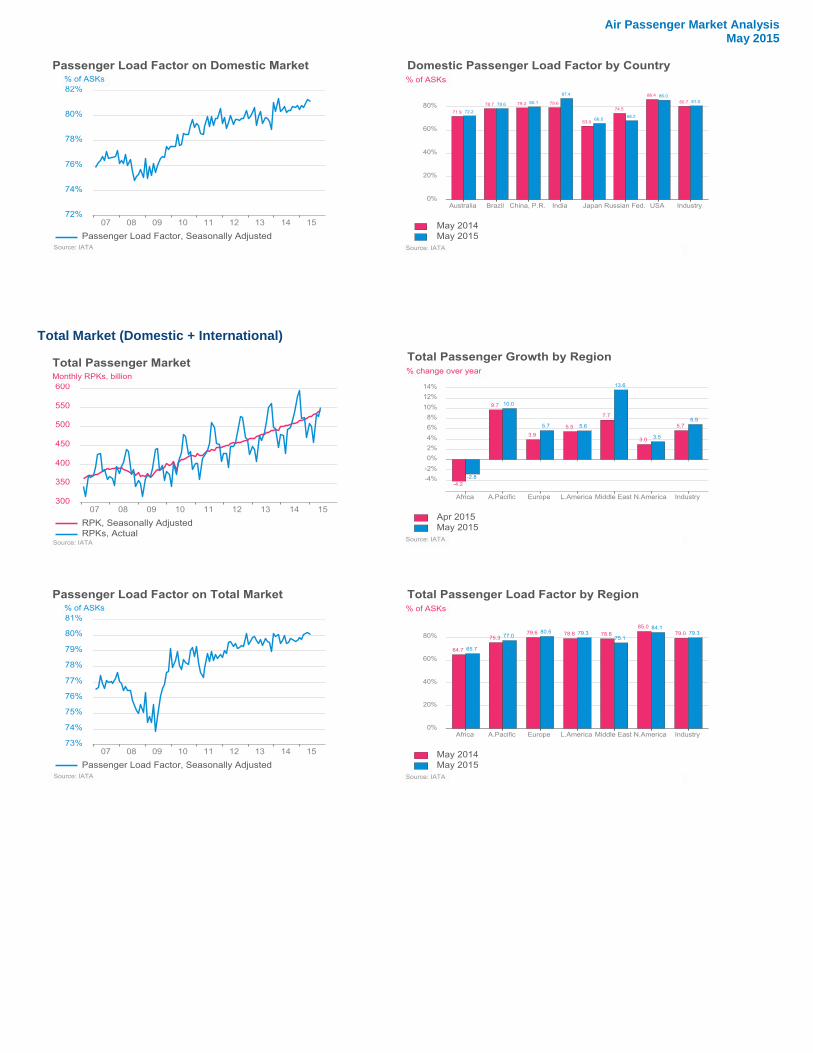
Industry load factors continue to show an upward trend. Despite lower oil prices, airlines are adding capacity at a slower
rate than the expansion in demand.
The economic outlook remains broadly positive with the fall in oil prices compared to mid-2014 expected to sustain
growth and demand for passenger travel in 2015. Although weakness in emerging markets has caused improvements
in business confidence to stagnate recently, some advanced economies are showing improvement, which should help
support growth in air travel.

Air Passenger Market Analysis May 2015
Year on Year Comparison Month on Month Comparison
May 2015 vs. May 2014 YTD 2015 vs. YTD 2014 May 2015 vs. Apr 2015
RPK ASK PLF RPK ASK PLF RPK ASK PLFpt
International 7.1% 6.7% 78.4% 6.5% 6.2% 78.2% 0.9% 0.9% 0.0%
Domestic 6.6% 6.2% 81.0% 6.1% 5.4% 80.4% 0.4% 0.6% -0.2%
Total Market 6.9% 6.5% 79.3% 6.3% 5.9% 79.0% 0.7% 0.8% -0.1%
FTK: Freight-Tonne-Kilometers; AFTK: Available Freight Tonne Kilometers; FLF: Freight Load Factor. All Figures are expressed in % change Year on Year except FLF which are the load factors for the specific month.
Data are seasonally adjusted. All figures are expressed in % change MoM except, FLFpt which are the percentage point difference between LF of two months.
PASSENGER MARKET
International Markets
Most regions posted strong increases in May compared to a year ago. On international markets, carriers in the Asia
Pacific region experienced a 9.4% rise. Although a slowdown compared to results seen throughout Q1 which were
given a boost by Lunar New Year holiday-related travel, the result was healthy. The strength of international air travel
for Asia Pacific carriers comes despite a weakness in regional trade activity during recent months. Such developments
have the potential to erode demand for business-related air travel.
Turning to other regions, international air travel for European carriers continues to rise, up 5.9% in May year-on-year.
The trend will likely continue, despite some downward pressure on economic progress due to firming in the Euro and oil
prices. That said, latest developments have increased the likelihood of Greece exiting the Eurozone, which has the
potential to inject further uncertainly into the region’s economy.
International air travel on North American carriers was up just 2.0% in May, but this is an improvement on the April rise
of 0.7%. Expectations for better economic performance in Q2 should support demand for air travel, but it is likely that
the strengthening dollar will continue to place downward pressure on international leisure travel to the US.
Carriers in the Middle East recorded strong growth of 14%. Markit’s measures of business activity in non-oil sectors
continue to show improvement and point to strong growth. The particularly strong result for May could reflect some
additional travel prior to Ramadan (beginning in June this year), which typically results in a slowdown for air travel as
people stay home for the duration of the Holy month.
Growth on Latin American carriers accelerated in May, rising 7.4% year-on-year. Regional trade volumes have been
improving over recent months, and despite weakness in Brazil and Argentina, the increase in trade activity has provided
a boost to business-related international travel.
Air Passenger Market Analysis May 2015
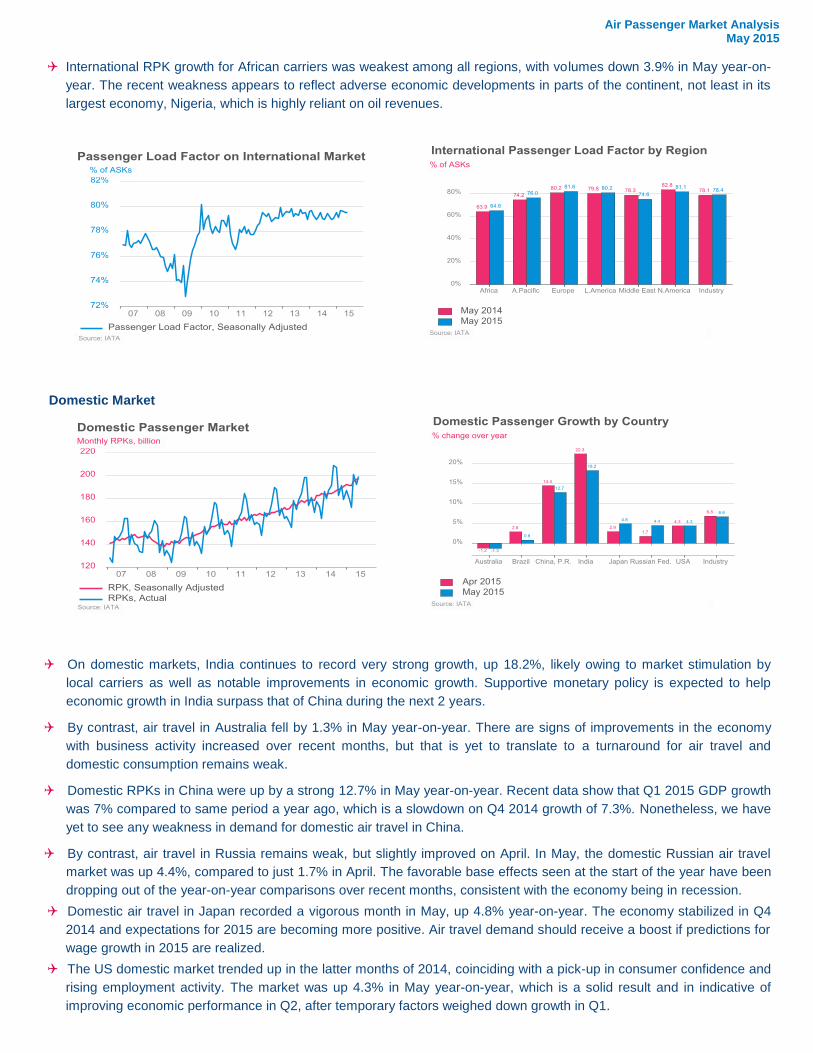
International RPK growth for African carriers was weakest among all regions, with volumes down 3.9% in May year-on-
year. The recent weakness appears to reflect adverse economic developments in parts of the continent, not least in its
largest economy, Nigeria, which is highly reliant on oil revenues.
Domestic Market
On domestic markets, India continues to record very strong growth, up 18.2%, likely owing to market stimulation by
local carriers as well as notable improvements in economic growth. Supportive monetary policy is expected to help
economic growth in India surpass that of China during the next 2 years.
By contrast, air travel in Australia fell by 1.3% in May year-on-year. There are signs of improvements in the economy
with business activity increased over recent months, but that is yet to translate to a turnaround for air travel and
domestic consumption remains weak.
Domestic RPKs in China were up by a strong 12.7% in May year-on-year. Recent data show that Q1 2015 GDP growth
was 7% compared to same period a year ago, which is a slowdown on Q4 2014 growth of 7.3%. Nonetheless, we have
yet to see any weakness in demand for domestic air travel in China.
By contrast, air travel in Russia remains weak, but slightly improved on April. In May, the domestic Russian air travel
market was up 4.4%, compared to just 1.7% in April. The favorable base effects seen at the start of the year have been
dropping out of the year-on-year comparisons over recent months, consistent with the economy being in recession.
Domestic air travel in Japan recorded a vigorous month in May, up 4.8% year-on-year. The economy stabilized in Q4
2014 and expectations for 2015 are becoming more positive. Air travel demand should receive a boost if predictions for
wage growth in 2015 are realized.
The US domestic market trended up in the latter months of 2014, coinciding with a pick-up in consumer confidence and
rising employment activity. The market was up 4.3% in May year-on-year, which is a solid result and in indicative of
improving economic performance in Q2, after temporary factors weighed down growth in Q1.
Air Passenger Market Analysis May 2015
Total Market (Domestic + International)

Air Passenger Market Analysis May 2015
ANNEX
Year on Year Comparison
May 2015 vs May 2014 YTD 2015 vs. YTD 2014
RPK ASK PLF RPK ASK PLF
Africa -3.9% -4.9% 64.6% -2.6% -2.9% 65.7%
Asia/Pacific 9.4% 6.8% 76.0% 8.6% 6.7% 77.5%
Europe 5.9% 4.1% 81.6% 5.2% 4.2% 80.0%
Latin America 7.4% 6.8% 80.2% 6.4% 6.4% 79.3%
Middle East 14.0% 19.7% 74.6% 12.1% 15.3% 77.2%
North America 2.0% 4.2% 81.1% 2.3% 3.5% 79.3%
International 7.1% 6.7% 78.4% 6.5% 6.2% 78.2%
Australia -1.3% -1.7% 72.2% -0.7% -1.1% 74.9%
Brazil 0.8% 0.9% 78.6% 4.1% 2.7% 80.5%
China P.R. 12.7% 11.6% 80.1% 12.0% 11.4% 81.3%
India 18.2% 7.7% 87.4% 20.1% 5.2% 84.3%
Japan 4.8% 0.9% 66.0% 3.7% 1.6% 65.5%
Russian Federation 4.4% 14.0% 68.2% 3.7% 7.9% 67.9%
US 4.3% 4.9% 86.0% 3.5% 3.8% 84.1%
Domestic 6.6% 6.2% 81.0% 6.1% 5.4% 80.4%
Africa -2.8% -4.2% 65.7% -1.9% -2.3% 66.7%
Asia/Pacific 10.0% 7.5% 77.0% 9.3% 7.3% 78.1%
Europe 5.7% 4.4% 80.5% 4.9% 4.1% 78.9%
Latin America 5.6% 5.0% 79.3% 6.0% 5.4% 79.5%
Middle East 13.6% 19.0% 75.1% 11.5% 14.5% 77.5%
North America 3.5% 4.6% 84.1% 3.1% 3.6% 82.3%
Total Market 6.9% 6.5% 79.3% 6.3% 5.9% 79.0% RPK: Revenue-Passenger-Kilometers; ASK: Available-Seat-Kilometers; PLF: Passenger-Load-Factor; All Figures are expressed in % change Year on Year except PLFwhich are the load factors for the specific month.

Air Passenger Market Analysis May 2015
Month on Month Comparison
May 2015 vs. Apr 2015 Market Share
RPK ASK PLFpt RPK
Africa -0.1% 0.6% -0.5% 2.0%
Asia/Pacific 1.0% 1.2% -0.1% 26.2%
Europe 0.5% 0.1% 0.3% 39.4%
Latin America 1.3% 0.8% 0.4% 4.3%
Middle East 2.2% 2.9% -0.5% 13.8%
North America 0.5% 0.7% -0.1% 13.6%
International 0.9% 0.9% 0.0% 100.0%
Australia -1.4% 0.0% -1.0% 2.7%
Brazil -1.1% 0.0% -0.9% 3.8%
China P.R. 0.2% 0.6% -0.3% 22.1%
India -1.8% 1.4% -2.7% 3.4%
Japan 1.4% 0.8% 0.4% 3.3%
Russian Federation 3.4% 2.0% 1.0% 3.5%
US 0.7% 0.8% -0.1% 43.5%
Domestic 0.4% 0.6% -0.2%
Africa -0.4% 0.6% -0.6% 2.0%
Asia/Pacific 0.6% 0.8% -0.2% 30.4%
Europe 0.5% 0.1% 0.3% 28.0%
Latin America 0.4% 0.7% -0.2% 5.2%
Middle East 2.2% 2.8% -0.4% 9.2%
North America 0.7% 0.8% -0.1% 25.3%
Total Market 0.7% 0.8% -0.1% 100% Data are seasonally adjusted. All figures are expressed in % change MoM except, FLFpt which are the percentage point difference between load factors of two months.
IATA Economics
Contact: Julie Perovic
2nd
July 2015
Terms and Conditions for the use of this IATA Economics Report and its contents can be found here: www.iata.org/economics-terms
By using this IATA Economics Report and its contents in any manner, you agree that the IATA Economics Report Terms and Conditions
apply to you and agree to abide by them. If you do not accept these Terms and Conditions, do not use this report.
FURTHER ANALYSIS AND DATA
Access data related to this briefing through
the Monthly Statistics publication:
http://www.iata.org/publications/Pages/monthly-
traffic-statistics.aspx
NEW RELEASE ALERTS
To receive email notification of new
analysis from IATA Economics, select
‘Economic Briefings’ from:
www.iata.org/optin