Embed Size (px)
Citation preview

5
LLNL Environmental Report for 1997 5-1
Air Monitoring
Paris E. AlthousePaula J. Tate
Introduction
Air surveillance monitoring is performed to evaluate compliance with local, state, andfederal laws and regulations and to ensure that human health and the environment areprotected from hazardous and radioactive air emissions. Federal environmental airquality laws and DOE regulations include 40 CFR 61, the National Emissions Standardsfor Hazardous Air Pollutants (NESHAPs) section of the Clean Air Act, and DOE Orders5400.1, General Environmental Protection Program, and 5400.5, Radiation Protection of thePublic and the Environment. The Environmental Regulatory Guide for Radiological EffluentMonitoring and Environmental Surveillance (U.S. Department of Energy 1991) provides theguidance for implementing DOE Orders 5400.1 and 5400.5. Other laws governing airquality include 22 CCR 67264.700 and 66265.710, Environmental and ComplianceMonitoring, and the California Air Toxics “Hot Spots” Information and Assessment Actof 1987 (AB2588). In general, the constituents that LLNL analyzes (in order to determineenvironmental impact) are at levels far below the regulatory standards.
LLNL conducts surveillance monitoring of ambient air to determine if airborneradionuclides or hazardous materials are being released by Laboratory operations, whatthe concentrations are, and what the trends are in the LLNL environs. In the airmonitoring program, particles are collected on filters and vapor is chemically trappedon a collection medium. Concentrations of various airborne radionuclides (includingparticles and tritiated water vapor) and beryllium are measured at the Livermore site,Site 300, at off-site locations throughout the Livermore and Tracy Valleys. In addition,some point sources and diffuse, or nonpoint sources, are monitored to fulfill NESHAPsrequirements (Gallegos et al. 1998a).
Methods
Several monitoring networks are established for surveillance of air particulates in theenvirons of LLNL and Site 300, as well as in the surrounding Livermore Valley andTracy. The sampling locations for each monitoring network are listed in Table 5-1. Allmonitoring networks use continuously operating samplers located as shown inFigures 5-1, 5-2, and 5-3. The radiological sampling networks utilize glass fiber filters,

5 Air Monitoring
5-2 LLNL Environmental Report for 1997
the high volume beryllium networks use cellulose filters, and the low volume networkuses Millipore AW-19 filters.
Table 5-1. Sampling locations listed by monitoring network.
High volumeradiological
(glass fiber filters)
High volumeberyllium
(cellulose filters)
Low volume grossalpha and beta
(millipore filters)
Tritium(silica gel)
Livermore site locations
SALV SALV SALVCAFE CAFE CAFEVIS VIS VISCOW COW COWMET MET METMESQ MESQ MESQB531(a) POOLCRED(a) B292 (a)
B331(a)
B514 (a)
B624(a)
Livermore Valley locations
FCC FCC ZON7FIRE HOSP ALTAHOSP FIRECHUR(b) XRDSRRCH(b) VETPATT HOSPZON7TANKALTA(c)
LWRP
Site 300
801E EOBSECP GOLFEOBS 801EGOLFNPSWCPWOBS
Site 300 off site
TFIR TFIR PRIMPRIM
a These locations are in areas of diffuse sources and are monitored to fulfill NESHAPs requirements.
b Location CHUR replaced RRCH in May of 1997.
c Location ALTA was removed from service in April 1997. It will be replaced by a new location in 1998.

Air Monitoring 5
LLNL Environmental Report for 1997 5-3
Patterson Pass Road
Greenville R
oad
Vas
co R
oad
East Avenue
N
5000
Scale: Meters
Sampling locations
Radiological particulate
Beryllium particulate
Tritium
LLNL perimeter
MESQ
COW
VIS
SALV
CRED
B514B624
B331B531
B292
POOL
CAFE
MET
Figure 5-1. Air particulate and tritium sampling locations on the Livermore site, 1997.

5 Air Monitoring
5-4 LLNL Environmental Report for 1997
daoR
ssaPtnomatlA
Nor
thL
iver
mor
eA
venu
e
Livermore
PattersonPass Road
Lake Del Valle
Valle
citos
Roa
d
Stanley Blvd.
Vas
co R
oad
Tesla Road
Gre
envi
lle R
oad
Mines Road
East Avenue
Shadow Cliffs
Cross
Road
Arr
oyo
Roa
dSo. Livermore
Avenue
HOSP
XRDS
FIRE
LWRP PATT
ZON7FCC
VET TANK
N
580
84
580CHUR
2 4
Scale: Kilometers
0
Sampling locations
Radiological particulate
Tritium
LLNL perimeter
ALTA
RRCH
Figure 5-2. Air particulate and tritium sampling locations in the Livermore Valley, 1997.
The Livermore site radiological air particulate networks consist of six samplers at theperimeter. In addition, two areas of special interest (B531 and CRED) are monitored forplutonium only. The Livermore Valley network consists of air samplers located in allcompass directions. For the purposes of data analysis, five samplers located in the leastprevalent wind directions (FCC, FIRE, HOSP, RRCH, and CHUR) are considered to be

Air Monitoring 5
LLNL Environmental Report for 1997 5-5
Livermore
N
Bunker 801
Bunker 851
Bunker 850
NPSEOBS
801E
ECP
TFIR(in City of Tracy)
GOLF
PRIM
WOBS
WCP
Corral Hollow Road
0 1600
Scale: Meters
800
Sampling locationsRadiological particulateBeryllium particulateTritium
Bunkers
LLNL perimeter
Figure 5-3. Air particulate and tritium sampling locations at Site 300, 1997.
upwind or representative of background locations and four samplers located in the mostprevalent downwind directions (PATT, ZON7, TANK, and ALTA) are considered mostlikely to be impacted by Laboratory operations. An additional sampler is located inanother area of special interest, the Livermore Water Reclamation Plant (LWRP),because of a plutonium release to the sanitary sewer system in 1967 with subsequent soilcontamination and potential resuspension (see Results section below). A technicalassessment of the beryllium monitoring locations at Site 300 was conducted in 1997.There is no requirement to sample for beryllium at Site 300; however, LLNL has decidedto continue beryllium monitoring at three locations on site and at TFIR in the city ofTracy. These air samplers are positioned to provide reasonable probability that anysignificant concentration of radioactive particulate or beryllium effluents from LLNLoperations will be detected should it occur. The geographical details of the particulatesampling locations are outlined in a procedure in Appendix A of the EnvironmentalMonitoring Plan (Tate et al. 1995).

5 Air Monitoring
5-6 LLNL Environmental Report for 1997
Two sampling systems were added in July 1997 as part of the new low-volume airsurveillance sampling network. The samplers are situated at the FCC and HOSPlocations, sites which are generally upwind of the Livermore site. The results are usedto establish background levels of gross alpha and beta activity for direct comparison toresults from the air effluent samplers. The sampling systems are very similar to the aireffluent samplers used in facilities, including sampling system design, sampleroperation, sample tracking, sample analysis, and processing of results.
LLNL also maintains 11 continuously operating airborne tritium samplers onthe Livermore site (Figure 5-1), 6 samplers in the Livermore Valley (Figure 5-2), and1 sampler near Site 300 (Figure 5-3). Four of the Livermore site locations (B331, B292,B514, and B624) monitor diffuse tritium emissions. The tritium sample locations aredetailed in Appendix A of the Environmental Monitoring Plan (Tate et al. 1995).
Particulate filters (glass fiber, cellulose, and Millipore) are changed each week at alllocations, and tritium samples are changed every two weeks. Duplicate quality controlsamplers are operated for 2 months in parallel with the permanent sampler at a givensite, and samples are analyzed to confirm results.
As outlined in the Environmental Regulatory Guide for Radiological Effluent Monitoring andEnvironmental Surveillance (U.S. Department of Energy 1991), gross alpha and gross betaair filter results are used as trend indicators; specific radionuclide analysis is done forplutonium, uranium, and gamma emitters. All analytical results are reported as ameasured concentration per volume of air, or at the minimum detection limit (MDL)when no activity is detected. In all cases, the MDL is more than adequate fordemonstrating compliance with the pertinent regulatory requirements for radionuclidesthat may be or are present in the air sample and for evaluating LLNL-inducedenvironmental impacts. Particle size distributions are not determined because theestimated effective dose equivalent to the maximally exposed individual is well belowthe 0.01 mSv (1 mrem) allowable limit as discussed in the above mentionedEnvironmental Regulatory Guide. Further details of the surveillance monitoring methodsare included in the Data Supplement, Chapter 5.
Results
This section discusses the air monitoring results at the Livermore site and at Site 300.
In April 1997, the filter media changed from cellulose to glass fiber for all radiologicalparticulate sampling. Blank glass-fiber filters contain detectable amounts of somenaturally occurring radiological isotopes. Of those radiological isotopes that LLNL
Air Monitoring 5
LLNL Environmental Report for 1997 5-7
monitors, detectable amounts of 235U, 238U, 40K, 228Ra, and 228Th are found on the blankfilters. A full investigation of the radioactive content on glass fiber filters used by LLNLis in progress. The measured concentrations of these isotopes were adjusted accordingto EPA procedures (EPA 1976). This procedure simply subtracts the appropriate blankfilter content from the gross analytical result to obtain a corrected net result.
Livermore Site
Airborne Radioactivity
Table 5-2 summarizes the monthly gross alpha and gross beta results for the LLNLperimeter, Livermore Valley, and Site 300 sampling locations. Medians, interquartileranges (IQR), and maximum values for each network are included. (See DataSupplement, Tables 5-1 and 5-2a and b for detailed location results for all high-volumenetworks for gross alpha and gross beta concentrations.) The monthly median grossalpha and gross beta concentrations are plotted in Figures 5-4 and 5-5, respectively.The gross beta results follow a similar pattern to previous year’s data. The gradualincrease in beta activity throughout the summer is due to an increase in resuspensionof soils that occurs during the dry season.
The gross alpha data are much more variable because of the nature of the standardanalytical method capabilities, and most of the data are very close to the minimumdetection limit of the method.
Typical gross alpha activity (median value) for the LLNL perimeter network is1.6 × 10−11 Bq/mL (4.4 × 10⁻²² Ci/mL); for the upwind Livermore Valley stationsthe value is 1.4 × 10⁻¹¹ Bq/mL (3.4 × 10⁻²² Ci/mL); and for the downwind LivermoreValley stations the value is 1.6 × 10⁻¹¹ Bq/mL (4.4 × 10⁻²² Ci/mL). Negative valuesoccur when the activity of the analytical background filters is higher than the activity onthe filters being analyzed. Typical gross beta activity (median value) for the LLNLperimeter is 5.1 × 10⁻¹⁰ Bq/mL (1.4 × 10⁻²⁰ Ci/mL); for the upwind Livermore Valleystations the value is 5.7 × 10⁻¹⁰ Bq/mL (1.4 × 10⁻²⁰ Ci/mL); and for the downwindLivermore stations the value is 4.9 × 10⁻¹⁰ Bq/mL (1.3 × 10⁻²⁰ Ci/mL). These values aresimilar to those obtained from previous monitoring data during the past several years.The primary sources of the alpha and beta activities are the naturally occurringradioisotopes of uranium and thorium, and any residual fallout from atmosphericweapons testing and the Chernobyl reactor accident in 1986.

5 Air Monitoring
5-8 LLNL Environmental Report for 1997
Table 5-2. Gross alpha and gross beta in air particulate samples summarized by month, 1997.(a)
Gross alpha (10–12 Bq/mL) Gross beta (10–12 Bq/mL)
Median Interquartilerange
Maximum Median Interquartilerange
Maximum
LLNL perimeter
Jan 23.5 78.8 107 185 407 784
Feb –4.74 49.6 85.1 278 146 412
Mar 28.8 66.9 138 297 220 605
Apr(b) 25.3 22.7 136 476 98.4 661
May 18.4 32.2 89.5 513 114 661
June 7.66 31.2 57.3 415 96.3 595
July 23.8 32.2 77.0 558 212 891
Aug 18.2 37.1 74.3 533 125 778
Sept –0.422 36.0 40.9 726 364 1350
Oct 11.2 40.7 64.6 1090 672 1470
Nov 8.64 38.2 57.2 521 223 989
Dec –11.5 24.6 69.8 856 324 1220
Livermore Valley upwind
Jan 31.2 76.3 155 280 315 645
Feb 26.9 53.2 122 274 130 424
Mar 26.7 36.5 70.8 292 129 550
Apr(b) 16.5 32.2 89.0 450 87.3 637
May 22.6 30.8 83.0 578 147 636
June 0.477 35.5 33.0 417 58.1 505
July 21.9 26.7 52.8 567 163 727
Aug 17.5 33.7 83.5 524 170 736
Sept –2.96 31.4 59.0 661 428 1270
Oct 17.4 32.4 37.1 1220 761 1550
Nov –1.23 36.1 77.0 579 374 1060
Dec –5.76 42.9 39.5 843 415 1330

Air Monitoring 5
LLNL Environmental Report for 1997 5-9
Table 5-2. Gross alpha and gross beta in air particulate samples summarized by month, 1997(a)
(concluded).
Gross alpha (10–12 Bq/mL) Gross beta (10–12 Bq/mL)
Median Interquartilerange
Maximum Median Interquartilerange
Maximum
Livermore Valley downwind
Jan 1.90 39.7 83.8 268 318 651
Feb 13.2 31.8 102 297 93.0 399
Mar 9.08 31.2 106 272 143 699
Apr(b) 20.9 18.5 42.4 497 63.3 587
May 17.6 43.2 71.2 564 116 713
June 7.23 17.6 45.1 421 31.7 550
July 22.1 24.7 70.6 553 192 846
Aug 30.8 20.5 50.0 499 127 657
Sept –7.75 27.7 63.5 700 307 1210
Oct 21.7 25.6 96.5 922 845 1710
Nov 6.04 30.0 64.6 523 483 1080
Dec 15.4 31.7 83.0 814 374 1300
Site 300
Jan 9.64 57.1 91.1 195 191 808
Feb 1.40 55.4 149 292 138 578
Mar 22.4 50.5 85.2 281 234 518
Apr(b) 20.1 28.5 65.6 496 115 614
May 37.5 32.7 101 643 131 910
June 10.7 21.3 58.5 507 101 671
July 39.3 35.2 97.2 706 185 1010
Aug 33.4 31.8 97.9 636 226 838
Sept 5.68 24.4 89.1 808 458 1310
Oct 21.3 31.7 85.0 884 766 1880
Nov 1.13 46.1 94.1 654 414 1260
Dec -2.77 53.5 65.1 790 349 1800
a Negative values indicate that at least half of the samples had activity of the background greater than that of the sample.
b Filter media changed from cellulose to glass fiber. Samples from April through December were collected on glass fiber filters.

5 Air Monitoring
5-10 LLNL Environmental Report for 1997
Co
nce
ntr
atio
n (
10–1
1 B
q/m
L) C
on
centratio
n (10
–10 pC
i/mL
)
MonthJan Feb Mar Apr May Jun Jul Aug Sep Oct Nov DecDec
0.0 0.0
10
20
1.0
2.0
–2.0
–1.0
3.0
4.0
5.0
6.0
7.0
8.0
Jan
LLNL perimeterLivermore Valley, upwindLivermore Valley, downwindSite 300
Figure 5-4. Monthly median gross alpha concentrations in particulate air samplesfrom the LLNL perimeter, Livermore Valley and Site 300 samplinglocations, 1997.
Gamma-emitting radionuclide concentrations in air that contribute to the activity in theLivermore site perimeter samples are summarized in Table 5-3. (See Data Supplement,Table 5-3 for monthly gamma data.) Of the nuclides tabulated, 7Be, 40K, 226Ra, 228Ra,and 228Th occur naturally. The primary source of 137Cs is long-term global fallout andfallout resuspension.
In addition to providing baseline data on global fallout, analysis of these radionuclidesenables LLNL to monitor the containment of the small inventories of mixed fissionproducts and radiochemical tracers used at LLNL. The Derived Concentration Guides(DCGs) for these radionuclides are also shown in Table 5-3. For air, DCGs specify theconcentrations of radionuclides that could be inhaled continuously 365 days a yearwithout exceeding the DOE primary radiation protection standard for the public, whichis 1 mSv/y (100 mrem/y) effective dose equivalent (DOE Order 5400.5). (Chapter 12 onRadiological Dose Assessment provides an explanation of this and other units of dose.)Finally, the fraction of the DCGs is presented. These values demonstrate that levels ofgamma activity present in air at the Livermore site perimeter are far below the DCGs.Air monitoring data are compared to the DOE DCG in 5400.5, and compliance with theEPA 100 µSv (10 mrem) standard (40 CFR 61) is demonstrated by modeling.

Air Monitoring 5
LLNL Environmental Report for 1997 5-11
Co
nce
ntr
atio
n (
10–1
0 B
q/m
L) C
on
centratio
n (10
–9 pC
i/mL
)
14
12
10
8.0
6.0
4.0
2.0
0.0
LLNL perimeterLivermore Valley, upwindLivermore Valley, downwindSite 300
JanDec Feb Mar Apr May JunMonth
Jul Aug Sep Oct Nov Dec Jan
1.0
10
20
30
Figure 5-5. Monthly median gross beta concentrations in particulate air samplesfrom the LLNL perimeter, Livermore Valley and Site 300 samplinglocations, 1997.
Table 5-3. Gamma activity in air particulate samples, Livermore site perimeter and Site 300, 1997.
7Be 40K 137Cs 22Na 226Ra 228Ra 228Th
(10–9 Bq/mL) (10–12 Bq/mL)
Livermore perimeter
Median 3.4 23 <0.2 <0.3 <3.7 1.9 <1.1
Interquartile range 1.0 —(a) —(a) —(a) —(a) 1.5 —(a)
Maximum 6.5 62 <0.3 0.7 <7.1 4.1 3.3
Median fraction ofDCG(b)
2.2 × 10⁻⁶ 7.0 × 10⁻⁷ <1.2 × 10⁻⁸ <6.6× 10⁻⁹ <1.0 × 10⁻⁴ 1.7 × 10⁻⁵ <7.1 × 10⁻⁴
Site 300
Median 4.2 23 <0.2 <0.3 <4.5 <1.2 <0.7
Interquartile range 0.9 —(a) —(a) —(a) —(a) —(a) —(a)
Maximum 7.0 63 1.0 1.0 <9.0 2.5 3.0
Median fraction of DCG 2.8 × 10⁻⁶ 6.9 × 10⁻⁷ <1.4 × 10⁻⁸ <7.3× 10⁻⁹ <1.2 × 10⁻⁴ <1.1 × 10⁻⁵ <4.8 × 10⁻⁴
DCG (Bq/mL) 1.5 × 10⁻³ 3.3 × 10⁻⁵ 1.5 × 10⁻⁵ 3.7 × 10⁻⁵ 3.7 × 10⁻⁸ 1.1 × 10⁻⁷ 1.5 × 10⁻⁹
a No measure of dispersion calculated. See Chapter 13, Quality Assurance.
b Derived Concentration Guide.

5 Air Monitoring
5-12 LLNL Environmental Report for 1997
Table 5-4 shows the median, IQR, maximum, and median fraction of DCG forconcentration of plutonium on glass fiber air filter samples collected in the LivermoreValley. (See Data Supplement, Table 5-4 for monthly data.) The highest off-site medianconcentration of 239Pu occurred at the Livermore Water Reclamation Plant (LWRP).Soils near the LWRP contain some detectable plutonium, principally resulting fromsludge-spreading operations following an estimated 1.2 × 10⁹ Bq (32 mCi) release to thesewer in 1967 (see Chapter 9, Soil and Sediment Monitoring). Resuspension of thesesoils probably accounts for the slightly higher median 239Pu in air concentrationsobserved. However, the median observed value is <0.00001 of the DCG.
Table 5-4 also shows the concentrations of airborne 239Pu on air filters from the LLNLperimeter locations. (See Data Supplement, Table 5-5 for the monthly data by location.)The highest concentration was registered at location SALV in October 1997; the concen-tration value is reported as 4.9 × 10⁻¹⁴ Bq/mL (1.3 × 10⁻²⁴ Ci/mL), which represents0.0001 of the DCG. The median concentration at location SALV is 7.7 × 10⁻¹⁵ Bq/mL(2.1 × 10 −25 Ci/mL), which is lower than the previous year.
In June 1991, two air particulate sampling locations (B531 and CRED) were added aspart of a special study to investigate the somewhat elevated levels of plutonium inair and surface soil in the southeast quadrant of the Livermore site (see Chapter 9, Soiland Sediment Monitoring, for general background on this study). These samplinglocations are now part of our routine monitoring network and provide data for diffusesource dose assessments. Table 5-4 shows the median concentrations of airborne 239Puat these two locations. (See Data Supplement, Table 5-6 for monthly data.) The medianconcentration of 4.7 × 10⁻¹⁴ Bq/mL (1.3× 10⁻²⁴ Ci/mL) at location B531 is higher thanthe median concentration for any of the other air particulate sampling locations, but isstill only 0.0001 of the DCG. The higher concentrations have been attributed to historicoperations, which included the operation of solar evaporators for plutonium-containingliquid waste (Silver et al. 1974).
Figure 5-6 shows the annual median concentrations of 239Pu for locations SALV (on site)and FCC (off site) from 1982 to 1997. Location FCC represents a typical upwindbackground location, and SALV represents the perimeter location having the highestannual average for most of this 15-year period. The annual median concentration forFCC was –0.54 × 10 −15 Bq/mL (–1.4 × 10 −26 Ci/mL). Figure 5-6 uses a log scale,therefore the positive value closest to the median is plotted. The higher values in thepast at SALV may be attributed to historical activities at LLNL; improvements inoperational processes in the immediate work area have contributed to the observeddownward trend of the data.

Air Monitoring 5
LLNL Environmental Report for 1997 5-13
10–15
10–16
1980 1982 1984 1986 1988Year
Co
nce
ntr
atio
n (
Bq
/mL
) Co
ncen
tration
(pC
i/mL
)
1990 1992 1994 1996 1998
10–14
10–13
10–12
10–13
10–14
2.7×10⁻¹⁵
10–12
10–11
SALVFCC
0.1% of derived concentration guide (DCG)
2.7×10⁻¹¹
Figure 5-6. Median plutonium concentrations in air particulate samples at twolocations, SALV and FCC, 1982 to 1997 (DCG = 7.4 × 10⁻¹⁰ Bq/mL).
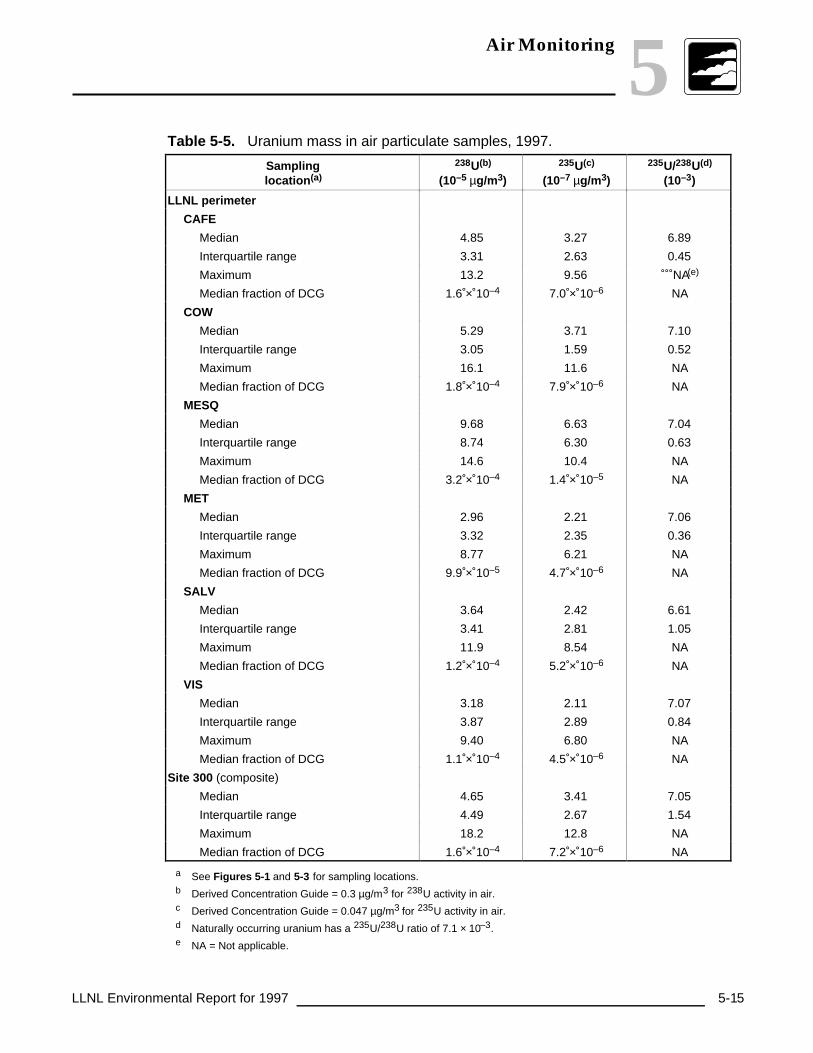
The median 235U and 238U concentrations in air samples from the Livermore siteperimeter are shown in Table 5-5. (See Data Supplement, Table 5-7 for monthly data.)The maximum measured concentration of 238U ( at location COW during October) is lessthan 0.0005 of the DCG. All 235U/238U median ratios are as expected for naturallyoccurring uranium; however, monthly data in the Data Supplement show someunexpected 235U/238U ratios, indicating other than natural uranium around theLivermore site perimeter. While no significant environmental impact stems from theobserved ratios, their cause is not known but they have occurred sporadically in the past.
Typical gross alpha and gross beta activity from the low-volume sampling locationsHOSP and FCC is 1.3 × 10⁻¹⁰ Bq/mL (3.5 × 10⁻²¹ Ci/mL) and 7.4 × 10⁻¹⁰ Bq/mL(2.0 × 10−20 Ci/mL), respectively. (See Data Supplement, Tables 5-8 and 5-9 for monthlymedian data.) These gross alpha values are higher than those reported from the highvolume sampling systems. This is probably due to differences in the filter type. A studyis being conducted to determine the cause.

5 Air Monitoring
5-14 LLNL Environmental Report for 1997
Table 5-4. Plutonium activity in air particulate samples (in 10–15 Bq/mL), 1997.
Samplinglocation(a) Median Interquartile
rangeMaximum Median fraction
of DCG(b)
Livermore Valley downwind locations
ALTA 2.4 5.4 4.7 3.2 × 10⁻⁶
PATT 0.47 5.4 6.6 6.3 × 10⁻⁷
TANK –0.6 3.4 9.9 —(c)
ZON7 2.3 3.4 12 3.1 × 10⁻⁶
Livermore Valley upwind locations
FCC –0.5 5.1 8.9 —(c)
FIRE 3.0 9.1 8.1 4.0 × 10⁻⁶
HOSP 2.1 5.0 13 2.9 × 10⁻⁶
RRCH –2.8 3.6 7.4 —(c)
CHUR 4.6 6.7 15 6.2 × 10⁻⁶
LLNL perimeter
CAFE 6.5 5.6 18 8.8 × 10⁻⁶
COW 3.0 8.4 11 4.0 × 10⁻⁶
MESQ 8.8 7.0 17 1.2 × 10⁻⁵
MET 6.7 5.3 12 9.1 × 10⁻⁶
SALV 7.7 11 49 1.0 × 10⁻⁵
VIS 6.2 5.3 15 8.4 × 10⁻⁶
Special interest
LWRP 11 8.8 24 1.4 × 10⁻⁵
Diffuse sources
B531 47 59 220 6.4 × 10⁻⁵
CRED 4.5 6.6 29 6.0 × 10⁻⁶
Site 300 on-site
Site 300 3.6 2.2 17 4.8 × 10⁻⁶
Site 300 downwind
PRIM –0.076 2.9 6.4 —(c)
TFIR 2.9 8.1 14 3.9 × 10⁻⁶
a See Figures 5-1, 5-2, and 5-3 for sampling locations.
b Derived Concentration Guide = 7.4 × 10⁻¹⁰ Bq/mL (2 × 10–14 µCi/mL) for 239Pu activity in air.
c Median fraction of DCG not calculated when median is a negative value.
Air Monitoring 5
LLNL Environmental Report for 1997 5-15
Table 5-5. Uranium mass in air particulate samples, 1997.
Samplinglocation(a)
238U(b)
(10–5 µg/m3)
235U(c)
(10–7 µg/m3)
235U/238U(d)
(10–3)
LLNL perimeter
CAFE
Median 4.85 3.27 6.89
Interquartile range 3.31 2.63 0.45
Maximum 13.2 9.56 NA(e)
Median fraction of DCG 1.6 × 10⁻⁴ 7.0 × 10⁻⁶ NA
COW
Median 5.29 3.71 7.10
Interquartile range 3.05 1.59 0.52
Maximum 16.1 11.6 NA
Median fraction of DCG 1.8 × 10⁻⁴ 7.9 × 10⁻⁶ NA
MESQ
Median 9.68 6.63 7.04
Interquartile range 8.74 6.30 0.63
Maximum 14.6 10.4 NA
Median fraction of DCG 3.2 × 10⁻⁴ 1.4 × 10⁻⁵ NA
MET
Median 2.96 2.21 7.06
Interquartile range 3.32 2.35 0.36
Maximum 8.77 6.21 NA
Median fraction of DCG 9.9 × 10⁻⁵ 4.7 × 10⁻⁶ NA
SALV
Median 3.64 2.42 6.61
Interquartile range 3.41 2.81 1.05
Maximum 11.9 8.54 NA
Median fraction of DCG 1.2 × 10⁻⁴ 5.2 × 10⁻⁶ NA
VIS
Median 3.18 2.11 7.07
Interquartile range 3.87 2.89 0.84
Maximum 9.40 6.80 NA
Median fraction of DCG 1.1 × 10⁻⁴ 4.5 × 10⁻⁶ NA
Site 300 (composite)
Median 4.65 3.41 7.05
Interquartile range 4.49 2.67 1.54
Maximum 18.2 12.8 NA
Median fraction of DCG 1.6 × 10⁻⁴ 7.2 × 10⁻⁶ NA
a See Figures 5-1 and 5-3 for sampling locations.b Derived Concentration Guide = 0.3 µg/m3 for 238U activity in air.c Derived Concentration Guide = 0.047 µg/m3 for 235U activity in air.d Naturally occurring uranium has a 235U/238U ratio of 7.1 × 10–3.e NA = Not applicable.

5 Air Monitoring
5-16 LLNL Environmental Report for 1997
Table 5-6 shows the median concentrations of tritiated water vapor for the LivermoreValley sampling locations. (See Data Supplement, Table 5-10 for biweekly data for eachlocation.) The highest annual median concentration was observed at location ZON7.At approximately 5.9 × 10⁻⁸ Bq/mL (1.6 × 10⁻¹⁸ Ci/mL), this concentration represents0.00002 of the DCG. The highest biweekly concentration was observed in Octoberat ZON7. If it were a yearly average, this concentration, 4.9 × 10⁻⁷ Bq/mL(1.3 × 10−17 Ci/mL), would be 0.0001 of the DCG. The 1997 tritium values are generallysimilar to those reported last year.
Table 5-6. Tritium in air samples (in 10–9 Bq/mL), 1997.
Samplinglocation(a)
Detectionfrequency Median IQR(b) Maximum
Medianfraction of
DCG(c)
Mediandose
(mSv)(d)
Livermore Valley
ZON7 25/26 58.6 64.4 488 1.6 × 10⁻⁵ 1.3 × 10⁻⁶
ALTA 6/8 <22.3 —(e) 44.8 <6.0 × 10⁻⁶ 4.8 × 10⁻⁶
XRDS 17/26 <12.9 —(e) 38.9 <3.5 × 10⁻⁶ 2.8 × 10⁻⁶
FIRE 15/26 <13.9 —(e) 28.2 <3.8 × 10⁻⁶ 3.0 × 10⁻⁶
VET 20/25 23.2 —(e) 76.2 6.3 × 10⁻⁶ 5.0 × 10⁻⁶
HOSP 7/26 <10.5 —(e) 42.9 <2.9 × 10⁻⁶ 2.3 × 10⁻⁶
Livermore perimeter
SALV 24/24 74.6 37.0 403 2.0 × 10⁻⁵ 1.6 × 10⁻⁵
MESQ 22/26 34.4 50.9 102 9.3 × 10⁻⁶ 7.4 × 10⁻⁶
CAFE 26/26 130 102 522 3.5 × 10⁻⁵ 2.8 × 10⁻⁵
MET 21/25 24.8 —(e) 81.4 6.7 × 10⁻⁶ 5.3 × 10⁻⁶
VIS 25/26 184 197 707 5.0 × 10⁻⁵ 3.9 × 10⁻⁵
COW 26/26 119 88.7 364 3.2 × 10⁻⁵ 2.6 × 10⁻⁵
POOL 24/24 267 192 1730 7.2 × 10⁻⁵ 5.7 × 10⁻⁵
Diffuse on-site sources
B292 26/26 112 97.5 796 3.0 × 10⁻⁵ 2.4 × 10⁻⁵
B331 25/25 1360 796 9950 3.7 × 10⁻⁴ 2.9 × 10⁻⁴
B514 26/26 4370 3780 7730 1.2 × 10⁻³ 9.4 × 10⁻⁵
B624 26/26 4180 2660 7730 1.1 × 10⁻³ 9.0 × 10⁻⁴
Site 300 off site
PRIM 5/24 <7.71 —(e) 10.1 <2.1 × 10⁻⁶ 1.7 × 10⁻⁶
a See Figures 5-1, 5-2, and 5-3 for sample locations.b Interquartile range.c Derived Concentration Guide = 3.7 × 10⁻³ Bq/mL (1 × 10⁻⁷ µCi/mL).d 1 mSv = 100 mrem.e Interquartile range not calculated. See Chapter 13, Quality Assurance.

Air Monitoring 5
LLNL Environmental Report for 1997 5-17
Table 5-6 also shows the median concentrations of tritiated water vapor that wereobserved at the Livermore site perimeter sampling locations. (See Data Supplement,Table 5-11 for biweekly data.) The highest annual median concentration was observed atlocation POOL, which was 2.7 × 10⁻⁷ Bq/mL (7.3 × 10⁻¹⁸ Ci/mL), or 0.00007 of the DCG.
Diffuse sources of tritium on the Livermore site are monitored at air tritium samplinglocations B331, B292, B514, and B624. Table 5-6 shows the median concentrationsof tritiated water vapor for these sampling locations. (See Data Supplement, Table 5-12for biweekly data.) The highest median concentration was observed at location B514.This concentration was 4.4 × 10⁻⁶ Bq/mL (1.2 × 10⁻¹⁶ Ci/mL) and represents 0.001of the DCG. The highest biweekly tritium concentration, 1.0 × 10⁻⁵ Bq/mL(2.7 × 10−16 Ci/mL), was observed in November at location B331. If it were a yearlyaverage, this concentration would represent 0.003 of the DCG.
The B331 location is near the Tritium Facility (Building 331), in which LLNL personnelhave reduced operations in recent years and performed significant inventory reductionand cleanup activities. During this process, tritium-contaminated equipment slated fordisposal is stored in a waste accumulation area before being sent to Hazardous WasteManagement facilities. During 1997, outgassing from such waste processing released anestimated 9.2 × 10¹⁰ Bq (2.5 Ci) of tritium to the atmosphere outside of Building 331.
The B624 location is situated in the Building 612 yard, which is dedicated to hazardouswaste, radioactive waste, and mixed-waste management activities. The yard consists ofseveral areas where waste containers that are outgassing tritium are stored outdoors.
The B514 sampling location is in a hazardous waste management area where tritium-contaminated waste is treated, and the B292 location is near an underground retentiontank that had previously leaked. The concentrations in air at the B514 sampling locationare variable because of the changing concentrations of tritium in the waste stream. The1996 median concentrations at B292 are similar to the median concentrations in 1996.
Beryllium in Air
The median concentrations of airborne beryllium for the Livermore site perimetersampling locations are shown in Table 5-7. (See Data Supplement, Table 5-13 formonthly data.) The highest value of 25.8 pg/m3 was found in the August composite atlocation MESQ and was most likely the result of ground moving activities west ofLLNL. The median concentration for this location is 0.001 of the monthly ambientconcentration guide (ACG) of 10,000 pg/m3 established by the Bay Area Air QualityManagement District (BAAQMD) and the Environmental Protection Agency (EPA).

5 Air Monitoring
5-18 LLNL Environmental Report for 1997
Table 5-7. Beryllium in air particulate samples (in pg/m3), Livermore siteperimeter and Site 300, 1997.
Samplinglocation(a)
Detectionfrequency
Median Interquartilerange
Maximum
Livermore perimeter
SALV 12/12 5.5 4.8 22
MESQ 12/12 15 16 26
CAFE 12/12 7.9 6.0 14
MET 12/12 6.1 6.3 14
VIS 12/12 5.3 4.4 13
COW 12/12 8.6 7.1 18
Site 300
EOBS 11/12 3.4 4.8 10
GOLF 12/12 5.3 7.4 14
TFIR 12/12 11 11 20
801E 12/12 10 9.5 17
a See Figures 5-1 and 5-3 for sampling locations. Summary results for sampling locations that wereremoved in April are not reported. Monthly data are reported in Data Supplement, Tables 5-13 and 5-19.
Figure 5-7 is a plot of the median beryllium concentration at the Livermore siteperimeter from 1974 through 1997. The overall median concentration during this timeperiod was calculated to be 0.002 of the ACG. Unless there is a change in LLNL’soperations, it is expected that the beryllium levels will remain unchanged.
Site 300
Airborne Radioactivity
Most gross alpha determinations at Site 300 were at or near the analytical limit ofdetection for the method. Table 5-2 shows the monthly gross alpha and gross betamedian, IQR, and maximum for sampling locations at Site 300. (See Data Supplement,Table 5-14 for monthly data.) The monthly median gross alpha and gross betaconcentrations are shown in Figures 5-4 and 5-5. The Site 300 gross beta results show asimilar pattern to those found at the Livermore site. Typical gross alpha activity is1.5 × 10–11 Bq/mL (4.0 × 10⁻²² Ci/mL).
Typical gross beta activity is 5.5 × 10⁻¹⁰ Bq/mL (1.5 × 10⁻²⁰ Ci/mL). The primarysources of observed gross alpha and gross beta activity are naturally occurringradioisotopes of uranium and thorium and their decay products, and any residualfallout from atmospheric weapons testing and the Chernobyl reactor accident (1986).

Air Monitoring 5
LLNL Environmental Report for 1997 5-19
19741972 1976 1978 1980 1982 1984Year
Co
nce
ntr
atio
n (
pg
/m3 )
1986 1988 1990 1992 1994 1996 1998
1
10
102
103
104
105
BAAQMD ambient concentration guide (ACG)
Median
Figure 5-7. Median concentration of beryllium in air particulate samples taken at theLivermore site perimeter, 1974 to 1997.
Table 5-3 lists the annual median activities, IQR, maximum, the fraction of the DCG, aswell as the DCG, of gamma-emitting radionuclides in samples from Site 300. (See DataSupplement, Table 5-15 for monthly data.) All these radionuclides were measured atconcentrations significantly below the DCGs. Of the nuclides tabulated, 7Be, 40K, 226Ra,228Ra, and 228Th are naturally occurring. The primary source of 137Cs normally is long-term global fallout and resuspension.
Table 5-4 shows the median concentration of 239Pu on air-filter samples collected fromSite 300. (See Data Supplement, Table 5-16 for monthly data.) The highest concentrationof 239Pu was observed in the August composite at a level of 1.7 × 10⁻¹⁴ Bq/mL(4.6 × 10−25 Ci/mL), or 0.00002 of the DCG.
Table 5-5 shows the median concentration of 238U, 235U, and the 235U/238U ratio on airsamples from Site 300. (See Data Supplement, Table 5-17 for monthly data.) Thehighest concentration of 238U was observed in the October composite at a level of1.8 × 10−4 µg/m3 (0.0006 of the DCG). The highest concentration of 235U was alsoobserved in the October composite at a level of 1.3 × 10⁻⁶ µg/m3 (0.00003 of the DCG).The overall levels were essentially the same as those reported in previous years.

5 Air Monitoring
5-20 LLNL Environmental Report for 1997
The ratio of 235U to 238U can be used to identify the source of the uranium. Both 235Uand 238U occur naturally in the area, but only 0.7% of the naturally occurring uranium is235U, and the remainder is almost entirely 238U. Because Site 300 operations usedepleted uranium that contains very little 235U, it follows that if the ratio remainsconstant and near 0.7% (within the limit of sampling and analytical error), then the 238Umeasured is from natural sources. The 235U/238U ratios in January, February, and Juneare less than expected for natural sources, which indicate some impact from operationsat Site 300. The median concentration of 238U for 1997, however, is only 0.0001 of theDCG (DOE Order 5400.5).
Table 5-6 shows the median concentration of tritiated water vapor that was observedat the new sampling location (PRIM) near Site 300. (See Data Supplement, Table 5-18for biweekly data.) The annual median concentration is <7.7 × 10⁻⁹ Bq/mL(2.1 × 10−19 Ci/mL), or 0.000002 of the DCG.
Beryllium in Air
The detection frequency, median, IQR, and maximum concentrations of airborneberyllium for the Site 300 sampling locations are shown in Table 5-7. (See DataSupplement, Table 5-19 for monthly data.) The highest beryllium concentration of19.7 pg/m3 occurred in September at location TFIR. The median concentration for thislocation is 0.001 of the federal and state ambient concentration limit, which is10,000 pg/m3.
Environmental Impact
The environmental impacts from both radioactive and nonradioactive effluents aredescribed in this section.
Radioactive Materials
LLNL operations involving radioactive materials had little impact on radionuclideconcentration in ambient air in 1997. Radionuclide concentrations in air at theLivermore site and in the Livermore Valley are well below levels that would causeconcern to the environment or public health according to existing regulatory standards.
The diffuse tritium sources at B292, B331, B514, and B624 have a localized effect; thetritium concentrations in October at all the site perimeter and off-site locations wereelevated.

Air Monitoring 5
LLNL Environmental Report for 1997 5-21
The concentrations of radionuclides measured around Site 300 and in the city of Tracywere well below all standards and, except for uranium isotopes, reflect background ornaturally occurring levels of these chemicals. (See Chapter 12, Radiological DoseAssessment, for discussion of estimated dose from these data.) The 235U/238U ratios inJanuary, February, and June are less than the ratio of naturally occurring concentrationsof these isotopes, which suggests the presence of depleted uranium in Site 300 airsamples. This depleted uranium can result from current testing of explosives orresuspension of material left over from testing in previous years.
Nonradioactive Materials
The concentrations of beryllium at both sites can be attributed to resuspension of surfacesoil containing naturally occurring beryllium. Local soils contain approximately 1 ppmof beryllium, and the air of the Livermore area and Central Valley typically contains10 to 100 µg/m3 of particulates. Using a value of 50 µg/m3 for an average dust load and1 ppm for beryllium content of dust, a conservative airborne beryllium concentrationof 50 pg/m3 can be predicted. The overall annual medians for the Livermore siteand Site 300 are 6.6 pg/m3 and 3.8 pg/m3, respectively. These data are lower thanpredicted, well below standards, and do not indicate the presence of a threat to theenvironment or public health.