Embed Size (px)
Citation preview
AFGL-TR-88-0265ENVIRONMENTAL RESEARCH PAPERS, NO. 1015
The First Large Balloon Launch from Antarctica
N
JOHN GROUNDKENNETH DALLASRALPH COWIEWILLARD F. THORN
,004, 26 September 1988
Approved for public release; distribution unlimigted.
r -
AEROSPACE ENGINEERING DIVISION GRAD
AIR FORCE GEOPHYSICS LABORATORYHANSCOM AFB, MA 01731
"Taiis technical report has been reviewed and is approved for publication"
FOR THE COMMANDER
ART 0. RN , hie ALONDesign & Analysis Branch Aerospace Engineering DivisionAerospace Engineering Division
This document has been reviewed by the ESD Public Affairs Office (PA) and isreleasable to the National Technical Information Sevices (NTIS).
Qualified requestors may obtain additional copies from the Defense TechnicalInformation Center. All others should apply to the National TechnicalInformation Service.
If your address has changed, or if you wish to be removed from the mailing list,or if the addressee is no longer employed by your organization, please notifyAFGL/DAA, Hanscom AFB, MA 01731. This will assist us in maintaining a currentmailing list.
Do not return copies of this report unless contractual obligations or notices ona specific document requires that it be returned.
UNCLASSFIED
SECURITY CLASSIFICATION OF THIS PAGE /A -'- , *7
REPORT DOCUMENTATION PAGE Form ApprovedRMB No. 0704-0188
ia, REPORT SECURITY CLASSIFICATION 1b. RESTRICTIVE MARKINGS
Unclassified2a, SECURITY CLASSIFICATION AUTHORITY 3. DISTRIBUTION I AVAILABILITY OF REPORT
Approved for public release;20 DECLASSIFICATKN i DOWNGRADING SCHEDULE distribution unlimited.
4. PERFORMING ORGANIZATION REPORT NUMBER(S) 5. MONITORING ORGANIZATION REPORT NUMBER(S)
AFGL-TR-88-0265ERP, No. 1015
6a, NAME OF PERFORMING ORGANIZANION 6o. OFFICE SYMBOL 7a. NAME OF MONITORING ORGANIZATION(if applicable)
Air Force Geophysics Laboratory LCE
6c. ADDRESS (City, State, and ZIP Code) 70. ADDRESS (Cijy, State, and ZIP Code)
Hanscom AFBMassachusetts 01731-5000
8a. NAME OF FUNDING / SPONSORING 8b. OFFICE SYMBOL 9. PROCUREMENT INSTRUMENT IDENTIFICATION NUMBER
ORGANIZATION (If applicable)
Space Test Program SD/CLTP
8C. ADDRESS (Cit, State, and ZIP Code) 10. SOURCE OF FUNDING NUMBERS
HQ Space Division/CLTP PROGRAM PROJECT TASK WORK UNITLos Angeles Air Force Base ELCMENT NO. NO. NO. ACCESSION NO
P.O. Box 92960, Los Angeles, CA 90009-2960 634027 CPD P-87-3 -
11. TITLE (include Security Classification)
The First Large Balloon Launch from Antarctica (U)
12. PERSONAL AUTHOR(S)
Ground, J., Dallas, K., Cowie, R., Thorn, W.F. *.*.:. -
13a. TYPE OF REPORT 13b. TIME COVERED 14. DATE OF REPORT (Year, Month, Day) 15. PAGE COUNT
Scientific, final FROM _ TO _ 1988 September 26 108
16. SUPPLEMENTARY NOTATION
17. COSATI CODES 18. SUBJECT TERMS (Continue on reverse if necessary and identify by bAok number)
FIELD GROUP SUB-GROUP Balloon Operations, Antarctic, stratospheric winds,
01 03 telemetry, ARGOS, balloon gondolas, Supernova 1987A.03 02
19. ABSTRACT (Continue on reverse it necessaty and identify by block number)
his collection of five papers discusses the many practical problems, logistics,meteorlogical planning, flight history and recovery operations for the first very large(11.6M cu ft) stratospheric balloon launched from Antarctica. The on-board Gamma RayAdvanced Detector (GRAD) was flown successfully to detect gamma ray emissions fromSupernova 1987A. The 2500-lb payload was recovered from a 12,500-ft plateau by LC-130aircraft.
The instrumentation for command-control and telemetry, payload integration and testing,and the telemetry station installed aboard an LC-130 aircraft are described. An overview -
of the performance of the ARGOS satellite tracking and data-recovery system on this flightis included.
20. DISTRIBUTION/AVAILABILII Y OF ABSTRACT 21. ABSTRACT SECURITY CLASSIFICATION
& UNCLASSIFIEDIUNLIMITED 0 SAME AS RPT. 0 DTIC USERS Unclassified
22a. NAME OF RESPONSIBLE INDIVIDUAL 22b. TELEPHONE (Include Area Code) 22c. OFFICE SYMBOL
Catherine L. Rice 617-377-3013 AFGL/LCE
DD FORM 1473, JUN 86 Provio. , ,itions are obsolete. SECURITY CLASSIFICATION OF THIS PAGE
UNCLASSIFIED
Contents
1. A LARGE BALLOON, ANTARCTICA AND SUPERNOVA 1987AJohn Ground 1
2. LOGISTICS AND SUPPORT FOR BALLOON FLIGHTS FROM ANTARCTICAKenneth Dallas 39
3. GRAD PAYLOAD INTEGRATION AND FLIGHT SYSTEM INSTRUMENTATIONRalph J. Cowie 49
4. AIRBORNE TELEMETRY STATION FOR GRADWillard F.Thom 71
5. PERFORMANCE OF ARGOS LOCATING SYSTEM IN GRAD FLIGHTWillard F. Thorn 94
iii
I
Contents1. BACKGROUND2. PLANNING DECISIONS3. FLIGHT OBJECTIVES4. MILESTONES5. CLIMATIC INVESTIGATIONS6. PRE-SHIPMENT ACTIVITIES7. PREFLIGHT ACTIVITIES8. LAUNCH ACTIVITIES9. FLIGHT HISTORY
10. RECOVERY11. DISCUSSION12. CONCLUSIONSAcknowledgementsReferencesAbbreviations
THE FIRST LARGE BALLOON
LAUNCH FROM ANTARCTICA
1. A Large Balloon, Antarctica and Supernova 1987A
by
John Ground
Abstract
The first very large, helium-filled, single-cell, polyethylene, zero-pressure balloon was launched
from Williams Field, Antarctica on 8 January 1988. Long-duration flight characteristics were
demonstrated and unique methods of tracking and data retrieval were developed. Payload recovery
from the Antarctic plateau was demonstrated. Valuable meteorological surface and stratospheric data
were collected. Logistical and operational problems asssociated with working in an isolated polar
environment were solved.
1. BACKGROUND
At the end of March 1987 the Space Astronomy Laboratory (SAL), University of Floridaconsulted the Air Force Geophysics Laboratory (AFGL) concerning the feasibility of flying a large zeropressure balloon from Amundsen-Scott Station (South Pole) Antarctica. This project, sponsored bySpace Division (SD) and funded by the Defense Advanced Research Projects Agency (DARPA), woulduse an 11.800.000 cubic foot balloon floating at 130,000 feet to detect gamma ray emissions fromSupernova 1987A, which had been detected in February 1987. These emissions, visible only in thesouthern hemisphere, could be best observed from the Antarctic continent. The ideal location was theSouth Pole. The sequence of events was such that the gamma ray emissions could be detected overAntarctica in January 1988. This coincided with the Artarctic surnmer, the only time testing of thisnature could be accomplished. There was only one opportunity to collect these data. These unusualcircumstances provided us a unique opportunity to demostrate the versatility and adaptability ofballoons as near space test vehicles.
1. 1 Gamma Ray Detector
The detector proposed for this experiment was developed for the Space Test Program (STP) andwas initially intended to fly aboard the space shuttle. We agreed that this detector could be mated to anAFGL balloon electronics command, control, and telemetry package within the time available. Thecost would be much less than a space shuttle experiment. The enviromental and logistical problemswere the major constraints for this effort.
1.2 Launch Site
The feasibility of this proposal was investigated immediately. Very quickly, the idea of usingAmundsen-Scott as an operational base was discarded because of logistical, operational, andmeteorological constraints. McMurdo Station, operated by the National Science Foundation (NSF),was selected as the alternate site. Efforts were redirected to solving the problems associated with an
operation from this location.
1.3 Balloon Launch Requirements
In the past helium-filled research balloons have been used in Antarctica. However, theseballoons were small, generally 19,000 to 300,000 cu ft, with payloads 50 lb or less. This would be thefirst attempt to launch a very large, helium-filled, zero-pressure balloon carrying a payload weighingnearly 2500 pounds. An effort of this magnitude requires heavy equipment for the launch vehicle,launch arm, and helium storage. Approximately 150,000 standard cubic feet of helium would berequired. All equipment would have to be airlifted to the site because of the short notice of this
(Received for publication 20 September 1988)
2
project. The logistical, operational, and meteorological problems was staggering; however, the
successes with the smaller balloons indicated the task was manageable.
2. PLANNING DECISIONS
On 23 July 1987, a meeting was held at AFGL to review the progress of the investigations and to
define the objectives and timetable for the Antarctica effort. Many problems and their solutions
surfaced; time was the critical factor. We decided to proceed with the project until a problem arose that
could not be solved within the time frame. A final Mission Readiness Review was scheduled for 10
November 1987. Other decisions made at this meeting were:
a) The launch site would be Williams Field, on the permanent ice shelf about 7 miles from
McMurdo Station. The National Science Foundation would pack a snow covered area for use as a
launch pad.
b) Gaseous helium would be the lifting gas, although investigations would continue for the use
of liquid helium, because a source for the proper size helium cylinders that could be air-shipped from
Christchurch, New Zealand to McMurdo Station, had not yet been identified.
c) Solar panels would provide long-duration power for the payload in lieu of a large weight of
batteries.
d) Since it appeared certain that the balloon would drift beyond line-of-sight (out of range from
the ground station) a mobile, telemetry/command station would be designed to go aboard the National
Science Foundation's LC-130 aircraft.el The payload would include a sunseeker to point the platform so that the solar panels faced
the sun and the gamma ray detector pointed toward the supernova.
f) The crews for the launch, telemetry, instrumentation, and data acquisition were chosen and
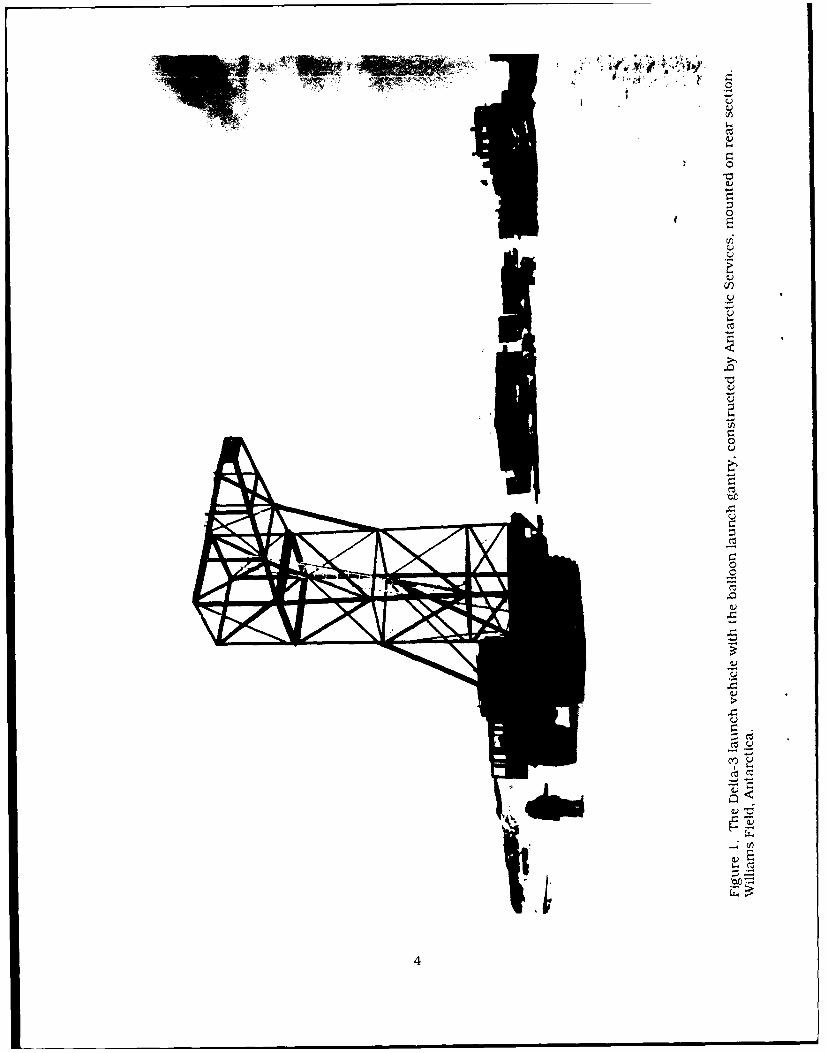
their functions defined.g) The launch vehicle would be the on-site Delta-3. AFGL would design the launch gantry and
the NSF's on-site contractor, Antarctic Services (ANS) would construct it (see Figure 1).
h) Service ARGOS would provide balloon position when the balloon was beyond range of the
base telemetry station.i) Space Division (SD) would arrange a C-141 airlift to fly the gondola and support equipment
from Holloman AFB, NM to McMurdo Station.j) Upper air wind and temperature data would be obtained from on-site radiosonde soundings.
Naval Support Forces Antarctica (NSFA) would provide the ground tracking unit, operator,
radiosonde helium, and radiosondes. AFGL would provide other high-altitude radiosonde balloons
and assist in launching them.
k) AFGL would provide and operate a tethersonde to obtain low level wind and temperature
data.1) The payload would be integrated and tested at AFGL, Det 1, Holloman AFB, NM. After
integration and testing it would be shipped intact to McMurdo. The shipping date was set for 13
November 1987, three days after the Mission Readiness Review.
3
.,j'~
CY C.)I-V00
'0S V
08V
VCr,C.)
C~)
I...
i.0*0V
C.)C..00V
.0C.)0
000
.0V.0
.0
V
C.).0V
.0C.)0.
- -
0.0
4
m) The final flight preparations and testing would be done in the new Heavy Equipment
Building at McMurdo.
n) The first launch atttempt was set for 6 January 1988.
3. FLIGHT OBJECTIVES
The main objective of this effort was to measure gamma ray emissions from Supernova 1987A
for a minimum of 3, and a maximum of 21 days. An 11,820,000 cubic foot balloon floating at a
constant altitude of 120,000 feet would be the platform for the gamma ray detector. It was desired but
not required that the detector be recovered so that it could be analyzed for deterioration caused by the
gamma ray strikes. Other objectives were to learn more about the surface, tropospheric, and
stratospheric meteorology of Antarctica, to test the ARGOS tracking system, and to develop balloon
launch techniques relevant to polar regions.
4. MILESTONES
Significant milestones, that is, major action items necessary to successfully accomplish the
project on schedule, are listed below:
a) Aug 14,1987 AFGL Memorandum of Agreement (MOA) signed.
b) Aug 20,1987 AFSC/SD final approval.
c) Sep 22,1987 helium and balloons to Port Hueneme, CA for surface shipment.
d) Sep 29,1987 Solar panels delivered to Holloman AFB, NM.
e) Oct 8,1987 Tesi of the upwind launch system.
f) Oct 9,1987 Detector system delivered to Holloman AFB, NM.
g) Oct 21,1987 Gamma Ray Advanced Detector (GRAD) operations plan completed.
h) Oct 27,1987 Environmental chamber tests completed.
) Nov 4,1987 Airborne telemetry station checks completed.
j) Nov 7,1987 Allup flight readiness tests completed.
k) Nov 10,1987 Mission Readiness Review. Approval granted to proceed to McMurdo.
1) Nov 13,1987 C-141 airlift shipment departed Holloman AFB, NM for McMurdo.
m) Dec 15,1987 All crews and equipment arrived at McMurdo.
n) Jan 3,1988 Allup launch, flight and telemetry tests completed at Williams Field.
o) Jan 6,1988 Launch minus two day tests completed. System ready for flight.p) Jan 8. 1988 System launched.q) Jan 11.1988 LC- 130 data flight terminated.r) Jan 13,1988 Payload recovery made using LC-130 aircraft.
s) Jan 29,1988 Last crew member left McMurdo.
t) Apr 27,1988 GRAD crew debriefed in Florida.u) May 3,1988 Formal GRAD debriefing held in Washington, DC.
5
5. CLIMATIC INVESTIGATIONS
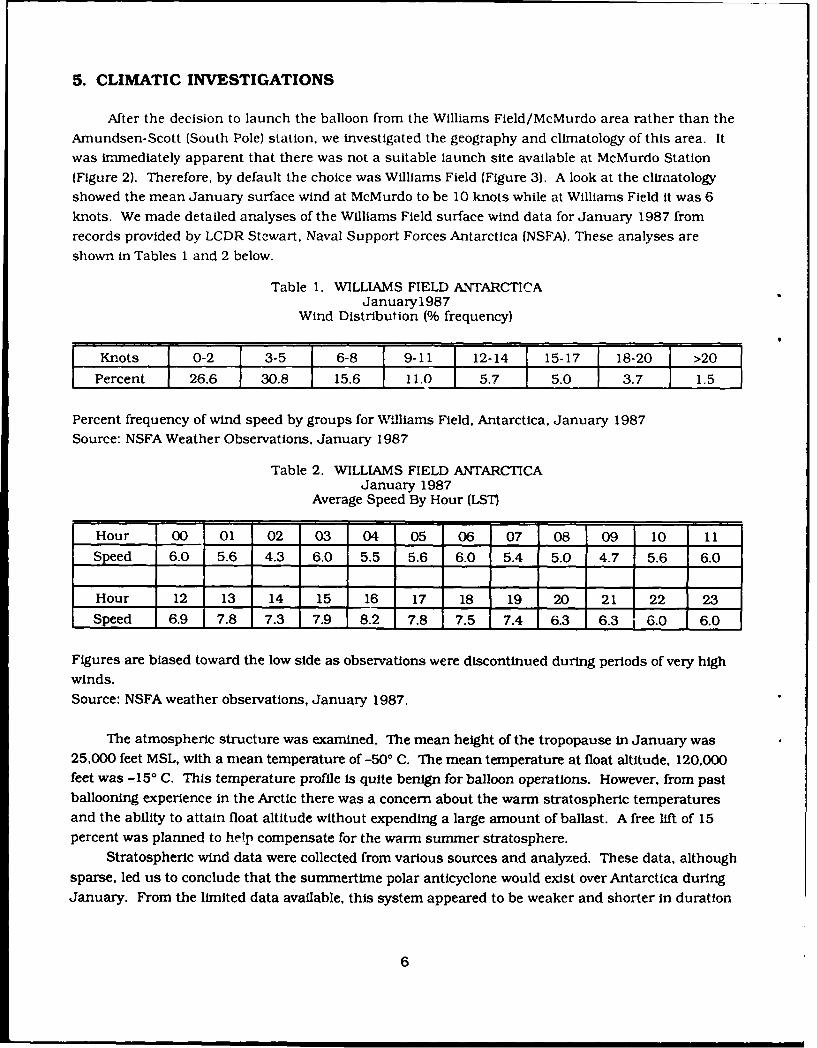
After the decision to launch the balloon from the Williams Field/McMurdo area rather than theAmundsen-Scott (South Pole) station, we investigated the geography and climatology of this area. Itwas immediately apparent that there was not a suitable launch site available at McMurdo Station
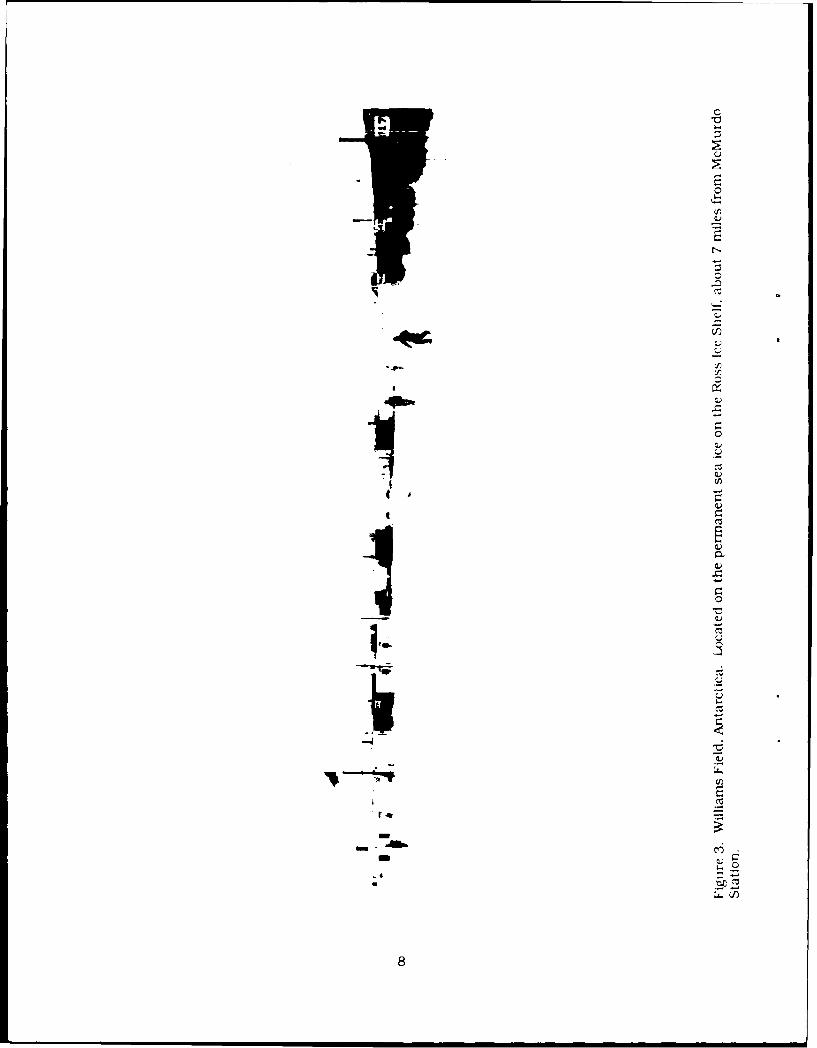
(Figure 2). Therefore, by default the choice was Williams Field (Figure 3). A look at the climatology
showed the mean January surface wind at McMurdo to be 10 knots while at Williams Field it was 6knots. We made detailed analyses of the Williams Field surface wind data for January 1987 fromrecords provided by LCDR Stewart, Naval Support Forces Antarctica (NSFA). These analyses are
shown in Tables 1 and 2 below.
Table 1. WILLIAMS FIELD ANTARCTICAJanuary1987
Wind Distribution (% frequency)
Knots 0-2 3-5 6-8 9-11 12-14 15-17 18-20 >20
Percent 26.6 30.8 15.6 11.0 5.7 5.0 3.7 1.5
Percent frequency of wind speed by groups for Williams Field, Antarctica, January 1987
Source: NSFA Weather Observations. January 1987
Table 2. WILLIAMS FIELD ANTARCTICAJanuary 1987
Average Speed By Hour (LST
Hour 00 01 02 03 04 05 06 07 08 09 10 11
Speed 6.0 5.6 4.3 6.0 5.5 5.6 6.0 5.4 5.0 4.7 5.6 6.0
Hour 12 13 14 15 16 17 18 19 20 21 22 23
Speed 6.9 7.8 7.3 7.9 8.2 7.8 7.5 7.4 6.3 6.3 6.0 6.0
Figures are biased toward the low side as observations were discontinued during periods of very high
winds.
Source: NSFA weather observations, January 1987.
The atmospheric structure was examined. The mean height of the tropopause in January was25,000 feet MSL, with a mean temperature of -500 C. The mean temperature at float altitude, 120,000
feet was -150 C. This temperature profile Is quite benign for balloon operations. However, from pastballooning experience in the Arctic there was a concern about the warm stratospheric temperaturesand the ability to attain float altitude without expending a large amount of ballast. A free lift of 15
percent was planned to help compensate for the warm summer stratosphere.
Stratospheric wind data were collected from various sources and analyzed. These data, although
sparse, led us to conclude that the summertime polar anticyclone would exist over Antarctica during
January. From the limited data available, this system appeared to be weaker and shorter in duration
6

0
0
.0
cu
co
.0
ci
cz
C
0I-
C.-
C
S
-C____ 0
C
C
C)
V
2! 4)
0*0V
i*u~
C)
*0V
r.
--
~- .9
~La0
8
than its northern hemisphere counterpart. We concluded that during the first half of January the
winds at 120,000 feet at 780 south latitude would be blowing from east to west at a speed of 10-15 knots.During the latter half of the month the winds would remain easterly and decrease in speed. We also
expected that the direction would reverse from east to west during the first half of February as the
wintertime stratospheric polar cyclone began to be reestablished. There were strong indications thatduring the first half of January the balloon trajectory would be along the 78th parallel and that the
balloon would return over the launch site in about 12-15 days (Nishimura, 1985)1. The actual flight
experience showed these predictions to be reasonably accurate.
Although the mean cloud cover for McMurdo is 6 tenths, this was not expected to present aproblem. It was desirable to launch in the absence of clouds but since the tracking would be done
electronically it was not essential to the operation.
6. PRE-SHIPMENT ACTIVITIES
After the kickoff meeting in late July preparation activities began in many areas and moved at arapid pace. Work began on the solar panels, logistics, gantry design, telemetry, helium procurement.
pointing systems, and launch testing. Meetings and submeetings were held to assess the progress of
the various aspects of the project. An AFGL instrumentation team travelled to the Space AstronomyLaboratory at the University of Florida to interface the AFGL flight instrumentation with the
experiment package. These various activities continued through September when the various pieces ofhardware were shipped to Detachment 1, AFGL, at Holloman AFB, NM for flight integration and
testing.With the arrival of the payload and crews at Holloman AFB, NM six distinct activities were
scheduled to assure the flight readiness of the system. The objective was to assemble the total systeminto the operational configuration that would be used at McMurdo.
The integration phase of the operation consumed most of the month of October. The GRADgondola complete with the AFGL instrumentation was mated with the solar panels, batteries and
sunseeker/rotator system. The complete gondola was suspended from a crane; then data were receivedfrom the payload by the telemetry system to be used on the ice. Operating commands were sent to the
payload to see that all systems responded properly. The ARGOS system was turned on and positioning
data were received.
While the integration phase was in progress the launch crew was busy practicing the upwindlaunch technique. (For an upwind launch the wind is blowing toward the launch vehicle carrying thegondola. Thus the balloon at bubble release is blown toward the launch vehicle. This technique
allows the launch vehicle to move more slowly, and over a shorter distance to release the payloaddirectly beneath the rising balloon.) A partially inflated balloon attached to a launch vehicle was
released and captured several times in wind conditions varying from calm to 10 knots. After two days
of testing the launch crew was satisfied that this launch technique could be used at McMurdo in light
1. Nishimura, J. (1985) Feasibility studies of "Polar Patrol Balloon", Adv. Space Res. 5 (No. 1):87-90.
9
wind conditions. At this point we set the wind launch criterion that a mean launch wind, surface to
bubble height. must not exceed 8 knots.
After the integration phase was complete the flight payload was environmentally tested in the
thermovac altitude chamber at Holloman AF3. By varying the chamber air pressure and temperature
to simulate the actual flight environment an altitude profile similar to the profile expected in
Antarctica was "flown". Problems were encountered with the experiment's high voltage power
supplies: these units failed during the simulated ascent when the pressure was changing rapidly. The
solar panels could not be operated under flight conditions. However, the panels were temperature
tested and shown to operate properly at the surface environment.
Immediately after the thermovac test the airborne telemetry was tested aboard a C- 130 aircraft.
These tests showed systems working. Aircraft vibration levels were found to be acceptable, but the
telemetry reception was unsatisfactory. These tests and resolutions are discussed in detail by Thorn.
The last step in the testing phase was the all-up test conducted on 7 November 1987. The payload
was rigged to the flight-ready mode, suspended from the launch vehicle and moved to the launch pad.
Pad checkouts were made. the telemetry systems checked through the Oklahoma State University
(OSU) tracking system. and all command functions were verified. All flight hardware was attached
and the payload was shock tested by driving the launch vehicle through a launch run. At this point the
system was flight ready and returned to the buildup area for packing and shipping.
On 10 November 1987 a Mission Readiness Review was held for review of all aspects of the project
and for final go ahead approval for shipment. The uncertainties at this point were: a) the range of the
C- 130 telemetry system. b) the status of a backup high voltage power supply, and the unknowns
associated with the meteorology. However, the risks were considered acceptable and the approval wasgiven to proceed with shipment. On 13 November 1987 the C-141 departed Holloman AFB, NM enroute
to McMurdo Station, Antarctica.
7. PREFLIGHT ACTIVITIES
After the crew and equipment arrived at McMurdo, operations were set up in the newly
constructed Heavy Equipment building at McMurdo. Preflight calibrations and testing were made
from here. Meanwhile, the control center and telemetry stations were being set up at Williams Field.
All the launch support equipment was checked and readied and the helium racks were moved to the
packed-snow launch pad at Williams Field. The Tufts launch arm was mounted on a sled and Ice
anchors were installed to hold it in position. The launch arm was installed in line with the prevailing
easterly winds. Once in place it could not be moved to accommodate winds from other directions, but
this did not become a problem because when the winds were light they were from a true easterly
direction.
7.1 Wind Direction Nomenclature
A digression is necessary here to explain how wind directions are reported. Three methods are
used, grid: magnetic and true. A grid wind references zero degree longitude as north and 180' longitude
as south. The winds at Williams Field are usually reported in grid, which is 170 degrees from true.
10
Magnetic directions are seldom used in Antarctica. Upper-level winds are usually reported in true
direction except at the Pole where, of necessity, grid is used. At Williams Field a grid west wind is a
true east wind.
7.2 High Altitude Radiosondes
Whenever the surface winds at McMurdo permitted, we released 141,000 cubic foot polyethyleneballoons to obtain wind data above 100,000 feet MSL. Ten launches were made and seven were
successful. The other three were destroyed by winds during the launch process. The mean altitude forthe successful launches was 138,000 feet MSL. Figure 4 shows a high-altitude radiosonde balloonbeing prepared for launch. The 5-mb level data for these launches are shown in Table 3.
Table 3. WILLIAMS FIELD ANTARCTICA5 Millibar Data
Date Height Temperature Direction Speed
(meters) ( 0C) (true) (knots)
17 Dec 1987 38230 -4.9* 070 17
20 Dec 1987 37988 -15.8 065 17
25 Dec 1987 37621 -6.3* 100 17
02 Jan 1988 37241 -17.5 110 12
03 Jan 1988 37379 -13.5 075 20
13 Jan 1988 37193 -15.8 105 15
16 Jan 1988 37319 -17.3 080 09
* The unusually warm temperature is due to the radiosonde's thermistor not being deployed properly.
The anomaly on 25 Dec Is valid data.
7.3 Telemetry Checkout
Another checkout of the airborne telemetry system was made from Williams Field. A small
tethered balloon raised the flight package to 500 feet above ground level (AGL), and with the aircraft onthe parking ramp the correct flight geometry was simulated. In the quiet environment, - absence of
other radiators - good results were achieved.
7.4 Pre-Flight Preparations - Williams Field
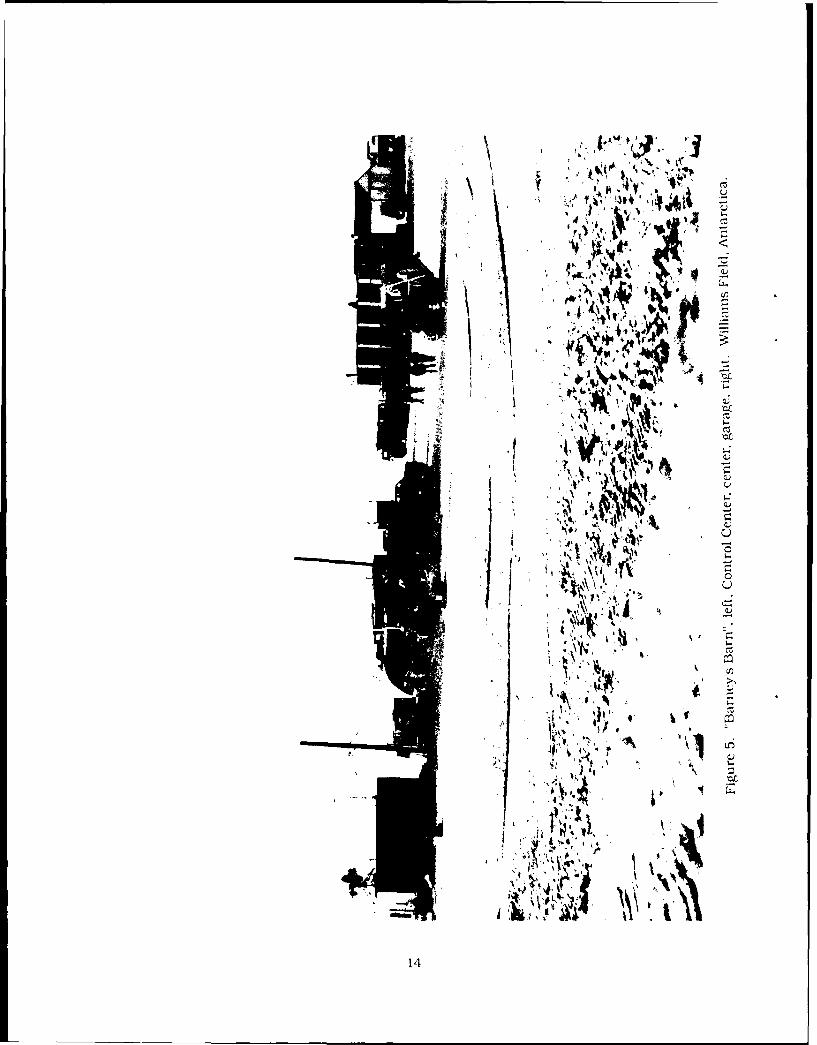
On 31 December 1987 the payload and the operations were shifted to Williams Field. The
gondola was housed in the garage at Williams Field. Operations were set up in a Quonset hut and the
telemetry was housed in the mobile structure known as "Barney's Bam". Final calibrations were madeand the systems assembled for the allup tests made on 3 Jan 1988. All checks proceeded normally and
all systems checked Go. The launch-minus two-day test (L-2) was set for 6 Jan and the launch set
11
mI
Figure 4. A 141,000 cubic foot radiosonde balloon inflated for launch at McMurdo Station,
Antarctica. Facing camera, Mr. Joe Longshore, AFGL, Det 1. Away from camera, Mr. Joe
Fumerola, PSL/NMSU.
12
for 0600 hours 8 Jan 1988. Figure 5 shows the layout at Williams Field.
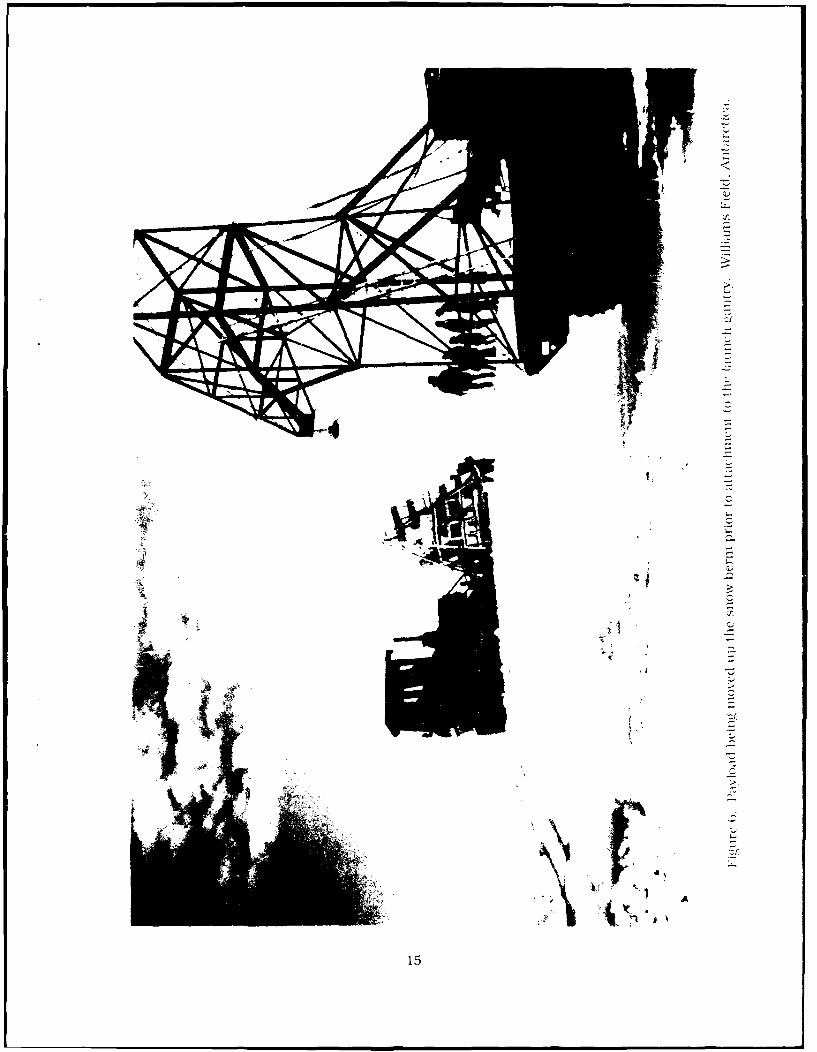
The L-2 preparations began the morning of 6 Jan 1988. The temperature hovered near the 250 F
mark most of the day. The winds were 6-8 knots and the sky was partly covered with low clouds. At
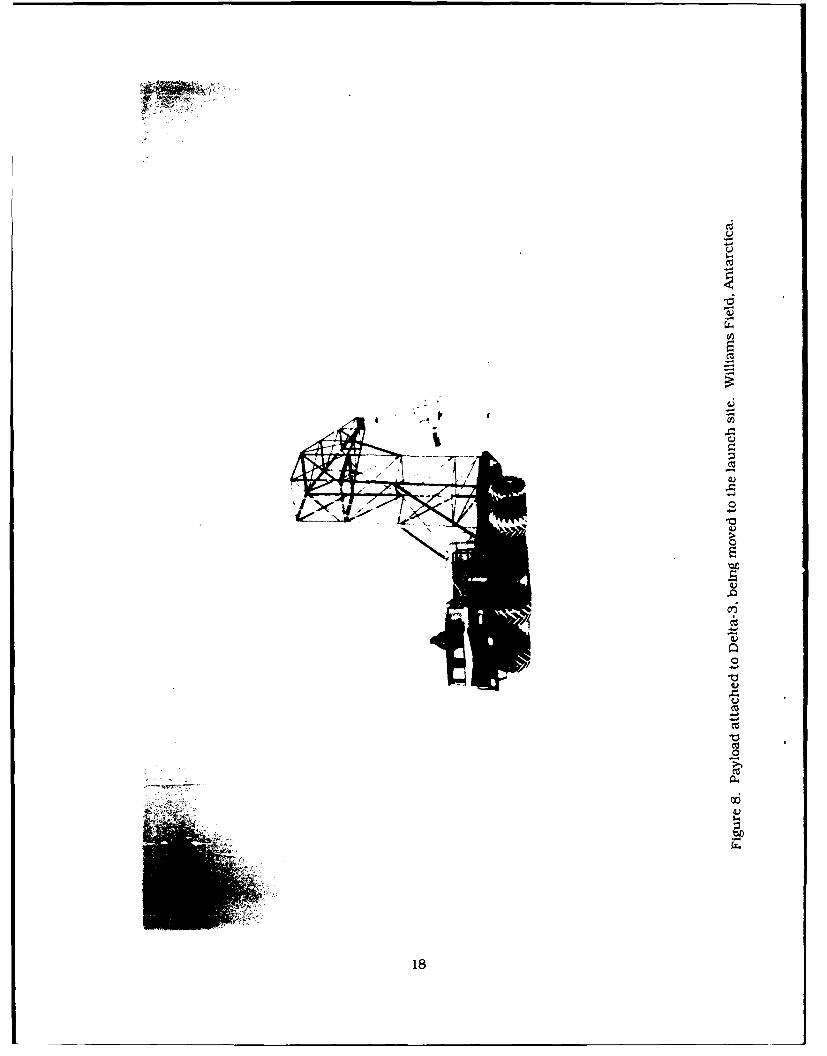
1130 hours the gondola was moved to the snow mound and attached to the gantry (see Figure 6). After
attachment to the Delta-3 launch vehicle the system was transported to the pad for final flight checks.
At 1700 hours all flight and experiment checks were complete and the system was flight ready. The
launch was reconfirmed for 0600 hours 8 January 1988. The gondola was returned to the garage to
await proper launch conditions.
8. LAUNCH ACTIVITIES
The launch activities began with the arrival of all crews at Williams Field at 0000 hours on 8 Jan
1988. The crews set about their various final flight preparations. Electronics, telemetry systems,
experimenter packages and the flight hardware were checked.
8.1 Launch Arm Test
During the checkout of the launch arm we discovered that the launch arm would not activate
because of the cold. The arm had been anchored to the ice for several days at below freezing
temperatures. The temperature this morning was lower than usual, 12' F. We borrowed an aircraft
heater to warm up the system and after about 2 hours of heating the arm would function well enough to
launch.
8.2 Working Environment for Crews
Although the surface temperature was 120 F, because of the light winds and the bright sunshine
and reflection from the snow covered surface, outdoor working conditions were not severe. As amatter of fact sunglasses were necessary and protection from sunburn was a concern. Layered
clothing was an aid in maintaining comfort. When the wind would rise a parka was necessary and
when calm, shirtsleeves were comfortable. Gloves were necessary when handling any exposed objects.
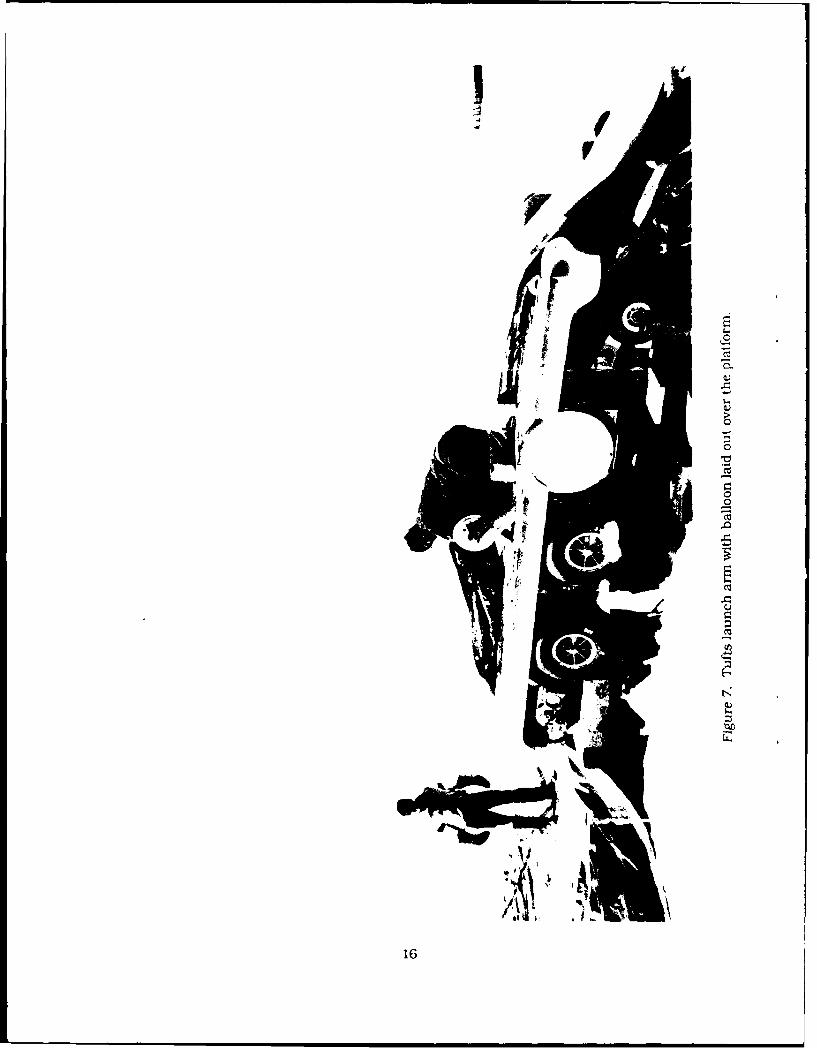
Figure 7 shows the balloon laid out over the platform of the Tufts launch arm.
8.3 Tethersonde
The tethersonde balloon was inflated and positioned at 500 feet AGL. Periodically profiles were
taken from the surface to 500 feet AGL to record temperature and wind data at 100 foot intervals. The
wind data were averaged to give a mean wind for the 500 foot layer. The launch criterion was that this
mean wind would not exceed 6 knots. The mean wind and surface temperature data are shown in
Table 4.
13
1K Ft4 :(,
t 4 V V ', •
C-
- :. • "- . .
<:jA¥ 4
, '! t , ,
-z
~.1
I 4,ii I I
I a>3a
.4 -
<\ ~ A
15
*1
V
I
I 1 i'
0
A '0
00
,0
H
N4.)I-
A
16
Table 4. WILLIAMS FIELD Tethersonde DataJanuary 1988
Time (LST) 0000 0200 0500 0600 0730 0830 0930 1000 1200
Wind Speed (kt) 9.6 5.3 6.3 7.7 5.2 4.5 5.5 5.8 4.5
Temperature (°F) 12.3 13.8 11.8 15.2 19.0 17.8 20.8 19.0 24.8
Mean wind speed, surface to 500 feet AGL and surface temperature data for Williams Field, Antarctica.
77 deg 52 min S, 167 deg 05 min E.
Source: AFGL tethersonde data, January 1988.
8.4 Launch
At 0500 LST all systems were Go for launch configuration. The launch winds were just above the
sx . iit iauia-h crilttrion and showing a tendency to increase. However, at 0730 LST the wind dropped
below six knots and the signal Go for launch was given. The payload was moved to the pad and final
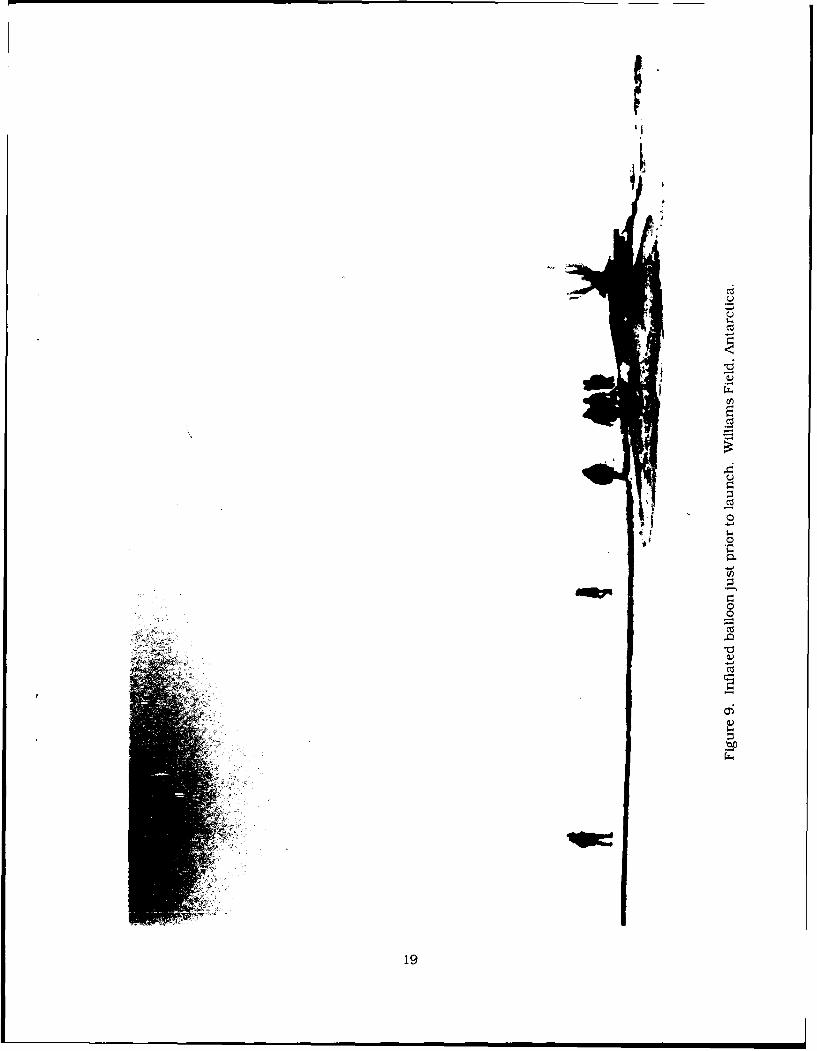
countdown checks were made (see Figure 8). Inflation began at 1105 LST. During inflation, the helium
fittings developed leaks and the valves on the helium tanks did not feed evenly. Occasionally a valve
would stop flowing. It could be freed by opening and closing the valve. Despite these problems the
inflation process was completed in 55 minutes. After inflation was complete. lift computations were
rechecked and the lift value compared with the weighoff scales to ensure that the system did have the
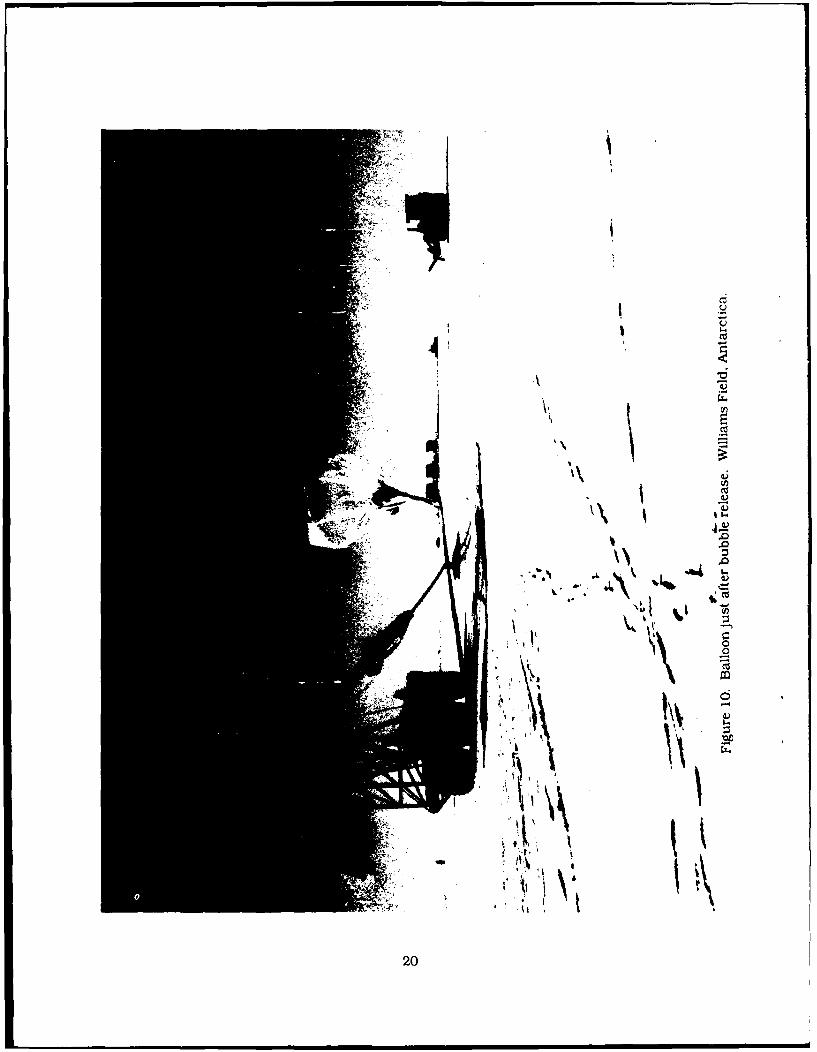
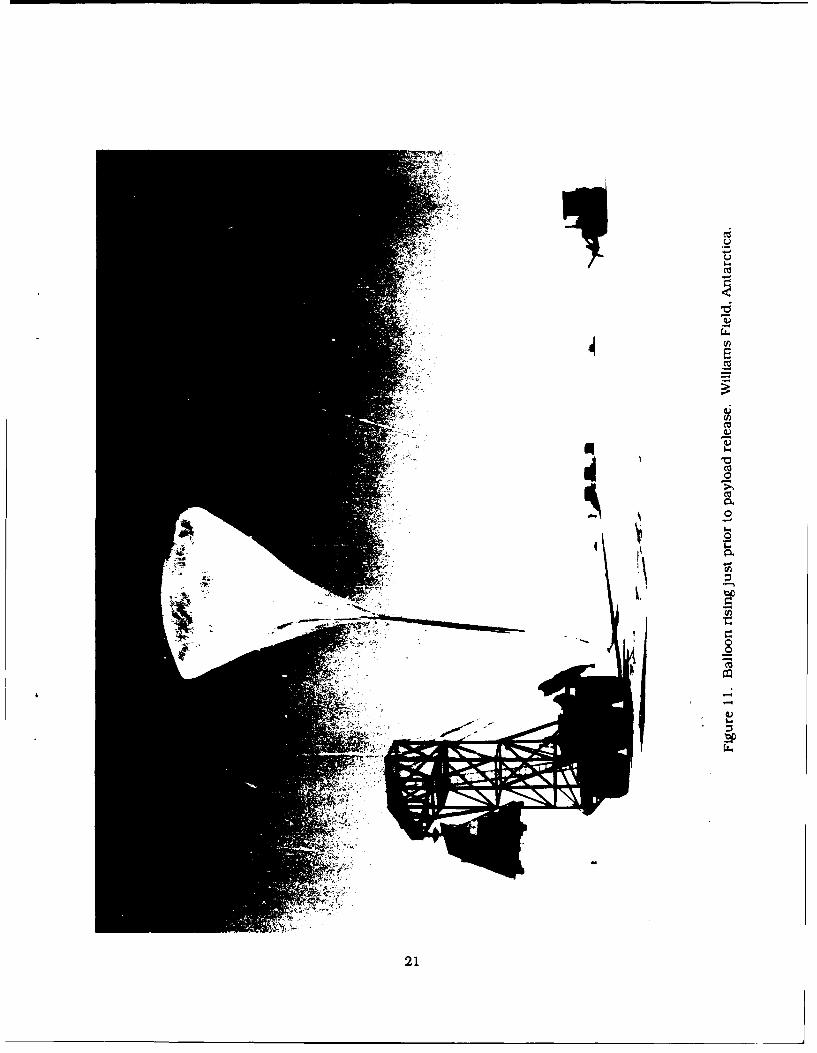
planned 15 percent free lift. Figure 9 shows the inflated balloon just prior to launch. When assured
that all was in order, at 1215 LST, I gave the signal to launch. The launch vehicle moved about 75 feet
ahead and slightly to the right during the launch sequence. The upwind launch technique worked well
and the balloon lifted off smoothly (see Figures 10, 11 and 12).
9. FLIGHT HISTORY
9.1 Ascent
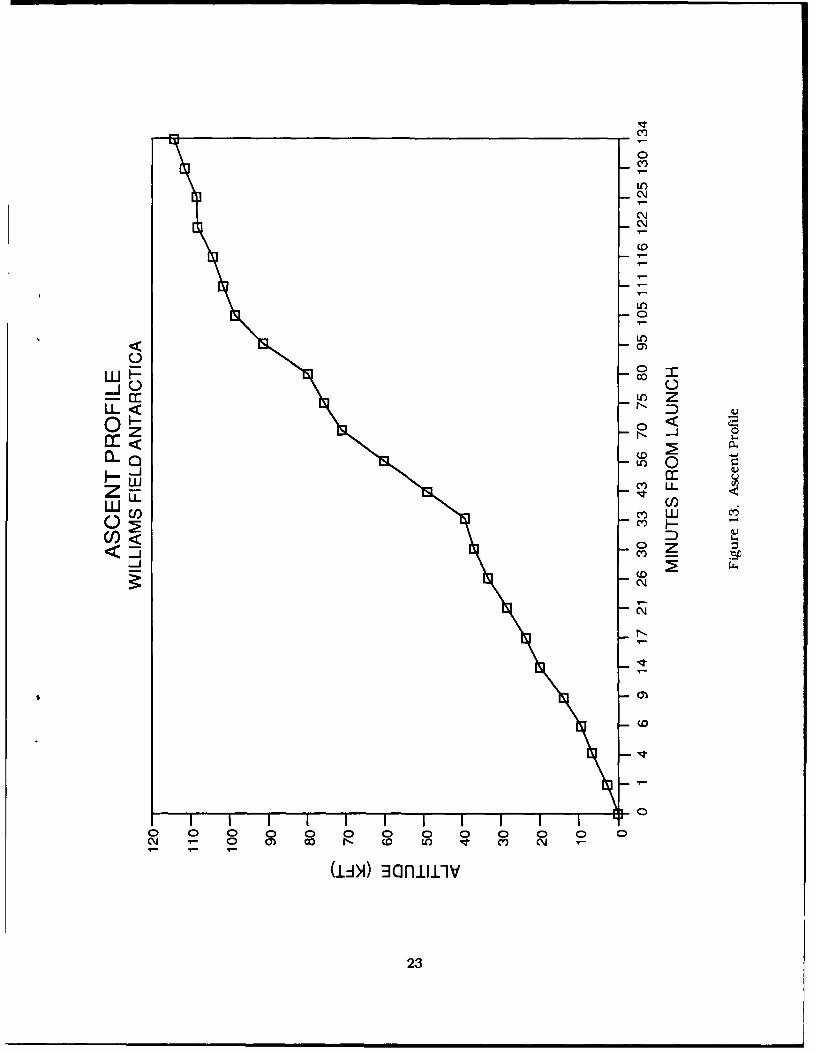
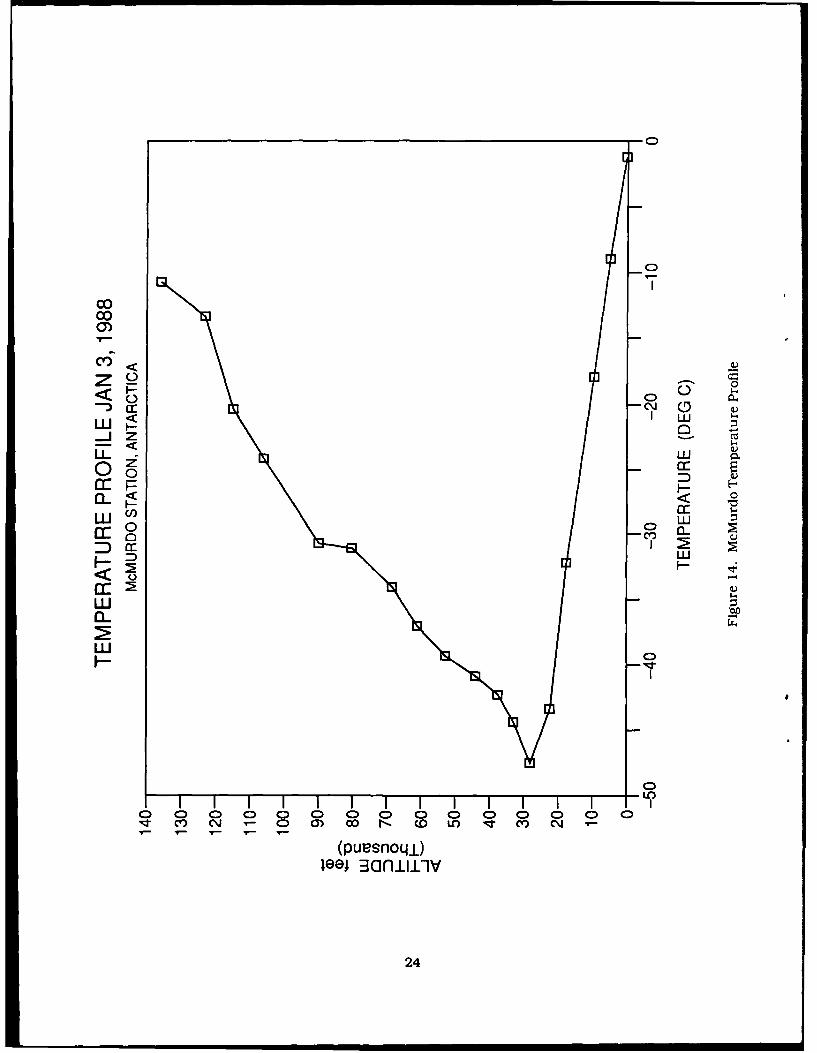
The ascent portion of AFGL Flight H88-01 was nominal. The balloon climbed at a rate of 1393
fpm to the tropopause, 27,000 feet, and then averaged 721 fpm from the tropopause to float altitude. At
float the altitude sensors indicated a pressure altitude of 114,400 feet. These sensors were calibrated
using the 1976 Standard Atmosphere. The "D" value for this day was 4000 feet, giving a true altitude of
118,400 feet. The climbout profile and a temperature profile are shown in Figures 13 and 14. The 3
January data were used for the temperature profile as this was the last radiosonde sounding availablethat attained temperatures at float altitude prior to launch. When the balloon reached float altitude at
1435 LST it was 194' (true) at 16 nautical miles from the launch point.
17
4)
to
cli
4)
.0
0
Vz
00
18
I.II~
c*3
- I(I)S
U
0
I-.0I-
00
*0
U
U
19
C.)
CZ)ks-
10
i0
~t1t0
200
Uz
I-
cucz.
0
21~
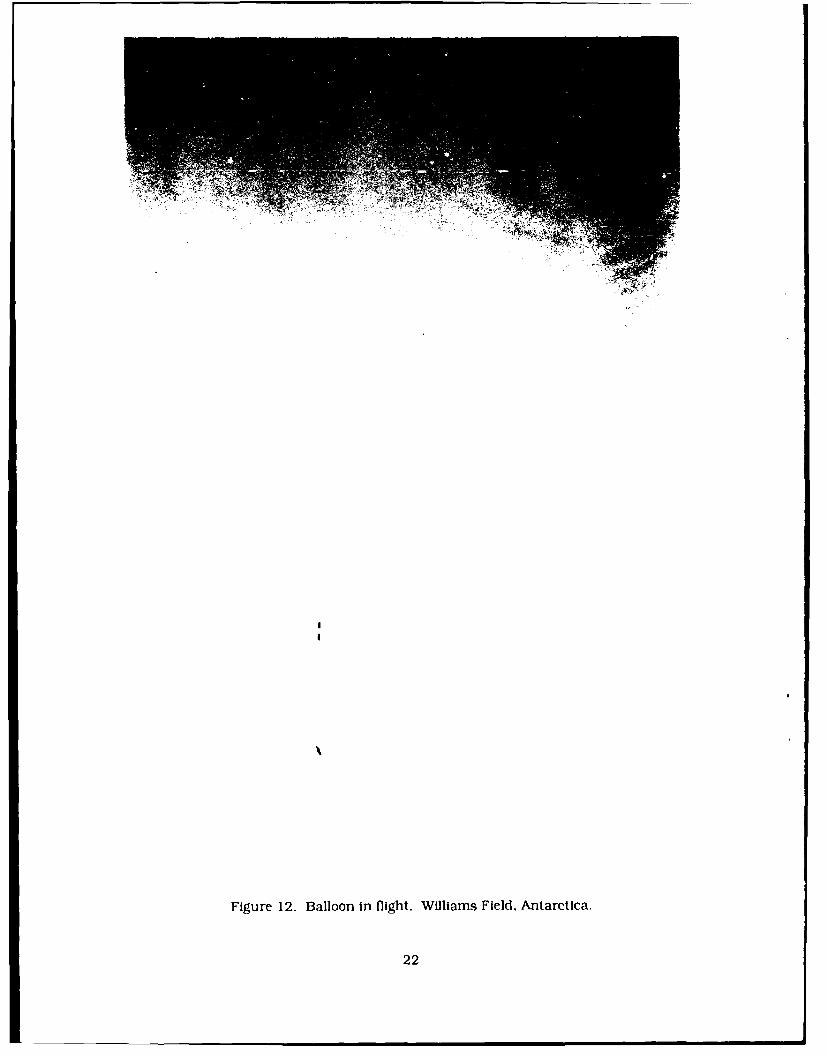
Figure 12. Balloon in flight. Williams Field, Antarctica.
22
0
CV)
C~j
0
LO)
C)
0 < a
N- 0
CL.
LU U-
U) <)
C~.J
0)
(0
-o
CY 0- 09 c l o L t C) C
(i±A) Koniiv
23
C)
C)
00Tcoa)
Zoc0
F- C)
L.J
-j z CZ
2 D
WCI) LU
crI-
w
o C)
C)CD CJ C- C0 C) C) CD. C) LCD a CrD CDM- C) M- W- I' 1L T
(puesnot4_)1ee; 3an.i--iv
24
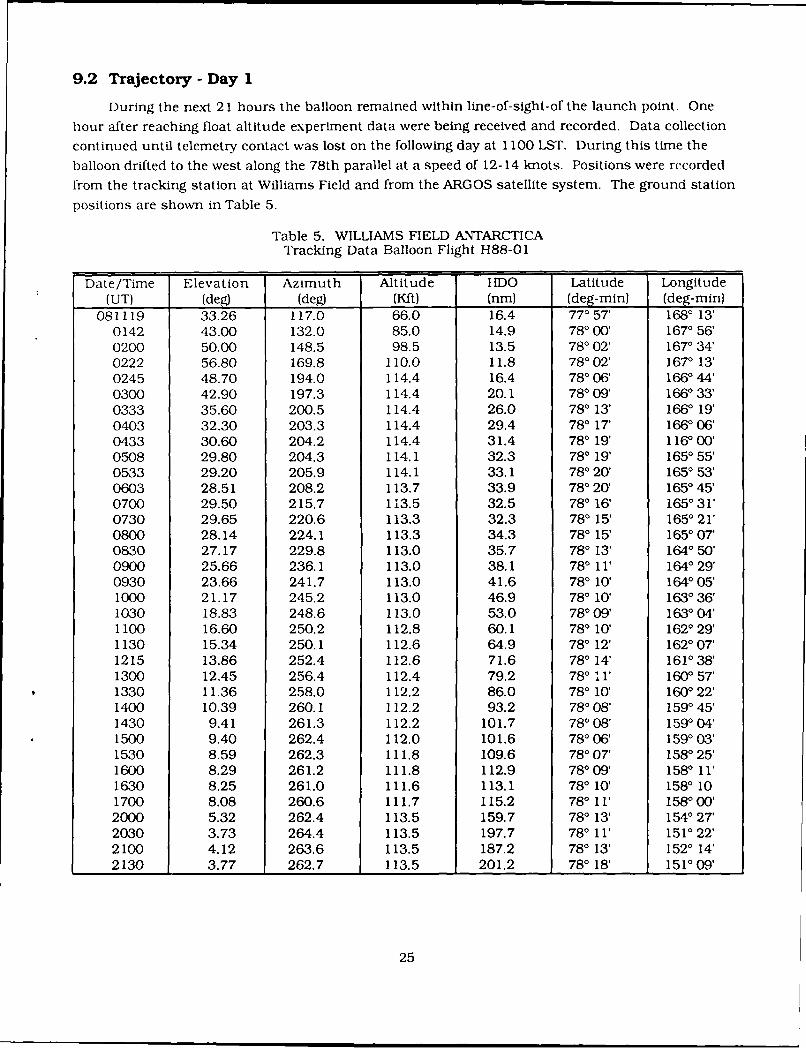
9.2 Trajectory - Day 1
During the next 21 hours the balloon remained within line-of-sight-of the launch point. One
hour after reaching float altitude experiment data were being received and recorded. Data collection
continued until telemetry contact was lost on the following day at 1100 LST. During this time the
balloon drifted to the west along the 78th parallel at a speed of 12-14 knots. Positions were recorded
from the tracking station at Williams Field and from the ARGOS satellite system. The ground station
positions are shown in Table 5.
Table 5. WILLIAMS FIELD ANTARCTICATracking Data Balloon Flight H88-01
Date/Time Elevation Azimuth Altitude HDO Latitude Longitude(UT) (deg) (deg) (Kft) (nm) (deg-min) (deg-min)
081119 33.26 117.0 66.0 16.4 770 57' 1680 13'0142 43.00 132.0 85.0 14.9 780 00' 1670 56'0200 50.00 148.5 98.5 13.5 780 02' 167O 34'0222 56.80 169.8 110.0 11.8 780 02' 1670 13'0245 48.70 194.0 114.4 16.4 780 06' 1660 44'0300 42.90 197.3 114.4 20.1 780 09' 1660 33'0333 35.60 200.5 114.4 26.0 780 13' 1660 19'0403 32.30 203.3 114.4 29.4 780 17' 1660 06'0433 30.60 204.2 114.4 31.4 780 19' 1160 00'0508 29.80 204.3 114.1 32.3 780 19' 1650 55'0533 29.20 205.9 114.1 33.1 780 20' 1650 53'0603 28.51 208.2 113.7 33.9 780 20' 1650 45'0700 29.50 215.7 113.5 32.5 780 16' 1650 31'0730 29.65 220.6 113.3 32.3 780 15' 1650 21'0800 28.14 224.1 113.3 34.3 780 15' 1650 07'0830 27.17 229.8 113.0 35.7 780 13' 1640 50'0900 25.66 236.1 113.0 38.1 780 11' 1640 29'0930 23.66 241.7 113.0 41.6 780 10' 1640 05'1000 21.17 245.2 113.0 46.9 780 10' 1630 36'1030 18.83 248.6 113.0 53.0 780 09' 1630 04'1100 16.60 250.2 112.8 60.1 780 10' 1620 29'1130 15.34 250.1 112.6 64.9 780 12' 1620 07'1215 13.86 252.4 112.6 71.6 780 14' 1610 38'
1300 12.45 256.4 112.4 79.2 780 11' 1600 57'1330 11.36 258.0 112.2 86.0 780 10' 1600 22'1400 10.39 260.1 112.2 93.2 780 08' 1590 45'1430 9.41 261.3 112.2 101.7 780 08' 1590 04'1500 9.40 262.4 112.0 101.6 780 06' 1590 03'1530 8.59 262.3 111.8 109.6 780 07' 1580 25'1600 8.29 261.2 111.8 112.9 780 09' 1580 11'1630 8.25 261.0 111.6 113.1 780 10' 1580101700 8.08 260.6 111.7 115.2 780 11' 1580 00'2000 5.32 262.4 113.5 159.7 780 13' 1540 27'2030 3.73 264.4 113.5 197.7 780 11' 1510 22'2100 4.12 263.6 113.5 187.2 780 13' 1520 14'2130 3.77 262.7 113.5 201.2 780 18' 1510 09'
25
During the first day at float altitude the balloon maintained a relatively constant altitude, rising
and sinking slightly with the rising and lowering of the sun. During the first low sun period small
amounts of ballast were poured to maintain the highest float altitude possible. A total of two percent.
80 pounds, was poured before telemetry/command capability was lost.
9.3 Command Actions
The final command actions taken before the balloon was beyond line-of-sight were to set all
safety and automatic controls. These actions were:
a) The 40,000 kft termination was activated.
b) The 100,000 ballast floor was activated.c) The rotate feature was set to automatic.
d) The burst switch was armed.
e) The beacon was turned on.
fi The impact system was armed.
9.4 ARGOS Data
While waiting for an aircraft to become available for a telemetry run, the balloon position and
its altitude were monitored through the ARGOS system. The balloon altitude and temperature datacould be read out through the ARGOS receive station located in the NSFA building at McMurdo. Dr.
Stearns, University of Wisconsin, had programed this station to receive the GRAD ARGOS data.Positions were received from Space Division (SD) twice daily via routine message traffic. This system
worked quite well in updating the health and position of the balloon. However, just prior to the datarun positions were received telephonically.
9.5 Flight Termination
On 9 January 1988 approval was received for the first data run via the LC-130 aircraft. Theballoon at 102322 LST was located 770 37' S, 1040 23' E, at an altitude of 114,500 feet MSL. This placedit about 800 nm west of the launch point. It was moving to the west at 10-12 knots. Immediatelyfollowing the receipt of the ARGOS position at 0330 LST, 11 January, the LC- 130 aircraft, XD04, was
airborne enroute to intercept the balloon. When the aircraft was about 80 miles from the balloon theaircraft telemetry data readout indicated that the 3000-volt power supply for the experiment hadfailed. Since the aircraft was on station and the system was in an area where recovery was possible,
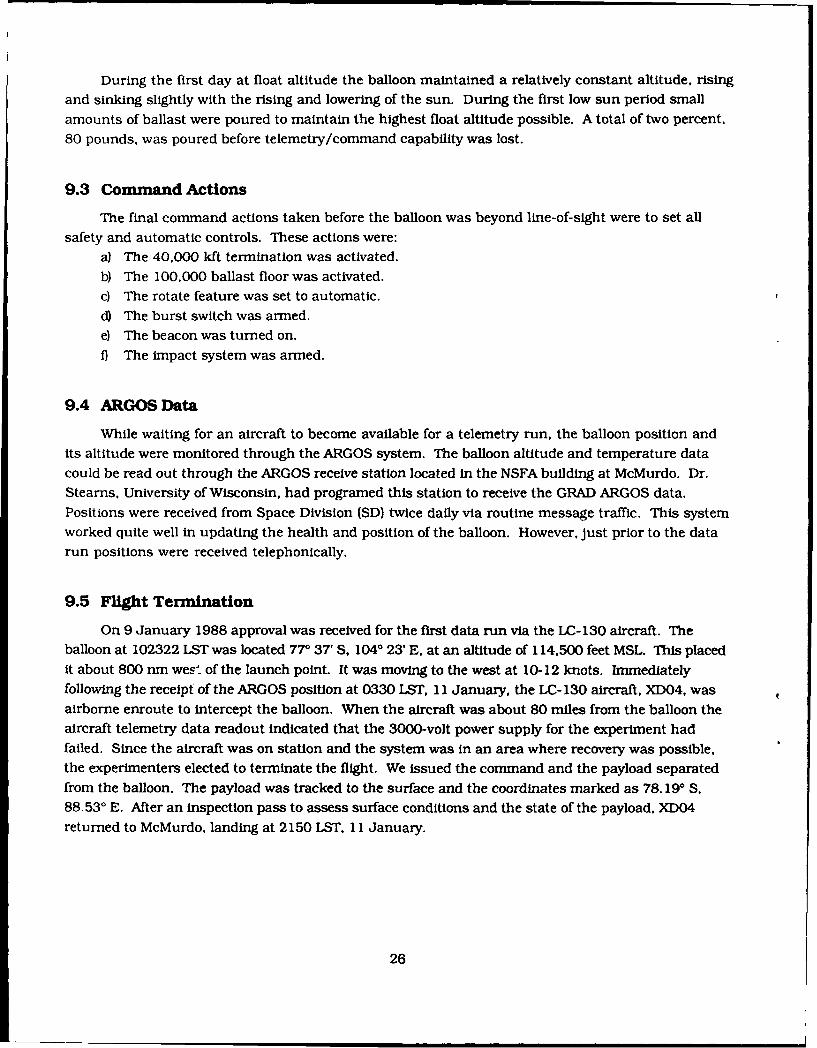
the experimenters elected to terminate the flight. We issued the command and the payload separatedfrom the balloon. The payload was tracked to the surface and the coordinates marked as 78.19 S,
88.530 E. After an inspection pass to assess surface conditions and the state of the payload, XD04returned to McMurdo, landing at 2150 LST, 11 January.
26
10. RECOVERY
After reviewing the aerial photographs of the recovery area NSFA/VXE6 decided that a recovery
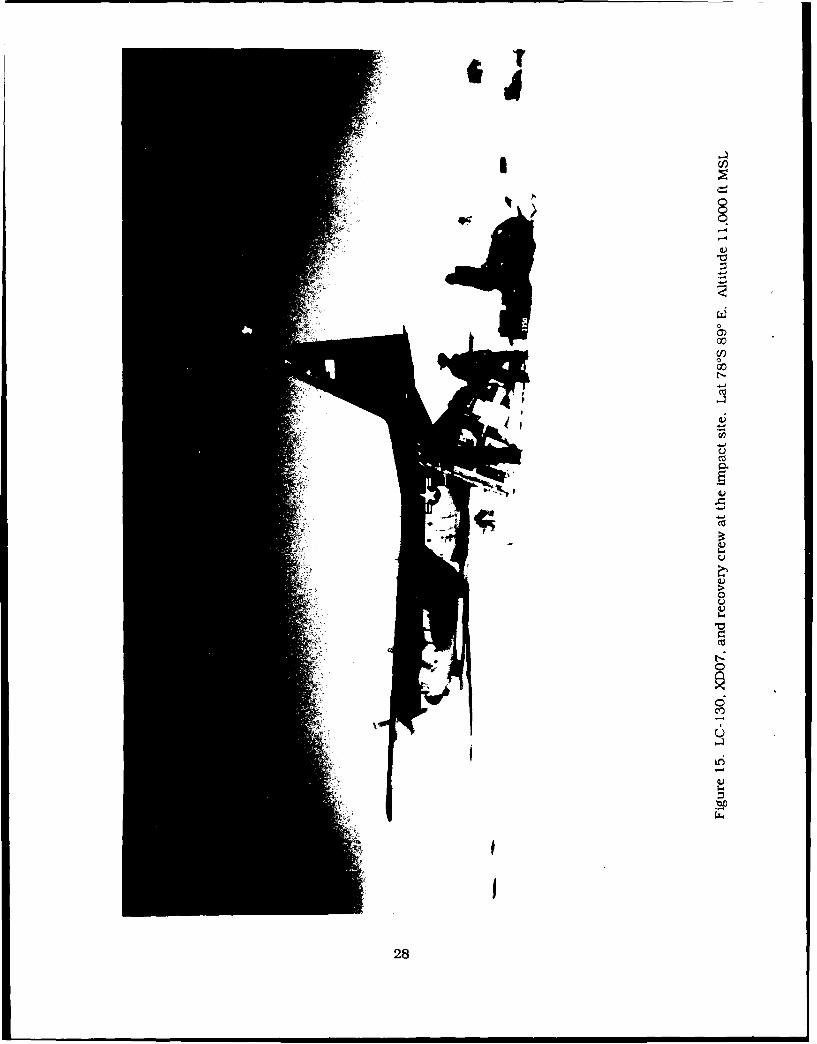
attempt of the payload could be made. On 12 January 1988 at 1500 hours LST the LC-130 recoveryaircraft. XD07, was enroute to the impact site. XD07 was able to land at the site and the payload wasrecovered (see Figure 15). (The recovery operation is covered in detail by Dallas.) The ground crew was
allowed only one hour to make the recovery. Initially two hours had been planned but it had takenmore time than was anticipated to relocate the payload. Because the snow at the impact location wasmuch softer than expected the aircraft takeoff was very difficult. Two long-distance, time-consumingruns had to be made before the aircraft became airborne. XD07 landed at Williams Field with the
payload at 0000 hours LST. 13 January. The payload was off-loaded and stored In the garage atWilliams Field.
At this point the mission was complete except for the final wrapups and the logistical problemsof returning all gear and supplies to the CONUS. Final detector testing was completed within a fewdays and items were prepared for shipment. The last person on the GRAD team, a logistics technician,left McMurdo on 29 January 1988.
11. DISCUSSION
11.1 ARGOS Tracking
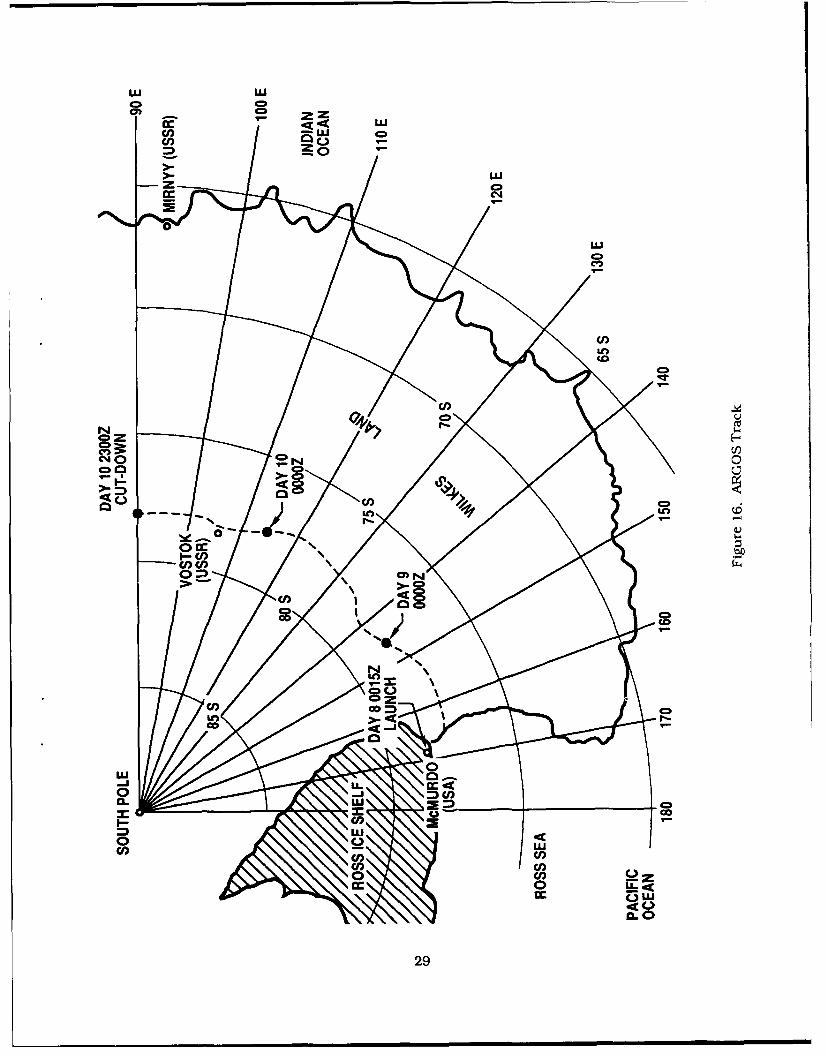
The ARGOS system provided excellent tracking over the period of the flight. Although there wasnoise in the data the accuracy was acceptable for long-duration balloon flights. Also, by bringing backlimited housekeeping data through this system we were able to monitor the health of the balloon inreal time. A smoothed plot of the position data is shown in Figure 16.
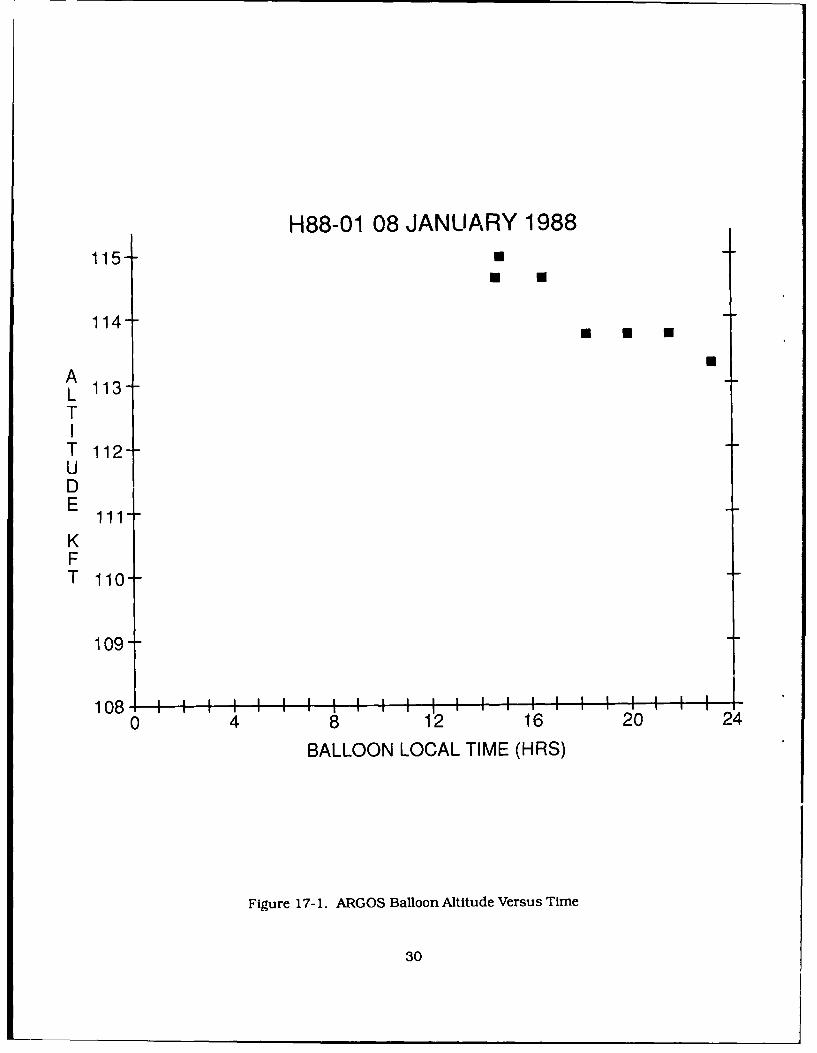
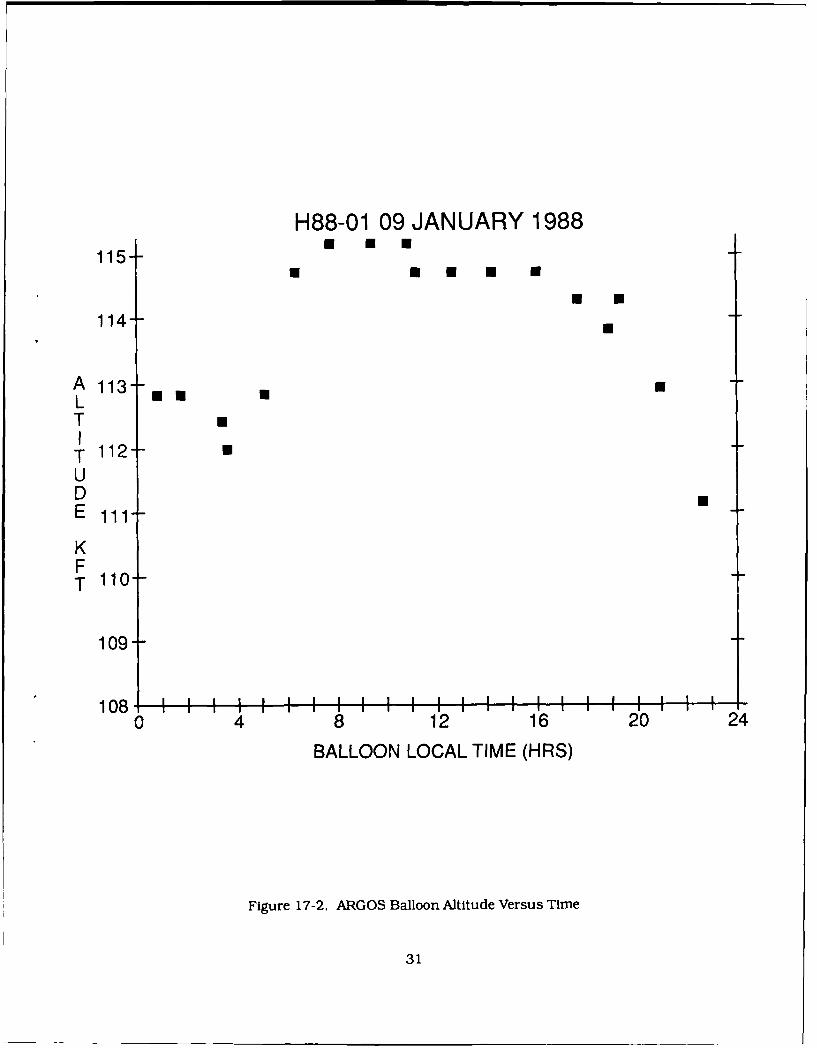
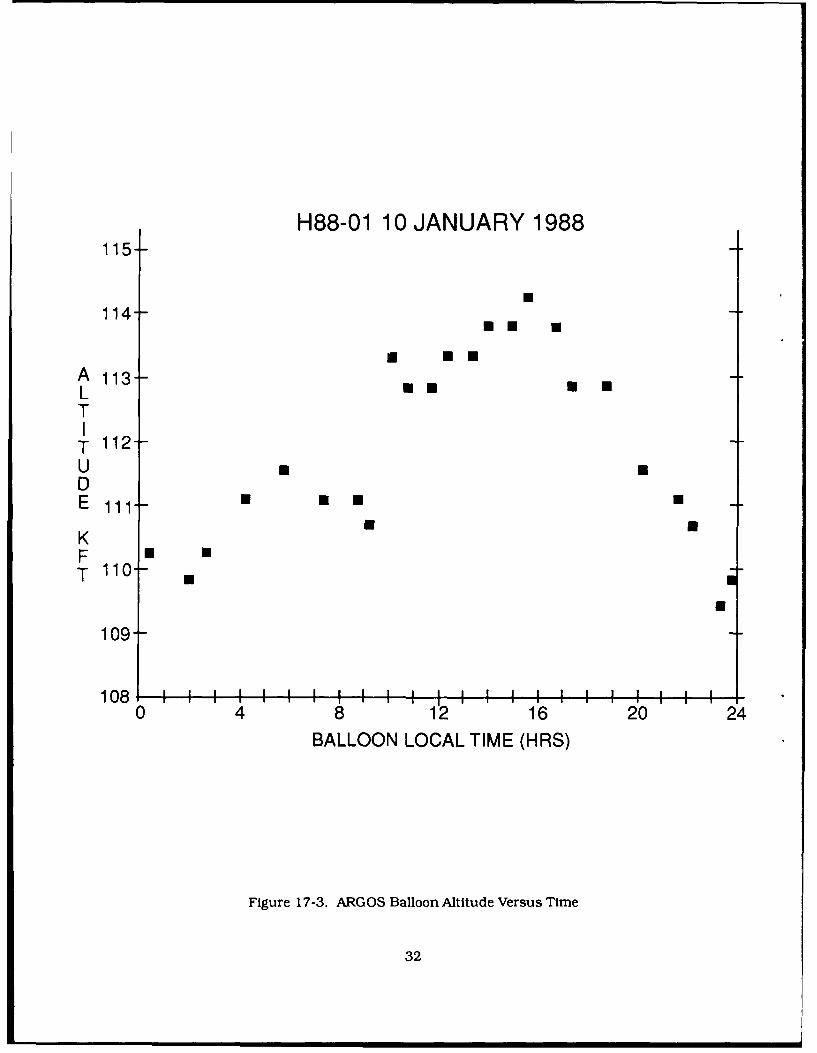
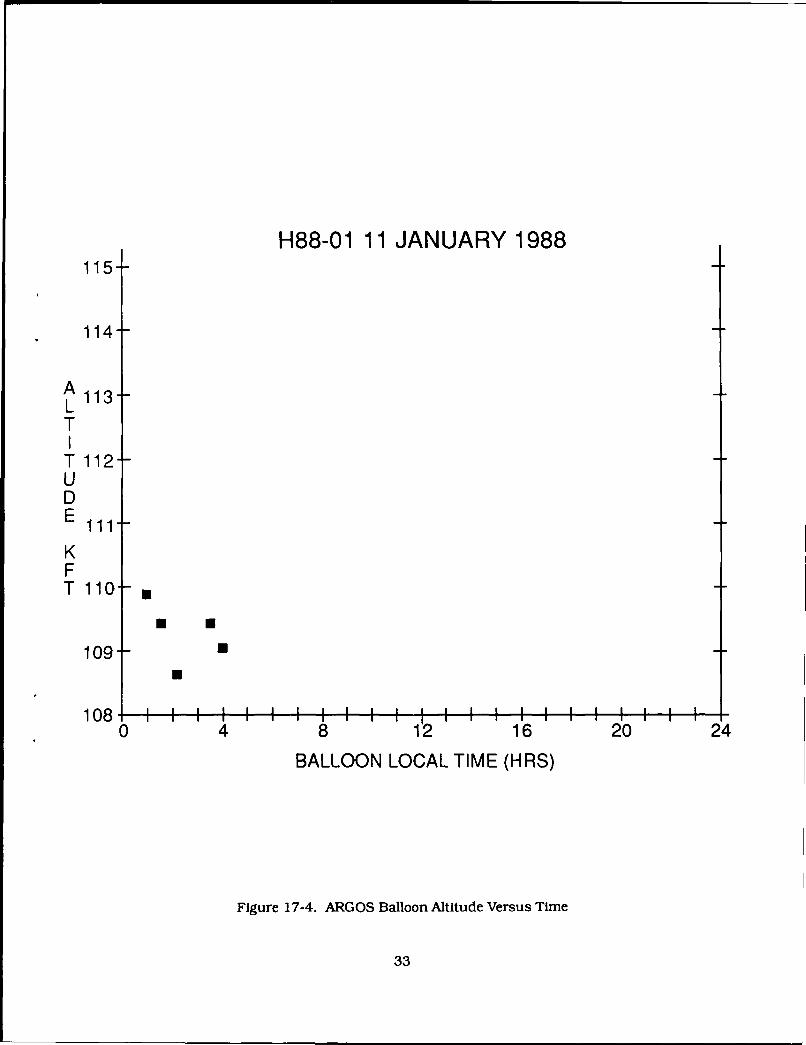
The altitude data received from ARGOS were plotted and showed, as expected, the balloonresponding to the rising and lowering of the sun. T he magnitude of this reaction was one of theunknowns at the onset of this flight effort. Excursions of 4000-6000 feet were noted between high sunand low sun. Each successive day the altitude dipped a little lower. It seems that eventually theballoon would have descended below 100,000 feet and the ballast valve would have been activated.This suggests that even at these high latitudes ballast is a necessity for long duration balloon flights,flights in excess of three days. The ARGOS atitude data are shown in Figures 17-1 to 17-4.
11.2 Comnunications
Various methods were used to communicate locally and between Antarctica and the CONUS.Around the launch site the primary mode of communications was by VHF radio operating on afrequency 138.125 Mhz. Telephone was used between McMurdo and Williams Field. The primaryquick-response link bet.veeen McMurdo and the CONUS was the INMARSAT telephone link. Routinetraffic was sent either normal message or E-mail. Mission Status Reports were sent daily via normalmessage, and ARGOS position reports were received twice daily. HF radio traffic was available but itwas cumbersome to use and the reception was unpredictable. Other telephone service was availablethrough the New Zealand station, Scott Base. Telephone calls through this system had to be scheduled
27
I0
'A0
(z
lkl
28-
LU LU40 4=cr) zz
q < LUCl) - LUCl) ou
30LU
LUC)
Cf)LnCD
Rr
NCoRo C) N 0
4= 0C)
L)
0 CC
>. CD
C5CD
C*40 Zco D CD
Ln >.co
0LU-j LL.0 -1
LU CDGo
LU
0cc 0
cr. uj
0
29
H88-01 08 JANUARY 1988115-
114-
L 113 -T
T 112-UDE
KFT 110-
109-
108 : i I I I II I I I I0 4 8 1'2 16 20 24
BALLOON LOCAL TIME (HRS)
Figure 17- 1. ARGOS Balloon Altitude Versus Time
30
H88-01 09 JANUARY 1988115-
114-
A 113-LTT 112 --UD
KFT 110-
109-
108 I I I I II I I I I I I -
0 4 8 12 16 20 24BALLOON LOCAL TIME (HRS)
Figure 17-2. ARGOS Balloon Altitude Versus Time
31
H88-01 10 JANUARY 1988115-
114-
A 113--
T
T 112-UUUD
E E
KF
109-
108, I I0 4 8 1'2 16 20 24
BALLOON LOCAL TIME (HRS)
Figure 17-3. ARGOS Balloon Altitude Versus Time
32
H88-01 11 JANUARY 1988
115-
114-
A 113-LT
T 112-UDE
KF
109--
0 48 1'2 16 20 24
BALLOON LOCAL TIME (HRS)
Figure 17-4. ARGOS Balloon Altitude Versus Time
33
days in advance. Mail service while available was extremely slow. Receipt time was ten to fourteen
days.
12. CONCLUSIONS
After the return of the GRAD team to the CONUS two debriefings were held. The first of these was
a technical and information workshop and the second was a formal debriefing to the sponsoring
agencies.
The data presented showed that:
a) Excellent data were obtained concerning Supernova 1987A.
b) Large zero pressure balloons can be launched in the Antarctic environment.
c) The ARGOS tracking system provides an acceptable track for long-duration ballooning.
d) Solar panels are a viable alternative for batteries during the polar summer.
e) The S-band airborne telemetry/command system was an excellent method of data retrieval
and balloon control.f) New data were collected concerning the Antarctic stratosphere during the austral summer.
g) Long duration zero pressure balloon flights of several days are possible.
As a result of this highly successful venture, a community interest workshop, hosted by the
National Science Foundation (NSF), was held to explore the use of this technology for those in the
scientific community who are interested in long duration near space experiments from Antarctica.
34
Acknowledgements
Acknowledgements and credits are given to the organizations and the individual field teammembers that participated in project GRAD. The following listing in alphabetical order shows theorganizations and their functions and the individual field team members and their roles.
Organizations:Aerospace Corp ARGOS setup and tracking support.Air Force Geophysics Laboratory Operations and InstrumentationAntarctica Services Support and Gantry ConstructionDefense Advanced Research Projects Agency Experiment Program Management and ScienceDetachment 1, Air Force Geophysics Laboratory Integration, Logistics and LaunchNASA Goddard ScienceNational Science Foundation SupportNaval Support Forces Antarctica Ground, Meteorological and Flight SupportNew Mexico State University
Solar Energy Institute Solar PanelsPhysical Science Laboratory Telemetry
Office of Naval Research Accelerated Procurement and Money TransfersOklahoma State University Data Acquisition and TrackingUSAF/AFSC Space Division Sponsorship and Funding
University of Florida Science and Gondola
35
The Field Team:
SrA D. Blair AFGL Flight Electronics
Dr. R. Coldwell U of FL Data Analysis
Mr. J. Cooper NMSU/PSL Telemetry
Mr. K. Dallas AFGL Engineering/Logistics
Dr. G. Eichorn U of FL Science
Mr. D. Ely U of FL Science Electronics
Mr. J. Furnerola NMSU/PSL Parachutes/Hardware
Mr. J. Ground AFGL Launch Director/Meteorology
SMS A. Hodges Det 1. AFGL Launch/Administration
Mr. B. Holloway OSU Data Acquisition
Dr. G. Lacshe DARPA Program Sponsor and Science
Mr. J. Longshore Det 1, AFGL Launch Crew Chief
TSG J. McDonald AFGL Flight Electronics
Mr. J. Mcklsson U of FL Science Electronics
Dr. C. Rester U of FL Principal Investigator
Mr. B. Seagraves NMSU/PSL Telemetry
Mr. L. Skach OSU Data Acquisition
Dr. R. Starr Catholic U Data Analysis
Mr. W. Thorn AFGL Engineering/Flight Electronics
Dr. J. Trombka NASA Goddard Science
The AFGL Electronics Integration Team:
Mr. R. J. Cowie
SrA D. Blair
AIC C. Hice
TSG J. McDonald
A special acknowledgement is made to Mr. Hans Laping who died in March, 1988. Mr. Laping
was one of the senior electronics design engineers for the GRAD project. Fortunately he lived to see the
success of his efforts, which gave him great joy. He is sorely missed at AFGL.
36
Bibliography
Koga, R. (1988) private comnmunication.Koga, R. (1987) private communication.Nishimura, J. (1985) Feasibility studies of "Polar Patrol Balloon", Adv. Space Res. 5 (No. 1):87-90.
37
Abbreviations
AFGL Air Force Geophysics Laboratory
AGL Above ground level
ANS Antarctic Services
DARPA Defense Advanced Research Projects Agency
fpm Feet per minute
GRAD Gamma Ray Advanced Detector
MOA Memorandum of Agreement
MSL Mean Sea Level
NSF National Science Foundation
NMSU New Mexico State University
NSFA Naval Support Forces Antarctica
OSU Oklahoma State University
PSL Physical Science Laboratory
SAL Space Astromony Laboratory
SD Space Division
WSMR White Sands Missile Range
38
Contents1. INTRODUCTION2. SHIPMENTS3. SUPPORT FACILITIES FOR FLIGHT
PREPARATIONS4. LAUNCH-PAD OPERATIONS5. TELEMETRY GROUND STATION6. PAYLOAD RECOVERY
2. Logistics and Support for Balloon Flights from Antarctica
by
Kenneth Dallas
1. INTRODUCTION
In view of the remote location, exceptionally harsh climate, and limited facilities at.Antarctica
for large-scale balloon operations, the following description of our pioneering experience with GRADis presented with emphasis on those details that should aid experimenters in planning similar
programs.
2. SHIPMENTS
2.1 Scheduing
The December-January interval during summer is the only practicable time for stratospheric
balloon operations from Antarctica. Proposals must be submitted by June I of the year prior to the
projected field program. Moreover, it is imperative that experimenters allow sufficient time for pre-
deployment of equipment up to one year in advance. This need arises from the fact that only one
39
resupply ship arrives at McMurdo station per year, this at the end of the season (late January-early
February).
2.2 Transportation Options
There are three methods of getting mission equipment to Antarctica: sealift, Kilo-air and
SAAM:
Sealift is the preferred method for all equipment, especially heavy and bulky articles. The
shipment must be at the embarkation point by December of the year before the projected field-party
deployment. It will be loaded into standard Milvans (20-ft ISO Intermodal containers) by the National
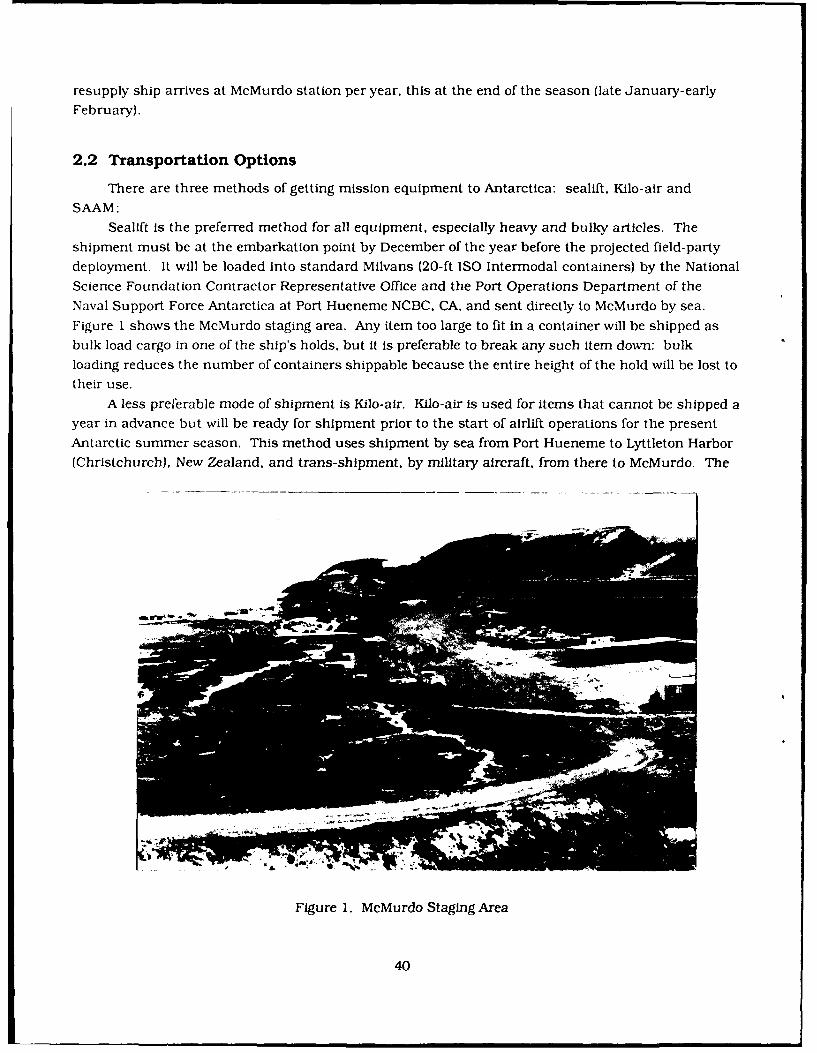
Science Foundation Contractor Representative Office and the Port Operations Department of theNaval Support Force Antarctica at Port Hueneme NCBC, CA, and sent directly to McMurdo by sea.
Figure 1 shows the McMurdo staging area. Any item too large to fit in a container will be shipped as
bulk load cargo in one of the ship's holds, but It is preferable to break any such item down: bulkloading reduces the number of containers shippable because the entire height of the hold will be lost to
their use.
A less preferable mode of shipment is Kilo-air. Kilo-air is used for items that cannot be shipped a
year in advance but will be ready for shipment prior to the start of airlift operations for the present
Antarctic summer season. This method uses shipment by sea from Port Hueneme to Lyttleton Harbor
(Christchurch), New Zealand, and trans-shipment, by military aircraft, from there to McMurdo. The
Figure 1. McMurdo Staging Area
40
least preferable method of shipment is by SAAM, Special Activity Air Mission, via military aircraft
d:rect from the United States to the ice. This mode requires advanced planning with the Naval
Support Force Antarctica and the Military Airlift Wing at Travis Air Force Base. The need to
cocrdinate with the wing at Travis arises from the fact that they are the only C-141-equipped unit
qualified to land on the Antarctic ice. These aircraft are only capable of landing on the ice untilapproximately the end of November, after which the ice no longer has the strength to support their
weight.
The other aircraft used for support are C-130's - from the 40 Squadron, Royal New Zealand AirForce, who make wheeled landings on the ice until approximately mid-December, and from the
Antarctic Development Squadron Six, United States Navy, who make ski-equipped landings
throughout the season.
2.3 Packaging
Due to fuel requirements for the longest leg of a C-141 flight from the United States, maximumload weight must be kept below 55,000 lb. Also, the maximum number of standard air cargo pallets
capable of being loaded on a C- 141 is 14. Additional information such as maximum dimensions, floorloadings, loading restrictions, etc., can be obtained from Air Force Systems Command Handbook for
Air Transportability, DH 1-11, written by the Aeronautical Systems Division (ASD) at Wright-
Patterson AFB, OH. All equipment that must be floor-loaded, and some that is to be loaded on palletsneeds to be certified for air transportability by ASD prior to shipment.
2.4 Transport of Equipment to Antarctica
Due to AFGL's short lead time, 6 months, to obtain gamma radiation from Supernova 1987Aduring January/Febuary 1988, the GRAD program used all three modes of transport. Kilo-air was used
to ship four helium containers by sea to New Zealand and from there to the ice via C-130 and C-141
flights, as the schedule permitted. These containers are 8-ft wide x 4-ft high x 20-ft long and weigh20,000 lb. Because the testing and systems integration activities were on-going into November 1987 it
was necessary to ship the remainder of the support equipment via a SAMM mission directly from the
AFGL Balloon R&D Test Facility at Holloman AFB, NM to the ice. This load included a 17,000-lblaunch arm, the gondola with the experiment and balloon-control hardware installed, solar panels,
telemetry stations and test/launch support equipment. The final packed load consisted of 9 1/2
pallets weighing approximately 44,000 lb. (Also on the plane were two turboprop engines which were
later used by VXE to recover a C- 130 aircraft that had been left on the polar plateau 12 years earlierwith damage sustained during an accident on takeoff.)
2.5 Return Transport to the U.S.A
The GRAD shipment via sea lift from McMurdo to Port Hueneme. CA consisted of two 20-ft
Milvans (ISO containers) containing all the ground support equipment and telemetryinstrumentation, each with a gross weight of approximately 20,000 Ib; one 20-ft ISO flat rack with the
balloon launch arm, gross weight 19,000 Ib; and the gondola with the detector in a 9 ft x 9 ft x 9 ft crate
41
weighing 1200 lb which was loose-loaded in the hold of the ship while the three containers were deck-
loaded. Also included in the return shipment were three of the four helium containers - the fourth was
retained at Mc Murdo to test their applicability to year-round use instead of bottles. After completion
of the program, space limitations on the C- 130's (due to the number of people leaving the ice for station
close-out) made it necessary to send by ship to New Zealand 10 small packing cases that were intended
for return to the United States by air. (This load of electronic test equipment and computers was
urgently needed to support other balloon-borne test programs.) It came from New Zealand by air
freight to Hanscom AFB, MA and arrived about the 15th of April, 1988. The container shipment
arrived at Holloman AFB, NM during the first week in May. The gondola was shipped to Hanscom by
truck from the port and also arrived during the first week in May.
3. SUPPORT FACILITIES FOR FLIGHT PREPARATIONS
3.1 Shops, Tools and Equipment
Support facilities exist at McMurdo, with carpentry and welding shops, but it is advisable to
bring anything that could possibly be needed since this support can be limited by resource non-
availability. If, after arriving on the ice an unforeseen need arises for tools or equipment, the Berg
Field Center at McMurdo can sometimes supply them. An exception is electronic test equipment
which must be brought by the experimenter. Also, plan on bringing any spare parts that could
possibly be needed - there is no supply service.Work space is at a premium at McMurdo, and is even less available at Williams Field, therefore
the minimum space requirements to accomplish the job should be carefully determined. Again,
planning with the Polar Program Branch of NSF and their support contractor is vital, so that theprogram needs are known far enough in advance to allow time to set up facilities and ship in materials
to support all the needs.
3.2 Housing for GRAD Payload Tests
We were extremely lucky to be able to use the new, heavy-vehicle maintenance building at
McMurdo for final payload equipment tests. This building was available because it was still under
construction and was not yet being used for vehicle repairs. This facility is a multi-bay building with
overhead cranes and very large garage doors which greatly facilitated the handling of the gondola. A
polyethylene-covered frame was erected inside the building to provide a clean room around the
gondola, to preclude dust contamination of the radiation detector during the background-radiation
calibrations. After the gondola was transported to the launch site at Williams Field it was housed
temporarily in a garage for tracked-vehicle maintenance. This building did not have sufficient height
to suspend the gondola for any further pointing-control tests, so only final electrical checks were
performed there.
After the payload had been flown and recovered from the polar plateau it was again temporarily
housed at Williams Field so that critical post-flight tests could be performed. All equipment was then
returned to the heavy-vehicle maintenance building at McMurdo and packed for shipment back to the
United States.
42
3.3 Materials-Handling Vehicles
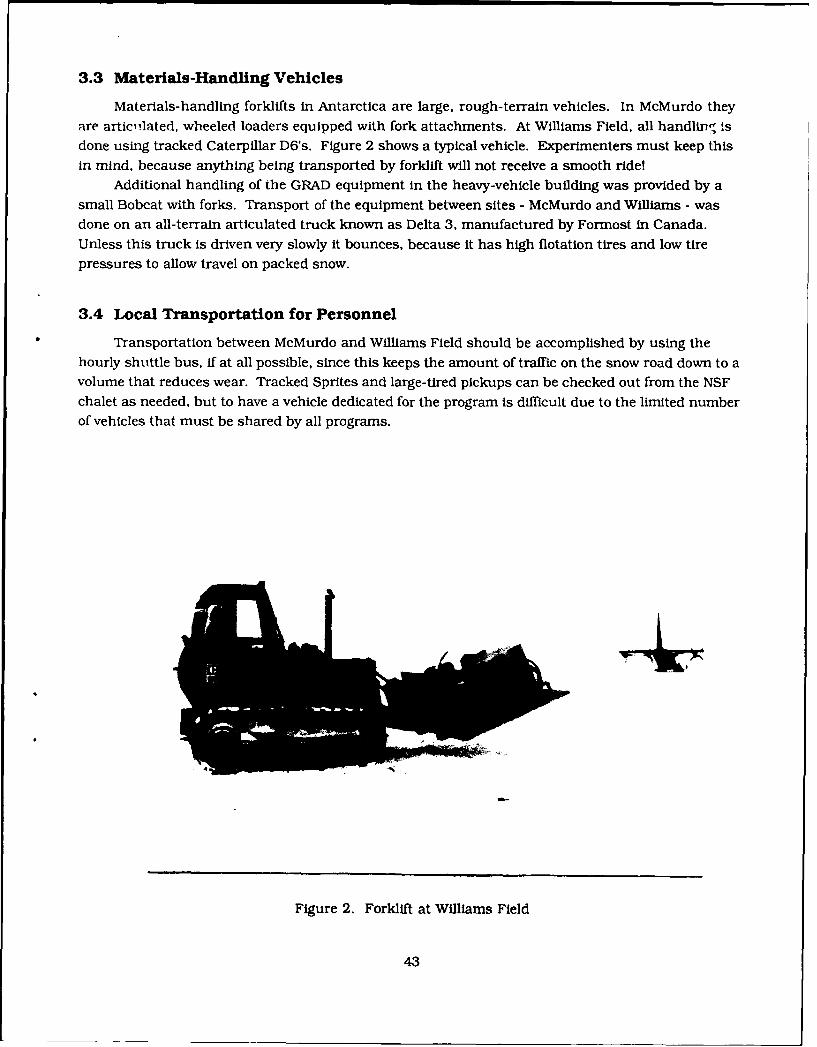
Materials-handling forklifts in Antarctica are large, rough-terrain vehicles. In McMurdo they
are artic,,lated, wheeled loaders equipped with fork attachments. At Williams Field, all handling Isdone using tracked Caterpillar D6's. Figure 2 shows a typical vehicle. Experimenters must keep thisin mind, because anything being transported by forklift will not receive a smooth ride!
Additional handling of the GRAD equipment in the heavy-vehicle building was provided by a
small Bobcat with forks. Transport of the equipment between sites - McMurdo and Williams - wasdone on an all-terrain articulated truck known as Delta 3, manufactured by Formost in Canada.
Unless this truck is driven very slowly it bounces, because it has high flotation tires and low tirepressures to allow travel on packed snow.
3.4 Local Transportation for Personnel
Transportation between McMurdo and Williams Field should be accomplished by using thehourly shuttle bus, if at all possible, since this keeps the amount of traffic on the snow road down to avolume that reduces wear. Tracked Sprites and large-tired pickups can be checked out from the NSF
chalet as needed, but to have a vehicle dedicated for the program is difficult due to the limited number
of vehicles that must be shared by all programs.
Figure 2. Forklift at Williams Field
43
4. LAUNCH-PAD OPERATIONS
4.1 Effects of Antarctic Environment on Launch Equipment
The helium racks were mounted on a 20-ton capacity sled which allowed movement on thepacked snow of the launch pad. The launch arm was mounted on a smaller sled which was thenprepositioned on the launch pad, and tied down to dead-man anchors made of buried telephone polesthat controlled the jumping reaction caused by release of the balloon.
Problems due to the cold and snow occurred in both the launch arm and the helium racks:The problems with the launch arm were caused by snow that had blown in under the frame and
caked around the release arm catch and snubber brake. This was relieved by directing hot air from aHerman-Nelson heater under the vehicle for two hours, melting out the snow pack. In this way thelaunch arm was made usable. The release-arm motion was slow - apparently because the fluid in thesnubber brake had stiffened up from the cold - but this did not affect the launch operation. Subsequentinvestigation revealed that there was an ice/snow pack in a guide-pin slot that engages the snubberbrake, causing the brake to actuate early. For future operations it is recommended that the undersideof the launch arm be enclosed to preclude the accumulation of snow and ice in these mechanisms. Theproblems with the helium racks were due to contraction of fittings from the cold. Pre-launch checksof the helium pressure found that two of the 32 cylinders had bled down to 300 psig from an average of2700 psig. This did not seriously affect operations because sufficient volume remained to provide twoballoon inflations if necessary. Also, a number of individual cylinder valve-cap shells neededtightening to stop the valves from leaking when open. The last problems occurred during inflation:leaks in the inflation-hose fittings were caused by additional cooling from pressure reduction and gasexpansion, and one 4-cylinder manifold valve froze up for the same reason. In future operations, allvalve shells should be tightened on arrival in Antarctica, and careful checks should be performed onsetup for inflation to ensure that all open cylinders and manifolds are providing helium flow.
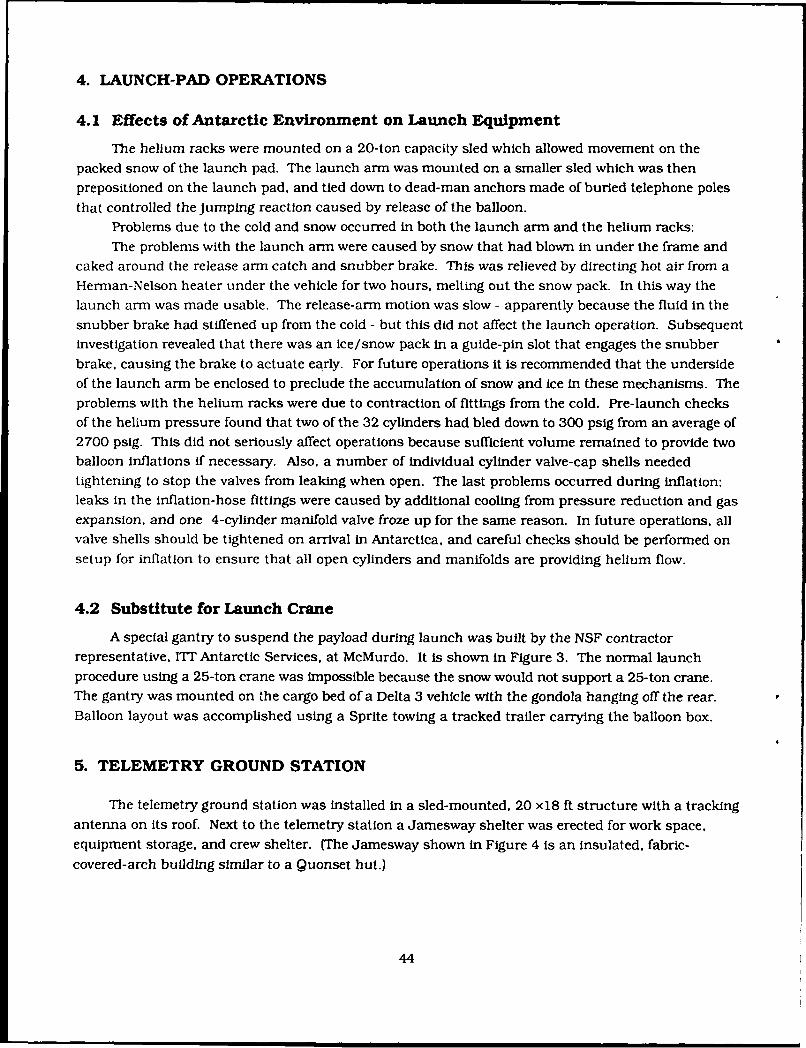
4.2 Substitute for Launch Crane
A special gantry to suspend the payload during launch was built by the NSF contractorrepresentative, IT" Antarctic Services, at McMurdo. It is shown in Figure 3. The normal launchprocedure using a 25-ton crane was impossible because the snow would not support a 25-ton crane.The gantry was mounted on the cargo bed of a Delta 3 vehicle with the gondola hanging off the rear.Balloon layout was accomplished using a Sprite towing a tracked trailer carrying the balloon box.
5. TELEMETRY GROUND STATION
The telemetry ground station was installed in a sled-mounted, 20 x18 ft structure with a trackingantenna on its roof. Next to the telemetry station a Jamesway shelter was erected for work space,equipment storage, and crew shelter. (The Jamesway shown in Figure 4 is an insulated, fabric-covered-arch building similar to a Quonset hut.)
44
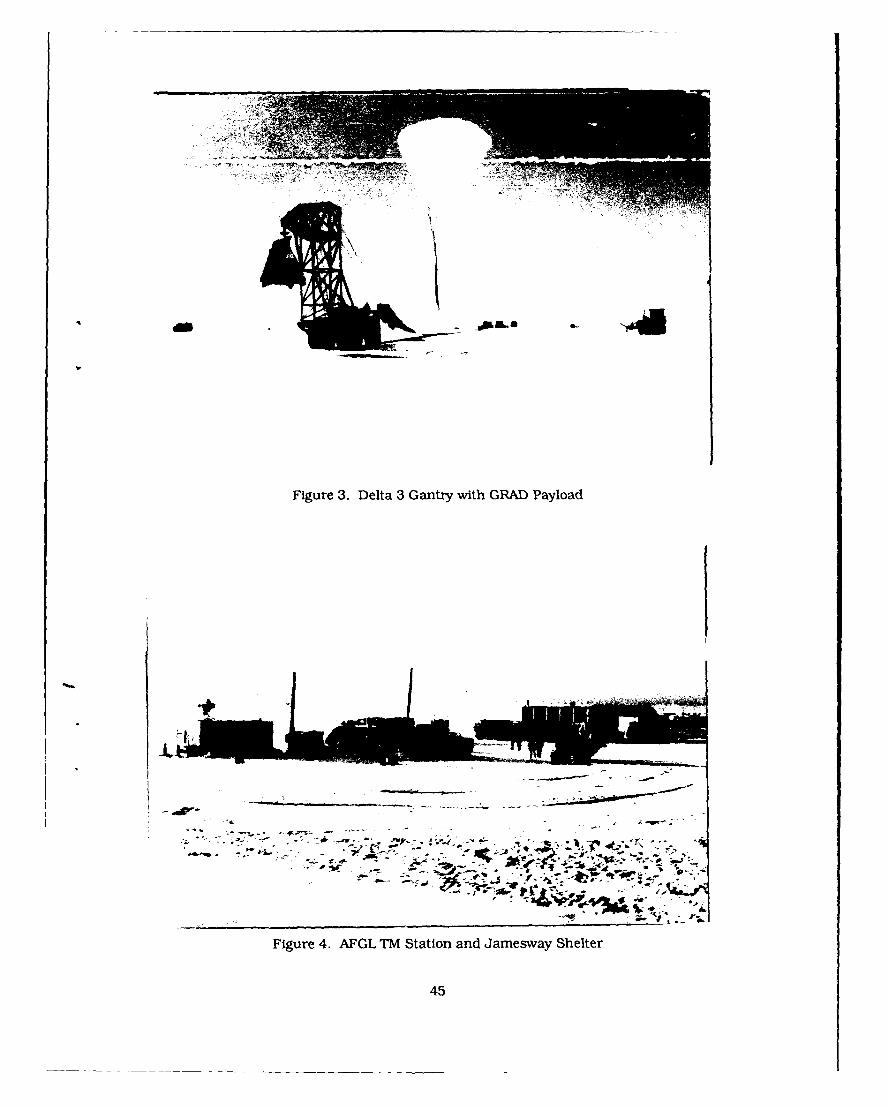
Figure 3. Delta 3 Gantry with GRAD Payload
-477
Figure 4. AFOL TM Station and Jarnesway Shelter
45
6. PAYLOAD RECOVERY
6.1 Impact Location
Recovery of any balloon payload cannot be guaranteed, but all reasonable effort will beattempted to effect recovery. The primary factors that affect recovery are the snow conditions at theimpact point and the location on the continent. Crevasse fields, soft, or exteremely ridged snow willpreclude landing of C- 130 aircraft on the polar plateau, and the distance from McMurdo or Pole andthe payload weight will affect the range of the C- 130's.
6.2 Planning and Rehearsal
The recovery operation should be planned in advance and actually rehearsed, because the timeon the ground at the recovery site may be severely limited by aircraft fuel requirements. Recoveryrequires close attention to designing the payload, especially in the areas of dimensions, howequipment is mounted, and priorities of what pats arc expendable.
The average altitude 3f the polar plateau is 10,000 feet above sea level: work Is extremelyfatiguing due to the lack of oxygen at those altitudes. One of the NSF requirements for GRAD recoverywas that a Navy medical corpsman be on board whose only duty was to watch crew members foroxygen starvation. Also, it must be kept in mind that the recovery crew will be wearing bulkyclothing; all equipment from the gondola should be designed to be manipulated while wearingmittens. Most important of all, don't design a gondola that won't fit through the doors of the aircraft!(Consult AFSC DH 1-11.)
6.3 Recovery of GRAD
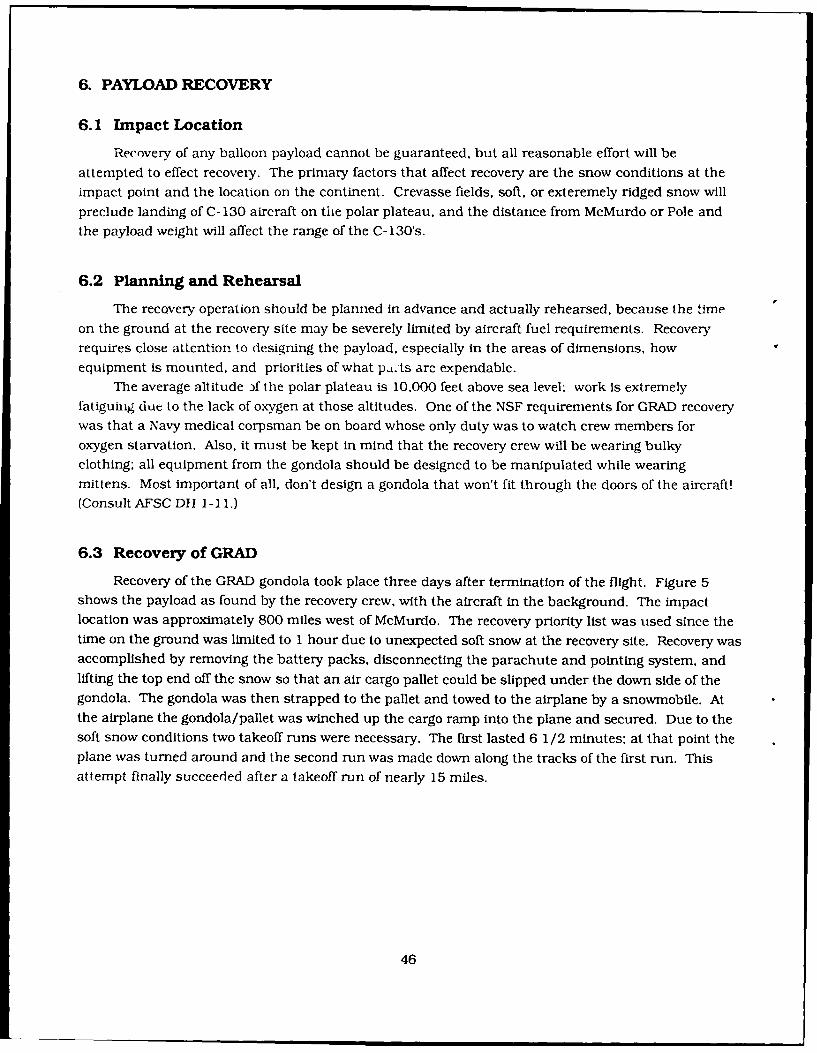
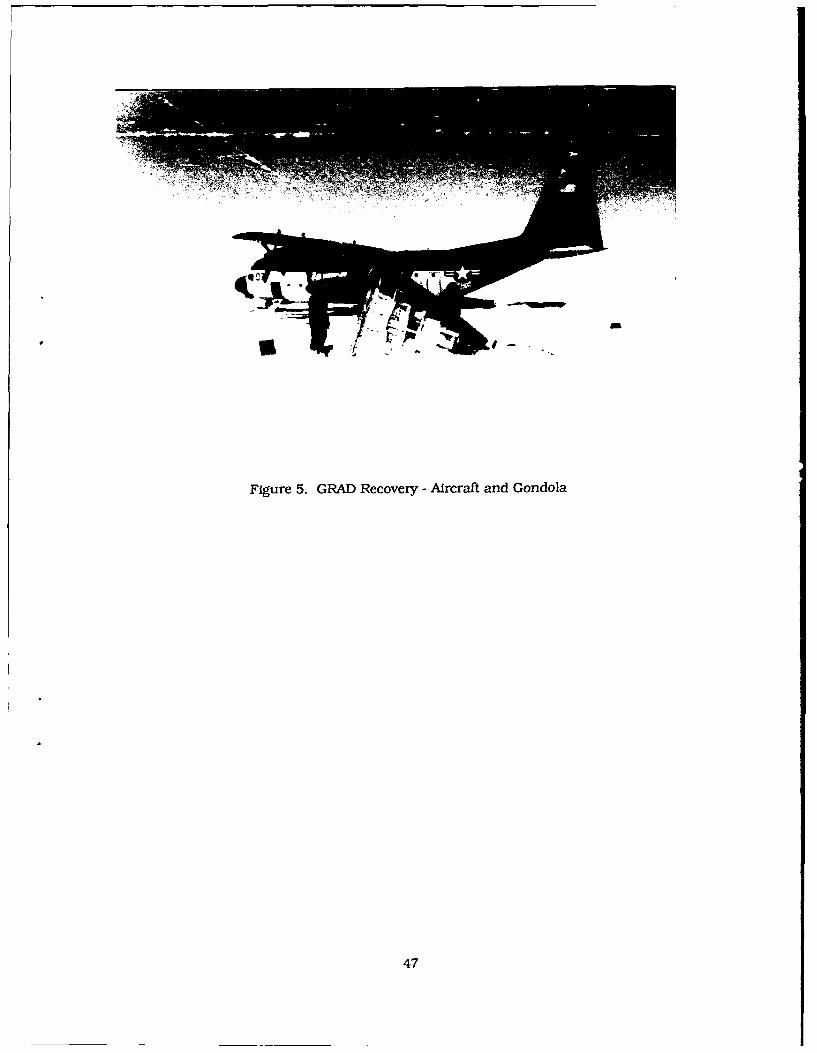
Recovery of the GRAD gondola took place three days after termination of the flight. Figure 5shows the payload as found by the recovery crew, with the aircraft in the background. The impactlocation was approximately 800 miles west of McMurdo. The recovery priority list was used since thetime on the ground was limited to 1 hour due to unexpected soft snow at the recovery site. Recovery wasaccomplished by removing the battery packs, disconnecting the parachute and pointing system, andlifting the top end off the snow so that an air cargo pallet could be slipped under the down side of thegondola. The gondola was then strapped to the pallet and towed to the airplane by a snowmobile. Atthe airplane the gondola/pallet was winched up the cargo ramp into the plane and secured. Due to thesoft snow conditions two takeoff runs were necessary. The first lasted 6 1/2 minutes; at that point theplane was turned around and the second run was made down along the tracks of the first run. Thisattempt finally succeeded after a takeoff run of nearly 15 miles.
46
9m
Figure 5. GRAD Recovery - Aircraft and Gondola
47
Contents1. INTRODUCTION2. SYSTEM REQUIREMENTS3. GONDOLA CONFIGURATION4. COMMAND UPLINKS5. SOLAR PANELS6. AFGL INSTRUMENTATION PACKAGES7. SYSTEMS TESTSAppendix A: Command ListsAppendix B: Telemetry Channel Assignments
3. GRAD Payload Integration and Flight System Integration
by
Ralph J. Cowle
1. INTRODUCTION
The AFGL balloon support requirements for the GRAD payload were first defined in detail at a
meeting at the University of Florida Space Astronomy Laboratory In Gainesville, Florida on 19
August 1987. At that meeting personnel from the New Mexico State University Solar Institutepresented three possible payload power system configurations for consideration. Ajoint decision was
made to proceed with a solar-panel battery-charging system described in Sections 2.3 and 5.0. The
"housekeeping" status monitors for the experiment and power systems and a command-control
interface to the AFGL balloon control system for the GRAD experiment were defined. The AFGL data-
acquisition encoder would be configured to provide as many monitors as all felt necessary for
adequate in-flight assessment of flight-system health. It should also provide all data necessary to
identify malfunctions and perhaps permit their correction via uplink radio command.
49
2. SYSTEM REQUIREMENTS
It was determined that apart from vehicle control, the GRAD experiment would need 28
individual command closures: 22 momentary, and 6 latching on/off functions. The experimentwould also need 24 digital bits to indicate on/off status of experiment control, battery solar-charge
controllers, dewar heaters, sun indicator, and rotator power. The experiment and balloon controlcommands are listed in the Appendix, Figures A- I and A-2. Figure B- I shows the digital subframe
assignments.
2.1 Telemetry Channels
The telemetry analog channel requirement could be satisfied by 23 channels as follows:
Battery # 1- 3 To monitor temperature, voltage and current
Battery #4 -3 Same as Battery #1Solar Array - 11 For 3 temperature. 6 current, 1 voltage and 1 insolation measurementsGRAD experiment - 6 temperature measurements from National Semiconductor, solid state
LM-335 devices that provide a 10-millivolt per degree Kelvin linear scale.
Figure B-2, Appendix B, lists the analog channel assignments.
2.2 Batteries
The payload power system was established as 4 battery packs made up of several silver-zinc
batteries, Type BB-622/U, each capable of providing 80 ampere hours at a nominal 6 volts DC. Five ofthese batteries would be series connected to yield a nominal 28-volt DC power pack. Four such packswould be utilized. Battery Packs # 1 and #4 would power the GRAD experiment and rotator, while
battery packs #2 and #3 would power the AFGL primary and back-up flight-control and data-
acquisition telemetry sytems. respectively.
2.3 Solar Array
Each of the four battery packs would have a charge controller fed from the solar panel array. Forreliability and ease of handling, the solar array was divided into two sections. The upper array halfwould charge battery packs # 1 and #3, while the lower array half would charge battery packs #2 and
#4. Solar power was estimated to provide about 1250 to 1300 watts per square meter at balloon float
altitude. The array was estimated to be about 70 square feet in area and weigh about 280 pounds. All
four charge controllers would be identical and a total of six would be built; two would be spares.
2.4 Interface Wiring
The GRAD experiment consisted of several individual modules interconnected by cables.Integration of these modules with the AFGL balloon control and data acquisition/transmission
system and to the power source batteries and solar array presented a difficult interface wiring
problem.
50
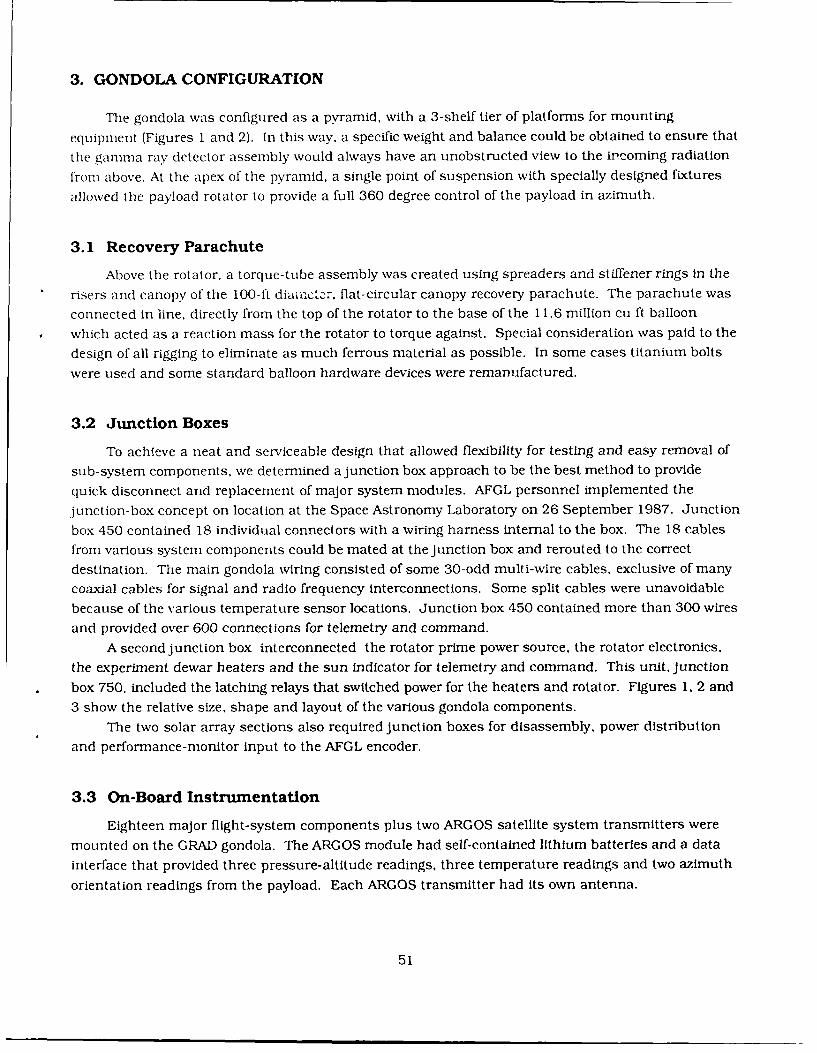
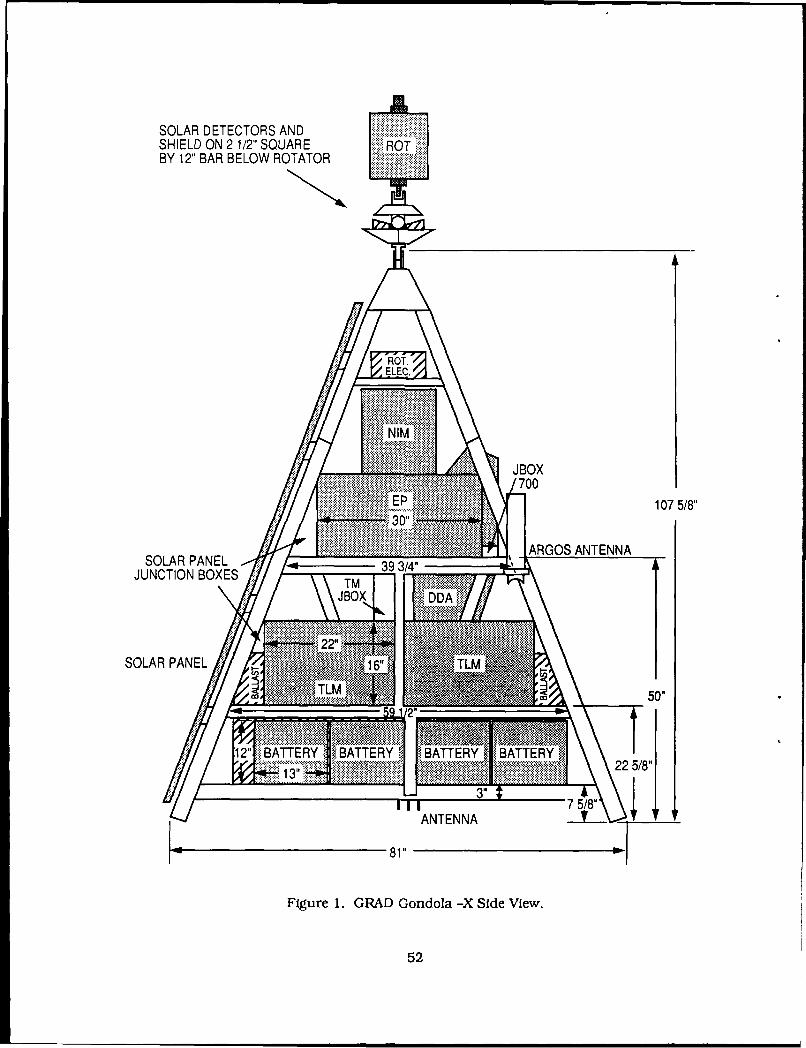
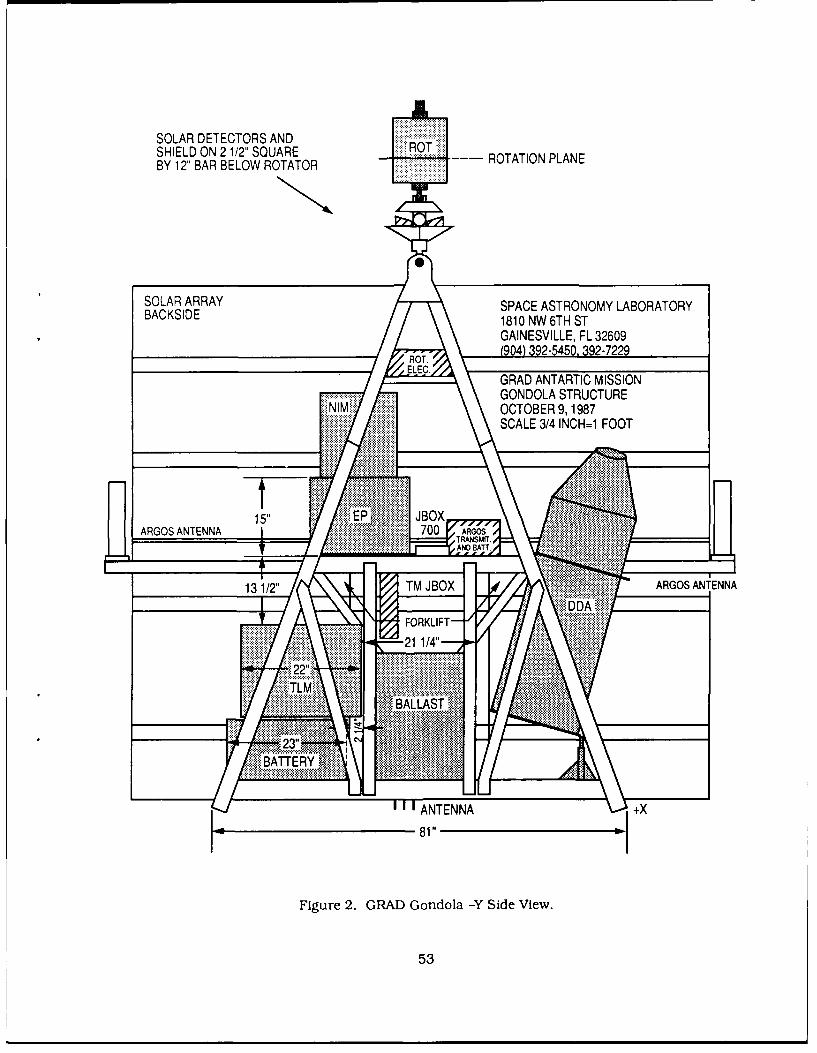
3. GONDOLA CONFIGURATION
The gondola was configured as a pyramid, with a 3-shelf tier of platforms for mounting
equipment (Figures 1 and 2). In this way, a specific weight and balance could be obtained to ensure that
the gamma ray detector assembly would always have an unobstructed view to the incoming radiation
from above. At the apex of the pyramid, a single point of suspension with specially designed fixtures
allowed the payload rotator to provide a full 360 degree control of the payload in azimuth.
3.1 Recovery Parachute
Above the rotator, a torque-tube assembly was created using spreaders and stiffener rings in the
risers and canopy of the 100-ft diuiJtr, flat-circular canopy recovery parachute. The parachute wasconnected in line, directly from the top of the rotator to the base of the 11,6 million cu ft balloonwhich acted as a reaction mass for the rotator to torque against. Special consideration was paid to the
design of all rigging to eliminate as much ferrous material as possible. In some cases titanium boltswere used and some standard balloon hardware devices were remanufactured.
3.2 Junction Boxes
To achieve a neat and serviceable design that allowed flexibility for testing and easy removal ofsub-system components, we determined a junction box approach to be the best method to providequick disconnect and replacement of major system modules. AFGL personnel implemented thejunction-box concept on location at the Space Astronomy Laboratory on 26 September 1987. Junctionbox 450 contained 18 individual connectors with a wiring harness internal to the box. The 18 cablesfrom various system components could be mated at the junction box and rerouted to the correctdestination. The main gondola wiring consisted of some 30-odd multi-wire cables, exclusive of manycoaxial cables for signal and radio frequency interconnections. Some split cables were unavoidablebecause of the various temperature sensor locations. Junction box 450 contained more than 300 wiresand provided over 600 connections for telemetry and command.
A second junction box interconnected the rotator prime power source, the rotator electronics,the experiment dewar heaters and the sun indicator for telemetry and command. This unit, junction
box 750. included the latching relays that switched power for the heaters and rotator. Figures 1, 2 and3 show the relative size, shape and layout of the various gondola components.
The two solar array sections also required junction boxes for disassembly. power distribution
and performance-monitor input to the AFGL encoder.
3.3 On-Board Instrumentation
Eighteen major flight-system components plus two ARGOS satellite system transmitters weremounted on the GRAD gondola. The ARGOS module had self-contained lithium batteries and a datainterface that provided three pressure-altitude readings, three temperature readings and two azimuth
orientation readings from the payload. Each ARGOS transmitter had Its own antenna.
51
SOLAR DETECTORS ANDSHIELD ON 2 1/2" SQUAREBY 12" BAR BELOW ROTATOR
ROT.ELEC.
..... .. .JBOXP107 5/8"
SOLAR PANEL ARGOS ANTENNA
JUNCTION BOXES
SOLAR PANEL . i16 l #
L~~2 I5II/858"
ANTENNA
Figure 1. GRAD Gondola -X Side View.
52
SOLAR DETECTORS ANDSHIELD ON 2 1/2" SQUAREBY 12" BAR BELOW ROTATOR ROTATION PLANE
SOLAR ARRAY SPACE ASTRONOMY LABORATORYBACKSIDE 1810 NW 6TH ST
i GAINESVILLE, FIL 32609
ROT.(90) 39-540, 92-7229
Fiur GRAD ANTARTIC MISSION53ONDOLASTRUCTURENI OCTOBER 9, 1987
SCALE 3/4 INCH=I FOOT
ARGOS ANTENNA 70 RO
13 1/2" TM JBOX " ARGOS ANTI NNA
FORKILIFT-Y--21 1/4" -
BALAS
I I I ANTENNA +
81"
Figure 2. GRAD Gondola -Y Side View.
53
78" '
BALLAST
78"D
Figre3.GRA GnLaTpEVew
54D
3.3.1 ANTENNAS
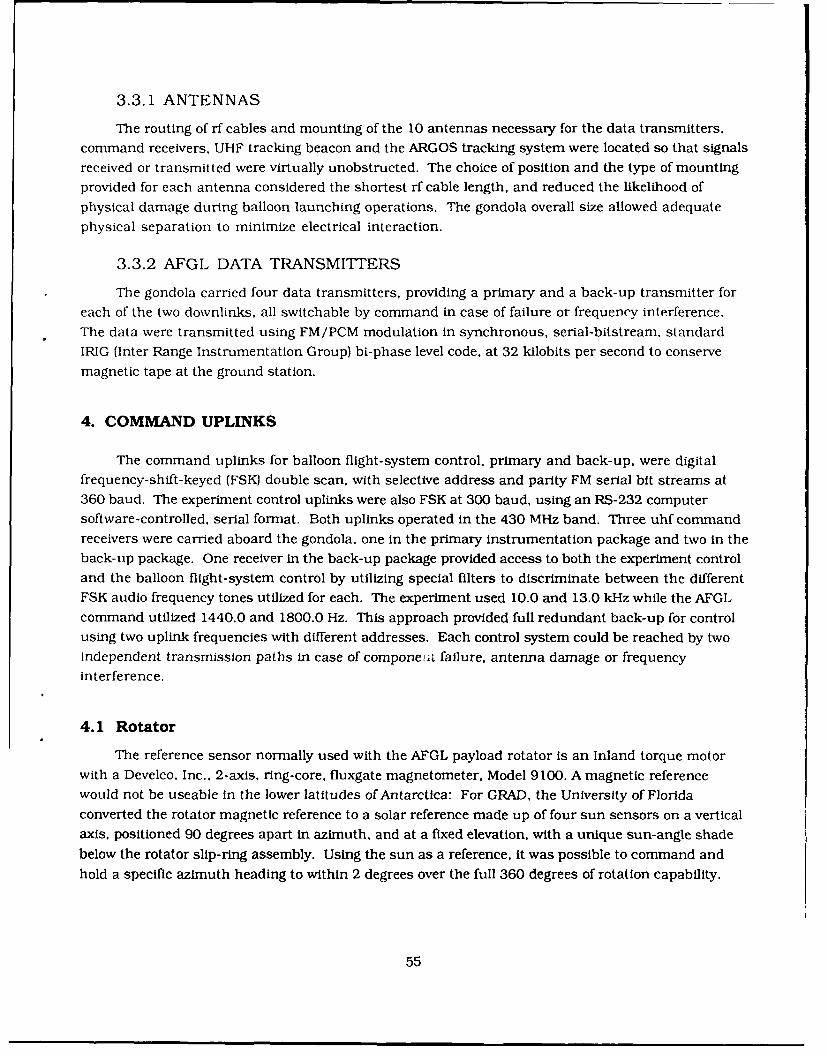
The routing of rf cables and mounting of the 10 antennas necessary for the data transmitters,command receivers, UHF tracking beacon and the ARGOS tracking system were located so that signalsreceived or transmitted were virtually unobstructed. The choice of position and the type of mountingprovided for each antenna considered the shortest rf cable length, and reduced the likelihood ofphysical damage during balloon launching operations. The gondola overall size allowed adequatephysical separation to minimize electrical interaction.
3.3.2 AFGL DATA TRANSMITTERS
The gondola carried four data transmitters, providing a primary and a back-up transmitter foreach of the two downlinks, all switchable by command in case of failure or frequency interference.The data were transmitted using FM/PCM modulation in synchronous, serial-bitstream, standardIRIG (Inter Range Instrumentation Group) bi-phase level code, at 32 kilobits per second to conservemagnetic tape at the ground station.
4. COMMAND UPLINKS
The command uplinks for balloon flight-system control, primary and back-up, were digitalfrequency-shift-keyed (FSK) double scan, with selective address and parity FM serial bit streams at360 baud. The experiment control uplinks were also FSK at 300 baud, using an RS-232 computersoftware-controlled, serial format. Both uplinks operated in the 430 MHz band. Three uhf commandreceivers were carried aboard the gondola, one in the primary instrumentation package and two in theback-tip package. One receiver in the back-up package provided access to both the experiment controland the balloon flight-system control by utilizing special filters to discriminate between the differentFSK audio frequency tones utilized for each. The experiment used 10.0 and 13.0 kHz while the AFGLcommand utilized 1440.0 and 1800.0 Hz. This approach provided full redundant back-up for controlusing two uplink frequencies with different addresses. Each control system could be reached by twoindependent transmission paths in case of componetat failure, antenna damage or frequencyinterference.
4.1 Rotator
The reference sensor normally used with the AFGL payload rotator is an Inland torque motorwith a Develco, Inc., 2-axis, ring-core, fluxgate magnetometer, Model 9100. A magnetic referencewould not be useable In the lower latitudes of Antarctica: For GRAD, the University of Floridaconverted the rotator magnetic reference to a solar reference made up of four sun sensors on a verticalaxis, positioned 90 degrees apart in azimuth, and at a fixed elevation, with a unique sun-angle shadebelow the rotator slip-ring assembly. Using the sun as a reference, it was possible to command andhold a specific azimuth heading to within 2 degrees over the full 360 degrees of rotation capability.
55
5. SOLAR PANELS
The solar panels were SX-20 photovoltaic modules manufactured by the Solarex Corp., RockvilleMaryland. Two sets of fifteen, 6-volt modules formed the array in the final flight configuration. Eachsection of the array had an insolation sensor (pyrometer) to measure the incident solar energy. Aphotocell sensor (sun indicator) with a very narrow field of view had a special mask (slit) thatprovided a voltage output whenever the solar panels faced the sun for optimum exposure within about1 degree in azimuth. The solar-charging system was designed and built by the University of NewMexico Solar Energy Institute of Las Cruces, New Mexico.
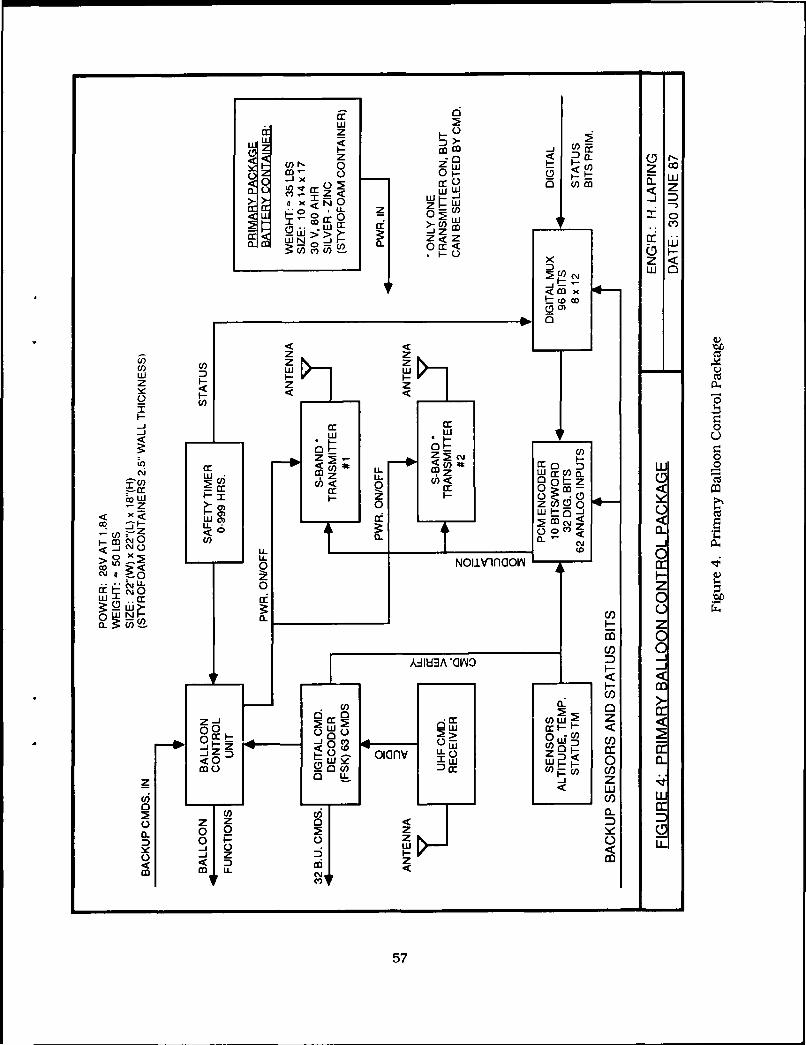
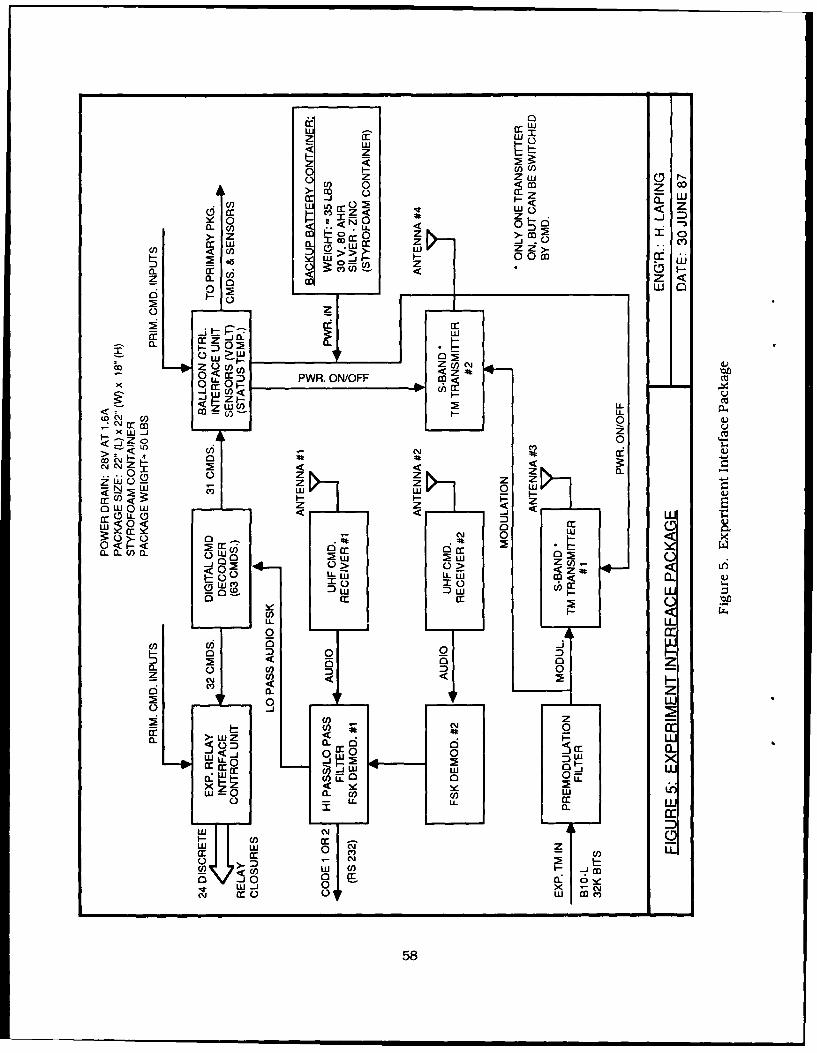
6. AFGL INSTRUMENTATION PACKAGES
Figures 4 and 5 are block diagrams of the AFGL primary and back-up instrumentation packages.Because of the very tight schedule imposed by the logistics for the GRAD Antarctic expedition, it soonbecame obvious that considerable time would be saved if we could take an existing flight system andmodify it to accomodate the GRAD requirements. We modified an AFGL flight system that had beenflown to support a balloon-borne laser experiment, and fabricated a duplicate set of equipment asspares. This approach saved engineering time because most drawings already existed.
6.1 Flight Timers
A few unusual changes to the routine AFGL balloon system design concepts were necessary: Thestandard flight timer, which is normally settable to a maximum of 99 hours for flight duration, had tobe modified to provide a maximum of 999 hours, and still retain all other standard features such asspeed-up, add-time, and time-remaining status readout capability for telemetry. Circuitry andcomponent changes were necessary, and additional testing was done to verify timer accuracy over theexpected duration and anticipated ambient temperature cycle.
6.2 Independent Flight Termination Circuit
An independent, aneroid cell-controlled, last resort type, flight termination circuit was added toensure that the mission would be properly terminated if the balloon with payload attached, should
descend to the 40,000-ft pressure-altitude level. This independent flight termination circuit was addedto the back-up balloon control unit and provided with an arm/disarm command and telemetry statusindicator. For activation, it was independently powered by a long-life lithium battery with sufficientcapacity to fire the squibs in the payload-separation-device under all anticipated environmentalconditions. Activation of this circuit would prevent the possibility of a derelict balloon, floatingaimlessly over the Antarctic, a potential hazard to aircraft.
56
6iw
H -J
LL J ::a. Co O Eru
e- z ~ WW- (9Z1 Z~/ 00
H -
(jL Zf 'iZCLL
>U a x<F- ZUrH rcr z z c
0o H
Hn 0 (
-z~ zO 0<QC9<j
WH0)
< LLto
~ __ __ _ zj cz
in-J
zI F-F-c
Ian z~z
C,,
F57
z zw
0 0 z>-m ca a:EL-L
ZU<zz
_ z0b 0
a- a:Z .
crz
0 7!
LL T-D PWR. ON/OFF o<z0 CC O L 1
N a:m caQ
< - o U) 0Qc
- z z 0 z-N W w w0W
< F-ir. U- . .0r NL 0 cUJ
0 w4
w ai a:<
. LLz CILI.D C
0 4 a06 6
W0D
5 0~
7- CO
w za: a: IL000 LL
W0 CL l0CN LL U. W cr
58 a

6.3 Automatic "Ballast Floor"
One additional change was made on location in Antarctica to provide an automatic "ballast
floor", using the analog output voltage from the on-board high-altitude pressure transducer (0 to 0.5
psia) as a reference. A comparator circuit was installed and set that whenever the balloon descended
below 100.000 feet, the ballast system was enabled for 1 minute out of 30 minutes. If at the end of 30
minutes, the balloon was below 100,000 feet, ballast would be poured for another minute, and so on.
This circuit was also provided with an arm/disarm command and telemetry indicator. This changewas implemented to ensure that the balloon system would stay aloft at least until all the pourable
ballast was expended, or until the 40,000-ft, last resort termination circuit activated to end the
mission.
6.4 Conclusions
The use of on-hand, flight-proven equipment with design modifications proved in the long run tohave merit, as it allowed us to keep on schedule. Most of the changes occurred in harness wiring and in
external cables. A special command Interface relay control box was designed and built to match the
GRAD requirements specifically. This new module was tailored to fit existing harness wiring andprovided 31 redundant circuit closures. Two different command channels and independent relayswere provided for each function to obviate the effects of component failure. All commands could be
accessed via either primary or back-up command links, thus ensuring positive system control as longas the balloon was within line-of-sight range of either a tracking aircraft or a suitably equippedground station.
7. SYSTEMS TESTS
On 21 October 1987, two complete sets of instruments were ready and available to begin altitude-
chamber testing at the Holloman facility. Preliminary testing with the GRAD experiment had beenfully successful and no serious rf interference had been noted. Successful open-loop telemetry checkshad been completed and all systems fully integrated, including the solar panel arrangement. The
altitude chamber tests were successfully completed between 26 and 30 October. The all-up, full-system
test was completed successfully on 3 November. On 13 November the flight system with spares was on
the way via C-141 special airlift to McMurdo Base, Antarctica - a little more than 60 days from theactual start of the GRAD payload integration effort.
59
Appendix A:Command Lists
Figures A- 1 and A-2 show the command lists for the experiment and balloon control. Thecommand numbers indicate individual channels and the first digit indicates the address code. Thiscommand system designed and built by AFGL can utilize address codes 1 through 9 for any uplinkfrequency.
61
EXPERIMENT COMMANDS
Project : GRAD Date 17 Oct 87Receiver Type: Vector / ConicRX #1: 423.6 MHz RX #2: 437.5 MHz RX #3: 437.5 MHz
CMD FUNCTION
132-232 GRAD Power ON133-233 GRAD Power ON (R)134-234 GRAD Power OFF135-235 GRAD Power OFF (R)
136-236 SYSTEM RESET137-237 SYSTEM RESET (R)
138-238 SWAP CPU139-239 SWAP CPU (R)
140-240 ROTATOR ON141-241 ROTATOR OFF142-242 ROTATOR ON (R)143-243 ROTATOR OFF (R)
144-244 HEATER ON145-245 HEATER OFF146-246 HEATER ON (R)147-247 HEATER OFF (R)
148-248 HV STANDBY ON149-249 HV STANDBY OFF150-250 HV STANDBY ON (R)151-251 HV STANDBY OFF (R)
152-252 BGO VETO DISABLE153-253 BGO VETO ENABLE154-254 BGO VETO DISABLE (R)155-255 BGO VETO ENABLE (R)
156-256 SELECT FSK CODE #1 OUTPUT157-257 SELECT FSK CODE #2 OUTPUT
158-258 SHUTDOWN OVERRIDE OFF159-259 SHUTDOWN OVERRIDE ON160-260 SHUTDOWN OVERRIDE OFF (R)161-261 SHUTDOWN OVERRIDE ON (R)
162-262 40 Kft ANEROID ARM163-263 40 Kft ANEROID DISARM
Figure A-I. Command List for Experiment
62
Balloon Control Commands
Project : GRAD Date : 17 Oct 87Receiver Type: Vector / ConicRX #1: 423.6 MHz RX #2: 437.5 MHz RX #3: 437.5 MHz
CMD FUNCTION
101-201 TX #1 ON (in Prim, Bln TM)102-202 TX #1 OFF
103-203 Add 10 hr to Flight Timer (in Prim)
104-204 BURST Switch ARM (Prim)105-205 BURST Switch DISARM
106-206 IMPACT Feet ARM (Prim)
107-207 IMPACT Feet DISARM
108-208 BALLAST Blow (NOT USED FOR GRAD)
109-209 TX #3 ON (in BU, GRAD TM)110-210 TX #3 OFF
111-211 TX #2 ON (on Plate Prim, Bln TM)112-212 TX #2 OFF
113-213114-214
115-215116-216
117-217 LATCH He Valve OPEN118-218119-219 He Valve OPEN Failsafe & UNLATCH Valve
120-220 TERMINATION-Valve121-221 TERMINATION-Valve
122-222123-223
124-224 BEACON ON (242.0 MHz)125-225 BEACON OFF (242.0 MHz)
126-226 TX #4 ON (on plate BU GRAD TM)127-227 TX #4 OFF
128-228 LATCH POUR Ballast129-229 POUR Ballast OPEN Failsafe & UNLATCH
130-230 ARM AUTO BALLAST131-231 DISARM AUTO BALLAST
Figure A-2. Command List for Balloon Control
63
Appendix B:Telemetry Channel Assignments
Figures B- 1 and B-2 list the balloon down-link telemetry channel assignments. A digital
multiplexer and PCM (pulse-code-modulation) data encoder designed and built by AFGL provided the
96 digital-bit status indicators for GRAD housekeeping monitors. This fully programmable encoder
provided 60 analog data channels.
65
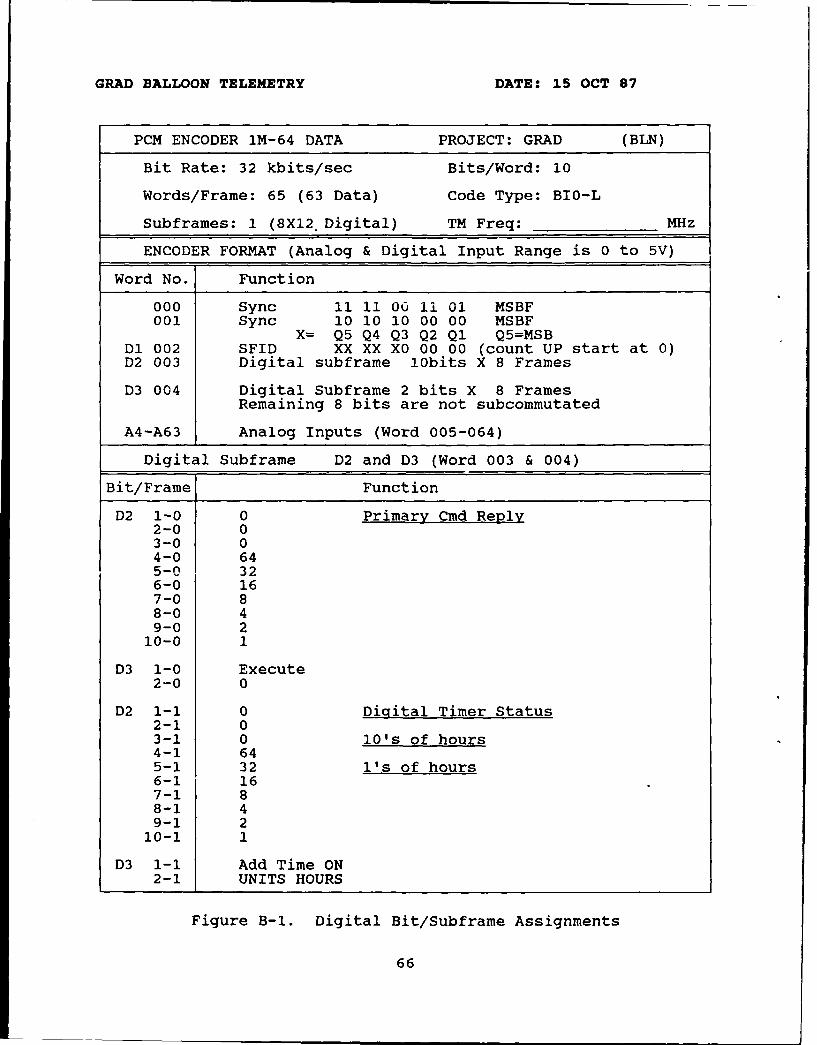
GRAD BALLOON TELEMETRY DATE: 15 OCT 87
PCM ENCODER 1M-64 DATA PROJECT: GRAD (BLN)
Bit Rate: 32 kbits/sec Bits/Word: 10
Words/Frame: 65 (63 Data) Code Type: BIO-L
Subframes: 1 (8X12. Digital) TM Freq: MHz
ENCODER FORMAT (Analog & Digital Input Range is 0 to 5V)
Word No. Function
000 Sync 11 11 06 ii 01 MSBF001 Sync 10 10 10 00 00 MSBF
X= Q5 Q4 Q3 Q2 Q1 Q5=MSBD1 002 SFID XX XX XO 00 00 (count UP start at 0)D2 003 Digital subframe 10bits X 8 Frames
D3 004 Digital Subframe 2 bits X 8 Frames
Remaining 8 bits are not subcommutated
A4-A63 Analog Inputs (Word 005-064)
Digital Subframe D2 and D3 (Word 003 & 004)
Bit/Frame Function
D2 1-0 0 Primary Cmd Reply2-0 03-0 04-0 645-0 326-0 167-0 88-0 49-0 2
10-0 1
D3 1-0 Execute2-0 0
D2 1-1 0 Digital Timer Status2-1 03-1 0 10's of hours4-1 645-1 32 l's of hours6-1 167-1 88-1 49-1 2
10-1 1
D3 1-1 Add Time ON2-1 UNITS HOURS
Figure B-I. Digital Bit/Subframe Assignments
66
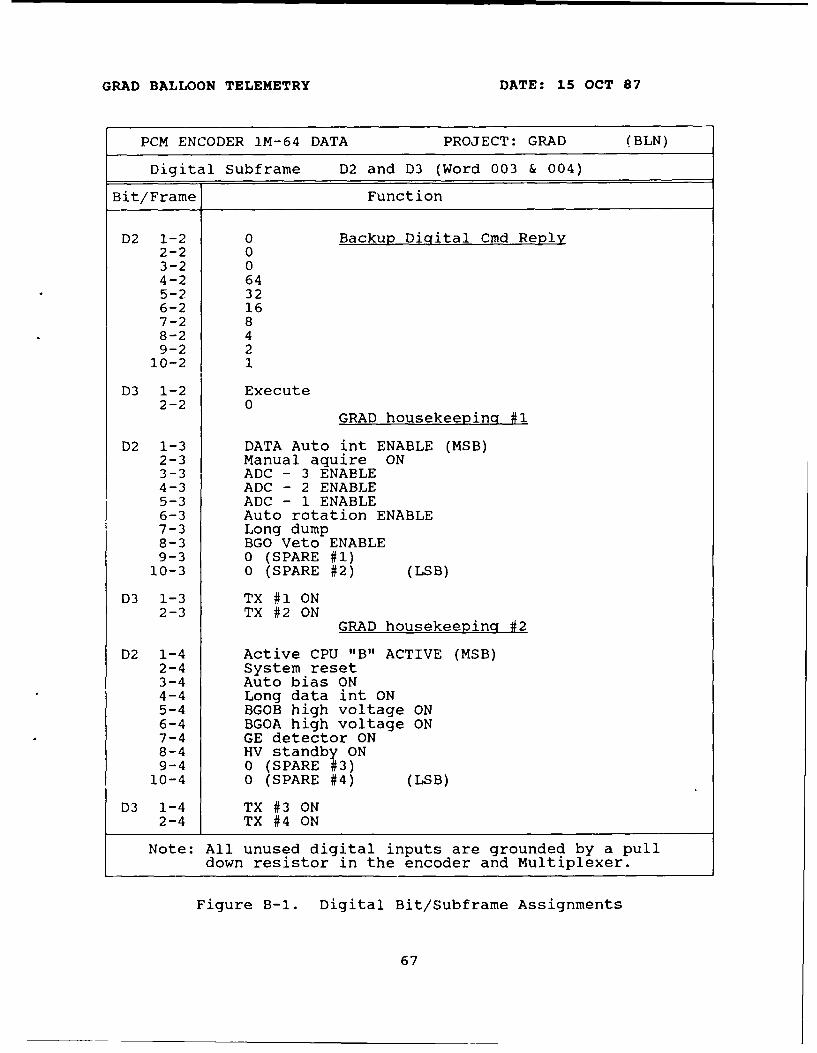
GRAD BALLOON TELEMETRY DATE: 15 OCT 87
PCM ENCODER IM-64 DATA PROJECT: GRAD (BLN)
Digital Subframe D2 and D3 (Word 003 & 004)
Bit/Frame Function
D2 1-2 0 Backup Digital Cmd Reply2-2 03-2 04-2 645-2 326-2 167-2 88-2 49-2 210-2 1
D3 1-2 Execute2-2 0
GRAD housekeeping #1
D2 1-3 DATA Auto int ENABLE (MSB)2-3 Manual aquire ON3-3 ADC - 3 ENABLE4-3 ADC - 2 ENABLE5-3 ADC - 1 ENABLE6-3 Auto rotation ENABLE7-3 Long dump8-3 BGO Veto ENABLE9-3 0 (SPARE #1)
10-3 0 (SPARE #2) (LSB)
D3 1-3 TX #1 ON2-3 TX #2 ON
GRAD housekeeping #2
D2 1-4 Active CPU "B" ACTIVE (MSB)2-4 System reset3-4 Auto bias ON4-4 Long data int ON5-4 BGOB high voltage ON6-4 BGOA high voltage ON7-4 GE detector ON8-4 HV standby ON9-4 0 (SPARE #3)
10-4 0 (SPARE #4) (LSB)
D3 1-4 TX #3 ON2-4 TX #4 ON
Note: All unused digital inputs are grounded by a pulldown resistor in the encoder and Multiplexer.
Figure B-1. Digital Bit/Subframe Assignments
67
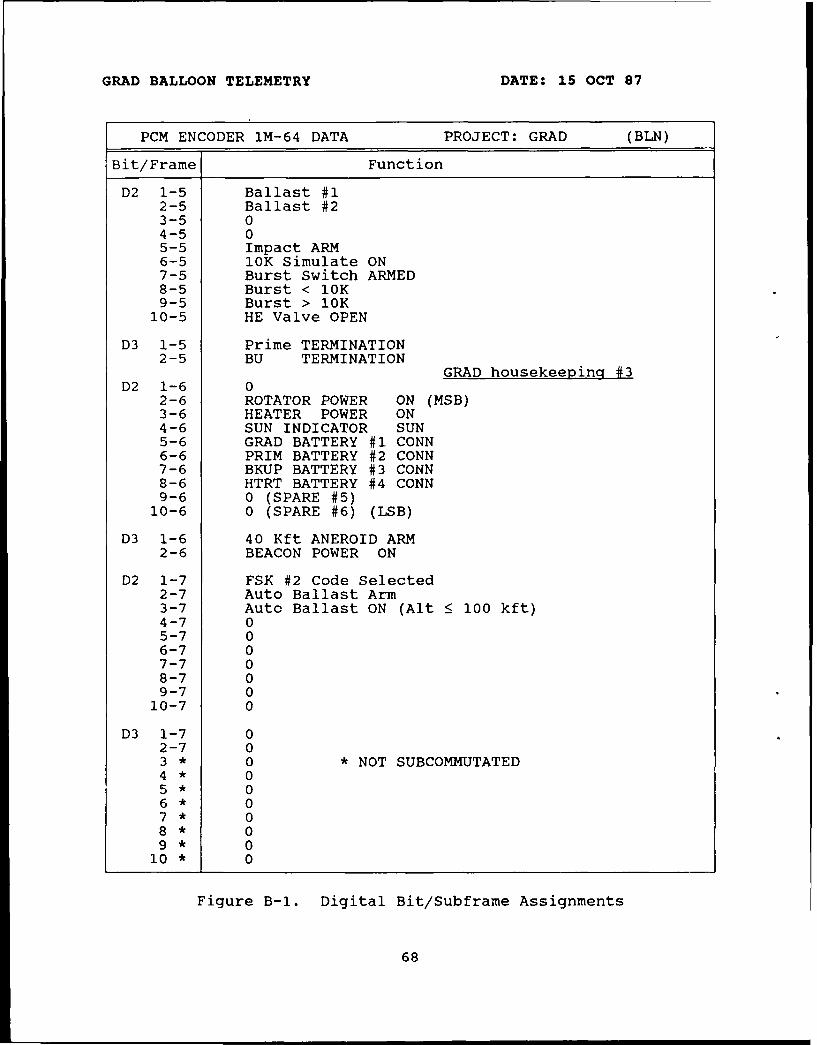
GRAD BALLOON TELEMETRY DATE: 15 OCT 87
PCM ENCODER 1M-64 DATA PROJECT: GRAD (BLN)
Bit/Frame Function
D2 1-5 Ballast #12-5 Ballast #23-5 04-5 05-5 Impact ARM6-5 10K Simulate ON7-5 Burst Switch ARMED8-5 Burst < 10K9-5 Burst > 10K10-5 HE Valve OPEN
D3 1-5 Prime TERMINATION2-5 BU TERMINATION
GRAD housekeeping #3D2 1-6 0
2-6 ROTATOR POWER ON (MSB)3-6 HEATER POWER ON4-6 SUN INDICATOR SUN5-6 GRAD BATTERY #1 CONN6-6 PRIM BATTERY #2 CONN7-6 BKUP BATTERY #3 CONN8-6 HTRT BATTERY #4 CONN9-6 0 (SPARE #5)10-6 0 (SPARE #6) (LSB)
D3 1-6 40 Kft ANEROID ARM2-6 BEACON POWER ON
D2 1-7 FSK #2 Code Selected2-7 Auto Ballast Arm3-7 Auto Ballast ON (Alt 100 kft)4-7 05-7 06-7 07-7 08-7 09-7 010-7 0
D3 1-7 02-7 03 * 0 * NOT SUBCOMMUTATED4* 05* 06* 07* 08* 09* 0
10* 0
Figure B-1. Digital Bit/Subframe Assignments
68
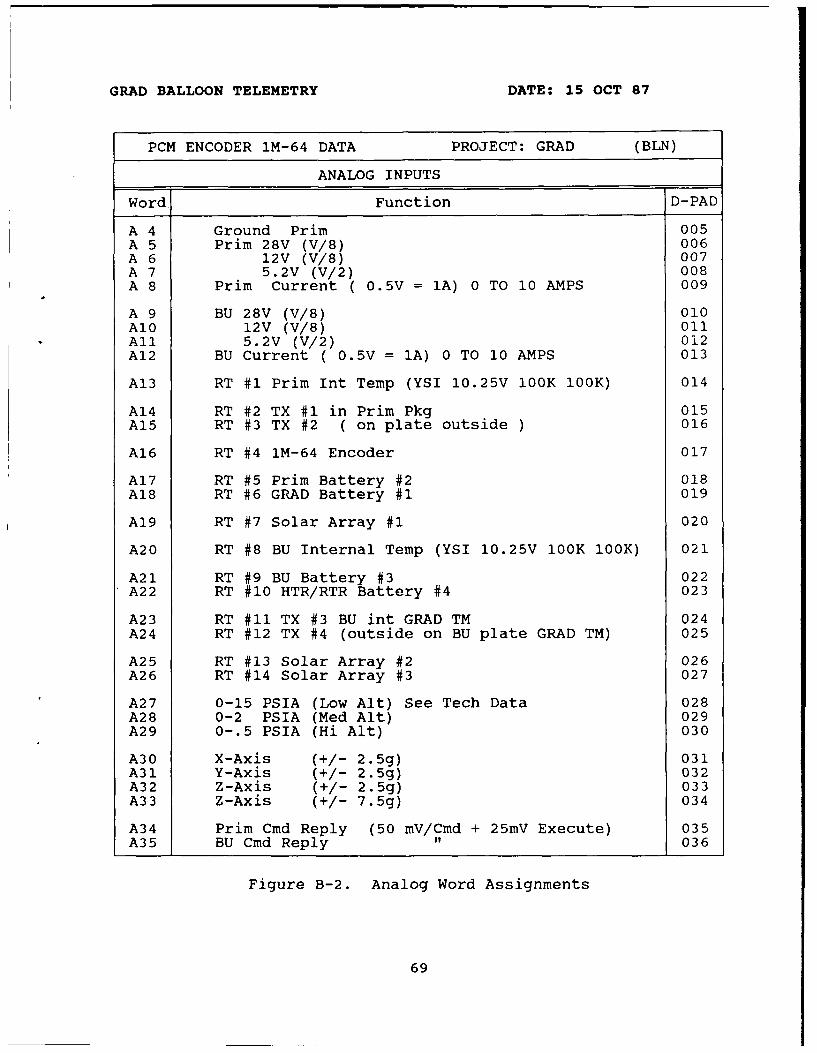
GRAD BALLOON TELEMETRY DATE: 15 OCT 87
PCM ENCODER 1M-64 DATA PROJECT: GRAD (BLN)
ANALOG INPUTS
Word Function D-PAD
A 4 Ground Prim 005A 5 Prim 28V (V/8) 006A 6 12V (V/8) 007A 7 5.2V (V/2) 008A 8 Prim Current ( 0.5V = 1A) 0 TO 10 AMPS 009
A 9 BU 28V (V/8) 010A10 12V (V/8) 011All 5.2V (V/2) 012A12 BU Current ( 0.5V = 1A) 0 TO 10 AMPS 013
A13 RT #1 Prim Int Temp (YSI 10.25V 100K 100K) 014
A14 RT #2 TX #1 in Prim Pkg 015A15 RT #3 TX #2 ( on plate outside ) 016
A16 RT #4 1M-64 Encoder 017
A17 RT #5 Prim Battery #2 018A18 RT #6 GRAD Battery #1 019
A19 RT #7 Solar Array #1 020
A20 RT #8 BU Internal Temp (YSI 10.25V 100K 100K) 021
A21 RT #9 BU Battery #3 022A22 RT #10 HTR/RTR Battery #4 023
A23 RT #11 TX #3 BU int GRAD TM 024A24 RT #12 TX #4 (outside on BU plate GRAD TM) 025
A25 RT #13 Solar Array #2 026A26 RT #14 Solar Array #3 027
A27 0-15 PSIA (Low Alt) See Tech Data 028A28 0-2 PSIA (Med Alt) 029A29 0-.5 PSIA (Hi Alt) 030
A30 X-Axis (+/- 2.5g) 031A31 Y-Axis (+/- 2.5g) 032A32 Z-Axis (+/- 2.5g) 033A33 Z-Axis (+/- 7.5g) 034
A34 Prim Cmd Reply (50 mV/Cmd + 25mV Execute) 035A35 BU Cmd Reply " 036
Figure B-2. Analog Word Assignments
69
GRAD BALLOON TELEMETRY DATE: 15 OCT 87
PCM ENCODER 1M-64 DATA PROJECT: GRAD (BLN)
ANALOG INPUTS
Word Function D-PAD
A36 Timer (50 mV/hr + 25 mV Add 10 hr) 037A37 RX #1 (Prim ) Sig Strength 038
A38 RX #2 (BU) Sig Strength 039A39 RX #3 (BU) Sig Strength 040
A40 UPPER ARRAY VOLTAGE (V/lI) 041A41 LOWER ARRAY VOLTAGE (V/lI) 042
A42 SPARE (ARRAY TEMP #4 LM-335Z) 043A43 SYSTEM ZERO CAL. (GND IN J-BOX 450) 044
A44 GRAD batt 1 current 0 TO 20 AMPS 045A45 PRIM batt 2 current (0.25 VOLT/AMP) 046A46 BKUP batt 3 current " 047A47 RTHT batt 4 current " 048
A48 SOL ARR U 1 I to GRAD & batt 1 0-50 AMPS 049A49 SOL ARR U 2 I to PRIM & batt 2 (0.1 V/A) 050A50 SOL ARR L 1 I to BKUP & batt 3 " 051A51 SOL ARR L 2 I to RTHT & batt 4 I 052
A52 Upper dewar temp 1 (LM335Z @ 5.2 V 053A53 Lower dewar temp 2 2.2 K/100 K OHM) 054A54 Elect box temp 3 V(100)-273 = TEMP C 055A55 NIM box temp 4 10 mV/deg K 056A56 RTR box temp 5 " 057A57 Sun sen temp 6 " 058
A58 GRAD batt 1 + 27 Volt (V/l1) 059A59 PRIM batt 2 + 27 Volt " 060A60 BKUP batt 3 + 27 Volt " 061A61 RTHT batt 4 + 27 Volt (V/lI) 062
A62 UPPER "Pyronometer" 063
A63 LOWER "Pyronometer" 064
Note: Word numbers such as 025 is the D-Pad Display.
D1 to A64 are the word numbers after Sync.D = Digital. A = Analog
Figure B-2. Analog Word Assignments
70
Contents1. HISTORY2. IMPLEMENTATION3. TESTING4. THE GRAD FLIGHT5. CONCLUSIONSAcknowledgements
4. Airborne Telemetry Station for GRAD
by
Willard F. Thorn
1. HISTORY
The GRAD balloon would, of course, drift with the wind. There were several theories as to where
it would go. The first was that it would drift west, staying at a constant latitude. The second theory
was that it would drift east, at a constant latitude. The third was: the path would be determined by the
time when we launched in relation to when the upper air turnaround in the Antarctic actually
occurred. Everyone agreed that the balloon would disappear over the horizon; depending on wind
speed, the horizon would be 12 to 48 hours away.
The telemetry (TM) system flown on GRAD required line-of-sight between the balloon and the
TM receiving station. After the balloon reached the horizon there would be no more data. One to two
days data from a possible three-week flight were not acceptable. Several solutions were proposed. All
but one were found to be impractical or impossible due, in part, to our lead-time constraints. The
workable solution was to fly a TM station on board an LC- 130 aircraft.
A TM station on board an LC- 130 would allow the TM station to go to the balloon wherever it
drifted. The National Science Foundation LC- 130 aircraft had enough range and endurance to fly up to
71
1500 miles, circle for an hour and return to the starting point. This capability provided coverage to
almost the entire Antarctic continent. See Figure 1.
2. IMPLEMENTATION
The most likely aircraft flight scenario was a flight of opportunity. We would be invited on a
flight of opportunity only if we would have little or no impact on the original mission. This meant we
had to be able to move our equipment in and set it up on a moment's notice - the entire system had to be
as light and compact as posssible. By going on a flight of opportunity we would have minimal impact
on the busy flight schedule.
2.1 TM Station Subsystems
Figure 2 is a block diagram of the TM system designed for the LC- 130. The four subsystems are
the receiving/transmitting equipment, the data-recording equipment, the antenna system, and the
power source.Modifications to the aircraft were against the rules. The only exception was that we might be
able to mount antennas to a hatch cover. The hatch cover is not a structural part and therefore would
not need so high a level of approval. In the past, other organizations had mounted antennas to hatch
covers and had them approved. Mounting to a hatch cover also gave us the flexibility to move quickly
from plane to plane by swapping hatch covers.
2.2 TM Station Setup
The best place in the aircraft to set up the station was against the forward bulkhead. See Figure 3.
Freight was normally loaded aft, and passengers in the front. By stowing one set of seats we could
install our station. This location had several other benefits: It was near the cargo-winch power plug,
the hatch cover with the best access is over the cockpit, about 10 feet away, and finally, this location
provided good communication with the flight crew.
The minimum equipment that would be needed to operate a TM station aboard the LC- 130
included: an S-band receiver, two command transmitters; a power supply for the transmitters, a
command generator and RS-232 Converter, a D-pad or a PCATS computer, the Florida computer, a
3500-watt inverter, and a bit synchronizer. For the most part, this is the same equipment used in the
ground station, just less of it.
2.3 Equipment Racks
Almost all of the equipment was small enough to fit in two shock-mounted racks. See Figure 4.
These racks, while heavy, could be carried by two people. The antennas were mounted to a hatch cover
and two last-minute items, the power conditioner and cassette recorder, were strapped to the floor.
72
Bauvet Is.
60
FalkNen Zealand
C73
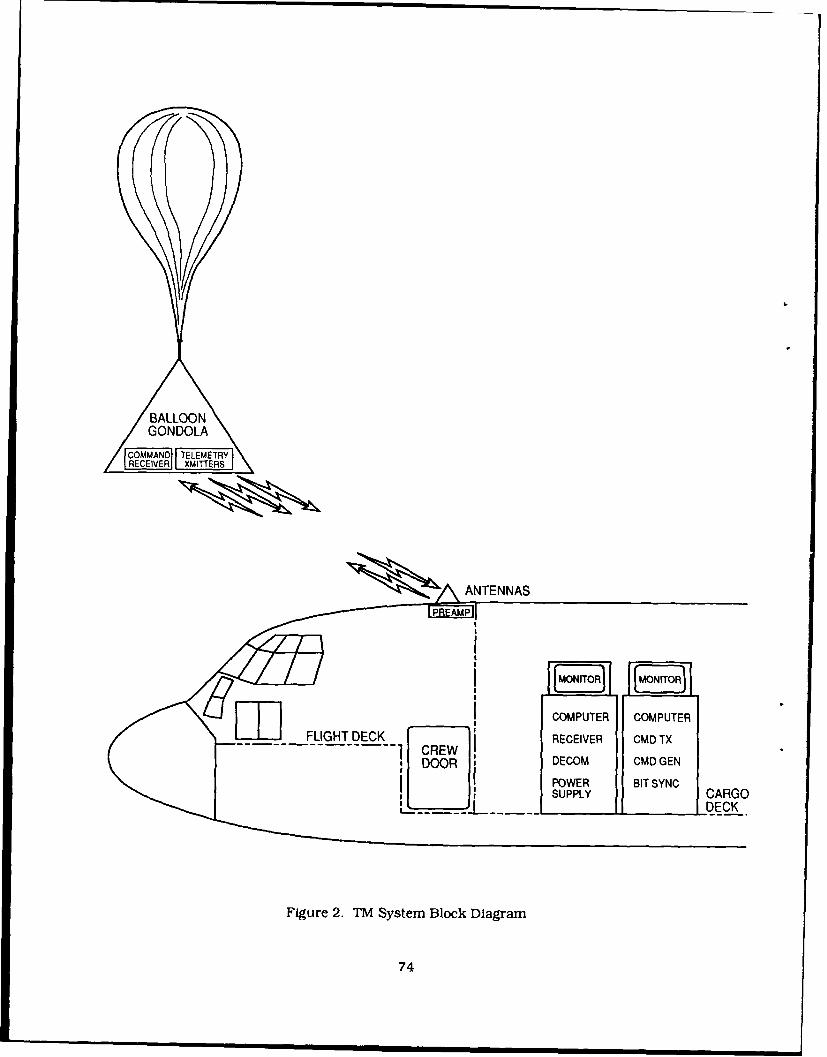
BALLOONGONDOLA
COMMANDI FTLERYI EVER Lj!lRS
FLIGH DCOMPUTER COMPUTERCRW DRECEIVER CMDTX
DRWR DECOM CMD GEN
POWER BIT SYNC,SUPPLY CARGO
L DECK
Figure 2. TM System Block Diagram
74
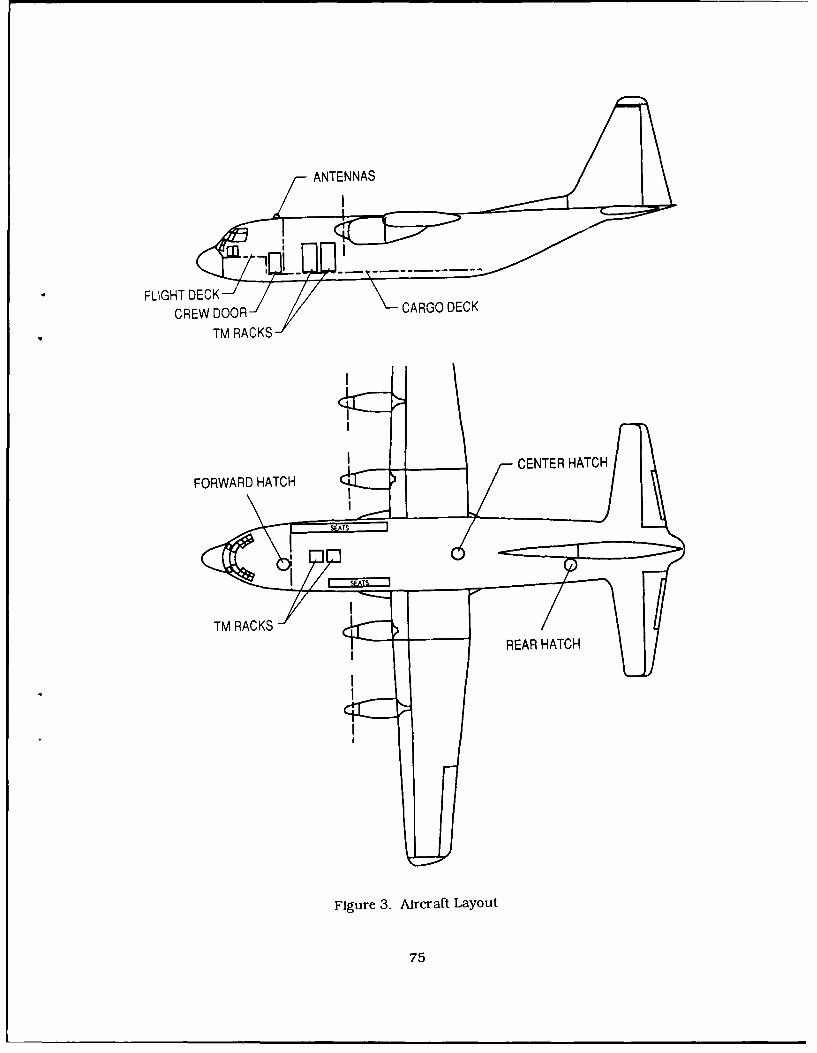
ANTENNAS
FLIGHT DECK- /yCRGDK
CREW DOOR CARGO DECKTM RACKS /
CENTER HATCHFORWARD HATCH
| SE.ATS
REAR HATCH
Figure 3. Aircraft Layout
75
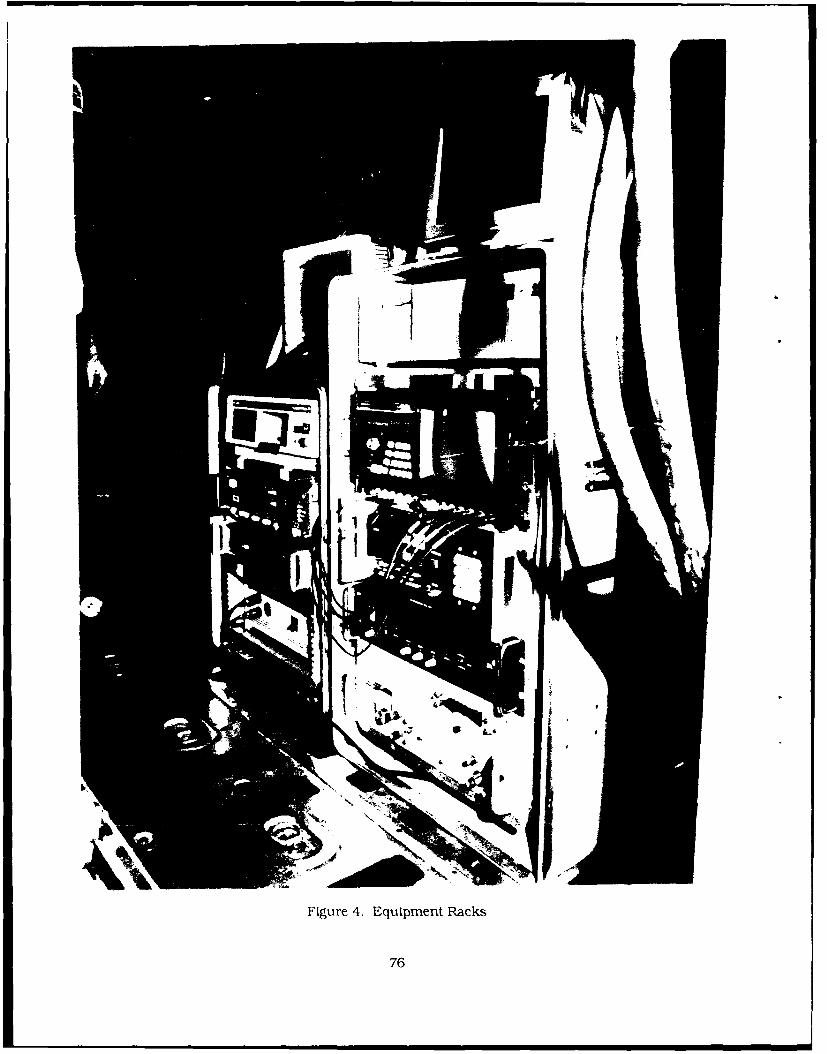
Figure 4. Equipment Racks
76
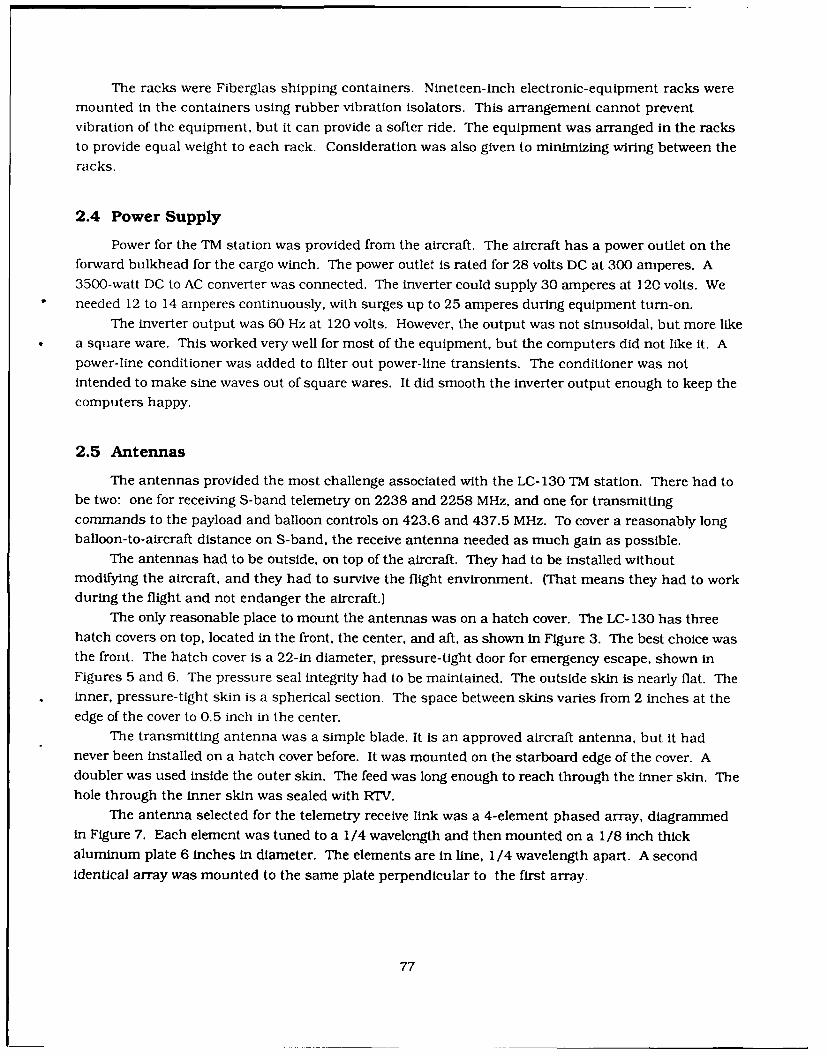
The racks were Fiberglas shipping containers. Nineteen-inch electronic-equipment racks weremounted in the containers using rubber vibration isolators. This arrangement cannot preventvibration of the equipment, but it can provide a softer ride. The equipment was arranged in the racksto provide equal weight to each rack. Consideration was also given to minimizing wiring between the
racks.
2.4 Power Supply
Power for the TM station was provided from the aircraft. The aircraft has a power outlet on theforward bulkhead for the cargo winch. The power outlet is rated for 28 volts DC at 300 amperes. A3500-watt DC to AC converter was connected. The inverter could supply 30 amperes at 120 volts. Weneeded 12 to 14 amperes continuously, with surges up to 25 amperes during equipment turn-on.
The inverter output was 60 Hz at 120 volts. However, the output was not sinusoidal, but more likea square ware. This worked very well for most of the equipment, but the computers did not like it. Apower-line conditioner was added to filter out power-line transients. The conditioner was notintended to make sine waves out of square wares. It did smooth the inverter output enough to keep the
computers happy.
2.5 Antennas
The antennas provided the most challenge associated with the LC- 130 TM station. There had tobe two: one for receiving S-band telemetry on 2238 and 2258 MHz, and one for transmittingcommands to the payload and balloon controls on 423.6 and 437.5 MHz. To cover a reasonably longballoon-to-aircraft distance on S-band, the receive antenna needed as much gain as possible.
The antennas had to be outside, on top of the aircraft. They had to be installed withoutmodifying the aircraft, and they had to survive the flight environment. (That means they had to work
during the flight and not endanger the aircraft.)The only reasonable place to mount the antennas was on a hatch cover. The LC- 130 has three
hatch covers on top, located in the front, the center, and aft, as shown in Figure 3. The best choice wasthe front. The hatch cover is a 22-in diameter, pressure-tight door for emergency escape, shown inFigures 5 and 6. The pressure seal integrity had to be maintained. The outside skin is nearly flat. Theinner, pressure-tight skin is a spherical section. The space between skins varies from 2 inches at the
edge of the cover to 0.5 inch in the center.
The transmitting antenna was a simple blade. It is an approved aircraft antenna, but it hadnever been installed on a hatch cover before. It was mounted on the starboard edge of the cover. Adoubler was used inside the outer skin. The feed was long enough to reach through the inner skin. Thehole through the inner skin was sealed with RTV.
The antenna selected for the telemetry receive link was a 4-element phased array, diagrammedin Figure 7. Each element was tuned to a 1/4 wavelength and then mounted on a 1/8 inch thickaluminum plate 6 inches in diameter. The elements are in line, 1/4 wavelength apart. A secondidentical array was mounted to the same plate perpendicular to the first array.
77
Ak
A.
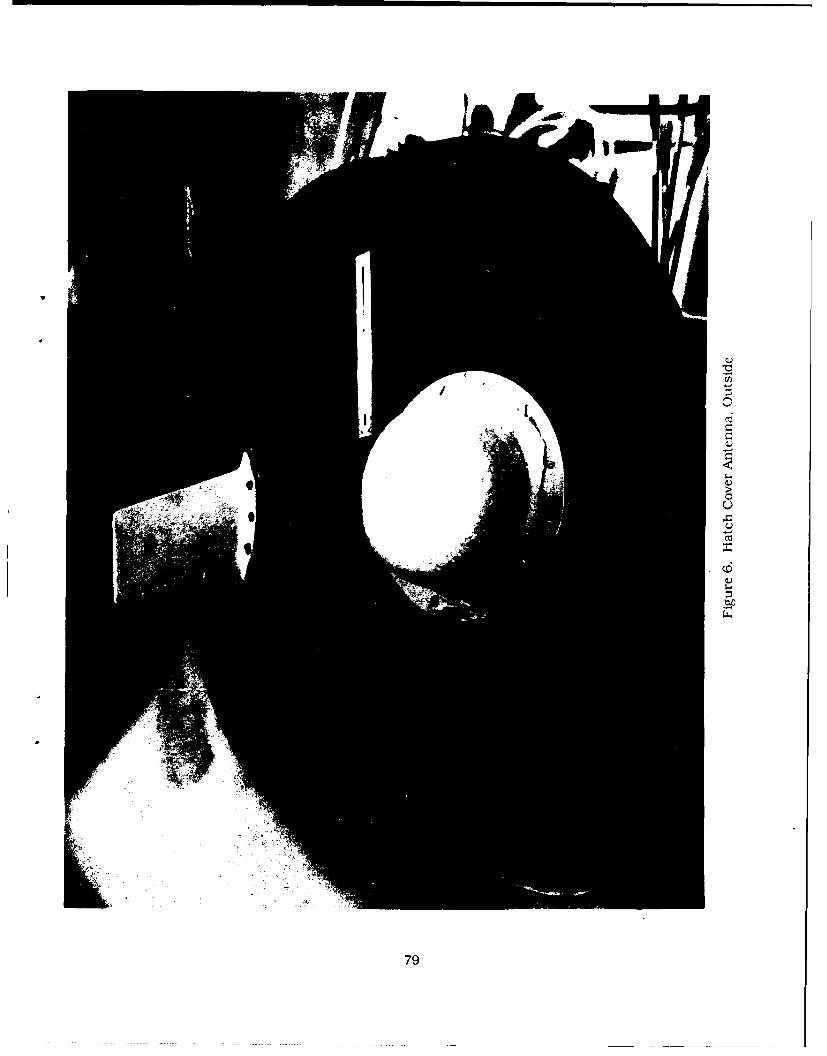
0
C.6.
79
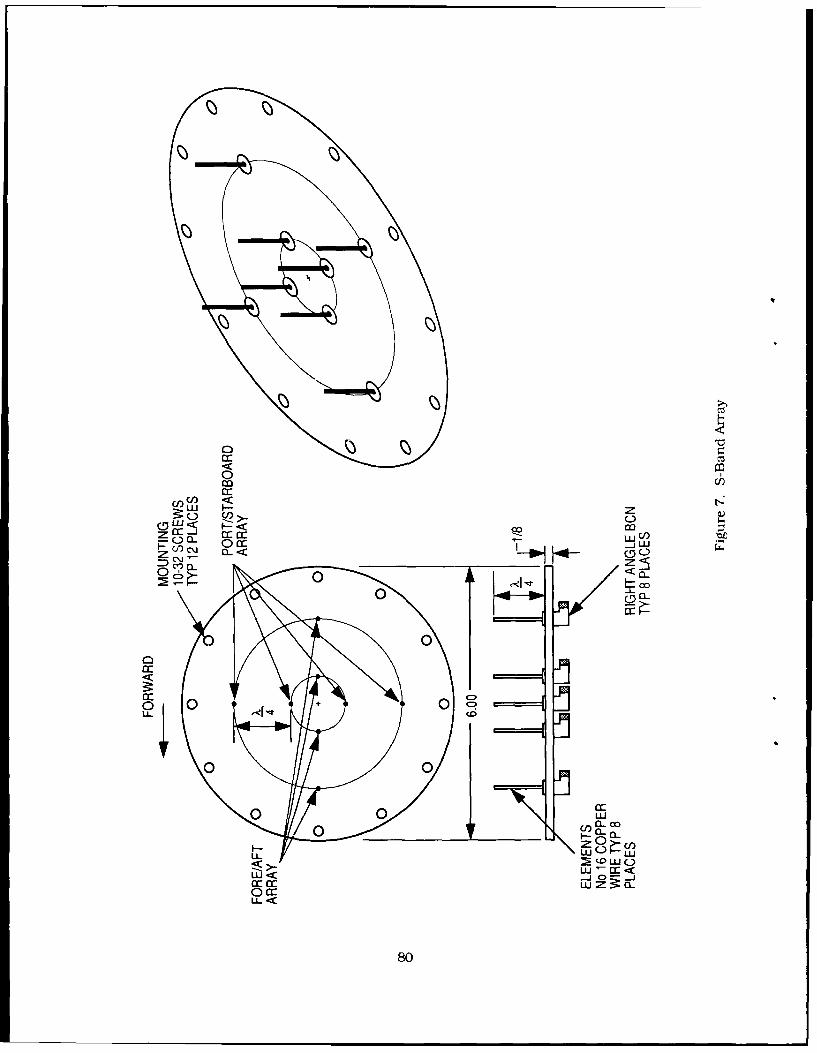
IL]I - z~0 q?)>- C-)6CJW < I. <m
06- WC/
0 1 CL
00
<w
3.~ULU
0 80
A printed-clrcult phasing device was used. It is diagrammed in Figure 8. The PC board was 6
inches square. OSM-type connectors were soldered directly to the PC board which was connected to
the four elements with equal-length coaxial cables 12 inches long. By selecting an array and the order
in which the elements were connected, the directional characteristics of the antenna could be adjusted
to point to the balloon.
The antenna pattern looking at the horizontal plane covered about 80 degrees: 40 degrees either
side of the line through the elements, as indicated in Figure 9.
Looking at a vertical plane through the elements, the pattern resembled a teardrop with its point
at thc antenna. The peak gain of the antenna was about 8 dB at elevation angles between 10 and 20
degrees.
The balloon range vs elevation angle is a fixed function for any particular height of balloon
above the aircraft. As the balloon gets closer, less antenna gain is needed. The receiver antenna gain
pattern coupled with the range versus elevation function provided a maximum range of 130 miles for
data with a 16 dB signal-to-noise (SNR) ratio. The data could be received to about 220 miles if a 12-dB
SNR could be tolerated. The balloon data link can get by with the lower SNR and the associated higher
error rate. As a result, the balloon data link had a maximum range similar to the balloon commandlink.
A 20-dB gain, low-noise preamplifier mounted to the inside of the hatch cover gave good signal .o
the receiver even though it was located about 20 feet away from the antenna.
An S-band, band-pass filter was placed between the phasing PC board and the preamplifier. This
prevented RF energy from the command link from getting into the receive system.
2.6 On-Board Data Recorder
Our AFGL data recorders are bigger, heavier, and draw more power than we could accept for use
aboard the aircraft. The solution was a high-quality stereo cassette recorder. It had recording
capability to 20 kHz frequency at the -3 dB point. Our two downlinks (for the balloon and experiment
data) were encoded at 32 kilobits per second (kBPS) in BiO-L code. This code has a prime frequency of
32 kHz. too high for the recorder. A code converter was used to convert the BIO-L to NRZ-S code. The
32-kb NRZ code has a prime frequency of 16 kHz. The experiment data frequently had long strings of
zeros. The S-code provided transitions for each zero thus maintaining the AC quality of the original
code. This was necessary because the recorder will not record DC. After the flight the cassette tape was
dubbed to the normal data recorders. The dubbed tapes were used for data play-back.
3. TESTING
The airborne telemetry station was sufficiently important to the GRAD program that a C- 130
aircraft was flown to Holloman AFB for testing. (The only difference between a C-130 and an LC- 130
are the skis on the LC- 130.)
81
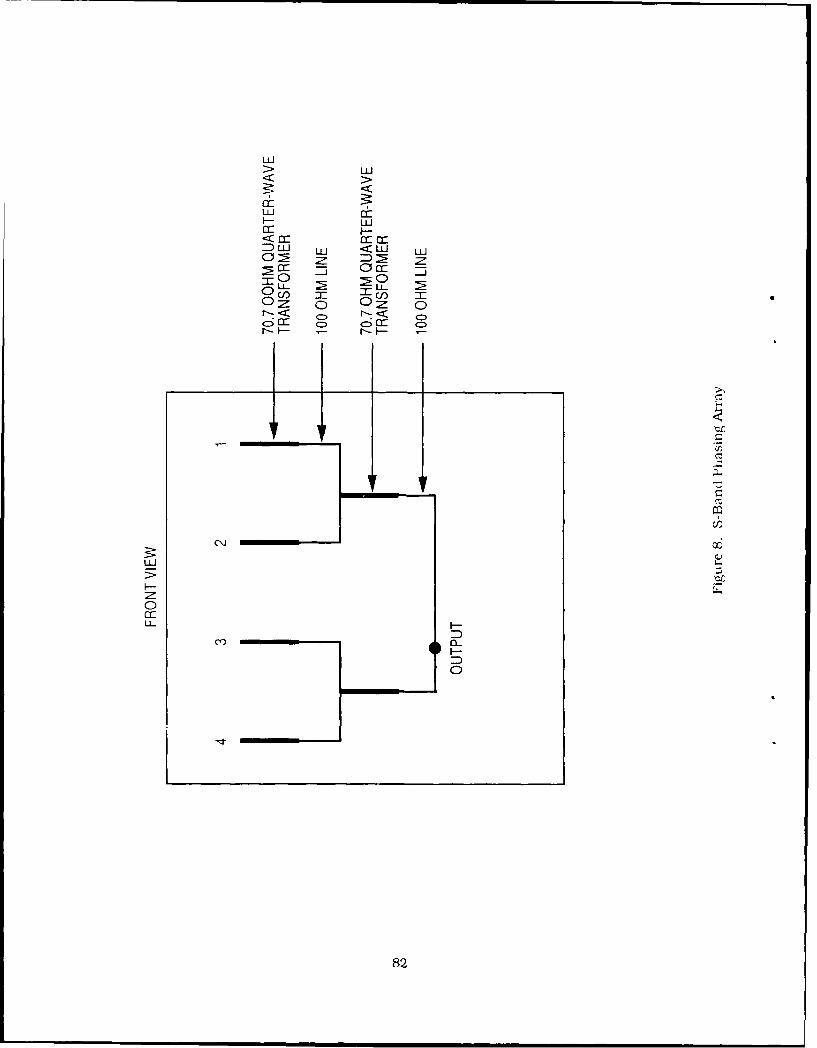
LUJ
LLLU
LUJ< cc
:D Lu ~ LU < i L
0 0
< C>< r-- < CD
C\J
0
cr-)LLF-
0
82
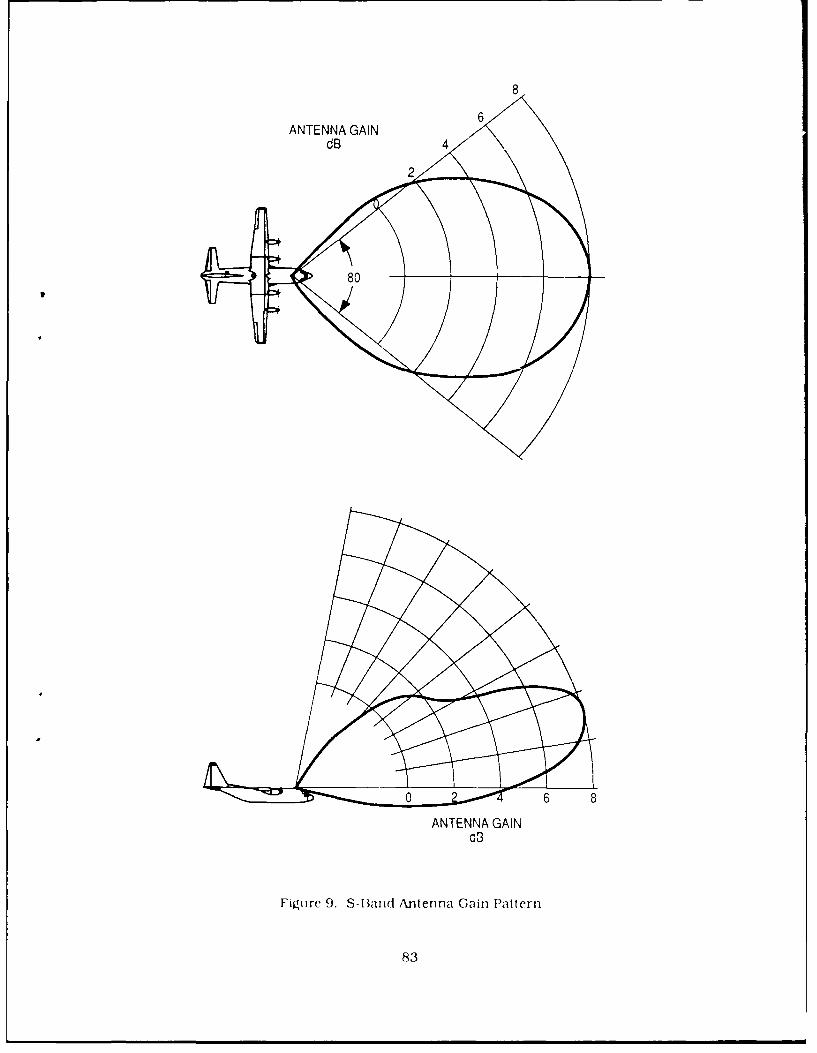
8
6ANTENNA GAIN
ANTENNA GAINd3
Figuire 9. S-Band Antenna Gain Pattern
83
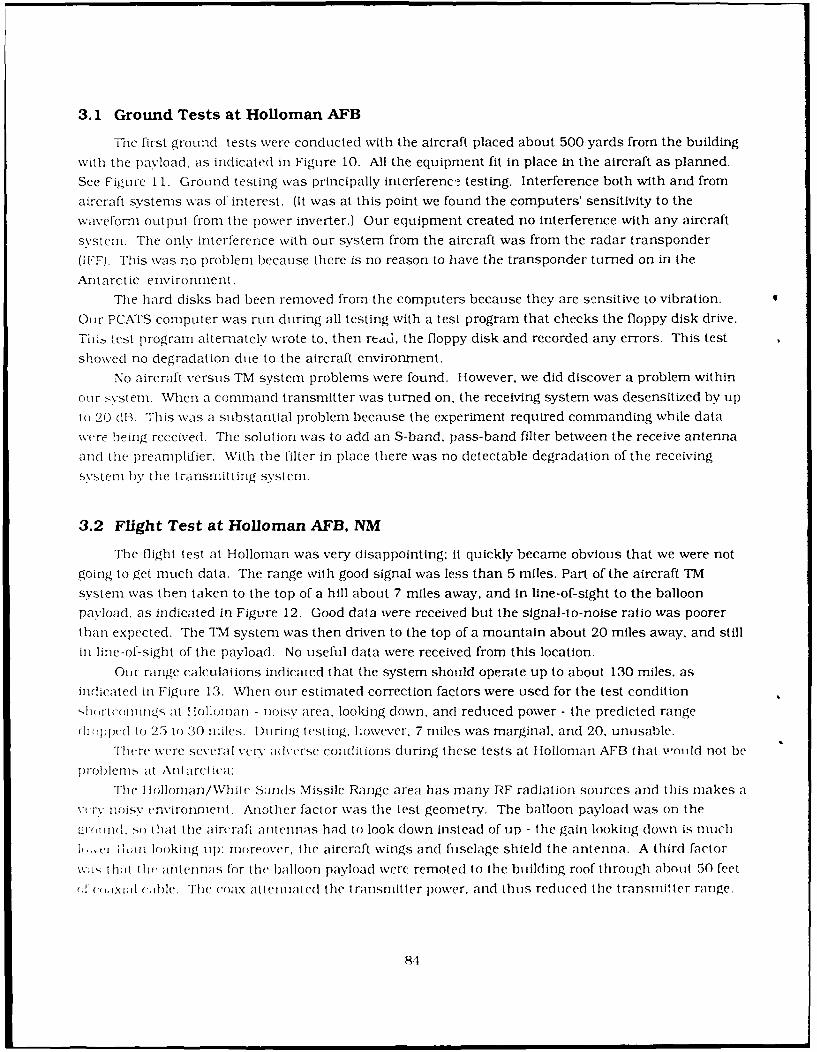
3.1 Ground Tests at Holloman AFB
Thc first ground tests were conducted with the aircraft placed about 500 yards from the building
with the payload, as indicated in Figure 10. All the equipment fit In place in the aircraft as planned.
See Figure 11. Ground testing was principally interferenc, testing. Interference both with and from
aircraft systems was of interest. (It was at this point we found the computers' sensitivity to the
waveform output from the power inverter.) Our equipment created no interference with any aircraft
system. The only interference with our system from the aircraft was from the radar transponder
(1FF). This was no problem because there is no reason to have the transponder turned on in the
Antarctic environment.
The hard disks had been removed from the computers because they are sensitive to vibration.
Our PCATS computer was run during all testing with a test program that checks the floppy disk drive.
Thi , test program alternately wrote to, then red, the floppy disk and recorded any errors. This test
showed no degradation due to the aircraft environment.
No aircraft versus TM system problems were found. However, we did discover a problem within
our system. When a command transmitter was turned on, the receiving system was desensitized by up
to 20 dB. This was a substantial problem because the experiment required commanding while data
were being received. The solution was to add an S-band, pass-band filter between the receive antenna
and the preamplifier. With the filter in place there was no detectable degradation of the receiving
systemn by the transmitting system.
3.2 Flight Test at Holloman AFB, NM
The flight test at Holloman was very disappointing; it quickly became obvious that we were not
going to get much data. The range with good signal was less than 5 miles. Part of the aircraft TM
system was then taken to the top of a hill about 7 miles away, and in line-of-sight to the balloon
payload, as indicated in Figure 12. Good data were received but the signal-to-noise ratio was poorer
than expected. The IM system was then driven to the top of a mountain about 20 miles away, and still
in line-of-sight of the payload. No useful data were received from this location.
Our range calculations indicated that the system should operate up to about 130 miles. as
indicated in Figure 13. When our estimated correction factors were used for the test condition
.,hirtcoii 1i0's at I lollor)an - noisy area, looking down, and reduced power - the predicted range
i()pprd to 25 to 30 nilcs. Duiring testing, however. 7 miles was marginal, and 20. unusable.
There were several very adlvrse conditions during these tests at Holloman AFB that wolld not be
probleris at Antarctica:The I follonianl/Whit Sands Missile Range area has many RF radiation sources and this makes a
ve.r noisv environment. Another factor was the test geometry. The balloon payload was on the
(roril, so that the aircraft antennas had to look down instead of up - the gain looking down is much
!,-ci ilt i looking up: moreover, the aircraft wings and fuselage shield the antenna. A third factor
w ;s that th antennas for the balloon payload were remoted to the building roof through about 50 feet
(i (mJi;l cablc. The coax attenuated the transmitter power, and thus reduced the transmitter range.
8,4
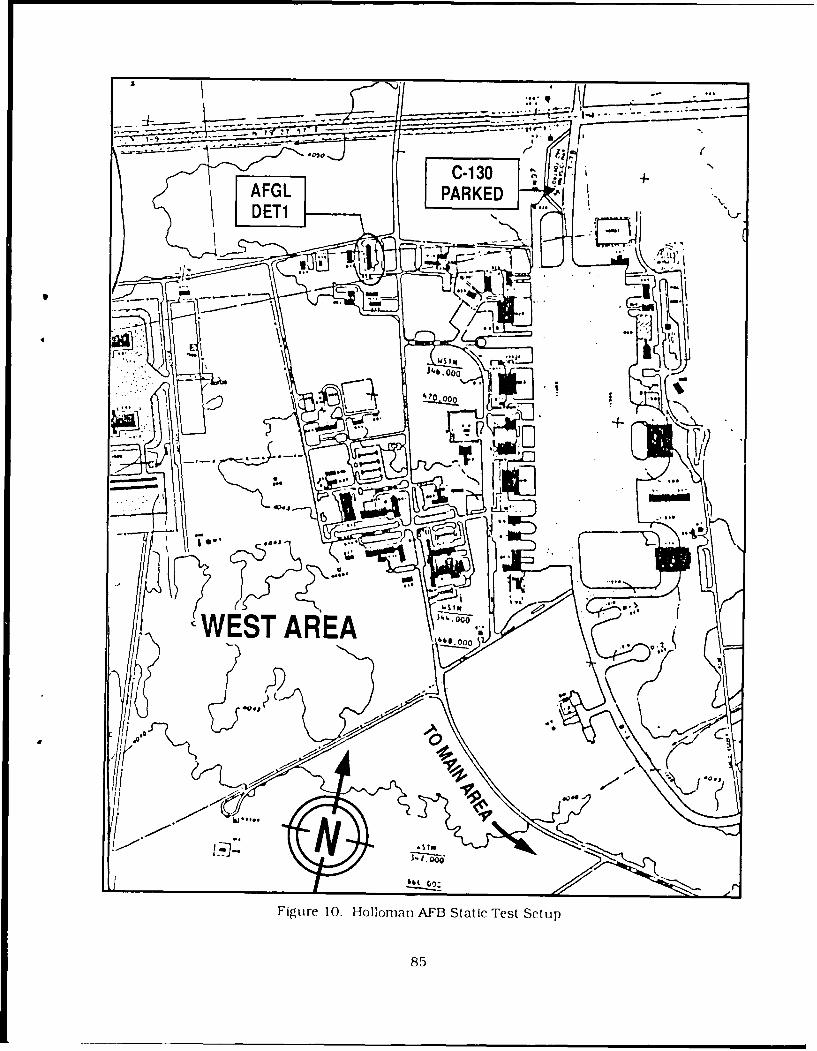
Ni,
- ~ -- ~ -- .06. iq
700
Figure 10. Hollornan AFB Static Test Setup
85
86
_______ ______40000,00
NORM
7SOFigre 2N olmnAI lgtTs ofgrto
PRIT87
RANGE EQUATION
Pt*Gt*Gr*WA2S/N =
K*T*B*L* 16*PiA2*RA2
DATA
Transmitter power Pt = 10 WTx antenna gain Gt = 3 dBRx antenna gain Gr = 7 dB at 7 deg elevation
Gr = 6 dB at 5 deg elevationWave length W = .429 ftBoltzman's constant K = 1.38e-23System noise temp T = 500 KBandwidth B = 500 kHzPolarization loss L = 3 dB
SIGNAL TO NOISE RATIO FOR EXPERIMENT LINK
S/N = 16 at 124 miles
SIGNAL TO NOISE RATIO FOR BALLOON LINK
S/N = 12 at 155 miles
15-
10-
o-co BALLOON LINK
c5-
EXPERIMENT LINK
0JJ
-50 50 100 150 200
SLANT RANGE Mi
Figure 13. GRAD Link Calculations
88
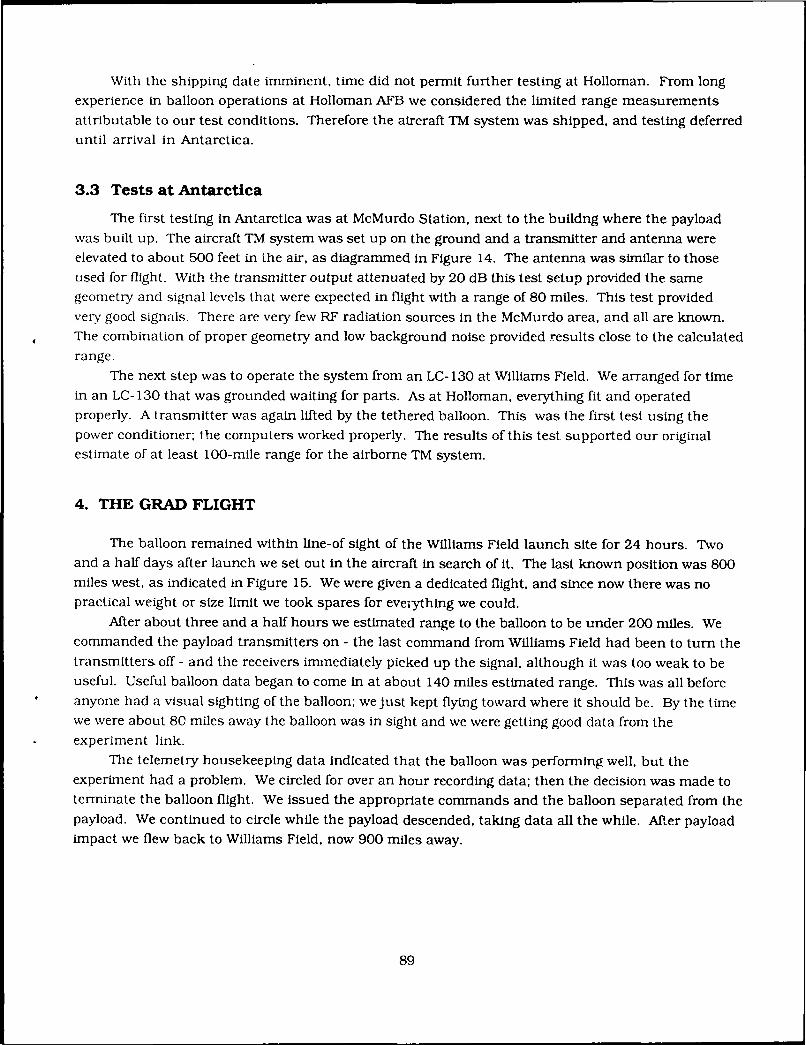
With the shipping date imminent, time did not permit further testing at Holloman. From long
experience in balloon operations at Holloman AFB we considered the limited range measurements
attributable to our test conditions. Therefore the aircraft TM system was shipped, and testing deferreduntil arrival in Antarctica.
3.3 Tests at Antarctica
The first testing in Antarctica was at McMurdo Station, next to the bulldng where the payload
was built up. The aircraft TM system was set up on the ground and a transmitter and antenna wereelevated to about 500 feet in the air, as diagrammed in Figure 14. The antenna was similar to thoseused for flight. With the transmitter output attenuated by 20 dB this test setup provided the same
geometry and signal levels that were expected in flight with a range of 80 miles. This test providedvery good signals. There are very few RF radiation sources in the McMurdo area, and all are known.The combination of proper geometry and low background noise provided results close to the calculated
range.The next step was to operate the system from an LC- 130 at Williams Field. We arranged for time
in an LC-130 that was grounded waiting for parts. As at Holloman. everything fit and operatedproperly. A transmitter was again lifted by the tethered balloon. This was the first test using the
power conditioner; the computers worked properly. The results of this test supported our originalestimate of at least 100-mile range for the airborne TM system.
4. THE GRAD FLIGHT
The balloon remained within line-of sight of the Williams Field launch site for 24 hours. Twoand a half days after launch we set out in the aircraft in search of it. The last known position was 800miles west, as indicated in Figure 15. We were given a dedicated flight, and since now there was nopractical weight or size limit we took spares for eveiything we could.
After about three and a half hours we estimated range to the balloon to be under 200 miles. Wecommanded the payload transmitters on - the last command from Williams Field had been to turn thetransmitters off - and the receivers immediately picked up the signal, although it was too weak to beuseful. Useful balloon data began to come in at about 140 miles estimated range. This was all beforeanyone had a visual sighting of the balloon: we just kept flying toward where it should be. By the timewe were about 80 miles away the balloon was in sight and we were getting good data from the
experiment link.The telemetry housekeeping data indicated that the balloon was performing well, but the
experiment had a problem. We circled for over an hour recording data; then the decision was made toterminate the balloon flight. We Issued the appropriate commands and the balloon separated from thepayload. We continued to circle while the payload descended, taking data all the while. After payloadimpact we flew back to Williams Field, now 900 miles away.
89
IC-z
I3I
crM cE
F--
< ~z 3:
00Z crz 0L~j L5?,- )
: : ~~ C\ -
0 C=> <0
//
1 i
Weddell Sea
_ _ _; _oANTARCTICA
-RECOVE RYk
• - ,South Pole
Figure 15. TM Flight Track and Recovery Location
91
5. CONCLUSIONS
The airborne telemetry system worked without a hitch for the entire flight. The balloon-to-
aircraft range was at least as good as calculations indicated it should be. We had expected to have a
limited flight of opportunity, but instead we got a much superior dedicated flight. The bottom line is
that the airborne telemetry system filled a very necessary void for the GRAD program.
92
Acknowledgements
Credit for making this TM system possible must be given to many organizations and people. The
Physical Sciences Laboratory, New Mexico State University, suggested the receive antenna design and
built the antenna phasing PC board. They also provided the PCATS computer decommutator. The
Oklahoma State University Electronics Laboratory supplied the S-band filter for the antenna. TheTM racks were built up by AFGL. The antenna was also built and mounted to the hatch cover 1 y AFGL.
The hatch cover was borrowed from the 57-APS training aircraft at Hanscom AFB. The cassette tape
recorder was purchased by Florida State University.
Most important of all was the cooperation from the National Science Foundation and the Navy
VXE-6 in providing us the aircraft and superb air crew.
93
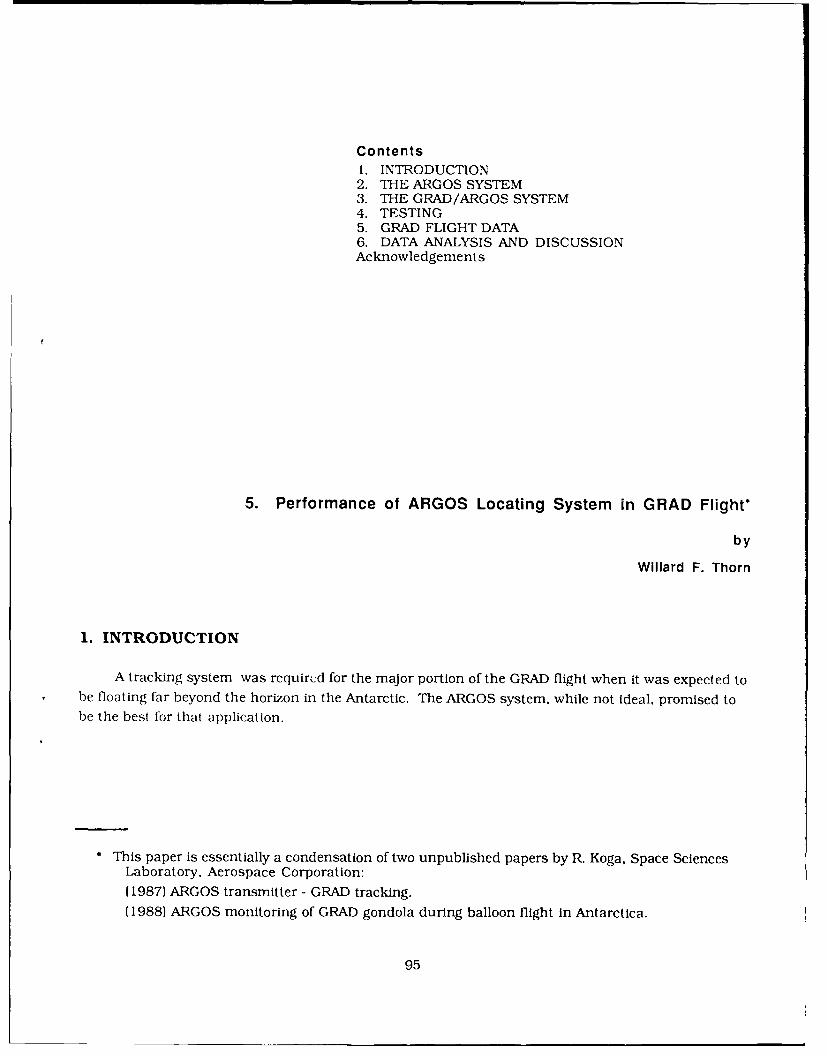
Contents1. INTRODUCTION2. THE ARGOS SYSTEM3. THE GRAD/ARGOS SYSTEM4. TESTING5. GRAD FLIGHT DATA6. DATA ANALYSIS AND DISCUSSIONAcknowledgements
5. Performance of ARGOS Locating System in GRAD Flight*
by
Willard F. Thorn
1. INTRODUCTION
A tracking system was requircd for the major portion of the GRAD flight when it was expected to
be floating far beyond the horizon in the Antarctic. The ARGOS system, while not ideal, promised to
be the best for that application.
This paper is essentially a condensation of two unpublished papers by R. Koga, Space Sciences
Laboratory, Aerospace Corporation:
(1987) ARGOS transmitter - GRAD tracking.
(1988) ARGOS monitoring of GRAD gondola during balloon flight in Antarctica.
95
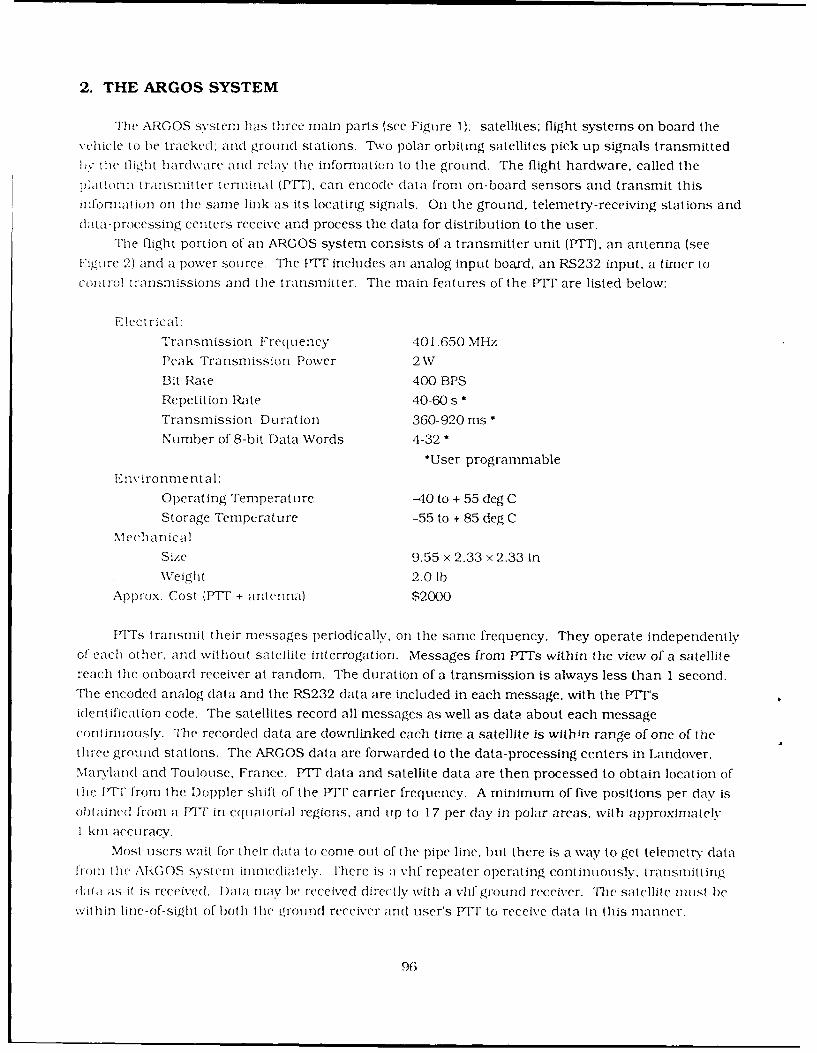
2. THE ARGOS SYSTEM
The ARGOS system has three main parts (see Figure 1): satellites; flight systems on board thevehicle to be tracked: and ground stations. Two polar orbiting satellites pick up signals transmitted)e the lioiht hardware and relay the information to the ground. The flight hardware, called the
tlatiol-1nn transmitter tenniial (VF1), can encode data from on-board sensors and transmit thisinforniation on the same link as its locating signals. On the ground, telemetry-receiving stations anddata-processing centers receive and process the data for distribution to the user.
The flight portion of an ARGOS system consists of a transmitter unit (PTT), an antenna (see
Figure 2) and a power source. The PIT includes an analog input board, an RS232 input, a timer to
coltrol transmissions and the transmitter. The main features of the FIT are listed below:
E !ec t ric al:
Transmission Frequency 401.650 MHz
Peak Transmission Power 2W
Bit Rate 400 BPS
Repetition Rate 40-60 s *
Transmission Duration 360-920 ms
Number of 8-bit Data Words 4-32 **User programmable
Environmental:
Operating Temperature -40 to + 55 deg C
Storage Temperature -55 to + 85 deg CMechanical
Size 9.55 x 2.33 x 2.33 in
Weight 2.0 lb
Approx. Cost (FITF + antenna) $2000
PFTs transmit their messages periodically, on the same frequency. They operate independently
of each other, and without satellite interrogation. Messages from PTTs within the view of a satellite
reach the onboard receiver at random. The duration of a transmission is always less than 1 second.
The encoded analog data and the RS232 data are included in each message, with the PTT's
identification code. The satellites record all messages as well as data about each message
continuously. The recorded data are downlinked each time a satellite is within range of one of the
three ground stations. The ARGOS data are forwarded to the data-processing centers in Landover.
Maryland and Toulouse, France. IT data and satellite data are then processed to obtain location of
the FIT" from the Doppler shift of the FIT carrier frequency. A minimum of five positions per day is
obtained from a FIT in eqriatorial regions, and up to 17 per (lay in polar areas, with approximately
I kin accuracy.
Most users wait for their data to come out of the pipe line, but there is a way to get telemetry data
Irin the ARGOS system imiediat ely. l'here is at vhf repeater operating continiously. transmitting
(akl as it is received. Data may he received directly with a vhf-ground receiver. The satellite must be
with in line-of-sight of both the groind receiver and user's FIT to receive data in this manner.
96
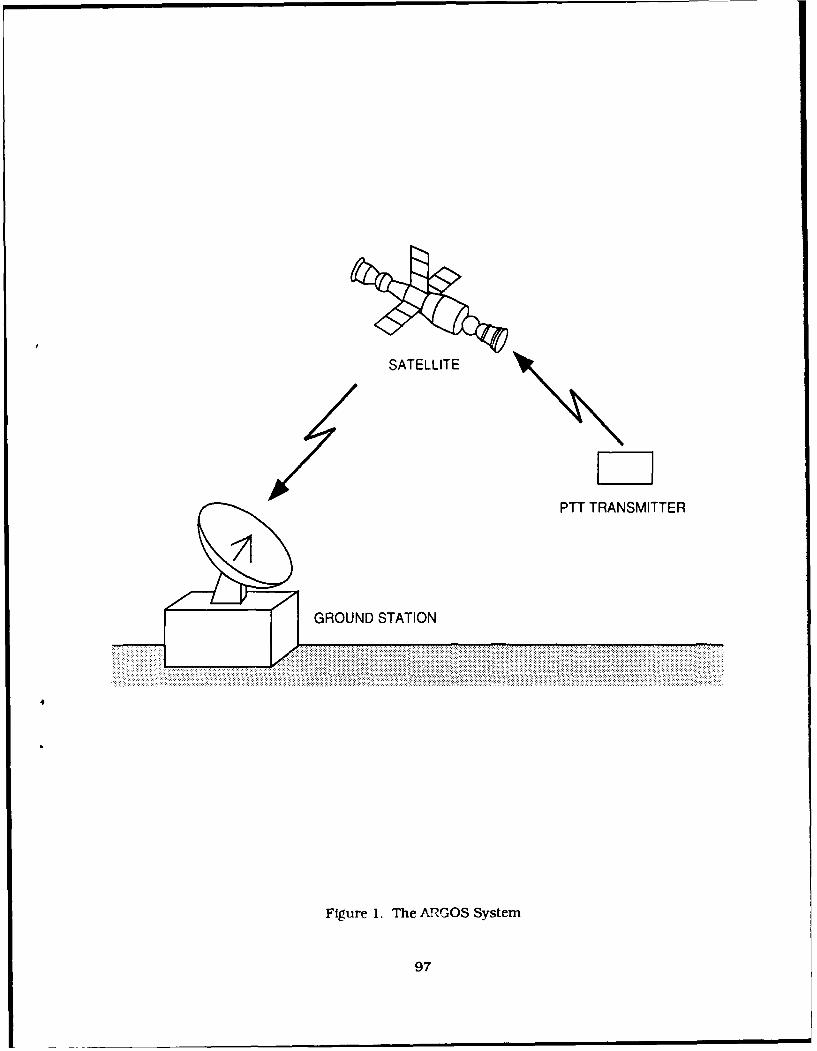
SATELLITE
PT TRANSM ITTE
Figure 1. The APG.'OS System
97
ANTENN
PTT TRANSMITTER
Figure 2. ARGOS Transmitter and Antenna
98
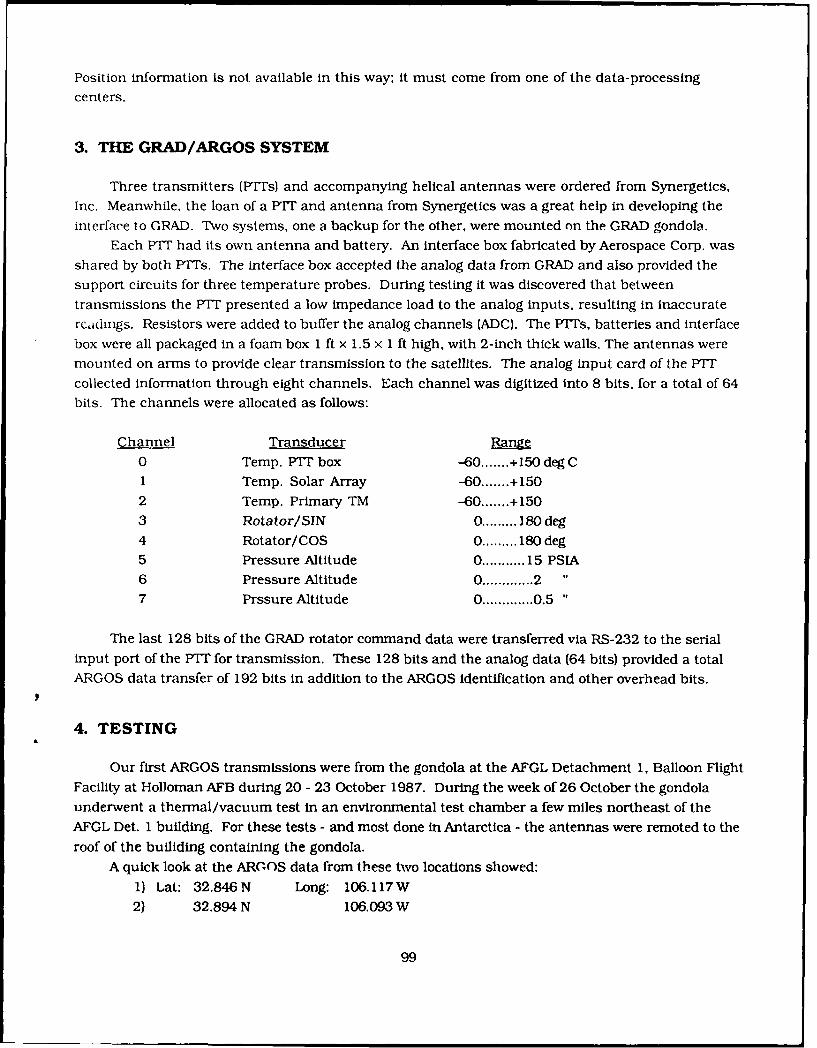
Position information is not available in this way; it must come from one of the data-processing
centers.
3. THE GRAD/ARGOS SYSTEM
Three transmitters (PT-s) and accompanying helical antennas were ordered from Synergetics,Inc. Meanwhile, the loan of a PTT and antenna from Synergetics was a great help in developing theinterface to GRAD. Two systems, one a backup for the other, were mounted on the GRAD gondola.
Each PT had its own antenna and battery. An interface box fabricated by Aerospace Corp. wasshared by both PTrs. The interface box accepted the analog data from GRAD and also provided thesupport circuits for three temperature probes. During testing it was discovered that betweentransmissions the PTT presented a low impedance load to the analog inputs, resulting in inaccuratereadings. Resistors were added to buffer the analog channels (ADC). The PTrs, batteries and interfacebox were all packaged in a foam box 1 ft x 1.5 x 1 ft high, with 2-inch thick walls. The antennas weremounted on arms to provide clear transmission to the satellites. The analog input card of the PTTcollected information through eight channels. Each channel was digitized into 8 bits, for a total of 64bits. The channels were allocated as follows:
Channel Transducer Range0 Temp. PTT box -60 ....... +150 degC1 Temp. Solar Array -60 ....... +1502 Temp. Primary TM -60 ....... +150
3 Rotator/SIN 0 ......... 180 deg4 Rotator/COS 0 ......... 180 deg5 Pressure Altitude 0 ........... 15 PSIA6 Pressure Altitude 0 ...... 27 Prssure Altitude 0 ............. 0.5
The last 128 bits of the GRAD rotator command data were transferred via RS-232 to the serialinput port of the PT1T for transmission. These 128 bits and the analog data (64 bits) provided a totalARGOS data transfer of 192 bits in addition to the ARGOS identification and other overhead bits.
4. TESTING
Our first ARGOS transmissions were from the gondola at the AFGL Detachment 1, Balloon FlightFacility at Holloman AFB during 20 - 23 October 1987. During the week of 26 October the gondolaunderwent a thermal/vacuum test in an environmental test chamber a few miles northeast of theAFGL Det. 1 building. For these tests - and most done in Antarctica - the antennas were remoted to theroof of the builiding containing the gondola.
A quick look at the ARGOS data from these two locations showed:1) Lat: 32.846 N Long: 106.117W2) 32.894 N 106.093 W
99
These values were obtained by averaging several hours of data. On the earth's surface, along aline of latitude, the distance in nautical miles (nm) is approximately equal to the arc length in
minutes times the cosine of the latitude; similarly, along longitude, distance in nm equals the arclength in minutes. The observed change, above, corresponds to movement of 2.8 nm to the north and
1.4 nm to the east - a reasonably accurate assessment.For the tests in Antarctica. an ARGOS file receiving station (a Compaq computer with modem
and phone) was set up at Aerospace Corporation in California. The information was disseminated viaTYMNET from the Service ARGOS computer. The data was stored on floppy disks. No direct accesswas made from McMurdo Station. There was an existing ARGOS VHF receiving system in the weather
station at McMurdo Station to gather data from unmanned weather monitors. Mr. G. Weidner, Univ.of Wisconsin, reprogrammed this system so that it would also print out data from the GRAD PTT's. Weused it to check whether the satellite was receiving the PTI data, without having to rely on
communications with the USA, and also to collect TM data (but not position) during the initial phaseof the balloon flight while the balloon and the VHF receiving station were both within line-of-sight of
the satellite.PiTs were often exercised to make sure that nothing had gone wrong during transportation to
Antarctica, and to check out the Aerospace Corp. data center. The ADC was calibrated by holding theinput voltage to a fixed value and decoding the received signal at Aerospace. Most conversions were
good to 0.01 volts. However, we noticed that channel 0 had a lower than usual input impedance andneeded an added calibration to ascertain the deviation. The first order correction for this channel is
made by adding 10 to the decimal value of the 8-bit word.
ARGOS positions with the gondola at McMurdo Station and at Williams Field place WilliamsField about 4.1 nm east and 0.5 nm north of Mc Murdo, in good agreement with maps of the area.
5. GRAD FLIGHT DATA
Most files processed during the flight were "TX" files. (The "DS" files were accessed occasionally
to search for more detailed information.)For each passage of the satellite a data group was received. Each TX file also included the
following information:
1. Identification code of the PIT2. Latitude in degrees3. Longitude in degrees4. Quality of the transmission
5. Day the transmission was made6. Time of the above day in UT7. Day the position fix was made8. Time of the above davIn IT9. Number of identical PT" information sets received by the satellite within one passage
100
6. DATA ANALYSIS AND DISCUSSION
6.1 Balloon Trajectory
The location data of the gondola were sorted using the quality factor of the transmission, and
averaged over the information from both PTrs. The balloon traversed about 76 degrees of the arc
along the 78 deg S latitude line, covering about 950 nm in about 3 days. Average speed was 13 knots.
6.2 Temperature Sensors
The ADC channel outputs were converted to temperature by the fonnula: Temp deg C = (ADC
output (volts) - 2.73)* 100. The temperature inside the ARGOS box varied between 2 and 48 deg C. The
back side of the solar cell array reached temperatures as high as 60 and as low as 0 deg C. (The
telemetry records indicated the array reached 90 deg C.) It is suspected that this temperature probe didnot have good thermal contact with the array. The primary TM box was about 70 deg C at 12 hours
after launch; then the temperature reading drastically dropped. (This is probably due to thetransmitter being shut off.)
6.3 Rotator
The observed outputs varied between 1.5 and 3.5 volts, as expected. The flight data taken atMcMurdo via S-band TM must be used to correlate this information.
6.4 Altitude Sensors
The data from the set of three AFGL pressure-altitude sensors were read out continuously. TheADC outputs are translated to altitude by the use of a table. Altitude values agreed well with otherindependent measurements when these were available.
6.5 GRAD Commands
The 128-bit command display was intended as a backup monitoring system to observe rotator
command words. The PTrs transmitted the last 128 bits they received. This transmission wasasynchronous to the commands and resulted in mostly O's with occasional l's. Time constraints did
not allow checkout before the flight. This connection did confirm that commands were being sent, butinterpretation of the data has not been possible.
7. CONCLUSIONS
The ARGOS system enabled us to monitor the location ot the balloon gondola and to acquire
some useful housekeeping information during the flight. When the flight was terminated, the gondolaparachuted down to a plateau west of Vostok, the Russian station. Since the PTrs were still
transmitting from the gondola on the ground, we could determine the location of the gondola and its
101
altitude. The location was: Lat. 78.23 deg S, Long. 90.07 deg E, altitude 13,000 ft (pressure altitude
based on 1976 Standard Atmosphere). After recovery of the gondola, it was reported that the locationwas correct but the correct altitude was 12.500 ft - an acceptable discrepancy. The ARGOS system
worked well, with little impact on GRAD system operations.
102
Acknowledgements
R_ Koga, Aerospace Corporation, designed the ARGOS system for GRAD and set up and operated
the data-gathering station at Aeospace during the flight. AFGL provided the mounting and interface tothe GRAD gondola. G. Weidner, University of Wisconsin, set up the VHF receiving station for GRAD atMcMurdo station.
*US. GOVERNMENT PRINTING OFFICE. " -
103