Embed Size (px)
Citation preview

AIR EMISSIONS FROM MULTIPLE HEARTH
SLUDGE INCINERATION: A PROCESS APPROACH
WALTER R. NIESSEN Camp Dresser & McKee Inc.
Boston, Massachusetts
ABSTRACT
The draft regulations (40 CFR Part 503) proposed by EPA for sludge incineration and the increasing scrutiny in NPDES permit renewal activities of the emissions from sludge incineration demand a better understanding of the air pollutant generation and control characteristics of these systems. With such knowledge, engineers and owners can design and operate their systems to minimize emissions and substantially mitigate potential health effects.
With this goal in mind, 154 sets of multiple hearth furnace process and emissions data were analyzed (55 sets of uncontrolled emission data, 99 sets of controlled emission data with 45 sets of matched inlet-outlet data for the same unit and sludge). The analysis sought correlations between design and operating configuration and emissions/ control efficiency. The results supported the formulation of generation/control algorithms for 17 pollutants (TSP, NO", S02' S03' CO, THC, PCDD, PCDF, As, Be, Cu, Ni, Cd, Pb, Hg, Cr and Zn). These algorithms were incorporated into a proprietary computer model (MHF.EXE) which includes: basic heat and material balances (for furnace, afterburner, scrubber and subcooler), followed by emission and control estimators, a stack dispersion estimator (including both downwash and elevated plume models), and current cancer risk potency slopes
47
and toxicity limits (supporting a simplified but direct health risk output).
MHF.EXE operates such as to allow the user to perform "what-if" evaluations of the net change in health impact of changes in furnace conditions, sludge composition, stack height and velocity, afterburner temperature, etc. From the results, optimal conditions for both permit qualification tests and / or steady state operations can be developed.
The paper presents the emission and control correlations and discusses the modeling results with reference to a specific furnace-emissions situation.
INTRODUCTION
MHF.EXE is founded on a process-based analysis of MHF emission data which produced quantitative relationships between design and operational parameters and emissions. The emission relationships are processed in a subsequent program module to estimate the ground level concentration (GLC) of 17 pollutants as a function of wind speed and atmospheric stability conditions. Building downwash effects are considered in the dispersion analysis. Then, using: (a) the toxicity health risk Reference Dose (RfD) factors for the toxic pollutants arsenic, beryllium, cadmium, chromium, lead, mercury, nickel and polychlorinated dioxins and
furans (PCDD, PCDF); and (b) the cancer risk potency factors for the key carcinogenic pollutants (arsenic, nickel, cadmium, chromium, beryllium and PCDD/PCDF), a GLC-weighted net health impact parameter (Figure-of-Merit or FOM) for both toxic and carcinogenic impacts are calculated. Overall, therefore, the model is given the basic sludge, incinerator and meteorological scenario as input and outputs a direct measure of health impact. One can then vary the scenario and follow the changes in the FOM. Such a "what-if?" analysis enables one to rapidly assess the value of operational changes, to visualize the impact of changes in sludge quality through enhanced industrial pretreatment programs, to quantitatively judge the merit of capital improvements, etc.
PROGRAM DESCRIPTION AND DERIVATION
Heat and Material Balance Module
The heat and material balance calculations used in MHF.EXE are straightforward. They draw on input data for sludge chemistry, moisture content and heating value; and target overall MHF excess air and tophearth temperature. Calculations are made to estimate the temperature and flue gas flow rate at the combustion hearth. The conditions at the combustion hearth are calculated by assuming that at that point in the furnace the sludge has a moisture content of 47% and the full excess air quantity is present. The effective moisture content corresponding to the combustion hearth heat balance was estimated from an analysis by Lewis and Lundberg [27] which is in general agreement with observations of operating furnaces.
The calculations continue with an estimation of the fuel needs to attain the input top hearth temperature. Provisions exist to add an afterburner and/or boiler. Air pollution control options include a wet scrubber or an electrostatic precipitator. Stack gas subcooling and stack gas reheat (with steam, hot air addition or fuel firing) are options. Stack height and building dimensions are also variables.
Emission Correlation Module
The relationships between uncontrolled pollutant emissions and design / operating conditions are complex. The carry-over of particulate, the formation of carbon monoxide and other combustible pollutants, the emission patterns of the key toxic metals and so forth change in a nonlinear manner and in response to different system variables. Therefore, a substantial data base which includes both emission and system variables
48
is needed to characterize system behavior. Also, the data must be both ahead of (the uncontrolled emission rate) and following (the controlled emission rate) the air pollution control device such that insightful systememission relationships may be developed.
To conduct this analysis, a data base which included 55 sets of uncontrolled emission data and 99 sets of controlled emission data were assembled (Refs. 1-26). The data include 45 inlet/outlet data pairs such that control relationships can be analyzed for the same system, sludge and the same sampling/analysis organization.
As with all "real world" data sets, the data vary in an unknown way with the sophistication of the testing firms and vary in completeness relative to the need for a comprehensive set of design, operating and emissions information. While often frustratingly incomplete or clearly including either inaccuracies or assumptions (rather than hard data), the data base supported what appear to be reasonable and useful correlations.
In general, the analysis was conducted by devising possible process variable-emission relationships and then testing the statistical significance of correlations using the coefficient of determination (COD or rsquared) for the least squares fit of the data for differing functional relationships. The scatter inherent in such a group of data from different testing firms, furnaces etc. regularly led to low COD values (say, 0.3-0.7), so graphical visualization of the degree of fit supplemented the purely mathematical test.
The discussions which follow and, where applicable, the attached graphs show the basic uncontrolled emission correlations for TSP, carbon monoxide, total hydrocarbons (THC), nitrogen oxides, the polychlorinated dioxins and furans and the key metals.
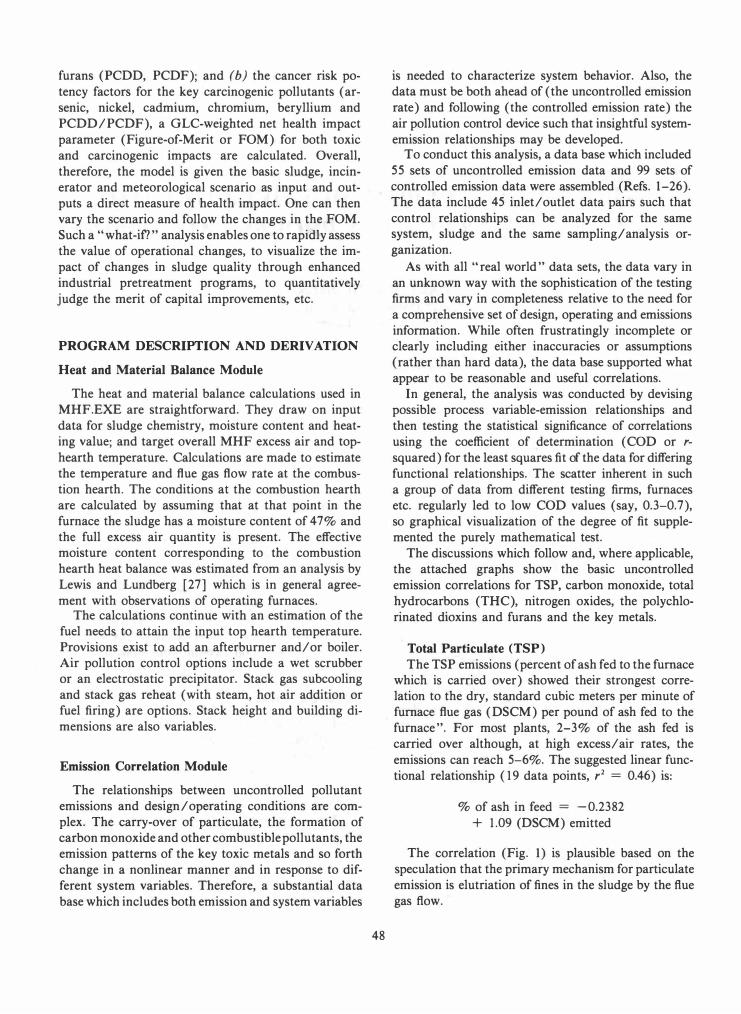
Total Particulate (TSP) The TSP emissions (percent of ash fed to the furnace
which is carried over) showed their strongest correlation to the dry, standard cubic meters per minute of furnace flue gas (DSCM) per pound of ash fed to the furnace". For most plants, 2-3% of the ash fed is carried over although, at high excess/air rates, the emissions can reach 5-6%. The suggested linear functional relationship (19 data points, r2 = 0.46) is:
% of ash in feed = -0.2382 + 1.09 (DSCM) emitted
The correlation (Fig. I) is plausible based on the speculation that the primary mechanism for particulate emission is elutriation of fines in the sludge by the flue gas flow.
7.00
0 6.00
r-.
1J U
.... 5.00 p
.!J
.... V
0
� 0 '-./
1J 4.00 u
.... ....
. -E
w
..t:
� 3.00 0
� 0 C
2.00
0
� p
n n 0 0 0
0 0 0
/ 0
0 1.00
1 2 3 4 5
Furnace Gas Flow (dry cu.m./lb ash fed)
FIG. 1 TSP EMISSION CORRELATION
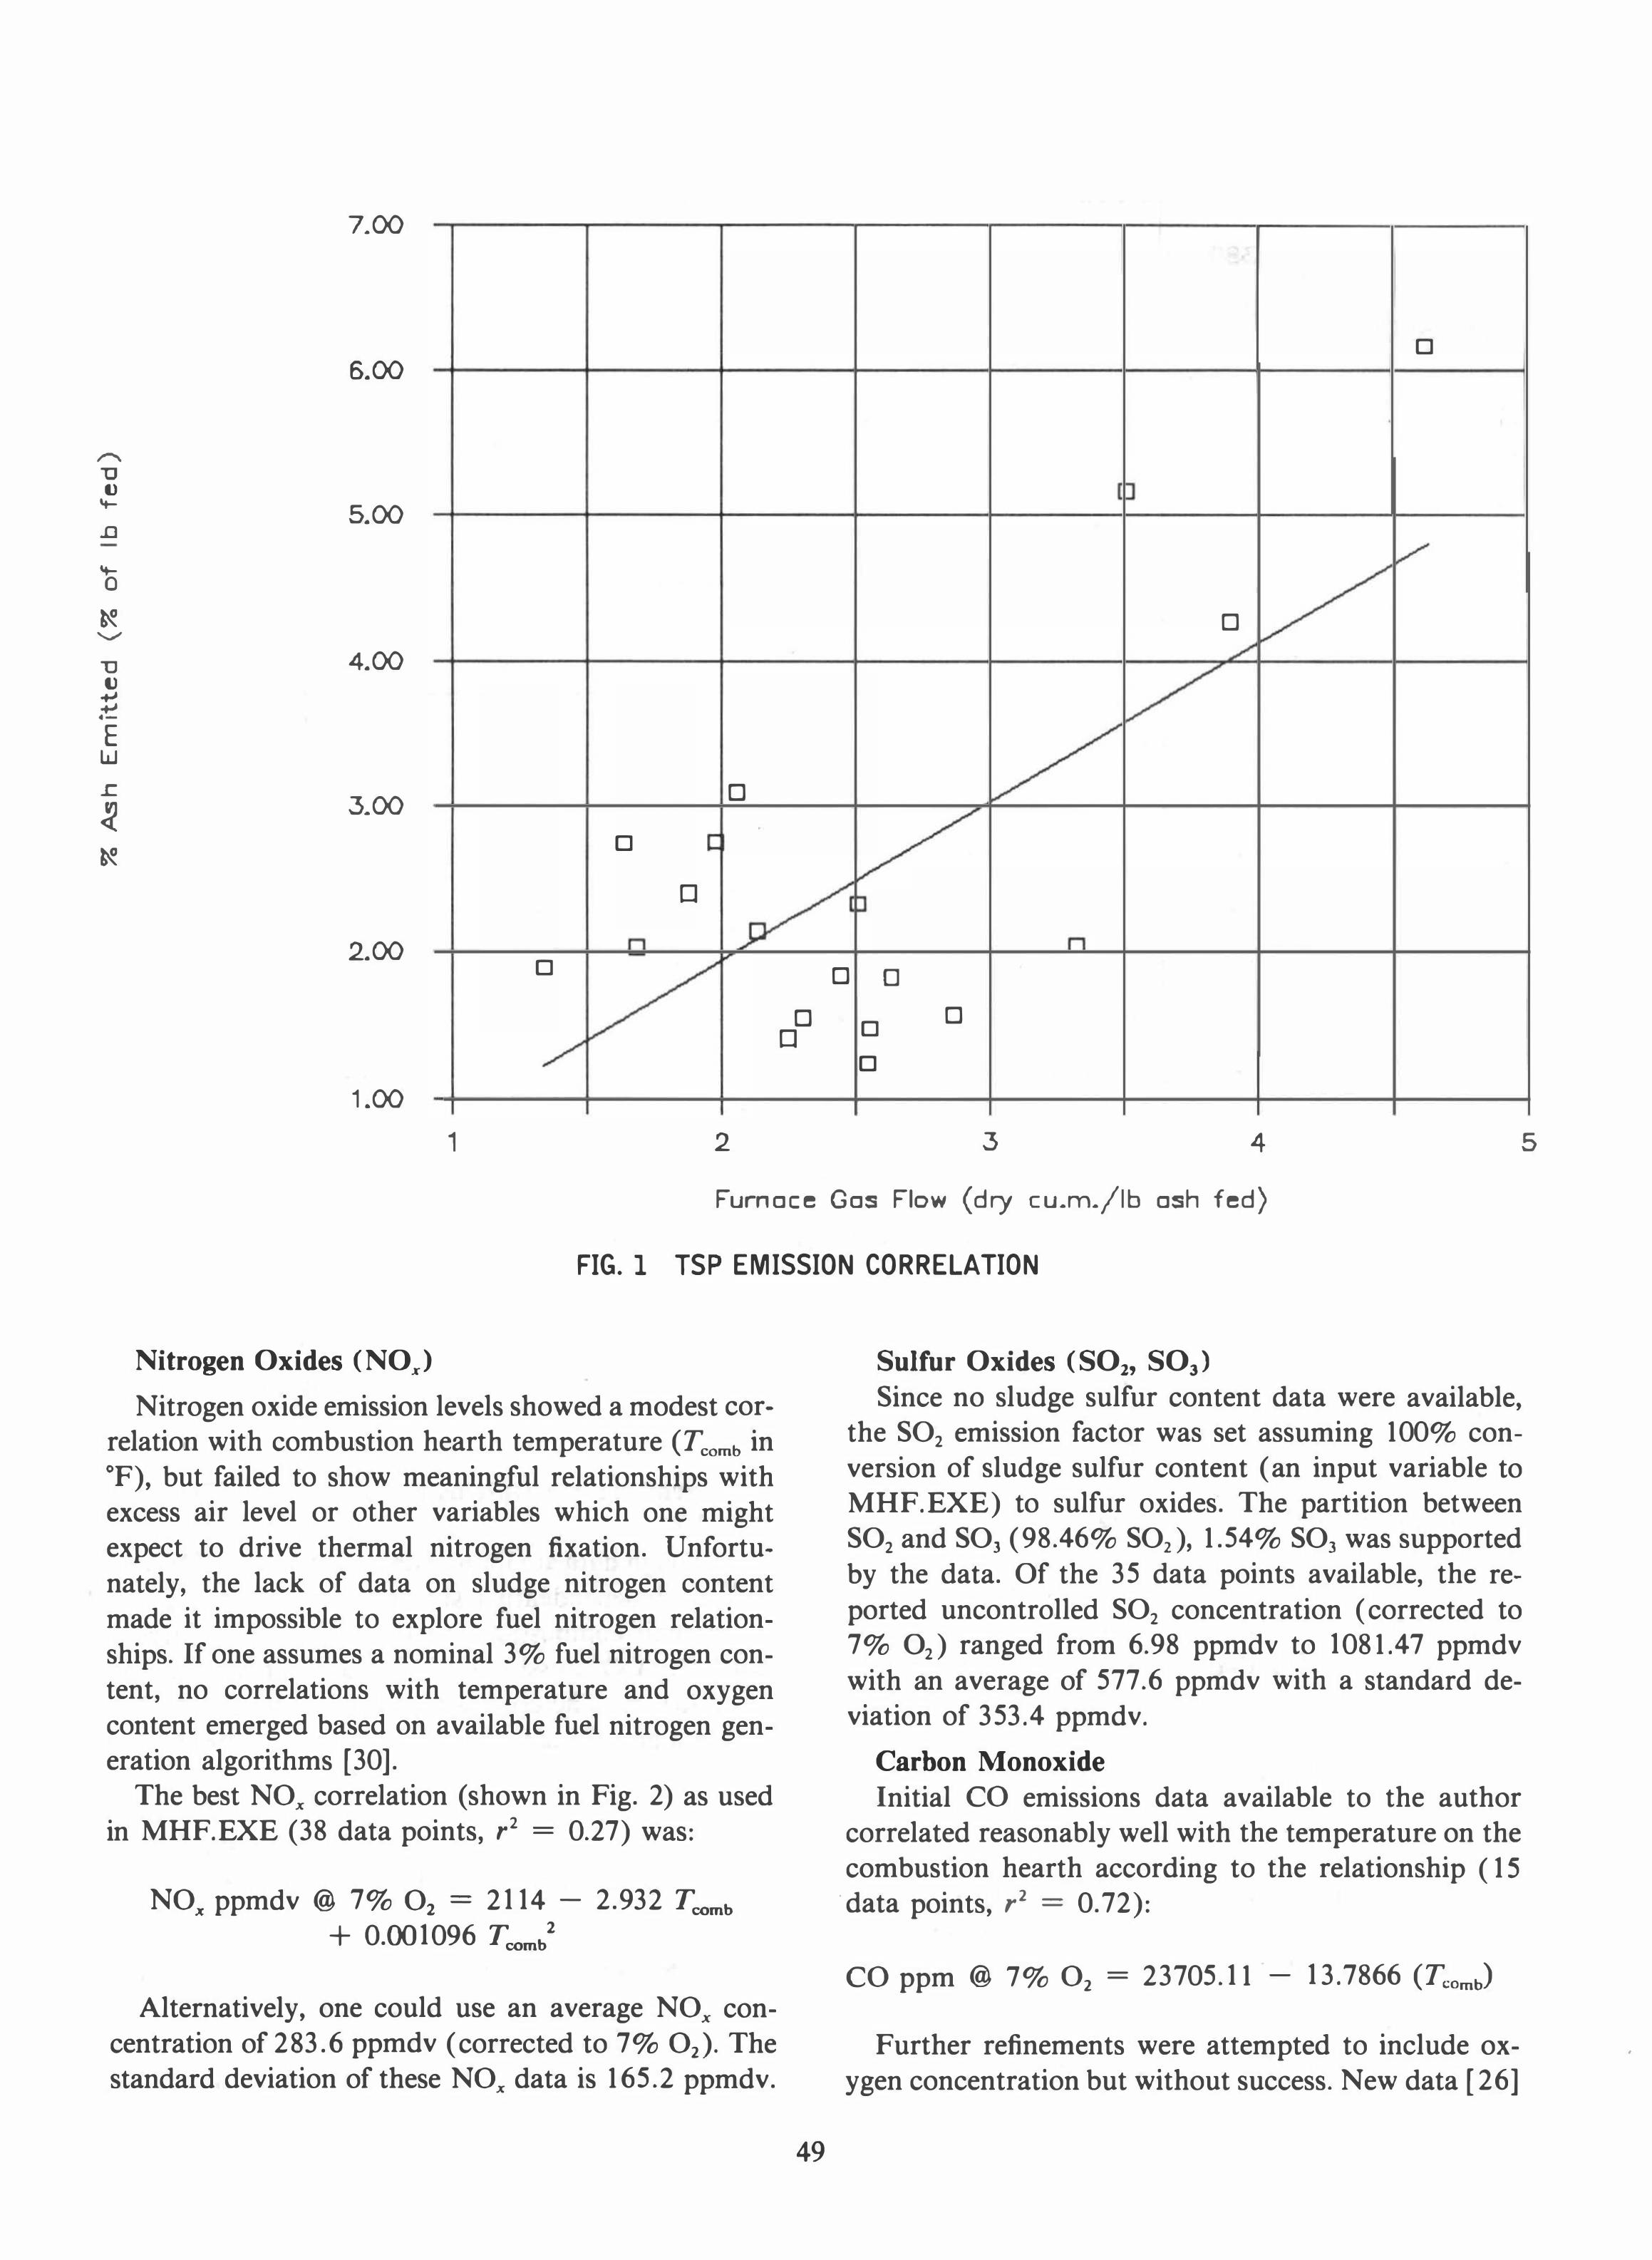
Nitrogen Oxides (NO)
Nitrogen oxide emission levels showed a modest correlation with combustion hearth temperature (Tcomb in OF), but failed to show meaningful relationships with excess air level or other variables which one might expect to drive thelmal nitrogen fixation. Unfortunately, the lack of data on sludge nitrogen content made it impossible to explore fuel nitrogen relationships. If one assumes a nominal 3% fuel nitrogen content, no correlations with temperature and oxygen content emerged based on available fuel nitrogen generation algorithms [30].
The best NOx correlation (shown in Fig. 2) as used in MHF.EXE (38 data points, ,
2 = 0.27) was:
NOx ppmdv @ 7% O2 = 2114 - 2.932 Tcomb + 0.001096 Tcomb2
Alternatively, one could use an average NOx concentration of 283.6 ppmdv (corrected to 7% O2), The standard deviation of these NOx data is 165.2 ppmdv.
49
Sulfur Oxides (S02' S03)
Since no sludge sulfur content data were available, the S02 emission factor was set assuming 100% conversion of sludge sulfur content (an input variable to MHF.EXE) to sulfur oxides. The partition between S02 and S03 (98.46% S02)' 1.54% S03 was supported by the data. Of the 35 data points available, the reported uncontrolled S02 concentration (corrected to 7% O2) ranged from 6.98 ppmdv to 1081.47 ppmdv with an average of 577.6 ppmdv with a standard deviation of 353.4 ppmdv.
Carbon Monoxide
Initial CO emissions data available to the author correlated reasonably well with the temperature on the combustion hearth according to the relationship (15 . data points, ,2
= 0.72):
CO ppm @ 7% O2 = 23705.11 - 13.7866 (Tcomb)
Further refinements were attempted to include oxygen concentration but without success. New data [26]
•

400 p 380
360
340 ,.-,. 0 N
320 0
� 300 ,.....
>' 280 E 0.. 0.. 260 '" c 240 0
� a 220 L +' C Il 200 u c 0
0 2 w
/ 0 [D
/ 0 L
� V �
0 o ,.., ./
n / eVc .,D 180 0
6 160 0 �D
I-z 0 140 u
120
100
0 L..J 0 0 0 n-.
Dt]
80
1.300 1.500 1.700
Combustion Hearth Temperature (F)
FIG.2 NO. VS COMBUSTION HEARTH TEMPERATURE
significantly blurred the correlation (Fig. 3). Exploration of alternate correlations (Fig. 4) indicated a superior correlation between CO and the furnace volumetric flow rate (actual cubic meters/minute) at Tcomb (32 data points, r2 = 0.82):
CO ppm @ 7% O2
= 1/[0.0001996 + 0.2677E-6 (acmm)]
The physical sense of the correlation is uncertain but it is speculated that the relationship reflects turbulence effects and/or, perhaps, the effect of the furnace size. Attempts at correlation with oxygen concentration and top hearth temperature were unfruitful.
Total Hydrocarbons (THC) THC emission rate correlated well with CO emis
sions. (14 data points, r2 = 0.71). The data shown in Fig. 5 are correlated by:
THC ppmv @ 7% O2 = 3.14E-4 (CO ppmv @ 7% 02r64�
50
Surprisingly, THC versus temperature correlation was far inferior to that with CO. Correlations with either temperature or oxygen concentration were very poor.
Polychlorinated Dioxins and Furans (PCDD/ PCDF)
Although data are limited and scattered, PCDD and PCDF (independently) showed some limited correlation with combustion hearth temperature. Correlations with CO emission rate were adequate but showed more scatter. The correlations for PCDD and PCDF (10 data points each, r2 = 0.22 and 0.32 respectively) are:
PCDD ug/kg sludge = 0.3816E3exp[ -.005778Tcomb] PCDF uglkg sludge = 0.3142E4exp[ -.006075 Tcomb]
Metals (Arsenic, Beryllium, Cadmium, Chromium, Copper, Lead, Mercury, Nickel and Zinc)
The metallic emissions showed, in general, a varying sensitivity to the combustion hearth temperature. Es-

(ppm CO @7% 02 vs Tcomb.) 8,000
0
7,000
6,000
r.. >
"U 0 0 E 5,000 a. !u [ a. ....... C'I 0 4,000
0 0 n
[ L.. �
� 0 "
0
..... 0 3,000
0 0
0 0 ()
2,000 0 DO D
r � 0 0 0 0 0
0 00 p°rlf 1,000 � m-'
0 0
1,200 1,400 1,600 1,800
Combustion Heorth Temperoture (F)
FIG.3 CO BURNOUT CORRELATION
51

4,500
oP 4,000
0
3,500
;--.. 0 >
1J E 3,000 a. a. '-"" N 0 2,500
\
� �
� " ..... 0 2,000 0 0
1,500
1,000
� §
0
� 0 l
� 0
� � '-....
u � r--- 0 0 CIlJ ----
-- ] r---
0 �
500
400 800 1,200 1,600 2,000 2,400 2,800 3,200
Gas Flow Rate (acm/m at hearth temp.)
FIG.4 CO TURBULENCE CORRELATION
52

600
500 r-..
C'l 0 � t'-
400 >
"U
E a.
a. '-'"
c 300 0
. -
.....
0 L
.....
C
U
U
c
0 200
() () I t-
100
o o
u
/'
V 0
c 0 / 0 0 .-/
1' ....... 0
1 ,000 2,000 3,000
CO Concentrotion (ppmv 7% 02)
FIG.5 CORRELATION OF THC WITH CO
53
0
[
0 p
� 0
4,000 5,000

r.. � '-" L 0 -+' U 0
u.. -+' c Il E
.r:: u
'c c I.LJ
1400%
1300%
1200%
1100%
1000%
900%
800%
700%
600%
500%
400%
300%
200%
100%
1,320
[
[
./ V
1,360
/' V
V � V
n 0
1,400 1,440
p
0
./ I--
0 V
/ 0
/ V n
/'" V
./ V
P 0
1,480 1,520 1,560 1,600 1,640
Combustion Hearth Temperoture (F)
FIG.6 ARSENIC EMISSION ENRICHMENT
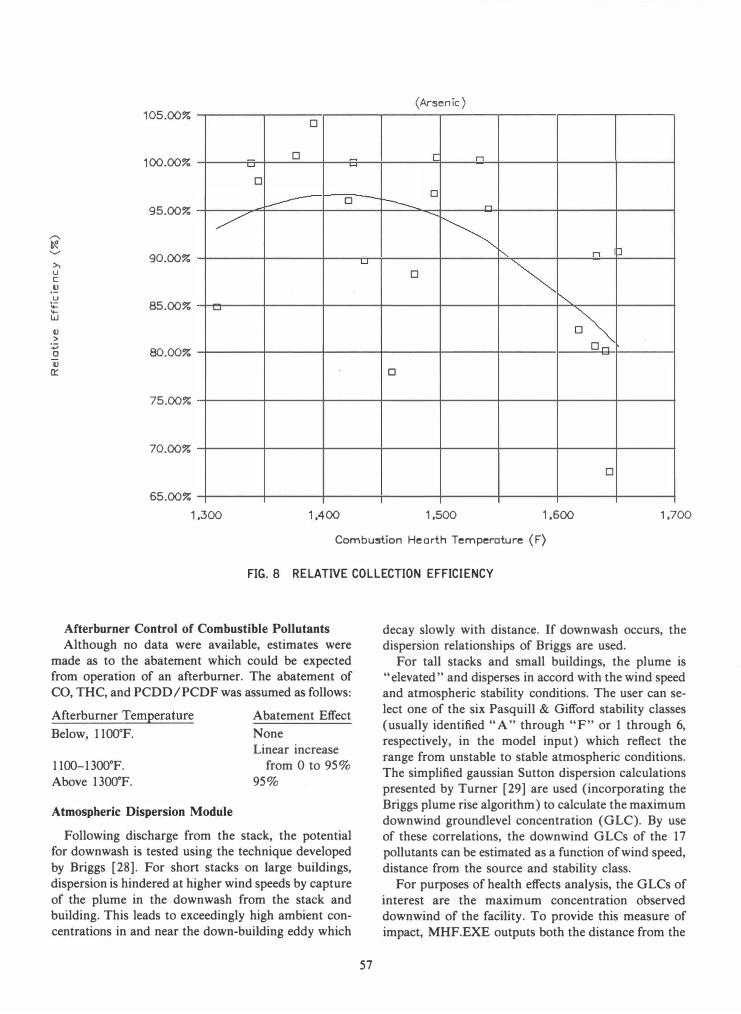
pecially for the elements known to exhibit volatilization (arsenic, cadmium, zinc and lead), uncontrolled emissions calculated as a fraction of the element fed to the incinerator increased as hearth temperature increased. The more refractory compounds of beryllium, copper, chromium and nickel showed lesser sensitivity. The relative temperature sensitivity shown in the data was fully in line with expectations.
The parameter selected for correlation was the " enrichment factor" for the emissions: the multiple of the particular metal emission that is found in the uncontrolled furnace off-gas which one would associate with the TSP emission rate at feed sludge metal concentrations. These factors range from near unity for beryllium, copper etc. to over lO-fold for arsenic and cadmium at elevated temperatures. For the special case of mercury, it was assumed that 100% of the feed metal is emitted.
Arsenic Above 1400°F, arsenic showed a strong combustion
54
hearth temperature sensitivity (see Fig. 6). The enrichment factor (EF-As) plotted on Fig. 6 for 12 data points (r2 = 0.46) is:
EF-As = (Tcomb - 1281.5)/37.8
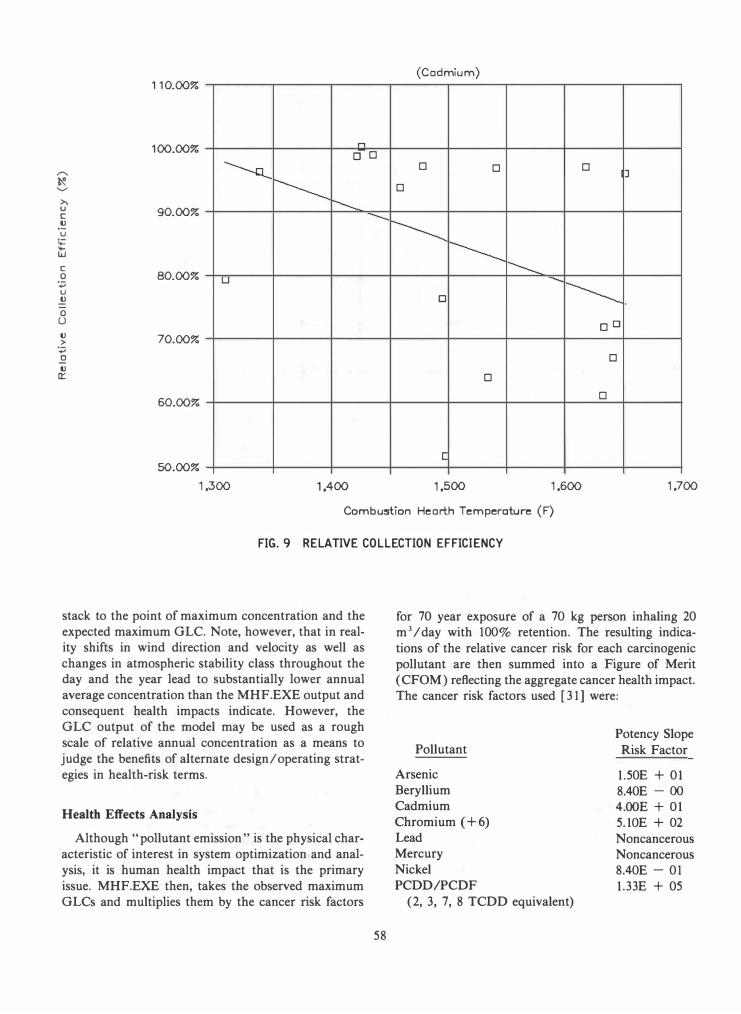
Cadmium Above 1400°F, cadmium also showed a strong com
bustion hearth temperature sensitivity, possibly due to the high vapor pressure of cadmium chloride (Fig. 7). The enrichment factor (EF-Cd) plotted on Fig. 7 for 16 data points (r2 = 0.32) is:
EF-Cd = exp[(Tcomb - 1273.42)/122.039]
Lead Paralleling experience in municipal solid waste in
cineration, lead does not show the strong temperature sensitivity seen for arsenic and cadmium. The more modest enrichment factor (EF-Pb) from 17 data points (r2 = 0.67) is:

r-.
� 'V
L
0 +'
U
a lL..
+'
c: tl
E .r: u
'c c:
LLJ
4000%
3500%
3000%
2500%
2000%
1500%
1 000%
500%
0%
1,300
0 .
61
0 -0
1,400
0
[ U
0 n
/
/ .A /U
EI
0
[ L
1,500 1,600 1,700
Combustion Hearth Temperature (F)
FIG.7 CADMIUM EMISSION CORRELATION
EF-Pb = exp[(TCO
mb - 1330.47)/170.918]
Zinc
Zinc emission data were irregular in character in attempted correlations with Tcomb' Little enrichment was observed below 1575°F and a modest enrichment above that. For temperatures above 1575°F, the following relationship roughly parallels the data:
EF-Zn (Tcomb > 1575°F) 1 + 0.016 (Tcomb - 1575)
Chromium, Copper, Nickel and Beryllium
Emission data for these metals showed no significant sensitivity to temperature. However, the data show a relatively consistent enrichment 1 depletion factor compared to the metal content in the original sludge ash. These factors are:
55
No. Enrichment Data Std. Dev.
Element Factor Points (% of Avg.)
Chromium 128.38% 16 34.65% Copper 94.20% 10 41.65% Nickel 110.89% 19 59.56% Beryllium 61.64% 14 74.30%
One might speculate that the lack of a temperature sensitivity for copper and nickel and the fact that the values are close to unity reflects a mix of particle sizes of the compounds of these elements in the ash slightly more finely divided than that of "typical" sludge ash. Conversely, the quite low beryllium factor suggests that the beryllium is in the coarser solids. These generalities are reasonable in that: (a) the chromium and copper are probably precipitates or scoured insoluble deposits; and (b) the beryllium probably enters the sewage as

a constituent of beryl or other sand/soil derived beryllium-bearing minerals.
Within MHF.EXE, the emission rates of these elements are calculated using the enrichment ratio multiplied by the natural sludge ash concentration of the respective elements.
Air Pollution Control Correlations
The MHF.EXE model includes correlations of the abatement efficiency of both wet scrubbers and electrostatic precipitators (ESP) relative to the 17 pollutants studied. As for the uncontrolled emissions, analysis of the data indicated variability in collection efficiency for some pollutants with differing operating conditions.
Total Suspended Particulate (TSP) Collection efficiency for TSP is an input variable for
the scrubber. Due to the several process variables known to affect scrubber efficiency (pressure drop and liquid-to-gas ratio, most importantly) and the generally inadequate documentation of the scrubber design/ operating parameters, a reliable efficiency predictor did not emerge from analysis of the data. Generalized performance algorithms for both devices are available, but without solid data against which to test them, it was decided not to incorporate them in the model at this time. For the ESP, a general correlation was incorporated assigning an efficiency of 90% per field (99% control for two fields, 99.9% control for three etc.). This ESP generalization was necessary due to the paucity of ESP collection data in sludge incineration applications.
Nitrogen Oxides (NOJ Data were lacking to evaluate average collection
efficiency for NOx' Based on the relatively high NO/ N0
2 ratio of "NOx", a maximum of about 5% in
scrubbers and no abatement in ESPs is expected. MHF.EXE assumes no NOx control .
Sulfur Oxides (S02> S03) Data indicate an average abatement of 93.43% for
S02 (24 data points, standard deviation of 11.91 % of the mean) and 77.14% for S03 (7 data points, standard deviation of 36.18% of the mean) in scrubbers. No abatement is assumed for ESPs.
Carbon Monoxide Data confirm the lack of abatement in either scrub
bers or ESPs for CO.
Total Hydrocarbons (THC) Data indicate a collection efficiency of 55% for
scrubbers and no abatement in ESPs.
56
Polychlorinated Dioxins and Furans (PCDD/ PCDF)
Although one might presume that particulate collection may result in the reduction of PCDD /PCDF, the data were too limited and the environmental importance too great to assume any abatement at this time.
Metals (Arsenic, Beryllium, Cadmium, Chromium, Copper, Lead, Mercury, Nickel and Zinc)
The collection efficiency for some metals differed in comparison to the overall TSP collection efficiency. Inlet-outlet data pairs for TSP and for the individual metals showed trends similar to those for the uncontrolled emission: sensitivity to the combustion hearth temperature for some elements, a lack of strong sensitivity for others.
Consistent with theory, one presumes that volatilization processes lead to enhanced emission rates in the hot zone with subsequent condensation on the smaller, hard-to-collect particles in the cooler regions of the system. Thus, high hearth temperatures not only increase emission but, also, decrease collection efficiency. For mercury, an average collection efficiency of 76% was observed for the scrubbers. No abatement of mercury was assumed for the ESP's.
Arsenic As for the emission correlation, sensitivity of the
scrubber efficiency to Tcomb was observed. For 20 data points, (r2 = 0.39) the relative efficiency (RE-As) as shown in Fig. 8 is given by:
RE-As = 13.91 - 0.004583 (Tcomb) - 9139/Tcomb
Cadmium Cadmium collection efficiency clearly shows deg
radation reflecting Tcomb effects (See Fig. 9), but there is more scatter (For 20 data points, y2 = 0.22). The RE-Cd is given by:
RE-Cd = 1.839 - 0.0006566 (Tcomb)
Other Metals
Scrubber No. Std. Dev. Collection Data (% of
Element Factor Points Avg.}
Chromium 73.31% 9 38.65% Copper 90.88% 13 26.16% Nickel 59.50% 12 86.93% Beryllium 100%
(est.) 3 N/A Zinc 97.70% 13 7.84% Lead 87.77% 21 16.14%
(Arsenic) 105.00%
0
100.00% 0 -=- L � L..J �
0
95.00%
r-.. � .........
90.00% >. u c
.� u
1;:: 85.00% .... w 0 >
� 80.00% D
0 � 0 --- r1
/ .......
� c::,. ...rr il LJ
� 0
I""-. �
� On 0 0:: 0
75.00%
70.00%
0
65.00%
1.300 1,400 1.500 1.600 1.700
Combustion HeDrth Temperoture (F)
FIG. 8 RELATIVE COLLECTION EFFICIENCY
Afterburner Control of Combustible Pollutants Although no data were available, estimates were
made as to the abatement which could be expected from operation of an afterburner. The abatement of CO, THC, and PCDD/PCDF was assumed as follows:
Afterburner Temperature
Below, 11 QOoF.
1100-1300°F. Above 13QOoF.
Atmospheric Dispersion Module
Abatement Effect None Linear increase
from 0 to 95% 95%
Following discharge from the stack, the potential for down wash is tested using the technique developed by Briggs [28]. For short stacks on large buildings, dispersion is hindered at higher wind speeds by capture of the plume in the downwash from the stack and building. This leads to exceedingly high ambient concentrations in and near the down-building eddy which
57
decay slowly with distance. If downwash occurs, the dispersion relationships of Briggs are used.
For tall stacks and small buildings, the plume is "elevated" and disperses in accord with the wind speed and atmospheric stability conditions. The user can select one of the six Pasquill & Gifford stability classes (usually identified "A" through "F" or 1 through 6, respectively, in the model input) which reflect the range from unstable to stable atmospheric conditions. The simplified gaussian Sutton dispersion calculations presented by Turner [29] are used (incorporating the Briggs plume rise algorithm) to calculate the maximum downwind groundlevel concentration (GLC). By use of these correlations, the downwind GLCs of the 17 pollutants can be estimated as a function of wind speed, distance from the source and stability class.
For purposes of health effects analysis, the GLCs of interest are the maximum concentration observed downwind of the facility. To provide this measure of impact, MHF.EXE outputs both the distance from the
(Codmium) 110.00%
100.00% rI o 0
........ � '" >. u 90.00% c tJ u
1;: .... w c 0 80.00%
+:0 u ..!!
� 0 0 0 � I----- 0
t::--.., ---
I-----I-----r-----.....
u .........
I-----0 0 0 DO tJ 70.00% >
+:0 0 0 tJ a:: 0
60.00% 0
[ 50.00%
1,300 1,400 1,500 1,600 1,700
Combustion Heorth Temperoture (F)
FIG. 9 RELATIVE COLLECTION E FFICIENCY
stack to the point of maximum concentration and the expected maximum GLC. Note, however, that in reality shifts in wind direction and velocity as well as changes in atmospheric stability class throughout the day and the year lead to substantially lower annual average concentration than the MHF.EXE output and consequent health impacts indicate. However, the GLC output of the model may be used as a rough scale of relative annual concentration as a means to judge the benefits of alternate design/ operating strategies in health-risk terms.
Health Effects Analysis
Although .. pollutant emission" is the physical characteristic of interest in system optimization and analysis, it is human health impact that is the primary issue. MHF.EXE then, takes the observed maximum GLCs and multiplies them by the cancer risk factors
58
for 70 year exposure of a 70 kg person inhaling 20 m J / day with 100% retention. The resulting indications of the relative cancer risk for each carcinogenic pollutant are then summed into a Figure of Merit (CFOM) reflecting the aggregate cancer health impact. The cancer risk factors used [31] were:
Pollutant
Arsenic Beryllium Cadmium Chromium (+ 6) Lead Mercury Nickel PCDD/PCDF
(2, 3, 7, 8 TCDD equivalent)
Potency Slope Risk Factor
1.50E + 01 8.40E - 00 4.ooE + 01 5.1OE + 02 Noncancerous Noncancerous 8.40E - 01 1.33E + 05

For toxic metals and compounds, MHF.EXE makes use of chronic (long-term) toxicity measures: the Reference Dose (RfD). A RfD for arsenic has not been developed; consequently, the RfD was assumed to be the Threshold Limit Value (TLV) divided by 420, as recommended by the Bay Area Air Quality Management District in San Francisco, CA. In contrast to the carcinogens, the GLC is used to generate the dosage (mg/kg/day for a 70 kg individual inhaling 20 m3 of air per day with 100% retention) and this dosage is compared with the RfD and summed to generate a toxicity figure of merit (TFOM). The TFOM thus indicates the degree of approach to the Reference Dose. The RID values used are:
Reference Dose
Pollutant {RfD2 Reference
Arsenic l.4E - 04 [32] Beryllium 5.0E - 03 [33] Cadmium 2.9E - 04 [33]
Chromium-+ 6 5.0E - 03 [33] Lead 1.4E - 03 [33] Mercury 2.0E - 02 [33] Nickel 2.0E - 02 [33] PCDD/PCDF 1.0E - 09 [33]
Model Strategy
In operation, MHF.EXE first does a hardware analysis, calculating the fiue gas quantities, hearth and offgas temperatures, fuel usage, etc. in accord with input instructions and input system configuration. As noted below, these input variables can be changed in subsequent runs. Then, based on the emission correlations, the uncontrolled emission rates are calculated for each of the 17 pollutants of interest. Control efficiencies are applied to give the net stack emission rates (grams per second). Dispersion estimates are then generated based on the input building and stack configurations and atmospheric stability class for a range of wind conditions (1-30) meters/ s). Finally, cancer and toxicity potency evaluations are made and summed to a net health risk "Figure of Merit" (TFOM and CFOM respectively).
Model Operation
To use the MHF.EXE model, an input file is prepared which inputs 44 system and sludge variables
59
when called from the opening screen instruction. Also, the file name for the output file is requested. For each run execution, MHF.EXE writes a comprehensive output file (recapitulation of the scenario for the run, emission and operating data and the GLOs and the CFOM and TFOM for the elevated plume case and, if pertinent, the downwash case. A summary of the results is written to the screen. The user can request that the summary table output to the monitor be either the down wash or forced to the elevated plume results (and can toggle between them if desired) and can have the GLC and FOM output reported either as absolute numerical values (micrograms per cubic meter, cancer incidence frequency and toxic dose approach to the RID) or as relative values normalized to the base case results (the initializing conditions read from the input file ).
After the base case has run, the operator can change one or more variables (examining the effect of higher stacks, different excess air levels etc.). The program re-executes and displays the new results. This progression can continue as long is desired. When the analysis is complete, the output file is closed and is subject to subsequent detailed review and analysis from a hard-copy printout or display on the monitor.
A sample run is appended showing as the base case an existing system configuration in California (Fig. 10). Downwash effects are seen to seriously impact on the calculated GLC's and FOM values. A second run with the "Relative Mode" option (Fig. 11) shows the effects of an elevated stack, an afterburner and higher excess air (lower combustion hearth temperature). It can be seen that the FOMC and FOMT have been reduced to 3.5% and 9.1 % of their base case values, respectively, through these changes.
SUMMARY
Given the present state of knowledge and the process complexity, it is almost impossible to use intuition to judge the consequences of system changes on the health impacts of MHF operation. Is increasing excess air helpful or hurtful? Will an incremental improvement in pretreatment have significant consequences? These are just a few of the questions now being asked. MHF.EXE offers a tool to quantify the results of various assumptions as an aid to policy formulation, system set-up, testing and operating modes and the like. With MHF.EXE engineers can now analyze many hardware and operational options at minimum cost to find the solutions to these questions.

RUN 1 RUN CONDITIONS
VARIABLE VALUE DEFINITION
6 1.0000 SLUDGE TYPE: l=RAW, 2=DIG, 3=ZIMPRO 7 .2500 PERCENT SOLIDS 8 .0200 PERCENT NITROGEN 9 1.0000 EXCESS AIR
10 84.0000 STACK HEIGHT (Ft) 11 3.4100 STACK DIAM. (Ft) 12 .4700 % SOLIDS FOR COMBUSTION 13 850.0000 TOP HEARTH TEMP (F) 14 .. 0000 PRIMARY AFTERBURNER TEMP (F) 15 .0000 SECONDARY A/B TEMP (F) 16 1.0000 APC TYPE: l=SCRUBBER, 2=ESP 17 450.0000 BOILER EXIT TEMP (F) 18 .0000 REHEAT AIR TEMP (F) 19 .0000 REHEAT AIR QUANTITY (acfm) 20 60.0000 AMBIENT TEMP (F) 21 350.0000 ASH DISCHARGE TEMP (F) 22 1.0000 FUEL TYPE: l=GAS, 2=#2 OIL 23 .7000 PERCENT VOLATILE 24 10000.0000 BTU PER LB. VOLATILE 25 16000.0000 WET Lb/Hr SLUDGE FEED RATE 26 4.0000 ATMOSPHERIC STABILITY CLASS 27 .0050 PERCENT SULFUR 28 1.8400 mg/kg CADMIUM IN DRY SLUDGE 29 8.0000 mg/kg NICKEL IN DRY SLUDGE 30 .2000 mg/kg CHROMIUM IN DRY SLUDGE 31 1.2400 mg/kg ARSENIC IN DRY SLUDGE 32 15.2000 mg/kg LEAD IN DRY SLUDGE 33 5.0000 mg/kg ZINC IN DRY SLUDGE 34 .4400 mg/kg MERCURY IN DRY SLUDGE 35 .4000 mg/kg BERYLLIUM IN DRY SLUDGE 36 1.0000 mg/kg COPPER IN DRY SLUDGE 37 2.0000 No. ESP FIELDS 38 110.0000 SUBCOOLER EXIT TEMP. (F) 39 70.0000 BUILDING HEIGHT (Feet) 40 215.0000 BUILDING LENGTH (Feet) 41 150.0000 BUILDING WIDTH (Feet) 42 .9570 SCRUBBER EFFICIENCY (Dec %) 43 .0100 % Cr as Cr+6 44 .0150 2, 3,7, 8-PCDD as % (PCDD+O .lxPCDF)
SYSTEM VARIABLES COMB. HEARTH TEMP. 1498.3 DEG. F TOP TEMP. c/o FUEL/H20 818.4 DEG . F BURNER FUEL .5 MMBtu/Dry Ton AFTERBURNER FUEL .0 MMBtu/Dry Ton REHEATER FUEL .0 MMBtu/Dry Ton WATER .0 Gallons/Dry Ton STACK VELOCITY 9.4 Feet/Second
FIGURE 10
60

•
RUN 1 EMISSION RATES (g/sec)
UNCONTROLLED CONTROLLED
POLLUTANT RATE POLLUTANT RATE
TSP . 2188E+04 TSP . 9407E+02
NOx . 1539E+Ol NOx . 1539E+Ol S02 . 4967E+Ol S02 . 3263E+00 S03 . 1942E+00 S03 . 5685E-Ol CO . 1536E+02 CO . 1536E+02 THC . 6408E+00 THC . 2884E+00 Be . 1798E-02 Be . 7731E-04
Cd . 8469E-Ol Cd .1537E-Ol
Ni . 6463E-Ol Ni . 2783E-Ol Cr . 1872E-02 Cr . 5588E-03
As .5113E-Ol As . 4952E-02
Pb . 2958E+00 Pb . 4735E-Ol
Zn . 3646E-Ol Zn . 1568E-02
Hg . 2220E-03 Hg . 5327E-04
CDD . 3353E-07 CDD . 3353E-07 CDF . 1767E-06 CDF . 1767E-06 Cu . 6869E-02 Cu . 2954E-03
ADDITIONAL EMISSION VALUES POLLUTANT UNITS UNCONTROLLED
TSP Ib/dry ton 8673.6750
TSP gr/dscf @ 7% 02 361. 5364
NOx ppmdv @ 7% 02 181.3860
NOx ppmv 74.9754
S02 ppmdv @ 7% 02 657.9036
S02 ppmv 271.9425
S03 ppmdv @ 7% 02 25.7255
S03 ppmv 10.6335
CO ppmdv @ 7% 02 4650.7380
CO ppmv 1922.3690
THC ppmdv @ 7% 02 338.8466
THC ppmv 140.0612
Hg grams/day 19.1770
DISTANCE TO MAXIMUM IMPACT
WINDSPEED
1. (m/sec) DOWNWASH? EFF. STACK HEIGHT
YES 7.
2.
4. 6. 8.
10.
15. 20. 25. 30.
YES 7.
YES 7. YES 7. YES 7.
YES 7. YES 7.
YES 7.
YES 7. YES 7.
FIGURE 10 (Cont'd)
61
CONTROLLED
372.9679
15.5461 132.4118
54.7320 164.7391
68.0944
6.4417 2.6626
4650.7380 1922.3690
152.4810 63.0276
4.6025
(Feet) DISTANCE
140.
140.
140. 140. 140.
140. 140. 140. 140. 140.
(Feet)
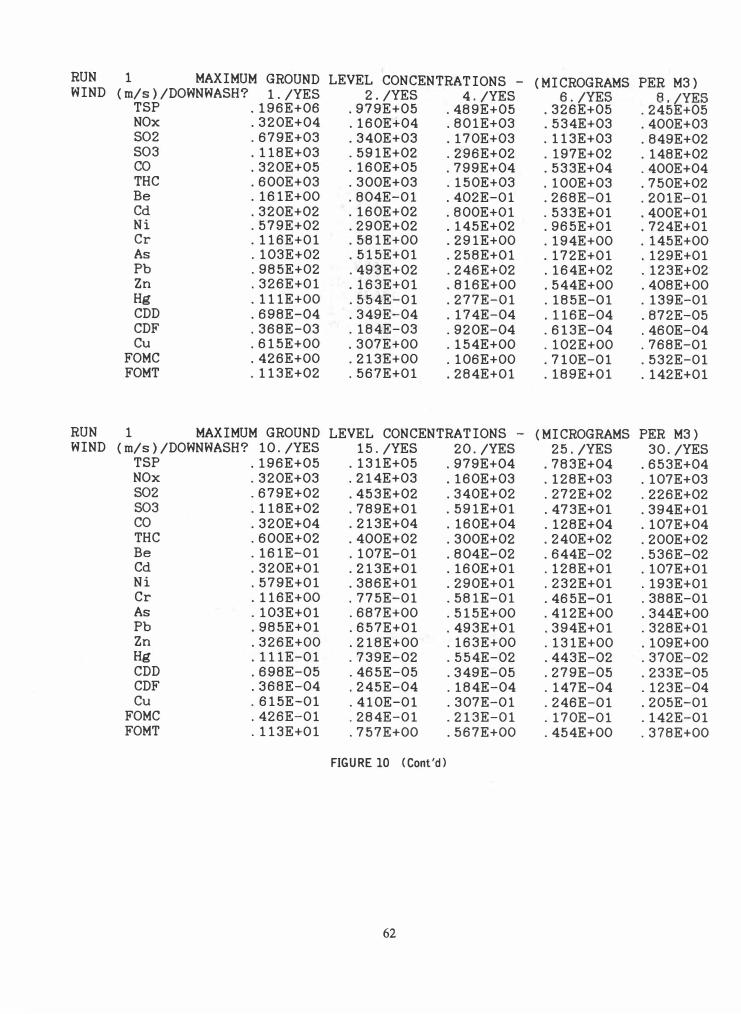
RUN 1 MAXIMUM GROUND LEVEL CONCENTRATIONS - (MICROGRAMS PER M3) WIND (m/s}/DOWNWASH? l./YES 2./YES 4./YES 6./YES e./YES
TSP . 196E+06 . 979E+05 . 489E+05 . 326E+05 . 245E+05 NOx . 320E+04 . l60E+04 .801E+03 . 534E+03 .400E+03 S02 . 679E+03 . 340E+03 . l70E+03 .113E+03 . 849E+02 S03 .118E+03 . 591E+02 . 296E+02 . 197E+02 . l48E+02 CO . 320E+05 . l60E+05 . 799E+04 . 533E+04 .400E+04 THC .600E+03 .300E+03 . l50E+03 .100E+03 . 750E+02 Be . l61E+OO .804E-Ol .402E-Ol . 268E-Ol .201E-Ol Cd . 320E+02 . l60E+02 .800E+Ol . 533E+Ol .400E+Ol Ni . 579E+02 . 290E+02 . l45E+02 . 965E+Ol . 724E+Ol Cr .116E+Ol . 581E+OO . 291E+OO . 194E+OO . l45E+OO As .103E+02 . 5l5E+Ol . 258E+Ol .172E+Ol . l29E+Ol Pb . 985E+02 . 493E+02 . 246E+02 . l64E+02 . l23E+02 Zn . 326E+Ol . l63E+Ol .816E+OO . 544E+OO .408E+OO Hg .111E+OO . 554E-Ol . 277E-Ol . l85E-Ol . l39E-Ol CDD . 698E-04 . 349E-04 . l74E-04 .116E-04 . 872E-05 CDF . 368E-03 . l84E-03 . 920E-04 . 6l3E-04 . 460E-04 Cu . 6l5E+OO .307E+OO . l54E+OO .102E+OO . 768E-Ol
FOMC . 426E+OO . 2l3E+OO .106E+OO .710E-Ol . 532E-Ol FOMT . l13E+02 . 567E+Ol . 284E+Ol . l89E+Ol . l42E+Ol
RUN 1 MAXIMUM GROUND LEVEL CONCENTRATIONS - (MICROGRAMS PER M3) WIND (m/s}/DOWNWASH? 10./YES 15./YES 20./YES 25 ./YES 30./YES
TSP . 196E+05 . l31E+05 . 979E+04 . 783E+04 . 653E+04 NOx . 320E+03 . 2l4E+03 . l60E+03 . l28E+03 .107E+03 S02 . 679E+02 . 453E+02 . 340E+02 . 272E+02 . 226E+02 S03 . l18E+02 . 789E+Ol . 591E+Ol . 473E+Ol . 394E+Ol CO . 320E+04 . 2l3E+04 . l60E+04 .128E+04 .107E+04 THC .600E+02 .400E+02 .300E+02 . 240E+02 .200E+02 Be . l61E-Ol .107E-Ol .804E-02 . 644E-02 . 536E-02 Cd . 320E+Ol . 2l3E+Ol . l60E+Ol . l28E+Ol .107E+Ol Ni . 579E+Ol . 386E+Ol . 290E+Ol . 232E+Ol .193E+Ol Cr .116E+OO . 775E-Ol .581E-Ol . 465E-Ol . 388E-Ol As .103E+Ol . 687E+OO . 5l5E+OO .4l2E+OO . 344E+OO Pb . 985E+Ol . 657E+Ol . 493E+Ol . 394E+Ol . 328E+Ol Zn . 326E+OO . 2l8E+OO . l63E+OO . l31E+OO .109E+OO Hg .111E-Ol . 739E-02 . 554E-02 . 443E-02 . 370E-02 CDD . 698E-05 . 465E-05 . 349E-05 . 279E-05 . 233E-05 CDF . 368E-04 . 245E-04 . l84E-04 . l47E-04 .123E-04 Cu . 6l5E-Ol .410E-Ol .307E-Ol . 246E-Ol .205E-Ol
FOMC . 426E-Ol . 284E-Ol .2l3E-Ol . l70E-Ol . l42E-Ol FOMT .113E+Ol . 757E+OO . 567E+OO . 454E+OO . 378E+OO
FIGURE 10 (Cont'd)
62

RUN 2
VARIABLE
6 7 8 9
10 11 12 13 14 15 16 17 18 19 20 21 22 23 24 25 26 27 28 29 30 31 32 33 34 35 36 37 38 39 40 41 42 43 44
RUN CONDITIONS
VALUE
1.0000 .2500 .0200
1.2500 160.0000
3.4100 .4700
850 .0000 1450.0000
.0000 1.0000
450.0000 .0000 .0000
60.0000 350.0000
1.0000 .7000
10000.0000 16000.0000
4.0000 .0050
1. 8400 8.0000
.2000 1. 2400
15.2000 5.0000
.4400
.4000 1.0000 2.0000
110.0000 70.0000
215.0000 150.0000
.9570
.0100
.0150
DEFINITION
SLUDGE TYPE: l =RAW, 2=DIG, 3=ZIMPRO PERCENT SOLIDS PERCENT NITROGEN EXCESS AIR STACK HEIGHT (Ft) STACK DIAM. (Ft) % SOLIDS FOR COMBUSTION TOP HEARTH TEMP (F) PRIMARY AFTERBURNER TEMP (F) SECONDARY A/B TEMP (F) APC TYPE: l =SCRUBBER, 2=ESP BOILER EXIT TEMP (F) REHEAT AIR TEMP (F) REHEAT AIR QUANTITY (acfm) AMBIENT TEMP (F) ASH DISCHARGE TEMP (F) FUEL TYPE: l=GAS, 2=#2 OIL PERCENT VOLATILE BTU PER LB. VOLATILE WET Lb/Hr SLUDGE FEED RATE ATMOSPHERIC STABILITY CLASS PERCENT SULFUR mg/kg CADMIUM IN DRY SLUDGE mg/kg NICKEL IN DRY SLUDGE mg/kg CHROMIUM IN DRY SLUDGE mg/kg ARSENIC IN DRY SLUDGE mg/kg LEAD IN DRY SLUDGE mg/kg ZINC IN DRY SLUDGE mg/kg MERCURY IN DRY SLUDGE mg/kg BERYLLIUM IN DRY SLUDGE mg/kg COPPER IN DRY SLUDGE No. ESP FIELDS SUBCOOLER EXIT TEMP. (F) BUILDING HEIGHT (Feet) BUILDING LENGTH (Feet) BUILDING WIDTH (Feet) SCRUBBER EFFICIENCY (Dec %)
,
% Cr as Cr+6 2,3,7,8-PCDD as %(PCDD+O.lxPCDF)
SYSTEM VARIABLES COMB. HEARTH TEMP. 1381.8 TOP TEMP. c/o FUEL/H20 767.0
DEG. F DEG. F
MMBtu/Dry Ton MMBtu/Dry Ton MMBtu/Dry Ton Gallons/Dry Ton Feet/Second
BURNER FUEL 1.4 AFTERBURNER FUEL 14.2 REHEATER FUEL .0 WATER .0 STACK VELOCITY 18.6
FIGURE 11
63

RUN 2 EMISSION RATES (g/sec) UNCONTROLLED CONTROLLED
POLLUTANT RATE POLLUTANT RATE TSP . 2520E+04 TSP .1084E+03 NOx .3088E+Ol NOx .3088E+Ol S02 . 4967E+Ol S02 . 3263E+00 S03 . 1942E+00 S03 . 5685E-Ol CO . 1541E+Ol CO . 1541E+Ol THC . 6427E-Ol THC . 2892E-Ol Be .2071E-02 Be . 8906E-04 Cd . 3756E-Ol Cd . 1615E-02 Ni . 7445E-Ol Ni . 3206E-Ol Cr . 2157E-02 Cr . 6436E-03 As .1042E-Ol As . 4479E-03 Pb . 1724E+00 Pb . 2759E-Ol Zn . 4200E-Ol Zn . 1806E-02 Hg . 2220E-03 Hg . 5327E-04 CDD . 9860E-08 CDD . 9860E-08 CDF . 5380E-07 CDF . 5380E-07 Cu . 7913E-02 Cu . 3402E-03
ADDITIONAL EMISSION VALUES POLLUTANT UNITS UNCONTROLLED
TSP Ib/dry ton 9990.9520 TSP gr/dscf @ 7% 02 207.5845 NOx ppmdv @ 7% 02 155 .2317 NOx ppmv 112 .2702 S02 ppmdv @ 7% 02 327.9454 S02 ppmv 237.1841 S03 ppmdv @ 7% 02 12.8234 S03 ppmv 9.2744 CO ppmdv @ 7% 02 4650.2450 CO ppmv 168 .1628 THC ppmdv @ 7% 02 338.7875 THC ppmv 245.0256 Hg grams/day 19 .1770
DISTANCE TO MAXIMUM IMPACT WINDSPEED
1. (m/sec) DOWNWASH? EFF. STACK HEIGHT
NO 194. 2. 4. 6. 8.
10. 15. 20. 25 . 30.
NO 177. NO 168. NO 166. NO 164. NO 163. NO 162. NO 162. NO 161. NO 161.
FIGURE 11 (Cont'd)
64
CONTROLLED
429.6108 8.9261
113.3191 81 .9572 82.1175 59.3909
3.2110 2.3223
232 .5123 168.1628 152.4544 110 .2615
4 .6025
(Feet) DISTANCE 4934 . 4378 . 4107. 4017. 3972. 3945. 3910. 3892. 3881. 3874.
(Feet)

WIND
RUN WIND
(m/s) /DOWNWASH? l./NO 2./NO 4./NO TSP . 283E+OO . 284E+OO . 285E+OO NOx . 492E+OO . 495E+OO . 497E+OO S02 . 245E+OO . 247E+OO . 248E+OO S03 . 245E+OO . 247E+OO . 248E+OO CO . 246E-Ol . 248E-Ol . 249E-Ol THC . 246E-Ol . 248E-Ol . 249E-Ol Be . 283E+OO . 284E+OO . 285E+OO Cd . 258E-Ol . 259E-Ol . 260E-Ol Ni . 283E+OO . 284E+OO . 285E+OO Cr . 283E+OO . 284E+OO . 285E+OO As . 222E-Ol . 223E-Ol . 224E-Ol Pb .143E+OO .144E+OO .144E+OO Zn . 283E+OO . 284E+OO . 285E+OO Hg . 245E+OO . 247E+OO . 248E+OO CDD . 721E-Ol . 726E-Ol . 729E-Ol CDF . 747E-Ol . 752E-Ol . 754E-Ol Cu . 283E+OO . 284E+OO . 285E+OO
FOMC . 350E-Ol . 353E-Ol . 354E-Ol FOMT .912E-Ol .918E-Ol .921E-Ol
2 MAXIMUM GROUND LEVEL CONCENTRATIONS -(m/s) /DOWNWASH? lO./NO 15./NO 20 ./NO
TSP . 286E+OO . 286E+OO . 286E+OO NOx . 498E+OO . 499E+OO . 499E+OO S02 . 248E+OO . 249E+OO . 249E+OO S03 . 248E+OO . 249E+OO . 249E+OO CO . 249E-Ol . 249E-Ol . 249E-Ol THC . 249E-Ol . 249E-Ol . 249E-Ol Be . 286E+OO . 286E+OO . 286E+OO Cd . 261E-Ol .261E-Ol . 261E-Ol Ni . 286E+OO . 286E+OO . 286E+OO Cr . 286E+OO . 286E+OO . 286E+OO As . 225E-Ol . 225E-Ol . 225E-Ol Pb . 145E+OO . 145E+OO . 145E+OO Zn . 286E+OO . 286E+OO . 286E+OO Hg . 248E+OO . 249E+OO . 249E+OO CDD . 730E-Ol . 731E-Ol .731E-Ol CDF . 756E-Ol . 757E-Ol . 757E-Ol Cu . 286E+OO . 286E+OO . 286E+OO
FOMC . 355E-Ol .355E-Ol . 355E-Ol FOMT . 923E-Ol . 924E-Ol . 924E-Ol
FIGURE 11 (Cont/d)
65
6 ./NO . 286E+OO . 498E+OO . 248E+OO . 248E+OO . 249E-Ol . 249E-Ol . 286E+OO . 261E-Ol . 286E+OO . 286E+OO . 224E-Ol .145E+OO . 286E+OO . 248E+OO . 730E-Ol . 755E-Ol . 286E+OO . 354E-Ol . 922E-Ol
(RELATIVE 25 ./NO
. 286E+OO . 499E+OO . 249E+OO . 249E+OO . 249E-Ol . 249E-Ol . 286E+OO . 261E-Ol . 286E+OO . 286E+OO . 225E-Ol . 145E+OO . 286E+OO . 249E+OO . 731E-Ol . 757E-Ol . 286E+OO . 355E-Ol . 924E-Ol
8./NO . 286E+OO . 498E+OO . 248E+OO . 248E+OO . 249E-Ol . 249E-Ol . 286E+OO . 261E-Ol . 286E+OO . 286E+OO . 225E-Ol .145E+OO . 286E+OO .248E+OO . 730E-Ol . 756E-Ol . 286E+OO . 355E-Ol . 923E-Ol
TO RUN 1) 30./NO
. 286E+OO
. 499E+OO
. 249E+OO
. 249E+OO
. 249E-Ol
. 249E-Ol . 286E+OO .261E-Ol . 286E+OO . 286E+OO . 225E-Ol . 145E+OO . 286E+OO . 249E+OO . 731E-Ol . 757E-Ol . 286E+OO . 355E-Ol . 924E-Ol

REFERENCES
[ 1 ] " Site 1 Draft Emission Test Report, Sewage Sludge Test Program. " Radian Corporation, Research Triangle Park, North Carolina, EPA Contract No. 68-02-6999, July 1 7, 1987.
[2] " Site 2 Draft Emission Test Report, Sewage Sludge Test Program. " Radian Corporation, Research Triangle Park, North Carolina, EPA Contract No. 68-02-6999, July 1 7, 1987.
[3] " Site 3 Draft Emission Test Report, Sewage Sludge Test Program. " Radian Corporation, Research Triangle Park, North Carolina, EPA Contract No. 68-02-6999, July 1 7, 1987.
[4] " Site 4 Draft Emission Test Report, Sewage Sludge Test Program. " Radian Corporation, Research Triangle Park, North Carolina, EPA Contract No. 68-02-6999, July 1 7, 1987.
[ 5 ] " Results of Tests on the Fluid Bed Incinerator at the Lakeview Water Pollution Control Plant. " Ontario Ministry of the Environment, February, 1986.
[6] " Greenberg, R R, Zoller, W. H., and Gordown, G. E., " Atmospheric Emissions of Elements on Particles from the Parkway Sewage Sludge Incinerator. " ES&T, American Chemical Society, 1981 .
[7] " Dewling, R. T. , and Manganelli, R. M. , and Bair, G. T. Jr. " Fate and Behavior of Selected Heavy Metals in Incinerated Sludge. " Journal WPCF 52 (no. 10, October, 1980).
[ 8 ] Trichon, M., and Dewling, R. T. " The Fate of Trace Metals in a Fluidized Bed Sewage Sludge Incinerator. " In Proceedings of the 74th Annual Meeting of the Air Pollution Control Association, Philadelphia, Pennsylvania, June 21-26, 1 98 1 .
[ 9 ] Beneyy, R . L., Knapp, K. T., and Duke, D . L. " Chemical and Physical Characterization of Municipal Sludge Incinerator Emissions. " EPA-600/ 3-84-047, March, 1984.
[ 10] " Organic and Inorganic Emissions from a Fluid Bed Sewage Sludge Incinerator at Duffin Creek Water Pollution Control Plant. " Environment Canada, Draft Report, November 1987.
[ 1 1 ] " National Dioxin Study Tier 4-Combustion Sources, Final Test Report-Site 1, Sewage Sludge Incinerator SSI-A . " Research Triangle Park, North Carolina: Radian Corporation, EPA-450/4-84-0141, April 1987.
[ 12] " National Dioxin Study Tier 4-Combustion Sources, Final Test Report-Site 3, Sewage Sludge Incinerator SSI-B. " Research Triangle Park, North Carolina: Radian Corporation, EPA-450/4-84-0141, April 1987.
[ 13] " National Dioxin Study Tier 4-Combustion Sources, Final Test Report-Site 12, Sewage Sludge Incinerator SSI-C. " Research Triangle Park, North Carolina: Radian Corporation, EPA-450/4-84-0141, April 1987.
[ 14] " Electrostatic Precipitator Efficiency on a Multiple Hearth Incinerator Burning Sewage Sludge. " Research Triangle Park, North Carolina: Radian Corporation, NTIS PB-88- 1 12 1 64, September, 1987.
[ 15 ] " Air Pollution Aspects of Sludge Incineration. " Environmental Protection Agency, EPA-625/4-75-009, June 1975.
[ 16] Farrell, J. B., and Wall, H. " Air Pollution Discharges from Ten Sewage Sludge Incinerators. " Cincinnati, Ohio: MERL, USEP A, February 5, 1981 .
[ 17 ] Copeland, B. J . " A Study of Heavy Metal Emissions From
66
Fluidized Bed Incinerators. " Oakbrook, Illinois: Copeland Systems, Inc.
[ 1 8] " Kita Tama Sesage Treatment Plant No. I, Energy-Conservation Type Sludge Cake Incinerator. "
[ 19 ] " Kitano STP, Hachioji-City. " Tokyo Engineering Consultants Co., Ltd., Sanki Engineering Co., Ltd. Water & Sewage Treatment Facilities Div., December I, 1988.
[20] "Tamagawa-jouru STP, Tokyo-Metropolitan. " Tokyo Engineering Consultants Co., Ltd., Sanki Engineering Co., Ltd. Water & Sewage Treatment Facilities Div., December I, 1988.
[ 2 1 ] " Kitatame No. I STP, Tokyo-Metropolitan. " Tokyo Engineering Consultants Co., Ltd., Sanki Engineering Co., Ltd. Water & Sewage Treatment Facilities Div., December I, 1988.
[22] " Asidagawa STP, Hiroshima-prefecture. " Tokyo Engineering Consultants Co., Ltd., Sanki Engineering Co., Ltd. Water & Sewage Treatment Facilities Div., December I, 1988.
[23] Yamada, Masaki. " Operation of Large Scale Drying-fluidized Sludge Incinerator. " NGK Bulletin No. 3.
[24] "Thermal Conversion of Municipal Wastewater Sludge, Phase II: Study of Heavy Metal Emissions. " Belle Mead, New Jersey: Nichols Engineering and Research Corp., EPA-600/2-8 1-203, September 198 1 .
[25] Washington Suburban Sanitary Commission Western Branch Wastewater Treatment Plant Incinerator Emissions Test Results, 1988.
[26] Gordon, D. " Emission Tests of the Greater Lawrence Wastewater Treatment Plant Multiple Hearth Sludge Incinerators. " December 1987.
[27] Lewis, F. M., and Lundberg, L. A. " Modifying Existing Multiple Hearth Incinerators to Reduce Emissions. " National Conference and Exhibition on Municipal Sewage Treatment Plant Sludge Management, Palm Beach, Florida, June 27-29, 1988.
[28] Briggs, G. A. " Diffusion Estimation for Small Emissions. " Air Resources Atmospheric Turbulence and Diffusion Laboratory, Oak Ridge, Tennessee: NOAA, May 1973.
[29] Turner, D. B. " Workbook of Atmospheric Dispersion Estimates. " Research Triangle Park, North Carolina: Air Resources Field Research Office, Environmental Science Services Administration, EPA Office of Air Programs, 1 970.
[30] Niessen, W. R. "Combustion and Incineration Processes, Applications in Environmental Engineering. " New York: Marcel Dekker, 1978.
[ 3 1 ] " Toxic Air Pollutant Source Assessment Manual for California Air Pollution Control Districts and Applicants for Air Pollution Control District Permits. " California Air Pollution Control Officers Association (CAPCOA). 1987.
[32]"Threshold Limit Values for Chemical Substances and P.hysical Agents in the Work Environment and Biological exposures Indices with Intended Changes for 1988- 1989. " American Conference of Governmental Industrial Hygenists (ACGIH), 1988.
[33] U.S. Environmental Protection Agency. " Superfund Public Health Evaluation Manual. " Washington, D.C.: USEPA Office of Emergency and Remedial Response, 1986.
Key Words: Emissions; Heavy Metals; Incineration; Multiple Hearth; Particulate Matter; Sludge