Embed Size (px)
Citation preview

PNNL-27464 Rev.1
Prepared for the U.S. Department of Energy under Contract DE-AC05-76RL01830
Air Dispersion Modeling of Radioactive Releases During Proposed 236Z Rubble Pile Removal Activities Report to CH2M HILL Plateau Remediation Company BA Napier JP Rishel C Arimescu EI Mart August 2018


PNNL-27464 Rev. 1
Air Dispersion Modeling of Radioactive Releases During Proposed 236Z Rubble Pile Removal Activities Report to CH2M HILL Plateau Remediation Company BA Napier JP Rishel EI Mart August 2018 Prepared for the U.S. Department of Energy under Contract DE-AC05-76RL01830 Pacific Northwest National Laboratory Richland, Washington 99352


iii
Summary This report is part of the planning process for the removal of the 236Z rubble remaining as of January
1, 2018, at the Plutonium Finishing Plant (PFP) on the Hanford Site. Pacific Northwest National Laboratory (PNNL) supports the U.S. Department of Energy (DOE) and the CH2M HILL Plateau Remediation Company (CHPRC) demolition planning effort by making engineering estimates of potential releases for various potential demolition alternatives. This report documents an analysis considering standard techniques for the removal of demolition rubble. It does not document any decisions about the removal approaches. This document is intended to guide the establishment of a boundary for the application of an air monitoring regime.
Atmospheric dispersion modeling using estimated release rates has been conducted to provide information on the location and levels of radioactive contamination that may be expected as the result of rubble removal activities. Hourly meteorological data collected over a 6-year period (2004–2009) were used to examine the effects of wind speed, direction, and stability on projected concentrations of contaminants in air and deposited on nearby surfaces.
The radioactive contamination of concern for the 236Z rubble is primarily transuranics from past operations. The source terms modeled in this report were based on the residual transuranic contamination levels that are anticipated to remain in the 236Z rubble following building demolition.
The potential airborne concentrations were established using the five-factor formula from DOE-HDBK-3010 (DOE 1994) considering material-at-risk, damage ratio, airborne release fraction, respirable fraction, and leak path factor. Radioactive contamination emissions were calculated by release mechanism and rubble pile area for on-shift and off-shift activities. The emissions from the applicable sources were combined to provide emissions estimates for each day from each cleanup area.
The U.S. Environmental Protection Agency’s (EPA’s) AERMOD computer code was used to estimate atmospheric dispersion and deposition of the released radioactive materials in the immediate vicinity of the planned rubble removal activities. The modeling was conducted to be fully representative of the range of the weather conditions that are possible (i.e., uses multiple full annual cycles of meteorological data) and representative of the expected cleanup period (i.e., models the hours of the day that rubble removal activities will occur).
Both airborne and surface concentrations were modeled with AERMOD. Hourly derived air concentrations (DAC) were modeled for an array of receptors covering the rubble pile site and surrounding area. Peak (95th and 99th percentile) values of time-integrated air concentrations at these receptor points are derived from these hourly values, with modeling results reported as total incremental air concentrations in DAC-hours occurring over the selected time period. The DAC-hours are integrated values. Air concentrations are expected to vary during the rubble removal processes. There will be transient periods with higher and lower airborne concentrations. However, since computed doses were based on integrated intake, the analysis of instantaneous airborne concentrations is not necessary. Total accumulated deposition amounts were also evaluated with AERMOD using the same array of receptors, with results reported as disintegrations per minute (dpm) per 100 cm2.
Each rubble pile was considered in terms of its size, location, and estimated contamination levels. The modeling was based on the assumed sequence of the rubble removal activities. The results in this

iv
report are based on cleanup schedules and methods proposed by CHPRC. As of January 1, 2018, there are broadly three large rubble piles (west, footprint, and east) remaining of the 236Z Building process cell. It is assumed that the overall cleanup will require either 1) 30 days over a 6-week period, or 2) 60 days over a 12-week period.
The modeling of demolition activities incorporated some assumptions based on input from CHPRC about release mitigation; use of fixatives and misting/spraying is included where applicable (misting is not used directly during the loading of wet rubble into ERDF containers). Work was assumed to be performed during 10-hour day shifts, swing shifts are not planned for the 236Z rubble removal.
The highest 95th percentile air exposure modeling results for the removal of the 236Z cell rubble are presented in Figure S.1 for the 30-day option and in Figure S.2 for the 60-day option. This rubble includes areas with the highest contamination levels in the PFP complex.
Summary Conclusion
The analysis shows that some releases of radioactive material are to be anticipated during the cleanup of the 236Z rubble piles. The modeling results presented here are closely tied to the details of how the rubble removal is to be conducted. The results indicate that for the rubble removal, the radiological exposures from the planned activities are predicted to be well below the designated limits for air and soil exposures. The cleanup of the 236Z main process cell rubble is expected to release some alpha-emitting radionuclides. However, the 95th and 99th percentile results based on 6 years of hourly climatological data, two representative cleanup periods, realistic mitigating actions, and a bounding source term indicate that concentrations at the fence line of the PFP facilities should remain well below 12 DAC-hours/week.
The results presented in this report are a reevaluation of a subset of the results presented in PNNL-20173 Rev. 4 (Napier, Rishel, and Mart 2017). The projected air concentrations and depositions from 236Z rubble removal are a small fraction of those related to the estimated releases for demolition and loadout of the 236Z Building reported therein. The projected emissions are lower because the bulk of the previous estimate resulted from removal of the strongbacks and the initial shearing of the structure; the strongbacks were removed during the building demolition and most of the shearing of the structure has been completed. In the evaluation in this current report, the loadout (removal) of the contaminated rubble was assumed to be controlled using water and fixatives that make the rubble damp, thus reducing the overall emissions.

v
Figure S.1. Predicted Weekly Air Exposure (DAC-hr/week) 95th Percentile Values for 236Z Rubble Pile Removal for the 30-day Removal Option.

vi
Figure S.2. Predicted Weekly Air Exposure (DAC-hr/week) 95th Percentile Values for 236Z Rubble Pile
Removal for the 60-day Removal Option

vii
Acknowledgments
The authors would like to extend their appreciation to Brian Oldfield and Peter Sauer of the CH2M HILL Plateau Remediation Company for financial and technical support of this work. Meteorological data from the Hanford Meteorological Station for the period was provided by Ken Burk, Pacific Northwest National Laboratory. This work was funded by CH2M HILL Plateau Remediation Company under the U.S. Department of Energy Contract DE-AC05-76RL01830.


ix
Acronyms and Abbreviations
AED aerodynamic equivalent diameter AERMOD American Meteorological Society/Environmental Protection Agency Regulatory Model ARF airborne release fraction Bq Becquerel BPIP Building Profile Input Program (AERMOD preprocessor program) CERCLA Comprehensive Environmental Response, Compensation, and Liability Act CFR Code of Federal Regulations CHPRC CH2M HILL Plateau Remediation Company Ci curie(s) cm centimeter(s) DAC derived air concentration DOE U.S. Department of Energy dpm disintegrations per minute DR damage ratio EF emission factor EPA U.S. Environmental Protection Agency ERDF Environmental Restoration Disposal Facility ft foot (feet) g gram GB Glovebox HEPA high-efficiency particulate air (filter) HMS Hanford Meteorological Station in inch(es) lb pound(s) LPF leak path factor m meter(s) MAR material-at-risk PFP Plutonium Finishing Plant PNNL Pacific Northwest National Laboratory PRF Plutonium Reclamation Facility (236Z Building) PRIME AERMOD Plume Rise Model Pu plutonium RF respirable fraction ST source term TRU Transuranic (comprised of elements with higher atomic number than uranium)


xi
Contents
Summary ........................................................................................................................................... iii Acknowledgments .............................................................................................................................vii Acronyms and Abbreviations ............................................................................................................ ix 1.0 Introduction ............................................................................................................................. 1.1 2.0 Discussion of Analysis Approach ............................................................................................ 2.1
2.1 Source Term Methodology .............................................................................................. 2.1 2.2 Air Dispersion Modeling Resulting in Air Concentration and Surface Contamination
Estimates ......................................................................................................................... 2.2 2.3 Airborne Contamination Dosimetry ................................................................................ 2.4 2.4 Summary of Anticipated Radionuclide Inventories ........................................................ 2.5 2.5 Modeling Rubble Removal ............................................................................................. 2.5 2.6 Quality Control Procedures and Documentation ............................................................. 2.7
3.0 Predicted Impacts .................................................................................................................... 3.1 3.1. Rubble Removal – Air Concentrations ........................................................................... 3.3 3.2 Maximum Air Concentrations at Facility Fence line ...................................................... 3.7 3.3 Building Demolition – Surface Deposition ................................................................... 3.11
4.0 Discussion of Results ............................................................................................................... 4.1 5.0 References ............................................................................................................................... 5.1 Appendix A Facility-Specific Source Term Analyses .................................................................... A.1 Appendix B Atmospheric Model Selection .................................................................................... B.1 Appendix C Air Dispersion Modeling Assumptions ...................................................................... C.1 Appendix D Quality Control Procedures ........................................................................................ D.1 Appendix E Input Data for 236Z Rubble Simulations .................................................................... E.1 Appendix F AERMOD Output File Listing ..................................................................................... F.1 Appendix G CAP88PC Dose Calculations for 236Z Cleanup Activities ....................................... G.1

xii
Figures Figure 1.0-1. The 236Z Rubble Prior to Soil-Cover Stabilization in Aerial View from the
Northeast (above), from the Southeast (lower left), and from the West (lower right) 1.2
Figure 2.4-1. 236Z Cleanup Zones Defined for this Analysis 2.5
Figure 2.5-1. Dust Release Rate during Active Cleanup Activities 2.7
Figure 2.5-2. Radioactive Source Term During Active Cleanup Activities 2.7
Figure 3.0-1. Base map for 236Z rubble pile locations 3.2
Figure 3.1-1. Predicted 236Z Rubble Removal 95th Percentile Weekly Air Concentrations for the 30-day removal Option 3.4
Figure 3.1-2. Predicted 236Z Rubble Removal 99th Percentile Weekly Air Concentrations for the 30-day removal Option 3.5
Figure 3.1-3. Predicted 236Z Rubble Removal 95th Percentile Weekly Air Concentrations for the 60-day removal Option 3.6
Figure 3.1-2. Predicted 236Z Rubble Removal 99th Percentile Weekly Air Concentrations for the 60-day removal Option 3.7
Figure 3.2-1. Predicted 95th Percentile Weekly Air Concentrations at the PFP Site Fence Line for Cleanup of the 236Z Rubble (DAC-hours) for the 30-day Option 3.8
Figure 3.2-2. Predicted 99th Percentile Weekly Air Concentrations at the PFP Site Fence Line for Cleanup of the 236Z Rubble (DAC-hours) for the 30-day Option 3.9
Figure 3.2-3. Predicted 95th Percentile Weekly Air Concentrations at the PFP Site Fence Line for Cleanup of the 236Z Rubble (DAC-hours) for the 60-day Option 3.10
Figure 3.2-4. Predicted 99th Percentile Weekly Air Concentrations at the PFP Site Fence Line for Cleanup of the 236Z Rubble (DAC-hours) for the 60-day Option 3.11
Figure 3.3-1. Predicted 95th Percentile Surface Deposition for 236Z from Rubble Removal for the 30-day Option 3.12
Figure 3.3-2. Predicted 99th Percentile Surface Deposition for 236Z from Rubble Removal for the 30-day Option 3.13
Figure 3.3-3. Predicted 95th Percentile Surface Deposition for 236Z from Rubble Removal for the 60-day Option 3.14
Figure 3.3-4. Predicted 99th Percentile Surface Deposition for 236Z Environmental Remediation Disposal Facility from Rubble Removal for the 60-day Option 3.15

xiii
Tables
Table 2.4-1. Anticipated Inventory of Radionuclides in Rubble of the 236Z Process Cell 2.6
Table 2.5-1 Cleanup Phases and Durations 2.6


1.1
1.0 Introduction
The Hanford Plutonium Finishing Plant (PFP), located in the 200 West Area, converted plutonium-bearing chemical solutions to metals and oxides until 1989. The current mission of the PFP requires deactivating and dismantling PFP complex systems and structures to the degree determined appropriate by the Comprehensive Environmental Response, Compensation, and Liability Act (CERCLA) process, thus eliminating significant hazard to workers, the public, and the environment and minimizing long-term surveillance and maintenance risks and costs. U.S. Department of Energy (DOE) and CH2M HILL Plateau Remediation Company (CHPRC) plans call for eventual demolition of the PFP structures. This effort includes cleanup of the rubble remaining from the demolition of the 236Z Building.
Pacific Northwest National Laboratory (PNNL) supports the demolition planning effort by making engineering estimates of potential releases of radioactive materials for various potential demolition alternatives. Atmospheric dispersion modeling has been conducted using projected release rates to provide information on the location and levels of radioactivity. This report documents an analysis for worker safety considering open-air cleanup using standard techniques. It does not document any decisions about the rubble removal approaches.
This report is part of the planning process for removing the rubble remaining from the 236Z main process cell at the PFP complex as of January 2018. This material as of January 2018 is shown in Figure 1.0-1. A number of the other structures in the immediate vicinity have been, or will be, removed before removal of this rubble occurs, including the remaining portions of the adjacent 234-5Z Building. Atmospheric dispersion calculations have been made using the AERMOD (40 CFR 51, Appendix W; EPA 2016) dispersion model developed by the U.S. Environmental Protection Agency (EPA). AERMOD is the EPA’s recommended dispersion model for regulatory applications; the model incorporates the latest understanding of atmospheric dispersion, and it explicitly accounts for building wake effects. The results from the AERMOD calculations are being used to help plan rubble removal activities that will keep potential contamination within the limits established for the project contamination area and to define exclusion zones.
The 236Z Building (also known as the Plutonium Reclamation Facility - PRF) was located south of the southeastern corner of the 234-5Z Building. The building was a four-story structure with tanks and columns used in the solvent extraction process located in the process cell—a large three-story room in the center of the 236Z Building. The rubble piles are the result of the demolition of the process cell; the remaining portions of the building have already been removed. During the final stage of demolition, the rubble was moved to allow access to the last portions of the cell walls; as a result there is now a rubble pile on the east side, a pile on the west side, and the remainder of the rubble in the original footprint of the process cell. The rubble is primarily broken concrete, with reinforcing material, metal inserts for jumper connections, and portions of the back wall of at least one gallery glovebox (GBB) intermingled.
The main report provides a description of the overall analysis approach used to evaluate the air emissions during cleanup (Section 2), the local patterns of predicted incremental air concentrations and deposition rates for removal of the rubble (Section 3), and a discussion of the results (Section 4). The appendices provide the details of the source-term analysis and atmospheric dispersion modeling. The source-term appendices include the modeling phases, source-term inventories, and cleanup options. The

1.2
air dispersion appendices include modeling assumptions as well as the AERMOD input and output file listings.
Figure 1.0-1. The 236Z Rubble Prior to Soil-Cover Stabilization in Aerial View from the Northeast
(above), from the Southeast (lower left), and from the West (lower right)

2.1
2.0 Discussion of Analysis Approach
Atmospheric dispersion modeling has been conducted in support of the cleanup of demolition rubble from the 236Z Building of the PFP complex using estimated release rates to provide information on the location and levels of radioactive contamination that may be expected as the result of cleanup activities. Hourly meteorological data collected over a 6-year period (2004–2009) was used to examine the effects of wind speed, direction, and stability on projected concentrations of contaminants in air and deposited on nearby surfaces.
The radioactive contamination of concern for the 236Z process cell rubble consists primarily of transuranics (TRU) from past operations. The source terms modeled in this report are based on the residual contamination levels reported in the nondestructive analyses performed prior to the building’s demolition.
The radiological consequences have been established using the methods discussed in DOE-HDBK-3010-94 (DOE 1994). This approach was successfully used for the 233-S Building, the 232Z Building (Droppo et al. 2006), the 105 KE Basin (Napier et al. 2008), the 224-U and 224-UA Buildings (Napier et al. 2009; Napier et al. 2010; Droppo et al. 2011), and other parts of the PFP complex (Napier, Rishel, and Mart 2017); measured concentrations and depositions during the demolition were within the ranges predicted by the modeling.
2.1 Source Term Methodology
The source term may be quantified using the five-factor formula1
ST = MAR * DR * ARF * RF * LPF (2-1a)
ST = MAR * EF (2-1b)
where: Source term (ST) = the total quantity of respirable material released to the atmosphere during the demolition
Material-at-risk (MAR) = the total quantity of radionuclides (in grams or curies of activity for each radionuclide) available to be acted on by a given physical stress
Damage ratio (DR) = the fraction of the MAR actually impacted by the demolition conditions
Airborne release fraction (ARF) = the fraction of a radioactive material suspended in air as an aerosol and thus available for transport due to a physical stress from a specific activity
Respirable fraction (RF) = the fraction of airborne radionuclides as particles that can be transported through air and inhaled into the human respiratory system and is commonly assumed to include particles 10-µm aerodynamic equivalent diameter (AED) and less
Leak path factor (LPF) = the fraction of the radionuclides in the aerosol transported through some confinement system (e.g., facility rooms, ductwork), filtration mechanism (e.g., high-efficiency particulate air [HEPA] or sand filters), and emission mitigation methods (e.g., misters or foggers).
Emission Factor (EF) = Product of the last four factors, where EF = DR*ARF*RF*LPF. 1 The following discussion is adapted from GENII Computer Code Application Guidance for Documented Safety Analysis, DOE-EH-4.2.1.4-Interim-GENII, Rev. 1, U.S Department of Energy, Washington, D.C.

2.2
For these analyses, the MAR is defined as the inventory that is within the rubble piles
Through collaboration with CHPRC, a conservative MAR was established which determined masses, fractions associated with different components of the source term provided by CHPRC based on the upper 95th percent confidence intervals. For specific components, contaminant quantities were provided and the release-rate methods were adapted to match the available data. For the PRF process cell, because of the difficulty of measuring the contaminant levels, a bounding assumption of 25 nCi/g of the entire solid structure had initially been assumed; this value was changed to 24.7 nCi/g for the PNNL-20173 Revision 4 analyses based on the results of non-destructive analyses (NDA) (CHPRC-03038: Sauer et al. 2016).
Details of the source term analysis for rubble removal are presented in Appendix A. Radioactive contamination emissions or source terms (STs) have been calculated by release mechanism and demolition area for on-shift and off-shift activities. The emissions from the applicable sources have been combined to provide emissions estimates for each day from each demolition area.
2.2 Air Dispersion Modeling Resulting in Air Concentration and Surface Contamination Estimates
The U.S. Environmental Protection Agency’s (EPA’s) AERMOD dispersion model is used to estimate atmospheric concentration and surface deposition of the released radioactive materials in the immediate vicinity of the demolition activities. AERMOD provides hourly estimates for the time periods that rubble removal is planned by accounting for the ambient meteorological conditions. The hourly estimates can be used to analyze longer time periods from within AERMOD or through post-processing. The rationale for the selection and use of the AERMOD dispersion model is documented in Appendix B.
The AERMOD dispersion and deposition modeling is based on weekly meteorological patterns identified from 6 years (2004 to 2009) of historical hourly meteorological measurements from the PFP met station (No. 19) and other supporting data from the Hanford Meteorological Station (No. 21). The meteorological data includes wind direction, wind speed, precipitation rate, and data from which to calculate location-dependent dispersion. The historical weather patterns are assumed representative of conditions that will occur during the demolition period. Some of the hourly data involved winds at > 15 mph. Even though cleanup activities will only occur when winds are < 15 mph, the high wind speed data were not excluded. This is because the 95th and 99th percentile dispersion conditions are based on a cumulative distribution function where only 5% or 1% of the cases result in less dispersion. That is, only the upper 5% or 1% of the dispersion coefficients impact the final 95% or 99% values. Since winds > 15 mph result in less concentrated plumes (greater dispersion), air concentrations computed for those conditions do not impact the final upper percentile values because they fall in the bottom 95% of the values.
The activities described in Appendix A are listed in a project spreadsheet (Appendix E). A duration (number of shifts) for each activity is estimated. The MAR during each shift is then pro-rated from the total inventory based upon the duration. The MAR is multiplied by the applicable emission factor described in Appendix A, Section A.1, to obtain the source term. The release is assumed to be constant during the activity, which is usually a full shift. If multiple activities are simulated to occur simultaneously, the concurrent releases are summed. This provides an hourly estimate of the release rate for the day. The spreadsheet is built so that each day is described, in the assumed order of cleanup. The sequential hourly release rates for the entire demolition are then available. This sequence of hourly

2.3
emissions is assumed to begin on the first day of the available meteorological data and the concentrations of contaminants in the air and depositions on the ground are estimated throughout the domain. The sequence is then repeated assuming the work begins on the second day of the meteorological data, and then the third, etc.
The 95th and 99th percentile values are based on each possible 5-day period as described above (since demolition will occur during a 10-hr/day, 5-day work week) in the 6 years of hourly met files used to compute hourly air concentrations from the hourly source terms. AERMOD evaluated each possible 5-day cumulative outcome (integrated air concentration) and a cumulative distribution function was built from each. Because each outcome had the same frequency of occurrence, the values were simply sorted from greatest to lowest. The value where only 5% are higher represents the 95th percentile value; similarly the value where only 1% are higher represents the 99th percentile value.
The 95th and 99th percentile air concentrations are modeled for an array of receptors covering the site fence line and nearby air monitoring locations. The historical data provides statistics on wind direction which are expected to represent wind patterns during demolition.
Weekly cumulative values of air concentrations are evaluated with modeling results reported as the 95th and 99th percentile of time-integrated derived air concentrations (DAC-hours) for air concentrations. As a result, the 95th or 99th percentile values for one location are most likely derived from different data than the values for any other location. Thus, the isopleths do not represent a single anticipated condition, but rather the most-likely near-worst case for all locations simultaneously.
The air concentrations and deposition rates are modeled for an array of receptors covering the demolition site and surrounding area. Weekly-averaged values of air concentrations are evaluated with modeling results reported as the 95th and 99th percentile of the time-integrated incremental derived air concentrations in DAC-hours. Total estimated depositions from all activities are presented as disintegrations per minute (dpm) per 100 cm2.
The modeling analysis defines the potential levels of air and surface exposures from the proposed demolition activities. Potential air exposures are defined in terms of 1) composite spatial patterns of average and peak concentrations and 2) the distribution of occurrences of peak (95th or 99th percentile) concentrations at measurement locations and control boundaries. The potential surface depositions are defined in terms of total deposited concentrations of alpha- and beta/gamma-emitting materials.
Using these methods, emission and air dispersion computations were made to assess the potential concentrations from different sets of demolition assumptions. The analysis process consisted of three steps:
1. Estimate the emission rates for the proposed activities - Step 1 starts with an estimate of the amount of contamination in the rubble, what form it is in, and where it is located. Cleanup methods and associated activities are identified in this step. These data are combined to generate estimates of emissions during the removal activities.
2. Compute the airborne and deposited concentrations - Step 2 takes the emission rate estimates from Step 1 and produces estimates of environmental concentrations. The main intermediate products are 95th and 99th percentile hourly air concentrations and hourly surface deposition.
3. Determine if the potential concentration levels are acceptable - Step 3 uses standards to evaluate the viability of the demolition option that has been modeled. For air exposures, a limit of 12 DAC-hours

2.4
per week is used. For deposition, a limit of 20 dpm per 100 cm2 removable alpha contamination is used. If none of the locations within the selected areas show values that exceed these limits, then the demolition is deemed to be viable.
The potential emission rates associated with proposed rubble removal activities are estimated based on specific methods of execution. Appendix A provides a detailed definition of those activities including the assumptions and approximations that are required to provide a context for the cleanup of the PRF rubble.
The air dispersion modeling with AERMOD requires a number of assumptions related to model options, source-term input definition, analysis products, time scales, and receptor locations. The details of those assumptions are also discussed in Appendix A.
2.3 Airborne Contamination Dosimetry
The dosimetry depends on the mixture of radioisotopes present. The inventories listed in Table 2.4-1 are assumed to represent the contamination present in the PRF rubble. The spectrum of radionuclides is based on the best information available.
U.S. Department of Energy (DOE 1998) regulations specify in 10 CFR 835.2, “Definitions,” that an airborne radioactivity area means any area accessible to individuals where the concentration of airborne radioactivity above natural background exceeds or is likely to exceed the DAC, or an individual present in the area without respiratory protection could receive an intake exceeding 12 DAC-hours in a week. If radionuclides “A,” “B,” and “C” are present in concentrations CA, CB, and CC, and if the applicable DACs are DACA, DACB, and DACC, respectively, then the concentrations shall be limited so that the following relationship exists:
1CA B
A B C
CC CDAC DAC DAC
+ + ≤ (2.2)
For a mixture of radionuclides where the concentrations of each are expressed in terms of a fraction, f, of a total, DACT, this can be written as:
1C TA T B T
A B C
f DACf DAC f DACDAC DAC DAC
×× ×+ + ≤ (2.3)
This relationship can be used to determine a maximum total concentration that meets the requirements as:
1CA B
A B C T
ff fDAC DAC DAC DAC
+ + = (2.4)
DACs are provided in 10 CFR 835 Appendix A for three absorption classes (F, M, and S). The absorption classes indicate the general time frame for absorption of the materials from the respiratory tract into the blood. The range of half-times for the absorption classes correspond to:
Class F: 100% at 10 minutes;

2.5
Class M: 10% at 10 minutes and 90% at 140 days; and
Class S: 0.1% at 10 minutes and 99.9% at 7000 days.
For the PFP plutonium contamination, DACs based on Class S absorption are applicable (DOE-STD-1128-2013, Section 5.2); however, the workplace monitoring is based on concentrations represented by Class M. The initial nitrate compounds will have mostly oxidized after years of exposure to air. For Am-241, 10 CFR 835 Appendix A only provides an absorption Class M DAC value.
2.4 Summary of Anticipated Radionuclide Inventories
Because nearly all of the 236Z Building has been demolished, and the exterior portions already removed, most of the remaining contaminated material is located in three zones. Nearly all of the rubble resulted from the demolition of the 236Z process cell, the footprint of which is highlighted in Figure 2.4-1. During the demolition, rubble that had accumulated near the walls of the cell was moved a short distance in either direction to allow access to the lower portions of the east and west walls. These secondary piles are conceptually illustrated in Figure 2.4-1.
Figure 2.4-1. 236Z Cleanup Zones Defined for this Analysis (236Z Process Cell Footprint Shown as Red Cross Hatch).
Table 2.4-1 provides a summary of the inventories used in the source term analyses in Appendix A. The total inventories are estimated based on the listed levels of residual contamination within the structure assumed at the time of demolition. The locations are based on a 17 December 2017 photo (see Figure 1.0-1) and Table 7 of CHPRC-03038 (Sauer 2016).
2.5 Modeling Rubble Removal
The modeling analysis requires definition of representative activities which include the assumed methods and duration (i.e., working days over an elapsed time period). The most-accessible rubble is assumed to be removed before less-accessible portions. The analyses credit the use of water and fixatives where applicable (misting is not used during loading of wet rubble into ERDF containers) to minimize airborne contamination spread.
236-ZEast Pile
West Pile

2.6
Each rubble pile is considered in terms of its size and anticipated contamination levels (see details in Appendix A). All demolition and load out will only occur when sustained wind speeds are less than 15 miles per hour. The results, which are presented in Section 3, are based on the sequential phases, durations, and methods described in Table 2.5-1. Two options are described which differ by duration.
Table 2.4-1. Anticipated Inventory of Radionuclides in Rubble of the 236Z Process Cell
Summary Debris Contamination Units Location
236Z Canyon 2064161 lb 24.7 nCi/g 3 piles Backwall of 1W GGB 98 g-Pu Footprint Jumper Penetration Inserts:
West 82 5.64 g-Pu West pile East 72 4.96 g-Pu East pile
Room 41 Process Drain Stubs: 18.0 g-Pu West pile
*The notation GGB indicates “Gallery glove box”
Table 2.5-1 Cleanup Phases and Durations
Phase Involved Pile
Duration (Option 1)
Duration (Option 2) Details
1 East Pile 9 days over 2-week period
18 days over 4-week period
It is assumed that the rubble is non-homogeneous; a ratio of concentration from 1/3 to 3 times the average is assumed. Actions are equivalent to scooping and loading, with minimal additional crushing. Releases from moist rubble are treated with the Environmental Protection Agency (EPA) method (Appendix A)
2 West Pile 6 days over 2-week period
12 days over 3-week period
It is assumed that the rubble is non-homogeneous; a ratio of concentration from 1/3 to 3 times the average is assumed. Actions are equivalent to scooping and loading, with minimal additional crushing. Releases from moist rubble are treated with the EPA method (Appendix A)
3 236Z Cell Footprint
15 days over 3-week period
30 days over 6-week period
It is assumed that the rubble is non-homogeneous; a ratio of concentration from 1/3 to 3 times the average is assumed. Actions are equivalent to scooping and loading, with minimal additional crushing. Releases from moist rubble are treated with the EPA method (Appendix A)

2.7
The analysis assumes that, even with fixatives, misting, and other controls, a certain amount of dust will escape to the environment during the cleanup activities. The amount of dust released as a function of time from the start of cleanup is shown in Figure 2.5-1. The actual radiation risk is related to the amount of residual radioactive contamination contained in the dust, which varies with the various piles being removed. An inventory-weighted plot of the source term is shown in Figure 2.5-2.
Figure 2.5-1. Dust Release Rate during Active Cleanup Activities
Figure 2.5-2. Radioactive Source Term During Active Cleanup Activities
The curves in Figures 2.5-1 and 2.5-2 reflect the scheduling assumptions made for the cleanup. The 30-day option assumes that the East pile is cleaned up over a 9-day period, the West pile over a 6-day period, and the 236Z process cell footprint over a 15-day period. The 60-day option used periods of twice the length as the 30-day period. The average contamination increases from 1/3 of the average to 3 times the average throughout each period. However, there are selected pieces of rubble that are assumed to be removed on the last day of each period, so the total emissions do not scale exactly linearly.
2.6 Quality Control Procedures and Documentation
The quality control procedures used for the analyses are discussed in Appendix D. Source term and emission rate worksheets are documented in Appendix E. Appendix F documents the contents of selected AERMOD input and output files. These output files contain listings of both modeling inputs and results. Appendix G provides a brief analysis of the potential public dose from the total estimated emissions using the regulatory computer code CAP88-PC (Rosnick 2014).


3.1
3.0 Predicted Impacts
The air concentration and surface deposition modeling efforts were conducted for cleanup of the 236Z rubble as described in terms of the zones described in Sections 2.4 and 2.5, Tables 2.4-1 and 2.5-1. The predicted potential impacts from cleanup of the 236Z rubble piles are presented in Sections 3.1 and 3.2.
The results presented in this section use a PFP facility area map shown in Figure 3.0-1 as a base map. The map includes the facility fence line (red) and the major roads (blue). The buildings and subsets of buildings that have been or will be demolished are shown as colored overlays. Structures shown in gray, most of which will be gone at the start of the 236Z cleanup activities, are not part of structures considered in this report. The structure marked in light blue is the footprint of the 236Z process cell; the two circles to the east and west are the locations of the remaining rubble piles.
The air exposure results presented below are the increments predicted to result from the cleanup modeling – and as such do not contain a background component. The air monitoring stations in the immediate vicinity of the PFP complex will be only able to detect increments in air exposures from demolition if those increments are large enough to be distinguished from the local background. The background for this area is estimated to be on the order of 0.015 DAC-hours for 1-week background exposures.1
The air dispersion modeling (described in Section 2.2) of the 236Z rubble cleanup estimates air concentration and surface deposition. Air concentration is characterized in terms of derived air concentration (DAC)-hour exposures summed over work-week time periods (5-day work weeks have been assumed). Surface deposition is characterized in terms of cumulative deposition expressed in disintegrations per minute (dpm) per 100 cm2 modeled over the elapsed time for the specific demolition activities under consideration.
1 In an analysis of the routine air samplers (Napier et al. 2010), the mean of background air samples at the Hanford 200-West monitoring stations is shown to be about 1.2 × 10⁻¹⁵ μCi/ml of gross alpha-emitters. Most of the background will be natural alpha-emitting radionuclides, primarily progeny of the uranium chain. If the background is assumed to have the same radionuclide spectrum as the contamination of the 236Z building (which is conservative from a dosimetric sense), the background levels of air concentration are at about 0.0001 DAC; 1-week background exposures are estimated to be about 0.015 DAC-hours.

3.2
Figure 3.0-1. Base Map for 236Z Rubble Pile Locations. Only the 236Z Process Cell Footprint and East
and West Piles are Modeled Sources.
To evaluate the potential exposure levels from the planned activities described in Section 2.2 and detailed in appendices, air concentrations and surface deposition amounts were computed as described in Section 2.2. Activities are assumed to occur during about 8 hours of a 10-hour day shift, with 5-day work weeks. Allowing for weekends and holidays, the start-to-finish demolition period for all the cleanup activities (all phases) is projected to be about 6 or 12 weeks, depending upon the option selected
Evaluation of the potential impacts of this 2 to 3 month period of projected activities required characterization of the full sequence of day-to-day demolition activities. Two modeling approaches were used in AERMOD to analyze the potential air concentration and surface deposition:

3.3
1. Maximum-impact model runs were conducted for “worst case” demolition weeks (i.e., demolition sequences resulting in the greatest activity-based weekly emission rates) based on meteorological patterns shown in hourly data collected over 6 years. The results of these runs provide a basis for the maximum impacts that could occur during any of the demolition phases described in Table 2.5-1, expressed as the upper 95th and 99th percentile values based on meteorological data.
2. Case-study model runs were conducted for the full projected sequence of releases. The results of these runs provide an indication of the order of magnitude of deposition from complete removal of the 236Z process cell debris.
To maximize the number of time periods used in the climatological definition of peak exposure values, the air quality modeling of climatological peak exposures was conducted using 5-day instead of 7-day weeks. For air concentrations, each 5-day cumulative DAC exposure is the same as what would be computed based on an expanded 7-day period (with no emissions on a 2-day weekend). For surface depositions, the modeling of each demolition activity is based on the number of demolition work-days rather than the elapsed time. Because the surface deposition results are based on cumulative deposition, the use of demolition work-days will provide predicted values for deposition computed over a shorter time period. The effect of using shorter times for computing peak surface depositions maximizes the predicted concentrations because they occur over a narrower range of ambient dispersion conditions. The cleanup activities for the 236Z rubble involve between 30 and 60 work days.
3.1. Rubble Removal – Air Concentrations
This section presents the air concentration modeling results for the removal of the 236Z rubble.
As described in Section 2.2, maximum-impact modeling runs are used to define the 95th and 99th percentile time-integrated air concentrations. The occurrence of the highest air concentrations will be associated with the coincidental occurrence of 1) operations with the largest projected release rates and 2) the most limiting meteorological dispersion conditions. Although the operations for rubble removal will extend over many weeks, the demolition of the more highly contaminated portions (i.e., areas that have the highest potential release rates) are projected to occur over a relatively short time period. To obtain the worst-case air concentrations, the maximum emission rates expected during planned work periods are modeled as potentially occurring anytime during the worst case dispersion conditions as indicated from six-years’ worth of hourly meteorological data.
Air concentrations are presented as isopleths of maximum values (expressed as total DAC-hours) resulting from weekly demolition activities. The highest, 5-day source term from the source term analysis discussed in Section 2.0 is used in AERMOD. The resulting daily AERMOD concentrations outputs are post-processed to determine the 95th and 99th percentile 5-day air concentration at each receptor location; the maximum air concentration isopleth presents the overall composite pattern of the maximum weekly air concentration at each receptor.
Note that actual air concentrations during demolition will depend on ambient meteorological conditions, and are likely to be less than the predicted bounding values because actual conditions are likely to be less restrictive than those selected.

3.4
Figure 3.1-1 shows the weekly total DAC-hours for removal of the 236Z Cell rubble for the 30-day option at the 95th percentile. The results are based on the highest projected weekly emission rate during the 236Z rubble removal. All other cleanup activities associated with 236Z cell and associated activities will have lower levels of weekly predicted peak exposures. No weekly fence line concentrations are predicted to exceed about 0.2 DAC-hours. Figure 3.1-2 shows the greatest weekly total DAC-hours at the 99th percentile for the 30-day option.
Figures 3.1-3 and 3.1-4 show similar results for the 60-day option. Because the daily amounts are smaller than for the 30-day option, the results are lower.
Figure 3.1-1. Predicted 236Z Rubble Removal 95th Percentile Weekly Air Concentrations (DAC-
hr/week) for the 30-day removal Option

3.5
Figure 3.1-2. Predicted 236Z Rubble Removal 99th Percentile Weekly Air Concentrations (DAC-hr/week) for the 30-day removal Option

3.6
Figure 3.1-3. Predicted 236Z Rubble Removal 95th Percentile Weekly Air Concentrations (DAC-hr/week) for the 60-day removal Option

3.7
Figure 3.1-4. Predicted 236Z Rubble Removal 99th Percentile Weekly Air Concentrations (DAC-
hr/week) for the 60-day removal Option
3.2 Maximum Air Concentrations at Facility Fence line
The air concentrations on the facility fence line were modeled for a series of receptors located on that boundary. Figure 3.2-1 provides the resulting spatial distribution of the highest predicted 95th percentile weekly air concentrations (with units of weekly total DAC-hour) for each fence line receptor for all of the 236Z rubble cleanup for the 30-day removal option. The 30-day 99th percentile values are shown in Figure 3.2-2. The results in Figures 3.2-1 and 3.2-2 represent the highest estimated emission rates under

3.8
restrictive dispersion conditions (95th and 99th percentile meteorological conditions). The actual exposures during demolition activities will be a function of the combinations of emission rates (function of the process, inventory and mitigative efforts) and ambient atmospheric conditions that occur during those activities.
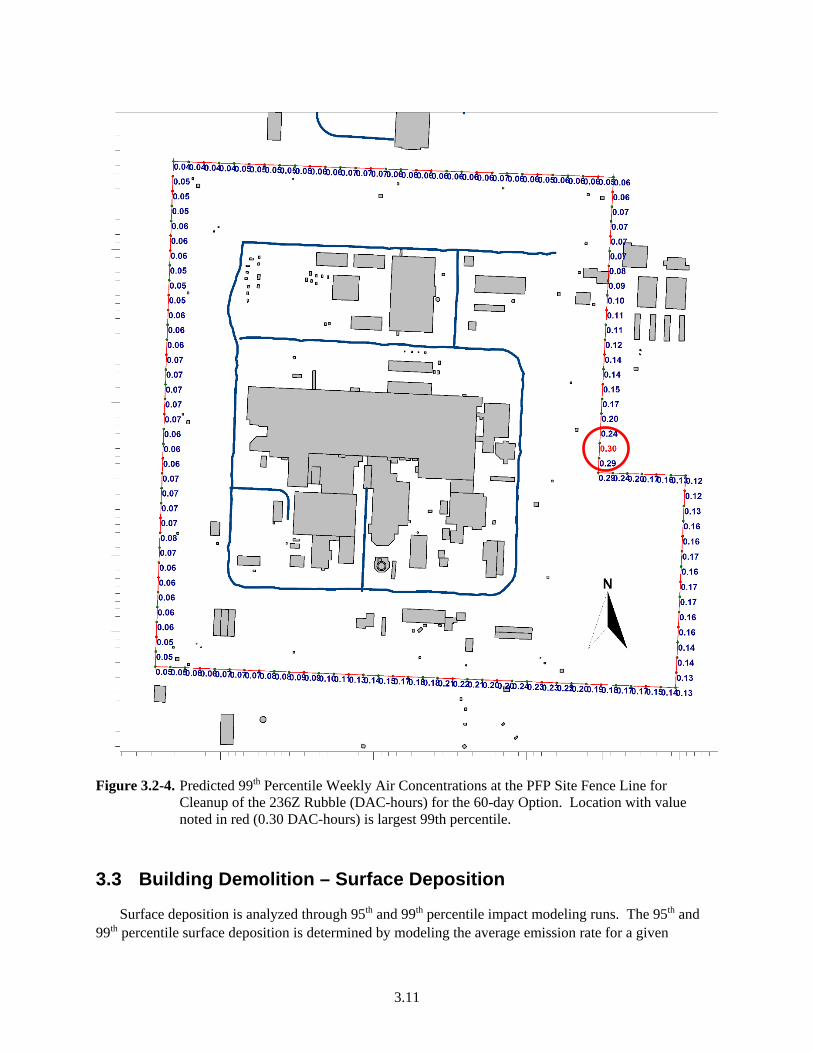
Figures 3.2-3 and 3.2-4 show the same information for the 60-day removal option.
Although not shown in these figures, the absolute highest modeled air concentration (i.e., the 100th percentile) exceeds the 95th percentile (based on 6 years of meteorological data) by over a factor of two. Because the air concentrations are based on 95th meteorological conditions coupled with very conservative estimated 236Z rubble inventory limits, these figures indicate that there is a high likelihood that the limit of 12 DAC-hours/week will not be exceeded beyond the current PFP fence line.
Figure 3.2-1. Predicted 95th Percentile Weekly Air Concentrations at the PFP Site Fence Line for
Cleanup of the 236Z Rubble (DAC-hours) for the 30-day Option. Location with value noted in red (0.31 DAC-hours) is largest 95th percentile.

3.9
Figure 3.2-2. Predicted 99th Percentile Weekly Air Concentrations at the PFP Site Fence Line for
Cleanup of the 236Z Rubble (DAC-hours) for the 30-day Option. Location with value noted in red (0.40 DAC-hours) is largest 99th percentile.

3.10
Figure 3.2-3. Predicted 95th Percentile Weekly Air Concentrations at the PFP Site Fence Line for
Cleanup of the 236Z Rubble (DAC-hours) for the 60-day Option. Location with value noted in red (0.21 DAC-hours) is largest 95th percentile.
3.11
Figure 3.2-4. Predicted 99th Percentile Weekly Air Concentrations at the PFP Site Fence Line for
Cleanup of the 236Z Rubble (DAC-hours) for the 60-day Option. Location with value noted in red (0.30 DAC-hours) is largest 99th percentile.
3.3 Building Demolition – Surface Deposition
Surface deposition is analyzed through 95th and 99th percentile impact modeling runs. The 95th and 99th percentile surface deposition is determined by modeling the average emission rate for a given

3.12
demolition activity based on 6 years’ worth of hourly meteorological data. The resulting model-calculated daily surface deposition values are then summed over the actual number of days the activity is expected to be performed and the total deposition value at each receptor location is retained and sorted. These 95th and 99th percentile isopleths are presented in this section for a variety of demolition activities; isopleths are expressed in units of alpha disintegrations per minute (dpm) per 100 cm2.
Actual surface deposition resulting from any demolition activity will depend on the ambient meteorological conditions that will occur during the demolition activities.
This section presents the surface deposition modeling results for the 236Z rubble; this material is identified in blue in Figure 3.0-1. The 236Z rubble cleanup activities leading to surface deposition were projected to occur for a total of either 30 or 60 working days.
The 95th percentile predicted surface depositions for the 30-day option are shown in Figure 3.3-1; the 99th percentile in Figure 3.3-2. Similar results for the 60-day option are shown in Figures 3.3-3 and 3.3-4. These figures are all very similar because the total amount of material eventually released is the same in all cases and over a sufficiently long period that daily variations are washed out.

3.13
Figure 3.3-1. Predicted 95th Percentile Surface Deposition (dpm per 100 cm2) for 236Z from Rubble Removal for the 30-day Option

3.14
Figure 3.3-2. Predicted 99th Percentile Surface Deposition (dpm per 100 cm2) for 236Z from Rubble Removal for the 30-day Option

3.15
Figure 3.3-3. Predicted 95th Percentile Surface Deposition (dpm per 100 cm2) for 236Z from Rubble
Removal for the 60-day Option

3.16
Figure 3.3-4. Predicted 99th Percentile Surface Deposition (dpm per 100 cm2) for 236Z from Rubble Removal for the 60-day Option

4.1
4.0 Discussion of Results
The source-term analysis projected the levels of releases of radioactive material that is to be anticipated during the removal of rubble from the 236Z main process cell that remains in 3 closely –spaced piles. The modeling results presented here are closely tied to the details of how the removal is to be conducted. It is assumed that most rubble will be loaded into Environmental Remediation Disposal Facility (ERDF) containers with front-end loaders as a slurry dampened by water and fixatives. This option represents a standard approach that has been used in several past demolition efforts at Hanford. The basic modeling assumptions related to the demolition methods are summarized in Table 4.0-1. These modeling results indicate that the radiological exposures from the planned cleanup efforts will be below the designated limits for air and soil exposures.
The removal of the 236Z rubble will also result in deposition of alpha-emitting radionuclides on the soil surfaces nearby. The administrative limit for surface contamination of 20 dpm/100 cm2 of alpha-particle emitters has been used as an indicator of the spread of surficial deposition. As indicated in Figures 3.3-1 through 3.3-4, this administrative limit should not be exceeded, on average, beyond the current PFP fenceline. However, the modeling does not specifically identify potential individual “hot particles”, which suggests that efforts to minimize and remediate the deposition, and to minimize the amount of available rubble at any one time, should be considered to minimize the spread of contamination during the demolition.
The results presented in this report are a reevaluation of a subset of the results in PNNL-20173 Rev. 4 (Napier, Rishel, and Mart 2016). The projected air concentrations and depositions are a small fraction of those related to the estimated releases for demolition and loadout of the 236Z Building reported therein. The projected emissions are lower because the bulk of the previous estimate resulted from the initial shearing of the building, which has now been nearly completed. In the evaluation in this current report, the loadout of the contaminated rubble is assumed to be controlled using water and fixatives that make the rubble damp, thus reducing the overall emissions.
In summary, this report documents anticipated releases and environmental contamination that could be expected for open-air cleanup of 236Z main process cell rubble using typical techniques. These results are provided for planning purposes. This report does not document any decisions about the decommissioning approaches.

4.2
Table 4.0-1. Key Modeling Assumptions
Parameter How Modeled Water-mist Application The rubble pile is assumed to be kept wet through application of water.
No potential release reduction by mist application was considered during transporting and loading of processed debris into approved shipping containers.
Fixative Application to Rubble
Leak path factors of 0.1 are applied to rubble because of soil cover, and fixative/water application, which are assumed to reduce the quantity of resuspended particulates by 90%. A fresh coat of fixative is assumed to be applied to all newly exposed surfaces at the end of rubble removal operations for a day. Because the rubble is covered with a soil layer, a Damage Ratio of 0.1 is also employed.
Exposure of Demolition Debris
An amount of rubble equivalent to that processed in one day was assumed to be uncovered from the earthen mound for all non-work-shift periods.
Component Removal Metallic components and structural reinforcements are treated in a manner similar to concrete rubble in terms of loading into ERDF containers.
Rubble processing rate The modeled rubble-pile cleanup rate is 30 working days over a 6-week period or 60 working days over a 12 week period at a steady rate of progress. This is equivalent to approximately 3.3% or 1.7% of the total rubble pile per day. The model used a 3x3 array of 9 ground-level release points to represent loading locations.
Rubble Moisture Content – 2%
This is captured as a term in the Airborne Release Factor calculation. Greater moisture content reduces the release potential.
Wind Speed < 15 mph
Incorporated by narrative consideration of project intentions. The 15 mph wind speed limit will serve to minimize migration of non-respirable contamination particles. Higher wind speeds actually create more favorable (dispersive) conditions and reduce airborne concentrations.

5.1
5.0 References
40 CFR Part 51. Code of Federal Regulations, Title 40, Protection of Environment, Part 51, “Revision to the Guideline on Air Quality Models: Adoption of a Preferred General Purpose (Flat and Complex Terrain) Dispersion Model and Other Revisions; Final Rule.”
DOE – U.S. Department of Energy. 1994. DOE Handbook, Airborne Release Fractions/Rates and Respirable Fractions for Nonreactor Nuclear Facilities, Volume 1 - Analysis of Experimental Data. DOE-HDBK-3010-94, Washington, D.C.
DOE – U.S. Department of Energy. 1998. Title 10, U.S. Code of Federal Regulations, Part 835. Occupational Radiation Protection. FR 63:213, pp. 59662-59689, Washington, D.C
DOE – U.S. Department of Energy. 2013. Good Practices for Occupational Radiological Protection in Plutonium Facilities, DOE-STD-1128-2013, Washington, D.C.
Droppo JG, Napier BA. 2006. Analysis of Radioactive Releases During Proposed Demolition Activities for the 232-Z Building, PNNL-15851, Pacific Northwest National Laboratory, Richland, Washington.
Droppo, JG, Jr, Napier BA. 2011. “Use of Source Term and Air Dispersion Modeling in Planning Demolition of Highly Alpha-Contaminated Buildings.” Proceedings of the 14th International Conference on Environmental Remediation and Radioactive Waste Management (ICEM 2011) , September 25–29, Reims, France.
EPA – U.S. Environmental Protection Agency. 1995. Compilation of Air Pollutant Emission Factors AP-42, Fifth Edition, Volume 1: Stationary Point and Area Sources. Research Triangle Park, North Carolina.
EPA – U.S. Environmental Protection Agency. 2008. Technology Transfer Network Support Center for Regulatory Air Models, http://www.epa.gov/scram001/(Access last checked 6/5/2008).
EPA – U.S. Environmental Protection Agency. 2016. User's Guide for the AMS/EPA Regulatory Model (AERMOD), EPA-454/B-16-011, Research Triangle Park, North Carolina.
Napier BA, Droppo JG, Rishel JP. 2008. Analysis of Radioactive Releases During Proposed Demolition Activities for the 105-KE Basin, PNNL-17631, Pacific Northwest National Laboratory, Richland, Washington.
Napier BA, JP Rishel, JG Droppo. 2009. Analysis of Radioactive Releases during Proposed Demolition Activities for the 224-U and 224-UA Buildings. PNNL-18332, Pacific Northwest National Laboratory, Richland, Washington.
Napier BA, Rishel JP, Droppo JG., Strom DJ, Joyce KE. 2010. Analysis of Radioactive Releases during Proposed Demolition Activities for the 224-U and 224-UA Buildings. PNNL-18332 Addendum, Pacific Northwest National Laboratory, Richland, Washington.

5.2
Napier BA, Rishel JP, Mart EA. 2017. Air Dispersion Modeling of Radioactive Releases During Proposed PFP Complex Demolition Activities, PNNL-20173 Rev. 4, Pacific Northwest National Laboratory, Richland, Washington.
Rosnick R. 2014. CAP88-PC Version 4.0 User Guide. Office of Radiation and Indoor Air, U.S. Environmental Protection Agency, Washington, D.C. Accessible at (April 2018) https://www.epa.gov/radiation/cap-88-cap-88-pc#tab-2. Sauer, PM, KJ Maloy, JL Westcott. 2016. Radiological Characterization of Plutonium Reclamation Facility Canyon Walls and Gallery Gloveboxes. CHPRC-03038, Rev 0, CH2M Hill Plateau Remediation Company, Richland, Washington.

Appendix A
Facility-Specific Source Term Analyses


A.1
Appendix A – Facility-Specific Source Term Analyses
The source term may be quantified using the five-factor formula
ST = MAR * DR * ARF * RF * LPF (A-1a)
ST = MAR * EF (A-1b)
where: Source term (ST) = the total quantity of respirable material released to the atmosphere during the demolition
Material-at-risk (MAR) = the total quantity of radionuclides (in grams or curies of activity for each radionuclide) available to be acted on by a given physical stress
Damage ratio (DR) = the fraction of the MAR actually impacted by the demolition conditions
Airborne release fraction (ARF) = the fraction of a radioactive material suspended in air as an aerosol and thus available for transport due to a physical stress from a specific activity
Respirable fraction (RF) = the fraction of airborne radionuclides as particles that can be transported through air and inhaled into the human respiratory system and is commonly assumed to include particles 10-µm aerodynamic equivalent diameter (AED) and less
Leak path factor (LPF) = the fraction of the radionuclides in the aerosol transported through some confinement system (e.g., facility rooms, ductwork), filtration mechanism (e.g., high-efficiency particulate air [HEPA] or sand filters), and emission mitigation methods (e.g., misters or foggers).
Emission Factor (EF) = Product of the last four factors, where EF = DR*ARF*RF*LPF.
Appendix A provides details on modeling assumptions and details on each of the rubble pile cleanup phases described in Table 2.5-1. As described in Section 2.1, source terms are developed by the five factor formula from DOE-HDBK-3010 involving the source term factors of MAR, DR, ARF, RF, and LPF (Equation 2a) (DOE 1994). Each of the cleanup steps includes some similar activities and processes (e.g., rubble dropping). For each of these similar activities certain assumptions were made regarding the source term factors and followed in the modeling of each phase. These general modeling assumptions are described in Section A.1.
A.1 General Modeling Assumptions
This section describes general modeling assumptions related to damage ratios, airborne release fractions and respirable fractions that are applicable to all of the cleanup activities.
A.1.1 Damage Ratios
Damage ratio (DR) refers to the fraction of MAR available for release. The damage ratio applied depends on the cleanup activity.

A.2
Rubble Load Out DR
All of the contamination associated with rubble is assumed available for release from rubble drop impacts (DR = 1.0).
Other Structural Removal DR
The rubble includes larger pieces of metallic structural pieces, such as jumper penetrations and metal reinforcing. It is assumed that 95% of the material on things such as the gallery glovebox back wall is fixed, and that 5% is removable.
DR = 0.01.
A.1.2 Airborne Release Fraction
ARF refers to the fraction of MAR available for release that becomes airborne. The ARF applied depends on the demolition activity.
Rubble Loadout ARF
Loading of rubble into transport containers (ERDF boxes) is performed by scooping it and placing it into the container. The material is assumed to be wet, however, misted is not used on the placement step to avoid introduction of excessive amounts of water to the ERDF container. As the material falls into the ERDF containers, it will be subject to entrainment in the air. The EPA considers its emission factor equation for aggregate-handling and storage piles to be applicable to the drop of bulk material onto piles (adapted from EPA 1995). The EPA equation was used to model releases from rubble dropping because it is more compatible with the physical realities of rubble removal than the DOE-HDBK-3010 method. The DOE handbook does not consider the impact on emission rates from moisture content and wind speed. Also, the rubble contamination is part of the debris matrix; thus modeling drops of free plutonium oxide powder, plutonium nitrate solution, or items with only surface contamination – as applied in the DOE handbook - is not deemed applicable to rubble removal. The adapted EPA equation is as follows:
ARFDROP = 1.6x10⁻⁶ ((WS/2.2)1.3) / ((M/2)1.4)
where: WS = characteristic wind speed over material drop region (m/s) - A characteristic wind speed for rubble drop was calculated using a characteristic wind speed for the site estimated by examining wind climatology from the Hanford Site. A compilation of average wind speeds and direction was provided in the data source. The ARF is more influenced by periods of higher winds (such as wind gusts). The characteristic wind speed for rubble-handling was estimated to be 3.2 m/s; the result is not sensitive to this assumption.
M = moisture value associated with dry material (control effectiveness of water spray handled separately) (%). Because water is applied to the pile, a moisture value of 2% for a wet construction aggregate was chosen, based on past experience. Small changes in assumed moisture content result in large variation of the resulting ARF; the 2% value selected is believed to be conservatively low, resulting in a calculated ARF that should overestimate the releases via this route.

A.3
Although the original EPA equation also includes a particle-size multiplier (ranging from about 0.1 to 0.8), the multiplier was set to 1.0 for all particle sizes in the release analysis, and the atmospheric transport of particle sizes is described in Section A.1.4. Therefore, the above equation does not include a particle size parameter.
Using the values described above (wind speed of 3.2 m/s and 2% moisture), the ARF for rubble dropping = 2.6 x 10⁻⁶.
Resuspension ARF
Surfaces exposed to the atmosphere between shifts will be subject to resuspension processes. Contamination by particulate radionuclides is a well-recognized phenomenon (Salbu et al 2018). Resuspension occurs when wind exerts a force on surface material or when there is a mechanical action that disrupts the surface (such as demolition operations or vehicular movement) (Semel 1984). The mechanical component is considered to be included in the ARFs for active demolition. The consideration of resuspension here is limited to the non-working shifts as wind-driven forces acting on unmoving rubble.
There are three modes of resuspension: true airborne resuspension, saltation, and creep. These three modes are generally a function of particle size. True resuspension is of importance in determining concentrations of respirable particles for determining worker safety; saltation and creep are mechanisms primarily of concern in contamination control.
Saltation describes particles ranging in diameter from about 100 – 500 microns, which jump or bounce under wind forcing within a layer close to the ground surface. Particles transported by surface creep range in diameter from about 500 – 1000 microns and move by sliding or rolling pushed along the ground by wind stresses and momentum exchange from the impact of smaller particles transported by saltation. Particles smaller than about 100 microns move by suspension in the air. In moving soils, suspension moves about 3-40% by weight, saltation 50-75%, and creep 5-25% (Sehmel 1984).
Saltation and creep move the largest amount of material. Saltating particles are lifted a small distance, gain momentum from the wind, and fall to strike the soil surface, sometimes causing “avalanches” of additional particles. Saltation of particles shows that sand and other small particles are not transported by diffusion processes but rather through the impact of saltating material, which act as small projectiles. Creep is similar but with smaller motions of larger particles. These motions cannot be described by eddy diffusion (the basis of Gaussian-type atmospheric transport models) and so are not directly included in the atmospheric transport modeling conducted herein. Over short periods of time, the transport of these larger particles is limited to distances of tens to hundreds of meters at most. They do not travel high enough to enter the breathing zone and are too large to be considered to be respirable.
True suspension lifts fine dust when the small dust particles are struck by saltating particles. If it were not for saltating movement, this fine dust would not be readily eroded. Dust less than 10 microns in diameter is extremely resistant to wind erosion (Chepil 1943). However, when this fine dust is mixed with coarser particles capable of saltation, it is more easily transported via suspension.
Modeling resuspension is not easy because of the large number of potential variables. The main ones include:
• Particle size, shape and adherence; • Wind speed,

A.4
• Surface type and cover (measured in terms of “roughness”); • Time since deposition; • Intensity of the mechanical action.
To quantify the suspension of contaminated soil/sediment into the atmosphere, three main approaches have been usually used: resuspension factors, resuspension rates, and mass loading. The resuspension factor relates the soil concentration (per unit area) to the air concentration (per unit volume) and has units of m-1. Resuspension factors are highly variable, with the reported range from wind resuspension ranging from 10-11 to 10-4 m-1 (Sehmel 1984, Maxwell and Anspaugh 2011) depending on many factors, although this variability is based on short sampling times and long-term variability will be less. The mass loading approach simply assumes that a fraction of dust in the air is at the same concentration of radioactive contamination as the underlying surface. This method has less variability (concentrations of dust in air range from a few micrograms/m3 following a rainstorm to grams/m3 in the heart of dust devils), but suffers from the required assumption that the dust in the air is related to the dust on nearby surfaces. Neither of these two approaches is conducive to the generation of a source term as input to dispersion modeling. The resuspension rate is a mass of material, assumed to have a contaminant concentration directly related to the source, suspended in a volume of air per unit time (sec-1). Although also plagued with large variabilities, this approach is most useful for source term modeling.
Sehmel (1984) provides average wind-induced resuspension rate values for both respirable and non-respirable particles. Average resuspension rates for non-respirable particles are on the order of 10-11 fraction resuspended per second. Average resuspension rates for respirable particles are more variable; the upper bound is on the order of 10-8 sec-1. These values have been adopted as bounding values for particles on surfaces of rubblized material.
The resuspension rate may be substituted in the DOE five-factor formula when adjusted for the duration of time that rubble lies unmoved. Additional terms in the five-factor formula that are required include the Damage Ratio and the Leak Path Factor. The rubble will be in piles, not uniformly distributed on the ground surface, which will act to cover much of the material and shield it from wind resuspension. Because the rubble is coarse and contains many large pieces, a conservative Damage Ratio value of 0.1 is assumed, which implies that up to 90% of the small particles are immobilized by the bulk of the material. Fixatives and soil covers will also be employed to reduce resuspension. Because not all exposed surfaces can easily be covered by fixatives, a Leak Path Factor of 0.1 is assumed, which is a credit of 90% reduction for fixative application. The planned operations also include extensive use of water (described as “Saturated Soil Entrainment”); an additional factor of 0.1 is assumed as credit for the use of water and partial soil cover on operating faces. When these factors are combined and the time units converted, the overall resuspension rates are 3.6x10⁻¹¹ per hour for large, non-respirable particles, and 3.6x10⁻⁸ per hour for smaller, respirable particles. These rates will be assumed for rubble piles for the 16 hours/day that active shift work is not occurring.
The amount of material available for resuspension depends upon the rate at which demolition occurs and the rubble is loaded out. It is assumed that at most one-day’s worth of rubble will be uncovered at any one time. Therefore, for conservativism in the modeling, a one-day fraction of the rubble pile will be assumed to be exposed for all non-work-shift periods. Moreover, no activities are assumed to occur that will disturb the rubble or otherwise impart energy during non-work-shift periods.

A.5
Other Structural Component ARF
DOE’s factors for impaction stress due to vibration shock were selected as the most representative release fractions for the removal processes. The ARF factors selected were 1x10⁻³ for removable contaminants and one-tenth that (1x10⁻⁴) for fixed contaminants (DOE 1994, Section 5.3.3.2.2).
Surfaces will be disturbed from a variety of sources, including movement and placement of material, general shaking of the rubble surface, vibrations from heavy equipment, and vibration from fall of rubble into the containers. Releases from these surfaces will be controlled by existing fixative, periodic application of fresh fixative, continually wet surfaces, and water spray/mist in the air. These controls are assumed to be sufficient to prevent any emissions from vibration of noncontact surfaces.
The EPA’s (EPA 1995) compilation of airborne release fractions includes a range of uncontrolled release fractions for crushing of ores and rocks that range from 0.012 to 6 pounds per ton of ore, which relates to an ARF of 6 x 10⁻⁶ to 3 x 10⁻³ – the DOE and EPA ranges overlap, supporting the selection of the DOE value (ARF = 1x10⁻³ removable; 1x 10⁻⁴ fixed).
A.1.3 Respirable Fraction
The respirable fraction refers to the fraction of the material that has become airborne that is in a respirable size (i.e., maximum diameter of 10 µm). The respirable fraction is conservatively assumed to equal 100% (RF = 1.0) for all processes in computing the ground contamination level.
The RF is the fraction of airborne radionuclides as particles that can be transported through air and inhaled into the human respiratory system. The RF is assumed to include particles 10-µm AED and less. In this study, all of the suspendable material is addressed (not just the respirable portion) although it is estimated that most radioactive particles in the releases are respirable in size. Only the respirable sized particles are used in computing the inhalation dose.
In this study, the radioactive particles are assumed to be bound to particles of dust from the rubble and transported as a size distribution of particles representative of construction dust. These particulates are removed from the plume and deposited onto the ground through dry deposition, a process that removes non-respirable particles much more effectively than respirable particles. The result of these considerations is that transport of radioactive particles is modeled as a mixture of particle sizes representative of dust from the rubble, and radioactive materials attached to dust are assumed to be inhaled as all respirable particles.
A respirable fraction of 1.0 is conservatively applied in the Source Term equation because the removal of non-respirable particles from the plume is treated separately as a transport and dispersion function within the AERMOD modeling (see Section A.1.4), and only about 1% of the particles escaping are greater than 10 microns in diameter.
A.1.4 Leak Path Factor
The LPF is the fraction of the radionuclides in the aerosol transported through some confinement deposition or filtration mechanism. For the purpose of this study, the LPF is used to address any controls

A.6
applied during and after the demolition process. This includes the mitigating effects of water mists, sprays, and fixatives applied to surfaces and rubble during and after demolition.
Rubble Loadout LPF
Because misting is not anticipated to be used during the loading of the ERDF containers, an LPF of 1.0 is applied. Because the material is expected to be very wet, releases are treated as essentially all respirable particles.
Resuspension Between Shifts LPF
As noted above, a leak path factor of 0.10 is applied because fixative or soil cover application are assumed to reduce the availability of airborne particulates by 90%. An additional factor of 0.1 is applied for the very wet conditions anticipated (“Saturated Soil Entrainment”). A fresh coat of fixative is assumed to be applied to all exposed surfaces (covering any gaps and material deposited on the existing fixative) during shift changes and at the end of demolition operations for a day, and that any contamination disturbed during daily activities may also be covered with clean soil at night.
Other Structural Component LPF
A leak path factor of 0.10 is applied because of water-mist application (and fixative applications) which are assumed to reduce the quantity of airborne particulates by 90% during sizing and handling preparatory to loading the structural components.
A.2 236Z (Plutonium Reclamation Facility) Process Cell Rubble
The 236Z Building (also known as the Plutonium Reclamation Facility – PRF) was located south of the southeastern corner of the 234-5Z Building and was connected to it by the 242Z Building. The building was a four-story structure. The tanks and columns used in the solvent extraction process were located in the process cell—a large three-story room in the center of the 236Z Building. As of January 2018, the outer portions of the building had been demolished and removed, and the process cell had been reduced to rubble. Most of the residual contamination remained in the process cell and on the outer walls of the process cell at the time of its demolition.
Amounts, locations, and isotopic mixtures of residual contamination in PFP complex buildings including 236Z were provided by a CHPRC team (Brian Oldfield and Peter Sauer) in a series of spreadsheets. These source terms were modified and simplified through discussions with CHPRC staff. PNNL-20173 Rev 4 (Napier, Rishel, and Mart 2017) adjusted the 236Z Cell inventories based on extensive NDA (documented in Sauer, 2016 – CHPRC-03038). The plutonium is assumed to be in oxide form, and small, dispersed particles (see HNF-SD-PRP-HA-002, Rev.13); although the nature of the activities in the 236Z Building – and the residual liquid stains on the walls –indicate that the material in this building was originally largely in the chemical form of soluble nitrates. However, oxides are assumed because the nitrates should have oxidized after many years of exposure to air.
As of January 2018, the rubble from the 236Z process cell demolition was contained in three piles – one in the original footprint of the cell itself and one on either side. These piles were covered with between 18 inches and 6 feet of clean soil in December 2017. These piles are illustrated in Figure A.2-1.

A.7
The east and west piles are centered about 50 feet on either side of the process cell original footprint. These three piles contain essentially 100% of the initial cell inventory, exclusive of the strongbacks which were removed and packaged for transport to WIPP. Based upon final report CHPRC-03038 (Sauer et al. 2016), the total transuranic content of the walls was 237 grams of plutonium; this is a mass average of 24.8 nCi/gram of concrete rubble. Non-Destructive Analysis tests (3B700-KTB-16-062) indicate that the west wall was more contaminated than the east wall by a factor of about 3.5. In addition, there are a number of metal parts and fittings that are mixed in with the rubble. These are enumerated in Table 2.4-1.
The cleanup process basically involves wetting the rubble, scooping it up and dropping it into ERDF transport containers. Some minor additional sizing and crushing may be required. Emission factors are summarized in Table A.2-1.
Figure A.2-1. The 236Z Building Rubble in Aerial View from the Northeast (above) Before being
Covered with Soil, and from the Southeast (lower left) and from the West (lower right) after Soil Stabilization.

A.8
Table A.2-1. General Modeling Approach for 236Z Cleanup Operations
236Z Section Operation Demolition Summary AERMOD Modeling approach EF
Main Cell - Cleanup
Loadout Scoop and drop into box Moist rubble treated with EPA method. Particle sizes divided into 6 size bins, each assigned size appropriate RFs and LPFs to derive a composite value
EF = 2.6x10⁻⁶
Resus-pension
Surfaces covered with fixative or clean soil, heavy application of water
Resuspension is treated with a resuspension rate during non-working hours.
EF = 3.6x10⁻⁸ per hour
Other Structural Sources
Picked up with rubble Moist rubble treated with EPA method. EF = 1.45x10⁻⁷
The assumed isotopic distribution is based on facility specific details given the historical processes that had occurred and the decay period, as shown in Table A.2-2. The facility DAC (Bq/m3) is based on the facility isotopic distribution.
Table A.2-2. 236Z Isotopic Distribution
Nuclide Weight % Activity % Specific Activity (Ci/g)
Specific Activity Bq/g Pu
“S” Class* 10CFR
835 DAC Bq/m3
Pu-238 0.03% 2.04% 1.71E+01 6.33E+11 1 Pu-239 92.94% 23.18% 6.20E-02 2.29E+09 2 Pu-240 6.80% 6.20% 2.27E-01 8.40E+09 2 Pu-241 0.15% 60.97% 1.03E+02 3.81E+12 100 Pu-242 0.08% 0.00% 3.96E-03 1.46E+08 2
Am-241* 0.55% 7.61% 3.43E+00 1.27E+11 0.1 TOTALS 100.55% 100.00% Facility DAC Bq/m3
The demolition schedule assumes that the overall demolition would require either 30 or 60 working days (about 6 or 12 weeks elapsed time).
The ERDF acceptance criteria include requirements that the pieces be sized into less than one-foot cubes. A hypothetical schedule is described, upon which the emissions estimates are based. Water and fixatives will be used throughout the load-out process to minimize spread of airborne contamination. Demolition will only occur when sustained wind speeds are less than 15 miles per hour. A summary of the emission factors and their derivation is given below.

A.9
Activity Impacted Structure Type DR ARF LPF Fraction RF* EF
Loading Rubble Rubble Removable
& Fixed 1.0 2.6x10⁻⁶ 1.0 -- 1.0 2.6x10⁻⁶
Resuspension – Between
Shifts Rubble Removable 0.1 1.0x10⁻⁸/sec 0.01 -- 1.0 3.6x10⁻⁸/hr
Other Structural Sources
Jumpers, metal pieces
Removable 0.01 1.0x10⁻³ 0.1 0.95 1.0 1.0x10⁻⁶
Fixed 0.01 1.0x10⁻⁴ 0.1 0.05 1.0 1.0x10⁻⁷
Composite EF 1.45x10⁻⁷
*Respirable Fraction only a factor for inhalation dose computation. However, particle sizes greater than 10 um are separately handled in the transport analysis (see Section A.1.4).
A.3 References
Chepil WS. 1943. Soil Erosion by Wind, Soil Research Laboratory, Dominion Department of Agriculture, Report of Investigations, Swift Current, Saskatchewan, Canada.
DOE – U.S. Department of Energy. 1994. DOE Handbook, Airborne Release Fractions/Rates and Respirable Fractions for Nonreactor Nuclear Facilities, Volume 1 - Analysis of Experimental Data. DOE-HDBK-3010-94, Washington, D.C.
Droppo JG, Jr, BA Napier, ER Lloyd, DS Mantooth, MJ Minette, and EM Mattlin. 2007. "Operational Limitations for Demolition of a Highly Alpha-Contaminated Building – Modeled Versus Measured Air and Surface Activity Concentrations." In 2007 Midyear Topical Meeting - Decontamination, Decommissioning, and Environmental Cleanup, January 21 - 24, 2007, Knoxville, Tennessee. PNNL-SA-52608, Pacific Northwest National Laboratory, Richland, Washington.
EPA – U.S. Environmental Protection Agency. 1995. Compilation of Air Pollutant Emission Factors AP-42, Fifth Edition, Volume 1: Stationary Point and Area Sources. Research Triangle Park, North Carolina.
Maxwell RM, Anspaugh LR. 2011. “An improved model for prediction of resuspension.” Health Phys. 101(6):722-30.
Plutonium Finishing Plant Emergency Planning Hazards Assessment (EPHA), HNF-SD-PRP-HA-002, Rev. 13. Richland, Washington.
Sauer, PM, KJ Maloy, JL Westcott. 2016. Radiological Characterization of Plutonium Reclamation Facility Canyon Walls and Gallery Gloveboxes. CHPRC-03038, Rev 0, CH2M Hill Plateau Remediation Company, Richland, Washington.
Salbu B, Kashparov V, Lind OC, Garcia-Tenorio R, Johansen MP, Child DP, Roos P, Sancho C. 2018. “Challenges associated with the behaviour of radioactive particles in the environment.” J Environ Radioact. 186:101-115.

A.10
Slinn WGN. 1984. “Precipitation Scavenging.” Chapter 11 in Atmospheric Science and Power Production, D Randerson, ed., DOE/TIC-27601, U.S. Department of Energy, Washington, D.C.

Appendix B
Atmospheric Model Selection


B.1
Appendix B – Atmospheric Model Selection
Releases of contaminants to the air during the demolition activities described in Appendix A potentially can have impacts in terms of the resulting increases in air and soil concentrations. An atmospheric dispersion modeling analysis has been conducted to generate estimates of these concentrations.
The air dispersion model AERMOD (EPA 2016) was selected for doing simulations of the potential air and soil exposures from the proposed demolition of the structures at the Plutonium Finishing Plant (PFP). The AERMOD modeling system is the air dispersion model preferred/recommended by EPA to be used in almost all circumstances, including for State Implementation Plans (SIP) revisions for existing sources and for New Source Review (NSR) and Prevention of Significant Deterioration (PSD) programs. In addition to being a recommended model, AERMOD also has modeling capabilities needed to address the dispersion from the proposed demolition of the PFP structures. AERMOD includes formulations for addressing air dispersion in the immediate vicinity of air emission sources. The model has dry deposition algorithms that account for the particle-size distribution and density as well as local surface and meteorological conditions. Important in the selection of AERMOD for this application is its ability to address building wake effects; the current version of AERMOD incorporates the building wake formulations developed by EPRI (Schulman, Strimaitis, and Scire 2000).
A potential limitation of AERMOD for Hanford applications is the model’s use of straight-line trajectories for the modeled airborne plumes. This model feature means that the model cannot account for downwind changes in wind direction. The Hanford Site does have complex wind patterns and AERMOD may not be an appropriate model for modeling potential concentrations at far-field distances (i.e., beyond the Hanford Site boundary). However, AERMOD is quite appropriate for near-field plume simulations being conducted in this effort.
References
EPA – U.S. Environmental Protection Agency. 2016. User's Guide for the AMS/EPA Regulatory Model (AERMOD), EPA-454/B-16-011, Research Triangle Park, North Carolina.
Schulman, L. L., D. G. Strimaitis, and J. S. Scire, 2000: Development and evaluation of the PRIME plume rise and building downwash model. Journal of the Air & Waste Management Association, 50, 378-390.


Appendix C
Air Dispersion Modeling Assumptions


C.1
Appendix C – Air Dispersion Modeling Assumptions
AERMOD information and documentation is available on the U.S. Environmental Protection Agency’s (EPA’s) website for regulatory air models (EPA 2008). The most recently released version of AERMOD was used (Version 16216). AERMOD is considered a commercial model. For Hanford Site applications, such a model must be tested to ensure it is operating correctly in its current implementation (Project Hanford Management System 2002). A series of test cases distributed with AERMOD obtained from the EPA website (EPA 2008) was run and compared with the official versions. The AERMOD runs were conducted using a single computer (PNNL property number WE28738) with the Windows 7 operating system with current updates installed. Test case results showed the code to be working correctly before and after the production runs.
After the potential source terms are defined, the second step in the PFP complex emissions analysis is to compute the airborne and deposited concentrations using the AERMOD air dispersion model. This appendix documents the air dispersion modeling approach, assumptions, and input data.
C.1 Air Dispersion Modeling Approach
The various phases of the cleanup of the 236Z rubble will generate fugitive dust emissions that are expected to have low levels of particulate transuranic content. The AERMOD air dispersion model is used to assess air quality resulting from complex onsite fugitive dust emissions.
The air dispersion modeling approach is designed to provide output products that are useful in the 236Z rubble removal planning process in terms of providing an understanding of the air and soil impact levels projected for a given cleanup option. An approach is needed that can address the potentially very large number of permutations and combinations of ambient weather conditions and the multi-faceted demolition options for each of the components of the PFP facilities.
The approach is to consider each major cleanup component of the PFP facilities separately (see Table 2.5-1). These computations are used to build a cumulative picture of potential environmental contamination from the full demolition of the PFP facilities. The air exposure analysis is independent of the demolition start date. Because the deposition analysis is based on the summation of the impacts of a series of events, the deposition analysis requires an assumption of a postulated start date and definition of a period of time elapsed during the year for the demolition of each component.
In addition to emission rates from the source term analysis being highly dependent on the cleanup options that are selected, the location and size of those emissions are also defined for each of the selected cleanup options.
As the result of their different measures of exposure levels, different approaches are used for the air concentration exposures and soil deposition totals. The concern for air exposures is based on the potential levels of air concentration during the demolition of each component. The concern for soil exposures is based on the total deposition not exceeding a specified surface concentration.

C.2
C.2 Airborne Exposures
Airborne exposures (time-integrated air concentrations) are evaluated in terms of weekly total exposures. A total weekly exposure limit is defined as 12 DAC-hours/week. For the evaluation of potential air exposures, the duration of the demolition activities is important only in terms of what activities are expected to occur in a one-week time frame. Thus, assuming that the cleanup of each component of the PFP complex does not overlap within the same week, the potential air exposures can be independently evaluated for each component.
The analysis determines the weekly air exposures downwind of the rubble removal activities accounting for the week-to-week variations in potential release rates and ambient meteorological conditions. The rubble removal activities involving the largest estimated release rates are evaluated first. These results define the largest potential air exposures. Calculations are performed to develop a distribution of potential concentrations; these are sorted to obtain the value that is not exceeded more than 5% of the time (the 95th percentile). The results for the air dispersion modeling are presented as maps of maximum potential weekly air exposures (at the 95th percentile level) computed over some meteorological time span (annual, seasonal, etc.). The results for the air modeling are presented in terms of 95th percentile potential weekly air exposures at selected environmental locations.
C.3 Deposition Exposures
Deposition exposures (cumulative depositions) are evaluated in terms of total accumulations on ground level surfaces downwind of the rubble removal activities. A total alpha deposition concentration limit of 20 dpm/100 cm2 is used. For the evaluation of potential deposition exposures, the duration of the rubble removal activities is important. That is, the deposition patterns from the sequential cleanup of each of the various components of the PFP facilities must be cumulatively added to evaluate the potential total deposition exposure.
The analysis of each component structure determines the total potential deposition exposures resulting from the cleanup of that component alone. The activities involving each of the components are evaluated. To allow logical sequencing of the deposition results, the cleanup of each component is assumed to occur over some specific period of elapsed time that represents the “window” during a year that rubble removal is assumed to occur. The order of deposition analyses is the same as the air exposures analyses.
The patterns of total deposition for a rubble removal activity are computed for the rubble removal period using the average emission rate for that rubble removal activity. These deposition patterns are evaluated for some appropriate period of meteorological data. The results for the air dispersion modeling are presented as maps of total maximum potential deposition exposures computed for activities during the component’s period of elapsed time.
C.4 AERMOD Modeling Assumptions and Input Data
The modeling of potential exposures accounting for building wake effects with AERMOD requires the use of point source releases. Area sources such as walls and ceilings are approximated by a grid of

C.3
point sources. The use of points to approximate an area is useful in that it does allow, if needed, the analysis to account for concentration variations over those areas.
Source Characteristics: The main sources for air emissions will be the waste loading activities. These sources were modeled as a matrix of point sources. The AERMOD runs were configured to directly produce maximum hourly concentration and deposition values for the days associated with the rubble removal activities.
Meteorological Data: The air dispersion analysis used multiple years of local meteorological data to define the local dispersion climatology. Six recent years of meteorological data records (calendar years 2004 to 2009) were obtained from the Hanford Meteorological Station (HMS) database for the analysis.1 This period was selected for comparability with earlier versions of this report. Surface meteorological input data to AERMOD consisted of a merged dataset containing surface data incorporating wind speed and direction data from the Hanford telemetry station number 19 located in the 200W area combined with meteorological surface observations from the central HMS station. Vertical structure input data to AERMOD consisted of radiosonde data from the meteorological station at the Spokane airport.2
Figure C.4-1 shows a wind rose plot 3 based on all conditions for this six years of record. Reflecting the modeling assumption that all rubble removal activities occur either during the day shift (6am to 4pm) or during swing shift (4pm to 2am), Figures C.4-2 and C.4-3 show a summary of the wind conditions for those two time periods, respectively. Figures C.4-4 and C.4-5 show how the wind conditions vary as function of the time of year for the morning and afternoon shifts.
The year 2009 is used to demonstrate inter-annual variability. Figures C.4-6 to C.4-10 correspond to the 1-year average values shown in Figures C.4-1 to C.4-5. Comparison of these figures shows the major features are essentially the same between the six- and one-year plots.
1 Ken Burk, Hanford Meteorological Station, Email dated 12/13/2007 defining link for Hanford meteorological data. 2 Forecast Systems Laboratory (FSL)/National Climatic Data Center (NCDC) Radiosonde Database Access, https://www.ncdc.noaa.gov/data-access/weather-balloon/integrated-global-radiosonde-archive for radiosonde data for Spokane, Washington. 3 Meteorological convention is used, which defines winds by direction from which they come.

C.4
Figure C.4-1. Average Six Year (2004–2009) Wind Rose (wind from) – All Conditions
Figure C.4-2. Average Six Year (2004–2009) Wind Rose (wind from) – Day Shift Conditions

C.5
Figure C.4-3. Average Six Year (2004–2009) Wind Rose (wind from) – Swing Shift Conditions

C.6
Winter (December – February) Spring (March – May)
Summer (June – August) Fall (September – November)
Figure C.4-4. Seasonal Average Six Year (2004–2009) Wind Rose (wind from) – Day Shift Conditions

C.7
Winter (December – February) Spring (March – May)
Summer (June – August) Fall (September – November)
Figure C.4-5. Seasonal Average Six Year (2004–2009) Wind Rose (wind from) – Swing Shift Conditions

C.8
Figure C.4-6. Annual (2009) Wind Rose (wind from) – All Conditions
Figure C.4-7. Annual (2009) Wind Rose (wind from) – Day Shift Conditions

C.9
Figure C.4-8. Annual (2009) Wind Rose (wind from) – Swing Shift Conditions
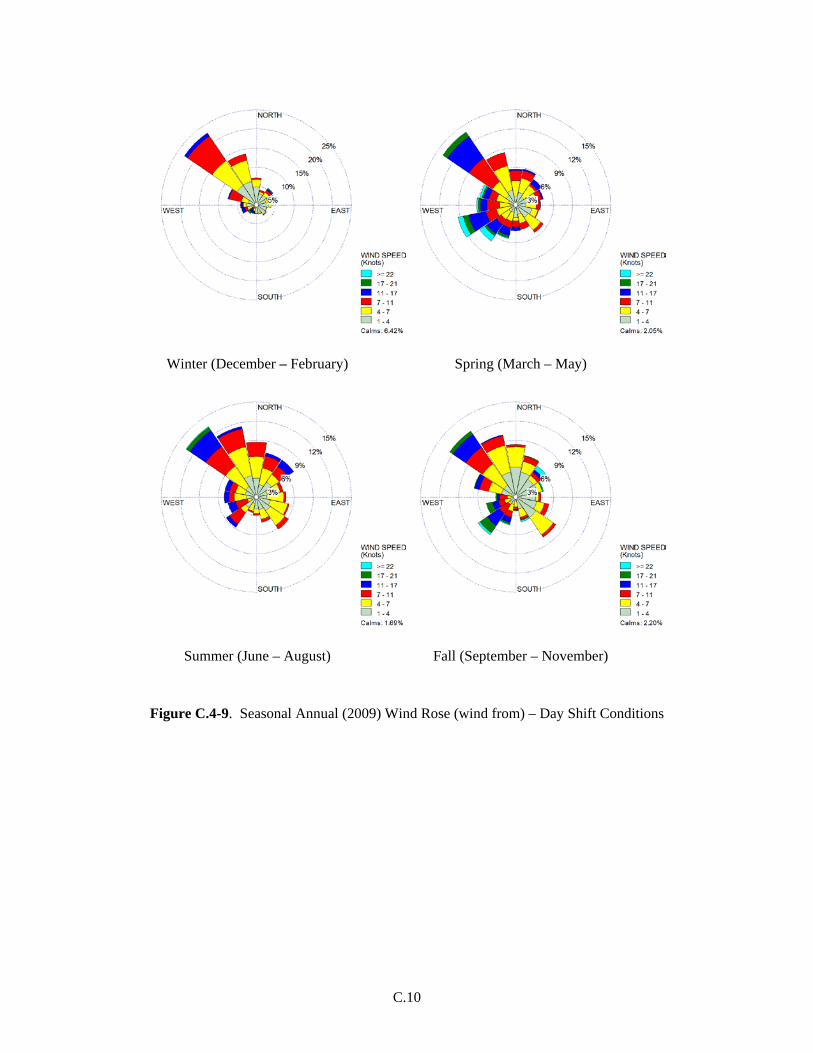
C.10
Winter (December – February) Spring (March – May)
Summer (June – August) Fall (September – November)
Figure C.4-9. Seasonal Annual (2009) Wind Rose (wind from) – Day Shift Conditions
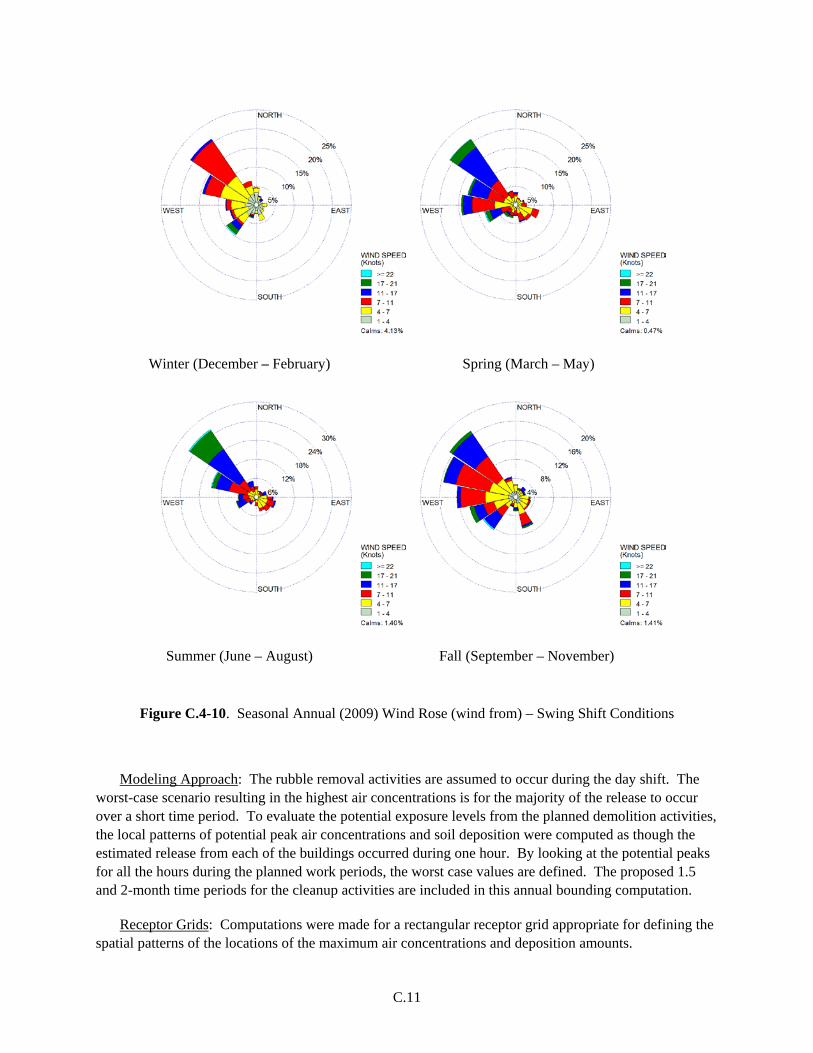
C.11
Winter (December – February) Spring (March – May)
Summer (June – August) Fall (September – November)
Figure C.4-10. Seasonal Annual (2009) Wind Rose (wind from) – Swing Shift Conditions
Modeling Approach: The rubble removal activities are assumed to occur during the day shift. The worst-case scenario resulting in the highest air concentrations is for the majority of the release to occur over a short time period. To evaluate the potential exposure levels from the planned demolition activities, the local patterns of potential peak air concentrations and soil deposition were computed as though the estimated release from each of the buildings occurred during one hour. By looking at the potential peaks for all the hours during the planned work periods, the worst case values are defined. The proposed 1.5 and 2-month time periods for the cleanup activities are included in this annual bounding computation.
Receptor Grids: Computations were made for a rectangular receptor grid appropriate for defining the spatial patterns of the locations of the maximum air concentrations and deposition amounts.
C.12
C.5 References
EPA – U.S. Environmental Protection Agency. 2008. Technology Transfer Network Support Center for Regulatory Air Models, http://www.epa.gov/scram/ (Access last checked 4/23/2018). Project Hanford Management System. 2002. Computer Software Management. HNF-PRO-309. October 24, 2002. Fluor Hanford, Inc. Richland, Washington

Appendix D
Quality Control Procedures


D.1
Appendix D – Quality Control Procedures
D.1 Overview
Quality Assurance (QA) requirements specified by PNNL were followed as documented in a project-specific software QA plan (Rishel and Napier 2018). A QA review of computations and results was conducted. Special aspects of QA requirements for this project are:
3. All modeling computations will be performed with commercial software: either by EXCEL or by AERMOD codes.
4. The equations for all computations in EXCEL will be documented in the project report.
5. The AERMOD model will be tested with the AERMOD distribution test cases to assure the AERMOD model is operating as expected. Documentation of run time options will be documented in the project report.
6. The versions of EXCEL and AERMOD, the computer platforms, and the computer operating system versions will be documented in the final report.
a. Arimescu: Excel 2010 Version 14.0.7145.5000, Lakes AERMOD View Version 9.5, operating on computer WE27050 running under Windows 7 Enterprise Service Pack 1.
b. Napier: Excel 365 Version 1807 Build 10325.20082, operating on computer WE31256 running under Windows 10 Enterprise Version 1803 Build 17134.165.
7. Electronic copies of all EXCEL spreadsheets and AERMOD run files used in the project results will be stored in the project file.
D.2 Reference Rishel JP, Napier BA. 2018. Air Dispersion Modeling for PFP Demolition Software Quality Assurance Plan, PNNL-27336, Pacific Northwest National Laboratory, Richland, WA.


Appendix E
Input Data for 236Z Rubble Simulations (Included on CD only)


Appendix F
AERMOD Output File Listing (Included on CD only)


Appendix G
CAP88-PC Dose Calculations for 236Z Cleanup Activities


G.1
Appendix G
CAP88PC Dose Calculations for 236Z Cleanup Activities
CAP88-PC Version 4.0.1.17 (Rosnick 2014) was used to determine the offsite and onsite Maximally-
Exposed Individual (MEI) doses, as well as a B Reactor receptor dose. Evaluation of annual release estimates from the cleanup activities at 236Z included 7.14x10⁶ Bq (1.93x10⁻⁴ Ci) Pu-239 total release from the rubble. Emissions included Pu-238, -239, -240, -241, and -242, as well as Am-241 but the activity was conservatively assumed to be entirely Pu-239 because its dose impact from a unit release of Pu-239 particulates is greater than that of the other isotopes. The rubble removal was assumed to release material at a low effective release height (10 m). The CAP88-PC model assumes a uniform release rate (Ci/sec) over the entire year.
The methods used to calculate the dose are consistent with that of DOE/RL-2006-29 (Snyder and Rokkan 2016). Three receptors were evaluated: one Offsite receptor and two Onsite receptors. Offsite receptor dose includes inhalation, external exposure, and ingestion dose where food is grown and harvested at the receptor site. Onsite receptor dose includes inhalation and external exposure dose at the receptor site plus average regional (within 50 mi of 200 Areas) food dose. Fulltime occupancy (8760 hr/yr) at each receptor location is assumed within CAP88-PC. Consistent with DOE/RL-2006-29 assumptions, a 50-year build-up time was implemented. This essentially assumes the same annual release occurs every year for 49-years and then during the 50th year the dose to the receptor is calculated. While such a release scenario and long term regional soil-deposition of emissions would not be applicable to the PFP rubble removal activities, the dose result will be conservative (over-estimating).
The Offsite MEI was located at the 200-West offsite receptor location of DOE/RL-2006-29 (Snyder
and Rokkan 2016), in the region of the Yakima River Horn ( Figure G-1). The onsite receptors were located at the 200-West onsite receptor location (same reference) at LIGO ( 1 in Figure G-1) and at the B Reactor ( 2 in Figure G-1). The distances to the receptors were determined using Google Earth© 2015 (image date May 2015) relative to PFP. Ten-year meteorology (2004-2013) from 200-West meteorological Station 7 was used in CAP88-PC. The population distribution data used for average regional food ingestion was based on 2010 census data (Hamilton and Snyder 2011). RESULTS
CAP88-PC dose results are listed in Table G-1. The Onsite receptor at LIGO would potentially incur the greatest dose from the radioactive emissions. The doses to all receptors evaluated are well below the EPA air pathway dose standard of 10 mrem (40 CFR 61, Subpart H, 2009 and WAC 246-247).

G.2
Figure G-1. Hanford Site Offsite and Onsite Receptors Evaluated.

G.3
Table G-1. CAP88-PC V4 Dose Results
Receptor Pu-239Annual Release from PFP
Location relative to PFP Dose (mrem TED)
Offsite MEI 7.14x10⁶ Bq (1.93x10⁻⁴ Ci) 23,980 m SE 3.0x10⁻⁴
Onsite MEI at LIGO
7.14x10⁶ Bq (1.93x10⁻⁴ Ci) 20,150 m ESE 4.9x10⁻⁴
Onsite Receptor at B
Reactor
7.14x10⁶ Bq (1.93x10⁻⁴ Ci) 8,970 m N 2.8x10⁻⁴
REFERENCES
40 CFR 61, Subpart H. 2009. “National Emission Standards for Radionuclides Other Than Radon From Department of Energy Facilities.” Code of Federal Regulations, U.S. Environmental Protection Agency, Washington, D.C.
Hamilton, EL and SF Snyder. 2011. Hanford Site Regional Population – 2010 Census. PNNL-20631, Pacific Northwest National Laboratory, Richland, Washington.
Rosnick R. 2014. CAP88-PC Version 4.0 User Guide. Office of Radiation and Indoor Air, U.S. Environmental Protection Agency, Washington, D.C. Accessible at (June 2016) https://www.epa.gov/radiation/cap-88-cap-88-pc#tab-2. Snyder, SF and DJ Rokkan. 2016. Calculating Potential-to-Emit Radiological Releases and Doses. DOE/RL-2006-29, revision 2, Department of Energy-Richland, Richland, WA. WAC 246-247. 2014. “Radiation Protection — Air Emissions.” Washington Administrative Code, Olympia, Washington. Accessed November 2015, at http://apps.leg.wa.gov/wac/default.aspx?cite=246-247.


PNNL-27464
Distribution
No. of No. of Copies Copies
Distr.1
40 CH2M HILL Plateau Remediation Company
SR Godfrey T4-55 MT Hughey T1-43 B Oldfield (35) T4-54 PM Sauer T5-72 DT Southerland T1-43 KA Wooley T1-43
6 Pacific Northwest National Laboratory BA Napier (2) K7-68 JP Rishel J2-25 EI Mart K7-68 SF Snyder K7-68 MD Freshley K9-75