Embed Size (px)
Citation preview

February 2010
NASA/TM-2010-216195
Air Data Boom System Development for the Max Launch Abort System (MLAS) Flight Experiment
Jessica A. Woods-Vedeler NASA Langley Research Center, Hampton, Virginia Jeff Cox, Robert Bondurant, Ron Dupont, Louise O’Donnell, and Wesley Vellines IV Modern Machine and Tool Company, Inc., Newport News, Virginia William M. Johnston Lockheed Martin Corporation, Hampton, Virginia Christopher M. Cagle, David M. Schuster, Kenny B. Elliott, and John A. Newman NASA Langley Research Center, Hampton, Virginia Erik D.Tyler Analytical Mechanics and Associates, Inc., Hampton, Virginia William J. Sterling NASA Goddard Space Flight Center, Wallops Flight Facility, Wallops Island, Virginia
https://ntrs.nasa.gov/search.jsp?R=20100009529 2018-09-03T21:41:18+00:00Z

NASA STI Program . . . in Profile
Since its founding, NASA has been dedicated to the advancement of aeronautics and space science. The NASA scientific and technical information (STI) program plays a key part in helping NASA maintain this important role.
The NASA STI program operates under the auspices of the Agency Chief Information Officer. It collects, organizes, provides for archiving, and disseminates NASA’s STI. The NASA STI program provides access to the NASA Aeronautics and Space Database and its public interface, the NASA Technical Report Server, thus providing one of the largest collections of aeronautical and space science STI in the world. Results are published in both non-NASA channels and by NASA in the NASA STI Report Series, which includes the following report types:
• TECHNICAL PUBLICATION. Reports of
completed research or a major significant phase of research that present the results of NASA programs and include extensive data or theoretical analysis. Includes compilations of significant scientific and technical data and information deemed to be of continuing reference value. NASA counterpart of peer-reviewed formal professional papers, but having less stringent limitations on manuscript length and extent of graphic presentations.
• TECHNICAL MEMORANDUM. Scientific
and technical findings that are preliminary or of specialized interest, e.g., quick release reports, working papers, and bibliographies that contain minimal annotation. Does not contain extensive analysis.
• CONTRACTOR REPORT. Scientific and
technical findings by NASA-sponsored contractors and grantees.
• CONFERENCE PUBLICATION. Collected
papers from scientific and technical conferences, symposia, seminars, or other meetings sponsored or co-sponsored by NASA.
• SPECIAL PUBLICATION. Scientific,
technical, or historical information from NASA programs, projects, and missions, often concerned with subjects having substantial public interest.
• TECHNICAL TRANSLATION. English-
language translations of foreign scientific and technical material pertinent to NASA’s mission.
Specialized services also include creating custom thesauri, building customized databases, and organizing and publishing research results. For more information about the NASA STI program, see the following: • Access the NASA STI program home page at
http://www.sti.nasa.gov • E-mail your question via the Internet to
[email protected] • Fax your question to the NASA STI Help Desk
at 443-757-5803 • Phone the NASA STI Help Desk at
443-757-5802 • Write to:
NASA STI Help Desk NASA Center for AeroSpace Information 7115 Standard Drive Hanover, MD 21076-1320

National Aeronautics and Space Administration Langley Research Center Hampton, Virginia 23681-2199
February 2010
NASA/TM-2010-216195
Air Data Boom System Development for the Max Launch Abort System (MLAS) Flight Experiment
Jessica A. Woods-Vedeler NASA Langley Research Center, Hampton, Virginia Jeff Cox, Robert Bondurant, Ron Dupont, Louise O’Donnell, and Wesley Vellines IV Modern Machine and Tool Company, Inc., Newport News, Virginia William M. Johnston Lockheed Martin Corporation, Hampton, Virginia Christopher M. Cagle, David M. Schuster, Kenny B. Elliott, and John A. Newman NASA Langley Research Center, Hampton, Virginia Erik D.Tyler Analytical Mechanics and Associates, Inc., Hampton, Virginia William J. Sterling NASA Goddard Space Flight Center, Wallops Flight Facility, Wallops Island, Virginia

Available from:
NASA Center for AeroSpace Information 7115 Standard Drive
Hanover, MD 21076‐1320 443‐757‐5802

1
AIR DATA BOOM SYSTEM DEVELOPMENT FOR THE MAX LAUNCH ABORT SYSTEM (MLAS) FLIGHT EXPERIMENT
Jessica A. Woods-Vedeler NASA Langley Research Center, Hampton, VA
Jeff Cox, Robert Bondurant, Ron Dupont, Louise O’Donnell, and Wesley Vellines IV
Modern Machine and Tool Co., Inc., Newport News, VA
William M. Johnston Lockheed Martin Corporation, Hampton, VA
Christopher M. Cagle, David M. Schuster, Kenny B. Elliott and John A. Newman
NASA Langley Research Center, Hampton, VA
Erik D.Tyler Analytical Mechanics and Associates, Inc., Hampton, VA
William J. Sterling
NASA Goddard Space Flight Center, Wallops Island, VA ABSTRACT
In 2007, the NASA Exploration Systems Mission Directorate (ESMD) chartered the NASA Engineering Safety Center (NESC) to demonstrate an alternate launch abort concept as risk mitigation for the Orion project’s baseline “tower” design. On July 8, 2009, a full scale and passively, aerodynamically stabilized MLAS launch abort demonstrator was successfully launched from Wallops Flight Facility following nearly two years of development work on the launch abort concept: from a napkin sketch to a flight demonstration of the full-scale flight test vehicle. The MLAS flight test vehicle was instrumented with a suite of aerodynamic sensors. The purpose was to obtain sufficient data to demonstrate that the vehicle demonstrated the behavior predicted by Computational Fluid Dynamics (CFD) analysis and wind tunnel testing. This paper describes development of the Air Data Boom (ADB) component of the aerodynamic sensor suite. The ADB system was developed during an intense 2 month period of January through February, 2008. The air data booms were designed to break away from the vehicle if impacted by a parachute riser line during the MLAS vehicle reorientation and yet remain attached under predicted ascent loads. The MLAS ADB system consisted of two SpaceAge Controls mini air data booms, a flight backup and supporting electronics. For Mach>0.2, these air data booms met the required accuracy of 0.01 for Mach number and an accuracy of +/- 0.5 deg on AOA and sideslip. The two booms were located 90 deg apart due to the uncertainty related to pitch plane orientation during ascent in the event that the vehicle experienced roll. Because of anticipated ADB flexibility during ascent, calibrated full bridge, bending strain gages were included at the base of the extension to characterize in-flight deflection of the ADB system. Structural analysis and failure testing were performed to verify that the air data boom and attached extension met strength and stiffness requirements. Experimental test results showed that the ADB system extension would fail at twice the load predicted by linear analysis but at less than 200 lbs impact force, nearly two orders of magnitude less than the potential impact load during flight. Installation

2
and initial alignment of the two flight ADB systems on the flight test vehicle were completed on-schedule.
NOMENCLATURE Cd Drag Coefficient Cp Pressure Coefficient d Depth, in E Modulus of Elasticity, psi e Distance, in f Force per Unit Length, lb/in Io
Cross-sectional Area of Inertia, in4 OD Outer Diameter, in MY Moment about Y axis, in-lb MZ Moment about Z axis, in-lb
M Free Stream Mach Number
r Radius, deg P Point Load, lb p Pressure, lb/ft2
po Total Pressure, lb/ft2
p Free Stream Pressure, lb/ft2
q Free Stream Dynamic Pressure, lb/ft2
V Free-Stream Velocity, ft/s
w Width, in
Greek Symbols Angle of Attack, deg Angle of Sideslip, deg Specific Heat Ratio Air Density, slugs/ft3
List of Acronyms
ADB Air Data Boom AOA Angle of Attack CEV Crew Exploration Vehicle CFD Computational Fluid Dynamics CLV Crew Launch Vehicle ESMD Exploration Systems Mission Directorate FF Forward Fairing GPS Global Positioning System IML Inner Mold Line IMU Inertial Measurement Unit LaRC NASA Langley Research Center MLAS Max Launch Abort System NESC NASA Engineering and Safety Center OML Outer Mold Line

3
INTRODUCTION
In 2007, the NASA Exploration Systems Mission Directorate (ESMD) chartered the NASA Engineering Safety Center (NESC) to demonstrate an alternate launch abort concept as risk mitigation for the Orion project’s baseline “tower” design. Orion is part of the NASA Constellation Program architecture. The alternate concept, known as the Max Launch Abort System (MLAS), would be capable of extracting the Crew Exploration Vehicle (CEV) from the launch vehicle at any time from crew ingress at the launch pad through staging and successful ignition of the second or upper stage of the Crew Launch Vehicle (CLV). On July 8, 2009, a full scale and passively, aerodynamically stabilized MLAS launch abort demonstrator was successfully launched from Wallops Flight Facility following nearly two years of development work on the launch abort concept: from a napkin sketch to a flight demonstration of the full-scale flight test vehicle.
The MLAS flight test vehicle was instrumented with a suite of aerodynamic sensors. The purpose was to obtain sufficient data to demonstrate that the vehicle demonstrated the behavior predicted by CFD analysis and wind tunnel testing. To achieve this objective, unsteady static pressures were acquired on the Forward Fairing (FF) and on the Crew Module (CM). These pressure measurements, in conjunction with wind speed and attitude information acquired via Air Data Booms (ADB), Inertial Measurement Units (IMU), and Global Positioning Systems (GPS) installed on the vehicle and radiosonde atmospheric measurement balloons launched prior to flight, were to enable validation of CFD models and wind tunnel test results. High frequency unsteady dynamic pressure data was also collected in order to characterize the aeroacoustic environment of MLAS during ascent.
This paper describes development of the ADB component of this system. In particular, two air data boom systems were developed for flight and an additional system as backup. Development and installation of the ADB systems occurred during a 2 month period of January through February, 2008. It is noted that while product brand names are indicated, NASA does not specifically endorse use of these products or guarantee their performance.
As described in the paper, there were several challenges to meet for successful ADB systems to be delivered. The most important challenge was a requirement that the two installed air data booms break away from the vehicle if impacted by a parachute riser line during the MLAS vehicle reorientation and yet remain attached under predicted ascent loads. Thus, each air data boom was notched at the base so that it would fail easily in shear yet have enough strength to resist failing under moments due to uniform aerodynamic loading. In the event that the flight loads induced deflection of the air data booms, it was also necessary to have knowledge about the angular deflection of the boom vanes so that angle of attack and sideslip angular measurements could be corrected for such deflection. Thus, the boom system was instrumented with strain gages at the base and a load-deflection calibration was needed. The final challenge was development of an alignable mounting fixture for the air data booms on the vehicle’s curved Inner Mold Line (IML).

4
REQUIREMENTS
Air Data Parameters
An ADB provides the necessary aerodynamic reference conditions required to reduce, analyze, and compare fairing ascent pressure data to analytical and wind tunnel pre-flight predictions. Mach number, angle-of-attack (AOA) and sideslip are the most important properties required to characterize the measured flight steady and unsteady pressure distributions. Without accurate measurement of these quantities, the measured data could not be anchored to corresponding conditions measured in the wind tunnel or computed by computational fluid dynamics (CFD). An ADB directly measures p , p0, angle-
of-attack and side-slip. Mach number can be derived from p and p0 using isentropic relations.
(1) 2
12
M
p
p
C p
where M is determined from a direct ADB measurement,
12
2
11
M
p
p
o
An accuracy of 0.01 was required on Mach number and an accuracy of +/- 0.5 deg on AOA and sideslip.
Structural Design
One of the critical phases of the MLAS flight demonstration was reorientation of the flight vehicle’s forward assembly following coast skirt separation. Mission success depended on a successful reorientation and positioning of the forward assembly such that the CM could be successfully extracted (ie. dropped) from the forward fairing. In order to assure a successful reorientation, two drogue parachutes were fired from the forward assembly following coast skirt separation. These drogues provided a drag force which assured the desired vehicle reorientation and slowed vehicle descent rate to allow sufficient time for damping of the forward assembly on the parachutes for successful CM extraction. Thus, the MLAS reorientation drogue parachutes were a mission critical element of the flight vehicle.
Because the air data boom system components could potentially introduce damage to the reorientation turn-around drogues, several design options were discussed by the MLAS team to minimize the likelihood of such damage. These options are summarized in Table 1. In particular, the pros and cons of a break away design were addressed in addition the relative benefits of mechanical retention vs. active separation. It was decided that the air data boom system components would be designed such that the exposed boom and extension would break off flush with the fairing Outer Mold Line (OML) surface when subjected to the high shear loads associated with a reorientation drogue line impact yet remain attached under the highest expected flight bending and shear loads. In the event that the air data boom
5
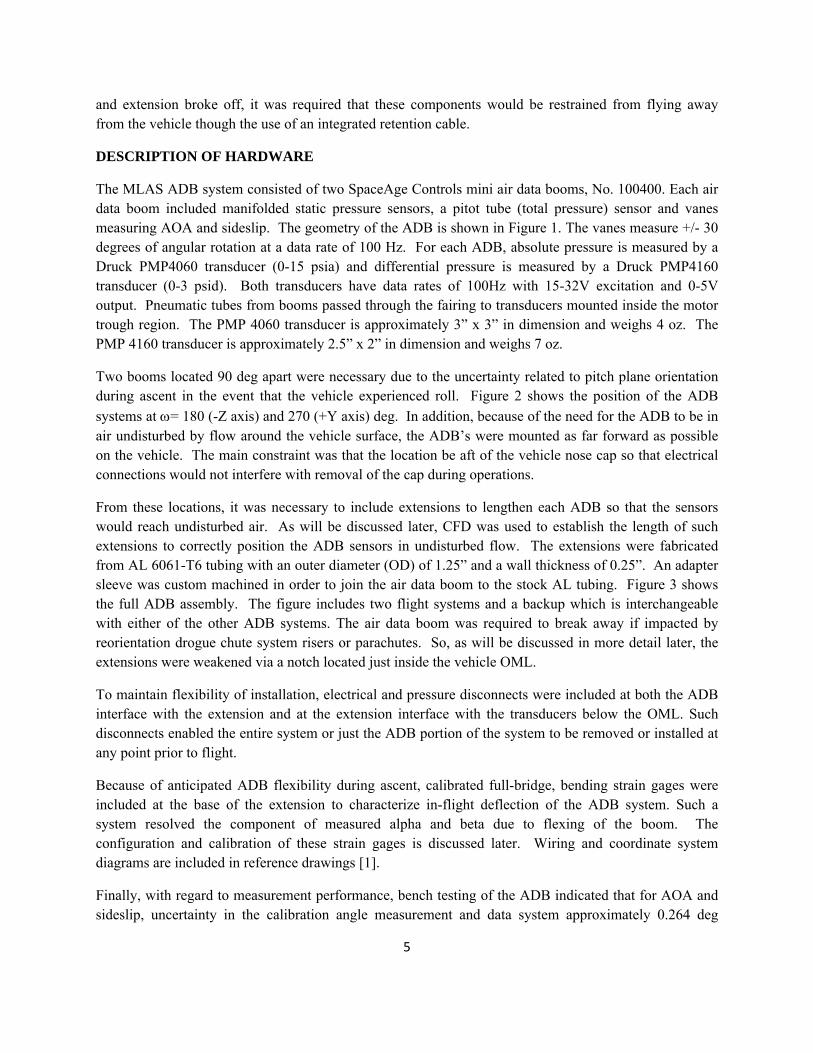
and extension broke off, it was required that these components would be restrained from flying away from the vehicle though the use of an integrated retention cable.
DESCRIPTION OF HARDWARE
The MLAS ADB system consisted of two SpaceAge Controls mini air data booms, No. 100400. Each air data boom included manifolded static pressure sensors, a pitot tube (total pressure) sensor and vanes measuring AOA and sideslip. The geometry of the ADB is shown in Figure 1. The vanes measure +/- 30 degrees of angular rotation at a data rate of 100 Hz. For each ADB, absolute pressure is measured by a Druck PMP4060 transducer (0-15 psia) and differential pressure is measured by a Druck PMP4160 transducer (0-3 psid). Both transducers have data rates of 100Hz with 15-32V excitation and 0-5V output. Pneumatic tubes from booms passed through the fairing to transducers mounted inside the motor trough region. The PMP 4060 transducer is approximately 3” x 3” in dimension and weighs 4 oz. The PMP 4160 transducer is approximately 2.5” x 2” in dimension and weighs 7 oz.
Two booms located 90 deg apart were necessary due to the uncertainty related to pitch plane orientation during ascent in the event that the vehicle experienced roll. Figure 2 shows the position of the ADB
systems at = 180 (-Z axis) and 270 (+Y axis) deg. In addition, because of the need for the ADB to be in air undisturbed by flow around the vehicle surface, the ADB’s were mounted as far forward as possible on the vehicle. The main constraint was that the location be aft of the vehicle nose cap so that electrical connections would not interfere with removal of the cap during operations.
From these locations, it was necessary to include extensions to lengthen each ADB so that the sensors would reach undisturbed air. As will be discussed later, CFD was used to establish the length of such extensions to correctly position the ADB sensors in undisturbed flow. The extensions were fabricated from AL 6061-T6 tubing with an outer diameter (OD) of 1.25” and a wall thickness of 0.25”. An adapter sleeve was custom machined in order to join the air data boom to the stock AL tubing. Figure 3 shows the full ADB assembly. The figure includes two flight systems and a backup which is interchangeable with either of the other ADB systems. The air data boom was required to break away if impacted by reorientation drogue chute system risers or parachutes. So, as will be discussed in more detail later, the extensions were weakened via a notch located just inside the vehicle OML.
To maintain flexibility of installation, electrical and pressure disconnects were included at both the ADB interface with the extension and at the extension interface with the transducers below the OML. Such disconnects enabled the entire system or just the ADB portion of the system to be removed or installed at any point prior to flight.
Because of anticipated ADB flexibility during ascent, calibrated full-bridge, bending strain gages were included at the base of the extension to characterize in-flight deflection of the ADB system. Such a system resolved the component of measured alpha and beta due to flexing of the boom. The configuration and calibration of these strain gages is discussed later. Wiring and coordinate system diagrams are included in reference drawings [1].
Finally, with regard to measurement performance, bench testing of the ADB indicated that for AOA and sideslip, uncertainty in the calibration angle measurement and data system approximately 0.264 deg

6
which is ~0.5% of the full scale output. Differential pressure gages used to measure static pressure have +/- 0.03 psid uncertainty and absolute pressure gages used to measure total pressure have +/- 0.01 psia uncertainty. The ADB measured Mach error derived from transducer calibration data shows that the ADB meets Mach uncertainty requirement for M=0.20 and above as shown in Figure 4. It is noted that all CFD and wind tunnel data was acquired at or above M=0.20.
PROCEDURE
The ADB system was developed based on analysis and testing. CFD was used to position the two flight ADB systems with the alpha and beta vanes in relatively undisturbed air forward of the vehicle. Anticipated loads were defined based on predicted dynamic pressure and vehicle attitude during ascent. Structural analysis and verification testing was performed in order to define a break-away mechanism for the ADB system. The ADB system was also instrumented and load-deflection calibrated in order to measure in-flight deflection of the system for correction of the alpha and beta vane measurements. Finally, the system was fabricated and installed on the flight test vehicle and initial alignment was performed on the system.
CFD Analysis (Placement/ location)
In order to obtain the most accurate measure of flow parameters, the air data boom metric components were required to be in air undisturbed by flow around the vehicle. Proximity of the ADB’s to the fairing surface can result in significant error in pressure and flow angle measurement. CFD (USM3D) was used to establish the location of the air data boom instruments relative to the vehicle nose to minimize such disturbances. Results are shown in Figure 5 and show that the optimal location for the aft-most beta vane is at X=-60 inches in the MLAS coordinate system. Figure 6 shows the planned installation geometry based on these results.
Ascent Loads Analysis
Ascent loads analysis was performed to evaluate the strength and stiffness requirements of the ADB system. Figure 7 shows the dynamic pressure and angle of attack of the vehicle and the load acting on the ADB due to these conditions during the MLAS flight trajectory [MLAS-D2-6E-MaxQAlpha-Rev200811112]. A factor of safety (FS) of 1.4 is included in the load conditions.
In the strength case, the ADB must be able to survive flight loads until being (potentially) struck by a reorientation drogue parachute component. From Figure 7, the maximum load occurs at about 20 seconds during the reorientation phase pitch-up and prior to drogue parachute deployment. Table 2 summarizes flight conditions at this time. In addition, while the ADB measures pressure data accurately up to about 30 deg AOA, it was desired for the ADB tip not to flex more than 2.5 deg under flight loads, if possible, at least until coast skirt separation. This established a load case for stiffness which occurs during the boost pitch-over near 2.5 sec in the flight trajectory.
It is noted that in the MLAS concurrent design process, the final air data boom loads estimate was not available until after testing performed in this study. The final loads are included in the Appendix for reference only. The difference between final loads and design loads is not substantial.

7
The load associate with the riser line stretch during parachute deployment was anticipated to be on the order of at least 8,000 lb.
Structural Design, Analysis and Testing of the ADB Extension
Structural Design
As indicated earlier, the ADB systems were required to break away from the vehicle if impacted by any components of the turn-around drogue parachute system but remain attached under normal flight loads. The model of break-away road signs was recommended for design [2]. Modern road signs are designed to withstand distributed wind loads that create a moment at the base while failing easily under the pure transverse shear loads associated with a vehicle impact.
In the case of the ADB, a notch at the base of the extension was selected to facilitate break-away due to impact. The notch was located below the vehicle OML to prevent entanglement or damage due to any remaining protrusion following extension failure. In this section, the analytical and experimental trade study conducted to design and evaluate three different notch geometries is discussed. A diagram of the notch geometry under consideration is shown in Figure 8.
Structural Analysis
Linear, finite element analysis was performed in Pro-Engineer [3] to evaluate the maximum stress in the notch under a statically applied flight load using loads from Table 2 with the following relation.
(3)
where,
f = force per unit length
Cd = 1.18 for a cylinder at 90 deg to the airflow [4]
OD = outer diameter
For both cases, the loads were applied uniformly distributed along the exposed portion of the ADB system. Inertial contributions were not included. Tip deflections and maximum stresses in the notch were predicted for both cases. Figure 9 shows a typical tip deflection result and Figure 10 shows results for the notch stress analysis. Results are summarized in Table 3. It is noted that the boom was actually sized for a maximum 2.5 in tip deflection under load, not a 2.5 deg rotation at the tip since the initial estimate of ascent loads became available only after the initial design of the extension.
Structural Testing
Because the notch is actually a non-linear geometry, it was necessary to perform structural testing to verify linear analytical results. For testing, three AL 6061-T6 AL tube test specimens with notches were fabricated as shown in Figure 11. Design vs. measured notch geometries are shown in Table 4.
)sin( ODqCdf

8
The experimental test setup geometry is shown in Figures 12 and 13. The boundary condition of the extension in the ADB bracket on the vehicle was approximated by clamping each test specimen at the base as shown in a photograph of the experimental test set up Figure 13. As indicated in Figure 12, the clamped length was 3.75 in and the distance to the notch was 7.43 in. The amount of extension clamped was consistent with the amount of extension to be clamped into the mounting bracket on the vehicle. While this was not the true boundary condition due to potential fairing and/or mounting bracket flexibility, the actual mounting bracket was not yet available for testing. As shown in the figure, a Linear Variable Differential Transformer (LVDT) was placed 35 in from the notch center to measure displacement. A uniformly distributed ‘flight’ load was not applied. Instead, a point load that produced an equivalent moment at the notch was used. The point load was applied 50 in from the notch center for the score and 26 in from the notch center for the other notches.
Load-Deflection Calibration
Structural flexibility of the ADB system due to the notch breakaway feature and the ADB itself results in significant angular deflection at vane measurement locations. As it would not be possible to resolve angular deflection of the vanes due to ADB deflection under flight loads, the ADB extension was instrumented with strain gages at the notch location and calibrated to measure angular deflection at vane locations due to uniformly applied flight loads. Thus, the flight angular data as measured by the vanes could be corrected via strain gage measurements. According to low subsonic calibration of the air data boom used in this study [5], static and total pressure measurements are insensitive to angles up to 30 degrees. Thus, no calibration was required for pressures.
Strain Gages
In order to maximize the output of strain gages under flight loads, the ADB extensions were instrumented with strain gages across the 0.06 in notches. Two full-bridge bending strain gages were installed on each extension, with half bridges located every 90 deg around the notch. To be sure that the gages laid flat against the notch, each half bridge was installed into longitudinal grooves of 0.25 in width and 1.25 in length. Because the cross-sectional area of the notch was still much less than that of the longitudinal grooves, the extension would still fail at the notch. Figure 14 shows an example of one-half of the full bridge arrangement.
The installation geometry for strain gages on each of the two flight ADB systems was designed such that the strain gage output corresponded to the specific ADB system orientation in the coordinate axis system when mounted. Thus, output for bending in the X-Z and in the X-Y planes corresponded in sign to the vehicle coordinate axis system convention for each ADB system when mounted. The backup ADB system was designed such that it was interchangeable with the other two. The difference that allowed this was simply an additional set of mounting holes in the ADB extension base at 90 deg away from the original mounting hole locations. These additional mounting holes allowed the ADB system to be translated but not rotated to a new location 90 deg away on the flight test vehicle.

9
Calibration Test Set Up and Load Cases
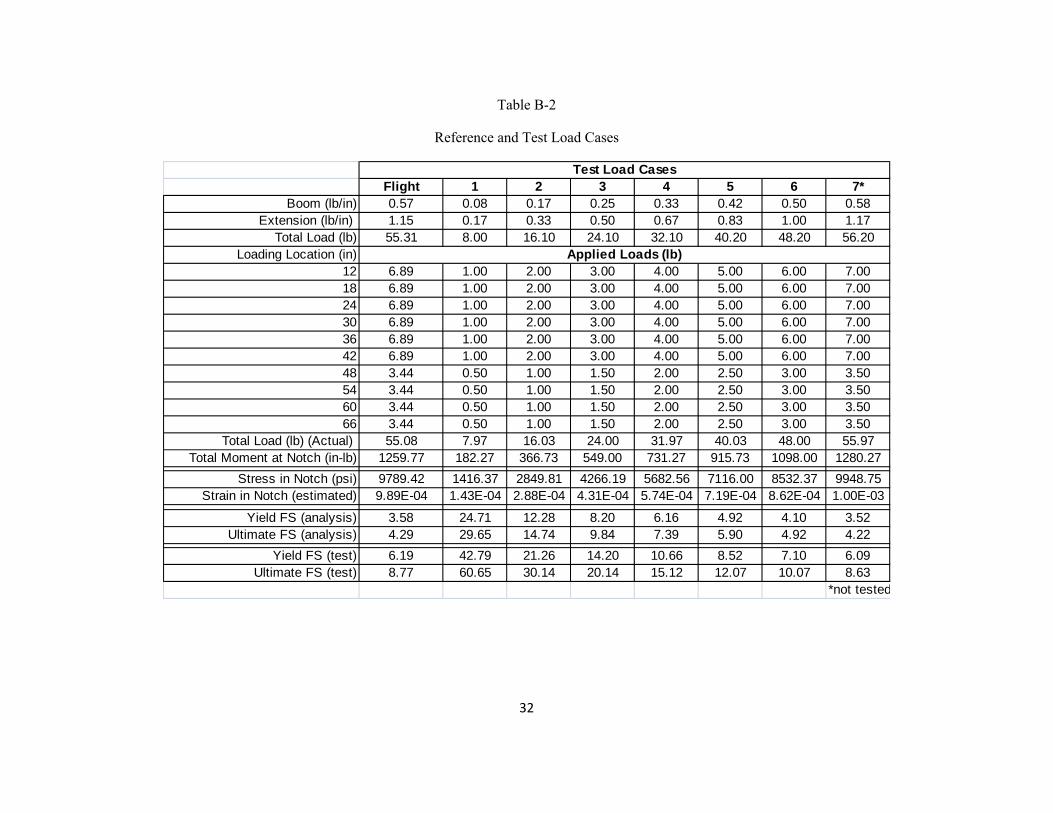
The objective of the test was to map a known, distributed load applied normally to the ADB system to strain gage bending output, angular rotation at the vane and tip locations, and tip displacement. A test set up was devised to simulate the distributed flight load condition. A similar approach to application of distributed loads on an air data boom was used in [6]. As shown in Figure 15, each ADB system was clamped at the base to 4 in of length using a V-block clamp as was done during structural testing. Starting at 12 in from the base, tie wraps were fastened around the cantilevered ADB system every 6 in. They were fastened loosely to prevent introduction of torsion during loading. A weight hangar of known weight was hung from the tie wraps at each location. In order to apply loads, calibrated weights were hung from each hangar such that the desired load distribution was achieved. A dial gage was placed at the tip of the ADB system to measure tip displacement and a hand-held inclinometer was used to measure angular rotation. The distributed load was piecewise continuous since the aerodynamic load acting on the extension would be greater than that on the ADB probe due to a larger OD. Incrementally increasing load cases were defined based on the stiffness load case. It was assumed that the full load was applied only outside of the notch since the notch would be at the vehicle OML and that only the outer, unclamped portion would be subjected to loads. These load cases are included in Appendix B.
Installation
The two flight ADB systems were installed on the MLAS flight test vehicle. The planned mounting location at X=-14.05 in was marked using the laser metrology system at both the 180 deg and 270 deg locations. Several other X-axis locations were marked for reference. Figure 16 shows white markings that indicate the mounting location. It was determined, however, that a hole drilled vertically through the curved fairing at this location would interfere with the forward fairing nose ring. Thus, the ADB system was shifted 2 in aft in X to accommodate the nose ring. With the notch location 1 in behind the OML and the system shift aft, the final positions of the aft vanes were at X=- 57 in instead of the planned X=-60 in. Table 5 summarizes the final location and geometry of installation. The table also summarizes the amount of ADB system extending outside the vehicle OML and above the vehicle nose.
A 0.25 in thick AL mounting plate was used to mount each ADB system bracket because the IML topography did not correspond to the design assumptions. The ADB bracket was mounted to the mounting plate.
Figure 17 shows the final mounted configuration. The notch location was 1 in below the OML of the vehicle. Two center bolts secured the extension to the mounting bracket “V” blocks and each block was secured with four bolts that tightened the extension tube to the mount.
A handheld inclinometer (same as used for the ADB load-deflection calibration) was used to perform initial alignment of the ADB extension in the mounted bracket. AL shim plates were added under the mounting plate to position the extension to within 0.1 deg of the angular reference. The angular reference used was a vertical surface on the inside of the vehicle nose ring. This point was found to be within 0.1 deg of two other locations below the motor troughs on the trailing edge of the forward fairing. A final alignment of the ADB system was planned with the laser metrology team.

10
The ADB probe and extension fit together with two opposing bolts. The two pressure lines interconnected at the top of the extension with press-on connectors. Two electrical connections via ‘Winchester’ type connectors were secured with tie-wraps at the top of the extension. Thus, the extension could be mounted on the vehicle and the probe later. This approach was used to accommodate height restrictions imposed on the vehicle by the launch pad shelter.
The extension could also be removed prior to installation of the vehicle nose cap to allow for vehicle handling. The extension was physically connected to the retention blocks with two 0.25” bolts through an extension tube. Four 0.25” bolts secured the retention blocks to the mounting bracket after each tube was inserted. The four strain gage wires for each ADB system also had disconnects inside the fairing.
The retention cable was planned to be a 3/8 in, swaged steel cable that passed through the extension on the OML of the vehicle and looped around the mounting bracket on the IML. The intent was that the cable would retain the ADB system in the event of impact from a reorientation drogue parachute component and prevent the ADB system from causing potentially catastrophic damage to the parachute system.
RESULTS AND DISCUSSION
Structural Analysis and Testing
Table 6 and Figures 18 and 19 summarize the results from structural testing of the extension specimens. For the scored tube, the load was applied at 50 in from the notch. The scored tube yielded at the clamped base rather than at the notch and did not fail under testing to 290 lb. The AL was too ductile to fail at a notch of the tested dimensions and, as a result, the application load required to break the scored tube exceeded the capability of the test setup. For the 0.5 in and 0.06 in notch, the loads were applied at 26 in from the notch. For the 0.5 in notch, significant yielding started at a lower load than for the 0.06 in notch but the test specimen broke at same load as the 0.06 in notch specimen and at approximately twice the load predicted by analysis. Apparently, the linear analysis provided a very conservative estimate of failure compared to the actual non-linear geometry performance. The conclusion was that the narrow geometry of the 0.06 in notch concentrated the stress better and would break more effectively than either the score or 0.5 in notches.
Load Deflection Calibration
All three of the ADB systems were load-deflection calibrated: 2 flight systems and 1 backup system. Load Cases 1-6 were used. Case 7 which represented the actual flight load was not used out of concern for damaging the hardware in the test setup. Calibration data tables and plots of individual cases are included in Appendix B.
Average results are shown in Figure 20. From this figure, it is seen that the rotation at alpha, beta and the tip of the boom are nearly the same within a band of measurement uncertainty. The rotation of the tip of the extension under load is much less and supports the observation that the majority of displacement along the ADB system under load occurred at the base of the probe at the interface of the probe and the extension due to the flexibility of the probe relative to the extension. In fact, the extension demonstrated very little displacement under all load cases. Figure 21 shows typical tip displacement under load.

11
In addition, from the tables in Appendix B, it is seen that for bending in MY that the strain output in the MZ direction is typically about 1% error indicating that the bending loads were being applied orthogonally to the test article.
Load Case 6 was the maximum load applied to the system. Case 7, a higher load case, represented the stiffness requirement for the ADB system which required no more than 2.5 deg tip displacement under stiffness flight loads. It can be seen that this requirement is not met since, even for load Case 6, the rotation is about 5 deg. The estimated tip rotation under the flight load is less than 6 deg. However, the ‘2.5 deg rotation at the tip’ requirement was a ‘meet if you can’ requirement as the total and static pressure measurements are still good up to about 30 deg rotation.
Figures 22-24 show results for the calibrations for rotations averaged over the three booms at the alpha vane, beta vane and tip vs. strain gage output due to load. Table 7 summarizes these calibrations. In general, MY output tends to be slightly higher than MZ output for a given load. This may be due to a slightly asymmetric arrangement of fasteners at the interface of the probe and adapter sleeve.
It is noted that the procedure for measuring angular rotations involved using a hand held inclinometer to 0.1 deg. The device was calibrated to 0.01 deg and was linear in the angular range of interest. However, it was observed that some error could occur due to human factors. While some repeatability testing was performed, the error could not be eliminated. It is estimated that this error was on the order of 0.25 deg and contributed to the overall uncertainty in the results.
Figure 20, in particular, shows a comparison of average results at all locations. At the highest load Case 6, it is observed that all three positions vary by only 0.27 deg rotation which is approximately 6% of the average measured rotation for that load case.
SUMMARY
Three Air Data Boom (ADB) systems were developed based on analysis and testing. The systems were designed based on CFD results and predicted flight loads. They were instrumented with strain gages and load-deflection calibrated to enable measurement of in-flight alpha and beta errors due to bending of the system under flight loads. Experimental test results showed that the ADB system extension would fail at twice the load predicted by linear analysis but at less than 200 lbs impact force, nearly two orders of magnitude less than the potential impact load during flight. Installation and initial alignment of the two flight ADB systems on the flight test vehicle were completed.
REFERENCES
[1] Drawing numbers: #1264674, #1264675, #1264676, Feb, 2009, Modern Machine& Tool Co., Inc., Newport News, VA.
[2] Discussion with Dr. Curt Larsen/NASA JSC.
[3] “Pro/Mechanica Wildfire”, v3.0, Parametric Technology Corporation (PTC), MA.
[4] Hoerner, S. F., Fluid Dynamic Drag, Jun. 25, 1965, ISBN 978-99911-944-4-8.

12
[5] Report No. X004A, “Calibration of Space Age Control 100400 Mini Air Data Boom,” Sept 21, 2001, VIGYAN, Inc., Hampton, VA, [6] Haering, Edward, Jr., “Air Data Calibration of a High-Performance Aircraft for Measuring Atmospheric Wind Profiles,” NASA Technical Memorandum 101714, Jan. 1990.

13
Table 1 Air Data Boom Reorientation Drogue Protection Options
Protection Provision Description Selection Implications
Breakaway Design
Design air data boom to break off flush with fairing OML at specified bending and/or shear load. Breakaway design loads to exceed expected flight loads.
Yes* Limits forces imposed on the drogue harness lines if there is contact during drogue deployment
No
Potential for fowling of the drogue harness lines. Potential additional rotational moments induced by the drogue harness snagging on air data booms.
Active Separation
Provide an active pyrotechnic separation system to separate air data boom prior to drogue deployment.
Yes
Complex design, initiation logic, and operations. Reduces capture of aerodynamic data during reorientation. May reduce probability of air data boom contact with drogue chutes and harness line fowling.
No*
Simpler design. Avoids unnecessary data boom separation in cases where harness lines do not contact air data booms. Maximizes capture of aerodynamic data during reorientation.
Mechanical Retention
Assure that the air data boom does not fly free of the fairing after failure or breakaway. Implemented with a steel lanyard connecting the boom to the fairing.
Yes*
Avoids data boom contact with drogue chutes. Avoids Fowling of drogue harness lines (this is deemed by the recovery team to be a minor issue - harness lines are protected with a steel braid cover)
No May avoid fowling of drogue harness lines.

14
Table 2 Design Strength and Stiffness Requirements (12-08)
Strength Requirement* Stiffness Requirement*
Angle of Attack 39 deg 20 deg
Dynamic Pressure 191 psf 238 psf
Lateral Acceleration 0.4 g 1.5 g
Max Tip Deflection N/A 2.5 deg
*Includes 1.4 factor of safety
Table 3 Structural Analysis Results
Stiffness Load Case Strength Load Case
191 psf 39 deg 238 psf 20 deg
Notch Width (in)
Tip Deflection
(in)
Peak Notch Stress
(ksi)
Tip Deflection
(in)
Peak Notch Stress
(ksi)
Score 2.09 31.21 1.41 20.24
0.06 2.16 74.40 1.46 50.39
0.5 2.25 30.25 1.53 32.94
Table 4 Specimen Notch Geometries
Description Design Width, w
(in)
Design Depth, d
(in)
Design Radius, r
(in)
Measured Width, w
(in)
Measured Depth, d
(in)
Score 0.0625 0.0625 V notch 0.022 0.07
NG Notch 0.06 0.15 0.03 0.06 0.15
0.5 in Notch 0.5 0.15 0.03 0.48 0.15

15
Table 5 Final Geometry of the Mounted ADB Systems
Feature Dimension or Coordinate
Exit hole Locations (two ADB) X = -12 in on Y axis and on -Z axis
Length of ADB system outside OML 59.15 in
Tip of Extension X = -47.25 in (20.45 in above nose tip)
Tip of Boom Location X= -71.15 (44.35 in above nose tip)
Table 6 Structural Test Results
Description e, distance of load from
notch (in)
Distance of LVDT from
center of notch (in)
Yield Load* (estimate)
(lb)
Displacement at onset of yield (in)
Ultimate Load (lb)
Displacement at Failure (in)
Score 50 36 60 1.68 Test stopped at 290 lb
N/A
NG Notch 26 36 120 1.6 165 2.96
0.5 in Notch 26 35 71 1 162 6.68
*Yield was defined as non-linear deformation

16
Table 7 Average Calibrations
(a) Average Angular Rotation: MZ
Strain (mV/5V) Alpha (deg) Beta (deg) Tip Angle (deg)0.0 0.12 0.14 0.142.5 0.62 0.64 0.655.0 1.12 1.14 1.157.5 1.62 1.64 1.6610.0 2.12 2.14 2.1612.5 2.62 2.64 2.6715.0 3.12 3.14 3.1717.5 3.62 3.64 3.6820.0 4.12 4.14 4.1922.6 4.64 4.66 4.71
* values do not include 0.1 deg base offset
(b) Average Angular Rotation: MY
Strain (mV/5V) Alpha (deg) Beta (deg) Tip Angle (deg)0.0 0.14 0.13 0.162.5 0.67 0.65 0.695.0 1.20 1.17 1.237.5 1.73 1.69 1.76
10.0 2.26 2.21 2.2912.5 2.79 2.73 2.8315.0 3.32 3.25 3.3617.5 3.85 3.77 3.8920.0 4.38 4.29 4.4222.6 4.93 4.83 4.98
* values do not include 0.1 deg base offset

17
Figure 1 Geometry of Space Age Controls, Inc. Mini Air Data Boom 100400.
+ZPanel 105
Panel 107
Panel 101
Panel 103
+Y
Air Data Boom Locations
Figure 2 MLAS Air Data Boom (ADB) and other pressure sensor locations, looking aft towards the vehicle nose.

18
Sleeve Adapter Insert Notch location and Strain Gage groove locations
(shown covered with protective aluminium tape)
Figure 3 Full ADB assembly (showing 2 ADB systems for flight and 1 backup).

19
Figure 4 Estimated Mach number uncertainty in measurement.
Figure 5 CFD analysis at M=0.5 and 0 deg AOA indicates optimal location of air data boom system relative to the MLAS coordinate system.

20
Figure 6 Planned air data boom system installation geometry showing beta vane located at MLAX X=-60 in

21
0
100
200
300
400
500
600
0 5 10 15 20 25
Time, sec
Dyn
Pre
ss,
psf
0
30
60
90
120
150
180
Lo
ad,
psf
an
d A
ng
le,
deg
Q
AoA
Boom Load
Burn-out Boost-Sep Coast-Sep Drogue-Deploy
Figure 7 Air data boom flight load based on dynamic pressure and angle of attack (design).
d= depth
w = width
r= radius
Figure 8 Notch geometry.
Figure 9 Structural Analysis Results for the Load Cases: Tip Deflection.
(see Table 3 for maximum tip displacements)

22
0.06 in notch
0.5 in notch
Score
Stiffness Load Case Strength Load Case
Figure 10 Structural Analysis Results for the Stiffness and Strength Load Cases : Notch Stress.
(see Table 2 for maximum stresses)
Figure 11 Notch geometry test specimens: score, 0.06” wide and 0.5” wide.

23
e
Fixed End
P
7.43 in
Notch
3.75 in
Figure 12 Experimental test setup geometry.
500 lb Load Cell**
LVDT*
Clamped BC
Figure 13 Experimental test setup for structural testing showing clamped boundary condition.

24
Figure 14 One-half of full bridge strain gage configuration for bending at notch location showing longitudinal grooves.
Figure 15 Load-Deflection Calibration Test Setup.

25
X=-12”
X=-47.25”
X=-71.15”
X=-12”
(a) View from Floor (b) View from vehicle nose looking aftward
Figure 16 Two ADB systems mounted on MLAS flight test vehicle.
Notch*
“Center” bolts
8”
*notch is covered by aluminum tape
Figure 17 IML view of the ADB system mounting configuration showing the blocks, bracket and mounting plate.

26
0.06 in width notch 0.5 in width notch
Clamped Boundary Condition
‘Score’ notch
Figure 18 Experimental results for test specimens.
0
50
100
150
200
250
0 2 4 6 8
Displacement (in)
Load
(lb
s)
0.060 inch Notch
0.500 inch Notch
Score Notch @26in (No Failure)
Score Notch @50in (No Failure)
Figure 19 Experimental results for test specimens.

27
0.00
1.00
2.00
3.00
4.00
5.00
6.00
0.0 5.0 10.0 15.0 20.0 25.0
Ang
le (d
eg)
Strain Voltage (mV/5V)
Averages
MZ Avg - Tip
MY Avg - Tip
MZ Avg - Alpha
MY Avg - Alpha
MZ Avg - Beta
MY Avg - Beta
Figure 20 Average load deflection calibration curve showing angular rotation vs. output voltage.
0.00
0.50
1.00
1.50
2.00
2.50
3.00
0 10 20 30 40 50 60
Tip
Def
lect
ion
(in)
Load (lb)
Tip Displacement Under LoadAir Data Boom #1: +MY
Figure 21 Typical tip displacement under load.

28
0.00
1.00
2.00
3.00
4.00
5.00
6.00
0.0 5.0 10.0 15.0 20.0 25.0
Ang
le (d
eg)
Strain Voltage (mV/5V)
Alpha Vane Rotation Under Load - Averages
MZ Avg - Alpha
MY Avg - Alpha
Figure 22 Average load deflection calibration curve showing angular rotation at the alpha vane vs. output voltage.
0.00
1.00
2.00
3.00
4.00
5.00
6.00
0.0 5.0 10.0 15.0 20.0 25.0
Ang
le (d
eg)
Strain Voltage (mv/5V)
Beta Vane Rotation Under Load - Averages
MZ Avg - Beta
MY Avg - Beta
Figure 23 Average load deflection calibration curve showing angular rotation at the beta vane vs. output voltage.

29
0.00
1.00
2.00
3.00
4.00
5.00
6.00
0.0 5.0 10.0 15.0 20.0 25.0
Ang
le (d
eg)
Strain Voltage (mV/5V)
Tip Rotation Under Load - Averages
MZ Avg - Tip
MY Avg - Tip
Figure 24 Average load deflection calibration curve showing angular rotation at the tip location vs. output voltage

30
APPENDIX A
Final Predicted Air Data Boom Loads (Reference Only)
Derived from trajectory case: MLAS-D2-6E-MaxQAlpha-95deg-Rev20090115
Table A-1 Final Strength and Stiffness Requirements
Strength Requirement* Stiffness Requirement*
Angle of Attack 38 deg 20 deg
Dynamic Pressure 182 psf 263 psf
Lateral Acceleration 1.1 g 1.75 g
Max Tip Deflection N/A 2.5 deg
*Includes 1.4 factor of safety
Burn-out Boost-Sep Coast-Sep Drogue-Deploy
0
100
200
300
400
500
600
700
0 5 10 15 20 25
Time, secf
Dyn
Pre
ss, p
sf
0
20
40
60
80
100
120
140
160
180
200
Lo
ad, p
sf a
nd
Ao
A, d
eg
Q
AoA
Boom Load
Figure A-1 Air data boom flight load based on dynamic pressure and angle of attack (Final)
31
APPENDIX B
Load-Deflection Calibration Load Cases
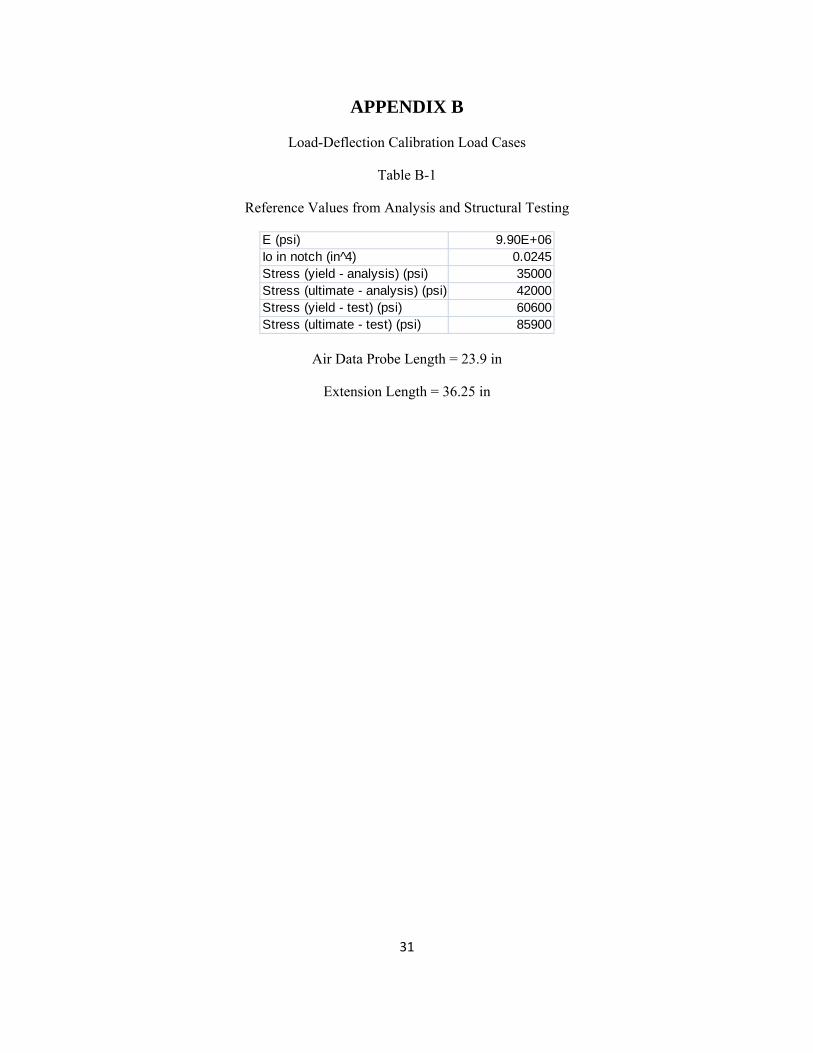
Table B-1
Reference Values from Analysis and Structural Testing
E (psi) 9.90E+06Io in notch (in 4̂) 0.0245Stress (yield - analysis) (psi) 35000Stress (ultimate - analysis) (psi) 42000Stress (yield - test) (psi) 60600Stress (ultimate - test) (psi) 85900
Air Data Probe Length = 23.9 in
Extension Length = 36.25 in
32
Table B-2
Reference and Test Load Cases
Flight 1 2 3 4 5 6 7*Boom (lb/in) 0.57 0.08 0.17 0.25 0.33 0.42 0.50 0.58
Extension (lb/in) 1.15 0.17 0.33 0.50 0.67 0.83 1.00 1.17Total Load (lb) 55.31 8.00 16.10 24.10 32.10 40.20 48.20 56.20
Loading Location (in)12 6.89 1.00 2.00 3.00 4.00 5.00 6.00 7.0018 6.89 1.00 2.00 3.00 4.00 5.00 6.00 7.0024 6.89 1.00 2.00 3.00 4.00 5.00 6.00 7.0030 6.89 1.00 2.00 3.00 4.00 5.00 6.00 7.0036 6.89 1.00 2.00 3.00 4.00 5.00 6.00 7.0042 6.89 1.00 2.00 3.00 4.00 5.00 6.00 7.0048 3.44 0.50 1.00 1.50 2.00 2.50 3.00 3.5054 3.44 0.50 1.00 1.50 2.00 2.50 3.00 3.5060 3.44 0.50 1.00 1.50 2.00 2.50 3.00 3.5066 3.44 0.50 1.00 1.50 2.00 2.50 3.00 3.50
Total Load (lb) (Actual) 55.08 7.97 16.03 24.00 31.97 40.03 48.00 55.97Total Moment at Notch (in-lb) 1259.77 182.27 366.73 549.00 731.27 915.73 1098.00 1280.27
Stress in Notch (psi) 9789.42 1416.37 2849.81 4266.19 5682.56 7116.00 8532.37 9948.75Strain in Notch (estimated) 9.89E-04 1.43E-04 2.88E-04 4.31E-04 5.74E-04 7.19E-04 8.62E-04 1.00E-03
Yield FS (analysis) 3.58 24.71 12.28 8.20 6.16 4.92 4.10 3.52Ultimate FS (analysis) 4.29 29.65 14.74 9.84 7.39 5.90 4.92 4.22
Yield FS (test) 6.19 42.79 21.26 14.20 10.66 8.52 7.10 6.09Ultimate FS (test) 8.77 60.65 30.14 20.14 15.12 12.07 10.07 8.63
*not tested
Test Load Cases
Applied Loads (lb)

33
Appendix B-3
Tables
(a) Load Calibration Results: Air Data Boom 1: +MY
MLAS AIR DATA BOOM - 1 LOAD SCHEDULE CHECK MY MZ DATE 2/12/09 LOCATION LOAD MY MZCN 5035 POS + + IN LBS m V / 5V m V / 5V
POSITION +ALPHA REDO ANGLE OF ATTACK NEG - - OUTPUT OUTPUT FROM END 42 5 2.834 -0.114+MY SCALE SCALE FROM END 42 10 5.663 -0.232
FROM EXTENSION SECTION BOOM SECTION 100 mV 100 mVEND INCHES 12 18 24 30 36 42 48 54 60 66 MY MZ DEFLECTION BASE OF END OF BETA ALPHA BOOMGROOVE INCHES 4 10 20 22 28 34 40 46 52 58 AOA SIDE SLIP TIP OF BOOM EXTENSION EXTENSION VANE VANE TIPHANGER 1 2 3 4 5 6 7 8 9 10 ALPHA BETA
LBS LBS LBS LBS LBS LBS LBS LBS LBS LBS m V / 5V m V / 5V INCHES DEG DEG DEG DEG DEGTEST Total Load (lb)
0 0 0 0 0 0 0 0 0 0 0 0 -0.004 -0.001 0.000 0.1 0.1 0.3 0.3 0.3
1 8.042 0.997 1.006 1.004 1.009 1.004 1.005 0.501 0.502 0.510 0.504 3.450 -0.144 0.416 0.1 0.2 0.9 1.0 0.9
2 16.042 1.997 2.006 2.004 2.009 2.004 2.005 1.001 1.002 1.010 1.004 7.150 -0.288 0.837 0.1 0.5 1.6 1.6 1.7
3 24.042 2.997 3.006 3.004 3.009 3.004 3.005 1.501 1.502 1.510 1.504 10.630 -0.404 1.243 0.1 0.8 2.1 2.3 2.3
4 32.042 3.997 4.006 4.004 4.009 4.004 4.005 2.001 2.002 2.010 2.004 14.446 -0.578 1.660 0.1 1.3 3.2 3.3 3.2
5 40.042 4.997 5.006 5.004 5.009 5.004 5.005 2.501 2.502 2.510 2.504 18.014 -0.690 2.054 0.1 1.4 4.0 4.1 4.2
6 48.042 5.997 6.006 6.004 6.009 6.004 6.005 3.001 3.002 3.010 3.004 21.668 -0.755 2.449 0.1 1.8 4.7 4.8 4.9
5 40.042 4.997 5.006 5.004 5.009 5.004 5.005 2.501 2.502 2.510 2.504 18.294 -0.693 2.026 0.1 1.4 4.1 4.1 4.2
4 32.042 3.997 4.006 4.004 4.009 4.004 4.005 2.001 2.002 2.010 2.004 14.848 -0.577 1.627 0.1 1.2 3.5 3.6 3.5
3 24.042 2.997 3.006 3.004 3.009 3.004 3.005 1.501 1.502 1.510 1.504 11.375 -0.450 NO DATA 0.1 0.9 2.8 2.8 2.9
2 16.042 1.997 2.006 2.004 2.009 2.004 2.005 1.001 1.002 1.010 1.004 7.848 -0.306 NO DATA 0.1 0.6 2.0 2.1 2.1
1 8.042 0.997 1.006 1.004 1.009 1.004 1.005 0.501 0.502 0.510 0.504 4.324 -0.164 NO DATA 0.1 0.5 1.3 1.3 1.2
0 0 0 0 0 0 0 0 0 0 0 0 0.762 -0.019 NO DATA 0.0 0.0 0.2 0.2 0.2

34
(b) Load Calibration Results: Air Data Boom 1: -MY
MLAS AIR DATA BOOM - 1 LOAD SCHEDULE CHECK MY MZ DATE 2/11/09 LOCATION LOAD MY MZCN 5035 POS + + IN LBS m V / 5V m V / 5V
POSITION -ALPHA ANGLE OF ATTACK NEG - - OUTPUT OUTPUT FROM END 42 5 -2.834 0.042-MY SCALE SCALE FROM END 42 10 -5.666 0.083
FROM EXTENSION SECTION BOOM SECTION 100 mV 100 mVEND INCHES 12 18 24 30 36 42 48 54 60 66 MY MZ DEFLECTION BASE OF END OF BETA ALPHA BOOMGROOVE INCHES 4 10 20 22 28 34 40 46 52 58 AOA SIDE SLIP TIP OF BOOM EXTENSION EXTENSION VANE VANE TIPHANGER 1 2 3 4 5 6 7 8 9 10 ALPHA BETA
LBS LBS LBS LBS LBS LBS LBS LBS LBS LBS m V / 5V m V / 5V INCHES DEG DEG DEG DEG DEGTEST Total Load (lb)
0 0 0 0 0 0 0 0 0 0 0 0 0.002 0.000 0.000 0.1 0.2 0.3 0.3 0.3
1 8.04 0.997 1.006 1.004 1.009 1.004 1.005 0.501 0.502 0.510 0.504 -3.446 0.048 0.418 0.1 0.3 0.9 0.9 1.0
2 16.04 1.997 2.006 2.004 2.009 2.004 2.005 1.001 1.002 1.010 1.004 -6.916 0.090 0.838 0.1 0.5 1.4 1.5 1.8
3 24.04 2.997 3.006 3.004 3.009 3.004 3.005 1.501 1.502 1.510 1.504 -10.634 0.126 1.240 0.1 1.0 2.3 2.0 2.3
4 32.04 3.997 4.006 4.004 4.009 4.004 4.005 2.001 2.002 2.010 2.004 -14.430 0.206 1.648 0.1 1.1 2.9 2.9 3.3
5 40.04 4.997 5.006 5.004 5.009 5.004 5.005 2.501 2.502 2.510 2.504 -18.066 0.223 2.155 0.1 1.4 3.7 3.7 3.9
6 48.04 5.997 6.006 6.004 6.009 6.004 6.005 3.001 3.002 3.010 3.004 -21.801 0.243 2.468 0.1 1.8 4.5 4.2 4.6
5 40.04 4.997 5.006 5.004 5.009 5.004 5.005 2.501 2.502 2.510 2.504 -18.412 0.232 2.075 0.1 1.6 3.9 3.0 3.8
4 32.04 3.997 4.006 4.004 4.009 4.004 4.005 2.001 2.002 2.010 2.004 -14.961 0.208 1.676 0.1 1.3 3.0 2.8 3.0
3 24.04 2.997 3.006 3.004 3.009 3.004 3.005 1.501 1.502 1.510 1.504 -11.486 0.168 NO DATA 0.1 1.0 2.4 2.0 2.8
2 16.04 1.997 2.006 2.004 2.009 2.004 2.005 1.001 1.002 1.010 1.004 -7.956 0.110 NO DATA 0.1 0.6 1.5 1.4 1.8
1 8.04 0.997 1.006 1.004 1.009 1.004 1.005 0.501 0.502 0.510 0.504 -4.422 0.062 NO DATA 0.1 0.4 0.8 0.8 1.2
0 0 0 0 0 0 0 0 0 0 0 0 -0.858 0.008 NO DATA 0.1 0.2 0.1 0.2 0.3
35
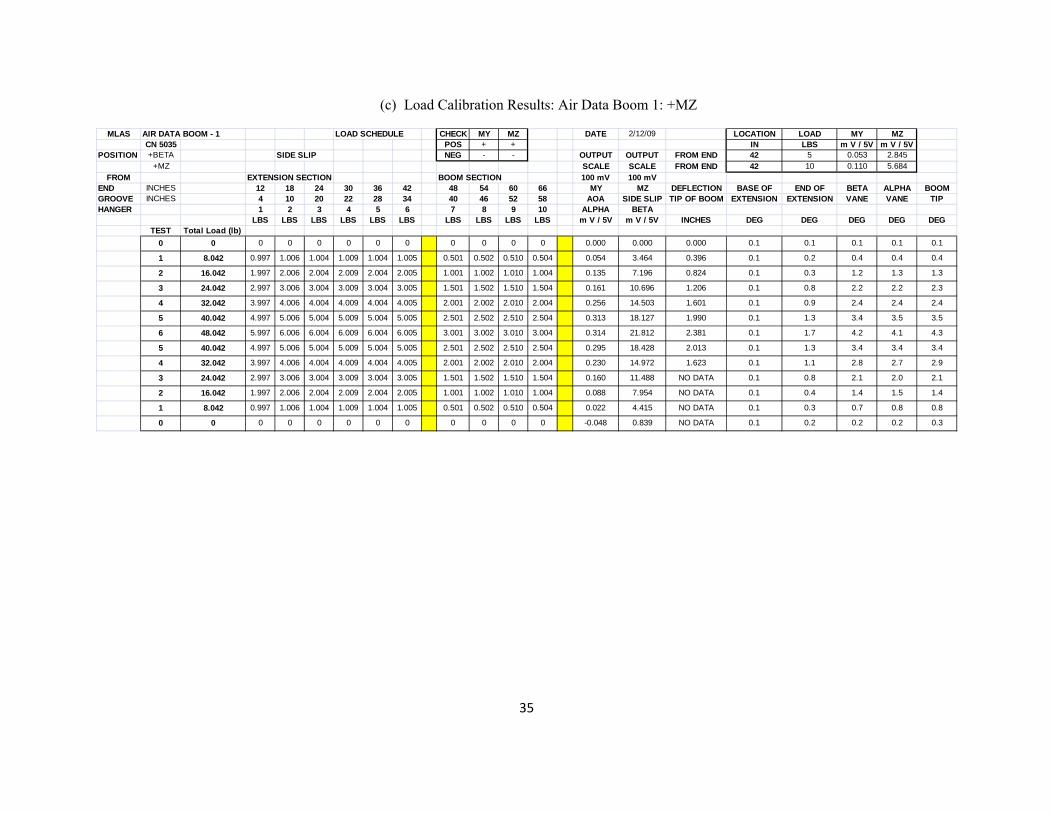
(c) Load Calibration Results: Air Data Boom 1: +MZ
MLAS AIR DATA BOOM - 1 LOAD SCHEDULE CHECK MY MZ DATE 2/12/09 LOCATION LOAD MY MZCN 5035 POS + + IN LBS m V / 5V m V / 5V
POSITION +BETA SIDE SLIP NEG - - OUTPUT OUTPUT FROM END 42 5 0.053 2.845+MZ SCALE SCALE FROM END 42 10 0.110 5.684
FROM EXTENSION SECTION BOOM SECTION 100 mV 100 mVEND INCHES 12 18 24 30 36 42 48 54 60 66 MY MZ DEFLECTION BASE OF END OF BETA ALPHA BOOMGROOVE INCHES 4 10 20 22 28 34 40 46 52 58 AOA SIDE SLIP TIP OF BOOM EXTENSION EXTENSION VANE VANE TIPHANGER 1 2 3 4 5 6 7 8 9 10 ALPHA BETA
LBS LBS LBS LBS LBS LBS LBS LBS LBS LBS m V / 5V m V / 5V INCHES DEG DEG DEG DEG DEGTEST Total Load (lb)
0 0 0 0 0 0 0 0 0 0 0 0 0.000 0.000 0.000 0.1 0.1 0.1 0.1 0.1
1 8.042 0.997 1.006 1.004 1.009 1.004 1.005 0.501 0.502 0.510 0.504 0.054 3.464 0.396 0.1 0.2 0.4 0.4 0.4
2 16.042 1.997 2.006 2.004 2.009 2.004 2.005 1.001 1.002 1.010 1.004 0.135 7.196 0.824 0.1 0.3 1.2 1.3 1.3
3 24.042 2.997 3.006 3.004 3.009 3.004 3.005 1.501 1.502 1.510 1.504 0.161 10.696 1.206 0.1 0.8 2.2 2.2 2.3
4 32.042 3.997 4.006 4.004 4.009 4.004 4.005 2.001 2.002 2.010 2.004 0.256 14.503 1.601 0.1 0.9 2.4 2.4 2.4
5 40.042 4.997 5.006 5.004 5.009 5.004 5.005 2.501 2.502 2.510 2.504 0.313 18.127 1.990 0.1 1.3 3.4 3.5 3.5
6 48.042 5.997 6.006 6.004 6.009 6.004 6.005 3.001 3.002 3.010 3.004 0.314 21.812 2.381 0.1 1.7 4.2 4.1 4.3
5 40.042 4.997 5.006 5.004 5.009 5.004 5.005 2.501 2.502 2.510 2.504 0.295 18.428 2.013 0.1 1.3 3.4 3.4 3.4
4 32.042 3.997 4.006 4.004 4.009 4.004 4.005 2.001 2.002 2.010 2.004 0.230 14.972 1.623 0.1 1.1 2.8 2.7 2.9
3 24.042 2.997 3.006 3.004 3.009 3.004 3.005 1.501 1.502 1.510 1.504 0.160 11.488 NO DATA 0.1 0.8 2.1 2.0 2.1
2 16.042 1.997 2.006 2.004 2.009 2.004 2.005 1.001 1.002 1.010 1.004 0.088 7.954 NO DATA 0.1 0.4 1.4 1.5 1.4
1 8.042 0.997 1.006 1.004 1.009 1.004 1.005 0.501 0.502 0.510 0.504 0.022 4.415 NO DATA 0.1 0.3 0.7 0.8 0.8
0 0 0 0 0 0 0 0 0 0 0 0 -0.048 0.839 NO DATA 0.1 0.2 0.2 0.2 0.3

36
(d) Load Calibration Results: Air Data Boom 1: -MZ
MLAS AIR DATA BOOM - 1 LOAD SCHEDULE CHECK MY MZ DATE 2/12/09 LOCATION LOAD MY MZCN 5035 POS + + IN LBS m V / 5V m V / 5V
POSITION -BETA SIDE SLIP NEG - - OUTPUT OUTPUT FROM END 42 5 -0.095 -2.844-MZ SCALE SCALE FROM END 42 10 -0.197 -5.682
FROM EXTENSION SECTION BOOM SECTION 100 mV 100 mVEND INCHES 12 18 24 30 36 42 48 54 60 66 MY MZ DEFLECTION BASE OF END OF BETA ALPHA BOOMGROOVE INCHES 4 10 20 22 28 34 40 46 52 58 AOA SIDE SLIP TIP OF BOOM EXTENSION EXTENSION VANE VANE TIPHANGER 1 2 3 4 5 6 7 8 9 10 ALPHA BETA
LBS LBS LBS LBS LBS LBS LBS LBS LBS LBS m V / 5V m V / 5V INCHES DEG DEG DEG DEG DEGTEST Total Load (lb)
0 0 0 0 0 0 0 0 0 0 0 0 0.000 -0.001 0.000 0.1 0.2 0.2 0.2 0.2
1 8.04 0.997 1.006 1.004 1.009 1.004 1.005 0.501 0.502 0.510 0.504 -0.102 -3.439 0.406 0.1 0.2 0.5 0.5 0.4
2 16.04 1.997 2.006 2.004 2.009 2.004 2.005 1.001 1.002 1.010 1.004 -0.255 -7.107 0.820 0.1 0.3 1.5 1.5 1.6
3 24.04 2.997 3.006 3.004 3.009 3.004 3.005 1.501 1.502 1.510 1.504 -0.344 -10.533 1.210 0.1 0.4 2.3 2.2 2.3
4 32.04 3.997 4.006 4.004 4.009 4.004 4.005 2.001 2.002 2.010 2.004 -0.534 -14.352 1.606 0.1 0.8 3.0 3.4 3.2
5 40.04 4.997 5.006 5.004 5.009 5.004 5.005 2.501 2.502 2.510 2.504 -0.616 -17.803 1.980 0.1 1.2 3.4 3.5 3.6
6 48.04 5.997 6.006 6.004 6.009 6.004 6.005 3.001 3.002 3.010 3.004 -0.709 -21.467 2.365 0.1 1.8 4.4 4.3 4.4
5 40.04 4.997 5.006 5.004 5.009 5.004 5.005 2.501 2.502 2.510 2.504 -0.650 -18.082 2.003 0.1 1.2 3.4 3.4 3.3
4 32.04 3.997 4.006 4.004 4.009 4.004 4.005 2.001 2.002 2.010 2.004 -0.571 -14.624 1.615 0.1 0.8 2.8 2.8 2.8
3 24.04 2.997 3.006 3.004 3.009 3.004 3.005 1.501 1.502 1.510 1.504 -0.465 -11.133 NO DATA 0.1 0.7 2.4 2.3 2.4
2 16.04 1.997 2.006 2.004 2.009 2.004 2.005 1.001 1.002 1.010 1.004 -0.343 -7.605 NO DATA 0.1 0.6 1.5 1.5 1.7
1 8.04 0.997 1.006 1.004 1.009 1.004 1.005 0.501 0.502 0.510 0.504 -0.227 -4.057 NO DATA 0.1 0.2 0.8 0.8 0.9
0 0 0 0 0 0 0 0 0 0 0 0 -0.107 -0.485 NO DATA 0.1 0.2 0.3 0.3 0.3

37
(e) Load Calibration Results: Air Data Boom 2: +MY
MLAS AIR DATA BOOM - 2 LOAD SCHEDULE CHECK MY MZ DATE 2/13/09 LOCATION LOAD MY MZCN 5035 POS + + IN LBS m V / 5V m V / 5V
POSITION +ALPHA REDO ANGLE OF ATTACK NEG - - OUTPUT OUTPUT FROM END 42 5 2.748 -0.072+MY SCALE SCALE FROM END 42 10 5.492 -0.142
FROM EXTENSION SECTION BOOM SECTION 100 mV 100 mVEND INCHES 12 18 24 30 36 42 48 54 60 66 MY MZ DEFLECTION BASE OF END OF BETA ALPHA BOOMGROOVE INCHES 4 10 20 22 28 34 40 46 52 58 AOA SIDE SLIP TIP OF BOOM EXTENSION EXTENSION VANE VANE TIPHANGER 1 2 3 4 5 6 7 8 9 10 ALPHA BETA
LBS LBS LBS LBS LBS LBS LBS LBS LBS LBS m V / 5V m V / 5V INCHES DEG DEG DEG DEG DEGTEST Total Load (lb)
0 0 0 0 0 0 0 0 0 0 0 0 0.001 0.000 0.000 0.1 0.2 0.2 0.2 0.2
1 8.04 0.997 1.006 1.004 1.009 1.004 1.005 0.501 0.502 0.510 0.504 3.347 -0.090 0.407 0.1 0.3 0.6 0.6 0.5
2 16.04 1.997 2.006 2.004 2.009 2.004 2.005 1.001 1.002 1.010 1.004 6.928 -0.181 0.820 0.1 0.5 1.3 1.3 1.4
3 24.04 2.997 3.006 3.004 3.009 3.004 3.005 1.501 1.502 1.510 1.504 10.330 -0.274 1.221 0.1 0.8 2.1 2.2 2.1
4 32.04 3.997 4.006 4.004 4.009 4.004 4.005 2.001 2.002 2.010 2.004 13.990 -0.372 1.636 0.1 1.2 2.8 2.8 2.8
5 40.04 4.997 5.006 5.004 5.009 5.004 5.005 2.501 2.502 2.510 2.504 17.492 -0.472 2.024 0.1 1.3 3.5 3.6 3.6
6 48.04 5.997 6.006 6.004 6.009 6.004 6.005 3.001 3.002 3.010 3.004 21.066 -0.546 2.446 0.1 1.8 4.3 4.2 4.3
5 40.04 4.997 5.006 5.004 5.009 5.004 5.005 2.501 2.502 2.510 2.504 17.758 -0.480 2.052 0.1 1.4 3.5 3.4 3.5
4 32.04 3.997 4.006 4.004 4.009 4.004 4.005 2.001 2.002 2.010 2.004 14.412 -0.407 1.654 0.1 1.0 2.9 2.9 2.8
3 24.04 2.997 3.006 3.004 3.009 3.004 3.005 1.501 1.502 1.510 1.504 11.038 -0.324 NO DATA 0.1 0.8 2.4 2.3 2.3
2 16.04 1.997 2.006 2.004 2.009 2.004 2.005 1.001 1.002 1.010 1.004 7.612 -0.236 NO DATA 0.1 0.4 1.6 1.6 1.7
1 8.04 0.997 1.006 1.004 1.009 1.004 1.005 0.501 0.502 0.510 0.504 4.179 -0.151 NO DATA 0.1 0.3 1.0 1.0 0.9
0 0 0 0 0 0 0 0 0 0 0 0 0.718 -0.065 NO DATA 0.1 0.1 0.2 0.2 0.2

38
(f) Load Calibration Results: Air Data Boom 2: -MY
MLAS AIR DATA BOOM - 2 LOAD SCHEDULE CHECK MY MZ DATE 2/13/09 LOCATION LOAD MY MZCN 5035 POS + + IN LBS m V / 5V m V / 5V
POSITION -ALPHA ANGLE OF ATTACK NEG - - OUTPUT OUTPUT FROM END 42 5 -2.755 0.052-MY SCALE SCALE FROM END 42 10 -5.503 0.103
FROM EXTENSION SECTION BOOM SECTION 100 mV 100 mVEND INCHES 12 18 24 30 36 42 48 54 60 66 MY MZ DEFLECTION BASE OF END OF BETA ALPHA BOOMGROOVE INCHES 4 10 20 22 28 34 40 46 52 58 AOA SIDE SLIP TIP OF BOOM EXTENSION EXTENSION VANE VANE TIPHANGER 1 2 3 4 5 6 7 8 9 10 ALPHA BETA
LBS LBS LBS LBS LBS LBS LBS LBS LBS LBS m V / 5V m V / 5V INCHES DEG DEG DEG DEG DEGTEST Total Load (lb)
0 0 0 0 0 0 0 0 0 0 0 0 0.002 0.001 0.000 0.1 0.2 0.3 0.3 0.3
1 8.04 0.997 1.006 1.004 1.009 1.004 1.005 0.501 0.502 0.510 0.504 -3.332 0.066 0.403 0.1 0.3 1.0 1.1 1.1
2 16.04 1.997 2.006 2.004 2.009 2.004 2.005 1.001 1.002 1.010 1.004 -6.866 0.116 0.810 0.1 0.6 1.5 1.6 1.6
3 24.04 2.997 3.006 3.004 3.009 3.004 3.005 1.501 1.502 1.510 1.504 -10.213 0.148 1.208 0.1 0.9 2.4 2.4 2.5
4 32.04 3.997 4.006 4.004 4.009 4.004 4.005 2.001 2.002 2.010 2.004 -13.846 0.216 1.607 0.1 1.2 3.0 3.1 3.1
5 40.04 4.997 5.006 5.004 5.009 5.004 5.005 2.501 2.502 2.510 2.504 -17.306 0.231 1.996 0.1 1.6 4.1 4.0 4.1
6 48.04 5.997 6.006 6.004 6.009 6.004 6.005 3.001 3.002 3.010 3.004 -20.962 0.269 2.412 0.1 1.9 4.8 4.9 4.9
5 40.04 4.997 5.006 5.004 5.009 5.004 5.005 2.501 2.502 2.510 2.504 -17.636 0.229 2.025 0.1 1.5 3.9 3.8 4.0
4 32.04 3.997 4.006 4.004 4.009 4.004 4.005 2.001 2.002 2.010 2.004 -14.273 0.172 1.630 0.1 1.2 3.0 2.9 3.0
3 24.04 2.997 3.006 3.004 3.009 3.004 3.005 1.501 1.502 1.510 1.504 -10.884 0.108 NO DATA 0.1 0.9 2.4 2.4 2.5
2 16.04 1.997 2.006 2.004 2.009 2.004 2.005 1.001 1.002 1.010 1.004 -7.443 0.043 NO DATA 0.1 0.7 1.7 1.7 1.8
1 8.04 0.997 1.006 1.004 1.009 1.004 1.005 0.501 0.502 0.510 0.504 -3.998 -0.021 NO DATA 0.1 0.4 0.9 0.9 1.0
0 0 0 0 0 0 0 0 0 0 0 0 -0.521 -0.085 NO DATA 0.1 0.2 0.3 0.3 0.3

39
(g) Load Calibration Results: Air Data Boom 2: +MZ
MLAS AIR DATA BOOM - 2 LOAD SCHEDULE CHECK MY MZ DATE 2/13/09 LOCATION LOAD MY MZCN 5035 POS + + IN LBS m V / 5V m V / 5V
POSITION +BETA SIDE SLIP NEG - - OUTPUT OUTPUT FROM END 42 5 -0.022 2.741+MZ SCALE SCALE FROM END 42 10 -0.043 5.482
FROM EXTENSION SECTION BOOM SECTION 100 mV 100 mVEND INCHES 12 18 24 30 36 42 48 54 60 66 MY MZ DEFLECTION BASE OF END OF BETA ALPHA BOOMGROOVE INCHES 4 10 20 22 28 34 40 46 52 58 AOA SIDE SLIP TIP OF BOOM EXTENSION EXTENSION VANE VANE TIPHANGER 1 2 3 4 5 6 7 8 9 10 ALPHA BETA
LBS LBS LBS LBS LBS LBS LBS LBS LBS LBS m V / 5V m V / 5V INCHES DEG DEG DEG DEG DEGTEST Total Load (lb)
0 0 0 0 0 0 0 0 0 0 0 0 0.001 0.001 0.000 0.1 0.1 0.2 0.2 0.2
1 8.04 0.997 1.006 1.004 1.009 1.004 1.005 0.501 0.502 0.510 0.504 -0.024 3.342 0.406 0.1 0.4 0.7 0.7 0.8
2 16.04 1.997 2.006 2.004 2.009 2.004 2.005 1.001 1.002 1.010 1.004 -0.047 6.705 0.818 0.1 0.6 1.4 1.4 1.3
3 24.04 2.997 3.006 3.004 3.009 3.004 3.005 1.501 1.502 1.510 1.504 -0.105 10.317 1.221 0.1 0.9 2.3 2.3 2.2
4 32.04 3.997 4.006 4.004 4.009 4.004 4.005 2.001 2.002 2.010 2.004 -0.107 13.778 1.641 0.1 1.2 2.9 2.9 3.0
5 40.04 4.997 5.006 5.004 5.009 5.004 5.005 2.501 2.502 2.510 2.504 -0.114 17.455 2.044 0.1 1.4 3.4 3.4 3.4
6 48.04 5.997 6.006 6.004 6.009 6.004 6.005 3.001 3.002 3.010 3.004 -0.135 21.016 2.453 0.1 1.7 4.3 4.3 4.4
5 40.04 4.997 5.006 5.004 5.009 5.004 5.005 2.501 2.502 2.510 2.504 -0.111 17.736 2.069 0.1 1.2 3.5 3.5 3.6
4 32.04 3.997 4.006 4.004 4.009 4.004 4.005 2.001 2.002 2.010 2.004 -0.091 14.401 1.667 0.1 0.9 2.9 2.9 2.8
3 24.04 2.997 3.006 3.004 3.009 3.004 3.005 1.501 1.502 1.510 1.504 -0.069 11.036 NO DATA 0.1 0.6 2.3 2.3 2.4
2 16.04 1.997 2.006 2.004 2.009 2.004 2.005 1.001 1.002 1.010 1.004 -0.047 7.620 NO DATA 0.1 0.5 1.5 1.5 1.5
1 8.04 0.997 1.006 1.004 1.009 1.004 1.005 0.501 0.502 0.510 0.504 -0.020 4.196 NO DATA 0.1 0.4 0.6 0.6 0.7
0 0 0 0 0 0 0 0 0 0 0 0 0.003 0.744 NO DATA 0.1 0.2 0.2 0.2 0.2
40
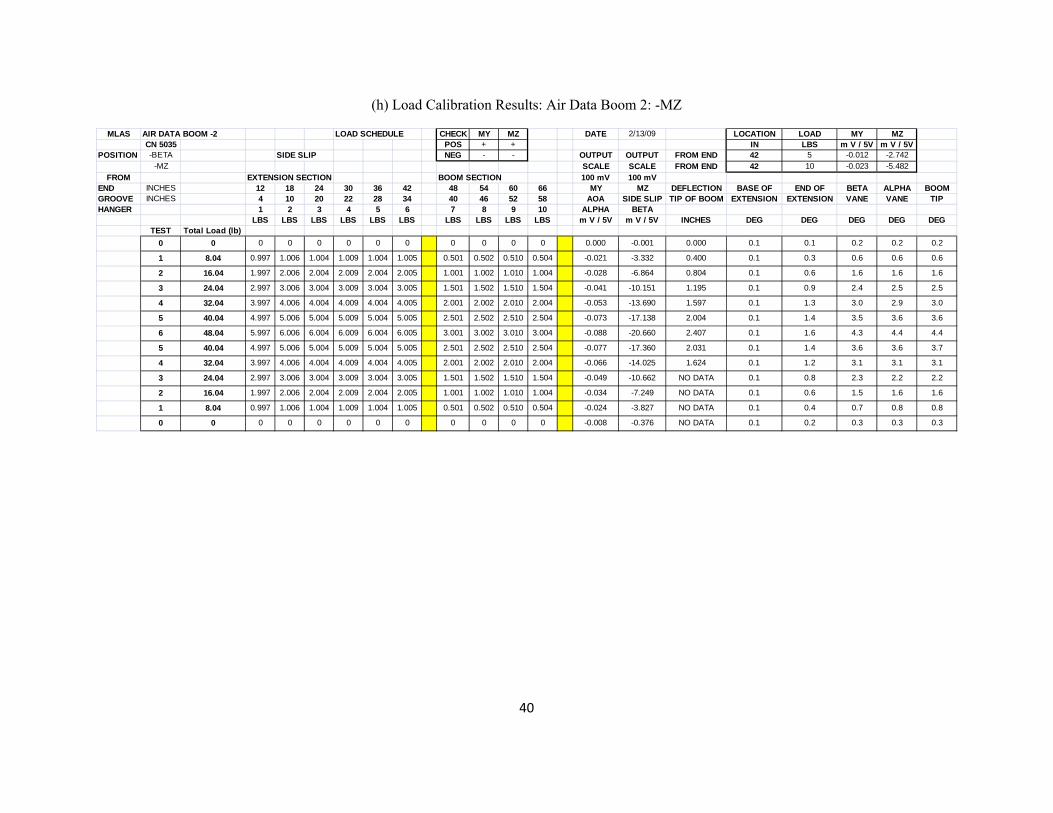
(h) Load Calibration Results: Air Data Boom 2: -MZ
MLAS AIR DATA BOOM -2 LOAD SCHEDULE CHECK MY MZ DATE 2/13/09 LOCATION LOAD MY MZCN 5035 POS + + IN LBS m V / 5V m V / 5V
POSITION -BETA SIDE SLIP NEG - - OUTPUT OUTPUT FROM END 42 5 -0.012 -2.742-MZ SCALE SCALE FROM END 42 10 -0.023 -5.482
FROM EXTENSION SECTION BOOM SECTION 100 mV 100 mVEND INCHES 12 18 24 30 36 42 48 54 60 66 MY MZ DEFLECTION BASE OF END OF BETA ALPHA BOOMGROOVE INCHES 4 10 20 22 28 34 40 46 52 58 AOA SIDE SLIP TIP OF BOOM EXTENSION EXTENSION VANE VANE TIPHANGER 1 2 3 4 5 6 7 8 9 10 ALPHA BETA
LBS LBS LBS LBS LBS LBS LBS LBS LBS LBS m V / 5V m V / 5V INCHES DEG DEG DEG DEG DEGTEST Total Load (lb)
0 0 0 0 0 0 0 0 0 0 0 0 0.000 -0.001 0.000 0.1 0.1 0.2 0.2 0.2
1 8.04 0.997 1.006 1.004 1.009 1.004 1.005 0.501 0.502 0.510 0.504 -0.021 -3.332 0.400 0.1 0.3 0.6 0.6 0.6
2 16.04 1.997 2.006 2.004 2.009 2.004 2.005 1.001 1.002 1.010 1.004 -0.028 -6.864 0.804 0.1 0.6 1.6 1.6 1.6
3 24.04 2.997 3.006 3.004 3.009 3.004 3.005 1.501 1.502 1.510 1.504 -0.041 -10.151 1.195 0.1 0.9 2.4 2.5 2.5
4 32.04 3.997 4.006 4.004 4.009 4.004 4.005 2.001 2.002 2.010 2.004 -0.053 -13.690 1.597 0.1 1.3 3.0 2.9 3.0
5 40.04 4.997 5.006 5.004 5.009 5.004 5.005 2.501 2.502 2.510 2.504 -0.073 -17.138 2.004 0.1 1.4 3.5 3.6 3.6
6 48.04 5.997 6.006 6.004 6.009 6.004 6.005 3.001 3.002 3.010 3.004 -0.088 -20.660 2.407 0.1 1.6 4.3 4.4 4.4
5 40.04 4.997 5.006 5.004 5.009 5.004 5.005 2.501 2.502 2.510 2.504 -0.077 -17.360 2.031 0.1 1.4 3.6 3.6 3.7
4 32.04 3.997 4.006 4.004 4.009 4.004 4.005 2.001 2.002 2.010 2.004 -0.066 -14.025 1.624 0.1 1.2 3.1 3.1 3.1
3 24.04 2.997 3.006 3.004 3.009 3.004 3.005 1.501 1.502 1.510 1.504 -0.049 -10.662 NO DATA 0.1 0.8 2.3 2.2 2.2
2 16.04 1.997 2.006 2.004 2.009 2.004 2.005 1.001 1.002 1.010 1.004 -0.034 -7.249 NO DATA 0.1 0.6 1.5 1.6 1.6
1 8.04 0.997 1.006 1.004 1.009 1.004 1.005 0.501 0.502 0.510 0.504 -0.024 -3.827 NO DATA 0.1 0.4 0.7 0.8 0.8
0 0 0 0 0 0 0 0 0 0 0 0 -0.008 -0.376 NO DATA 0.1 0.2 0.3 0.3 0.3

41
(i) Load Calibration Results: Air Data Boom 3: +MY
MLAS AIR DATA BOOM - 3 LOAD SCHEDULE CHECK MY MZ DATE 2/18/09 LOCATION LOAD MY MZCN 5035 POS + + IN LBS m V / 5V m V / 5V
POSITION +ALPHA ANGLE OF ATTACK NEG - - OUTPUT OUTPUT FROM END 42 5 2.615 0.005+MY SCALE SCALE FROM END 42 10 5.234 0.012
FROM EXTENSION SECTION BOOM SECTION 100 mV 100 mVEND INCHES 12 18 24 30 36 42 48 54 60 66 MY MZ DEFLECTION BASE OF END OF BETA ALPHA BOOMGROOVE INCHES 4 10 20 22 28 34 40 46 52 58 AOA SIDE SLIP TIP OF BOOM EXTENSION EXTENSION VANE VANE TIPHANGER 1 2 3 4 5 6 7 8 9 10 ALPHA BETA
LBS LBS LBS LBS LBS LBS LBS LBS LBS LBS m V / 5V m V / 5V INCHES DEG DEG DEG DEG DEGTEST Total Load (lb)
0 0 0 0 0 0 0 0 0 0 0 0 -0.001 0.000 0.000 0.1 0.1 0.2 0.2 0.2
1 8.04 0.997 1.006 1.004 1.009 1.004 1.005 0.501 0.502 0.510 0.504 3.168 0.003 0.405 0.1 0.2 0.9 0.9 1.0
2 16.04 1.997 2.006 2.004 2.009 2.004 2.005 1.001 1.002 1.010 1.004 6.536 0.009 0.809 0.1 0.4 1.6 1.6 1.7
3 24.04 2.997 3.006 3.004 3.009 3.004 3.005 1.501 1.502 1.510 1.504 9.764 0.016 1.205 0.1 0.9 2.4 2.4 2.5
4 32.04 3.997 4.006 4.004 4.009 4.004 4.005 2.001 2.002 2.010 2.004 13.266 0.023 1.609 0.1 1.1 3.0 3.1 3.1
5 40.04 4.997 5.006 5.004 5.009 5.004 5.005 2.501 2.502 2.510 2.504 16.614 0.047 1.996 0.1 1.3 3.7 3.8 3.8
6 48.04 5.997 6.006 6.004 6.009 6.004 6.005 3.001 3.002 3.010 3.004 20.095 0.041 2.405 0.1 1.5 4.6 4.7 4.7
5 40.04 4.997 5.006 5.004 5.009 5.004 5.005 2.501 2.502 2.510 2.504 16.993 0.025 2.028 0.1 1.2 3.9 3.9 4.0
4 32.04 3.997 4.006 4.004 4.009 4.004 4.005 2.001 2.002 2.010 2.004 13.816 0.017 1.648 0.1 1.1 3.2 3.2 3.3
3 24.04 2.997 3.006 3.004 3.009 3.004 3.005 1.501 1.502 1.510 1.504 10.612 0.012 NO DATA 0.1 0.8 2.5 2.6 2.6
2 16.04 1.997 2.006 2.004 2.009 2.004 2.005 1.001 1.002 1.010 1.004 7.354 0.007 NO DATA 0.1 0.7 1.6 1.6 1.6
1 8.04 0.997 1.006 1.004 1.009 1.004 1.005 0.501 0.502 0.510 0.504 4.090 0.001 NO DATA 0.1 0.2 1.1 1.1 1.2
0 0 0 0 0 0 0 0 0 0 0 0 0.809 -0.006 NO DATA 0.1 0.2 0.2 0.2 0.2

42
(j) Load Calibration Results: Air Data Boom 3: -MY
MLAS AIR DATA BOOM - 3 LOAD SCHEDULE CHECK MY MZ DATE 2/18/09 LOCATION LOAD MY MZCN 5035 POS + + IN LBS m V / 5V m V / 5V
POSITION -ALPHA ANGLE OF ATTACK NEG - - OUTPUT OUTPUT FROM END 42 5 -2.619 -0.026-MY SCALE SCALE FROM END 42 10 -5.242 -0.050
FROM EXTENSION SECTION BOOM SECTION 100 mV 100 mVEND INCHES 12 18 24 30 36 42 48 54 60 66 MY MZ DEFLECTION BASE OF END OF BETA ALPHA BOOMGROOVE INCHES 4 10 20 22 28 34 40 46 52 58 AOA SIDE SLIP TIP OF BOOM EXTENSION EXTENSION VANE VANE TIPHANGER 1 2 3 4 5 6 7 8 9 10 ALPHA BETA
LBS LBS LBS LBS LBS LBS LBS LBS LBS LBS m V / 5V m V / 5V INCHES DEG DEG DEG DEG DEGTEST Total Load (lb)
0 0 0 0 0 0 0 0 0 0 0 0 0.002 0.000 0.000 0.1 0.2 0.2 0.2 0.2
1 8.04 0.997 1.006 1.004 1.009 1.004 1.005 0.501 0.502 0.510 0.504 -3.152 0.011 0.409 0.1 0.2 0.5 0.5 0.6
2 16.04 1.997 2.006 2.004 2.009 2.004 2.005 1.001 1.002 1.010 1.004 -6.158 0.016 0.815 0.1 0.3 1.2 1.2 1.3
3 24.04 2.997 3.006 3.004 3.009 3.004 3.005 1.501 1.502 1.510 1.504 -9.680 0.008 1.198 0.1 0.4 2.1 2.2 2.2
4 32.04 3.997 4.006 4.004 4.009 4.004 4.005 2.001 2.002 2.010 2.004 -13.180 0.030 1.610 0.1 0.7 2.9 2.9 2.9
5 40.04 4.997 5.006 5.004 5.009 5.004 5.005 2.501 2.502 2.510 2.504 -16.495 0.021 2.005 0.1 1.0 3.8 3.8 3.9
6 48.04 5.997 6.006 6.004 6.009 6.004 6.005 3.001 3.002 3.010 3.004 -19.884 -0.003 2.393 0.1 1.4 4.5 4.4 4.5
5 40.04 4.997 5.006 5.004 5.009 5.004 5.005 2.501 2.502 2.510 2.504 -16.779 0.024 2.023 0.1 1.2 3.8 3.8 3.8
4 32.04 3.997 4.006 4.004 4.009 4.004 4.005 2.001 2.002 2.010 2.004 -13.608 0.027 1.636 0.1 0.8 3.2 3.4 3.3
3 24.04 2.997 3.006 3.004 3.009 3.004 3.005 1.501 1.502 1.510 1.504 -10.406 0.024 NO DATA 0.1 0.7 2.3 2.4 2.5
2 16.04 1.997 2.006 2.004 2.009 2.004 2.005 1.001 1.002 1.010 1.004 -7.153 0.017 NO DATA 0.1 0.4 1.4 1.4 1.5
1 8.04 0.997 1.006 1.004 1.009 1.004 1.005 0.501 0.502 0.510 0.504 -3.901 0.008 NO DATA 0.1 0.3 0.9 0.8 0.9
0 0 0 0 0 0 0 0 0 0 0 0 -0.616 0.001 NO DATA 0.1 0.2 0.3 0.3 0.3

43
(k) Load Calibration Results: Air Data Boom 3: +MZ
MLAS AIR DATA BOOM - 3 LOAD SCHEDULE CHECK MY MZ DATE 2/18/09 LOCATION LOAD MY MZCN 5035 POS + + IN LBS m V / 5V m V / 5V
POSITION +BETA SIDE SLIP NEG - - OUTPUT OUTPUT FROM END 42 5 -0.049 2.614+MZ SCALE SCALE FROM END 42 10 -0.099 5.225
FROM EXTENSION SECTION BOOM SECTION 100 mV 100 mVEND INCHES 12 18 24 30 36 42 48 54 60 66 MY MZ DEFLECTION BASE OF END OF BETA ALPHA BOOMGROOVE INCHES 4 10 20 22 28 34 40 46 52 58 AOA SIDE SLIP TIP OF BOOM EXTENSION EXTENSION VANE VANE TIPHANGER 1 2 3 4 5 6 7 8 9 10 ALPHA BETA
LBS LBS LBS LBS LBS LBS LBS LBS LBS LBS m V / 5V m V / 5V INCHES DEG DEG DEG DEG DEGTEST Total Load (lb)
0 0 0 0 0 0 0 0 0 0 0 0 -0.001 0.000 0.000 0.1 0.1 0.1 0.1 0.1
1 8.04 0.997 1.006 1.004 1.009 1.004 1.005 0.501 0.502 0.510 0.504 -0.063 3.168 0.404 0.1 0.2 0.9 0.9 0.9
2 16.04 1.997 2.006 2.004 2.009 2.004 2.005 1.001 1.002 1.010 1.004 -0.126 6.536 0.806 0.1 0.4 1.4 1.4 1.5
3 24.04 2.997 3.006 3.004 3.009 3.004 3.005 1.501 1.502 1.510 1.504 -0.189 9.720 1.190 0.1 0.7 2.3 2.4 2.4
4 32.04 3.997 4.006 4.004 4.009 4.004 4.005 2.001 2.002 2.010 2.004 -0.253 13.184 1.585 0.1 1.1 3.0 3.0 3.1
5 40.04 4.997 5.006 5.004 5.009 5.004 5.005 2.501 2.502 2.510 2.504 -0.319 16.474 1.956 0.1 1.4 3.5 3.5 3.6
6 48.04 5.997 6.006 6.004 6.009 6.004 6.005 3.001 3.002 3.010 3.004 -0.403 19.885 2.346 0.1 1.6 4.3 4.3 4.4
5 40.04 4.997 5.006 5.004 5.009 5.004 5.005 2.501 2.502 2.510 2.504 -0.334 16.760 1.976 0.1 1.1 3.6 3.7 3.7
4 32.04 3.997 4.006 4.004 4.009 4.004 4.005 2.001 2.002 2.010 2.004 -0.271 13.580 1.591 0.1 0.9 2.9 2.9 2.9
3 24.04 2.997 3.006 3.004 3.009 3.004 3.005 1.501 1.502 1.510 1.504 -0.207 10.363 NO DATA 0.1 0.8 2.2 2.2 2.1
2 16.04 1.997 2.006 2.004 2.009 2.004 2.005 1.001 1.002 1.010 1.004 -0.150 7.105 NO DATA 0.1 0.6 1.5 1.5 1.4
1 8.04 0.997 1.006 1.004 1.009 1.004 1.005 0.501 0.502 0.510 0.504 -0.083 3.850 NO DATA 0.1 0.3 1.1 1.1 1.2
0 0 0 0 0 0 0 0 0 0 0 0 -0.024 0.564 NO DATA 0.1 0.1 0.2 0.2 0.2

44
(l) Load Calibration Results: Air Data Boom 3: -MZ
MLAS AIR DATA BOOM -3 LOAD SCHEDULE CHECK MY MZ DATE 2/19/09 LOCATION LOAD MY MZCN 5035 POS + + IN LBS m V / 5V m V / 5V
POSITION -BETA SIDE SLIP NEG - - OUTPUT OUTPUT FROM END 42 5 0.050 -2.606-MZ SCALE SCALE FROM END 42 10 0.102 -5.218
FROM EXTENSION SECTION BOOM SECTION 100 mV 100 mVEND INCHES 12 18 24 30 36 42 48 54 60 66 MY MZ DEFLECTION BASE OF END OF BETA ALPHA BOOMGROOVE INCHES 4 10 20 22 28 34 40 46 52 58 AOA SIDE SLIP TIP OF BOOM EXTENSION EXTENSION VANE VANE TIPHANGER 1 2 3 4 5 6 7 8 9 10 ALPHA BETA
LBS LBS LBS LBS LBS LBS LBS LBS LBS LBS m V / 5V m V / 5V INCHES DEG DEG DEG DEG DEGTEST Total Load (lb)
0 0 0 0 0 0 0 0 0 0 0 0 -0.001 0.002 0.000 0.1 0.2 0.3 0.3 0.3
1 8.04 0.997 1.006 1.004 1.009 1.004 1.005 0.501 0.502 0.510 0.504 0.060 -3.163 0.386 0.1 0.4 1.0 1.1 1.1
2 16.04 1.997 2.006 2.004 2.009 2.004 2.005 1.001 1.002 1.010 1.004 0.126 -6.534 0.783 0.1 0.7 1.9 1.9 1.8
3 24.04 2.997 3.006 3.004 3.009 3.004 3.005 1.501 1.502 1.510 1.504 0.202 -9.718 1.163 0.1 1.0 2.5 2.6 2.6
4 32.04 3.997 4.006 4.004 4.009 4.004 4.005 2.001 2.002 2.010 2.004 0.254 -13.172 1.555 0.1 1.2 3.1 3.2 3.1
5 40.04 4.997 5.006 5.004 5.009 5.004 5.005 2.501 2.502 2.510 2.504 0.310 -16.497 1.950 0.1 1.5 3.9 3.9 3.9
6 48.04 5.997 6.006 6.004 6.009 6.004 6.005 3.001 3.002 3.010 3.004 0.375 -19.892 2.345 0.1 1.8 4.3 4.3 4.4
5 40.04 4.997 5.006 5.004 5.009 5.004 5.005 2.501 2.502 2.510 2.504 0.309 -16.758 1.967 0.1 1.6 3.8 3.9 3.9
4 32.04 3.997 4.006 4.004 4.009 4.004 4.005 2.001 2.002 2.010 2.004 0.248 -13.582 1.581 0.1 1.1 3.2 3.2 3.2
3 24.04 2.997 3.006 3.004 3.009 3.004 3.005 1.501 1.502 1.510 1.504 0.184 -10.383 NO DATA 0.1 0.9 2.7 2.7 2.8
2 16.04 1.997 2.006 2.004 2.009 2.004 2.005 1.001 1.002 1.010 1.004 0.123 -7.136 NO DATA 0.1 0.7 2.0 2.0 2.0
1 8.04 0.997 1.006 1.004 1.009 1.004 1.005 0.501 0.502 0.510 0.504 0.063 -3.881 NO DATA 0.1 0.4 1.3 1.4 1.4
0 0 0 0 0 0 0 0 0 0 0 0 -0.001 -0.594 NO DATA 0.1 0.1 0.2 0.2 0.2

45
FIGURES
0.0
0.5
1.0
1.5
2.0
2.5
3.0
3.5
4.0
4.5
5.0
5.5
0 10 20 30 40 50
An
gle
, de
g
Total Load (lb)
Angular RotationAir Data Boom 1: +MY
Beta
Alpha
Tip
Extension
Figure B-1 Angular Rotation of Air Data Boom 1: +MY.
0.0
0.5
1.0
1.5
2.0
2.5
3.0
3.5
4.0
4.5
5.0
0 10 20 30 40 50
An
gle
, de
g
Load, lb
Angular RotationAir Data Boom 1: -MY
Beta
Alpha
Tip
Extension
Figure B-2 Angular Rotation of Air Data Boom 1: -MY.
0.0
0.5
1.0
1.5
2.0
2.5
3.0
3.5
4.0
4.5
5.0
0 10 20 30 40 50
An
gle
, de
g
Total Load (lb)
Angular RotationAir Data Boom 1: +MZ
Beta
Alpha
Tip
Extension
Figure B-3 Angular Rotations of Air Data Boom 1: +MZ.
0.0
0.5
1.0
1.5
2.0
2.5
3.0
3.5
4.0
4.5
5.0
0 10 20 30 40 50
An
gle
, de
g
Total Load (lb)
Angular RotationAir Data Boom 1: -MZ
Beta
Alpha
Tip
Extension
Figure B-4 Angular Rotation of Air Data Boom 1: -MZ.
46
0.0
0.5
1.0
1.5
2.0
2.5
3.0
3.5
4.0
4.5
5.0
0 10 20 30 40 50
Ang
le, d
eg
Load, lb
Angular RotationAir Data Boom 2: +MY
Beta
Alpha
Tip
Extension
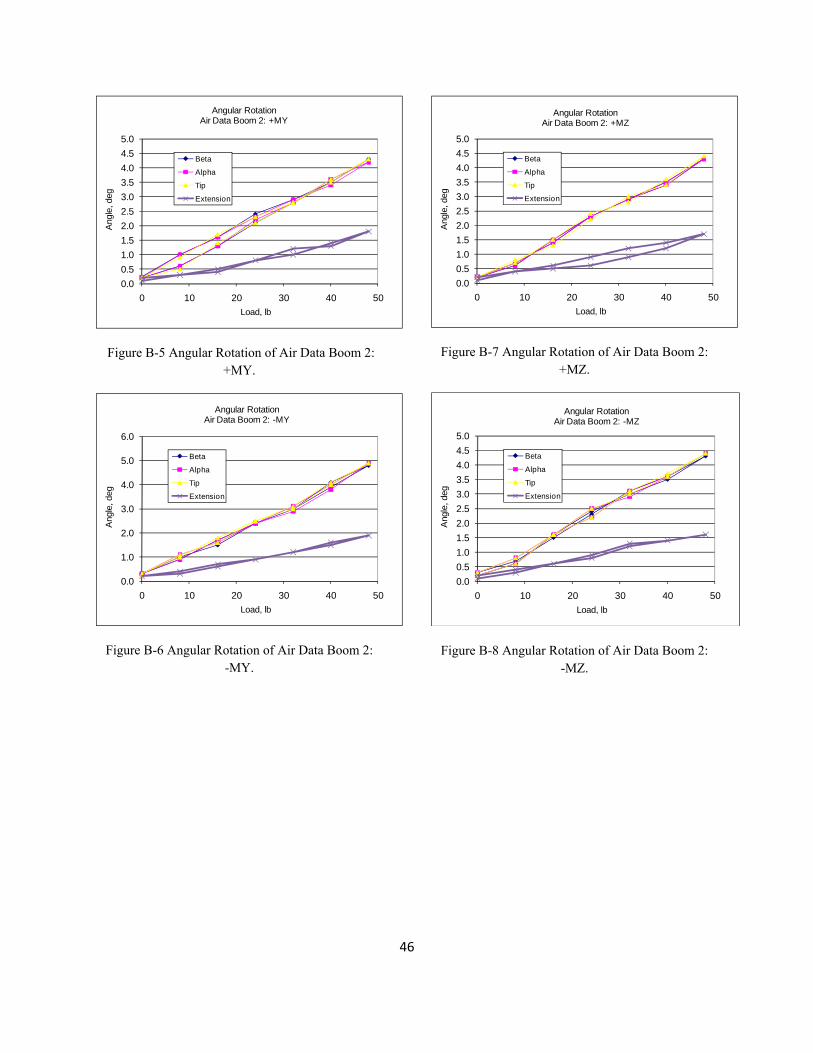
Figure B-5 Angular Rotation of Air Data Boom 2: +MY.
0.0
1.0
2.0
3.0
4.0
5.0
6.0
0 10 20 30 40 50
Ang
le, d
eg
Load, lb
Angular RotationAir Data Boom 2: -MY
Beta
Alpha
Tip
Extension
Figure B-6 Angular Rotation of Air Data Boom 2: -MY.
0.0
0.5
1.0
1.5
2.0
2.5
3.0
3.5
4.0
4.5
5.0
0 10 20 30 40 50
Ang
le, d
eg
Load, lb
Angular RotationAir Data Boom 2: +MZ
Beta
Alpha
Tip
Extension
Figure B-7 Angular Rotation of Air Data Boom 2: +MZ.
0.0
0.5
1.0
1.5
2.0
2.5
3.0
3.5
4.0
4.5
5.0
0 10 20 30 40 50
Ang
le, d
eg
Load, lb
Angular RotationAir Data Boom 2: -MZ
Beta
Alpha
Tip
Extension
Figure B-8 Angular Rotation of Air Data Boom 2: -MZ.

47
0.0
0.5
1.0
1.5
2.0
2.5
3.0
3.5
4.0
4.5
5.0
0 10 20 30 40 50
Ang
le, d
eg
Load, lb
Angular RotationAir Data Boom 3: +MY
Beta
Alpha
Tip
Extension
Figure B-9 Angular Rotation of Air Data Boom 3: +MY.
0.0
0.5
1.0
1.5
2.0
2.5
3.0
3.5
4.0
4.5
5.0
0 10 20 30 40 50
Ang
le, d
eg
Load, lb
Angular RotationAir Data Boom 3: -MY
Beta
Alpha
Tip
Extension
Figure B-10 Angular Rotation of Air Data Boom 3: -MY.
0.0
0.5
1.0
1.5
2.0
2.5
3.0
3.5
4.0
4.5
5.0
0 10 20 30 40 50
Ang
le, d
eg
Load, lb
Angular RotationAir Data Boom 3: +MZ
Beta
Alpha
Tip
Extension
Figure B-11 Angular Rotation of Air Data Boom 3: +MZ.
0.0
0.5
1.0
1.5
2.0
2.5
3.0
3.5
4.0
4.5
5.0
0 10 20 30 40 50
An
gle
, de
g
Load, lb
Angular RotationsAir Data Boom 3: -MZ
Beta
Alpha
Tip
Extension
Figure B-12 Angular Rotation of Air Data Boom 3: -MZ.
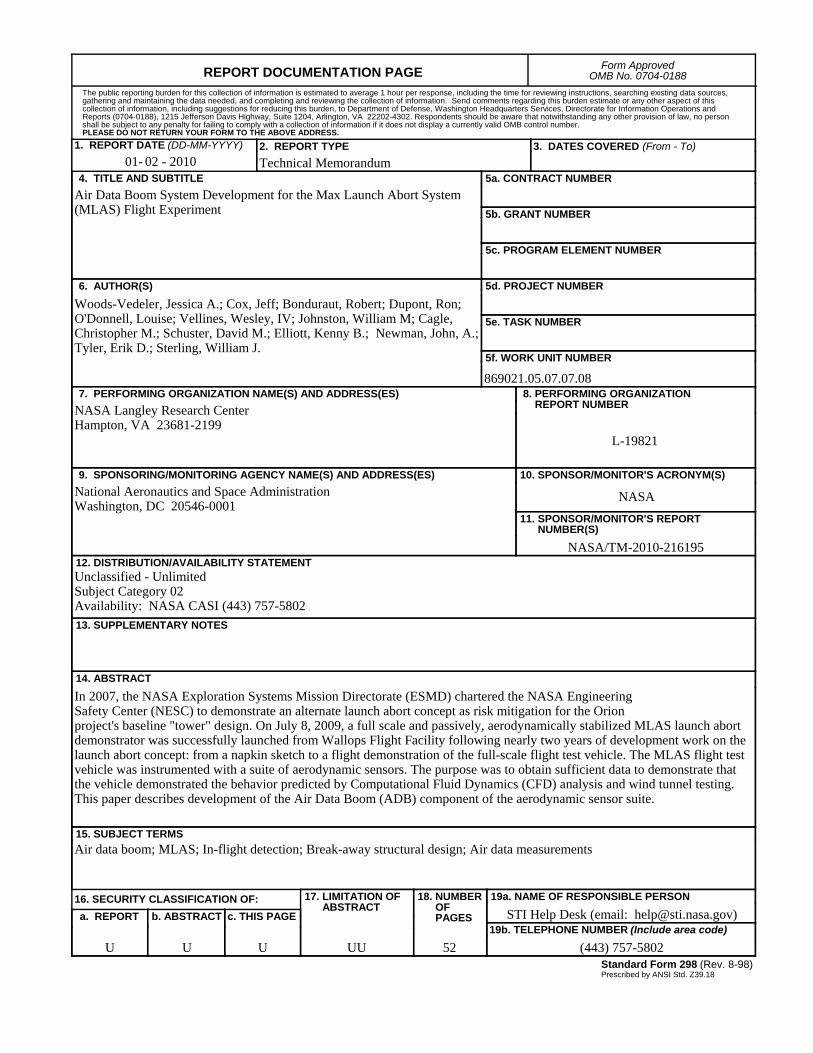
REPORT DOCUMENTATION PAGE Form ApprovedOMB No. 0704-0188
2. REPORT TYPE Technical Memorandum
4. TITLE AND SUBTITLEAir Data Boom System Development for the Max Launch Abort System (MLAS) Flight Experiment
5a. CONTRACT NUMBER
6. AUTHOR(S)
Woods-Vedeler, Jessica A.; Cox, Jeff; Bonduraut, Robert; Dupont, Ron; O'Donnell, Louise; Vellines, Wesley, IV; Johnston, William M; Cagle, Christopher M.; Schuster, David M.; Elliott, Kenny B.; Newman, John, A.; Tyler, Erik D.; Sterling, William J.
7. PERFORMING ORGANIZATION NAME(S) AND ADDRESS(ES)NASA Langley Research CenterHampton, VA 23681-2199
9. SPONSORING/MONITORING AGENCY NAME(S) AND ADDRESS(ES)National Aeronautics and Space AdministrationWashington, DC 20546-0001
8. PERFORMING ORGANIZATION REPORT NUMBER
L-19821
10. SPONSOR/MONITOR'S ACRONYM(S)
NASA
13. SUPPLEMENTARY NOTES
12. DISTRIBUTION/AVAILABILITY STATEMENTUnclassified - UnlimitedSubject Category 02Availability: NASA CASI (443) 757-5802
19a. NAME OF RESPONSIBLE PERSON
STI Help Desk (email: [email protected])
14. ABSTRACT
In 2007, the NASA Exploration Systems Mission Directorate (ESMD) chartered the NASA Engineering Safety Center (NESC) to demonstrate an alternate launch abort concept as risk mitigation for the Orion project's baseline "tower" design. On July 8, 2009, a full scale and passively, aerodynamically stabilized MLAS launch abort demonstrator was successfully launched from Wallops Flight Facility following nearly two years of development work on the launch abort concept: from a napkin sketch to a flight demonstration of the full-scale flight test vehicle. The MLAS flight test vehicle was instrumented with a suite of aerodynamic sensors. The purpose was to obtain sufficient data to demonstrate that the vehicle demonstrated the behavior predicted by Computational Fluid Dynamics (CFD) analysis and wind tunnel testing. This paper describes development of the Air Data Boom (ADB) component of the aerodynamic sensor suite.
15. SUBJECT TERMSAir data boom; MLAS; In-flight detection; Break-away structural design; Air data measurements
18. NUMBER OF PAGES
5219b. TELEPHONE NUMBER (Include area code)
(443) 757-5802
a. REPORT
U
c. THIS PAGE
U
b. ABSTRACT
U
17. LIMITATION OF ABSTRACT
UU
Prescribed by ANSI Std. Z39.18Standard Form 298 (Rev. 8-98)
3. DATES COVERED (From - To)
5b. GRANT NUMBER
5c. PROGRAM ELEMENT NUMBER
5d. PROJECT NUMBER
5e. TASK NUMBER
5f. WORK UNIT NUMBER
869021.05.07.07.08
11. SPONSOR/MONITOR'S REPORT NUMBER(S)
NASA/TM-2010-216195
16. SECURITY CLASSIFICATION OF:
The public reporting burden for this collection of information is estimated to average 1 hour per response, including the time for reviewing instructions, searching existing data sources, gathering and maintaining the data needed, and completing and reviewing the collection of information. Send comments regarding this burden estimate or any other aspect of this collection of information, including suggestions for reducing this burden, to Department of Defense, Washington Headquarters Services, Directorate for Information Operations and Reports (0704-0188), 1215 Jefferson Davis Highway, Suite 1204, Arlington, VA 22202-4302. Respondents should be aware that notwithstanding any other provision of law, no person shall be subject to any penalty for failing to comply with a collection of information if it does not display a currently valid OMB control number.PLEASE DO NOT RETURN YOUR FORM TO THE ABOVE ADDRESS.
1. REPORT DATE (DD-MM-YYYY)02 - 201001-