Embed Size (px)
Citation preview

PNNL-17796
Air Conditioner Compressor Performance Model N Lu YL Xie Z Huang August 2008


DISCLAIMER United States Government. Neither the United States Government nor any agency thereof, nor Battelle Memorial Institute, nor any of their employees, makes any warranty, express or implied, or assumes any legal liability or responsibility for the accuracy, completeness, or usefulness of any information, apparatus, product, or process disclosed, or represents that its use would not infringe privately owned rights. Reference herein to any specific commercial product, process, or service by trade name, trademark, manufacturer, or otherwise does not necessarily constitute or imply its endorsement, recommendation, or favoring by the United States Government or any agency thereof, or Battelle Memorial Institute. The views and opinions of authors expressed herein do not necessarily state or reflect those of the United States Government or any agency thereof.
PACIFIC NORTHWEST NATIONAL LABORATORY
operated by BATTELLE
for the UNITED STATES DEPARTMENT OF ENERGY
under Contract DE-AC0576RL01830
Printed in the United States of America
Available to DOE and DOE contractors from the Office of Scientific and Technical Information,
P.O. Box 62, Oak Ridge, TN 37831-0062; ph: (865) 576-8401, fax: (865) 576-5728
email: [email protected]
Available to the public from the National Technical Information Service, U.S. Department of Commerce, 5285 Port Royal Rd., Springfield, VA 22161
ph: (800) 553-6847, fax: (703) 605-6900 email: [email protected]
online ordering: http://www.ntis.gov/ordering.htm
LEGAL NOTICE
This report was prepared as a result of work sponsored by the California Energy Commission (CEC) and the University of California (UC), and performed by Pacific Northwest National Laboratory (PNNL). It does not necessarily represent the views of CEC, PNNL, UC, their employees, or the State of California. CEC, the State of California, its employees, PNNL, and UC make no warranty, expressed or implied, and assume no legal liability for the information in this report; nor does any party represent that the use of this information will not infringe upon privately owned rights. This report has not been approved or disapproved by CEC, PNNL, or UC, nor has CEC, PNNL, or UC passed upon the accuracy or adequacy of the information in this report.
This document was printed on recycled paper. (8/00)


PNNL-17796 Air Conditioner Compressor Performance Model N Lu Y Xie Z Huang August 2008 Prepared for Lawrence Berkeley National Laboratory for the California Energy Commission under Contract DE-AC05-76RL01830 Pacific Northwest National Laboratory Richland, Washington 99352


iii
Summary
In recent years, phasor measurement units (PMUs) have recorded more and more slow voltage recovery (SVR) events in the electrical grid, especially in areas supplying heavy air-conditioning loads. The sustained low voltages have caused power quality issues and raised concerns about system voltage collapse. Meanwhile, the significant reduction in voltage stability margin may lead to a similar chain of events. For these reasons, it is critical that SVR events be modeled and prevented to assure that the system voltage recovers to its nominal value in a few seconds.
Fundamentally, SVR events are caused by stalled compressors inside single-phase air-conditioning (SPAC) units, which can not be simulated satisfactorily by either three-phase motor models or ZIP models. Therefore, a new modeling approach is needed.
During the past years, the Western Electricity Coordinating Council (WECC) Load Modeling Task Force (LMTF) has led the effort to develop the new modeling approach. As part of this effort, the Bonneville Power Administration (BPA), Southern California Edison (SCE), and Electric Power Research Institute (EPRI) Solutions tested 27 residential air-conditioning units to assess their response to delayed voltage recovery transients. After completing these tests, different modeling approaches were proposed, among them a performance modeling approach that proved to be one of the three favored for its simplicity and ability to recreate different SVR events satisfactorily.
Funded by the California Energy Commission (CEC) via Lawrence Berkeley National Laboratory under its load modeling project, researchers at Pacific Northwest National Laboratory (PNNL) led the follow-on task to analyze the motor testing data to derive the parameters needed to develop a performance model for the SPAC unit. To derive the performance model, PNNL researchers first used the motor voltage and frequency ramping test data to obtain the real (P) and reactive (Q) power versus voltage (V) and frequency (f) curves. Then, curve fitting was used to develop the P-V, Q-V, P-f, and Q-f relationships for motor running and stalling states. The resulting performance model ignores the dynamic response of the air-conditioning motor. Because the inertia of the air-conditioning motor is very small (H<0.05), the motor reaches from one steady state to another in a few cycles, so, the performance model is a fair representation of the motor behaviors in both running and stalling states.

iv
Acknowledgment
The preparation of this report was conducted with support from the California Energy Commission’s Public Interest Energy Research Program, WA# MR-049, through the California Institute of Energy and Environment, Award Number MTX-06-01, and support from Pacific Northwest National Laboratory. The authors would like to thank Richard Bravo, Southern California Edison, and Dmitry Kosterev, Bonneville Power Administration, for providing PNNL with the air-conditioner testing data and contributing to many insightful discussions. This work is supported by the California Institute for Energy and Environment (CIEE) and California Energy Commission.

v
Acronyms and Abbreviations
AC air conditioner BPA Bonneville Power Administration CEC California Energy Commission CIEE California Institute for Energy and Environment EPRI Electric Power Research Institute HVAC heating, ventilation, and air-conditioning LMFT Load Modeling Task Force PMU phasor measurement unit PNNL Pacific Northwest National Laboratory SCE Southern California Edison SPAC single-phase air-conditioning SVR slow voltage recovery WECC Western Electricity Coordinating Council

vi
Contents
Summary ........................................................................................................................................... iii Acknowledgment .............................................................................................................................. iv Acronyms and Abbreviations............................................................................................................. v 1.0 Introduction................................................................................................................................ 1
1.1 Development of a New Modeling Approach..................................................................... 4 1.2 Report Contents and Organization..................................................................................... 4
2.0 Data Preparation......................................................................................................................... 5 2.1 Data Sets ............................................................................................................................ 5
2.1.1 SCE Data Sets......................................................................................................... 6 2.1.2 BPA Data Sets ........................................................................................................ 7
2.2 Data Preprocessing: Filtering and Normalization............................................................. 8 2.3 Curve Fitting...................................................................................................................... 9 2.4 Temperature Interpolation ............................................................................................... 10
2.4.1 SCE Data Sets....................................................................................................... 10 2.4.2 BPA Data Sets ...................................................................................................... 10
3.0 Discussion of Results ............................................................................................................... 12 3.1 Individual Compressor Models........................................................................................ 12 3.2 Aggregated Performance Model...................................................................................... 19
4.0 References................................................................................................................................ 21

1
1.0 Introduction
In recent years, phasor measurement units (PMUs) have recorded more and more slow voltage recovery (SVR) events in the electrical grid, especially in areas supplying heavy air conditioning loads. During an SVR event, the voltage recovers to the nominal level in tens of seconds instead of tens of cycles after a fault is cleared (the faults are usually cleared in three to five cycles at the transmission level). Sustained low voltages have caused power quality issues and raised concerns of voltage system collapse. Meanwhile, the significant reduction in the voltage stability margin may lead to a similar chain of events. Therefore, it is critical that SVR events be modeled and prevented.
Most heating, ventilation, and air-conditioning (HVAC) units used by households and small business buildings are single-phase air-conditioning (SPAC) units, which include a condenser fan, an air handler fan, and a compressor, as shown in Figure 1 and Figure 2. The two fans consume approximately 20% of the total power of an air-conditioning unit, while the compressor consumes 80% of the total power under normal operating conditions. The air handler and condenser fan motors can be modeled by either three-phase motor models or ZIP models, because these motors restart when voltage recovers, as shown in Figure 3 and Figure 4.
Figure 1. The Configuration of an Air-Conditioner Unit
For the compressor motor, however, once the fault voltage drops below its stalling threshold (usually around 0.6 to 0.7 p.u.), the motor stalls in a few cycles. This is because the pressurized gas in the compression pipes produces a constant torque on the motor shaft, and the electrical torque can not overcome the load torque once the voltage drops below a certain threshold. Once stalled, the compressor motor current jumps to three to seven times its rated value when the fault is cleared and the voltage starts to recover. This over-current condition

2
produces a voltage drop, the magnitude of which depends on the amount of stalled motor and the feeder impedance. Under such depressed voltage conditions, the motor electrical torque is not able to overcome the motor load torque. Thus, the compressor motor remains stalled until its thermal relay detects the over-current and trips the compressor offline. Depending on the magnitude of the over-current, the process, can take from seconds to tens of seconds, as shown in Figure 5. Therefore, the fundamental cause of the SVR event is the stalled motors inside a SPAC unit. Because neither the three-phase motor model nor the ZIP model alone can model the compressor behavior properly for both the motor running and stalling states, a new modeling approach is needed for the modeling of SPAC units.
Figure 2. The Electrical System of an Air Conditioner (Kosterev 2007)
Figure 3. The P-V and Q-V Curves of the Air-Handler Inside an Air-Conditioner Unit (Kosterev 2007)

3
Figure 4. The P-V and Q-V Curves of the Condenser Fan Inside an Air-Conditioner Unit (Kosterev 2007)
50 60 70 80 90 100 1100
10
20
30
40
50
Thermal Relay Current (A)
Ther
mal
Rel
ay T
rippi
ng T
ime
Figure 5. Thermal Relay Testing Results
4
1.1 Development of a New Modeling Approach
During the past years, the Western Electricity Coordinating Council (WECC) Load Modeling Task Force (LMTF) has led the effort to develop the new modeling approach. Under the auspices of the WECC LMTF, the Bonneville Power Administration (BPA), Southern California Edison, and Electric Power Research Institute (EPRI) Solutions tested 27 residential air-conditioning units to assess their response to delayed voltage recovery transients. As a result of the tests, three modeling approaches were proposed: 1) the performance modeling approach, which is an empirical model derived from the motor testing results; 2) the hybrid modeling approach, which uses a three-phase motor model to represent the motor running state and a performance model to represent the motor stalling state; and 3) the single-phase positive-sequence modeling approach, which is derived from the voltage and torque equations for the single-phase induction motor.
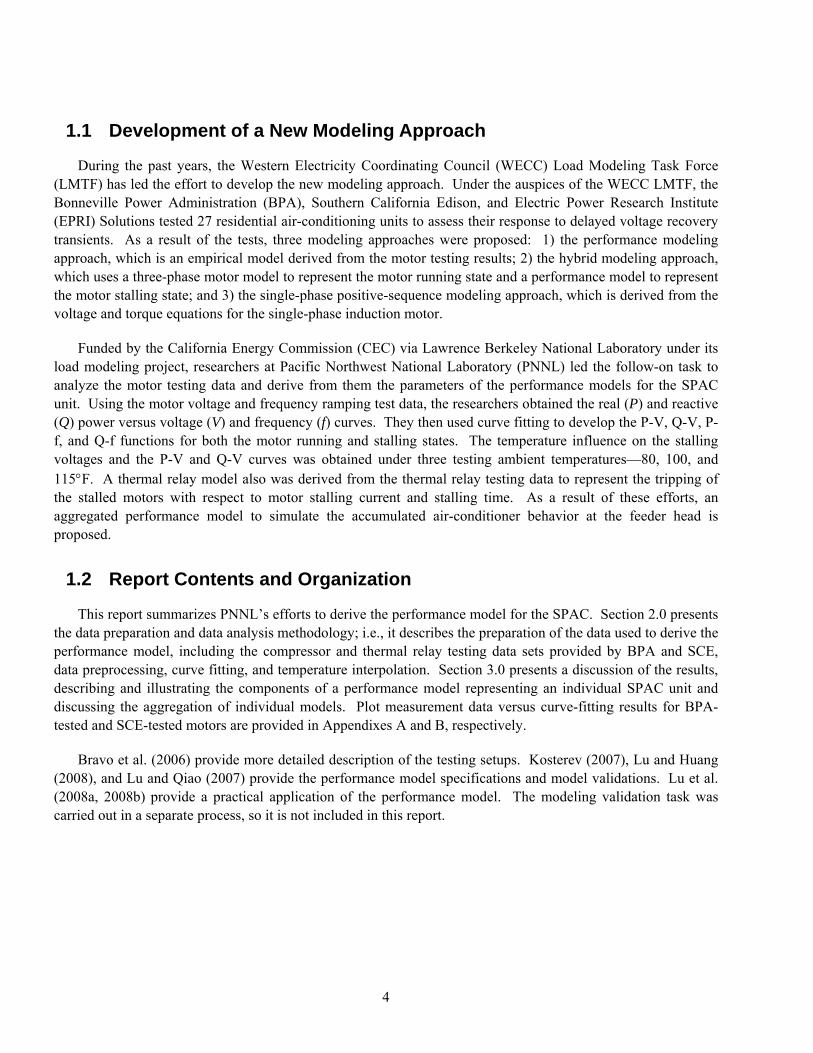
Funded by the California Energy Commission (CEC) via Lawrence Berkeley National Laboratory under its load modeling project, researchers at Pacific Northwest National Laboratory (PNNL) led the follow-on task to analyze the motor testing data and derive from them the parameters of the performance models for the SPAC unit. Using the motor voltage and frequency ramping test data, the researchers obtained the real (P) and reactive (Q) power versus voltage (V) and frequency (f) curves. They then used curve fitting to develop the P-V, Q-V, P-f, and Q-f functions for both the motor running and stalling states. The temperature influence on the stalling voltages and the P-V and Q-V curves was obtained under three testing ambient temperatures—80, 100, and 115°F. A thermal relay model also was derived from the thermal relay testing data to represent the tripping of the stalled motors with respect to motor stalling current and stalling time. As a result of these efforts, an aggregated performance model to simulate the accumulated air-conditioner behavior at the feeder head is proposed.
1.2 Report Contents and Organization
This report summarizes PNNL’s efforts to derive the performance model for the SPAC. Section 2.0 presents the data preparation and data analysis methodology; i.e., it describes the preparation of the data used to derive the performance model, including the compressor and thermal relay testing data sets provided by BPA and SCE, data preprocessing, curve fitting, and temperature interpolation. Section 3.0 presents a discussion of the results, describing and illustrating the components of a performance model representing an individual SPAC unit and discussing the aggregation of individual models. Plot measurement data versus curve-fitting results for BPA-tested and SCE-tested motors are provided in Appendixes A and B, respectively.
Bravo et al. (2006) provide more detailed description of the testing setups. Kosterev (2007), Lu and Huang (2008), and Lu and Qiao (2007) provide the performance model specifications and model validations. Lu et al. (2008a, 2008b) provide a practical application of the performance model. The modeling validation task was carried out in a separate process, so it is not included in this report.

5
2.0 Data Preparation
Deriving a performance model for the SPAC unit required data preparation that involved the use of data sets, data preprocessing, curve fitting, and temperature interpolation, as described in the following sections.
2.1 Data Sets
As indicated previously, the data used in this modeling task were provided by BPA and SCE. A total of 19 air-conditioner compressor units were tested; 9 by BPA and 10 by SCE. Because the data sets for 3 units tested by BPA and 3 tested by SCE were incomplete, only 13 complete data sets are shown in Table 1. These data sets include the following testing scenarios: voltage ramp-down and ramp-up, voltage oscillation, voltage sags, frequency oscillation, frequency ramp-down and ramp-up. The units were tested under different ambient temperatures as follows:
• BPA: Most motors were tested under 95ºF.
• SCE: Motors were tested under 80, 100, and 115ºF.
Table 1. Air-Conditioner Units Tested
Air-Conditioner Name Agency 1. Carrier 3-Ton Recip 38TKB036 2. Payne 3-Ton Scroll PA12NA036 3. Trane 3-Ton Recip 2TTB0036A 4. York 3.5-Ton Recip H4DB042S06 5. York 4-Ton Scroll H5DB048S06 6. York 3-Ton Recip H4DB036S06
BPA
7. AC10-Carrier 5-Ton Scroll 8. AC3-Rheem 3-Ton Scroll 9. AC4-Carrier 3-Ton Scroll
10. AC5-Coleman 4-Ton Scroll SCE 11. AC6-Rheem 4-Ton Scroll 12. AC7-Carrier 4-Ton Scroll 13. AC8-Goodman 4-Ton Recip
The detailed experimental setup and data collection process were documented by SCE (Yinger et al. 2006; Bravo et al. 2006).

6
2.1.1 SCE Data Sets
SCE provided PNNL with 10 sets of air-conditioner compressor testing data. The data were organized according to the air-conditioner (AC) index, as shown in Table 1. Three ambient temperatures were considered: 80, 100, and 115ºF. There were a few bad data sets among them:
• Data for AC 1 are incomplete and in a different file format than the other testing records.
• Data for AC 2 are not accessible.
• Data for AC 9 at 100ºF are not accessible.
Therefore, only the data sets for the remaining seven AC units tested were used to derive the performance model; the filenames are listed in Table 2. There are 15 fields in the SCE-provided CSV data files. According to Table 1 in SCE’s documentation (Yinger et al. 2006), the following three fields were used subsequently: MATH 1 of input voltage, MATH 9 of total real power, and MATH 10 of total apparent power (see Tables 3 and 4).
Table 2. Data Files Used for Modeling
Name of Data File
AC3_TS101_Ramp_70%115F.csv AC3_TS84_Ramp_70%80F.csv AC3_TS88_Ramp_70%100F.csv AC4_TS66_Ramp_10%100F.csv AC4_TS69_Ramp_70%80F.csv AC4_TS83_Ramp_10%115F.csv AC5_TS67_Ramp_10%100F.csv AC5_TS67_Ramp_10%80F.csv AC5_TS77_Ramp_115F.csv AC6_TS55_Ramp_10%80F.csv AC6_TS60_Ramp_60%100F.csv AC6_TS96_Ramp_10%115F.csv AC7_TS80_Ramp_10%100F.csv AC7_TS84_Ramp_10%80F.csv AC7_TS85_Ramp_10%115F.csv AC8_TS63_Ramp_10%100F.csv AC8_TS69_Ramp_10%115F.csv AC8_TS74_Ramp_10%80F.csv AC10_TS69_Ramp_10%80F.csv AC10_TS71_Ramp_10%100F.csv AC10_TS77_Ramp_10%115F.csv
7
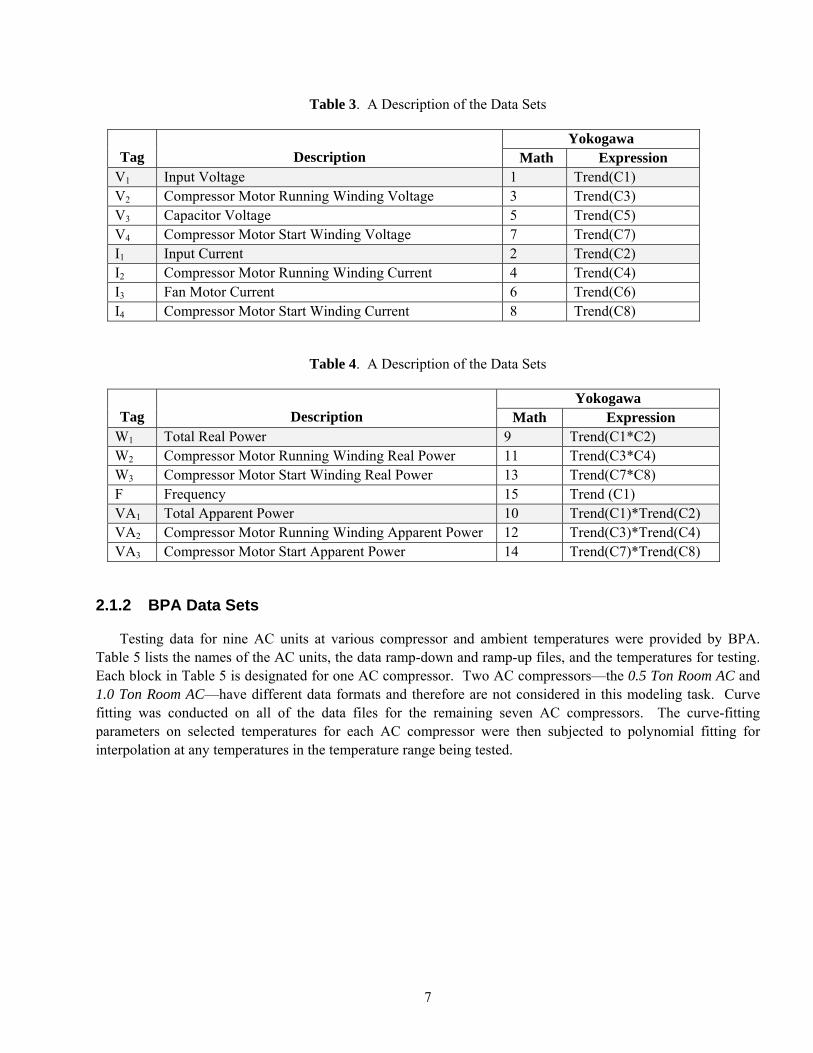
Table 3. A Description of the Data Sets
Yokogawa Tag Description Math Expression
V1 Input Voltage 1 Trend(C1) V2 Compressor Motor Running Winding Voltage 3 Trend(C3) V3 Capacitor Voltage 5 Trend(C5) V4 Compressor Motor Start Winding Voltage 7 Trend(C7) I1 Input Current 2 Trend(C2) I2 Compressor Motor Running Winding Current 4 Trend(C4) I3 Fan Motor Current 6 Trend(C6) I4 Compressor Motor Start Winding Current 8 Trend(C8)
Table 4. A Description of the Data Sets
Yokogawa Tag Description Math Expression
W1 Total Real Power 9 Trend(C1*C2) W2 Compressor Motor Running Winding Real Power 11 Trend(C3*C4) W3 Compressor Motor Start Winding Real Power 13 Trend(C7*C8) F Frequency 15 Trend (C1) VA1 Total Apparent Power 10 Trend(C1)*Trend(C2) VA2 Compressor Motor Running Winding Apparent Power 12 Trend(C3)*Trend(C4) VA3 Compressor Motor Start Apparent Power 14 Trend(C7)*Trend(C8)
2.1.2 BPA Data Sets
Testing data for nine AC units at various compressor and ambient temperatures were provided by BPA. Table 5 lists the names of the AC units, the data ramp-down and ramp-up files, and the temperatures for testing. Each block in Table 5 is designated for one AC compressor. Two AC compressors—the 0.5 Ton Room AC and 1.0 Ton Room AC—have different data formats and therefore are not considered in this modeling task. Curve fitting was conducted on all of the data files for the remaining seven AC compressors. The curve-fitting parameters on selected temperatures for each AC compressor were then subjected to polynomial fitting for interpolation at any temperatures in the temperature range being tested.

8
Table 5. Data Files Used for Modeling by AC Unit
Carrier 3-Ton Recip 38TKB036 RampDOWN
RampUP York 3.5-Ton Recip H4DB042S06
RampDOWN
RampUP
ac38tkb036_C080_A072_VOLT_RampDOWN_15sec.mat 80 80 acH4DB04200_A83_VOLT_RampDOWN_30sec_SK.mat 73 ac38tkb036_C080_A072_VOLT_RampDOWN_60sec.mat 85 acH4DB04200_A83_VOLT_RampUP_30sec_SK.mat 80 80 ac38tkb036_C080_A072_VOLT_RampUP_00_12cycle_10sec.mat 90 acH4DB04280_A073_VOLT_RampDOWN_60sec.mat 83 83 ac38tkb036_C080_A072_VOLT_RampUP_00_12cycle_15sec.mat 95 95 acH4DB04295_A080_VOLT_RampDONW_20sec.mat 85 ac38tkb036_C080_A072_VOLT_RampUP_00_12cycle_60sec.mat 100 acH4DB04295_A080_VOLT_RampDOWN_10sec.mat 90 ac38tkb036_C085_A085_VOLT_RAMPDOWN_60sec.mat 105 acH4DB04295_A080_VOLT_RampDOWN_30sec.mat 92 ac38tkb036_C090_A085_VOLT_RAMPDOWN_60sec.mat 110 acH4DB04295_A080_VOLT_RampDOWN_60sec.mat ac38tkb036_C095_A085_VOLT_RampDOWN_15sec.mat 115 acH4DB04295_A080_VOLT_RampUP_00_06cycles_05sec.mat ac38tkb036_C095_A085_VOLT_RampDOWN_60sec.mat 123 acH4DB04295_A080_VOLT_RampUP_00_06cycles_15sec.mat ac38tkb036_C095_A085_VOLT_RampUP_00_06cycle_15sec.mat acH4DB04295_A080_VOLT_RampUP_00_06cycles_30sec.mat ac38tkb036_C095_A085_VOLT_RampUP_00_06cycle_60sec.mat acH4DB04295_A080_VOLT_RampUP_00_60cycles_30sec.mat ac38tkb036_C100_A085_VOLT_RAMPDOWN_60sec.mat acH4DB04200_A080_VOLT_RampDONW_20sec.mat ac38tkb036_C105_A085_VOLT_RAMPDOWN_60sec.mat acH4DB04205_A085_VOLT_RampDONW_20sec.mat ac38tkb036_C110_A085_VOLT_RAMPDOWN_60sec.mat acH4DB04210_A090_VOLT_RampDONW_10sec.mat ac38tkb036_C115_A085_VOLT_RAMPDOWN_60sec.mat acH4DB04210_A090_VOLT_RampDONW_20sec.mat ac38tkb036_C123_A085_VOLT_RAMPDOWN_60sec.mat acH4DB04210_A090_VOLT_RampDONW_60sec.mat ac38tkb036_CONT_C095_A082_VOLT_RampDOWN_15sec.mat acH4DB04210_A092_VOLT_RampDONW_20sec.mat ac38tkb036_CONT_C095_A082_VOLT_RampUP_00_06cyce_01sec.mat acH4DB04215_A092_VOLT_RampDONW_20sec.mat ac38tkb036_CONT_C095_A082_VOLT_RampUP_00_06cyce_15sec.mat acH4DB04200_A83_VOLT_RampDOWN_30sec.mat
acH4DB04200_A83_VOLT_RampUP_05sec.mat
Payne 3-Ton Scroll PA12NA036 RampDOWN
RampUP acH4DB04200_A83_VOLT_RampUP_10sec.mat
acPA12NA036_C080_A076_VOLT_RampDOWN_30sec.mat 80 80 acH4DB04200_A83_VOLT_RampUP_15sec.mat acPA12NA036_C080_A076_VOLT_RampDOWN_60sec.mat 95 95 acH4DB04200_A83_VOLT_RampUP_30sec.mat acPA12NA036_C080_A076_VOLT_RampUP_00_06cycle_10sec.mat 115 115
acPA12NA036_C080_A076_VOLT_RampUP_00_06cycle_30sec.mat York 3-Ton Recip H4DB036S06 RampDOWN
RampUP
acPA12NA036_C095_A085_VOLT_RampDOWN_60sec.mat acH4DB_C085_A075_VOLT_RAMPDOWN_30sec.mat 85 acPA12NA036_C095_A085_VOLT_RampUP_00_06cycle_10sec.mat acH4DB_C090_A085_VOLT_RAMPDOWN_30sec.mat 90 acPA12NA036_C095_A085_VOLT_RampUP_00_06cycle_60sec.mat acH4DB_C095_A085_VOLT_RAMPDOWN_30sec.mat 95 95 acPA12NA036_C115_A090_VOLT_RampDOWN_60sec.mat acH4DB_C100_A085_VOLT_RAMPDOWN_30sec.mat 100 acPA12NA036_C115_A090_VOLT_RampUP_10sec.mat acH4DB_C105_A085_VOLT_RAMPDOWN_30sec.mat 105 acPA12NA036_C115_A090_VOLT_RampUP_30sec.mat acH4DB_C110_A085_VOLT_RAMPDOWN_30sec.mat 110 acPA12NA036_CONT_C095_A080_VOLT_RampDOWN_05sec.mat acH4DB_C115_A085_VOLT_RAMPDOWN_30sec.mat 115 acPA12NA036_CONT_C095_A080_VOLT_RampDOWN_30sec.mat acH4DB_CONT_C095_A085_VOLT_RampDOWN_30sec.mat acPA12NA036_CONT_C095_A080_VOLT_RampUP_020_03cycle_01sec.mat acH4DB_CONT_C095_A085_VOLT_RampDOWN_01sec.mat acPA12NA036_CONT_C095_A080_VOLT_RampUP_020_03cycle_05sec.mat acH4DB_CONT_C095_A085_VOLT_RampDOWN_10sec.mat acH4DB_C095_A085_VOLT_RampDOWN_60sec.mat
Trane 3-Ton Recip 2TTB0036A RampDOWN
RampUP acH4DB_C095_A086_VOLT_RampDOWN_60sec.mat
ac2TTX4036_C095_A080_VOLT_Rampdown_30sec.mat 95 95 acH4DB_C095_A086_VOLT_RampDOWN_30sec.mat ac2TTX4036_C095_A080_VOLT_Rampdown_60sec.mat 115 acH4DB_C095_A086_VOLT_RampUP_00_06cycle_60sec.mat ac2TTX4036_C095_A080_VOLT_RampUP_30sec.mat acH4DB_C095_A086_VOLT_RampUP_00_06cycle_30sec.mat ac2TTX4036_C095_A085_VOLT_Rampdown_60sec.mat acH4DB_C095_A086_VOLT_RampUP_00_06cycle_10sec.mat ac2TTX4036_C115_A085_VOLT_Rampdown_60sec.mat
York 4-Ton Scroll H5DB048S06 RampDOWN
RampUP
York 3-Ton Recip H1TC036S06 RampDOWN
RampUP acH5DB048_C085_A071_VOLT_Rampdown_60sec.mat 85
acH1TC_C095_A083_VOLT_Rampdown_10sec.mat 95 acH5DB048_C087_A071_VOLT_Rampdown_30sec.mat 87 acH1TC_C095_A083_VOLT_Rampdown_20sec.mat acH5DB048_C095_A080_VOLT_Rampdown_30sec.mat 95 95 acH1TC_C095_A083_VOLT_Rampdown_30sec.mat acH5DB048_C095_A080_VOLT_Rampdown_60sec.mat 100 acH5DB048_C0115_A087_VOLT_Rampdown_30sec.mat 115 0.5-Ton Room AC acH5DB048_C0115_A087_VOLT_Rampdown_60sec.mat ac05btu_v_ramp_down01.mat acH5DB036_C100_A83_VOLT_Rampdown_30sec.mat ac05btu_v_ramp_down10.mat acH5DB036_C100_A83_VOLT_Rampdown_30sec_SK.mat ac05btu_v_ramp_down30.mat acH5DB048_Cont_C095_A080_VOLT_Drop_025_01sec_RampUp_60sec.mat ac05btu_v_ramp_down30B.mat acH5DB048_Cont_C095_A080_VOLT_Drop_025_01sec_RampUp_30sec.mat ac05btu_v_ramp_down60.mat acH5DB048_Cont_C095_A080_VOLT_Rampdown_30sec.mat ac05btu_v_ramp_up30s01.mat acH5DB048_Cont_C095_A080_VOLT_Rampdown_60sec.mat ac05btu_v_ramp_up30s05.mat ac05btu_v_ramp_up30s10.mat 1.0-Ton Room AC ac05btu_v_ramp_up30s1B.mat ac12btu_vramp_down_10sec.mat ac05btu_v_ramp_up30s20.mat ac12btu_vramp_down_15sec.mat ac05btu_v_ramp_up60s01.mat ac12btu_vramp_down_30sec.mat ac05btu_v_ramp_up60s10.mat ac12btu_vstall_1sec_rampup_10sec.mat ac05btu_v_ramp_up60s20.mat ac12btu_vstall_1sec_rampup_30sec.mat ac12btu_vstall_30sec_rampup_30sec.mat
2.2 Data Preprocessing: Filtering and Normalization
To reduce the high frequency oscillation of the time series data, an averaging filter was applied on the time series. Data segments for ramp-down and ramp-up processes were then selected from the entire time series for subsequent curve fitting.

9
The subsequent curve fitting was conducted on both raw time series data and normalized data, which are normalized by the motor apparent power defined as:
22 QPS +=
2.3 Curve Fitting
The following functions were selected for curve fitting to minimize the simulation errors for the voltage ramp-down, ramp-up, and oscillation cases:
1) For ramp-down:
40403
0
21 )()( bxbbxb
bxbby −+−+−
+=
2) For ramp-up:
22
31 xkxky +=
where x is the voltage and y denotes raw or normalized real power P or reactive power Q, as shown in Figure 6.
Figure 6. The P-V and Q-V Curves
For each AC compressor motor, fitting parameters were optimized for the P-V and Q-V curves of the ramp-down and ramp-up processes at each of the three temperatures: 80, 100, and 115ºF, respectively.

10
As shown in Figure 6, the other two sets of important parameters are the critical voltages, Vstall, below which the motor will stall, and Vrecover, above which the motor will restart. The curve-fitting results are presented in Appendixes A and B of this report.
2.4 Temperature Interpolation
Temperature was interpolated for the SCE and BPA data sets, as described here.
2.4.1 SCE Data Sets
The curve-fitting parameters of the P-V and Q-V curves and the peak voltage of the power time series at any temperature between 80ºF and 115ºF were interpolated. The interpolation was based on a polynomial fitting of each of the fitting parameters based on the optimal fitting parameters at three temperatures. The P-V and Q-V curves at any temperatures between 80ºF and 115ºF could therefore be simulated. A second order polynomial fitting was used:
012
2)( pTpTpTa ++=
where a(T) represents a parameter used in P-V/Q-V curve fitting of either ramp-down or ramp-up processes at temperature T (between 80ºF and 115ºF). The polynomial fitting parameters are listed in Table B.2 in Appendix B.
2.4.2 BPA Data Sets
As can be seen in Table B.2, the number of temperatures, under which different AC compressors were tested, differed. Although ramp-down data were available at multiple temperatures for most compressors, ramp-up data were available at fewer temperatures. Therefore, temperature interpolation was only conducted when data were available from at least three testing temperatures. The temperature interpolation starts with a second order polynomial fitting on each curve-fitting parameter based on the optimal curve-fitting parameter values at the testing temperatures where a(T) represents a parameter used in P-V/Q-V curve fitting of either ramp-down or ramp-up processes at temperature T. Then the curve-fitting parameters at any temperature within the temperature range being tested are calculated from the polynomial fitting parameters and are subsequently used to simulate the P-V/Q-V curves at that temperature.
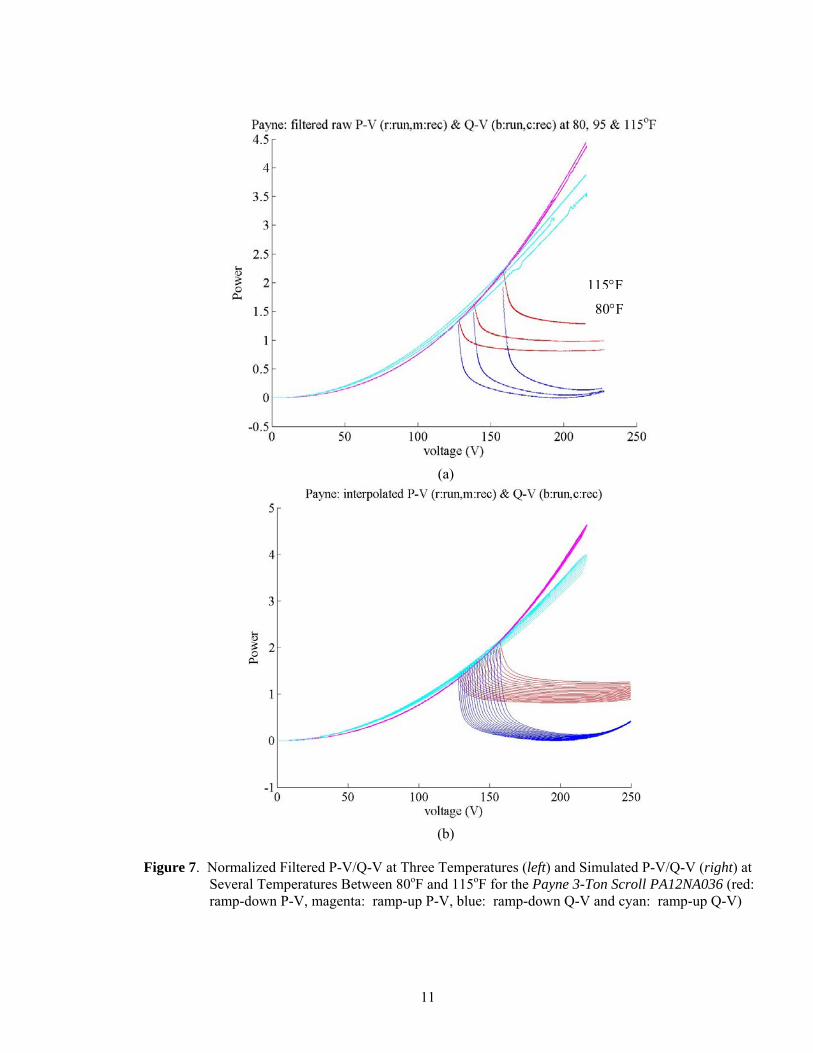
Because the AC Payne 3-Ton Scroll PA12NA036 has data at three common temperatures for both ramp-down and ramp-up processes, it was used to demonstrate the temperature interpolation of curve-fitting parameters and the subsequent simulation of P-V/Q-V curves at any temperature in the testing temperature range. The polynomial fitting parameters of this AC are tabulated in Table A.4 in Appendix A and the interpolated P-V/Q-V time series at temperatures between 80oF to 115oF are shown below in Figure 7.
For other AC compressors, the temperature interpolation was still conducted whenever data from at least three temperatures are available for either ramp-down or ramp-up process and simulated P-V/Q-V curves are shown in Figure A.2 in Appendix A, but the polynomial fitting parameters are not listed.
11
(a)
(b)
Figure 7. Normalized Filtered P-V/Q-V at Three Temperatures (left) and Simulated P-V/Q-V (right) at
Several Temperatures Between 80oF and 115oF for the Payne 3-Ton Scroll PA12NA036 (red: ramp-down P-V, magenta: ramp-up P-V, blue: ramp-down Q-V and cyan: ramp-up Q-V)
115°F80°F

12
3.0 Discussion of Results
The components of a performance model representing an individual SPAC unit are described and illustrated, and the aggregation of individual models are discussed in the following sections.
3.1 Individual Compressor Models
Figure 8 and Figure 9 show the running and stalling curves derived from the voltage ramp-down and ramp-up cases when the ambient temperature was 100oF. The black bars in Figure 8 shows the voltage range of the compressor stalling voltages.
0 50 100 150 200 2500
2
4
6
8
10
Voltage (V)
P a
nd Q
(kW
and
kV
ar)
PV curves
QV curves
(a) P-V and Q-V curves
0 50 100 150 200 2500
0.5
1
1.5
2
2.5
Voltage (V)
P a
nd Q
(pu)
PV curves
QV curves
(b) Normalized P-V and Q-V curves
Figure 8. The P-V and Q-V Curves of 11 Tested Compressors Obtained from Voltage Ramp-Down Tests

13
0 50 100 150 200 2500
5
10
15
20
25
Voltage (V)
Rea
l Pow
er (k
W)
tripped
restarted
(a) P-V and Q-V curves
0 0.2 0.4 0.6 0.8 10
0.5
1
1.5
2
2.5
3
3.5
Voltage (V)
Rea
l Pow
er (p
.u.)
tripped
restarted
(b) Normalized P-V and Q-V curves
Figure 9. The P-V and Q-V Curves of 11 Tested Compressors Obtained from Voltage Ramp-Up Tests
There are few observations:
• Stalling voltages: As shown in Table 6, the stalling voltages range from 126 V to 149 V. As shown in Figure 10, the stalling voltage increases proportionally (2 to 3 V/ºF) when the ambient temperature increases. The band width of the stalling voltages is approximately 25 V for all of the compressors tested. As shown in Figure 11 (Kosterev 2007), the stalling voltage is also related with fault duration. Therefore, the stalling voltages range from 0.5 to 0.6 p.u., depending on the fault duration and ambient temperature.
• Recovery voltage: As shown in Figure 9, some compressor motors were tripped by thermal relay before the voltage recovered to full voltage. Instead of restarting, AC4 tested by SCE rotated backwards. The

14
motor restart depends on the pressure equalization process of the compressor. Usually, it takes minutes for the pressure to equalize. Some of the motors may be tripped off line because the thermal relay reacts with the increased temperature in the motor winding. To be conservative in modeling, one can assume that all the compressor motors will not restart once they stall.
Table 6. The Stall and Recover Voltages of the Tested Compressors
AC Name Vstall (V) Vrecover (V)
Carrier 3-Ton Recip 38TKB036 146 159 tripped Payne 3-Ton Scroll PA12NA036 138 192 restarted Trane 3-Ton Recip 2TTB0036A 126 145 restarted
York 3.5-Ton Recip H4DB042S06 129 143 restarted York 4-Ton Scroll H5DB048S06 138 148 tripped York 3-Ton Recip H4DB036S06 146 193 restarted
AC10-Carrier 5-Ton Scroll 132 196 tripped AC3-Rheem 3-Ton Scroll 143 173 tripped AC4-Carrier 3-Ton Scroll 149 90 rotate backwards
AC5-Coleman 4-Ton Scroll 130 191 restarted AC6-Rheem 4-Ton Scroll 135 172 restarted AC7-Carrier 4-Ton Scroll 126 166 tripped
AC8-Goodman 4-Ton Recip 138 177 restarted
Figure 10. The Impact of Ambient Temperature on Compressor Stalling Voltage

15
Figure 11. The Impact of Voltage Sag Duration on Compressor Stalling Voltage (Kosterev 2007)
• Running curves: There is more than one way to represent running curves. One can choose to represent a running curve by one- or two-segment curves. For the purposes of this effort, PNNL used one continuous function to represent the running curve and BPA used a two-segment representation. Both worked well in the simulation. The key issue is that if one wants to get a more accurate representation for voltage oscillation as shown in Figure 12, a more sophisticated representation of real power will be needed. Otherwise, the compressor real power can be considered to be constant power load when running above stalling voltage. The reactive power changes more dramatically (0.2 to 0.4 p.u.) compared with the real power variations. Depending on the purpose of the simulation, one can represent it using polynomial functions as defined by Kosterev (2007) or as described in Section 2.3.
Figure 12. An Example of Validating the Voltage Oscillation Case. The curves obtained by Optimal Curve-Fitting Parameters (red: P and blue: Q); the curves obtained from measurement (magenta: P and black: Q)
16
• Stalling curves: The representation of the stalling curve is straight forward; one can either use
2
2
VKQ
VKP
qstall
Pstall
=
=
or to be more precise use
22
31
22
31
VKVKQ
VKVKP
qqstall
PPstall
+=
+=
As shown in Figure 7, the stalling curve is not sensitive to the ambient temperature. Once the motor stalls, the motor will be treated as a Z type load.
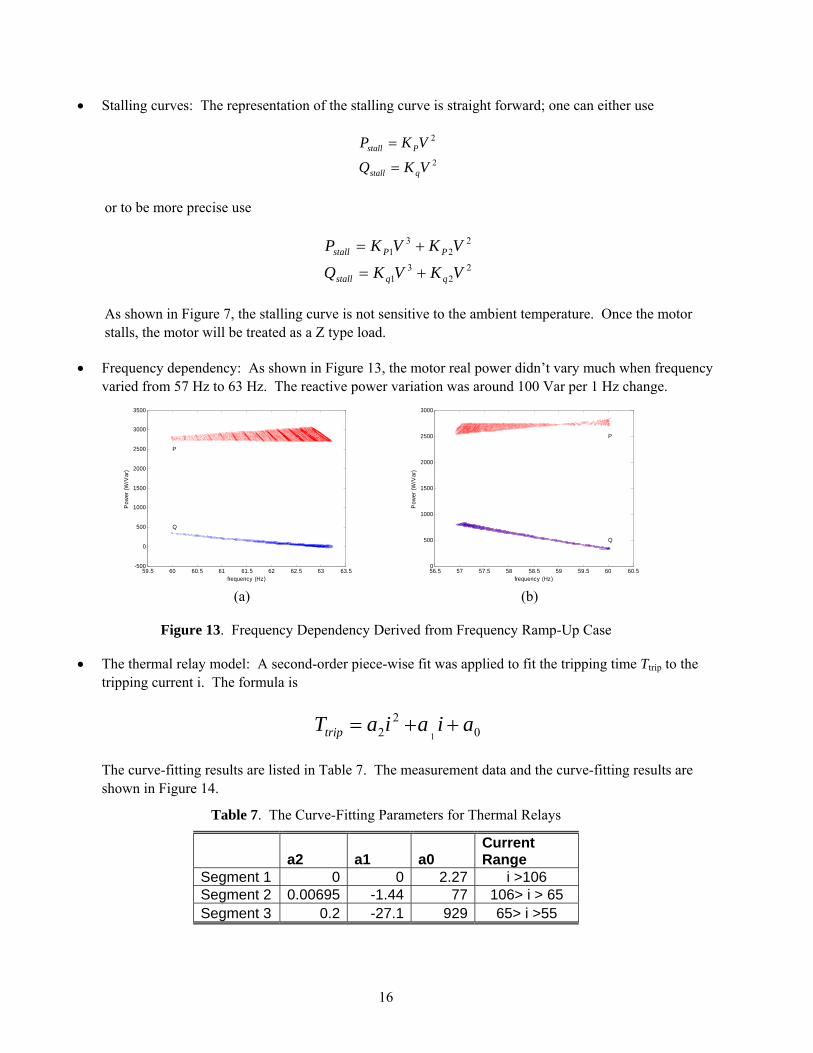
• Frequency dependency: As shown in Figure 13, the motor real power didn’t vary much when frequency varied from 57 Hz to 63 Hz. The reactive power variation was around 100 Var per 1 Hz change.
59.5 60 60.5 61 61.5 62 62.5 63 63.5-500
0
500
1000
1500
2000
2500
3000
3500
frequency (Hz)
Pow
er (W
/Var
)
Q
P
56.5 57 57.5 58 58.5 59 59.5 60 60.50
500
1000
1500
2000
2500
3000
frequency (Hz)
Pow
er (W
/Var
)
Q
P
(a) (b)
Figure 13. Frequency Dependency Derived from Frequency Ramp-Up Case
• The thermal relay model: A second-order piece-wise fit was applied to fit the tripping time Ttrip to the tripping current i. The formula is
02
2 1aiaiaTtrip ++=
The curve-fitting results are listed in Table 7. The measurement data and the curve-fitting results are shown in Figure 14.
Table 7. The Curve-Fitting Parameters for Thermal Relays
a2 a1 a0 Current Range
Segment 1 0 0 2.27 i >106 Segment 2 0.00695 -1.44 77 106> i > 65 Segment 3 0.2 -27.1 929 65> i >55

17
40 60 80 100 120 1400
10
20
30
40
50
60
70
Thermal Relay Current (A)
Ther
mal
Rel
ay T
rippi
ng T
ime
FirstSegmentSecondSegmentThirdSegmentmeasurement
Figure 14. Thermal Relay Testing Results
• A complete parameter set of all tested compressor motors is shown in Table 8 through Table 11.
Table 8. The Normalized Running P Curve Parameters
AC Name b(0)_P(run) b(1)_P(run) b(2)_P(run) b(3)_P(run) b(4)_P(run)
Carrier 3-Ton Recip 38TKB036 0.65 1.00 0.01 -0.16 0.99 Payne 3-Ton Scroll PA12NA036 0.61 0.99 0.01 -0.17 1.69 Trane 3-Ton Recip 2TTB0036A 0.54 0.83 0.02 0.07 0.42 York 3.5-Ton Recip H4DB042S06 0.57 0.77 0.01 -0.06 0.80 York 4-TonScroll H5DB048S06 0.60 0.96 0.01 -0.05 0.78 York 3-Ton Recip H4DB036S06 0.65 1.03 0.01 -0.26 1.94 AC10-Carrier 5-Ton Scroll 0.56 0.87 0.02 0.05 0.28 AC3-Rheem 3-Ton Scroll 0.62 0.90 0.02 -0.06 0.91 AC4-Carrier 3-Ton Scroll 0.64 0.88 0.02 0.06 0.70 AC5-Coleman 4-Ton Scroll 0.57 1.01 0.01 -0.26 1.54 AC6-Rheem 4-Ton Scroll 0.57 0.73 0.03 0.11 0.40 AC7-Carrier 4-Ton Scroll 0.53 0.82 0.03 0.14 0.18
AC8-Goodman 4-Ton Recip 0.59 0.73 0.03 0.30 -0.27

18
Table 9. The Normalized Running Q Curve Parameters
AC Name b(0)_Q(run) b(1)_Q(run) b(2)_Q(run) b(3)_Q(run) b(4)_Q(run)
Carrier 3-Ton Recip 38TKB036 0.65 0.30 0.01 -0.72 6.65 Payne 3-Ton Scroll PA12NA036 0.62 0.21 0.01 -0.92 9.39 Trane 3-Ton Recip 2TTB0036A 0.56 0.15 0.02 -0.29 4.36 York 3.5-Ton Recip H4DB042S06 0.58 0.20 0.01 -0.45 6.25 York 4-Ton Scroll H5DB048S06 0.60 0.20 0.02 -0.76 4.76 York 3-Ton Recip H4DB036S06 0.65 0.29 0.01 -0.78 7.29 AC10 Carrier 5-Ton Scroll 0.58 0.11 0.02 0.00 2.16 AC3-Rheem 3-Ton Scroll 0.63 0.24 0.01 -0.41 5.48 AC4-Carrier 3-Ton Scroll 0.66 0.17 0.02 -0.44 5.34 AC5-Coleman 4-Ton Scroll 0.57 0.25 0.02 -0.52 3.37 AC6-Rheem 4-Ton Scroll 0.59 0.18 0.02 0.01 4.76 AC7-Carrier 4-Ton Scroll 0.55 0.10 0.02 -0.18 2.51 AC8-Goodman 4-Ton Recip 0.61 0.04 0.03 0.09 4.49
Table 10. Normalized Stalling Curve Parameters
AC Name k(1)_P(stall) k(2)_P(stall) k(1)_Q(stall) k(2)_Q(stall)
Carrier 3-Ton Recip 38TKB036 2.13 1.90 0.23 3.95 Payne 3-Ton Scroll PA12NA036 1.71 2.93 -1.96 5.13 Trane 3-Ton Recip 2TTB0036A 2.20 3.33 -0.10 4.41 York 3.5-Ton Recip H4DB042S06 2.33 1.98 0.12 3.89 York 4-Ton Scroll H5DB048S06 2.40 1.83 0.28 3.99 York 3-Ton Recip H4DB036S06 1.42 3.18 -3.24 7.16 AC10-Carrier 5-Ton Scroll 0.49 3.98 -0.93 4.04 AC3-Rheem 3-Ton Scroll 1.30 2.69 -0.11 3.39 AC4-Carrier 3-Ton Scroll 1.68 2.10 0.87 2.55 AC5-Coleman 4-Ton Scroll 1.89 2.61 -0.14 4.61 AC6-Rheem 4-Ton Scroll 1.29 2.64 -0.21 3.29 AC7-Carrier 4-Ton Scroll 1.70 3.24 -0.38 4.08
AC8-Goodman 4-Ton Recip 0.94 3.01 -0.27 3.32
19
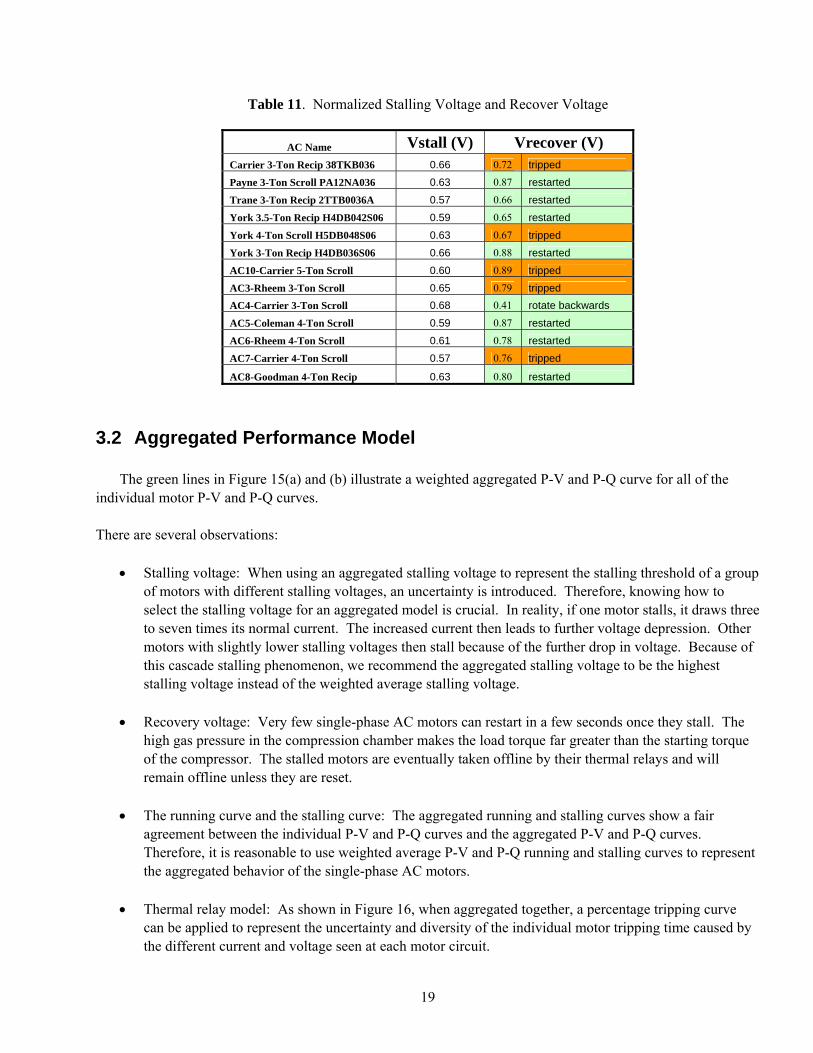
Table 11. Normalized Stalling Voltage and Recover Voltage
AC Name Vstall (V) Vrecover (V) Carrier 3-Ton Recip 38TKB036 0.66 0.72 tripped Payne 3-Ton Scroll PA12NA036 0.63 0.87 restarted
Trane 3-Ton Recip 2TTB0036A 0.57 0.66 restarted
York 3.5-Ton Recip H4DB042S06 0.59 0.65 restarted
York 4-Ton Scroll H5DB048S06 0.63 0.67 tripped
York 3-Ton Recip H4DB036S06 0.66 0.88 restarted
AC10-Carrier 5-Ton Scroll 0.60 0.89 tripped AC3-Rheem 3-Ton Scroll 0.65 0.79 tripped AC4-Carrier 3-Ton Scroll 0.68 0.41 rotate backwards
AC5-Coleman 4-Ton Scroll 0.59 0.87 restarted
AC6-Rheem 4-Ton Scroll 0.61 0.78 restarted AC7-Carrier 4-Ton Scroll 0.57 0.76 tripped
AC8-Goodman 4-Ton Recip 0.63 0.80 restarted
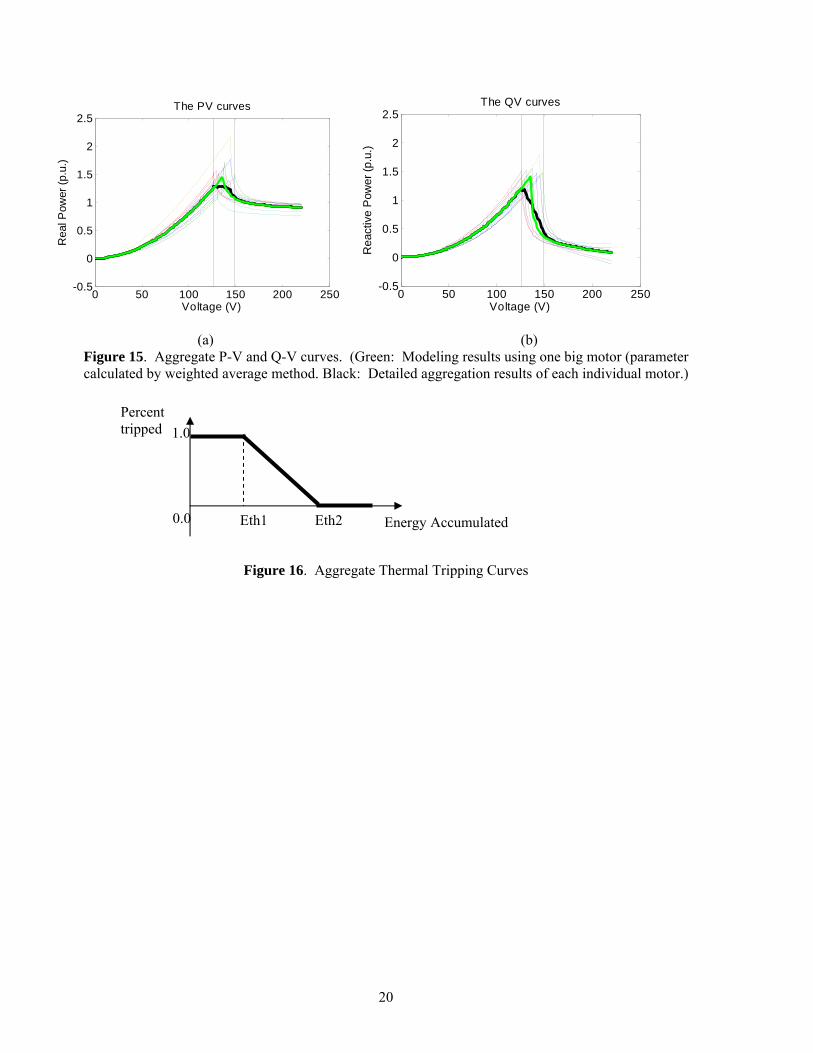
3.2 Aggregated Performance Model The green lines in Figure 15(a) and (b) illustrate a weighted aggregated P-V and P-Q curve for all of the individual motor P-V and P-Q curves. There are several observations:
• Stalling voltage: When using an aggregated stalling voltage to represent the stalling threshold of a group of motors with different stalling voltages, an uncertainty is introduced. Therefore, knowing how to select the stalling voltage for an aggregated model is crucial. In reality, if one motor stalls, it draws three to seven times its normal current. The increased current then leads to further voltage depression. Other motors with slightly lower stalling voltages then stall because of the further drop in voltage. Because of this cascade stalling phenomenon, we recommend the aggregated stalling voltage to be the highest stalling voltage instead of the weighted average stalling voltage.
• Recovery voltage: Very few single-phase AC motors can restart in a few seconds once they stall. The
high gas pressure in the compression chamber makes the load torque far greater than the starting torque of the compressor. The stalled motors are eventually taken offline by their thermal relays and will remain offline unless they are reset.
• The running curve and the stalling curve: The aggregated running and stalling curves show a fair
agreement between the individual P-V and P-Q curves and the aggregated P-V and P-Q curves. Therefore, it is reasonable to use weighted average P-V and P-Q running and stalling curves to represent the aggregated behavior of the single-phase AC motors.
• Thermal relay model: As shown in Figure 16, when aggregated together, a percentage tripping curve
can be applied to represent the uncertainty and diversity of the individual motor tripping time caused by the different current and voltage seen at each motor circuit.
20
(a) (b) Figure 15. Aggregate P-V and Q-V curves. (Green: Modeling results using one big motor (parameter calculated by weighted average method. Black: Detailed aggregation results of each individual motor.)
Figure 16. Aggregate Thermal Tripping Curves
0 50 100 150 200 250-0.5
0
0.5
1
1.5
2
2.5
Voltage (V)
Rea
ctiv
e P
ower
(p.u
.)
The QV curves
0 50 100 150 200 250-0.5
0
0.5
1
1.5
2
2.5
Voltage (V)
Rea
l Pow
er (p
.u.)
The PV curves
Percent tripped
Energy Accumulated Eth1 Eth2
1.0
0.0

21
4.0 References
Yinger R, R Bravo, and D Martinez. 2006 Air Conditioner Stalling Effects Study/Air Conditioner Testing Procedures. Southern California Edison, Rosemead, California.
Bravo, R, R Yinger, and L Gaillac. 2006. Conditioner Stalling Unit Level Solutions Test Report. Southern California Edison, Rosemead, California.
Kosterev, D. 2007. LMTF 2007-02 - AC Unit Model Specifications. LMTF document, Bonneville Power Administration, Vancouver, Washington.
Lu N and Z Huang. 2008. WECC Air Conditioner Load Model Performance Model Specifications. PNNL-16355, Pacific Northwest National Laboratory, Richland, Washington.
Lu N and HA Qiao. 2007. Composite Load Model Evaluation. PNNL-16916, Pacific Northwest National Laboratory, Richland, Washington.
Lu N, B Yang and Z Huang. 2008a. Evaluation of Southern California Edison Air-Conditioner Stalling Solutions. PNNL-17686, Pacific Northwest National Laboratory, Richland, Washington.
Lu N, B Yang, Z Huang, R Bravo, and D Kosterev. 2008b. The System Impact of Air Conditioner Under-voltage Protection Schemes. PNNL-61885, Pacific Northwest National Laboratory, Richland, Washngton.
22
Appendix A
Curve-Fitting Plots for BPA-Tested Motors

23
123F
80F
115F
80F
115F
95F
92F
73F
95F

24
Figure A.1. Original Test Results (black) and Filtered P (red)/Q (green) at Ramp-Down (left) and the P-V/Q-V Curves (right) of all Files (see Table 1) for the Seven Air-Conditioners (ACs) Used (from top
to bottom, AC name is displayed in the plot title)
85F
115F
85F
115F

25
Figure A.2. Normalized Filtered P-V/Q-V at Three Temperatures (left) and Simulated P-V/Q-V (right) at Several Temperatures Between 80oF and 115oF for the Payne 3-Ton Scroll PA12NA036 (red: ramp-down P-V; magenta: ramp-up P-V; blue: ramp-down Q-V; cyan: ramp-up Q-V)
26
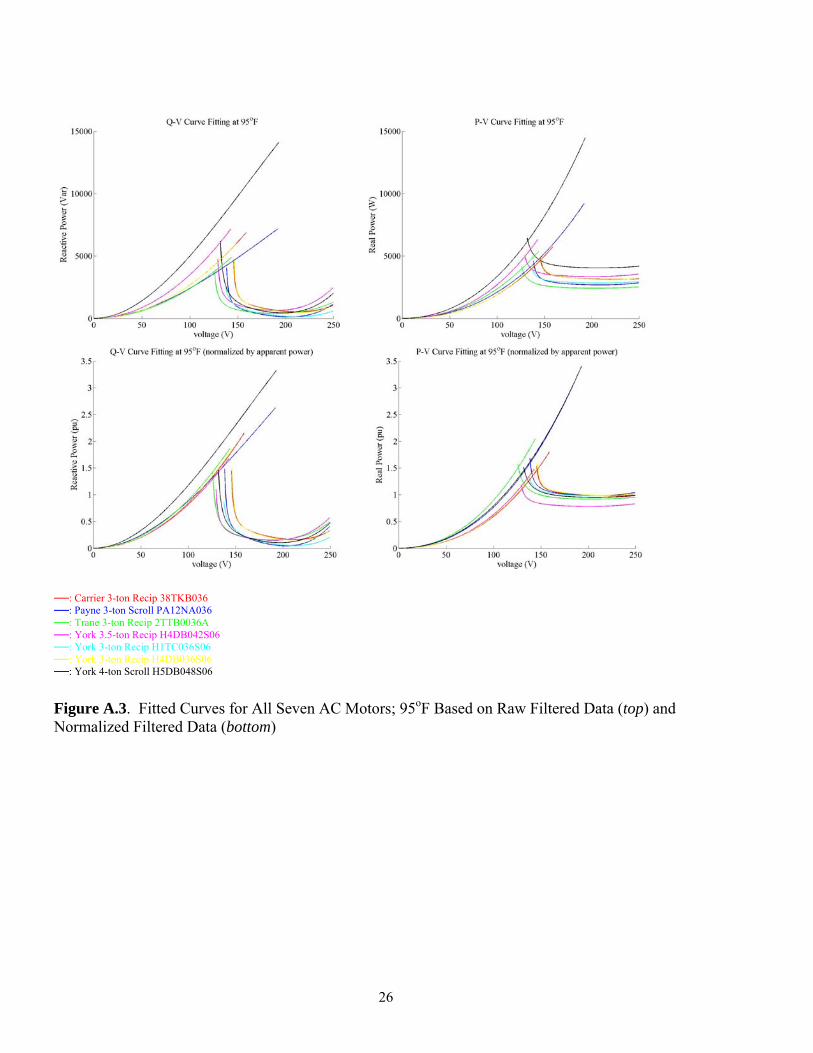
Figure A.3. Fitted Curves for All Seven AC Motors; 95oF Based on Raw Filtered Data (top) and Normalized Filtered Data (bottom)
──: Carrier 3-ton Recip 38TKB036 ──: Payne 3-ton Scroll PA12NA036 ──: Trane 3-ton Recip 2TTB0036A ──: York 3.5-ton Recip H4DB042S06 ──: York 3-ton Recip H1TC036S06 ──: York 3-ton Recip H4DB036S06 ──: York 4-ton Scroll H5DB048S06

27
Figure A.4. Comparison of the Reconstructed P/Q Voltage-Oscillation Time Series Using the Optimal Curve-Fitting Parameters (red: P and blue: Q) with the Test Data Measured (magenta: P and black Q)

28
Appendix B
Curve-Fitting Plots and Tables for SCE-Tested Motors

29

30
Figure B.1. Original Test Results (black) and Filtered P (left), Q (middle) and V (right) Time Series at Temperatures of 80°F (red), 100°F (blue) and 115°F (green) for the 7 Air
Conditioners (ACs) Used (from top to bottom, AC name is displayed in the plot title)

31
Figure B.2. Raw Filtered P-V and Q-V at Three Temperatures (panel 1) and Interpolated P-V (panel 2), Q-V (panel 3), and P-V/Q-V together (panel 4) at Several Temperatures Between 80oF and 115oF for the 7 ACs Used (from top to bottom) (red: ramp-down P-V; magenta: ramp-up P-V; blue: ramp-down Q-V; cyan: ramp-up Q-V)
80°F
115°F
80°F
115°F115°F
80°F
P Q

32
Figure B.3. Normalized Filtered P-V and Q-V at Three Temperatures (panel 1) and Interpolated Normalized P-V (panel 2), Q-V (panel 3), and P-V/Q-V Together (panel 4) at Several Temperatures Between 80oF and 115oF for the 7 ACs Used (from top to bottom) (red: ramp-down P-V; magenta: ramp-up P-V; blue: ramp-down Q-V; cyan: ramp-up Q-V)
80°F
115°F
80°F
115°F
115°F
80°F
P Q

33
80oF
100°F
115°F
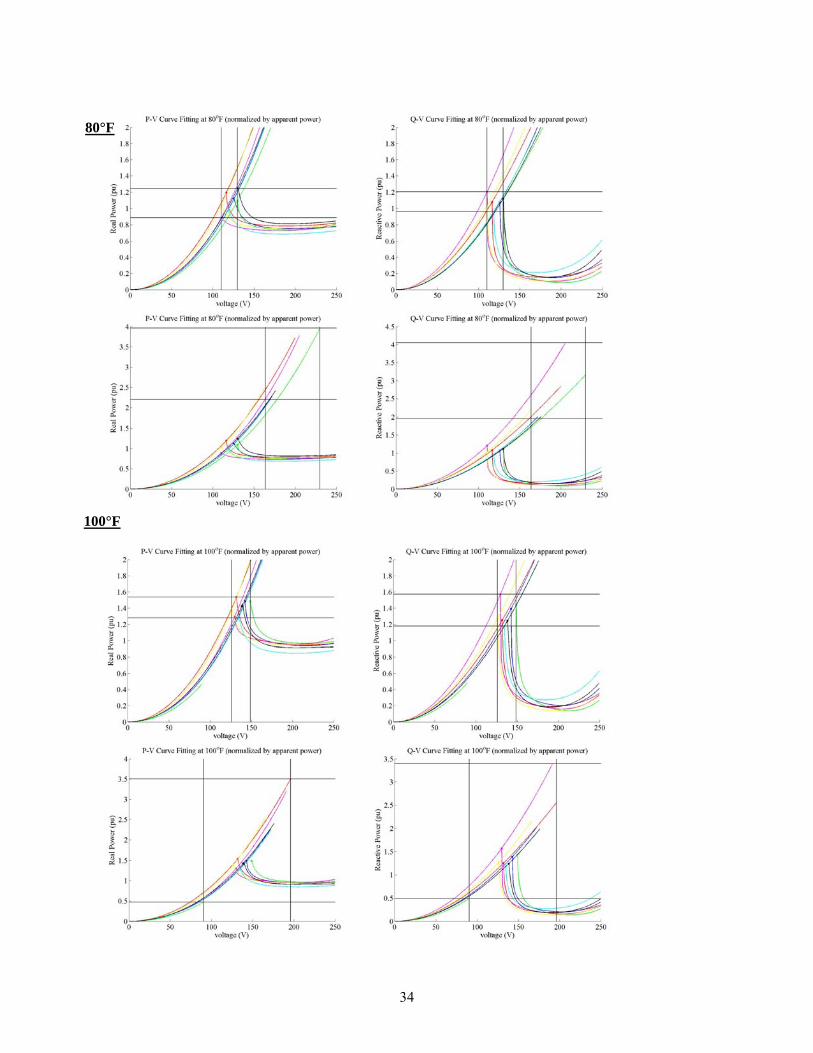
Figure B.4. Fitted P-V/Q-V Curves of All 7 AC Motors at Three Temperatures Based on Raw Filtered Data
──: AC 10 ──: AC 3 ──: AC 4 ──: AC 5 ──: AC 6 ──: AC 7 ──: AC 8
34
100°F
80°F

35
115°F
Figure B.5. Fitted P-V/Q-V Curves of All AC Motors at Three Temperatures Based on Normalized Filtered Data Table B.2. Optimal Parameters for Curve-Fitting P-V and Q-V Curves on Raw Filtered Data at 80oF
P-V Rampdown Rampup AC b(0)_P(run) b(1)_P(run) b(2)_P(run) b(3)_P(run) b(4)_P(run) k(1)_P(rec) k(2)_P(rec)
AC10 1.095E+02 4.367E+03 1.567E+04 9.737E-01 7.095E-07 3.560E-04 4.825E-01 AC3 1.144E+02 2.471E+03 2.278E+04 3.527E+00 6.601E-08 5.426E-04 2.175E-01 AC4 1.233E+02 2.484E+03 7.972E+03 6.191E-02 1.012E-06 3.636E-04 1.826E-01 AC5 9.847E+01 3.486E+03 1.101E+04 -8.683E-01 1.097E-06 8.899E-04 2.608E-01 AC6 1.052E+02 2.843E+03 3.011E+04 4.157E+00 3.118E-07 6.911E-04 2.785E-01 AC7 9.634E+01 2.674E+03 2.603E+04 4.117E+00 9.714E-08 7.178E-04 2.938E-01 AC8 1.216E+02 3.044E+03 2.339E+04 4.199E+00 2.665E-07 4.291E-04 2.775E-01
Q-V Rampdown Rampup AC b(0)_Q(run) b(1)_Q(run) b(2)_Q(run) b(3)_Q(run) b(4)_Q(run) k(1)_Q(rec) k(2)_Q(rec)
AC10 1.117E+02 5.816E+02 1.805E+04 -1.061E-01 3.457E-06 -5.978E-04 5.419E-01 AC3 1.211E+02 5.291E+02 1.442E+04 -3.493E+00 4.791E-06 1.125E-05 2.723E-01 AC4 1.258E+02 4.631E+02 8.911E+03 -5.360E+00 4.002E-06 -2.168E-04 2.625E-01 AC5 1.039E+02 7.395E+02 1.694E+04 -7.135E+00 3.501E-06 -1.484E-04 5.031E-01 AC6 1.126E+02 5.558E+02 2.185E+04 1.568E+00 6.354E-06 -1.156E-04 3.705E-01 AC7 1.033E+02 5.700E+01 2.420E+04 4.359E-01 1.988E-06 -2.503E-04 3.985E-01 AC8 1.261E+02 4.209E+02 1.737E+04 -1.980E+00 8.232E-06 -1.224E-04 3.153E-01
V critical Rampdown Rampup
AC peak_V(run) peak_V(rec) AC10 1.164E+02 2.009E+02 AC3 1.257E+02 1.721E+02 AC4 1.300E+02 2.300E+02 AC5 1.104E+02 2.057E+02 AC6 1.185E+02 1.700E+02 AC7 1.105E+02 1.638E+02 AC8 1.301E+02 1.769E+02

36
Tab;le B.2. Continued At 100oF
P-V Rampdown Rampup AC b(0)_P(run) b(1)_P(run) b(2)_P(run) b(3)_P(run) b(4)_P(run) k(1)_P(rec) k(2)_P(rec)
AC10 1.242E+02 5.138E+03 2.944E+04 1.394E+00 7.169E-07 2.724E-04 4.882E-01 AC3 1.356E+02 3.629E+03 1.414E+04 -1.079E+00 1.563E-06 4.918E-04 2.241E-01 AC4 1.416E+02 3.111E+03 1.604E+04 9.956E-01 1.061E-06 5.621E-04 1.546E-01 AC5 1.248E+02 4.971E+03 5.982E+03 -5.754E+00 3.232E-06 8.764E-04 2.662E-01 AC6 1.250E+02 3.803E+03 2.871E+04 2.683E+00 8.942E-07 6.285E-04 2.832E-01 AC7 1.162E+02 3.612E+03 2.575E+04 2.853E+00 3.331E-07 6.998E-04 2.936E-01 AC8 1.303E+02 3.295E+03 2.929E+04 6.187E+00 -5.167E-07 3.986E-04 2.812E-01
Q-V Rampdown Rampup AC b(0)_Q(run) b(1)_Q(run) b(2)_Q(run) b(3)_Q(run) b(4)_Q(run) k(1)_Q(rec) k(2)_Q(rec)
AC10 1.275E+02 6.632E+02 2.427E+04 3.750E-02 5.481E-06 -5.162E-04 4.956E-01 AC3 1.386E+02 9.528E+02 1.197E+04 -7.447E+00 9.430E-06 -4.287E-05 2.819E-01 AC4 1.454E+02 6.018E+02 1.350E+04 -7.112E+00 8.097E-06 2.889E-04 1.875E-01 AC5 1.243E+02 1.218E+03 1.722E+04 -1.164E+01 7.084E-06 -6.569E-05 4.691E-01 AC6 1.302E+02 9.307E+02 2.110E+04 2.054E-01 1.058E-05 -1.045E-04 3.531E-01 AC7 1.213E+02 4.373E+02 2.237E+04 -3.631E+00 4.711E-06 -1.554E-04 3.700E-01 AC8 1.339E+02 1.889E+02 2.517E+04 1.836E+00 8.670E-06 -1.147E-04 3.100E-01
V critical Rampdown Rampup
AC peak_V(run) peak_V(rec) AC10 1.320E+02 1.960E+02 AC3 1.426E+02 1.728E+02 AC4 1.489E+02 9.049E+01 AC5 1.297E+02 1.915E+02 AC6 1.345E+02 1.723E+02 AC7 1.262E+02 1.664E+02 AC8 1.384E+02 1.769E+02
At 115oF
P-V Rampdown Rampup AC b(0)_P(run) b(1)_P(run) b(2)_P(run) b(3)_P(run) b(4)_P(run) k(1)_P(rec) k(2)_P(rec)
AC10 1.324E+02 4.696E+03 7.797E+04 1.463E+01 -2.745E-06 7.063E-04 4.199E-01 AC3 1.398E+02 3.013E+03 5.306E+04 1.218E+01 -3.227E-06 4.741E-04 2.265E-01 AC4 1.595E+02 3.881E+03 1.679E+04 1.065E+00 8.984E-07 5.642E-04 1.533E-01 AC5 1.383E+02 5.588E+03 2.892E+04 1.559E+00 5.239E-07 8.834E-04 2.678E-01 AC6 1.360E+02 3.893E+03 5.376E+04 1.025E+01 -1.361E-06 5.128E-04 2.981E-01 AC7 1.323E+02 4.503E+03 2.445E+04 1.356E+00 7.301E-07 5.578E-04 3.110E-01 AC8 1.438E+02 4.183E+03 1.740E+04 1.209E+00 1.215E-06 4.525E-04 2.727E-01
Q-V Rampdown Rampup AC b(0)_Q(run) b(1)_Q(run) b(2)_Q(run) b(3)_Q(run) b(4)_Q(run) k(1)_Q(rec) k(2)_Q(rec)
AC10 1.394E+02 2.358E+02 4.312E+04 6.743E+00 5.137E-06 -2.339E-04 4.354E-01 AC3 1.468E+02 1.684E+02 3.564E+04 4.190E+00 4.957E-06 -4.772E-05 2.868E-01 AC4 1.625E+02 8.868E+02 1.367E+04 -9.776E+00 1.554E-05 4.158E-04 1.793E-01 AC5 1.432E+02 1.481E+03 2.636E+04 -1.313E+01 1.212E-05 6.504E-05 4.273E-01 AC6 1.424E+02 6.413E+02 3.641E+04 6.822E+00 1.151E-05 -4.148E-04 3.914E-01 AC7 1.363E+02 8.539E+02 1.938E+04 -8.176E+00 9.311E-06 -4.298E-04 3.905E-01 AC8 1.453E+02 6.292E+02 1.697E+04 -1.412E+00 1.389E-05 -5.481E-05 2.975E-01
V critical Rampdown Rampup
AC peak_V(run) peak_V(rec) AC10 1.444E+02 1.639E+02 AC3 1.530E+02 1.776E+02 AC4 1.655E+02 9.065E+01 AC5 1.471E+02 1.739E+02 AC6 1.481E+02 1.805E+02 AC7 1.398E+02 1.698E+02 AC8 1.480E+02 1.678E+02

37
Tab;le B.2. Continued At 80oF
P-V Rampdown Rampup AC b(0)_P(run) b(1)_P(run) b(2)_P(run) b(3)_P(run) b(4)_P(run) k(1)_P(rec) k(2)_P(rec)
AC10 1.095E+02 7.353E-01 2.639E+00 1.640E-04 1.195E-10 5.994E-08 8.125E-05 AC3 1.144E+02 6.130E-01 5.651E+00 8.749E-04 1.637E-11 1.346E-07 5.396E-05 AC4 1.233E+02 6.990E-01 2.243E+00 1.741E-05 2.847E-10 1.023E-07 5.137E-05 AC5 9.847E+01 7.071E-01 2.233E+00 -1.762E-04 2.225E-10 1.805E-07 5.291E-05 AC6 1.052E+02 5.466E-01 5.788E+00 7.992E-04 5.994E-11 1.329E-07 5.355E-05 AC7 9.634E+01 6.088E-01 5.925E+00 9.371E-04 2.211E-11 1.634E-07 6.689E-05 AC8 1.216E+02 6.731E-01 5.171E+00 9.283E-04 5.892E-11 9.488E-08 6.134E-05
Q-V Rampdown Rampup AC b(0)_Q(run) b(1)_Q(run) b(2)_Q(run) b(3)_Q(run) b(4)_Q(run) k(1)_Q(rec) k(2)_Q(rec)
AC10 1.117E+02 9.793E-02 3.039E+00 -1.786E-05 5.821E-10 -1.007E-07 9.125E-05 AC3 1.211E+02 1.313E-01 3.576E+00 -8.665E-04 1.189E-09 2.790E-09 6.754E-05 AC4 1.258E+02 1.303E-01 2.507E+00 -1.508E-03 1.126E-09 -6.101E-08 7.387E-05 AC5 1.039E+02 1.500E-01 3.437E+00 -1.447E-03 7.102E-10 -3.010E-08 1.021E-04 AC6 1.126E+02 1.069E-01 4.201E+00 3.015E-04 1.222E-09 -2.223E-08 7.123E-05 AC7 1.033E+02 1.298E-02 5.508E+00 9.923E-05 4.525E-10 -5.697E-08 9.072E-05 AC8 1.261E+02 9.307E-02 3.840E+00 -4.378E-04 1.820E-09 -2.706E-08 6.971E-05
V critical Rampdown Rampup
AC peak_V(run) peak_V(rec) AC10 1.164E+02 2.009E+02 AC3 1.257E+02 1.721E+02 AC4 1.300E+02 2.300E+02 AC5 1.104E+02 2.057E+02 AC6 1.185E+02 1.700E+02 AC7 1.105E+02 1.638E+02 AC8 1.301E+02 1.769E+02
At 100oF
P-V Rampdown Rampup AC b(0)_P(run) b(1)_P(run) b(2)_P(run) b(3)_P(run) b(4)_P(run) k(1)_P(rec) k(2)_P(rec)
AC10 1.242E+02 8.652E-01 4.957E+00 2.348E-04 1.207E-10 4.587E-08 8.220E-05 AC3 1.356E+02 9.004E-01 3.509E+00 -2.676E-04 3.877E-10 1.220E-07 5.560E-05 AC4 1.416E+02 8.753E-01 4.514E+00 2.801E-04 2.987E-10 1.582E-07 4.349E-05
AC5 1.248E+02 1.008E+00 1.214E+00 -1.167E-03 6.556E-10 1.778E-07 5.400E-05 AC6 1.250E+02 7.312E-01 5.520E+00 5.158E-04 1.719E-10 1.208E-07 5.445E-05 AC7 1.162E+02 8.222E-01 5.863E+00 6.494E-04 7.582E-11 1.593E-07 6.684E-05 AC8 1.303E+02 7.285E-01 6.476E+00 1.368E-03 -1.142E-10 8.812E-08 6.217E-05
Q-V Rampdown Rampup AC b(0)_Q(run) b(1)_Q(run) b(2)_Q(run) b(3)_Q(run) b(4)_Q(run) k(1)_Q(rec) k(2)_Q(rec)
AC10 1.275E+02 1.117E-01 4.087E+00 6.314E-06 9.230E-10 -8.693E-08 8.345E-05 AC3 1.386E+02 2.364E-01 2.970E+00 -1.847E-03 2.339E-09 -1.063E-08 6.994E-05 AC4 1.454E+02 1.693E-01 3.797E+00 -2.001E-03 2.278E-09 8.129E-08 5.276E-05 AC5 1.243E+02 2.470E-01 3.493E+00 -2.361E-03 1.437E-09 -1.333E-08 9.517E-05 AC6 1.302E+02 1.789E-01 4.056E+00 3.951E-05 2.034E-09 -2.009E-08 6.789E-05 AC7 1.213E+02 9.954E-02 5.092E+00 -8.265E-04 1.072E-09 -3.537E-08 8.422E-05 AC8 1.339E+02 4.176E-02 5.564E+00 4.058E-04 1.917E-09 -2.536E-08 6.853E-05
V critical Rampdown Rampup
AC peak_V(run) peak_V(rec) AC10 1.320E+02 1.960E+02 AC3 1.426E+02 1.728E+02 AC4 1.489E+02 9.049E+01 AC5 1.297E+02 1.915E+02 AC6 1.345E+02 1.723E+02 AC7 1.262E+02 1.664E+02 AC8 1.384E+02 1.769E+02
38
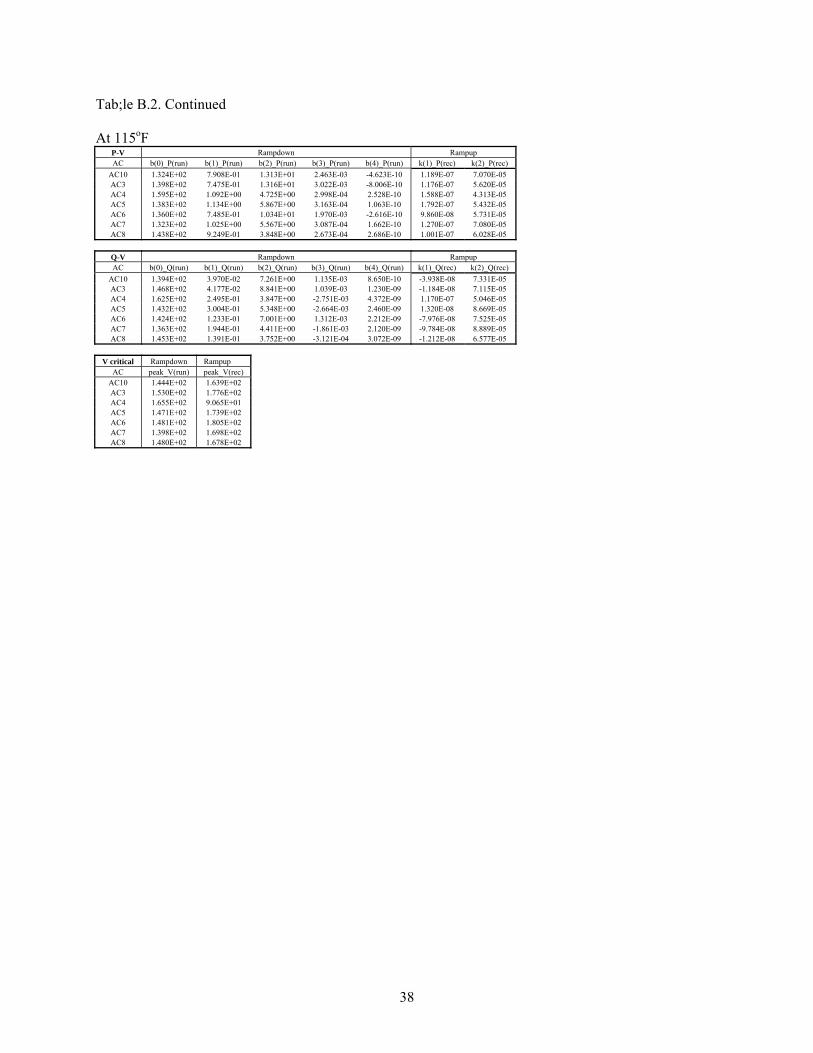
Tab;le B.2. Continued At 115oF
P-V Rampdown Rampup AC b(0)_P(run) b(1)_P(run) b(2)_P(run) b(3)_P(run) b(4)_P(run) k(1)_P(rec) k(2)_P(rec)
AC10 1.324E+02 7.908E-01 1.313E+01 2.463E-03 -4.623E-10 1.189E-07 7.070E-05 AC3 1.398E+02 7.475E-01 1.316E+01 3.022E-03 -8.006E-10 1.176E-07 5.620E-05 AC4 1.595E+02 1.092E+00 4.725E+00 2.998E-04 2.528E-10 1.588E-07 4.313E-05 AC5 1.383E+02 1.134E+00 5.867E+00 3.163E-04 1.063E-10 1.792E-07 5.432E-05 AC6 1.360E+02 7.485E-01 1.034E+01 1.970E-03 -2.616E-10 9.860E-08 5.731E-05 AC7 1.323E+02 1.025E+00 5.567E+00 3.087E-04 1.662E-10 1.270E-07 7.080E-05 AC8 1.438E+02 9.249E-01 3.848E+00 2.673E-04 2.686E-10 1.001E-07 6.028E-05
Q-V Rampdown Rampup AC b(0)_Q(run) b(1)_Q(run) b(2)_Q(run) b(3)_Q(run) b(4)_Q(run) k(1)_Q(rec) k(2)_Q(rec)
AC10 1.394E+02 3.970E-02 7.261E+00 1.135E-03 8.650E-10 -3.938E-08 7.331E-05 AC3 1.468E+02 4.177E-02 8.841E+00 1.039E-03 1.230E-09 -1.184E-08 7.115E-05 AC4 1.625E+02 2.495E-01 3.847E+00 -2.751E-03 4.372E-09 1.170E-07 5.046E-05 AC5 1.432E+02 3.004E-01 5.348E+00 -2.664E-03 2.460E-09 1.320E-08 8.669E-05 AC6 1.424E+02 1.233E-01 7.001E+00 1.312E-03 2.212E-09 -7.976E-08 7.525E-05 AC7 1.363E+02 1.944E-01 4.411E+00 -1.861E-03 2.120E-09 -9.784E-08 8.889E-05 AC8 1.453E+02 1.391E-01 3.752E+00 -3.121E-04 3.072E-09 -1.212E-08 6.577E-05
V critical Rampdown Rampup
AC peak_V(run) peak_V(rec) AC10 1.444E+02 1.639E+02 AC3 1.530E+02 1.776E+02 AC4 1.655E+02 9.065E+01 AC5 1.471E+02 1.739E+02 AC6 1.481E+02 1.805E+02 AC7 1.398E+02 1.698E+02 AC8 1.480E+02 1.678E+02

Task I: Air-Conditioner Modeling
39
39
Table B.3. Parameters of Second-Order Polynomial Fitting on Curve-Fitting Parameters of the Three Temperatures Based on Raw Filtered Data
AC polynomial Rampdown P-V Rampdown Q-V Rampup P-V Rampup Q-V Critical V
index parameter b(0) b(1) b(2) b(3) b(4) b(0) b(1) b(2) b(3) b(4) k(1) k(2) k(1) k(2) Rampdown Rampup
AC10 P0 7.39E+00 -1.43E+04 5.43E+05 1.96E+02 -5.22E-05 4.95E+01 -7.19E+03 2.09E+05 9.99E+01 -3.30E-05 8.26E-03 -6.46E-01 2.45E-03 3.40E-01 6.60E+01 -2.14E+02
AC10 P1 1.71E+00 3.89E+02 -1.24E+04 -4.41E+00 1.19E-06 7.70E-01 1.72E+02 -4.55E+03 -2.25E+00 7.40E-07 -1.74E-04 2.52E-02 -7.18E-05 6.39E-03 5.14E-01 9.53E+00
AC10 P2 -5.40E-03 -1.94E+00 7.28E+01 2.46E-02 -6.61E-09 1.06E-04 -9.31E-01 2.70E+01 1.26E-02 -3.55E-09 9.46E-07 -1.38E-04 4.21E-07 -4.84E-05 1.46E-03 -5.43E-02
AC3 P0 -1.48E+02 -2.48E+04 7.49E+05 2.77E+02 -9.60E-05 -2.38E+01 -1.80E+04 4.13E+05 2.35E+02 -1.35E-04 1.06E-03 1.53E-01 7.72E-04 1.98E-01 2.23E+01 2.34E+02
AC3 P1 5.06E+00 5.67E+02 -1.60E+04 -5.96E+00 2.10E-06 2.56E+00 3.99E+02 -8.87E+03 -5.20E+00 2.96E-06 -9.53E-06 1.20E-03 -1.50E-05 1.29E-03 1.65E+00 -1.42E+00
AC3 P2 -2.23E-02 -2.83E+00 8.65E+01 3.18E-02 -1.13E-08 -9.37E-03 -2.10E+00 4.86E+01 2.78E-02 -1.51E-08 3.88E-08 -4.81E-06 6.81E-08 -4.50E-06 -4.44E-03 8.09E-03
AC4 P0 1.13E+02 4.54E+03 -1.05E+05 -1.33E+01 -2.24E-06 8.33E+01 2.67E+03 -5.91E+04 -1.89E+01 5.42E-05 -2.67E-03 5.94E-01 -6.09E-03 1.30E+00 9.13E+01 2.39E+03
AC4 P1 -4.94E-01 -7.14E+01 2.22E+03 2.63E-01 7.11E-08 1.71E-01 -5.51E+01 1.35E+03 3.75E-01 -1.29E-06 6.03E-05 -8.15E-03 1.12E-04 -2.03E-02 1.16E-01 -4.29E+01
AC4 P2 7.82E-03 5.71E-01 -1.01E+01 -1.20E-03 -3.81E-10 4.50E-03 3.45E-01 -6.21E+00 -2.57E-03 8.32E-09 -2.80E-07 3.75E-05 -4.81E-07 9.17E-05 4.60E-03 2.00E-01
AC5 P0 -1.04E+02 -1.00E+04 4.38E+05 1.86E+02 -7.31E-05 7.64E+01 -2.63E+03 1.52E+05 3.96E+01 2.50E-05 1.21E-03 2.02E-01 5.68E-04 3.91E-01 7.79E+01 1.57E+02
AC5 P1 3.49E+00 2.44E+02 -9.41E+03 -4.01E+00 1.58E-06 -1.99E-01 5.66E+01 -3.05E+03 -8.71E-01 -6.27E-07 -6.56E-06 1.10E-03 -1.94E-05 3.89E-03 -3.80E-02 1.65E+00
AC5 P2 -1.21E-02 -9.46E-01 5.09E+01 2.09E-02 -8.21E-09 6.78E-03 -1.82E-01 1.70E+01 3.59E-03 4.48E-09 3.27E-08 -4.64E-06 1.31E-07 -3.11E-05 5.56E-03 -1.31E-02
AC6 P0 -3.25E+01 -1.06E+04 4.33E+05 1.42E+02 -4.30E-05 2.60E+01 -9.64E+03 2.67E+05 1.23E+02 -4.48E-05 -1.07E-04 4.33E-01 -5.02E-03 1.22E+00 7.74E+01 2.60E+02
AC6 P1 2.31E+00 2.64E+02 -9.01E+03 -3.05E+00 9.52E-07 1.25E+00 2.14E+02 -5.48E+03 -2.69E+00 9.81E-07 2.05E-05 -3.67E-03 1.10E-04 -1.85E-02 2.80E-01 -2.11E+00
AC6 P2 -7.30E-03 -1.20E+00 4.97E+01 1.65E-02 -5.13E-09 -2.03E-03 -1.09E+00 3.02E+01 1.45E-02 -4.28E-09 -1.31E-07 2.17E-05 -6.07E-07 9.77E-05 2.91E-03 1.24E-02
AC7 P0 3.59E+01 1.79E+03 1.05E+04 8.06E-01 2.51E-06 5.40E+01 5.38E+02 6.76E+03 -6.08E+00 3.01E-05 -1.17E-03 5.62E-01 -5.90E-03 1.15E+00 7.57E+01 1.74E+02
AC7 P1 5.67E-01 -1.76E+01 3.61E+02 1.25E-01 -6.37E-08 3.90E-01 -2.60E+01 4.65E+02 3.09E-01 -7.41E-07 4.31E-05 -6.02E-03 1.23E-04 -1.58E-02 1.55E-01 -3.42E-01
AC7 P2 2.37E-03 3.58E-01 -2.08E+00 -1.05E-03 4.19E-10 2.83E-03 2.50E-01 -3.09E+00 -2.85E-03 4.87E-09 -2.45E-07 3.34E-05 -6.58E-07 7.99E-05 3.50E-03 2.62E-03
AC8 P0 1.93E+02 1.27E+04 -2.49E+05 -1.02E+02 3.87E-05 1.81E+02 1.07E+04 -2.28E+05 -1.10E+02 8.11E-05 1.72E-03 8.99E-02 6.72E-04 2.07E-01 1.48E+02 3.77E+01
AC8 P1 -1.96E+00 -2.27E+02 5.89E+03 2.32E+00 -8.34E-07 -1.54E+00 -2.22E+02 5.21E+03 2.29E+00 -1.66E-06 -2.79E-05 4.07E-03 -1.82E-05 2.64E-03 -7.43E-01 3.13E+00
AC8 P2 1.33E-02 1.33E+00 -3.11E+01 -1.23E-02 4.42E-09 1.07E-02 1.17E+00 -2.68E+01 -1.16E-02 9.32E-09 1.46E-07 -2.16E-05 1.03E-07 -1.62E-05 6.44E-03 -1.74E-02

Task I: Air-Conditioner Modeling
40
40
Table B.4. Parameters of Second Order Polynomial Fitting on Curve-Fitting Parameters of the Three Temperatures Based on Normalized Filtered Data
AC polynomial Rampdown P-V Rampdown Q-V Rampup P-V Rampup Q-V Critical V
index parameter b(0) b(1) b(2) b(3) b(4) b(0) b(1) b(2) b(3) b(4) k(1) k(2) k(1) k(2) Rampdown Rampup
AC10 P0 7.39E+00 -2.40E+00 9.14E+01 3.30E-02 -8.78E-09 6.60E+01 4.95E+01 -1.21E+00 3.52E+01 1.68E-02 -5.56E-09 1.39E-06 -1.09E-04 -2.14E+02 4.12E-07 5.73E-05
AC10 P1 1.71E+00 6.54E-02 -2.09E+00 -7.42E-04 2.00E-10 5.14E-01 7.70E-01 2.89E-02 -7.66E-01 -3.80E-04 1.25E-10 -2.94E-08 4.24E-06 9.53E+00 -1.21E-08 1.08E-06
AC10 P2 -5.40E-03 -3.27E-04 1.23E-02 4.14E-06 -1.11E-12 1.46E-03 1.06E-04 -1.57E-04 4.55E-03 2.12E-06 -5.97E-13 1.59E-10 -2.33E-08 -5.43E-02 7.09E-11 -8.15E-09
AC3 P0 -1.48E+02 -6.15E+00 1.86E+02 6.86E-02 -2.38E-08 2.23E+01 -2.38E+01 -4.46E+00 1.02E+02 5.83E-02 -3.35E-08 2.62E-07 3.79E-05 2.34E+02 1.92E-07 4.90E-05
AC3 P1 5.06E+00 1.41E-01 -3.97E+00 -1.48E-03 5.21E-10 1.65E+00 2.56E+00 9.90E-02 -2.20E+00 -1.29E-03 7.34E-10 -2.36E-09 2.97E-07 -1.42E+00 -3.71E-09 3.21E-07
AC3 P2 -2.23E-02 -7.02E-04 2.14E-02 7.90E-06 -2.79E-12 -4.44E-03 -9.37E-03 -5.21E-04 1.21E-02 6.90E-06 -3.76E-12 9.63E-12 -1.19E-09 8.09E-03 1.69E-11 -1.12E-09
AC4 P0 1.13E+02 1.28E+00 -2.96E+01 -3.74E-03 -6.29E-10 9.13E+01 8.33E+01 7.50E-01 -1.66E+01 -5.32E-03 1.53E-08 -7.51E-07 1.67E-04 2.39E+03 -1.71E-06 3.65E-04
AC4 P1 -4.94E-01 -2.01E-02 6.25E-01 7.40E-05 2.00E-11 1.16E-01 1.71E-01 -1.55E-02 3.79E-01 1.06E-04 -3.64E-10 1.70E-08 -2.29E-06 -4.29E+01 3.15E-08 -5.70E-06
AC4 P2 7.82E-03 1.61E-04 -2.84E-03 -3.38E-07 -1.07E-13 4.60E-03 4.50E-03 9.70E-05 -1.75E-03 -7.23E-07 2.34E-12 -7.87E-11 1.06E-08 2.00E-01 -1.35E-10 2.58E-08
AC5 P0 -1.04E+02 -2.03E+00 8.89E+01 3.77E-02 -1.48E-08 7.79E+01 7.64E+01 -5.33E-01 3.09E+01 8.03E-03 5.07E-09 2.45E-07 4.10E-05 1.57E+02 1.15E-07 7.92E-05
AC5 P1 3.49E+00 4.96E-02 -1.91E+00 -8.13E-04 3.21E-10 -3.80E-02 -1.99E-01 1.15E-02 -6.19E-01 -1.77E-04 -1.27E-10 -1.33E-09 2.24E-07 1.65E+00 -3.94E-09 7.90E-07
AC5 P2 -1.21E-02 -1.92E-04 1.03E-02 4.24E-06 -1.67E-12 5.56E-03 6.78E-03 -3.69E-05 3.46E-03 7.28E-07 9.09E-13 6.63E-12 -9.42E-10 -1.31E-02 2.66E-11 -6.30E-09
AC6 P0 -3.25E+01 -2.04E+00 8.33E+01 2.73E-02 -8.27E-09 7.74E+01 2.60E+01 -1.85E+00 5.13E+01 2.37E-02 -8.60E-09 -2.06E-08 8.33E-05 2.60E+02 -9.64E-07 2.35E-04
AC6 P1 2.31E+00 5.07E-02 -1.73E+00 -5.86E-04 1.83E-10 2.80E-01 1.25E+00 4.12E-02 -1.05E+00 -5.17E-04 1.89E-10 3.93E-09 -7.06E-07 -2.11E+00 2.11E-08 -3.55E-06
AC6 P2 -7.30E-03 -2.31E-04 9.55E-03 3.17E-06 -9.86E-13 2.91E-03 -2.03E-03 -2.09E-04 5.82E-03 2.80E-06 -8.22E-13 -2.52E-11 4.17E-09 1.24E-02 -1.17E-10 1.88E-08
AC7 P0 3.59E+01 4.08E-01 2.38E+00 1.84E-04 5.71E-10 7.57E+01 5.40E+01 1.22E-01 1.54E+00 -1.38E-03 6.84E-09 -2.66E-07 1.28E-04 1.74E+02 -1.34E-06 2.62E-04
AC7 P1 5.67E-01 -4.02E-03 8.23E-02 2.85E-05 -1.45E-11 1.55E-01 3.90E-01 -5.93E-03 1.06E-01 7.04E-05 -1.69E-10 9.82E-09 -1.37E-06 -3.42E-01 2.81E-08 -3.60E-06
AC7 P2 2.37E-03 8.16E-05 -4.74E-04 -2.38E-07 9.55E-14 3.50E-03 2.83E-03 5.70E-05 -7.04E-04 -6.48E-07 1.11E-12 -5.57E-11 7.60E-09 2.62E-03 -1.50E-10 1.82E-08
AC8 P0 1.93E+02 2.81E+00 -5.50E+01 -2.26E-02 8.56E-09 1.48E+02 1.81E+02 2.37E+00 -5.04E+01 -2.44E-02 1.79E-08 3.81E-07 1.99E-05 3.77E+01 1.49E-07 4.58E-05
AC8 P1 -1.96E+00 -5.03E-02 1.30E+00 5.12E-04 -1.84E-10 -7.43E-01 -1.54E+00 -4.91E-02 1.15E+00 5.05E-04 -3.66E-10 -6.17E-09 9.00E-07 3.13E+00 -4.02E-09 5.85E-07
AC8 P2 1.33E-02 2.95E-04 -6.87E-03 -2.72E-06 9.77E-13 6.44E-03 1.07E-02 2.59E-04 -5.91E-03 -2.57E-06 2.06E-12 3.24E-11 -4.77E-09 -1.74E-02 2.28E-11 -3.58E-09