Embed Size (px)
Citation preview

AHA QCOR in CVD and Stroke 2010: AHA QCOR in CVD and Stroke 2010: Controversies in Atrial FibrillationControversies in Atrial Fibrillation
“Introduction: Contemporary “Introduction: Contemporary Epidemiology of AF, Stroke Rates, Epidemiology of AF, Stroke Rates, and the Effectiveness of Warfarin”and the Effectiveness of Warfarin”
Daniel E. Singer, MDDaniel E. Singer, MD

Presenter Disclosure InformationDaniel E. Singer, MD“Introduction: Contemporary Epidemiology of AF,
Stroke Rates, and the Effectiveness of Warfarin”
FINANCIAL DISCLOSURE:Research Grant: Daiichi Sankyo, significant.Consultant/Advisory Board: Boehringer Ingelheim, significant; Daiichi Sankyo, significant; Johnson and Johnson, modest; Medtronic, significant; Merck and Co., modest; Sanofi Aventis, modest; St. Jude Medical, modest.Honorarium/Symposium Presentation: Bristol-Myers Squibb, Pfizer, modest.Executive Committee: ROCKET-AF trial of rivaroxaban in AF.
UNLABELED/UNAPPROVED USES DISCLOSURE:None

AF: The importance of StrokeAF: The importance of Stroke
AF can cause distressing symptoms and inefficient AF can cause distressing symptoms and inefficient
cardiac function which lead to increased rates cardiac function which lead to increased rates
of hospitalization. It has been associated with of hospitalization. It has been associated with
higher mortality rates. But the most important higher mortality rates. But the most important
complication of AF is ischemic stroke.complication of AF is ischemic stroke.
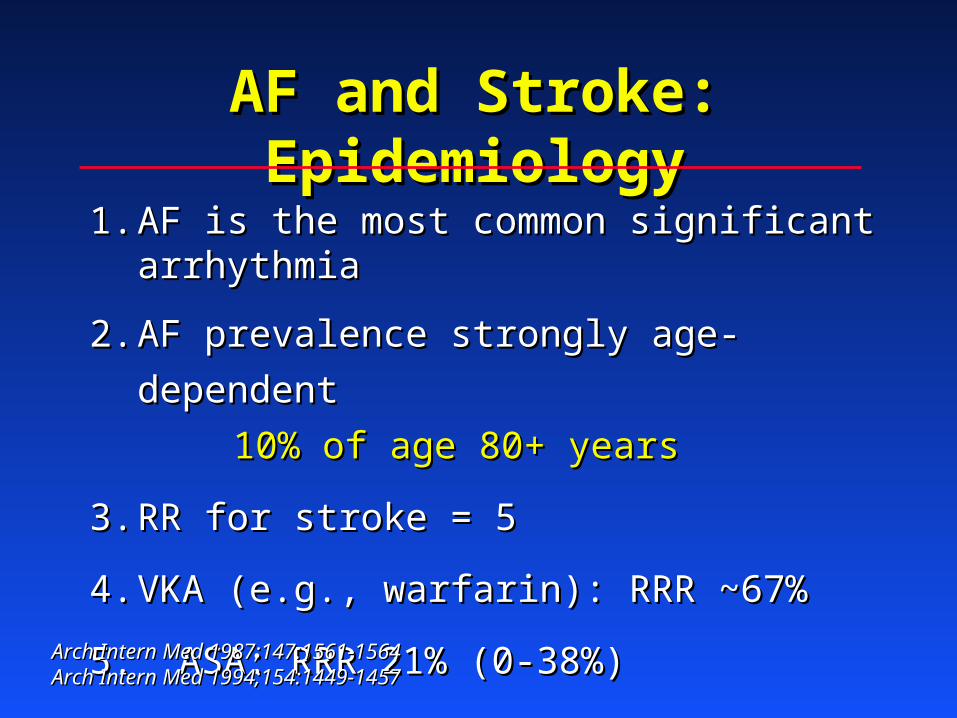
AF and Stroke: EpidemiologyAF and Stroke: Epidemiology
1.1. AF is the most common significant arrhythmiaAF is the most common significant arrhythmia
2.2. AF prevalence strongly age-dependentAF prevalence strongly age-dependent
10% of age 80+ years10% of age 80+ years
3.3. RR for stroke = 5RR for stroke = 5
4.4. VKA (e.g., warfarin): RRR ~67%VKA (e.g., warfarin): RRR ~67%
5. ASA: RRR 21% (0-38%)5. ASA: RRR 21% (0-38%)
Arch Intern Med 1987;147:1561-1564Arch Intern Med 1987;147:1561-1564Arch Intern Med 1994;154:1449-1457Arch Intern Med 1994;154:1449-1457

Prevalence of Diagnosed Prevalence of Diagnosed AF by Age and SexAF by Age and Sex
Go AS et al. JAMA 2001;285:2370–2375
<55 55–59 60–64 65–69 70–74 75–79 80–84 85
Age (years)
0
1
2
3
4
5
6
7
8
9
10
11
12
Pre
vale
nce
(%
)
WomenMen
0.1 0.20.4
0.9 1.0
1.7 1.7
3.03.4
5.0 5.0
7.3 7.2
10.3
9.1
11.1

Projected Number of Adults Projected Number of Adults with AF in the US, 1995-2050with AF in the US, 1995-2050
*JAMA. 2001;285:2370-2375
2.942.942.662.66
2.442.442.262.26
2.082.08
3.333.33
3.803.80
4.344.34
4.784.785.165.16
5.425.42 5.615.61
0.00.0
1.01.0
2.02.0
3.03.0
4.04.0
5.05.0
6.06.0
7.07.0
19901990 19951995 20002000 20052005 20102010 20152015 20202020 20252025 20302030 20352035 20402040 20452045 20502050
YearYear
Adults with Atrial Fibrillation, millions Adults with Atrial Fibrillation, millions

Lifetime Risk of Developing AF*Lifetime Risk of Developing AF*
• Lifetime risk of developing AF for Lifetime risk of developing AF for men and women ages 40 and men and women ages 40 and over*over*
Overall: about 1 in 4Overall: about 1 in 4
**Lloyd-Jones D, et al. Circulation 2004;110:1042-1046. Lloyd-Jones D, et al. Circulation 2004;110:1042-1046. Based predominantly on data from white individuals.Based predominantly on data from white individuals.

AF and Stroke: Framingham Study, 30-Year AF and Stroke: Framingham Study, 30-Year Follow-up*Follow-up*
Strokes Strokes Age Prev AF per 1000pyo per 1000pyAF RR
60-6960-69 1.8%1.8% 4.54.5 21 21 4.7 4.7 70-7970-79 4.7%4.7% 9.09.0 49 49 5.4 5.4 80-8980-89 10.2%10.2% 1414 71 71 5.0 5.0
* Wolf PA, Abbott RD, Kannel WB, Arch Intern Med 1987;147: 1561-* Wolf PA, Abbott RD, Kannel WB, Arch Intern Med 1987;147: 1561-1564; adjusted for BP1564; adjusted for BP

AF: Putative Mechanism for AF: Putative Mechanism for StrokeStroke
AFAF loss of loss of atrialatrialcontractioncontraction
LA thrombusLA thrombus embolismembolism

Left atrial appendage thrombus
LA
LAA-Thrombus
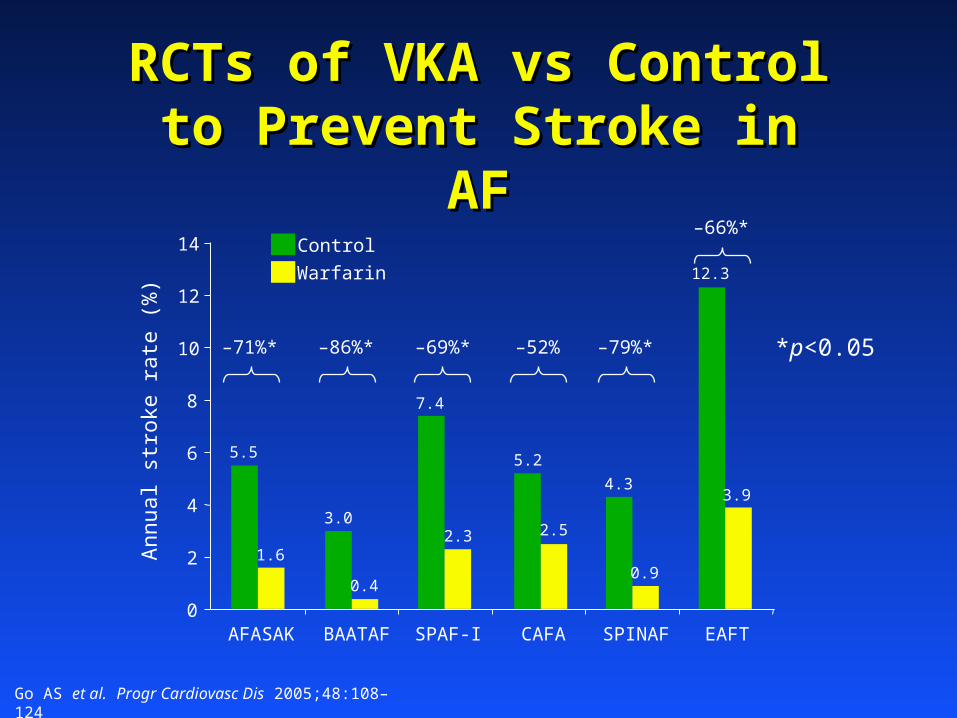
RCTs of VKA vs Control to RCTs of VKA vs Control to Prevent Stroke in AFPrevent Stroke in AF
Go AS et al. Progr Cardiovasc Dis 2005;48:108–124
*p<0.05
AFASAK BAATAF SPAF-I CAFA SPINAF EAFT
Ann
ual s
trok
e ra
te (
%)
0
2
4
6
8
10
12
14 Control
Warfarin
–71%* –86%* –69%* –52% –79%*
–66%*
5.5
1.6
3.0
0.4
7.4
2.3
5.2
2.5
4.3
0.9
12.3
3.9

Efficacy of Anticoagulation for AFEfficacy of Anticoagulation for AF
Trial Target Ranges: INR ~ 1.8-4.2Trial Target Ranges: INR ~ 1.8-4.2
RelativeRelative AbsoluteAbsolute
Risk ReductionRisk Reduction Risk ReductionRisk Reduction
Pooled 1° RCTs Pooled 1° RCTs 68%68% (50-79%) (50-79%) 3.1% 3.1% per yearper year
EAFTEAFT 66%66% (43-80%) (43-80%) 8.4% 8.4% per yearper year
Arch Intern Med 1994;154:1449-1457Arch Intern Med 1994;154:1449-1457Lancet 1993;342:1255-1262Lancet 1993;342:1255-1262

Safety of Anticoagulation for AFSafety of Anticoagulation for AF
Pooled 1° RCTsPooled 1° RCTs 0.3%0.3% per yr per yr 0.1%0.1% per yr per yr
Intracranial Hemorrhage:Intracranial Hemorrhage:
AnticoagulationAnticoagulation ControlControl
Absolute Rates ofAbsolute Rates of

Efficacy of Aspirin for AFEfficacy of Aspirin for AF
Pooled 3 trials versus placebo:Pooled 3 trials versus placebo:
AFASAKAFASAK 75 mg daily75 mg dailySPAF ISPAF I 325 mg daily325 mg dailyEAFTEAFT 300 mg daily300 mg daily
Relative Risk Reduction: Relative Risk Reduction: 21% (0-38%)21% (0-38%)No signif impact on severe/fatal strokeNo signif impact on severe/fatal stroke
*JAMA 2002;288:2441-2448 (AFASAK I &II, EAFT, PATAF, SPAF I-III)*JAMA 2002;288:2441-2448 (AFASAK I &II, EAFT, PATAF, SPAF I-III)

The Optimal INRThe Optimal INR
For an anticoagulant where toxicity results For an anticoagulant where toxicity results from an exaggeration of the beneficial effect, from an exaggeration of the beneficial effect, choosing the right “dose,” here INR, is crucial.choosing the right “dose,” here INR, is crucial.

SPAF III: INR 1.2-1.5 plus ASA SPAF III: INR 1.2-1.5 plus ASA versus INR 2.0-3.0versus INR 2.0-3.0
RRR favoring INR 2-3: 74% (50-87%)RRR favoring INR 2-3: 74% (50-87%)
No reduction in risk of ICHNo reduction in risk of ICH
Lancet 1996; 348: 633–38Lancet 1996; 348: 633–38

Figure 1b
International Normalized Ratio (INR) Level
Odd
s R
atio
s
0
1
2
3
4
5
6
7
8
9
< 1.5 1.5-1.9 2.0-2.5 2.6-3.0 3.1-3.5 ≥ 3.6
ThromboembolismIntracranial Hemorrhage
=
10.19
=
11.12
128 121 73 41 14 19TE cases
132 389 544 280 114 122TE controls
10 24 45 34 15 36ICH cases
41 144 252 119 68 41ICH controls
Circ CV Qual and Outcomes 2009;2:297-304

Antithrombotic Trials in Antithrombotic Trials in AF: Core FindingsAF: Core Findings
Anticoag. at INR 2.0-3.0 Anticoag. at INR 2.0-3.0 veryvery effective effective- - Generally safeGenerally safe- Moderately burdensome- Moderately burdensome
Aspirin is much less effectiveAspirin is much less effective

Anticoagulation for AF: For Whom?Anticoagulation for AF: For Whom?
Guideline perspective:Guideline perspective:
Anticoagulate AF patients whose risk of Anticoagulate AF patients whose risk of stroke is high enough to “merit” the burden stroke is high enough to “merit” the burden and risk of warfarin therapyand risk of warfarin therapy
ASA for othersASA for others

Pooled Analysis of AF Trials:Pooled Analysis of AF Trials:Risk Factors for Stroke*Risk Factors for Stroke*
Relative Risk (RR)Relative Risk (RR)
VariableVariable Multivariate Multivariate
Prior stroke/TIAPrior stroke/TIA 2.5 2.5
Hx HBPHx HBP 1.6 1.6
Age**Age** 1.4 1.4
Hx DiabetesHx Diabetes 1.7 1.7
**RR per decade**RR per decade
**Arch Intern Med 1994;154:1449-1457Arch Intern Med 1994;154:1449-1457

Echo Risk Factors for Stroke With AF: Pooled Echo Risk Factors for Stroke With AF: Pooled
Analysis of Control Arms of 3 RCTs*Analysis of Control Arms of 3 RCTs*
FeatureFeature RR RR p valuep value
LV dysfunctionLV dysfunction
mod-severemod-severe 3.043.04 <0.001<0.001
*Arch Intern Med 1998;158:1316-1320, univariate*Arch Intern Med 1998;158:1316-1320, univariate

CHADSCHADS22 AF Stroke Risk Score* AF Stroke Risk Score*
C = C = CCHFHF 1 point1 point
H = H = HHypertensionypertension 1 point1 point
A = A = AAge >75 yearsge >75 years 1 point1 point
D = D = DDiabetesiabetes 1 point1 point
S = Prior S = Prior SStroke/TIAtroke/TIA 2 points2 points
NB: Applies to persistent or paroxysmal AFNB: Applies to persistent or paroxysmal AF
*Gage, et al. JAMA 2001; 285(22): 2864-70*Gage, et al. JAMA 2001; 285(22): 2864-70

CHADSCHADS22 AF Stroke Risk Score AF Stroke Risk Score
CHADSCHADS22
ScoreScore
No. of No. of PatientsPatients
(n = 1733)(n = 1733)
No. of No. of StrokesStrokes
(n = 94)(n = 94)
NRAF CrudeNRAF Crude
Stroke Rate perStroke Rate per
100 Patient-100 Patient-YearsYears
00 120120 22 1.21.2
11 463463 1717 2.82.8
22 523523 2323 3.63.6
33 337337 2525 6.46.4
44 220220 1919 8.08.0
55 6565 66 7.77.7
66 55 22 44.044.0
Risk of Stroke in National Registry of Atrial Fibrillation (NRAF) Risk of Stroke in National Registry of Atrial Fibrillation (NRAF) Participants, Stratified by CHADSParticipants, Stratified by CHADS22 Score* Score*
*C=CHF, H=HBP, A=age >75, D=diabetes, S=prior stroke/TIA. Gage, et al. JAMA 2001; 285(22): 2864-70*C=CHF, H=HBP, A=age >75, D=diabetes, S=prior stroke/TIA. Gage, et al. JAMA 2001; 285(22): 2864-70

Risk of Stroke in AF: Impact of Risk of Stroke in AF: Impact of Paroxysmal AFParoxysmal AF
From pooled trialsFrom pooled trials1 (~25% had PAF) (~25% had PAF)
RR (PAF/Sust AF) = RR (PAF/Sust AF) = 0.90.9 (univar) (univar)
From ACTIVE WFrom ACTIVE W2 (18% had PAF) (18% had PAF)RR (PAF/Sust AF) = RR (PAF/Sust AF) = 0.940.94 (multivar) (multivar)
11Arch Intern Med 1994;154:1449-1457Arch Intern Med 1994;154:1449-145722JACC 2007;50:2156-61JACC 2007;50:2156-61

AF Stroke Prevention AF Stroke Prevention Guidelines*Guidelines*
Clinical ProfileClinical Profile
(Applies to PAF, as well)(Applies to PAF, as well)
Treatment Treatment RecommendationRecommendation
Prior stroke/TIA Prior stroke/TIA
(CHADS(CHADS22 ≥ ≥ 2)2)
Warfarin, INR 2-3Warfarin, INR 2-3
≥ ≥ 22 of the following RFs: of the following RFs:
CHF, HTN, age CHF, HTN, age ≥≥ 75, DM 75, DM (CHADS(CHADS22 ≥ ≥ 2)2)
Warfarin, INR 2-3Warfarin, INR 2-3
1 RF (not prior stroke)1 RF (not prior stroke)
(CHADS(CHADS22 =1=1))
ASA or warfarinASA or warfarin
0 RF0 RF
(CHADS(CHADS22 =0=0))
ASAASA
Anticoagulation recommendation assumes: 1) patient is not a bleeding risk, and Anticoagulation recommendation assumes: 1) patient is not a bleeding risk, and 2) high quality of anticoagulation will occur.2) high quality of anticoagulation will occur.
* ACCP 8 (Chest 2008; 133:546S-592S); ACC/AHA/ESC 2006 (Europace 2006;8:651-745.)* ACCP 8 (Chest 2008; 133:546S-592S); ACC/AHA/ESC 2006 (Europace 2006;8:651-745.)

Trends in Warfarin Use and Trends in Warfarin Use and Outcomes in AF patientsOutcomes in AF patients
Lakshminarayan K, et al., Atrial Fibrillation and Stroke in the General Medicare Population. Stroke 2006;37:1969-1974.

BAFTA: Warfarin vs. Aspirin in Elderly BAFTA: Warfarin vs. Aspirin in Elderly AF Patients*AF Patients*
• RCT of Warfarin, INR 2-3, vs ASA, 75mg/dRCT of Warfarin, INR 2-3, vs ASA, 75mg/d
• PopulationPopulation– N=973, age >=75: mean age = 81.5 yrsN=973, age >=75: mean age = 81.5 yrs– Recruited Apr 2001 – Nov 2004Recruited Apr 2001 – Nov 2004
*Mant JM, et al. Lancet 2007; 370: 493-503.*Mant JM, et al. Lancet 2007; 370: 493-503.

BAFTA Study OutcomesBAFTA Study Outcomes
Relative risk=0.48, (95% CI 0.28-0.80)*Relative risk=0.48, (95% CI 0.28-0.80)*
– Annual risk on warfarin = 1.8%Annual risk on warfarin = 1.8%
– Annual risk on aspirin = 3.8%Annual risk on aspirin = 3.8%
– Bleeding rates ~same on warfarin and Bleeding rates ~same on warfarin and aspirin in this elderly cohort.aspirin in this elderly cohort.
*Analysis by intention to treat*Analysis by intention to treat

Problem: The risk schemes Problem: The risk schemes are not very predictive.are not very predictive.

Percent of patients with and without Percent of patients with and without stroke by CHADSstroke by CHADS22 stroke risk score stroke risk score National Registry of Atrial Fibrillation (NRAF) cohort (n=1733) National Registry of Atrial Fibrillation (NRAF) cohort (n=1733)
0%
5%
10%
15%
20%
25%
30%
35%
0 1 2 3 4 5 6
CHADS2 Score
% o
f P
atie
nts
No Stroke
Stroke
Data from Gage et al. JAMA 2001;285:2864-2870.

AF Stroke Risk Schemes: ROC Curves*AF Stroke Risk Schemes: ROC Curves*
*Fang et al. JACC 2008;51:810-5*Fang et al. JACC 2008;51:810-5

Problem (?): Stroke rates in Problem (?): Stroke rates in AF appear to be declining.AF appear to be declining.

Decreasing Stroke Rates: Decreasing Stroke Rates: CHADSCHADS22=1, Off Warfarin=1, Off Warfarin
StudyStudy Time PeriodTime Period Stroke rateStroke rate
AFI RCTs: ASAAFI RCTs: ASA11 1987-961987-96 2.2 (1.6-3.1)2.2 (1.6-3.1)
ATRIA: +/- ASAATRIA: +/- ASA22 1996-20031996-2003 1.2 (1.0-1.4)1.2 (1.0-1.4)
BAFTA: ASABAFTA: ASA33 2003-20062003-2006 1.4 (0.6-2.9)1.4 (0.6-2.9)
11Circulation. 2004;110(16):2287-92.Circulation. 2004;110(16):2287-92.22Ann Intern Med. 2009;151:297-305 Ann Intern Med. 2009;151:297-305 33cited in Stroke 2009;40:2607-2610cited in Stroke 2009;40:2607-2610

Anticoagulation for AF in the Anticoagulation for AF in the “Real World”“Real World”

AAnnTTicoagulation and icoagulation and RRisk isk Factors Factors IIn n AAtrial Fibrillationtrial Fibrillation
(ATRIA) Study(ATRIA) Study
Massachusetts General HospitalMassachusetts General Hospital
Kaiser Permanente Division of ResearchKaiser Permanente Division of Research

ATRIA Cohort OutcomesATRIA Cohort Outcomes
• N=13,559, 1996-2003N=13,559, 1996-2003
• Median follow-up of 6.0 yearsMedian follow-up of 6.0 years
• 66,754 person-years of observation,66,754 person-years of observation,– ~50% on warfarin; 532,000 INR tests~50% on warfarin; 532,000 INR tests
• 1,092 validated TE events (1017 ischemic 1,092 validated TE events (1017 ischemic strokes)strokes)
• 299 validated ICH events299 validated ICH events

““Net Clinical Benefit” in AFNet Clinical Benefit” in AF
TEs prevented minus ICHs induced TEs prevented minus ICHs induced
(TE rate off warfarin - TE rate on warfarin) (TE rate off warfarin - TE rate on warfarin)
minus minus 1.5x1.5x
(ICH rate on warfarin - ICH rate off warfarin)(ICH rate on warfarin - ICH rate off warfarin)

-0.25
0.11
1.00
2.34
-0.65
-0.37
0.44
1.29
0.08
0.40
1.40
3.30
Age <65
Age 65-74
Age 75-84
Age ≥ 85
Warfarin worse Warfarin better
-1 -0.5 0 0.5 1 1.5 2 2.5 3 3.5
The net clinical benefit of warfarin by age group
Net Clinical Benefit(events per 100 person years)
Ann Intern Med 2009;151:297-305

-0.11
0.19
0.97
2.07
2.22
-0.44
-0.27
0.43
1.21
0.58
0.20
0.45
1.41
2.79
3.75
CHADS2 =0
CHADS2 =1
CHADS2 =2
CHADS2 =3
CHADS2 =4-6
Net Clinical Benefit (events per 100 persons per years)
Warfarin worse Warfarin better
-1 -0.5 0 0.5 1 1.5 2 2.5 3 3.5
*CHADS2 is a widely used stroke risk classification scheme for patients with AF.6 C=congestive heart failure; H=hypertension; A=age>75 years; D=diabetes; and S=prior ischemic stroke. The presence of each clinical feature confers one point except for S which confers 2 points.
The net clinical benefit of warfarin by CHADS2 score*
Ann Intern Med 2009;151:297-305

The Importance of “TTR” in Achieving The Importance of “TTR” in Achieving the Net Benefit of Warfarin in AFthe Net Benefit of Warfarin in AF

Stroke and Systemic Emboli (SE) Stroke and Systemic Emboli (SE) Outcomes by INR Control Category: Outcomes by INR Control Category:
Results from SPORTIF III and V*Results from SPORTIF III and V*
2.1
1.341.07
0.2 0.280.06
0
0.5
1
1.5
2
2.5
Poor Moderate Good
Eve
nts
per
100
pat
ien
t- y
ears
Stroke and SEHemorrhagic stroke
*White, HD et al. Comparison of Outcomes Among Patients Randomized to Warfarin Therapy According to Anticoagulant Control. Arch Intern Med. 2007; 167:239-245.
<60% 60-75% >75%
TTR = % of time spent at INR 2.0-3.0TTR = % of time spent at INR 2.0-3.0

ACTIVE-W VKA arm: Time in ACTIVE-W VKA arm: Time in Therapeutic Range (TTR)Therapeutic Range (TTR)
CountryCountry Mean TTRMean TTR
South AfricaSouth Africa 46.346.3
BrazilBrazil 47.147.1
RussiaRussia 53.453.4
PolandPoland 55.355.3
BelgiumBelgium 58.758.7
United StatesUnited States 62.962.9
NetherlandsNetherlands 64.064.0
ArgentinaArgentina 64.564.5
Czech RepublicCzech Republic 66.866.8
ItalyItaly 67.267.2
CanadaCanada 68.568.5
GermanyGermany 69.369.3
AustraliaAustralia 74.574.5
United KingdomUnited Kingdom 74.874.8
SwedenSweden 77.877.8
Circ 2008;118:2029-37Circ 2008;118:2029-37
““In medicine, In medicine, geography is destiny.”geography is destiny.”

The Importance of “TTR” in Achieving the The Importance of “TTR” in Achieving the Net Benefit of Warfarin in AFNet Benefit of Warfarin in AF
““Do the right thing”Do the right thing”
““Do the right thing Do the right thing rightright””

Problems with WarfarinProblems with Warfarin
• Much inter- and intra-individual variation in Much inter- and intra-individual variation in dosing: Monitoring is crucial (17 INRs/yr)dosing: Monitoring is crucial (17 INRs/yr)
• Drug and diet interactionsDrug and diet interactions
• ~4 day lag in effect, both on and off ~4 day lag in effect, both on and off
• Much physician and patient burden; Much physician and patient burden; significant discontinuation ratessignificant discontinuation rates

Response of IndustryResponse of Industry
Increasing prevalence of AF and dissatisfaction Increasing prevalence of AF and dissatisfaction with warfarin have prompted extraordinary with warfarin have prompted extraordinary investment in novel anticoagulants, primarily investment in novel anticoagulants, primarily Xa-I and DTIs.Xa-I and DTIs.
• Multiple non-inferiority megatrialsMultiple non-inferiority megatrials
• ~40,000+ AF patients in RCTs~40,000+ AF patients in RCTs
Stroke Prevention in AF: The FutureStroke Prevention in AF: The Future
1.1. Optimizing warfarinOptimizing warfarin
2. Replacing warfarin – “Breaking the warfarin 2. Replacing warfarin – “Breaking the warfarin barrier”barrier”
3. True cure for AF:3. True cure for AF:• initiator: ablation/isolation of PVinitiator: ablation/isolation of PV• substrate: “maze” proceduresubstrate: “maze” procedure

Stroke Prevention in AF: The FutureStroke Prevention in AF: The Future
4. “Rx” of LAA: surgery, Watchman catheter 4. “Rx” of LAA: surgery, Watchman catheter approachapproach
5. **Better risk stratification: stroke, ICH**5. **Better risk stratification: stroke, ICH**

Trends in publications on AFTrends in publications on AF
46 55 65 54 37 51 53 59 94 106 138 160223
317 343
594
834
998
1212
1644
1812
2075
0
500
1000
1500
2000
2500
1966
-67
1968
-69
1970
-71
1972
-73
1974
-75
1976
-77
1978
-79
1980
-81
1982
-83
1984
-85
1986
-87
1988
-89
1990
-91
1992
-93
1994
-95
1996
-97
1998
-99
2000
-01
2002
-03
2004
-05
2006
-07
2008
-09
Source: PubMed May 2010; Search limits: atrial fibrillation in title, human, English language.Source: PubMed May 2010; Search limits: atrial fibrillation in title, human, English language.
Year
Nu
mb
er o
f P
ub
lica
tio
ns

ENDEND

Warfarin?Warfarin?

Warfarin and Vitamin K: PharmacogeneticsWarfarin and Vitamin K: Pharmacogenetics
Common gene variants for warfarin sensitivity:Common gene variants for warfarin sensitivity:--CYP2C9CYP2C9: S-warfarin metabolism: S-warfarin metabolism--VKORC1VKORC1: warfarin effect: warfarin effect
2 genes account for ~25% variability in warf dose2 genes account for ~25% variability in warf dose
Clinical impact: ??Clinical impact: ??

Risk Factors for ICHRisk Factors for ICH
ClinicalClinical•AgeAge
•HypertensionHypertension
•Prior strokePrior stroke
•Anticoagulation (esp. VKA with INR>3.5)Anticoagulation (esp. VKA with INR>3.5)
GeneticGeneticApolipoprotein Apolipoprotein εε2 or 2 or εε4 (RR ~2 for “lobar” ICH)4 (RR ~2 for “lobar” ICH)

Imaging for Cerebral Small Vessel Imaging for Cerebral Small Vessel DiseaseDisease
Radiographic manifestations of cerebral small vessel disease.*Radiographic manifestations of cerebral small vessel disease.*
Left, T2*GRE MRI with left occipital ICH and multiple microbleeds Left, T2*GRE MRI with left occipital ICH and multiple microbleeds (arrows) in a patient with probable CAA.(arrows) in a patient with probable CAA.
Right, FLAIR sequence demonstrates extensive leukoaraiosis.Right, FLAIR sequence demonstrates extensive leukoaraiosis.
*Rost et al., *Rost et al., Stroke.Stroke. 2008; 39:2166-2173 2008; 39:2166-2173

Atritech, Inc., WATCHMANAtritech, Inc., WATCHMAN


Left Atrial Appendage Casts*Left Atrial Appendage Casts*
*Anat Rec 1995;242:553-61*Anat Rec 1995;242:553-61