Embed Size (px)
Citation preview
For updated information, please visit www.ibef.org November 2017
AGRICULTURE AND
ALLIED INDUSTRIES
Table of Content
Executive Summary……………….….…….3
Advantage India…………………..….……..4
Market Overview …………………….……..6
Recent Trends and Strategies …………..16
Growth Drivers…………………….............20
Opportunities…….……….......……………30
Industry Associations……………....……..39
Case Studies……………....…………….…35
Useful Information……….......…………….41
For updated information, please visit www.ibef.org Agriculture and Allied
Services 3
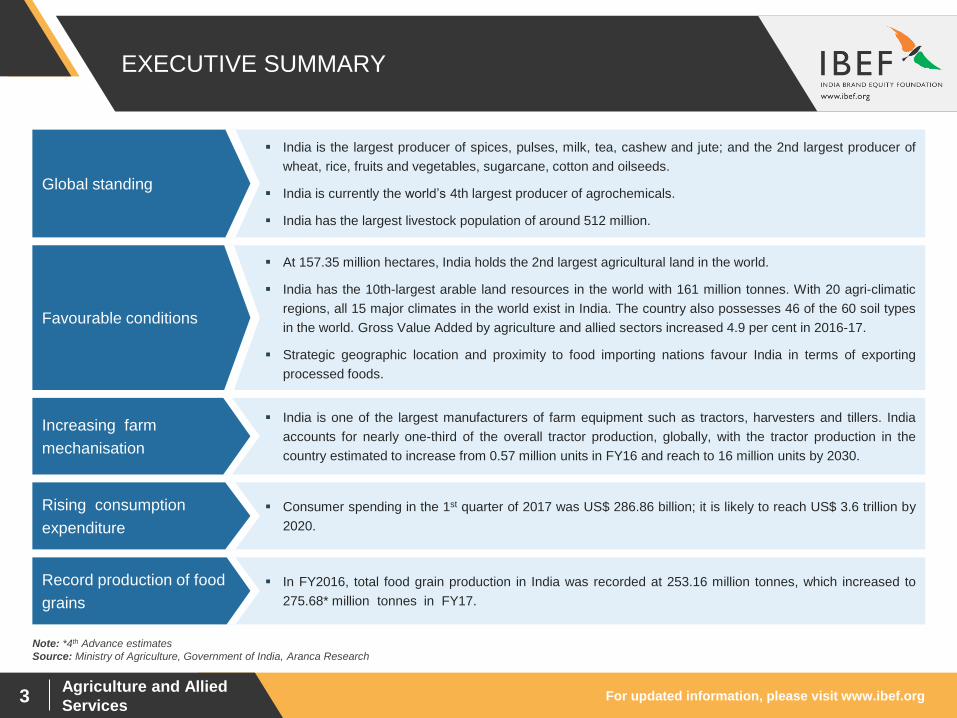
At 157.35 million hectares, India holds the 2nd largest agricultural land in the world.
India has the 10th-largest arable land resources in the world with 161 million tonnes. With 20 agri-climatic
regions, all 15 major climates in the world exist in India. The country also possesses 46 of the 60 soil types
in the world. Gross Value Added by agriculture and allied sectors increased 4.9 per cent in 2016-17.
Strategic geographic location and proximity to food importing nations favour India in terms of exporting
processed foods.
India is one of the largest manufacturers of farm equipment such as tractors, harvesters and tillers. India
accounts for nearly one-third of the overall tractor production, globally, with the tractor production in the
country estimated to increase from 0.57 million units in FY16 and reach to 16 million units by 2030.
Consumer spending in the 1st quarter of 2017 was US$ 286.86 billion; it is likely to reach US$ 3.6 trillion by
2020.
In FY2016, total food grain production in India was recorded at 253.16 million tonnes, which increased to
275.68* million tonnes in FY17.
EXECUTIVE SUMMARY
India is the largest producer of spices, pulses, milk, tea, cashew and jute; and the 2nd largest producer of
wheat, rice, fruits and vegetables, sugarcane, cotton and oilseeds.
India is currently the world’s 4th largest producer of agrochemicals.
India has the largest livestock population of around 512 million.
Global standing
Source: Ministry of Agriculture, Government of India, Aranca Research
Increasing farm
mechanisation
Favourable conditions
Rising consumption
expenditure
Record production of food
grains
Note: *4th Advance estimates

Agriculture and Allied Services
ADVANTAGE INDIA
For updated information, please visit www.ibef.org Agriculture and Allied
Services 5
ADVANTAGE INDIA
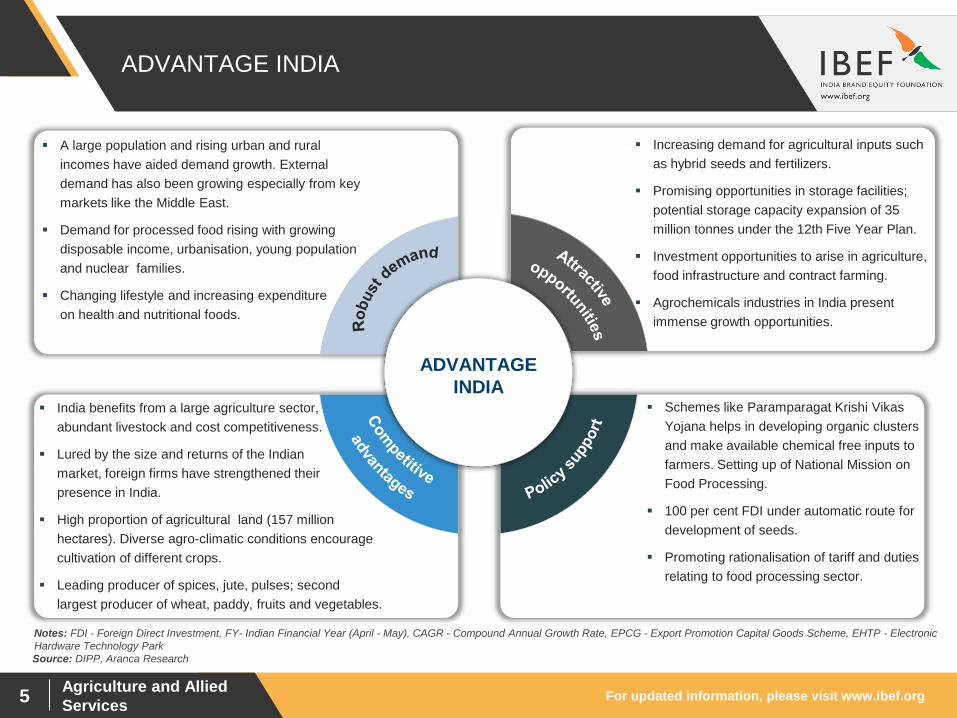
A large population and rising urban and rural
incomes have aided demand growth. External
demand has also been growing especially from key
markets like the Middle East.
Demand for processed food rising with growing
disposable income, urbanisation, young population
and nuclear families.
Changing lifestyle and increasing expenditure
on health and nutritional foods.
Increasing demand for agricultural inputs such
as hybrid seeds and fertilizers.
Promising opportunities in storage facilities;
potential storage capacity expansion of 35
million tonnes under the 12th Five Year Plan.
Investment opportunities to arise in agriculture,
food infrastructure and contract farming.
Agrochemicals industries in India present
immense growth opportunities.
India benefits from a large agriculture sector,
abundant livestock and cost competitiveness.
Lured by the size and returns of the Indian
market, foreign firms have strengthened their
presence in India.
High proportion of agricultural land (157 million
hectares). Diverse agro-climatic conditions encourage
cultivation of different crops.
Leading producer of spices, jute, pulses; second
largest producer of wheat, paddy, fruits and vegetables.
Schemes like Paramparagat Krishi Vikas
Yojana helps in developing organic clusters
and make available chemical free inputs to
farmers. Setting up of National Mission on
Food Processing.
100 per cent FDI under automatic route for
development of seeds.
Promoting rationalisation of tariff and duties
relating to food processing sector.
ADVANTAGE
INDIA
Source: DIPP, Aranca Research
Notes: FDI - Foreign Direct Investment, FY- Indian Financial Year (April - May), CAGR - Compound Annual Growth Rate, EPCG - Export Promotion Capital Goods Scheme, EHTP - Electronic
Hardware Technology Park
Agriculture and Allied Services
MARKET OVERVIEW
For updated information, please visit www.ibef.org Agriculture and Allied
Services 7
GROWTH IN AGRICULTURE
Source: Ministry of Agriculture, Print Release, RBI, Aranca Research
Notes: GDP – Gross Domestic Product, MOSPI – Ministry of Statistics and Programme Implementation, FY16 – Advance Estimates, PE – provisional estimate
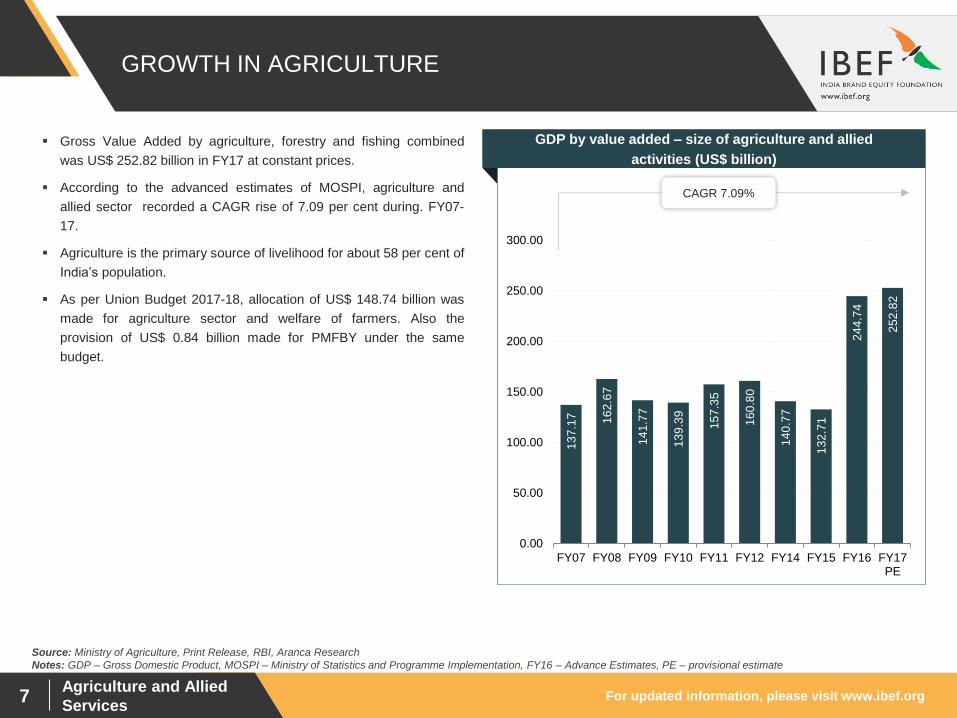
Gross Value Added by agriculture, forestry and fishing combined
was US$ 252.82 billion in FY17 at constant prices.
According to the advanced estimates of MOSPI, agriculture and
allied sector recorded a CAGR rise of 7.09 per cent during. FY07-
17.
Agriculture is the primary source of livelihood for about 58 per cent of
India’s population.
As per Union Budget 2017-18, allocation of US$ 148.74 billion was
made for agriculture sector and welfare of farmers. Also the
provision of US$ 0.84 billion made for PMFBY under the same
budget.
Visakhapatnam port traffic (million tonnes) GDP by value added – size of agriculture and allied
activities (US$ billion)
CAGR 7.09%
13
7.1
7
16
2.6
7
14
1.7
7
13
9.3
9
15
7.3
5
16
0.8
0
14
0.7
7
13
2.7
1
24
4.7
4
25
2.8
2
0.00
50.00
100.00
150.00
200.00
250.00
300.00
FY07 FY08 FY09 FY10 FY11 FY12 FY14 FY15 FY16 FY17PE
For updated information, please visit www.ibef.org Agriculture and Allied
Services 8
MAJOR SEASONS: KHARIF AND RABI … (1/2)
11
0
11
6
11
4
12
4
12
8
12
4
12
8
12
6
12
6
13
7
12
1
11
8
10
4
12
1 13
1
13
2
12
9
12
6
12
5 1
39
0
50
100
150
200
250
300
FY08 FY09 FY10 FY11 FY12 FY13 FY14 FY15 FY16 FY17
Rabi Kharif
Source: Finance Ministry, Ministry of Agriculture, Aranca Research
* -As per 4th advance estimates, 1 as on November 24, 2017
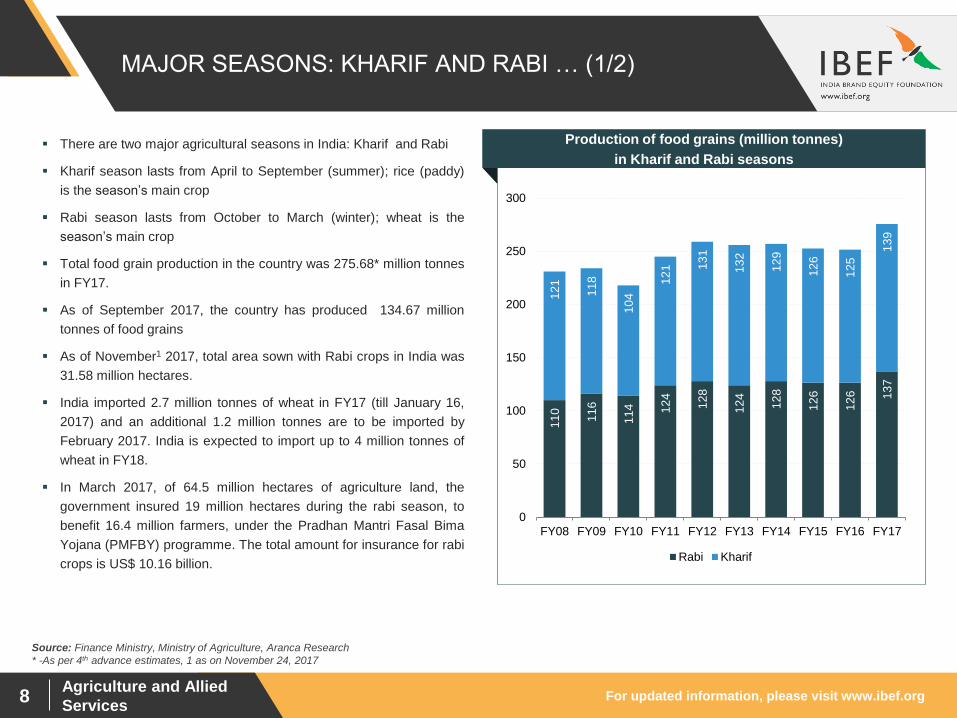
There are two major agricultural seasons in India: Kharif and Rabi
Kharif season lasts from April to September (summer); rice (paddy)
is the season’s main crop
Rabi season lasts from October to March (winter); wheat is the
season’s main crop
Total food grain production in the country was 275.68* million tonnes
in FY17.
As of September 2017, the country has produced 134.67 million
tonnes of food grains
As of November1 2017, total area sown with Rabi crops in India was
31.58 million hectares.
India imported 2.7 million tonnes of wheat in FY17 (till January 16,
2017) and an additional 1.2 million tonnes are to be imported by
February 2017. India is expected to import up to 4 million tonnes of
wheat in FY18.
In March 2017, of 64.5 million hectares of agriculture land, the
government insured 19 million hectares during the rabi season, to
benefit 16.4 million farmers, under the Pradhan Mantri Fasal Bima
Yojana (PMFBY) programme. The total amount for insurance for rabi
crops is US$ 10.16 billion.
Visakhapatnam port traffic (million tonnes) Production of food grains (million tonnes)
in Kharif and Rabi seasons
For updated information, please visit www.ibef.org Agriculture and Allied
Services 9
MAJOR SEASONS: KHARIF AND RABI … (2/2)
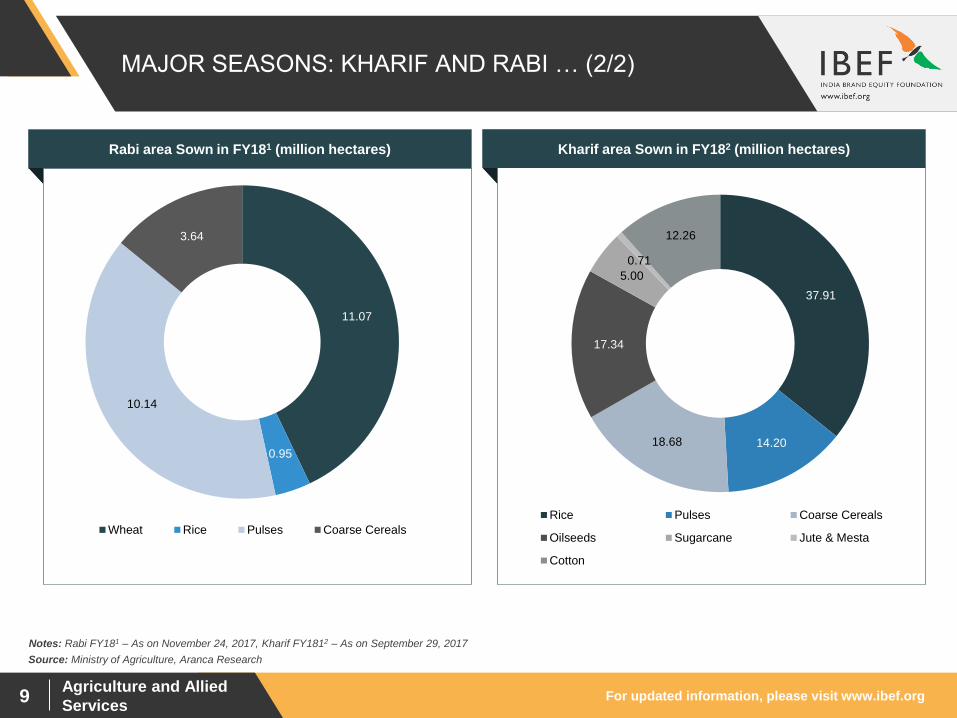
37.91
14.20 18.68
17.34
5.00
0.71
12.26
Rice Pulses Coarse Cereals
Oilseeds Sugarcane Jute & Mesta
Cotton
Source: Ministry of Agriculture, Aranca Research
Visakhapatnam port traffic (million tonnes) Kharif area Sown in FY182 (million hectares)
Notes: Rabi FY181 – As on November 24, 2017, Kharif FY1812 – As on September 29, 2017
11.07
0.95
10.14
3.64
Wheat Rice Pulses Coarse Cereals
Visakhapatnam port traffic (million tonnes) Rabi area Sown in FY181 (million hectares)
For updated information, please visit www.ibef.org Agriculture and Allied
Services 10
PRODUCTION OF RICE AND WHEAT ON THE RISE
79
81
81
87
95
94
94
96
89
98
97
99
89
96
10
5
10
5
10
5
10
6
10
5
11
0
0
20
40
60
80
100
120
FY08 FY09 FY10 FY11 FY12 FY13 FY14 FY15 FY16 FY17
Production of wheat Production of Rice
Source: Ministry of Agriculture, Aranca Research
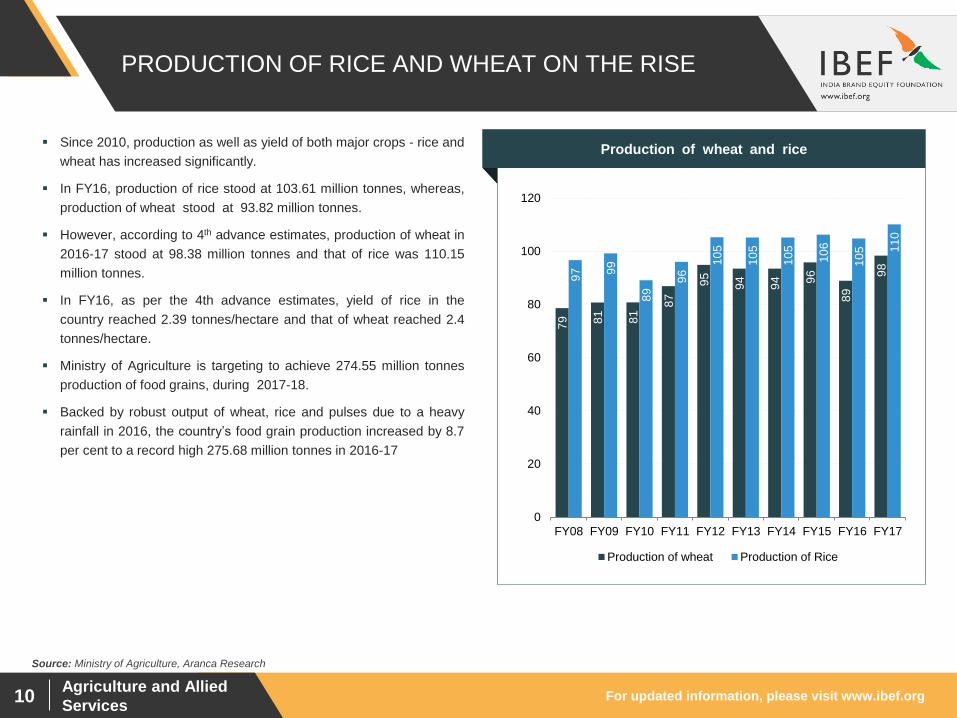
Since 2010, production as well as yield of both major crops - rice and
wheat has increased significantly.
In FY16, production of rice stood at 103.61 million tonnes, whereas,
production of wheat stood at 93.82 million tonnes.
However, according to 4th advance estimates, production of wheat in
2016-17 stood at 98.38 million tonnes and that of rice was 110.15
million tonnes.
In FY16, as per the 4th advance estimates, yield of rice in the
country reached 2.39 tonnes/hectare and that of wheat reached 2.4
tonnes/hectare.
Ministry of Agriculture is targeting to achieve 274.55 million tonnes
production of food grains, during 2017-18.
Backed by robust output of wheat, rice and pulses due to a heavy
rainfall in 2016, the country’s food grain production increased by 8.7
per cent to a record high 275.68 million tonnes in 2016-17
Visakhapatnam port traffic (million tonnes) Production of wheat and rice
For updated information, please visit www.ibef.org Agriculture and Allied
Services 11
FRUIT AND VEGETABLE PRODUCTION CONTINUES
TO INCREASE
16
6.9
18
2.8
19
1.8
21
1.2
21
4.7
22
3.1
24
0.5
25
7.3
26
8.8
27
7.3
28
0.5
28
3.4
29
9.8
52
93
0.0
50.0
100.0
150.0
200.0
250.0
300.0
350.0
Source: National Horticulture Board, Assorted Articles, FAO Stat, Aranca Research
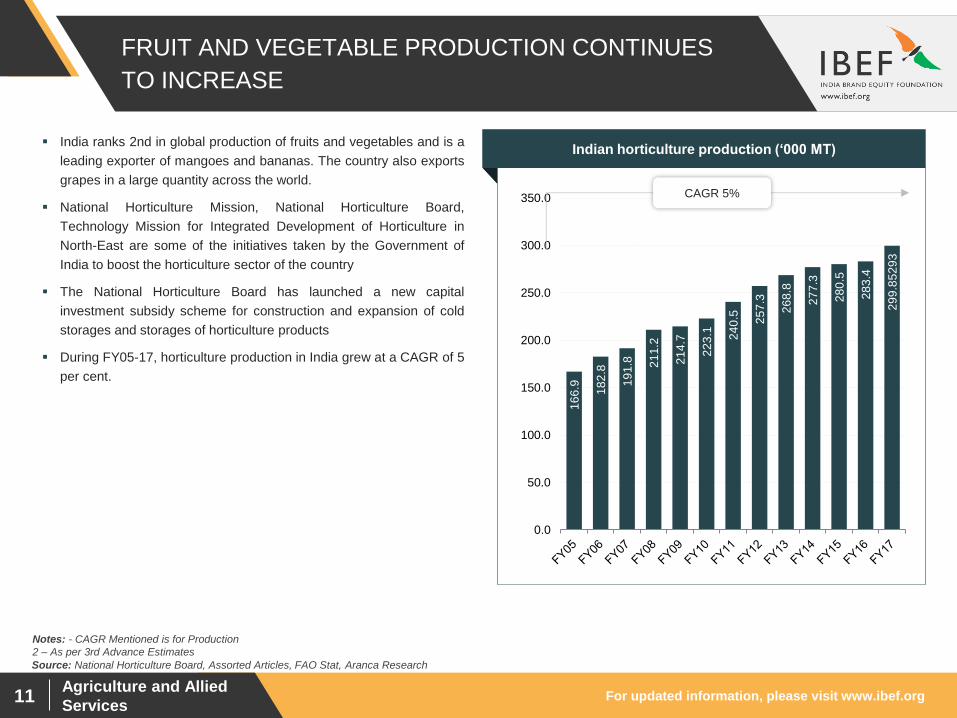
India ranks 2nd in global production of fruits and vegetables and is a
leading exporter of mangoes and bananas. The country also exports
grapes in a large quantity across the world.
National Horticulture Mission, National Horticulture Board,
Technology Mission for Integrated Development of Horticulture in
North-East are some of the initiatives taken by the Government of
India to boost the horticulture sector of the country
The National Horticulture Board has launched a new capital
investment subsidy scheme for construction and expansion of cold
storages and storages of horticulture products
During FY05-17, horticulture production in India grew at a CAGR of 5
per cent.
Visakhapatnam port traffic (million tonnes) Indian horticulture production (‘000 MT)
CAGR 5%
Notes: - CAGR Mentioned is for Production
2 – As per 3rd Advance Estimates
For updated information, please visit www.ibef.org Agriculture and Allied
Services 12
SURGE IN DEMAND OF INDIAN AGRICULTURAL
PRODUCTS … (1/2)
11
.30
15
.60
24
.70
29
.20
43
.23
38
.70
32
.08
33
.87
8.7
3
0.00
5.00
10.00
15.00
20.00
25.00
30.00
35.00
40.00
45.00
50.00
FY10 FY11 FY12 FY13 FY14 FY15 FY16 FY17 FY18*
Source: Ministry of Commerce, World Trade Organisation, Indian Budget 2016, APEDA, Business Standard
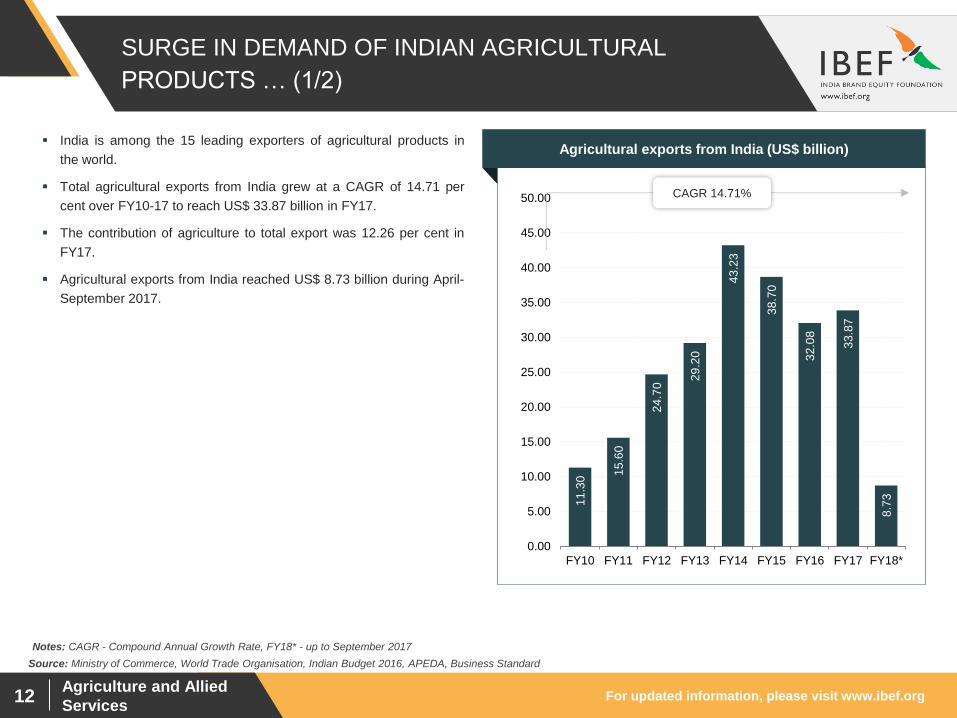
India is among the 15 leading exporters of agricultural products in
the world.
Total agricultural exports from India grew at a CAGR of 14.71 per
cent over FY10-17 to reach US$ 33.87 billion in FY17.
The contribution of agriculture to total export was 12.26 per cent in
FY17.
Agricultural exports from India reached US$ 8.73 billion during April-
September 2017.
Visakhapatnam port traffic (million tonnes) Agricultural exports from India (US$ billion)
CAGR 14.71%
Notes: CAGR - Compound Annual Growth Rate, FY18* - up to September 2017
For updated information, please visit www.ibef.org Agriculture and Allied
Services 13
SURGE IN DEMAND OF INDIA AGRICULTURAL
PRODUCTS … (2/2)
1.6
2
0.1
6
2.7
7
0.2
0.6
4
1.8
3
0.3
2
0
0.5
1
1.5
2
2.5
3
Rice GuargumMeal
MarineProducts
Oil Meals Sugar BuffaloMeat
CashewNut
Source: Ministry of Agriculture, APEDA, Aranca Research 1 –Data is for April – September 2016
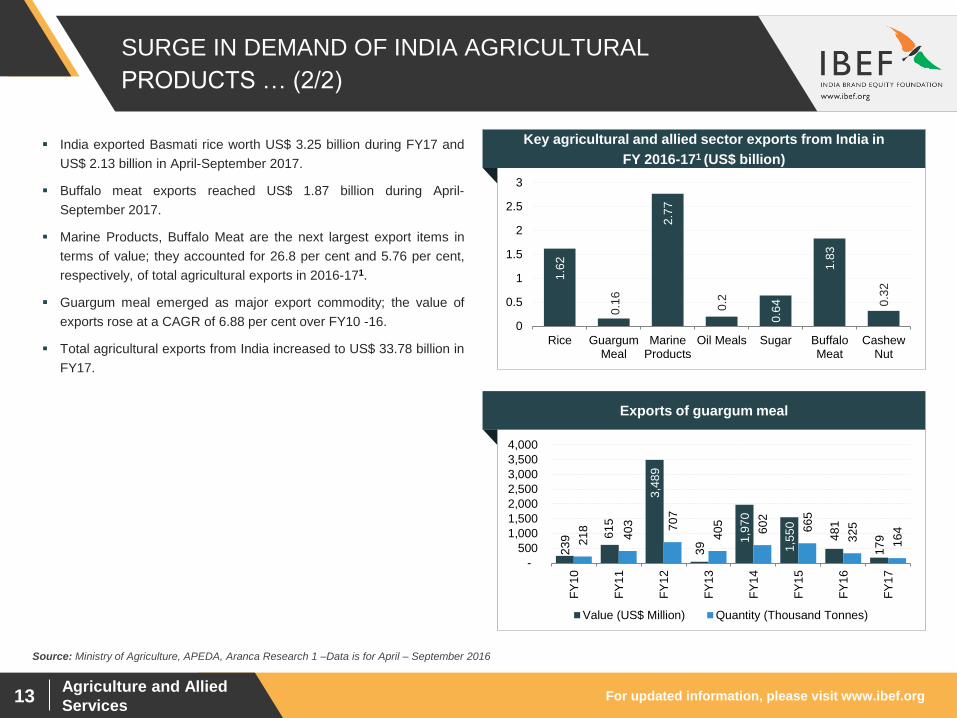
India exported Basmati rice worth US$ 3.25 billion during FY17 and
US$ 2.13 billion in April-September 2017.
Buffalo meat exports reached US$ 1.87 billion during April-
September 2017.
Marine Products, Buffalo Meat are the next largest export items in
terms of value; they accounted for 26.8 per cent and 5.76 per cent,
respectively, of total agricultural exports in 2016-171.
Guargum meal emerged as major export commodity; the value of
exports rose at a CAGR of 6.88 per cent over FY10 -16.
Total agricultural exports from India increased to US$ 33.78 billion in
FY17.
Key agricultural and allied sector exports from India in
FY 2016-171 (US$ billion)
23
9 61
5
3,4
89
39
1,9
70
1,5
50
48
1
17
9
21
8
40
3
70
7
40
5
60
2
66
5
32
5
16
4
-
500
1,000
1,500
2,000
2,500
3,000
3,500
4,000
FY
10
FY
11
FY
12
FY
13
FY
14
FY
15
FY
16
FY
17
Value (US$ Million) Quantity (Thousand Tonnes)
Exports of guargum meal
For updated information, please visit www.ibef.org Agriculture and Allied
Services 14
FOOD PROCESSING SEGMENTS and PRIVATE
PLAYERS
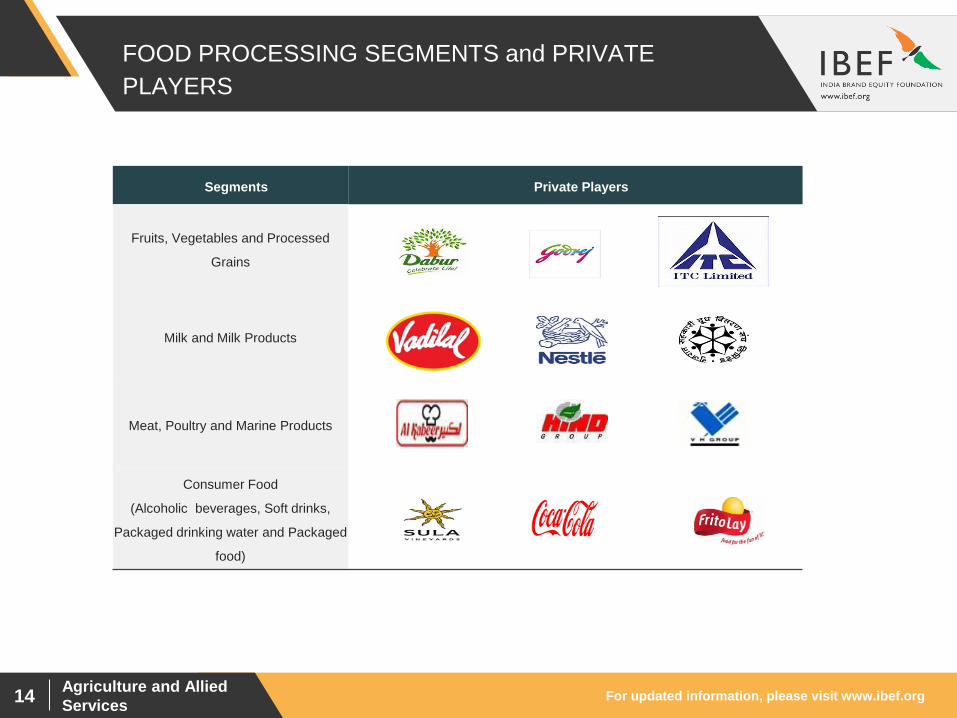
Segments Private Players
Fruits, Vegetables and Processed
Grains
Milk and Milk Products
Meat, Poultry and Marine Products
Consumer Food
(Alcoholic beverages, Soft drinks,
Packaged drinking water and Packaged
food)
For updated information, please visit www.ibef.org Agriculture and Allied
Services 15
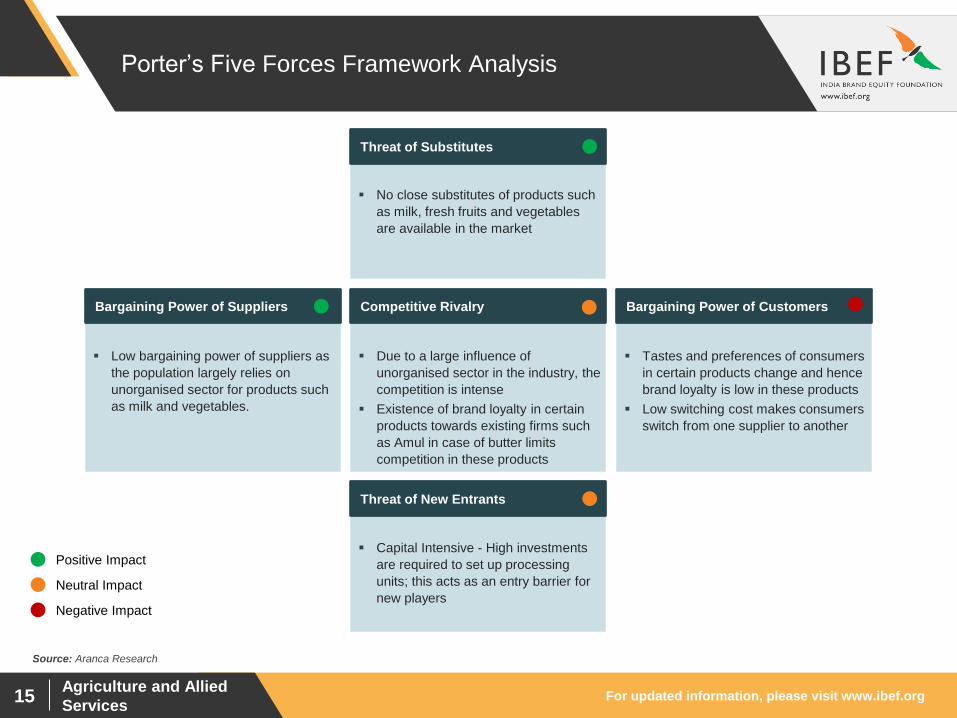
Porter’s Five Forces Framework Analysis
Low bargaining power of suppliers as
the population largely relies on
unorganised sector for products such
as milk and vegetables.
Bargaining Power of Suppliers
No close substitutes of products such
as milk, fresh fruits and vegetables
are available in the market
Threat of Substitutes
Due to a large influence of
unorganised sector in the industry, the
competition is intense
Existence of brand loyalty in certain
products towards existing firms such
as Amul in case of butter limits
competition in these products
Competitive Rivalry
Capital Intensive - High investments
are required to set up processing
units; this acts as an entry barrier for
new players
Threat of New Entrants
Tastes and preferences of consumers
in certain products change and hence
brand loyalty is low in these products
Low switching cost makes consumers
switch from one supplier to another
Bargaining Power of Customers
Positive Impact
Neutral Impact
Negative Impact
Source: Aranca Research
Agriculture and Allied Services
RECENT TRENDS
AND STRATEGIES
For updated information, please visit www.ibef.org Agriculture and Allied
Services 17
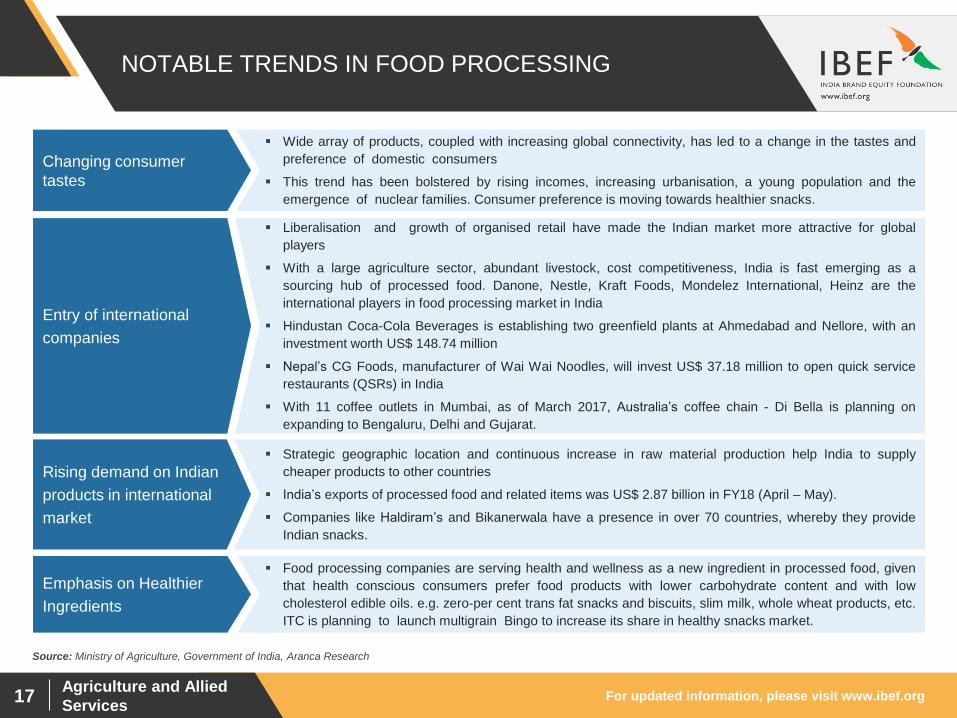
Food processing companies are serving health and wellness as a new ingredient in processed food, given
that health conscious consumers prefer food products with lower carbohydrate content and with low
cholesterol edible oils. e.g. zero-per cent trans fat snacks and biscuits, slim milk, whole wheat products, etc.
ITC is planning to launch multigrain Bingo to increase its share in healthy snacks market.
Emphasis on Healthier
Ingredients
Liberalisation and growth of organised retail have made the Indian market more attractive for global
players
With a large agriculture sector, abundant livestock, cost competitiveness, India is fast emerging as a
sourcing hub of processed food. Danone, Nestle, Kraft Foods, Mondelez International, Heinz are the
international players in food processing market in India
Hindustan Coca-Cola Beverages is establishing two greenfield plants at Ahmedabad and Nellore, with an
investment worth US$ 148.74 million
Nepal’s CG Foods, manufacturer of Wai Wai Noodles, will invest US$ 37.18 million to open quick service
restaurants (QSRs) in India
With 11 coffee outlets in Mumbai, as of March 2017, Australia’s coffee chain - Di Bella is planning on
expanding to Bengaluru, Delhi and Gujarat.
Strategic geographic location and continuous increase in raw material production help India to supply
cheaper products to other countries
India’s exports of processed food and related items was US$ 2.87 billion in FY18 (April – May).
Companies like Haldiram’s and Bikanerwala have a presence in over 70 countries, whereby they provide
Indian snacks.
NOTABLE TRENDS IN FOOD PROCESSING
Wide array of products, coupled with increasing global connectivity, has led to a change in the tastes and
preference of domestic consumers
This trend has been bolstered by rising incomes, increasing urbanisation, a young population and the
emergence of nuclear families. Consumer preference is moving towards healthier snacks.
Changing consumer
tastes
Source: Ministry of Agriculture, Government of India, Aranca Research
Rising demand on Indian
products in international
market
Entry of international
companies
For updated information, please visit www.ibef.org Agriculture and Allied
Services 18
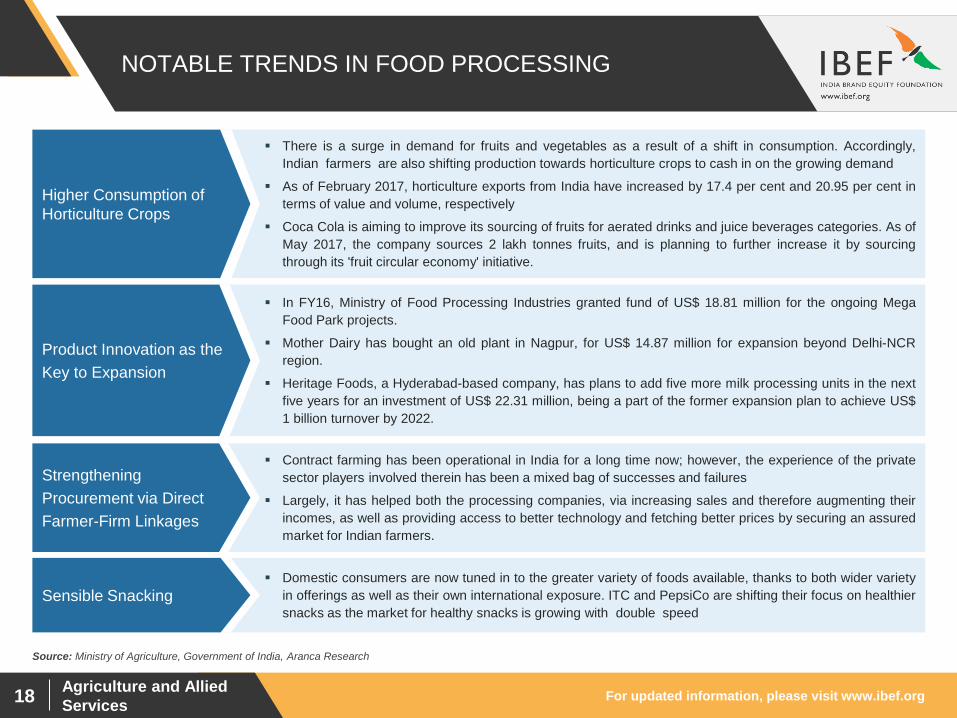
In FY16, Ministry of Food Processing Industries granted fund of US$ 18.81 million for the ongoing Mega
Food Park projects.
Mother Dairy has bought an old plant in Nagpur, for US$ 14.87 million for expansion beyond Delhi-NCR
region.
Heritage Foods, a Hyderabad-based company, has plans to add five more milk processing units in the next
five years for an investment of US$ 22.31 million, being a part of the former expansion plan to achieve US$
1 billion turnover by 2022.
Contract farming has been operational in India for a long time now; however, the experience of the private
sector players involved therein has been a mixed bag of successes and failures
Largely, it has helped both the processing companies, via increasing sales and therefore augmenting their
incomes, as well as providing access to better technology and fetching better prices by securing an assured
market for Indian farmers.
Domestic consumers are now tuned in to the greater variety of foods available, thanks to both wider variety
in offerings as well as their own international exposure. ITC and PepsiCo are shifting their focus on healthier
snacks as the market for healthy snacks is growing with double speed
NOTABLE TRENDS IN FOOD PROCESSING
There is a surge in demand for fruits and vegetables as a result of a shift in consumption. Accordingly,
Indian farmers are also shifting production towards horticulture crops to cash in on the growing demand
As of February 2017, horticulture exports from India have increased by 17.4 per cent and 20.95 per cent in
terms of value and volume, respectively
Coca Cola is aiming to improve its sourcing of fruits for aerated drinks and juice beverages categories. As of
May 2017, the company sources 2 lakh tonnes fruits, and is planning to further increase it by sourcing
through its 'fruit circular economy' initiative.
Higher Consumption of
Horticulture Crops
Source: Ministry of Agriculture, Government of India, Aranca Research
Strengthening
Procurement via Direct
Farmer-Firm Linkages
Product Innovation as the
Key to Expansion
Sensible Snacking
For updated information, please visit www.ibef.org Agriculture and Allied
Services 19
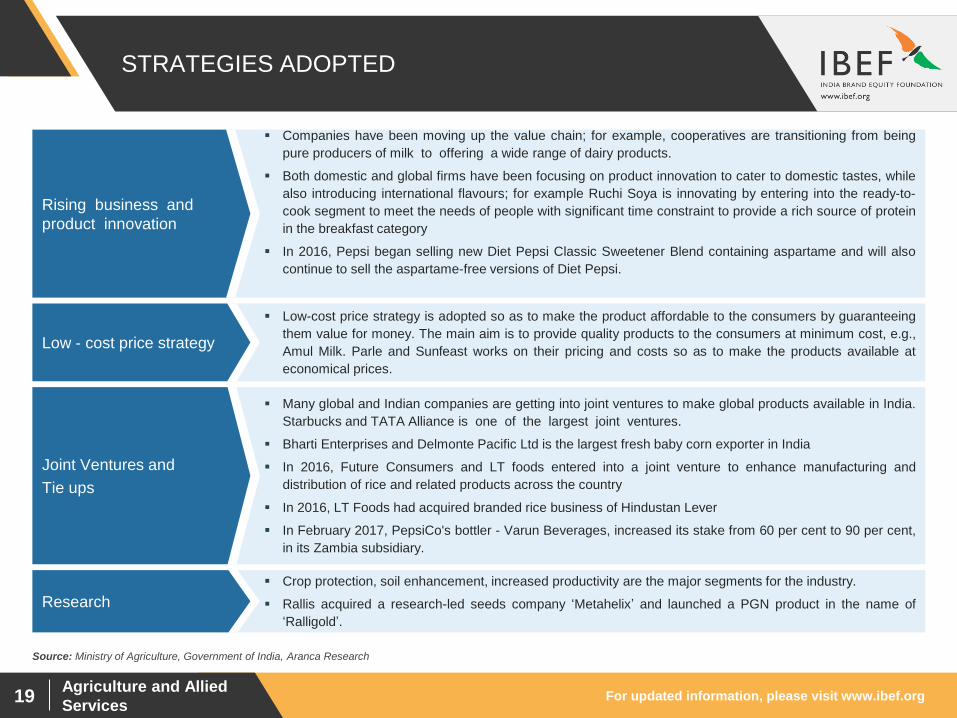
Low-cost price strategy is adopted so as to make the product affordable to the consumers by guaranteeing
them value for money. The main aim is to provide quality products to the consumers at minimum cost, e.g.,
Amul Milk. Parle and Sunfeast works on their pricing and costs so as to make the products available at
economical prices.
Many global and Indian companies are getting into joint ventures to make global products available in India.
Starbucks and TATA Alliance is one of the largest joint ventures.
Bharti Enterprises and Delmonte Pacific Ltd is the largest fresh baby corn exporter in India
In 2016, Future Consumers and LT foods entered into a joint venture to enhance manufacturing and
distribution of rice and related products across the country
In 2016, LT Foods had acquired branded rice business of Hindustan Lever
In February 2017, PepsiCo's bottler - Varun Beverages, increased its stake from 60 per cent to 90 per cent,
in its Zambia subsidiary.
Crop protection, soil enhancement, increased productivity are the major segments for the industry.
Rallis acquired a research-led seeds company ‘Metahelix’ and launched a PGN product in the name of
‘Ralligold’.
Companies have been moving up the value chain; for example, cooperatives are transitioning from being
pure producers of milk to offering a wide range of dairy products.
Both domestic and global firms have been focusing on product innovation to cater to domestic tastes, while
also introducing international flavours; for example Ruchi Soya is innovating by entering into the ready-to-
cook segment to meet the needs of people with significant time constraint to provide a rich source of protein
in the breakfast category
In 2016, Pepsi began selling new Diet Pepsi Classic Sweetener Blend containing aspartame and will also
continue to sell the aspartame-free versions of Diet Pepsi.
STRATEGIES ADOPTED
Rising business and
product innovation
Source: Ministry of Agriculture, Government of India, Aranca Research
Joint Ventures and
Tie ups
Low - cost price strategy
Research

Agriculture and Allied Services
GROWTH DRIVERS
For updated information, please visit www.ibef.org Agriculture and Allied
Services 21
GROWTH DRIVERS OF INDIAN AGRICULTURE
Source: Note: MSP - Minimum Support Price
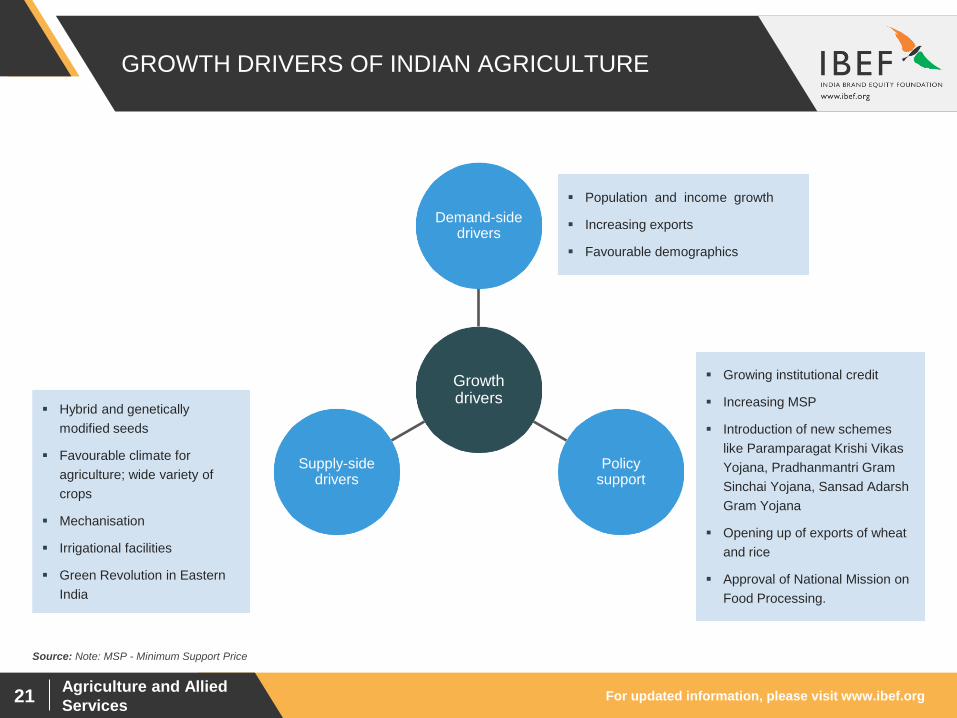
Growth drivers
Demand-side drivers
Policy support
Supply-side drivers
Hybrid and genetically
modified seeds
Favourable climate for
agriculture; wide variety of
crops
Mechanisation
Irrigational facilities
Green Revolution in Eastern
India
Growing institutional credit
Increasing MSP
Introduction of new schemes
like Paramparagat Krishi Vikas
Yojana, Pradhanmantri Gram
Sinchai Yojana, Sansad Adarsh
Gram Yojana
Opening up of exports of wheat
and rice
Approval of National Mission on
Food Processing.
Population and income growth
Increasing exports
Favourable demographics
For updated information, please visit www.ibef.org Agriculture and Allied
Services 22
RISING INCOME AND GROWING MIDDLE CLASS TO
DRIVE DEMAND FOR PROCESSED FOOD
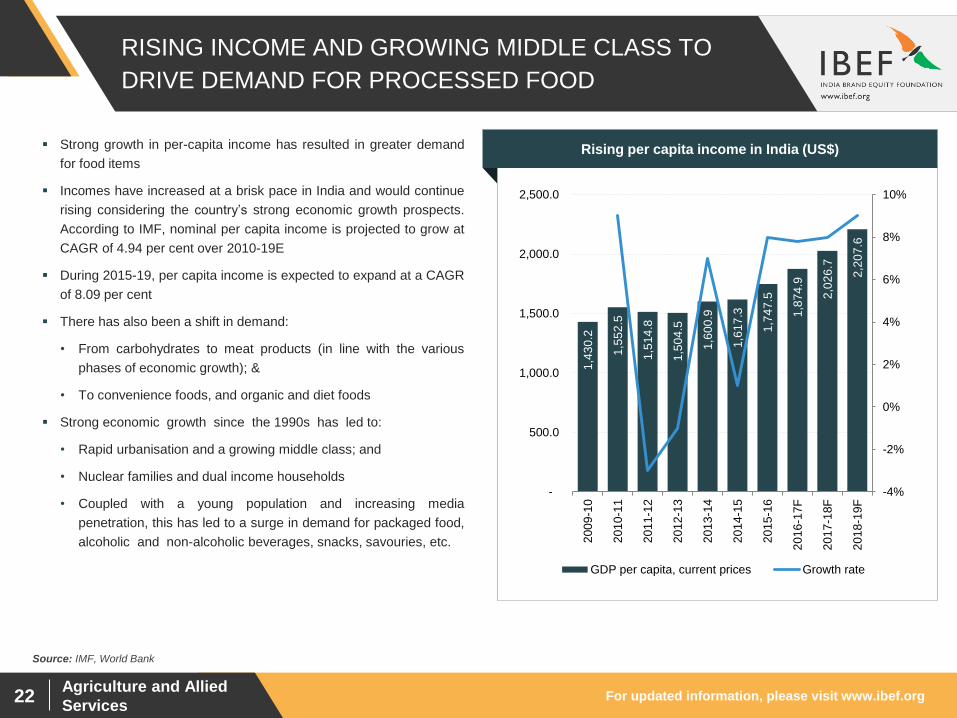
Strong growth in per-capita income has resulted in greater demand
for food items
Incomes have increased at a brisk pace in India and would continue
rising considering the country’s strong economic growth prospects.
According to IMF, nominal per capita income is projected to grow at
CAGR of 4.94 per cent over 2010-19E
During 2015-19, per capita income is expected to expand at a CAGR
of 8.09 per cent
There has also been a shift in demand:
• From carbohydrates to meat products (in line with the various
phases of economic growth); &
• To convenience foods, and organic and diet foods
Strong economic growth since the 1990s has led to:
• Rapid urbanisation and a growing middle class; and
• Nuclear families and dual income households
• Coupled with a young population and increasing media
penetration, this has led to a surge in demand for packaged food,
alcoholic and non-alcoholic beverages, snacks, savouries, etc.
Rising per capita income in India (US$)
Source: IMF, World Bank
1,4
30
.2
1,5
52
.5
1,5
14
.8
1,5
04
.5
1,6
00
.9
1,6
17
.3
1,7
47
.5
1,8
74
.9
2,0
26
.7
2,2
07
.6
-4%
-2%
0%
2%
4%
6%
8%
10%
-
500.0
1,000.0
1,500.0
2,000.0
2,500.0
200
9-1
0
201
0-1
1
201
1-1
2
201
2-1
3
201
3-1
4
201
4-1
5
201
5-1
6
201
6-1
7F
201
7-1
8F
201
8-1
9F
GDP per capita, current prices Growth rate
For updated information, please visit www.ibef.org Agriculture and Allied
Services 23
GROWING AREA UNDER IRRIGATION
54
,71
5
56
,48
9
58
,55
0
59
,51
2
60
,41
5
58
,12
2
61
,06
5
61
,61
2
61
,63
2
68
,20
0
-
10,000
20,000
30,000
40,000
50,000
60,000
70,000
80,000
FY05 FY06 FY07 FY08 FY09 FY10 FY11 FY12 FY13 FY17
Source: Food and Agricultural Organisation US, Ministry of Agriculture, Union Budget 2017-18
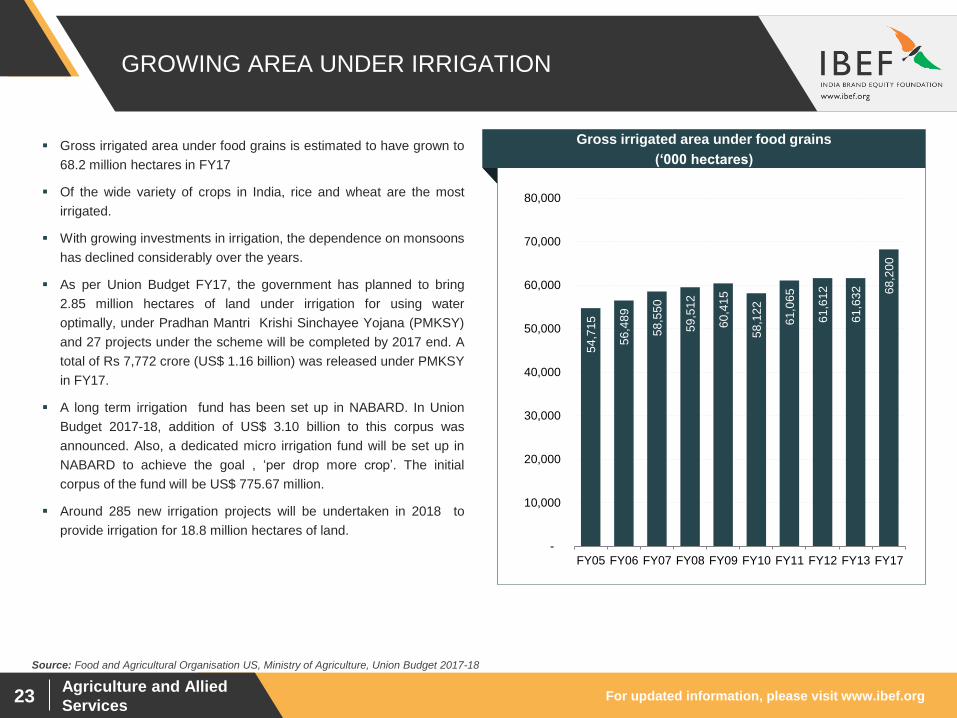
Gross irrigated area under food grains is estimated to have grown to
68.2 million hectares in FY17
Of the wide variety of crops in India, rice and wheat are the most
irrigated.
With growing investments in irrigation, the dependence on monsoons
has declined considerably over the years.
As per Union Budget FY17, the government has planned to bring
2.85 million hectares of land under irrigation for using water
optimally, under Pradhan Mantri Krishi Sinchayee Yojana (PMKSY)
and 27 projects under the scheme will be completed by 2017 end. A
total of Rs 7,772 crore (US$ 1.16 billion) was released under PMKSY
in FY17.
A long term irrigation fund has been set up in NABARD. In Union
Budget 2017-18, addition of US$ 3.10 billion to this corpus was
announced. Also, a dedicated micro irrigation fund will be set up in
NABARD to achieve the goal , ‘per drop more crop’. The initial
corpus of the fund will be US$ 775.67 million.
Around 285 new irrigation projects will be undertaken in 2018 to
provide irrigation for 18.8 million hectares of land.
Visakhapatnam port traffic (million tonnes) Gross irrigated area under food grains
(‘000 hectares)
For updated information, please visit www.ibef.org Agriculture and Allied
Services 24
EXPORTS OF PROCESSED FOOD AND RELATED
PRODUCTS
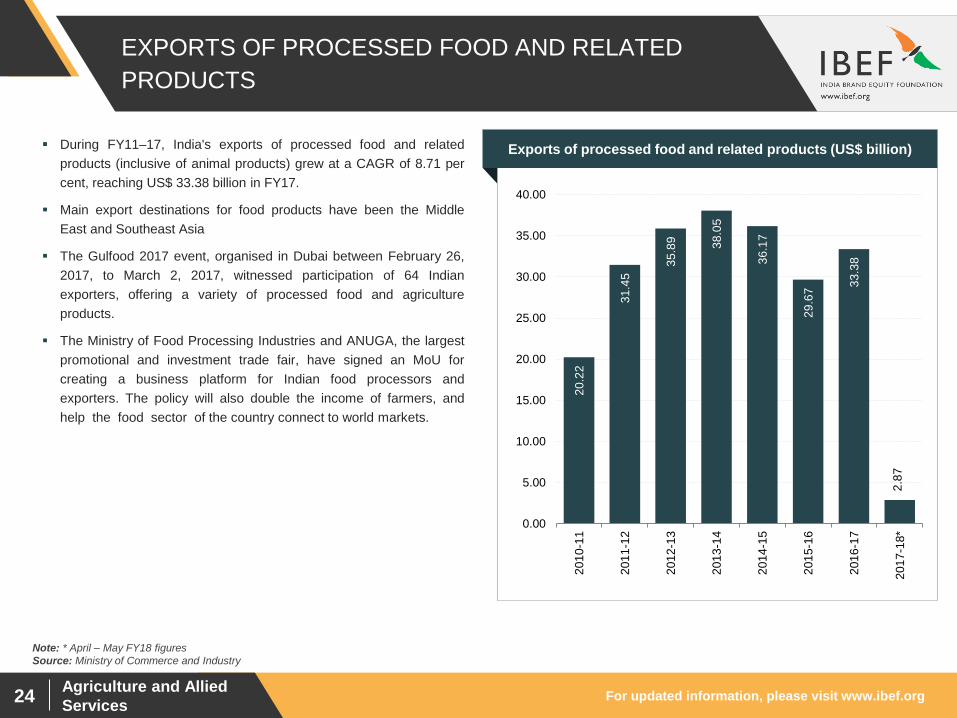
During FY11–17, India's exports of processed food and related
products (inclusive of animal products) grew at a CAGR of 8.71 per
cent, reaching US$ 33.38 billion in FY17.
Main export destinations for food products have been the Middle
East and Southeast Asia
The Gulfood 2017 event, organised in Dubai between February 26,
2017, to March 2, 2017, witnessed participation of 64 Indian
exporters, offering a variety of processed food and agriculture
products.
The Ministry of Food Processing Industries and ANUGA, the largest
promotional and investment trade fair, have signed an MoU for
creating a business platform for Indian food processors and
exporters. The policy will also double the income of farmers, and
help the food sector of the country connect to world markets.
Exports of processed food and related products (US$ billion)
Note: * April – May FY18 figures
Source: Ministry of Commerce and Industry
20
.22
31
.45
35
.89
38
.05
36
.17
29
.67
33
.38
2.8
7
0.00
5.00
10.00
15.00
20.00
25.00
30.00
35.00
40.00
201
0-1
1
201
1-1
2
201
2-1
3
201
3-1
4
201
4-1
5
201
5-1
6
201
6-1
7
201
7-1
8*
For updated information, please visit www.ibef.org Agriculture and Allied
Services 25
INSTITUTIONAL CREDIT TO AGRICULTURE ON A RISE
74
90
10
0
12
1
14
6 1
57
15
9 16
9
90
90
19
24
20
27
31
38
41
40
21
23
13
12
15
19
23
23
27
15
18
0
20
40
60
80
100
120
140
160
180
FY
07
FY
08
FY
09
FY
10
FY
11
FY
12
FY
13
FY
14
FY
15
FY
16*
Commercial Banks Cooperative Banks Regional Rural Banks
Source: Ministry of Agriculture, RBI, National Sample Survey Organisation (NSSO), Aranca Research *: Provisional
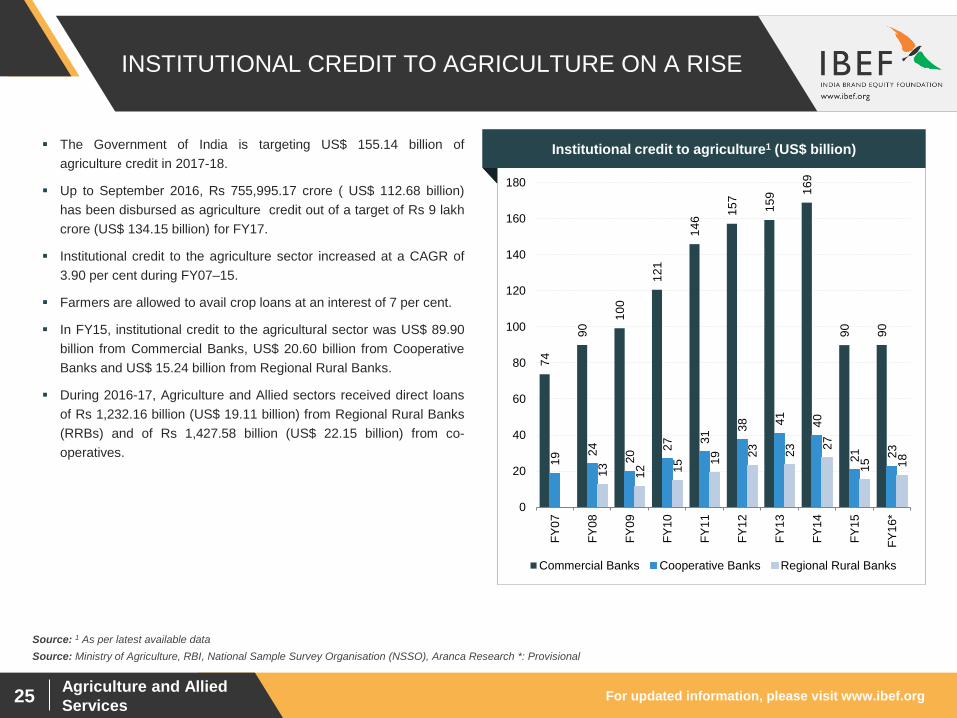
The Government of India is targeting US$ 155.14 billion of
agriculture credit in 2017-18.
Up to September 2016, Rs 755,995.17 crore ( US$ 112.68 billion)
has been disbursed as agriculture credit out of a target of Rs 9 lakh
crore (US$ 134.15 billion) for FY17.
Institutional credit to the agriculture sector increased at a CAGR of
3.90 per cent during FY07–15.
Farmers are allowed to avail crop loans at an interest of 7 per cent.
In FY15, institutional credit to the agricultural sector was US$ 89.90
billion from Commercial Banks, US$ 20.60 billion from Cooperative
Banks and US$ 15.24 billion from Regional Rural Banks.
During 2016-17, Agriculture and Allied sectors received direct loans
of Rs 1,232.16 billion (US$ 19.11 billion) from Regional Rural Banks
(RRBs) and of Rs 1,427.58 billion (US$ 22.15 billion) from co-
operatives.
Visakhapatnam port traffic (million tonnes) Institutional credit to agriculture1 (US$ billion)
Source: 1 As per latest available data
For updated information, please visit www.ibef.org Agriculture and Allied
Services 26
COMPETITIVE ADVANTAGE
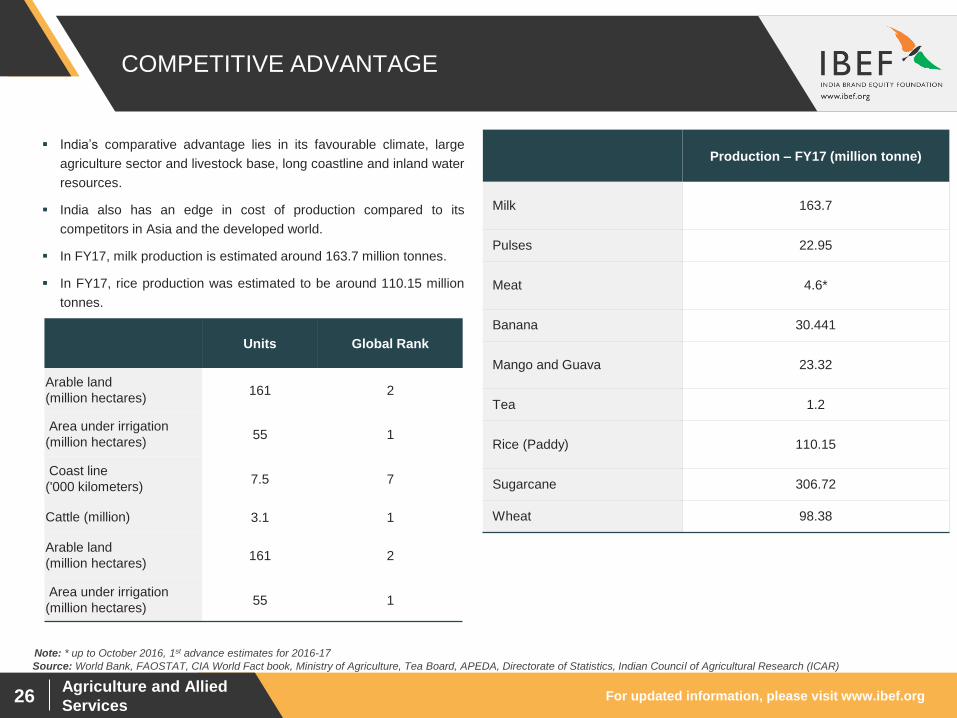
India’s comparative advantage lies in its favourable climate, large
agriculture sector and livestock base, long coastline and inland water
resources.
India also has an edge in cost of production compared to its
competitors in Asia and the developed world.
In FY17, milk production is estimated around 163.7 million tonnes.
In FY17, rice production was estimated to be around 110.15 million
tonnes.
Production – FY17 (million tonne)
Milk 163.7
Pulses 22.95
Meat 4.6*
Banana 30.441
Mango and Guava 23.32
Tea 1.2
Rice (Paddy) 110.15
Sugarcane 306.72
Wheat 98.38
Source: World Bank, FAOSTAT, CIA World Fact book, Ministry of Agriculture, Tea Board, APEDA, Directorate of Statistics, Indian Council of Agricultural Research (ICAR)
Note: * up to October 2016, 1st advance estimates for 2016-17
Units Global Rank
Arable land
(million hectares) 161 2
Area under irrigation
(million hectares) 55 1
Coast line
('000 kilometers) 7.5 7
Cattle (million) 3.1 1
Arable land
(million hectares) 161 2
Area under irrigation
(million hectares) 55 1
For updated information, please visit www.ibef.org Agriculture and Allied
Services 27
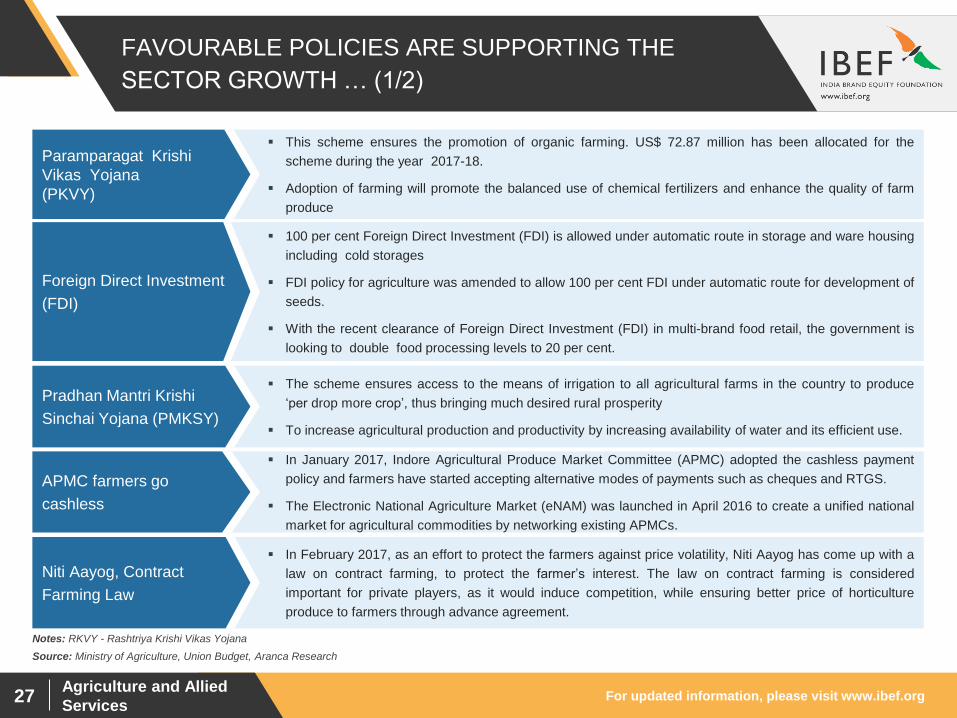
100 per cent Foreign Direct Investment (FDI) is allowed under automatic route in storage and ware housing
including cold storages
FDI policy for agriculture was amended to allow 100 per cent FDI under automatic route for development of
seeds.
With the recent clearance of Foreign Direct Investment (FDI) in multi-brand food retail, the government is
looking to double food processing levels to 20 per cent.
The scheme ensures access to the means of irrigation to all agricultural farms in the country to produce
‘per drop more crop’, thus bringing much desired rural prosperity
To increase agricultural production and productivity by increasing availability of water and its efficient use.
In February 2017, as an effort to protect the farmers against price volatility, Niti Aayog has come up with a
law on contract farming, to protect the farmer’s interest. The law on contract farming is considered
important for private players, as it would induce competition, while ensuring better price of horticulture
produce to farmers through advance agreement.
FAVOURABLE POLICIES ARE SUPPORTING THE
SECTOR GROWTH … (1/2)
This scheme ensures the promotion of organic farming. US$ 72.87 million has been allocated for the
scheme during the year 2017-18.
Adoption of farming will promote the balanced use of chemical fertilizers and enhance the quality of farm
produce
Paramparagat Krishi
Vikas Yojana
(PKVY)
Source: Ministry of Agriculture, Union Budget, Aranca Research
In January 2017, Indore Agricultural Produce Market Committee (APMC) adopted the cashless payment
policy and farmers have started accepting alternative modes of payments such as cheques and RTGS.
The Electronic National Agriculture Market (eNAM) was launched in April 2016 to create a unified national
market for agricultural commodities by networking existing APMCs.
APMC farmers go
cashless
Niti Aayog, Contract
Farming Law
Notes: RKVY - Rashtriya Krishi Vikas Yojana
Pradhan Mantri Krishi
Sinchai Yojana (PMKSY)
Foreign Direct Investment
(FDI)
For updated information, please visit www.ibef.org Agriculture and Allied
Services 28
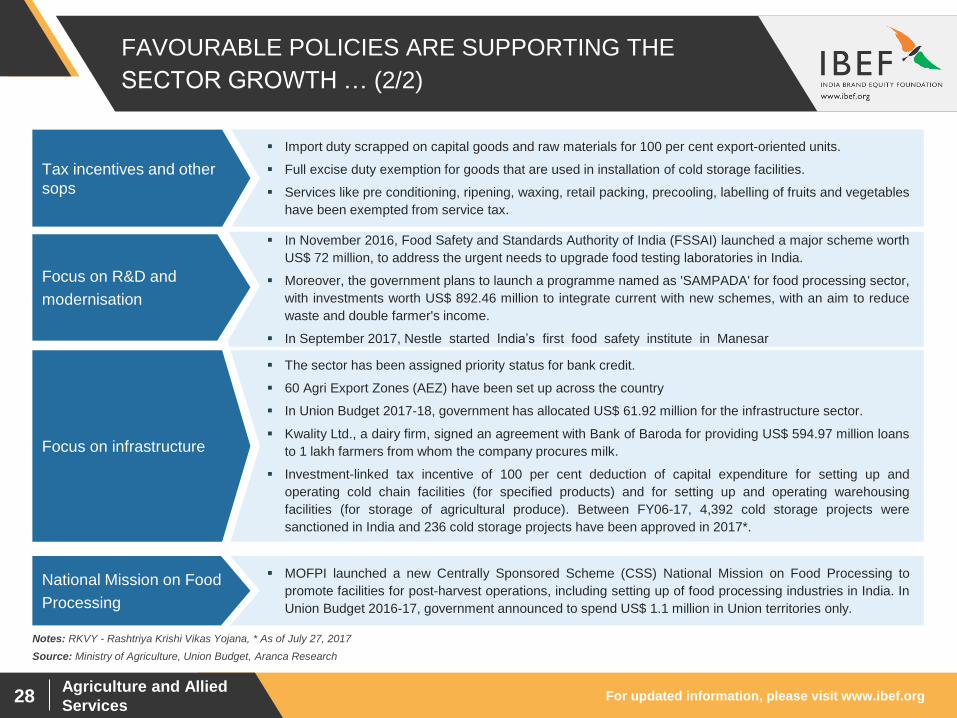
In November 2016, Food Safety and Standards Authority of India (FSSAI) launched a major scheme worth
US$ 72 million, to address the urgent needs to upgrade food testing laboratories in India.
Moreover, the government plans to launch a programme named as 'SAMPADA' for food processing sector,
with investments worth US$ 892.46 million to integrate current with new schemes, with an aim to reduce
waste and double farmer's income.
In September 2017, Nestle started India’s first food safety institute in Manesar
The sector has been assigned priority status for bank credit.
60 Agri Export Zones (AEZ) have been set up across the country
In Union Budget 2017-18, government has allocated US$ 61.92 million for the infrastructure sector.
Kwality Ltd., a dairy firm, signed an agreement with Bank of Baroda for providing US$ 594.97 million loans
to 1 lakh farmers from whom the company procures milk.
Investment-linked tax incentive of 100 per cent deduction of capital expenditure for setting up and
operating cold chain facilities (for specified products) and for setting up and operating warehousing
facilities (for storage of agricultural produce). Between FY06-17, 4,392 cold storage projects were
sanctioned in India and 236 cold storage projects have been approved in 2017*.
MOFPI launched a new Centrally Sponsored Scheme (CSS) National Mission on Food Processing to
promote facilities for post-harvest operations, including setting up of food processing industries in India. In
Union Budget 2016-17, government announced to spend US$ 1.1 million in Union territories only.
FAVOURABLE POLICIES ARE SUPPORTING THE
SECTOR GROWTH … (2/2)
Import duty scrapped on capital goods and raw materials for 100 per cent export-oriented units.
Full excise duty exemption for goods that are used in installation of cold storage facilities.
Services like pre conditioning, ripening, waxing, retail packing, precooling, labelling of fruits and vegetables
have been exempted from service tax.
Tax incentives and other
sops
Source: Ministry of Agriculture, Union Budget, Aranca Research
National Mission on Food
Processing
Notes: RKVY - Rashtriya Krishi Vikas Yojana, * As of July 27, 2017
Focus on infrastructure
Focus on R&D and
modernisation
For updated information, please visit www.ibef.org Agriculture and Allied
Services 29
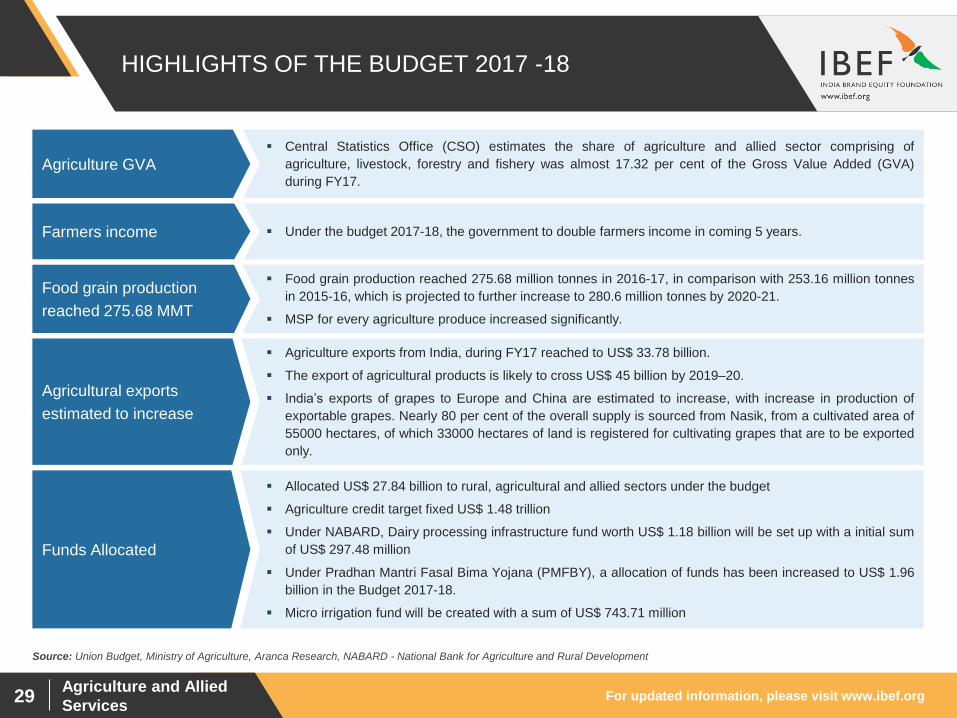
Central Statistics Office (CSO) estimates the share of agriculture and allied sector comprising of
agriculture, livestock, forestry and fishery was almost 17.32 per cent of the Gross Value Added (GVA)
during FY17.
Under the budget 2017-18, the government to double farmers income in coming 5 years.
Agriculture exports from India, during FY17 reached to US$ 33.78 billion.
The export of agricultural products is likely to cross US$ 45 billion by 2019–20.
India’s exports of grapes to Europe and China are estimated to increase, with increase in production of
exportable grapes. Nearly 80 per cent of the overall supply is sourced from Nasik, from a cultivated area of
55000 hectares, of which 33000 hectares of land is registered for cultivating grapes that are to be exported
only.
Food grain production reached 275.68 million tonnes in 2016-17, in comparison with 253.16 million tonnes
in 2015-16, which is projected to further increase to 280.6 million tonnes by 2020-21.
MSP for every agriculture produce increased significantly.
Allocated US$ 27.84 billion to rural, agricultural and allied sectors under the budget
Agriculture credit target fixed US$ 1.48 trillion
Under NABARD, Dairy processing infrastructure fund worth US$ 1.18 billion will be set up with a initial sum
of US$ 297.48 million
Under Pradhan Mantri Fasal Bima Yojana (PMFBY), a allocation of funds has been increased to US$ 1.96
billion in the Budget 2017-18.
Micro irrigation fund will be created with a sum of US$ 743.71 million
HIGHLIGHTS OF THE BUDGET 2017 -18
Source: Union Budget, Ministry of Agriculture, Aranca Research, NABARD - National Bank for Agriculture and Rural Development
Agricultural exports
estimated to increase
Funds Allocated
Food grain production
reached 275.68 MMT
Farmers income
Agriculture GVA
Agriculture and Allied Services
OPPORTUNITIES
For updated information, please visit www.ibef.org Agriculture and Allied
Services 31
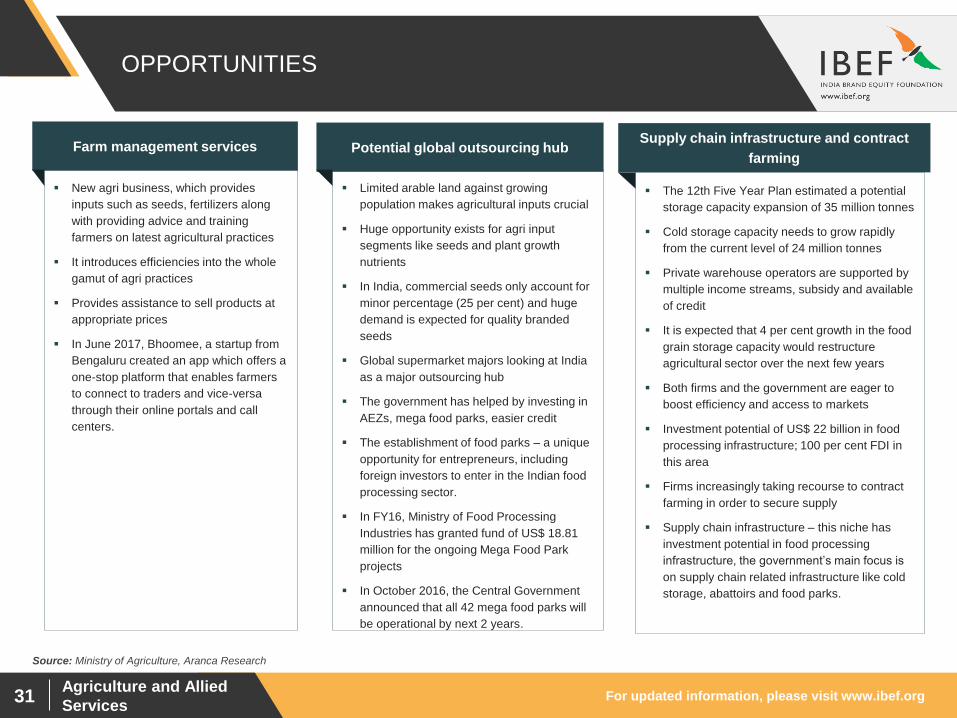
OPPORTUNITIES
New agri business, which provides
inputs such as seeds, fertilizers along
with providing advice and training
farmers on latest agricultural practices
It introduces efficiencies into the whole
gamut of agri practices
Provides assistance to sell products at
appropriate prices
In June 2017, Bhoomee, a startup from
Bengaluru created an app which offers a
one-stop platform that enables farmers
to connect to traders and vice-versa
through their online portals and call
centers.
Farm management services
Limited arable land against growing
population makes agricultural inputs crucial
Huge opportunity exists for agri input
segments like seeds and plant growth
nutrients
In India, commercial seeds only account for
minor percentage (25 per cent) and huge
demand is expected for quality branded
seeds
Global supermarket majors looking at India
as a major outsourcing hub
The government has helped by investing in
AEZs, mega food parks, easier credit
The establishment of food parks – a unique
opportunity for entrepreneurs, including
foreign investors to enter in the Indian food
processing sector.
In FY16, Ministry of Food Processing
Industries has granted fund of US$ 18.81
million for the ongoing Mega Food Park
projects
In October 2016, the Central Government
announced that all 42 mega food parks will
be operational by next 2 years.
Potential global outsourcing hub
The 12th Five Year Plan estimated a potential
storage capacity expansion of 35 million tonnes
Cold storage capacity needs to grow rapidly
from the current level of 24 million tonnes
Private warehouse operators are supported by
multiple income streams, subsidy and available
of credit
It is expected that 4 per cent growth in the food
grain storage capacity would restructure
agricultural sector over the next few years
Both firms and the government are eager to
boost efficiency and access to markets
Investment potential of US$ 22 billion in food
processing infrastructure; 100 per cent FDI in
this area
Firms increasingly taking recourse to contract
farming in order to secure supply
Supply chain infrastructure – this niche has
investment potential in food processing
infrastructure, the government’s main focus is
on supply chain related infrastructure like cold
storage, abattoirs and food parks.
Supply chain infrastructure and contract
farming
Source: Ministry of Agriculture, Aranca Research
For updated information, please visit www.ibef.org Agriculture and Allied
Services 32
AGRO CHEMICALS … (1/2)
1.0
5
1.1
5
1.3
8
1.6
6
1.9
2
1.9
5
1.9
6
6.3
0
0
1
2
3
4
5
6
7
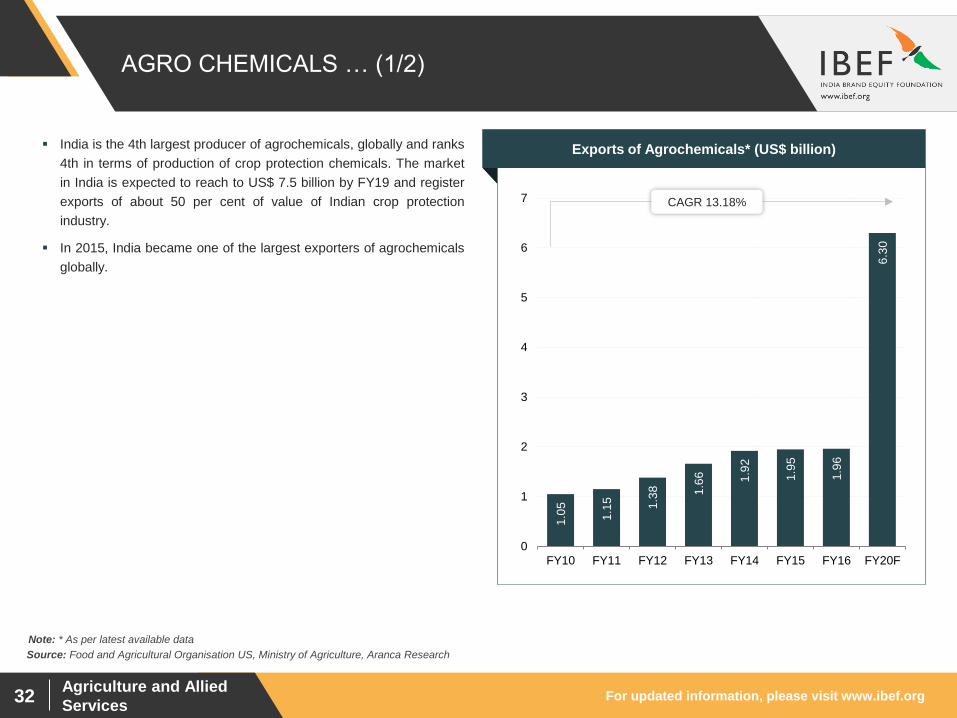
FY10 FY11 FY12 FY13 FY14 FY15 FY16 FY20F
CAGR 13.18%
Source: Food and Agricultural Organisation US, Ministry of Agriculture, Aranca Research
India is the 4th largest producer of agrochemicals, globally and ranks
4th in terms of production of crop protection chemicals. The market
in India is expected to reach to US$ 7.5 billion by FY19 and register
exports of about 50 per cent of value of Indian crop protection
industry.
In 2015, India became one of the largest exporters of agrochemicals
globally.
Visakhapatnam port traffic (million tonnes) Exports of Agrochemicals* (US$ billion)
Note: * As per latest available data
For updated information, please visit www.ibef.org Agriculture and Allied
Services 33
AGRO CHEMICALS … (2/2)
24
%
13
%
11
%
8%
7%
7%
5%
5%
5%
15
%
0%
5%
10%
15%
20%
25%
30%
Source: Food and Agricultural Organisation US, Ministry of Agriculture, Aranca Research
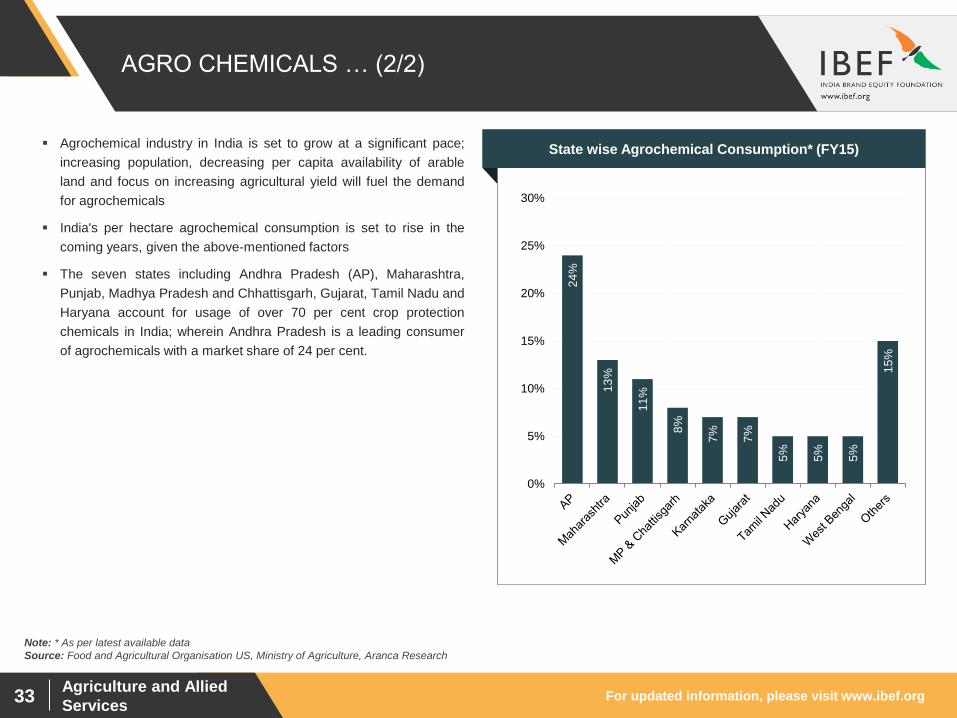
Agrochemical industry in India is set to grow at a significant pace;
increasing population, decreasing per capita availability of arable
land and focus on increasing agricultural yield will fuel the demand
for agrochemicals
India's per hectare agrochemical consumption is set to rise in the
coming years, given the above-mentioned factors
The seven states including Andhra Pradesh (AP), Maharashtra,
Punjab, Madhya Pradesh and Chhattisgarh, Gujarat, Tamil Nadu and
Haryana account for usage of over 70 per cent crop protection
chemicals in India; wherein Andhra Pradesh is a leading consumer
of agrochemicals with a market share of 24 per cent.
Visakhapatnam port traffic (million tonnes) State wise Agrochemical Consumption* (FY15)
Note: * As per latest available data
For updated information, please visit www.ibef.org Agriculture and Allied
Services 34
GOVERNMENT INITIATIVES THAT WILL FURTHER
PROP UP THE SECTOR
Source: Ministry of Agriculture, DIPP, Aranca Research; Note: RFID – Radio Frequency Identification
Allocation of US$ 3.9 billion for RFID, US$ 234 million for long – term rural credit fund, US$ 7.03 billion for short – term cooperative rural credit
finance fund, US$ 3.9 billion for short – term RRB refinance fund
Target of US$ 155.14 billion agricultural credit during 2017 – 18.
The Food Processing Industries have taken few initiatives for developing the food – processing sector that would enhance the exports of agro and
processed foods and income of farmers
Government is planning to invest US$ 8 billion so as to revive 4 fertilizer plants and setting up 2 plants to produce farm nutrients
Financial Outlay of US$ 35.47 million has been announced under the National Dairy Development Board (NDDB) to boost milk output and per
animal production of milk
In March 2017, the government has approved the creation of buffer crops to stabilised prices as well as increase their imports, For the same, an
agency named as Buffer Stock Management Agency (BSMA) has been formed, which is responsible for efficient management like liquidation,
storage, maintenance and procurement of the stock.
In March 2017, the government created a Banana Research Centre in Vaishali, Bihar, as the district’s climate is best suited for production of
bananas.
In May 2017, the government signed an MoU with Malaysia to develop Ammonia and Urea manufacturing plant. The project is expected to cost
around US$ 2.1 billion and will have a capacity to produce 2.4 million tonnes of Urea and 1.35 million tonnes of Ammonia annually.
In May 2017, the Ministry of Agriculture and Farmers Welfare launched e-Krishi Samvad, an internet-based platform that will provide direct and
effective solutions to the problems faced by farmers and stakeholders in the agriculture sector.
In May 2017, the Ministry of Agriculture voiced plans for the development of the agricultural sector under which the ministry has decided to set up
500,000 tonnes of cold storage capacity, 1,000 pack houses and 150 ripening chambers. The ministry also plans to rollout a model contract
farming law by October 2017.

Agriculture and Allied Services
CASE STUDIES
For updated information, please visit www.ibef.org Agriculture and Allied
Services 36
RALLIS INDIA: BENEFITTING FROM DEMAND OF
AGRICULTURAL INPUTS
14
0.5
17
4.3
18
5.3
23
3.6
26
6.5
26
5.1
28
6.3
29
7.3
21
4.5
23
3.6
30
.5
22
.3
31
.8
38
.4
31
.1
31
.7
39
.4
36
.8
25
.2
41
.2
0.0
50.0
100.0
150.0
200.0
250.0
300.0
350.0
FY
08
FY
09
FY
10
FY
11
FY
12
FY
13
FY
14
FY
15
FY
16
FY
17
Net Sales Profit before taxes
Source: Company website, Aranca Research
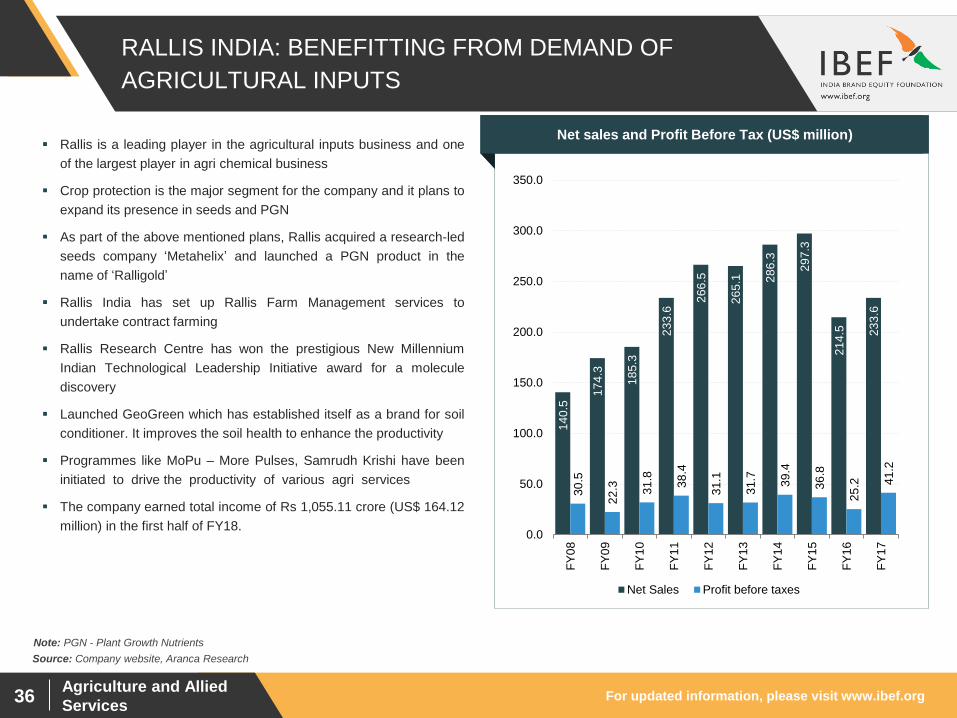
Rallis is a leading player in the agricultural inputs business and one
of the largest player in agri chemical business
Crop protection is the major segment for the company and it plans to
expand its presence in seeds and PGN
As part of the above mentioned plans, Rallis acquired a research-led
seeds company ‘Metahelix’ and launched a PGN product in the
name of ‘Ralligold’
Rallis India has set up Rallis Farm Management services to
undertake contract farming
Rallis Research Centre has won the prestigious New Millennium
Indian Technological Leadership Initiative award for a molecule
discovery
Launched GeoGreen which has established itself as a brand for soil
conditioner. It improves the soil health to enhance the productivity
Programmes like MoPu – More Pulses, Samrudh Krishi have been
initiated to drive the productivity of various agri services
The company earned total income of Rs 1,055.11 crore (US$ 164.12
million) in the first half of FY18.
Visakhapatnam port traffic (million tonnes) Net sales and Profit Before Tax (US$ million)
Note: PGN - Plant Growth Nutrients
For updated information, please visit www.ibef.org Agriculture and Allied
Services 37
THE AMUL SAGA: A COOPERATIVE MOVEMENT
LEADS THE WAY … (1/2)
0.9
1.3
1.5
1.7
2.1
2.4
2.5
3.0
3.4
3.5
4.2
0.0
0.5
1.0
1.5
2.0
2.5
3.0
3.5
4.0
4.5
FY07 FY08 FY09 FY10 FY11 FY12 FY13 FY14 FY15 FY16 FY17
CAGR 16.29%
Source: Company website, Aranca Research
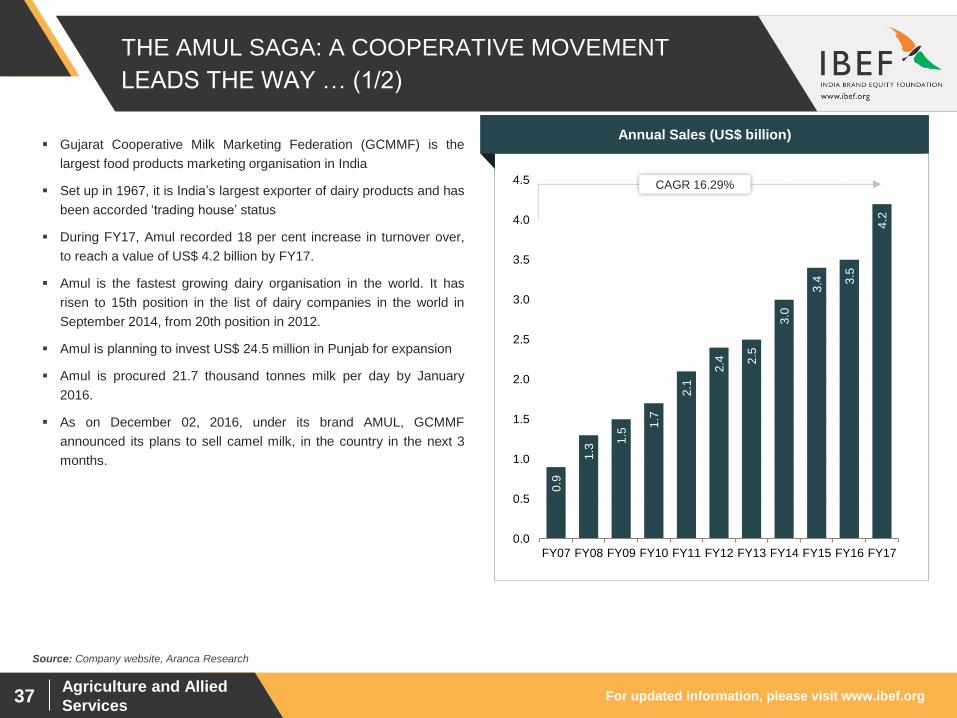
Gujarat Cooperative Milk Marketing Federation (GCMMF) is the
largest food products marketing organisation in India
Set up in 1967, it is India’s largest exporter of dairy products and has
been accorded ‘trading house’ status
During FY17, Amul recorded 18 per cent increase in turnover over,
to reach a value of US$ 4.2 billion by FY17.
Amul is the fastest growing dairy organisation in the world. It has
risen to 15th position in the list of dairy companies in the world in
September 2014, from 20th position in 2012.
Amul is planning to invest US$ 24.5 million in Punjab for expansion
Amul is procured 21.7 thousand tonnes milk per day by January
2016.
As on December 02, 2016, under its brand AMUL, GCMMF
announced its plans to sell camel milk, in the country in the next 3
months.
Visakhapatnam port traffic (million tonnes) Annual Sales (US$ billion)
For updated information, please visit www.ibef.org Agriculture and Allied
Services 38
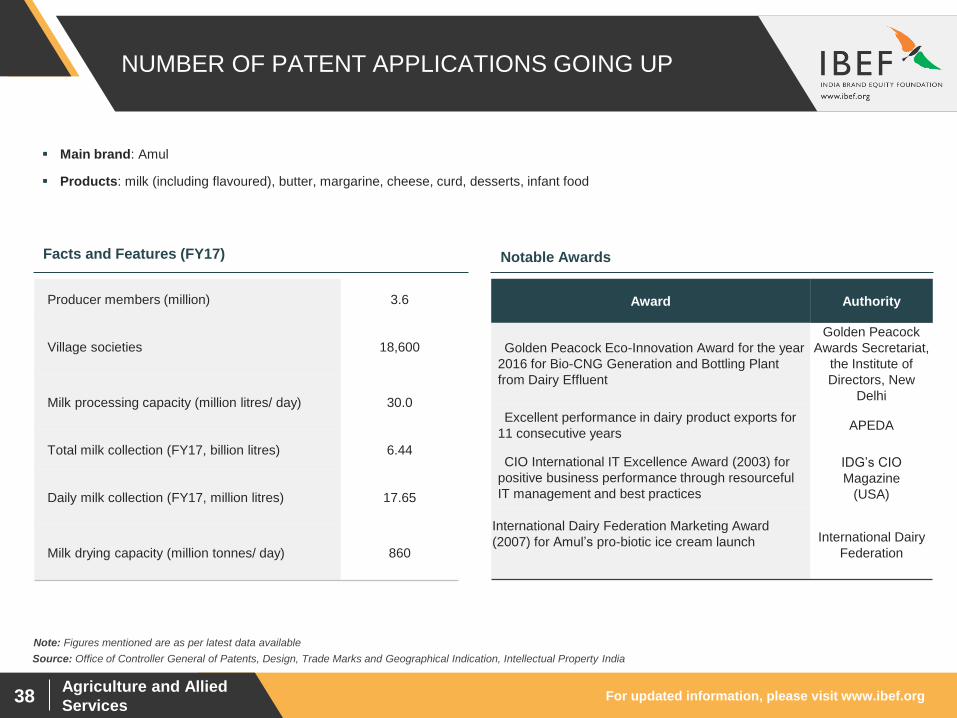
NUMBER OF PATENT APPLICATIONS GOING UP
Main brand: Amul
Products: milk (including flavoured), butter, margarine, cheese, curd, desserts, infant food
Source: Office of Controller General of Patents, Design, Trade Marks and Geographical Indication, Intellectual Property India
Note: Figures mentioned are as per latest data available
Producer members (million) 3.6
Village societies 18,600
Milk processing capacity (million litres/ day) 30.0
Total milk collection (FY17, billion litres) 6.44
Daily milk collection (FY17, million litres) 17.65
Milk drying capacity (million tonnes/ day) 860
Award Authority
Golden Peacock Eco-Innovation Award for the year
2016 for Bio-CNG Generation and Bottling Plant
from Dairy Effluent
Golden Peacock
Awards Secretariat,
the Institute of
Directors, New
Delhi
Excellent performance in dairy product exports for
11 consecutive years APEDA
CIO International IT Excellence Award (2003) for
positive business performance through resourceful
IT management and best practices
IDG’s CIO
Magazine
(USA)
International Dairy Federation Marketing Award
(2007) for Amul’s pro-biotic ice cream launch
International Dairy
Federation
Facts and Features (FY17) Notable Awards
Agriculture and Allied Services
INDUSTRY
ASSOCIATIONS
For updated information, please visit www.ibef.org Agriculture and Allied
Services 40
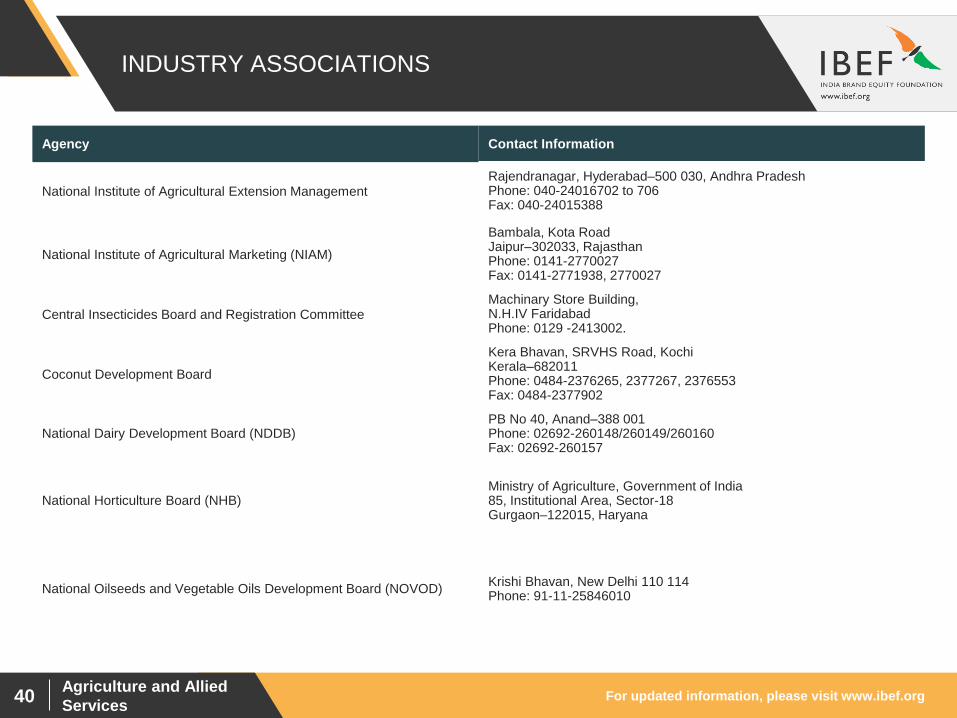
INDUSTRY ASSOCIATIONS
Agency Contact Information
National Institute of Agricultural Extension Management Rajendranagar, Hyderabad–500 030, Andhra Pradesh Phone: 040-24016702 to 706 Fax: 040-24015388
National Institute of Agricultural Marketing (NIAM)
Bambala, Kota Road Jaipur–302033, Rajasthan Phone: 0141-2770027 Fax: 0141-2771938, 2770027
Central Insecticides Board and Registration Committee Machinary Store Building, N.H.IV Faridabad Phone: 0129 -2413002.
Coconut Development Board
Kera Bhavan, SRVHS Road, Kochi Kerala–682011 Phone: 0484-2376265, 2377267, 2376553 Fax: 0484-2377902
National Dairy Development Board (NDDB)
PB No 40, Anand–388 001 Phone: 02692-260148/260149/260160 Fax: 02692-260157
National Horticulture Board (NHB)
Ministry of Agriculture, Government of India 85, Institutional Area, Sector-18 Gurgaon–122015, Haryana
National Oilseeds and Vegetable Oils Development Board (NOVOD)
Krishi Bhavan, New Delhi 110 114 Phone: 91-11-25846010

Agriculture and Allied Services
USEFUL
INFORMATION
For updated information, please visit www.ibef.org Agriculture and Allied
Services 42
GLOSSARY
AIBP: Accelerated Irrigation Benefit Programme
Breeder seeds: Seeds move from germ-plasm (research) stage to breeder stage
CAGR: Compound Annual Growth Rate
Certified/quality seeds: Foundation seeds are further multiplied to get certified seeds, which are sold to farmers
FMTTI: Farm Machinery Training and Testing Institutes
Foundation seeds: Breeder seeds are multiplied as foundation seeds
FY: Indian Financial Year (April to March) – FY12 implies April 2011 to March 2012
KCC: Kisan Credit Card
MSP: Minimum Support Prices
NFSM: National Food Security Mission
NMAM: National Mission on Agricultural Mechanisation
PGN: Plant Growth Nutrients
RKVY: Rashtriya Krushi Vikas Yojana is a central government scheme providing funds to state governments to spend on agriculture
Wherever applicable, numbers have been rounded off to the nearest whole number
For updated information, please visit www.ibef.org Education and
Training 43
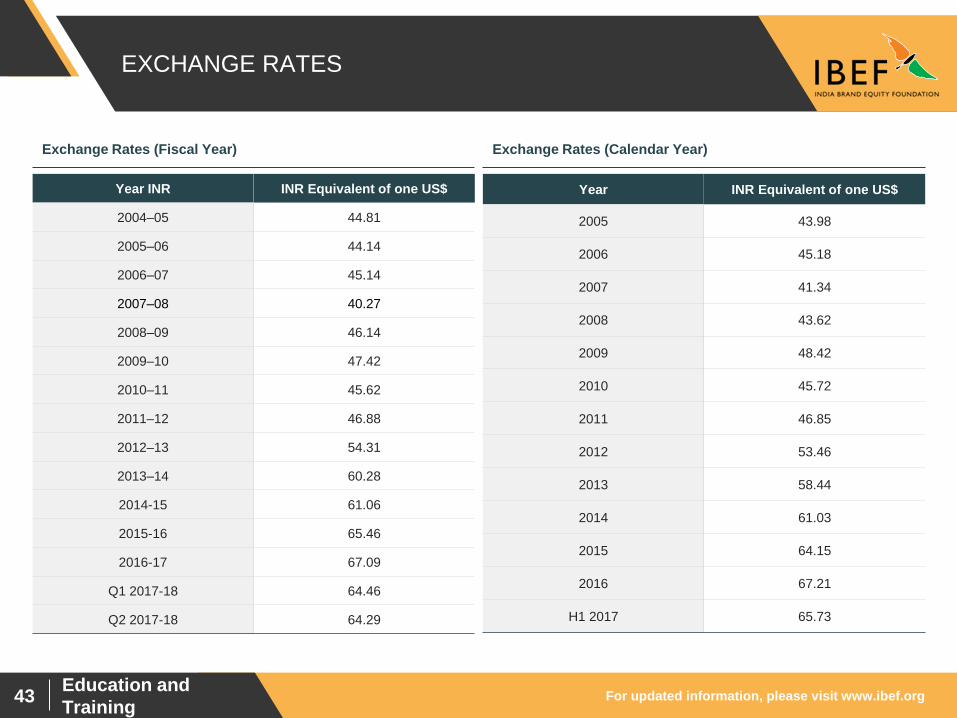
EXCHANGE RATES
Exchange Rates (Fiscal Year) Exchange Rates (Calendar Year)
Year INR INR Equivalent of one US$
2004–05 44.81
2005–06 44.14
2006–07 45.14
2007–08 40.27
2008–09 46.14
2009–10 47.42
2010–11 45.62
2011–12 46.88
2012–13 54.31
2013–14 60.28
2014-15 61.06
2015-16 65.46
2016-17 67.09
Q1 2017-18 64.46
Q2 2017-18 64.29
Year INR Equivalent of one US$
2005 43.98
2006 45.18
2007 41.34
2008 43.62
2009 48.42
2010 45.72
2011 46.85
2012 53.46
2013 58.44
2014 61.03
2015 64.15
2016 67.21
H1 2017 65.73
For updated information, please visit www.ibef.org Agriculture and Allied
Services 44
DISCLAIMER
India Brand Equity Foundation (IBEF) engaged Aranca to prepare this presentation and the same has been prepared by Aranca in consultation
with IBEF.
All rights reserved. All copyright in this presentation and related works is solely and exclusively owned by IBEF. The same may not be reproduced,
wholly or in part in any material form (including photocopying or storing it in any medium by electronic means and whether or not transiently or
incidentally to some other use of this presentation), modified or in any manner communicated to any third party except with the written approval
of IBEF.
This presentation is for information purposes only. While due care has been taken during the compilation of this presentation to ensure that the
information is accurate to the best of Aranca and IBEF’s knowledge and belief, the content is not to be construed in any manner whatsoever as a
substitute for professional advice.
Aranca and IBEF neither recommend nor endorse any specific products or services that may have been mentioned in this presentation and nor do
they assume any liability or responsibility for the outcome of decisions taken as a result of any reliance placed on this presentation.
Neither Aranca nor IBEF shall be liable for any direct or indirect damages that may arise due to any act or omission on the part of the user due to any
reliance placed or guidance taken from any portion of this presentation.