Embed Size (px)
Citation preview

AGRICULTURAL RESEARCH IN SOUTHEAST ASIAA CROSS-COUNTRY ANALYSIS OF RESOURCE ALLOCATION, PERFORMANCE, AND IMPACT ON PRODUCTIVITYGert-Jan Stads, Alejandro Nin Pratt, Norah Omot, and Nguyen Thi Pham
OCTOBER 2020
facilitated by APAARI and IFPRI


AGRICULTURAL RESEARCH IN SOUTHEAST ASIAA CROSS-COUNTRY ANALYSIS OF RESOURCE ALLOCATION, PERFORMANCE, AND IMPACT ON PRODUCTIVITYGert-Jan Stads, Alejandro Nin Pratt, Norah Omot, and Nguyen Thi Pham
OCTOBER 2020
facilitated by APAARI and IFPRI
INDO-PACIFIC

ABOUT ASTI
Extensive empirical evidence demonstrates that agricultural research investment has greatly contributed to economic growth, agricultural development, and poverty reduction in developing regions. Numerous global and regional initiatives emphasize the importance of agricultural research to achieving the productivity growth urgently needed to feed expanding populations; reduce poverty levels; respond to shifting consumption patterns; and address new challenges, such as those imposed by climate change. ASTI contributes to this agenda by collecting and publishing quantitative and qualitative information and trends on spending levels and allocations, funding sources, human resource capacities, research outputs, and institutional developments in agricultural research. In addition, it conducts in-depth analyses of the performance and efficiency of agricul-tural research systems and the long-term impact of agricultural research investment on productivity growth. Working with a large network of country-level collaborators, ASTI conducts primary surveys to collect data from government, higher education, nonprofit, and (when possible) private agricultural research agencies in around 90 low- and middle-income countries worldwide. In the Indo–Pacific region, ASTI is co-led by the International Food Policy Research Institute (IFPRI) and the Asia–Pacific Association of Agricultural Research Institutions (APAARI).
ABOUT IFPRI
Established in 1975, IFPRI provides research-based policy solutions to sustainably reduce poverty and end hunger and malnutrition. The Institute conducts research, communicates results, optimizes partnerships, and builds capacity to ensure sustainable food production, promote healthy food systems, improve markets and trade, transform agriculture, build resilience, and strengthen institutions and governance.
ABOUT APAARI
Established in 1990, APAARI is a knowledge facilitator aimed at strengthening agri-food research and innova-tion systems in the Asia–Pacific region. It connects its members, partners, and other stakeholders through regional dialogue and collective actions.
ABOUT THE AUTHORS
Gert-Jan Stads ([email protected]) is ASTI’s senior program manager, based at IFPRI.Alejandro Nin Pratt ([email protected]) is a senior research fellow, based at IFPRI.Norah Omot ([email protected]) is ASTI’s coordinator for the Asia–Pacific region, based at APAARI.Nguyen Thi Pham ([email protected]) is an ASTI research assistant, based at APAARI.
II |

ACKNOWLEDGMENTS
The authors are grateful to Isiwat Bandrapiwat, Roslina Binti Ali, Ernesto Brown, Pol Chanthy, Tran Danh Suu, Thanda Kyi, Aeintjue Kay Khing, Cho Cho San, Arif Surahman, Pham Thi Xuan, Phonepaseuth Vongsipasom, Princess Alma Ani, and Truong Thi Thu Trang for coordinating national survey rounds in their respective coun-tries and for their vital contributions to ASTI’s country-level publications. The authors also thank the very large number of research agencies that provided detailed data to the national surveys. Without the commitment of these participating individuals and agencies, ASTI’s work in Southeast Asia would not have been possible. The authors also thank Lang Gao and Léa Vicky Magne Domgho for their outstanding research support; Tarathip Sanboonkrong and Tansitha Tanaphatrujira for their logistical support; Nienke Beintema and Ravi Khetarpal for comments on drafts of this report; Mary Jane Banks and Joan Stephens for their invaluable editing and design contributions; and Martina Spisiakova and Sasireka Rajendran for their important role in disseminating the findings of this report. Finally, the authors express special thanks to the Australian Centre for International Agricultural Research (ACIAR) for its generous funding of ASTI’s activities in Southeast Asia and the Pacific, and to ACIAR’s country managers for facilitating the survey work.
RELATED ASTI OUTPUTS
• ASTI’s country briefs provide visual, highly accessible presentations of recent institutional, financial, and human resource trends in national agricultural research. They also feature a more in-depth analyses of the key challenges that individual agricultural research systems currently face, along with policy options to address these challenges.
• ASTI’s interactive country pages allow users to access detailed data on investment and human resource trends in agricultural research, and to download country-level publications and other information.
• ASTI’s country benchmarking tool for Southeast Asia enables cross-country comparisons and rankings of key ASTI indicators.
• ASTI’s data download tool allows users to explore in-depth datasets, to filter the data by country and indicator, and to view the data graphically.
• ASTI’s agency directory allows users to search and filter agencies by a number of criteria, including by country, and to locate agencies on a map.
This publication has not been peer reviewed. The views expressed are those of the authors and do not necessarily reflect the official posi-tion of the International Food Policy Research Institute, the Asia–Pacific Association of Agricultural Research Institutions, or their partners.
Copyright © 2020 International Food Policy Research Institute and Asia–Pacific Association of Agricultural Research Institutions. Sections of this document may be reproduced without the express permission of, but with acknowledgment to, IFPRI and APAARI. This publication is licensed for use under a Creative Commons Attribution 4.0 International License (CC BY 4.0). To view this license, visit https://creative-commons.org/licenses/by/4.0.
Photo Credits: © Neil Palmer/CIAT, Georgina Smith/CIAT, Ulet Ifansasti/CIFOR, and International Rice Research Institute image collection
| III

TABLE OF CONTENTS
LIST OF ACRONYMS VII
EXECUTIVE SUMMARY IV
1| INTRODUCTION 1
2| INSTITUTIONAL CONTEXT 3
3| HUMAN RESOURCES 9
Composition of Agricultural Researchers by Qualification Level 11
Composition of Agricultural Researchers by Age Bracket 14
Composition of Agricultural Researchers by Gender 15
Agricultural Research Support Staff 17
Agricultural Research Focus 19
4| FINANCIAL RESOURCES 21
Quantifying Southeast Asia’s Level of Underinvestment in Agricultural R&D 25
Allocation of Agricultural Research Expenditures across Cost Categories 28
Funding Sources of Agricultural R&D 29
5| AGRICULTURAL RESEARCH OUTPUTS 33
Scientific Publications 34
Newly Released Varieties 36
6| PERFORMANCE OF AGRICULTURAL RESEARCH SYSTEMS 39
Cost per Unit of Research Output 40
Productivity per Researcher versus Cost per Researcher 40
Cost Structure and Human Resources 43
Research Investment Intensity and Funding 44
Overall performance 45
7| FUTURE PRODUCTIVITY GROWTH THROUGH INCREASED AGRICULTURAL RESEARCH INVESTMENT 47
Impact of Higher Research Investment on Agricultural Productivity 48
Prioritizing Research Investment in Staple versus High-Value Crops 50
Impact of Increased R&D Investment on Future Agricultural Production, Consumption, and Trade 55
IV | AGRICULTURAL RESEARCH IN SOUTHEAST ASIA

8| CONCLUSION AND POLICY RECOMMENDATIONS 59
APPENDIX A—ASTI'S INDICATOR OF ATTAINABLE RESEARCH INTENSITY 63
APPENDIX B—FRAMEWORK FOR ASSESSING THE PERFORMANCE OF AGRICULTURAL
RESEARCH SYSTEMS 65
APPENDIX C—R&D INVESTMENT AND KNOWLEDGE STOCKS 69
APPENDIX D—TOTAL FACTOR PRODUCTIVITY PROJECTIONS 71
REFERENCES 73
LIST OF BOXES
1| Private Agricultural Research in Southeast Asia 7
2| Quantifying Agricultural Researcher Numbers and Research Spending 10
3| The Impact of COVID-19 on Agricultural Research 31
4| Agricultural Extension in Southeast Asia 36
5| Long-Term Agricultural Productivity Growth 51
LIST OF FIGURES
1| Institutional composition of agricultural research, 2017 6
2| FTE agricultural researchers by degree, 2017 12
3| Distribution of agricultural researchers by qualification level, 2017 13
4| Distribution of agricultural researchers by age bracket, 2017 14
5| Share of female agricultural researchers by country, 2003 and 2017 16
6| Distribution of PhD-qualified agricultural researchers by gender, 2017 17
7| Support-staff-to-researcher ratios, 2017 18
8| Focus of agricultural research by country, 2017 19
9| Focus of crop researchers, 2017 20
10| Agricultural R&D spending in Southeast Asia, 2000–2017 22
11| Regional agricultural R&D spending as a share of AgGDP, 2000–2017 24
12| Actual agricultural research intensity ratios and attainable targets, 2017 26
13| Spending by cost category for the main government research agencies, 2013–2017 averages 27
14| Agricultural R&D funding by source for the main government agencies, 2013–2017 averages 29
TABLE OF CONTENTS | V

15| Number of peer-reviewed publications per FTE researcher, 2013–2017 averages 34
16| Determinants of country-level costs per unit of research output 41
17| Agricultural research spending per quality-adjusted article, 2013–2017 42
18| Productivity of researchers and cost per researcher, 2013–2017 42
19| Regional productivity growth projections under two investment scenarios to 2050 49
20| Projected average yearly growth in agricultural productivity under two investment scenarios, 2016–2050 50
21| Projected relative growth in agricultural productivity under four agricultural research investment scenarios, 2016–2050 54
A1| R&D intensity index using two partial measures 64
B1| Agricultural research spending and number of quality-adjusted articles published in agricultural journals, 2013–2016 average 68
C1| Evolution of knowledge stocks, 1981–2017, and projections under the Business-as-usual scenario to 2050 70
LIST OF TABLES
1| Number of agencies conducting agricultural research, 2017 6
2| Principal agricultural R&D agencies in Southeast Asian countries and their relative share of total national FTE research capacity, 2017 8
3| Number of agricultural researchers by country, 2000, 2013, and 2017 11
4| Number of PhD-qualified agricultural researchers, 2003, 2013, and 2017 12
5| Agricultural R&D spending by country, 2000, 2013, and 2017 23
6| Agricultural research intensity ratios by country, 2000, 2013, and 2017 24
7| Number of new varieties released and formally registered by Southeast Asia’s main government research agencies, 2013/14–2017/18 37
8| Indicators of qualification of human resources and cost structure, 2013–2017 43
9| Indicators of investment intensity and sources of funding, 2013–2017 43
10| Summary of performance of research systems, strengths, and weaknesses 46
11| Crop share of total harvested area, 2013–2016, and average yearly change in crop share, 1991–2016 53
12| Share of crop, livestock, and fisheries output, 2016, and yearly change, 1991–2016 54
13| Consumption and net exports of agricultural commodities as a share of output, 2016, and projected shifts by 2050 under the Business-as-usual and Closing-the-gap R&D investment scenarios 57
C1| Estimated parameters of the PIM knowledge stock model for advanced and less-advanced research systems 69
D1| Elasticities determining changes in total factor productivity resulting from changes in stocks of domestic knowledge 72
VI | AGRICULTURAL RESEARCH IN SOUTHEAST ASIA

LIST OF ACRONYMS
ACIAR Australian Centre for International Agricultural Research
AgGDP agricultural gross domestic product
AH quality-adjusted published research article
AMFR Agency for Marine and Fisheries Research [Indonesia]
APAARI Asia–Pacific Association of Agricultural Research Institutions
ASEAN Association of Southeast Asian Nations
CARDI Cambodian Agricultural Research and Development Institute
DA Department of Agriculture [Thailand]
DAR Department of Agricultural Research [Myanmar]
DEA data envelopment analysis
FAO Food and Agriculture Organization of the United Nations
FELDA Federal Land Development Authority [Malaysia]
FORDA Forestry and Environment Research Development and Innovation Agency [Indonesia]
FTE(s) full-time equivalent [agricultural researcher(s)]
GDP gross domestic product
IAARD Indonesian Agency for Agricultural Research and Development
IFPRI International Food Policy Research Institute
IPB Bogor Agricultural University [Indonesia]
IRIEC Indonesian Research Institute for Estate Crops
JICA Japanese International Cooperation Agency
MARDI Malaysian Agricultural Research and Development Institute
MOAC Ministry of Agriculture and Cooperatives [Thailand]
NAFRI National Agriculture and Forestry Research Institute [Laos]
NARS(s) national agricultural research system(s)
NGO(s) nongovernmental organization(s)
PIM perpetual inventory method
PLS partial least squares
PPP(s) purchasing power parity [index]
R&D research and experimental development
RD Rice Department [Thailand]
S&T science and technology
SMART Sinar Mas Agro Resources and Technology [Indonesia]
SMARTD Sustainable Management of Agricultural Research and Technology Dissemination [Indonesia]
TFP total factor productivity
VAAS Vietnam Academy of Agricultural Sciences
VINASEED Vietnam National Seed Corporation
LIST OF ACRONYMS | VII

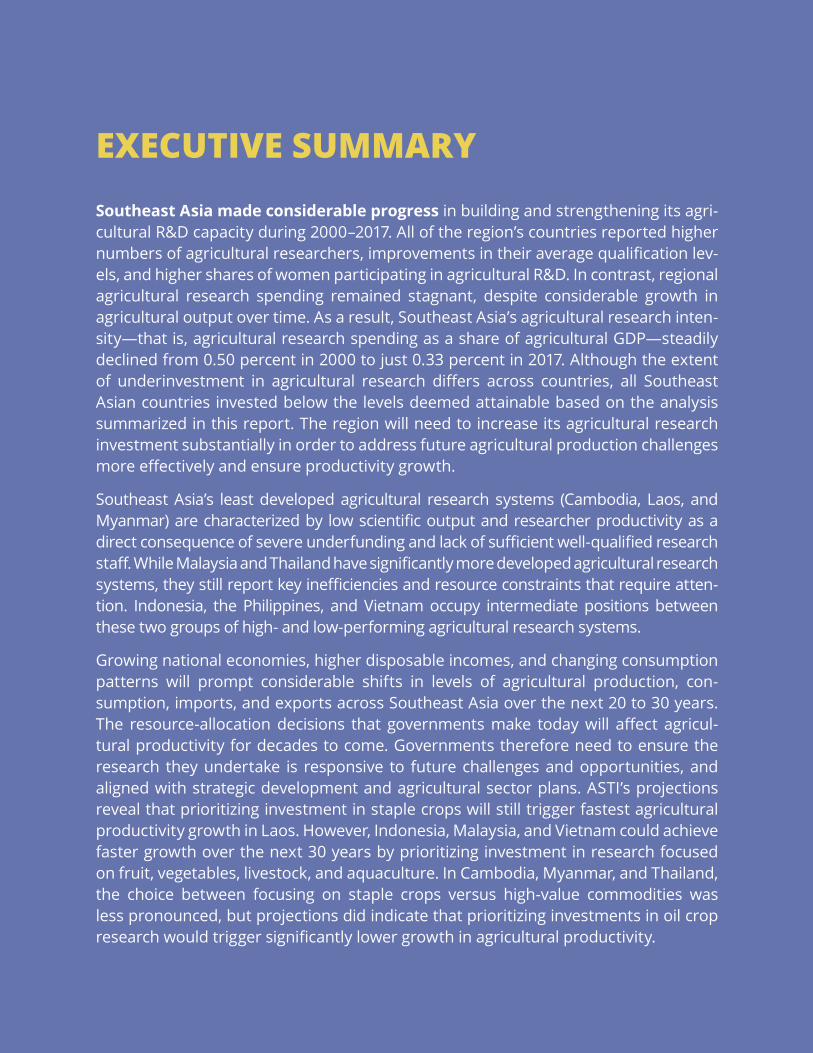
EXECUTIVE SUMMARYSoutheast Asia made considerable progress in building and strengthening its agri-cultural R&D capacity during 2000–2017. All of the region’s countries reported higher numbers of agricultural researchers, improvements in their average qualification lev-els, and higher shares of women participating in agricultural R&D. In contrast, regional agricultural research spending remained stagnant, despite considerable growth in agricultural output over time. As a result, Southeast Asia’s agricultural research inten-sity—that is, agricultural research spending as a share of agricultural GDP—steadily declined from 0.50 percent in 2000 to just 0.33 percent in 2017. Although the extent of underinvestment in agricultural research differs across countries, all Southeast Asian countries invested below the levels deemed attainable based on the analysis summarized in this report. The region will need to increase its agricultural research investment substantially in order to address future agricultural production challenges more effectively and ensure productivity growth.
Southeast Asia’s least developed agricultural research systems (Cambodia, Laos, and Myanmar) are characterized by low scientific output and researcher productivity as a direct consequence of severe underfunding and lack of sufficient well-qualified research staff. While Malaysia and Thailand have significantly more developed agricultural research systems, they still report key inefficiencies and resource constraints that require atten-tion. Indonesia, the Philippines, and Vietnam occupy intermediate positions between these two groups of high- and low-performing agricultural research systems.
Growing national economies, higher disposable incomes, and changing consumption patterns will prompt considerable shifts in levels of agricultural production, con-sumption, imports, and exports across Southeast Asia over the next 20 to 30 years. The resource-allocation decisions that governments make today will affect agricul-tural productivity for decades to come. Governments therefore need to ensure the research they undertake is responsive to future challenges and opportunities, and aligned with strategic development and agricultural sector plans. ASTI’s projections reveal that prioritizing investment in staple crops will still trigger fastest agricultural productivity growth in Laos. However, Indonesia, Malaysia, and Vietnam could achieve faster growth over the next 30 years by prioritizing investment in research focused on fruit, vegetables, livestock, and aquaculture. In Cambodia, Myanmar, and Thailand, the choice between focusing on staple crops versus high-value commodities was less pronounced, but projections did indicate that prioritizing investments in oil crop research would trigger significantly lower growth in agricultural productivity.


1| INTRODUCTION
Over the past three decades, strong economic growth, rising agricultural productivity and output, and the structural transformation of the agricultural sector have driven considerable advances in food security in Southeast Asia and enabled the region to become a net exporter of agricultural commodities. Whereas the vast majority of Southeast Asian people still lived in rural areas during the 1960s and 1970s, today, the bulk of the population lives in cities. Even in the least urbanized countries (Cambodia, Laos, and Myanmar) urbanization rates are rapidly rising (Sheng 2020). Combined with income growth, this has had a profound impact on the region’s labor markets. In 1991, 60 percent of the Southeast Asian population was still employed in the agricultural sector, but by 2019, this share had been halved, to just 30 percent (World Bank 2020). In conjunction with these shifts in employment, rural households are deriving an increasing proportion of their income from nonfarm sources, which has had an important impact in reducing overall poverty (Booth 2019). Nearly one in two Southeast Asians were living in extreme poverty in the 1990s. By 2015, this share had fallen to 12 percent (Sheng 2020). Notwithstanding these extraordinary economic transformations, a large share of the region’s population, whose income levels are just above the poverty line, remain vulnerable to unforeseen income and price shocks; natural disasters; and public health shocks, such as the current COVID-19 pandemic.
Despite the gradually diminishing contribution of agriculture to gross domestic product (GDP) and employment, the sector will continue to play a crucial role in driving future economic growth, poverty alleviation, and food security across Southeast Asia in the coming decades. The ongoing process of economic growth and structural transformation requires major sustained investments in the agricultural sector because the long-term success of economywide poverty reduction and sustainable improvements in food security depend on a growing economy that successfully integrates labor and capital markets in rural and urban areas, and stimulates higher productivity in both (Timmer 2015).

2 | AGRICULTURAL RESEARCH IN SOUTHEAST ASIA
Over the past decades, agricultural output has grown more rapidly in Southeast Asia than in other developing regions around the world (USDA-ERS 2019). A significant share of this past agricultural pro-duction growth, however, was driven by the expansion of cultivated land area and the exploitation of the nat-ural resource base (with accompanying environmen-tal degradation). With the main drivers of historical growth in agricultural production virtually exhausted, future agricultural growth in the region will be highly dependent on technical change to enable yield increases, more efficient use of scarce resources, and a reduction in crop losses. Investments in agricultural research and development (R&D) are critical in this regard. They are a key driver of agricultural produc-tivity growth over time, and will ensure that farmers have access to a steady supply of innovations that meet their needs.
Despite the importance of agricultural R&D to sustained agricultural productivity growth, many Southeast Asian countries continue to underinvest. This constrains sustainable future growth and, in turn, countries’ capacity to tackle the complex issues of food insecurity, poverty, climate change, land and water resource degradation, and shifting dietary patterns. Given the substantial time lag between investing in research and reaping its rewards—which is typically decades, not just years—agricultural research requires a long-term commitment of sus-tained funding (Dias Avila and Evenson 2010; Fuglie, Wang, and Ball 2012; Alston et al. 2009). Public spend-ing on agricultural research is a sensible investment that has been shown to outperform other public agricultural expenditures, including irrigation and fertilizer subsidies, in terms of raising agricultural pro-ductivity (Diaz-Bonilla, Orden, and Kwieciński 2014).
This report assesses recent trends in invest-ments, human resource capacity, and research
1 Data for Brunei, Singapore, and Timor Leste were not available, so these countries are excluded from this report.
outputs in agricultural research in Southeast Asia. It also summarizes the results of ASTI’s modeling analyses of potential future investment scenarios and their variable impacts on long-term agricul-tural productivity growth. Agricultural research is herein defined to include research on crops, live-stock, forestry, fisheries, and natural resources, as well as onfarm postharvest research. The analyses are based on comprehensive datasets prepared by ASTI, which in the Indo-Pacific region is co-led by the International Food Policy Research Institute (IFPRI) and the Asia–Pacific Association of Agricultural Research Institutions (APAARI) and funded by the Australian Centre for International Agricultural Research (ACIAR). During 2018–2019, ASTI imple-mented a comprehensive survey collecting first-hand data from more than 300 agricultural research agen-cies in eight Southeast Asian countries: Cambodia, Indonesia, Laos, Malaysia, Myanmar, the Philippines, Thailand, and Vietnam.1 The agency-level data col-lected covers institutional, human resource, financial, research focus, and research output information for the 2013–2017 period. These data were merged with existing ASTI datasets for prior years (where available) to allow for longer term analyses of research invest-ment and capacity trends. Although detailed data were collected from many private-sector companies, coverage was insufficient to allow an accurate over-view of the region’s private involvement in agricultural research to be reported. The data and analyses pre-sented in this report therefore only include agricul-tural research performed by the government, higher education, and nonprofit sectors. This report focuses on national agricultural research capacity, invest-ment, and outputs only. Data on the contributions of international agricultural research agencies operating in Southeast Asia, such as the centers of the CGIAR, have been excluded.

2| INSTITUTIONAL CONTEXT
Key Findings
• The bulk of Southeast Asia’s agricultural research is conducted by government agencies.
• The role of the higher education sector has risen gradually in most countries over time, albeit slowly.
• The emergence of many new universities has in some cases led to greater fragmentation of agricultural research systems. Nonetheless, research performed by the government and higher education sectors is broadly complementary.

AGRICULTURAL INNOVATION is the result of the interaction of a multitude of actors and stake-holders. An effective governance system is therefore essential to optimize the payoffs to investments in agricultural R&D, ensure coherence with policy and planning, promote the creation of synergies, and avoid unnecessary duplication in research under-takings. Institutional infrastructure and governance arrangements vary across the agricultural research and innovation systems of Southeast Asian coun-tries. In most countries, however, the responsibility for agricultural R&D rests with the ministries (or equivalent) that oversee the agricultural sector. Malaysia is an important exception in that it has two large ministries focusing on agriculture—the Ministry of Agriculture and Food Industry and the Ministry of Plantation Industries and Commodities. All of the region’s agricultural ministries have devel-oped medium-term sectoral plans, but the extent to which these prioritize agricultural R&D differs widely. Thailand, for instance, has set explicit R&D investment targets in its 20-year strategy for the agricultural sector. Similarly, neighboring Malaysia explicitly recognizes the importance of agriculture in its economic, food security, and agricultural sector plans. Unlike Thailand, however, Malaysia has not set any explicit investment targets for agricultural R&D.
Overall, the national agricultural R&D systems of Indonesia, Malaysia, the Philippines, Thailand, and Vietnam are more developed and better integrated into national innovation frameworks than those of Cambodia, Laos, and Myanmar. In these more developed systems, additional oversight and governance of agricultural innovation is often provided by ministries of science and technology (S&T) or their equivalent. These often play an important role in formulating and providing advice on policy, setting priorities, and coordinating agricultural innovation activities. Nonetheless, agriculture-related priorities may not always be satisfactorily embedded within national S&T policies because such policies and their
associated legal frameworks are typically formulated by ministries overseeing S&T, whereas agricultural research agencies tend to be administered by ministries of agriculture. Consequently, synergistic coordination among the relevant actors is often lacking, and decisionmaking can be fragmented.
The structure of Southeast Asia’s agricultural research systems is complex, comprising a large number of individual research agencies. Although large government research agencies anchor national agricultural research systems (NARSs) in all countries in the region, the institutional setup of these agen-cies differs considerably. Throughout the region, the main government research institutions are struc-tured and governed in five distinct manners: (1) as a research department within a ministry of agriculture (Myanmar); (2) as a semiautonomous government institute (Cambodia, Laos, and Malaysia); (3) as mul-tiple government departments focusing on specific agricultural subsectors, for example, agriculture and livestock (Thailand); (4) as numerous institutes grouped under a council or academy (Indonesia and Vietnam); and (5) as multiple, partially overlapping research systems, overseen by different government departments (the Philippines). In all countries, the principal government research institutions are com-plemented by other, mostly smaller, government and higher education agencies and, in some cases, non-profit institutions. While there have been ongoing internal reorganizations over the past decade, the institutional structure of agricultural research in most Southeast Asian countries has remained largely unchanged. However, Cambodia is currently planning to address the fragmentation of its present agricul-tural R&D system by merging the crop, livestock, for-estry, fisheries, and rubber research institutes into a single entity: the Cambodia Academy of Agricultural Sciences. The merger is likely to occur in the next few years and is expected to improve R&D coordination and prioritization, and produce major economies of scale and scope through resource sharing.
4 | AGRICULTURAL RESEARCH IN SOUTHEAST ASIA

As previously mentioned, ASTI identified more than 300 government, higher education, and non-profit agencies involved in agricultural R&D in the region. The total number of agencies differs widely across countries, ranging from just 6 in Laos to nearly 80 in the Philippines (Table 1). Although the number of individual agencies is higher in the higher educa-tion sector, the bulk of region’s agricultural research is conducted at government research agencies. In 2017, government agencies represented between 60 percent (the Philippines) and 85 percent (Malaysia and Myanmar) of the countries’ total number of agricultural researchers (Figure 1). The role of the higher education sector has gradually risen over time in most countries, albeit slowly, both through the creation of new universities and of new depart-ments and faculties within existing universities (often
with only a handful of permanent staff). The recent emergence of many new higher education agencies has in some cases led to an increased fragmenta-tion of agricultural research systems. Nonetheless, research performed by the government and higher education sectors tends to be broadly complemen-tary, with universities focusing on more basic types of research, and government research agencies mostly concentrating on applied research and the develop-ment of new production technologies and processes. The region’s main agricultural universities are the University of the Philippines, Los Baños; Universti Putra Malaysia; Kasetsart University in Thailand, and Bogor Agricultural University (IPB) in Indonesia. All these universities have a strong reputation in the region and beyond, both in terms of education and the quality of their research (Table 2).
INSTITUTIONAL CONTEXT | 5
2 In addition, ASTI also surveyed a large number of private companies involved in agricultural R&D. Due to insufficient coverage in some countries, the private sector has been excluded from this report. For a concise overview of privately performed agricultural R&D being undertaken in the region, see Box 1 on page 7.

6 | AGRICULTURAL RESEARCH IN SOUTHEAST ASIA
Figure 1—Institutional composition of agricultural research, 2017
75%
67%
61%
85%
85%
60%
75%
78%
24%
27%
39%
15%
15%
40%
25%
22%
2%
6%
Cambodia
Indonesia
Laos
Malaysia
Myanmar
Philippines
Thailand
Vietnam
Share of FTE agricultural researchers
Government Higher education Nonprofit
Source: Constructed by authors from ASTI (various years).Notes: FTE = full-time equivalent. See ASTI’s country pages for more detailed information on the agricultural R&D agencies operating in each country (https://www.asti.cgiar.org/countries).
Table 1—Number of agencies conducting agricultural research, 2017
Country Government Higher education Nonprofit Total
Cambodia 6 9 1 16
Indonesia 15 44 2 61
Laos 1 5 – 6
Malaysia 13 11 – 24
Myanmar 25 4 – 29
Philippines 24 55 – 79
Thailand 8 43 – 51
Vietnam 33 11 – 44
TOTAL 125 182 3 310
Source: Constructed by authors from ASTI (various years).Note: See ASTI’s country pages for more detailed information on the agricultural R&D agencies operating in each country (https://www.asti.cgiar.org/countries).

INSTITUTIONAL CONTEXT | 7
BOX 1 | PRIVATE AGRICULTURAL RESEARCH IN SOUTHEAST ASIA
In recent decades, private-sector agricultural R&D has gained prominence in Indonesia, Malaysia, the Philippines, Thailand, and Vietnam. Privately funded or performed R&D in Cambodia, Laos, and Myanmar, on the other hand, remains negligible. Most of the region’s private investments occur in high-value commodities, such as plantation and industrial crops, horticulture, and agricultural inputs. Complete datasets for the region’s private firms were not available, so it is difficult to provide specifics of public versus private investments, or of developments over time.
Indonesia and Malaysia are the world’s largest palm oil producers and exporters. Some of the bigger plantations have sizeable R&D programs. Sime Darby Plantation (Malaysia), the Federal Land Development Authority (FELDA, Malaysia), Sinar Mas Agro Resources and Technology (SMART, Indonesia), Lonsum (Indonesia), Socfindo (Indonesia), and Hoang Anh Gia Lai Group (Vietnam) are among the main global oil palm (and to a lesser extent rubber) research performers. Similarly, the Philippines is one of the world’s leading exporters of bananas and pineapples, and local companies like Marsman Drysdale, Lapanday, and Tadeco, as well as multinationals like Delmonte and Dole, are major performers of research on bananas and pineapples (as well as other horticultural commodities). In addition to conducting in-house research, many plantation companies outsource some of their research to government research institutes or universities. The seed sector is another important area for private R&D investment. The private seed industry is concentrated mostly around hybrid rice and maize, legumes, and high-valued horticultural crops. Private actors include local firms, such as Charoen Pokphand Group (Thailand), Chia Tai (Thailand), ThaiBinh Seed (Vietnam), and the Vietnam National Seed Corporation (VINASEED), as well as multinationals like Bayer Crop Science, Cargill, Dupont, East–West Seed, Monsanto, and Syngenta. The multinationals dominate the funding and performance of R&D on fertilizers, pesticides, and herbicides for cereal, horticultural, and plantation crops. Many multinationals operate sizeable R&D facilities in the region, but a considerable amount of their R&D is outsourced to local government agencies and universities. Thailand is a comparatively strong regional performer of private livestock (feed) and food processing research, with companies like Charoen Pokhpand and Betagro playing a central role.
Governments across the region have instituted various incentives to stimulate private investment in agricultural R&D. In Malaysia, the Philippines, Thailand, and Vietnam, companies that provide R&D services are eligible for various income-tax exemptions and tax allowances for capital expenditures on R&D. Indonesia has recently introduced a set of similar regulations to boost private R&D, and these are expected to take effect by the end of 2020. The Thai government is actively encouraging private investment in areas of research that complement rather than compete with the public sector. To this end, in 2016 it established the Food Innopolis, which operates a 20,000 square meter food innovation hub at Thailand Science Park to accommodate private R&D and innovation activities. The hub allows innovators to pool R&D resources with the goal of increasing the competitiveness of the Thai food industry.
Source: Authors.

8 | AGRICULTURAL RESEARCH IN SOUTHEAST ASIA
Table 2—Principal agricultural R&D agencies in Southeast Asian countries and their relative share of total national FTE research capacity, 2017
Country Main government agencies Main higher education agencies Mainnonprofitagencies
Cambodia • Cambodian Agricultural Research Institute: 22%
• General Directorate of Agriculture: 24%• Cambodian Rubber Research Institute:
8%• Forestry and Wildlife Research Institute:
8%• Inland Fisheries Research and
Development Institute: 7%• National Animal Health and Production
Research Institute: 6%
• Royal University of Agriculture: 14%
• Prek Leap National School of Agriculture: 6%
Indonesia • Indonesian Agency for Agricultural Research and Development: 37%
• Forest Research and Development Agency: 26%
• Bogor Agricultural University: 7%
• Indonesian Research Institute for Estate Crops: 6%
Laos • National Agriculture and Forestry Research Institute: 61%
• National University of Laos: 19%
Malaysia • Malaysia Agricultural Research and Development Institute: 36%
• Malaysian Palm Oil Board: 19% • Forestry Research Institute Malaysia:
12%
• Universiti Putra Malaysia: 9%
Myanmar • Department of Agricultural Research: 53%
• Department of Agriculture: 21%• Forest Research Institute: 10%
• Yezin Agricultural University: 10%
Philippines • Integrated Agricultural Research Centers: 24%
• Philippine Rice Research Institute: 11%• Ecosystems Research and Development
Bureau: 8%
• University of the Philippines Los Baños: 8%
Thailand • Department of Agriculture: 19%• Department of Livestock Development:
20%• Department of Fisheries: 13%• Department of Forestry: 10%• Rice Department: 6%
• Kasetsart University: 9%
Vietnam • Vietnam Academy of Agricultural Science: 34%
• National Institute of Animal Science: 14%
• Vietnam Academy for Water Resources: 8%
• Vietnamese Academy of Forest Sciences: 7%
• Research Institutes for Aquaculture: 7%
• Vietnam National University of Agriculture: 5%
Source: Constructed by authors from ASTI (various years).Notes: This table only lists agencies that account for at least 5 percent of a country’s agricultural research capacity. Consequently, the individual agency shares do not sum to 100 percent. See ASTI’s country pages for more detailed information on the agricultural R&D agencies operating in each country (https://www.asti.cgiar.org/countries).

3| HUMAN RESOURCES
Key Findings
• All Southeast Asian countries have steadily expanded their agricultural research capacity since 2000. Average researcher qualifications have improved over time, as has female participation in agricultural research.
• Throughout the region, civil servant recruitment restrictions, low public-sector salaries, promotions based on seniority rather than merit, and a general lack of incentives have impeded government agencies’ ability to attract and retain highly qualified research staff.
• Indonesia and Thailand are challenged by having aging pools of qualified agricultural researchers, whereas research agencies in Cambodia, Laos, and Myanmar are mainly staffed by junior, relatively inexperienced researchers.

SOUTHEAST ASIA EMPLOYED more than 17,000 agricultural researchers in 2017 in FTEs (Box 2 and Table 3). The region has made considerable progress in building and strengthening its agricultural R&D capacity since the turn of the millennium. All countries employed higher numbers of researchers in 2017 than they did in 2000 (although exact 2000 numbers for Thailand were not available). Overall, growth in agricultural research capacity during 2000–2017 was much stronger in the countries with a long history of political and economic isolation (Cambodia, Laos, Myanmar, and Vietnam) than
in the other countries in the region. With the disman-tling of their Marxist-Leninist legacy, and the initiation of reform toward a market economy in the 1990s, these countries gradually began investing in their agricultural R&D systems after prolonged periods of neglect. In Cambodia and Vietnam, researcher numbers more than doubled during 2000–2017, whereas Laos and Myanmar reported roughly 80 percent growth during this period. Growth was considerably slower, but nonetheless sub-stantial, in Indonesia, Malaysia, the Philippines, and Thailand.
BOX 2 | QUANTIFYING AGRICULTURAL RESEARCHER NUMBERS AND RESEARCH SPENDING
The Concept of Full-Time Equivalent Agricultural ResearchersASTI bases its calculations of human resource and financial data on full-time equivalents (FTEs), which take into account the proportion of time researchers spend on research, as opposed to other activities. University staff members, for example, spend the bulk of their time on nonresearch-related activities, such as teaching, administration, and student supervision, which need to be excluded from research-related resource calculations. As a result, four faculty members estimated to spend 25 percent of their time on research would individually represent 0.25 FTEs and collectively be counted as 1 FTE.
The Purchasing Power Parity Index as the Preferred Measure for Quantifying Research InvestmentsComparing data on research expenditures is a highly complex process due to important differences in price levels across countries. The largest components of a country’s agricultural research expenditures are staff salaries and local operating costs, rather than internationally traded capital investments. For example, the wages of a field laborer or a laboratory assistant at a research facility are much lower in Cambodia than they are in any European country; similarly, locally made office furniture in Indonesia will cost a fraction of a similar set of furniture bought in Australia. Standard market exchange rates are the logical choice for conversions when measuring financial flows across countries; however, they are far from perfect currency converters for comparing economic data. At present, the preferred conversion method for calculating the relative size of economies, or other economic data such as agricultural research spending, is the purchasing power parity (PPP) index. PPPs measure the relative purchasing power of different currencies by eliminating national differences in pricing levels for a wide range of goods and services. They are also used to convert current GDP prices in individual countries to a common currency. In addition, PPPs are relatively stable over time, whereas exchange rates fluctuate considerably (for example, fluctuations in the U.S. and Australian dollar exchange rates in recent years).
Source: Authors.
10 | AGRICULTURAL RESEARCH IN SOUTHEAST ASIA

Care should be taken in making cross-country comparisons of the number of researchers employed because the definition of what qualifies as “official”
researcher status can differ across countries. Indonesia and Malaysia, for example, have recently introduced policies requiring that scientists hold a minimum of an MSc degree to qualify for a research position at a government research institution. In contrast, the bulk of agricultural researchers (and new recruits) in Cambodia, Laos, and Myanmar are only qualified to the BSc-degree level. In addition, the sheer number of researchers offers no indication of the effectiveness of a country’s agricultural research capacity. Vietnam, for example, has the region’s second-largest agricultural R&D system in terms of numbers of FTE researchers, yet it only ranks fifth in terms of research spending. Uncontrolled growth in Vietnam’s researcher numbers in recent years has led to severe staffing imbalances, with too many young, inexperienced researchers enter-ing the system, and a severe lack of senior researchers to train and mentor them. The government has recently introduced a number of measures to rationalize the country’s imbalanced R&D system. Idiosyncrasies like these need to be taken into account when comparing staffing numbers across countries.
COMPOSITION OF AGRICULTURAL RESEARCHERS BY QUALIFICATION LEVEL
A minimum number of PhD-qualified scientists is gen-erally considered fundamental to the conception, exe-cution, and management of high-quality research; to effective communication with policymakers, donors, and other stakeholders, both locally and through regional and international forums; and for increasing an institute’s chances of securing competitive funding. All countries in Southeast Asia reported an increase in the number of PhD-qualified agricultural research-ers they employed during 2003–2017, but consider-able cross-country differences exist. Malaysia and Indonesia reported the highest numbers of qualified agricultural researchers (Figure 2). In both countries, roughly one in three researchers held PhD degrees,
and about 40 percent were MSc-qualified. As men-tioned, both Indonesia and Malaysia have recently introduced policies requiring scientists to hold at least a MSc degree in order to qualify for a position as an agricultural researcher at a government institution. These measures have prompted a steady upward trend in the number of researchers with PhD degrees, and a decline in those qualified to the BSc-degree level only. In the Philippines, Vietnam, and Thailand, average qualification levels were considerably lower. Nonetheless, Vietnam has made considerable strides in strengthening its agricultural R&D capacity over time. During 2003–2017, the country’s absolute num-ber of PhD-qualified researchers increased by more
HUMAN RESOURCES | 11
Table 3—Number of agricultural researchers by country, 2000, 2013, and 2017
CountryFTEs
2000 2013 2017
Cambodia 149.2 276.3 319.0
Indonesia 3,343.8 4,105.8 4,289.5
Laos 111.6 182.7 203.2
Malaysia 1,086.4 1,493.8 1,543.4
Myanmar 369.7 537.2 657.1
Philippines 2,435.0 2,665.6 2,962.0
Thailand na 2,674.7 2,911.4
Vietnam 2,089.4 4,029.3 4,250.1
TOTAL na 15,965.4 17,135.8
Source: Constructed by authors from ASTI (various years).Notes: Data include all staff in research positions at the government, higher education, and nonprofit agencies; na = data were not available. See ASTI’s country pages for more detailed information on research staff levels for the entire 2000–2017 period. Agency directories on these country pages provide further detail on research capacity at the agency level (https://www.asti.cgiar.org/countries).

12 | AGRICULTURAL RESEARCH IN SOUTHEAST ASIA
than 300 FTEs, reflecting the combined result of large-scale recruitment and extensive postgraduate training (Table 4). In contrast, long-term civil servant recruitment restrictions have caused a shortage of PhD-qualified researchers in Thailand. The bulk of Thai agricultural researchers are BSc-qualified, but a recent large-scale PhD scholarship program launched by the Thai gov-ernment should address the most acute capacity challenges in the coming years. The region’s poorest countries, which have the least developed agricultural research systems—Cambodia, Laos, and Myanmar—employed considerably fewer PhD-qualified scientists than their more prosperous neighbors, both in abso-lute and relative terms. In fact, at both government research agencies and universities, these countries lack the critical mass of PhD-qualified scientists required to ensure that research has a tangible impact on agri-cultural productivity growth and poverty reduction. Moreover, very few universities in these countries offer PhD training in agricultural sciences, so opportunities to pursue in-country postgraduate training are severely
restricted. Continuing education to the MSc or PhD level generally depends on donor funding, which is scarce.
On average, agricultural researchers employed at government research institutes across Southeast
Figure 2—FTE agricultural researchers by degree, 2017
25.3
1,279.3
21.6
472.0
76.7
409.9
517.1
753.8
117.4
1,748.1
73.1
638.0
166.7
1,020.3
949.3
2,081.2
176.3
1,262.1
108.5
433.4
413.7
1,531.8
1,445.1
1,415.2
Cambodia
Indonesia
Laos
Malaysia
Myanmar
Philippines
Thailand
Vietnam
Number of FTE agricultural researchers
PhD MSc BSc
319.0
203.2
4,289.5
2,911.4
657.1
1,543.4
4,250.1
Total number of FTEs
2,962.0
Source: Constructed by authors from ASTI (various years).Notes: Data include all staff in research positions at the government, higher education, and nonprofit agencies. FTE = full-time equivalent.
Table 4—Number of PhD-qualified agricultural researchers, 2003, 2013, and 2017
CountryFTEs
2003 2013 2017
Cambodia 21.1 18.0 25.3
Indonesia 736.0 1,091.1 1,279.3
Laos 6.4 25.4 21.6
Malaysia 365.9a 435.8 472.0
Myanmar 18.8 59.2 76.7
Philippines na 368.1 409.9
Thailand na 462.2 517.1
Vietnam 435.9 654.3 753.8
TOTAL na 3,114.0 3,555.6
Source: Constructed by authors from ASTI (various years).Notes: FTEs = full-time equivalents; na = data were not available.a. This data point is for 2002.

HUMAN RESOURCES | 13
Asia hold much lower qualification levels than their university-based counterparts (Figure 3). In Thailand, for example, the disparity in the official status of government-based scientists (as civil servants) and university scientists (as teachers/researchers) prevents govern-ment agencies from offering the competitive salaries and benefits needed to attract, motivate, and retain staff. This has provoked the departure of many well-qualified, young researchers in favor of bet-ter conditions at universities and in the private sector. In Cambodia’s government system, when it comes to salary levels, nothing distinguishes research from non-research staff, nor PhD-qualified employees from those only qual-ified to the BSc-degree level. This clearly acts as a major disincentive both to pursuing a career in science at a government institution and to pursuing postgraduate training. Similarly, in Myanmar, a young scientist with a BSc degree in agri-culture can earn a higher salary in an entry-level position with a non-governmental organization (NGO) or donor-funded initiative than a senior, PhD-qualified scientist can at a government institution. Across the region, low public-sector sala-ries make attracting and retaining highly qualified research staff extremely challenging. Moreover, promotional opportunities at gov-ernment agencies are often based on seniority rather than merit, making government agencies unattractive employers for young,
Figure 3—Distribution of agricultural researchers by qualification level, 2017
11%
13%
28%
55%
13%
7%
17%
80%
7%
34%
8%
23%
4%
60%
15%
30%
15%
55%
40%
43%
30%
46%
53%
18%
22%
41%
25%
49%
34%
34%
51%
55%
75%
33%
32%
2%
57%
47%
30%
2%
71%
25%
67%
28%
62%
5%
34%
15%
CARDI
Higher education
IAARD
Higher education
NAFRI
Higher education
MARDI
Higher education
DAR
Higher education
Government
Higher education
MOAC
Higher education
VAAS
Higher education
Share of FTE agricultural researchers
PhD MSc BSc
Cam
bodi
aIn
done
sia
Laos
Mal
aysi
aTh
aila
ndVi
etna
mPh
ilipp
ines
Mya
nmar
Source: Constructed by authors from ASTI (various years).Notes: FTE = full-time equivalent. CARDI = Cambodian Agricultural Research and Development Institute; IAARD = Indonesian Agency for Agricultural Research and Development; NAFRI = National Agriculture and Forestry Research Institute; MARDI = Malaysian Agricultural Research and Development Institute; DAR = Department of Agricultural Research; MOAC = Ministry of Agriculture and Cooperatives; and VAAS = Vietnam Academy of Agricultural Sciences.

14 | AGRICULTURAL RESEARCH IN SOUTHEAST ASIA
ambitious scientists. Appropriate conditions and incentives need to be established to encourage
long-term commitment from researchers at govern-ment agencies across the region.
COMPOSITION OF AGRICULTURAL RESEARCHERS BY AGE BRACKET
A closer look at the composition of the region’s agricultural researchers by age bracket reveals that different countries are dealing with different capacity chal-lenges. On the one hand, Indonesia, the Philippines, and Thailand face the impact of long-term recruitment restrictions, which have gradually increased the average age of PhD-qualified researchers over time. As of 2017, 71 percent of researchers with PhD degrees at government research agencies in the Philippines and Thailand, and 62 percent of research-ers with PhD degrees at the Indonesian Agency for Agricultural Research and Development (IAARD) were over the age of 50 and approaching the mandatory retirement age (Figure 4). Consequently, these countries are faced with large-scale capacity losses in the coming years. On the other hand, agricultural research systems in Cambodia, Laos, Myanmar, and (to a lesser extent) Vietnam lack a critical mass of highly qualified and experi-enced researchers. These systems are primarily staffed by young researchers with relatively limited experience. In addition, most agricultural faculties in Cambodia and Laos employ only a handful of professors (most of whom are in their thirties), which seriously confines the scope and overall quality of graduate and research programs within these faculties.
Figure 4—Distribution of agricultural researchers by age bracket, 2017
Cam
bodi
aIn
done
sia
Laos
Mal
aysi
aTh
aila
ndVi
etna
mPh
ilipp
ines
Mya
nmar
0% 25% 50% 75% 100%
PhD
All
PhD
All
PhD
All
PhD
All
PhD
All
PhD
All
PhD
All
PhD
All
Share of FTE agricultural researchers by age bracket (%)
<31 31-40 41-50 51-60 >60
CARD
ICa
mbo
dia
IAAR
DIn
done
sia
NAF
RILa
osM
ARD
IM
alay
sia
DAR
Mya
nmar
Gov
ernm
ent
R&D
age
ncie
sPh
ilipp
ines
MO
ACTh
aila
ndVA
ASVi
etna
m
Source: Constructed by authors from ASTI (various years).Notes: FTE = full-time equivalent. CARDI = Cambodian Agricultural Research and Development Institute; IAARD = Indonesian Agency for Agricultural Research and Development; NAFRI = National Agriculture and Forestry Research Institute; MARDI = Malaysian Agricultural Research and Development Institute; DAR = Department of Agricultural Research; MOAC = Ministry of Agriculture and Cooperatives; and VAAS = Vietnam Academy of Agricultural Sciences.

HUMAN RESOURCES | 15
A workforce with a balance of junior and senior researchers is essential to the long-term continuity of R&D programs. The Thai government has recently launched a sizeable PhD scholarship scheme for agricultural researchers in response to the imminent loss of PhD-qualified researchers employed by the Ministry of Agriculture and Cooperatives (MOAC). It is critical, however, for such training opportunities to be instituted on a more permanent basis, rather than as an urgent reaction to large-scale staff losses due to retirement. Indonesia has recently raised the official retirement age for its most senior researchers from 57 to 70 years. This measure will buy more time for senior scientists to train and mentor their younger colleagues in the decade ahead. Throughout the region,
R&D agencies will need to systematically monitor (anticipated) gaps in skills and specializations in order to facilitate a timely and accurate response when training needs arise. They will also need to ensure that solid incentive systems are in place to retain young scientists and ensure that sufficient senior scientists remain to mentor them. The young and relatively inexperienced pools of agricultural researchers in the countries that are still in the early stages of building their agricultural R&D systems represent an important opportunity. With well-targeted formal postgraduate and on-the-job training (and associated funding), these countries are strongly positioned to build a highly qualified pool of scientists serving a wide range of domains for decades.
COMPOSITION OF AGRICULTURAL RESEARCHERS BY GENDER
Female researchers, professors, and senior managers offer different insights from their male counterparts, and their input provides an important perspective in addressing the unique and pressing challenges of female farmers in the region. Consequently, it is important that agricultural R&D agencies employ a bal-ance of male and female researchers. In recent years, the overall share of female agricultural researchers was considerably higher in Southeast Asia (49 percent in 2017) than in other developing regions around the world, such as Africa south of the Sahara (24 percent in 2014), South Asia (20 percent in 2016/17), West Asia and North Africa (34 percent in 2012), and Latin America and the Caribbean (36 percent in 2013) (Stads 2015; Stads et al. 2016; Beintema and Stads 2017; and Stads 2019). Once again, these regional averages mask a considerable degree of cross-country variation. Female participation is lowest in Laos and Cambodia, where just 25 and 30 percent of agricultural research-ers, respectively, were women as of 2017 (Figure 5). In contrast, Malaysia, Myanmar, and the Philippines
actually employed higher numbers of female research-ers than male researchers. In fact, nowhere in the world is the share of female researchers higher than in Myanmar (71 percent in 2017). Whereas the country’s high rate of female participation may appear positive at face value, the underlying reason is a cause for con-cern. Civil servant salaries in Myanmar are so low that they are insufficient to support a family and hence act as a disincentive to the employment of predominantly male household heads. Consequently, research posi-tions mainly attract female applicants.
A growing number of women across Southeast Asia have made advances in agricultural research in recent years. At many agricultural faculties across the region, female students outnumber male students, resulting in a steady influx of young female research-ers into R&D agencies. In addition, laws that promote gender parity and equal opportunities, alongside changing cultural perceptions of the role of women, support from families, and the presence of female role models have also triggered a steady increase in

16 | AGRICULTURAL RESEARCH IN SOUTHEAST ASIA
Figure 5—Share of female agricultural researchers by country, 2003 and 2017
24%
30%
21%
37%
62%
40%
40%
30%
44%
25%
52%
71%
57%
47%
47%
Cambodia
Indonesia
Laos
Malaysia
Myanmar
Philippines
Thailand
Vietnam
Share of female researchers
2003 2017
na
Source: Constructed by authors from ASTI (various years).Notes: Data include researchers employed at government and higher education agencies with BSc, MSc, and PhD degrees; data for Malaysia and the Philippines are for 2002; na = data were not available.

HUMAN RESOURCES | 17
the number of female agricultural researchers over time. In fact, every country in the region reported a higher number of female researchers in 2017 than they did in 2003 (2002 in the case of Malaysia and the Philippines). Growth was strongest in the Philippines, Indonesia, and Malaysia, where the share of female agricultural researchers rose by a notable 14–17 per-centage points during the 2003–2017 period.
Despite these positive developments, in a number of countries women remain much less likely to hold PhD degrees than their male colleagues. In Cambodia, as of 2017, just 8 percent of agricultural researchers with PhD degrees were female (Figure 6). In Vietnam, that same year, only one in four PhD-qualified
researchers were female, which is remarkable given that nearly one in two of the country’s researchers—that is, the combined total of those with BSc, MSc, and PhD degrees—were female. Moreover, women remain less likely to hold management positions than their male colleagues throughout the region. The vast majority of government research institutes and uni-versity faculties in Southeast Asia are still headed by men, which means that women have less influence in priority-setting and policymaking processes, poten-tially creating a bias in decisionmaking. These data indicate that, notwithstanding recent progress, most countries still have a long way to go to approach true gender balance.
AGRICULTURAL RESEARCH SUPPORT STAFF
Technical, administrative, and other support staff play a considerable role in facilitating the conduct of agricultural research, so it is important to take support staff numbers into account when assessing
the overall capacity and performance of agricul-tural research systems. Considerable variation was reported in the ratio of support staff to FTE research-ers at the national agricultural research agencies
Figure 6—Distribution of PhD-qualified agricultural researchers by gender, 2017
8%
38%
28%
48%
73%
56%
50%
25%
92%
62%
72%
52%
27%
44%
50%
75%
Cambodia
Indonesia
Laos
Malaysia
Myanmar
Philippines
Thailand
Vietnam
Distribution of total PhD-qualified researchers
Women Men
Source: Constructed by authors from ASTI (various years).

18 | AGRICULTURAL RESEARCH IN SOUTHEAST ASIA
across Southeast Asia. As of 2017, the Malaysian Agricultural Research and Development Institute (MARDI) employed more than four support staff per researcher. In contrast, ratios below 1 were recorded at NAFRI (Laos), the Department of Agricultural Research (DAR, Myanmar), MOAC (Thailand), and the Vietnam Academy of Agricultural Sciences (VAAS) (Figure 7). There is no uniform recommendation of the “ideal” ratio of support staff to researchers. It is highly dependent on the organization’s overall research
mandate; the commodities being researched; whether the research is laboratory-oriented, office-, or field-based; and the number of research stations being operated across agroecological zones. On the whole, ratios tend to be higher at institutes with large crop-production schemes that require a greater num-ber of field workers.
Importantly, uniform cross-country definitions of researchers and technicians do not exist. As pre-viously mentioned, the minimum requirement for
Figure 7—Support-staff-to-researcher ratios, 2017
0.0 0.5 1.0 1.5 2.0 2.5 3.0 3.5 4.0 4.5
Vietnam (VAAS)
Thailand (MOAC)
Myanmar (DAR)
Malaysia (MARDI)
Laos (NAFRI)
Indonesia (IAARD)
Cambodia (CARDI)
FTEs
Technical support staff Administrative support staff Other support staff
Source: Constructed by authors from ASTI (various years).Notes: Detailed data on support staff in the Philippines were not available. FTE = full-time equivalent. “Technical support staff” directly support agri-cultural research activities but are not formally classified as researchers; they have at least a secondary education plus additional technical training, and some technical support positions may require a university degree. “Administrative support staff” carry out secretarial and administrative tasks and have at least a secondary education plus additional professional training; administrative staff include accountants, computer personnel, personnel managers, and secretaries. “Other support staff” include positions that don’t fall into the other categories, such as drivers, field work-ers, and guards. CARDI = Cambodian Agricultural Research and Development Institute; IAARD = Indonesian Agency for Agricultural Research and Development; NAFRI = National Agriculture and Forestry Research Institute; MARDI = Malaysian Agricultural Research and Development Institute; DAR = Department of Agricultural Research; MOAC = Ministry of Agriculture and Cooperatives; and VAAS = Vietnam Academy of Agricultural Sciences.

HUMAN RESOURCES | 19
a researcher in Indonesia and Malaysia is an MSc degree, so many of the BSc-qualified technicians, research assistants, and laboratory assistants at IAARD and MARDI are classified as support staff. Given proper training and promotional opportu-nities, however, these well-qualified technical staff could be an extremely valuable resource for the
future development of agricultural research in these countries. In contrast, in Vietnam, a significant num-ber of BSc-qualified staff—which would be counted as support staff in other countries—are classified as researchers. It is therefore important to take the country context into account when comparing ratios of support staff to researcher.
AGRICULTURAL RESEARCH FOCUS
ASTI collected detailed information on the alloca-tion of FTE researchers across commodity areas. Crop research dominates agricultural R&D in most countries. In 2017, 40 percent of all agricultural researchers in the eight Southeast Asian countries focused on crops, whereas livestock and forestry
each represented 14 percent (Figure 8). The remaining researchers concentrated their attention on fisheries, natural resources, socioeconomics, or other areas. The research agendas of Cambodia, Laos, Malaysia, and Myanmar are heavily focused on crop research. Livestock and aquaculture research play a relatively
Figure 8—Focus of agricultural research by country, 2017
0% 20% 40% 60% 80% 100%
Cambodia
Indonesia
Laos
Malaysia
Myanmar
Philippines
Thailand
Vietnam
Share of FTE researchers
Crops LivestockForestry FisheriesNatural resources SocioeconomicsOther
Source: Constructed by authors from ASTI (various years). Note: FTE = full-time equivalent.

20 | AGRICULTURAL RESEARCH IN SOUTHEAST ASIA
important role in Thailand and Vietnam. Indonesia is an important global contributor to forestry research.
Rice is the most researched crop in Southeast Asia, which is not surprising given it is the primary staple food in most countries. Although the dietary importance of rice has fallen gradually throughout the region as a result of economic development and income growth, it remains a key production and consumption commodity, particularly for poor house-holds. Given that rice retains considerable political importance (in that it can topple government leaders, spark mass protests, or trigger food riots), much of the region’s government assistance and subsidies continue to target rice cultivation, and hence rice
research. Cambodia’s and Laos’s research agendas are particularly rice-centric (Figure 9). In Laos, for example, rice accounted for just 20 percent of the country’s total crop production value; yet rice was the focus of nearly 60 percent of crop research. Malaysia stands out from its Southeast Asian neighbors in that a relatively large proportion of its crop research is ded-icated to nonfood crops, mostly oil palm and rubber. This is hardly surprising given that oil palm plantations account for three-quarters of the country’s cultivated land area, and while MARDI has experienced severe budget cuts in recent years, investments in oil palm research are still on the rise.
Figure 9—Focus of crop researchers, 2017
0% 20% 40% 60% 80% 100%
Cambodia
Indonesia
Laos
Malaysia
Myanmar
Philippines
Thailand
Vietnam
Share of FTE crop researchers
Rice Other cerealsRoots and tubers PulsesOilbearing HorticulturalOther crops
Source: Constructed by authors from ASTI (various years). Note: FTE = full-time equivalent.

4| FINANCIAL RESOURCES
Key Findings
• Southeast Asia’s agricultural research spending rose sharply during the years immediately following the 2007/08 global food crisis, but has remained fairly stagnant since.
• As a percentage of agricultural gross domestic product (AgGDP), however, Southeast Asia’s agricultural research spending has steadily fallen since 2000. The region’s underinvestment in agricultural research is considerable.
• Agricultural research is predominantly government-funded, but donors play an important role in the region’s poorer countries with less developed agricultural research systems.

22 | AGRICULTURAL RESEARCH IN SOUTHEAST ASIA
PUBLIC AGRICULTURAL RESEARCH spending
in Southeast Asia increased by 35 percent in real
terms, from $2.0 billion in 2000 to $2.7 billion in 2017,
measured in inflation-adjusted 2011 PPP dollars
(Figure 10).3 Overall, regionwide spending exhibited an
erratic pattern over time. During the years immediately
following the Asian financial crisis (1997–1998)—which
hit Indonesia, Malaysia, and Thailand particularly
hard—governments across the region increased
their investment in R&D to counteract the impact
of declining private investment. During 2000–2004,
regional agricultural R&D spending rose by more than
a quarter (but declined again in subsequent years). The
2007–2008 global food price crisis provoked a similar
government response, with regional agricultural
R&D investment increasing by 23 percent during 2007–2009 alone. In more recent years, however, regionwide spending on agricultural R&D plateaued, hovering around the $2.6 billion mark.
Breakdown of Agricultural Research Spending by Country
Absolute levels of agricultural R&D investment vary greatly by country. Nearly 80 percent of Southeast Asia’s agricultural R&D investments in 2017 were made by just three countries: Thailand ($847 million), Indonesia ($630 million), and Malaysia ($629 million). In contrast, Cambodia, Laos, and Myanmar spent only a fraction of these amounts. In fact, these three countries combined accounted for just 4 percent of total regional
Figure 10—Agricultural research spending in Southeast Asia, 2000–2017
0
500
1,000
1,500
2,000
2,500
3,000
2000 2002 2004 2006 2008 2010 2012 2014 2016
Million PPP dollars(inflation-adjusted; 2011 constant prices)
Sources: Constructed by authors from ASTI (various years). 2000–2012 data for Thailand were taken from Suphannachart (2016).Notes: Expenditures cover all salaries, operating and program costs, and capital investments by agricultural R&D agencies in the government, higher education, and nonprofit sectors of Cambodia, Indonesia, Laos, Malaysia, Myanmar, the Philippines, Thailand, and Vietnam.
3 In accordance with international standards, ASTI presents spending data in purchasing power parity (PPP) dollars, which measure the relative purchasing power of currencies across countries by eliminating national differences in price levels (see Box 2 on page 10).

FINANCIAL RESOURCES | 23
spending (Table 5). Thailand recorded the region’s high-est growth in agricultural R&D investment in absolute terms during 2000–2017, and the country’s spending is expected to continue to grow in the medium to long term. Thailand’s 20-year Agriculture and Cooperatives Strategy has explicitly underscored the important role of agricultural R&D in raising future agricultural produc-tivity, and as such, it has set an ambitious yearly growth target of 5 percent of MOAC’s agricultural R&D spend-ing until 2036.
Although growth in research investment was highest in Thailand in absolute terms, Myanmar reported the highest growth in relative terms over the 2000–2017 timeframe (nearly 350 percent)—albeit from an extremely low base. Since sanctions against Myanmar were eased, a large influx of donor funding, coupled with government prioritization of agricultural research, helped to initiate the much-needed upgrade of research infrastructure and equipment, as well as for research programs. Like Myanmar, both Cambodia and Vietnam have also experienced long periods of political isolation. When these countries opened their econ-omies to the outside world in the 1990s and 2000s,
agrarian reforms were embedded in general economic reforms, supporting the transition toward market econ-omies. Agricultural R&D spending gradually increased as national governments realized that strong agricul-tural R&D systems are a prerequisite for agricultural and economic development. Meanwhile, donors began supporting large agricultural research projects.
Following a renewed government commitment to supporting growth of the country’s agricultural sector, agricultural research expenditures in the Philippines rose by more than half during 2013–2017. In contrast, long-term spending trends have been more erratic in Malaysia and Indonesia. In Malaysia, funding for food-crop research was severely cut in recent years, while investments in oil palm R&D have continued to rise. Indonesian agricultural R&D is characterized by consid-erable fluctuations in yearly spending, but the country recorded a gradual overall decline in R&D investment (in inflation-adjusted terms). In recent years, fluctuations in Indonesia’s yearly spending levels were to a large extent driven by the irregular influx of funding through a large World Bank loan-financed project involving large-scale upgrades and construction of R&D infrastructure, as well as the purchase of laboratory equipment. Similar funding volatility occurred in Laos, where the agricul-tural R&D system is the most dependent on donor funding of all Southeast Asian countries. The initiation or completion of large donor-funded projects has had a considerable impact on the country’s annual levels of agricultural R&D spending.
Intensity of Agricultural Research Investment
Analyzing absolute levels of research expenditures only explains so much. Another way of comparing the commitment to public agricultural R&D invest-ments across countries is to measure total public agricultural research spending as a percentage of AgGDP. This relative measure goes beyond absolute agricultural research spending levels to indicate the intensity of investments. High-income countries invest
Table 5—Agricultural R&D spending by country, 2003, 2013, and 2017
CountryMillion PPP dollars; 2011 constant prices
2003 2013 2017
Cambodia 16.0 27.2 30.2
Indonesia 909.6 726.9 629.7
Laos 20.3 16.8 19.3
Malaysia 663.1 657.3 629.0
Myanmar 6.8 21.6 46.6
Philippines 219.4 195.8 298.4
Thailand 533.6 730.6 847.2
Vietnam 143.6 155.9 177.6
TOTAL 2,512.3 2,532.2 2,678.0
Sources: Constructed by authors from ASTI (various years); 2003 data for Thailand are from Suphannachart (2016).Note: See ASTI’s country pages for more detailed information on coun-try-level expenditures for the entire 2000–2017 period (https://www.asti.cgiar.org/countries).

24 | AGRICULTURAL RESEARCH IN SOUTHEAST ASIA
2.7 percent of their AgGDP in agricultural research, on average. China invests around 0.6 percent, Brazil around 1.8 percent, and India around 0.3 percent (ASTI various years). It should be noted that when comparing intensity ratios across countries, broader agricultural and economic contexts need to be taken into account.
In 2017, Southeast Asia invested on average $0.33 in agricultural research for every $100 of agricultural output, down from $0.50 in the year 2000 (Figure 11). These ratios are well below the 1 percent investment target recommended by global and regional bodies like the United Nations and African Union. In fact, not one Southeast Asian country met this 1 percent target in 2017. Thailand and Malaysia reported the region’s high-est intensity ratios, at 0.94 and 0.85 percent, respec-tively (Table 6). Thailand’s ratio has rapidly increased in recent years as a result of the aforementioned ambitious R&D investment growth targets it set forth. Malaysia traditionally had the highest ratio of all Southeast Asian countries. In 2002, the country invested close to 1.9
percent of its AgGDP in agricultural R&D, but its agricul-tural research spending has stagnated over time, while its AgGDP continued to grow. As a result, Malaysia’s
Figure 11—Regional agricultural R&D spending as a share of AgGDP, 2000–2017
0.00
0.10
0.20
0.30
0.40
0.50
0.60
2000 2003 2006 2009 2012 2015
Agricultural R&D spendingas a % of AgGDP
Sources: Constructed by authors from ASTI (various years); 2000–2012 data for Thailand are based on Suphannachart (2016).
Table 6—Agricultural research intensity ratios by country, 2000, 2013, and 2017
CountryAgricultural R&D spending as a % of AgGDP
2000 2013 2017
Cambodia 0.19 0.20 0.22
Indonesia 0.39 0.22 0.17
Laos 0.68 0.28 0.26
Malaysia 1.59 1.04 0.85
Myanmar 0.03 0.03 0.06
Philippines 0.35 0.28 0.41
Thailand 0.75 0.64 0.94
Vietnam 0.17 0.19 0.20
TOTAL 0.50 0.34 0.33
Sources: Constructed by authors from ASTI (various years); 2000 data for Thailand are based on Suphannachart (2016).Note: The intensity ratios indicate each country’s investment in agricul-tural research as a share of its agricultural gross domestic product.

FINANCIAL RESOURCES | 25
intensity ratio fell by nearly half during 2000–2017. The other Southeast Asian countries recorded considerably lower agricultural R&D intensity ratios than Thailand and Malaysia. The Philippines invested 0.41 percent of the country’s AgGDP in agricultural research in 2017, which was considerably higher than the 0.28 percent
ratio recorded in 2013. In contrast, ratios in Cambodia and Vietnam have remained relatively stagnant over time at around 0.20 percent, while those of both Laos and Indonesia fell precipitously during 2000–2017. Myanmar’s intensity ratio is among the lowest in the world, at around just 0.06 percent.
QUANTIFYING SOUTHEAST ASIA’S LEVEL OF UNDERINVESTMENT IN AGRICULTURAL R&D
National governments have a critical responsibility when it comes to providing sufficient and sustained agricultural R&D funding, and for creating an enabling environment within which agricultural innovation can prosper. Given the substantial time lag between investing in research and reaping its rewards—which usually takes decades, not just years—agricultural research requires a long-term funding commitment. In reality, these long research cycles rarely coincide with short-term election cycles, shifting political
agendas, and changes in government budget allo-cations—all of which have major implications for agricultural research. Decisionmakers have limited incentive to support long-term investment in agri-cultural research because extracting political credit for doing so is difficult. Agricultural research directly competes with other important public investment areas, including education, health, and infrastruc-ture, the impacts of which are more rapidly visible than those of research.

26 | AGRICULTURAL RESEARCH IN SOUTHEAST ASIA
As the agricultural research intensity ratios above suggest, Southeast Asia is underinvesting in agricul-tural research. It is hard to quantify the exact level of underinvestment, however. Conventional recom-mendations of agricultural research intensity levels, such as the 1 percent investment targets mentioned above, assume that national investments should be proportional to the size of the agricultural sector. In reality, a country’s capacity to invest in agricultural research depends on a range of variables, including the size of the economy, a country’s income level, and the availability of relevant technology spillovers from other countries. In efforts to address these nuances,
ASTI developed a multi-factored indicator of esti-mated “attainable” research intensity that comprises this range of weighted criteria (for further details, see Nin Pratt 2016 and Appendix A). Under this approach, countries with the same mix of inputs are expected to require similar minimum levels of research invest-ment, and investment below that level can be inter-preted as an indicator of potential underinvestment.
ASTI’s weighted indicator of research intensity demonstrates that all Southeast Asian countries are indeed underinvesting in agricultural research (Figure 12). Underinvestment is most severe in Myanmar. Based on the structural characteristics of
Figure 12—Actual agricultural research intensity ratios and attainable targets, 2017
0.84
1.55
1.72
0.61
1.19
0.91
0.64
0.67
0.20
0.94
0.41
0.06
0.85
0.26
0.17
0.22
0.00 0.20 0.40 0.60 0.80 1.00 1.20 1.40 1.60
Vietnam
Thailand
Philippines
Myanmar
Malaysia
Laos
Indonesia
Cambodia
Agricultural R&D spending as a % of AgGDP
Actual intensity ratio Attainable intensity target
Sources: Calculated by authors based on ASTI (various years) and Nin Pratt (2016).Notes: Traditional intensity ratios assess agricultural research investment as a share of AgGDP to determine whether countries may be underinvesting. ASTI’s intensity index incorporates multiple weighted factors that account for the size and nature of a nation’s economy, thereby facilitating more accurate cross-country comparisons. For more information on the methodology underlying this indicator, see Appendix A of this report, Nin Pratt (2016), and https://astinews.ifpri.info/2017/07/01/a-new-look-at-research-investment-goals-for-ssa/.

FINANCIAL RESOURCES | 27
Myanmar’s economy and its agricultural sector, the country should be able to invest 0.61 percent of its AgGDP in agricultural research, in other words, ten times its actual 2017 level. Indonesia, Vietnam, and the Philippines have the potential to roughly qua-druple their R&D investment, while Cambodia and Laos should be able to triple theirs. Relative levels of underinvestment were lower in Malaysia and Thailand. Nonetheless, the margin for improvement in these two countries is still considerable. Overall, the extent of underinvestment in agricultural research is much higher in Southeast Asia than it is in South Asia (Stads 2019).
The analysis also reveals that a one-size-fits-all investment target, such as the 1 percent target above, is unrealistic. Results indicate that the 1 percent target is unattainable for five of the eight countries in Southeast Asia. Only Malaysia, the Philippines, and Thailand are capable of investing more, based on the structure of their economies and agricultural sectors. For the other countries, investment targets in the 0.6–0.9 percent range are achievable. For example, for Laos, an investment target of 0.91 percent of AgGDP is thought to be realistic because this is equivalent to the levels invested by countries with similar structural characteristics. To have met this target in 2017, Laos
Figure 13—Spending by cost category for the main government research agencies, 2013–2017 averages
0% 20% 40% 60% 80% 100%
Cambodia–CARDI
Indonesia–IAARD
Laos–NAFRI
Malaysia–MARDI
Myanmar–DAR
Thailand–MOAC
Vietnam–VAAS
Share of total expenditures (%)
Salaries
Operating and program costs
Capital investments
Source: Constructed by authors from ASTI (various years).Notes: Data for government research agencies in the Philippines were of insufficient quality to be included in this figure. CARDI = Cambodian Agricultural Research and Development Institute; IAARD = Indonesian Agency for Agricultural Research and Development; NAFRI = National Agriculture and Forestry Research Institute; MARDI = Malaysian Agricultural Research and Development Institute; DAR = Department of Agricultural Research; MOAC = Ministry of Agriculture and Cooperatives; and VAAS = Vietnam Academy of Agricultural Sciences. See ASTI’s country briefs for a more detailed breakdown of yearly expenditures by cost category for these and other agricultural R&D agencies (https://www.asti.cgiar.org/countries).

28 | AGRICULTURAL RESEARCH IN SOUTHEAST ASIA
would need to have invested $67 million, instead of the $19 million it actually invested (both in inflation-adjusted, 2011 constant prices). In other words, the gap between Laos’s actual investment in agricultural research and its estimated attainable investment was nearly $48 million in 2017.
As the Laos example above indicates, the coun-try’s absolute level of underinvestment in agricultural R&D was very high in 2017. Yet similarly high levels of underinvestment occurred in prior years as well. This prompts two important questions: first, what could the
country’s agricultural productivity have been in 2017 had these higher levels of investment accumulated over time, and second, what could future agricultural productivity levels be if Laos increased its investments to attainable levels moving forward. These questions are addressed under the future growth section of this report (Page 47), which presents analyses of the long-term impact of agricultural research investment on productivity, along with the results of various scenario models assessing how best to enhance future produc-tivity growth in the region.
ALLOCATION OF AGRICULTURAL RESEARCH EXPENDITURES ACROSS COST CATEGORIES
A breakdown by cost category of agricultural research spending by the main national R&D agencies during 2013–2017 reveals important differences across coun-tries. At NAFRI (Laos) and DAR (Myanmar), salaries accounted for less than one-fifth of total spending (Figure 13). What distinguishes DAR from NAFRI, however, are the Department’s relatively high capital investments. In fact, most of the growth in DAR’s expenditure in recent years was driven by increased capital investment. A large influx of donor funding, following the country’s first ever donor conference in 2013, coupled with an increase in the government’s prioritization of agricultural research, initiated much-needed upgrades of research infrastruc-ture and equipment. However, much more funding is needed in the coming years to upgrade laboratories, office space, research equipment, vehicles, and informa-tion technology—particularly in the more remote parts of the country—to overcome decades of neglect.
In Malaysia, MARDI’s funding for research programs fell by almost half during 2013–2017, severely affecting its capacity to generate innovative, high-quality outputs. The institute is also struggling to maintain its laboratories and research equipment due to extremely low levels of fund-ing for capital investments. Although exact data were not available, the current Malaysian government (which came
into power in 2018) is said to have cut MARDI’s funding even further. The result of these cuts to the operating and capital budgets is a gradual rise in salary-related expenses as a relative share of MARDI’s total budget. By 2017, two-thirds of MARDI’s expenditures were allocated to salaries, which is by far the highest level in Southeast Asia. This situation contrasts sharply with Malaysia’s oil palm, rubber, and cocoa boards, which spend one-third of their total budgets on salaries, on average, allowing them far more scope to conduct research and upgrade their research infrastructure and equipment.
Similarly to MARDI, capital investments by the Cambodian Agricultural Research and Development Institute (CARDI, Cambodia) and VAAS (Vietnam) were minimal during 2013–2017. Outdated equipment and facilities are increasingly compromising the volume and quality of research outputs, especially at CARDI. The composition of R&D expenses seems to be more bal-anced at MOAC’s departments (Thailand) and at IAARD (Indonesia). In recent years, the very large World Bank–loan funded Sustainable Management of Agricultural Research and Technology Dissemination (SMARTD) program contributed extensively to the rehabilitation and upgrading the physical infrastructure of some of the research units within IAARD.

FINANCIAL RESOURCES | 29
FUNDING SOURCES OF AGRICULTURAL R&D
Funding for agricultural R&D in Southeast Asia is derived from a variety of sources, including national governments, donors, development banks, producer organizations, and the private sector, along with inter-nally generated revenues through the sale of goods and services. National governments are by far the most important source of funding for agricultural R&D in the region, although important variation occurs across countries (Figure 14). Government funding can be disbursed to an agricultural R&D agency through a variety of channels. In most countries, core funding
is allocated by the Ministry of Agriculture or equiva-lent, but some countries have an S&T ministry that allocates complementary research funding through one or more science funds, either competitively or through direct budget allocations.
The research departments under MOAC (Thailand) are wholly government funded. In addition to core funding from the ministry, complementary funding is raised through competitive grants from the National Research Council, the Thailand Research Fund, and the Agricultural Research Development
Figure 14—Agricultural R&D funding by source for the main government agencies, 2013–2017 averages
0% 20% 40% 60% 80% 100%
Cambodia–CARDI
Laos–NAFRI
Malaysia–MARDI
Thailand–MOAC
Vietnam–VAAS
Share of total funding
Government
Donors and development banks
Commodity levies and producer organizations
Sales of goods and services
Other
Source: Constructed by authors from ASTI (various years).Notes: Exact data on donor funding were unavailable for the Philippines and difficult to determine for Indonesia and Myanmar because the vast majority of donor funding is channeled through and allocated by the central government ministries, and as such is often inaccurately reported as government funding. CARDI = Cambodian Agricultural Research and Development Institute; NAFRI = National Agriculture and Forestry Research Institute; MARDI = Malaysian Agricultural Research and Development Institute; MOAC = Ministry of Agriculture and Cooperatives; and VAAS = Vietnam Academy of Agricultural Sciences.

30 | AGRICULTURAL RESEARCH IN SOUTHEAST ASIA
Agency. Likewise, MARDI (Malaysia) is entirely funded by the national government, through both core and competitive funding. In Indonesia, about 80–90 per-cent of agricultural research conducted by IAARD, the Forestry and Environment Research Development and Innovation Agency (FORDA), the Agency for Marine and Fisheries Research (AMFR), and the uni-versities was funded by the government ministries supervising them.
In contrast, a large portion of total agricultural R&D funding in Laos and Cambodia is provided by foreign donor agencies. Donors play a less central—but nonetheless substantial—role in funding agricultural R&D in Indonesia, Myanmar, the Philippines, and Vietnam. ACIAR is the principal foreign donor agency funding agricultural research projects conducted by government and higher education agencies in Cambodia, Indonesia, Laos, and Vietnam. ACIAR has supported a wide range of projects over time—either directly or through competitive mechanisms.
These projects have focused on crop breeding, crop production systems, soil fertility, postharvest handling, animal productivity, forestry market opportunities, aquaculture development, and agricultural extension services. Training and capacity strengthening play a key role in many of the projects that ACIAR supports. Like ACIAR, the Japanese International Cooperation Agency ( JICA) has been a constant supporter of agricultural R&D in the region. In Myanmar, JICA has supported seed bank for germplasm at DAR for over 30 years and is currently funding a large rice-breeding project, various capacity strengthening activities, and infrastructure upgrades. Similar JICA–funded activities in support of research on mechanization, maize, and rice are taking place in Indonesia and Vietnam. Likewise, South Korea’s Rural Development Administration is supporting numerous smaller research projects in Cambodia, Indonesia, Laos, Myanmar, the Philippines, and Vietnam. Other important donors to agricultural R&D in the region include the governments of China,

FINANCIAL RESOURCES | 31
BOX 3 | THE IMPACT OF COVID-19 ON AGRICULTURAL RESEARCH
At the time of writing this report, Southeast Asia was less affected by the COVID-19 pandemic than many other parts of the world. However, high (and rising) numbers of infections were still being recorded on a daily basis in Indonesia and the Philippines. It is hard to predict how long the pandemic will last, but it could have a considerable impact on the region’s agricultural R&D in terms of the cessation or suspension of nonessential operations, and travel restrictions and social distancing requirements inhibiting day-to-day activities. Unlike many other types of scientific research, most agricultural research is time-bound and cannot be paused for weeks or months because it requires constant periodic observations or depends on activities that can only be performed at certain times of the year (for example, planting season). Some research agencies could run the risk of losing years of work by having to abruptly stop long-term projects that depend on time-sensitive data. The validity and accuracy of the results of such projects cannot be guaranteed, and some research managers may see no alternative than to discontinue these projects altogether, resulting in a serious loss of time and resources. The more severe and protracted the pandemic, the greater the potential negative impact will be on agricultural research outputs.
A second uncertainty stemming from the pandemic relates to future agricultural R&D funding. COVID-19 is a health crisis of unprecedented proportions, demanding an increasing share of government budgets worldwide. Other vital sectors to developing-country economies, such as agriculture, are likely to experience budget cuts, at least in the short term. Indonesia, for example, has already announced it will divert some of its public spending from “nonessential” areas to social security and the health sector. Moreover, the worldwide economic downturn emerging from the pandemic could negatively affect the capacity of governments and donors to support agricultural development projects in the coming years. Large cuts in agricultural R&D funding are therefore a real possibility. Severe fluctuations or cuts in agricultural R&D funding will have a negative impact on the release of new varieties and technologies, and therefore on future agricultural productivity growth and poverty reduction. At this critical stage, where climate change is already adversely affecting the agricultural sector, well-targeted public expenditures in agriculture, especially those on R&D, remain essential.
Despite all these uncertainties, the COVID-19 crisis is also bringing important opportunities to agricultural research agencies across the region. Areas like zoonotic disease control, food value chains, and food system resilience will certainly be prominent in policy discussions in the coming years, presenting research agencies with important opportunities to provide scientific evidence to guide these discussions and decisions.
Source: Authors.

Sweden, Switzerland, and the United States, and the European Union. The Asian Development Bank has assisted the agricultural sectors of Cambodia, Laos, and Vietnam through various loans and grants, financing the construction and upgrades of research laboratories and other infrastructure. Negotiations are currently ongoing between Myanmar and the Asian Development Bank for a project on agribusiness value chains that contains sizeable support for agricultural R&D programs and infrastructure improvements. The World Bank has supported various multi-million-dollar projects to strengthen institutions, particularly in Indonesia and Vietnam.
Vietnam stands out from the other countries in the region in that its public R&D institutes generate a considerable share of their income through the sale of goods and services. During 2013–2017, 47 percent of the funding for VAAS member institutions was derived from government sources, 36 percent was generated internally, and 8 percent was contributed by donors and development bank loans. Since 2005, Vietnam has embarked on a gradual process of trans-ferring more financial and managerial autonomy to its research institutions, which has demanded that an increasing share of budgets be self-funded through the sale of goods and services. This has led to a prolif-eration of nonresearch services, such as the produc-tion and sale of seed and planting material, as well as consultancies and extension services. As of 2017, 6 of the 19 VAAS member institutions generated more than half of their total income internally. By 2025, core funding from the government will be further cut, and all VAAS members will be required to self-fund at least 20 percent of their budgets, which will pose a real challenge to some. Similar shifts in the com-position of funding are also occurring at non-VAAS
government agencies and universities in Vietnam. On the downside, generating nonresearch income tends to redirect research agencies’ attention to areas that may not be of high priority or that would be more appropriately performed by the private sector.
Research conducted by Malaysia’s palm oil and rubber boards is funded through commodity levies. Oil palm growers pay a tax (known as a cess) of 13 ringgit per metric ton of oil palm produced, of which 11 ringgit is allocated to the palm oil board’s operating and research expenses. For rubber, a cess of 40 ringgit per metric ton is imposed on exports from Peninsular Malaysia. The Indonesian Research Institute for Estate Crops (IRIEC), which in contrast to IAARD centers has semiautonomous status, is predominantly funded through revenues from the sale of plantation crops and technology inputs (for example, seed stock), as well as through funding from the private sector for contract research.
Universities typically receive core research funding through the Ministry of Education, or equiv-alent, and complement this funding stream through various competitive funding mechanisms, donor grants, and the provision of services to the private sector. Kasetsart University in Thailand, for example, generates 60 percent of its income through service provision. It mobilizes resources by leasing univer-sity land for research by private companies or by providing other services to government and other stakeholders, such as satellite imaging services. IPB (Indonesia) receives considerable funding from Wageningen University in the Netherlands through its Interdisciplinary Research and Education Fund. Its oil palm research is funded through the National Research and Innovation Agency, the Indonesian Oil Palm Estate Fund, and a number of private parties.
32 | AGRICULTURAL RESEARCH IN SOUTHEAST ASIA

5| AGRICULTURAL RESEARCH OUTPUTS
Key Findings
• Rice is the most researched crop across Southeast Asia, with the exception of Malaysia. The vast majority of new crop varieties released in the region in recent years have been rice varieties.
• Overall, the publication record of Southeast Asia’s agricultural researchers is weak, especially in the poorer countries with less developed agricultural research systems.
• Throughout the region, agricultural researchers in the higher education sector produce considerably more peer-reviewed publications than their colleagues at government research agencies.

34 | AGRICULTURAL RESEARCH IN SOUTHEAST ASIA
SCIENTIFIC PUBLICATIONS
AGRICULTURAL RESEARCH PRODUCES new knowledge, technologies, and varieties that can gener-ate significant returns. Typically, the path from research to innovation and direct impact takes time. One of the practical ways to quantify scientific output is to count the number of peer-reviewed publications produced by agricultural R&D agencies. Although this measure gives
no indication of the quality or impact of the research, it is an important gauge of a country’s scientific capacity and performance.
Data on the national number of agricultural science publications (in terms of books, book chapters, and peer-reviewed articles in national, Asian, and interna-tional journals) were not available, but detailed data
Figure 15—Number of peer-reviewed publications per FTE researcher, 2013–2017 averages
na
0.72
0.16
0.64
1.32
3.54
5.56
0.06
0.08
0.09
0.12
0.26
0.44
0.48
0.0 1.0 2.0 3.0 4.0 5.0 6.0
Laos
Cambodia
Thailand
Myanmar
Vietnam
Indonesia
Malaysia
Peer-reviewed publications per FTE researcher
Government Higher education
Source: Constructed by authors from ASTI (various years). Notes: FTE = full-time equivalent; na = data were not available. Peer-reviewed publications include books, book chapters, and journal articles in national, regional, and international journals. Data for the Philippines were unavailable. For Malaysia, government data exclude the Veterinary and the Fisheries Research Institute, and the higher education category only includes Univesiti Putra Malaysia, Universiti Malaysia Kelantan, and Universiti Malaysia Sarawak. For Indonesia, government data include the Agency for Marine & Fisheries Research and Development, the Forestry Research and Development Agency, and nine of ten centers under the Indonesian Agency for Agricultural Research and Development; the higher education category only includes Bogor Agricultural University. For Vietnam, government data exclude the Center for Technology Development and Agricultural Extension, the Vietnam Academy for Water Resources, the National Institute for Agricultural Planning and Projection, the Research Institute of Aquaculture No 1, and the Research Institute for Oil and Oil Plants; the higher education sector excludes Ho Chi Minh City University of Agriculture and Forestry, Hue University of Agriculture and Forestry, and Can Tho University. For Thailand, government data only includes depart-ments under the Ministry of Agriculture and Cooperatives. For Cambodia, government data only includes the Cambodian Agricultural Research and Development Institute. For Myanmar, government data only includes the Department of Agricultural Research, and the higher education category only includes Yezin Agricultural University.

FUTURE GROWTH THROUGH INCREASED AGRICULTURAL RESEARCH INVESTMENT | 35
from a number of the larger research agencies and agri-cultural faculties indicates that Southeast Asia’s publica-tion output is very low. As always, a considerable degree of cross-country variation exists, but most Southeast Asian countries recorded ratios of publications per FTE researcher of less than 1 per year (Figure 15)—a fraction of comparable ratios of high-income countries. This is a cause for concern, given that research institutes with a poor track record of publications are less likely to have impact, to collaborate with international partners, and to generate competitively sourced funding. Moreover, many government research institutes provide insuffi-cient incentives to encourage their scientists to publish the results of their research, and only some institutes factor a scientist’s publication record into his or her
performance appraisal. In many cases the publication of research results is not seen as a priority, so scientists may lack the necessary expertise to produce work of an acceptable standard for publication. In addition, many agricultural researchers in the region lack knowledge of the English language, which precludes the potential for publication in international journals. Similarly, lim-ited English proficiency hinders access to knowledge through international sources. Malaysia ranks first among Southeast Asian countries in terms of scientific publications per FTE researcher, followed by Indonesia and Vietnam.4 Malaysian researchers also published their research results more extensively in international journals than their col-leagues from other countries in the region. Agricultural
4 Detailed publication data for Thailand’s higher education sector were not available; however, the publication record of scientists in the higher education sector, in which most of the country’s PhD-qualified agricultural researchers are active, is known to be considerably higher than that of the MOAC research agencies.

36 | AGRICULTURAL RESEARCH IN SOUTHEAST ASIA
researchers in the region’s poorer countries (Cambodia, Laos, and Myanmar) produce considerably fewer publi-cations, mostly in local outlets. Across all countries, the number of publications by scientists employed in higher education sector is considerably higher (between 2 and 12 times as high) than the number published by scien-tists employed in the the government sector. Research
conducted by government agencies tends to be more focused on releasing technologies and varieties that directly benefit farmers. The research undertaken by Southeast Asia’s university-based agricultural research-ers, who are significantly more well-qualified than their government-based counterparts (see Figure 3), is often more theoretical, speaking to scholarly debates.
NEWLY RELEASED VARIETIES
Publications are only one indicator of output by agricultural research agencies. Typically, they are a by-product of the development of new technologies,
improved crop varieties, improved production pro-cesses, or new chemical or biological inputs (Box 4). Unfortunately, not all countries maintain comparable
BOX 4 | AGRICULTURAL EXTENSION IN SOUTHEAST ASIA
To ensure that the outputs of agricultural research systems reach end users (that is, farmers), effective agricultural extension is crucial. In most Southeast Asian countries, a specialized agency administered by the Ministry of Agriculture (or equivalent) delineates broad plans and priorities for agricultural extension (the exceptions being the Philippines and Vietnam, where local governments have primarily responsibility). Provincial offices and departments typically coordinate and manage service delivery, including staff training, but services to farmers are actually provided by agents at the district or village level.
Most of the region’s agricultural research extension systems are pluralistic in that they engage a wide variety of actors beyond those employed by government agencies. Nongovernmental organizations (NGOs) play a particularly important role in the delivery of extension services in Cambodia and Laos. In countries with contract farming, private companies are also engaged to offer farmers training and days spent in the field. Farmer organizations and cooperatives are particularly active in extension provision in Indonesia, the Philippines, and Thailand. While these pluralistic systems offer a range of advantages, poor coordination among providers can sometimes result in both duplication of activities and gaps in farmer coverage.
In recent years, many countries have taken steps toward decentralizing agricultural extension in an effort to increase the efficiency of delivery, promote participatory approaches, and increase responsiveness to farmers’ needs. Despite these efforts, constraints in funding and human resource capacity have often reduced the overall effectiveness of the region’s national agricultural extension systems.
Source: OECD (2017).

FUTURE GROWTH THROUGH INCREASED AGRICULTURAL RESEARCH INVESTMENT | 37
databases of newly released crop varieties and tech-nologies. In addition, available data do not distinguish between varieties developed in-house by a national government R&D agency and those developed externally (for example, by a CGIAR center) and only tested or adapted to local conditions prior to being approved for release. Moreover, many R&D agencies release numerous noncrop products and technolo-gies that are not captured in the data, so the resulting comparison of innovation capacity across countries
is inaccurate. Keeping this in mind, the available data do indicate significant cross-country variation. Unsurprisingly, the region’s smaller countries with less developed research systems— in particular, Cambodia and Laos—released considerably fewer new varieties (Table 7). Almost all the recently released varieties in Cambodia and Laos were of cereals (rice and maize), despite the relative importance of cassava, beans, and horticultural crops (especially within CARDI’s research agenda).
Table 7—Number of new varieties released and formally registered by Southeast Asia’s main government research agencies, 2013/14–2017/18
CommodityCambodia Indonesia Laos Myanmar Philippines Thailand Vietnam
CARDI IAARD NAFRI DAR Government agencies DA and RD VAAS
Rice 6 26 9 26 103 15 24
Maize 1 13 – 4 51 2 3
Wheat – 3 – 7 – – –
Sorghum – 2 – – – 1 –
Cassava – 3 – – 1 1 –
Potatoes and sweet potatoes – 5 – – 4 2 –
Fruit – 23 – – 4 8 –
Vegetables – 25 – 1 25 1 2
Legumes – 16 – 8 9 2 –
Coconuts – 11 – – – – –
Groundnuts – 8 – 4 – – 1
Sugarcane – 7 – 1 – 6 –
Plantation crops – 50 – – 10 2 –
Fiber crops – 11 – 2 – 1 –
Ornamental plants – 69 – – 3 9 –
Spices – – – – 9 3 –
Forage crops – – 3 – – – –
TOTAL 7 272 12 53 219 53 30
Source: Constructed by authors from ASTI (various years). Notes: CARDI = Cambodian Agricultural Research and Development Institute; IAARD = Indonesian Agency for Agricultural Research and Development; NAFRI = National Agriculture and Forestry Research Institute; DAR = Department of Agricultural Research; DA = Department of Agriculture; RD = Rice Department; VAAS = Vietnam Academy of Agricultural Sciences. “Plantation crops” includes oil palm, rubber, and coffee. Data for Cambodia, the Philippines, and Thailand are for 2013–2017; data for Myanmar and Vietnam are for 2013–2018; data for Indonesia are for 2014–2018; data for Laos are for 2018 (the year the National Seed Policy was established allowing improved plant varieties to be formally registered). Data for Malaysia were excluded due to lack of disaggregation of public and private varietal releases; however, the number of new varieties registered by the Malaysian Agricultural Research and Development Institute is limited and mostly includes varieties of rice.

38 | AGRICULTURAL RESEARCH IN SOUTHEAST ASIA
In recent years, the bulk of new crop varieties in Myanmar, the Philippines, and Vietnam were also cereals. More than three-quarters of the 351 new crop varieties formally registered in Vietnam during 2013–2018 were from (local and foreign) private companies. In the public sector, VAAS member institutions registered a combined total of just 30 new crop varieties during this period, and the Vietnam National University of Agriculture reg-istered 21 new varieties. A similar picture emerges for Thailand. As in Vietnam, the private sector in Thailand accounts for roughly three-quarters of all new crop vari-eties registered. By comparison, the innovative capacity of the country’s Rice Department (RD) and Department of Agriculture (DA) is limited. During 2013–2017, these
two government departments registered 15 and 38 new varieties, respectively. During 2014–2018, IAARD (Indonesia) not only released more new crop varieties than the region’s other national agricultural research agencies, but the varieties released were also far more diverse; they included cereals, horticultural crops, roots and tubers, pulses, plantation crops, fiber crops, and ornamental plants. IAARD also had success in obtaining an increasing number of patents in recent years, which underscores the potential for further commercialization of innovative technologies. IAARD is also becoming increasingly successful at licensing its technologies to the private sector.

6| PERFORMANCE OF AGRICULTURAL RESEARCH SYSTEMS
Key Findings
• The agricultural research systems of Southeast Asia’s more economically developed countries rank substantially higher than those of the region’s poorer countries on nearly all performance indicators.
• Malaysia has the most efficient agricultural research system in Southeast Asia in terms of cost per unit of research output. Myanmar’s agricultural research system ranks lowest.
• The composition of research staff (in terms of qualification levels) and the level and composition of research spending (in terms of allocations to salaries, operating costs, and capital investments) are important drivers of overall system performance.

THIS CHAPTER IDENTIFIES the strengths and weaknesses of Southeast Asia’s various agricultural research systems.5 The performance of each country’s research system is assessed using a single indicator: the cost of research per unit of output. This indicator is then disaggregated as cost per researcher and productivity level per researcher, both of which are closely linked to a research system’s cost structure and the quality of its human resource capacity. Finally, the funding structure and overall extent of underinvestment of each research system shed light on the factors
that constrain or facilitate systems’ effective use of research inputs.
The framework chosen to analyze the perfor-mance of the region’s agricultural research systems is based on the hierarchical interrelationships among a number of indicators (Figure 16). It facilitates the identification of strengths and weaknesses in the use of research inputs throughout the process of producing research output. Please consult Appendix B for definitions of the individual indicators and how they contribute to the assessment of a system’s over-all performance.
COST PER UNIT OF RESEARCH OUTPUT
The cost per unit of research output is considerably lower in Southeast Asian countries with larger and more developed research systems (Malaysia and Thailand) than it is in smaller countries with much smaller systems (Cambodia and Laos). Myanmar is clearly an outlier in the region, with an average cost of 2.88 million PPP dollars per quality-adjusted publica-tion (Figure 17).6 Malaysia has the most efficient agri-cultural research system in the region as measured by R&D spending per quality-adjusted publication (0.29
million PPP dollars per article). Interestingly, Vietnam recorded a cost per quality-adjusted publication sim-ilar to Thailand’s and lower than Indonesia’s, despite spending considerably less in agricultural R&D than these two countries. Finally, Indonesia recorded rela-tively high costs per output compared with Malaysia and Thailand, the two other countries with leading agricultural research systems. This appears to point to certain inefficiencies in Indonesia’s agricultural research system.
PRODUCTIVITY PER RESEARCHER VERSUS COST PER RESEARCHER
Results indicate that high productivity per researcher is positively correlated with high spending per researcher (Figure 18). For example, Malaysia’s spending per researcher is 4 times higher than both Cambodia’s and Laos’s, but the productivity of
Malaysian researchers is 10 times higher than in these two countries. Compared with Vietnam, Malaysia spends 10 times as much on agricultural research per researcher and obtains 15 times more output per researcher. Compared with Thailand, Malaysia spends
40 | AGRICULTURAL RESEARCH IN SOUTHEAST ASIA
5 The Philippines is excluded from the analysis in this chapter because the quality and coverage of the relevant cost category and funding source data were inadequate to conduct an in-depth analysis or comparison with other Southeast Asian countries.
6 See Appendix B for a definition of quality-adjusted publications.

PERFORMANCE OF AGRICULTURAL RESEARCH SYSTEMS | 41
Figure 16—Determinants of country-level costs per unit of research output
Productivity of researchersProductivity = number of quality-adjusted publications / number of FTEs
Cost per researcherCost per FTE = total cost of R&D / number of FTEs
Cost per unit of research output Cost per unit of output = total cost of agricultural R&D (including salary-related, operating, and capital expenses) / the number of quality-adjusted publications
Cost structure • Capital investments as a share
of total expenditures (%) • Salary costs / number of FTE
researchers
Composition of researchers by qualification level
• Share of FTEs with MSc and PhD degrees (%)
• Ratio of FTEs with PhD degrees to FTEs with MSc degrees
Surrounding environment and structural characteristics
• Scale of the country’s agricultural R&D system • Size of the country’s economy • Country’s income level • Size of the country’s agricultural sector
Agricultural R&D investment intensity
• Investment gap (that is, gap between actual and attainment levels of investment)
• Growth in R&D spending
Funding sources and constraints • Country-level funding volatility • Country-level government funding, plus the proceeds
of commodity levies and the sale of goods and services, as a share of total agricultural research funding
• Country-level donor funding as a share of total government funding, plus the proceeds of commodity levies and the sale of goods and services
Source: Devised by authors.

Figure 18—Productivity of researchers and cost per researcher, 2013–2017
0.09
0.260.14
1.43
0.03
0.67
0.090.100.17
0.11
0.42
0.07
0.27
0.040.00
0.40
0.80
1.20
1.60
0.00
0.40
0.80
1.20
1.60
Cambodia Indonesia Laos Malaysia Myanmar Thailand Vietnam
Million 2011 PPP dollars
Researcher productivity Cost per researcher
Quality-adjusted publications per researcher
Sources: Authors based on ASTI (various years) and SCImago (2020).Note: See Appendix B for further detail.
42 | AGRICULTURAL RESEARCH IN SOUTHEAST ASIA
Figure 17—Agricultural research spending per quality-adjusted article, 2013–2017
Million 2011 PPP dollars
1.15
0.67 0.79
0.29
2.88
0.41 0.420.00
0.50
1.00
1.50
2.00
2.50
3.00
3.50
Cambodia Indonesia Laos Malaysia Myanmar Thailand Vietnam
Spending per quality-adjusted article
Sources: Authors based on ASTI (various years) and SCImago (2020).Notes: In order to facilitate viable cross-country comparisons, the number of articles published per country was converted to the number of articles of similar quality published per country. Hence, research output is the number of articles published by a country’s scientists in the areas of agronomy and biology, adjusted by the h-index, as follows: AHi = Ai×(Hi/Hmax), where AHi is the number of articles, adjusted for quality, per country; Ai is the actual number of articles published; Hi is the h-index of I; and Hmax is the highest h-index among all the countries in the region. See Appendix B for further detail.

55 percent more per researcher, but obtains more than twice the output per researcher. Spending per researcher in Indonesia is very low and closer to lev-els observed in Laos and Cambodia, with productivity being only 40 percent of Thailand’s productivity but
still twice that of Laos. Although Vietnam recorded the lowest level of spending per researcher (PPP$0.04 million), its productivity is comparable to Cambodia’s, which spends more than twice as much than Vietnam per researcher (PPP$0.10 million).
COST STRUCTURE AND HUMAN RESOURCES
Differences in cost and productivity of researchers are related to differences in the qualification levels of researchers and the allocation of research spending reflected in the cost structure. Table 8 compares indi-cators of the qualification levels of researchers and the cost structure of R&D systems based on ASTI data. Overall, average researcher qualifications are highly correlated with researcher productivity, with Indonesia being an important exception (Table 8). Researchers with MSc and PhD degrees represent 69 percent of all agricultural researchers in Indonesia and Malaysia. These two countries also have the high-est ratio of PhD-qualified to MSc-qualified researchers (about 0.75). This result helps explain why Malaysia recorded the highest productivity of all the region’s countries, but it does not explain the differences between Indonesia and Malaysia. Vietnam ranks third
after Indonesia and Malaysia in terms of its share of MSc- and PhD-qualified agricultural researchers (63 percent), but its ratio of PhD- to MSc-qualified research, at 0.36, is considerably lower (less than half Malaysia’s ratio). In the case of Thailand, Laos, and Cambodia, about half the total number of agricultural researchers are qualified to the MSc- or PhD-degree levels, but the ratio of researchers with PhD degrees to those with only MSc degrees is significantly higher in Thailand (0.52) than in either Laos (0.33) or Cambodia (0.19). Thailand’s lower overall productivity per researcher compared with that of Malaysia may be due to its lower average researcher qualification levels.
High shares of capital expenditures and low aver-age salary-related costs per researcher appear to be associated with low researcher productivity, whereas high salary-related costs are the main driver of higher
PERFORMANCE OF AGRICULTURAL RESEARCH SYSTEMS | 43
Table 8—Indicators of qualification of human resources and cost structure, 2013–2017
Indicator Cambodia Indonesia Laos Malaysia Myanmar Thailand Vietnam
Researcherqualifications
Share of researchers with MSc and PhD degrees (%) 46 69 50 69 36 52 63
Ratio of PhD-qualified researchers to MSc-qualified researchers 0.19 0.73 0.33 0.75 0.48 0.51 0.36
Cost structure
Share of capital expenditures in total spending (%) 24 21 14 6 39 10 3
Salary-related costs per FTE researcher (thousand 2011 PPP dollars) 13 38 12 151 13 112 9
Source: Calculated by authors based on ASTI (various years).Note: Researcher qualification data cover both government and higher education sectors, while the cost structure data exclude the higher education sector.

costs per researcher (see the last two rows of Table 8 and Figure 18). One explanation of high capital invest-ments being negatively correlated with productivity is their potential to be associated with the unproductive assets (with high fixed costs), which can leave com-paratively limited funds available for salary-related expenses and operating costs. Capital expenses represent only 6 percent of Malaysia’s total costs, compared with 21 percent of Indonesia’s (reflecting the aforementioned upgrades to infrastructure under the World Bank loan–funded SMARTD initiative). In Malaysia, spending on salaries per researcher totaled PPP$151,000, compared with $112,000 in Thailand and just $38,000 in Indonesia. Overall, countries with
smaller research systems recorded higher shares of capital expense than countries with larger systems. Vietnam stands apart from most countries in the region in that it spends very little on salaries despite having a high share of researchers with MSc and PhD degrees (63 percent). This has led the country to achieve relatively high productivity per researcher at a very low cost. The Vietnamese government, however, has announced incremental yearly salary increases for researchers to 2030, counterbalanced with staff cuts in order to rationalize its agricultural research system. These two measures will drive up the average cost per researcher in the coming years.
RESEARCH INVESTMENT INTENSITY AND FUNDING
Underinvestment and budget constraints have an important impact on the quantity and quality of research outputs, and on the overall cost structure and composition of human resource capacity in agri-cultural research systems. As such, investment levels are an important determinant of performance. As previously discussed, all countries in the region are underinvesting in agricultural R&D, but the level of underinvestment is more severe among the lower income countries with smaller research systems (Table 9). Malaysia and Thailand are the two best performers with ratios of actual investments to attainable invest-ments of 71 and 61 percent, respectively. All other countries recorded ratios of less than 33 percent, and Myanmar’s ratio was just 11 percent. Average rates of agricultural research investment growth for the decade preceding 2017 demonstrate that Cambodia and Myanmar were the only countries to increase their investment at significant rates, but this should be considered in context, since they are also major
underinvestors (Table 9). All other countries in the region recorded either slow or negative growth in agricultural R&D spending during 2008–2017, which is a major concern. Indonesia, in particular, reduced its spending at an average rate of –3.0 percent per year.
Government funding, commodity levies, and internally generated resources through the sale of goods and services are the main sources of agricul-tural research funding in Indonesia, Thailand, Malaysia, and Vietnam, representing more than 80 percent of each country’s total funding (see the bottom rows of Table 9). In Laos and Cambodia, donors play a major role in funding agricultural R&D. Higher donor depen-dency is positively correlated with funding volatility in developing countries around the globe (Stads and Beintema 2015), and data reveal that Southeast Asia is no exception. Severe fluctuations in yearly agricultural R&D funding can compromise long-term budgeting, staffing, and planning decisions, all of which affect the research continuity and outcomes.
44 | AGRICULTURAL RESEARCH IN SOUTHEAST ASIA
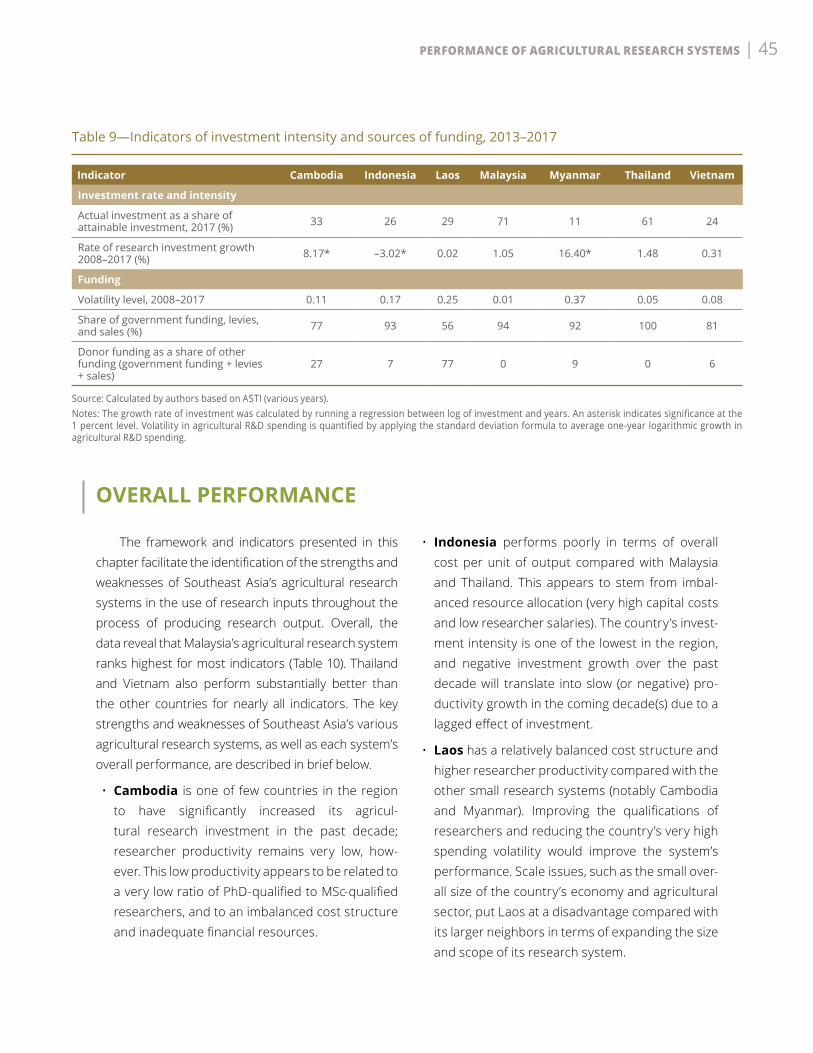
OVERALL PERFORMANCE
The framework and indicators presented in this chapter facilitate the identification of the strengths and weaknesses of Southeast Asia’s agricultural research systems in the use of research inputs throughout the process of producing research output. Overall, the data reveal that Malaysia’s agricultural research system ranks highest for most indicators (Table 10). Thailand and Vietnam also perform substantially better than the other countries for nearly all indicators. The key strengths and weaknesses of Southeast Asia’s various agricultural research systems, as well as each system’s overall performance, are described in brief below.
• Cambodia is one of few countries in the region to have significantly increased its agricul-tural research investment in the past decade; researcher productivity remains very low, how-ever. This low productivity appears to be related to a very low ratio of PhD-qualified to MSc-qualified researchers, and to an imbalanced cost structure and inadequate financial resources.
• Indonesia performs poorly in terms of overall cost per unit of output compared with Malaysia and Thailand. This appears to stem from imbal-anced resource allocation (very high capital costs and low researcher salaries). The country’s invest-ment intensity is one of the lowest in the region, and negative investment growth over the past decade will translate into slow (or negative) pro-ductivity growth in the coming decade(s) due to a lagged effect of investment.
• Laos has a relatively balanced cost structure and higher researcher productivity compared with the other small research systems (notably Cambodia and Myanmar). Improving the qualifications of researchers and reducing the country’s very high spending volatility would improve the system’s performance. Scale issues, such as the small over-all size of the country’s economy and agricultural sector, put Laos at a disadvantage compared with its larger neighbors in terms of expanding the size and scope of its research system.
PERFORMANCE OF AGRICULTURAL RESEARCH SYSTEMS | 45
Table 9—Indicators of investment intensity and sources of funding, 2013–2017
Indicator Cambodia Indonesia Laos Malaysia Myanmar Thailand Vietnam
Investment rate and intensity
Actual investment as a share of attainable investment, 2017 (%) 33 26 29 71 11 61 24
Rate of research investment growth 2008–2017 (%) 8.17* –3.02* 0.02 1.05 16.40* 1.48 0.31
Funding
Volatility level, 2008–2017 0.11 0.17 0.25 0.01 0.37 0.05 0.08
Share of government funding, levies, and sales (%) 77 93 56 94 92 100 81
Donor funding as a share of other funding (government funding + levies + sales)
27 7 77 0 9 0 6
Source: Calculated by authors based on ASTI (various years). Notes: The growth rate of investment was calculated by running a regression between log of investment and years. An asterisk indicates significance at the 1 percent level. Volatility in agricultural R&D spending is quantified by applying the standard deviation formula to average one-year logarithmic growth in agricultural R&D spending.

• Malaysia has the top-ranked research system in the region: it recorded the lowest cost per unit of output, the highest rate of researcher productiv-ity, relatively high investment intensity, and the lowest level of spending volatility. Nevertheless, stagnant investment growth in the past (and negative growth in R&D spending targeting food crops) will result in sluggish productivity growth in the coming years.
• Myanmar recorded extreme underinvestment in agricultural R&D in recent years, and this rep-resents a major constraint. Investment at very high rates of growth will be necessary in the com-ing decade. Improving the qualification levels of researchers is another urgent priority. Given the country’s structural characteristics, its research system has the potential to operate at a similar size to Malaysia’s.
• Thailand is the second-rank performer in the region after Malaysia. It recorded relatively high researcher productivity, low per-unit output costs, and high investment intensity. The relatively low researcher qualification levels are the main weak-ness of the Thai system.
• Vietnam has the potential to develop a research system to rival Malaysia’s and Thailand’s. Its current system is already proving to be cost-effective (although its pool of researchers is relatively underpaid). Investment growth and intensity remain far too low, however, as does researcher productivity. Uncontrolled recruitment over the past decade has inflated the system’s staffing levels. Well-targeted downsizing could improve overall efficiency. On a positive note, the system relies on its own sources of funding and recorded relatively low spending volatility.
46 | AGRICULTURAL RESEARCH IN SOUTHEAST ASIA
Table 10—Summary of performance of research systems, strengths, and weaknesses
Indicator Cambodia Indonesia Laos Malaysia Myanmar Thailand Vietnam
Cost per unit of output 6 4 5 1 7 2 3
Cost per researcher 3 5 4 7 2 6 1
Researcher productivity 5 3 4 1 7 2 5
Researcher qualifications 7 1 5 2 5 3 4
Cost structure 7 6 4 3 1 4 1
Investment intensity 3 5 3 1 7 2 6
Research funding 5 3 6 2 7 1 3
Source: Calculated by authors based on ASTI (various years). Notes: Countries were ranked by each indicator, then rankings were averaged to attain a score from best (1) to worse (7) for each area of performance. Note also that in some cases, two countries tied for a position in the rankings.

7| FUTURE PRODUCTIVITY GROWTH THROUGH INCREASED AGRICULTURAL RESEARCH INVESTMENT
Key Findings
• Increased agricultural research spending would trigger considerable agricultural productivity growth across Southeast Asia.
• Prioritizing R&D investment in high-value commodities would result in faster future productivity growth in Indonesia, Malaysia, the Philippines, and Vietnam. Prioritizing R&D investment in staple crops is still a prudent course of action in Cambodia, Laos, Myanmar, and Thailand.
• Attaining self-sufficiency in rice production by 2050 is highly unlikely in Malaysia and challenging for Indonesia. Much higher investment in rice research, coupled with a large increase in land area under rice cultivation, would be required. The remaining Southeast Asian countries are projected to maintain rice self-sufficiency to 2050, even at relatively modest rates of future growth in rice research investment.

ANALYZING THE PAST performance of agricul-tural research systems, as in the previous chapter, is useful for identifying systems’ strengths and weak-nesses and detecting areas needing improvement. Conversely, strict reliance on historical data will not prepare an agricultural research system for its future challenges and opportunities. In the next 20 to 30 years, the economies of Southeast Asia will continue
to grow, incomes will increase, and consumption patterns will change, as will the demand for agricul-tural products, imports, and exports. As more rural workers migrate to urban areas, farmers will demand new technologies to deal with growing land and labor costs. In this context, forward-looking models are useful for assessing the risks and potentials of differ-ent scenarios of research investment.
IMPACT OF HIGHER RESEARCH INVESTMENT ON AGRICULTURAL PRODUCTIVITY
As previously demonstrated, all Southeast Asian countries are underinvesting in agricultural R&D. In an effort to quantify the exact level of underinvestment, ASTI developed “attainable” investment targets for each of the countries based on the size of their agri-cultural sector and total economy, their income level, and the availability of relevant technology spillovers from other countries. Underinvestment in agricultural R&D was most severe in Myanmar (see Figure 12). As of 2017, Indonesia, the Philippines, and Vietnam were only investing at a quarter of their estimated attainable levels, and Cambodia and Laos were investing at about one-third of their attainable levels. Underinvestment in Malaysia and Thailand was less severe, but nonetheless substantial. ASTI ran medium- to long-term projec-tions to assess the impact on agricultural productivity of countries gradually closing the gaps between their actual 2017 investment levels and their respective (estimated) attainable investment levels. The analysis included two different scenarios of projected R&D investment: a Business-as-usual scenario, under which investment growth continues its historical trajectory, and a Closing-the-gap scenario, under which growth is set at rates that will gradually close the investment gap by 2030, and thereafter maintaining it closed to 2050.7
The projected trends indicate that, were Southeast
Asian countries to accelerate their agricultural R&D investment to the levels needed to close the R&D investment gap by 2030, the long-term impact on agricultural productivity growth would be substantial (Figure 19). The region’s total factor productivity (TFP) in agriculture would be nearly three times higher in 2050 than in 2016, which corresponds to an aver-age yearly growth rate of 2.9 percent (see Box 5 for a detailed explanation of TFP). In contrast, modeling results indicate that, were R&D investment to continue to grow at long-term historical rates, agricultural pro-ductivity would increase at an average rate of just 0.9 percent per year, or 42.0 percent for the entire 2016–2050 period. It is important to note that significantly increased R&D investment after 2016 would not have an immediate impact on agricultural TFP due to the lagged effect of investment on productivity growth. Most of the impacts on productivity would accrue in the 2030s and 2040s.
The impact of accelerated R&D investment on agricultural productivity can vary significantly across countries, depending on their past and present levels of underinvestment, and the effectiveness with which each country converts investment into TFP growth. Modeling results project agricultural productivity growth in Myanmar beyond the regional average under
48 | AGRICULTURAL RESEARCH IN SOUTHEAST ASIA
7 See Appendix C and D for descriptions of the methodology used to calculate the stocks of knowledge derived from R&D investment and the TFP elasticities used to convert changes in knowledge stocks to TFP growth.

both investment scenarios (Figure 20). It is important to note, however, that as of 2017 Myanmar was the region’s largest underinvestor in agricultural research. As such, it has a wider gap to close and would require more intensive agricultural R&D investment growth compared with the other Southeast Asian countries. This faster growth, combined with much higher R&D investment growth rates during 2008–2017 (see Table 8), results in high rates of projected productivity growth. Unsurprisingly, projections indicate much lower yearly agricultural productivity growth in Indonesia, Laos, and Malaysia in the coming years (under both investment scenarios) due to these countries’ low
(or negative) rate of R&D investment growth during 2008–2017. Indonesia’s agricultural TFP growth under the Business-as-usual scenario is projected to average –0.1 percent per year during 2017–2050 due to the contraction in the country’s R&D investment in recent years. By raising agricultural research investment to levels that would close the investment gap by 2030, Indonesia could achieve an average rate of yearly TFP growth of 1.1 percent during 2016–2050. For Malaysia, projected productivity growth under both scenarios is quite similar (0.5 and 0.6 percent, respectively) because Malaysia’s R&D investment gap is the low-est of all Southeast Asian countries. Consequently,
FUTURE PRODUCTIVITY GROWTH THROUGH INCREASED AGRICULTURAL RESEARCH INVESTMENT | 49
Figure 19—Regional productivity growth projections to 2050 under two investment scenarios
0
2
4
6
8
10
12
14
16
18
0
50
100
150
200
250
300
1981 1986 1991 1996 2001 2006 2011 2016 2021 2026 2031 2036 2041 2046
Historical total factor productivityTotal factor productivity under the Business-as-usual scenarioTotal factor productivity under the Closing-the-gap scenarioHistorical R&D spendingR&D spending under the Business-as-usual scenarioR&D spending under the Closing-the-gap scenario
Index of total factor productivity (2016 = 100) Agricultural R&D spending (billion 2011 PPP dollars)
Sources: Calculated by authors based on USDA-ERS (2019) and ASTI (various years).Notes: Under the Business-as-usual scenario, R&D investment increases at a yearly rate of 1.4 percent during 2016–2050; closing the investment gap by 2030 would require an increase in regional agricultural R&D spending of 5.5 percent per year. This scenario assumes that growth in R&D investment would gradually fall after 2030 to reach a rate of 3.5 percent in 2050.

50 | AGRICULTURAL RESEARCH IN SOUTHEAST ASIA
a much lower rate of future R&D investment growth is needed to close the gap by 2030 (see Figure 12). Relatedly, Malaysia’s very low growth in R&D invest-ment over the past decade is a major contributing factor to its projected slow agricultural productivity growth in the coming years. It is important to recognize
that these initial projections maintain the existing allocation of investment across various commodities and lines of research. The impact of modifying the allocation of investments across various commodities is examined in the next section.
PRIORITIZING RESEARCH INVESTMENT IN STAPLE VERSUS HIGH-VALUE CROPS
It is not only the level, but also the allocation of agri-cultural R&D investment that is important. A country that intends to develop new value chains and increase its agricultural exports, for example, would require a completely different allocation of its R&D invest-ment than a country pursuing the goal of achieving self-sufficiency in the production of staple crops. The
first country might prioritize investment in high-value commodities, such as livestock, aquaculture, and hor-ticulture, whereas the second country might prioritize investment in rice research. Such policy decisions have important implications for future agricultural growth patterns and trade in agricultural commodities. ASTI therefore modeled different scenarios of investment
Figure 20—Projected average yearly growth in agricultural productivity under two investment scenarios, 2016–2050
2.1
- 0.1 - 0.1
0.5
3.1
0.3 0.9
1.7
0.9
2.9
1.11.2
0.6
7.7
1.50.9
2.7 2.9
-1.0
0.0
1.0
2.0
3.0
4.0
5.0
6.0
7.0
8.0
9.0
Cambodia Indonesia Laos Malaysia Myanmar Philippines Thailand Vietnam Region
Business-as-usual scenario Closing-the-gap scenario
Yearly growth in total factor productivity (%)
Source: Calculated by authors based on USDA-ERS (2019).Notes: Under the Business-as-usual scenario, each country’s long-term average historical growth rate is used to project future investment; under the Closing-the-gap scenario, growth of investment is calculated as the yearly rate required for the country to shift its actual level of agricultural research investment to its attainable level during 2016–2030 (See Figure 12).

FUTURE PRODUCTIVITY GROWTH THROUGH INCREASED AGRICULTURAL RESEARCH INVESTMENT | 51
BOX 5 | LONG-TERM AGRICULTURAL PRODUCTIVITY GROWTH
Increasing the efficiency of agricultural production—that is, getting more output from the same amount of resources—is critical for improving food security. Total factor productivity (TFP) is an indicator of how efficiently agricultural land, labor, capital, and other inputs (seed, fertilizer, and so on) are used to produce a country’s agricultural outputs (crops, livestock, and so on). TFP is calculated as the ratio of total agricultural outputs to total production inputs, so when more output is produced from a constant amount of resources, TFP increases. R&D activities producing new crop varieties, technologies, and innovations are a crucial driving factor of TFP, but technological spillovers from abroad, higher numbers of skilled workers, investments that favor the development of input and output markets (such as in roads and communications), and government policies and institutions that promote market development and competition are major drivers as well.
Overall, growth in Southeast Asia’s TFP was fairly slow during the 1980s and 1990s, but significant acceleration has occurred since (see the Figure below). For much of the 1980s, 1990s, and 2000s, Malaysia recorded the highest growth in agricultural TFP among Southeast Asian countries, not least because of its sustained high levels of agricultural R&D investment. However, the countries that recorded the highest TFP growth during the 2000–2016 period were Cambodia, Laos, Myanmar, and Vietnam. The market-oriented agriculture and trade policy reforms that these countries passed in recent decades were conducive to private-sector investment and prompted important production efficiencies. Moreover, trade integration with the global economy, and with member countries of the Association of Southeast Asian Nations (ASEAN) in particular, has been a major driver of productivity growth in these countries.
It is critical that agricultural TFP growth is sustained into the future because it will positively affect farm incomes and reduce rural poverty. Future growth of agricultural output and produc-tivity will be highly dependent on technical change. Sustained high levels of agricultural R&D investment will play a critical role in driving future innovation. R&D investment decisions that countries make today will have serious repercussions for agricul-tural productivity growth in the decades to come. It is therefore crucial that countries identify untapped potential in economi-cally important crop and livestock areas.
Source: Authors.
50
100
150
200
250
300
1980 1985 1990 1995 2000 2005 2010 2015
Cambodia Indonesia Laos Malaysia
Myanmar Philippines Thailand Vietnam
Index(1980=100)
Long-term growth in agricultural TFP, 1980–2016
Source: Calculated by authors based on USDA-ERS (2019).

52 | AGRICULTURAL RESEARCH IN SOUTHEAST ASIA
allocations to assess their effects on future agricultural TFP growth.
Cambodia and Malaysia are characterized by extreme production specialization (Table 11). In Cambodia, 90 percent of harvested area during 2013–2016 was allocated to staple crops (cereals and roots), of which 75 percent was under rice production. During the same timeframe, Malaysia allocated 88 percent of its land to oil palm and other plantation crops, such as rubber, sugarcane, cocoa, coffee, tea, and fiber crops. The countries with the highest level of production diversification (at least at this level of aggregation) are Indonesia and the Philippines: 33 percent of both countries’ harvested area was allocated to rice during 2013–2016, and 25–29 percent was under oil crops. The Philippines also allocated the highest shares of land to nonrice cereals (18 percent) and to fruit and vegetables (16 percent). Laos, Thailand, and Vietnam all had more than 50 percent of their crop area under rice cultivation, and the remainder under
a wide variety of secondary crops. Finally, Myanmar recorded a pattern of crop diversification similar to those of Indonesia and the Philippines, but the relative importance of pulses differentiate it from the other countries. Land allocation is not static, however, and has shifted considerably with time. All countries, with the exceptions of the Philippines and Thailand, reduced their shares of rice in total production area since the early 1990s, but the patterns of area expansion differ significantly for other crops. Higher income countries like Indonesia, Malaysia, and Thailand have expanded oil crop production over time. Cambodia has increased its production of cassava, pulses, and oilseeds in a process of diversification that is set to continue into the future. Production of fruit and vegetables, and cereals other than rice have gained prominence in both Laos and Vietnam.
Together, livestock and fisheries have averaged about one-third of the total value of agricultural production (excluding forestry) in Southeast Asia over

FUTURE PRODUCTIVITY GROWTH THROUGH INCREASED AGRICULTURAL RESEARCH INVESTMENT | 53
time. (Table 12). The lowest livestock and fisheries shares were recorded by Laos and Cambodia. All countries in Southeast Asia, with the exception of Thailand, increased fisheries as a share of total output from the early 1990s. Fastest growth in fisheries production occurred in Indonesia and Vietnam. Overall, growth in livestock production was slower in most countries compared with growth in crop production and fisheries. Myanmar is the only country to have significantly expanded its livestock sector since 1991. Livestock shares also increased in Malaysia and the Philippines in the past 25 years, but the changes were relatively small compared with Myanmar.
ASTI ran long-term projections to determine the impact of different R&D investment priorities on agri-cultural TFP. The four scenarios gave investment prior-ity (1) to cereals, roots and tubers, and pulses (that is, staple crops); (2) to oil crops and other cash crops (that is, sugarcane, coffee, cocoa, rubber); (3) to fruit and vegetables; and (4) to livestock and fisheries. Under all four scenarios, during the 2016–2050 period, invest-ment increased at an average yearly rate of 6 percent for the target commodity group, and by 3 percent per year for all other commodities. TFP growth was calcu-lated for the agricultural sector and period as a whole
Table 11—Crop share of total harvested area, 2013–2016, and average yearly change in crop share, 1991–2016
Country/Share/ Rate of change in share Rice Other
cereals Roots Pulses Oilseeds Fruit and vegetables
Other crops
Cambodia
Share (%) 75.2 3.7 9.2 1.7 4.5 3.9 1.8
Rate of change of share (%) –0.6 3.7 11.3 2.2 3.2 –1.9 –3.6
Indonesia
Share (%) 33.0 9.2 2.9 0.5 28.7 6.2 19.5
Rate of change of share (%) –0.9 –1.0 –3.2 –5.1 1.8 0.0 1.1
Laos
Share (%) 56.0 14.3 4.3 1.2 2.8 14.0 7.3
Rate of change of share (%) –1.6 6.7 0.0 –2.4 0.0 5.3 1.2
Malaysia
Share (%) 9.3 0.1 0.1 0.0 72.7 2.2 15.6
Rate of change of share (%) –1.2 –6.0 –9.5 0.0 2.1 –0.3 –4.3
Myanmar
Share (%) 39.7 6.1 0.5 24.9 18.5 5.1 5.2
Rate of change of share (%) –1.4 0.0 2.6 2.8 0.7 0.0 0.0
Philippines
Share (%) 32.2 17.6 2.4 0.5 25.0 15.8 6.5
Rate of change of share (%) 0.9 –2.0 –1.0 0.2 0.1 1.0 0.8
Thailand
Share (%) 50.9 6.7 7.0 1.0 4.8 7.6 22.0
Rate of change of share (%) 0.0 –1.4 –0.8 –4.1 –1.0 0.0 1.8
Vietnam
Share (%) 54.9 8.2 5.0 2.2 3.6 13.3 12.9
Rate of change of share (%) –0.9 2.6 –0.9 –1.5 –2.1 2.1 4.0
Source: Calculated by authors based on FAO (2020).

54 | AGRICULTURAL RESEARCH IN SOUTHEAST ASIA
Table 12—Share of crop, livestock, and fisheries output, 2016, and yearly change, 1991–2016
CountryShare in agricultural
production value, 2016 (%)Yearly change in share of
production value, 1991–2016 (%)
Crops Livestock Fisheries Total Crops Livestock Fisheries
Cambodia 73.1 7.6 19.4 100 7.8 –2.6 3.2
Indonesia 59.7 6.1 34.2 100 1.2 –1.6 6.6
Laos 82.0 8.6 9.4 100 4.7 –2.0 1.5
Malaysia 55.1 24.3 20.6 100 –1.1 0.8 1.2
Myanmar 62.4 19.1 18.5 100 –2.5 4.6 2.0
Philippines 54.9 19.1 26.0 100 –1.6 1.7 0.7
Thailand 72.6 16.9 10.5 100 0.9 –0.3 –1.5
Vietnam 56.7 16.7 26.6 100 –1.1 0.3 5.6
Source: Calculated by authors based on FAO (2020).
Figure 21—Projected relative growth in agricultural productivity under four agricultural research investment scenarios, 2016–2050
0.0
0.2
0.4
0.6
0.8
1.0
1.2
1.4
1.6
1.8
Cambodia Indonesia Laos Malaysia Myanmar Philippines Thailand Vietnam
Staple crops Oil crops and other cash crops Fruits and vegetables Livestock and fisheries
Projected 2016–2050 total factor productivity growth relative to the staple crop prioritization scenario (staple crop scenario = 1)
Sources: Calculated by authors based on ASTI (various years), FAO (2020), and USDA-ERS (2019).Notes: The four scenarios, respectively, prioritize investment in (1) cereals, roots and tubers, and pulses (that is, staple crops); (2) oil crops, sugarcane, coffee, cocoa, rubber, and other cash crops (that is, oil crops and other cash crops); (3) fruit and vegetables; and (4) livestock and fisheries. In all these scenarios, investment in target commodities increases at a yearly rate of 6 percent, whereas investment in all other commodities increases at a yearly rate of 3 percent. See Appendices C and D for further detail.

FUTURE PRODUCTIVITY GROWTH THROUGH INCREASED AGRICULTURAL RESEARCH INVESTMENT | 55
to determine how the different scenarios affected sector-wide growth in each country.
Projections indicate that increasing R&D investment in staple crops and livestock and fish-eries yields the highest TFP growth for the region (Figure 21). Prioritizing investment in staple crop research (Scenario 1) is clearly the best option for Laos. Projection results for Laos for Scenario 1 yield 25 per-cent higher overall agricultural TFP growth compared with results for Scenarios 3 and 4 (fruit and vegetables, and livestock and fisheries, respectively) and 50 percent higher TFP growth compared with results for Scenario 2 (oil crops and other cash crops). In Cambodia and
Myanmar, Scenarios 1 and 4 yield comparable results in agricultural TFP growth, whereas, in Malaysia, the great-est impact on TFP growth is derived from Scenarios 2 and 4 (30 and 40 percent higher TFP growth, respec-tively, compared with Scenario 1). Projections for Thailand, which has a more diversified agricultural production and export sector, indicate virtually no difference among Scenarios 1, 3, and 4. Projections for Vietnam, on the other hand, indicate that the highest TFP growth results from Scenario 4 (almost 60 percent higher TFP growth compared with Scenario 1). Finally, for the Philippines, the best results stem from Scenarios 3 and 4.
IMPACT OF INCREASED R&D INVESTMENT ON FUTURE AGRICULTURAL PRODUCTION, CONSUMPTION, AND TRADE
Future agricultural TFP growth is not the only factor underlying R&D investment decisions. Other factors relate to changing consumption patterns and to trade in agricultural products. For example, countries con-cerned about their dependence on food imports may want to stimulate domestic production of staple crops, whereas other countries may focus on developing export markets for certain agricultural commodities in order to drive economic growth. Different R&D investment priorities could also stem from policy goals, such as reducing rural poverty or facilitating access to cheaper food, and so on. The R&D allocation decisions that countries make today have important implications for the production of various agricultural commodities and for future trade flows across countries.
Projected levels of domestic consumption of agri-cultural commodities in 2050 were compared with projected levels of output resulting exclusively from growth in TFP under two different scenarios of R&D investment (the Business-as-usual scenario and the Closing-the-gap scenario). It is important to note that in this case the purpose is to highlight the impact of dif-ferent rates of R&D investment on output growth, so all other factors affecting output (such as expanded land
area or fertilizer use), as well as productivity growth from sources other than R&D investment (for example, more efficient use of inputs) are assumed to remain unchanged. As such, the projections of net exports should not be interpreted as forecasts, but only as indicators of how TFP growth can change the patterns of trade in food commodities and affect food security.
Projected changes in total consumption depend on population growth and shifts in per capita con-sumption, which in turn depends on income changes. Regionwide, projections indicate increased consump-tion during 2017–2050 of 24 percent for staple crops, 33 percent for oil crops, 85 percent for fruit and vege-tables, and 50 percent livestock products (IFPRI 2019). These shifts in consumption patterns and TFP growth have varied effects on the different commodity groups over time (Table 13). Focusing on cereals, under both R&D investment scenarios, five Southeast Asian coun-tries are projected to be food self-sufficient by 2050.
Myanmar and Thailand appear to have the strongest comparative advantage for cereals, measured as the ratio of net exports to total output. In 2016, Thailand’s cereal exports represented 13 percent of the country’s total cereal output, and this

56 | AGRICULTURAL RESEARCH IN SOUTHEAST ASIA
share is projected to reach 45 percent by 2050 under a Business-as-usual scenario. In Myanmar, export levels are projected to increase from just 2 percent of the country’s cereal output in 2016 to nearly 60 percent in 2050, regardless of the investment scenario chosen. Cambodia and Vietnam are also projected to be net exporters of cereals in 2050, whereas Laos is projected to remain self-sufficient and only become a net cereal exporter under the Closing-the-gap scenario. Indonesia is projected to continue to struggle to achieve self-sufficiency in rice production and would require significantly higher levels of R&D investment (beyond those modeled under the Closing-the-gap scenario) to trigger faster productivity growth and reach self-sufficiency in 2050. The Indonesian government’s plans to expand rice area could represent a viable means of reducing import dependence. Cereal production in the Philippines is similar to the situation in Indonesia. In 2016, the Philippines imported 24 percent of its total cereal output. Under the Business-as-usual scenario, Philippine imports are projected to rise to 33 percent
of output in 2050. Accelerated TFP growth is needed for the Philippines to attain self-sufficiency in cereals. With its current land allocation and specialization in the production of plantation crops, Malaysia is projected to remain a major food-importing nation, especially for cereals, under both investment scenarios. Note that, for Cambodia and Laos, net exports under the Closing-the-gap scenario are smaller than those projected under the Business-as-usual scenario. This can be explained by a growing demand for feed due to fast growth of the livestock sector under the Closing-the-gap scenario. With more staples being used to feed livestock, exportable surpluses are projected to decrease.
In the case of oil crops, human consumption only represents a fraction of most countries’ output based on other uses, including biofuel. By 2050, Malaysia and Indonesia are projected to remain the largest producers and world exporters of palm oil, with Malaysia exporting the equivalent of 80 percent of its total output, and Indonesia exporting 60 percent of its

FUTURE PRODUCTIVITY GROWTH THROUGH INCREASED AGRICULTURAL RESEARCH INVESTMENT | 57
Table 13—Consumption and net exports of agricultural commodities as a share of output, 2016, and projected shifts by 2050 under the Business-as-usual and Closing-the-gap R&D investment scenarios
Commodity group/country
Consumption/output (%) Net exports/output (%)
Actual, 2016
Business-as usual scenario
Closing-the- gap scenario
Actual,2016
Business-as usual scenario
Closing-the-gap scenario
Cereals
Cambodia 38 20 11 1 24 34
Indonesia 71 99 65 –21 –49 –8
Laos 36 46 29 5 3 22
Malaysia 261 362 355 –301 –289 –290
Myanmar 35 10 2 2 57 56
Philippines 81 91 64 –24 –33 10
Thailand 33 23 23 13 45 41
Vietnam 46 38 32 9 25 22
Oil crops
Cambodia 25 17 10 17 52 41
Indonesia 3 3 3 62 60 64
Laos 17 27 19 –3 –47 –13
Malaysia 0.3 0.5 0.5 82 84 81
Myanmar 9 4 1 –28 37 4
Philippines 3 4 3 1 71 2
Thailand 14 14 14 –3 6 –3
Vietnam 18 9 5 –132 5 –66
Fruit and vegetables
Cambodia 95 79 44 –5 17 47
Indonesia 88 200 142 1 –112 –53
Laos 68 133 83 0 –91 –22
Malaysia 126 198 193 –51 –132 –128
Myanmar 92 61 13 0 37 79
Philippines 75 94 60 13 -5 30
Thailand 80 76 76 24 29 27
Vietnam 66 70 57 13 9 23
Livestock
Cambodia 30 24 14 1 21 55
Indonesia 16 44 28 –8 –145 –63
Laos 48 124 71 –12 –174 –59
Malaysia 37 61 59 –28 –92 –90
Myanmar 16 12 3 5 37 76
Philippines 39 58 42 –21 –12 –4
Thailand 28 36 36 8 –13 –13
Vietnam 15 7 5 –1 49 64
Sources: Constructed by authors based on IFPRI (2019) and FAO (2020).Notes: Data on consumption projections are from IFPRI (2019) from a scenario following historical trends. Data on output projections are based on pro-jected TFP growth through R&D investment; and data on net exports are derived from consumption and production data; and information on commodity balances are from FAO (2020). See Appendices C and D for further detail.

58 | AGRICULTURAL RESEARCH IN SOUTHEAST ASIA
total output under both scenarios. Cambodia, which in 2016 was exporting the equivalent of 17 percent of its output, is also projected to become an exporter of oil crops at levels of 40–50 percent of its output, depend-ing on which investment scenario is pursued. As in the case of cereals, faster agricultural growth under the Closing-the-gap scenario is projected to result in greater domestic demand for palm oil for nonhuman consumption. Vietnam, for example, could shift from self-sufficiency in oil crops under the Business-as-usual scenario, to importing the equivalent of 66 percent of its total output under the Closing-the-gap-scenario. For the same reasons, Myanmar and the Philippines could both become net exporters of oil crops in 2050 under the Business-as-usual scenario (37 and 71 per-cent of their output, respectively), or be self-sufficient under the Closing-the-gap scenario. Laos is projected to be a net importer of palm oil in 2050 under both scenarios.
Thailand, the Philippines, and Vietnam were Southeast Asia’s only exporters of fruit and vegeta-bles in 2016, with net exports equivalent to 24 percent of total output in Thailand and 13 percent of output in the Philippines and Vietnam. Malaysia imported 51 percent of total output of fruit and vegetables, whereas the other countries were self-sufficient. By 2050, Indonesia, Laos, and Malaysia are projected to become major importers of fruit and vegetables under both investment scenarios. Thailand remains an exporter of fruit and vegetables under both scenarios, whereas Myanmar’s exports of fruit and vegetables are projected to reach 37 percent of domestic output under the Business-as-usual scenario, and 79 percent under the Closing-the-gap scenario. The Philippines and Vietnam are projected to produce fruit and vege-tables at close to self-sufficiency levels by 2050 under the Business-as-usual scenario (with exports totaling –5 and 9 percent of domestic production, respec-tively); under the Closing-the-gap scenario, exports are projected to expand to 30 percent of output in the Philippines and 23 percent of output in Vietnam.
Cambodia could become a net exporter of fruit and vegetables under both scenarios, but under the Closing-the-gap scenario, exports could reach almost 50 percent of total production, compared with just 17 percent under the Business-as-usual scenario.
In 2016, the region's trade in livestock products was relatively low compared with output levels. The largest importers were Malaysia and the Philippines (28 and 21 percent of domestic livestock output, respectively) followed by Laos (12 percent of output). All other countries recorded levels close to self-sufficiency. Projected shares to 2050 indicate that Vietnam and Myanmar have the potential of becoming net exporters of poultry and pork, exporting more than 40 percent of domestic production under both scenarios. Cambodia could also become a net exporter of livestock with shares reaching 21 percent of total livestock production under the Business-as-usual scenario, and 55 percent under the Closing-the-gap scenario. Malaysia, Indonesia, and Laos are projected to remain net importers of livestock, with Malaysia importing about the same quantity as it would produce, while Laos and Indonesia importing more than 100 percent of their livestock output under the Business-as-usual scenario. With higher productivity growth under the Closing-the-gap scenario, imports could still represent about 60 percent of domestic output by 2050 in both Laos and Indonesia. The Philippines is projected to reduce its imports of livestock from 21 percent of output to 12 or 4 percent depending on TFP growth. It is important to note that these results only take productivity increases into account (Table 12), but countries would also have the option of expanding their animal stocks. For net livestock exporters, higher productivity would likely result in increased stocks and contribute to their comparative advantage in the production of poultry and pig meat. Importers could also increase stocks to reduce imports, but this could also affect trade in cereals because higher stocks would lead to increased demand for feed.

8| CONCLUSION AND POLICY RECOMMENDATIONS
More ambitious policy measures are needed to
• tackle Southeast Asia’s underinvestment in agricultural research,
• ensure that the research conducted targets well-defined areas of priority,
• ensure that research institutions stay adequately staffed into the future, and
• strengthen research linkages both in-country and at the subregional level.

DESPITE THE DIMINISHING contribution of agriculture to GDP and employment in Southeast Asia over the past three decades, the sector will continue to play a crucial role in driving economic growth, as long-term economywide poverty reduction and food security depend on rising agricultural productivity and the integration of labor and capital markets in rural and urban areas. Agricultural research invest-ment is positively associated with high returns, but these returns take time—often decades—to accrue. Consequently, the inherent lag from the inception of research to the adoption of new technologies calls for sustained and stable agricultural research funding. ASTI evidence demonstrates that Southeast Asia’s agricultural research spending has been relatively stagnant in recent years (in inflation-adjusted terms), while agricultural output has increased steadily over time. As a result, regional agricultural research intensity—that is agricultural research spending as a percentage of agricultural output—fell from 0.50 per-cent of AgGDP in 2000 to just 0.33 percent in 2017. Nonetheless, agriculture in Southeast Asia continues to be challenged by production inefficiencies, natural resource depletion, climate change, and environmen-tal degradation, emphasizing the need for consider-ably higher levels of sustained agricultural research investment in the coming decades.
Although the extent of underinvestment in agricultural research differs across countries, all Southeast Asian countries invest below what are deemed to be attainable and effective levels. Continued underinvestment will constrain long-term agricultural productivity growth and the capacity of countries to develop value chains, achieve self-sufficiency in a broader range of commodities, reduce poverty, and ensure food security. To address agricultural production challenges more effectively, all countries need to substantially raise their agricultural research investment levels in the coming years.
National governments remain by far the most important source of funding for agricultural research in the region. Although the private sector plays an
important role in conducting in-house research on plantation and industrial crops, horticulture, and agricultural inputs in some of Southeast Asia’s larger economies, it is still a relatively untapped source of funding for publicly performed agricultural research in most countries. To provide much-needed higher and sustainable levels of funding into the future, governments should explore innovative mechanisms that tap into private funds for a broader range of com-modities (such as Malaysia’s levies on oil palm and rubber production). In a region where most countries produce or export plantation and high-value crops, this could be viable complement to government (and donor) funding.
Funding for agricultural research not only needs to increase, but also be targeted more directly to areas of priority. In the next 20–30 years, the econ-omies of Southeast Asia will continue to grow, dis-posable incomes will rise, and consumption patterns will change. These transformations will prompt shifts in the demand for agricultural products, in turn affecting local production levels and trade in terms of imports and exports. Given the long time lag between investing in research and reaping its bene-fits, the decisions countries make about the alloca-tion of their agricultural research resources will have profound implications on agricultural productivity for decades. Countries therefore need to anticipate and plan for these production and consumption shifts, and to design responsive research agendas well in advance. ASTI’s forward-looking projections can sup-port countries in assessing the risks and potentials of different research investment scenarios, and in establishing long-term research priorities and invest-ment allocations that align with national development and innovation plans. The projections reveal that pri-oritizing investment in staple crops is still the most prudent option in Laos, while Indonesia, Malaysia, the Philippines, and Vietnam have the potential to achieve faster agricultural productivity growth into the future by prioritizing investment in research related to fruit, vegetables, livestock, and aquaculture. In Cambodia,
60 | AGRICULTURAL RESEARCH IN SOUTHEAST ASIA

Myanmar, and Thailand, differences between the impacts of prioritizing research on staple crops or high-value commodities were less pronounced, but projections indicated that investments in oil crop research would trigger significantly lower productivity growth. Cambodia, Myanmar, and Vietnam are all pro-jected to become net rice exporters by 2050, opening the door for increased diversification into high-value commodities.
In addition to higher levels of sustainable funding for agricultural research, a more efficient allocation of this funding across salaries, operating costs, and cap-ital investments could also improve the overall perfor-mance of agricultural research systems. ASTI’s analysis reveals that high fixed capital costs per researcher and low salary spending are associated with lower overall researcher productivity across Southeast Asia (in terms of output per researcher). Human capital—both in terms of the quantity and quality of researchers—is another key factor in explaining
cross-country differences in the performance of agricultural research systems. Notwithstanding wide-spread improvements in researcher numbers, qualifi-cation levels, and female participation in the past two decades, the performance and innovative capacity of many of Southeast Asia’s agricultural research systems remains inadequate. The least developed agricultural research systems (Cambodia, Laos, and Myanmar) are characterized by low scientific output and researcher productivity, which are the direct consequence of insufficient funding levels and inade-quately qualified researchers. Even though the more developed Malaysian and Thai systems rank more highly on these metrics, they also remain challenged by important system inefficiencies and resource con-straints. Indonesia, the Philippines, and Thailand will lose a sizable share of their PhD-qualified research capacity in the coming years due to retirement, whereas the research systems of Cambodia, Laos, and Myanmar (and to a lesser extent Vietnam) are
CONCLUSION AND POLICY RECOMMENDATIONS | 61

62 | AGRICULTURAL RESEARCH IN SOUTHEAST ASIA
mostly staffed by junior, comparatively inexperienced researchers, which limits the potential for the effective conduct of research. In light of these diverse human resource challenges, it is critical that all of the region’s countries develop adequate strategies for staff suc-cession and training. They need to closely monitor anticipated specialization and skills gaps, and provide a timely and accurate response as training needs arise. It is also essential that agricultural curriculums at universities be strengthened to ensure a greater responsiveness to the needs of a modern, market- oriented agricultural sector. Governments will also need to ensure competitive salary levels and solid incentive schemes to retain and motivate their research staff. Failing all these measures, significant knowledge are likely to emerge, raising concerns about the quality and quantity of research outputs and the overall effec-tiveness of the regions’ agricultural research systems.
Finally, the institutional framework of agricultural research (and innovation) agencies must be conducive to the pursuit of national development and agricul-tural sector priorities. Governments have an import-ant role to play in ensuring that national agricultural research agendas are cohesive, and in providing the necessary policy environment to stimulate coopera-tion among R&D agencies and reduce duplication of research effort in order to maximize synergies and efficiencies in the use of the limited resources. Further integration of agricultural research at the regional level will be indispensable so that countries with lim-ited domestic research capacity can benefit from the gains achieved in countries with more developed sys-tems. Continued support to and growth of regional bodies, networks, and mechanisms will further aid in defining, implementing, and funding a research agenda that targets issues of regional interest.

| 63
APPENDIX A—ASTI'S INDICATOR OF ATTAINABLE RESEARCH INTENSITYThe data envelopment analysis (DEA) approach is used to obtain the ASTI intensity index (AII) and to calculate feasible levels of investment and investment gaps for individual countries. The AII calculates a country’s R&D investment intensity relative to four main structural factors: (1) the size of the agricultural sector (proxied by AgGDP), (2) the size of the economy (proxied by GDP), (3) income level (proxied by GDP per capita), and (4) potential spill-ins (proxied for country i as the sum of R&D investment of all other countries weighted by a measure of the similarity of country i ’s output composition with the output composition of each other country). These four variables are proxies for structural variables that constrain policymakers’ R&D decisions. For exam-ple, R&D investment by a low-income country with a small economy would likely be proportionally lower than investment by a high-income country with a large economy because the small country has a smaller innovation market and is constrained by the supply of researchers based on a less-developed education system, the quality of research institutions, available funding, and several other factors.
In generic form, this measure can be represented as:
AIIi = f [ ( R&Di /GDPi ) , ( R&Di /AgGDPi ) , ( R&Di /yi ) , (R&Di / SPi ) ] , [A1]
where AIIi is the AII of country i, R&D is expenditure on agricultural R&D, y is income per capita, SP is a measure of potential spill-ins, and f[] is a function aggregating the four measures of intensity into a single index indi-cating the R&D investment intensity of country i. The DEA method looks for endogenous weights to aggregate the individual indexes into the overall AII. This approach has been extended more recently to build indexes that comply with the characteristics required by index theory. The approach used by Whittaker et al. (2015) is adapted here to build a multi-factored measure of R&D intensity.
The main concepts underlying the calculation of the index are depicted in Figure A1. The axes in the figure represent values of R&D investment relative to two variables, income (GDP per capita) and AgGDP. The use of two inputs in the figure is for illustrative purposes only. Each point in the figure represents a country with coordinates AgGDP/R&D and income/R&D, in the vertical and horizontal axes, respectively. Note that these coordinates represent the inverse of partial intensity ratios, with the measure in the vertical axis being the inverse of the traditional intensity ratio used to measure agricultural R&D investment intensity. The farther a country is from the point of origin, the lower its R&D intensity.
R&D investment intensity is determined by comparing country D with point D* because both D and D* have the same proportion of AgGDP and income (that is, they are in the same ray through the origin). In this case, D* shows much higher values of R&D/AgGDP and R&D/income than D, which means that the R&D intensity of point D* is higher than that of D. Countries A, B, and C in Figure A1 are the countries with highest R&D intensity because no other countries are closer to the point of origin along the respective rays (rays OA, OB, and OC in Figure A1, respectively).
Investments by countries A, B, and C outline the “intensity frontier.” This frontier defines the space of invest-ment intensity for the sample countries, with the highest intensity defined by points A, B, and C, and by all linear combinations of these three points (the lines connecting A, B, and C). Countries with less intensive investment are in the space above and to the right of the frontier. So, for example, the intensity measure for country D can

64 | APPENDIX A—ASTI’s INTENSITY INDEX
be calculated as AIID = OD*/OD, which is the distance of country D from the frontier. This distance is a measure of the difference of investment intensity between D and the maximum potential investment (investment at the frontier). By definition, countries at the frontier have intensity index values equal to 1 because the distance of each of these countries from the frontier is AIIA = OA/OA = AIIB = OB/OB = AIIC = OC/OC = 1. Countries in the intensity space above the frontier will show AII values between 0 and 1. Comparing frontier countries with country D (in Figure 2) establishes the intensity indexes AIIA = AIIB = AIIC = 1 ≥ AIID ≥ 0. The closer the AII is to 1, the higher the investment intensity of that country—that is, the higher the country’s R&D investment relative to the value of its AgGDP and income level.
The discussion of the intuition of the methodology used here shows that the DEA approach allows us to determine the maximum potential intensity that a country can reach (given observed intensities for all countries). As a corollary, this allows us to obtain the actual gap in investment intensity for that country, which can be measured as the difference between maximum potential intensity and the actual intensity. This method also allows us to express the potential intensity for each country in terms of any of the partial intensity ratios that constitute the AII. For example, as discussed above, the coordinates of the efficient point D* are (AgGDP/R&D)D* = (AgGDP/R&D)D×(OD*/OD) and (income/R&D)D* = (income/R&D)D × (OD*/OD). From these expressions, we obtain the potential intensity ratio for country D as IRPD = 1/[(AgGDP/R&D)D × (OD*/OD)], as one of the coordinates of the reference point for D at the intensity frontier.
Figure A1—R&D intensity index using two partial measures
A
B
D
E
C
Y=AgGDP/R&D
X=Income/R&D
D*
E*
YA
YD
YE
YC
YB
xA xD xB xCxE
O
Notes: The intensity ratios are expressed as the inverse of R&D spending / AgGDP and R&D / income, where A, B, and C determine the “frontier,” showing the value of AgGDP and income per unit of R&D invested. AgGDP = agricultural gross domestic product; R&D = research and development.
| 65
APPENDIX B—FRAMEWORK FOR ASSESSING THE PERFORMANCE OF AGRICULTURAL RESEARCH SYSTEMSThe framework that ASTI chose to analyze the performance of the region’s agricultural research systems is based on the hierarchical interrelationships among a number of indicators (See Figure 16). Definitions of the individual indicators and how they contribute to the assessment of a system’s overall performance are provided below.
OVERALL PERFORMANCE: COST PER QUALITY-ADJUSTED PUBLISHED ARTICLE
The first step is to define an indicator to summarize, in a single value, the performance of the research system, taking data constraints (in terms of availability, disaggregation, and coverage) into account. A relevant eco-nomic indicator to evaluate the performance is cost per unit of output, which links outputs to inputs. Its value depends on productivity, the quantity and quality of inputs, and the cost of applying those inputs. Based on the limited availability of comparable cross-country agricultural research output data, ASTI determined that the number of quality-adjusted publications in agricultural and biological science was the most dependable indicator for comparing agricultural research outputs and processes across countries.8, 9 Data on the num-ber of publications and their “h-index”—an indicator of quantity and quality of publications—were taken from SCImago (2020) to build a quality-adjusted measure of research output, that is, the quality-adjusted number of scientific articles published in the areas of agriculture and biology.10, 11 Agricultural research expenditure data from ASTI (various years) are used to measure the cost of the research system. These two measures are then combined to calculate the cost of research per unit of output for each country in Southeast Asia as follows:
Co = R&D/AH = (research spending) / (number of scientific publications adjusted by the h-index). [B1]
8 The quantity and quality of publications is intended to be correlated with technologies, products, and processes resulting from research. This indicator could nevertheless be biased in favor of some countries, such as those with larger and more developed research systems or systems with a proportionately larger numbers of researchers in the higher education sector. No information was available to allow the scope and direc-tion of possible biases to be determined.
9 A major constraint to building this indicator was specifying research outputs. Da Silva e Souza et al. (2007) classify research outputs under four categories (1) scientific production; (2) production of technical publications; (3) development of technologies, products, and processes; and (4) technology diffusion. ASTI data only capture research activities, so publications targeting agricultural businesses and producers (Category 2) and efforts to make research products known to the public (Category 4) are not included. Available data for the remaining two categories (1 and 3), raise questions about the viability of cross-country comparisons. Given their consistency across countries, bibliographies of scientific publications are the most reliable source of comparable data on research outputs. Such data provide information on the quantity and quality of scientific publications in agricultural and biological sciences and include book chapters, articles in refereed journals, and abstracts and articles in proceedings of technical meetings from SCImago (2020).
10 The h-index is an author-level metric that measures both the productivity and citation impact of the publications of a scientist. The index can also be applied to the impact of a journal, a research institute or university, or an entire country.
11 In order to facilitate viable cross-country comparisons, the number of articles published per country was converted to the number of articles of similar quality published per country. Hence, research output is the number of articles published by a country’s scientists in the areas of agronomy and biology, adjusted by the h-index, as follows: AHi = Ai×(Hi/Hmax), where AHi is the number of articles, adjusted for quality, per country; Ai is the actual number of articles published; Hi is the h-index of I; and Hmax is the highest h-index among all the countries in the region.

66 | APPENDIX B—FRAMEWORK FOR ASSESSING THE PERFORMANCE OF AGRICULTURAL RESEARCH SYSTEMS
This indicator of the overall performance of an agricultural research system is then disaggregated into different sub-indexes to facilitate analysis of the various areas of performance and explain the differences in costs per unit of output across countries (see Figure 16).
COST PER RESEARCHER AND PRODUCTIVITY OF RESEARCHERS
The cost per unit of research output (Co) can be disaggregated as the cost per FTE researcher (Cfte) and the output per researcher (Ofte). The cost per researcher is defined as the ratio of total expenses on salaries, operating costs, and capital investment by a given country’s agricultural R&D agencies and the total number of researchers in the country’s agricultural research system (measured in FTEs):
Cfte = R&D/FTEs. [B2]
Researchers’ productivity is measured as the ratio of quality-adjusted scientific publications (AH) to the number of FTE researchers: Ofte = AH/FTEs. [B3]
Hence, Cfte / Ofte = (R&D / FTE) × (FTE / AH) = R&D / AH indicates that the cost per unit of output is equivalent to the ratio of the total cost of research and the productivity of researchers. These two indicators are inter- dependent because they are simultaneously affected by numerous factors, primarily the system’s cost structure (that is, the way resources are allocated), and the quality of human resources based on the composition of researchers by their qualification level (that is, whether their highest qualification is a BSc, MSc, or PhD degree).
COST STRUCTURE AND HUMAN RESOURCES
Cost per researcher and productivity per researcher depend on a combination of the composition of research staff (in terms of qualification levels) and the composition of research spending (in terms of allocations to salaries, operating costs, and capital investments). High costs per researcher could result, for example, from high fixed costs of underutilized equipment and infrastructure (that is, a small number of researchers for the available infrastructure). It could also be the result of high salary costs. A research system that is mostly staffed by PhD-qualified scientists, for example, is likely to produce higher and more qualitative research outputs than a system that is mostly staffed by scientists with only BSc degrees. However, the salary cost for PhD-qualified researchers tends to be much higher than for BSc-qualified researchers, thereby increasing the overall research cost of such a system. A real trade-off therefore exists between keeping the cost per researcher low, on the one hand, and raising researcher productivity, on the other. The more productive researchers are, the smaller the cost per unit of output, but the higher the cost per researcher, the higher the cost per unit of output. The goal is to find an allocation of resources that optimizes cost and productivity. The relative composition of the various components of research costs (that is, salaries, operating costs, and capital investments) can also have an important impact on productivity. Insufficient funding to carry out research programs and keep researchers meaningfully engaged will negatively affect productivity, for example. The framework underlying this metric incorporates two indicators of cost structure in order to analyze a country’s particular input mix:
• Share of capital costs in total research costs
• Average salary costs per researcher

APPENDIX B—FRAMEWORK FOR ASSESSING THE PERFORMANCE OF AGRICULTURAL RESEARCH SYSTEMS | 67
In addition, two indicators are used to quantify the quality of human resources:
• PhD- and MSc-qualified researchers as shares of the total number of FTE researchers
• The ratio of PhD-qualified to MSc-qualified researchers
RESEARCH INVESTMENT INTENSITY AND FUNDING
The cost structure and human resource composition of an agricultural research system are in part determined by how much a country invests in agricultural research overall (that is, the research investment intensity), which in turn depends directly on available sources of funding and on political decisions and priorities. Limited availability of funding and/or extreme fluctuations in year-to-year funding constrain investment, which in turn can have neg-ative implications for the (future) quality of human resources or access to the capital that is required to carry out research effectively. A country's commitment to investing in agricultural R&D is expressed through measures that quantify the investment gap and the annual growth of investment during the decade preceding 2017:
• Investment gap = Actual R&D investment / Attainable investment (see Figure 12)
• Yearly growth rate of R&D investment 2008–2017
Constraints and commitment to funding agricultural research are quantified through three indicators:
• (Government funding + Commodity levies + Internally generated resources through the sale of goods and services) / Total agricultural research funding
• Donor funding / (Government funding + Commodity levies + Internally generated resources through the sale of goods and services)
• Funding volatility = Standard deviation of yearly growth rate of research investment during the 2013–2017 period
The first indicator is a measure of the financial autonomy of the system and its capacity to access funding. The second indicator is generally associated with the dependency of a research system on external funding (mostly in poorer countries). Volatility of investment is associated with funding constraints and the impossibility of the system to assure sustainable funding to plan and develop high-quality research in the medium and long run (Stads and Beintema 2015).
ENVIRONMENTAL AND STRUCTURAL CHARACTERISTICS
Finally, environmental or exogenous factors affect the efficiency of the research process (Figure B1). The figure compares global values of agricultural research spending (horizontal axis) and scientific articles adjusted by the h-index (AH, vertical axis) at the country level, highlighting the position of Southeast Asian countries compared with the rest of the world. It is clear that the level of R&D investment is an important determinant of the quantity and quality of research output. Up to a certain point, countries can increase their overall research output by increasing investment, but this increase is capped based on structural characteristics, such as a country’s
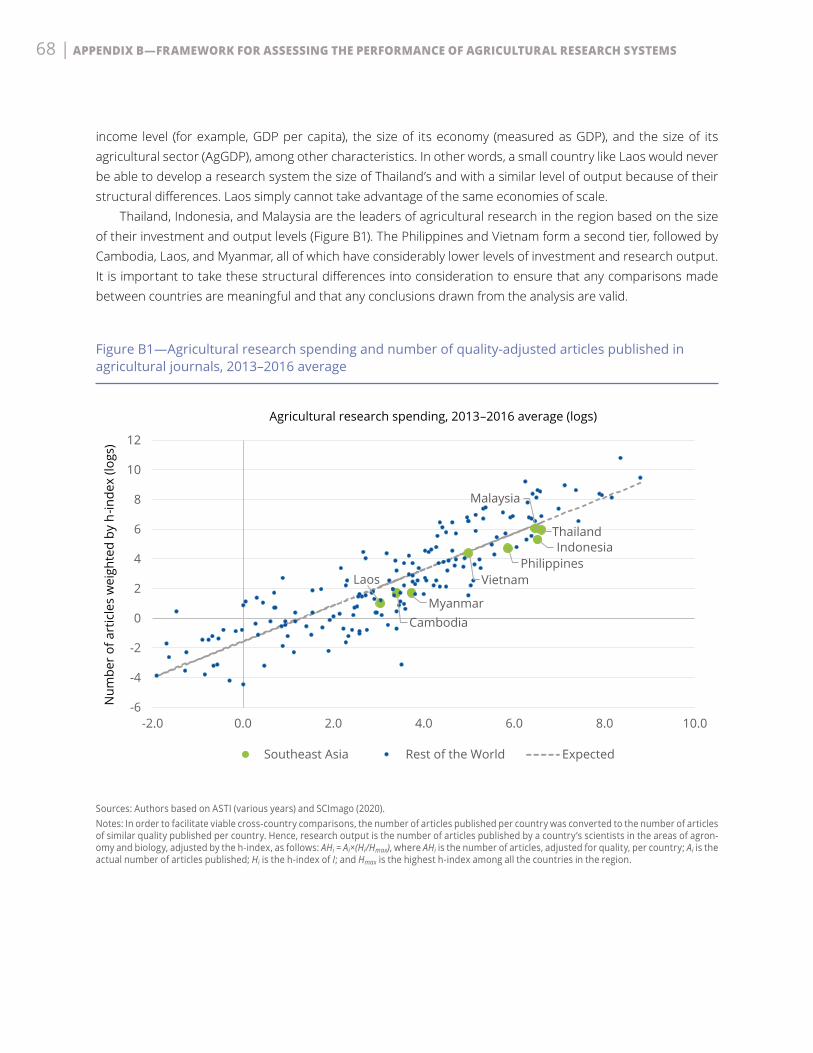
68 | APPENDIX B—FRAMEWORK FOR ASSESSING THE PERFORMANCE OF AGRICULTURAL RESEARCH SYSTEMS
income level (for example, GDP per capita), the size of its economy (measured as GDP), and the size of its agricultural sector (AgGDP), among other characteristics. In other words, a small country like Laos would never be able to develop a research system the size of Thailand’s and with a similar level of output because of their structural differences. Laos simply cannot take advantage of the same economies of scale.
Thailand, Indonesia, and Malaysia are the leaders of agricultural research in the region based on the size of their investment and output levels (Figure B1). The Philippines and Vietnam form a second tier, followed by Cambodia, Laos, and Myanmar, all of which have considerably lower levels of investment and research output. It is important to take these structural differences into consideration to ensure that any comparisons made between countries are meaningful and that any conclusions drawn from the analysis are valid.
Figure B1—Agricultural research spending and number of quality-adjusted articles published in agricultural journals, 2013–2016 average
Laos
CambodiaMyanmar
Vietnam
Malaysia
IndonesiaThailand
Philippines
-6
-4
-2
0
2
4
6
8
10
12
-2.0 0.0 2.0 4.0 6.0 8.0 10.0
Num
ber
of a
rtic
les
wei
ghte
d by
h-in
dex
(logs
)
Agricultural research spending, 2013–2016 average (logs)
Southeast Asia Rest of the World Expected
Sources: Authors based on ASTI (various years) and SCImago (2020).Notes: In order to facilitate viable cross-country comparisons, the number of articles published per country was converted to the number of articles of similar quality published per country. Hence, research output is the number of articles published by a country’s scientists in the areas of agron-omy and biology, adjusted by the h-index, as follows: AHi = Ai×(Hi/Hmax), where AHi is the number of articles, adjusted for quality, per country; Ai is the actual number of articles published; Hi is the h-index of I; and Hmax is the highest h-index among all the countries in the region.

| 69
APPENDIX C—R&D INVESTMENT AND KNOWLEDGE STOCKSStudies have shown that R&D investments create a stock of knowledge over time that yields returns into the future (Esposti and Pierani 2003, Griliches 1995, Alston and Pardey 1998). To model this process, we first need to determine how fast R&D investment enters and exits the stock of knowledge, as well as how quickly the stock depreciates. We follow the work by Esposti and Pierani (2003), which focuses on agriculture, and adopt the perpetual inventory method (PIM) to build the stock of R&D knowledge analogous with physical capital. The model requires little information: an initial value of the stock; the series of gross R&D investment; and three key parameters—a depreciation or decay rate of the stock (δ), a stochastic gestation lag period (G), and a parameter (β) that defines the shape of the gestation period. Using ASTI’s data on R&D investment and data on estimated TFP changes from the Food and Agriculture Organization of the United Nations (FAO), we apply a partial least squares (PLS) approach, which is particularly suited to the problem at hand, to recover the full set of basic parameters in PIM, and thereafter the lag structure linking R&D expenditure to the accumulation of the knowledge stock and its impact on productivity. The knowledge stocks and TFP projections are obtained through the following steps:
1. We used PLS to determine the parameters that define the stock of knowledge in the PIM model (Table C1).
Table C1—Estimated parameters of the PIM knowledge stock model for advanced and less-advanced research systems
Type of research system Depreciation(δ) Gestation period (G) β
Advanced 0.116 17 0.63
Less-advanced 0.145 14 0.57
Source: Constructed by authors based on PLS regression. Note: Countries with advanced research systems include Indonesia, Malaysia, the Philippines, and Thailand; countries with less-advanced research systems include Cambodia, Laos, Myanmar, and Vietnam.
2. With these parameters, we calculate the stock of knowledge for each country, assuming, without loss of generality, that the R&D expenditure does not contribute to the knowledge stock during the gesta-tion period. The knowledge stock (KS) in period t can therefore be represented as follows:
KSt = KSt-1 (1-δ ) + Rt-G , [C1]
where t is the current period, δ is the depreciation rate, and G is the gestation period. In other words, the knowledge stock in period t is equal to the knowledge stock in the previous period (t–1), less the depreciation of the stock (1–δ), plus the R&D investment from period t-G (Rt–G ) . Hence, the investment matures during period (G) until it contributes new knowledge to the knowledge stock. If G=0, then investment in t is immediately incorporated into the knowledge stock with no gestation period. The larger the value of G, the longer it takes

70 | APPENDIX C—R&D INVESTMENT AND KNOWLEDGE STOCKS
for the investment to contribute to knowledge.12 By backward substitution, Equation [C1] can be expressed as an infinite weighted sum of past investments:
KSt = Rt-G + (1-δ) Rt-(G+1) + (1-δ)2 Rt-(G+2) + ⋯ + (1-δ)s-G Rt-s + , [C2]
where the weights are a function of the depreciation rate and of the age of the investment. Equivalently:
KSt = ω0Rt + ω1 Rt-1 + ω2Rt-2 + ⋯ + ωsRt-s + ⋯ , [C3]
where ωs = (1–δ)s–G is a weight in the range of (0,1) and s is the investment’s age. In Equations [C2] and [C3], the weight ωs=1 if s=G, ωs=0 if s<G, and 0<ωs<1 if s>G. The ωs in [C3] can be interpreted as the contribution (that is, productivity) of the different “vintages” of R&D investment to the knowledge stock. They can also be viewed as the weights used to aggregate different vintages into one technology stock. On this basis, KSt is a measure of the aggregate stock of knowledge at time t (Figure C1).
Figure C1—Evolution of knowledge stocks, 1981–2017, and projections under the Business-as-usual scenario to 2050
0
20
40
60
80
100
120
140
160
1981 1991 2001 2011 2021 2031 2041 2051
IndexIndonesia in 2017=100
Indonesia Malaysia ThailandPhilippines Vietnam Cambodia, Laos & Myanmar
Sources: Authors’ calculations based on ASTI (various years), FAO (2020), and USDA-ERS (2019).
12 Note that this is a simplification to illustrate the methodology, indicating that it is necessary to wait G years for this investment to be incorporated to the knowledge stock. The model incorporates an increasing share of the investment during the gestation period, deter-mined by the parameter β.

| 71
13 The TFP data used in the analysis was obtained from USDA-ERS (2019).
APPENDIX D—TOTAL FACTOR PRODUCTIVITY PROJECTIONSTo link the stock of knowledge with production we use the neoclassical production function as in Griliches (1995), where output (Y) is a function of inputs (X) and the stock of technology (SK):
[D1]
For simplicity, we assume that the production function in Equation [D1] is represented by the Cobb-Douglas function, with constant returns to scale on conventional inputs, and where α and γ are parameters:
[D2]
From Equation [D2] we define TFP as follows:13
[D3]
As a result, TFP growth is a function of changes in the knowledge stock:
[D4]
Equation [D4] represents the relationship between the benefits and costs of R&D investment, where the ben-efits are given by growth in TFP, and the costs result from R&D expenditures in prior periods that contribute to a change in total stock of knowledge in the year of analysis. The change in SK (dSK/SK) represents a change in the capacity of a country to produce “new ideas,” whereas the impact of “new ideas” on productivity is given by the parameter γ.
For this study, stocks of knowledge by crop and livestock activity were calculated using data on research focus (ASTI various years) indicating the share of their time that researchers spend on specific research activi-ties. Given that there is no information on TFP at the crop level, TFP growth by crop was calculated as follows:
1. A regression of ln(TFP) against year was run for each country to determine yearly TFP growth (the coefficient of the year independent variable) for the period 1981–2016.
2. Yields were calculated for each crop (yc=output/harvested area) and livestock activity (ylvsk=output/animal stock) and, as with TFP, the ln(yield) was run against year to obtain the average yearly rate of yield growth for the period 1981–2016 by activity and country.
3. Using each activity’s share in total output (sm), we calculated the measure of total yield growth (GY ) as the sum of each individual yield weighted by its output share:
[D5]
4. We then used GY to calculate the contribution of each activity’s yield growth to the aggregated yield:
[D6]
where for each country.

72 | APPENDIX D—TOTAL FACTOR PRODUCTIVITY PROJECTIONS
5. Cm enables us to allocate TFP growth at the country level across activities:
[D7]
6. Using changes in TFP by crop (gTFPm) , as defined above, and changes in country’s i knowledge stock, we obtain an overall knowledge stock-TFP elasticity for each crop and country:
[D8]
Elasticity values used in the analysis are shown in Table D1.
Table D1—Elasticities determining changes in total factor productivity resulting from changes in stocks of domestic knowledge
Commodity Cambodia Indonesia Laos Malaysia Myanmar Philippines Thailand Vietnam
Rice 0.215 0.275 0.203 0.160 0.266 0.094 0.191 0.059
Maize 0.249 0.181 0.414 0.159 0.265 0.164 0.131 0.365
Sorghum – – – – 0.267 0.094 0.199 0.063
Cereals, other – – – – 0.265 0.094 0.132 –
Potatoes – 0.320 0.414 – 0.325 0.094 0.207 0.365
Roots and tubers, other
0.282 0.180 0.414 0.159 0.265 0.094 0.303 0.061
Beans 0.233 0.181 0.202 – 0.266 0.094 0.132 0.071
Pulses, other – 0.181 – – 0.325 0.094 – 0.365
Soybeans 0.254 0.180 0.201 0.159 0.265 0.094 0.131 0.073
Oil palm 0.241 0.180 – 0.160 – 0.155 0.065 –
Coco palm 0.275 0.180 – 0.290 0.264 0.094 0.132 0.365
Groundnuts 0.207 0.181 0.204 0.267 0.143 0.132 0.365
Oil crops, other 0.237 0.182 0.414 0.159 0.265 0.094 0.131 0.068
Bananas 0.243 0.320 0.202 0.159 0.266 0.164 0.132 0.365
Fruit, other 0.233 0.320 0.414 0.291 0.266 0.094 0.253 0.064
Vegetables 0.228 0.320 0.203 0.290 0.325 0.164 0.132 0.065
Nuts 0.282 0.182 – 0.201 0.325 0.094 – 0.064
Cotton 0.259 0.182 0.200 – 0.266 0.094 0.290 0.365
Other crops 0.282 0.320 0.414 0.290 0.325 0.164 0.225 0.077
Cattle 0.253 0.180 0.201 0.159 0.265 0.094 0.131 0.073
Dairy 0.256 0.181 0.201 0.159 0.265 0.094 0.131 0.365
Sheep and goats – 0.180 0.202 0.159 0.266 0.094 0.132 0.066
Poultry 0.247 0.181 0.202 0.159 0.325 0.094 0.132 0.065
Livestock, other 0.233 0.181 0.203 0.272 0.266 0.094 0.132 0.060
Fisheries 0.282 0.320 0.414 0.290 0.325 0.164 0.225 0.365
Sources: Authors’ calculations based on ASTI (various years) and FAO (2020). Note: Commodity elasticities were calculated based on historical yield growth of individual commodities, adjusted for each commodity’s contribu-tion to sector-wide agricultural TFP growth and long-term shifts in a country’s R&D investment allocation by commodity.
.
| 73
REFERENCESAlston, J., M. Andersen, J. James, and P. Pardey. 2009. Persistence Pays: U.S. Agricultural Productivity Growth and the
Benefits from Public R&D Spending. New York, Dordrecht, Heidelberg, and London: Springer.
Alston, J., B. Craig, and P. Pardey. 1998. Dynamics in the Creation and Depreciation of Knowledge and the Returns to Research. EPTD Discussion Paper No. 35. Washington, DC: International Food Policy Research Institute.
ASTI. Various years. ASTI database. www.asti.cgiar.org/data (accessed June, 2020).
Beintema, N., and G.-J. Stads. 2017. A Comprehensive Overview of Investments and Human Resource Capacity In African Agricultural Research. ASTI Synthesis Report. Washington, DC: International Food Policy Research Institute.
Booth, A. 2019. Living Standards in Southeast Asia: Changes over the Long Twentieth Century, 1900–2015. Amsterdam: Amsterdam University Press.
Da Silva e Souza, G., E. Gonçalves Gomes, M. Castilo Magalhães, and A. Dias. 2007. “Economic Efficiency of Embrapa’s Research Centers and the Influence of Contextual Variables. Pesquisa Operacional 27 (1): 15–26.
Dias Avila, A., and R. Evenson. 2010. “Total Factor Productivity Growth in Agriculture: The Role of Technological Capital.” In Handbook of Agricultural Economics, B. Gardner and G. Rausser, ed. Amsterdam: Elsevier.
Diaz-Bonilla, E., D. Orden, and A. Kwieciński. 2014. Enabling Environment for Agricultural Growth and Competitiveness. OECD Food, Agriculture and Fisheries Papers 67. Paris: Organisation for Economic Co-operation and Development.
Esposti, M., and F. Pierani. 2003. “Building the Knowledge stock: Lags, Depreciation, and Uncertainty in R&D Investment and Link with Productivity Growth.” Journal of Productivity Analysis 19 (1): 33–58.
FAO (Food and Agriculture Organization of the United Nations). 2020. FAOSTAT database. www.fao.org/faostat/en/#home (accessed June, 2020).
Fuglie, K., S. Wang, and V. Ball. 2012. Productivity Growth in Agriculture: An International Perspective. Wallingford, UK, and Cambridge, MA, USA: CAB International.
Griliches, Z. 1995. “R&D and Productivity: Econometric Results and Measurement Issues.” In Handbook of the Economics of Innovation and Technological Change, P. Stoneman, ed. Oxford, UK: Blackwell Publishers Ltd.
IFPRI (International Food Policy Research Institute). 2019. IMPACT Projections of Food Production, Consumption, and Hunger to 2050, With And Without Climate Change: Extended Country-Level Results for 2019. Washington, DC: International Food Policy Research Institute.
Nin Pratt, A. 2016. Comparing Apples to Apples: A New Indicator of Research and Development Investment Intensity in Agriculture. IFPRI Discussion Paper 1559. Washington, DC: International Food Policy Research Institute.

74 | REFERENCES
OECD (Organisation for Economic Co-operation and Development). 2017. Building Food Security and Managing Risk in Southeast Asia. Paris: OECD Publishing.
SCImago. 2020. SCImago Journal & Country Rank. https://www.scimagojr.com/SCImago (accessed June, 2020).
Sheng, Y. 2020. “Economic Development and Poverty Reduction in Southeast Asia.” In Development and Poverty Reduction: A Global Comparative Perspective, Y. Zheng and J. Qian, ed. London and New York: Routledge.
Stads, G.-J. 2015. Agricultural R&D in West Asia and North Africa: Recent Investment and Capacity Trends. ASTI Synthesis Report. Washington, DC: International Food Policy Research Institute.
________. 2019. “Resource Allocation for Agricultural Research in South Asia: Trends, Challenges, and Policy Implications.” Chapter 11 in Agricultural Policy and Program Framework: Priority Areas for Research and Development in South Asia, R. Shrestha, S. Bokhtiar, R. Khetarpal, and Y. Thapa, ed. Dhaka, Bangladesh: SAARC Agriculture Centre.
Stads, G.-J., and N. Beintema. 2015. “Agricultural R&D Expenditure in Africa: An Analysis of Growth and Volatility.” European Journal of Development Research 27 (3): 391–406.
Stads, G.-J., N. Beintema, S. Perez, K. Flaherty, and C. Falconi. 2016. Agricultural Research in Latin America and the Caribbean: A Cross-Country Analysis of Institutions, Investment, and Capacities. ASTI Synthesis Report. Washington, DC: International Food Policy Research Institute.
Suphannachart, W. 2016. “Returns to Major Agricultural R&D Sources in Thailand.” American Journal of Economics 6 (1): 22–26.
Timmer, P. 2015. “Food Security, Structural Transformation, Markets and Government Policy. Asia & the Pacific Policy Studies 4 (1): 4–19.
Whittaker, G., B. Barnhart, R. Färe, and S. Grosskopf. 2015. “Application of Index Number Theory to the Construction of a Water Quality Index: Aggregated Nutrient Loadings Related to the Areal Extent of Hypoxia in the Northern Gulf of Mexico.” Ecological Indicators 49: 162–168.
USDA-ERS (United States Department of Agriculture, Economic Research Service). 2019. International Agricultural Productivity Database. http://www.ers.usda.gov/data-products/international-agricultural-productivity/ (accessed June, 2020).
World Bank. 2020. World Development Indicators. http://datatopics.worldbank.org/world-development-indicators/ (accessed June, 2020).


INTERNATIONAL FOOD POLICY RESEARCH INSTITUTE1201 Eye Street, NW, Washington, DC 20005 USA | T. +1-202-862-5600 | F. +1-202-862-5606 | Email: [email protected] | www.ifpri.org
ASIA–PACIFIC ASSOCIATION OF AGRICULTURAL RESEARCH INSTITUTIONSFAO Annex Building, 202/1 Larn Luang Road, Bangkok, 10100, Thailand | T. +662 282 2918 | F. +662 282 2919
Email: [email protected] | www.apaari.org