Embed Size (px)
Citation preview
African Journal of
Agricultural Research Volume 11 Number 30 28 July 2016
ISSN 1991-637X

ABOUT AJAR The African Journal of Agricultural Research (AJAR) is published weekly (one volume per year) by Academic Journals.
African Journal of Agricultural Research (AJAR) is an open access journal that publishes high-quality solicited and unsolicited articles, in English, in all areas of agriculture including arid soil research and rehabilitation, agricultural genomics, stored products research, tree fruit production, pesticide science, postharvest biology and technology, seed science research, irrigation, agricultural engineering, water resources management, marine sciences, agronomy, animal science, physiology and morphology, aquaculture, crop science, dairy science, entomology, fish and fisheries, forestry, freshwater science, horticulture, poultry science, soil science, systematic biology, veterinary, virology, viticulture, weed biology, agricultural economics and agribusiness. All articles published in AJAR are peer- reviewed.
Contact Us
Editorial Office: [email protected]
Help Desk: [email protected]
Website: http://www.academicjournals.org/journal/AJAR
Submit manuscript online http://ms.academicjournals.me/

. Editors
Prof. N.A. Amusa
Editor, African Journal of Agricultural Research Academic Journals.
Dr. Panagiota Florou-Paneri Laboratory of Nutrition, Faculty of Veterinary Medicine, Aristotle University of Thessaloniki, Greece.
Prof. Dr. Abdul Majeed Department of Botany, University of Gujrat,India, Director Horticulture, and landscaping. India.
Prof. Suleyman TABAN Department of Soil Science and Plant Nutrition, Faculty of Agriculture, Ankara University, 06100 Ankara-TURKEY.
Prof.Hyo Choi
Graduate School Gangneung-Wonju National University Gangneung, Gangwondo 210-
702, Korea.
Dr. MATIYAR RAHAMAN KHAN
AICRP (Nematode), Directorate of Research, Bidhan Chandra Krishi
Viswavidyalaya, P.O. Kalyani, Nadia, PIN-741235, West Bengal. India.
Prof. Hamid AIT-AMAR University of Science and Technology, Houari Bouemdiene, B.P. 32, 16111 EL-Alia, Algiers, Algeria.
Prof. Sheikh Raisuddin Department of Medical Elementology and
Toxicology,Jamia Hamdard (Hamdard University) New Delhi, India.
Prof. Ahmad Arzani Department of Agronomy and Plant Breeding College of Agriculture Isfahan University of Technology
Isfahan-84156, Iran.
Dr. Bampidis Vasileios
National Agricultural Research Foundation (NAGREF), Animal Research Institute 58100 Giannitsa, Greece.
Dr. Zhang Yuanzhi Laboratory of Space Technology, University of Technology (HUT) Kilonkallio Espoo, Finland. Dr. Mboya E. Burudi International Livestock Research Institute (ILRI) P.O. Box 30709 Nairobi 00100, Kenya. Dr. Andres Cibils Assistant Professor of Rangeland Science
Dept. of Animal and Range Sciences Box 30003, MSC 3-I New Mexico State University Las Cruces, NM 88003 (USA). Dr. MAJID Sattari
Rice Research Institute of Iran, Amol-Iran. Dr. Agricola Odoi University of Tennessee, TN., USA.
Prof. Horst Kaiser Department of Ichthyology and Fisheries Science Rhodes University, PO Box 94, South Africa.
Prof. Xingkai Xu Institute of Atmospheric Physics, Chinese Academy of Sciences, Beijing 100029,
China.
Dr. Agele, Samuel Ohikhena Department of Crop, Soil and Pest Management, Federal University of Technology
PMB 704, Akure, Nigeria. Dr. E.M. Aregheore The University of the South Pacific, School of Agriculture and Food Technology Alafua Campus, Apia, SAMOA

Editorial Board
Dr. Bradley G Fritz Research Scientist, Environmental Technology Division, Battelle, Pacific Northwest National Laboratory, 902 Battelle Blvd., Richland, Washington, USA.
Dr. Almut Gerhardt LimCo International, University of Tuebingen, Germany.
Dr. Celin Acharya Dr. K.S.Krishnan Research Associate (KSKRA), Molecular Biology Division, Bhabha Atomic Research Centre (BARC), Trombay, Mumbai-85, India.
Dr. Daizy R. Batish Department of Botany, Panjab University, Chandigarh, India.
Dr. Seyed Mohammad Ali Razavi University of Ferdowsi, Department of Food Science and Technology, Mashhad, Iran.
Dr. Yasemin Kavdir
Canakkale Onsekiz Mart University, Department of Soil Sciences, Terzioglu Campus 17100 Canakkale Turkey.
Prof. Giovanni Dinelli Department of Agroenvironmental Science and Technology Viale Fanin 44 40100, Bologna
Italy.
Prof. Huanmin Zhou College of Biotechnology at Inner Mongolia Agricultural University, Inner Mongolia Agricultural University, No. 306# Zhao Wu Da Street, Hohhot 010018, P. R. China, China.
Dr. Mohamed A. Dawoud Water Resources Department, Terrestrial Environment Research Centre, Environmental Research and Wildlife Development Agency (ERWDA), P. O. Box 45553, Abu Dhabi, United Arab Emirates.
Dr. Phillip Retief Celliers
Dept. Agriculture and Game Management, PO BOX 77000, NMMU, PE, 6031, South Africa.
Dr. Rodolfo Ungerfeld Departamento de Fisiología, Facultad de Veterinaria, Lasplaces 1550, Montevideo 11600, Uruguay. Dr. Timothy Smith Stable Cottage, Cuttle Lane, Biddestone, Chippenham, Wiltshire, SN14 7DF. UK. Dr. E. Nicholas Odongo,
27 Cole Road, Guelph, Ontario. N1G 4S3 Canada. Dr. D. K. Singh Scientist Irrigation and Drainage Engineering Division, Central Institute of Agricultural Engineeinrg Bhopal- 462038, M.P. India.
Prof. Hezhong Dong Professor of Agronomy, Cotton Research Center, Shandong Academy of Agricultural Sciences, Jinan 250100 China.
Dr. Ousmane Youm Assistant Director of Research & Leader, Integrated Rice Productions Systems Program Africa Rice Center (WARDA) 01BP 2031, Cotonou, Benin.

Table of Contents: Volume 11 Number 30, 2 8 July, 2016
ARTICLES
Diversity of soil macrofauna under sugarcane monoculture and two different natural vegetation types 2669 Glécio Machado Siqueira, Ênio Farias de França Silva, Mariana Matos Moreira, Gustavo André de Araújo Santos and Raimunda Alves Silva
Gelatin extraction from Kumakuma (Brachyplathystoma filamentosum) skin using the liming method 2678 Elen Vanessa Costa da Silva, Rosinelson da Silva Pena and Lúcia de Fátima Henriques Lourenço
Soil porosity and density in sugarcane cultivation under different tillage systems 2689 Everton Martins Arruda, Risely Ferraz de Almeida, Luis Augusto da Silva Domingues, Antonio Carlos da Silva Junior, Emmerson Rodrigues de Moraes, Leonardo Rodrigues Barros, Jéssika Lorrine de Oliveira Sousa and Regina Maria Quintão Lana
Phosphorus and silicon fertilizer rates effects on dynamics of soil phosphorus fractions in oxisol under common bean cultivation 2697 Alessandra Mayumi Tokura Alovisi, Antonio Eduardo Furtini Neto, Ademar Pereira Serra, Alves Alexandre Alovisi, Luciene Kazue Tokura, Elaine Reis Pinheiro Lourente, Robervaldo Soares da Silva, Camila Farah Borges da Silva and Jucinei Souza Fernandes
Improvement of maize yield and soil fertility by 2-years compost application in Malawi’s northern districts 2708 Naohiro Matsui, Koji Nakata, Chisambi Cornelius and Moyo Macdonald
Physical and physicochemical attributes of noni fruits fertilized with cattle manure and potassium 2720 Antônio Gustavo de Luna Souto, Lourival Ferreira Cavalcante, Vânia da Silva Fraga, Belísia Lúcia Moreira Toscano Diniz, Maria Rosimeire Miguel da Silva, Roberto Monteiro Ferreira Filho, Evandro Franklin Mesquita, Stênio Andrey Guedes Dantas and Francisco Vanies da Silva Sá
Yield and quality of dual-purpose barley and triticale in a semi-arid environment in Tunisia 2730 Sadreddine BEJI
Statistical process control in self compensating emitters using water at different saline concentrations 2736 Patrícia Ferreira da Silva, José Dantas Neto, Rigoberto Moreira de Matos, Sabrina Cordeiro de Lima and Delfran Batista dos Santos
Exchangeable cations and available phosphorus in soils with variable charge after application of special liming materials 2744 Jessica Alves dos Santos, Adriel Ferreira da Fonseca, Domenico Zocco and Igor Vieira
African Journal of Agricultural Research

Table of Contents: Volume 11 Number 30, 2 8 July, 2016
ARTICLES
Physiological potential of tamarind seeds subjected to stress conditions and storage 2761 Ana V. C. da Silva, Adrielle N. R. Soares, Priscilla S. Santos, Ana L. S. Nascimento, Marina F. da Vitória, Jéssica M. S. P. Oliveira, Marília F. de V. Melo, Ana da S. Ledo and Allivia R. C. Rabbani
Characterization of goat production systems and trait preferences of goat keepers in Bench Maji zone, south western Ethiopia 2768 Tegegn Fantahun, Kefyalew Alemayehu and Solomon Abegaz
Potential for recovery of Campomanesia xanthocarpa Mart. ex O. berg seedlings from water deficit 2775 Larissa Fatarelli Bento, Silvana de Paula Quintão Scalon, Daiane Mugnol Dresch and Zefa Valdivina Pereira
Growth analysis of sugarcane inoculated with diazotrophic bacteria and nitrogen fertilization 2786 Renan O. Pedula, Nivaldo Schultz, Rafael C. Monteiro, Willian Pereira, Adelson P. de Araújo, Segundo Urquiaga and Veronica M. Reis
Saline water and organic matter in the development and quality of Licania rigida Benth. seedlings 2796 Alian Cássio Pereira Cavalcante, Manoel Alexandre Diniz Neto, Lourival Ferreira Cavalcante, Adailza Guilherme Cavalcante, Belísia Lúcia Moreira Toscano Diniz, Raunira da Costa Araújo, Evandro Franklin de Mesquita and José Flávio Cardoso Zuza
Abscisic acid-mediated stomatal closure and antioxidant defenses in Jatropha curcas L. seedlings submitted to moderate water deficit 2806 Leandro Dias da Silva, Tessio Araujo de Santana, Priscila Souza de Oliveira, Bruno Galvêas Laviola, Márcio Gilberto Cardoso da Costa, Alex-Alan Furtado de Almeida and Fábio Pinto Gomes
Photosynthesis and water relations of sunflower cultivars under salinity conditions 2817 Fátima Marques de A. Maia, Alan Carlos Costa, Jônatas Neves de Castro, Clarice Aparecida Megguer and Frederico Antônio Loureiro Soares
Physiological quality of sesame seed harvested at different plant positions and maturity stages 2825 Cristiane Fernandes Lisboa, Deyner Damas Aguiar Silva, Itamar Rosa Teixeira, André José de Campos, Ivano Alessandro Devilla, and Alessandro Guerra da Silva
African Journal of Agricultural Research

Vol. 11(30), pp. 2669-2677, 28 July, 2016
DOI: 10.5897/AJAR2016.11083
Article Number: A9DC9C959727
ISSN 1991-637X
Copyright ©2016
Author(s) retain the copyright of this article
http://www.academicjournals.org/AJAR
African Journal of Agricultural Research
Full Length Research Paper
Diversity of soil macrofauna under sugarcane monoculture and two different natural vegetation types
Glécio Machado Siqueira1*, Ênio Farias de França Silva2, Mariana Matos Moreira3, Gustavo André de Araújo Santos1 and Raimunda Alves Silva1
1Department of Geosciences, UFMA - Federal University of Maranhão, Av. dos Portugueses, 1966, Bacanga, CEP
65080-805, São Luís – MA, Brazil. 2Department of Rural Technology, Federal Rural University of Pernambuco, Dom Manoel de Medeiros, s/n, 52171-900,
Recife, PE, Brazil. 3Department of Agrophorestry Engineering, University of Santiago de Compostela, Campus Universitario, 27002,
Lugo, Spain.
Received 3 April, 2016; Accepted 8 June, 2016
Soil macrofauna organisms are recognized as ecological indicators of soil management practices. Sugarcane monoculture can have negative impacts on soil, including biodiversity loss, which should be evaluated. In that sense, the aim of this was to determine the diversity macrofauna under sugarcane (Saccharum spp.) annual growth cycle (2012-2013) comparing two different natural vegetation areas (Sandbank and Atlantic forest). The study areas are located at Usina Santa Teresa in Goiana municipality, in Zona Mata Norte of the Pernambuco State (Brazil). Soil macrofauna samples were collected in January, April and August 2013. In order to collect soil macrofauna samples, 5 pitfall traps were placed in the field for 7 days. Descriptive statistics and biodiversity indices were used to carry out data analysis. The presence and biodiversity indices were affected by the hydrological regime. Sugarcane harvest with straw burning initially promoted soil macrofauna taxa better adapted to system drastic changes. Moreover, as sugarcane growth year went by, soil macrofauna biodiversity indices similar to those reported at natural vegetation areas (Sandbank and Atlantic Forest) were observed. Key words: Bioindicator, burnt sugarcane, functional groups, soil macrofauna.
INTRODUCTION Brazil is the largest producer of sugarcane in the world (Cerri et al., 2011). The main product of sugarcane is sucrose which is used as raw material in human food
industries or is fermented to produce ethanol (Mello et al., 2014; Siqueira et al., 2015). Despite its economic importance, the intensive cultivation and processing of
*Corresponding author. E-mail: [email protected]. Tel: +55 98 983281331.
Author(s) agree that this article remain permanently open access under the terms of the Creative Commons Attribution
License 4.0 International License

2670 Afr. J. Agric. Res. sugar has negative environmental impacts. According to Rossetto et al. (2010), sugarcane monoculture leads to biodiversity loss and affects local and regional fauna and flora. Furthermore, soil tillage is traditionally with use of various agricultural machinery mainly made with disc plows, dish harrows and subsoilers (Portilho et al., 2011; Tavares et al., 2015; Surendran et al., 2016) that negatively affect soil aggregation and reduce biological activity (Benito et al., 2008). In addition to modifying soil physico-chemical characteristics, sugarcane cultivation also produces environmental chemical contamination and soil compaction (Iwai et al., 2008; Nurhidayati et al., 2012; Siqueira et al., 2013).
Soil is the habitat of different organisms that constantly interact and move thus influencing physic, chemical and biological properties of soil (Siqueira et al., 2014, Frouz et al., 2015). Soil macrofauna includes a great variety of edaphic organisms larger than 2 mm in size (Baretta, 2007; Bardgett and van der Putten, 2014) that contribute to soil homogenization, soil structure improvement (Siqueira et al., 2014) and therefore increase root penetration and air and water internal fluxes (Brussaard et al., 2007; Oliveira, 2008; Moura et al., 2015).
Edaphic macrofauna components include the following taxonomic groups: termites (Isoptera), woodlice (Isopoda), spiders (Arachnida), centipedes (Chilopoda), millipedes (Diplopoda), earthworms (Oligochaeta), slugs and snails (Mollusca), and ants (Hymenoptera) (Baretta, 2007; Bardgett and van der Putten, 2014). As those organisms have a large influence on soil physical, chemical and biological properties they are considered as "ecosystem engineers" (Lavelle et al., 2006; Kampichler and Bruckner, 2009; Garcia-Palacios et al., 2013). Some groups, like earthworms, have a key role in plant growth, nutrient cycling, productivity, soil properties improvement and clay transfer to soil surface (Baretta, 2007, Lubbers et al., 2013; Oliveira et al., 2014, Wagg et al., 2014). Furthermore, because of their strong interaction with soil, macrofauna communities are also profoundly affected by agricultural practices, such as land-use change, tillage or fertilizers. Since soil macrofauna is very sensitive to both chemical and physical soil parameters, it may be used as ecological indicators of agricultural practices (Merlim 2005; Siqueira et al., 2014). According to Schmidt et al. (2005), ants are good ecological indicators due to their vast abundance and species richness, large geographic distribution, sensitivity to environmental changes, ease to rear and perform morpho species identification (Siqueira et al., 2014; Cordeiro et al., 2004).
Soil macrofauna abundance depends on management practices, fertilization, liming, soil compaction, soil porosity, nutrient and minerals availability and osmotic pressure, among others (Baretta, 2007; Cividanes et al., 2009). Compacted soil becomes anaerobe, with reduced air and water circulation, being unsuitable for some
organisms (Siqueira et al., 2014). Thus agricultural practices that promote soil compaction lead to soil macrofauna decrease.
The study of soil macrofauna communities in each habitat fraction contributes to understanding the role of those organisms in the soil. Their response to soil management practices, environmental interactions or habitat changes occurs quickly (Correia and Oliveira, 2000). In that sense, their abundance, diversity and spatial variability allow the comprehension of their dynamics, the development of biodiversity indicators and therefore the adoption of agricultural practices in accordance with soil macrofauna ecological function.
Despite the essential role of soil macrofauna in soil management, only few studies relating to soil macrofauna and sugarcane culture have been conducted (Pasqualin et al., 2012; Benazzi et al., 2013). Thus, the present study aims to determine diversity of soil macrofauna under sugarcane (Saccharum spp.) annual growth cycle (2012-2013) and two different natural vegetation areas (Sandbank and Atlantic Forest). MATERIALS AND METHODS Study area In the present study, soil macrofauna biodiversity was evaluated under different land uses: sugarcane monoculture (Saccharum spp.) and natural vegetations (Sandbank and Atlantic Forest). The study area is located in Usina Santa Teresa in Goiana municipality, in Zona Mata Norte of the Pernambuco State (Brazil) (Figure 1), whose geographic coordinates are 07°33’39’’S and 35°00’10’’W.
In this study, the area under sugarcane monoculture has 6.5 ha, a mean altitude of 8.5 m and has been cultivated with sugarcane for at least 24 years. The sugarcane management practices include burning of harvest residues. In 2010-2011, soil was ploughed and power harrowed, and sugarcane was replanted. Adjacent to the sugarcane area, there is the Sandbank area, with 260 ha, virtually unchanged due to its intrinsic characteristics. Most of the time, the water table is above the surface and during high tide periods, the Sandbank area is affected by saline waters. The Atlantic forest area belongs to a natural reserve in Usina Santa Teresa in Goiana, and in the present study 448 ha of it were used. Soil and climate characterization The soils in the study area region is derived from “Barreiras group”, comprising final tertiary sediments from continental origin and presenting sandy to clay texture (Brazil 1969,1972). In the lowland study areas, Spodosols (Soil Survey Staff 2010) with sugarcane plantations are found and in the Sandbank area, there are clay Gleysoils (Soil Survey Staff 2010). This lowland study area, located 10 km in land from the Atlantic Ocean, is representative of a regional lowland landscape whose soils are affected by seawater salinity and where sugarcane plantations are the main economic activity. On the other hand, in the upland study area (altitude above 55.7 m – Figure 1), cohesive Ultisols and Oxisol soils exist (Soil Survey Staff 2010). Specifically in the Atlantic forest area Oxisol soils are dominant, having a good structure and homogeneity along
Siqueira et al. 2671
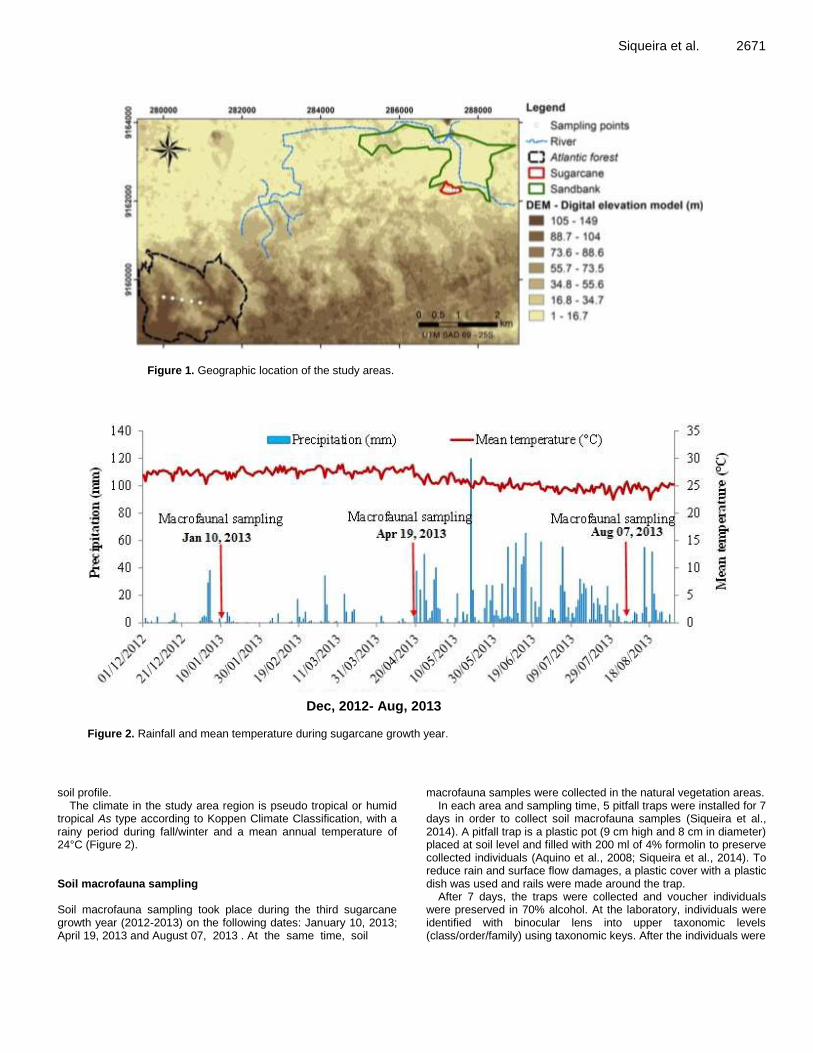
Figure 1. Geographic location of the study areas.
Figure 2. Rainfall and mean temperature during sugarcane growth year.
soil profile.
The climate in the study area region is pseudo tropical or humid tropical As type according to Koppen Climate Classification, with a rainy period during fall/winter and a mean annual temperature of 24°C (Figure 2). Soil macrofauna sampling Soil macrofauna sampling took place during the third sugarcane growth year (2012-2013) on the following dates: January 10, 2013; April 19, 2013 and August 07, 2013 . At the same time, soil
macrofauna samples were collected in the natural vegetation areas. In each area and sampling time, 5 pitfall traps were installed for 7
days in order to collect soil macrofauna samples (Siqueira et al., 2014). A pitfall trap is a plastic pot (9 cm high and 8 cm in diameter) placed at soil level and filled with 200 ml of 4% formolin to preserve collected individuals (Aquino et al., 2008; Siqueira et al., 2014). To reduce rain and surface flow damages, a plastic cover with a plastic dish was used and rails were made around the trap.
After 7 days, the traps were collected and voucher individuals were preserved in 70% alcohol. At the laboratory, individuals were identified with binocular lens into upper taxonomic levels (class/order/family) using taxonomic keys. After the individuals were
Dec, 2012- Aug, 2013

2672 Afr. J. Agric. Res. identified, they were stored and separated into functional groups. Data analysis Initially, the data concerning soil macrofauna communities was analyzed using statistical descriptors to determine the main statistical moments to the total number of taxa in each area [number of taxa, minimum value, maximum value, mean, variance, standard deviation, coefficient of variation (%), skewness, kurtosis and Kolmogorov-Smirnov test (p<0.05)].
Then, abundance (individuals trap-1 day-1), Shannon index, total richness, mean richness and Pielou index were determined (Magurran, 2004).
Species abundance and diversity are expressed in biodiversity indices. Abundance refers to how common or rare a species is relative to other species in a defined location or community. Diversity takes into account both species richness (number of different species from the same community) and species evenness (individuals’ distribution in each species) (Siqueira et al., 2014). Shannon index is represented in Equation 1: ∑ (1) Where pi is the taxa i relative frequency. Total richness (S) corresponds to the number of taxa present in the different land use areas. Mean richness is the mean number of taxa present in each land use. Pielou index indicates soil macrofauna community evenness and is calculated as follows (Equation 2):
(2)
where H’ is the Shannon index result and S is the total richness in every land use area. Pielou index varies between 0 (a taxonomic group is dominant) and 1 (relative abundance is similar between taxonomic groups).
Finally, in order to relate biodiversity parameters and to identify biodiversity patterns or dominant taxa, bar graphics were made.
RESULTS AND DISCUSSION
Since sugarcane management practices included straw burning, a lower biodiversity was expected in that area (Pasqualin et al., 2012; Benazzi et al., 2013). Indeed, the sugarcane area presented the lowest number of taxa at every sampling time (Table 1). In turn, the Sandbank area presented the highest number of taxa (Table 1). That was also expected because this area is situated in the lowland (Figure 1) where water table is very close to the surface allowing the preservation of organic matter contents, thus contributing to epigenic soil fauna feeding. This fact was also reported by Leite-Rossi and Trivinho-Strixino (2012) at riverbanks areas in São Paulo state (Brazil). At the beginning of this study, the Atlantic forest area presented a number of taxa with values in between the other land use areas (Table 1).
The natural vegetation areas (Sandbank and Atlantic forest) presented the same number of taxa at the time of the second and third sampling (Table 1). Moreover, the taxa present in each land use area differed according to
the intrinsic characteristic of each area that result from differences in decomposition material, land cover type and macrofauna species dominance (Leite-Rossi and Trivinho-Strixino, 2012; Abbas et al., 2013).
The taxa richness at the sugarcane and the Atlantic forest areas increased over time (Table 1), probably reflecting a climatic impact on soil macrofauna. The Climograph drawn during the sugarcane growth season has confirmed that the first sampling took place during the dry season, a period of low rainfall (Figure 2). At the sugarcane area, the negative effect on taxa diversity was worse due to the recent crop harvest with burning of harvest residues (Portilho et al., 2011; Nurhidayati, 2012). Soil macrofauna communities at the Atlantic forest area, situated in the upland part of the study area, were more affected by climatic conditions than the Sandbank ones. In that area, soil organisms showed a seasonal behaviour with lower activity during the dry period (Menezes et al., 2009).
Table 2 represents statistical descriptors and measures of central tendency for the total abundance of individuals in different land use areas at every sampling time. Each time sampling took place, the data concerning soil macrofauna communities presented a lognormal distribution, according to Kolmogorov-Smirnov test, and great differences between skewness and kurtosis values (Table 2). The similar fitting of lognormal distribution observed at both the sugarcane area and the natural vegetation areas could indicate that sugarcane cultivation did not have a severe negative impact on the communities assessed in this study. At the time of the first sampling, the abundance of individuals was very low in the Sandbank area (Table 2). In the Atlantic forest and the sugarcane areas, greater data dispersion was observed (Table 2). This could be a sign of a lower biological stability in those areas (some taxa were favoured depending on the ecological context).
At the time of the last sampling, the number of individuals decreased in all land use area (Table 2). The highest values were recorded at the Sandbank area (Table 2). This could indicate a greater biological stability in that area. In turn, at the sugarcane and the Atlantic forest areas the soil macrofauna taxa, affected by the lack of rainfall, presented a quick development, possibly reflecting an ecosystem response to drought conditions attenuation (Souto et al., 2008; Siqueira et al., 2014) reported that soil macrofauna individuals able to survive during drought periods are better adapted to extrinsic environmental processes. Moreover, this disorderly increase in soil macrofauna individuals at the sugarcane and the Atlantic forest areas had perhaps promoted competition among trophic groups.
Considering the daily abundance of individuals per trap, the sugarcane and the Atlantic forest areas had a great number of individuals on the first sampling time, with

Siqueira et al. 2673
Table 1. Taxa richness of soil macrofauna communities in different land use areas at every sampling time.
Sampling time Sugarcane Sandbank Atlantic Forest
Jan 10, 2013
Acari Araneae Diplura Entomobryomorpha Formicidae Isoptera
Acari Araneae Coleoptera Diplura Entomobryomorpha Formicidae Isoptera Poduromorpha Sternorrhyncha Symphyla Thysanoptera Anura
Araneae Coleoptera Diplopoda Diptera Entomobryomorpha Formicidae Isoptera Orthoptera
Number of taxa 6 12 8
Apr 19, 2013
Acari Araneae Coleoptera Diplura Formicidae Isoptera Orthoptera Poduromorpha Anura
Acari Araneae Blattodea Coleoptera Formicidae Gastropoda Isopoda Isoptera Orthoptera Poduromorpha Thysanoptera
Acari Araneae Chilopoda Coleoptera Diplura Formicidae Heteroptera Isoptera Orthoptera Poduromorpha Anura
Number of taxa 9 11 11
Aug 07, 2013
Aranae Coleoptera Diplopoda Diptera Entomobryomorpha Formicidae Hymenoptera Orthoptera
Acari Araneae Blattodea Chilopoda Coleptera Dermaptera Diptera Entomobryomorpha Formicidae Isopoda Orthoptera Poduromorpha
Acari Araneae Coleoptera Diplura Diptera Entomobryomorpha Formicidae Heteroptera Isoptera Larva neuroptera Orthoptera Thysanoptera
Number of taxa 8 12 12
4.457 and 12.429 individuals, respectively (Table 3). This agrees with the greater mean standard deviation and variance recorded in Table 2. In those areas, soil macrofauna individuals reacted to drought conditions by long-distance travelling looking for feed, enhancing the probability of being captured by traps. At the Sandbank area, this could not have occurred due to permanent good feeding conditions.
At the time of the second sampling, daily abundance per trap was similar between all land uses. This could be related to the disorderly increase in soil macrofauna individuals less adapted to drought conditions in the sugarcane and the Atlantic forest areas (Souto et al.,
2008), as previously discussed. On the last sampling day, the Sandbank area presented the highest daily number of individuals per trap (10.914), probably reflecting better ecological stability during the rainy season. In this area, soil macrofauna individuals were well adapted to the usual water table fluctuations and to stable feed availability.
Shannon index indicates species abundance distribution, highlighting less common species (Magurran, 2004). The lower the value of this Shannon index, the higher dominance can one particular species have on the study community (Magurran, 2004). The lower value at the sugarcane (1.641) and the Atlantic forest (1.582)

2674 Afr. J. Agric. Res.
Table 2. Statistical descriptors of the total abundance of individuals in different land use areas at every sampling time.
Jan 10, 2013
Apr 19, 2013
Aug 07, 2013
Sugarcane Sandbank Atlantic forest
Sugarcane Sandbank Atlantic forest
Sugarcane Sandbank Atlantic forest
Minimum 1 1 3
3 3 3
1 2 1
Maximum 87 11 193
185 214 355
10 297 99
Mean 26.167 3.917 55.250
54.778 46.818 55.182
4.875 31.833 24.500
Variance 1116.567 15.356 6930.214
3933.694 5025.164 11012.164
11.554 7005.788 1023.545
Standard deviation 33.415 3.919 83.248
62.719 70.888 104.939
3.399 83.701 31.993
Coefficient of variation 127.701 100.051 150.675
114.497 151.412 190.169
69.724 262.934 130.583
Skew 1.546 1.162 1.305
1.292 1.844 2.768
0.87 3.436 1.567
Kurtosis 1.957 -0.222 -0.229
0.976 2.535 8.121
-0.567 11.855 1.731
Kolmogorov-Smirnov test 0.275Ln 0.271Ln 0.356Ln
0.247Ln 0.288Ln 0.329Ln
0.235Ln 0.468Ln 0.231Ln
Table 3. Daily abundance, taxa richness and biodiversity indices of soil macrofauna communities in different land use areas at every sampling time.
Sampling time Land use Individuals.trap-1
.day-1
Standard deviation Shannon Total richness Mean richness Pielou
Jan 10, 2013
Sugarcane 4.457 2.071 1.641 6 2.4 0.635
Sandbank 1.343 1.883 2.991 12 3.0 0.834
Atlantic Forest 12.429 6.999 1.582 8 4.4 0.527
Apr 19, 2013
Sugarcane 14.714 4.898 2.514 11 5.20 0.727
Sandbank 14.429 8.321 2.148 11 5.00 0.621
Atlantic Forest 17.114 7.403 1.832 11 6.00 0.530
Aug 07, 2013
Sugarcane 1.114 0.566 2.744 8 3.8 0.915
Sandbank 10.914 6.304 1.453 12 8.2 0.405
Atlantic Forest 8.400 10.954 2.581 12 5.2 0.720
areas on the first sampling time (dry season) confirms the dominance of a few numbers of taxa, better adapted to drought conditions (Table 3). At
the Sandbank area (2.991), a great contribution and interconnection between present taxa could have taken place, not highlighting any dominant
taxa. On the last sampling time, the opposite pattern occurred, revealing a great evenness in taxa abundances at the sugarcane (2.744) and

Siqueira et al. 2675
Figure 3. Proportional specimen distribution among taxa in different land use areas at every sampling time.
the Atlantic forest (2.581) areas (Table 3).
Pielou’s index is constrained between 0 and 1 with the larger index value indicating a more even community (Maguran, 2004). As for Shannon index, its values were lower in the sugarcane (0.635) and the Atlantic forest (0.527) areas at the first sampling time (dry season), but the opposite occurred at the time of the last sampling (Table 3).
In fact, the sugarcane area presented the highest values of biodiversity indices at the end of this study. This result suggests that at the beginning of the sugarcane growth year, soil macrofauna communities undergo an initial selection and only individuals better adapted to sugarcane management practices and climatic conditions persist (Portilho et al., 2011; Moura et al., 2015).
Regarding proportional specimen distribution it’s evident that, initially, no dominant taxa existed in the Sandbank area (Figure 3). In turn, Formicidae (55%), general predators of less frequent taxa, were dominant in the sugarcane area. Ants play important functions in maintaining soil health (Del Toro et al., 2012; Ribeiro et al., 2016). And it has been used as soil quality bioindicators in areas with anthropogenic interference and in this situation they could act as less frequent taxa predators (Andersen and Majer, 2004; Schmidt et al., 2005). Similar results were also reported by Pasqualin et al. (2012) at sugarcane areas under different crop management practices. Coleoptera (43%) and Isoptera (41%) were dominant in the Atlantic forest areas; the flying individuals can travel over longer distances looking

2676 Afr. J. Agric. Res. for feed.
On the second sampling time, Isoptera (37%) were dominant at the sugarcane area; soil cover with plant residues promoted organic matter decomposers. Formicidae were dominant at the Sandbank area (42%). Poduromorpha were dominant at the Atlantic forest area (58%). These last taxa have a key role in organic matter decomposition and are an excellent soil quality indicator (Rovedder et al., 2009). The abundance of this order rose in the Atlantic forest area with the improvement in hydrological conditions.
Finally, at the end of the study, individuals were more evenly distributed among taxa in the sugarcane area (Figure 3) corroborating the biodiversity indices values (Table 3). Even so, the predators (Formicidae - 26% and Aranae - 13%) had great abundances, probably revealing that ecological equilibrium had been achieved under the intensive cultivation of sugarcane. In the Sandbank area, Formicidae were dominant (78%), probably reflecting the great feed availability in that area, and not an ecological adaptation as described by Schmidt et al. (2005). These results agree with the lowest observed values of Shannon and Pielou indices (Table 3). Conclusions Soil macrofauna communities under different land uses were affected by the hydrological regime in the study area. Sugarcane cultivation with straw burning initially promoted those taxa better adapted to drastic changes in the system (such as Formicidae). Moreover, as the sugarcane growth year went by, a biological equilibrium as compared to that of the natural vegetation areas was achieved. Biodiversity indices showed that every land use presented dominant patterns with different relevance degrees to the ecosystem. The biodiversity increase at the sugarcane area during its growth year has allowed the description of a food chain setting: Formicidae dominance at the beginning, followed by predators emergence, until finally an evenly distributed community was reached.
Conflict of Interests The authors have not declared any conflict of interests.
ACKNOWLEDGEMENTS
The authors thank Conselho Nacional de Desenvolvimento Científico e Tecnológico (CNPq) and Fundação de Amparo a Pesquisa do Estado de Pernambuco – Brazil (FACEPE) by a DCR- Desenvolvimento Científico Regional grant awarded to
the first author. They also thank Fundação de Amparo à Pesquisa e ao Desenvolvimento Científico e Tecnológico do Maranhão - Brazil (FAPEMA), for funding the publication of thispaper (APCINTER 192415/2014, BATI 25407/2015 and BEPP 01301/15). REFERENCES Abbas MN, Muhammad M, Shahnaz AR, Khalid N, Razia I (2013). The
Macroinvertebrate Communities Associated with Some Weed Plants of Sugarcane (Sacharum Officinarum) and Wheat (Triticum aestivum) Crops of Faisalabad District (Pakistan). World Appl. Sci. J. 28(6):817-825
Andersen AN, Majer JD (2004). Ants show the way down under: invertebrates as bioindicators in land management. Front. Ecol. Environ. 2:291-298.
Aquino AM, Filho EM, Ricci MSF, Casanoves F (2008). Earthworms populations in agroforestry systems with conventional and organic coffee. Ciênc. Agrotec. 32:4.
Bardgett RD, Van Der Putten WH (2014). Belowground biodiversity and ecosystem functioning. Nature 515(7528):505-511.
Baretta D (2007). Soil fauna and other edaphic attributes as environmental quality indicators in areas with Araucaria angustifolia in São Paulo State, Brazil (in Portuguese). Thesis (PhD in agronomy) – Universityof São Paulo, ESALQ, Piracicaba, São Paulo, Brazil.
Benazzi ES, Bianchi MO, Correia MEF, Lima E, Zonta E (2013). Impacts of sugarcane harvesting methods on soil macrofauna in production area in Espirito Santo – Brazil. Semina: Ciênc. Agrár. (Londrina) 34(6,1):3425-3441.
Benito NP, Guimarães MF, Pasini A (2008). Crop management systems characterization in a typical hapludox soil using biological, physical and chemical parameters (in Portuguese). Semina 29:473-484.
Brazil MA (1969). Soil precision survey of Itapirema Experimental Station soils. Technical Bulletin no. 12,Ministry of Agriculture, Rio de Janeiro, Brazil.
Brazil MA (1972). Soil quick survey- characterization of Pernambuco State soils. Technical Bulletin no. 26, vol. 2, Ministry of Agriculture, Recife, Brazil.
Brussaard L, de Ruiter PC, Brown GG (2007). Soil biodiversity for agricultural sustainability. Agric. Ecosyst. Environ. 121(3):233-244.
Cerri CC, Galdos MV, Maia SMF, Bernoux M, Feigl BJ, Powlson D, Cerri CEP (2011). Effect of sugarcane harvesting systems on soil carbon stocks in Brazil: An examination of existing data. Eur. J. Soil Sci. 62(1):23-28.
Cividanes FJ, Barbosa JC, Martins ICF, Pattaro F, Nunes MA, Santos RS (2009). Diversity and spatial distribution of ground arthropods in agroecosystems. Bragantia 68(4):991-1002.
Cordeiro FC, Dias FC, Merlim AO, Correia MF, Aquino AM, Brow G (2004). Diversity of soil invertebrate macrofauna as indicative of soil quality in organic system production. Rev. Univ. Rural 24:29-34.
Correia EF, Oliveira LCM (2000). Soil fauna: General and methodological aspects. Seropédica, Embrapa Agrobiologia.
Del Toro I, Ribbons RR, Pelini SL (2012). The little things that run the world revisited: a review of ant-mediated ecosystem services and disservices (Hymenoptera: Formicidae). Myrmecol. News 17:133-146.
Iwai CB, Yupin P, Noller B N (2008). Earthworm: potential bioindicator for monitoring diffuse pollution by agrochemical residues in Thailand. KKU Res. J. 139:1081-1088.
Kampichler C, Bruckner A (2009). The role of microarthropods in terrestrial decomposition: A meta-analysis of 40 years of litterbag studies. Biol. Rev. 84(3):375-389.
Lavelle P, Decaëns T, Aubert M, Barot S, Blouin M, Bureau F, Margerie P, Mora P, Rossi JP (2006). Soil invertebrates and ecosystem services. Eur. J. Soil Biol. 42:S3-S15.
Leite-Rossi LA, Trivinho-Strixino S (2012). Are sugarcane leaf-detritus

well colonized by aquatic macroinvertebrates? Acta Limnol. Bras. 24:303-313.
Lubbers IM, van Groenigen KJ, Fonte SJ, Six J, Brussaard L, van Groenigen JW (2013). Greenhouse-gas emissions from soils increased by earthworms. Nature Climate Change 3(3):187–194.
Magurran AE (2004). Measuring biological diversity, 6th ed., Blackwell Publishing, Malden.
Mello FFC, CEP Davies, Holbrook NM, Paustian K, Maia SMF, Galdos MV, Bernoux M, Cerri CC (2014). Payback time for soil carbon and sugar-cane ethanol. Nature Climate Change 4(7):1-5.
Menezes CEG, Correia MEF, Pereira MG, Batista I, Rodrigues KDM, Couto WH, Anjos LHCA, Oliveira IP (2009). Soil macrofauna in three succession stages of a seasonal semidecidous forest and a mixed pasture in Pinheiral - Rio de Janeiro State. Rev. Bras. Ciênc. Solo 33:1647-1656.
Merlim AO (2005). Soil in macrofauna in preserved and degraded araucaria ecosystems in the State Park of Campos de Jordão, Master Thesis, Ecology and Agroecossystem, São Paulo University, Piracicaba, São Paulo, Brazil.
Moura EG, Aguiar ACF, Piedade AR, Rousseau GX (2015). Contribution of legume tree residues and macrofauna to the improvement of abiotic soil properties in the eastern Amazon. Applied Soil Ecology. doi: 10.1016/j.apsoil.2014.10.008.
Nurhidayati N, Arisoesilaningsih E, Suprayogo D, Hairiah K (2012). Earthworm population density in sugarcane cropping system applied with various quality of organic matter. J. Trop. Life Sci. 2:103-109.
Oliveira FS, Varajo AFDC, Varajo CAC, Schaefer CEGR, Boulang B (2014). The role of biological agents in the microstructural and mineralogical transformations in aluminium lateritic deposit in Central Brazil. Geoderma 226-227(1):250–259.
Oliveira JB (2008). Applied Pedology .3rd ed. Piracicaba, FEALQ. Pasqualin LA, Dionísio JA, Zawadneak MAC, Marçal CT (2012).
Edaphic macrofauna in sugar cane crops and forest in northwestern Paraná – Brazil. Semina 33(1):7-18.
Portilho IIR, Borges CD, Costa AR, Salton JC, Mercante FM (2011). Residues of sugarcane crop and its effects on the epigeic invertebrate fauna. Semina 32(3):959-970.
Ribeiro R, Solar DC, Barlow J, Andersen AN, Schoereder JH, Berenguer E, Ferreira JN, Alan T (2016). Biodiversity consequences of land-use change and forest disturbance in the Amazon: A multi-scale assessment using ant communities. Biol. Conserv. 197:98–107.
Rossetto R, Dias FLF, Vitti AC, Cantarella H (2010). Fertility maintenance and recovery of soils under sugarcane crop. In: Cortez, L.A.B. Bioethanol of sugarcane: No Tillage for Productivity and Sustainability. São Paulo, Blucher pp. 381-403.
Rovedder APM, Eltz FLF, Drescher MS, Schenato RB, Antoniolli Z I (2009). Edaphic organisms as bioindicators of restoration of degraded soils by arenização on the Bioma Pampa. Ciênc. Rural 39(4):1051-1058.
Schmidt K, Corbetta R, Camargo AJA (2005). Ants of João da Cunha Island, SC, Brazil: 307 composition and diversity. Biotemas 18(1):57-71.
Siqueira GM, Silva EFF, Dafonte JD (2015). Distribuição espacial da condutividade elétrica do solo medida por indução eletromagnética e da produtividade de cana-de-açúcar. Bragantia 74(2):215-223.
Siqueira GM, Silva EFF, Montenegro AAA, Vidal Várquez E, Paz-Ferreira J (2013) Multifractal analysis of vertical profiles of soil penetration. Nonlin. Process. Geophys. 20:529-541.
Siqueira GM, Silva EFF, Paz-Ferreiro J (2014). Land Use Intensification Effects in Soil Arthropod Community of an Entisol in Pernambuco State, Brazil. Sci, World J. 7 p.
Soil Survey Staff (2010). Keys to Soil Taxonomy, 11th ed. USDA-Natural Resources Conservation 312 Service, Washington, DC.
Souto PC, Souto JS, Miranda JRPD, Santos RVD, Alves AR (2008). Soil microbial 314 community and mesofauna under dry forest vegetation in the semi-arid region of Paraíba, Brazil. Rev. Bras. Ciênc. Solo 32:151-160.
Siqueira et al. 2677 Surendran U, Ramesh V, Jayakumar M, Marimuthu S, Sridevi G (2016).
Improved sugarcane productivity with tillage and trash management practices in semi arid tropical agro ecosystem in India. Soil Till. Res. 158:10-21.
Tavares UE, Monteiro Rolim M, Souza de Oliveira V, Maria Regis Pedrosa E, Siqueira GM Guedes Magalhães A (2015). Spatial Dependence of Physical Attributes and Mechanical Properties of Ultisol in a Sugarcane Field. Sci. World J. pp. 1-10.
Wagg C, Bender SF, Widmer F, van der Heijden MGA (2014). Soil biodiversity and soil community composition determine ecosystem multifunctionality. Proceed. Natl. Acad. Sci. United States Am. 111:52665270.

Vol. 11(30), pp. 2678-2688, 28 July, 2016
DOI: 10.5897/AJAR2016.11183
Article Number: B21F6C059730
ISSN 1991-637X
Copyright ©2016
Author(s) retain the copyright of this article
http://www.academicjournals.org/AJAR
African Journal of Agricultural Research
Full Length Research Paper
Gelatin extraction from Kumakuma (Brachyplathystoma filamentosum) skin using the liming method
Elen Vanessa Costa da Silva1*, Rosinelson da Silva Pena2 and Lúcia de Fátima Henriques Lourenço3
1Food Technology Department, Estadual University of Pará, UEPA, Belém, PA, Brazil.
2Faculty of Food Engineering, Technology Institute, Federal University of Pará (UFPA), Postal code: 66075-110, Belém,
PA, Brazil. 3Faculty of Food Engineering, Federal University of Pará (UFPA) – Rua Augusto Côrrea, 01, P. O. Box 479, Postal
Code: 66075-110, Belém, PA, Brazil.
Received 4 May, 2016; Accepted 14 July, 2016
Gelatin extraction process from Kumakuma (Brachyplathystoma filamentosum) skin was optimized using a calcium hydroxide solution. The gelatin obtained was characterized through scanning electron microscopy and analyses of yield, gel strength, color, viscosity, amino acid profile, melting point, foaming capacity, and emulsifying capacity. The optimized conditions were defined over ten days of pre-treatment at 50°C. This condition resulted in desirability of 0.965 and yield and gel strength values of 20.24% and 221 g, respectively. Glycine was the main amino acid both in the fish skin (11.68%) and in the gelatin obtained (23.39%). Gelatin had extendable and consistent gel characteristics and its microstructure showed even threads with small gaps throughout, which is favorable for the food industry. Key words: Residue, fish, pre-treatment, gelatin, gel strength.
INTRODUCTION Gelatin is a valuable protein derived from animal by-products obtained through partial hydrolysis of collagen originated from cartilages, bones, tendons and skins of cold-water (cod, king weakfish, salmon, among others), and warm-water fish (tuna, catfish, tilapia, among others) (Sakr, 1997). However, no study has been carried out with the Amazon species Kumakuma (Brachyplathystoma filamentosum), a large-size fish that can reach over 1.5 m in the overall length and weigh 100 kg, which is widely
used in the filleting industry (Gonçalves et al., 2003). The procedures used to extract collagen from fish
normally involve chemical pre-treatment of the raw material and mild temperature during the process (Karim and Bhat, 2009). Depending on the method employed in the pre-treatment, two types of gelatin with different characteristics can be produced. Type-A gelatin (isoelectric point at pH 6 to 9) is produced by acid treatment of the collagen, while type-B gelatin (isoelectric
*Corresponding author. E-mail: [email protected]. Tel: +5591981140062.
Author(s) agree that this article remain permanently open access under the terms of the Creative Commons Attribution
License 4.0 International License

point at pH 5) is produced by alkaline treatment (Stainsby, 1987). Gelatin is a protein derived from the partial hydrolysis of collagen and is made up of approximately 19 amino acids (Osborne et al., 1990). Collagen’s thermal stability is related to its imino acid content (proline and hydroxyproline). The higher this content, the greater the stability of the bonds among proteins. Collagen is denatured at temperatures above 40°C, which produces a mix of species with one, two, or three randomly weaved polypeptide chains. On the other hand, the controlled cooling of collagen (below its melting point) causes the recovery of the helicoidal structure (Wong, 1994).
The liming process, which uses calcium hydroxide (Ca(OH)2) in the collagen pre-treatment, was especially designed to extract gelatin from the skin and bones of mammals. This type of process normally takes days or months depending on the calcium hydroxide concentration and temperature employed (Schreiber and Gareis, 2007). An alkaline extraction process of type-B gelatin from fish was patented by Stanley (2002). This process consists of an initial extraction through liming for 42 days followed by an acid extraction process. The use of Ca(OH)2 is usually preferred for its ability to regulate alkalinity, which does not allow the collagen to elongate and lose firmness (Ockerman and Hansen, 1999). In addition, the gelatin yield and bloom strength are much higher (Jamilah et al., 2011). Response surface methodology (RSM) has been an effective tool to control food processes. It is an important experimental design and a critical technology in process optimization (Cho et al., 2004).
The worldwide production of gelatin was approximately 326,000 metric tons, 46% which is from pig skins, 29.4% from bovine hide, 23.1% from bones, and 1.5% from other parts (GME, 2008). However, the common occurrence of bovine spongiform encephalopathy (BSE) has caused problems to human health and, therefore, the use of by-products from mammals has been limited in the processing of foods, cosmetics, and pharmaceuticals (Cho et al., 2005). Thus, research on processes to obtain gelatin from fish, particularly from skin and bones, has increased the aim to obtain a product with properties equivalent to those of gelatin from mammals (Gudmundsson, 2002). The present study aimed to obtain gelatin from fish skin using the liming method, as well as to determine the ideal processing conditions using the response surface methodology, besides assessing desirability function and characterizing the properties of the gelatin obtained. MATERIALS AND METHODS The study used fresh skins from Kumakuma (B. filamentosum) fish purchased at the Ver-o-Peso fish market in the city of Belém, PA, Brazil. The raw material was transported under refrigeration (2 to 4°C) in isothermic boxes to the laboratory of products of animal origin (Laboratório de Produtos the Origem Animal – LAPOA) of the
da Silva et al. 2679 Federal University of Pará (UFPA), where the trials were carried out. Obtaining gelatin The gelatin was obtained by the liming method based on the methodology proposed by Jamilah et al. (2011). The fish skins were washed in running water to remove undesirable materials, and after excess water was drained, the skins were immersed in a saturated Ca(OH)2 solution at a concentration of 27 g/L at 20°C. For each kilogram of wet skin, 2 L saturated solution were used as impregnation medium. After pre-treatment (6 to 14 days), the skins were removed and washed in ten parts of water (m/m) to remove excess alkali, maintaining the skins at pH 10. For each 20 g of skin, 100 ml distilled water were added and the system was maintained in a water bath (36 to 64°C) for collagen extraction. Next, hydrochloric acid was used to lower the solution’s pH to approximately 5. The solution was then filtered in Whatman no. 4 filter paper and the denatured collagen (gelatin) collected was placed in trays, frozen at -50°C, and lyophilized for 30 h. The lyophilized product (gelatin) was vacuum packaged in polyethylene bags, stored at -22°C, and later subjected to the assays in the experimental design. Analytical determinations Analyses were performed for moisture (method no. 950.46), total proteins with correction factor 5.55 (method no. 928.08), lipids (method no. 960.39), and ashes (method no. 920.153) according to the AOAC (2002). Skin pH was determined through AOAC method no. 981.12 and gelatin pH, using the methodology proposed by Schrieber and Gareis (2007). The amino acid profile was determined using a Waters-PICO Tag™ high-performance liquid chromatograph (Waters model 712 WISP, Watford, Herts, UK) according to White et al. (1986). Water activity was determined with an Aqualab 3TE electronic hygrometer (Decagon Devices Inc., USA). All analyses were performed in triplicate. Instrumental color was determined with a CR 310 colorimeter (Minolta, Japan) using the Commission Internationale de L’Éclairage (CIE) L*, a*, and b* space, where L* is luminosity, a* is red color intensity, and b* is yellow color intensity. The chroma index (c*) and hue angle (h°) were calculated (Hunterlab, 2008). Determining the technological properties The total yield and gelatin yield (%) were calculated from the ratio between gelatin weight and skin wet weight (Binsi et al., 2009). Gel strength (Bloom) was determined in a texture analyzer using a cylindrical Teflon probe 12.5 mm in diameter pressing 4 mm into the gelatin at 1 mm/s (Choi and Regenstein, 2000). The morphological analyses were carried out in a LEO-1430 (LEO, USA) scanning electron microscope. The samples were metallized with gold using a coating time of 1.5 min. The analysis conditions for the secondary electron images were: electron beam current = 90 µA, constant acceleration voltage = 10 kV, and work distance = 15 mm. The melting point was investigated based on the methodology by Choi and Regenstein (2000). The foaming capacity (FC) was determined in gelatin solutions at different concentrations (1, 2, and 3%) and homogenized at 1,750 rpm for 1 min at room temperature (24°C). FC was calculated from the ratio between the volumes before and after homogenization (Shahiri et al., 2010).
The emulsifying capacity (EC) was determined according to Shahiri et al. (2010), with modifications. Twenty milliliters of 3.3% gelatin solution were mixed with 20 ml soybean oil. The mix was homogenized at 1,750 rpm for 30 s and then centrifuged at 2,000 g

2680 Afr. J. Agric. Res. Table 1. 22 experimental design matrix with the results obtained for yield (%) and gel strength (g).
Test Coded Real Response
A B Time (h) Temperature (°C) Yield (%) Gel strength (g)
1 -1.00 -1.00 7.0 40.0 14.0 70.0
2 -1.00 1.00 7.0 60.0 30.0 39.0
3 1.00 -1.00 13.0 40.0 10.0 78.0
4 1.00 1.00 13.0 60.0 23.5 57.0
5 -1.41 0.00 6.0 50.0 21.0 89.0
6 1.41 0.00 14.0 50.0 16.0 163.0
7 0.00 -1.41 10.0 36.0 12.0 80.0
8 0.00 1.41 10.0 64.0 26.0 75.0
9 0.00 0.00 10.0 50.0 25.1 243.0
10 0.00 0.00 10.0 50.0 21.0 240.0
11 0.00 0.00 10.0 50.0 24.9 200.0
for 5 min. EC was calculated as the ratio between the volume of the emulsified portion and the initial volume. Viscosity was determined according to Yang et al. (2008). The sample was placed in a water bath at 45°C and transferred to the Ostwald-Fensk Viscosimeter (no. 100), which was placed in a water bath at 60°C for 10 min for temperature stabilization. The reading was expressed in centipoise (cP). Experimental design A central rotatable composite design (CRCD) and the surface response methodology (SRM) were used to define the best conditions for the responses of total process yield and gel strength allied to the appropriate viscosity conditions for the product’s commercial purposes. Eleven (11) assays (Table 1) were performed, four were factorial (combination among the levels ±1), three in the central point (two variables at level 0), and four axial (one variable at level ±α and the other variable at level 0). For each response, variable significance or interactions were verified using the polynomial equation described in Equation 1.
(1) where Y is the dependent variable (gel yield and strength); β0 is the constant; βi, βii, and βij are regression coefficients; Xi and Xj are the level of the independent variables. The deviations and relative deviations between the experimental values and those predicted by the models for each response variable at the optimal condition were calculated by Equations 2 and 3, respectively: Deviation = Y - Ῡ (2) Relative deviation = Y-Ŷ/Y × 100 (3) where Y is the experimental response and Ῡ is the response predicted by the model. Statistical analysis The experimental data of the design and analysis of variance (ANOVA) and the determination of the optimal point of the design
through the desirability function were analyzed using the software Statistica 7.0 for Windows.
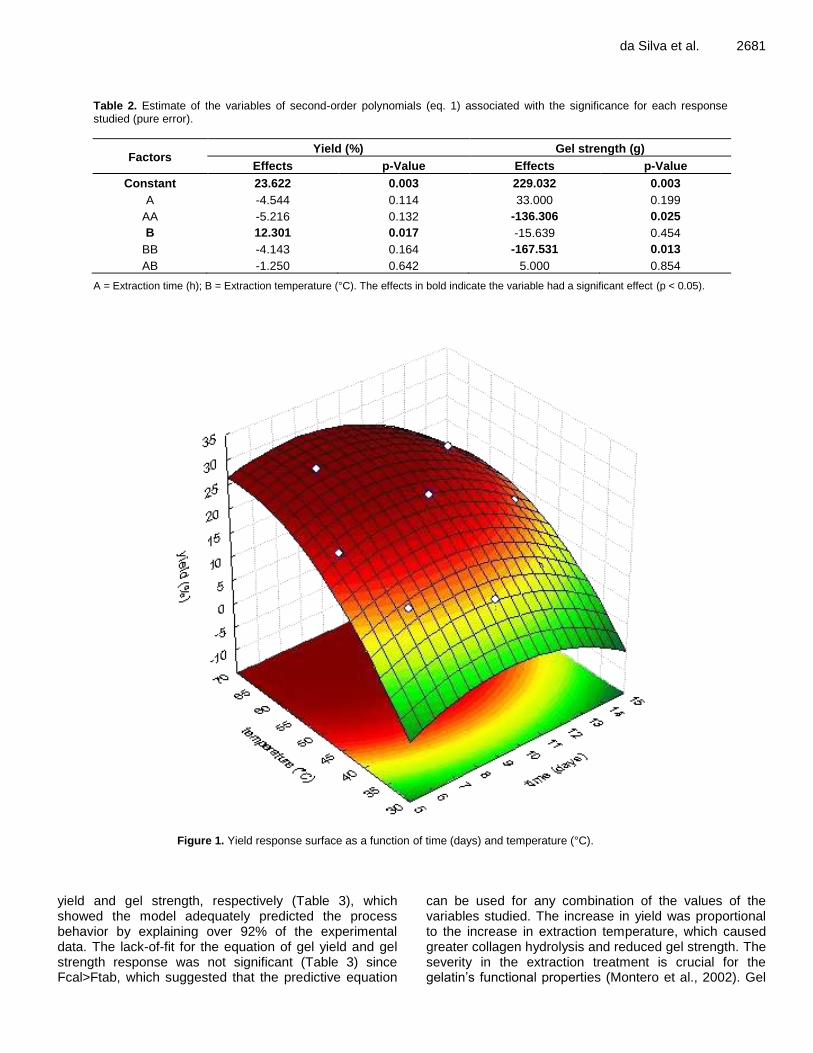
RESULTS AND DISCUSSION Optimizing the gelatin obtention process The last two columns of Table 1 presented the experimental results obtained for yield (%) and gel strength (g). The estimated coefficients of the factors for the model of each response assessed are shown in Table 2. The effects in bold indicated that the variable had a significant effect (p ≤ 0.05). Obtaining higher yields in gelatin extraction processes was the key to enable its use as a potential source of production. The effect on total yield was significant and positive for linear extraction temperature (B), that is, the higher this factor, the greater the yield. Figure 1 shows higher yields in the ranges in which higher extraction temperatures were employed, which may have allowed for more pronounced collagen hydrolysis and led to higher yields.
For gel strength (Table 2), the effects were significant and negative for quadratic pre-treatment time (AA) and quadratic extraction temperature (BB), that is, the higher these factors, the lower the gel strength will be. It can also be seen that the linear pre-treatment time (A) had the greatest effect on gel strength. The increase in temperature lead to greater gel strength, however, as temperature increased, gel strength tended to decrease with the consequent formation of low-molecular-weight peptides. It had been known that gel strength and the other functional properties of gelatins (viscosity, melting point, and gelling point) were dependent on the gelatins’ molecular weight distribution and amino acid composition (Johnston-Banks, 1990). The highest gel strength values were obtained when temperatures around 50°C were employed (Figure 2).
ANOVA resulted in R2 values of 0.93 and 0.92 for gel
da Silva et al. 2681
Table 2. Estimate of the variables of second-order polynomials (eq. 1) associated with the significance for each response studied (pure error).
Factors Yield (%) Gel strength (g)
Effects p-Value Effects p-Value
Constant 23.622 0.003 229.032 0.003
A -4.544 0.114 33.000 0.199
AA -5.216 0.132 -136.306 0.025
B 12.301 0.017 -15.639 0.454
BB -4.143 0.164 -167.531 0.013
AB -1.250 0.642 5.000 0.854
A = Extraction time (h); B = Extraction temperature (°C). The effects in bold indicate the variable had a significant effect (p < 0.05).
Figure 1. Yield response surface as a function of time (days) and temperature (°C).
yield and gel strength, respectively (Table 3), which showed the model adequately predicted the process behavior by explaining over 92% of the experimental data. The lack-of-fit for the equation of gel yield and gel strength response was not significant (Table 3) since Fcal>Ftab, which suggested that the predictive equation
can be used for any combination of the values of the variables studied. The increase in yield was proportional to the increase in extraction temperature, which caused greater collagen hydrolysis and reduced gel strength. The severity in the extraction treatment is crucial for the gelatin’s functional properties (Montero et al., 2002). Gel

2682 Afr. J. Agric. Res.
Figure 2. Gel strength response surface as a function of time (days) and temperature (°C).
Table 3. Analysis of variance (ANOVA) for gel yield and strength as functions of the independent variance (pre-treatment time and temperature), F test, and R2.
Sources SS DF MS F cal. F tab. R2
Yield
Regression 292.10 1 292.1 21.36 18.51 0.93
Residue 123.05 9 13.67 - - -
L. F 112.37 7 16.05 3.0 19.35 -
Error 10.68 2 5.343 - - -
Total 415.15 10 41.51564 -
-
Model 23.6228+6.1505(B)
Gel strength
Regression 50126.82 2 25063.41 28.26 19.0 0.92
Residue 7093.36 8 886.67
- -
L. F 5940.69 6 990.11 1.71 19.3 -
Error 1152.67 2 576.33 - - -
Total 57220.18 10 5722.01 - - -
Model 229.03 -68.15(AA)-83.76(BB)
consistency decreased for extraction temperatures above 50°C, which matches Ledward (1986), Norman et al.
(2000), and Cho et al. (2004). According to these authors, higher extraction temperatures cause the

da Silva et al. 2683
Figure 3. Desirability function for yield (%) and gel strength (g).
breakdown of properties and the protein fragments produced decrease the gelling capacity and, consequently, gel strength. Thus, employing high temperatures and long pre-treatment times is desirable to obtain higher yields, but cause the fragmentation of alpha (α) chains in the collagen, which reduces gel strength (Johnston-Banks, 1990; Cho et al., 2004). The increase in pre-treatment time close to the optimal point (10 days) caused an increase both in yield and gel strength. A similar result was found by Johnston-Banks (1990) and Poppe (1992), who reported that the number of cross bonds must be weakened enough to convert the collagen into a form appropriate for extraction. According to the desirability function for the gel yield and gel strength responses (Figure 3), over 10 days of pre-treatment and extraction temperature of 50°C can be obtained for maximum desirability condition (0.96), 23.62% yield and 229.14 g gel strength. According to Jamilah and Harvinder (2002), the yield of gelatin from fish varies from
6 to 19% and gel strength, from 250 to 260 g. Assays were carried out at the optimal temperature (50°C) and pre-treatment time (10 days) so that the experimental values of gel yield and strength were compared to those predicted by the regression models. The difference between the experimental and predicted values resulted in a relative deviation of -3.6% for yield and -16.6% for gel strength, which shows that the method can be used to predict the yield and gel strength of gelatin within the experimental domain. Characterization of the skin and gelatin Table 4 shows the values of composition and physicochemical parameters determined for the skin and the gelatin obtained. Skin moisture was at the same magnitude observed for corvina (Johnius dussumieri, 62.3%) and shortfin scad (Decapterus macrosoma,

2684 Afr. J. Agric. Res.
Table 4. Physicochemical properties of the skin and gelatin extracted from kumakuma skin.*
Components Skin* Gelatin*
Moisture (%) 58.83 ± 0.57 11.37 ± 0.98
Lipid (%) 14.25 ± 0.22 5.39 ± 0.21
Protein (%) 31.08 ± 0.99 81.67 ± 0.83
Ash (%) 0.37 ± 0.04 0.34 ± 0.06
pH 6.72 ± 0.01 4.50 ± 0.08
Water activity 0.98 ±0.06 0.25 ± 0.01
*3 replicate.
60.4%) (Cheow et al., 2007). For the gelatin, moisture was within the range observed for commercial gelatins (9 to 14%) (Eastoe and Leach, 1977). The fat content in the skins was high (14.25 ± 0.22%) since the fish used had a high fat content. Ribeiro et al. (2013) found 14.5 ± 0.3% fat in Kumakuma muscle. Shahiri et al. (2012) found 13.12 ± 0.20% fat in the skin and 0.31 ± 0.07% in the collagen of rainbow trout (Onchorhynchus mykiss). The fat content of 5.39 ± 0.21% found in the gelatin shows that the treatments prior to the extraction with Ca (OH)2 was efficient in reducing this component. The protein contents in the skin (31.08 ± 0.99%) and gelatin (81.67 ± 0.83%) were similar to those observed in the skin (30.6 ± 0.9%) and gelatin (84.28 ± 5.39%) of Nile tilapia (Rawdkuen et al., 2013). Jamilah et al. (2011) found proteins contents of 31.01 ± 0.48 and 80.02 ± 0.33%, respectively, in the skin and gelatin extracted from the skin of freshwater fish using the liming method. The ash content in the skin was lower than that reported by Bueno et al. (2011) (1.9 ± 0.3%) in tilapia skin. In turn, the ash content of the gelatin was close to that found by Ratnasari et al. (2013) (0.20%) in the gelatin from red tail catfish (Phractocephalus hemioliopterus) extracted with Ca(OH)2 and by Sarbon et al. (2013) for gelatin from chicken skin (0.37%). According to Jones (1977) and Muyonga et al. (2004), the maximum ash content recommended for gelatins is 2.6%. However, Benjakul et al. (2009) indicated that high-quality gelatin must not have over 0.5% ashes. Jongiareonrak et al. (2006) suggested that the high protein content and the lower content of moisture, ashes, and fat in gelatin are determined by the raw material or by the residual chemical products after processing. The low pH of the gelatin obtained (4.5 ± 0.08) is attributed to the extraction process, in which the pH of the gelatin solution was reduced with a strong acid. Cheow et al. (2007) also reported low pH values for the gelatin extracted from corvina (3.35) and shortfin scad (4.87). The low water activity value suggests good gelatin stability regarding microbiological degradation.
Table 5 shows the amino acids profile in Kumakuma skin and gelatin. The imino acids proline (Pro) and hydroxyproline (Hyp), which represented 13.59 and 14.40% of the total amino acids in the skin and gelatin,
were directly correlated with gel strength (Holzer, 1996) since they play a role in the stabilization of the triple helix (Ramachandran, 1988). Actually, the amino acid composition is key for the physical properties of the gelatin. Gelatins with limited imino acid content tend to have lower melting points (Ratnasari, 2013). The values of hydroxyproline in the skin (8.40%) and in the gelatin (9.35%) matched those reported by Nalinanon et al. (2008) of hydroxyproline representing 7 to 10% of the total amino acids. Glycine was the main amino acid in the skin (23.77%) and in the gelatin (24.97%), which matches the results observed by Cho et al. (2004) and Silva et al. (2014), who found, respectively, 27.54% glycine in gelatin from shark cartilage and 30.7% in gelatin from cobia. According to Nagarajan et al. (2012), one third of collagen is made up of glycine. In order to close the triple helix structure, the small glycine molecules are needed to occupy every third position (Te Nijenhuis, 1977). According to Piez and Sherman (1970), the formation and effective stabilization of the triple helix structure in the collagen requires the repetition of the sequence Gly X-Y, in which X and Y can be any amino acid with at least one proline or hydroxyproline in any other triplet. Thus, GLY-PRO-Y, X-GLY-HYP, and GLY-PRO-HYP are important for the stabilization of the collagen structure (Privalov, 1982).
Small amounts of cysteine (0.01%) and methionine (1.77%) were identified in the gelatin, similarly to what was reported by Hou et al. (2009). These amino acids play a crucial role in the formation of disulfide bonds (Foegeding et al., 1996). The presence of cysteine might indicate that the gelatin contained a small amount of protein from the stroma (Duan et al., 2011; Bougatef et al., 2012). Lysine stabilizes the gelatin structure by forming structures between the cross-link chains. The percentage of lysine in the gelatin was 3.02%, a result close to that found by Cho et al. (2004) in gelatin from shark cartilage (2.27%) and from pigs (2.32%).
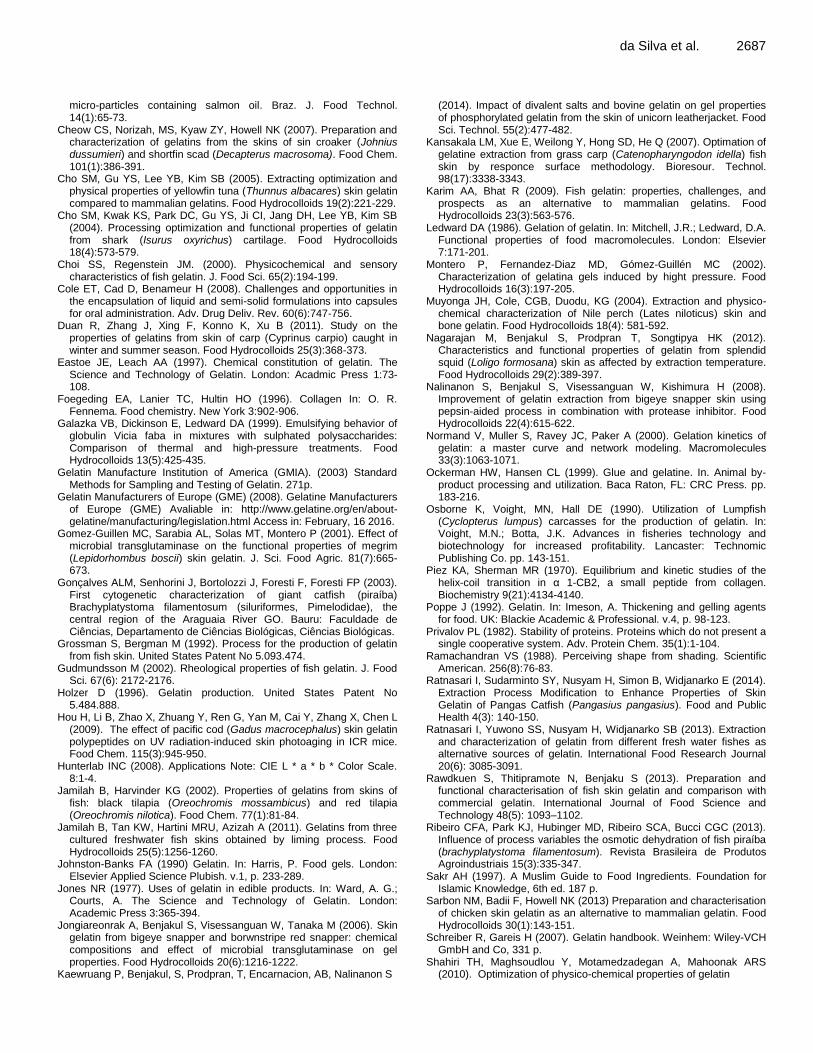
The yield (Table 6) obtained for gelatin from Kumakuma skin pre-treated with Ca (OH)2 was 20.24 ± 0.02%. The results were close to those observed by Ratnasari et al. (2014) (23.12%), who used Ca(OH)2 in pre-treatment. Jamilah et al. (2011), using the extraction process with liming for 14 days, obtained yield of 39.97%.
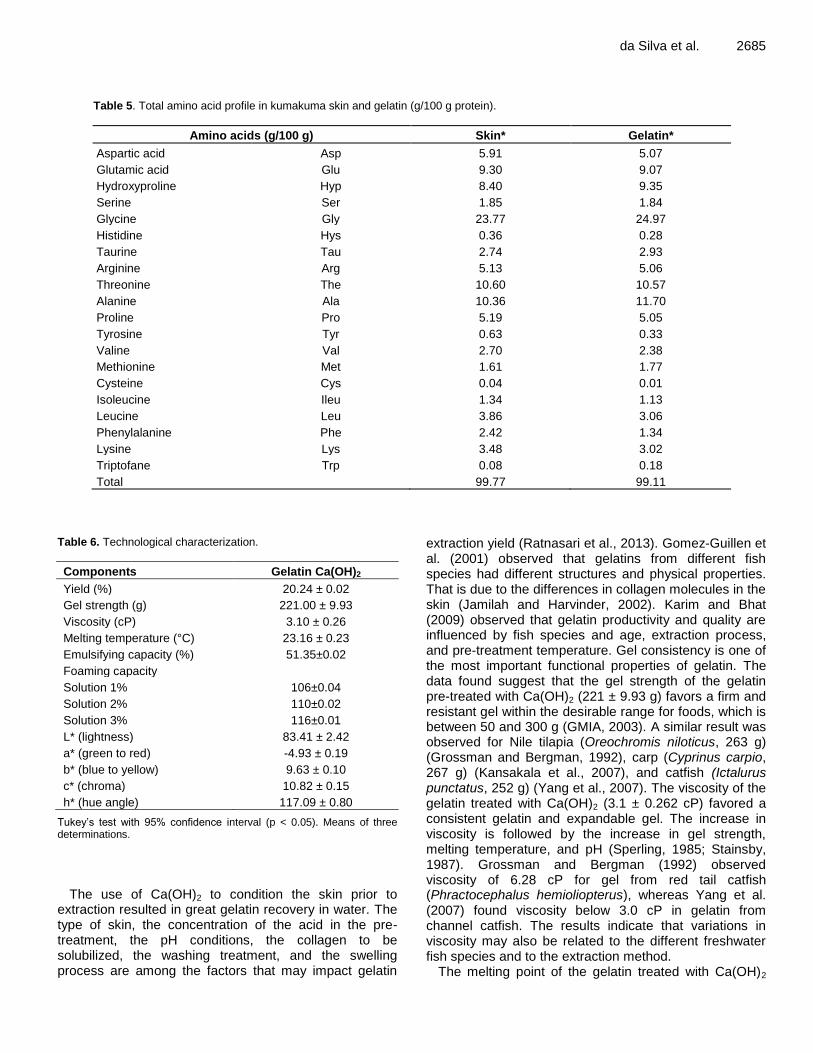
da Silva et al. 2685
Table 5. Total amino acid profile in kumakuma skin and gelatin (g/100 g protein).
Amino acids (g/100 g) Skin* Gelatin*
Aspartic acid Asp 5.91 5.07
Glutamic acid Glu 9.30 9.07
Hydroxyproline Hyp 8.40 9.35
Serine Ser 1.85 1.84
Glycine Gly 23.77 24.97
Histidine Hys 0.36 0.28
Taurine Tau 2.74 2.93
Arginine Arg 5.13 5.06
Threonine The 10.60 10.57
Alanine Ala 10.36 11.70
Proline Pro 5.19 5.05
Tyrosine Tyr 0.63 0.33
Valine Val 2.70 2.38
Methionine Met 1.61 1.77
Cysteine Cys 0.04 0.01
Isoleucine Ileu 1.34 1.13
Leucine Leu 3.86 3.06
Phenylalanine Phe 2.42 1.34
Lysine Lys 3.48 3.02
Triptofane Trp 0.08 0.18
Total 99.77 99.11
Table 6. Technological characterization.
Components Gelatin Ca(OH)2
Yield (%) 20.24 ± 0.02
Gel strength (g) 221.00 ± 9.93
Viscosity (cP) 3.10 ± 0.26
Melting temperature (°C) 23.16 ± 0.23
Emulsifying capacity (%) 51.35±0.02
Foaming capacity
Solution 1% 106±0.04
Solution 2% 110±0.02
Solution 3% 116±0.01
L* (lightness) 83.41 ± 2.42
a* (green to red) -4.93 ± 0.19
b* (blue to yellow) 9.63 ± 0.10
c* (chroma) 10.82 ± 0.15
h* (hue angle) 117.09 ± 0.80
Tukey’s test with 95% confidence interval (p < 0.05). Means of three determinations.
The use of Ca(OH)2 to condition the skin prior to extraction resulted in great gelatin recovery in water. The type of skin, the concentration of the acid in the pre-treatment, the pH conditions, the collagen to be solubilized, the washing treatment, and the swelling process are among the factors that may impact gelatin
extraction yield (Ratnasari et al., 2013). Gomez-Guillen et al. (2001) observed that gelatins from different fish species had different structures and physical properties. That is due to the differences in collagen molecules in the skin (Jamilah and Harvinder, 2002). Karim and Bhat (2009) observed that gelatin productivity and quality are influenced by fish species and age, extraction process, and pre-treatment temperature. Gel consistency is one of the most important functional properties of gelatin. The data found suggest that the gel strength of the gelatin pre-treated with Ca(OH)2 (221 ± 9.93 g) favors a firm and resistant gel within the desirable range for foods, which is between 50 and 300 g (GMIA, 2003). A similar result was observed for Nile tilapia (Oreochromis niloticus, 263 g) (Grossman and Bergman, 1992), carp (Cyprinus carpio, 267 g) (Kansakala et al., 2007), and catfish (Ictalurus punctatus, 252 g) (Yang et al., 2007). The viscosity of the gelatin treated with Ca(OH)2 (3.1 ± 0.262 cP) favored a consistent gelatin and expandable gel. The increase in viscosity is followed by the increase in gel strength, melting temperature, and pH (Sperling, 1985; Stainsby, 1987). Grossman and Bergman (1992) observed viscosity of 6.28 cP for gel from red tail catfish (Phractocephalus hemioliopterus), whereas Yang et al. (2007) found viscosity below 3.0 cP in gelatin from channel catfish. The results indicate that variations in viscosity may also be related to the different freshwater fish species and to the extraction method.
The melting point of the gelatin treated with Ca(OH)2

2686 Afr. J. Agric. Res.
Figure 4. Electron micrographs of kumakuma gelatin at 50 (A) and 200x (B) magnification.
was 23.16 ± 0.23, which was directly related to the Amino acid content in the original collagen molecule. Melting point in this range results in quick-dissolving gelatin, which defines the possible applications in the food industry. Cho et al. (2005) observed melting points of 24.3°C for gelatin from tuna (Thunnus albacares), 33.8°C for gelatin from bovines, and 36.5°C for gelatin from pigs. The gelatin had emulsifying power, a parameter that is dependent on the level of exposition of hydrophobic residues in the gelatin’s interior (Shyni et al., 2014). The content of the hydrophobic amino acid tyrosine (Table 5) in gelatin from Kumakuma skin was 0.33%. Shyni et al. (2014) mentioned values of 0.25 and 0.26% in gelatin from rohu and tuna skin, respectively. The amount of tyrosine is likely responsible for the high emulsifying power of the gelatins. The solutions of the gelatins obtained for the same protein concentration had foaming capacity, which increased with higher protein concentrations in all gelatin solutions. The hydrophobic surfaces of the peptide chain are responsible for the gelatin’s emulsifying and foaming properties (Galazka et al., 1999; Cole, 2008). The gelatin extracted through the liming method had a shiny whitish color. Jamilah et al. (2011), when performing extraction using the liming method, found values of L* were 79.45 ± 1.10, a* were -0.71± 0.09, and b* were 5.75 ± 0.14 in gelatin from striped catfish skin. The c* value far from zero means clear color. The h° defines the hue itself, and when positive, indicates a tendency for clear color (Cheow et al., 2007; Hunterlab Inc, 2008). Such values correspond to the gelatin color, however, this does not impact other functional properties. Figure 4 shows the electromicrographies of gelatin from Kumakuma skin obtained through scanning electron microscopy (MEV). The gelatin’s microstructure had even thin threads and small gaps throughout. Overall, the arrangement and combination of protein molecules in the gel matrix directly contributes to the gelatin’s gel strength since the microstructure of the gel tissue is related with the
gelatin’s properties (Yang et al., 2008; Benjakul, 2009). Gels with fewer inter-chain bonds or thinner chains may be more easily degraded by applying force, which results in lower gel strength (Kaewruang et al., 2014). Conclusion According to the model proposed, the optimal extraction conditions were established at 10 days of pre-treatment and extraction temperature of 50°C. The use of high temperatures was desirable for obtaining higher yields, but caused a decrease in the gelatin’s gel strength. Glycine was the amino acid found in the highest amount both in the skin and gelatin. Gelatin had expandable and consistent gel characteristic and its microstructure showed even threads with small gaps throughout, which is favorable for the food industry. Conflict of Interests The authors have not declared any conflict of interests. REFERENCES Association of Official Analytical Chemists (AOAC) (2002). Official
Methods of Analysis of the Association of Official Analytical Chemists (17th Ed.). Washington: AOAC International.
Benjakul S, Oungbho K, Visessanguan W, Thiansilakul Y, Roytrakul S (2009). Characteristic of gelatin from the skins of bigeye snapper, Priacanthus tayenus and Priachanthus macracantus. Food Chem. 116(2):445-451.
Binsi PK, Dileep AO, Badii F, Howell, NK (2009). Rheological and functional properties of gelatin from the skin of Bigeye snapper (Priacanthus hamrur) fish: Influence of gelatin on the gel-forming ability of fish mince. Food Hydrocolloids 23(1):132-145.
Bougatef A, Balti R, Sila A, Nasri R, Graia G, Nasri M (2012). Recovery and physicochemical properties of smooth hound (Mustelus mustelus) skin gelatin. Int. J. Food Sci. Technol. 48(2):248-254.
Bueno CM, Alvim ID, Koberstein TCRD, Portela MC, Grosso C (2011). Production of tilapia skin gelatin and its use in the production of
micro-particles containing salmon oil. Braz. J. Food Technol. 14(1):65-73.
Cheow CS, Norizah, MS, Kyaw ZY, Howell NK (2007). Preparation and characterization of gelatins from the skins of sin croaker (Johnius dussumieri) and shortfin scad (Decapterus macrosoma). Food Chem. 101(1):386-391.
Cho SM, Gu YS, Lee YB, Kim SB (2005). Extracting optimization and physical properties of yellowfin tuna (Thunnus albacares) skin gelatin compared to mammalian gelatins. Food Hydrocolloids 19(2):221-229.
Cho SM, Kwak KS, Park DC, Gu YS, Ji CI, Jang DH, Lee YB, Kim SB (2004). Processing optimization and functional properties of gelatin from shark (Isurus oxyrichus) cartilage. Food Hydrocolloids 18(4):573-579.
Choi SS, Regenstein JM. (2000). Physicochemical and sensory characteristics of fish gelatin. J. Food Sci. 65(2):194-199.
Cole ET, Cad D, Benameur H (2008). Challenges and opportunities in the encapsulation of liquid and semi-solid formulations into capsules for oral administration. Adv. Drug Deliv. Rev. 60(6):747-756.
Duan R, Zhang J, Xing F, Konno K, Xu B (2011). Study on the properties of gelatins from skin of carp (Cyprinus carpio) caught in winter and summer season. Food Hydrocolloids 25(3):368-373.
Eastoe JE, Leach AA (1997). Chemical constitution of gelatin. The Science and Technology of Gelatin. London: Acadmic Press 1:73-108.
Foegeding EA, Lanier TC, Hultin HO (1996). Collagen In: O. R. Fennema. Food chemistry. New York 3:902-906.
Galazka VB, Dickinson E, Ledward DA (1999). Emulsifying behavior of globulin Vicia faba in mixtures with sulphated polysaccharides: Comparison of thermal and high-pressure treatments. Food Hydrocolloids 13(5):425-435.
Gelatin Manufacture Institution of America (GMIA). (2003) Standard Methods for Sampling and Testing of Gelatin. 271p.
Gelatin Manufacturers of Europe (GME) (2008). Gelatine Manufacturers of Europe (GME) Avaliable in: http://www.gelatine.org/en/about-gelatine/manufacturing/legislation.html Access in: February, 16 2016.
Gomez-Guillen MC, Sarabia AL, Solas MT, Montero P (2001). Effect of microbial transglutaminase on the functional properties of megrim (Lepidorhombus boscii) skin gelatin. J. Sci. Food Agric. 81(7):665-673.
Gonçalves ALM, Senhorini J, Bortolozzi J, Foresti F, Foresti FP (2003). First cytogenetic characterization of giant catfish (piraíba) Brachyplatystoma filamentosum (siluriformes, Pimelodidae), the central region of the Araguaia River GO. Bauru: Faculdade de Ciências, Departamento de Ciências Biológicas, Ciências Biológicas.
Grossman S, Bergman M (1992). Process for the production of gelatin from fish skin. United States Patent No 5.093.474.
Gudmundsson M (2002). Rheological properties of fish gelatin. J. Food Sci. 67(6): 2172-2176.
Holzer D (1996). Gelatin production. United States Patent No 5.484.888.
Hou H, Li B, Zhao X, Zhuang Y, Ren G, Yan M, Cai Y, Zhang X, Chen L (2009). The effect of pacific cod (Gadus macrocephalus) skin gelatin polypeptides on UV radiation-induced skin photoaging in ICR mice. Food Chem. 115(3):945-950.
Hunterlab INC (2008). Applications Note: CIE L * a * b * Color Scale. 8:1-4.
Jamilah B, Harvinder KG (2002). Properties of gelatins from skins of fish: black tilapia (Oreochromis mossambicus) and red tilapia (Oreochromis nilotica). Food Chem. 77(1):81-84.
Jamilah B, Tan KW, Hartini MRU, Azizah A (2011). Gelatins from three cultured freshwater fish skins obtained by liming process. Food Hydrocolloids 25(5):1256-1260.
Johnston-Banks FA (1990) Gelatin. In: Harris, P. Food gels. London: Elsevier Applied Science Plubish. v.1, p. 233-289.
Jones NR (1977). Uses of gelatin in edible products. In: Ward, A. G.; Courts, A. The Science and Technology of Gelatin. London: Academic Press 3:365-394.
Jongiareonrak A, Benjakul S, Visessanguan W, Tanaka M (2006). Skin gelatin from bigeye snapper and borwnstripe red snapper: chemical compositions and effect of microbial transglutaminase on gel properties. Food Hydrocolloids 20(6):1216-1222.
Kaewruang P, Benjakul, S, Prodpran, T, Encarnacion, AB, Nalinanon S
da Silva et al. 2687
(2014). Impact of divalent salts and bovine gelatin on gel properties of phosphorylated gelatin from the skin of unicorn leatherjacket. Food Sci. Technol. 55(2):477-482.
Kansakala LM, Xue E, Weilong Y, Hong SD, He Q (2007). Optimation of gelatine extraction from grass carp (Catenopharyngodon idella) fish skin by responce surface methodology. Bioresour. Technol. 98(17):3338-3343.
Karim AA, Bhat R (2009). Fish gelatin: properties, challenges, and prospects as an alternative to mammalian gelatins. Food Hydrocolloids 23(3):563-576.
Ledward DA (1986). Gelation of gelatin. In: Mitchell, J.R.; Ledward, D.A. Functional properties of food macromolecules. London: Elsevier 7:171-201.
Montero P, Fernandez-Diaz MD, Gómez-Guillén MC (2002). Characterization of gelatina gels induced by hight pressure. Food Hydrocolloids 16(3):197-205.
Muyonga JH, Cole, CGB, Duodu, KG (2004). Extraction and physico-chemical characterization of Nile perch (Lates niloticus) skin and bone gelatin. Food Hydrocolloids 18(4): 581-592.
Nagarajan M, Benjakul S, Prodpran T, Songtipya HK (2012). Characteristics and functional properties of gelatin from splendid squid (Loligo formosana) skin as affected by extraction temperature. Food Hydrocolloids 29(2):389-397.
Nalinanon S, Benjakul S, Visessanguan W, Kishimura H (2008). Improvement of gelatin extraction from bigeye snapper skin using pepsin-aided process in combination with protease inhibitor. Food Hydrocolloids 22(4):615-622.
Normand V, Muller S, Ravey JC, Paker A (2000). Gelation kinetics of gelatin: a master curve and network modeling. Macromolecules 33(3):1063-1071.
Ockerman HW, Hansen CL (1999). Glue and gelatine. In. Animal by-product processing and utilization. Baca Raton, FL: CRC Press. pp. 183-216.
Osborne K, Voight, MN, Hall DE (1990). Utilization of Lumpfish (Cyclopterus lumpus) carcasses for the production of gelatin. In: Voight, M.N.; Botta, J.K. Advances in fisheries technology and biotechnology for increased profitability. Lancaster: Technomic Publishing Co. pp. 143-151.
Piez KA, Sherman MR (1970). Equilibrium and kinetic studies of the helix-coil transition in α 1-CB2, a small peptide from collagen. Biochemistry 9(21):4134-4140.
Poppe J (1992). Gelatin. In: Imeson, A. Thickening and gelling agents for food. UK: Blackie Academic & Professional. v.4, p. 98-123.
Privalov PL (1982). Stability of proteins. Proteins which do not present a single cooperative system. Adv. Protein Chem. 35(1):1-104.
Ramachandran VS (1988). Perceiving shape from shading. Scientific American. 256(8):76-83.
Ratnasari I, Sudarminto SY, Nusyam H, Simon B, Widjanarko E (2014). Extraction Process Modification to Enhance Properties of Skin Gelatin of Pangas Catfish (Pangasius pangasius). Food and Public Health 4(3): 140-150.
Ratnasari I, Yuwono SS, Nusyam H, Widjanarko SB (2013). Extraction and characterization of gelatin from different fresh water fishes as alternative sources of gelatin. International Food Research Journal 20(6): 3085-3091.
Rawdkuen S, Thitipramote N, Benjaku S (2013). Preparation and functional characterisation of fish skin gelatin and comparison with commercial gelatin. International Journal of Food Science and Technology 48(5): 1093–1102.
Ribeiro CFA, Park KJ, Hubinger MD, Ribeiro SCA, Bucci CGC (2013). Influence of process variables the osmotic dehydration of fish piraíba (brachyplatystoma filamentosum). Revista Brasileira de Produtos Agroindustriais 15(3):335-347.
Sakr AH (1997). A Muslim Guide to Food Ingredients. Foundation for Islamic Knowledge, 6th ed. 187 p.
Sarbon NM, Badii F, Howell NK (2013) Preparation and characterisation of chicken skin gelatin as an alternative to mammalian gelatin. Food Hydrocolloids 30(1):143-151.
Schreiber R, Gareis H (2007). Gelatin handbook. Weinhem: Wiley-VCH GmbH and Co, 331 p.
Shahiri TH, Maghsoudlou Y, Motamedzadegan A, Mahoonak ARS (2010). Optimization of physico-chemical properties of gelatin
2688 Afr. J. Agric. Res.
extracted from fish skin of rainbow trout (Onchorhynchus mykiss). Bioresource Technol. 101(15): 6207-6214.
Shahiri TH, Maghsoudlou Y, Motamedzadegan A, Sadeghi MAR, Rostamzad H (2012). Study on some properties of acid-soluble collagens isolated from fish skin and bones of rainbow trout (Onchorhynchus mykiss). Intl. Food Res. J. 19(1):251-257.
Shyni K, Hema GS, Ninan G, Mathew S, Joshy CG, Lakshmanan PT (2014) Isolation and characterization of gelatin from the skins of skipjack tuna (Katsuwonus pelamis), dog shark (Scoliodon sorrakowah), and rohu (Labeo rohita). Food Hydrocolloids 39(1):68-76.
Silva R, Bandeira SF, Pinto LAA (2014). Characteristics and chemical composition of skins gelatin from cobia (Rachycentron canadum). Food Sci. Technol. 57(2):580-585.
Sperling LH (1985). Introduction of physical polymer science. John Wiley and Sons. Inc New York. 88 p.
Stainsby G (1987). Gelatin gels. In: Pearson, A.M.; Dutson, T.R.; Baily, A.J. Collagen as Food: Advances in Meat Research, New York: Van Nostrand Reinhold. 4:209-222.
Stanley FD (2002). Improved alkaline process for preparing type B fish gelatin. World Intellectual Property Organization. Patent No 2002094959.
Te Nijenhuis K (1977). Gelatin. Adv. Polymer Sci. 130(1):1-267.
White JA, Hart RJ, Kry JC (1986). An evaluabtion of the waters pico-tag
system for the amino acid analysis of food materials. J. Automatic Chem. 8(4):170-177.
Wong DWS (1994). Mechanism and theory in food chemistry. New York: Van Nostrand Reinhold, 432 p.
Yang H, Wang Y, Jiang M, Oh, JH, Herring J. Zhou P. (2007). Optimization of the extraction and subsequent physical properties of channel catfish (Ictalurus punctatus) skin gelatin. J. Food Sci. 72(4):188-195.
Yang H, Wang Y, Zhou P, Regeistein JM (2008). Effects of alkaline and acid pre-treatment on the physical properties and nanostructures of the gelatin from channel catfish skins. Food Hydrocolloids 22(8):1541-1550.

Vol. 11(30), pp. 2689-2696, 28 July, 2016
DOI: 10.5897/AJAR2015.10608
Article Number: C450D0A59735
ISSN 1991-637X
Copyright ©2016
Author(s) retain the copyright of this article
http://www.academicjournals.org/AJAR
African Journal of Agricultural Research
Full Length Research Paper
Soil porosity and density in sugarcane cultivation under different tillage systems
Everton Martins Arruda1*, Risely Ferraz de Almeida2, Luis Augusto da Silva Domingues3, Antonio Carlos da Silva Junior2, Emmerson Rodrigues de Moraes4, Leonardo Rodrigues
Barros1, Jéssika Lorrine de Oliveira Sousa1 and Regina Maria Quintão Lana4
1Federal University of Goiás, Agronomy School, Zip Code: 74001-970, Goiânia, Goiás, Brazil.
2Agrarian and Veterinarian Faculty, State University of São Paulo, Zip Code: 18610-307, Jaboticabal, São Paulo Brazil. 3Federal Institute of Education, Science and Technology, Sobradinho Farm, Zip Code: 38400-974, Uberlândia, Minas
Gerais, Brazil. 4Federal University of Uberlândia, Institute of Agricultural Sciences, Zip code: 38400-902 Uberlândia,
Minas Gerais, Brazil.
Received 4 November, 2015; Accepted 17 February, 2016
Monitoring the physical quality of soils under intensive sugarcane production requires sustainable forms of use and soil management. Thus, the objective of this research was to evaluate the influence of soil tillage systems on soil porosity and density in ratoon-cane cultivation, in addition to possible changes which may occur during the season. The experiment was carried out in the state of Goiás, Brazil. The Experimental design was randomized blocks with four replications. The following tillage systems were evaluated: 1. Moldboard plow + Harrow; 2. Subsoiler + Harrow; 3. Direct planting; 4. Subsoiler + Direct planting; 5. Stubble thrasher + Subsoiler; 6. Stubble thrasher + Harrow + Moldboard plow + Harrow, in soil layers 0-0.2; 0.2-0.4 and 0.4-0.6 m. Regardless of the tillage system used during sugarcane cultivation, the ratoon crop showed reduced total soil pore volume and macroporosity, as well as increased soil density in the 0.4-0.6 m layer. However, the use of direct planting resulted in +higher soil macroporosity values in the 0-0.2 m layer and yields similar to conventional systems which use the moldboard plow. Therefore, it is recommended for producers to adopt conservation soil tillage systems, combining productivity and soil quality. Key words: Soil management, ratoon-cane, soil compaction, conservation system.
INTRODUCTION The current sugarcane crop management techniques involve vigorous soil disturbance at planting, by using plows, harrows and subsoilers (Centurion et al., 2007).
Thus, in recent years, soil preparation under sugarcane has been questioned, searching for an alternative to adopt a conservation system that prioritizes minimum
*Corresponding author. E-mail: [email protected].
Author(s) agree that this article remain permanently open access under the terms of the Creative Commons Attribution
License 4.0 International License

2690 Afr. J. Agric. Res. tillage (Arruda et al., 2015).
Among the management components, perhaps the initial soil preparation influences soil physical quality indicators the most, because it directly acts on the structure (Hamza and Anderson, 2005), influencing the aggregation processes (Choudhurya et al., 2014), compression (Cunha et al., 2009; Bangita and Rao, 2012), soil porosity and density (Tormena et al., 2004; Domingues, 2012) in addition to pores size and water availability to plants (Machado et al., 2008). Therefore, understanding and quantification of the impact of these factors on soil physical properties are important to establish sustainable farming systems (Tormena et al., 2004).
The longevity of the sugarcane production cycle is largely dependent on mechanization. Some producers conduct up to 10 cuts in one area while maintaining satisfactory yields (Domingues, 2012). However, negative effects on sugarcane yield in terms of use and soil management are difficult to measure, especially to isolate the soil compaction factor (Mazurana et al., 2011). In addition to that, there is little research work on sugarcane reporting physical changes over the years regarding ratoon crops.
The successive ratoon cultivation occurring in the same production area (monoculture) and soil disturbance at the time of field reform have prevented the implementation of no-tillage system in sugarcane. Therefore, researchers should develop new minimum tillage systems or even adopt conventional systems with little impact on the environment, with emphasis on soil quality.
The long-term effect of soil preparation systems is not well documented, especially when such preparation involves soil conservation tillage systems and changes in sugarcane ratoon. According to Tormena et al. (2004) understanding and quantifying the impacts of different soil tillage systems on physical quality, such as influences on sugarcane productivity, are fundamental for the development of sustainable agricultural systems.
Thus, the objective of this research was to evaluate the influence of soil tillage systems on soil porosity and density in ratoon-cane cultivation, in addition to possible changes during the plant-cane season. MATERIALS AND METHODS
The research was conducted during 2009-2010 and 2011-2012 seasons of plant-cane and ratoon-cane respectively, in an experimental area of the Jalles Machado Mill, in the municipality of Goianésia, the state of Goiás, Brazil, at coordinates 15°10'02" south latitude and 49°15'12" west longitude. The climate is classified as Aw type (megathermal) or tropical savannah, with dry winters and rainy summers, according to the Köppen classification. The altitude of this area is 640 m and the average annual rainfall is 1600 mm (Figure 1). The soil was classified as Dystrophic Yellow Red Latosol (Embrapa, 2013). The sieve analysis of the soil showed 432, 450 and 452 g kg-1 of clay in the 0-0.2; 0.2-0.4 and 0.4-0.6 m layers, respectively (Embrapa, 2009). Chemical analysis
of the soil under plant-cane and the ratoon crop can be seen in Table 1. Historically, the area was intended for grain production (soybean, maize and sorghum) until 2003, when sugarcane was planted. The experiment was established during the reform of the plantation at soil preparation time, before planting for the 2009-2010 seasons.
The experimental units were 19.5 m wide x 50 m long, made up of 13 lines of sugarcane spaced at 1.5 m apart. The total area of the plots was 975 m2. The useful area had 5 central lines and was 10 m long, totaling 300 m2. The experimental design was randomized blocks with four replications. Assessments during the ratoon crop (2011-2012) were performed with factorial 6 x 3 in split plots (plot factors were the soil tillage systems and subplot factors were the soil layers). However, evaluations comparing ratoon-cane season with the plant-cane season were conducted with a factorial 6 x 2 in split plots (plot factors were the soil tillage systems and subplot factors were the harvest season), in isolation for each layer of soil (0-0.2; 0.2-0.4 and 0.4-0.6 m). Treatments consisted of tillage systems used in soil preparation as following: 1. Moldboard plow + harrow (MP+H); 2. Subsoiler + harrow (S+H); 3. Desiccation + Direct planting (DP); 4. Subsoiler + Direct planting (S+DP); 5. Stubble thrasher + Subsoiler (ST+S); 6. Stubble thrasher + harrow + Moldboard plow+ harrow (HMPH).
At the beginning, soil acidity correction was performed using dolomitic limestone at a dose of 1.5 t ha-1. Gypsum was applied on the soil surface at a dose of 800 kg ha-1. Manual planting of sugarcane was performed with furrowing (average depth of 0.35 to 0.4 m), placing 18 buds per m-2 of the CTC 02 variety. Fertilization with 250 kg ha-1 of monoammonium phosphate, equivalent to 120 kg ha-1 of P2O5 and 27 kg ha-1of nitrogen (N-NH4
+), was done at planting. Cover fertilization of the crop was done in September 2009 with liquid formulation N-P-K of 05-00-13 + 0.3 % zinc + 0.3 % Boron. The fertilization for ratoon-cane (2010-2011 and 2011-2012 crop seasons) was performed according to the requirements of the plant and estimated productivity by surface application of 90 kg ha-1 N, 30 kg ha-1 P2O5 and 110 kg ha-1 of K2O in both seasons.
The evaluations were performed after the plant-cane (2009-2010) and ratoon-cane (2011-2012) were harvested, by collecting undisturbed soil samples from the layers 0-0.2; 0.2-0.4 and 0.4-0.6 m. Uhland-type sampler and a Koppecky metal ring with an internal volume defined to determine the total porosity, macroporosity, microporosity and soil density were used. All determinations were carried out according to the methodology of Embrapa (1997).
The sugarcane harvest was done manually and without burning, considering a useful area with five central lines and length of 40 m of the parcel, totaling 300 m2. Subsequently, the plants were weighed (kg) using a scale attached to a stem loader. Later, the data were extrapolated to a hectare (average productivity in tons of stems per hectare).
Statistical analysis
Statistical analysis was performed by analysis of variance (F test), and when significant (P<0.05), comparisons of means were made using the Tukey test (Ferreira, 2008).
RESULTS AND DISCUSSION Porosity and density of soil under ratoon-cane Soil macroporosity values showed statistical difference (P<0.05) between tillage systems and layers (Table 2). The highest soil macroporosity values were observed in

Arruda et al. 2691
Figure 1. Geographical location of the area that was conducted the survey, Brazil.
Table 1. Chemical analysis of soil from the experimental area of the Jalles Machado Mill, Goianésia, state of Goiás, Brazil, during the 2009-2010 and 2011-2012, under plant-cane and ratoon-cane, respectively.
pH Ca Mg P K Al H + Al V MOS
cmolc dm−3
mg dm−3
cmolc dm−3
% g kg−1
Plant-cane
0 – 0.2 m
4.01 0.45 0.29 1.4 78.0 1.6 8.25 10.2 19.2
0.2 – 0.4 m
3.97 0.23 0.17 0.7 19.2 2.0 8.70 4.8 10.4
0.4 – 0.6 m
3.24 0.17 0.12 0.4 18.7 2.4 9.23 3.9 10.2
Ratoon-cane
0 – 0.2 m
6.02 1.40 0.78 3.26 52.0 0.04 2.22 50.7 23.8
0.2 – 0.4 m
5.21 2.30 0.32 2.24 24.7 0.24 2.70 49.8 16.7
0.4 – 0.6 m
5.21 0.30 0.24 0.48 19.1 0.17 2.30 21.5 13.9
pH in H2O; Ca+2
, Mg+2
and Al+3
in KCl (1 mol L-1); P and K
+ in HCl (0.05 mol L
-1) + H2SO4 (0.0125 mol L
-1); H + Al in Buffer
(SMP at pH 7.0); Base saturation (V); O.M: Organic Matter (Colorimetric Method). Embrapa (2009). The Ca+2
, Mg+2
and Al+3
in cmolcdm
−3; P and K
+ in mg dm
−3; H+Al in cmolcdm
−3.
the 0-0.2 m layer in Direct planting (DP), Subsoiler + direct planting (S+DP) and Stubble thrasher + harrow + moldboard plow + harrow (HMPH) systems.
The highest soil macroporosity in minimum tillage systems (DP and S+DP) may occur due to higher contribution of organic material, which these conservation

2692 Afr. J. Agric. Res.
Table 2. Total volume of pores, macroporosity, microporosity and soil density in ratoon-cane under different tillage systems in the cerrado region, in Goianésia – the State of Goiás, Brazil, crop 2011-2012.
Layers (m) Soil preparation systems
MP+H S+H DP S+DP ST+S HMPH
Total volume of pores (m3 m
-3)
0.0 – 0.2 0.45 0.44 0.47 0.47 0.44 0.49
0.2 – 0.4 0.49 0.46 0.43 0.44 0.45 0.46
0.4 – 0.6 0.46 0.47 0.43 0.47 0.46 0.45
Macroporosity (m3 m
-3)
0.0 – 0.2 0.08bA
0.09bA
0.14aA
0.12abA
0.09bA
0.12abA
0.2 – 0.4 0.09aA
0.11aA
0.09aB
0.10aA
0.11aA
0.11A
0.4 – 0.6 0.08aA
0.09aA
0.09aB
0.10aA
0.10aA
0.09A
Microporosity (m3 m
-3)
0.0 – 0.2 0.36 0.35 0.34 0.35 0.35 0.38
0.2 – 0.4 0.39 0.34 0.34 0.33 0.34 0.34
0.4 – 0.6 0.38 0.37 0.35 0.38 0.35 0.36
Soil density (g cm-3
)
0.0 – 0.2 1.29 1.32 1.30 1.29 1.40 1.25
0.2 – 0.4 1.29 1.38 1.40 1.42 1.42 1.39
0.4 – 0.6 1.36 1.30 1.38 1.31 1.38 1.43
MP+H: Moldboard plow + harrow; S+H: subsoiler + harrow; DP: direct planting; S+DP: subsoiler + direct planting; ST+S: stubble thrasher + subsoiler; HMPH: stubble thrasher + harrow + moldboard plow + harrow. Means followed by different letters in the upper column (compare depths within treatments) and lower in line (compare treatments) differ by Tukey test (P<0.05).
systems provide (Arruda et al., 2015), and also due to high sugarcane root accumulation in the 0-0.2 m layer (Blackburn, 1984), especially in ratoon (Faroni and Trivelin, 2006) which favors the formation of macropores (Mazurana et al., 2011). The root system residue of sugarcane from the previous production cycle and the continuous root renewal process among the ratoons of the current cycle, through the decomposition of secondary roots, was expected to promote the emergence of new pores (biopores).
Similar results were found by Paulino et al. (2004) who, when researching soil tillage systems in ratoon, found higher soil macroporosity values in minimum tillage. Similar results were also found by Camilotti et al. (2005), studying conventional tillage and no-tillage, including the subsoil, but statistical difference in soil macroporosity was not identified.
The HMPH system also showed high soil macroporosity levels, being statistically similar to DP and S+DP. Tormena et al. (2004) in a study of dystrophic red Latosol detected increased soil macroporosity values in areas cultivated under conventional systems (moldboard plow and light harrow), compared with those cultivated under conservation system (direct planting) and minimum tillage (scarification and light harrow).
Only the DP system showed statistical difference (P<0.05) among soil layers where 0-0.2 m showed higher soil macroporosity values in relation to the 0.2-0.4 and 0.4-0.6 m layers. This fact can be attributed to soil disturbance in conservation systems in the surface layers. The lack of statistical difference (P>0.05) in soil macroporosity for conventional systems probably occurred via the action of agricultural implements in the deeper soil layers, homogenizing the soil profile, which usually does not happen in conservation tillage systems (DP). The soil preparation system with moldboard plow + harrow (MP+H) showed low soil macroporosity values (close to 0.08 m
3 m
-3), values below this limit are
considered critical, signaling soil compaction process. The minimum amount of pore space occupied by air should be 0.10 m
3 m
-3 (Dexter, 1988; Tormena et al.,
2004), which still allows for normal sugarcane root system development (Vomocil and Flocker, 1961) and that of most crops (Argenton et al., 2005). Other tillage systems had average values over 0.10 m
3 m
-3, and this
indicates that the aeration and water availability conditions were adequate for the sugarcane development.
The microporosity values and soil density were not

Arruda et al. 2693
Figure 2. Total volume of pores in soil (m3 m-3) layers under plant-cane and ratoon-cane in the Brazilian Cerrado region, in 2010 and 2012 respectively. Means followed by lower case letters differ among themselves between growing seasons, by Tukey test (P<0.05).
statistically different (P>0.05) between soil tillage systems and soil layers (Table 2). Similar results were found by Centurion et al. (2007) and Cunha et al. (2009), respectively.
The average soil density values were found to be 1.32 g cm
-3. According to Argenton et al. (2005), the average
values considered critical for clay soils are 1.30 g dm-3
. Displaying said textured soils from 200 to 550 g kg
-1 clay
can reach the critical density of 1.55 g cm-3
(Reinert et al., 2001) and texture soils of about 480 g kg
-1 can reach
1.36 and 1.64 g cm-3
(Silva et al., 2008). The performance of sugar cane roots may be damaged as the values exceed 1.20 g cm
-3 (Segato et al., 2006).
Porosity and density of soil under ratoon-cane in relation to plant-cane Significant differences were found between the total pore volume, macroporosity and soil density of ratoon-cane’s growing seasons and plant-cane cultivation, and this difference was only found in the 0.4-0.6 m layer of soil (P<0.05). However, there were no significant differences between tillage systems (P>0.05).
The total volume of pores in soil under the ratoon-cane crop decreased by 7% (0.45 m m
-3) in comparison to the
previous plant-cane crop (0.48 m m-3
) in the 0.4 to 0.6 m soil layer (Figure 2). Soil macroporosity under ratoon-cane showed a reduction of 18% (0.09 m
-3) when
compared to the plant-cane crop (0.12 m-3
) in 0.4 to
0.6 m soil layer (Figure 3). Centurion et al. (2007), in their plant-cane cultivation
research, observed reduction in total porosity and soil macroporosity only in the fourth year of ratoon crop. The authors did not find any difference between plant-cane and second ratoon-cane crop, which may be due to the short cultivation time of sugarcane. The difference between plant-cane and the fourth ratoon-cane season probably occurred because of heavy traffic of agricultural machinery and implements on the sugarcane plantation. Camillotti et al. (2005), when evaluating the effect of soil tillage systems over time, also observed reduced soil macroporosity after the fourth year of sugarcane cultivation in the subsurface layers, regardless of the soil preparation system studied (P>0.05).
An increase of 8.8% in the mean of soil density wasobserved under the ratoon-cane crop (1.36 g cm
-3)
when compared to that of the plant-cane crop which was 1.24 g cm
-3 in the 0.4-0.6 m soil layer (Figure 4). Soil
density tends to increase with the greater depths of the soil profile, which is probably due to reduced presence of organic matter, aggregation and amount of roots, in addition to compression caused by the soil layers above (Reinert and Reichert, 2006).
The results of soil density of this research agree with those of Centurion et al. (2007), who observed increases in soil density values in the second ratoon-cane season in relation to the plant-cane season. Camilotti et al. (2005) observed increased soil density after the fourth sugarcane harvest in the 0.2-0.5 m soil layer, regardless

2694 Afr. J. Agric. Res.
Figure 3. Macroporosity in soil (m3 m-3) layers under plant-cane and ratoon-cane in the Brazilian Cerrado region, in 2010 and 2012 respectively. Means followed by lower case letters differ among themselves between growing seasons, by Tukey test (P<0.05).
Figure 4. Density in soil (g cm-3) layers under plant-cane and ratoon-cane in the Brazilian Cerrado region, in 2010 and 2012 respectively. Means followed by lower case letters differ among themselves between growing seasons, by Tukey test (P<0.05).
of soil tillage system used. Soil microporosity values were not statistically different (P>0.05) in the assessments of soil layers (Figure 5). Similar results were obtained by Tormena et al. (2004) and Centurion et al. (2007). Soil
microporosity is strongly influenced by texture and organic carbon content and is little influenced by increased soil density caused by traffic of agricultural machinery and equipment (Araújo et al., 2004).

Arruda et al. 2695
Figure 5. Microporosity in soil (m3 m-3) layers under plant-cane and ratoon-cane in the Brazilian Cerrado region, in 2010 and 2012 respectively. Means followed by lower case letters differ between themselves among growing seasons, by Tukey test (P<0.05).
Table 3. Productivity of sugarcane culms (Mg ha-1) during plant-cane and ratoon-cane production seasons under different tillage systems in the Brazilian cerrado region.
Growing
Season
Tillage systems
MP+H S+H DP S+DP ST+S HMPH
Plant-cane 104.8aA
94.4abA
98.9abA
93.6bA
93.5bA
105.2aA
Ratoon-cane 65.7aB
54.9bB
58.7abB
55.2bB
59.8abB
65.9aB
MP+H: Moldboard plow + Harrow; S+H: Subsoiler + Harrow; DP: Direct planting; S+DP: Subsoiler + Direct planting; ST+S: Stubble thrasher + Subsoiler; HMPH: Stubble thrasher + Harrow + Moldboard plow + Harrow. Means followed by different uppercase letters in the column (compare growing seasons within the same treatment) and lowercase in line (compare tillage systems) differ by Tukey test (P<0.05).
Yield of culms in plant-cane and ratoon-cane The productivity of sugarcane stalks (Mg ha
-1) showed a
significant interaction between tillage systems and crop seasons (P<0.05). The plant-cane season showed higher yields with MP+H and HMPH tillage systems, but not statistically different from S+H and DP. The ratoon-cane season showed that the highest yields continued to prevail with MP+H and HMPH tillage systems, but statistically did not differ from ST+S and DP (Table 3).
The fact that the conservation system (DP) presented productivity statistically similar to conventional systems (MP+H and HMPH) for both plant-cane and ratoon-cane is a positive sign for the sugarcane production due to low production costs with: energy (diesel oil), manual labor,
depreciation of agricultural machinery, among others (Arruda et al., 2015). The advantages of DP should also be pointed out regarding soil physical quality, as with the higher macroporosity values verified under ratoon-cane crop (Table 2).
During the plant-cane season, the S+DP and ST+S systems presented lower productivity compared to HMPH system. During the ratoon-cane season the S+DP and S+H systems produced lower yields compared with the HMPH system. The fact that the minimum tillage system (S+DP) showed lower plant-cane and ratoon-cane productivity when compared with the conventional system (HMPH) can be attributed to the use of subsoiler in these tillage systems, which also occurred in S+DP (plant-cane) and S+H (ratoon-cane). The deep soil decompression

2696 Afr. J. Agric. Res. with a subsoiler can have negative effects on sugarcane growth. The formation of large clumps in the soil reduces the stem contact with the soil, which in turn reduces budding and initial root growth (Arruda et al., 2015).
The average plant-cane stalk yields in the 2009-2010 seasons (98.46 Mg ha
-1) were higher than those found in
ratoon-cane in the 2011-2012 season (60.08 Mg ha-1
). The drop in ratoon-cane productivity may be related to lower total porosity and macroporosity in soil, and the subsequent increase of soil density in the 0.4-0.6 m layer. Some destructive evaluations of plant root system development, for a study also held in the same area of research, may have also contributed to the low productivity during the ratoon-cane season.
Conclusions
Regardless of the planting system used during the preparations for sugarcane plantation, the ratoon-cane season showed reduced total pore volume and soil macroporosity, as well as increased soil density in the 0.4 to 0.6 m layer. However, the use of direct planting presented higher soil macroporosity values in the 0-0.2 m layer, and yields similar to conventional systems with the use of the moldboard plow.
Therefore, producers are recommended to adopt soil conservation tillage systems, combining productivity and soil quality.
Conflict of Interests
The authors have not declared any conflict of interests. ACKNOWLEDGEMENTS
The authors thank the following Brazilian institutions for their financial support: Fundação de Amparo à Pesquisa do Estado de Goiás (FAPEG), Fundação de Amparo à Pesquisa do Estado de Minas Gerais (FAPEMIG), Coordenação de Aperfeiçoamento de Pessoal de Nível Superior (CAPES) and Conselho Nacional de Desenvolvimento Científico e Tecnológico (CNPQ). REFERENCES Araújo AM, Tormena CA, Silva AP (2004). Propriedades físicas de um
latossolo vermelho distrófico cultivado e sob mata nativa. Rev. Bras. Ciênc. Solo 28(2):337-345.
Argenton J, Albuquerque JA, Bayer C, Wilder LP (2005). Comportamento de atributos relacionados com a forma da estrutura de Latossolo Vermelho sob sistemas de preparo e plantas de cobertura. Rev. Bras. Ciênc. Solo. 29(3):425-435.
Arruda EM, Almeida RF, Silva Junior AC, Ribeiro BT, Silva AA, Lana RMQ (2015). Aggregation and organic matter content in different tillage systems for surgacane. Afr. J. Agric. Res. 10(4):281-288.
Bangita B, Rao BK (2012). Impacts of compaction relief treatments on soil physical properties and performance of sugarcane (Saccharum
spp.) under zonal tillage system. Geoderma 189:351-356. Blackburn F (1984). Sugarcane. Longman, New York, USA. 414 p. Camilotti F, Andrioli I, Dias FLF, Casagrande AA, Silva AR, Mutton MA,
Centurion JF (2005). Efeito prolongado de sistemas de preparo do solo com e sem cultivo de soqueira de cana crua em algumas propriedades físicas do solo. Eng. Agríc. 25(1):189-198.
Centurion JF, Freddi OS, Aratani RG, Etzner AFM, Beutler AN, Andrioli I (2007). Influência do cultivo da cana-de-açúcar e da mineralogia da fração argila nas propriedades físicas de latossolos vermelhos. Rev. Bras. Ciênc. Solo 31(2):199-209.
Choudhury SG, Srivastavab S, Singha R, Chaudharia SK, Sharmaa DK, Singhc SK, Sarkard D (2014). Tillage and residue management effects on soil aggregation, organic carbon dynamics and yield attribute in rice–wheat cropping system under reclaimed sodic soil. Soil Till. Res. 136:76-83.
Cunha JPAR, Cascão VN, Reis EF (2009). Compactação causada pelo tráfego de trator em diferentes manejos de solo. Acta Sci. Agron. 31(3):371-375.
Dexter AR (1988). Advances in characterization of soil structure. Soil Till. Res. 11:199-238.
Domingues LAS (2012). Atributos físicos do solo, desenvolvimento radicular e produtividade de cana-de-açúcar em preparos de solo em áreas de renovação e expansão. Tese de Doutorado em Agronomia - Universidade Federal de Uberlândia, Uberlândia, Brasil 92 p.
Empresa Brasileira de Pesquisa Agropecuária (Embrapa) (1997). Manual de métodos de análise de solo. Rio de Janeiro: Embrapa Solos 212 p.
Empresa Brasileira de Pesquisa Agropecuária (Embrapa) (2009). Manual de análises químicas de solos, plantas e fertilizantes. 2. ed. Brasília. Embrapa Inform. Tecnol. 627 p.
Empresa Brasileira de Pesquisa Agropecuária (Embrapa) (2013). Sistema Brasileiro de classificação de Solos. 3ª. ed. Rio de Janeiro: Embrapa Solos 350 p.
Faroni CE, Trivelin PCO (2006). Quantificação de raízes metabolicamente ativas de cana-de-açúcar. Pesq. Agropec. Bras. 41(6):1007-1013.
Ferreira DF (2008). Sisvar: Um programa para análises e ensino de estatística. Rev. Cient. Sympos. 6:36-41.
Hamza MA, Anderson WK (2005). Soil compaction in cropping systems: A review of the nature, causes and possible solutions. Soil Till. Res. 82(2):121-145.
Machado JL, Tormena CA, Fidalski J, Scapim CA (2008). Inter-relações entre as propriedades físicas e os coeficientes da curva de retenção de água de um latossolo sob diferentes sistemas de uso. Rev. Bras. Ciênc. Solo 32(2):495-502.
Mazurana M, Levien R, Muller J, Conte O (2011). Sistemas de preparo de solo: alterações na estrutura do solo e rendimento das culturas. Rev. Bras. Ciênc. Solo 35(4):1197-1206.
Paulino AF, Medina CC, Azevedo MCB, Silveira KRP, Trevisan AA, Murata IM (2004). Escarificação de um Latossolo Vermelho na pós-colheita de soqueira de cana-de-açúcar. Rev. Bras. Ciênc. Solo 28(5):911-917.
Reinert DJ, Reichert JM (2006). Propriedades Físicas do Solo. Universidade Federal de Santa Maria, Centro de Ciênc. Rurais 18 p.
Reinert DJ, Reichert JM, Silva VR (2001). Propriedades físicas de solos em sistema de plantio direto irrigado. In: Irrigação por aspersão no Rio Grande do Sul. Imprensa Universitária. Santa Maria, Brasil pp. 114-133.
Segato SV, Pinto AS, Jendiroba E, Nóbrega JCM (2006). Atualização em produção de Cana-de-Açúcar. Piracicaba, São Paulo, Brasil 451 p.
Silva AP, Tormena CA, Fidalski J, Inhoff S (2008). Funções de pedotransferência para as curvas de retenção de água e de resistência do solo à penetração. Rev. Bras. Ciênc. Solo 32(1):1-10.
Tormena CA, Vidigal Filho PS, Gonçalves ACA, Araújo MA, Pintro JC (2004). Influence of different tillage systems in physical properties of a distrophic Red Latosol. Rev. bras. Eng. Agríc. Ambient. 8(1):65-71.
Vomocil JA, Flocker WJ (1961). Effect of soil compaction on storage and movement of soil air and water. Trans. Am. Soc. Agric. Eng. 4:242-246.
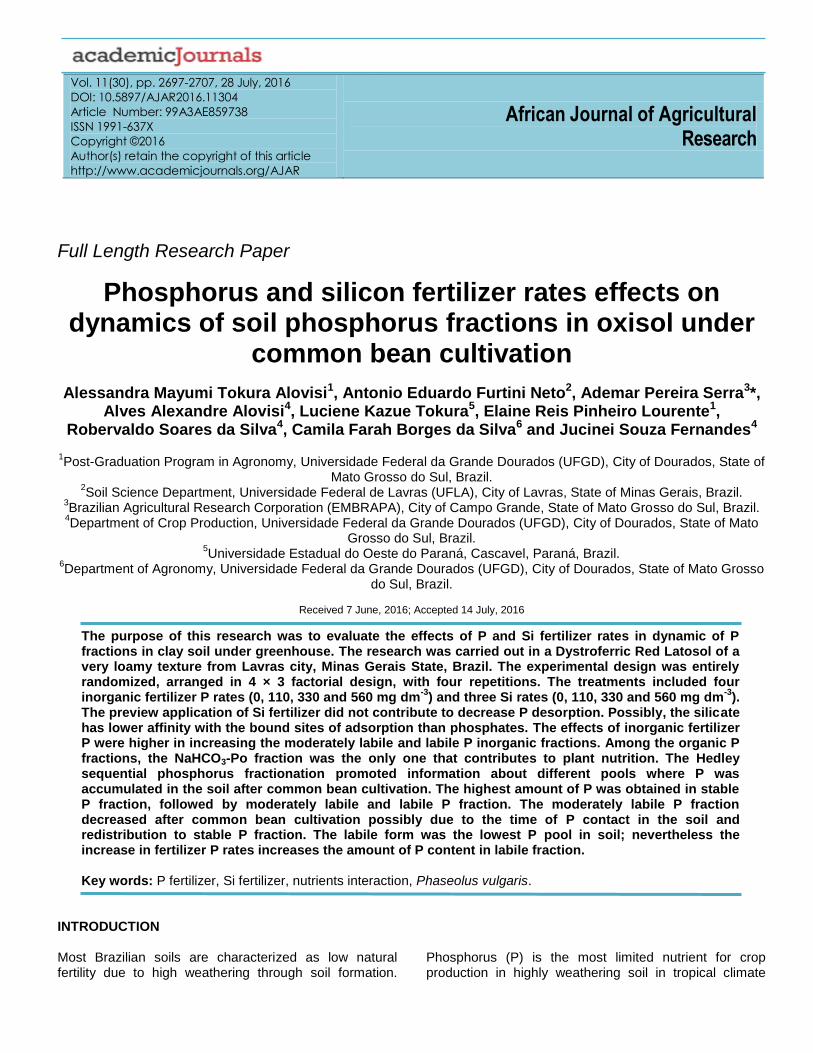
Vol. 11(30), pp. 2697-2707, 28 July, 2016
DOI: 10.5897/AJAR2016.11304
Article Number: 99A3AE859738
ISSN 1991-637X
Copyright ©2016
Author(s) retain the copyright of this article
http://www.academicjournals.org/AJAR
African Journal of Agricultural Research
Full Length Research Paper
Phosphorus and silicon fertilizer rates effects on dynamics of soil phosphorus fractions in oxisol under
common bean cultivation
Alessandra Mayumi Tokura Alovisi1, Antonio Eduardo Furtini Neto2, Ademar Pereira Serra3*, Alves Alexandre Alovisi4, Luciene Kazue Tokura5, Elaine Reis Pinheiro Lourente1,
Robervaldo Soares da Silva4, Camila Farah Borges da Silva6 and Jucinei Souza Fernandes4
1Post-Graduation Program in Agronomy, Universidade Federal da Grande Dourados (UFGD), City of Dourados, State of
Mato Grosso do Sul, Brazil. 2Soil Science Department, Universidade Federal de Lavras (UFLA), City of Lavras, State of Minas Gerais, Brazil.
3Brazilian Agricultural Research Corporation (EMBRAPA), City of Campo Grande, State of Mato Grosso do Sul, Brazil.
4Department of Crop Production, Universidade Federal da Grande Dourados (UFGD), City of Dourados, State of Mato
Grosso do Sul, Brazil. 5Universidade Estadual do Oeste do Paraná, Cascavel, Paraná, Brazil.
6Department of Agronomy, Universidade Federal da Grande Dourados (UFGD), City of Dourados, State of Mato Grosso
do Sul, Brazil.
Received 7 June, 2016; Accepted 14 July, 2016
The purpose of this research was to evaluate the effects of P and Si fertilizer rates in dynamic of P fractions in clay soil under greenhouse. The research was carried out in a Dystroferric Red Latosol of a very loamy texture from Lavras city, Minas Gerais State, Brazil. The experimental design was entirely randomized, arranged in 4 × 3 factorial design, with four repetitions. The treatments included four inorganic fertilizer P rates (0, 110, 330 and 560 mg dm
-3) and three Si rates (0, 110, 330 and 560 mg dm
-3).
The preview application of Si fertilizer did not contribute to decrease P desorption. Possibly, the silicate has lower affinity with the bound sites of adsorption than phosphates. The effects of inorganic fertilizer P were higher in increasing the moderately labile and labile P inorganic fractions. Among the organic P fractions, the NaHCO3-Po fraction was the only one that contributes to plant nutrition. The Hedley sequential phosphorus fractionation promoted information about different pools where P was accumulated in the soil after common bean cultivation. The highest amount of P was obtained in stable P fraction, followed by moderately labile and labile P fraction. The moderately labile P fraction decreased after common bean cultivation possibly due to the time of P contact in the soil and redistribution to stable P fraction. The labile form was the lowest P pool in soil; nevertheless the increase in fertilizer P rates increases the amount of P content in labile fraction. Key words: P fertilizer, Si fertilizer, nutrients interaction, Phaseolus vulgaris.
INTRODUCTION Most Brazilian soils are characterized as low natural fertility due to high weathering through soil formation.
Phosphorus (P) is the most limited nutrient for crop production in highly weathering soil in tropical climate
2698 Afr. J. Agric. Res. (Daroub et al., 2003). The P distributions in soil are presented in organic and inorganic P fractions, which combined to define the total soil P (Hedley et al., 1982; Alovisi et al., 2011).
The highly weathering soil shows high capacity of P adsorption and results in small available P in soil solution (Guedes et al., 2012, 2016). The P supply is quite important in early stage of plant growth and the P supply is affected by many factors in the soil, as example: P fertilizer rates, soil mineralogy, cropping systems, and other environment conditions (Grant et al., 2004). Opposing to the other nutrients, the P fertilizer might be applied in overdose in most occasions to saturate the adsorptions sites in soil to remain enough P supply for plant growth (Furtini Neto et al., 2001). The recommendation of P fertilizer is directly related to soil mineralogy, due to P capacity in adsorption in Fe/Al oxy-hydroxides (Wang et al., 2015), as the case of inner sphere complexes formation (Fe
3+–O– P), and surface
bound in Fe–OH groups (Kim et al., 2011). Furthermore, the clay composition affects the capacity
of P adsorption in soil (Tokura et al., 2002). The adequate offer of P to crops in highly weathering soil is always a challenge, due to complexity in P interactions. The interactions of phosphate (P) ions may form complex minerals in association with cations (Ca, Al, and Fe) (Hinsinger, 2001). The link between P and Fe speciation affects the P concentration in soil (Sundman et al., 2016), as the case of maximum P adsorption capacity correlated with clay, sand, silt, soil organic matter, base saturation, and pH (Pinto et al., 2013). Thus, the knowledge of P interactions in soil and its availability associated with the possibility of reverse P adsorption is quite important to improve P fertilizer recommendation in cropping systems.
The possibility to use another fertilizer source to improve the availability of P in soil solution may be profitable. The silicon (Si) has been studied as a possibility to improve P availability in soil solution due to similarity of silicate anion (H3SiO4
-) with phosphate
(H2PO4-). Lee and Kim (2007) reported silicate as a
competitor of phosphate and its possibility to exchange phosphate from adsorption sites, resulting in increasing availability of phosphate in soil solution. The Si is present in solid phase of the soil in many types of clay and other mineral compounds, but in highly weathering soil as the case of oxisols its content in soil solution is limited (Guedes et al., 2016).
The possibility to increase Si content in soil solution seems to be a profitable alternative to reduce P adsorption and consequently increases P availability. As observed by Cartes et al. (2015), the presence of Si in
solution showed slight reduction in capacity of P sorption. Nevertheless, many unknown factors about Si and P adsorption are still necessary to disclose, as the case of environment factors, soil physical-chemical reactions, soil mineralogy, and Si-P interactions (Alovisi et al., 2014). Thus, the knowledge of nature and P forms distribution in soil may offer important information to the process of evaluation and P availability.
The sequential P fractionation may contribute to identify the P forms retention in soil and its capacity of P supply to soil solution. The sequential P fractionation proposed by Hedley et al. (1982) allows having information about P availability in short and long-term through the P fractionation with different extractor from the weakest to the strongest extractor. These extractors allow the removing of P from solid soil phase and possibility to determine labile, moderately labile, and stable P forms. The purpose of this research was to evaluate the effects of P and Si fertilizer rates in dynamic of P fractions in clay soil under greenhouse. MATERIALS AND METHODS Location and soil description The research was carried out in a soil with a very loamy texture and clay mineralogy constituted mainly by Al/Fe oxy-hydroxides, classified according to Santos et al. (2013) as Dystroferric Red Latosol (LVdf). The greenhouse location was the campus of Universidade Federal de Lavras located in the city of Lavras, State of Minas Gerais, Brazil (approximately 21°13’46.54’’S and 44°58’26.30’’W, average altitude 932 m above sea level). Soil properties evaluations The soil was collected in 0 to 20 cm depth under native vegetation of Brazilian Cerrado biome. After collection, the soil was air-dried, broke up and passed through a 5 mm sieve for the greenhouse experiments. A portion of the samples was passed through a 2 mm sieve and then subjected to physical, chemical and mineralogical analyses. The physical analysis involved the determination of the granulometric fractions of the air-dried soil (ADS) using the pipette method (Day, 1965).
The chemical analyses included the pH, sorption complex, organic C, macronutrients and micronutrients content. The availability of P was evaluated using the Mehlich-1 extractor (Claessen, 1997) and ion-exchange resin (Raij and Feitosa, 1980). The free Fe oxy-hydroxides from the clay fraction were obtained by dissolution with dithionite-citratebicarbonate (Fed) (Mehra and Jackson, 1960). The less crystalline Fe oxy-hydroxides of the clay fraction was obtained with ammonium oxalate acid (FeO) according to Schwertman et al. (1986), and the iron and aluminium oxy-hydroxides by ADS sulphuric attack were determined according to Claessen (1997).
*Corresponding author. E-mail: [email protected].
Abbreviations: Po, P organic; Pi, P inorganic.
Author(s) agree that this article remain permanently open access under the terms of the Creative Commons Attribution
License 4.0 International License

Alovisi et al. 2699
Table 1. Chemical, physical and mineralogical soil properties.
Soil properties %
pHH2O 4.8
Al+3
(cmolc dm-3
) 1.1
Ca+2
(cmolc dm-3
) 0.4
Mg2+
(cmolc dm-3
)
0.2
K+(mg dm
-3)
30
H+
+ Al3+
(cmolc dm-3
)
9.5
Mehlich1-P (mg dm-3
) 1.1
Resin-P (mg dm-3
) 12.9
SB (cmolc dm-3
) 0.7
Effective CEC (cmolc.dm-3
) 1.7
CEC to pH 7.0 (cmolc. dm-3
) 10.2
BS (%) 7
m (%) 61
SOM (dag kg-1
) 3.9
Si (mg dm-3
) 6.2
B (mg dm-3
) 0.4
Cu (mg dm-3
) 2.1
Fe (mg dm-3
) 73.1
Mn (mg dm-3
) 11.4
Zn (mg dm-3
) 0.1
Coarse sand (g kg-1
) 110
Thin sand (g kg-1
) 60
Silt (g kg-1
) 110
Clay (g kg-1
) 720
SiO2 (g kg-1
) 153
Al2O3 (g kg-1
) 262
Fe2O3 (g kg-1
) 237
TiO2 (g kg-1
) 202
P2O5 (g kg-1
) 1.4
Fed (g kg-1
) 138.8
Feo (g kg-1
) 2.8
Ct (g kg-1
) 160
Gb (g kg-1
) 310
CEC: Cation exchange capacity; total acidity pH 7.0 (H+ +Al3+
); Exchangeable (KCl 1 mol L
-1) Ca
2+, Mg
2+ and Al
3+; BS: Base Saturation=(Σ cations/CEC)×100.
In the free clay, the gibbsite and kaolinite contents were quantified using differential thermal analysis. The determination of the soluble Si in the soils was conducted according to the method proposed by McKeaque and Cline (1963). The results of the physical, chemical and mineralogical characterization of the studied soil before the application of the treatments are presented in Table 1. Experimental design and treatments implementation The experimental design used was entirely random, arranged in a 4 × 3 factorial, with four repetitions, with amount of 48 experimental units. The treatments included four P rates (0, 110, 330 and 560 mg dm-3) and four Si rates (0, 110, 330 and 560 mg dm-3). The P fertilizer rates were defined by the remaining P (Alvarez et al., 2000). Vases with a soil capacity of 3 dm3 were filled with 2.7 dm3 of soil.
The soil samples were then subjected to three sequential incubations for a period of 30 days each under humidity conditions equivalent to 60% of the total pore volume (TPV) occupied by water (Freire et al., 1980), which was controlled by daily weighing. The three incubations followed this sequence: (1) incubation after dolomitic limestone application, which was through the micropulverised calcined dolomitic limestone (35% CaO and 14% MgO) applied to the soils in sufficient quantity to elevate the value of the base saturation to 70%; (2) incubation after Si application, the silicic acid was applied in the form of H4SiO4 (60% SiO2) at the rates of 0, 110, 330 and 560 mg dm-3 of Si, as defined based on the P rates; and (3) incubation after basic fertilization corresponded to the following nutrient contents in the form of salts p.a. in mg dm-3 of soil: 100 of N; 150 of K; 62 of S; 0.81 of B; 1.3 of Cu; 5.0 of Zn; 3.6 of Mn; 1.6 of Fe; and 0.15 of Mo.
The nutrients were applied in a solution form and mixed into the soil for a higher uniformity. The sources of nutrients were: K2SO4;

2700 Afr. J. Agric. Res. Table 2. Soil properties after soil acidity correction, basic fertilizing and treatment applications.
Treatment1
pH K Ca Mg Al H+Al CEC m BS Resin-P
Si
mg dm-3
cmolc dm-3
% mg dm-3
P0Si0 5.2 126 3.3 2.1 0.1 4.0 9.8 2.0 59.1 11.2 6.69
P0Si330 5.2 128 3.4 2.2 0.1 4.0 9.8 2.0 59.4 11.5 19.91
P0Si560 5.2 123 3.3 2.1 0.1 3.7 9.5 2.0 60.8 11.5 27.79
P110Si0 5.3 130 3.3 2.2 0.1 3.7 9.9 1.0 62.2 24.5 6.65
P110Si330 5.2 121 3.3 2.2 0.1 4.3 10.2 2.0 57.5 27.8 20.62
P110Si560 5.1 124 3.4 2.0 0.2 4.5 10.3 3.0 56.3 25.4 27.29
P330Si0 5.3 129 3.1 2.1 0.1 4.2 9.7 2.3 57.2 81.8 7.99
P330 Si330 5.1 134 3.4 2.2 0.1 5.0 11.0 2.0 54.3 83.4 22.92
P330Si560 5.2 131 3.3 2.0 0.1 4.5 10.2 2.0 55.8 81.0 25.37
P560Si0 5.3 129 3.3 2.2 0.1 4.7 10.5 2.0 55.4 126.1 13.90
P560Si330 5.1 135 3.4 2.4 0.1 5.6 11.7 2.0 52.1 131.4 18.78
P560Si560 5.1 135 3.4 2.1 0.1 5.4 11.2 2.0 51.8 127.8 25.25 1The rates of P and Si are in mg dm
-3. CEC: Cation exchange capacity; total acidity pH 7.0 (H+ +Al
3+); Exchangeable (KCl 1 mol L
-1) Ca
2+, Mg
2+ and
Al3+
; BS: Base Saturation=(Σcations/CEC) × 100.
(NH4)2HPO4; NH4NO3; KH2PO4; H3PO4; MnSO4.2H2O; CuSO4.5H2O; (NH4)6MO7O24.4H2O; ZnSO4.7H2O; FeSO4.7H2O; and H3BO3. After the incubation period of the soils with the treatments in the greenhouse, soil subsamples of each experimental unit (vases) were collected for the analytical determinations (Table 2).
Planting was performed 30 days after the last incubation. Five common bean seeds per vase were sown. After 20 days, the plants were thinned, leaving two plants per vase. The vases were maintained with the humidity at 60% of the TPV (Freire et al., 1980) through the daily weighing of the vases and the addition of deionized water. The cultivar of the common bean plant used was ESAL 168. Topdressing fertilization with N and K were conducted according to the growth of the plants. The treatments received 200 and 170 mg dm-3 of N and K, respectively, parceled out in seven applications, in addition to the application of 20 mg of sulphur. Plant and measurement The first mature leaves at the tip of the common bean plant branch were collected at the onset of flowering (Malavolta et al., 1997) from each vase and the whole plants were harvested at the physiological maturation of the grains by cutting the plants at ground level. The vegetable matter was dried in a forced-air oven at a temperature between 65 and 70°C and ground in Willey-type mill. The total P content was determined through the mineralisation with nitric-perchloric digestion (Malavolta et al., 1997) and the extracts were measured using colorimetry (Braga and Defelipo, 1974). The aerial part dry matter (APDM) and grains dry matter (GDM) were determined in the plants harvested at the end of the growth cycle. The P accumulated in the aerial part was calculated by multiplying the APDM value by the content of P and dividing this value by 1,000. Phosphorus fractionation in the soil
The phosphorus fractionation in soil was carried before and after the common bean cultivation, the collection of samples were carried out in each experimental units to analytical determinations and for Hedley sequential Po (P organic) and Pi (P inorganic) fractionations
(resin-Pi, NaHCO3-Po, NaHCO3-Pi, NaOH 0.1M-Po, NaOH 0.1M-Pi, NaOH 0.5M-Po, NaOH 0.5M-Pi, HCl-Pi, and residual-Pi), following the methodology of Hedley et al. (1982). The P forms were determined as follow: labile P forms (resin-Pi, NaHCO3-Po, and NaHCO3-Pi), moderately labile (NaOH 0.1M-Po, NaOH 0.1M-Pi, NaOH 0.5M-Po, and NaOH 0.5M-Pi), and stable P fractions (HCl-Pi, and residual-Pi). Statistical analysis The variables evaluated in the experiment were submitted to the analysis of variance (ANOVA) by the F-test (P≤0.01) using the SISVAR statistical analyses software. In the case of significant (P≤0.01) difference in Si and P fertilizer rates, the polynomial equation was adjusted. Simple Pearson’s correlations were applied between P forms, soil organic and inorganic P fractions with APDM, DMG, and P-APDM.
RESULTS AND DISCUSSION Soil inorganic phosphorus (Pi) fractions
The variables (P and Si fertilizer rates) showed significant interactions in the results of Pi fractions in the soil. Inorganic P in NaOH 0.5M, residual-Pi and HCl-Pi even with significant effects of the interactions did not adjust any equation to the data. The labile inorganic P fractions, NaHCO3-Pi, HCl-Pi and resin-Pi were the lower soil P fractions, which were expected due to high weathering in Oxisol (Table 3).
The NaOH 0.1M-Pi and NaOH 0.5M-Pi considered moderately labile for plants showed higher concentration in comparison to labile fraction, as well as observed by Tiessen et al. (1984). These results confirmed the presence of Fe/Al oxy-hydroxides, as goethite and gibbsite, and clay mineralogy composed by kaolinite

Alovisi et al. 2701 Table 3. Soil inorganic P fractions after common bean cultivated.
Treatment1
Inorganic P fractions (mg dm-3
)
Resin-Pi (%)
NaHCO3-Pi (%)
NaOH 0.1 M-Pi (%)
NaOH 0.5 M-Pi (%)
HCl-Pi (%)
P0Si0 2.7 (+69) 23.5 (+91) 63.5 (+22) 90.6 (+17) 5.1 (+87)
P0Si330 1.7(+17) 15.8 (+90) 59.3 (+17) 96.0 (+26) 2.4 (+70)
P0Si560 1.6 (+46) 9.4 (+85) 58.5 (+25) 99.7 (+30) 2.2 (+80)
P110Si0 4.4 (-9) 6.0 (-6) 109.0 (+15) 114.7 (+25) 2.4 (+26)
P110Si330 5.3 (+19) 6.3 (-16) 100.8 (+17) 105.3 (+18) 3.0 (+29)
P110Si560 4.3 (-43) 5.6 (-21) 101.1 (+4) 105.1 (+19) 3.0 (+33)
P330Si0 19.4 (-39) 28.0 (-6) 190.8 (-3) 133.2 (+22) 4.3 (+40)
P330 Si330 16.2 (-52) 30.5 (-13) 185.9 (-6) 129.1 (+18) 3.6 (+23)
P330Si560 26.3 (-22) 26.5 (-13) 182.7 (-7) 133.9 (+21) 9.1 (+73)
P560Si0 71.2(+13) 51.4 (-15) 215.3 (-11) 145.9 (+11) 6.4 (+41)
P560Si330 70.3 (+7) 57.8 (-11) 227.5 (-5) 138.1 (+9) 5.6 (+31)
P560Si560 79.3 (-3) 62.0 (-8) 173.4 (-38) 143.2 (+14) 7.8 (+53)
CV.(%) 9.33 3.26 7.70 22.26 13.52
Soil form native vegetation 1.68 1.13 40.42 2.83 25.05 1The rates of Si and P-fertiliser applications are in mg dm
-3. Values between parentheses indicate percentage of decreasing (-) or increasing (+) in the
P fractions after the common bean cultivation.
(Table 1), may result in high capacity of generated bond highly energetic with P. Thus, the NaOH 0.1M-Pi and NaOH 0.5M-Pi fractions act as sink for the P fertilizer in soil. Furthermore, the absence of P fertilizer and the 110 kg P2O5 ha
-1 showed the lowest resin-P due to majority
uptake and exportation by common bean plant and low replacement of the Pi uptake to the soil solution.
The rates of P fertilizer increased the availability of Pi in the labile (resin-P and NaHCO3-Pi) and moderately labile fractions (NaOH 0.1M-Pi) (Figure 1); these results indicated that the application of P fertilizer saturated the adsorption site of P, as it was observed by Conte et al. (2003). The rates of silicate fertilizer increased the availability of Pi before the cultivation of common bean. Possibly, the Si fertilizer applied increased the availability of Pi due to decreasing of bond energy of phosphate to soil colloids (Carvalho et al., 2001). The labile (resin-Pi and NaHCO3-Pi) and moderately labile fractions (NaOH 0.1M-Pi) decreased after common bean cultivated (Figure 1), which may reassure the increase in P availability and uptake by common bean plant with the application of Si fertilizer, which was more evident in the treatments with higher rates of P fertilizer (Table 3). The uptake of P by common bean from resin-Pi and NaHCO3-Pi fractions ensure the lability of these Pi fractions (Figure 1), as well as attained by Hedley et al. (1982).
As reported by Lilienfein et al. (2000), the effects of P uptake by plant in short-time are more evident in labile and moderately labile P fractions. In relation to NaOH 0.1M-Pi and NaOH 0.5M-Pi, moderately labile fractions, this comprises the P bound in Fe/Al oxy-hydroxides, the content of both fractions increased with the increment of P fertilizer rates. These increase in moderately labile
fractions indicated that these fractions accumulate the excess of P fertilizer applied. As reported by Tokura et al. (2011), the moderately labile fractions (NaOH 0.1M-Pi and NaOH 0.5M-Pi) act as sink of P in the soil, majority in the soils with high content of Fe and Al oxy-hydroxides.
The highest content of NaOH 0.5M-Pi after common bean cultivated may be associated with more time of contact between Pi from fertilizer applied and Fe/Al oxy-hydroxides in the soil. The soil of the experiment had high content of Fe/Al oxy-hydroxides (Table 1); these oxides pursue high capacity of P immobilization forming complex of high energy and hard reversibility (Tokura et al., 2002, 2011). Nevertheless, these moderately labile fractions may show lability, working as a factor of the buffer amount of soil P (Rheinheimer et al., 2000).
The decrease of NaOH 0.1M-Pi after common bean cultivated suggested this fraction as the major buffer amount of the labile fractions, which may replace the P in soil solution after plant uptake extract. This fact may be reassured by the significant and positive correlation of NaOH 0.1M-Pi
with aerial part dry matter (APDM), grain
dry matter (GDM) and phosphorus accumulated in P-APDM (Table 4). The content of P extracted with HCl showed little modifications with the application of P fertilizer (Table 3), indicating little amount of P from fertilizer accumulates in the stable P fraction (HCl-P). The HCl extract preferably the P bound in Ca, however, in Oxisol due to weathering the Ca exchangeable tend to be small, resulting in small content of P bound with Ca. Nevertheless, the cultivation of common bean increased the content of P extracted by HCl, indicating that a small part of the P fertilizer accumulated in HCl-P fraction, which did not contribute to common bean nutrition as

2702 Afr. J. Agric. Res.
P fertilizer (mg P/dm3)
0
10
20
30
40
50
60
70
80
90
0 110
y=4.5649+0.0920**x R2=0.9977 ^
y=3.5640+0.1023**x R2=0.9966 ^
y=4.0801+0.0988**x R2=0.9975 ^
330 560
After Bean Cultivated
P fertilizer (mg P dm-3
)
Resi
n-P
(m
g d
m-3
)
0
10
20
30
40
50
60
70
80
90
0 110
y=5.9404+0.1247**x R2=0.9987 ^
y=4.5161+0.1456**x R2=0.9970 ^
y=4.1003+0.1410**x R2=0.9977 ^
330 560
Before Bean Cultivated
0 kg Si ha-1
330 kg Si ha-1
560 kg Si ha-1
P fertilizer (mg P/dm3)
Pi N
a b
icarb
onate
(m
g/d
m3)
0
10
20
30
40
50
60
70
80
0 110
y=2.8201+0.1130**x R2=0.9962 ^
y=4.5698+0.0953**x R2=0.9987 ^
y=4.7215+0.0953**x R2=0.9997 ^
330 560
0 kg Si ha-1
330 kg Si ha-1
560 kg Si ha-1
NaH
CO
3-P
i (m
g d
m-3
)
0
10
20
30
40
50
60
70
80y=5.9404+0.1247**x R
2=0.9987 ^
y=4.5161+0.1456**x R2=0.9970 ^
y=4.1003+0.1410**x R2=0.9977 ^
0
10
20
30
40
50
60
70
80
90
100y=20.8540+0.1264**x R
2=0.9936 ^
y=22.5163+0.0980**x R2
=0.9928 ^
y=25.7743+0.0908**x R2
=0.9844 ^
P fertilizer (mg P dm-3
)
0 110 330 560
0 kg Si ha-1
330 kg Si ha-1
560 kg Si ha-1
P fertilizer (mg P dm-3
)
NaO
H 0
.1M
-Pi
(mg
P d
m-3
)
0
10
20
30
40
50
60
70
80
90
100
0 110
y=16.4945+0.0821**x R2=0.9742 ^
y=12.3858+0.1015**x R2=0.9954 ^
y=9.7566+0.1173**x R2
=0.9957 ^
330 560
A
B
C
Figure 1. Soil inorganic P fractions affected by P and Si fertilizer rates under common bean cultivation.
observed in Table 4, due to absence of correlation with APDM, GDM and phosphorus in the P-APDM.
Comparing the soil P content extracted to HCl before and after common bean cultivation, decrease in HCl-P content after common bean cultivation was observed (Table 3). Possibly, the decrease may be associated with common bean uptake of Ca and P through the plant cycle, which may favored the dissolution of Ca phosphates. As reported by Novais et al. (2007), soil with higher cations exchange capacity (CEC) and higher soil organic matter may increase the capacity of Ca sink, thus favours the dissolutions of Ca phosphates.
Soil organic P fractions The treatments (Si and P fertilizer rates) evaluated showed significant (p<0.01) interactions. The data of NaOH 0.5M-Po fraction did not adjust regression equations even with the significant effect of P fertilizer rates. The NaOH 0.1M-Po fraction predominates organic P fractions, in accordance with Cassagne and Remaury (2000). Before or after common bean cultivation, the Po decreased with the increase in P fertilizer rates (Figure 2).
The reduction may be due to higher organic matter

Alovisi et al. 2703
Table 4. Person´s correlations between P fractions and forms with the dry matter aerial part (DMAP), grain dry matter (GDM), P accumulate in DMAP (P-DMAP).
P fractions and forms DMAP GDM P-DMAP
Resin-Pi 0.92** 0.94** 0.83**
NaHCO3-Pi 0.92** 0.94** 0.84**
NaHCO3-Po 0.50** 0.56** 0.50**
NaOH 0.1M-Pi 0.90** 0.92** 0.83**
NaOH 0.1M-Po -0.57** -0.55** -0.43**
NaOH 0.5M-Pi 0.53** 0.60** 0.57**
NaOH 0.5M-Po 0.02ns
-0.01ns
0.14ns
HCl-Pi -0.16ns
-0.13ns
-0.06ns
Residual-Pi -0.28ns -0.21
ns -0.21
ns
Labile-P1 0.92** 0.94** 0.84**
Moderately labile-P2 0.64** 0.63** 0.69**
Stable-P3 -0.30
ns -0.23
ns -0.23
ns
**Significant at 1% of probability. *Significant at 5% of probability. NS: No-significant. 1Labile P
forms (resin-Pi, NaHCO3-Po, and NaHCO3-Pi), 2moderately labile (NaOH 0.1M-Po, NaOH
0.1M-Pi, NaOH 0.5M-Po, and NaOH 0.5M-Pi), and 3stable P fractions (HCl-Pi, and residual-Pi).
0 kg Si ha-1
330 kg Si ha-1
560 kg Si ha-1
P fertilizer (mg dm-3
)
NaH
CO
3-P
o (
mg
dm
-3)
0
10
20
30
40
50
60
0 110
y=53.483-0.0614**x R2=0.9793
y=52.0524-0.0434**x R2=0.9692
y=50.277-0.0380**x R2=0.9339
330 560
^
^
^
B
A
P fertilizer (mg dm-3
)
0
10
20
30
40
50
60
0 110
y=49.3503-0.0423**x R2=0.9542
y=51.296-0.0311**x R2=0.9956
y=50.0075-0.0345**x R2=0.8887
330 560
^
^
^
0
10
20
30
40
50
60
70
80
90
100
110y=78.8740-0.1179**x R
2=0.9335
y=70.9262-0.0977**x R2=0.9550
y=64.1178-0.0776**x R2=0.9149 ^
^
^
After Bean Cultivation
NaO
H 0
.1M
-Po
(m
g d
m-3
)
0
10
20
30
40
50
60
70
80
90
100
110
0 kg Si ha-1
330 kg Si ha-1
560 kg Si ha-1
y=76.8120-0.1124**x R2=0.9464
y=84.5615-0.1316**x R2=0.9360
y=68.111-0.0941**x R2=0.9714 ^
^
^
Before Bean Cultivated
Figure 2. Soil organic P fractions affected by P and Si fertilizer under common bean cultivation.
mineralization promoted by increase in P content and uptake of P by plants (Araújo et al., 1993; Tokura et al.,
2011). The decrease in Po fractions was higher than Pi fractions (Table 3). This can occur because of the

2704 Afr. J. Agric. Res.
Table 5. Soil organic P fractions after common bean cultivated.
Treatment1
Po fractions
NaHCO3-Po NaOH 0.1 M -Po NaOH 0.5 M -Po
mg dm-3
P0Si0 16.7 (-76) 54.2 (-18) 7.0 (-78)
P0Si330 22.6 (-60) 59.1 (-28) 4.8 (-86)
P0Si560 17.2 (-60) 55.7 (+37) 8.8 (-64)
P110Si0 21.9 (-21) 43.5 (-61) 10.9 (-74)
P110Si330 17.1 (-18) 48.8 (-60) 8.9 (-78)
P110Si560 13.3 (-2) 60.6 (-43) 12.6 (-63)
P330Si0 7.9 (-25) 14.8 (-86) 13.3 (-65)
P330 Si330 9.7 (-57) 24.0 (-72) 12.3 (-74)
P330Si560 11.1 (-64) 22.5 (-74) 11.6 (-80)
P560Si0 4.5 (-81) 94.3 (-37) 9.9 (-92)
P560Si330 3.3 (-87) 53.2 (-64) 7.6 (-85)
P560Si560 1.9 (-92) 102.80 (-4) 18.9 (-63)
C.V. (%) 14.12 11.96 10.40
Soil form native vegetation 48.81 183.84 69.20 1The rates of Si and P-fertilizer applications are in mg dm
-3. Values between parentheses indicate percentage of
decreasing (-) or increasing (+) in the P fractions after the common bean cultivation.
association of Po accumulation with the increase in soil organic matter; what did not occur during the experimental time. Besides, the NaHCO3-Po fractions are related to the organic compounds of easy decomposition, which sustains and is regulator by microbial biomass of soil (Lourente et al., 2016). Seybold et al. (1999) reported that transformation of Pi to Po in clay soils is more difficult than sand soil, due to higher activity of adsorptions site in clay soils conferring to clay soil lower resilience than sand soil. This performance was observed in the results (Tables 3 and 4), which resulted in higher proportion of Pi fractions than Po fractions. As reported by Kämpf and Curi (2000), the organic compounds imply an inhibitor effect in the crystallization process of Fe/Al oxy-hydroxides favoring the formation of microcrystalline forms with high specific surface.
The specific surface has the capacity of P adsorption, but many organic compounds are concurrent with orthophosphates by the adsorptions sites (Lopez-Hernandez et al., 1986; Guedes et al., 2016). Tokura et al. (2002) reported lower P desorption in the mineral soil fraction with the increase of weathering process which compensated the increase of soil organic matter participation in supply P for plants uptake. Thus, the Po fractions may have relevant participation as source of P for plants uptake, through the release of P from mineralization of Po (Novais and Smyth, 1999; Cunha et al., 2007).
Even though the reactions of precipitation and P adsorption which regulates retention and releases P in the soil; generally, these reactions act with great intensity and fast, the mineralization remains of the organic
compounds of P and also contributes to the remains in the medium-term and long-term of the levels of labile P in the soil available for plants (Novais et al., 2007). The negative and significant results of correlation between the NaOH 0.1M-Po and APDM, GDM and phosphorus in APDM (Table 4), indicate these fractions buffer the labile P fractions in soil, once the decrease in NaOH 0.1M-Po after the common bean cultivation (Table 5). All the Po fractions decreased its content, even in the treatment with absence of P fertilizer (Table 5). Thus, the P bound in soil organic matter compounds can be considered the major quantity factor of P in no fertilizer soil. While in soil P fertilizer, the balance of P in solution remained by both Po and Pi fractions. Phosphorus forms in the soil The moderately labile and stable forms of P were predominant (Table 6), which is in accordance with the fact of the magnitude of P adsorption depending on quantity of constituents with capacity of adsorption molecules in soil. Oxisols tend to prime the Pi fractions bound to mineral fractions with high energy and the inorganic forms stabilized physically and chemically (Rheinheimer et al., 2008).
The results indicate that the application of P fertilizer accumulated majority in moderately labile and stable P fractions. The P forms in the soil were affected after common bean cultivation. The decrease of P after common bean cultivation occurred in the labile and moderately labile P fractions (Figure 3). The reduction of

Alovisi et al. 2705
Table 6. Soil phosphorus forms after common bean cultivated.
Treatment1
P forms
Labile P2 Moderately labile P
3 Stable P
4
mg dm-3
P0Si0 42.9 (-41) 215.4 (-3) 443.0 (+14)
P0Si330 40.1 (-33) 219.2 (-7) 459.0 (+19)
P0Si560 28.3 (-37) 222.8 (+22) 431.6 (+11)
P110Si0 32.3 (-17) 278.0 (-16) 439.7 (+10)
P110Si330 28.7 (-6) 263.8 (-21) 439.2 (+6)
P110Si560 23.3 (-18) 279.4 (-13) 405.3 (+7)
P330Si0 55.4 (-23) 352.1 (-21) 432.86 (+5)
P330 Si330 56.3 (-38) 351.3 (-20) 444.1 (+7)
P330Si560 63.9 (-33) 350.7 (-21) 423.6 (+1)
P560Si0 127.1 (-13) 465.4 (-29) 417.4 (-0.4)
P560Si330 131.4 (-15) 426.4 (-24) 421.8 (+11)
P560Si560 143.3 (-17) 438.3 (-22) 418.1 (+18)
C.V. (%) 7.56 4.36 17.36
Soil from native vegetation 51.62 296.29 186.72 1The rates of Si and P-fertilizer applications are in mg dm
-3.
2Labile P forms (resin-P, NaHCO3-Po, and NaHCO3-Pi),
3moderately labile
(NaOH 0.1M-Po, NaOH 0.1M-Pi, NaOH 0.5M-Po, and NaOH 0.5M-Pi), and 4stable P fractions (HCl-Pi, and residual-Pi). Values between
parentheses indicate percentage of decreasing (-) or increasing (+) in the P fractions after the common bean cultivation.
P f
orm
s (%
)
0
10
20
30
40
50
60
70
80
90
100
Labile-P
Moderately labile-P
Stable-P
P0S
i 0
P0S
i 330
P0S
i 560
P110S
i 0
P110S
i 330
P110S
i 560
P330S
i 0
P330S
i 330
P330S
i 560
P560S
i 0
P560S
i 330
P560S
i 560
P and Si fertilizer (mg dm-3
)
Before bean cultivated
0
10
20
30
40
50
60
70
80
90
100
Labile-P
Moderately labile-P
Stable-P
P0S
i 0
P0S
i 33
0
P0S
i 56
0
P1
10S
i 0
P1
10S
i 33
0
P1
10S
i 56
0
P3
30S
i 0
P3
30S
i 33
0
P3
30S
i 56
0
P5
60S
i 0
P5
60S
i 33
0
P5
60S
i 56
0
P and Si fertilizer (mg dm-3
)
After bean cultivated
Figure 3. Effects of Si and P-fertilization on soil P fractions before and after common bean cultivated. 1Labile P forms (resin-Pi, NaHCO3-Po, and NaHCO3-Pi), 2moderately labile (NaOH 0.1M-Po, NaOH 0.1M-Pi, NaOH 0.5M-Po, and NaOH 0.5M-Pi), and 3stable P fractions (HCl-Pi, and residual-Pi).
P is the consequence of the plant uptake due to the positive correlation between the labile and moderately labile P fraction with the APDM, GDM and P accumulated in the aerial part (Table 4). As reported by Rheinheimer et al. (2000) and Alovisi et al. (2011), the moderately labile P fraction is dynamic and participates in the
availability of P for plant nutrition once moderately labile fraction decreased its participation in total P in soil through time. On the other hand, increment occurred in stable P forms (Figure 3); this P form did not contribute to common bean nutrition as observed by the absence of correlation between stable P forms with APDM, GDM,

2706 Afr. J. Agric. Res. and P accumulated in P-APDM (Table 4).
Generally, the P fertilizer applied was slowly redistributed to moderately labile and stable P forms in the soil due to the reactions with clay-minerals and Fe/Al oxy-hydroxides in the soil. As reported by Novais and Smyth (1999), the contact of P in soil with clay-minerals and Fe/Al oxy-hydroxides through time results in formation of inter sphere complex with high energy of bound. The Si fertilizer affected little quantity the alteration in P forms (Table 6). The preview application of Si fertilizer did not contribute to decrease P fixation. Possibly, the silicate has lower affinity with the bound sites of adsorption than phosphates. Carvalho et al. (2001) observed in soil less weathering higher effects of Si in desorption of P than in soil more weathering as the case of Oxisol.
The moderately labile and stable P forms showed higher amount of P (Figure 3), which is related to high amount of Fe/Al oxy-hydroxides in the soil. The total content of P after common bean cultivation was higher than in the soil without P fertilizer. Basically, the highest amount of total P is due to the exportation by grain to be less than the amount of P fertilizer applied. The increase in total P content may affect some soil chemical as: the natural balance among P forms in soil, its relations with the other nutrients, the microbial biomass, and the rate transfer among environments (Sharpley et al., 1995). Conclusions The preview application of Si fertilizer did not contribute to decrease desorption of P in soil. Possibly, the silicate has lower affinity with the bound sites of adsorption than phosphates. The P fertilizer applied increase majority the moderate labile P fraction followed by labile P fraction. Among the organic P fractions, the NaHCO3-Po fraction was the only one that contributed to the plant nutrition. The Hedley sequential fractionation promoted information about different pools where P was accumulated in the soil after common bean cultivation. The highest amount of P was obtained in stable P fraction, followed by moderately labile and labile P fraction. The moderately labile P fraction decreased after common bean cultivation possibly due to the contact time and redistribution to stable P fraction. The labile form was the lowest P pool in soil; nevertheless, the increase in P fertilizer rates increases the amount of P in labile fraction. Conflict of interests The authors have not declared any conflict of interests. REFERENCES
Alovisi AMT, Furtini Neto AE, Carneiro LF, Curi N, Santos JZL,
Alovisi AA (2011). Dinâmica das formas de fósforo em solos de textura
e mineralogia contrastantes cultivados com arroz. Acta Sci. Agron. 33:171-179.
Alvarez VVH, Novais RF, Dias LE, Oliveira JA (2000). Determinação de fósforo remanescente. Bol. Inf. Soc. Bras. Cien. Solo. 25:27-33.
Araújo MSB, Salcedo IH, Sampaio EVSB (1993). Efeito de fertilizações fosfatadas anuais em solo cultivado com cana-de-açúcar, intensidade e formas de acumulação. Rev. Bras. Cien. Solo. 17:389-396.
Braga JM, Defelipo BV (1974). Determinação espectrofotométrica de fósforo em extratos de solos e plantas. Rev. Ceres. 21:73-85.
Cartes P, Cea M, Jara A, Violante A, Mora ML (2015). Description of mutual interactions between silicon and phosphorus in Andisols by mathematical and mechanistic models. Chemosphere. 131:164-170.
Carvalho R, Furtini Neto AE, Santos CD, Fernandes LA, Curi N, Rodrigues DC (2001). Interações silício-fósforo em solos cultivados com eucalipto em casa de vegetação. Pesqu. Agropecu. Bras. 36:557-565.
Cassagne N, Remaury M (2000). Forms and profile distribution of soil phosphorus in alpine Inceptisols and Spodosols (Pyrenees, France). Geoderma. 95:161-172.
Claessen MEC (Org.) (1997). Manual de métodos de análise de solo. 2.ed. rev. atual. Rio de Janeiro: Embrapa - CNPS. 212p.
Conte E, Anghinoni I, Rheinheimer DS (2003). Frações de fósforo acumulada em latossolo argiloso pela aplicação de fosfato no sistema plantio direto. Rev. Bras. Cien. Solo. 27:893-900.
Cunha GM, Gama-Rodrigues AC, Costa GS, Velloso ACX (2007). Organic phosphorus in diagnostic surface horizons of different brazilian soil orders. R. Bras. Ci. Solo 31:667-671.
Daroub SH, Gerakis A, Ritchie JT, Friesen DK, Ryan J (2003). Development of a soil-plant phosphorus simulation model for calcareous and weathered tropical soils. Agric. Syst. 76:1157-1181.
Day PR (1965). Particle fractionation and particle-size analysis. In: Black CA. (Ed.). Methods of soil analysis. Madison: Am. Soc. Agron. 1:545-556.
Freire JC, Ribeiro MAV, Bahia VG, Lopes AS, Aquino LH (1980). Resposta do milho cultivado em casa de vegetação a níveis de água em solos da região de Lavras (MG). Rev. Bras. Cienc. Solo. 4:5-8.
Furtini Neto AE, Vale FR, Resende AV, Guilherme LRG, Guedes GA (2001). Fertilidade do solo. Lavras: UFLA/FAEPE. 252p.
Grant B, Smith WN, Desjardins R, Lemke R, Li C (2004). Estimated N2O and CO2 emissions as influenced by agricultural practices in Canada. Climatic Change 65:315-332.
Guedes EMS, Fernandes AR, Lima HV, Serra AP, Costa JR, Guedes RS (2012). Impacts of different management systems on the physical quality of an Amazonian oxisol. Rev. Bras. Cienc. Solo. 36:1269-1277.
Guedes RS, Melo LCA, Vergütz L, Rodríguez-Vila A, Covelo EF, Fernandes AR (2016). Adsorption and desorption kinetics and phosphorus hysteresis in highly weathered soil by stirred flow chambre experiments. Soil Till. Res. 162:46-54.
Hedley MJ, Stewart JWB, Chauhan BS (1982). Changes in inorganic soil phosphorus fractions induced by cultivation practices and laboratory incubations. Soil Sci. Soc. Am. J. 46:970-976.
Hinsinger P (2001). Bioavailability of soil inorganic P in the rhizosphere as affected by root-induced chemical changes: a review. Plant Soil. 237:173-195.
Kämpf N, Curi N (2000). Óxidos de Ferro: Indicadores de Ambientes Pedogênicos e Geoquímicos; Novais RF, Alvarez V, Schaefer CEGR. eds.; Tópicos em Ciência do Solo: Viçosa. pp. 107-138.
Kim J, Li W, Philips BL, Grey CP (2011). Phosphate adsorption on the iron oxy-hydroxides goethite (α-FeOOH), akaganeite (β-FeOOH), and lepidocrocite (γ-FeOOH): a 31P NMR study. Energy Environ. Sci. 4:4298-4305.
Lee YB, Kim PJ (2007). Reduction of phosphate adsorption by ion competition with silicate in soil. Korean J. Environ. Agric. 26(4)286-296.
Lilienfein J, Wilcke W, Ayarza MA, Vilela L, Lima SC, Zech W (2000). Chemical fractionation of phosphorus, sulphur, and molybdenum in Brazilian savannah Oxisols Ander different land use. Geoderma. 96:31-46.
Lopez-Hernandez D, Siegert G, Rodriguez JV (1986). Competitive
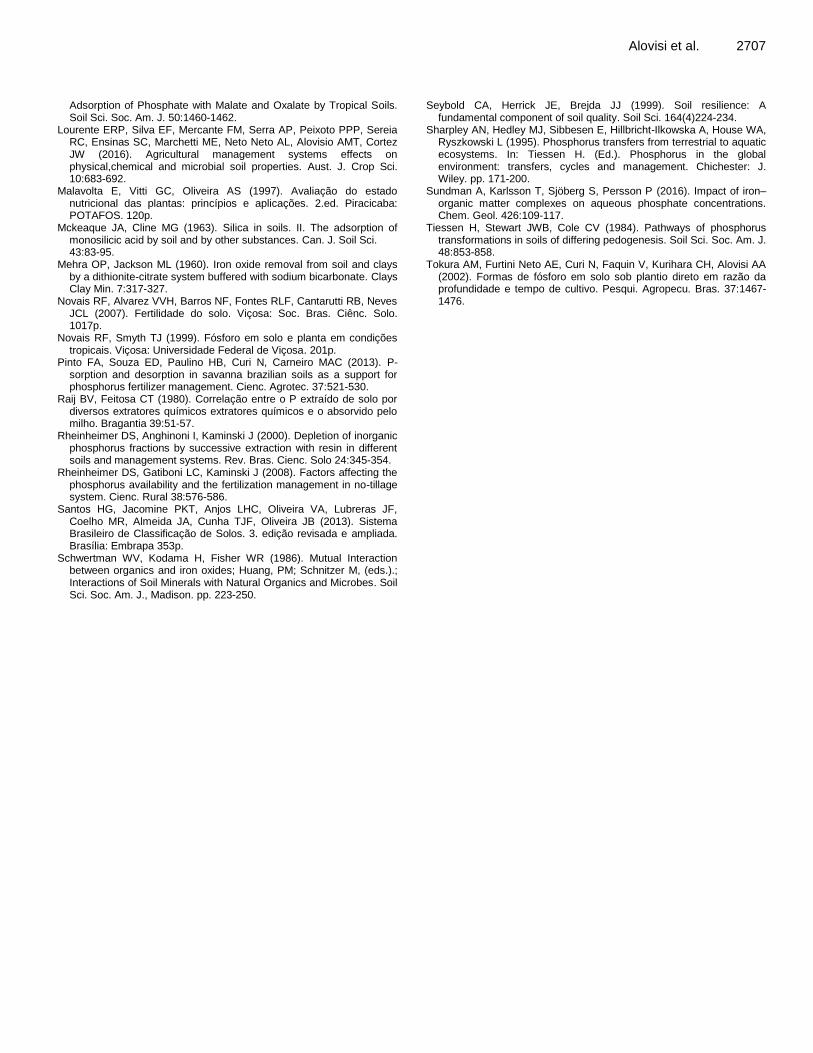
Adsorption of Phosphate with Malate and Oxalate by Tropical Soils. Soil Sci. Soc. Am. J. 50:1460-1462.
Lourente ERP, Silva EF, Mercante FM, Serra AP, Peixoto PPP, Sereia RC, Ensinas SC, Marchetti ME, Neto Neto AL, Alovisio AMT, Cortez JW (2016). Agricultural management systems effects on physical,chemical and microbial soil properties. Aust. J. Crop Sci. 10:683-692.
Malavolta E, Vitti GC, Oliveira AS (1997). Avaliação do estado nutricional das plantas: princípios e aplicações. 2.ed. Piracicaba: POTAFOS. 120p.
Mckeaque JA, Cline MG (1963). Silica in soils. II. The adsorption of monosilicic acid by soil and by other substances. Can. J. Soil Sci. 43:83-95.
Mehra OP, Jackson ML (1960). Iron oxide removal from soil and clays by a dithionite-citrate system buffered with sodium bicarbonate. Clays Clay Min. 7:317-327.
Novais RF, Alvarez VVH, Barros NF, Fontes RLF, Cantarutti RB, Neves JCL (2007). Fertilidade do solo. Viçosa: Soc. Bras. Ciênc. Solo. 1017p.
Novais RF, Smyth TJ (1999). Fósforo em solo e planta em condições tropicais. Viçosa: Universidade Federal de Viçosa. 201p.
Pinto FA, Souza ED, Paulino HB, Curi N, Carneiro MAC (2013). P-sorption and desorption in savanna brazilian soils as a support for phosphorus fertilizer management. Cienc. Agrotec. 37:521-530.
Raij BV, Feitosa CT (1980). Correlação entre o P extraído de solo por diversos extratores químicos extratores químicos e o absorvido pelo milho. Bragantia 39:51-57.
Rheinheimer DS, Anghinoni I, Kaminski J (2000). Depletion of inorganic phosphorus fractions by successive extraction with resin in different soils and management systems. Rev. Bras. Cienc. Solo 24:345-354.
Rheinheimer DS, Gatiboni LC, Kaminski J (2008). Factors affecting the phosphorus availability and the fertilization management in no-tillage system. Cienc. Rural 38:576-586.
Santos HG, Jacomine PKT, Anjos LHC, Oliveira VA, Lubreras JF, Coelho MR, Almeida JA, Cunha TJF, Oliveira JB (2013). Sistema Brasileiro de Classificação de Solos. 3. edição revisada e ampliada. Brasília: Embrapa 353p.
Schwertman WV, Kodama H, Fisher WR (1986). Mutual Interaction between organics and iron oxides; Huang, PM; Schnitzer M, (eds.).; Interactions of Soil Minerals with Natural Organics and Microbes. Soil Sci. Soc. Am. J., Madison. pp. 223-250.
Alovisi et al. 2707 Seybold CA, Herrick JE, Brejda JJ (1999). Soil resilience: A
fundamental component of soil quality. Soil Sci. 164(4)224-234. Sharpley AN, Hedley MJ, Sibbesen E, Hillbricht-Ilkowska A, House WA,
Ryszkowski L (1995). Phosphorus transfers from terrestrial to aquatic ecosystems. In: Tiessen H. (Ed.). Phosphorus in the global environment: transfers, cycles and management. Chichester: J. Wiley. pp. 171-200.
Sundman A, Karlsson T, Sjöberg S, Persson P (2016). Impact of iron–organic matter complexes on aqueous phosphate concentrations. Chem. Geol. 426:109-117.
Tiessen H, Stewart JWB, Cole CV (1984). Pathways of phosphorus transformations in soils of differing pedogenesis. Soil Sci. Soc. Am. J. 48:853-858.
Tokura AM, Furtini Neto AE, Curi N, Faquin V, Kurihara CH, Alovisi AA (2002). Formas de fósforo em solo sob plantio direto em razão da profundidade e tempo de cultivo. Pesqui. Agropecu. Bras. 37:1467-1476.

Vol. 11(30), pp. 2708-2719, 28 July, 2016
DOI: 10.5897/AJAR2016.10884
Article Number: 1755A9A59742
ISSN 1991-637X
Copyright ©2016
Author(s) retain the copyright of this article
http://www.academicjournals.org/AJAR
African Journal of Agricultural Research
Full Length Research Paper
Improvement of maize yield and soil fertility by 2-years compost application in Malawi’s northern districts
Naohiro Matsui1*, Koji Nakata2, Chisambi Cornelius3 and Moyo Macdonald4
1Environment department, The General Environmental Technos Co., Ltd, Osaka, Japan.
2Overseas Agricultural Development Association, Tokyo, Japan.
3Department of Agricultural Research and Service, Ministry of Agriculture and Food Security, Lunyangwa, Malawi.
4Department of Agricultural Research and Service, Ministry of Agriculture and Food Security, Chiteze, Malawi.
Received 9 February, 2016; Accepted 2 June, 2016
Fertilizer use in Malawi is limited due to the relatively high fertilizer price, improvement of fertilizer efficiency is therefore necessary to enhance both maize yield and soil fertility. 2-years compost application was conducted to evaluate its effectiveness in improving soil fertility and enhancing maize yields. Compost application was shown to be effective even at the early stage of application in improving soil fertility and consequently enhancing maize yields. Before compost application, soil fertility was quite poor reflected in a low maize yield (0 to 1.5 t/ha), however compost application made 2 to 4 times larger maize yields. Despite the sufficient amount of N (92 kgN/ha), single application of chemical fertilizer adversely affected maize yield coupled with the poor initial growths. Soil moisture content became 4 times larger with compost application with a shift from 5 to 20%. Moreover, CEC was improved from 10.2 meq/100mg to 13.7 meq/100mg by compost application, resulting in an increase of nutrient retention capacity. Soil C % decreased in 2.5 years if no compost was applied, but soil C % increased by compost application. As such compost application can be effective to maintain soil C % for enhancement of soil fertility. Nitrogen use efficiency (NUE) was greatly improved 2 to 5 times larger when chemical fertilizer (46 kgN) was applied mixed with compost while a single chemical fertilizer application (92 kgN) represented lower NUE than mixed application. Keywords: compost, maize yield, soil fertility, CEC, soil C, nitrogen use efficiency
INTRODUCTION Soil fertility and land productivity have been declining and becoming a significant problem in the sub-Saharan African countries including Malawi. This problem is now explicitly perceived as major constraint by farmers (Budelman and Defoer, 2000; Tully et al., 2015). Malawi
government started the Farm Input Subsidy Program (FISP) in 2005 which was a large scale, national program aimed at enhancing household food security. However, fertilizer prices rose dramatically in 2007 and 2008 (Yara, 2008), doubling the cost of the FISP and leading to a
*Corresponding author. E-mail: [email protected].
Author(s) agree that this article remain permanently open access under the terms of the Creative Commons Attribution
License 4.0 International License

projected budget shortfall of almost US$80 million. This rise in fertilizer prices is caused by the vulnerability of Malawi to international market, which is exacerbated by being landlocked (Denning et al., 2009) illustrated by the fact that a metric ton of urea which cost about U.S. $90 FOB (free on board) in Europe, arrive in Malawi at 8 times higher price of $770 (Sanchez, 2002). Given the high cost of fertilizer, efficient use of N fertilizer is of both agroeconomic and environmental importance.
According to the study conducted by IFA (1992), 50% of total arable land for maize was fertilized with the amount of 26 kg/ha in Malawi. This figure is rather low considering that the average value of fertilizer rate between 1994 and 1996 was 136 kg/ha in the world, and 55 kg/ha in Africa (FAO, 2006). Besides a low application rate of fertilizer, many Malawian farmers find fertilizer use to be of limited profitability or even negative effect (Ricker-Gilbert and Jayne, 2011; Kamanga et al., 2014). A profitability of fertilizer use is a constraint to its use on maize so that fertilizer efficiency, especially N use efficiency shall be improved.
The improvement of soil fertility status through the use of organic matter applications has been demonstrated by a number of researchers in Malawi (Sakala, 2003; Mustafa-Msukwa et al, 2011; Thierfelder et al. 2015). Compost application shall be a promising measure for enhancing soil fertility as a part of organic matter based technologies (Kumwenda et al., 1997; Scotti et al. 2015; Solomon and Jafer 2015). Since soils in Malawi are inherently poor in organic matter, nutrient retention capacity is low, and a leaching rate is high. An increase of the N-use efficiency by compost application is therefore quite necessary to decrease leaching loss.
Sustainable land management promotion (SLMP) project started in November, 2011 by the collaboration between Malawi and Japanese Governments with the objective of “Enforcement of technology to increase soil fertility” through compost application. Towards this, this study was carried out to evaluate its effectiveness of compost application both to improve soil fertility and to enhance maize growths in two crop seasons at 2013/14 and 2014/15. MATERIALS AND METHODS Experiment locations The 2 years maize growing study was conducted to evaluate effects of compost application in the four stations, Lunyangwa (LNG), Banga (BNG), Mkondezi (MKD) and Ntchenachena (NTC) of the Department of Agricultural Research Services (DARS) in the northern Malawi (Figure 1). Average rainfall in the cropping season between October and May during 2002 to 2013 was 1,008 mm in LNG, 1,219 mm in BNG, 1,439 mm in MKD and 1,346 mm in NTC. Variety SC637 was cultivated for the maize growing test in both cropping seasons of 2013/14 and 2014/15. Split-plot having 3 x 3.5 m was designed with three replications. In order to avoid the border effects, two middle rows of each split-plot were harvested and weighted fresh maize grain in situ was converted to dry yield (t/ha)
Matsui et al. 2709 after drying. Compost preparation Different methods were adopted for compost making as shown in Figure 2. Windrow was made by placing the mixture of raw materials in a long narrow piled called wind-row while Changu was made by piling in a circle forming a conical shape. Application rates of composts were calculated based on N content which aims to determine the analysis. N content was adjusted to 92 kgN/ha which is the Malawian recommendation level described in the Guide to Agricultural Production (Ministry of Agriculture; MOA 1991). 46 kgN at basal and the remaining 46 kgN was applied at top dressing (Table 1). In a single chemical fertilizer application, two different application rates, recommended rate (RCF) (92 kgN/ha) and conventional rate (CCF) (46 kgN/ha) were applied by NPK at basal and urea at top dressing. Soil analysis Soil analysis was carried out to determine both current soil fertility level and effects of compost application on soil fertility. For the analysis, the analytical laboratory was established for the first time in the northern region of Malawi in SLMP. Moisture content was measured from samples collected with a 100 cc stainless steel cylinder. Sand content was measured by the nylon mesh method (Moritsuka et al. 2015). pH, Na and EC were measured after shaking soil samples for 1 h at a soil-to-water ratio of 1:5. K, NO3, Na were measured by the Ion meters (HORIBA LAQUA twin, the model B-731 for K, B-741 for NO3 and B-722 for Na). Available P was determined using the spectrophotometer (BELLSTONE WSP-UV800A) with the extraction solution by Mehlich III (Mehlich, 1984). Total C and N contents were determined by the Walkley-Black method (Walkley and Black, 1934) and by micro Kjeldahl method (AOAC 1995), respectively. Cation exchange capacity (CEC), calcium and magnesium were measured by Kjeldahl Ammonia Distillation method and by Complexometric Determination (Niina, 1960). For the results of maize yields and soil analysis, statistical analysis was conducted using the software JMP 8.0.2 version for Windows (SAS Inc., 2009). Tukey-kramer HSD test was performed for F-test at a significance level either at 0.1 or 0.5. N efficiency has been defined in different terms and at different scales by various researchers, but the concept of N efficiency is very useful for implementing a wise fertilizer use. The study adopted the definition used in Zimbabwe (Vanlauwe et al., 2011) in which an increase of grain yield per unit of fertilizer N applied over the unfertilized production is defined as Nitrogen Use Efficiency (NUE).
RESULTS, DISCUSSION AND CONCLUSION Maize yield
Table 2 and Table 3 showed the yield results (dry grain weight) from the maize growing test at the four stations in 2014 and 2015. In 2-years experiment, higher average yields in the compost application were recorded in BNG, NTC while the lowest yield was recorded in MKD. Effects of compost application didn’t vary a lot between two methods and among the three environments. Yields in mixture were notably high, and which were higher than chemical fertilizer application (RCF, CCF) except for LNG 2014 (Table 2).

2710 Afr. J. Agric. Res.
Figure 1. Locations of the four research stations where this study was conducted.
The yields in no treatment plot can be considered as the current soil fertility which is not influenced by any treatments, and which increased in the order of MKD (0.00 t/ha) < LNG (0.82 t/ha) < BNG (0.95 t/ha) < NTC (1.51 t/ha). These figures are low considering that average maize yield (t/ha) in 2008 to 2010 was 5.15 for world and 1.81 for Sub-Sharan Africa (FAOSTAT, 2013). No yield was recorded in MKD showing the current soil fertility is extremely low. Maize yields of other stations were almost as same as national average yield which was 1.3 metric tons per hectare (t/ha) during the 20 years from 1998 to 2007 (FAO, 2008).
Comparing to the existing soil fertility, compost application produced higher yields and their effects were as high as those of chemical fertilizer. RCF was the
second lowest yield despite having the same N content as compost application. RCF was two times higher in N application rates than CCF, but yields of RCF were inferior than those of CCF. This fact indicates that N amount was not a determinant factor for maize yield in the studied soils. Moreover, the current soil fertility (No treatment) was almost the same in LNG and BNG but effects of compost application on maize yields were significantly higher in BNG, showing that there is a certain condition to activate effects of compost application.
Yields in 2015 increased from 2014 in most of stations except for MKD. In 2014, compost application produced high yields as chemical fertilizer in BNG, NTC and even superior yields in LNG, MKD. RCF showed a quite low
(NTC)
(LNG)
(BNG)
(MKD)
Nkhatabay
Rumphi
Mzimba North
Mzimba South
Banga
Mkondezi
Ntchenachena
Lunyangwa
(MKD)
(BNG)
(LNG)
(NTC) Lilongwe
Blantyre
Mzuzu

Matsui et al. 2711
Figure 2. Three different environments and two methods examined in this study.
yield and survival rate in LNG while the mixture plot produced the highest yield (Figure 3). Growth difference among treatments became relevant 4 weeks after germination in MKD (Figure 4) as shown by poor crop developments in CCF, RCF in contrast to compost (Changu and Windrow) and Mixture.
Two years comparison showed different tendency regarding compost application effects (Figure 5). A significant decline of yield together with quite low survival rate was observed in RCF at LNG while both yield and survival rate were highest in Mixture. Rainfall in 10 to 15 days between male flowering and silk emergence is considered to be most important for maize growths since it influences effective growth and grain formation (Araus
et al., 2012). Rainfall during this period in 2014 was 101 mm but only 61 mm in 2015 in MKD. Lesser amount of rainfall was attributable to the decline of maize yield from 2014 to 2015. NTC also showed highest yield in mixture which was 4 times higher than no-treatment (Control). Changes of soil properties in two years Soil chemical properties Soil chemical properties determined before and after 2 seasons of compost application, were compared. Soils were weakly acidic to acidic before compost application
3 environments
Open
Shade
Plastic
Windrow
Changu
2 methods
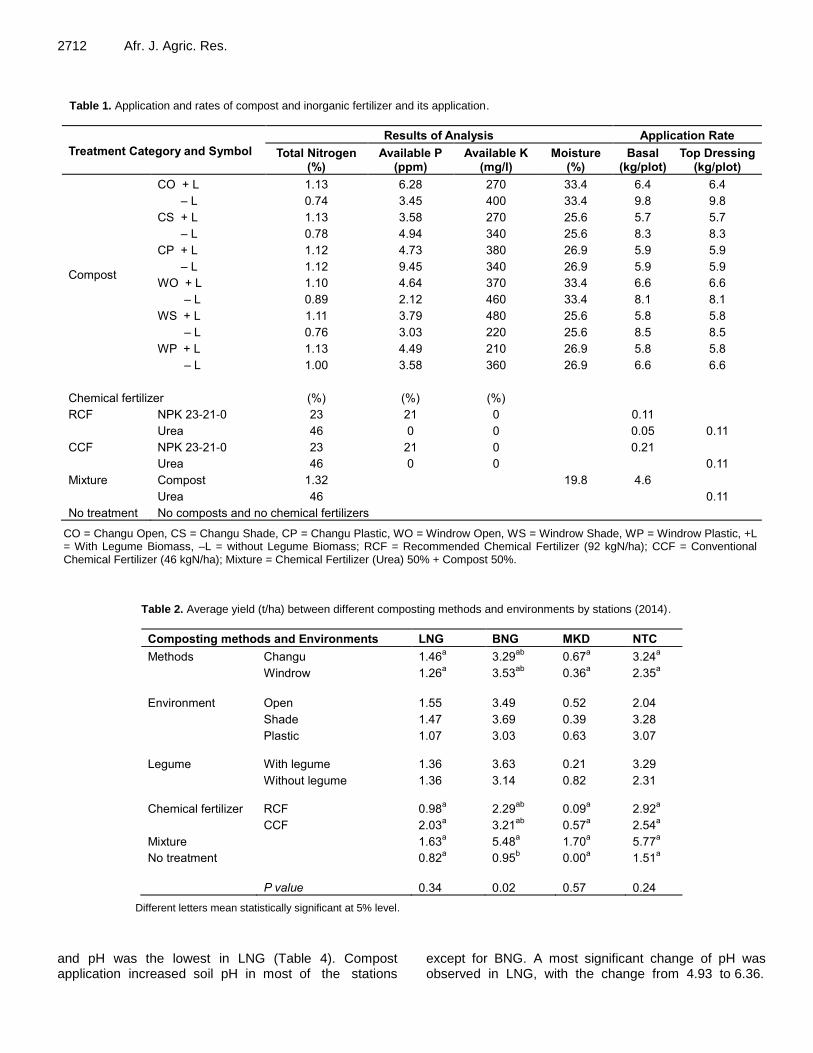
2712 Afr. J. Agric. Res.
Table 1. Application and rates of compost and inorganic fertilizer and its application.
Treatment Category and Symbol
Results of Analysis Application Rate
Total Nitrogen (%)
Available P (ppm)
Available K (mg/l)
Moisture (%)
Basal (kg/plot)
Top Dressing (kg/plot)
Compost
CO + L
– L
1.13
0.74
6.28
3.45
270
400
33.4
33.4
6.4
9.8
6.4
9.8
CS + L
– L
1.13
0.78
3.58
4.94
270
340
25.6
25.6
5.7
8.3
5.7
8.3
CP + L
– L
1.12
1.12
4.73
9.45
380
340
26.9
26.9
5.9
5.9
5.9
5.9
WO + L
– L
1.10
0.89
4.64
2.12
370
460
33.4
33.4
6.6
8.1
6.6
8.1
WS + L
– L
1.11
0.76
3.79
3.03
480
220
25.6
25.6
5.8
8.5
5.8
8.5
WP + L
– L
1.13
1.00
4.49
3.58
210
360
26.9
26.9
5.8
6.6
5.8
6.6
Chemical fertilizer (%) (%) (%)
RCF NPK 23-21-0
Urea
23
46
21
0
0
0
0.11
0.05
0.11
CCF NPK 23-21-0
Urea
23
46
21
0
0
0
0.21
0.11
Mixture Compost
Urea
1.32
46
19.8
4.6
0.11
No treatment No composts and no chemical fertilizers
CO = Changu Open, CS = Changu Shade, CP = Changu Plastic, WO = Windrow Open, WS = Windrow Shade, WP = Windrow Plastic, +L = With Legume Biomass, –L = without Legume Biomass; RCF = Recommended Chemical Fertilizer (92 kgN/ha); CCF = Conventional Chemical Fertilizer (46 kgN/ha); Mixture = Chemical Fertilizer (Urea) 50% + Compost 50%.
Table 2. Average yield (t/ha) between different composting methods and environments by stations (2014).
Composting methods and Environments LNG BNG MKD NTC
Methods Changu 1.46a 3.29
ab 0.67
a 3.24
a
Windrow 1.26a 3.53
ab 0.36
a 2.35
a
Environment Open 1.55 3.49 0.52 2.04
Shade 1.47 3.69 0.39 3.28
Plastic 1.07 3.03 0.63 3.07
Legume With legume 1.36 3.63 0.21 3.29
Without legume 1.36 3.14 0.82 2.31
Chemical fertilizer RCF 0.98a 2.29
ab 0.09
a 2.92
a
CCF 2.03a 3.21
ab 0.57
a 2.54
a
Mixture 1.63a 5.48
a 1.70
a 5.77
a
No treatment 0.82a 0.95
b 0.00
a 1.51
a
P value 0.34 0.02 0.57 0.24
Different letters mean statistically significant at 5% level.
and pH was the lowest in LNG (Table 4). Compost application increased soil pH in most of the stations
except for BNG. A most significant change of pH was observed in LNG, with the change from 4.93 to 6.36.

Matsui et al. 2713
Table 3. Average yield (t/ha) between different composting methods and environments by stations (2015).
Composting methods and Environments LNG BNG MKD NTC
Methods Changu 2.78ab
6.28a 0.46
a 5.24
b
Windrow 2.04abc
5.63a 0.35
a 5.08
b
Environment Open 2.41 5.52 0.26 4.73
Shade 2.27 5.33 0.44 5.69
Plastic 2.55 5.51 0.45 5.06
Legume With legume 2.49 6.08 0.36 5.27
Without legume 2.33 5.70 0.46 5.05
Chemical fertilizer RCF 0.11c 6.44
a 0.03
a 4.00
bc
CCF 1.84abc
5.81a 0.07
a 3.72
bc
Mixture 3.45a 6.75
a 0.77
a 8.03
a
No treatment 0.86bc
2.65a 0.08
a 1.75
c
P value < 0.001 0.33 0.20 < 0.001
Different letters mean statistically significant at 5% level.
Figure 3. Growths conditions of the trials, mixture (left) and in RCF plot (right) in LNG, 2015.
Acidity amelioration by compost application would be more effective if soils are quite acidic and not coarse texture.
pH also significantly changed by chemical fertilizer application (CCF and RCF), and by mixed application of compost and chemical fertilizer. Since pH in no treatment plot showed no significant difference in two years, pH increase in chemical fertilizer plots would be due to the fact that one H
+ ion is absorbed by the plant (or OH
-
excreted) at the uptake of nitrate. Good quality topsoil should have EC within the range of
100 to 1500 μS/cm (Bardgett, 2005). EC before and even after compost application were mostly less than 100 µS/cm showing soil fertility level was low. Low soil fertility
also was reflected in low content of NO3, K and P. Since changes of EC in two years were only significant in BNG, soil fertility improvement was not sufficient by 2-yrs compost application.
Soil C % is the key of soil fertility and all stations showed C % was less than 1.0 % (Table 4). In 2.5 years from December , 2012 to May, 2015 soil C % decreased significantly in no treatment and CCF while no significant change was recorded in Changu and significant increase was recorded in Windrow (Table 5). 15 ton/ha of compost was applied in this study however this amount was not enough to increase soil C in Changu and Mixture, but was only able to maintain current soil C level. Since soil C level was quite low in the study area, further study to

2714 Afr. J. Agric. Res.
Figure 4. Growths conditions at the different treatments 4 weeks after germination in MKD (No: no treatment, RCF; recommended chemical fertilizer, CCF: conventional chemical fertilizer, C + CF: mixture of compost and chemical fertilizer).
increase current C % by compost application will be necessary in terms of application amount and compost quality.
Soil physical properties Soil moisture content
Keeping a good range of soil moisture content is important for agriculture practice. When a moisture content is low, microbial activity is hampered and then important N source as microbial biomass cannot be expected. Compost can be counter-measure against drought. US compost council (2008) has stated that the frequency and intensity of irrigation may be reduced by compost because of its drought resistance and efficient water use. Water holding capacity can be increased even in sandy soils with the addition of compost. As most of project site soils are sandy, effect of compost application would be highly expected.
Soil moisture content changed after compost application in MKD and BNG (Figure 6). At MKD, soil water contents before compost application were around 5%, but it increased over 20 % which is almost 4 times higher. Likewise, 10% increase in Changu and Windrow, and 15 % in Bokasi at BNG. As over 20% of moisture content was reported as an appropriate maize growth (Quaye et al., 2009), an increased soil water content by compost application in this study could have attributed to an increased in maize yield.
Improvement of CEC
Sandy soils such as this study soils are subject to a significant nutrient leaching unless proper measure is not provided. Compost application will help to refrain the soil from leaching because negatively charged compost attracts positively charged bases such as Mg
++, Ca
++ and
K+. Also, compost indirectly reserve N in soils. Microorganisms digest organic matter (composts) and
No RCF CCF Changu Mixture
C + CF Windrow

Matsui et al. 2715
Figure 5. Maize yields and survival rates in the growing tests at the four stations in 2014 and 2015. Different letters among the treatments indicate the significance at the 5% level.
Lunyangwa (LNG)
2014 2015
Banga (BNG)
2014 2015
Mkondezi (MKD)
2014 2015
Low yield in MKD could be attributable to a shortage of rainfall.
aa
a
a
abc
a
aab
bcc
a
abc
0
10
20
30
40
50
60
70
80
90
100
0.0
0.5
1.0
1.5
2.0
2.5
3.0
3.5
4.0
Changu Windrow RCF100 CCF100 Mixture Control
Surviva
l rate
(%)
Yie
ld (
t/h
a)
Dry wt.(t/ha)
Plant survival rate (%)
ab
abc
c
abc
a
bc
a a
b
ab
a
ab
0.0
10.0
20.0
30.0
40.0
50.0
60.0
70.0
80.0
90.0
100.0
0.0
0.5
1.0
1.5
2.0
2.5
3.0
3.5
4.0
Changu Windrow RCF100 CCF100 Mixture Control
Surviva
l rate
(%)
Yie
ld (
t/h
a)
Dry wt.(t/ha)
Plant survival rate (%)
ab
a
bc
abc…
a
c
a
ab
a aa a
0
10
20
30
40
50
60
70
80
90
100
0.0
1.0
2.0
3.0
4.0
5.0
6.0
7.0
Changu Windrow RCF100 CCF100 Mixture Control
Surviva
l rate
(%)
Yie
ld (
t/h
a)
Dry wt.(t/ha)
Plant survival rate (%)
a
aa
a
a
b
a
aa
aa a
0
10
20
30
40
50
60
70
80
90
100
0.0
1.0
2.0
3.0
4.0
5.0
6.0
7.0
Changu Windrow RCF100 CCF100 Mixture Control
Surviva
l rate
(%)
Yie
ld (
t/h
a)
Dry wt.(t/ha)
Plant survival rate (%)
a a
a
a
a
a
a
a
a
a
a
0
10
20
30
40
50
60
70
80
90
100
0.0
0.2
0.4
0.6
0.8
1.0
1.2
1.4
1.6
1.8
2.0
Changu Windrow RCF100 CCF100 Mixture Control
Surviva
l rate
(%)
Yie
ld (
t/h
a)
Dry wt.(t/ha)
Plant survival rate (%)
aa
a a
a
a
a a
a
a
a
a
0
10
20
30
40
50
60
70
80
90
100
0.0
0.2
0.4
0.6
0.8
1.0
1.2
1.4
1.6
1.8
2.0
Changu Windrow RCF100 CCF100 Mixture Control
Surviva
l rate
(%)
Yie
ld (
t/h
a)
Dry wt.(t/ha)
Plant survival rate (%)
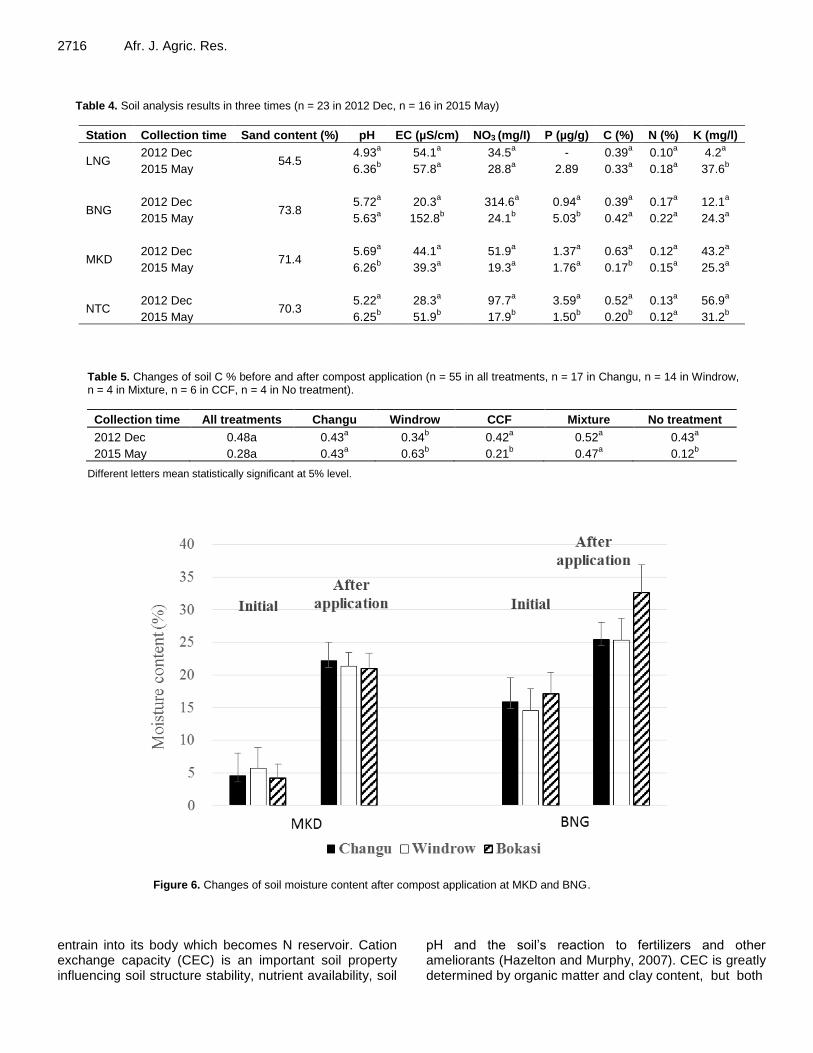
2716 Afr. J. Agric. Res.
Table 4. Soil analysis results in three times (n = 23 in 2012 Dec, n = 16 in 2015 May)
Station Collection time Sand content (%) pH EC (µS/cm) NO3 (mg/I) P (µg/g) C (%) N (%) K (mg/l)
LNG 2012 Dec
54.5 4.93
a 54.1
a 34.5
a - 0.39
a 0.10
a 4.2
a
2015 May 6.36b 57.8
a 28.8
a 2.89 0.33
a 0.18
a 37.6
b
BNG 2012 Dec
73.8 5.72
a 20.3
a 314.6
a 0.94
a 0.39
a 0.17
a 12.1
a
2015 May 5.63a 152.8
b 24.1
b 5.03
b 0.42
a 0.22
a 24.3
a
MKD 2012 Dec
71.4 5.69
a 44.1
a 51.9
a 1.37
a 0.63
a 0.12
a 43.2
a
2015 May 6.26b 39.3
a 19.3
a 1.76
a 0.17
b 0.15
a 25.3
a
NTC 2012 Dec
70.3 5.22
a 28.3
a 97.7
a 3.59
a 0.52
a 0.13
a 56.9
a
2015 May 6.25b 51.9
b 17.9
b 1.50
b 0.20
b 0.12
a 31.2
b
Table 5. Changes of soil C % before and after compost application (n = 55 in all treatments, n = 17 in Changu, n = 14 in Windrow, n = 4 in Mixture, n = 6 in CCF, n = 4 in No treatment).
Collection time All treatments Changu Windrow CCF Mixture No treatment
2012 Dec 0.48a 0.43a 0.34
b 0.42
a 0.52
a 0.43
a
2015 May 0.28a 0.43a 0.63
b 0.21
b 0.47
a 0.12
b
Different letters mean statistically significant at 5% level.
Figure 6. Changes of soil moisture content after compost application at MKD and BNG.
entrain into its body which becomes N reservoir. Cation exchange capacity (CEC) is an important soil property influencing soil structure stability, nutrient availability, soil
pH and the soil’s reaction to fertilizers and other ameliorants (Hazelton and Murphy, 2007). CEC is greatly determined by organic matter and clay content, but both
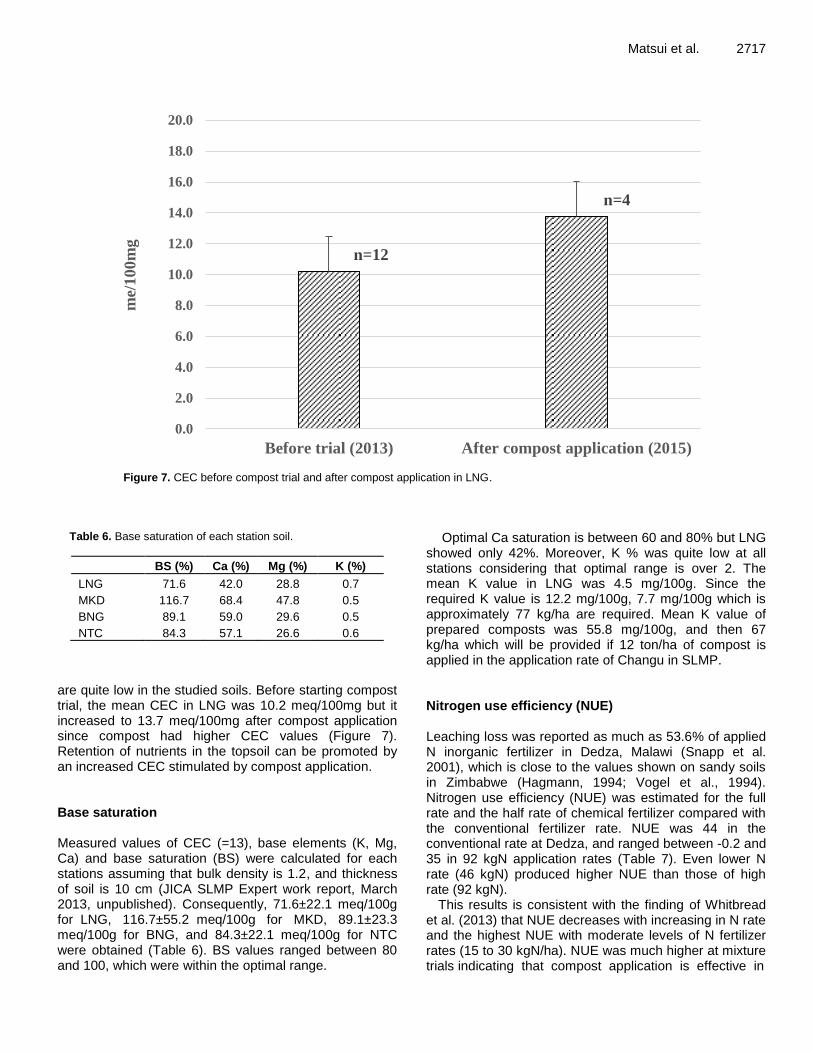
Matsui et al. 2717
Figure 7. CEC before compost trial and after compost application in LNG.
Table 6. Base saturation of each station soil.
BS (%) Ca (%) Mg (%) K (%)
LNG 71.6 42.0 28.8 0.7
MKD 116.7 68.4 47.8 0.5
BNG 89.1 59.0 29.6 0.5
NTC 84.3 57.1 26.6 0.6
are quite low in the studied soils. Before starting compost trial, the mean CEC in LNG was 10.2 meq/100mg but it increased to 13.7 meq/100mg after compost application since compost had higher CEC values (Figure 7). Retention of nutrients in the topsoil can be promoted by an increased CEC stimulated by compost application. Base saturation Measured values of CEC (=13), base elements (K, Mg, Ca) and base saturation (BS) were calculated for each stations assuming that bulk density is 1.2, and thickness of soil is 10 cm (JICA SLMP Expert work report, March 2013, unpublished). Consequently, 71.6±22.1 meq/100g for LNG, 116.7±55.2 meq/100g for MKD, 89.1±23.3 meq/100g for BNG, and 84.3±22.1 meq/100g for NTC were obtained (Table 6). BS values ranged between 80 and 100, which were within the optimal range.
Optimal Ca saturation is between 60 and 80% but LNG showed only 42%. Moreover, K % was quite low at all stations considering that optimal range is over 2. The mean K value in LNG was 4.5 mg/100g. Since the required K value is 12.2 mg/100g, 7.7 mg/100g which is approximately 77 kg/ha are required. Mean K value of prepared composts was 55.8 mg/100g, and then 67 kg/ha which will be provided if 12 ton/ha of compost is applied in the application rate of Changu in SLMP. Nitrogen use efficiency (NUE) Leaching loss was reported as much as 53.6% of applied N inorganic fertilizer in Dedza, Malawi (Snapp et al. 2001), which is close to the values shown on sandy soils in Zimbabwe (Hagmann, 1994; Vogel et al., 1994). Nitrogen use efficiency (NUE) was estimated for the full rate and the half rate of chemical fertilizer compared with the conventional fertilizer rate. NUE was 44 in the conventional rate at Dedza, and ranged between -0.2 and 35 in 92 kgN application rates (Table 7). Even lower N rate (46 kgN) produced higher NUE than those of high rate (92 kgN).
This results is consistent with the finding of Whitbread et al. (2013) that NUE decreases with increasing in N rate and the highest NUE with moderate levels of N fertilizer rates (15 to 30 kgN/ha). NUE was much higher at mixture trials indicating that compost application is effective in
n=12
n=4
0.0
2.0
4.0
6.0
8.0
10.0
12.0
14.0
16.0
18.0
20.0
Before trial (2013) After compost application (2015)
me/
10
0m
g

2718 Afr. J. Agric. Res. Table 7. Nitrogen balance and N use efficiency (NUE) in Dedza and SLMP project (Upper row; conventional 92 kgN, lower row; compost mixed 46 kgN).
LNG 2014/15 BNG 2014/15 MKD 2014/15 NTC 2014/15 Dedza (Snapp et al. 2001)
Fertilizer rate (kg N ha-1
) 92 92 92 92
69 46 46 46 46
Maize yield (kg N ha-1
) 1.836 6.214 72 3.716
3.033 3.453 6.443 812 8.035
Removal N by harvest (kg N ha-1
) 32 105 3.1 63
52 59 108 15 135
N leached (kg N ha-1
) - - - - 37
NUE (kg maize/kg N applied) 10.6 35 -0.2 21.4
44 56.3 75 15 136.6
increasing NUE. ACKNOWLEDGMENTS This research was conducted within the project “Sustainable land management promotion (SLMP) project” durated from 2011 to 2015 with the participation of the Ministry of Agriculture, Food security (MoAFS), Malawi and Japan International Cooperation Agency (JICA). The authors are deeply indebted to local farmers, for their valuable work on compost making. Conflict of interests The authors have not declared any conflict of interests. REFERENCES
AOAC (Association of Official Analytical Chemists) (1995). Official
methods of analysis, vol. II. AOAC, Washington, DC. Araus JL, Serret MD, Edmeades GO (2012). Phenotyping maize for
adaptation to drought. Front Physiol. 10(3):305. Bardgett R (2005). The Biology of Soil: A community and ecosystem
approach. Oxford University Press, Oxford. Budelman A, Defoer T (2000). Not by nutrient alone: a call to broaden
the soil fertility initiative. Nat. Resour. Forum 24:173-184. Denning G, Kabambe P, Sanchez P, Malik A, Flor R, Harawa R (2009).
Input Subsidies to Improve Smallholder Maize Productivity in Malawi: Toward an African Green Revolution. PLoS Biol. 7(1):e1000023.
FAO (2006). Fertilizer use by crop. Fertilizer and plant nutrition bulletin 17. FAO, Rome
FAOSTAT (2008). FAOSTAT database. Production: Crops. http://faostat.fao.org/site/567/default.aspx
FAO (2013). FAOSTAT Online Statistical Service. Rome: FAO available online at http://faostat.fao.org
Hagmann J (1994). Lysimeter measurement of nutrient losses from a sandy soil under conventional-till and ridge-till. In: B.E. Jensen et al.
(ed.) Soil tillage for crop production and protection of the environment. Proc. of the 13
th Int. Conf., Int. Soil Tillage Res.
Organisation (ISTRO), Aalbourg, Denmark. 24-29 July 1994. Int. Soil Tillage Res. Organisation, Aabourg. pp. 305-310.
Hazelton P, Murphy B (2007). Interpreting soil test results. What do all the numbers mean? CSIRO Publishing, Victoria.
International Fertilizer Industry Association (IFA) (1992). International Fertilizer Development Center (IFDC), and Food and Agricultural Organization of the United Nations (FAO). Fertilizer Use by Crop. Rome
Kamanga BCG, Waddington SR, Almekinders CJM, Giller KE (2014). Improving the efficiency of use of small amounts of nitrogen and phosphorus fertilizer on smallholders maize in Central Malawi. Exp. Agric. 50(2):229-249.
Kumwenda JDT, Waddington SR, Snapp SS, Jones RB, Blackie MJ (1997). Soil fertility management in the smallholder maize-based cropping systems of Africa. In: The Emerging Maize Revolution in Africa: The Role of Technology, Institution and Policy. Michigan State University, USA.
Mehlich A (1984). Mehlich 3 soil test extractant: A modification of Mehlich 2 extractant. Commun. Soil Sci. Plant Anal.15:1409-1416.
MOA (Ministry of Agriculture) (1991). Malawi guide to agriculture production. Lilongwe, Malawi: Ministry of Agriculture, Government of Malawi 120 pp.
Moritsuka N, Izawa G, Katsura K, Matsui N (2015). Simple method for measuring soil sand content by nylon mesh sieving. Soil Sci. Plant Nutr. 61(3):1-5
Mustafa-Msukwa AK, Mutimba JK, Masangano C, Edriss AK (2011). An assessment of the adoption of compost manure by smallholder farmers in Balaka district, Malawi. S. Afr. J. Agric. Ext. 39:17-25.
Niina K (1960). Complexometric Determination of Calcium and Magnesium-II-Application to soil analysis -The determination of calcium and magnesium in soil extracts-. Bulletin Forestry and Forestry Production Research Institute, Japan 128:145-158.
Quaye AK, Laryea KB, Abeney-Mickson S (2009). Soil Water and Nitrogen Interaction Effects on Maize (Zea mays L.) Grown on a Vertisol. J. For. Horic. Soil Sci. 3:1.
Ricker-Gilbert J, Jayne TS (2011). What are the Enduring Effects of Fertilizer Subsidy Programs on Recipient Farm Households? Evidence from Malawi. Staff Paper Series. Department of Agricultural, Food, and Resource Economics, Michigan State University.
Sakala WD, Kumwenda JDT, Saka AR (2003). The potential of green manures to increase soil fertility and maize yields in Malawi. Biol. Agric. Hortic. 21:121-130.

Sanchez PA (2002). Soil fertility and hunger in Africa. Science
295(5562):2019-2020. SAS Institute Inc (2009). SAS/STAT® 9.2User’s Guide, Second Edition.
Cary, NC: SAS Institute Inc. Scotti R, Bonanomi G, Scelza R, Zoina A, Rao MA (2015). Organic
amendments as sustainable tool to recovery fertility in intensive agricultural systems. J. Soil Sci. Plant Nutr. 15(2):333-352.
Snapp SS, Borden HR, Rohrbach DD (2001). Improving nitro- gen efficiency: Lessons from Malawi and Michigan. In J. Galloway et al. (ed.) Optimizing nitrogen management in food and energy production and environmental protection. 2nd Int. Nitrogen Conf. Papers, Potomac,MD. A.A. Balkema Publ., Lisse/Abingdon/Exton/Tokyo pp. 42-48.
Solomon E, Jafer D (2015). Yield Response of Maize to Integrated Soil Fertility Management on Acidic Nitosol of Southwestern Ethiopia. J. Agron. 14:152-157.
Thierfelder C, Bunderson WT, Mupangwa W (2015). Evidence and lessons learned from long-term on-farm research on conservation agriculture systems in communities in Malawi and Zimbabwe. Environments 2:317-337.
Tully K, Sullivan C, Weil R, Sanchez P (2015). The state of soil degradation in Sub-Saharan Africa: Baselines, trajectories, and solutions. Sustainability 7:6523-6552.
US Composting Council (2008). Compost and its benefits. Factsheet, US Composting Council, Bethesda, MD.
Matsui et al. 2719 Vanlauwe B, Kihara J, Chivenge P, Pypers P, Coe R, Six J (2011).
Agronomic use efficiency of N fertilizer in maize-based systems in sub-Saharan Africa within the context of integrated soil fertility management, Plant Soil 339:35–50.
Vogel H, Hyangumbo I, Olsen K (1994). Effect of tied ridging and mulch ripping on water conservation in maize production on sandveld soils. Der Tropenlandwirt 95:33-44.
Walkley A, Black IA (1934). An examination of the Degtjareff method for determining soil organic matter, and a proposed modification of the chromic acid titration method. Soil Sci. 37:29-38.
Yara (2008). The Fertilizer Market. http://yara.com/investor_relations/annual_report_archive/2008/financial_md_a/business_environment/

Vol. 11(30), pp. 2720-2729, 28 July, 2016
DOI: 10.5897/AJAR2016.11202
Article Number: E15A72659748
ISSN 1991-637X
Copyright ©2016
Author(s) retain the copyright of this article
http://www.academicjournals.org/AJAR
African Journal of Agricultural Research
Full Length Research Paper
Physical and physicochemical attributes of noni fruits fertilized with cattle manure and potassium
Antônio Gustavo de Luna Souto1*, Lourival Ferreira Cavalcante2, Vânia da Silva Fraga3, Belísia Lúcia Moreira Toscano Diniz4, Maria Rosimeire Miguel da Silva3, Roberto Monteiro Ferreira Filho3, Evandro Franklin Mesquita5, Stênio Andrey Guedes Dantas1 and Francisco
Vanies da Silva Sá6
1Programa de Pós-graduação em Fitotecnia, Universidade Federal de Viçosa, Viçosa-MG, Brazil.
2Programa de Pós Graduação em Agronomia, Universidade Federal da Paraíba, CEP: 58397-000, Areia-PB, Brazil.
3Programa de Pos Graduação em Ciência do Solo, Universidade Federal da Paraíba, CEP: 58397-000, Areia-PB,
Brazil. 4Departamento de Agricultura, Universidade Federal da Paraíba, CEP: 58220-000, Bananeiras-PB, Brazil.
5Departamento de Agrárias e Exatas, Universidade Estadual da Paraíba, Catolé do Rocha-PB Brazil. CEP: 58884-000. 6Centro de Tecnologia de Recursos Naturais, Universidade Federal de Campina Grande, Campina Grande-PB, Brazil.
CEP: 58429-900
Received 9 May, 2016; Accepted 20 July, 2016
Noni has been introduced in Brazil just over a decade ago. Therefore, the information regarding crop fertilization and its influence on fruit quality is rare in the literature. Among macronutrients, potassium is highly concentrated in noni plants, and fertilization with cattle manure contributes to plant nutrition and fruit quality. This study sought to evaluate the effect of potassium fertilizer and cattle manure on the physical and physicochemical attributes of noni fruits. The treatments were distributed in randomized blocks, with four replications and two plants per plot, arranged in a factorial design 5 × 2 related to 0, 13.2, 37.5, 61.5 and 69.6 g plant
-1 potassium chloride doses in soils without and with 12 kg
plant-1
of cattle manure, with a C/N = 18:1 ratio. Cattle manure increased the average fruit weight from 99.6 to 113.4 g, expressing an increase of 13.9% for plants without and with organic compounds. Potassium chloride provided an increase of 61% in fruit weight and 31.25% in titratable acidity in fruits of plants without and with the highest dose of potassium chloride. Potassium chloride and cattle manure increased fruit mass, fruit length, fruit diameter, pulp mass, vitamin C and glucose contents in noni fruits. Key words: Fruit quality, Morinda citrifolia L., organic mineral fertilizer.
INTRODUCTION Noni (Morinda citrifolia L.) is a tropical fruit tree widely distributed in the islands of the South Pacific, Southeast Asia, Central America and parts of India (West et al., 2011). In these regions, its fruit has been used as an alternative source of medicine for centuries to combat
several diseases (Macpherson et al., 2007; West et al., 2011). The fruit of noni, classified as syncarp, has whitish-yellow to white coloring and a characteristic strong odor. It has a high concentration of vitamin C, antioxidants, proteins and carbohydrates (Canuto et al., 2010; Costa et

al., 2013; Palioto et al., 2015). It is used as a medicament, especially its concentrated juice. The culture of noni has been recently introduced in Brazil, therefore, the information about its cultivation and the quality of the achieved yield is still scarce in the literature (Silva et al., 2012; Silva et al., 2014a).
Among the macronutrients, potassium is highly concentrated in noni plants, being the second most abundant element in leaves and the first most abundant element in fruits (Cavalcante et al., 2014; Silva et al., 2014b). This is due to the importance of potassium in various physiological processes of the plant, such as the synthesis and translocation of carbohydrates, activation of enzymes and the formation of organic compounds, with an effect on fruit production and fruit quality (Gross, 1991; Jifon and Lester, 2009; Lester et al., 2010; Marschner, 2012).
Cattle manure is a major source of organic raw material. It is used in the Brazilian family farming, including in the northeastern semiarid. This activity, according to Galvão et al. (2008), is associated with its high availability on most farms, and the purchasing value in many cases does not significantly increase production costs. Kumar and Ponnuswami (2013) and Silva et al. (2014b) attribute to cattle manure, an adequate supply of organic matter, the nutrition of noni plants and may therefore contribute to the quality of the fruit, since the organic input improves the soil's physical and chemical properties and increases biochemical and edaphic microbiological activity (Mandal et al., 2007; Dunjana et al., 2012).
In soil fertilization, the use of organic materials added to mineral fertilizers, which significantly influence the root system architecture and the nutritional stage is crucial to the success of fruit production (Brito et al., 2005), for the application of organic sources and mineral fertilization influence on fruit quality of passion fruit plants. However, has little information about the effect of the organic and mineral fertilization on the physical and physicochemical quality noni fruit. Thus, this study sought to evaluate the effect of mineral fertilization with potassium chloride and organic fertilization, with cattle manure on the physical and physicochemical attributes of noni fruits. MATERIALS AND METHODS
The experiment was conducted from July 2012 to November 2013 in a 40 m × 30 m experimental area in the Agriculture Sector of the Human, Social and Agricultural Sciences Centre of the Federal University of Paraíba, Bananeiras City, and Paraiba State, Brazil.
The rainy season is concentrated from April to August and the dry period is from September to January. The accumulated rainfall during the experiment was 1,175 mm. During the same period, daily temperature values and relative humidity were recorded and
Souto et al. 2721 average monthly data were obtained as shown in Figure 1. The values of average temperature and relative humidity of the air during the experimental period were, 25°C and 65%, respectively.ds
The soil of the area, according to the criteria of the Brazilian System of Soil Classification -SiBCS (Embrapa, 2013), was classified as an Oxisoil Dystrophic. Before the experiment installation, soil samples were collected for analysis of physical and chemical attributes as fertility (Table 1) and determined using the methods described by (Donagema et al., 2011).
Before the experiment, a liming with 3.3 t ha-1 of limestone (47% of CaO, 2% of MgO and 91% of PRNT) was performed across the experimental area in the layer 0 to 20 cm to increase the percentage of soil saturation by exchangeable bases from 39.7 to 80.0%. After the limestone reaction, 40 cm × 40 cm × 40 cm holes, spaced 4 m between plants and between rows, were opened, the seedlings were transplanted 60 d after the seed planting. The treatments were distributed in randomized blocks with four replications and two plants of noni (Morinda citrifolia L.) cv. citrifolia per plot. They were arranged in a 5 × 2 factorial design related to 0, 13.2, 37.5, 61.5 and 69.6 g plant-1 potassium chloride doses in order to increase the previous soil’s K content from 20 to 45, 90, 135 and 150 mg dm-3, in soils without and with 12 kg plant-1 of cattle manure with a C/N ratio of 18:1, as estimated by Donagema et al. (2011). This dose was used to increase the organic matter content of the soil from 1.69 to 4.00%. The result of the chemical analysis of the manure used is shown in Table 2.
The fertilization with potassium chloride and organic matter was made in three equal applications of 0, 4.4, 12.5, 20.5 and 23.2 g plant-1 of KCl and 4 kg plant-1 of cattle manure, adding another 200 g related to 5% humidity. The first fertilization was performed pre plant during the whole filling on July 7, 2012. The second and the third fertilizations were performed during the growing period at 30 (August 1, 2012) and 270 days after transplanting the seedlings (July 4, 2013). In all three fertilizations, 40 g plant-1 of P2O5 from single superphosphate (20% of P2O5, 10% of S and 18% of Ca) were applied. Nitrogen fertilization corresponded to the applications of 30 g plant-1 of N as ammonium sulfate (20% of N, 21% of S) at 30 days after transplanting (August 2012) and in April and June 2013, as suggested by Cavalcante et al. (2014) for noni crops in 2010. At 510 days after the installation of the experiment, in November 2013, eight fruits per treatment were collected at the physiological maturity stage. After reaching commercial maturity, that is, a white-porcelain color (Silva et al., 2012; Silva et al., 2014a), fruits were packed in polystyrene trays, then taken to the laboratory to measure length and diameter with a Digimess@ digital caliper. The mass of the fruit and the pulp was measured in a semi-analytical balance. After pulping fruits, the physicochemical properties of soluble solids (SS) were determined by direct readings of the juice with a digital portable refractometer model RHB0-80B. The titratable acidity (TA) was measured in a 10 mL juice sample by adding 1 ml of phenolphthalein and titration with NaOH at 0.1 N. The ratio SS/TA was obtained by the ratio between soluble solids and titratable acidity. Vitamin C was determined by titration of DFI solution (2, 6-diclofenolindofenol) in 1 ml of juice diluted in 50 ml of 0.5% oxalic acid. The levels of glucose and sucrose were obtained in juice by the Lane Enyon method (AOAC, 2005) and identified bythe Somogyi-Nelson method (Southgate, 1991).
Data were submitted to analysis of variance by "F" test at 5% probability. The means concerning cattle manure were compared by "F" test, which is conclusive for two factors, and means referring to doses of potassium chloride were compared by polynomial regression using the statistical software SISVAR version 5.3
*Corresponding author. E-mail: [email protected]. Tel: (+55) 83 99817898.
Author(s) agree that this article remain permanently open access under the terms of the Creative Commons Attribution
License 4.0 International License

2722 Afr. J. Agric. Res.
Figure 1. Average monthly values of relative humidity (―), air temperature (∙∙∙∙) and rainfall (- - -) from June 2012 to November 2013 during the experiment.
Table 1. Characterization of the chemical attributes as fertility and physical soil before the experiment.
Chemical atributes - fertility Physical attributes
pH in H2O (1:2.5) 5.23 Sand (g kg-1
) 653
P (mg kg-1
) 3.30 Silt (g kg-1
) 229
K+ (cmolc kg
-1) 0.05 Clay (g kg
-1) 118
Ca2+
(cmolc kg-1
) 1.80 Ada (g kg-1
) 24.8
Mg2+
(cmolc kg-1
) 1.16 Soil density (g cm-3
) 1.29
Na+ (cmolc kg
-1) 0.01 Particle density (g cm
-3) 2.71
SB (cmolc kg-1
) 3.01 Degree of flocculation (%) 78.9
Al3+
+ H+ (cmolc kg
-1) 4.58 Index of dispersion (%) 21.1
Al3+
(cmolc kg-1
) 0.46 Total porosity (%) 52.4
CEC (cmolc kg-1
) 7.59 Macroporosity (%) 40.1
V (%) 39.7 Microporosity (%) 12.3
N (%) 0.09 UFC – 0.01 MPa (%) 12.3
OC (%) 0.98 UPWP – 1.50 MPa (%) 3.8
OM (%) 1.69 Available water (%) 8.5
ECse (dmS cm-1
) 0.05 Textural classification: Sand loam
SB = Sum of bases; CEC = Cation exchange capacity; V = Exchangeable base saturation; OC = Organic carbon; OM = Organic matter in the soil; ECse = Electrical conductivity in the soil saturation extract; Ada = Clay dispersed in water; UFC = Water content at field capacity, tension of -0.01 MPa; Upwp = Water content at the permanent wilting point, tension of -1.50 MPa.

Souto et al. 2723
Table 2. Chemical characterization of the cattle manure used in the experiment.
Chemical characterization
pH OM N P K+ Ca
2+ Mg
2+ Na
+ C:N
H2O (1:2.5) -----g dm-3
----- -mg dm-3
- ---------------cmolcdm-3
---------------
8.58 323.86 10.44 2.07 2.49 4.65 5.25 1.19 18:1
OM = Organic matter in the cattle manure; C:N = Carbon/nitrogen ratio. (Ferreira, 2014).
RESULTS AND DISCUSSION
According to the summary of variance analyses (Table 3), the interaction between cattle manure × doses of potassium (M × K) had significant effects on fruit diameter (FD) and pulp mass (PM) of noni fruits. It is also stated that average fruit weight (FW) and fruit length (FL) were not influenced by this interaction, but responded to single effects of cattle manure (M) and potassium chloride doses (K).
The application of cattle manure in the soil provided the plants develop of increased mass (133.4 g) over the plants without the organic fertilizer (99.6 g), as observed in Figure 2a. Thus, it appears that the organic fertilizer application in the form of cattle manure promoted an increase of 33.93% on average fruit weight compared to treatment without their manure. Cattle manure, despite a low chemical composition in terms of nitrogen and potassium, but high on calcium and magnesium (Table 2), increases the soil fertility level and the availability of nutrients to plants (Galvão et al., 2008; Silva et al., 2014b). This input, in addition to improving soil structure, increases the pore space of the soil, and stimulates root development (Mosaddeghi et al., 2009) and promotes the absorption of water and nutrients by plants, thus, reflecting in fruits with an increased mass, such as in noni fruits.
These results are in accordance with the results obtained by Costa et al. (2015) in pitaia red (Hylocereus undatus (Haw.) Britton and Rose), where the authors observed that the application of organic fertilizer in the form of cattle manure, provided the formation of fruits with high mass, which was attributed to the high concentration of nutrients such as nitrogen and phosphorus. The addition of potassium chloride resulted in a linear increase of 0.709 g
-1 in fruit mass per unit
increase of mineral fertilizer to the soil (Figure 2b). The values increased from 80.7 to 130 g and represented an increase of 61.1% in fruits of plants in soils with and without the maximum KCl dose of 69.6 g plant
-1 in each
application and 0.88% per unit increase in potassium chloride. This is due to a higher outflow of sucrose to the apoplast in function of the availability of potassium, increasing the translocation of sugars to drain-tissues, in
this case, the fruit promotes further growth (Taiz and Zeiger, 2013).
The highest fruit mass of plants treated with cattle manure (Figure 2a) and with the highest potassium chloride dose (Figure 2b) exceeded the value of 50 g fruit
-1 obtained by Silva et al. (2012) for noni plants in an
unfertilized soil and indicates the feasibility of the respective inputs. Organic manure according to Kumar and Ponnuswami (2013) is responsible also for improving other physical traits in noni fruits like size, diameter, length and volume. The effects of cattle manure and potassium chloride on fruit length (Figure 3) were similar to those observed for the average noni fruit mass. The fertilization with cattle manure promoted increase in the length of the fruit noni with values of 75.5 mm, compared to treatments without fertilization - 69.2 mm; the application of fertilizer increased by 9.1% the length of the fruits (Figure 3a). At potassium chloride doses promoted a linear growth in fruit length (Figure 3b). Values increased from 65.5 mm in plants without KCl to 67.8, 72.2, 76.6 and 78.0 mm, respectively, in plants fertilized with 13.2, 37.5, 61.5 and 69.6 g plant
-1 of KCl.
The values are in the range 40 to 100 mm observed for noni fruits harvested by Macpherson et al. (2007) and Cavalcante et al. (2014) in Australia and in Brazil.
The increase in potassium chloride doses stimulated the development of the diameter of noni fruits. They were greater in fruits of plants treated with cattle manure (Figure 4). Plants In the soil without cattle manure, the increase was from 48.7 to 54.4 mm in plants with and without the highest potassium chloride dose. On the other hand, plants in the soil with the organic compound, fruit diameter increased linearly from 49.9 to 55.3 mm in plants of the soil without the highest dose of KCl.
By comparison, the results resemble the 50 to 60 mm variation in fruit diameter presented by Silva et al. (2014a) upon fertilizing noni plants with cattle manure with and without potassium fertilization. In the situations with absence and presence of cattle manure, there were increase of 11.70 and 10.82%, respectively, in plants with the highest dose of KCl and without this mineral fertilizer. The highest values of length and fruit diameter in plants treated with KCl and cattle manure express the require-ment of potassium for growth, yield, quality, participation in various metabolic processes and the highest concentration of cations in fruits (Jifon and Lester, 2009; Marschner, 2012). As for cattle manure, besides promoting

2724 Afr. J. Agric. Res.
Table 3. Analysis of variance of physical characters of noni fruits in soils with or without cattle manure (M) as a function of potassium chloride (K).
SV DF Mean Square
FW FL FD MP
Blocks 3 355.17ns
0.55ns
0.18ns
264.25*
Cattle manure (M) 1 1905.50** 3.96** 0.32* 1005.30**
Potassium chloride (K) 4 4056.96** 2.97** 0.76** 3021.13**
M × K 4 257.79ns
0.46ns
0.31** 361.13**
Residue 27 131.20 0.30 0.07 80.92
Total 39
Mean 106.49 7.64 5.18 77.05
CV (%) 10.76 7.23 5.12 11.71
SV = Source of variation; DF = Degree of freedom; CV = Coefficient of variation; ns = Not significant.
KCl doses (g plant-1
)
0,0 13,2 37,5 61,5 69,6
Fru
it w
eig
ht
(g)
0
40
80
120
160
y = 80.700 + 0.795**x R2 = 0.89
B
Cattle manure
Fru
it w
eigh
t (g
)
0
40
80
120
160
Without
With
b60.99
a40.113
A
Figure 2. Average mass of noni fruits in soils without and with cattle manure (A) and potassium chloride doses (B).
the physical improvement due to soil structuring, aggregate stability and increase of soil’s macroporous space (Dunjana et al., 2012), it encourages root growth and biochemical and microbiological activity of the soil (Mandal et al., 2007), promoting nutrient absorption and resulting in larger fruits. Regardless of the presence or absence of cattle manure, the pulp mass of noni fruits increased linearly by 0.546 and 0.680 g per unit increase of potassium chloride, being higher in fruits of plants with cattle manure (Figure 5).
The pulp mass from treatments with and without manure increased from 52.14 to 90.14 g fruit
-1 and from
57.3 to 104.63 g fruit-1
in plants with and without the highest dose of KCl. These increase due to higher potassium fertilization, account for 72.9 and 82.6% increases, respectively, in plants with and without organic fertilization. The results are in agreement with Silva et al. (2014a) upon establishing the fertilization with potassium chloride, and cattle manure which promotes significant
increases in pulp yield of noni fruits. According to the summary of analyses of variance, the interaction cattle manure × potassium doses, except from acidity, interfered significantly on the chemical characteristics of noni fruits, as indicated in Table 4.
In plants treated without soil organic fertilizer, the soluble solid contents in fruits, with increasing doses of potassium chloride, did not adjust to any type of regression which has the mean value of 4.84°Brix. In treatments with cattle manure, the contents increased up to a dose of 41.14 g plant
-1 of KCl, with a maximum value
of 5.31°Brix (Figure 6a). By relating the values of 5.31 to 4.84, it is verified that soluble solid content in the pulp of noni fruits increased by 9.71% due to cattle manure application. The application of potassium chloride with cattle manure contributed to the increase in solid soluble contents of noni fruits due to the induction of synthesis and translocation of carbohydrates and activation of enzymes. It also contributed to the formation of organic

Souto et al. 2725
Cattle manure
Fru
it l
eng
th (
mm
)
0
20
40
60
80
100
Without
With
b2.69
a5.75
A
KCl doses (g plant-1)
0.0 13.2 37.5 61.5 69.6
Fru
it l
eng
th (
mm
)
0
20
40
60
80
100
y = 65.5227 + 0,01864**x R2 = 0.84
B
Figure 3. Average length of noni fruits in soils without and with cattle manure (A) and potassium chloride doses (B).
KCl doses (g plant-1
)
0.0 13.2 37.5 61.5 69.6
Fru
it d
iam
eter
(m
m)
0
20
40
60
80
ywithout
= 48.73 - 0.127**x + 0.003**x2 R
2 = 0.83
ywith
= 49.97 +0.078**x R2 = 0.87^
^
Figure 4. Noni fruit diameter in soils with (―) or without (- - -) cattle manure as a function of potassium chloride.
acids, which was also found for yellow passion and melon fruits (Brito et al., 2005; Jifon and Lester, 2009). Even considering the soluble solid contents in the fruits, the values were lower than all values obtained by Kumar e Ponnuswami (2013) in fruits of noni under different irrigation regimes and sources of organic manure, which ranged from 7.21 to 10.53°Brix.
The titratable acidity increased linearly by 0.0020% in citric acid per unit increase of potassium fertilization. The values increased from 0.48 to 0.63% in fruits of plants with and without the highest dose of potassium chloride
(69.6 g plant-1
), which is equivalent to an increase of 31.25% (Figure 6b). These results are above the 0.39% value obtained by Silva et al. (2012) and the 0.32% value obtained by Canuto et al. (2010) for noni fruits without any mineral or organic fertilization. The soluble solids/titratable acidity ratio of fruits of treatments with cattle manure (Figure 7) decreased linearly by 0.0521 per unit increase of KCl, from 10.5395 to 6.9133, when he linked the lowest and highest dose of potassium fertilizer, with losses of 34.40%. Fortaleza et al. (2005) presented a similar decrease upon verifying a reduction in the

2726 Afr. J. Agric. Res.
KCl doses (g plant-1
)
0.0 13.2 37.5 61.5 69.6
Fru
it p
ulp
(g
)
0
30
60
90
120
150
ywithout
= 52.14 + 0.546**x R2=0.80
ywith
= 57.30 + 0.680**x R2=0.82
^
Figure 5. Noni fruit pulp in soils with (―) or without (- - -) cattle manure as a function of potassium chloride.
KCl doses (g plant-1)
0.0 13.2 37.5 61.5 69.6
So
lub
le s
oli
d (
°Bri
x)
2.0
2.5
3.0
3.5
4.0
4.5
5.0
5.5
6.0
6.5
7.0
ywithout
= 4.84
ywith
= 4.13 + 0.0576**x - 0.0007**x2 R
2 = 0.93^
^
A
KCl doses (g plant-1
)
0.0 13.2 37.5 61.5 69.6
Tit
rata
ble
aci
dit
y (
% c
itri
c ac
id)
0.2
0.3
0.4
0.5
0.6
0.7
0.8
y= 0.4820 + 0.0020**x R2= 0.90^
B
Figure 6. Soluble solid (A) and Titratable acidity (B) of noni fruits in soils with (―) or without (- - -) cattle manure as a function of potassium chloride.
SS/TA ratio value in fruit pulps of sour passion fruit genotypes with an increase in K2O doses applied to the soil. In the treatments without cattle manure, the SS/TA ratio increased up to the estimated potassium dose of 29.11 g plant
-1, reaching the maximum value of 9.4858
(Figure 7). Despite the increase in treatments without organic matter, the results of SS/TA of noni fruits were lower than the 28.12 value obtained by Canuto et al. (2010) and the 26.69 value obtained by Silva et al. (2012). This lower value is the response of the high
titratable acidity, as indicated in Figure 6b. In treatments without cattle manure, the increase in
potassium fertilization increased the levels of vitamin C to 135.6 mg 100 mL
-1 of juice at the estimated maximum
dose of 53.6 g plant-1
of KCl. Higher doses compromise of the vitamin C content of fruits (Figure 8). The beneficial effects of K supplementation through potassic fertilization to plants can be related to a series of factors, such as improving the photosynthetic CO2 assimilation by leaves, higher translocation assimilates and there is improvement

Souto et al. 2727
KCl doses (g plant-1
)
0.0 13.2 37.5 61.5 69.6
SS
/TA
0
3
6
9
12
15
ywith
= 8.697 + 0.0533**x - 0.0009**x2 R
2= 0.76
ywithout
= 10.5395 - 0.0521**x R2= 0.75
^
^
Figure 7. SS/TA (soluble solids/titrable acidity) ratio of noni fruits in soils with (―) or without (- - -) cattle manure as a function of potassium chloride.
KCl doses (g plant-1
)
0.0 13.2 37.5 61.5 69.6
Vit
amin
C (
mg
10
0 m
L-1
)
0
40
80
120
160
200
ywithout
= 55.13 + 3.002**x - 0.028**x2 R
2= 0.76
ywith
= 77.55 + 0.793**x R2= 0.92
^
^
Figure 8. Vitamin C of noni fruits in soils with (―) or without (- - -) cattle manure as a function of potassium chloride.
in water relations between the leaves and the fruits, thus, contributing to higher enzyme activity which interferes in the availability of substrate for the biosynthesis of vitamin C (Gross, 1991). Similar results were presented by
Consta'n-Aguilar et al. (2014) in a study of the physical and chemical quality of tomato cherry (Solanum lycopersicum L.), where they observed that increased doses of K2O, increased vitamin C content of fruit. In the

2728 Afr. J. Agric. Res.
KCl doses (g plant-1
)
0.0 13.2 37.5 61.5 69.6
Sucr
ose
(g 1
00
g-1
)
0
3
6
9
12
15
ywith
= 9.06
ywithout
= 8.75
^
^
B
KCl doses (g plant-1
)
0.0 13.2 37.5 61.5 69.6
Glu
cose
(g
10
0 g
-1)
0.0
0.2
0.4
0.6
0.8
1.0
1.2
1.4
1.6
1.8
2.0
ywith
= 1.282 + 0.0080**x - 0,0002**x2 R
2= 0.99
ywithout
= 1.15
^
^
A
Figure 9. Glucose (A) and Sucrose (B) of noni fruits in soils with (―) or without (- - -) cattle manure as a function of potassium chloride.
soil with cattle manure, the vitamin C content increased linearly by 0.793 mg 100 mL
-1 per unit increase of
potassium fertilization, reaching the maximum value of 132.74 mg 100 mL
-1 of juice at the highest KCl dose of
69.6 g plant-1
. The highest values of vitamin C in fruits of plants
fertilized with 53.6 and 69.6 g plant-1
of potassium chloride in treatments with and without cattle manure corresponded to increase of 147 and 71.16% in the vitamin C content compared to fruits of plants not fertilized with potassium. Jifon and Lester (2009) and Ali et al. (2012) recorded similar tendencies upon verifying that the potassium fertilization of melons (Cucumis melo L.) and blackberries (Rubus spp.) increased the vitamin C content of fruits. Comparing the results, vitamin C contents at 113.00, 23.10 and 12.16 mg 100 mL
-1 were
higher than contents obtained by West et al. (2011), Costa et al. (2013) and Palioto et al. (2015) for noni fruits without any mineral or organic fertilization. These values express the importance of mineral and organic fertilization for the quality of noni fruits. Except for glucose levels of fruits from plants of treatments with cattle manure, glucose and sucrose contents did not adjust to any mathematical model with the increase of potassium chloride doses applied to the soil (Figure 9).
Glucose values, under organic fertilization conditions, increased up to 1.36 g 100 g
-1 of pulp at the estimated
maximum KCl dose of 20 g plant-1
. However, values decreased with higher doses of the mineral fertilizer. As to absence of cattle manure, data were represented by the average content of 1.15 g 100 g
-1 of pulp, and
indicated an inferiority of 18.26% of fruits of treatments with and without cattle manure (Figure 9a).
The increase in glucose in noni fruits in function of potassium chloride doses is associated with photo-synthesis in leaves, resulting in the production of sugars,
photoassimilate transports from leaves to fruits, activation of enzymes and substrate availability for ascorbic acid and β-carotene biosynthesis (Jifon and Lester, 2009; Lester et al., 2010). As for sucrose (Figure 9b), average levels were 9.06 and 8.75 g 100 g
-1 of pulp with the
increase in potassium doses, expressing a modest superiority of 3.54% of fruits of treatments with and without cattle manure. In comparison, the contents 1.36 and 9.06 g 100 g
-1 of glucose and sucrose in fruits of
treatments with cattle manure and potassium exceed 1.30 and 0.99 g 100 g
-1 of glucose and sucrose,
respectively, as reported by West et al. (2011) for noni fruit pulps. Conclusion The dose of 69.6 g plant
-1 of potassium chloride and
cattle manure increased fruit mass, fruit length, fruit diameter, pulp mass, vitamin C and glucose contents in noni fruits. The increase in potassium chloride increased the titratable acidity and decreased the soluble solids/titratable acidity ratio in the pulp of fruits. The cattle manure increased the weight and length in noni fruits. Conflict of interests The authors have not declared any conflict of interests. ACKNOWLEDGEMENTS The authors thank the Conselho Nacional de Desenvolvimento Científico e Tecnológico (CNPq) and Coordenação de Aperfeiçoamento de Pessoal de Ensino

Superior (CAPES) for the financial support and the scholarship granted to the first author. REFERENCES Ali L, Alsanius BW, Rosberg AK, Svensson B, Nielsen T, Olsson ME
(2012). Effects of nutrition strategy on the levels of nutrients and bioactive compounds in blackberries. Eur. Food Res. Technol. 234(1):33-44.
AOAC Internacional (2005). Official methods of analysis of AOAC International. 16 ed. AOAC International, Arlington, Texas, United States.
Brito MEB, Melo AS, Lustosa JPO, Rocha MB, Viégas PRA, Holanda FSR (2005). Rendimento e qualidade da fruta do maracujazeiro-amarelo adubado com potássio, esterco de frango e de ovino. Rev. Bras. Frutic. 27(2):260-263.
Canuto GAB, Xavier AAO, Neves LC, Benassi MT (2010). Caracterização físico-química de polpas de frutos da Amazônia e sua correlação com a atividade anti-radical livre. Rev. Bras. Frutic. 32(4):1196-1205.
Cavalcante LF, Silva JJM, Rocha LF, Dantas TAG, Bezerra FTC, Nascimento JAM (2014). Adubação, composição mineral, irrigação e produção do noni. Breve conhecimento da planta e bases para a produção. pp. 45-70.
Consta´n-Aguilar, C, Leyva R, Romero L, Soriano T, Ruiz JM (2014). Implication of potassium on the quality of cherry tomato fruits after postharvest during cold storage. Int. J. Food Sci. Nutr. 65(2):203-211.
Costa AB, Oliveira AMC, Silva AMO, Mancini-Filho J, Lima A (2013). Atividade antioxidante da polpa, casca e sementes do noni (Morinda citrifolia Linn). Rev. Bras. Frutic. 5(2):345-354.
Costa AC, Ramos JD, Silva FOR, Menezes TP, Moreira RA, Duarte MH (2015). Adubação orgânica e Lithothamnium no cultivo da pitaia vermelha. Semin., Ciênc. Agrár. 36(1):77-88.
Donagema GK, Campos DVB, Calderano SB, Teixeira WG, Viana JHM (2011). Manual de métodos de análise de solo. 2. ed. Embrapa Solos, Rio de Janeiro, Rio de Janeiro, Brasil.
Dunjana N, Nyamugafata P, Shumba A, Nyamangara J, Zongore S (2012). Effects of cattle manure on selected soil physical properties of smallholder farms on two soils of Murewa, Zimbabwe. Soil Use Manage. 28(2):221-228.
Embrapa (2013). Sistema Brasileiro de Classificação de Solos. 3 ed. Embrapa, Brasília, Distrito Federal, Brasil.
Ferreira DF (2014). Sisvar: a Guide for its Bootstrap procedures in multiple comparisons. Ciênc. Agrotec. 38(2):109-112.
Fortaleza JM, Peixoto JR, Junqueira NTV, Oliveira AT, Rangel LEP (2005). Características físicas e químicas em nove genótipos de maracujá-azedo cultivado sob três níveis de adubação potássica. Rev. Bras. Frutic. 27(1):124-127.
Galvão SRS, Salcedo IH, Oliveira FF (2008). Acumulação de nutrientes em solos arenosos adubados com esterco bovino. Pesqui. Agropecu. Bras. 33(1):99-105.
Gross J (1991). Carotenoids. Pigments in vegetables: chlorophylls and carotenoids pp. 75-278.
Jifon JL, Lester GE (2009). Foliar potassium fertilization improves fruit quality of field-grown muskmelon on calcareous soils in south Texas. J. Sci. Food Agric. 89(14):2452-2460.
Souto et al. 2729 Kumar SM, Ponnuswami V (2013). Effect of different water regimes and
organic manures on quality parameters of noni (Morinda citrifolia). Afr. J. Agric. Res. 8(27):3534-3543.
Lester GE, Jifon JL, Makus DJ (2010). Impact of potassium nutrition on postharvest fruit quality:Melon (Cucumis melo L) case study. Plant Soil 335(1):117-131.
Macpherson H, Daniells J, Wedding B, Davis C (2007).The Potential for a New Value Adding Industries for Noni Tropical Fruit Producers. Rural Industries Research and Development Corporation. Sidney, Australian.
Mandal A, Patra AK, Singh D, Swarup A, Masto RE (2007). Effect of long-term application of manure and fertilizer on biological and biochemical activities in soil during crop development stages. Bioresour. Technol. 98(18):3585-3592.
Marschner P (2012).Mineral nutrition of higher plants. 3 ed. Elsevier®, San Diego, United States.
Mosaddeghi MR, Mahboubi AA, Safadoust A (2009). Short-term effects of tillage and manure on some soil physical properties and maize root growth in a sandy loam soil in western Iran. Soil Till. Res. 104(1):173-179.
Palioto GF, Silva CFG, Mendes MP, Almeida VV, Rocha CLMSC, Tonin LTD (2015). Composição centesimal, compostos bioativos e atividade antioxidante de frutos de Morinda citrifolia Linn (noni) cultivados no Paraná. Rev. Bras. Plantas Med. 17(1):59-66.
Silva JJM, Cavalcante LF, Diniz BLMT, Souto AGL, Bezerra MAF (2014). Colheita e pós-colheita do noni. Noni: Breve conhecimento da planta e bases para a produção pp. 99-110.
Silva JJM, Cavalcante LF, Nascimento JAM, Diniz BLMT, Souto AGL (2014b). Esterco bovino e potássio na composição mineral de plantas de noni. Ciênc. Florest. 24(4):1017-1026.
Silva LR, Medeiros PVQ, Leite GA, Silva KJP, Mendonça V, Silva GG (2012). Caracterização do fruto de Morinda citrifolia L. (noni). Rev. Cubana Plant Med. 17(1):93-100.
Southgate DAT (1991). Determination of foods carbohydrates. Elservier Applied Science, London, United Kingdom.
Taiz L, Zeiger E (2013). Fisiologia vegetal. 5 ed. Artmed, Porto Alegre, Rio Grande do Sul, Brasil.
West BJ, Deng S, Jensen CJ (2011). Nutrient and phytochemical analyses of processed noni puree. Food Res. Int. 44(7):2295-2301.

Vol. 11(30), pp. 2730-2735, 28 July, 2016
DOI: 10.5897/AJAR2016.10803
Article Number: 68E1FCD59750
ISSN 1991-637X
Copyright ©2016
Author(s) retain the copyright of this article
http://www.academicjournals.org/AJAR
African Journal of Agricultural Research
Full Length Research Paper
Yield and quality of dual-purpose barley and triticale in a semi-arid environment in Tunisia
Sadreddine BEJI
Forage Crops Department, Higher Institute of Agriculture Kef, Boulifa 7119, Kef, Tunisia.
Received 12 January, 2016; Accepted 20 July, 2016
The semi-arid region of Tunisia is characterized by a low and erratic rainfall. This makes year-round maintenance of pasture and forage production under non-irrigated conditions both costly and difficult. In order to fill the winter feed gap in the livestock cycle; some cereals can be used as dual-purpose. This study aimed at evaluating agronomic performances and grain quality of two dual-purposes cereal crops, Barley and Triticale, cut at the pseudo stem erect stage (C30). The trial was conducted during 2010-2011 and 2011-2012 seasons under a semi-arid environment. Yields did not significantly differ between years and although barley yielded more forage crop than triticale the yield was not significantly different. Crude protein in the plant was significantly higher in barley (18.2%) compared to triticale (17.4%). Defoliation has caused a significant grain yield reduction for both cereals and was about 22% for triticale and 28% for barley; grain yield after forage removal was statistically higher for triticale (3.47 T/ha) than barley (2.85 T/ha). As average for the two seasons of the trial, grain protein was significantly higher after clipping for barley (11.35% for dual purpose and 10.17% for grain production only) and was not affected for triticale (9.38% versus 9.55%). Under Tunisian semi-arid environment, triticale and barley have comparable yields with a small superiority for triticale in grain yield after forage use and higher plant and grain protein contents in barley. Key words: Cereals defoliation, forage, protein, grain.
INTRODUCTION In Tunisia, farmers face serious problems of low quantity and quality of forage to feed their animals. The year-round maintenance of pastures and production of forage crops is difficult to achieve in rain fed areas. This is caused by low and erratic rainfall and poor soil fertility conditions, which characterize the semi-arid and arid regions. One of the solutions, used mainly by local and small farmers, is the practice of dual-purpose cereals; these cereals are grazed or cut at a young stage
(tillering) and then allowed to re-grow up to grain production. This will provide forage during winter season which is known as a forage deficit, reduce pressure on other feed resources and allow farmers to harvest grain and straw at the end of plant cycle. In Tunisia, dual-purpose use of cereals is commonly practised by Small ruminent breeders. The main crop serving as winter grazing and grain for feed is barley with 45000 ha annually which represents about 20% of total forage area
E-mail: [email protected]. Tel: +21698237412.
Author(s) agree that this article remain permanently open access under the terms of the Creative Commons Attribution
License 4.0 International License

(Ouji et al., 2010)
The most frequently used species for dual-purpose cropping in the Mediterranean context are barley, oats and triticale (Epplin et al., 2000). Biomass productivity before grazing and grain yield after regrowth define the suitability of these cereal species to dual-purpose practice. Researches about cereals dual-purpose for seeds and forage have given widely varying results according to the climate, to fertilization to the specie, to seed rate and date and to the cut or grazing stage. In fact, the practice of first use by cutting or grazing helps to gain a certain amount of nutritious forage, but may reduce straw and grain production particularly when conducted in late growth stage. This practice is common in Morocco (Belaird and Morris, 1991); Syria (Mazid and Hallagian, 1983) and Tunisia (Amara et al., 1985). In Mediterranean environments, Hadjichristodoulou (1991) reported that grazing affected grain yield of dual-purpose barley in rain fed conditions, while the same effect was not detectable in irrigated conditions. According to the same author, one clipping at tillering stage reduced total dry matter yield by 12 to 64% and crude protein by 30%. Thus, the management of cutting stage influences the forage and grain yield. Royo et al. (1997) have reported that, when cut at the first detectable node stage (C. 31) triticale and barley forage yield was almost double the yield at the pseudo-stem erect stage (C. 30). Defoliation during early growth stages optimizes seed yield and forage quantity and quality (El-Shatnawi et al., 2004). According to Giunta et al. (2015), understanding phenology is critical for the success of a dual- purpose crop as it determines both the duration of the grazing period and affects the recovery period. Decreases in grain yield after clipping have been attributed to a reduced number of spikes/m² at harvest in barley (Scott et al., 1988) and triticale (Royo et al., 1993) and also to a reduced grain number (Bonachela et al., 1995) and kernel weight (Royo et al., 1994).
Other studies have reported a grain yield increase after a cutting or grazing during green stage. This increase has been associated to the decrease of lodging (Droushiotis, 1984). Other results showed also that a properly managed grazing does not reduce grain yield in the dual-purpose system. It shows that the stocking pressure and number of cuts have been shown as important factors that influence the subsequent grain yield (Arzadun et al., 2003; Hossain et al., 2003). Epplin et al. (2000) and Hossain et al. (2003) also suggested that an optimal choice of planting date and density is crucial if cereal is to produce high forage and grain yields.
Other studies dealt with the influence of dual-purpose cereals on quality traits (Royo et al., 1994; Garcia del Moral et al., 1995; Royo and Pares, 1996; Royo et al., 1997; Royo and Tribó, 1997; Khalil et al., 2002b). With the exception of kernel weight, Khalil et al. (2002b) did not find detrimental effects of dual-purpose management on wheat grain protein or on dough strength parameters,
Beji 2731 nor was grain protein content affected by forage removal in barley and triticale (Royo et al., 1997). Royo et al. (1993) reported that triticale was seen to be good for forage production compared with other cereals, and barley had the highest crude protein content. The results also showed that different varieties of the species investigated had different behaviors with respect to their dual-purpose capacity. This result was contrary to that found by Khalil et al. (2002a) who found no significant differences among wheat cultivars due to the management system.
The objective of this study was to investigate the effect of defoliation on grain production and quality of two dual-purpose species, triticale and barley under rainfall conditions in a semi-arid region of Tunisia.
MATERIALS AND METHODS
The present study was carried out over 2 years (2010-2011 and 2011-2012) in el Kef region, in the experimental field of the higher Institute of Agriculture Kef (36° 11’ 9’’ N, Longitude 8° 42’ 59’’ E ; Altitude 652 m). The trial was carried out in a clay-sandy-loamy soil with about 25 cm ploughable soil and with low organic matter content (1.8%). The climate is Mediterranean, with rainfall concentrated in the autumn and winter. The average annual rainfall is 419 mm on the basis of 20 years.
Monthly rainfall as well as maximum and minimum temperatures of the two seasons of trial are reported in Figure 1. Rainfall from October to June was 496 mm in 2010/2011 and 508 mm in 2011/2012, which is above the annual average (419 mm). Both seasons had a wet winter (December, January and February) with 167 mm during first year and 244 mm for the second year. But greater rainfall was registered during March and April of the second year (143 mm) compared to same period of the first year (51 mm). It supposes that the regrowth of tested cereals will be better during 2011/2012 season.
The experiment assessed the response of two cereal species to winter clipping. Triticale (triticosecale Wittmack) variety Tcl 83 and barley (Hordeum vulgare L) variety Martin. In Northwest region of Tunisia, Triticale has been introduced as an alternative to barley by local farmers during last decade. The two chosen cultivars, Martin for barley and Tcl 83 for Triticale are very common in Tunisia. They are used for forage or for grain. Ben Youssef et al. (2001) and Ouji et al. (2010) have reported that Martin cultivar is good to be used in dual-purpose management.
The experimental design was a split plot with four replications and each plot measured 6 m² in which the main factor was the species and the secondary one the treatment. The two management systems (treatments) experimented were: (i) control plots which were only clipped at plant maturity in order to estimate the grain yield and (ii) dual purpose plots which were clipped first time and harvested as forage at the stem erect stage (C30) and then let regrowth up to plant maturity. For both treatments the whole plant was hand harvested at maturity and straw and grain yields (SY and GY) were estimated. Sowing was carried out early October (06 October 2010 and 08 October 2011 respectively for the first year and second year of the experiment) at a density of 300 viable seeds/m². The soil was chisel plowed in September and just prior to sowing. Pre-sowing fertilization rates for all plots were 46 kg P/ha and 18 kg N/ha. During growth cycle 2 fertilizations were provided: 40 Kg N/ha in 3 leafs stage and 50 kg N/ha after clipping for dual-purpose treatments and in elongation stage for grain only use treatments. Weeds and diseases were chemically controlled.

2732 Afr. J. Agric. Res.
Figure 1. Rainfall and average of monthly maximum temperature and minimum temperatures during 2010/2011 and 2011/2012 in the location of trials.
Forage harvest was done on 13 February 2011 and 19 February 2012 for barley and 24 February 2011 and 26 February 2012 for triticale respectively for the first year and second year of the experiment. Plants were cut about 12 cm above ground level. Grain harvest was made at plant maturity on 28 June 2011 and 01 July 2012 for both species.
Fresh biomass production from each dual-purpose plot was determined at harvest and it’s reported in tones of dry matter per hectare (TDM/ha). A 500 g sample was also taken for chemical analysis. The samples were dried to constant weight at 65°C in a forced-air oven. Milk feed units (MFU) were calculated after the energy production equations of Chase (1981). Forage and grain crude protein content were evaluated by means of the standards micro-kjeldahl procedure. Grain yield (GY), number of spikes/m² (NS/m²), number of grains per spike (NG/Sp) and thousand-kernel weight (TKW) were determined for each plot at seed maturity. Analyses of variance (ANOVA) were performed using (1985) and means were separated using Duncan Test.
RESULTS
Influence of defoliation at C30 stage and species on grain yield, straw production, yield components and forage production
Results of forage quantity harvested in C30 are shown in Table 1. Forage yield did not depend on the species. Barley and triticale has given comparable quantities of forage and only a slight superiority was noticed for barley compared to triticale, respectively 2.45 and 2.3 t/ha as average of the two years of trial. For both species, herbage dry matter was superior during the first year of the experiment (2010/2011) but without being statistically different.
The results of the analysis of variance for grain yield and its components are shown in Table 1. Cutting at the green stage (C30) has caused reduction of grain yield for dual-purpose use comparing to grain use only
management system. This reduction was more pronounced for barley (-28 and -27% respectively for 2010/2011 and 2011/2012) than for triticale (-19 and - 23% respectively for 2010/2011 and 2011/2012). For both species this reduction was statistically significant (P <0.01). In the other hand, when they were not cut in C30 stage, barley and triticale had similar yields, which were not statistically different (3.92 t/ha for barley and 4.41 t/ha for triticale as average yields for the two years). For dual-purpose management system, triticale seems to be more adapted and has given a grain yield of 3.47 t/ha which is significantly higher (P <0.05) than barley grain yield (2.85 t/ha). The interaction treatment x species was significant (P <0.05) for grain yield.
The spike number/m² increased from 330 to 394 spikes /m² for barley and from 310 to 332 spikes/m² for triticale as average for the two years of experiment. This range of variation was statistically significant (P <0.05). In the other hand, spike fertility was significantly affected only by treatment (P <0.05). Number of grains/spike has decreased after clipping by 30% for barley and 20% for triticale. The third yield component, thousand-kernel weight, was a very stable variable, being similar for both treatments. It was not significantly affected by forage use neither by the species.
Straw quantity is also important for cereals producers in general and for animal keepers in particular, as it constitutes an alternative nutrition resource mainly during deficit period. With this trial, it appears that triticale gives more straw quantity in both managements systems (P <0.01). Clipping has affected significantly straw production, and reduced it by (33%) for barley and (28%) for triticale (P <0.05). For both cereals, this reduction was more pronounced during the second year of the experiment 2011/2012. The interaction between species

Beji 2733 Table 1. Forage yield, straw production, grain yield and related components in different managements systems of dual-purpose barley and triticale.
Forage yield Year Forage DM
(T/ha) SY (T/ha) NS/m² NG/Sp TGW (g) GY (T/ha)
Barley one use (grain only) 2010/2011 - 4.83
b 333
cb 27
ab 40.05
a 3.85
a
2011/2013 5.14 ab
327 cb
31 a 40.20
a 4.01
a
Barley dual-Purpose 2010/2011 2.43
a 3.12
c 401
a 20
c 39.42
a 2.74
c
2011/2013 2.46 a 3.43
c 487
a 22
c 39.18
a 2.95
c
Triticale one use (grain only) 2010/2011 - 5.88
a 304
c 34
a 40.66
a 4.38
a
2011/2013 5.62 a 314
c 32
a 40.81
a 4.44
a
Triticale dual-Purpose 2010/2011 2.29
a 4.31
c 305
c 25
b 39.95
a 3.45
b
2011/2013 2.35 a 3.97
c 357
b 28
ab 40.08
a 3.48
b
CV (%) 5.76 8.43 7.45 8.45 7.17 6.68
Species NS ** NS NS NS *
Treatment - * * * NS **
Year NS NS * NS NS NS
Treatment x Year NS NS NS NS NS NS
Treatment x Species NS * NS NS NS *
Species x Year NS NS NS NS NS NS
Treatment x Year x Species NS NS NS NS NS NS
Distinct letters in the row indicate significant differences according to Duncan test (*P ≤ 0.05, ** P ≤ 0.01, NS: not significant).SY: Straw yield; NS/m²: Number of spike per m²; NG/Sp: Number of grains per spike; Number of grains per spike NG/Sp and TKW: Thousand-kernel weight; GY: Grain yield.
and harvesting treatment was significant (P <0.05). The higher straw quantity was obtained with triticale used for grain only.
Influence of defoliation at C30 stage and species grain and forage protein content
Results of this study indicated that forage barley has ahigher protein content (182.6 g/kg DM) than forage triticale (174.2 g/kg DM) when it is cut at C30 stage. Analysis of variance has shown that this difference is significant (P <0.05) (Table 2).
This experiment has also shown that in two years of trial, dual-purpose cultivation affected positively the grain protein content of the two tested species. Clipped plant in C30 stage has given grain more rich in protein: 113.56 g/kg DM Vs 101.76 g/kg DM for barley and 95.57 g/kg DM Vs 93.88 g/kg DM for triticale. This increase of grain protein content between treatments was significant only for barley (P <0.05). The forage nutritional value, expressed as MFU/kg DM, was on average 0.78 MFU/kg DM for triticale and 0.68 MFU/ kg DM for barley and showed statistical variation linked to the specie (P <0.05).
DISCUSSION Winter cereals were grown for the dual-purpose of forage
and grain as an alternative to grain production only in a semi arid climate. The objective was to produce forage during winter (a season of scarce forage supply in the area) and to evaluate effects of clipping on grain production, which have been usually observed (Hadjichristodoulou, 1991; Royo et al., 1997; El-Shatnawi et al., 2004; Droushiotis, 1984).
In our experiment, triticale and barley have given similar forage production, between 2.29 and 2.46 DM t/ha for both species and during the two experimental years. This could be attributed to the fact that the cutting stage (C30) is too early and that different species could not express differences in biomass production. Specific traits for each species will be more observable after cutting with regrowth. Royo et al. (1997) have reported, under Mediterranean conditions, similar forage yields in first detectable node stage for triticale (2.03 t/ha) and barley (2.11 t/ha).
Yield components were differently affected by dual-purpose treatment. Thus, Clipping at C30 stage has enhanced spike number production barley and triticale. This is explained by the removal of the apical domination during final stage of the tillering period. In fact, with defoliation the predominant apex is eliminated and then tiller production restarts again and could drive to a higher number of productive tillers per plant (Briske and Richards, 1994). Bonachela et al. (1995) have also found that forage use during winter makes the tillering period

2734 Afr. J. Agric. Res.
Table 2. Forage crude protein, milk feed units in green forage and Grain Crude protein in relation to management system.
Forage yield Year FCP (g/kg DM) MFU/kg DM GCP (g/kg DM)
Barley one use (grain only) 2010/2011 - 99.45
b
2011/2012 102.82 b
Barley dual-Purpose 2010/2011 181.1
a 0.67
b 111.52
a
2011/2012 183.5 a 0.70
b 114.97
a
Triticale one use (grain only) 2010/2011 - 93.58
c
2011/2012 94.17 c
Triticale dual-Purpose 2010/2011 176.2
b 0.79
a 95.07
c
2011/2012 173.7 b 0.77
a 95.90
c
CV (%) 9,2 8.21 8,79
Species ** ** *
Year NS NS *
Treatment - - *
Treatment x species - - NS
Treatment x Year NS NS NS
Treatment x Year x Species NS NS NS
longer and then capacity to make fertile tiller and spike greater. Compared with cereals species grown in temperate regions, triticale and barley cultivars adapted to Mediterranean climates have relatively short life cycles, especially in the phases before terminal spikelet (Kirby, 1991), Thus a longer life cycle before the stage of maximum spikes number could increase tillering potential and, thereby, spikes number.
As for the number of grains per spike triticale and barley showed smaller grain number under dual-purpose treatment. The decrease in grain number in the clipped treatment can be explained by a reduction in the carbohydrate supply to the developing ears between clipping and anthesis, decreasing the number of of fertile tillers (Dunphy et al., 1982; Winter and Thompson, 1990).
The current study confirmed the shortage of grain yield for both cereals when they are used in dual-purpose compared to grain only management as found by Hadjichristodoulou (1991) who has reported a reduction in barley grain yield under rain fed conditions. Royo and Tribó (1997) found a reduction in grain yield ranging from 7 to 70%, by comparison to losses of triticale of 8 to 24%. Bonachela et al. (1995) recorded a grain yield reduction of 11% in Southern Spain, averaged over cultivars and 3 years. Royo et al. (1997) has reported, for barley, similar reduction of 23% when forage was cut at stage C30 and 42% when forage was cut at stage C31.
Grain yield reduction after forage removal is attributed, in our trial, to the reduction of spike fertility, thus the grain number per spike in both cereals was statistically reduced after forage removal. The good rainfall
conditions during February and March have allowed a good restart of tillering and then more spikes per plant, which was associated with a reduction of grain number per spike.
In our study, protein produced in forage was superior in Barley compared to Triticale and averaged 182.3 g/kg DM for barley and 174.9 g/kg DM for triticale and This is in accordance with Royo et al. (1997) results who have measured around 172 g/kg DM for triticale cut in C30 and C31 stages and around 189 g/kg DM for barley cut at same stages. In the contrary, triticale forage has shown better energy content than triticale 0.78 MFU/kg DM vs 0.68 MFU/kg DM. In the other hand, grain protein content was positively affected by defoliation for both species. The significant increase of grain protein after defoliation in C30 stage could be attributed to the dilution effect, since the grain yield was decreasing after clipping and the number of spikes per plant was higher. The higher content of grain protein for dual-purpose use could also be explained by a higher consumption of nutrients than in only grain use. This conclusion joins results of Francia et al. (2006) who have reported also an increase of grain protein content after clipping during green stage for barley and oat. Conclusions Of the two crops studied, triticale demonstrates clear superiority in the grain yield, milk feed units value and straw production over barley in the dual-purpose system

in the semi-arid region of Tunisia. Triticale has shown good regrowth after clipping in green stage and reduction of grain yield did not exceed 22%, although barley grain yield was reduced by 29% after forage removal during tillering stage. In the other hand, barley has given grain and forage more rich in protein than triticale and this for both management systems.
Triticale has specific morpho-physiological traits that make it more suitable to dual-purpose cultivation than other cereals. It is highly efficient in the utilization of water and nutrients in limiting conditions, a good capacity for tillering, and high capacity for regrowth after forage use; that, in addition to its capacity to compete, enables a fast and large accumulation of biomass. Further research which study the economic impact of dual purpose management of Triticale compared to only grain use may aid to make the choice for the dual or single use of triticale and barley. Conflict of Interests The authors have not declared any conflict of interests. REFERENCES Amara H, Ketata H, Zouaghi M (1985). Use of barley (Hordeum vulgar
L.) for forage and grain in Tunisia. Rachis 4(2):28-33. Arzadun MJ, Arroquy JI, Laborde HE, Brevedan RE (2003). Grazing
pressure on beef and grain production of dual-purpose wheat in Argentina. Agron. J. 95(5):1157-1162.
Belaird A, Moris ML (1991). Wheat and barley production in rainfed marginal environment of west Asia and North Africa; problems and prospects. CIMMYT Econ. Working paper 91/02 CIMMYT Mexico, D.F., Mexico.
Ben Youssef S, Chakroun M., El Felah M, Omri N (2001). Aptitude à la double exploitation de génotypes d’orge en région Subhumide de Tunisie. Fourrages 168:509-521.
Bonachela S, Orgaz F, Fereres E (1995). Winter cereals grown for grain and for the dual-purpose of forage plus grain. I. Production. Field crop Res. 44:1-11.
Briske DD, Richards JH (1994). Physiological responses of individual plants to grazing: Current status and ecological significance. Ecological implications of livestock herbivory in the west. Soc. Range Management, Denver, CO, pp. 147-176.
Chase LE (1991). Energy prediction equations in USA at NY DHAI Forage laboratory. Production Agricultural Training School, Ithaca, NY.
Droushiotis DN (1984). The effect of variety and harvesting stage on forage production of barley in a low-rainfall environment. J. Agric. Sci. 102(02):289-293.
Dunphy DJ, McDaniel ME, Holt EC (1982). Effect of forage utilization on wheat grain Yield. Crop Sci. 22:106-109.
El-Shatnawi MKJ, Ghosheh H, Shannag H, Ereifej K (1999). Defoliation time and intensity of wall barley in the Mediterranean rangeland. J. Range Manage 52:258-262.
El-Shatnawi MKJ, Ghosheh H, Shannag H, Ereifej K (1999). Defoliation time and intensity of wall barley in the Mediterranean rangeland. J. Range Manage 52:258-262.
El-Shatnawi MKJ, Ghosheh HZ (1999). Effect of clipping on wall barley (Hordeum murinum L.): tillering and forage production. Afr. J. Range For. Sci. 15:92-96.
Epplin FM, Hossain I, Krenzer Jr EG (2000). Winter wheat fall–winter forage yield and grain yield response to planting date in a dual-purpose system. Agric. Syst. 63(3):161-173.
Beji 2735 Francia E, Pecchioni N, Nicosia OLD, Paoletta G, Taibi L, Franco V,
Odoardi M, Stanca AM, Delogu G (2006). Dual-purpose barley and oat in a Mediterranean environment. Field Crops Res. 99(2):158-166.
Garcia del MLF, Boujenna A, Yanez J, Ramos JM (1995). Forage production, grain yield, and protein content in dual-purpose triticale grown for both grain and forage. Agron. J. 87:902-908.
Giunta F, Motzo R, Fois G, Bacciu P (2015). Developmental ideotype in
the context of the dual‐purpose use of triticale, barley and durum wheat. Ann. Appl. Biol. 166(1) :118-128.
Hadjichristodoulou A (1990). Self-regenerating pasture barley. Rachis, 9(2):13-17.
Hossain I, Epplin FM, Krenzer Jr EG (2003). Planting date influence on dual-purpose winter wheat forage yield, grain yield, and test weight. Agron. J. 95:1179-1188.
Khalil HI, Carver BF, Krenzer EG, MacKown CT, Horn GW (2002a). Genetic trends in winter wheat yield and test weight under dual-purpose and grain only management systems. Crop Sci. 42:710-715.
Khalil HI, Carver BF, Krenzer EG, MacKown CT, Horn GW, Rayas-Duarte P (2002b). Genetic trends in winter wheat grain quality with dual-purpose and grain only management systems. Crop Sci. 42:1112-1116.
Kirby EJM (1991). Cereal development in Mediterranean developments. In: Acevedo E, Fereres E, Gimenez C, Srivastava JP.(Eds.). Improvement and management of winter cereals under temperature, Drought and Salinity Stresses. Proceedings Of a ICARDA-INIA Symposium, 1987 at Cordoba, Spain, pp. 66-84.
Mazid A, Hallajian M (1983). Crop-livestock interactions. Information from a barley survey in Syria. Res. Rep. 10:28.
Ouji A, Rouassi M, Ben Salem L (2010). Comportement Varietale de l’orge (Hordeum vulgare L.) en double exploitation. Annales de l’INRAT. 83:103-117
Royo C, Insa JA, Boujenna A, Ramos JM, Montesinos E, Garcia Del ML (1994). Yield and quality of spring triticale used for forage and grain as influenced by sowing date and cutting stage. Field Crop Res., 37:161-168.
Royo C, Lopez A, Serra J, Tribó F (1997). Effect of sowing date and cutting stage on yield and quality of irrigated barley and triticale used for forage and grain. J. Agron. Crop Sci. 179:227-234.
Royo C, Montesinos E, Molina-Cano JL, Serra J (1993). Triticale and other small grain cereals for forage and grain in Mediterranean conditions. Grass Forage Sci. 48:11-17.
Royo C, Pares D (1996). Yield and quality of winter and spring triticales for forage and grain. Grass Forage Sci. 51:449-455.
Royo C, Tribó F (1997). Triticale and barley for grain and dual-purpose (forage + grain) in Mediterranean-type environment. II. Yield, yield components, and quality. Aust. J. Agric. Res. 48:423-432.
Scott WR, Hines S, Love G (1988). The effect of grazing on components of grain yield in winter barley. New Zealand J. Exp. Agric. 165:313-319.
Winter SR, Thompson EK (1990). Grazing winter wheat: I:response of semidwarf cultivars to grain and grazed production systems. Agron. J. 82:33-37.
Vol. 11(30), pp. 2736-2743, 28 July, 2016
DOI: 10.5897/AJAR2016.11214
Article Number: 7AB210059754
ISSN 1991-637X
Copyright ©2016
Author(s) retain the copyright of this article
http://www.academicjournals.org/AJAR
African Journal of Agricultural Research
Full Length Research Paper
Statistical process control in self compensating emitters using water at different saline concentrations
Patrícia Ferreira da Silva*, José Dantas Neto, Rigoberto Moreira de Matos, Sabrina Cordeiro de Lima and Delfran Batista dos Santos
Federal University of Campina Grande, Academic Unit of Agricultural Engineering, Irrigation and Drainage Laboratory,
CEP 58429-140, Campina Grande, PB, Brazil.
Received 12 May, 2016; Accepted 14 July, 2016
The statistical process control applied in the irrigation systems allows the visualization of process to reduce wastage of inputs, such as water and energy quality, which contributes to assessing its proper functioning, and feasibility of implementation and operation. That is why it is necessary to evaluate the self-compensating emitters using saline water at different concentrations. This experiment was applied in the greenhouse, agricultural engineering academic unit, Federal University of Campina Grande. The treatments consisted of five salinity levels of irrigation water (ECwi) (0.6, 1.5, 2.5, 3.5 and 4.5 dS m
-1 at
25°C), set in pressure of 160 kPa during 15 irrigation trials for new emitters, with 350 h of operation. The use of statistical process control tool has shown promise in identifying emitters’ problems due to the use of lower quality water for irrigation. The inferior quality of water does not influence the flow and Christiansen uniformity coefficient of self-compensating emitters, but after 350 h of operation, there is need management operations and maintenance of the system to be made. The uniformity coefficient Christiansen (CUC) for new and used emitters above 90% was rated as excellent in all treatments saline. The Shewhart control charts allowed diagnosing of about 350 h of operation which is necessary for the maintenance of the irrigation system when operating with saline water. Key words: Quality engineering, Shewhart charts, electrical conductivity.
INTRODUCTION Statistical process control is a tool in scientific experiments, used to assess product quality and can submit changes so as to generate information to improve it (Montgomery, 2009). This information helps to verify that the process is within an acceptable standard of quality (Werkema, 1995).
Irrigation systems are perfectly adapted to the
application of statistical quality control, since with the fixed elimination of waste water in the operation and maintenance there are cost reduction and increased efficiency of the systems (Justi et al., 2010).
One of the main tools of statistical control are the Shewhart charts that allow monitoring of the average and the variability of the evaluated data quality characteristics
*Corresponding author. E-mail: [email protected].
Author(s) agree that this article remain permanently open access under the terms of the Creative Commons Attribution
License 4.0 International License

inherent in any product or process (Saldanha et al., 2013;Ide et al., 2009; Roldan et al., 2013). It is also important to point out that, regardless of the process, it will hardly be the null variability.
In Brazil, there are few places that have enough structure to make a detailed assessment of irrigation systems in order to be able to carry out the improvement of such equipment, and it is necessary for the construction of test benches designed for laboratory testing in order to compare with the field conditions (Valnir Júnior et al., 2011).
The deployments of increasing frequent environmental laws and stringent rules on the classification of water bodies and environmental guidelines were made to frame CONAMA RESOLUTION nº 357, on 17 March 2005. Technological development for systems that make use of low-quality water is increasingly necessary, considering the rationing of this well increasingly scarce on the planet (Orssatto et al., 2014). Faced with the problem of scarcity of water resources, saline water irrigation system applied to crops was used as an alternative; aimed to save water resources of good quality (Busato and Soares, 2010).
Therefore, the use of the control tools in identifying problems caused by emitters on the basis of low-quality water usage in irrigation is of utmost importance, since the methodology used for the evaluation of uniformity based on coefficients of uniformity can be subjected to errors. In this way, the Shewhart control charts rise as an alternative to identifying random variations, common causes, systematic variations, and the special causes of continuous adjustment process allowed.
The aim of this study is to evaluate self-compensating emitters submitted to the use of different saline water concentrations through the application of statistical process control tools. MATERIALS AND METHODS The experiment was conducted in a greenhouse owned by an academic unit of agricultural engineering, Federal University of Campina Grande - PB, 7° 12 ' 88 "South latitude, 35° 54 ' 40" West longitude and an average elevation of 532 m.
The pressurization system used in the experiment consisted of a motorcycle 0.5 HP centrifugal pump. The operation of pump operation, with start time 6.00 h and end each cycle of application at 11.00 h, was performed manually following the start times, duration of application and flow test. To prevent the entry of suspended particles in the system with size greater than the diameter of the exit of the emitters, a 1 "screen filter with a capacity of 5 m3 h-1 was used. The five sidelines were composed of masonry structure with 8 m long, 1 m wide and 0.11 m tall, with three experimental modules, five reservoirs and Bourdon type gauge 1, connected to the input of the emitters. The drip hose used in the experiment is self-compensating, with emitters spacing of 0.30 m and a recommended operating pressure in the range of 60 to 420 kPa.
The treatments were composed of five levels of irrigation water salinity (ECw) (0.6, 1.5, 2.5, 3.5 and 4.5 dS m-1 at 25°C) and three repetitions, to 160 pressure (kPa) provided to the system. The waters of different concentrations saline were prepared
da Silva et al. 2737 methodology as proposed by Richards (1954).
The flow rates of the emitters were sampled comparable to the method proposed by Deniculi et al. (1980). 15 evaluations in each collection to new emitters and 350 h of operation at each level of salinity of the water were carried out. The flow data determined the coefficient of the uniformity of Christiansen CUC (Equation 1):
( ∑ | |
) (1)
In that, Qi = flow collected on each emitter (L h-1); = average flow rates collected from all the emitters (L h-1); n = number of emitters. The application of the tools provided by the statistical process control emphasized the need to determine the normality of the data by the Kolmogorov-Smirnov test, with the modification of Lilliefors, then the stages of statistical process control was applied through the Shewhart control charts of individual samples, with the aid of Minitab 16 software.
The "X - R" graphic was used in monitoring the mean value (X) and its variability. The model uses the arithmetic mean of the values resulting from the measurements of sample form as a process of position measurement, securing three standard deviations, increased average standards and setting the Upper Control Limit (UCL). According to Equation 2, three fallen deviations from the average as Equation 3 sets the Lower Control Limit (LCL) of the process; thus, the center line represents the mean value of quality according to the state under control (Lima et al., 2006).
(2) (3) In that, UCL = upper bound of control; X = is the control chart axis and corresponds to the average value of flows; σ = is the estimator of the population standard deviation; LCL = lower bound of control.
RESULTS AND DISCUSSION Normality tests The results of applying the Kolmogorov-Smirnov test for normality with the modification of Lilliefors (Lilliefors, 1967), to flow and the Christiansen Uniformity coefficient (CUC) of new issuers, are in Table 1 with uniformity coefficient of Christiansen (CUC) of new emitters. It was found that only the flow parameter from issuers to S2 treatment (1.5 dS m
-1) did not obtained a normal
distribution; this fact occurred because the level of significance observed is lower than 10%. Possibly, this could have occurred because of differences between the data, but as the samples were always collected in pairs, the difference may be due to the clogging of the holes, providing flow with uneven distribution.
Saldanha et al. (2013) opine that the process has a normal distribution of their frequencies that can carry out a proper assessment of process capability. If these prerequisites are not met, it is not possible to make any inference about the process capability.
The normality of the data by the Kolmogorov-Smirnov with modifying Lilliefors (Lilliefors, 1967) to the flow and the coefficient of uniformity of Christiansen (CUC) to

2738 Afr. J. Agric. Res.
Table 1. Descriptive statistics of parameters evaluated according to the Kolmogorov-Smirnov test with the Lilliefors modification (1967) for flow and Christiansen uniformity coefficient in the new emitter.
Parameter Maximum
value
Minimum value
Average Standard deviation
CV Normality
Value V Crit P- Valor Normal
S1 (0.6 dSm-1
)
FLOW 2.45 2.21 2.39 0.064 0.69 0.12 0.22 0.15 Yes
CUC 99.98 98.53 99.41 0.46 0.47 0.10 0.22 0.15 Yes
S2(1.5 dSm-1
)
FLOW 3.64 2.21 2.45 0.33 13.76 0.42 0.22 0.01 No
CUC 99.89 97.00 98.92 0.87 0.88 0.13 0.22 0.15 Yes
S3(2.5 dSm-1
)
FLOW 2.45 2.21 2.37 0.07 3.28 0.15 0.22 0.15 Yes
CUC 99.94 97.47 99.20 0.67 0.68 0.13 0.22 0.15 Yes
S4(3.5 dSm-1
)
FLOW 2.45 2.21 2.38 0.06 2.53 0.12 0.22 0.15 Yes
CUC 99.97 99.06 99.56 0.32 0.32 0.12 0.22 0.15 Yes
S5(4.5 dSm-1
)
FLOW 2.45 2.21 2.38 0.06 2.66 0.19 0.22 0.10 Yes
CUC 99.98 98.75 99.49 0.41 0.42 0.12 0.22 0.15 Yes
p-valor, The observed significance level. Vcrit:, critical value.
Table 2. Descriptive statistics of parameters evaluated according to the Kolmogorov-Smirnov test with the Lilliefors modification (1967) for flow and Christiansen uniformity coefficient in drippers with 350 h of operation.
Parameter Maximum
value Minimum
value Average
Standard deviation
CV Normality
Value V Crit P- Valor Normal
S1 (0.6 dSm-1
)
FLOW 2.57 2.09 2.32 0.15 6.65 0.13 0.22 0.15 Yes
CUC 99.88 96.58 98.57 0.92 0.93 0.15 0.22 0.15 Yes
S2(1.5 dSm-1
)
FLOW 2.60 2.21 2.41 0.12 4.98 0.13 0.22 0.15 Yes
CUC 99.93 90.00 97.71 2.35 2.38 0.19 0.22 0.10 Yes
S3(2.5 dSm-1
)
FLOW 2.63 2.27 2.47 0.10 4.30 0.09 0.22 0.15 Yes
CUC 99.88 97.75 98.77 0.74 0.75 0.11 0.22 0.15 Yes
S4(3.5 dSm-1
)
FLOW 2.61 2.15 2.49 0.13 5.45 0.22 0.22 0.05 No
CUC 99.94 94.34 98.61 1.34 1.36 0.17 0.22 0.15 Yes
S5(4.5 dSm-1
)
FLOW 2.75 2.27 2.49 0.15 6.03 0.19 0.22 0.10 Yes
CUC 99.69 97.00 98.53 0.84 0.85 0.08 0.22 0.15 Yes
p-valor, The observed significance level. Vcrit:, critical value. emitters with 350 h of operation are shown in Table 2. Note that the flow to the emitters in S4 (3.5 dSm
-1) did not
show a normal distribution, since the observed level of significance was 0.05. This can be explained by sediment

da Silva et al. 2739
Figure 1. Control charts of individual flow measurements for the S1 treatment (A), S3 (B), S4 (C) and S5 (D) in the new emitters.
buildup forming a white crust through the water reflected in the hole observed in differences flows. Vasconcelos et al. (2013) found similar results for the electrical conductivity of water, using the same Lilliefors modification test. Application of statistical process control The Shewhart control chart for individual measurements over 15 tests for evaluation of the emitters is given in Figure 1. It was observed that the testing for the flow of the new emitters in the S1 treatment (0.6 dS m
-1); S3 (2.5
dS m-1
) and S5 (4.5 dS m-1
) are within the control limits, that is they did not show variation, >3σ or <3σ which were the limits for the process, and the UCL control upper limit of approximately (2.66 L h
-1) and lower control
limit LCL (2.09 L h-1
). The process was under control and the distributed flow near the observed mean line (2,3 h L
-
1) was indicated. Thus, there was no particular factor that
promotes a process that behaves differently than usual or could result in a displacement of the expected quality level (Figure 1A, B and D).
The S4 treatment (3.5 dS m-1
) test 2 was close to the lower control limit, that is, out of statistical control (Figure
1C). According Werkema (1995), this fact is indicative of the lack of control of a process due to special causes that account for 15% of the problems in the process. The removal of these special causes may be done by trained operatives and maintenance personnel through local actions such pressure variation correction, cleaning emitter obstructed, the energy oscillation control and others that do not involve significant investment, that is, there is a point at which maintenance needs for the irrigation system may be used efficiently.
If special causes responsible for process variation are eliminated, and even present in a normal distribution, then it can be considered that the process is in statistical control, which means it is a stable process. Even so, the process still produces defective items and it is essential to evaluate the process capability to meet the specifications laid down in accordance with customer requirements (Gonçalez and Werner, 2009).
A similar result was gotten by Juchen et al. (2013) while studying drip irrigation for the production of fertigated lettuce with agro-industrial wastewaters. The limits control specification (ECL) were among 6,069 L h
-1
m-1
for the lower limit (LCL) and 8,058 L h-1
m-1
to the upper limit (UCL); four treatments applied work were observed and the flows were distributed close to the
S1 (0.6 dS m-1
) S3 (2.5 dS m-1
)
151413121110987654321
3.00
2.75
2.50
2.25
2.00
1.75
1.50
Test
Flo
w
_X=2.39
UCL=2.61
LCL=2.17
(A)
151413121110987654321
3.00
2.75
2.50
2.25
2.00
1.75
1.50
Test
Flo
w
_X=2.37
LCL=2.09
UCL=2.66
(B)
S4 (3.5 dS m
-1) S5 (4.5 dS m
-1)
151413121110987654321
3.00
2.75
2.50
2.25
2.00
1.75
1.50
Test
Flo
w
_X=2.38
UCL=2.57
LCL=2.20
(C)
151413121110987654321
3.00
2.75
2.50
2.25
2.00
1.75
1.50
Test
Flo
w
_X=2.38
UCL=2.58
LCL=2.18
(D)

2740 Afr. J. Agric. Res.
Figure 2. Control charts of individual flow measurements for the S1 treatment (A), S2 (B), S3 (C) and S5 (D) applied to emitter with 350 h of operation.
average of 7,063 L h
-1m
-1. As for the S2 (1.5 dS m
-1)
points of the tests, they were not normally distributed and, therefore, could not get a control chart with the same.
The data collected for the preparation of Shewhart charts with 350 operating hours over 15 trials are shown in Figure 2. It is noted that the S1 treatment (0.6 dS m
-1)
and S2 (1.5 dS m-1
) flow of data remains within the control limits (Figure 2A and B), but for the S1treatment (0.6 dS m
-1) test 4 to 8, the data represented an average
line sequence above and as for the S2 treatment (1.5 dS m
-1) test 7 to 11, the data are in the following midline
above; therefore, such processes were considered out of quality statistical control (Figure 2A and B).
A similar result was that of Giron et al. (2014) who studied the application of statistical process control in a company poultry sector. Such observations may be the result of one or a few related causes that produces large variations in the process and occur as a result of behavior deviations from "normal" process, and lack of timely evaluation agreement with the criteria recommended by Werkema (1995), which may happen due to changes in temperature conditions inside the
greenhouse or even destabilization of the pressure supplied to the system.
In S3 treatment (2.5 dS m-1
), it is observed that test 6 is above the upper control limit and the test 13 below the control lower limit outside. Therefore, for the process to S5 treatment (4.5 dS m
-1), test 2 is above the upper
control limit, similar to the S3 treatment (2.5 dS m-1
) which process remains out of control (Figure 2C and D). These variations of controlled irrigation may be the result of variations in the irrigation system as an oscillation in the emitter operating pressure during operation (Montgomery, 2009). Also according to the author, points that are under the lower control limit (LCL) recommended denouncement of the existence of some problems in the process and, in the case of evaluation of irrigation, they can be explained by factors such as pressure variation system, clogging, water temperature, and many other factors.
Figure 3 displays the results for individual measures with the distribution of 15 tests for the Christiansen uniformity of coefficient (CUC). There is, for the S1 treatments (0.6 dS m
-1); S2 (1.5 dS m
-1); S4 (3.5 dS m
-1)
and S5 (4.5 dS m-1
). The CUC results were satisfactory
S1 (0.6 dS m
-1) S2 (1.6 dS m
-1)
151413121110987654321
3.00
2.75
2.50
2.25
2.00
1.75
1.50
Test
Flo
w
_X=2.32
LCL=2.01
UCL=2.62
(A)
151413121110987654321
3.00
2.75
2.50
2.25
2.00
1.75
1.50
Test
Flo
w
_X=2.41
LCL=2.11
UCL=2.71
(B)
S3 (2.5 dS m
-1) S5 (4.5 dS m
-1)
151413121110987654321
3.00
2.75
2.50
2.25
2.00
1.75
1.50
Test
Flo
w
_X=2.47
LCL=2.31
UCL=2.63
1
1
(C)
151413121110987654321
3.00
2.75
2.50
2.25
2.00
1.75
1.50
Test
Flo
w
_X=2.49
UCL=2.75
LCL=2.22
1
(D)

da Silva et al. 2741
Figure 3. Control charts for individual averages and Christiansen uniformity coefficient (CUC) as a function of salinity of irrigation water S1(A), S2 (B), S3 (C), S4(D) and S5 (E) in new emitters.
although some trials were very close to the UCL and the data distribution was random to the median line lying within the control limits. However, only the S1 and S5 are under control treatments. S2 treatment (1.5 dS m
-1) is
from test 4 to 9; sequence points such as the S4 (3.5 dS m
-1) have a non-random point sequence 11 to 15 (Figure
3 A, B, D and E). Juchen et al. (2013) also noted in their study, the
existence of a type of points sequence below the central line configuration between samples 22 to 27, suggesting therefore that there may be a special problem cause for
the process and promotes a different behavior as usual or may result in a displacement of the expected quality level.
For S3 treatment (2.5 dS m-1
) it is found that the test 6 is below the lower control limit (LCL = 97.54%) and this is considered an extreme variation for having a point outside the limit, that is, the process is out of quality control, but no value was greater than the upper control limit (UCL = 100%) (Figure 3C). Similar results were found by Hermes et al. (2013) in his work on quality control in drip irrigation with a wastewater cassava
S1 (0.6 dS m-1
) S2 (1.5 dS m-1
)
151413121110987654321
100
99
98
97
96
95
Test
CU
C
_X=99.41
UCL=100
LCL=97.93
(A)
151413121110987654321
100
99
98
97
96
95
Test
CU
C
_X=98.92
UCL=100
LCL=96.79
(B)
S3 (2.5 dS m
-1) S4 (3.5 dS m
-1)
151413121110987654321
100
99
98
97
96
95
Test
CU
C
_X=99.20
UCL=100
LCL=97.541
(C)
151413121110987654321
100
99
98
97
96
95
Test
CU
C
_X=99.56
UCL=100
LCL=98.49
(D)
S5 (4.5 dS m-1
)
151413121110987654321
100
99
98
97
96
95
Test
CU
C
_X=99.49
UCL=100
LCL=98.00
(E)

2742 Afr. J. Agric. Res.
Figure 4. Control charts for individual averages and Christiansen uniformity coefficient (CUC) as a function of salinity of irrigation water S1(A), S2 (B), S3 (C), S4(D)and S5 (E) with 350 h operation.
processing system.
Another observation was indications of lack of control in the S2 treatments process (1.5 dS m
-1); S3 (2.5 dS m
-1)
and S4 (3.5 dS m-1
) with the existence of consecutive sequences values both above and below the middle line, besides the very occurrence points outside the control limits (Figure 3B, C and D). It is emphasized, however, that all assays over 90% were rated as excellent Justi et
al. (2010) applied control chart for Christiansen uniformity coefficient in a sprinkler irrigation system and observed the existence of a point outside the upper
control limit, and the graph had behaved so similar to that described in this study. Frigo et al. (2013) states that the values above the upper control limit should be considered acceptable because the higher the values, the better the irrigation of evaluated coefficients.
The control chart for the CUC in 15 tests, with five irrigation water salinity levels with 350 operating hours is seen in Figure 4. Note that S1; S3 and S5 were approximately between 95% for the lower limit (LCL) and 100% for the upper limit (UCL) and by observing 3 treatments, it is seen that the CUC is distributed close to
S1 (0.6 dS m-1
) S2 (1.5 dS m-1
)
151413121110987654321
100
98
96
94
92
90
88
Test
CU
C_X=98.57
LCL=95.65
UCL=100
(A)
151413121110987654321
100
98
96
94
92
90
88
Test
CU
C
_X=97.72
LCL=9.46
UCL=100
1
(B)
S3 (2.5 dS m
-1) S4 (3.5 dS m
-1)
151413121110987654321
100
98
96
94
92
90
88
Test
CU
C
_X=98.77
LCL=96.84
UCL=100
(C)
151413121110987654321
100
98
96
94
92
90
88
Test
CU
C
_X=98.61
LCL=95.82
UCL=100
1
(D)
S5 (4.5 dS m
-1)
151413121110987654321
100
98
96
94
92
90
88
Test
CU
C
_X=98.53
UCL=100
LCL=95.96
(E)

the average of 98% while the S1 treatment and S3 were under control. However, in the S5 treatment the existence of a sequence values setting type, such as the increase of the Christiansen uniformity coefficient, 9 to 13 was observed (Figure 4A, C, and E).
Juchen et al. (2013) also found the same effect studying quality control in drip irrigation for the production of lettuce fertigated with agro industrial wastewaters. For Gonçalves and Antoniassi (2010), the estimation uncertainty is a term that refers to statistical control maintenance as a survey conducted by a testing laboratory that can only return to the specific or random causes, while significant changes in the object usually analyzed occur in uncertainty.
In S2 treatments (1.5 dS m-1
) and S4 (3.5 dS m-1
) the existence of a sequence of values of the type which also have points outside the lower limit setting control (LCL = 98 46 and 95.82%, respectively) (Figure 4B and D) was observed. When observing some point outside the control limits, when the point is below the lower control limit, it indicates that this should be given special attention and be investigated (Souza et al., 2009). Also, according to the authors one process is out of control when one or more points are outside the limits; under the random configuration or when there are special settings with points inside or outside the control limits.
In this context, the use of statistical methods does not guarantee the solution of all the problems of a process, but it is a rational, logical and organized way to determine where the problems are and to find ways to solve them. These methods can help in getting systems to ensure continuous improvement of quality and productivity at the same time (Lima et al., 2006). Conclusions 1. The use of statistical process control tool has shown promises in identifying emitters’ problems due to the use of lower quality water for irrigation. 2. The inferior quality of water does not influence the flow and Christiansen uniformity coefficient of self-compensating emitters, but after 350 h of operation, management operations and maintenance of the system should be made. 3. The uniformity coefficient Christiansen (CUC) for new and used emitters above 90% rated were excellent in all treatments S1 saline (0.6 dS m
-1), S2 (1.5 dS m
-1), S3
(2.5 dS m-1
), S4 (3.5 dS m-1
) and S5 (4.5 dS m-1
). 4. The Shewhart control charts allowed diagnosing of about 350 h of operation which is necessary for the maintenance of the irrigation system when operating with saline water.
Conflict of Interests The authors have not declared any conflict of interests.
da Silva et al. 2743 REFERENCES Busato CCM, Soares AA (2010). Desempenho de gotejadores,
utilizando água de baixa qualidade química e biológica. Biosci. J. 26(5):739-746.
Deniculi W, Bernardo S, Thiébaut JTL, Sediyama GC (1980). Uniformidade de distribuição de água, em condições de campo num sistema de irrigação por gotejamento. Rev. Ceres. 27(150):155-162.
Frigo JP, Vilas Boas MA, Frigo EP, Hermes E, Tessaro E (2013) . Irrigação diurna e noturna em um sistema de aspersão convencional em Palotina-PR. Braz. J. Irrigation and Drainage 18(2): 318-327.
Giron E, Opazo MAU, Rocha Junior WF, Gimenes RM (2014). Aplicação do controle estatístico de processo em uma empresa do setor avícola. RAI: Rev. de Administração e Inovação 10(4):38- 62.
Gonçalez PU, Werner L (2009). Comparação dos índices de capacidade do processo para distribuições não-normais. Rev. Gest. e Produção 16 (01):121-132.
Gonçalves E B, Antoniassi R (2010). Incerteza em resultados analíticos e verificação de conformidade de qualidade de alimentos. Ciênc. e Tecn. de Alimentos. 30(4):917-927.
Hermes E, Vilas Boas MA, Gomes SD, Gomes BM, Reis CF (2013). Quality control in irrigation and fertigation with cassava processing wastewater into drip system. Int. J. Food Agric. Environ. (Print) 11(2):841-845.
Ide MS, Ribeiro JRJI, Souza LM (2009). Gráficos de controle com uma abordagem de séries temporais. Rev. Elet. Produção Engenharia 2(1):69-84.
Juchen CR, Suzek FL, Vilas Boas MA (2013). Irrigação por gotejamento para produção de alface fertirrigada com águas residuárias agroindustriais. Braz. J. Irrigation Drainage 18(1):243-256.
Justi AL, Vilas Boas MA, Sampaio SC.(2010) Índice de capacidade do processo na avaliação da irrigação por aspersão. Engenharia Agríc. 30(2):264-270.
Lilliefors HW (1967). On the Kolmogorov-Smirnov test for normality with mean and variance unknown. J. Am. Stat. Assoc. 62(318):399-402.
Lima AAN, Lima JR, Silva JL (2006). Aplicação do controle estatístico de processo na indústria farmacêutica. Rev. Ciênc. Farm. Básica Aplicada 27(3):177-187.
Montgomery DC (2009). Introdução ao controle estatístico da qualidade. Tradução Ana Maria Lima de Farias, Vera Regina Lima de Farias e Flores; Revisão técnica Luiz da Costa Laurencel. – Rio de Janeiro: LTC, 4 ed reimpressa 513 p.
Orssatto F, Vilas Boas MA, Nagamine R, Uribe-Opazo MA (2014). Shewhart's control charts and process capability ratio applied to a sewage treatment station. Engenharia Agríc. 34(4):770-77.
Richards LA (1954). Diagnosis and improvement of saline and alkali soils. Washington: United States Salinity Laboratory 160 p (Agriculture Handbook, 60).
Roldan VPS, Cabral ACQ, Filho JCLS, Santos SM, Pessoa MNM (2013). Inovação em serviços: análise do caso de uma empresa de médio porte no nordeste brasileiro. Rev. Gest. Ind. 9(1):1-23.
Saldanha P, Rothe, CK, Benedett FR, Pacheco DAJ, Jung CF, Ten Caten CS (2013.) Analisando a aplicação do Controle Estatístico de Processos na indústria química: Um estudo de caso. Rev. Espacios 34(11):1-17.
Souza LM, Júnior JIR, Reis GM, Ide MS (2009). Eficiência dos gráficos de controle xbarra, ewma e cusum. Eletrônica Engenharia 1(1):81-94.
Valnir Junior M, Carvalho CM, Carvalho CM, Santos Neto AM, Soares JI, Lima SCRV, Carvalho MR (2011). Análise de desempenho em laboratório de linha gotejadora nova e após sua utilização em campo. Rev.bras. de agric. irrigada. 5(4):351-360.
Vasconcelos NS, Dantas Neto J, Medeiros JF, Lima CJGS (2013). Qualidade Das Águas Subterrâneas De Área Irrigada Da Comunidade De Pau Branco Em Mossoró (RN). Rev. Holos. 1(29):11-23.
Werkema MCC (1995). Ferramentas da qualidade: ferramentas estatísticas básicas para o gerenciamento de processos. FCO - UFMG 404 p.

Vol. 11(30), pp. 2744-2760, 28 July, 2016
DOI: 10.5897/AJAR2016.11128
Article Number: 84DA18B59758
ISSN 1991-637X
Copyright ©2016
Author(s) retain the copyright of this article
http://www.academicjournals.org/AJAR
African Journal of Agricultural Research
Full Length Research Paper
Exchangeable cations and available phosphorus in soils with variable charge after application of special
liming materials
Jessica Alves dos Santos1*, Adriel Ferreira da Fonseca1, Domenico Zocco2 and Igor Vieira3
1State University of Ponta Grossa, Av. Carlos Cavalcanti, Ponta Grossa, Paraná, Brazil. 2Omya International AG, PO Box 335, Baslerstrasse 42, 4665 Oftringen, Switzerland. 3Omya do Brasil Ltda, Av. Angélica, 2220, 2° andar, São Paulo, São Paulo, Brazil.
Received 13 April, 2016; Accepted 14 July, 2016
Special liming materials have the potential to control soil acidity and constitute a source of nutrients for plant development. In this study, the efficiency of special liming materials was evaluated. Their effects in soil exchangeable cations and available P concentrations were compared with the ones of dolomitic limestone (DL). Samples of Typic Distrudept and Rhodic Hapludox were collected from 0 to 20 cm layer. Two experiments were conducted in a completely randomized block of 4x4x8 factorial design. Four liming materials were studied: DL, granulated micronized calcite (GMC), granulated micronized dolomite (GMD) and carbonated suspension (CS). The liming materials were added to the soils doses that increase the soil bases saturation (V) to 50, 70 and 90%; and a control treatment. The treated soil samples were incubated at 23 ± 2°C and 60% of soil water retention capacity for eight periods (0, 7, 15, 30, 45, 60, 75 and 90 days). Exchangeable Ca, Mg and K, and available P were determined. All liming materials increase exchangeable Ca and Mg, and available P. However, the most efficient source that increased exchangeable Ca in the studied soils were CS followed by GMC. Key words: Special liming materials, micronized limestone, carbonated suspension, availability of nutrients, Inceptisol, Oxisol.
INTRODUCTION Soil acidity is a severe agricultural problem in the world. Firstly, soil acidity is mainly due to: the removal of basic cations (Ca
2+, Mg
2+ and K
+), cation exchange capacity
(CEC) from the soil and their substitution with exchangeable aluminum (Al
3+) and non-dissociated
hydrogen (H+). Secondly, soil acidity is caused by Ca, Mg
and K uptake and exportation by the harvested crops (Nagy and Kónya, 2007; Souza et al., 2007; Raij, 2011). Acidity might result in accumulation of rich soil particles in Al
3+ and iron (Fe) oxide, Al
3+ and manganese (Mn)
*Corresponding author. E-mail: [email protected].
Author(s) agree that this article remain permanently open access under the terms of the Creative Commons Attribution
License 4.0 International License
toxicity and Ca, Mg, K and phosphorus (P) deficiency in the soil (Hue, 2011). Therefore, in acid soils, the plants have no opportunity to grow adequately and their yields are negatively affected, mainly in situations of water stress (Joris et al., 2013).
Liming controls acidity, reestablishes or provides high productivity, make nutrients available, reduce Al
3+ and
consequently supply the soil with Ca and Mg (Caires et al., 2001). However, the most used liming material in the Brazilian agriculture presents low solubility as compared to the special liming materials for soil acidity control (Oliveira et al., 2014). The special liming materials comprised calcium and/or magnesium carbonates [CaCO3, MgCO3 and (Ca,Mg)CO3] called granulated micronized calcite or dolomite and carbonated suspension. However, there are few studies that show the capacity of providing nutrients such as Ca and Mg, and make K and P available as a result of special liming material application in soils with variable charges (such as the Typic Distrudept and Rhodic Hapludox). Also, these special liming materials can be a strategy to fast increase the soil relationship Ca/Mg, due to the present of very fine particle size (< 7.0 µm) as compared to a limestone (< 500.0 µm) (Coelho, 2004).
The objective of this study was to evaluate the efficiency of special liming materials as compared to dolomitic limestone (DL), on exchangeable Ca, Mg, and K and available P concentrations in Typic Distrudept and Rhodic Hapludox. MATERIALS AND METHODS Two soils with variable charges, Typic Distrudept and Rhodic Hapludox, were collected in the region of Paraná Campos Gerais, Brazil. Typic Distrudept had the follow attributes in the 0-20 cm layer: 4.3 of pH (CaCl2), 103.3, 11.3, 30.8, 9.3 and 2.3 mmolc dm-3 of H+Al, Al, Ca, Mg and K, respectively; and 23.4 mg dm-3 of P; 21.0 g dm-3 and 29.0% of organic carbon (OC) by Walkey-black method (Pavan et al., 1992) and soil base saturation (V), respectively; 200.0, 255.2 and 544.8 g kg-1 of clay, silt and sand, respectively; 1.2 g cm-3 and 1.5 cm3 cm-3 of bulk density (BD) and water saturation (S) (EMBRAPA, 1997), respectively. This soil was managed in no-tillage for 15 years and crops succession between black oat and soybean for the last 4 years. The other soil (without previous cropping), Rhodic Hapludox, had the follow attributes in the 0-20 cm layer: 3.8 of pH (CaCl2), 151.6, 26.0, 6.0, 7.0 and 1.5 mmolc dm-3 of H+Al, Al, Ca, Mg and K, respectively; and 1.6 mg dm-
3 of P; 33.0 g dm-3 and 8.7% of OC by Walkey-black method (Pavan et al., 1992) and V, respectively; 736.0, 174.2 and 89.8 g kg-1 of clay, silt and sand, respectively; 1.0 g cm-3 and 1.0 cm3 cm-3 of BD and S (EMBRAPA, 1997), respectively. After collection, the soil samples were dried in oven with forced air circulation at 40°C for 48 h. Thereafter, they were ground and sieved in a 2.0 mm mesh sieve. Each experimental unit consisted of 500 g of the sieved soil, weighed on a precision scale (Balmak ELP 10 and 5000.0 g of maximum and 20.0 g of minimum ± 1.0 g). Two experiments were conducted separately with Typic Distrudept and Rhodic Hapludox.
The design used in both experiments, was completely randomized in a 4x4x8 in factorial design with four replications. Four liming materials were studied: dolomitic limestone (DL – 898.7
dos Santos et al. 2745 g kg-1 of effective calcium carbonate (ECC)), granulated micronized calcite (GMC – 962.7 g kg-1 of ECC), granulated micronized dolomite (GMD – 1006.5 g kg-1 of ECC) and carbonated suspension (CS – 770.0 g kg-1 of ECC), whose physical and chemical characteristics liming materials were performed according to MAPA (2007). The specific surface area (SSA) of the liming materials determined with the method of França and Couto (2007) were 306.6; 1055.0; 1099.0 and 1559 m2 kg-1 for DL, GMC, GMD and CS, respectively. The liming materials contents in CaO and MgO, analyzed according to MAPA (2007), were respectively 265.9 and 257.6 g kg-1 for DL; 462.2 and 15.5 g kg-1 for GMC; 345.9 and 121.5 g kg-1 for GMD and 361.1 and 8.30 g kg-1 for CS.
For each liming material, three doses that are supposed to increase V to 50, 70 and 90% were studied. Also, a control treatment was included, that is, untreated check. The doses of the liming material were determined using the equation of Raij et al. (1996):
Where: LR: lime requirement (Mg ha-1) for layer 0-20 cm; CEC: cation exchange capacity (mmolc dm-3); V1: base saturation (%) obtained; and V2: targeted base saturation (%). The ECC was estimated using the equation according to Raij (1977):
Where: ECC (%): effective calcium carbonate; NP: neutralizing power, calculated with the equation [CaO (%) x 1.79 + MgO (%) x 2.48] and RE: relative efficiency of the liming.
The 100% RE was adopted for the special liming materials, due to the fact that they present very low particle size (< 7.0 µm) as compared to good quality limestone with particles size < 300.0 µm – according to the scale of MAPA (2007). The doses of each liming materials applied in each experimental unit and in each soil were calculated taking into consideration the soil volume and BD of each soil study.
The doses estimated to increase V to 50, 70 and 90% of Typic Distrudept were of 3.41, 6.65 and 9.89 Mg ha-1 for DL, respectively; 3.18, 6.21 and 9.23 Mg ha-1 for GMC, respectively; 3.05, 5.94 and 8.83 Mg ha-1 for GMD, respectively; and 3.98, 7.76 and 11.54 Mg ha-1 for CS, respectively. The doses estimated to increase V to 50, 70 and 90% of Rhodic Hapludox were of 7.63, 11.33 and 15.03 Mg ha-1 for DL, respectively; 7.13, 10.58 and 14.03 Mg ha-1 for GMC, respectively; 6.82, 10.12 and 13.42 Mg ha-1 for GMD, respectively; and 8.91, 13.22 and 17.54 Mg ha-1 for CS, respectively.
The liming materials were duly homogenized with the soil and incubated for 0, 7, 15, 30, 45, 60, 75 and 90 days. Constant temperature of 23±2°C and soil humidity of 60% soil water retention capacity, were maintained 339.0 and 224.0 mL kg-1 deionized water with an average electrical conductivity of 0.5 µS cm-1 were added to Typic Distrudept and Rhodic Hapludox, respectively.
At the end of each incubation period (0, 7, 15, 30, 45, 60, 75 and 90 days), the experimental units of both soils were removed from the incubation room and taken to the laboratory, dried in oven at 40°C with forced air circulation, ground and sieved in a 2.0 mm mesh sieve. Then, the attributes exchangeable Ca2+, Mg2+ and K+, and available P were determined with the methods suggest by Pavan et al. (1992).
The data was submitted to statistical analysis employing the computer program SAS Version 9.1.2 (SAS 2004). The program suggested transformations of exchangeable Mg and available P
CEC x (V2 – V1) LR = (10 x ECC)
(NP x RE) ECC = 100

2746 Afr. J. Agric. Res.
Table 1. Interactions significant effects (F values) (p < 0.0001) between liming materials (dolomitic limestone, granulated micronized calcite, granulated micronized dolomite and carbonated suspension) after application of 50, 70 and 90% dose to increase soil base saturation and a control treatment, for eight incubation periods (0, 7, 15, 30, 45, 60, 75 and 90 days) on exchangeable calcium (Ca), magnesium (Mg) and potassium (K), and available phosphorus (P) in two different soils (Typic Distrudept and Rhodic Hapludox).
Soils Ca Mg K P
Typic Distrudept
Liming material x Dose applied 121.73 333.69 397.95 245.45
Liming material x Incubation period 33.52 41.64 74.50 185.32
Dose applied x Incubation period 25.95 120.33 126.04 105.23
Liming material x Dose applied x Incubation period 14.75 39.89 48.63 59.03
Rhodic Hapludox
Liming material x Dose applied 551.59 809.31 4.07 17.68
Liming material x Incubation period 89.92 219.94 32.59 46.30
Dose applied x Incubation period 53.18 247.75 6.99 115.00
Liming material x Dose applied x Incubation period 42.22 142.79 10.50 49.27
concentrations of both soils into square root. Three factors were considered in the statistical model: (i) four liming materials (DL, GMC, GMD and CS), (ii) four doses (a control treatment, V to 50, 70 and 90%) and (iii) eight incubation periods (0, 7, 15, 30, 45, 60, 75 and 90 days). The effect of predictive variables (dose of liming materials) was adjusted to the response variables (soil attributes) for each incubation period, using the regression models (linear or quadratic). The profile analysis was also used to compare the effects of each dose of liming material used during the periods of incubation.
RESULTS
Typic Distrudept
This study was conducted to observe the efficiency of liming materials in the variation of exchangeable Ca, Mg and K, and available P concentrations. Significant effects (p < 0.0001) were observed in Typic Distrudept on Ca, Mg, K and P content from the interactions between the liming materials, doses applied and incubation periods (Table 1).
All liming materials increased exchangeable Ca concentration in soil (Figure 1). The DL, GMC, GMD and CS increased from 30.8 mmolc dm
-3 (soil initial condition)
to 66.5, 81.7, 71.0 and 103.0 mmolc dm-3
in the dose to increased V (DIV) to 90%, respectively. The CS in DIV to 70 and 90% resulted in higher exchangeable Ca concentration in soil than the others (liming materials and doses) at the end of 90 days incubation period (Figure 1). However, between 7 and 60 days of incubation, the CS with the DIV of 90% presented higher exchangeable Ca concentration than the other liming materials (Figure 3).
During the incubation period, the DL provided the highest exchangeable Mg concentration in all the doses
(Figure 1). Also, DL, applied with the DIV of 70 and 90%, efficiently increased Mg in DIV to 70 and 90%, more clearly at 90 days of incubation (Figure 4).
The exchangeable K concentrations after DL application were changed along the time (Figure 2). The doses of CS applied at 50 and 70% DIV resulted in higher exchangeable K concentrations in all the incubation periods (Figures 2 and 5). This increase was also observed with GMD (applied at 90% DIV). For GMC dose of 70% DIV, this special liming material increased exchangeable K concentration at the end of the incubation period of 90 days.
The available P concentrations were highly increased by special liming materials (GMC, GMD and CS) than DL (Figure 2). This increase was more evident with the application of GMC at 90% DIV, between 75 and 90 days (Figure 6). Study in Rhodic Hapludox Significant effects (p < 0.0001) were observed in Rhodic Hapludox from the interactions between the liming materials, doses applied and incubation periods (Table 1). GMC and CS were more efficient in increasing exchangeable Ca concentrations than DL and GMD. After application of GMC at 70 and 90% DIV, the exchangeable Ca concentrations increased to 66.4 and 76.0 mmolc dm
-3, respectively (Figure 7). When CS was
applied at 70 and 90% DIV, the exchangeable Ca concentrations increased to 75.5 and 85.6 mmolc dm
-3,
respectively (Figure 7). Moreover, these increases of the exchangeable Ca concentrations in CS treatment soil were more evident after 75 days of incubation (Figure 9).

dos Santos et al. 2747
Figure 1. Liming materials effects on exchangeable calcium (Ca2+) and magnesium (Mg2+) concentrations in Typic Distrudept (n = 4 ± standard deviation) at different periods of incubation (90 days) for the control treatment and after application of 50, 70 and 90% dose to increase soil base saturation (DIV). (♦) Dolomitic limestone. (■) Granu lated micronized calcite. (▲) Granulated micronized dolomite. (●) Carbonated suspension. Coefficient of variation: 5.2 and 4.5% to Ca and Mg, respectively.
All liming materials (DL, CMG, DMG and SC) increased the exchangeable Mg concentration in soil (Figure 7). However, DL doses of 70 and 90% DIV were more efficient than others in increasing and maintaining
exchangeable Mg concentrations all the time (Figure 10). All liming materials and doses application, generally,
resulted in slight increase of exchangeable K and their concentrations were maintained in all the times (Figures
Control 50% DIV
70% DIV 90% DIV
Control 50% DIV
70% DIV 90% DIV
0
38
75
113
150
0 15 30 45 60 75 90
0
38
75
113
150
0 15 30 45 60 75 90
0
38
75
113
150
0 15 30 45 60 75 90
0
38
75
113
150
0 15 30 45 60 75 90
0
15
30
45
60
0 15 30 45 60 75 90
0
15
30
45
60
0 15 30 45 60 75 90
0
15
30
45
60
0 15 30 45 60 75 90
0
15
30
45
60
0 15 30 45 60 75 90
Exch
an
gea
ble
cal
ciu
m (
Ca
2+)
(mm
ol c
dm
-3)
Exch
an
gea
ble
magnesi
um
(M
g2+)
(mm
ol c
dm
-3)
Incubation periods (days)

2748 Afr. J. Agric. Res.
Figure 3. Response of Typic Distrudept (n = 4) to different doses of liming materials (control treatment and after application of 50, 70 and 90% dose to increase soil base saturation (DIV)) through exchangeable calcium (Ca2+) concentrations at different periods of incubation (days). (♦) Dolomitic limestone. (■) Granulated micronized calcite. (▲) Granulated micronized dolomite. (●) Carbonated suspension. Vertical bars indicate the least significant difference (LSD). *: P < 0.05. **: P < 0.01.
0
38
75
113
150
0 4 8 12
0 day
0
38
75
113
150
0 4 8 12
7 days
0
38
75
113
150
0 4 8 12
15 days
0
38
75
113
150
0 4 8 12
30 days
0
38
75
113
150
0 4 8 12
45 days
0
38
75
113
150
0 4 8 12
60 days
0
38
75
113
150
0 4 8 12
75 days
0
38
75
113
150
0 4 8 12
90 days
Exch
an
gea
ble
cal
ciu
m (
Ca
2+)
(mm
ol c
dm
-3)
Dose of liming materials (Mg ha-1
)
♦ ŷ = 54.60 + 6.32x - 0.54x2 R² = 0.54**
■ ŷ = 53.61 + 4.82x - 0.06x2 R² = 0.93**
▲ ŷ = 50.57 + 3.21x + 0.17x2 R² = 0.96**
● ŷ = 52.99 + 7.58x - 0.32x2 R² = 0.98**
♦ ŷ = 56.86 + 2.11x R² = 0.64**
■ ŷ = ȳ = 82.92
▲ ŷ = ȳ = 61.55
● ŷ = 53.40 + 6.86x - 0.18x2 R² = 0.96**
♦ ŷ = 49.76 - 6.13x + 0.82x2 R² = 0.48**
■ ŷ = 53.17 + 4.22x + 0.06x2 R² = 0.95**
▲ ŷ = 56.40 + 4.63x - 0.37x2 R² = 0.65*
● ŷ = 53.77 + 5.31x - 0.07x2 R² = 0.99**
♦ ŷ = ȳ = 62.41
■ ŷ = ȳ = 68.39
▲ ŷ = 61.78 + 3.89x -0.47x2 R² = 0.59**
● ŷ = 62.48 + 2.54x + 0.07x2 R² = 0.98*
♦ ŷ = 56.47 - 0.56x + 0.10x2 R² = 0.20**
■ ŷ = ȳ = 57.44
▲ ŷ = 55.96 + 4.52x - 0.47x2 R² = 0.75**
● ŷ = 4.09x + 55.5 R² = 0.99**
♦ ŷ = ȳ = 61.24
■ ŷ = + 55.71 - 0.36x + 0.16x2 R² = 0.89*
▲ ŷ = ȳ = 66.96
● ŷ = 57.34 + 3.70x R² = 0.99**
♦ ŷ = ȳ = 62.51
■ ŷ = ȳ = 65.54
▲ ŷ = 53.24 + 7.75x - 0.59x2 R² = 0.73**
● ŷ = ȳ = 81.11
♦ ŷ = 61.61 + 4.55x - 0.37x2 R² = 0.59**
■ ŷ= 58.83 - 1.71x + 0.39x2 R² = 0.92**
▲ ŷ = ȳ = 66.45
● ŷ= 58.37 + 5.31x - 0.09x2 R² = 0.97*
LSD LSD
LSD LSD
LSD LSD
LSD LSD

dos Santos et al. 2749
Figure 4. Response of Typic Distrudept (n = 4) to different doses of liming materials (control treatment and after application of 50, 70 and 90 % dose to increase soil base saturation (DIV)) through exchangeable magnesium (Mg2+) concentrations at different periods of incubation (days). (♦) Dolomitic limestone. (■) Granulated micronized calcite. (▲) Granulated micronized dolomite. (●) Carbonated suspension. Vertical bars indicate the least significant difference (LSD). *: P < 0.05. **: P < 0.01.
8 and 11). However, CS at 90% DIV led to little increase of exchangeable K concentrations until 45 days of incubation (Figure 11). Available P concentrations were increased highly by GMC, GMD and CS (in all doses) than DL (Figure 8), mainly after 15 days (Figure 12).
DISCUSSION Liming in Typic Distrudept All liming materials increased exchangeable Ca
0
15
30
45
60
0 4 8 12
0 day
0
15
30
45
60
0 4 8 12
7 days
0
15
30
45
60
0 4 8 12
15 days
0
15
30
45
60
0 4 8 12
30 days
0
15
30
45
60
0 4 8 12
45 days
0
15
30
45
60
0 4 8 12
60 days
0
15
30
45
60
0 4 8 12
75 days
0
15
30
45
60
0 4 8 12
90 days
Exch
an
gea
ble
magnesi
um
(M
g2
+)
(mm
ol c
dm
-3)
Dose of liming materials (Mg ha-1
)
♦ ŷ = 6.26 + 4.90x - 0.32x2 R² = 0.94**
■ ŷ = 7.78 + 5.71x - 0.39x2 R² = 0.95**
▲ ŷ = 8.28 + 6.63x - 0.73x2 R² = 0.82**
● ŷ = 6.26 + 4.20x - 0.24x2 R² = 0.94**
♦ ŷ = ȳ = 25.36
■ ŷ = 12.13 + 3.60x - 0.31x2 R² = 0.47**
▲ ŷ = ȳ = 18.67
● ŷ = 10.73 + 1.67x - 0.19x2 R² = 0.95**
♦ ŷ = 16.04 + 1.93x R² = 0.93**
■ ŷ = 13.38 + 1.05x - 0.04x2 R² = 0.74**
▲ ŷ = 15.40 + 3.94x - 0.48x2 R² = 0.61**
● ŷ = ȳ = 10.04
♦ ŷ = ȳ = 30.66
■ ŷ = ȳ = 21.04
▲ ŷ = 26.19 - 1.98x + 0.05x2 R² = 0.62**
● ŷ = 23.39 - 3.59x + 0.20x2 R² = 0.84**
♦ ŷ = ȳ = 26.18
■ ŷ = 12.47 + 0.90x + 0.05x2 R² = 0.67**
▲ ŷ = 15.11 - 1.06x + 0.19x2 R² = 0.43**
● ŷ = 12.81 - 1.29x + 0.12x2 R² = 0.36**
♦ ŷ = 16.28 + 2.44x - 0.13x2 R² = 0.88**
■ ŷ = 16.20 + 0.14x + 0.07x2 R² = 0.68**
▲ ŷ = 17.79 + 0.95x - 0.19x2 R² = 0.72*
● ŷ = 16.26 - 1.45x + 0.05x2 R² = 0.82**
♦ ŷ = 24.51 + 1.73x + 0.13x2 R² = 0.77**
■ ŷ = ȳ = 27.81
▲ ŷ = 26.09 - 4.65x + 0.53x2 R² = 0.79**
● ŷ = 25.84 - 4.98x + 0.44x2 R² = 0.83**
♦ ŷ = 13.70 + 6.85x - 0.26x2 R² = 0.85**
■ ŷ = 16.84 + 2.67x - 0.20x2 R² = 0.93**
▲ ŷ = ȳ = 15.96
● ŷ = ȳ = 15.15
LSD
LSD
LSD LSD
LSD LSD
LSD LSD

2750 Afr. J. Agric. Res.
Figure 2. Liming materials effects on exchangeable potassium (K+) and available phosphorus (P) concentrations on a Typic Distrudept (n = 4 ± standard deviation) at different periods of incubation (90 days) for the control treatment and after application of 50, 70 and 90% dose to increase soil base saturation (DIV). (♦) Dolomitic limestone. (■) Granulated micronized calcite. (▲) Granulated micronized dolomite. (●) Carbonated suspension. Coefficient of variation: 4.5 and 5.2% to K and P, respectively.
concentration in soil. Oleynik et al. (1998) considered concentrations of Ca above 40.0 mmolc dm
-3 as high
level. At the end of 90 days incubation, CS applied at 70
and 90% DIV resulted in higher exchangeable Ca concentration in soil than the others (liming materials and doses). Then, the CS efficiency regarding fast and major
Control 50% DIV
70% DIV 90% DIV
Control 50% DIV
70% DIV 90% DIV
0
2
3
5
6
0 15 30 45 60 75 90
0
2
3
5
6
0 15 30 45 60 75 90
0
2
3
5
6
0 15 30 45 60 75 90
0
2
3
5
6
0 15 30 45 60 75 90
0
18
35
53
70
0 15 30 45 60 75 90
0
18
35
53
70
0 15 30 45 60 75 90
0
18
35
53
70
0 15 30 45 60 75 90
0
18
35
53
70
0 15 30 45 60 75 90
Exch
an
gea
ble
po
tass
ium
(K
+)
(mm
ol c
dm
-3)
Avai
lab
le p
ho
spho
rus
(P)
(mg
dm
-3)
Incubation periods (days)
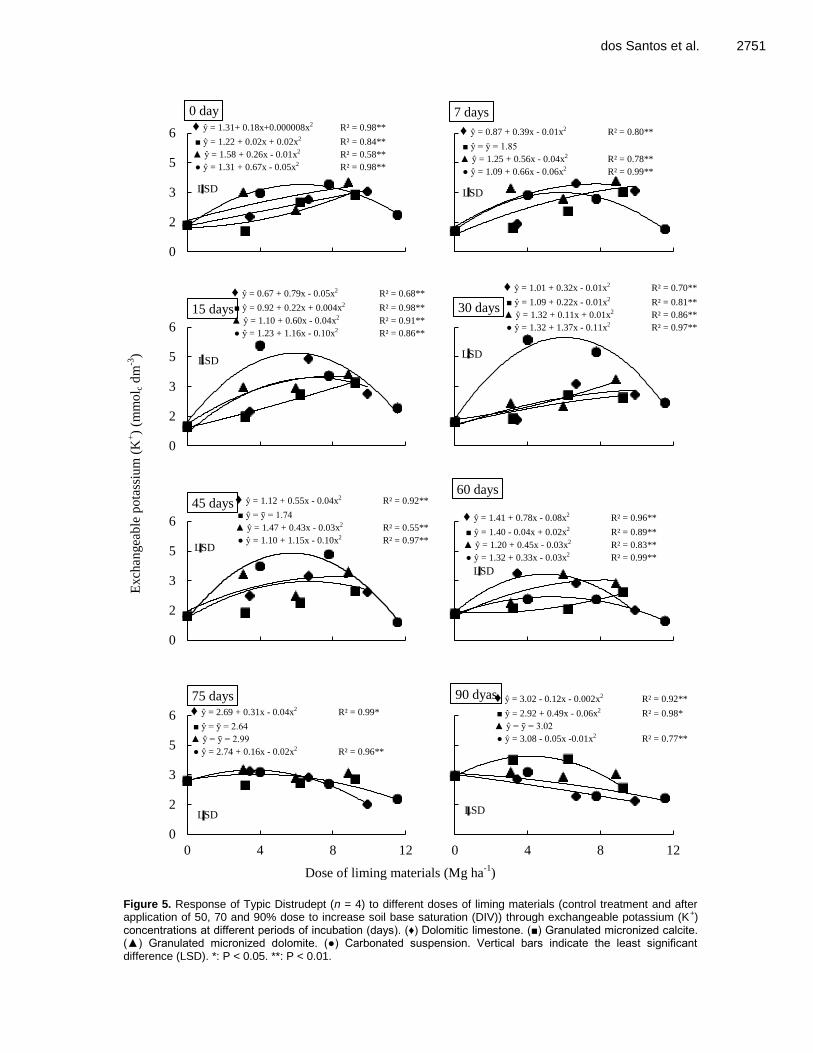
dos Santos et al. 2751
Figure 5. Response of Typic Distrudept (n = 4) to different doses of liming materials (control treatment and after application of 50, 70 and 90% dose to increase soil base saturation (DIV)) through exchangeable potassium (K+) concentrations at different periods of incubation (days). (♦) Dolomitic limestone. (■) Granulated micronized calcite. (▲) Granulated micronized dolomite. (●) Carbonated suspension. Vertical bars indicate the least significant difference (LSD). *: P < 0.05. **: P < 0.01.
0
2
3
5
6
0 4 8 12
0 day
0
2
3
5
6
0 4 8 12
7 days
0
2
3
5
6
0 4 8 12
15 days
0
2
3
5
6
0 4 8 12
30 days
0
2
3
5
6
0 4 8 12
45 days
0
2
3
5
6
0 4 8 12
60 days
0
2
3
5
6
0 4 8 12
75 days
0
2
3
5
6
0 4 8 12
90 dyas
Exch
an
gea
ble
po
tass
ium
(K
+)
(mm
ol c
dm
-3)
Dose of liming materials (Mg ha-1
)
♦ ŷ = 1.31+ 0.18x+0.000008x2 R² = 0.98**
■ ŷ = 1.22 + 0.02x + 0.02x2 R² = 0.84**
▲ ŷ = 1.58 + 0.26x - 0.01x2 R² = 0.58**
● ŷ = 1.31 + 0.67x - 0.05x2 R² = 0.98**
♦ ŷ = 0.87 + 0.39x - 0.01x2 R² = 0.80**
■ ŷ = ȳ = 1.85
▲ ŷ = 1.25 + 0.56x - 0.04x2 R² = 0.78**
● ŷ = 1.09 + 0.66x - 0.06x2 R² = 0.99**
♦ ŷ = 0.67 + 0.79x - 0.05x2 R² = 0.68**
■ ŷ = 0.92 + 0.22x + 0.004x2 R² = 0.98**
▲ ŷ = 1.10 + 0.60x - 0.04x2 R² = 0.91**
● ŷ = 1.23 + 1.16x - 0.10x2 R² = 0.86**
♦ ŷ = 1.01 + 0.32x - 0.01x2 R² = 0.70**
■ ŷ = 1.09 + 0.22x - 0.01x2 R² = 0.81**
▲ ŷ = 1.32 + 0.11x + 0.01x2 R² = 0.86**
● ŷ = 1.32 + 1.37x - 0.11x2 R² = 0.97**
♦ ŷ = 1.12 + 0.55x - 0.04x2 R² = 0.92**
■ ŷ = ȳ = 1.74
▲ ŷ = 1.47 + 0.43x - 0.03x2 R² = 0.55**
● ŷ = 1.10 + 1.15x - 0.10x2 R² = 0.97**
♦ ŷ = 1.41 + 0.78x - 0.08x2 R² = 0.96**
■ ŷ = 1.40 - 0.04x + 0.02x2 R² = 0.89**
▲ ŷ = 1.20 + 0.45x - 0.03x2 R² = 0.83**
● ŷ = 1.32 + 0.33x - 0.03x2 R² = 0.99**
♦ ŷ = 2.69 + 0.31x - 0.04x2 R² = 0.99*
■ ŷ = ȳ = 2.64
▲ ŷ = ȳ = 2.99
● ŷ = 2.74 + 0.16x - 0.02x2 R² = 0.96**
♦ ŷ = 3.02 - 0.12x - 0.002x2 R² = 0.92**
■ ŷ = 2.92 + 0.49x - 0.06x2 R² = 0.98*
▲ ŷ = ȳ = 3.02
● ŷ = 3.08 - 0.05x -0.01x2 R² = 0.77**
LSD LSD
LSD LSD
LSD
LSD
LSD LSD

2752 Afr. J. Agric. Res.
Figure 6. Response of Typic Distrudept (n = 4) to different doses of liming materials (control treatment and after application of 50, 70 and 90% dose to increase soil base saturation (DIV)) through available phosphorus (P) concentrations at different periods of incubation (days). (♦) Dolomitic limestone. (■) Granulated micronized calcite. (▲) Granulated micronized dolomite. (●) Carbonated suspension. Vertical bars indicate the least significant difference (LSD). *: P < 0.05. **: P < 0.01.
0
18
35
53
70
0 4 8 12
0 day
0
18
35
53
70
0 4 8 12
7 days
0
18
35
53
70
0 4 8 12
15 days
0
18
35
53
70
0 4 8 12
30 days
0
18
35
53
70
0 4 8 12
45 days
0
18
35
53
70
0 4 8 12
60 days
0
18
35
53
70
0 4 8 12
75 days
0
18
35
53
70
0 4 8 12
90 days
Avai
lab
le p
ho
spho
rus
(P)
(mg
dm
-3)
Dose of liming materials (Mg ha-1
)
♦ ŷ = ȳ = 22.30
■ ŷ = 19.55 + 2.62x - 0.41x2 R² = 0.73**
▲ ŷ = 17.46 - 3.26x + 0.58x2 R² = 0.47**
● ŷ = 21.98 + 3.16x - 0.26x2 R² = 0.74**
♦ ŷ = ȳ = 22.65
■ ŷ = ȳ = 15.44
▲ ŷ = 18.68 - 2.94x + 0.53x2 R² = 0.40**
● ŷ = 23.06 + 2.99x - 0.25x2 R² = 0.89**
♦ ŷ = 19.26 + 1.90x - 0.14x2 R² = 0.83*
■ ŷ = 17.38 + 0.35x - 0.19x2 R² = 0.70**
▲ ŷ = 15.69 - 3.24x + 0.67x2 R² = 0.67**
● ŷ = 18.70 + 3.51x - 0.24x2 R² = 0.99*
♦ ŷ = ȳ = 21.27
■ ŷ = ȳ = 9.76
▲ ŷ = 15.55 - 2.57x + 0.58x2 R² = 0.57**
● ŷ = ȳ = 25.90
♦ ŷ = ȳ = 23.03
■ ŷ = 18.69 - 3.24x + 0.17x2 R² = 0.98**
▲ ŷ = 16.82 - 0.13x + 0.26x2 R² = 0.67**
● ŷ = 20.11 + 1.82x - 0.13x2 R² = 0.46**
♦ ŷ = ȳ = 20.72
■ ŷ = 21.54 - 2.14x + 0.003x2 R² = 0.97*
▲ ŷ = 17.64 - 3.23x + 0.59x2 R² = 0.53**
● ŷ = 21.88 + 1.79x - 0.14x2 R² = 0.53**
♦ ŷ = ȳ = 6.68
■ ŷ = 6.45 - 1.73x + 0.85x2 R² = 0.97**
▲ ŷ = 9.03 + 9.66x - 0.83x2 R² = 0.96**
● ŷ = 9.25 + 4.44x - 0.24x2 R² = 0.91**
♦ ŷ = ȳ = 6.07
■ ŷ = 9.12 + 11.06x - 0.67x2 R² = 0.71**
▲ ŷ = 5.19 + 10.08x - 0.73x2 R² = 0.97**
● ŷ = 5.16 + 6.68x - 0.46x2 R² = 0.94*
LSD LSD
LSD LSD
LSD LSD
LSD
LSD

dos Santos et al. 2753
Figure 7. Liming materials effects on exchangeable calcium (Ca2+) and magnesium (Mg2+) concentrations in Rhodic Hapludox (n = 4 ± standard deviation) ) at different periods of incubation (90 days) for the control treatment and after application of 50, 70 and 90 % dose to increase soil base saturation (DIV). (♦) Dolomitic limestone. (■) Granulated micronized calcite. (▲) Granulated micronized dolomite. (●) Carbonated suspension. Coefficient of variation: 6.0 and 2.9% to Ca and Mg, respectively.
soil Ca availability can be due to the following factors: finer particle size (in order < 7.0 µm), higher SSA (1559.0 m
2 kg
-1) and higher CaO content (361.1 g kg
-1 of CaO).
DL applied at 90% DIV increased the exchangeable Mg concentration from 9.3 (soil initial condition) to 36.7 mmolc dm
-3 (at the end of the experimental period of 90
days). The high efficiency of DL in MgO concentration increase could be due to its higher content of MgO (257.6 g kg
-1) than other liming materials. In fact, Mg could have
been released from DL during the incubation period (Alcarde, 2005). However, these increases had few practical implications because exchangeable Mg
Control 50% DIV
70% DIV 90% DIV
Control 50% DIV
70% DIV 90% DIV
0
38
75
113
150
0 15 30 45 60 75 90
0
38
75
113
150
0 15 30 45 60 75 90
0
38
75
113
150
0 15 30 45 60 75 90
0
38
75
113
150
0 15 30 45 60 75 90
0
15
30
45
60
0 15 30 45 60 75 90
0
15
30
45
60
0 15 30 45 60 75 90
0
15
30
45
60
0 15 30 45 60 75 90
0
15
30
45
60
0 15 30 45 60 75 90
Exch
an
gea
ble
cal
ciu
m (
Ca
2+)
(mm
ol c
dm
-3)
Exch
an
gea
ble
magnesi
um
(M
g2+)
(mm
ol c
dm
-3)
Incubation periods (days)

2754 Afr. J. Agric. Res.
Figure 9. Response of Rhodic Hapludox (n = 4) to different doses of liming materials (control treatment and after application of 50, 70 and 90% dose to increase soil base saturation (DIV)) through exchangeable calcium (Ca2+) concentrations at different periods of incubation (days). (♦) Dolomitic limestone. (■) Granulated micronized calcite. (▲) Granulated micronized dolomite. (●) Carbonated suspension. Vertical bars indicate the least significant difference (LSD). *: P < 0.05. **: P < 0.01.
concentrations higher than 8.0 mmolc dm
-3 has been
considered to be sufficiently high level (Oleynik et al.,
1998).
The exchangeable K concentrations after liming
0
38
75
113
150
0 7 13 20
0 day
0
38
75
113
150
0 7 13 20
7 days
0
38
75
113
150
0 7 13 20
15 days
0
38
75
113
150
0 7 13 20
30 days
0
38
75
113
150
0 7 13 20
45 days
0
38
75
113
150
0 7 13 20
60 days
0
38
75
113
150
0 7 13 20
75 days
0
38
75
113
150
0 7 13 20
90 days
Exch
an
gea
ble
cal
ciu
m (
Ca
2+)
(mm
ol c
dm
-3)
Dose of limimg materials (Mg ha-1
)
♦ ŷ = 7.36 + 3.11x - 0.05x2 R² = 0.97**
■ ŷ = 12.95 + 5.24x R² = 0.94**
▲ ŷ = 7.58 + 2.82x - 0.01x2 R² = 0.99**
● ŷ = 8.73 + 6.54x - 0.08x2 R² = 0.98**
♦ ŷ = 8.77 + 2.77x - 0.07x2 R² = 0.98**
■ ŷ = 5.86 + 11.15x - 0.33x2 R² = 0.86**
▲ ŷ = 9.30 + 4.09x - 0.13x2 R² = 0.89**
● ŷ = 6.67 + 6.14x - 0.07x2 R² = 0.91**
♦ ŷ = 13.95 + 1.41x R² = 0.99**
■ ŷ = 13.16 + 7.17x - 0.18x2 R² = 0.99**
▲ ŷ = 12.95 + 3.27x - 0.12x2 R² = 0.87**
● ŷ = 13.14 + 2.59x + 0.08x2 R² = 0.99**
♦ ŷ = 8.26 + 3.17x - 0.12x2 R² = 0.99*
■ ŷ = 2.55 + 5.90x R² = 0.95**
▲ ŷ = 8.90 + 3.42x R² = 0.99**
● ŷ = 11.01 + 4.60x R² = 0.99**
♦ ŷ = 8.23 + 4.52x - 0.20x2 R² = 0.94**
■ ŷ = 6.92 + 10.08x - 0.52x2 R² = 0.95**
▲ ŷ = 7.43 + 2.74x + 0.0009x2 R² = 0.98**
● ŷ = 7.28 + 4.05x - 0.004x2 R² = 0.99**
♦ ŷ = 9.92 + 1.39x R² = 0.94*
■ ŷ = 6.15 + 4.73x R² = 0.98*
▲ ŷ = 8.70 + 4.97x - 0.19x2 R² = 0.99*
● ŷ = 8.84 + 5.72x -0.11x2 R² = 0.99**
♦ ŷ = 14.22 + 4.44x - 0.20x2 R² = 0.99**
■ ŷ = 14.90 - 0.39x + 0.34x2 R² = 0.96**
▲ ŷ = 14.55 + 4.60x - 0.12x2 R² = 0.96**
● ŷ = 13.09 + 4.59x - 0.02x2 R² = 0.97**
♦ ŷ = 20.95 + 3.37x R² = 0.83**
■ ŷ= 15.57 + 8.72x - 0.36x2 R² = 0.93**
▲ ŷ = ȳ = 14.56
● ŷ = 13.61 + 9.64x - 0.29x2 R² = 0.98**
LSD LSD
LSD LSD
LSD LSD
LSD LSD

dos Santos et al. 2755
Figure 101. Response of Rhodic Hapludox (n = 4) to different doses of liming materials (control treatment and after application of 50, 70 and 90% dose to increase soil base saturation (DIV)) through exchangeable magnesium (Mg2+) concentrations at different periods of incubation (days). (♦) Dolomitic limestone. (■) Granulated micronized calcite. (▲) Granulated micronized dolomite. (●) Carbonated suspension. Vertical bars indicate the least significant difference (LSD). *: P < 0.05. **: P < 0.01.
material application had few changes together with time. These changes in exchangeable K concentrations can be
ascribed to soil pH increase (Malavolta, 2006). Besides, the high Ca and Mg concentrations in soil can increase
0
15
30
45
60
0 7 13 20
0 day
0
15
30
45
60
0 7 13 20
7 days
0
15
30
45
60
0 7 13 20
15 days
0
15
30
45
60
0 7 13 20
30 days
0
15
30
45
60
0 7 13 20
45 days
0
15
30
45
60
0 7 13 20
60 days
0
15
30
45
60
0 7 13 20
75 days
0
15
30
45
60
0 7 13 20
90 days
Exch
an
gea
ble
magnesi
um
(M
g2+)
(mm
ol c
dm
-3)
Dose of liming materials (Mg ha-1
)
♦ ŷ = 11.65 + 3.76x - 0.12x2 R² = 0.56**
■ ŷ = 14.04 - 0.28x - 0.02x2 R² = 0.52**
▲ ŷ = ȳ = 19.53
● ŷ = 15.05 + 2.85x - 0.20x2 R² = 0.45** ♦ ŷ = 14.08 + 1.12x - 0.02x2 R² = 0.88**
■ ŷ = 14.67 - 1.16x + 0.05x2 R² = 0.72**
▲ ŷ = 14.25+ 0.51x - 0.02x2 R² = 0.71*
● ŷ = 13.52 - 0.29x R² = 0.76**
♦ ŷ = 14.85 + 0.38x + 0.02x2 R² = 0.94**
■ ŷ = 14.95 - 1.05x+ 0.02x2 R² = 0.86**
▲ ŷ = ȳ = 14.47
● ŷ = 14.30 + 2.31x - 0.14x2 R² = 0.85**
♦ ŷ = 12.17+2.30x - 0.04x2 R² = 0.93**
■ ŷ = ȳ = 10.93
▲ ŷ = ȳ = 11.72
● ŷ = 11.97 - 0.69x + 0.02x2 R² = 0.76**
♦ ŷ = 9.10 + 0.98x + 0.0004x2 R² = 0.56**
■ ŷ = 10.26 - 0.89x + 0.08x2 R² = 0.63**
▲ ŷ = 9.85 - 0.24x - 0.02x2 R² = 0.92**
● ŷ = ȳ = 12.03
♦ ŷ = 7.04 + 0.50x + 0.03x2 R² = 0.78**
■ ŷ = ȳ = 7.10
▲ ŷ = 6.25 + 1.09x - 0.01x2 R² = 0.89**
● ŷ = 6.65 + 0.12x + 0.007x2 R² = 0.89**
♦ ŷ = 8.79+ 2.22x - 0.07x2 R² = 0.78**
■ ŷ = 9.06+ 2.07x - 0.15x2 R² = 0.70**
▲ ŷ = 9.60+ 2.80x - 0.21x2 R² = 0.96**
● ŷ = 9.70+ 0.62x - 0.03x2 R² = 0.48**
♦ ŷ = 24.24 - 2.04x + 0.15x2 R² = 0.74**
■ ŷ = 24.43 - 4.29x + 0.22x2 R² = 0.97**
▲ ŷ = 24.01 - 1.62x + 0.03x2 R² = 0.72**
● ŷ= 24.24 + 0.07x - 0.05x2 R² = 0.84**
LSD
LSD
LSD
LSD
LSD LSD
LSD LSD

2756 Afr. J. Agric. Res.
Figure 11. Response of Rhodic Hapludox (n = 4) to different doses of liming materials (control treatment and after application of 50, 70 and 90 % dose to increase soil base saturation (DIV)) through exchangeable potassium (K+) concentrations at different periods of incubation (days). (♦) Dolomitic limestone. (■) Granulated micronized calcite. (▲) Granulated micronized dolomite. (●) Carbonated suspension. Vertical bars indicate the least significant difference (LSD). *: P < 0.05. **: P < 0.01.
desorption and availability of soil K (Havlin et al., 2014). However, these exchangeable K concentrations normally
0
2
3
5
6
0 7 13 20
0 day
0
2
3
5
6
0 7 13 20
7 days
0
2
3
5
6
0 7 13 20
15 days
0
2
3
5
6
0 7 13 20
30 days
0
2
3
5
6
0 7 13 20
45 days
0
2
3
5
6
0 7 13 20
60 days
0
2
3
5
6
0 7 13 20
75 days
0
2
3
5
6
0 7 13 20
90 days
Exch
an
gea
ble
po
tass
ium
(K
+)
(mm
ol c
dm
-3)
Dose of liming materials (Mg ha-1
)
♦ ŷ = ȳ = 1.77
■ ŷ = 1.79 + 0.02x - 0.002x2 R² = 0.53**
▲ ŷ = 1.79 - 0.05x + 0.004x2 R² = 0.57**
● ŷ = ȳ = 1.79
♦ ŷ = 1.83 - 0.01x - 0.0004x2 R² = 0.70*
■ ŷ = 1.86 + 0.02x - 0.004x2 R² = 0.67**
▲ ŷ = ȳ = 1.62
● ŷ = ȳ = 1.66
♦ ŷ = 2.21- 0.06x R² = 0.76**
■ ŷ = ȳ = 1.91
▲ ŷ = 2.38 + 0.32x - 0.01x2 R² = 0.98**
● ŷ = ȳ = 2.40
♦ ŷ = ȳ = 1.47
■ ŷ = ȳ = 1.53
▲ ŷ = ȳ = 1.57
● ŷ = ȳ = 1.58
♦ ŷ = ȳ = 1.67
■ ŷ = 1.61 - 0.09x+ 0.01x2 R² = 0.67**
▲ ŷ = 1.62 - 0.02x + 0.001x2 R² = 0.43**
● ŷ = ȳ = 1.64
♦ ŷ = ȳ = 1.88
■ ŷ = ȳ = 1.62
▲ ŷ = ȳ = 1.54
● ŷ = 1.61 - 0.09x + 0.01x2 R² = 0.67**
♦ ŷ = ȳ = 1.63
■ ŷ = ȳ = 1.61
▲ ŷ = ȳ = 1.54
● ŷ = 1.61 - 0.09x + 0.01x2 R² = 0.67**
♦ ŷ = ȳ = 1.92
■ ŷ = 2.06 + 0.03x - 0.004x2 R² = 0.50**
▲ ŷ = ȳ = 1.91
● ŷ = 2.05- 0.004x - 0.0012x2 R² = 0.83*
LSD LSD
LSD
LSD
LSD LSD
LSD
LSD
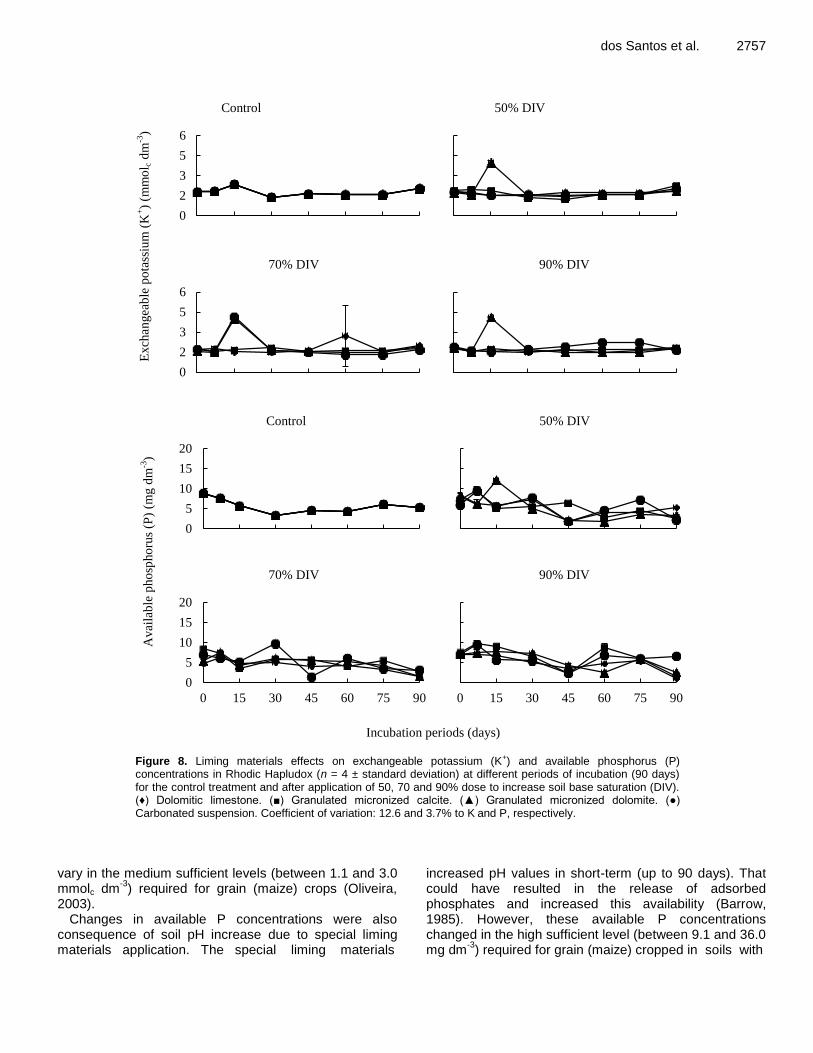
dos Santos et al. 2757
Figure 8. Liming materials effects on exchangeable potassium (K+) and available phosphorus (P) concentrations in Rhodic Hapludox (n = 4 ± standard deviation) at different periods of incubation (90 days) for the control treatment and after application of 50, 70 and 90% dose to increase soil base saturation (DIV). (♦) Dolomitic limestone. (■) Granulated micronized calcite. (▲) Granulated micronized dolomite. (●) Carbonated suspension. Coefficient of variation: 12.6 and 3.7% to K and P, respectively.
vary in the medium sufficient levels (between 1.1 and 3.0 mmolc dm
-3) required for grain (maize) crops (Oliveira,
2003). Changes in available P concentrations were also
consequence of soil pH increase due to special liming materials application. The special liming materials
increased pH values in short-term (up to 90 days). That could have resulted in the release of adsorbed phosphates and increased this availability (Barrow, 1985). However, these available P concentrations changed in the high sufficient level (between 9.1 and 36.0 mg dm
-3) required for grain (maize) cropped in soils with
Control 50% DIV
70% DIV 90% DIV
Control 50% DIV
70% DIV 90% DIV
0
2
3
5
6
0 15 30 45 60 75 90
0
2
3
5
6
0 15 30 45 60 75 90
0
2
3
5
6
0 15 30 45 60 75 90
0
2
3
5
6
0 15 30 45 60 75 90
0
5
10
15
20
0 15 30 45 60 75 90
0
5
10
15
20
0 15 30 45 60 75 90
0
5
10
15
20
0 15 30 45 60 75 90
0
5
10
15
20
0 15 30 45 60 75 90
Exch
an
gea
ble
po
tass
ium
(K
+)
(mm
ol c
dm
-3)
Avai
lab
le p
ho
spho
rus
(P)
(mg
dm
-3)
Incubation periods (days)
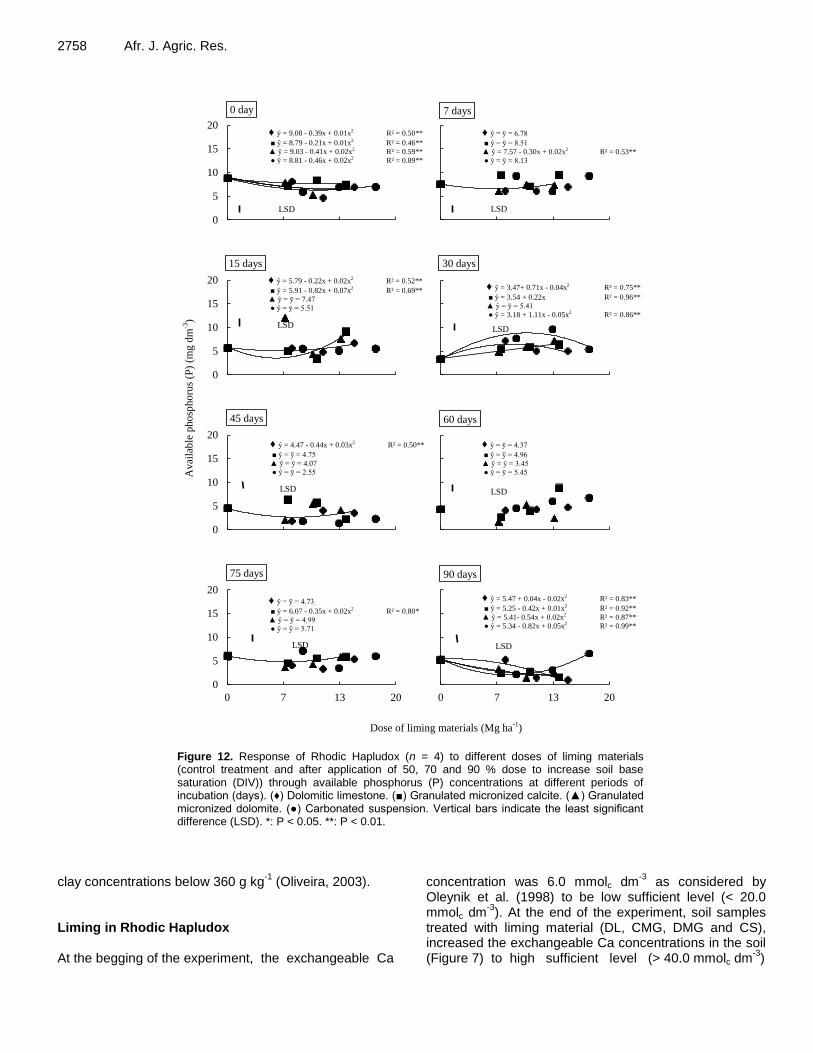
2758 Afr. J. Agric. Res.
Figure 12. Response of Rhodic Hapludox (n = 4) to different doses of liming materials (control treatment and after application of 50, 70 and 90 % dose to increase soil base saturation (DIV)) through available phosphorus (P) concentrations at different periods of incubation (days). (♦) Dolomitic limestone. (■) Granulated micronized calcite. (▲) Granulated micronized dolomite. (●) Carbonated suspension. Vertical bars indicate the least significant difference (LSD). *: P < 0.05. **: P < 0.01.
clay concentrations below 360 g kg
-1 (Oliveira, 2003).
Liming in Rhodic Hapludox At the begging of the experiment, the exchangeable Ca
concentration was 6.0 mmolc dm-3
as considered by Oleynik et al. (1998) to be low sufficient level (< 20.0 mmolc dm
-3). At the end of the experiment, soil samples
treated with liming material (DL, CMG, DMG and CS), increased the exchangeable Ca concentrations in the soil (Figure 7) to high sufficient level (> 40.0 mmolc dm
-3)
0
5
10
15
20
0 7 13 20
0 day
0
5
10
15
20
0 7 13 20
7 days
0
5
10
15
20
0 7 13 20
15 days
0
5
10
15
20
0 7 13 20
30 days
0
5
10
15
20
0 7 13 20
45 days
0
5
10
15
20
0 7 13 20
60 days
0
5
10
15
20
0 7 13 20
75 days
0
5
10
15
20
0 7 13 20
90 days
Avai
lab
le p
ho
spho
rus
(P)
(mg
dm
-3)
Dose of liming materials (Mg ha-1
)
♦ ŷ = 9.08 - 0.39x + 0.01x2 R² = 0.50**
■ ŷ = 8.79 - 0.21x + 0.01x2 R² = 0.46**
▲ ŷ = 9.03 - 0.41x + 0.02x2 R² = 0.59**
● ŷ = 8.81 - 0.46x + 0.02x2 R² = 0.89**
♦ ŷ = ȳ = 6.78
■ ŷ = ȳ = 8.51
▲ ŷ = 7.57 - 0.30x + 0.02x2 R² = 0.53**
● ŷ = ȳ = 8.13
♦ ŷ = 5.79 - 0.22x + 0.02x2 R² = 0.52**
■ ŷ = 5.91 - 0.82x + 0.07x2 R² = 0.69**
▲ ŷ = ȳ = 7.47
● ŷ = ȳ = 5.51
♦ ŷ = 3.47+ 0.71x - 0.04x2 R² = 0.75**
■ ŷ = 3.54 + 0.22x R² = 0.96**
▲ ŷ = ȳ = 5.41
● ŷ = 3.18 + 1.11x - 0.05x2 R² = 0.86**
♦ ŷ = 4.47 - 0.44x + 0.03x2 R² = 0.50**
■ ŷ = ȳ = 4.75
▲ ŷ = ȳ = 4.07
● ŷ = ȳ = 2.55
♦ ŷ = ȳ = 4.37
■ ŷ = ȳ = 4.96
▲ ŷ = ȳ = 3.45
● ŷ = ȳ = 5.45
♦ ŷ = ȳ = 4.73
■ ŷ = 6.07 - 0.35x + 0.02x2 R² = 0.80*
▲ ŷ = ȳ = 4.99
● ŷ = ȳ = 5.71
♦ ŷ = 5.47 + 0.04x - 0.02x2 R² = 0.83**
■ ŷ = 5.25 - 0.42x + 0.01x2 R² = 0.92**
▲ ŷ = 5.41- 0.54x + 0.02x2 R² = 0.87**
● ŷ = 5.34 - 0.82x + 0.05x2 R² = 0.99**
LSD LSD
LSD LSD
LSD LSD
LSD LSD

(Oleynik et al., 1998) varying from 24.03 to 109.00 mmolc dm
-3. However, the CS can be an important source of Ca
for production systems and makes them similar (Fraser and Scott, 2011; Oliveira et al., 2014) or superior (as observed in this study) to commercial limestone used for liming purposes.
Particularly, exchangeable Mg concentrations were increased from medium sufficient level (7.0 mmolc dm
-3)
to high sufficient level (> 8.0 mmolc dm-3
) according to the scale of Oleynik et al. (1998). DL was reported to be effective material to increase exchangeable Mg concentrations (Hou et al., 2012) because of its higher higher MgO concentration of 257.6 g kg
-1.
The changes in exchangeable K concentrations can be ascribed to the increases of the pH, Ca and Mg concentrations that favored the soil K solubility (Malavolta, 2006) and release (Havlin et al., 2014). Exchangeable K concentrations [between 1.1 and 3.0 mmolc dm
-3 required for grain (maize) crops (Oliveira,
2003)] were in the medium sufficient level and good as per grain (maize) crops (Oliveira, 2003).
The soil pH increased (from around 4.0 to 6.5) in short period of 90 days because of the treatments. That can have resulted in more P desorption (Silva et al., 2000; Motta et al., 2002) and/or labile-P (Calegari et al., 2013) concentrations, widely seen in others clayed soils (Raij, 2011). In addition, the available P concentrations were along the time increased from low of 1.6 mg dm
-3 to high
sufficient levels varying from 4.6 to 11.0 mg dm-3
. Thus, through the available P increase, liming could contribute efficiently to the cultivation of cereals crop (maize) in soils with clay concentrations above 360 g kg
-1 (Oliveira,
2003). Therefore, it can be concluded that all the liming
materials increased exchangeable Ca and Mg, and available P concentrations in soils with variable charges (Typic Distrudept and Rhodic Hapludox). The application of liming materials (except GMD) at the dose of 70% DIV was efficient to promote this increase of available nutrients. The DL was efficient to improve exchangeable Ca and Mg concentrations in soils with variable charge. However, CS followed by GMC were more efficient than DL regarding exchangeable Ca increases in both soils. Conflict of Interests The authors have not declared any conflict of interests.
ACKNOWLEDGEMENTS
The authors acknowledge the support from CNPq, CAPES, Omya do Brasil, for the use of the research facilities of the Multi-User Laboratories Complex (C-LABMU/PROPESP/UEPG) and all the students of agronomy department who assisted in the soil sampling
dos Santos et al. 2759 and soil chemical analysis. REFERENCES Alcarde JC (2005). Corretivos da acidez dos solos: características e
interpretações técnicas por J.C. Alcarde. São Paulo, ANDA. 24 p. Barrow NJ (1985). Reaction of anions and cations with variable charge
soils. Adv. Agron. 38:183-230. Caires EF, Feldhaus IC, Blum J (2001). Crescimento radicular e
nutrição da cevada em função da calagem e aplicação de gesso. Bragantia 60:213-223.
Calegari A, Tiecher T, Hargrove WL, Ralisch R, Tessier D, Tourdonnetf S, Guimarães MF, Santos DR (2013). Long-term effect of different soil management systems and winter crops on soil acidity and vertical distribution of nutrients in a Brazilian Oxisol. Soil Till. Res. 133:32-39.
Coelho AM (2004). Eficiência de calcário de diferentes granulometrias na correção da acidez do solo. Ministério da Agricultura Pecuária e Abastecimento 4 p.
Empresa Brasileira de Pesquisa Agropecuária – EMBRAPA (1997). Manual de métodos de análise de solo. EMBRAPA-Solos, Rio de Janeiro P 212.
França SCA, Couto HJB (2007). Análise microgranulométrica – Malvern e Sedigraph. In: Sampaio JA, et al. (eds) Tratamento de minérios – práticas laboratoriais. CETEM-MCT, Rio de Janeiro pp.101-122.
Fraser MA, Scott BJ (2011). Variability of acidity in agricultural soils – the impact of timber burning at land clearing. Aust. J. Soil. Res. 49:223-230.
Havlin JL, Tisdale SL, Nelson WL, Beaton JD (2014). Soil fertility and fertilizers: an introduction to nutrient management. Uper Sadle River, Pearson 516 p.
Hou E, Wen D, Li J, Zuo W, Zhang L, Kuang Y, Li J (2012). Soil acidity and exchangeable cations in remnant natural and plantation forests in the urbanized Pearl River Delta, China. Aust. J. Soil. Res. 50:207-215.
Hue NV (2011). Alleviating soil acidity with crop residues. Soil Sci. 176:543-549.
Joris HAW, Caires EF, Bini AF, Scharr DA, Haliski A (2013). Effects of soil acidity and water stress on corn and soybean performance under a no-till system. Plant Soil 365:409-424.
Malavolta E (2006). Manual de nutrição mineral de plantas. São Paulo: Ceres 638 p.
Ministério da Agricultura, Pecuária e Abastecimento – MAPA (2007). Manual de métodos analíticos oficiais para fertilizantes minerais, orgânicos, organominerais e corretivos. Brasília: MAPA. 141 p.
Motta PEF, Curi N, Siqueira JO, Raij BV, Furtini Neto AE, Lima JM (2002). Adsorção e formas de fósforo em Latossolos: influência da mineralogia e histórico de uso. Rev. Bras. Ciênc. Solo 26:349-359.
Nagy NM, Kónya J (2007). Study of pH-dependent charges of soils by surface acid–base properties. J. Colloid. Interf. Sci. 305:94-100.
Oleynik J, Bragagnolo N, Bublitz U, Silva JCC (1998). Análises de solo: tabelas para transformação de resultados analíticos e interpretação de resultados. Curitiba: EMATER. 64 p.
Oliveira EL (2003). Sugestão de adubação e calagem para culturas de interesse econômico no Estado do Paraná. Londrina: IAPAR, 30 p.
Oliveira LR, Cunha HP, Silva NM, Pádua IPM (2014). Chemical and mineralogical characterization and soil reactivity of brazilian waste limestones. APCBEE Procedia 9:8-12.
Pavan MA, Bloch MF, Zempulski HC, Miyazawa M, Zocoler DC (1992). Manual de análise química do solo e controle de qualidade. Londrina: Instituto Agronômico do Paraná 38 p.
Raij B (1977). Estudo de materiais calcários usados como corretivos do solo no estado de São Paulo. IV – O poder relativo de neutralização total. Bragantia 36:139-145.
Raij BV (2011). Fertilidade do solo e manejo de nutrientes. Piracicaba: IPNI, 420 p.
Raij BV, Cantarella H, Quaggio JA, Furlani AMC (1996). Recomendações de adubação e calagem para o estado de São Paulo. 2 ed. Campinas: IAC. 285 p.

2760 Afr. J. Agric. Res. SAS System (2004). SAS Institute Inc. SAS OnlineDoc® 9.1.2. Cary,
NC: SAS Institute. Silva CA, Anderson SJ, Guilherme LRG (2000). Uso de cromatografia
de exclusão por tamanho na caracterização de substâncias húmicas de Latossolo Vermelho-Escuro sob efeito de calagem. Rev. Bras. Ciênc. Solo 24:495-503.
Souza DMG, Miranda LN, Oliveira SA (2007). Acidez do solo e sua
correção. In: Novais, R.F. et al. Fertilidade do solo. Viçosa, MG: SBCS. pp. 206-274.

Vol. 11(30), pp. 2761-2767, 28 July, 2016
DOI: 10.5897/AJAR2016.11321
Article Number: 3D21F4059762
ISSN 1991-637X
Copyright ©2016
Author(s) retain the copyright of this article
http://www.academicjournals.org/AJAR
African Journal of Agricultural Research
Full Length Research Paper
Physiological potential of tamarind seeds subjected to stress conditions and storage
Ana V. C. da Silva1*, Adrielle N. R. Soares2, Priscilla S. Santos3, Ana L. S. Nascimento4, Marina F. da Vitória2, Jéssica M. S. P. Oliveira2, Marília F. de V. Melo5, Ana da S. Ledo1 and
Allivia R. C. Rabbani6
1Embrapa Coastal Tablelands, Aracaju, SE, Brazil.
2Post-graduate Program in Agriculture and Biodiversity, Federal University of Sergipe, São Cristovão, SE, Brazil. 3Post-graduate Program in Biotechnology of Renorbio, Federal University of Sergipe, São Cristovão, SE, Brazil.
4Forests Engineering, Scholar DTI CNPq, Embrapa Coastal Tablelands, Aracaju, SE, Brazil.
5Post-graduate Program in Forest Science, Faculty of Agricultural Sciences, State University of São Paulo/UNESP,
Botucatu, SP, Brazil. 6Federal Institute of Bahia, Porto Seguro, BA, Brazil.
Received 14 June, 2016; Accepted 14 July, 2016
Tamarind (Tamarindus indica L.) is a fruit species native to Equatorial Africa, India and Southeast Asia. Its seeds experience slow germination, thus, study on the influence of environmental factors, such as water and salt stresses, on seed germination, is required to assess the tolerance of these seeds to storage, and to maintain the vigor and the viability in the period between harvesting and sowing. The objective of this study was to evaluate the performance of tamarind seeds subjected to salt and water stresses and to storage. Three experiments were carried out in a completely randomized design with four replications of 25 seeds, totaling 100 seeds per treatment. For stress conditions, treatments consisted of moistening of the substrate with different concentrations of PEG 6000 (experiment 1) and NaCl (experiment 2) - 0 (control); -0.3; -0.6; -1.2. For the storage trial (experiment 3), seeds remained stored for 0 (control), 12, 24, 36 and 48 months. In the germination test, the percentage of germination, the speed of germination index, the mean speed and the mean germination time were assessed. All variables were influenced by the water and salt stress, and the seeds of tamarind sensitive to potential used in this work. As in the test with water and saline potential storage trials showed that the physiological seed quality was impaired when they were subjected to long storage period. Key words: Tamarindus indica L, salinity, polyethyleneglycol, stress, storage.
INTRODUCTION Tamarind (Tamarindus indica L.) is a fruit species of the Fabaceae family, native to Equatorial Africa, India and Southeast Asia. It occurs in tropical and subtropical regions, and is considered ideal to be grown in semi-arid regions, since it tolerates 5 to 6 months of drought
(Pereira et al., 2007). The species has wide use, and can be employed in
environment decoration (Donadio et al., 1988). However, the main product is the fruit, and its bittersweet flavored pulp can be used in the preparation of jam,

2 7 6 2 A f r . J . A g r i c . R e s . ice creams, liqueurs, concentrated juices and seasoning for several foods (Gurjão et al., 2006), and in folk medicine (Komutarin et al., 2004). In natura seeds are used as forage for domestic animals, and as gum for fabric or paper. Its trunk provides good quality wood for construction (Bourou et al., 2013), although it is difficult to work with due to its hardness (Silva et al., 2011).
Tamarind seed is orthodox, and the seedlings have epigeal germination, occurring between 15 to 45 days after sowing, with 65 to 75% germination of both freshly harvested and stored seeds (El-Siddig, 2006). Germination occurs under favorable conditions of light, temperature, water, salt and oxygen concentration (Carvalho and Nakagawa, 2012). Thus, one of the objectives of this study on seed germination is to verify the influence of these environmental factors on the germination process (Guan et al., 2009).
Environmental factors, denominated stress, or environmental disorders, which limit crop productivity (Ashraf and Harris, 2004), such as water or salt stress, may influence the germination and the development of several species in different regions (Nogueira et al., 2005). In saline soils, the salts affect the plants due to water osmotic retention and the specific ionic effect on the protoplasm. Saline solutions retain water and thereby reduce water potential, making this resource increasingly less available to plants (Nasr et al., 2011).
Water stress may adversely affect germination, vegetative growth, plant stand, yield, and in severe cases, it may cause seedlings death (Silva and Pruski, 1997) since water stress leads to the reduction of enzyme activity, and consequently to the reduction of the meristem development (Popinigis, 1985; Hadas, 1976). Very negative osmotic potential, especially at the beginning of imbibing, promotes drastic reduction of water uptake by seeds, and may derail the sequence of events of the germination process (Bansal et al., 1980).
Physiological quality of seeds has recently been one of the most studied aspects, since they are subjected to several degenerative changes that occur after maturity, which may be of biochemical, physiological and physical origin, and are associated with vigor reduction (Alizaga et al., 1990). The storage is a very important practice to maintain the physiological quality of seeds, and to ensure the maintenance of vigor and viability during the period between harvesting and sowing (Azevedo et al., 2003).
Thus, studies involving the germination behavior of seeds subjected to the condition of artificial stresses are instruments that provide a better understanding of the capacity for survival and adaptation of these species in conditions of natural stresses, such as drought and
saline soils (Pereira et al., 2012).
Thus, given the lack of information on the germination of tamarind seeds under stress conditions, as well as the influence of storage on seeds vigor, the objective of this study was to evaluate the behavior of tamarind seed subjected to stress conditions and storage. MATERIALS AND METHODS Three experiments were carried out in the Plant Physiology Laboratory of the Applied Biology Department of FCAV/UNESP, Campos de Jaboticabal-SP, with T. indica seeds. Before the establishment of the three trials, seeds were mechanically scarified with sandpaper (220 grit), on both surfaces of the seed coat. In all the trials, the experimental design was completely randomized with four replications of 25 seeds, totaling 100 seeds per treatment. Experiment 1 (water stress)
To verify the effect of different water potentials in the germination process, polyethylene glycol (PEG 6000) was used as osmotic agent. Seeds were sown on a sheet of paper moistened with distilled water (control treatment) and PEG solution (polyethylene glycol) of 2.5 times the weight of the paper, at the potential of -0.3; -0.6; -1.2 Mpa, placed in gerbox-type boxes with four replications of 25 seeds. The boxes remained in biochemical oxygen demand (B.O.D) chambers, equipped with fluorescent lamps, under constant temperature of 30°C.
The concentrations of the different potentials of PEG solutions used for 30°C were obtained based on the equation of Michel and Kayfmann (1973). Experiment 2 (salt stress) To simulate salt stress, seeds were sown on a sheet of paper moistened with distilled (control treatment) and NaCl solution (sodium chloride) of 2.5 times the paper weight, at potentials of -0.3; -0.6; -1.2 Mpa, placed in gerbox-type boxes with four replications of 25 seeds. The boxes remained in B.O.D chambers, equipped with fluorescent lamps, under constant temperature of 30°C.
NaCl solutions used to simulate salt stress and determine the tolerance limit of tamarind seeds to NaCl were prepared using the Van’t Hoff equation (Salisbury and Ross, 1992). Experiment 3 (storage) To verify the influence of storage on tamarind seed germination, seeds were stored in cold chamber at a temperature of 10°C and 50% relative humidity (RH) for different times: 0 (freshly harvested), 12, 24, 36 and 48 months. Germination tests in the three trials were carried out according to the recommendations of the Rules for Seeds Analysis – RAS” (Brasil, 2009), using B.O.D chambers, equipped with fluorescent lamps, under constant temperature of 30°C.
Germination percentage was performed at 30 days after sowing,
*Corresponding author. E-mail: [email protected].
Author(s) agree that this article remain permanently open access under the terms of the Creative Commons Attribution
License 4.0 International License
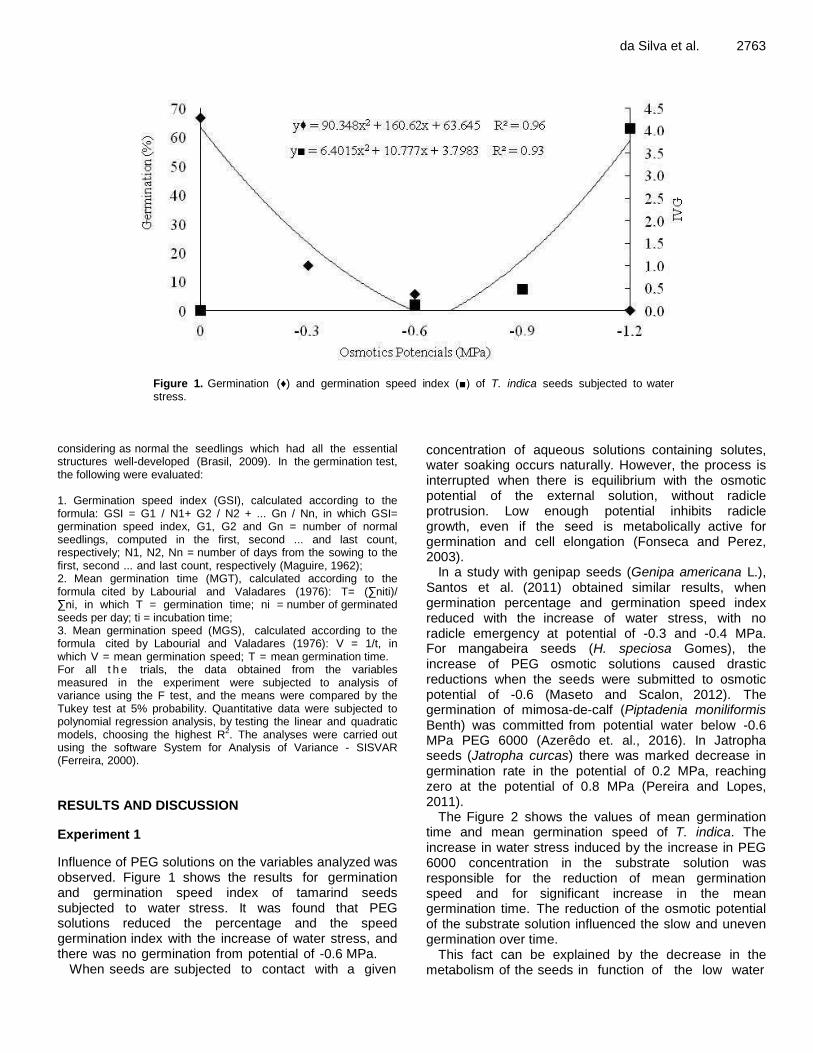
da Silva et al. 2763
Figure 1. Germination (♦) and germination speed index (■) of T. indica seeds subjected to water stress.
considering as normal the seedlings which had all the essential structures well-developed (Brasil, 2009). In the germination test, the following were evaluated: 1. Germination speed index (GSI), calculated according to the formula: GSI = G1 / N1+ G2 / N2 + ... Gn / Nn, in which GSI= germination speed index, G1, G2 and Gn = number of normal seedlings, computed in the first, second ... and last count, respectively; N1, N2, Nn = number of days from the sowing to the first, second ... and last count, respectively (Maguire, 1962); 2. Mean germination time (MGT), calculated according to the formula cited by Labourial and Valadares (1976): T= (∑niti)/ ∑ni, in which T = germination time; ni = number of germinated seeds per day; ti = incubation time; 3. Mean germination speed (MGS), calculated according to the formula cited by Labourial and Valadares (1976): V = 1/t, in which V = mean germination speed; T = mean germination time. For all t h e trials, the data obtained from the variables measured in the experiment were subjected to analysis of variance using the F test, and the means were compared by the Tukey test at 5% probability. Quantitative data were subjected to polynomial regression analysis, by testing the linear and quadratic models, choosing the highest R2. The analyses were carried out using the software System for Analysis of Variance - SISVAR (Ferreira, 2000).
RESULTS AND DISCUSSION
Experiment 1
Influence of PEG solutions on the variables analyzed was observed. Figure 1 shows the results for germination and germination speed index of tamarind seeds subjected to water stress. It was found that PEG solutions reduced the percentage and the speed germination index with the increase of water stress, and there was no germination from potential of -0.6 MPa.
When seeds are subjected to contact with a given
concentration of aqueous solutions containing solutes, water soaking occurs naturally. However, the process is interrupted when there is equilibrium with the osmotic potential of the external solution, without radicle protrusion. Low enough potential inhibits radicle growth, even if the seed is metabolically active for germination and cell elongation (Fonseca and Perez, 2003).
In a study with genipap seeds (Genipa americana L.), Santos et al. (2011) obtained similar results, when germination percentage and germination speed index reduced with the increase of water stress, with no radicle emergency at potential of -0.3 and -0.4 MPa. For mangabeira seeds (H. speciosa Gomes), the increase of PEG osmotic solutions caused drastic reductions when the seeds were submitted to osmotic potential of -0.6 (Maseto and Scalon, 2012). The germination of mimosa-de-calf (Piptadenia moniliformis Benth) was committed from potential water below -0.6 MPa PEG 6000 (Azerêdo et. al., 2016). In Jatropha seeds (Jatropha curcas) there was marked decrease in germination rate in the potential of 0.2 MPa, reaching zero at the potential of 0.8 MPa (Pereira and Lopes, 2011).
The Figure 2 shows the values of mean germination time and mean germination speed of T. indica. The increase in water stress induced by the increase in PEG 6000 concentration in the substrate solution was responsible for the reduction of mean germination speed and for significant increase in the mean germination time. The reduction of the osmotic potential of the substrate solution influenced the slow and uneven germination over time.
This fact can be explained by the decrease in the metabolism of the seeds in function of the low water

2 7 6 4 A f r . J . A g r i c . R e s .
Figure 2. Mean germination time (♦) and mean speed germination (■) of T. indica seeds subjected to water stress.
availability for the digestion of reserves and translocation of metabolized products. Water stress can reduce both the percentage and the germination speed, with a wide range of responses between the most sensitive and the resistant species (Bewley and Black, 1994). Therefore, it is necessary to provide adequate level of hydration during seeds imbibition stage, in order to allow the reactivation of the metabolic processes, culminating in the growth of the embryonic axis (Marcos, 2005).
Similar results were found by Teixeira et al. (2011) in a study with crambe seeds (Crambe abyssinica Hochst), in which the increase in PEG 6000 concentrations in the substrate solution caused significant increase in the mean germination time, and reduction in germination speed. Avila et al. (2007) concluded that with the reduction of the osmotic potential, there was an increase in the number of days to the initial germination of canola seeds (Brassica napus L.). Rabbani et al. (2012) found a decrease in the mean germination speed and mean germination time of moringa seeds (Moringa oleífera), with the increase in water stress. Experiment 2 Figure 3 shows the results of germination (A), germination speed index (B) and mean germination speed (C) of tamarind seeds subjected to salt stress with NaCl solutions. The germination behavior of seeds was similar to those that were subjected to PEG 6000
solutions, with reduction in the germination potential. There was reduction in germination and in the mean germination speed when the seeds were submitted to NaCl solutions, from the potential of -0.3 MPa. However, unlike water stress in saline, there was no germination for any of the treatments, showing that the tamarind seed are more sensitive to drought stress to saline.
The high concentration of salts is a stress factor in plants, as water is osmotically retained in saline, thus increasing the salt concentration becomes less and less available to plants (Munns, 2002). The species are sensitive to salinity and when sown in saline, initially a decrease in water absorption was observed, which acts by reducing the speed of the physiological and biochemical processes (Flowers, 2004), so the presence of higher levels of ions in plants less tolerant to water stress, can have adverse effects on the permeability of cell membranes (Greenway and Munns, 1980), also causing a reduction in the germination process in terms of higher levels of salt stress, pointing out that these levels vary with the species (Pereira et al., 2012). This information become important for purposes of recommendations for the planting of species able to withstand different conditions of osmotic potential in various ecological situations, especially when considering the saline soils and areas with low water availability (Rego et al., 2011).
Martins et al. (2011) also observed an adverse effect on speed and percentage of seed germination melaleuca (Melaleuca quinquenervia) according to the increase of the amount of NaCl in the solution. In cedar seeds

da Silva et al. 2765
C
B A
Figure 3. Germination (A), germination speed index (B) and mean germination speed (C) of T. indica seeds subjected to salt stress.
(Cedrela odorata L.) the adverse effects of salt stress on seed germination was evident at concentrations of 25 mM NaCl, KCl and CaCl2 (Ferreira et al., 2013). In a study on okra seeds (Abelmoschus esculentus L.) Dkhil and Denden (2010) found that germination was impaired when the seeds were subjected to solutions of 80 and 100 mM NaCl. Experiment 3 Figure 4 shows the influence of storage times on the germination (A) and on the germination speed index (B) of tamarind seeds stored for different times. It was found that storage caused reduction in percentage and in germination speed in all storage times, and tamarind seeds are sensitive to prolonged storage.
Probably this reduction in germination is related to the fluctuations in water content, which was enough to promote higher respiratory rates, resulting in increased consumption of seeds reserves during respiration, and thus accelerating the deterioration speed (Guedes et al., 2010). Decreases in viability and vigor during the storage time can be attributed to degenerative changes,
which are typical of deterioration, reflecting the reduction of physiological quality (Corvello et al., 1999).
Similar results were observed by Scalon et al. (2012) in a study on the storage of uvaia seeds (Eugenia pyriformis Cambess), in which the percentage of freshly harvested seed germination was higher when compared with those subjected to storage. Contrary results were reported by Höring et al. (2011) in jatropha seeds, in which stored seeds presented higher GSI. Souza et al. (2016) found that in quinoa seeds (Chenopodium quinoa Willdenow), the physiological quality was not affected by prolonged storage for over 300 days.
Understandimg the dynamics of seed germination is essential to add information that is necessary to promote improvements in working conditions and germination. Overall, the results presented in the 'experiment 3' provided a better understanding of the survivability of the tamarind seeds in conditions of natural stress. Conclusion The tamarind seeds are sensitive to water and salt

2766 Afr. J. Agric. Res.
Figure 4. Germination (A) and germination speed index (B) of T. indica seeds subjected to storage.
stress, but water stress caused major damage to the seeds with the increase of osmotic solutions of PEG, being sensitive from the potential of -0.6 MPa. The seeds were sensitive to prolonged storage, this is not recommended for species. Conflict of Interests
The authors have not declared any conflict of interests. REFERENCES Alizaga RL, Melo VDC, Santos DSB, Irigon DL (1990). Relationship
of vigor tests in bean seeds to seedling emergence. Rev. Bras. Sementes. 12(2):44-58.
Ashraf M, Harris PJC (2004). Potential biochemical indicators of salinity tolerance in plants. Plant Sci. 166(1):3-16.
Avila MR, Braccini AL, Scapim CA, Fagliari JR, Santos JL (2007). Influence of manitol- induced water stress on canola seed germination and seedling growth. Rev. Bras. Sem. 29(1):98-106.
Azerêdo GA, Paula RC, Valeri SV (2016). Germination of Piptadenia moniliformis Benth seeds under water stress. Ciênc. Flores. 26(1):193-202.
Azevedo MRQA, Gouveia JPG, Trovão DMM, Queiroga VP (2003). Influence of packing and storage conditions on the vigor of sesame seeds. Rev. Bras. de Eng. Agr. e Amb. 7(3):519-524.
Bansal RP, Bhati PR, Send DN (1980). Differential specificity in water imbibition of Indian arid zone. Biol. Plantar. 22(5)327-331.
Bewley JD, Black M (1994). Seeds: physiology of development and germination. 2. ed. New York: Plenum Press. 445 p.
Bourou S, Bowe C, Diouf M, Damme PV (2013). Ecological and human impacts on stand density and distribution of tamarind (Tamarindus indica L.) in Senegal. Afr. J. Ecol. 50(3)253-265.
Brasil, Ministério da Agricultura e reforma Agrária (2009). Rules for Seed Analysis. Brasília: SNDA/DNDV/CLAV. 398 p.
Carvalho NM, Nakagawa J (2012). Sementes: Ciência, tecnologia e produção. Jaboticabal: FUNEP 590 p.
Corvello WBV, Villela FA, Nedel JL, Peske RST (1999). Harvesting time and storage of cedro (Cedrela fissilis vell.) seeds. Rer. Bras. de Sem. 21(2):28-34.
Dkhil BB, Denden M (2010). Salt stress induced changes in germination, sugars, starch and enzyme of carbohydrate metabolism in Abelmoschus esculentus L. (Moench.) seeds. Afr. J. Agric. Res. 5(12)1412-1418.
Donadio LC, Nachtigal JC, Sacramento CK do (1988). Frutas exóticas. Jaboticabal: Funep. 279 p.
El-Siddig K (2006). Agronomy and production areas. (Ed.). Southampton: Centre for Underutilised Crops. In: Tamarind, Tamarindus indica. pp. 50-86.
Ferreira DF (2000). Sistema de análises de variância para dados balanceados: programa de análises estatísticas e planejamento de esperimento. Lavras: UFLA (SISVAR 4. 3, Software). Ferreira EGBS, Matos VP, Sena LHM, Oliveira RG, Sales AGFA (2013). Germination and vigor process of Cedrela odorata L. seeds under salt stress. Ciênc. Flor. 23(1):99-105.
Flowers TJ (2004). Improving crop salt tolerance. J. Exp. Bot. 55(396)307-319.
Fonseca SCL, Perez SCJGA (2003). Germination of Adenanthera pavonina L. seeds: peg and polyamines effects under different temperatures. Rev. Bras. de Sem. 25(1):1-6.
Greenway H, Munns R (1980). Mechanisms of salt tolerance in nonhalophytes. Ann. Rev. Plant Physiol. 31:149-190.
Guan B, Zhang H, Tian Y, Japhet W, Wang P (2009). Germination responses of Medicago ruthenica seeds to salinity, alkalinity and temperature. J. Arid Env. 73(1)135-138.
Guedes RS, Alves EU, Gonçalves EP, Viana JS, Santos SS (2010). Physiological quality of Amburana cearensis (Allemão) A.C. Smith seeds stored. Semina: Ciênc. Agrár. 31(2)331-342.
Gurjão KCO, Bruno RLA, Almeida FAC, Pereira WE, Bruno GB (2006). Development of fruits and seeds of tamarind. Rev. Bras. de Frut. 28(3)351-354.
Hadas A (1976). Water uptake and germination of leguminous seeds under changing external water potencial in osmotic solution. J. Exp. Bot. 27(3)480-489.
Höring CF, Malavasi MM, Malavasi UC (2011). Non-controlled storage on Jatropha curcas L. seed quality Semina: Ciênc. Agr. 32(2)521-526. Komutarin T, Azadi S, Butterworth L, Keil D, Chitsomboon B, Suttajit M, Meade BJ (2004). Extract of the seed coat of Tamarindus indica inhibits nitric oxide production by murine macrophages in vitro and in vivo. Food Chemic. Toxicol. 42(4)649-658.
Labourial LG, Valadares MEB (1976). On the germination of seeds Calotropis procera (Ait) Ait.f. An Acad. Bras. Cienc. 18:263-284p.
Maguire JD (1962). Speed of germination-aid in selection and evaluation for seedlig emergence and vigor. Crop Sci. 2(1):176-177.
Marcos FJ (2005). Fisiologia de sementes de plantas cultivadas. 1. ed. Piracicaba: FEALQ. 495 p.
Martins CC, Pereira MRR, Marchi SR (2011). Germination of Melaleuca quinquenervia seeds under water and salt stress conditions. Plant. Dan. 29(1):1-6.
Masetto TE, Scalon SPQ (2014). Drying and Osmotic Conditioning in Hancornia speciosa Gomes Seeds. Flor. Amb. 21(1):62-68.
Michel BE, Kayfmann MR (1973). The osmotic potential of
polyethylene glycol 6000. Plant Physiol. 51(5):914-916. Munns R (2002). Comparative physiology of salt and water stress.
Plant Cell Environ. 25(2)239-250. Nasr SMH, Parsakhoo A, Naghavi H, Koohi SKS (2011). Effect of salt
stress on germination and seedling growth of Prosopis juliflora (Sw.). New For. 43(1):9265-9269.
Nogueira RJMC, Moraes JAPV, Burity HA (2005). Modifications in vapor diffusion resistence of leaves and water relations in barbados cherry plants under water stress. Rev. Bras. Fisiol. Veg. 13(1):75-87.
Pereira MD, Lopes JC (2011). Germination and development of jatropha seedlings under water stress conditions. Semina: Ciênc. Agr. 32(1):1837-1842.
Pereira MRR, Martins CC, Souza GSF, Martins D (2012). Influence of saline and water stress on germination of Urochloa decumbens and Urochloa ruziziensis. Biosci. J. 28(4):537-545.
Pereira P, Melo B, Frazao A, Alves P (2014). A cultura do tamarindeiro (Tamarindus indica L.). 2007. Acesso em, 26:8-13.
Popinigis F (1985). Fisiologia da semente. Bras. AGIPLAN. 289 p. Rabbani ARC, Silva-Mann R, Ferreira RA, Pessoa MAS, Barros
ES, Mesquita JB (2012). Water restriction on moringa seeds (Moringa oleifera L.). Rer. Cient. UDO Agríc. 12(3)563-569.
Rego SS, Ferreira MM, Nogueira AC, Grossi F, Sousa RK, Brondani GE, Araujo MA, Silva ALL (2011). Water and Salt Stress in the Germination of Anadenanthera colubrine (Veloso) Brenan Seeds. J. Biotechnol. Biodiv. 2(4):37-42.
da Silva et al. 2767 Salisbury FB, Ross CW (1992). Plant Physiol. Wadsworth Publishing
Company. 682 p. Santos ARF, Silva-Mann R, Ferreira RA (2011). Water restriction in
jenipapo seeds (Genipa americana L.). Rev. Árvore. 35(2):213-220. Scalon SPQ, Neves SEM, Maseto TE, Pereira ZV (2012). Desiccation
sensivity and storage in Eugenia pyriformis Cambess. seeds (UVAIA). Rev. Bras. Frut. 34(1):269-276.
Silva D, Pruski FF (1997). Recursos hídricos e desenvolvimento sustentável da agricultura. Vicosa, MG: UFV, Departamento de Engenharia Agricola. 252 p.
Silva GBP, Barros GL, Almeida JPN, Procópio IJS, Medeiros PVQ (2011). Time of germination and early development in the production of seedlings Tamarindus indica L. Rer. Ver. 6(2):58-63.
Souza FFJ, Devilla IA, Souza RTG, Teixeira IR, Spehar CR (2016). Physiological quality of quinoa seeds submitted to different storage conditions. Afr. J. Res. 11(15):1299-1308.
Teixeira RN, Toledo MZ, Ferreira G, Cavariani C, Jasper SP (2011). Crambe seeds germination and vigor under water stress. Irrigation 16(1):42-51.
Vol. 11(30), pp. 2768-2774, 28 July, 2016
DOI: 10.5897/AJAR2015.10170
Article Number: 2C15F1459766
ISSN 1991-637X
Copyright ©2016
Author(s) retain the copyright of this article
http://www.academicjournals.org/AJAR
African Journal of Agricultural Research
Full Length Research Paper
Characterization of goat production systems and trait preferences of goat keepers in Bench Maji zone, south
western Ethiopia
Tegegn Fantahun1*, Kefyalew Alemayehu2 and Solomon Abegaz3
1Department of Animal Science, College of Agriculture and Natural Resources, Mizan-Tepi University, P. O. Box 260,
Mizan-Teferi, Ethiopia. 2Department of Animal Production and Technology, College of Agriculture and Environmental Science, Bahir Dar
University, P. O. Box 2145, Bahir Dar, Ethiopia. 3Institute of Biodiversity Conservation, P. O. Box 30726, Addis Ababa, Ethiopia.
Received 15 July, 2015; Accepted 29 October, 2015
Studies to characterize goat production system and identify breeding practices and trait preferences of goat keepers were conducted in three districts (Sheko, Shey Bench and Meanit Shasha) of Bench Maji zone, southwestern Ethiopia. Semi-structured questionnaires and own-flock ranking experiments were employed for data collection. The results of the analyses revealed that the average goat flock size was 9.8±9.3. The flock structure constituted females (42.7%), intact males (19.0%), castrates (1.9%) and kids of both sex (36.5%). Goat production was rated highest for income and then as source of meat, with lowest rating as a means of saving. Most of respondents practiced selection for breeding does than bucks. Mating was predominantly uncontrolled. Twinning ability (I=0.29) for female and body size (I= 0.35) for male were the most highly rated traits at own flock ranking. The goat production system in Sheko and Shey Bench districts was characterized by mixed crop-livestock, while in Meanit Shasha, agro-pastoralism was dominant. Thus, the breeding objectives of the communities are to improve meat production and increase income through increased number of goat flocks. Key words: Agro-pastoralism, breeding objectives, breeding practices, mixed crop-livestock.
INTRODUCTION Goats are kept in a wide range of agro-ecological zones and management systems in Africa. They are found in small herds on mixed farms all over Africa, from the humid coastal zones in West Africa to the highlands of Ethiopia (Peacock, 2005). The majority of the goat
population is found in large flocks in the arid and semi-arid lowlands which are the characteristics of pastoral and agro–pastoral production systems. Goats are kept by nearly all pastoralists, often in mixed flocks with sheep, freely grazing or browsing in the rangelands of Ethiopia
*Corresponding author. E-mail: [email protected].
Author(s) agree that this article remain permanently open access under the terms of the Creative Commons Attribution
License 4.0 International License

(FARM Africa, 1996; Yoseph, 2007). Goats are among the most important livestock species in Ethiopia. The population of goats in the country is estimated to be 22.78 million (CSA, 2011). Based on physical characteristics differences, four families and 13 breeds of goats have been identified in Ethiopia (FARM Africa, 1996; DAGRIS, 2007).
Goat production over the years is one of the major means of improving the livelihoods of poor livestock keepers, reducing poverty and attaining sustainable agriculture and universal food security due to their nature to produce in harsh climate with low quality roughages (Peacock, 2005; Madsen et al., 2007; Abdul-Aziz, 2010). Goats provide their owners with a broad range of products and socio-economic services and have played an important role in the social life of many African people (Tesfaye, 2004; Peacock, 2005). Goats can play a vital role in ensuring the food security of a household, often being the only asset possessed by a poor family. In times of disaster, such as crop failure or family illness, goats can be sold to purchase food or medicine (Peacock, 2005; Solaiman, 2010; CSA, 2011).
A good understanding of a production system is important for initiating programs that are meant to improve goat productivity including genetic improvement programs (Kosgey et al., 2006). Farmers in different production systems have different trait preferences due to the varying production activities and available resources (Ouma et al., 2004; Duguma et al., 2010). Definition of breeding objective should be a follow up activity, after defining the production system, in designing genetic improvement strategies (Duguma et al., 2010), since it would provide guidance for people involved in genetic improvement programmes (Kosgey, 2004). Involvement of farmers and pastoralists in defining breeding objectives and identifying traits to be targeted helps to increase the success of breed improvement programs (Getachew et al., 2010).
Bench Maji is known with diversified ethnic groups, varying agro climatic condition, different production systems and a variety of livestock genetic resources. Yet the goat production system and trait preferences of goat keepers in the area were not studied. Therefore, the objective of this study was to characterize the goat production systems and identify trait preference of goat keepers. MATERIALS AND METHODS Study site Bench Maji Zone (BMZ) is located in south western Ethiopia at 34°45’ to 36°10’E longitude and 5°40’ to 7°40’N latitude. The altitude ranges from 500 to 3,000 masl. The annual average temperature range from 15.1 to 27.5°C, while the annual rainfall range from 400 to 2,000 mm (BMZFED, 2012). The study area consisted of three districts namely Sheko, Shey Bench and Meanit Shasha.
Fantahun et al. 2769 Sampling techniques and data collection methods The study was conducted from December 2011 to August 2012. A total of 180 (60 per district) goat owners were selected by using stratified sampling techniques. The selected respondents were interviewed by semi-structured questionnaires. General information list of FAO (2011) and Oromiya livestock breed survey questionnaire (Workneh et al., 2004) were used as a checklist in designing the questionnaire. In addition, own-flock ranking was used to identify trait preferences and the breeding objectives as used earlier by Tadele (2010) and Duguma et al. (2010). Data analysis Descriptive statistics, Chi-square tests and multiple mean comparisons using Bonferroni’s correction were employed to analyze the data by Statistical Analysis System (SAS 9.0, 2002). Indexes were also calculated for all rankings data according to the following formula: Index = sum of (3 for rank 1 + 2 for rank 2 + 1 for rank 3) given for an individual reason (attribute) divided by the sum of (3 for rank 1 + 2 for rank 2 + 1 for rank 3) for overall reasons (attributes).
RESULTS Household socio-economic characteristics The average family size of the households sampled in the study was about 7.4 (SD=2.91). The average reported age of the respondents was 40.6 (SD=12.35) years with a range of 19-81 years. The majority of respondent households were male headed (93.3%) and only 6.7% of the households were female headed. In terms of literacy of respondents, higher proportion of illiterate (44.4%) was found followed by respondents which could read and write (28.9%).
On average, respondents in the three districts ranked their main source of cash income into sale of crops (I=0.52) as the first, while livestock and livestock products (I=0.35) ranked the second. Sale of homemade beverages was ranked as third source of income (I=0.11). In contrast to Sheko and SheyBench districts, the respondents in Meanit Shasha ranked their source of cash income into sale livestock and livestock products as the first (I=0.57) while sales of crops (I=0.35) ranked the second. Sale of homemade beverages was ranked as third source of income (I=0.08).
Livestock holding The livestock species maintained in the area were cattle, sheep, goats, chickens and equines. The average reported livestock possessions are presented in Table 1. Respondents at Meanit Shasha had significantly higher (P<0.05) number of cattle, goat and chicken, while respondents at Shey Bench had significantly higher (P<0.05) number of sheep than their counterparts. However, there was no significant difference (P<0.05)

2770 Afr. J. Agric. Res.
Table 1. Livestock holdings per household in the study areas.
Animal Sheko Shey Bench Meanit Shasha Overall
Mean ± SD Mean ± SD Mean ± SD Mean ± SD
Cattle 4.50 ±2.82b 5.25±3.31
b 8.95±5.45
a 6.23±4.42
Goat 6.10 ± 2.31b 4.55±1.73
b 18.75±11.51
a 9.80±9.30
Sheep 1.60 ±1.46b 5.85± 3.12
a 2.60±2.21
b 3.35±2.98
Chicken 4.45±4.50b 6.15±5.13
b 12.50±8.29
a 7.70±7.03
Donkey 0.05±0.22a 0.25±0.44
a 0.20±0.41
a 0.17±0.37
Mule 0.20±0.52a 0.10±0.31
a 0
a 0.10±0.35
Horse 0b 0.35±0.58
a 0
b 0.12±0.37
a,b
Means on the same row with different superscripts are significantly different (P<0.05).
Figure 1. Goat flock size and structures in the study areas.
between the three districts in horse, mule and donkey holding. Goat flock structure The flock structure obtained in the study is presented according to age and sex classes in Figure 1. In total, the proportion of females older than six months constituted 42.7%, while intact and castrate males in the same age constituted 19.0 and 1.9% of the whole flock, respectively. Kids (both sexes) less than 6 months of age
constituted 36.5%, while females older than one year of age and 6 months to 1 year of age accounted for 28.2 and 14. 5% of the population, respectively and ranked first, second and third from the whole flock. Purpose of keeping goat The respondents in the three districts were ranked according to the reason why they kept goats, accordingly, goat production has been serving as source of income, meat, saving, wealth storage and cultural ceremonies for
Figure
0
5
10
15
20
25
30
35
40
45
kids < 6months
Male 6months to
1 year
Female 6months to
1 year
Male >1year
Female >1year
Castrates
Per
cen
t
Age and sex categories
Sheko
Shey Bench
Meanit Shasha

Fantahun et al. 2771
Table 2. Ranked constraints of goat production in the study areas.
Constraints Sheko Shey Bench Meanit Shasha
Overall Index Index Rank Index Rank Index Rank
Feed shortage 0.35 1 0.34 1 0.33 2 0.33
Water shortage 0
0.04 5 0.15 3 0.06
Disease 0.05 4 0.25 2 0.41 1 0.24
Drought 0
0
0.04 4 0.009
Market 0.04 5 0.02 6 0.01 6 0.02
Mobility 0.02 6 0
0.04 4 0.015
Labor shortage 0.34 2 0.22 3 0.01 6 0.2
Predator 0.2 3 0.13 4 0.02 5 0.15
the goat keepers of the study areas. The overall index result indicated that majority of the respondents (index value of 0.42) rated goat was primarily kept for income source, meat was the second with index value of 0.32 and saving was rated as third having index value 0.16. Breeding practices Mating was predominantly uncontrolled in the area. About 23.3, 20 and 76.7% of respondents in Sheko, Shey Bench and Meanit Shasha, respectively, kept their own breeding buck. Majority of respondents at Meanit Shasha (86.7%), Sheko (75%) and Shey Bench (73.3%) reported breeding bucks were originated from own flock while the rest of them reported that bucks were purchased from market. The majority (about 83.3% at Sheko, 58.3% at Meanit Shasha and 76.7% at Shey Bench) of respondents keep bucks for fattening while others reported that they were maintaining bucks for both fattening as well as mating purpose. When the flocks did not have a breeding male, the majority (93 to 100%) of the goat keepers relied on bucks from neighbors’ flocks to service the females.
Moreover, few of the respondents at Sheko reported that they got the service by taking their does to a local market where bucks for sale can be used and paying the buck owner an amount of money. Selection of breeding goats Selection of parents of the next generation for both males and females was practiced at varying rate. Out of the whole respondents, 77.8% were interested in selection for females while only 37.2% have interest in selecting for males. Majority of the respondents (78.3% at Sheko, 81.7% at Meanit Shasha and 73.3% at Shey Bench) gave attention and practice selection of breeding females. On the other hand, only 38.5, 47.6 and 36.7% reported practicing selection of breeding males at Sheko, Meanit Shasha and Shey Bench, respectively.
Castration Castration was practiced by 81.7% of respondents at Meanit Shasha, 68.3% at Sheko and 65% at Shey Bench. Male kids of more than six months old were commonly castrated. The respondents have multiple castration objectives such as for improving fattening potential and temperament of buck and indirectly controlling breeding. Male kids of more than six months old were commonly castrated. Castration was entirely done through traditional method using local materials such as wood and stone. Majority of the respondents did not supplement castrated bucks. Goat production constraints Constraints of goat production in the study area are presented in Table 2. The constraints were reported across the districts and some of them may not have appeared on the first to third rank lists according to respondents’ prioritization. Feed shortage was the most frequently mentioned production constraint and ranked as the first with index value of 0.33. Disease ranked the second mentioned as important constraints threatening goat production (I=0.24) while labor shortage for goatherd shepherding was the third frequently mentioned constraint with index value of 0.20. Trait preference and breeding objectives The results obtained on the trait preference from own flock ranking for female and male goats are presented in Tables 3 and 4, respectively. Twinning ability (I=0.31), kid growth (0.21), mothering character (I=0.13) and body size (I=0.13) were the most highly rated traits for selecting female goat from their own flocks. On the other hand, body size and growth rate were ranked as first and second preferred traits with overall index value of 0.42 and 0.27, correspondingly to the selection of best male from their own flocks.

2772 Afr. J. Agric. Res.
Table 3. Reasons for ranking preferred female goats within own flock.
Characters Sheko Shey Bench Meanit Shasha
Overall Index Index Rank Index Rank Index Rank
Body size 0.1 5 0.2 3 0.12 5 0.13
Color 0.05 6 0.06 5 0.04 6 0.05
Mothering character 0.11 4 0.12 4 0.16 3 0.13
Kid growth 0.22 2 0.21 2 0.2 2 0.21
Age at first Kidding 0.03 8 0.02 7 0.02 8 0.02
Kidding interval 0.12 3 0.05 6 0.14 4 0.10
Twining ability 0.3 1 0.36 1 0.27 1 0.31
Adaptive 0.02 7 0.02 7 0.03 7 0.02
Longevity 0.01 9 0.02 7 0.03 7 0.02
Temperament 0.01 10 0.02 7 0
0.01
Table 4. Reasons for ranking preferred male goats within own flock.
Preferred traits Sheko Shey Bench Meanit Shasha
Overall Index Index Rank Index Rank Index Rank
Body size 0.45 1 0.46 1 0.35 1 0.42
Color 0.19 3 0.15 3 0.15 4 0.16
Horn 0.04 5 0 0.02 6 0.02
Growth rate 0.27 2 0.3 2 0.24 2 0.27
Adaptability 0
0.02 6 0.17 3 0.07
Mating ability 0.05 4 0.03 5 0.06 5 0.05
Temperament 0
0.04 4 0
0.01
Twinning ability for female and body size for male were the most highly rated traits for selecting goat at own flock ranking experiment. The production objectives of goat keeper are income sources, meat and saving. Therefore, breeding objectives of the community are to improve growth of goat thereby improving meat production potential of goats and increased income through increased number of kid crops in goat flocks. DISCUSSION From the results, higher number of goat population was obtained at Meanit Shasha (18.75±11.51) which is significantly different from both Sheko (6.10±2.31) and Shey Bench (4.55±1.73). This is because Meanit Shasha area is characterized as that of agro-pastoral having huge goat population. The average goat flock size (9.8) is higher than the case reported for FARM Africa (1996) which suggested a mean flock size of 7 for Arsi-Bale goats, 4 for Hararghe Highland goats, and 6 for Keffa goats. The result closely relates with average flock sizes of 10 for Central Highland, 11 for Woyto-Guji and 11 for Western lowland goats as reported by the same author. In contrast, Grum (2010) reported average flock size of
32.8 for Short Eared Somali goat population which is quite higher than flock size reported by this study.
The study showed that goats were not milked in the study areas, because no respondents reported they keep goats for milk. This is in agreement with the report for FARM Africa (1996) that goats were not milked in parts of Gojam, Wellega, Keffa and Wolayta. However, reports of Girum (2010) for Short Eared Somali Goats and (FARM Africa, 1996) showed goats are milked in all other parts of the country except in the parts of the country indicated above.
Castration was mainly practiced to improve the fattening potential, thereby it is a means of getting higher sale prices at a later date. It was also practiced to improve temperament of buck and the respondents believe that castrated goats can be raised with females together without problem. Male kids more than six month old were commonly castrated. In agreement with this report, different findings indicated that castration at early age has positive impact on weight gain (Singh, 2000; Wondwosen, 2007). Usually better bucks with good body conformation and having potential for fattening are subjected to castration at early age which results in loss of important gene (negative selection).
Good understanding on the relative importance of the

different constraints is fundamental prior to initiating any genetic improvement programme (Baker and Gray, 2003). Across districts, different constraints with variable rank were reported for instance feed shortage ranked as the first most limiting production constraint at Sheko and Shey Bench, while disease occurrence was ranked as the first followed by feed shortage at Meanit Shasha. Water shortage was third ranked problem at Meanit Shasha. On average, index value, in this finding in agreement with Takele (2005) report that feed shortage, disease and shortage labor for herding is the most limiting production constraints in the same study area. Similarly, in other parts of the country, feed shortage was also the most frequently mentioned goat production constraint (Grum, 2010). Conclusion In conclusion, the goat production system in the Sheko and the Shey Bench areas were characterized by mixed crop-livestock, whereas the Meanit Shasha area was characterized by agro-pastoral. Goats in the mixed crop-livestock production system were characterized by small flock size than the agro-pastoral. Goats are kept in the areas for multiple production objectives contributing to household income and food security. Does having high twinning ability with best kid growth and bucks with large body size with good growth rate were the most preferred traits. Higher twinning rate was obtained from the goat flocks because of higher preference for twinning by goat owners. This showed that the goat populations are relatively productive. Thus, the breeding objectives of the communities are to improve meat production and increase income through increased number of kid crops and improved growth. Conflict of interests The authors have not declared any conflict of interests. ACKNOWLEDGEMENTS The authors thank Mizan-Tepi and Bahir Dar University of Ethiopia for their financial support. REFERENCES Abdul-Aziz M (2010). Present status of the world goat populations and
their productivity. Lohmann Inform. 45(2):42-50. Baker RL, Gray GD (2003). Appropriate breeds and breeding schemes
for sheep and goats in the tropics: the importance of characterizing and utilizing disease resistance and adaptation to tropical stresses. In: Sani R., Gray G.D. and Baker R.L. (eds.), Better Worm Control for Small Ruminants in Tropical Asia, Australian Centre for International Agricultural Research (ACIAR), Monograph.
Banerjee AK, Animut G, Ermias E (2000). Selection and breeding
Fantahun et al. 2773
strategies for increased productivity of goats in Ethiopia. In: Merkel R.C., Abebe G. and Goetsch A.L. (eds.), The opportunities and challenges of enhancing goat production in East Africa. Proc. of a Conf. held at Debub University, Awassa, Ethiopia. 10-12 November 2000. E (Kika) de la Garza Institute for Goat Research, Langston University, Langston, OK pp. 70-79.
Bench Maji Zone Finance and Economic Development (BMZFED) (2012). Annual report of Bench Maji zone finance and economic development main department. Mizan-Teferi, Ethiopia.
Central Statistical Authority (CSA) (2011). Agricultural sample survey 2010/11. Report on livestock and livestock characteristics. Volume 2, Stat. Bull. # 505. Addis Ababa, Ethiopia.
DAGRIS (Domestic Animal Genetic Resources Information System) (2007). Domestic Animal Genetic Resources Information System (DAGRIS). In Kemp S., Mamo Y., Asrat B. and Dessie T. (eds.). International Livestock Research Institute, Addis Ababa, Ethiopia. Retrieved March 21, 2012, from http://dagris.ilri.cgiar.org
Duguma G, Mirkena T, Haile A, Iñiguez L, Okeyo A, Tibbo M, Rischkowsky B, Sölkner J, Wurzinger M (2010). Participatory approaches to investigate breeding objectives of livestock keepers. Livestock Research for Rural Development, Volume 22, Article # 64 Retrieved July 19, 2011, from http://www.lrrd.org/lrrd22/4/dugu22064.htm
FARM Africa (1996). Goat types of Ethiopia and Eritrea. Physical description and management systems. FARM-Africa, London, UK, and ILRI (International Livestock Research Institute), Nairobi, Kenya, 76 p.
FAO (Food and Agriculture Organization) (2011).Draft guidelines on phenotypic characterization of animal genetic resources. Commission on genetic resources for food and agriculture. Thirteenth Regular Session. Food and Agriculture Organization of the United Nations, Rome, Italy, 78 p.
Getachew T, Haile A, Tibbo M, Sharma A K, Sölkner J, Wurzinger M (2010). Herd management and breeding practices of sheep owners in a mixed crop-livestock and a pastoral system of Ethiopia. Afr. J. Agric. Res. 5(8):685-691.
Grum G (2010). Community-based participatory characterization of the Short Eared Somali goat population around Dire Dawa. MSc. Thesis, Haramaya University, Dire Dawa, Ethiopia, 112 p.
Kosgey IS (2004). Breeding objectives and breeding strategies for small ruminants in the tropics. PhD Thesis, Wageningen University, The Netherlands, 271 p.
Kosgey IS, Baker RL, Udo HMJ, van Arendonk JAM (2006). Successes and failures of small ruminant breeding programs in the tropics: A review. Small Rumin. Res. 61:13-28.
Madsen J, Nielsen MO, Henriksen J (2007). Use of goats in poverty alleviation and potential effects on the environment. Copenhagen, Denmark, 12 p.
Ouma E, Obare G, Abdulai A, Drucker A (2004). Assessment of farmer preferences for cattle traits in smallholder cattle production systems of Kenya and Ethiopia. Conf. on International Agricultural Research for Development, Deutscher Tropentag, 5-7 October 2004, Berlin, Germany.
Peacock C (2005). Goats: Unlocking their potential for Africa’s farmers. Farm-Africa Working Papers Series No. 2. Paper presented at the Seventh Conf. of Ministers Responsible for Animal Resources, 31 October–4 November, 2005, Kigali, Rwanda.
Singh DK (2000). Effect of age at castration on gain in body weight and carcass characteristics of kids. Indian Vet. J. 77(6):513-516.
Solaiman SG (2010). Goat Science and Production. Blackwell Publishing.
Statistical Analysis System (SAS) (2002). SAS Institute Inc. Cary. North Carolina, USA.
Tadele M (2010). Identifying breeding objectives of smallholders/pastoralists and optimizing community-based breeding programs for adapted sheep breeds in Ethiopia. PhD Thesis,University of Natural Resources and Life Sciences, Vienna,116 p.
Takele T (2005). On-farm Characterization of Sheko breed of in Southern Ethiopia cattle. MSc. Thesis, Haramaya University, Dire Dawa, Ethiopia 105 p.
Tesfaye A (2004). Genetic characterization of indigenous goat

2774 Afr. J. Agric. Res.
populations of Ethiopia using Microsatellite DNA markers. PhD Thesis, NDRI, India 215 p.
Wondwosen K (2007). Husbandry practices of goats in Ddalocha woreda,southern Ethiopia. MSc. Thesis, Haramaya University, Dire Dawa, Ethiopia 118 p.
Workneh A, van Dorland A, Rowlands J (2004). Design, execution and analysis of the livestock breed survey in Oromiya Regional State, Ethiopia. OADB (Oromiya Agricultural Development Bureau), Addis Ababa, Ethiopia, and ILRI (International Livestock Research Institute), Nairobi, Kenya, 260 p.
Yoseph M (2007). Reproductive traits in Ethiopian male goats, with
special reference on breed and nutrition. PhD Thesis, Uppsala, Sweden 54 p.

Vol. 11(30), pp. 2775-2785, 28 July, 2016
DOI: 10.5897/AJAR2016.11231
Article Number: 8B87DFB59768
ISSN 1991-637X
Copyright ©2016
Author(s) retain the copyright of this article
http://www.academicjournals.org/AJAR
African Journal of Agricultural Research
Full Length Research Paper
Potential for recovery of Campomanesia xanthocarpa Mart. ex O. berg seedlings from water deficit
Larissa Fatarelli Bento1*, Silvana de Paula Quintão Scalon1,2, Daiane Mugnol Dresch1 and Zefa Valdivina Pereira3
1Faculty of Agricultural Sciences, Federal University of Grande Dourados, Road Dourados Itahum, km12, Rural
Subdivision, CEP: 79804970, Dourados, State Mato Grosso do Sul, Brazil. 2Cnpq Productivity Scholarship, Faculty of Agricultural Sciences, Federal University of Grande Dourados, Road
Dourados Itahum, km12, Rural Subdivision, CEP: 79804970, Dourados, State Mato Grosso do Sul, Brazil. 3Faculty of Biological and Environmental Sciences, Federal University of Grande Dourados, Road Dourados Itahum,
km12, Rural Subdivision, CEP: 79804970, Dourados, State Mato Grosso do Sul, Brazil.
Received 17 May, 2016; Accepted 16 June, 2016
The objective of this study is to evaluate the effect of water deficit and the recovery potential following rehydration, on the metabolism of Campomanesia xanthocarpa seedlings. The seedlings were distributed in two groups: the first group was the control, in which, plants were hydrated periodically in order to maintain 70% water holding capacity and the second was the treatment group characterized by stress, in which irrigation was suspended until the photosynthetic rate showed levels close to zero, at which point the plants were once again rehydrated with subsequent daily irrigation for one week, maintaining the water holding capacity at 70%. C. xanthocarpa shows a reduction in stomatal conductance and photosystem PSII efficiency. Water deficit decreases the water potential in the leaves and all the traits of the photosynthetic metabolism in C. xanthocarpa seedlings in twenty days of suspension of irrigation. These are later recovered with the re-establishment of the water supply. However, exposure of the seedlings to a second cycle of water deficit during the evaluation period demonstrated that the metabolism traits do not re-establish equilibrium. Key words: Cerrado, guabiroba, photosynthesis.
INTRODUCTON Plants are frequently exposed to multiple stress conditions, which limit their growth and development. Among the environmental factors, water deficiency is one of the stress factors that cause more damage to the physiological and metabolic processes of plants (Larcher,
2006; Taiz and Zeiger, 2013), thus determining their distribution (Sakamoto and Murata, 2002).
Several physiological and biochemical responses are observed as a result of water deficit. CO2 assimilation by the leaves is reduced mainly because of stomatal
*Corresponding author. E-mail: [email protected]. [email protected].
Author(s) agree that this article remain permanently open access under the terms of the Creative Commons Attribution
License 4.0 International License

2776 Afr. J. Agric. Res. closure, damage to the membranes, and impaired enzymatic activity, especially that of enzymes involved in CO2 fixation and ATP synthesis. Meanwhile, it has also been reported that under severe water stress, in addition to stomatal restrictions to CO2 uptake, limitations can occur in non-stomatal components, such as reduction in RuBisCO activity, CO2 availability in chloroplasts, and damage to the reaction centers of photosystem II, however, the extent of the effects of water deficiency will depend, among other factors, on its intensity and duration and on their recovery potential, as it requires adaptive changes and/or deleterious effects (Flexas et al., 2006; Xu et al., 2009).
Brazil has a rich and diversified flora regarding fruit species especially those producing edible and commercially useful fruits. Campomanesia xanthocarpa Mart. ex O. Berg, commonly known as „gabiroba‟, which belongs to the family Myrtaceae, is native to Brazil and found in almost all forest formations from the state of Minas Gerais to the southernmost edge of Rio Grande do Sul (Lorenzi, 1992). The fruit presents an abundant and succulent pulp, and is appreciated regionally. It is used in the production of refreshments, ice cream, liqueurs, and homemade sweets, owing to the presence of significant levels of pectic substances. Gabiroba fruits have good nutritional value owing to the high level of vitamin C, minerals, and phenolic compounds, which allows them to be considered a functional food (Santos et al., 2009). The species is also important for the production of coal and good-quality firewood.
Few studies have focused on the effect of water deficit on the physiological processes in native plants. This is an important area for research, since this abiotic stress has effects on various plant processes, many of which reflect mechanisms of adaptation to different habitats. Such knowledge of C. xanthocarpa metabolism will allow the production of quality seedlings. This will be useful since there is a need to replant owing to high mortality rates when the plants are exposed to environmental stresses to which they are not adapted (Carvalho et al., 2003), in addition to permitting sustainable exploration, and the possibility of regeneration of degraded areas.
Considering the natural habitat of C. xanthocarpa, it is believed that their occurrence is related to increased photosynthetic efficiency and the plant‟s capacity for recuperation, following periods of water stress sustained in their natural environment. In light of this, the present work aimed to evaluate the effect of water deficit and the recovery potential following rehydration, on the metabolism of C. xanthocarpa seedlings. MATERIALS AND METHODS C. xanthocarpa fruits were collected at the beginning of the month of December 2013, using matrices distributed in the Cerrado areas, located near the municipality of Dourados/Mato Grosso do Sul State. After collection, the fruits were manually processed and the seeds extracted and selected according to their integrity and
uniformity. The selected seeds were washed in running water to eliminate pulp remains and then dried using Germitest® paper tissues.
In order to obtain the seedlings, the seeds were sown in tubes of 50 × 190 mm at a depth of one centimeter, which contained distroferric red latosol, sand, and Bioplant® commercial substrate, at the proportion of 1:1:1. The seedlings, measuring about 15 cm, were transplanted into 5 kg capacity pots in the same soil, where they were acclimatized for 30 days, with irrigation at 70% water holding capacity and kept in a 40% shade (Sombrite®) greenhouse. During the course of the experiment, the plants were protected from pluviometric precipitation by a plastic cover.
The pots were distributed in two groups. The first group was the control, in which, plants were hydrated periodically in order to maintain 70% water holding capacity. The second was the treatment group characterized by stress, in which irrigation was suspended until the photosynthetic rate showed levels close to zero, at which point the plants were once again rehydrated with subsequent daily irrigation for one week, maintaining the water holding capacity at 70%. This treatment was applied twice. The seedlings were evaluated up to 172 days since the start of the treatments.
To evaluate the effect of intermittent water deficit, the plants were monitored every two days, until the photosynthetic rate was at levels close to zero, and following rehydration with daily hydration for one week, at which point the following characteristics were evaluated: 1. Chlorophyll index: Obtained with the help of a chlorophyll meter (Konica Minolta, SPAD 502). 2. Gas exchanges: The photosynthetic rate - A (µmol m-2 s-1), foliar transpiration - E (mmol m-2 s-1), stomatal conductance 3. Gs (mol m-
2 s-1) and internal CO2 concentration - Ci (µmol mol-1) were measured using an infrared gas analyzer (IRGA) (Model LCi PRO; Analytical Development Co. Ltd., Hoddesdon, UK). The measurements were performed on three seedlings per treatment in the morning, between 08:00 h and 11:00 h, and were recorded from two fully extended previously marked leaves. All measurements were taken from these marked leaves. Only the data measured under a photosynthetic photon flux (PPF) above 700 mmol m−2 s−1
were considered. From the gas exchange data, the following ratios were calculated: instantaneous water-use efficiency (WUE µmol CO2/ mmol-1 H2O), intrinsic water-use efficiency (IWUE µmol CO2/ mmol-1 H2O), and instantaneous carboxylation efficiency (A/Ci µmol m-2 s-1/ µmol mol-1). 4. Chlorophyll a fluorescence: A portable fluorometer (model OS-30p) (Opti-Sciences Chlorophyll Fluorometer, Hudson, USA), was used to measure the initial fluorescence (F0), the maximum fluorescence (Fm), and the potential quantum efficiency of photosystem II (Fv/Fm). From these fluorescence data, the following parameters were calculated: variable fluorescence (Fv = Fm − F0) and effective absorbed energy conversion efficiency of photosystem II (Fv/F0). Fluorescence determinations were performed between 08:00 h and 11:00 h, on the same leaves used to evaluate gas exchanges, and they were submitted to a 30-minute dark adaptation period using leaf-clip holders, so that all the reaction centers in that foliar region acquired the „open‟ configuration, indicating the complete oxidation of the photosynthetic electron transport system. 5. Leaf water potential (Ψω): Obtained from readings performed on the second pair of fully extended leaves from the apex to the base, between 10:00 h and 11:00 h, using pressure chamber Scholander (Portable Plant water status console - modelo 3115) (Scholander et al., 1964), immediately after leaf collection. The values were obtained in bar and later converted to MPa.
For gas exchanges, the design was completely randomized with two water regimes (control - irrigated periodically and stress) and four repetitions, in which each one corresponded to one seedling.
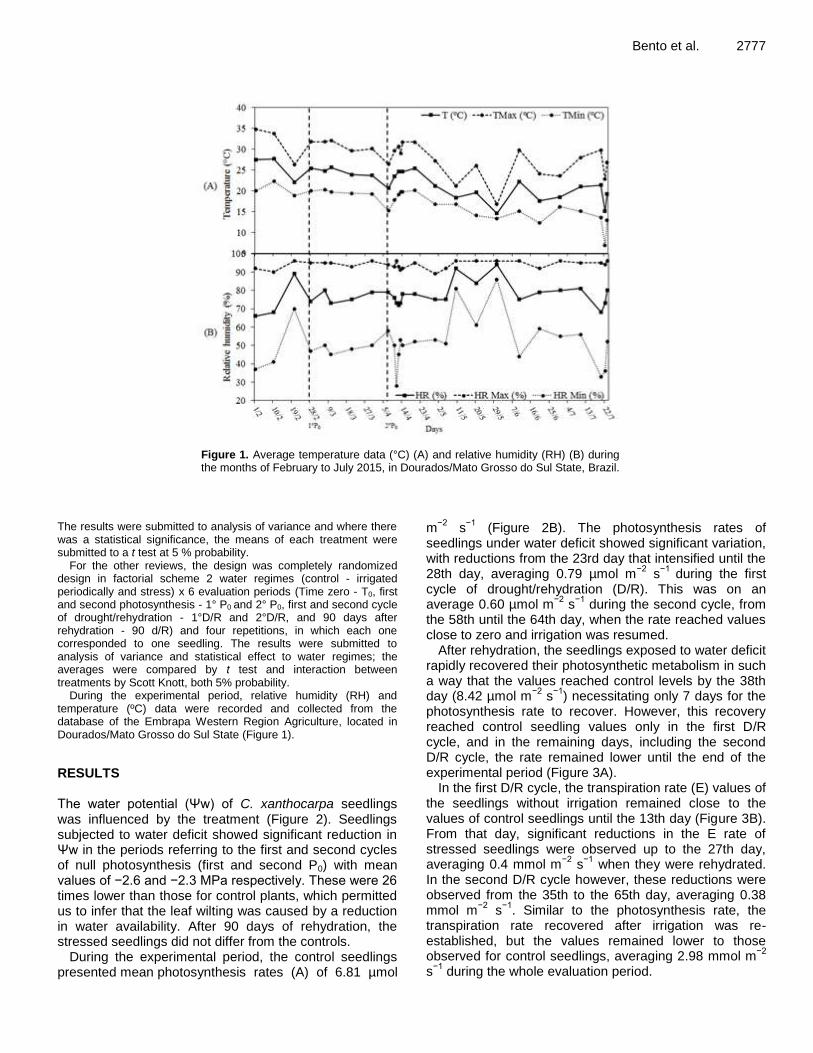
Bento et al. 2777
Figure 1. Average temperature data (°C) (A) and relative humidity (RH) (B) during the months of February to July 2015, in Dourados/Mato Grosso do Sul State, Brazil.
The results were submitted to analysis of variance and where there was a statistical significance, the means of each treatment were submitted to a t test at 5 % probability.
For the other reviews, the design was completely randomized design in factorial scheme 2 water regimes (control - irrigated periodically and stress) x 6 evaluation periods (Time zero - T0, first and second photosynthesis - 1° P0 and 2° P0, first and second cycle of drought/rehydration - 1°D/R and 2°D/R, and 90 days after rehydration - 90 d/R) and four repetitions, in which each one corresponded to one seedling. The results were submitted to analysis of variance and statistical effect to water regimes; the averages were compared by t test and interaction between treatments by Scott Knott, both 5% probability.
During the experimental period, relative humidity (RH) and temperature (ºC) data were recorded and collected from the database of the Embrapa Western Region Agriculture, located in Dourados/Mato Grosso do Sul State (Figure 1).
RESULTS The water potential (Ψw) of C. xanthocarpa seedlings was influenced by the treatment (Figure 2). Seedlings subjected to water deficit showed significant reduction in Ψw in the periods referring to the first and second cycles of null photosynthesis (first and second P0) with mean values of −2.6 and −2.3 MPa respectively. These were 26 times lower than those for control plants, which permitted us to infer that the leaf wilting was caused by a reduction in water availability. After 90 days of rehydration, the stressed seedlings did not differ from the controls.
During the experimental period, the control seedlings presented mean photosynthesis rates (A) of 6.81 µmol
m−2
s−1
(Figure 2B). The photosynthesis rates of seedlings under water deficit showed significant variation, with reductions from the 23rd day that intensified until the 28th day, averaging 0.79 µmol m
−2 s
−1 during the first
cycle of drought/rehydration (D/R). This was on an average 0.60 µmol m
−2 s
−1 during the second cycle, from
the 58th until the 64th day, when the rate reached values close to zero and irrigation was resumed.
After rehydration, the seedlings exposed to water deficit rapidly recovered their photosynthetic metabolism in such a way that the values reached control levels by the 38th day (8.42 µmol m
−2 s
−1) necessitating only 7 days for the
photosynthesis rate to recover. However, this recovery reached control seedling values only in the first D/R cycle, and in the remaining days, including the second D/R cycle, the rate remained lower until the end of the experimental period (Figure 3A).
In the first D/R cycle, the transpiration rate (E) values of the seedlings without irrigation remained close to the values of control seedlings until the 13th day (Figure 3B). From that day, significant reductions in the E rate of stressed seedlings were observed up to the 27th day, averaging 0.4 mmol m
−2 s
−1 when they were rehydrated.
In the second D/R cycle however, these reductions were observed from the 35th to the 65th day, averaging 0.38 mmol m
−2 s
−1. Similar to the photosynthesis rate, the
transpiration rate recovered after irrigation was re-established, but the values remained lower to those observed for control seedlings, averaging 2.98 mmol m
−2
s−1
during the whole evaluation period.

2778 Afr. J. Agric. Res.
Figure 2. Water potential - Ψw of seedlings Campomanesia xanthocarpa in function water regimes. Small letters compare treatments (stressed and control) and capital letters compare control and capital letters in italics compare the stressed seedlings within the evaluation periods.
Regarding the water use efficiency (A/E) ratio, no significant differences were observed in seedlings from both treatments until the 23rd day of evaluation (Figure 3C). After the 35
th day, fluctuations in the average A/E of
the seedlings under water deficit were observed, indicating values lower than those observed in the controls until the end of the evaluation period, with the exception of day 65 (2.9 µmol CO2/mmol H2O) when a higher A/E was observed in stressed seedlings than in control seedlings.
The mean internal CO2 concentration (Ci) fluctuated during the whole experiment (Figure 4A). The stressed seedlings showed a significant increase in concentration of this gas at the 9th day of suspension of irrigation (322 μmol mol
−1), a behavior that was also observed on the
38th and 65th days, averaging 326 μmol mol−1
, until the end of the experiment. It is worthwhile to note that the 28th and 65th days were when the seedlings under stress showed photosynthesis rates close to zero, in addition to showing the biggest reductions in transpiration and stomatal conductance.
The mean values of instantaneous carboxylation efficiency (A/Ci) were similar in both treatments until the 23rd day (Figure 4B). However, the plants under water stress showed a marked decline until the 28th day (0.014 μmol m
−2 s
−1/μmol mol
−1) during the first DR cycle, and in
the second cycle, this reduction was most pronounced on the 65th day (0.001 μmol m
−2 s
−1/μmol mol
−1) regardless
of the re-establishment of irrigation, and this condition was maintained until the end of the experiment.
The stressed seedlings showed significant reductions in stomatal conductance (Gs) from the 23rd to the 27th day in the first D/R cycle, when rehydration then occurred and a rapid recovery was observed (Figure 4C).
However, in the second cycle this reduction was noticeable from the 38th until the 65th day. The observed behavior denotes slow recovery following rehydration and, in both cycles, the levels detected remained below control levels until the 137th day of evaluation, suggesting that the stomata of this species need time to recover their hydration and/or the leaves their water potential.
With respect to the intrinsic water-use efficiency (A/Gs), the means observed showed oscillations during the whole evaluation period, but a trend was observed in which the values were higher in stressed seedling, except on days 9 and 38 (Figure 4D), when they were significantly reduced, averaging 16.03 and 26.95 µmol CO2/mol H2O, respectively.
With respect to the chlorophyll index (SPAD), a significant interaction was observed between the irrigation strategies and the evaluation periods (Figure 5A). The seedlings under water deficit showed reductions in chlorophyll index in the periods referring to the first D/R cycle, second P0 cycle, and second D/R cycle. After 90 days of rehydration, no difference was observed in the stressed seedlings compared to the control.
Generally, chlorophyll a fluorescence parameters were influenced by the interaction between the treatments (Figure 5), with the exception of the initial fluorescence (F0), which did not significantly differ between the periods evaluated, with an average of 0.274 electrons quantum
−1,
but was higher in the seedlings under stress when compared to control seedlings (Figure 5B).
Maximum fluorescence (Fm) and variable fluorescence (Fv) were negatively influenced by water deficit (Figures 5C and D), which led to significant reductions during the first P0 and second P0, with the Fm averaging 0.597 and

Bento et al. 2779
Figure 3. Photosynthetic rate - A (A), transpiration rate - E (B), water use efficiency - A/E (C) depending on the evaluation days between irrigated seedlings Campomanesia xanthocarpa and subject to conditions water stress.
0.590 electrons quantum
−1 and the Fv 0.276 and 0.287
electrons quantum−1
. After 90 days rehydration, stressed seedlings differed from the control, showing an increase in Fm and Fv (Figures 5C and D).
The quantum efficiency of photosystem II (Fv/Fm) was reduced as a consequence of the stress caused by water deficiency. The lowest values (0.431 and 0.435 electrons quantum
−1) occurred in the periods during which the
seedlings reached null photosynthesis (Figure 5E),
however in the second rehydration (R) the seedlings
previously under stress showed significant recovery for this trait (0.431 and 0.435 electrons quantum
−1), which
was maintained until the end of the evaluation. The same response behavior was observed for the
effective absorbed energy conversion efficiency of the photosystem II (Fv/F0) as for Fv/Fm (Figure 5E), in which this variable recovered in the second R (3993.16 electrons quantum
−1) (Figure 5F).

2780 Afr. J. Agric. Res.
Figure 4. Mean values of internal CO2 concentration - Ci (A), instantaneous carboxylation efficiency of CO2 -A/Ci (B), stomatal conductance - Gs (C) and intrinsic efficiency of water use - A/Gs (D) in the light of day evaluation of seedlings irrigated Campomanesia xanthocarpa and under water stress conditions

Bento et al. 2781
Figure 5. Chlorophyll index (A), F0 - minimum fluorescence (B); Fm - maximum fluorescence (C); Fv - variable fluorescence (D); Fv/Fm - quantum efficiency of photosystem II (E) and Fv/F0 - efficiency of photosystem effective the absorbed energy conversion (F) of seedlings Campomanesia xanthocarpa in function water regimes. Small letters compare treatments (stressed and control) and capital letters compare control and capital letters in italics compare the stressed seedlings within the evaluation periods.
DISCUSSION C. xanthocarpa seedlings under water restriction showed a reduction in water potential (Ψw), reaching a mean
value of −2.4 MPa when the photosynthesis rate was lowered to values close to zero, along with the loss of turgidity in the leaves (Figure 2). These Ψw values are considered critical for ligneous plants of the Cerrado

2782 Afr. J. Agric. Res. (Franco et al., 2005), and are sufficient to promote alterations in content and in the free energy of the water in the soil and in the plants. This reduction subsequently affects physiological processes, initially interrupting cell expansion, introducing stomatal closure, lowering photosynthesis, in addition to interfering in various other basic metabolic processes such as synthesis and degradation of carbohydrates and proteins, and the accumulation of solutes, which will have an impact on plant growth and productivity (Kumar and Sing, 1998).
Following rehydration, the Ψw of the seedlings previously kept under water restriction, recovered and reached values close to the control. However, the values observed both for the irrigated seedlings as well as for those maintained under water restriction remained above levels considered critical (−1.5 MPa) until the end of the experiment, which could have affected photosynthesis in field conditions (Da Matta et al., 2007). This fact is probably related to the lower relative air humidity (Figure 1) observed in the days around the evaluation periods, promoting water loss by the leaves. Environmental factors are known to not only act directly on water loss, but they can also act indirectly by controlling stomatal behavior, as is the case of air humidity (Seixas, 2009).
The initial decrease in photosynthesis, accompanied by stomatal conductance (Gs) and increase in internal CO2 concentration (Ci) after the suspension of irrigation on day 23, suggests that stomatal restriction is initially responsible for the reduction in CO2 uptake in the seedlings during the first days of water deficiency (Figure 3 and 4). This occurs because of the partial closure of the stomata, controlled either by dehydration of the guard cells or by hormonal response, which restricts water loss in the leaves due to transpiration. Our experiment showed that transpiration had already reduced significantly by the 13
th day. At the same time, the partial
closure of the stomata leads to a drop in CO2 entry and assimilation, thus compromising the photosynthetic process (Magalhães et al., 2008; Araújo and Deminicis, 2009).
However, even under low Gs values, it was observed that during the longest stress period, when the photosynthesis rate was near zero, the stressed seedlings presented levels of internal CO2 concentration similar to those of irrigated seedlings in the first D/R cycle, and an increase in the concentration of this gas in the second cycle (Figure 3). This behavior indicated that other factors influence CO2 uptake. Further, it suggests the presence of chemical signals in the plants, such as abscisic acid, which control the stomatal opening during drought periods (Hirayama and Shinozaki, 2010; Oliveira et al., 2011). It constitutes a strategy used by the plants to reduce excessive water loss due to transpiration (Albuquerque et al., 2013) and therefore avoiding tissue dehydration, in addition to permitting the maintenance of the integrity of the water transport system and the development of water potential, when the soil is
undergoing progressive drought (Magalhães et al., 2008).
Similarly, the reduction in transpiration rate (E), an anticipated effect to the low Gs and the action of intrinsic factors (abscisic acid) was also demonstrated through the instantaneous water-use efficiency, which remained similar to the control during the first days of suspension of irrigation, until the 23
rd day (Figura 3A, B). This occurs
because instantaneous water-use efficiency (A/E) can increase when water deficiency is first established, since the partial closure of the stomata has a stronger effect on the exit of water molecules than on the quantity of CO2 fixed (Pompelli et al., 2010; Silva et al., 2010).
It has been proposed that both stomatal (resistance to CO2 entry) and non-stomatal factors (low enzymatic activity for CO2 assimilation) may be the main causes for the reduction in carbon assimilation, reflecting changes in stomatal conductance patterns and internal carbon (Farquhar and Sharkey, 1982; Mielke et al., 2003; Herrera et al., 2008). Additionally, non-stomatal limitations gradually progress with the intensity and duration of the water stress, such as the decrease in RuBisCo activity, CO2 availability in the chloroplast and photochemical efficiency of PSII (Flexas et al., 2006; Xu et al., 2009).
As such, the drop in photosynthesis in C. xanthocarpa seedlings can be attributed to the initial reduction in stomatal conductance associated with the reduction in CO2 carboxylation efficiency (A/Ci) by RuBisCo (Figure 4B) as the duration and intensity of the stress increased. Values below 0.05 mol m
−2 s
−1, observed in this study,
are indicative of severe water deficit and are accompanied by non-stomatal limitations (Medrano et al., 2002; Sircelj et al., 2007) such as damage to the photochemical apparatus, through thylakoid membrane de-structuring (Dias and Bruggermann, 2010), and reduction in the activity of enzymes involved in photosynthetic reactions, such as RuBisCo, leading to the interruption of photosynthetic processes (Tang et al., 2002; Ghannoum et al., 2003; Liu et al., 2014).
The capacity of the plants to recover their photosynthetic rate (A) following rehydration is of fundamental importance. This, along with their capacity to avoid and/or withstand water stress represent the resistance of the plants to drought, in addition to its ability to prevent decrease in productivity of plant cultivations (Chaves et al., 2009; Pinheiro and Chaves, 2011).
Following rehydration, total recovery of carbon assimilation by the seedlings was observed in the first D/R cycle; however, this recovery was partial in the second cycle, with 70% recovery in relation to the seedlings maintained under irrigation (Figure 3B). Usually, plants submitted to water stress present a maximum photosynthetic rate recovery of 40–60% after rehydration, whereby the recovery continues in the following days, yet the maximum photosynthesis rate is not always reached (Flexas et al., 2004; Sofo et al., 2004; Souza et al., 2004). This occurs because the carbon gain

obtained during the period of water stress and rehydration may depend on both the speed and degree of photosynthetic recovery, as well as on the degree and speed of the decline in photosynthesis during low water availability (Flexas et al., 2006; Xu et al., 2009).
In the case of the C. xanthocarpa seedlings, a total recovery of A in seven days is considered to be fast. This was similar to observations recorded for Hancornia speciosa Gomes (Scalon et al., 2015), Myracrodruon urundeuva Allemão (Costa et al., 2015), Khaya ivorensis A. Chev (Albuquerque et al., 2013), Eucalyptus and Acacia spp. (Warren et al., 2011), Tabebuia aurea S. Manso (Oliveria et al., 2011), and Carapa guianensis Fusée-Aublet (Gonçalves et al., 2009) seedlings. For other species, the recovery of photosynthetic traits occurred only after fourteen days after rehydration (Calbo and Moraes, 2000).
As the stress prolonged, C. xanthocarpa seedlings showed a marked decrease in Gs (from the 23
rd day of
suspension of irrigation) (Figure 4C), leading to reduction in A due to the low intracellular CO2 concentrations (Ci) and the inhibition of foliar metabolism (non-stomatal factors) (Ben et al., 2009; Ashraf, 2010). Such reductions in A were reflected in lower A/E for the stressed seedlings, in which they remained at levels below those of the control, even after rehydration, throughout the experimental period.
In some species, the maintenance of lower stomatal conductance following rehydration imposes a substantial limitation for photosynthesis (Gallé and Feller, 2007; Galmés et al., 2007) and transpiration recovery. In the present work, it was possible to observe such behavior, since even after seven days of rehydration the recovery of stomatal conductance was partial and lower in both D/R cycles when compared to the irrigated seedlings, reaching a maximum of 63% (Figure 3C).
Similar results to those obtained for C. xanthocarpa were observed in other species. In H. speciosa, stomatal conductance recovery (63%) occurred six days after rehydration, yet at lower levels when compared to irrigated plants, suggesting that the stomata in those species are slow in recuperating hydration (Scalon et al., 2015). Likewise, 60% recovery of stomatal conductance was observed in Populus euphratica after six days of rehydration (Bogeat-Triboulot et al., 2007), while in Bactris gasipaes Kunth seedlings, 50% recovery of stomatal conductance occurred three days after water was added back to the soil (Oliveira et al., 2002).
In the case of C. xanthocarpa seedlings, considering that the recovery of stomatal conductance was partial and lower when compared to the control, it is noteworthy that, such recovery was much slower in the second D/R cycle, suggesting that prolonged stress on the seedlings may have created water tension in the xylem, which affected the water transport system. According to Manzoni et al. (2012), both stomatal as well as xylem conductance are reduced when water is limiting, in
Bento et al. 2783 comparison to well-hydrated plants. This is because, the regulation of foliar water conductance depends on cavitations and on the recovery of xylem vessels, and these vessels are more sensitive in leaf veins (Cochard et al., 2002). Under water stress, chlorophyll levels in the leaves may be reduced, which will affect photosynthesis (Din et al., 2011; Asharaf and Harris, 2013).
In the present study, maintenance of chlorophyll levels in the seedlings grown under suspension of irrigation during one of the periods of higher stress (1° F0) may have been due to the lower hydration state of the cells in the leaves. This could have caused the pigment to concentrate and contribute to a higher chlorophyll quantification, thus masking the effect of the stress, while explaining the observed reduction in photosynthetic rate in the same period.
However, in the first D/R, the stressed seedlings showed reduction in chlorophyll levels, which was also observed in the second P0 and second
D/R, indicating
that the water deficit led to a reduction in the efficiency of the photosynthetic apparatus, which was maintained even after irrigation was re-established. These data usually result from the degradation of chlorophyll molecules or from impaired chlorophyll synthesis (Dalmolin, 2013). The reduction in chlorophyll index in C. xanthocarpa seedlings seems to have occurred in a more pronounced way as the result of reduced pigment synthesis, since yellowing of the leaves, a typical indication of chlorosis resulting from chlorophyll degradation, was not observed. Meanwhile, in these seedlings, the chlorophyll levels were recovered 90 days after rehydration.
The increase in initial photosynthesis (F0) in the seedlings cultivated under suspension of irrigation indicates that the functionality of the photosynthetic apparatus is compromised, as a consequence of damage to the reaction center of photosystem II (PSII) or the reduction of the capacity of excitation energy transfer from the antenna to the reaction center (Maxwell and Johnson, 2000; Baker, 2008). With the decrease in chlorophyll content in the leaves, it is believed that a lower amount of energy was absorbed by the antenna complex, meaning it was not transmitted, causing increased alterations in the photosynthetic capacity because of the stress caused by water deficiency.
In addition, the photochemical quantum efficiency of PSII (Fv/Fm) also decreased as a function of the water deficit, averaging 0.433 electrons quantum
−1, suggesting
the occurrence of photo-inhibitory damage to the reaction centers of PSII (Figure 5). When intact, the observed values of Fv/Fm remained between 0.75 and 0.85 electrons quantum
−1 (Baker and Rosenqvst, 2004). Under
severe water stress, plants frequently present a marked photo-inhibitory effect characterized by a significant decrease in quantum yield (Araújo and Deminicis, 2009). The damage to the photosynthetic apparatus occurs due to photo-oxidation of D1 proteins in the PSII, which are

2784 Afr. J. Agric. Res. localized in the thylakoid membranes and show high sensitivity to oxygen reactive species, produced during the photochemical stage of photosynthesis (Biswall et al., 2011) which increase due to water deficit. This is proved by the reduction in Fm and the reduction in electron flux between the photosystems (Tatagiba et al., 2014) and confirmed by the decrease in Fv during the periods of increased water stress (1° P0 and 2° P0).
Similarly, the Fv/F0 ratio was reduced, with the mean value observed (0.901 electrons quantum
−1) being much
lower than 4 to 6 electrons quantum−1
, the levels at which the functionality of the reaction centers of PSII are preserved when facing water stress (Rohácek, 2002). As such, the values verified for the ratio Fv/F0 confirm the damage to the photosynthetic apparatus, since this ratio has been widely used to amplify small variations detected in Fv/Fm (Reis and Campostrini, 2011), being an indicator more sensitive to perturbations in PSII functionality.
At the end of the 90 days after re-establishment of irrigation, the plants previously submitted to stress presented normal PSII functionality, evidenced by the recovery in Fv/Fm and Fv/F0 ratios, demonstrating that the damage caused by water stress was reversible. However, the time spent in this recovery indicates that the type of photo-inhibition developed by the stressed seedlings was chronic, in which the lower water content in the leaves, damages the photosynthetic system by intensifying the damage from light exposure. This in turn reduces the quantum efficiency and the maximum photosynthetic rate, exhibiting effects with relatively long duration, persisting for weeks or months (Taiz and Zeiger, 2013).
Conclusion
C. xanthocarpa shows a reduction in stomatal conductance as the first line of defense against water deficit; however, as the intensity and duration of the stress increase, non-stomatal factors are observed, presenting a reduction in photosystem PSII efficiency, which is repaired after irrigation is resumed. Water deficit decreases the water potential in the leaves and all the traits of the photosynthetic metabolism in C. xanthocarpa seedlings in twenty days of suspension of irrigation. These are later recovered with the re-establishment of the water supply.
However, exposure of the seedlings to a second cycle of water deficit during the evaluation period demonstrated that the metabolism traits do not re-establish equilibrium.
Conflict of Interests
The authors have not declared any conflict of interests.
ACKNOWLEDGEMENTS The authors acknowledge the Foundation for the
Development of Education, Science and Technology of the State of Mato Grosso do Sul (FUNDECT) and the Coordination for the Improvement of Higher Education Personnel (CAPES). REFERENCES Albuquerque MPF, Moraes FKC, Santos RIN, Castro GLS, Ramos
EMLS, Pinheiro HA (2013). Ecofisiologia de plantas jovens de mogno-africano submetidas à deficit hídrico e reidratação. Pes. Agrop. Bras. 48(1):9-6.
Araújo SAC, Deminicis BB (2009). Fotoinibição da Fotossíntese. Rev. Bras. Biociênc. 7(4):463-472.
Asharaf M, Harris PJC (2013). Photosynthesis under stressful environments: An overview. Photosynthetica 51:163-190.
Ashraf M (2010). Inducing drought tolerance in plants: some recent advances. Biotechnol. Adv. 28:169-183.
Baker NR (2008). Chlorophyll fluorescence: a probe of photosynthesis in vivo. Ann. Rev. Plant. Biol. 59:89-113.
Baker NR, Rosenqvst E (2004). Applications of chlorophyll fluorescence can improve crop production strategies: an examination of future possibilities. J. Exp. Bot. 55(403):1607-1621.
Ben AC, Ben Rouina B, Sensoy S, Boukhris M, Ben Abdallah F (2009). Changes in gas exchange, proline accumulation and antioxidative enzyme activities in three olive cultivars under contrasting water availability regimes. Environ. Exp. Bot. 67:345-352.
Biswal BPN, Joshi MK, Raval UCB (2011). Photosynthesis, a global sensor of environmental stress in green plants: stress signaling and adaptation. Curr. Sci. 101:47-56.
Bogeat-Triboulot MB, Brosché M, Renaut J, Jouve L, Le Thiec D, Fayyaz P, Vinocur B, Witters E, Laukens K, Teichmann T, Altman A, Hausman JF, Polle A, Kangasjärvi J, Dreyer E (2007). Gradual soil water depletion results in reversible changes of gene expression, protein profiles, ecophysiology, and growth performance in Populus euphratica, a poplar growing in arid regions. Plant Physiol. 143:876-892.
Calbo MER, De Moraes JAPV (2000). Efeitos da deficiência de água em plantas de Euterpe oleracea (açaí). Rev. Bras. Bot. 23(3):225-230.
Carvalho Filho JLS, Arrigoni-Blank MF, Blank AF, Rangel MAS (2003). Produção de mudas de jatobá (Hymenaea courbaril L.) em diferentes ambientes, recipientes e composições de substratos. Cerne 9(1):109-118.
Chaves MM, Flexas J, Pinheiro C (2009). Photosynthesis under drought and salt stress: regulation mechanisms from whole plant to cell. Ann. Bot. 103:551-560.
Cochard H, Coll L, Le Roux X, Ameglio T (2002). Unraveling the Effects of Plant Hydraulics on Stomatal Closure during Water Stress in Walnut. Plant Physiol. 128:282-290.
Costa AS, Freire ALO, Bakke IA, Pereira FHF (2015). Respostas fisiológicas e bioquímicas de plantas de aroeira (Myracrodruon urundeuva Allemão) ao déficit hídrico e posterior recuperação. Irriga 20(4):705-717.
Da Matta FM, Ronchi CP, Maestri M, Barros RS (2007). Ecophysiology of coffee growth and production. Braz. J. Plant Physiol. 19(4):485-510.
Dalmolin AC (2013). Relações hídricas, trocas gasosas e anatomia foliar de Vochysia divergens pohl. espécie invasora no pantanal mato-grossense. Tese (Doutorado em Física Ambiental) - Universidade Federal de Mato Grosso, Cuiabá-MT. 106 f.
Dias MC, Bruggemann W (2010). Limitations os photosynthesis in Phaseolus vulgaris under drought stress: gas exchange, chlorophyll fluorescence and Calvin cycle enzymes. Photosynthetica 48(1):96-102.
Din J, Khan SU, Ali I, Gurmani AR (2011). Physiological and agronomic response of canola varieties to drought stress. J. Anim. Plant Sci. 21:78-82.
Farquhar GD, Sharkey TD (1982). Stomatal Conductance and Photosynthesis. Ann. Rev. Plant Physiol. 33(1):317-345.
Flexas J, Bota J, Cifre J, Mariano Escalona J, Galmes J, Gulias J, Lefi

K, Martinez-Canellas F.S, Moreno T.M.; Ribascarbo M, Riera D, Sampol B, Medrano H (2004). Understanding down-regulation of photosynthesis under water stress: future prospects and searching for physiological tools for irrigation management. Ann. Appl. Biol. 144(3):273-283.
Flexas J, Ribas-Carbó M, Bota J, Galmés J, Henkle M, Martínezcañellas S, Medrano H (2006). Decreased Rubisco activity during water stress is not induced by decreased relative water content but related to conditions of low stomatal conductance and chloroplast CO2 concentration. New Phytol. 172(1):73-82.
Franco AC, Bustamante M, Caldas LS, Goldstein G, Meinzer FC, Kozovits AR, Rundel P, Corandin VTR (2005). Leaf functional traits of Neotropical savanna trees in relation to seasonal water déficit. Trees 19:326-335.
Gallé A, Feller U (2007). Changes of photosynthetic traits in beech saplings (Fagus sylvatica) under severe drought stress and during recovery. Physiol. Plant 131:412-421.
Galmés J, Medrano H, Flexas J (2007). Photosynthetic limitations in response to water stress and recovery in Mediterranean plants with different growth forms. New Phytol. 175:81-93.
Ghannoum O, Conroy JP, Driscoll SP, Paul MJ, Foyeru CH, Lawlor DW (2003). Nonstomatal limitations are responsible for drought induced photosynthetic inhibition in four C4 species. New Phytol.159:599- 608.
Gonçalves JF C, Silva CEM, Guimarães DG (2009). Fotossíntese e potencial hídrico foliar de plantas jovens de andiroba submetidas à deficiência hídrica e à reidratação. Pesq. Agrop. Bras. 44:8-14.
Herrera A, Tezara W, Marín O, Rengifo E (2008). Stomatal and non-stomatal limitations of photosynthesis in trees of a tropical seasonally flooded forest. Physiol. Plant 134(1):41-48.
Hirayama T, Shinozaki K (2010). Research on plant abiotic stress responses in the postgenome era: past, present and future. The Plant J. Cell Mol. Biol. 61(6):1041-52.
Kumar A, Singh DP (1998). Use of physiological indices as a screening technique for drought to tolerance in oilseed Brassica species. Ann. Bot. 81(3):413-420.
Larcher W (2006). Ecofisiologia vegetal. São Carlos: Rima. 532 p. Liu ZB, Cheng RM, Xiao WF, Guo QS, Wang N (2014). Effect of off-
Season flooding on growth, photosynthesis, carbohydrate partitioning, and nutrient uptake in Distylium chinense. PloS One 9(9):1-9.
Lorenzi H (1992). Árvores brasileiras: manual de identificação e cultivo de plantas arbóreas nativas do Brasil. Nova Odessa: Plantarum 368p.
Magalhães Filho JR, Amaral LR, Machado DFSP, Medina CL, Machado EC (2008). Deficiência hídrica, trocas gasosas e crescimento de raízes em laranjeira “Valência” sobre dois tipos de porta enxerto. Bragantia 67(1):75-82.
Manzoni S, Vico G, Porporato A, Katul G (2012). Biological constraints on water transport in the soil–plant–atmosphere system. Adv. Water Res. 51:292-304.
Maxwell K, Johnson G (2000). Chlorophyll fluorescence-a practical guide. J. Exp. Bot. 51:659-668.
Medrano H, Escalona JM, Bota J, Gulías J, Flexas J (2002). Regulation of photosynthesis in C3 plants in response of progressive drought: stomatal conductance oas a reference parameter. Ann. Bot. 89:895-905.
Mielke MS, Almeida AAF, Gomes FP, Auilar AG, Mangabeira PAO (2003). Leaf gas exchange, chlorophyll fluorescence and growth responses of Genipa americana seedlings to soil flooding. Environ. Exp. Bot. 50(3):221-231.
Oliveira AKM, De Gualtieri SCJ, Bocchese RA (2011). Gas exchange of potted Tabebuia aurea plants under hydric stress. Acta Sci. Agron. 33(4):641-647.
Oliveria MAJ, Bovi MLA, Machado EC, Gomes MMA, Habermann G, Rodrigues JD (2002). Fotossíntese, condutância estomática e transpiração em pupunheira sob deficiência hídrica. Sci. Agric. 59:59-63.
Bento et al. 2785 Pinheiro C, Chaves MM (2011). Photosynthesis and drought: can we
make metabolic connections from available data? J. Exp. Bot. 62:869-882.
Pompelli MF, Barata-Luís R, Vitorino HS, Gonçalves ER, Rolim EV, Santos MG, Almeida-Cortez JS, Ferreira VM, Lemos EE, Endres L (2010). Photosynthesis, photoprotection and antioxidant activity of purging nut under drought deficit and recovery. Biomass Bioenergy 34(8):1207-1215.
Reis FO, Campostrini E (2011). Microaspersão de água sobre a copa: um estudo relacionado às trocas gasosas e à eficiência fotoquímica em plantas de mamoeiro. Rev. Bras. Agrociênc. 17:284-295.
Rohácek K (2002). Chlorophyll fluorescence parameters: the definitions, photosynthetic meaning, and mutual relationships. Photosynthetica 40(1):13-29.
Sakamoto A, Murata N (2002). The role of glycine betaine in the protection of plants from stress: clues from transgenic plants. Plant Cell Environ. 25:163-171.
Santos MS, Carneiro PIB, Wosiacki G, Petkowicz CLO, Carneiro EBB (2009). Caracterização físico-química, extração e análise de pectinas de frutos de Campomanesia xanthocarpa B. (Gabiroba). Ciênc. Agrár. 30:101-106.
Scalon SPQ, Kodama FM, Dresch DM, Mussury RM, Pereira ZV (2015). Gas exchange and photosynthetic activity in Hancornia speciosa Gomes seedlings under water deficit conditions and during rehydration. Biosci. J. 31:1124-1132.
Scholander PF, Hammel HT, Hemmingsen EA, Bradstreet ED (1964). Hydrostatic pressure and osmotic potential in leaves of mangroves and some other plants. P. Natl. Acad. Sci. USA 52:119-125.
Seixas GB (2009). Determinação da transpiração em plantas de Nim Indianos (Azadiracha Indica A. Juss) utilizando métodos de estimativa de fluxo de seiva. Dissertação (Mestrado em Física Ambiental) – Universidade Federal de Mato Grosso, MT 88 p.
Silva EN, Ferreira SLS, Fontenele AV, Ribeiro RV, Viégas RA, Silveria JAG (2010). Photosynthetic changes and protective mechanisms against oxidative damage subjected to isolated and combined drought and heat stresses in Jatropha curcas plants. J. Plant Physiol. 167:1157-1164.
Sircelj H, Tauszb M, Grill D, Batic F (2007). Detecting different levels of drought stress in apple trees (Malus domestica Borkh.) with selected biochemical and physiological parameters. Sci. Hortic. 113:362-369.
Sofo A, Dichio B, Xiloyannis C, Maisa A (2004). Effects of different irradiance levels on some antioxidant enzymes and on malondialdehyde content during rewatering in olive tree. Plant Sci. 166(2):293-302.
Souza RP, Machado EC, Silva JAB, Lagôa AMMA, Silveira, JAG (2004). Photosynthetic gas exchange, chlorophyll fluorescence and some associated metabolic changes in cowpea (Vigna unguiculata) during water stress and recovery. Environ. Exp. Bot. 51(1)45-56.
Taiz L, Zeiger E (2013). Fisiologia vegetal, 5ª edição Internacional. Ed. Artmed. 954p.
Tang AC, Kawamitsu Y, Kanechi M, Boyer JS (2002). Photosynthetic oxygen evolution at low water potential in leaf discs lacking an epidermis. Ann. Bot. 89:861-870.
Tatagiba SD, Moraes GABK, Nascimento KJT, Peloso AF (2014). Limitações fotossintéticas em folhas de plantas de tomateiro submetidas a crescentes concentrações salinas. Rev. Eng. Agric. 22:138-149.
Warren CR, Aranda I, Cano FJ (2011). Responses to water stress of gas exchange and metabolites in Eucalyptus and Acacia spp. Plant Cell Environ. 34:1609-1629.
Xu Z, Zhou G, Shimizu H (2009). Are plant growth and photosynthesis limited by predrought following rewatering in grass? J. Exp. Bot. 60(13):37-49.

Vol. 11(30), pp. 2786-2795, 28 July, 2016
DOI: 10.5897/AJAR2016.11141
Article Number: 4E1ABBB59770
ISSN 1991-637X
Copyright ©2016
Author(s) retain the copyright of this article
http://www.academicjournals.org/AJAR
African Journal of Agricultural Research
Full Length Research Paper
Growth analysis of sugarcane inoculated with diazotrophic bacteria and nitrogen fertilization
Renan O. Pedula1, Nivaldo Schultz1, Rafael C. Monteiro1, Willian Pereira1, Adelson P. de Araújo1, Segundo Urquiaga2 and Veronica M. Reis2*
1Universidade Federal Rural do Rio de Janeiro, Km 07 BR 465, Seropédica - Rio de Janeiro, Brazil.
2Embrapa Agrobiologia, Km 07 BR 465, Seropédica - Rio de Janeiro, Brazil.
Received 20 April, 2016; Accepted 24 June, 2016
The use of inoculants containing growth-promoting diazotrophic bacteria can stimulate mass and nutrient accumulation in sugarcane. The purpose of this study was to evaluate plant growth and accumulation of macroelements in sugarcane, variety RB92579, under bacterial inoculation with or without N fertilization. The field experiment was carried out in a Red-Yellow Podzolic soil in Seropédica, RJ, in a randomized block design with four replications. The treatments consisted of 50 kg N ha
-1; 50 kg
N ha-1
+ inoculation; inoculation; and an absolute control. The following bacteria were inoculated: Gluconacetobacter diazotrophicus, Herbaspirillum seropedicae, Herbaspirillum rubrisubalbicans, Azospirillum amazonense, and Burkholderia tropica. The plants were sampled at 100, 130, 168, 212, 261, and 295 days after planting (DAP), and growth and nutrient accumulation rates were estimated by functional analysis of plant growth. Nutrient accumulation rates were highest around 180 DAP for N and P, and around 160 DAP for K, in the different treatments, preceding the maximal crop growth rate (between 210 and 220 DAP). The accumulation of biomass, N, P and K was greater and crop growth rates were higher in the treatments with bacterial inoculation fertilized or not with 50 kg N ha
-1,
compared with the control. Key words: Saccharum species, inoculum, growth promotion.
INTRODUCTION The release of new sugarcane varieties contributed to this increase in cultivated area and productivity. The selection of varieties was based on various parameters related to growth patterns, e.g., shoot dry matter accumulation throughout the cycle. In the case of sugarcane, this pattern is represented by a sigmoid curve which shows an initial phase of slow growth followed by
an exponential growth phase and finally maturation, when growth becomes slow and eventually stagnant (Oliveira et al., 2010).
Nitrogen is one of the most required nutrients for sugarcane growth, along with potassium. The N fertilizer rates used on Brazilian fields are on average 40 kg ha
-1 N
for plant cane and 80 kg ha-1
N for ratoon crops (Nunes
*Corresponding author. E-mail: [email protected].
Author(s) agree that this article remain permanently open access under the terms of the Creative Commons Attribution
License 4.0 International License
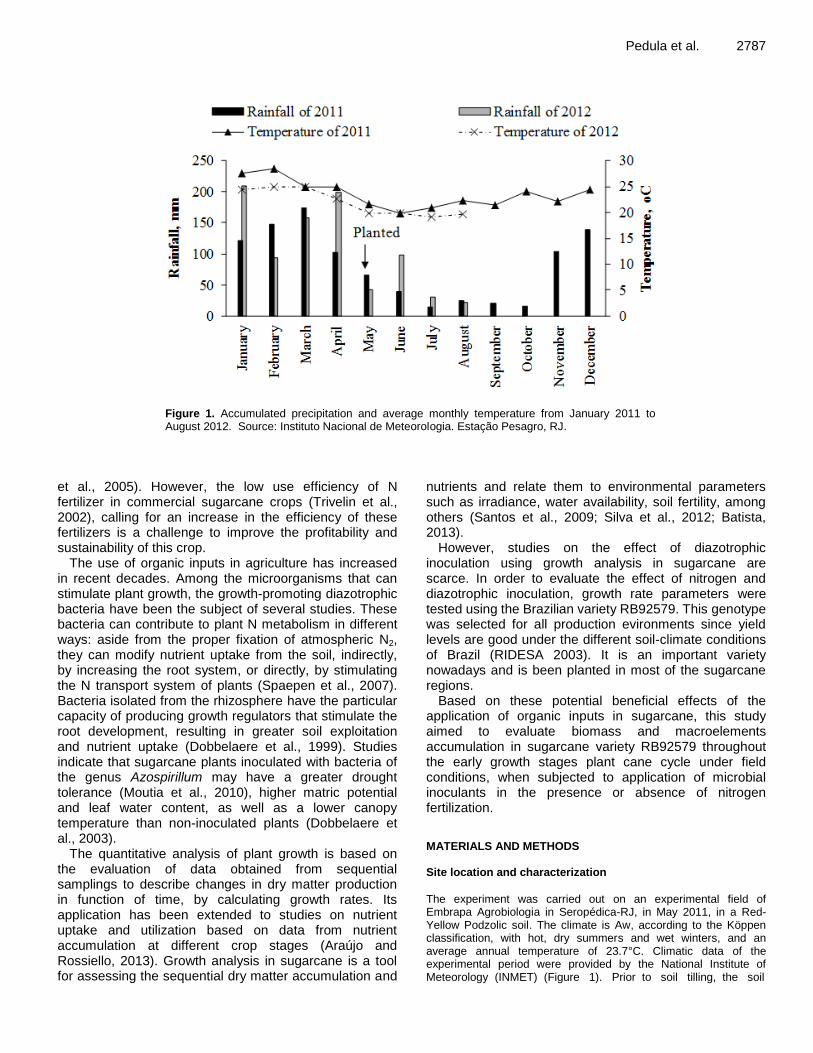
Pedula et al. 2787
Figure 1. Accumulated precipitation and average monthly temperature from January 2011 to August 2012. Source: Instituto Nacional de Meteorologia. Estação Pesagro, RJ.
et al., 2005). However, the low use efficiency of N fertilizer in commercial sugarcane crops (Trivelin et al., 2002), calling for an increase in the efficiency of these fertilizers is a challenge to improve the profitability and sustainability of this crop.
The use of organic inputs in agriculture has increased in recent decades. Among the microorganisms that can stimulate plant growth, the growth-promoting diazotrophic bacteria have been the subject of several studies. These bacteria can contribute to plant N metabolism in different ways: aside from the proper fixation of atmospheric N2, they can modify nutrient uptake from the soil, indirectly, by increasing the root system, or directly, by stimulating the N transport system of plants (Spaepen et al., 2007). Bacteria isolated from the rhizosphere have the particular capacity of producing growth regulators that stimulate the root development, resulting in greater soil exploitation and nutrient uptake (Dobbelaere et al., 1999). Studies indicate that sugarcane plants inoculated with bacteria of the genus Azospirillum may have a greater drought tolerance (Moutia et al., 2010), higher matric potential and leaf water content, as well as a lower canopy temperature than non-inoculated plants (Dobbelaere et al., 2003).
The quantitative analysis of plant growth is based on the evaluation of data obtained from sequential samplings to describe changes in dry matter production in function of time, by calculating growth rates. Its application has been extended to studies on nutrient uptake and utilization based on data from nutrient accumulation at different crop stages (Araújo and Rossiello, 2013). Growth analysis in sugarcane is a tool for assessing the sequential dry matter accumulation and
nutrients and relate them to environmental parameters such as irradiance, water availability, soil fertility, among others (Santos et al., 2009; Silva et al., 2012; Batista, 2013).
However, studies on the effect of diazotrophic inoculation using growth analysis in sugarcane are scarce. In order to evaluate the effect of nitrogen and diazotrophic inoculation, growth rate parameters were tested using the Brazilian variety RB92579. This genotype was selected for all production evironments since yield levels are good under the different soil-climate conditions of Brazil (RIDESA 2003). It is an important variety nowadays and is been planted in most of the sugarcane regions.
Based on these potential beneficial effects of the application of organic inputs in sugarcane, this study aimed to evaluate biomass and macroelements accumulation in sugarcane variety RB92579 throughout the early growth stages plant cane cycle under field conditions, when subjected to application of microbial inoculants in the presence or absence of nitrogen fertilization.
MATERIALS AND METHODS Site location and characterization
The experiment was carried out on an experimental field of Embrapa Agrobiologia in Seropédica-RJ, in May 2011, in a Red-Yellow Podzolic soil. The climate is Aw, according to the Köppen classification, with hot, dry summers and wet winters, and an average annual temperature of 23.7°C. Climatic data of the experimental period were provided by the National Institute of Meteorology (INMET) (Figure 1). Prior to soil tilling, the soil

2788 Afr. J. Agric. Res. chemical properties in the 0 to 20 cm layer were analyzed with the following results: pH (H2O) 5.7; 0.1 cmolc dm-3 Al; 2.7 cmolc dm-3 Ca; 1.3 cmolc dm-3 Mg; 45 mg L-1 K and 18 mg L-1 P. In the 20 to 40 cm layer: pH (H2O) 5.3; 0.1 cmolc dm-3 Al; 2.0 cmolc dm-3 Ca; 0.8 cmolc dm-3 Mg; 26 mg L-1 K, and 5.5 mg L-1 P. Soil tillage consisted of plowing, harrowing and liming with 1 Mg ha-1 dolomitic limestone, incorporated by disking, followed by planting after 45 days. Planting fertilization was based on soil chemical analysis and crop nutrient requirements, as described by Rossetto et al. (2013). At the bottom of the furrow, 120 kg ha-1 P2O5 was applied as single superphosphate, 40 kg ha-1 of micronutrients as Fritted Trace Elements (FTE BR-12) and 0.4 kg ha-1 of ammonium molybdate at planting, and 160 kg ha-1 K2O as potassium chloride, 50% at the bottom of the furrow at planting and 50% after 60 days. Nitrogen was fertilized at planting in a single application at the bottom of the planting furrow, in the form of urea.
The variety RB92579 used in the study has an upright growth habit, leaves with curved ends and wide limb, low flowering, a slow growth rate, average maturation, high sucrose content, as well as good sprouting, high tillering in plant cane, good canopy closure, and is equally suited for all production environments (RIDESA, 2003).
The experiment was arranged in a randomized block design with four replications, with four treatments: fertilization with 50 kg N ha-1
as urea, 50 kg N ha-1 + inoculation, inoculation, and a control with no N fertilization or inoculation. The experimental plot consisted of four 4 m long rows spaced 1.2 m apart. The seedlings for planting (cuttings with three buds) were inoculated in the field at planting, as described by Schultz et al. (2012). Inoculation procedure The inoculated diazotrophic bacteria species were Gluconacetobacter diazotrophicus (PAL5T
= BR11281), Azospirillum amazonense (Cbamc = BR11145), Herbaspirillum seropedicae (HRC54 = BR11335), Herbaspirillum rubrisubalbicans (HCC103 = BR11504) and Burkholderia tropica (PPe8T = BR 11366), previously selected by Oliveira et al. (2003, 2006). To obtain the inoculum, bacteria from the collection of diazotrophic bacteria of Embrapa Agrobiologia (with initials BR) were subcultured on DYGS medium (Baldani et al., 2014). The inoculum solution was prepared by diluting 100 ml of medium containing 109 cells ml-1 in 100 L of clean water. All strains with this bacterial density were mixed at planting. Cuttings (plantlets) with three buds were placed in raffia bags according to the quantity required per crop row (15 buds per meter), immersed for 30 min in the inoculum suspension in 200 L containers and left to stand under natural shade for 60 min after inoculation. Data analysis of growth rate Six biomass samples were taken monthly from August 2011 to February 2012 (100, 130, 168, 212, 261, and 295 days after planting). At each evaluation, the plants growing along 1 m of the two center rows per plot were sampled. Within each evaluated plant row, an internal boundary of 0.5 m between each sampled meter was established, resulting in three samplings per row.
The leaf area was determined for the leaf blades on the representative stems of the clump of stalks (main stems), by counting the number of green leaves (fully expanded leaves with a minimum of 20% green area, counted from leaf zero and the measurements made on leaf blade +3, which is the first leaf blade with open ligule (Casagrande, 1991). The length and width of the middle portion of leaf blade +3 was measured according to the methodology described by Hermann and Hall (1999). The leaf area was estimated by the expression LA = L × W × 0.75 × (N+2), where
LA is the leaf area per stem, L is the length of leaf blade +3, W is the width of leaf blade +3, 0.75 - form factor, and N is the number of open leaves with a green area of at least 20% (leaf blade 0 to +7). The leaf area index (LAI) was obtained (in m² m-²) based on the leaf area per tiller and number of tillers per m2 area, according to the methodology used by Larcher (2000).
After each sampling, the plants were separated into stem, straw and flag leaf (green leaves). The samples were dried in a circulating-air oven at 65°C during 2 to 3 days until it reached constant weight. The material was ground and sent to a laboratory to determine the N, K, P, Ca and Mg concentrations (Nogueira and Souza, 2005). Nutrient accumulation in biomass was calculated as the product of the nutrient concentration by the dry weight of the material per unit of land area.
To compute the rates of growth and nutrient accumulation, the method of functional plant growth analysis was applied (Araújo and Rossiello, 2013). The data of biomass, leaf area index and nutrient accumulation, with replications, were adjusted by linear regression to a second degree exponential polynomial, W = exp (a + bT + cT2), which was linearized by ln W = a + bT + cT2, where W corresponds to the observed data, T to the time in days after planting, and a, b and c to the coefficients obtained by regression. The second degree exponential polynomial model was chosen due to the observed R2 (greater than 70%), the simplicity of the model and the appropriate biological significance of the curves obtained.
From the functions fitted to the primary data, the functions corresponding to the instantaneous growth rates were derived, e.g. crop growth rate, net assimilation rate and absolute nutrient accumulation rate (Hunt, 1982; Araújo and Rossiello, 2013). The crop growth rate (CGR) represents the variation in dry matter accumulation by the crop per unit land area in a time interval, the net assimilation rate (NAR) is the increase in dry matter per unit leaf area and time and the absolute rates of nutrient accumulation represent the variation in the nutrient amount accumulated by the crop per unit land area and time.
Analysis of variance of primary data was performed as a factorial design between N sources and sampling dates, considering the evaluation times as subplots (Araújo, 2003). Due to the heteroscedasticity, the original data were transformed into natural logarithms prior to analysis of variance (Araújo, 2003).
RESULTS The analysis of variance of natural-log transformed data indicated significant effects of interactions between N sources and sampling dates for data of accumulation of biomass, N, P, K, Ca, and Mg in the shoots. This indicates that the evaluated N sources modified the patterns of accumulation of biomass and nutrients by sugarcane plants and therefore the growth and nutrient accumulation rates (Araújo, 2003). The coefficients of the second degree exponential polynomial models fitted to the primary data in the four treatments are presented in Table 1. The R
2 values of the model ranged from 0.91 to
0.97 for shoot biomass, from 0.69 to 0.80 for leaf area index, and were consistently above 0.80 for shoot nutrient accumulation, indicating an adequate fit to the primary data.
The curve of shoot biomass accumulation of variety RB92579 indicated that the months of the highest vegetative growth (Figure 2a) coincided with the summer months (between 200 and 250 DAP). This intensified growth was accompanied by greater leaf production, as

Pedula et al. 2789
Table 1. Coefficients of the polynomial exponential second order models (ln W = a + bt + ct2) fitted to the data of shoot dry matter, leaf area index, and accumulation of nitrogen, phosphorus, potassium, calcium and magnesium in shoots in sugarcane under four treatments of inoculation and nitrogen fertilization.
Coefficent 50 kg ha-1
N Inoculation 50 kg ha-1
N + Inoculation Control
Shoot dry matter
A 3.01616 2.08679 2.64622 1.99155
B 0.03155 0.042002 0.036924 0.039941
C -4.60783 e-5 -7.07358 e-5 -5.85386 e-5 -6.36908 e-5
R2
0.97655 0.97183 0.97497 0.91577
Leaf area index
A -2.66629 -2.62893 -3.45236 -2.53861
B 0.032358 0.031927 0.044601 0.030176
C -6.3187 e-5 -6.0486 e-5 -9.7061 e-5 -5.7165 e-5
R2
0.75678 0.83963 0.69290 0.80139
Nitrogen accumulation
A -1.87628 -2.92432 -2.07834 -2.74933
B 0.039227 0.050440 0.043102 0.046095
C - 7.89332 e-5 -10.2512 e-5 -8.75183 e-5 -9.1912 e-5
R2
0.91139 0.87896 0.93669 0.88511
Phosphorus accumulation
A -4.26377 -4.78127 -3.75275 -5.14993
B 0.043359 0.047418 0.038768 0.050305
C -8.88574 e-5 -9.32955 e-5 -7.43086 e-5 -10.1752 e-5
R2
0.92062 0.87054 0.92697 0.86217
Potassium accumulation
A -0.8776 -2.335770244 -2.10233 -3.10984
B 0.029572 0.045617291 0.045493 0.050165
C -5.7044E-05 -9.65883E-05 -9.71342E-05 -0.000104814
R2
0.89415 0.89820 0.96418 0.87242
Calcium accumulation
A -2.05901 -3.38103 -2.26855 -3.07062
B 0.027623 0.042133 0.031635 0.035030
C -4.81566 e-5 -8.19558 e-5 -5.82413 e-5 -6.17385 e-5
R2
0.80420 0.87436 0.829910 0.85461
Magnesium accumulation
A -4.43944 -5.44985 -4.74746 -4.13817
B 0.041572 0.053564 0.047306 0.036513
C -87.53068 e-5 -105428 e-5 -9.18091 e-5 -6.19901 e-5
R2
0.92317 0.95817 0.94965 0.89755
shown by the higher values of LAI during this period (Figure 2b). In the treatments 50 kg N ha
-1 + inoculation
and inoculation, shoot dry matter accumulation 240 DAP was around 3.4 and 3.3 kg m
-2, respectively, that is, 17.6
and 15.2% greater than in the treatments 50 kg N ha-1
and control, respectively (Figure 2a). In the treatments inoculation and control, this dry matter accumulation was only reached approximately 25 days later. These results suggest that inoculation with growth-promoting bacteria improved plant vigor, increasing sugarcane dry matter

2790 Afr. J. Agric. Res.
100 150 200 250 300
Sho
ot
dry
mat
ter
(g m
-2)
0
1000
2000
3000
4000
5000
100 150 200 250 300
Lea
f ar
ea ind
ex (
m2 m
-2)
0
1
2
3
4
5
6
100 150 200 250 300
Cro
p g
row
th r
ate
(gm
-2 d
ay-1
)
0
5
10
15
20
25
30
35
Control Inoculated 50 kg ha-1 N 50 kg ha-1 N + inoculated
100 150 200 250 300
Net
ass
imila
tio
n r
ate
(g m
-2 le
af d
ay-1
)
0
2
4
6
8
10
Days after planted Days after planted
dc
a b
Figure 2. Aboveground part (a) leaf area index (b), crop growth rate (c) and net
assimilation rate (d) of sugarcane, RB92579 variety, grown in a Red-Yellow Podzolic
soil in Seropédica-RJ, Brazil. Values estimated from the 2nd order exponential
polynomial model fitted to the primary data set.
Figure 2. Aboveground part (a) leaf area index (b), crop growth rate (c) and net assimilation rate (d) of sugarcane, RB92579 variety, grown in a Red-Yellow Podzolic soil in Seropédica-RJ, Brazil. Values estimated from the 2nd order exponential polynomial model fitted to the primary data set.
accumulation.
Unlike dry matter accumulation (Figure 2a), the LAI peaked around 220 DAP in the treatment 50 kg N ha
-1 +
inoculation, whereas this peak occurred around 270 DAP in the other treatments (Figure 2b), with a reduction in leaf area at the end of the growth cycle due to leaf senescence.
The initial crop growth rate (CGR, Figure 2c) of variety RB92579 100 DAP was lowest in the control treatment (6 g m
-2 day
-1) and about 9 g m
-2 day
-1 in the treatment 50 kg
N ha-1
+ inoculation. The CGR still differed between the two treatments at 220 DAP, 50 kg N ha
-1 + inoculation
peaked with 33 g m-2
day-1
, while the peak in the control treatment was 26 g m
-2 day
-1 (Figure 2c). The pattern of
the net assimilation rate (NAR) differed from that of CGR (Figure 2d), because of the tendency of reduction in photosynthetic activity with increasing plant age (Hunt,
1982). In the control treatment, the NAR was highest at 190 DAP (9 g m
-2 day
-1) and in treatment 50 kg N ha
-1 195
DAP (7 g m-2
day-1
). Although, the treatment fertilized with N + inoculation had a lower NAR curve than the other treatments, the larger LAI in this treatment may have offset these lower NAR values (Figure 2b).
The treatments inoculation and 50 kg N ha-1
+ inoculation promoted the highest values of shoot N accumulation, observed around 240 DAP (Figure 3a), indicating that inoculation promoted an increase in N accumulation in relation to the treatments fertilization with 50 kg N ha
-1 and control. The N accumulation rate was
highest at 170 DAP, and decreased continuously thereafter until 250 DAP in all treatments (Figure 3b). The control and fertilization with 50 kg N ha
-1 had lower rates
over the evaluation period (maximum values of 0.15 and 0.16 g m
-2 day
-1, respectively). Inoculation resulted in the

Pedula et al. 2791
100 150 200 250 300
Sho
ot
dry
mat
ter
(g m
-2)
0
1000
2000
3000
4000
5000
100 150 200 250 300
Lea
f ar
ea ind
ex (
m2 m
-2)
0
1
2
3
4
5
6
100 150 200 250 300
Cro
p g
row
th r
ate
(gm
-2 d
ay-1
)
0
5
10
15
20
25
30
35
Control Inoculated 50 kg ha-1 N 50 kg ha-1 N + inoculated
100 150 200 250 300N
et a
ssim
ilatio
n r
ate
(g m
-2 le
af d
ay-1
)
0
2
4
6
8
10
Days after planted Days after planted
dc
a b
Figure 2. Aboveground part (a) leaf area index (b), crop growth rate (c) and net
assimilation rate (d) of sugarcane, RB92579 variety, grown in a Red-Yellow Podzolic
soil in Seropédica-RJ, Brazil. Values estimated from the 2nd order exponential
polynomial model fitted to the primary data set.
Figure 3. N accumulation (a), N accumulation rate (b), P accumulation (c), the accumulation rate of P (d), accumulation of K (e) and rate of accumulation of K (f) of sugarcane variety RB92579 grown in a Red-Yellow Podzolic soil in Seropédica-RJ, Brazil. Estimated values from the exponential polynomial model school set to primary data.
highest N accumulation rate (0.23 g m
-2 day
-1), while
fertilization with 50 kg N ha-1
+ inoculation in 0.20 g m-2
day
-1, indicating that inoculation stimulated N
accumulation in sugarcane plants (Figure 3b). In the treatments control and fertilization with 50 kg N
ha-1
, P accumulation was similar in the evaluation period (Figure 3c). The association of inoculation with 50 kg N ha
-1 fertilization resulted in increased P accumulation in
the evaluation period, with maximal P accumulation 260 DAP (3.68 gm
-2). The P accumulation rate was highest
around 180 DAP in all treatments. The rate of P accumulation was highest in the inoculation treatment
(around 0.029 g m-2
day-1
), followed by 50 kg N ha-1
+ inoculation (maximum of 0.028 g m
-2 day
-1) (Figure 3d).
Fertilization with 50 kg N ha-1
and control treatment reached maximum P accumulation rates of the order of 0.025 to 0.022 g P m
-2 day
-1, respectively. The
accumulation curve suggests that inoculation favored P accumulation by sugarcane plants more than the control and fertilization with 50 kg N ha
-1.
In the inoculation treatment, K accumulation was 20 g m
-2 245 DAP, but the association of inoculation with
fertilization with 50 kg N ha-1
had an additional effect on K accumulation (24 g m
-2) (Figure 3e). Thus, these results

2792 Afr. J. Agric. Res.
Figure 4. Ca accumulation (a), Ca accumulation rate (b), Mg accumulation (c) Mg accumulation rate (d) of sugarcane, RB92579 variety, grown in a Red-Yellow Podzolic soil in Seropédica-RJ, Brazil. Values estimated from the exponential polynomial model school set to primary data.
suggest that inoculation promoted greater K accumulation than the control treatment and 50 kg N ha
-1. The K
accumulation rate was highest at 160 DAP in all treatments (Figure 3f). The K accumulation rate was the highest in the treatment fertilized with 50 kg N ha
-1 +
inoculation followed by the inoculation treatment (0.17 and 0.21 g m
-2 day
-1, respectively), both higher than in the
treatments with 50 kg N ha-1
and control, indicating a positive effect of the combination of 50 kg N ha
-1 +
inoculation. The Ca and Mg accumulation by sugarcane also reflect
the data of other accumulated macro elements. Inoculation increased Ca accumulation, so that the maximum accumulation of the treatments inoculation and 50 kg N ha
-1 + inoculation occurred at 255 DAP, that is,
25 days earlier than in the treatments control and fertilization with 50 kg N ha
-1 (Figure 4a). The Ca
accumulation rate was higher in the treatments inoculation and combination of N fertilizer with inoculant (Figure 4b). The maximum Ca accumulation rate in the treatments control and fertilization with 50 kg N ha
-1 occurred at 185
DAP (0.039 and 0.044 g m-2
day-1
, respectively). Inoculation and the combination of 50 kg N ha
-1 +
inoculation accumulated 0.059 and 0.049 g Ca m-2
day-1
, 180 DAP, respectively. These results show that the
inoculant increased Ca accumulation, both when applied separately or together with 50 kg N ha
-1, although the
efficiency in the combined treatment was lower. In the treatments control and 50 kg N ha
-1, Mg
accumulation was lower than in the inoculation treatments and fertilization with 50 kg N ha
-1 + inoculation
until 275 DAP (Figure 4c). Thereafter, there was a decrease in Mg accumulation in the treatments inoculation and 50 kg N ha
-1 + inoculation, with lower
values than in the treatments control and fertilization with 50 kg N ha
-1. The maximum Mg accumulation in the
control and 50 kg N ha-1
occurred 275 DAP (3.4 and 3.7 g m
-2, respectively). Magnesium accumulation was the
same in the treatments inoculation and 50 kg N ha-1
+ inoculation (maximum accumulation of 3.8 g m
-2 255
DAP). The Mg accumulation rate was improved by inoculation and by the combination of 50 kg N ha
-1 +
inoculation until 225 DAP (Figure 4d). The treatments control and 50 kg N ha
-1 showed similar curves, with
maximum values of the order of 0.026 g m-2
day-1
205 DAP, indicating that fertilization with 50 kg N ha
-1 had no
additional effect on the Mg accumulation rate in comparison with the control. The Mg accumulation rate in the treatments inoculation and 50 kg N ha
-1 + inoculation
peaked 190 DAP (0.033 and 0.031 g m-2
day-1
,

respectively). This shows that there was an additional effect of inoculum on Mg accumulation in relation to the treatment with 50 kg N ha
-1 fertilizer only, although in the
treatment with inoculant only, Mg accumulation was greater than in the combination of the two treatments. DISCUSSION Inoculation using five selected diazotrophs showed positive effects on sugarcane growth parameters evaluated in the presence or not of N-fertilizer. These strains were previously selected by their functions based on plant growth regulators (Fuentes-Ramiréz et al., 1993; Muthukumarasamy et al., 2002; Radwan et al., 2002), phosphate solubilization as identified for G. diazotrophicus and B. tropica strains, antagonism to plant pathogens (Piñon et al., 2002; Muñoz-Rojas et al., 2005), among others. But endophytic colonization was also an important attribute for these elected PGPR strains tested (Cavalcante and Döbereiner, 1988; Caballero-Melado and Martinez-Romero, 1994; Olivares et al., 1997; Oliveira et al., 2004). All these attributes can partially explain the observed growth rate curves and macro elements accumulated as described in Figures 2, 3 and 4.
Based on these several features, this higher plant vigor was also a result of better exploitation of soil and applied nutrients, resulting in a higher mass accumulation (Figure 2). Although root growth was not assessed in this study, one can speculate that the treatments with diazotrophic bacterial inoculation producing growth regulators modified growth rates curves in response to the improved root development.
The parameters of sugarcane growth evaluated were compatible with other data describing varieties planted in other regions of Brazil. For example, the highest LAI was reached at 215 DAP in the treatment 50 kg N ha
-1 +
inoculation (Figure 2b), which is different from the behavior observed by Gascho and Shih (1983) who reported a maximum LAI value in sugarcane 150 DAP. Similar growth pattern was described by Farias et al. (2007), who stated an increase in LAI until 210 days after sprouting in variety SP 79-1011 under different irrigation treatments in the first year of cultivation, reaching values of 4 m
2 m
-2, 150 days after sprouting in an irrigation
treatment with 100% crop evapotranspiration replacement and of 5 m
2 m
-2, when combined with zinc fertilization.
Oliveira et al. (2010) also observed the same growth for variety RB92579, divided into three phases also described by Machado et al. (1982), where in the first 200 days, growth was slow, from 200 to 400 days, the plants accumulated 70 to 80% of dry matter and in the following 100 days the remaining 10%. Averaged across all treatments, variety RB92579 accumulated about 14 Mg ha
-1 dry weight of shoot at 212 DAP, to 42.3 Mg ha
-1 at
293 DAP (Figure 2a), with a growth similar to that
Pedula et al. 2793 observed by these authors. Based on the rates observed by Machado et al. (1982), at the end of the cycle the expected yield would be around 114 Mg ha
-1 dry weight,
which would represent 257 Mg ha-1
fresh shoots, based on the same proportions. Applying the same proportionality of dry matter/fresh matter of Machado et al. (1982), a final yield of 203 Mg ha
-1 of fresh stalks of
variety RB92579 at the end of the cycle 500 DAP can be estimated.
The data of shoot biomass production observed in variety RB92579 are superior to those reported by Gava et al. (2001) in the third ratoon crop for var. SP80-1842 on a similar soil to that used in this study (Typic Haplustult). According to these authors, the relative growth rate (RGR) of sugarcane is high in the beginning, followed by a decline, which is related, among other factors, to the increased intraspecific competition for light and nutrients. Santos et al. (2009) also used growth data to estimate the RGR of var. RB75126, 120 DAP, observing a linear decrease in RGR, ending growth around 240 DAP, with initial values of around 0.05 g g
-1
day-1
in the best treatment. Unlike dry matter (Figure 2a), the LAI peaked around
220 DAP in the treatment 50 kg N ha-1
+ inoculation, whereas in the other treatments this maximum occurred around 270 DAP (Figure 2b). The maximum values of nutrient accumulation rates indicate the stage of greatest nutritional crop demand (Araújo and Rossiello, 2013). The highest accumulation rates of N and P were observed around 180 DAP, while K accumulation rate peaked around 160 DAP, in the different treatments (Figure 3). The crop growth rate peaked around 210 to 220 DAP (Figure 2), evidencing that the maximum nutrient demand precedes the maximum sugarcane growth rate. Santos et al. (2009) also observed P influence on sugarcane growth in Brazilian condition. Thus, in the later stages of the growth cycle, nutrient accumulation decreases and phenomena of internal remobilization and nutrient translocation predominate (Gava et al., 2001; Oliveira et al., 2010, 2013).
In general, the accumulation of macro elements was higher in the early growth stages (around 200 DAP), similar to dry matter accumulation, as also reported by Gava et al. (2001). Oliveira et al. (2013) observed critical limits of N in variety SP81-3250 in two growing seasons and three different soils and at all sites the N shoot concentration decreased during crop growth. Oliveira (2011) reported lower values of P accumulation rate, of 0.15 g m
-2 day
-1 in an Hapludox soil (distrophic Red
Latossol), under climatic conditions that may have decreased plant growth. Values of K accumulation rate were higher than those reported in soils of lower fertility, such as the K accumulation rate of 0.15 g m
-2 day
-1
described by Leite (2011) in a treatment with ammonium nitrate application.
The data presented here are similar to those obtained by Oliveira (2008), where the N and K accumulation rates

2794 Afr. J. Agric. Res. in sugarcane were practically zero 300 DAP, denoting that at the beginning of the maturation stage the nutrient uptake ceases and sugarcane plant improves the internal remobilization of nutrients (Gava et al., 2001). In this particular case, the application of diazotrophs modified this natural behavior of sugarcane variety RB92579. This crop starts to mobilize the nutrients and accumulate sugars after the fast growth phase as expected, but the inoculation delays this behavior, elongating the growth period (Figure 2a) and still increasing the rates of leaf area index (Figure 2b). Limitation at this point is the space between plants reducing sunlight acquisition by the green leaves, that start to decrease rapidly after 200 to 250 DAP (Figure 2c). As the control and nitrogen treatments posses less leaf area at the beginning, they continue to accumulated biomass while the inoculated treatments were sunlight limited (Figure 2d). This particular movement of leaf area and crop growth rate will interfere on the final biomass at the end of this cane cycle, and also interfere on the crop yield at harvest as observed by other authors that used this same mixture of strains in different sugarcane locations using other varieties (Oliveira et al., 2006; Schultz et al., 2012). It can be easily observed in Figures 3 and 4. So, based on this growth rate curves, it can be expected that sugarcane growth period can be modified by the inoculation, independent on the N-fertilization. But significant differences on cane yield will be controlled by the environmental conditions.
Based on the data obtained, it is possible to conclude that inoculation with diazotrophic bacteria, in combination with N fertilization or not, increases the accumulation of shoot dry matter and leaf area index of the sugarcane variety RB92579 during the first crop year and can be used as an inoculant that increase nutrient accumulation in sugarcane RB92579, in particular of N, P and K. ACKNOWLEDGEMENTS The authors wish to thank the Coordination of Improvement of Higher Education Personnel - CAPES, the National Council for Scientific and Technological Development - CNPq and the Carlos Chagas Foundation for Research Support of the State of Rio de Janeiro - FAPERJ for the scholarships, and MCT/CNPq/CTAgro, project number 558329/2009-8.
Conflict of interests The author has not declared any conflict of interests. Abbreviations CGR, Crop growth rate; CONAB, Companhia Nacional de Abastecimento; UNICA, União da Industria de Cana-
de-açúcar; RIDESA, Rede Interuniversitária para o Desenvolvimento do Setor Sucroalcooleiro; LAI, leaf area index; NAR, net assimilation rate; N, nitrogen; K, potassium; P, phosphorus; Ca, calcium; Mg, magnesium; DAP, days after planting. REFERENCES
Araújo AP (2003). Analysis of variance of primary data on plant growth analysis. Pesq. Agrop. Bras. 38(1):1-10.
Araújo AP, Rossiello ROP (2013). Aplicação da análise quantitativa do crescimento vegetal para avaliar a absorção e a utilização de nutrientes. In: Araújo AP, Alves BJR eds. Tópicos em Ciência do Solo. Viçosa: Soc. Bras. Ciênc. Solo 8:293-323.
Baldani JI, Reis VM,Videira SS, Boddey LH, Baldani VLD (2014). The art of isolating nitrogen-fixing bacteria from non-leguminous plants using N-free semi-solid media: a practical guide for microbiologists. Plant Soil 384(1):413-431.
Batista ELS, Zolnier S, Ribeiro A, Lyra GB, Silva TGF, Boehringer D (2013). Modelagem do crescimento de cultivares de cana-de-acucar no periodo de formacao da cultura. Rev. Bras. Eng. Agric. Ambient. 7(10):1080-1087.
Caballero-Melado J, Martinez-Romero E (1994). Limited genetic diversity in the endophytic sugarcane bacteria Acetobacter diazotrophicus. Appl. Environ. Microbiol. 60(5):1532-1537.
Casagrande AA (1991). Tópicos de morfologia e fisiologia da cana-de-açúcar. Jaboticabal: Funep.
Cavalcante V, Dobereiner J (1988). A new acid-tolerant nitrogen-fixing bacterium associated with sugarcane. Plant Soil 108(1):23-31.
Dobbelaere SA, Croonenborghs A, Thys BA, Vande J, Vanderleyden J (1999). Phytostimulatory effect of Azospirillum brasilense wild type and mutant strains altered in IAA production on wheat. Plant Soil 212(2):155-164.
Farias CHA, Neto JD, Fernandes PD, Gheiy HR (2005). Índice de área foliar em cana-de-açúcar sob diferentes níveis de irrigação e zinco na Paraíba. Caatinga 20(4):45-55.
Fuentes-Ramiréz LE, Jimenez-Salgado T, Abarca-Ocampo IR, Caballero-Mellado J (1993). Acetobacter diazotrophicus, an indoleacetic acid producing bacterium isolated from sugarcane cultivars of México. Plant Soil 154(2):145-150.
Gascho GJ, Shih SF (1983). Sugarcane. In: Teare ID, Peet MM. eds. Crop water relations. New York: Wiley-Interscience pp. 445-479.
Gava GJC, Trivelin PCO, Oliveira M, Penatti CP (2001). Crescimento e acúmulo de nitrogênio em cana-de-açúcar cultivada em solo coberto com palhada. Pesq. Agrop. Bras. 36(11):1347-1354.
Hermann ER, Câmara GMS (1999). Um método simples para estimar a área foliar de cana-de-açúcar. STAB- Açúcar Álcool e Subprodutos 17(5):32-34.
Hunt R (1982). Plant growth curves. The functional approach to plant growth analysis. London: Edward Arnold. 247p.
Larcher W (2000). Ecofisiologia Vegetal. Tradução: Prado, C. H. B. A. São Paulo: Editora RiMa. 531p.
Leite JM (2011). Acúmulo de fitomassa e de macronutrientes da cana-de-açúcar relacionadas ao uso de fontes de nitrogênio. Dissertação de Mestrado. Esalq. USP. 90p.
Machado EC, Pereira AR, Fahal JI, Arruda HV, Cione J (1982). Índices biométricos de duas cultivares de cana-de-açúcar. Pesq. Agrop. Bras. 17(9):1323-1329.
Moutia JFY, Saumtally S, Spaepen S, Vanderleyden J (2010). Plant growth promotion of Azospirillum sp. in sugarcane is influenced by genotype and drought stress. Plant Soil 337(1-2):233-242.
Muñoz-Rojas J, Fuentes-Ramírez LE, Caballero-Mellado J (2005). Antagonism among Gluconacetobacter diazotrophicus strains in culture media and in endophytic association. FEMS Microbiol. Ecol. 54(1):57-66.
Muthukumarasamy R, Revathi G, Seshadri S, Lakshminarasimhan C (2002). Gluconacetobacter diazotrophicus (syn. Acetobacter diazotrophicus), a promising diazotrophic endophyte in tropics. Curr. Sci. 83(2):137-145.
Nogueira ARA, Souza GB (2005). Manual de laboratório: solo, água,
nutrição vegetal, nutrição animal e alimentos. São Carlos-SP: Embrapa Pecuária Sudeste. 313p.
Nunes JRD, Pinto RSA, Trento FE, Elias AI (2005). Indicadores agrícolas do setor canavieiro, safra 2003/2004. Ribeirão Preto: Idea. 111p.
Olivares FL, James EK, Baldani JI, Döberenier J (1997). Infection of mottled stripe disease-susceptible and resistant sugar cane varieties by the endophytic diazotroph Herbaspirillum. New Phytol. 135(4):723-727.
Oliveira ALM, Canuto EL, Reis VM, Baldani JI (2003). Response of micropropagated sugarcane varieties to inoculation with endophytic diazotrophic bacteria. Braz. J. Microbiol. 34(1):59-61.
Oliveira ALM, Canuto EL, Silva EE, Reis VM, Baldani JI (2004). Survival of endophytic diazotrophic bacteria in soil under different moisture levels. Braz. J. Microbiol. 35(4):295-299.
Oliveira ALM, Canuto EL, Urquiaga S, Reis VM, Baldani JI (2006). Yield of micropropagated sugarcane varieties in different soil types following inoculation with diazotrophic bacteria. Plant Soil 284(1):23-32.
Oliveira ECA (2008). Dinâmica de nutrientes na cana-de-açúcar em sistema irrigado de produção. Dissertação de mestrado. Recife, Universidade Federal de Pernambuco 73f.
Oliveira ECA (2011). Balanço nutricional da cana-de-açúcar relacionada à adubação nitrogenada. Tese (Doutorado). Piracicaba. Escola Superior de Agricultura Luiz de Queirós, Universidade de São Paulo. 213p.
Oliveira ECA, Gava GJC, Trivelin PCO, Otto R, Franco HCJ (2013). Determining a critical nitrogen dilution curve for sugarcane. J. Plant Nutr. Soil Sci. 176(5):712-723.
Oliveira ECA, Oliveira RI, Andrade BMT, Freire FJ, Júnior MAL, Machado PR (2010). Growth and dry matter production in sugarcane varieties grown under full irrigation. Rev. Bras. Engen. Agríc. Ambient 14(9):951-960.
Piñon D, Casas M, Blanch M, Fontaniella B, Blanco Y, Vicenti C, Solas MT, Legaz ME (2002). Gluconacetobacter diazotrophicus, a sugar cane endosymbionte produces a bacteriocin against Xantomonas albilineans, a sugar cane pathogen. Res. Microbiol. 153(6):345-351.
Radwan T EL-S El-D, Mohamed Z, Reis VM (2002). Production of indole-3-acetic acid by different strains of Azospirillum and Herbaspirillum spp. Symbiosis 32(1):39-54.
RIDESA (2003). Catalogo nacional de variedades ‘ RB’ de cana-de-açúcar. 136p.
Rossetto R, Vitti AC, Gava GJC, Mellis EV, Vargas VP, Cantarella H (2013). Cana de açúcar, cultivo com sustentabilidade. Informações Agronômicas. 42p.
Santos VR dos, Moura Filho G, Albuquerque AW de, Costa JPV da, Santos CG dos, Santo ACI dos (2009). Growth and yield of sugar cane under different phosphorus sources. Rev. Bras. Eng. Agric. Ambient 13:389-396.
Pedula et al. 2795 Schultz N, Morais RF, Silva JA, Baptista RB, Oliveira RP,
Leite JM,
Pereira W, Carneiro Júnior JB, Alves BJR, Baldani JI, Boddey RM, Urquiaga S, Reis VM (2012). Avaliação agronômica de duas variedades de cana de açúcar inoculadas com bactérias diazotróficas e adubadas com nitrogênio. Pesqui. Agropec. Bras. 47(2):261-268.
Silva TGF, Moura MSB, Zolnier S, Carmo JFA, Souza LSB (2012). Biometria da parte aérea de cana soca irrigada no submédio do vale do São Francisco. Rev. Ciênc. Agric. 43(3):500-509.
Spaepen S, Vanderleyden J, Remans R (2007). Indole-3-acetic acid in microbial and microorganism-plant signaling. FEMS Microbiol. Rev. 31(4):425-448.
Trivelin PCO, Vitti AC, Oliveira MW, Gava GJ, Sarries GA (2002). Utilizacao do nitrogenio e produtividade da cana de acucar cana planta em solo arenoso com incorporacao de residuos da cultura. Rev. Bras. Cien. Solos 23(3):123-131.

Vol. 11(30), pp. 2796-2805, 28 July, 2016
DOI: 10.5897/AJAR2016.11061
Article Number: F62D61E59772
ISSN 1991-637X
Copyright ©2016
Author(s) retain the copyright of this article
http://www.academicjournals.org/AJAR
African Journal of Agricultural Research
Full Length Research Paper
Saline water and organic matter in the development and quality of Licania rigida Benth. seedlings
Alian Cássio Pereira Cavalcante1*, Manoel Alexandre Diniz Neto2, Lourival Ferreira Cavalcante1, Adailza Guilherme Cavalcante1, Belísia Lúcia Moreira Toscano Diniz2, Raunira
da Costa Araújo2, Evandro Franklin de Mesquita3 and José Flávio Cardoso Zuza2
1Universidade Federal da Paraíba (UFPB), Centro de Ciências Agrárias (CCA), Areia-PB, Brasil.
2Universidade Federal da Paraíba (UFPB), Centro de Ciências Humanas, Sociais e Agrárias (CCHSA), Bananeiras-PB,
Brasil. 3Universidade Estadual da Paraíba (UEPB), Centro de Ciências Humanas e Agrárias (CCHA), Catolé do Rocha-PB,
Brasil.
Received 29 March, 2016; Accepted 2 June, 2016
Licania rigida Benth. (oiticica) is a native species from the Northeastern Brazil. In this sense, the aim of this study is to evaluate the effects of irrigation with saline water and organic matter on the growth and quality of oiticica seedlings. The experiments were laid out in randomized complete block using a 5 × 2 factorial design related to electrical conductivity of irrigation water at 0.5, 1.5, 3.0, 4.5 and 6.0 dS m
-1 in a
substrate with and without organic castor bean compost (Ricinus communis) and soil in a volume ratio of 0:1 and 1:1 v/v. Growth in height, stem diameter, leaf number, leaf area, chlorophyll a and b and total chlorophyll indices, shoot and root dry matter and Dickson Quality Index were evaluated. The increase in water salinity inhibited biometric growth, seedlings production of root and shoot biomass, chlorophyll content and Dickson Quality Index. Increase in water salinity, except for root biomass, inhibited biometric growth, shoot biomass accumulation, chlorophyll a, b and total, chlorophyll indexes and quality index of oiticica seedlings. In the results, although the Dickson Quality Index did not decrease with increasing water salinity and did not vary among treatments with and without organic compost, the transplanting of seedlings in the field was found to be suitable. Key words: Salinity, organic compost, oiticica.
INTRODUCTION Oiticica (Licania rigida Benth.), which belongs to the “Chrysobalanaceae family”, is an oilseed from Brazil. It is disseminated through the riparian forests of the Caatinga region of Sertão, Seridó, Brazilian Northeast Agreste and
Ceará, as well as through the basins of Piauí, Ceará, Rio Grande do Norte and Paraíba (Beltrão and Oliveira, 2007). This oleaginous species adapts to the water deficit of the soil possibly because of its deep root system, and
*Corresponding author. E-mail: [email protected]
Author(s) agree that this article remain permanently open access under the terms of the Creative Commons Attribution
License 4.0 International License

this ensures its green coloring throughout the year. Its production coincides with the driest period of the year in the semi-arid region of Paraíba (Diniz Neto et al., 2014). Among its uses, the most significant is the use of its seed oil as raw material in the siccative paint industry and soap factories (Maia, 2004). However, it also has medicinal properties (Roque and Loiola, 2013).
Its importance as a raw material in the production of oil and soap clearly stands out. This highlights the need to evaluate the behavior of oiticica in relation to water salinity as an alternative to the semi-arid producer (Diniz Neto et al., 2014). Although the use of saline water in irrigation is considered as an alternative in the productive system due to the scarcity of water in quantity and quality, there are serious risks of adding salts to the soil at impairing levels for productive areas and plants (Matos et al., 2013).
Due to water scarcity, the use of saline water in agriculture relies on the adoption of technological or chemical and organic methods (or both simultaneously) to reduce the degenerative effects of the salinity on the soil and plants (Cavalcante et al., 2007; Mesquita et al., 2015). Organic matter is considered as important, as measured by Silva et al. (2008) for guava (Psidium guava) and Souza et al. (2014) for noni (Morinda citrifolia) plants irrigated with non-saline water and water with increasing salinity, ranging from 0.3 to 8 dS m
-1.
Organic inputs from plants and animals increase water retention capacity, soil aggregation and reduce soil density (Mgbeze and Abu, 2010). They also act in the soil’s chemical improvement, by providing an increase in nutrient concentrations (Nóbrega et al., 2008), and in soil’s microbiological improvement by increasing the population and the fauna diversity of saline soils and saline-sodic soils (Ndubuisinnaji et al., 2011; Sall et al., 2015).
Among organic material sources, there are organic compounds produced by the fermentation of plant part mixture with bovine manure, or manure from other types of flock, which may or may not contain other mineral components (Primo et al., 2010). In this sense, according to Cha-um and Kirdmanee (2011), the organic compost from castor beans in soils degraded by salts stimulates growth, biomass production and physiological efficiency of plants in saline environments. Changes in metabolism induced by salinity are the result of plants’ physiological responses such as: Stimulus to growth, photosynthetic capacity, and accumulation of chlorophyll (Souto et al., 2015).
Given the above, the aim of this study was to evaluate the effects of irrigation with saline water and organic matter on the growth and quality of oiticica seedlings. MATERIALS AND METHODS
The experiment was conducted between February and May 2014 in a screened greenhouse at the Humanities, Social and Agricultural
Cavalcante et al. 2797 Center of the Federal University of Paraíba, Bananeiras, Paraíba state.
Initially, the composting windrow was prepared with vegetative parts of castor bean plants (stem, branches and leaves), crushed and placed at a height of 20 cm, interspersed with cattle manure in 5 cm thick layers. The piles were 1 m wide, 1.5 m high and 5 m long. The material was turned over every two weeks and temperatures were taken with a thermometer with a range of up to 150°C. At 80 days after piling, the material showed a uniformed color and particle size, suitable for the preparation of the substrate.
The experimental design was completly randomized with five replications and two plants per plot in a 5 × 2 factorial design related to irrigation water salinity levels at 0.5, 1.5, 3.0, 4.5 and 6.0 dS m-1 in the presence and absence of castor bean organic compost + material from layers 20 to 40 cm, with lower content of organic matter. The soil was classified, following the criteria of the Brazilian System of Soil Classification (SiBCS) (EMBRAPA, 2013), as Dystrophic Yellow Latosol in volume proportions of 0:1 and 1:1 v/v. The soil and the organic compost were characterized chemically according to methodologies suggested by the Brazilian Agricultural Research Corporation (EMBRAPA) (Donagema et al., 2011). The results are shown in Table 1.
Oiticica seeds were obtained from plants from the municipality of Catolé do Rocha, Catolé do Rocha microregion and Alto Sertão Paraibano mesoregion. Then the shells were manually eliminated with a knife and yhe seeds were placed in paper bags until sowing.
The experimental units were 20 × 30 cm black polyethylene bags, with a maximum volume of 3 dm-3 of substrate. It contained two seeds per treatment. The first emergence occurred between 20 and 30 days after sowing. Thinning was performed at 10 days after emergence, and the most vital plant of each experimental unit was excluded.
Saline preparation of saline solution was done by adding 1.5 dS m-1 non-iodized sodium chloride to 92%
The preparation of saline water from 1.5 dS m-1 was done by adding non-iodized sodium chloride with 92% purity to obtain the desired conductivity. The solution was measured with a digital portable CD 860 conductivity meter.
At 60 days after the first emergence of seedlings, the growth in plant height was measured from the base of the plant to the end of the main stem with a graduated ruler. The stem diameter was measured at the base of the plant, 2 cm from the soil, with a digital caliper. The leaves were then counted after previous measurements of leaf number, leaf area, shoot dry matter, root dry matter (both were summed to obtain total dry matter), chlorophyll a and b and total chlorophyll content. The Dickson Quality Index was calculated for oiticica seedlings.
The oiticica seedlings were collected, and then the shoot and root were separated. They were packed in paper bags and placed in a circulation air oven at 65ºC until they were constantly dried. Then, samples were weighed on an analytical balance to obtain shoot and root dry matter and subsequently the Dickson Quality Index (DQI). This index is a balanced formula including the relations among morphological characteristics, such as total dry matter (TDM), shoot dry matter (SDM), root dry matter (RDM), plant height (PHe) and stem diameter (SD) (DICKSON et al., 1960) using the equation:
(
) (
)
The results were submitted for variance analysis by F test. Means of soil with and without organic compost were compared by F test, which is conclusive to values between two factors, and means for electrical conductivity of irrigation water were calculated by regression using the t test with the statistical software ASSISTAT version 7.7 beta (Silva and Azevedo, 2002).

2798 Afr. J. Agric. Res. Table 1. Chemical characterization of the soil at the layer 20-40 cm and of the castor bean compost used to prepare the substrate for oiticica seedlings.
Sources
Chemical attributes
*pH P K
+ Na
+ H
+Al
3+ Al
3+ Ca
2+ Mg
2+ BS CEC V OM
mg dm-1
cmolc dm-3
% g kg-1
Soil 5.7 19.1 0.23 0.1 0.2 0.0 4.4 0.4 5.1 5.3 96.9 10.4
COC 8.2 921.0 12.3 1.5 0.8 0.0 14.1 4.2 - - - 259
* = pH in water; COC = castor bean organic compost; BS = base sum (Ca2+
+ Mg2+
+ K+); CTC = cation exchange capacity [BS + (H
+ + Al
3+); V =
saturation by exchangeable bases (BS/CTC)100; OM = Organic matter. RESULTS AND DISCUSSION Although the interaction between salinity and organic castor bean compost did not show significant effects on any of the variables (Table 2), the sources of variation significantly interfered with growth in height, stem diameter, leaf emergence and leaf area of oiticica seedlings. This interaction situation contradicted the findings of Cavalcante et al. (2007), who recorded significant effects for the interaction of irrigation water salinity x organic matter levels on the growth and production of yellow passion fruit. However, the result is in accordance with the findings of Silva et al. (2008), Diniz et al. (2014) and Souza et al. (2014); they concluded that the isolated effects of irrigation water salinity inhibit and organic matter stimulates the growth of guava (P. guajava), oiticica (L. rigida) and noni (M. citrifolia) during the formation of seedlings.
The growth in the height of oiticica seedlings reduced along with the electrical conductivity of irrigation water. However, in the same situation, it increased in the substrate with organic compost in comparison to the treatment without the organic input (Figure 1). The increase in the salt concentration of water inhibited linearly at a 1.023 cm level per unit increase of electrical conductivity. Growth in height promoted a 22.6% loss among plants irrigated with a higher and lower salt content water, and 4.11% per unit increase of irrigation water salinity (Figure 1A). According to these results, salt stress generally affects plant growth (including oiticica), by reducing the CO2 fixation, thus reducing the rate of plant cell division and elongation (Freire et al., 2010). As for the effects of the organic compost, when the value of the plants with organic input was compared to the value of those without (Figure 1B), there was an increase of 23.7% in the value of the plants with organic input. This is a result of the inhibition of aggression by organic compost salts to seedlings. This increase indicated that the organic input mitigates the adverse effects of salinity through benefits to physical properties by increasing the pore space (Mellek et al., 2010), to chemical properties by improving fertility (Bendouali et al., 2013), and to biological properties by increasing the population and the microbial diversity of soil (Sall et al., 2015; Ndubuisinnaji
et al., 2011) thus, mitigating the degenerative actions of salts on plants. In this sense, organic inputs, according to Brahmaprakash and Sahu (2012), mitigate the negative effects of salinity on plants by releasing humic substances in the medium, which reduce the osmotic pressure inside roots, keeping the superiority of the total potential energy of soil water, and providing the uptake of nutrients by plants.
Similar to the decrease in height, the growth in stem diameter was also affected by the increase in the electrical conductivity of irrigation water and stimulated by the addition of the castor bean organic compost (Figure 2). The decreases were from 4.17 to 4.08, 3.93, 3.80 and 3.57 mm in plants irrigated with water at 0.5, 1.5, 3.0, 4.5 and 6.0 dS m
-1, respectively, inducing a loss of 14.4%
among plants treated with water at 6.0 and 0.5 dS m-1
, and 2.62% increase in each unit of saline water irrigation (Figure 2A). Contrary to what was obtained in seedling in saline water, when compared on the other hand, the stem diameter of the seedling treated with organic compost exceeded the stem of the seedling not treated by 18.3% (Figure 2B).
The increase in diameter growth of oiticica seedlings in soil with organic compost in a saline environment is a response to the physical improvement of the substrate and to the stimulating action of organic proteins and solutes which work by inhibiting the negative action of salinity and stimulating the growth of plants. This is also verified by Silva et al. (2008) and Mesquita et al. (2015), for guava (Psidium guajava) and neem plants (Azadirachta indica) respectively, using irrigation with saline water in a substrate with solid and liquid cattle manure.
The saline water hindered, while the addition of the organic compost to the substrate increased leaf production of oiticica seedlings respectively (Figure 3). The linear decrease was 0.199 leaf per unit increase of water salinity, with a loss of 18.21% among seedlings irrigated with water at 6.0 and 0.5 dS m
-1, corresponding
to 3.31% for each unit increase in water salt content (Figure 3A). As for the organic compost in substrate, there was a 12.24% increase in the number of leaves of seedlings with organic compost in comparison to those without it in the substrate (Figure 3B). It may have

Cavalcante et al. 2799 Table 2. Summary of the analysis of variance for plant growth in height (PHe), stem diameter (SD), leaf number (LN) and leaf area (LA) of oiticica seedlings (L. rigida) irrigated with saline water and organic castor bean compost.
SOV df Mean square
PHe SD LN LA
Blocks 4 1.44* 0.11ns
0.37ns
38.57ns
Salinity (S) 4 53.22* 0.48* 2.02* 476.12**
COC proportions (P) 1 435.13** 5.41** 6.48* 2,596.75**
S x P 4 58.96ns
0.21ns
1.68ns
42.43ns
Error 36 23.95 0.22 0.94 45.21
Total 49 - - - -
Linear Reg. 1 172.92* 1.53* 5.76*
1,787.01**
Quadratic Reg. 1 18.94ns
0.24ns
0.71ns
53.11ns
CV (%) - 17.60 11.94 17.53 11.09
COC = castor bean organic compost; CV = Coefficient of variation; ns
= not significant by Tukey test; * and ** = significant at 5 and 1% probability, respectively.
Figure 1. Height of oiticica seedlings in saline water with (A) Soil with organic compost and (B) Soil without organic compost.
Figure 2. Stem diameter of oiticica seedlings in saline water (A) in soil with and (B) in soil without organic compost.
caused chemical (Nóbrega et al., 2008) and microbiological improvement by increasing the population
and the fauna diversity of the soil (Ndubuisinnaji et al., 2011).
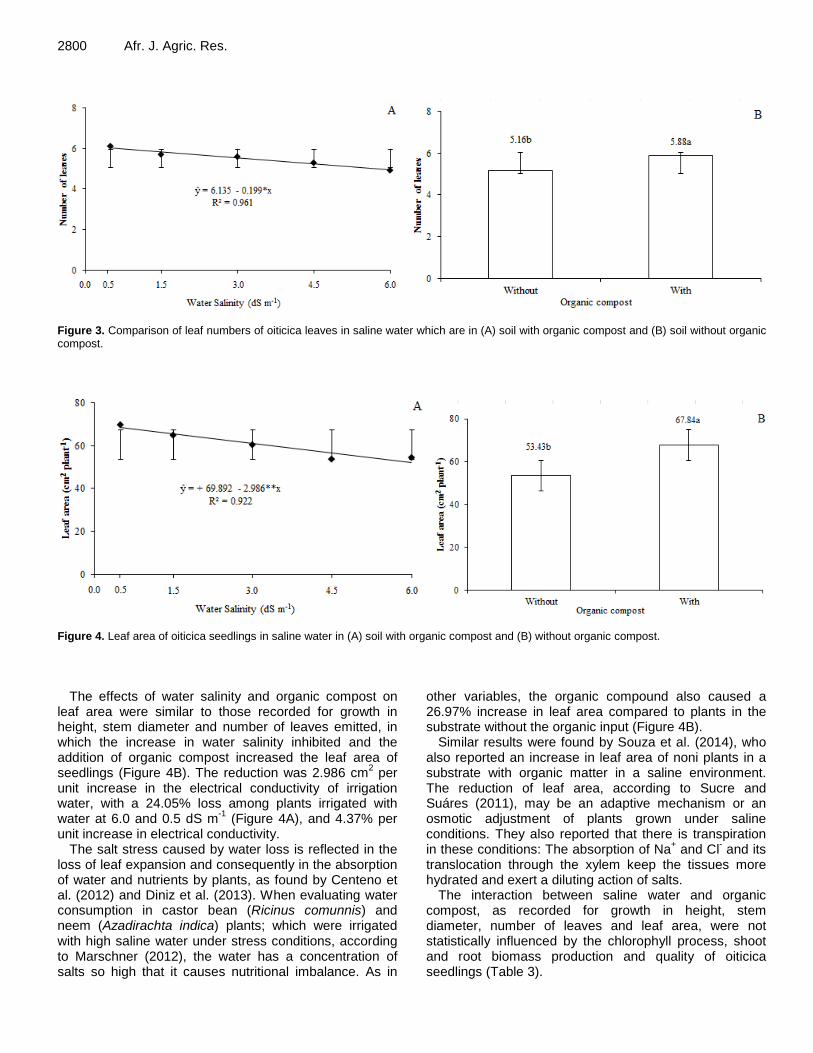
2800 Afr. J. Agric. Res.
Figure 3. Comparison of leaf numbers of oiticica leaves in saline water which are in (A) soil with organic compost and (B) soil without organic compost.
Figure 4. Leaf area of oiticica seedlings in saline water in (A) soil with organic compost and (B) without organic compost.
The effects of water salinity and organic compost on leaf area were similar to those recorded for growth in height, stem diameter and number of leaves emitted, in which the increase in water salinity inhibited and the addition of organic compost increased the leaf area of seedlings (Figure 4B). The reduction was 2.986 cm
2 per
unit increase in the electrical conductivity of irrigation water, with a 24.05% loss among plants irrigated with water at 6.0 and 0.5 dS m
-1 (Figure 4A), and 4.37% per
unit increase in electrical conductivity. The salt stress caused by water loss is reflected in the
loss of leaf expansion and consequently in the absorption of water and nutrients by plants, as found by Centeno et al. (2012) and Diniz et al. (2013). When evaluating water consumption in castor bean (Ricinus comunnis) and neem (Azadirachta indica) plants; which were irrigated with high saline water under stress conditions, according to Marschner (2012), the water has a concentration of salts so high that it causes nutritional imbalance. As in
other variables, the organic compound also caused a 26.97% increase in leaf area compared to plants in the substrate without the organic input (Figure 4B).
Similar results were found by Souza et al. (2014), who also reported an increase in leaf area of noni plants in a substrate with organic matter in a saline environment. The reduction of leaf area, according to Sucre and Suáres (2011), may be an adaptive mechanism or an osmotic adjustment of plants grown under saline conditions. They also reported that there is transpiration in these conditions: The absorption of Na
+ and Cl
- and its
translocation through the xylem keep the tissues more hydrated and exert a diluting action of salts.
The interaction between saline water and organic compost, as recorded for growth in height, stem diameter, number of leaves and leaf area, were not statistically influenced by the chlorophyll process, shoot and root biomass production and quality of oiticica seedlings (Table 3).

Cavalcante et al. 2801 Table 3. Summary of analysis of variance for chlorophyll a (Cla), chlorophyll b (Clb), total chlorophyll index (Clt), shoot dry matter (SDM), root dry matter (RDM) and Dickson Quality Index (DQI) of oiticica seedlings (L. rigida) in saline water and proportions of castor bean organic compost.
SOV df Mean square
Cla CIb CIt SDM RDM DQI
Blocks 4 3.27ns
0.29ns
4.12ns
2.06ns
0.45ns
0.44ns
Salinity (S) 4 165.18** 7.41** 231.05** 10.97**
0.51ns
1.99**
COC Proportions (P) 1 1,332.31** 16.70** 1,661.18** 25.92** 22.45** 0.06ns
S × P 4 9.61ns
0.48ns
10.36ns
1.07ns
0.46ns
0.22ns
Error 36 7.59 0.58 6.05 2.16 0.50 0.35
Total 49 - - - - - -
Linear Reg. 1 568.82** 21.16** 816.24** 36.00** 0.02ns
6.39**
Quadratic Reg. 1 91.05**
0.31ns
99.96** 1.03
ns 0.64
ns 0.08
CV (%) - 12.27 11.99 8.54 21.68 22.48 14.27
Figure 5. Chlorophyll a index of oiticica seedlings in saline water in (A) soil with organic compost and (B) soil without organic compost.
The highest estimated index of chlorophyll a was 25.71, referring to the estimated maximum water electric conductivity at 0.8 dS m
-1, but the irrigation with saline
water above that level (1.5, 3.0, 4.5 and 6.0 dS m-1
) hindered the production of chlorophyll a in oiticica by 0.54, 6.46, 18.83 and 37.61% (Figure 5A). Going by these results, salinity changes the metabolism and physiology of plants, with negative effects on the photosynthetic capacity and chlorophyll a accumulation. This is in agreement with those obtained in the study of Freire et al. (2014) and Souto et al. (2015) for yellow passion fruits and noni plants, respectively, which were irrigated with saline water.
Cattle manure unlike saline water, stimulates the production of chlorophyll a. This statement is based on a superiority of 59.79% more chlorophyll a in the leaves of plants from treatments with the organic compost in relation to soil without such organic input (Figure 5B). The organic input may have provided the release of liquid or solid humic substances to the substrate. This
decreased the osmotic potential difference of the substrate, promoting the release of compounds such as humic acids, which stimulate the osmotic adjustment of plants growing in a saline environment (Brahmaprakash and Sahu, 2012).
The increase in water salinity was linearly inhibited at a level of 0.373 per unit increase in the electrical conductivity of water. Chlorophyll b index decreased from 7.35 to 5.29, inducing a 28.03% loss among plants irrigated with water at 0.5 and 6.0 dS m
-1, and 5.11% per
unit increase in saline water irrigation (Figure 6A). The behavior of data are compatible with Scalon et al. (2003), who concluded that water or soil salt stress hinders the activity of chlorophyll b. According to the authors, this chlorophyll pigment captures energy from other wave lengths and transfers it to the chlorophyll a, which uses it in photosynthesis photochemical reactions. This function can be inhibited by salinity. This on the other hand, contradicts Bezerra et al. (2013), who established that the chlorophyll content in Parkinsonia aculeata plants

2802 Afr. J. Agric. Res.
Figure 6. Chlorophyll b index of oiticica seedlings in saline water with (A) soil with organic compost and (B) soil without organic compost.
Figure 7. Total chlorophyll index of oiticica seedlings in saline water with (A) in soil with organic compost and (B) in soil without organic compost.
was not reduced under salt stress. Cattle manure provided a 20% increase in the chlorophyll b contents of oiticica seedlings (Figure 6B) which is lower when compared to its effect on chlorophyll a.
The effects of saline water and cattle manure on chlorophyll a and b are transferred to total chlorophyll, which is the sum of both. Thus, the increase in the electrical conductivity of the irrigation water decreased the total chlorophyll index of oiticica plants from 32.87 to 32.44, 30.46, 26.78 and 21.42. There was a record of 1.22, 7.33, 18.53 and 34.83% losses among oiticica seedlings irrigated with water at 1.5, 3.0, 4.5 and 6.0 dS m
-1, respectively, in comparison with plants irrigated with
low-saline water (Figure 7A). Thus, the addition of the organic compost, similar to chlorophyll a and b, increased the total chlorophyll index of plants compared to plants in the substrate without organic compost (Figure 7B).
Chlorophyll absorbs quanta of light incident on leaves. This function is hindered when plants such as oiticica seedlings are subjected to salt stress, and this hindrance
results in photosynthetic deficiency. Similar results were reported by Mendonça et al. (2010), Silva et al. (2011), Matos et al. (2013), Freire et al. (2014), Souza et al. (2014) and Souto et al. (2015) for eucalyptus (Eucalyptus spp.), jatropha (Jatropha curcas), passion fruit and noni seedlings under irrigation with saline water.
Root dry matter accumulation of the seedlings was the only variable that did not respond to the effects of water salinity (Table 3). The data did not fit any regression model but corresponded with the average value of 3.13 g plant
-1 (Figure 8A). This behavior differs from that of the
vast majority of food and non-food plants classified as sensitive, moderately sensitive and moderately tolerant to water or soil salt stress (Ayers and Westcot, 1999).
These plants presented a hindered growth and yield potential due to either the increase in the salt content of the irrigation water, or of other recorded variables.
The decrease in growth was as low as 54.47% in seedlings without organic compost (Figure 8B).
The increase in water electrical conductivity did not
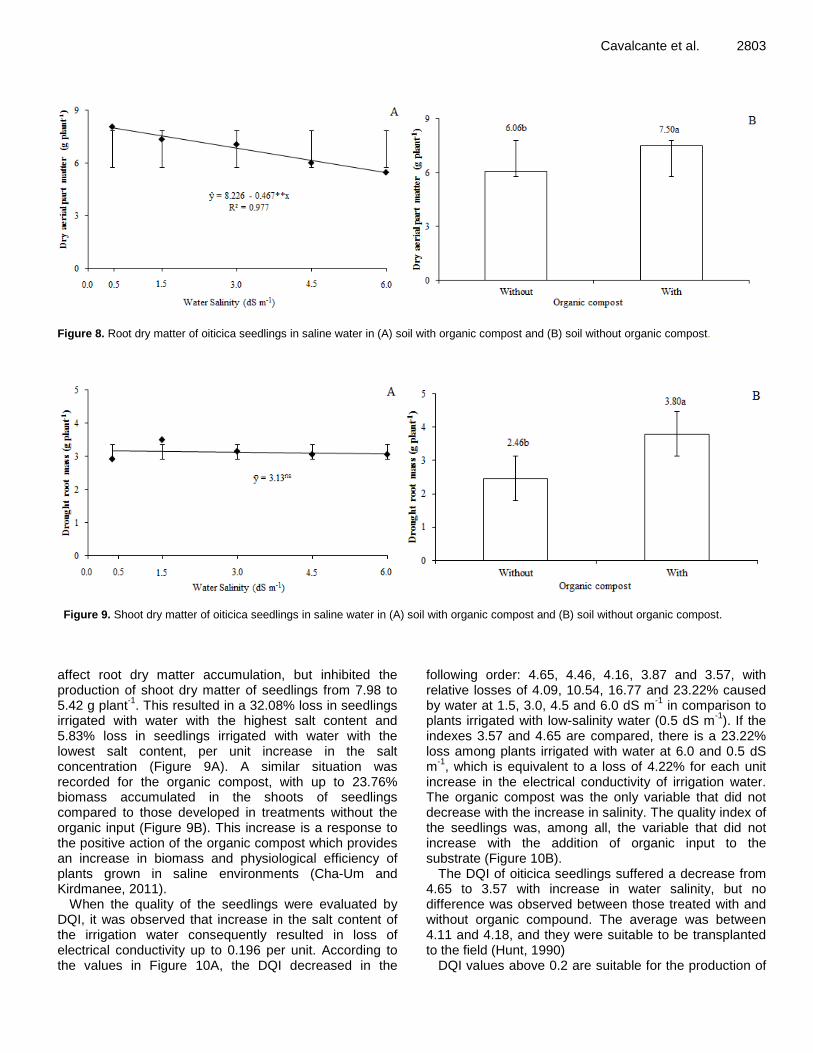
Cavalcante et al. 2803
Figure 8. Root dry matter of oiticica seedlings in saline water in (A) soil with organic compost and (B) soil without organic compost.
Figure 9. Shoot dry matter of oiticica seedlings in saline water in (A) soil with organic compost and (B) soil without organic compost.
affect root dry matter accumulation, but inhibited the production of shoot dry matter of seedlings from 7.98 to 5.42 g plant
-1. This resulted in a 32.08% loss in seedlings
irrigated with water with the highest salt content and 5.83% loss in seedlings irrigated with water with the lowest salt content, per unit increase in the salt concentration (Figure 9A). A similar situation was recorded for the organic compost, with up to 23.76% biomass accumulated in the shoots of seedlings compared to those developed in treatments without the organic input (Figure 9B). This increase is a response to the positive action of the organic compost which provides an increase in biomass and physiological efficiency of plants grown in saline environments (Cha-Um and Kirdmanee, 2011).
When the quality of the seedlings were evaluated by DQI, it was observed that increase in the salt content of the irrigation water consequently resulted in loss of electrical conductivity up to 0.196 per unit. According to the values in Figure 10A, the DQI decreased in the
following order: 4.65, 4.46, 4.16, 3.87 and 3.57, with relative losses of 4.09, 10.54, 16.77 and 23.22% caused by water at 1.5, 3.0, 4.5 and 6.0 dS m
-1 in comparison to
plants irrigated with low-salinity water (0.5 dS m-1
). If the indexes 3.57 and 4.65 are compared, there is a 23.22% loss among plants irrigated with water at 6.0 and 0.5 dS m
-1, which is equivalent to a loss of 4.22% for each unit
increase in the electrical conductivity of irrigation water. The organic compost was the only variable that did not decrease with the increase in salinity. The quality index of the seedlings was, among all, the variable that did not increase with the addition of organic input to the substrate (Figure 10B).
The DQI of oiticica seedlings suffered a decrease from 4.65 to 3.57 with increase in water salinity, but no difference was observed between those treated with and without organic compound. The average was between 4.11 and 4.18, and they were suitable to be transplanted to the field (Hunt, 1990)
DQI values above 0.2 are suitable for the production of

2804 Afr. J. Agric. Res.
Figure 10. Dickson quality index of oiticica seedlings in saline water in (A) soil with organic compost and (B) soil without organic compost.
seedlings and despite its decrease with increasing water salt content; the equivalence of DQI values in the presence and absence of organic matter signifies the tolerance of this species to salts during the phase of seedling formation or the early growth of plants. Diniz Neto et al. (2014) also recognized that the change caused by the addition of biofertilizer; and irrigation with saline water of different salt levels was not significant on the oiticica seedlings.
Growth inhibitions, chlorophyll index, production of shoot dry matter and quality index of seedlings are responses to the depressive action of water salinity in physiological processes. These physiological processes include: The opening and closing of stomata, carbon dioxide fixation, activity of chlorophyll and photosynthetic efficiency. This was stated by Taiz and Zeiger (2013) for plants in general and Souza et al. (2014, 2015) for noni plants. On the other hand, the increases in the variables are due to the high fertility potential of the organic compost provided by phosphorus, potassium, calcium and magnesium (Table 1). The increase is also due to the beneficial action of organic inputs which results in the physical improvement of the soil for the growth of the root system, as discussed by Mgbeze and Abu (2010) and Benbouali et al. (2013); and also the improvement in soil biological activity (Cha-Um and Kirdmanee, 2011). Conclusion The increase in water salinity inhibited biometric growth (except for root biomass), chlorophyll indexes, shoot dry matter and Dickson quality index of oiticica seedlings. The organic compost, except for the Dickson Quality Index, stimulated biometric growth; chlorophyll indexes and formation of shoot and root dry matter of seedlings. The quality index of seedlings did not decrease with the increase in salinity and did not vary with or without treatment with organic compost. The seedlings were also
observed to be suitable to be transplanted to the field. Conflict of Interests The authors have not declared any conflict of interests. REFERENCES Ayers RS, Westcot DWA (1999). Qualidade da água na agricultura.
Campina Grande: UFPB, Irrig. Dren. 29:153. Beltrão NEM, Oliveira MIP (2007). Oleaginosas potenciais do Nordeste
para a produção de biodiesel. Campina Grande: Embrapa Algodão. 2007. 54p.
Benbouali EH, Hamoudi SAEA, Larich A (2013). Short-term effect of organic residue incorporation on soil aggregate stability along gradient in salinity in the lower cheliff plain (Algeria). Afr. J. Agric Res. 8(19):2144-2152.
Bezerra FTC, Andrade LA, Cavalcante LF, Pereira WE, Bezerra MAF (2013). Emergência e crescimento inicial de plantas de Parkinsonia aculeata L. (fabaceae) em substrato salino. Rev. Árvore 37(4):611-618.
Brahmaprakash GP, Sahu PK (2012). Biofertilizers for sustainability. J. India Inst. Sci. 92:37-62.
Cavalcante LF, Rodolfo Júnior F, Sá JR, Curvelo CRS, Mesquita EF (2007). Influência da água salina e matéria orgânica no desempenho do maracujazeiro amarelo e na salinidade do substrato. Irrigation 12(4):505-518.
Centeno CRM, Azevedo CAV, Santos DB, Lira VM, Santos JB (2012). Estimación de la evapotranspiración del rícino (Ricinus communis L.) cv. BRS energía regado com diferentes niveles de água salina. Agrociencia 42:321-331.
Cha-Um S, Kirdmanee C (2011). Remediation of salt-affected soil by the addition of organic matter na investigation into improving glutinous rice productivity. Sci. Agric. 68(4):406-410.
Dickson A, Leaf AL, Hosner JF (1960). Quality appraisal of white spruce and white pine seedling stock in nurseries. For. Chron. 36:10-13.
Diniz BLMT, Cavalcante LF, Mesquita FO, Lima Neto AJ, Nunes JC, Diniz Neto MA (2013). Crescimento inicial e consumo hídrico de nim submetido ao estresse salino e biofertilizante bovino. Rev. Bras. Ciênc. Agrár. 8:470-475.
Diniz Neto MA, Silva I F, Cavalcante LF, Diniz BLMT, Silva JCA, SILVA EC (2014). Mudas de oiticica irrigadas com águas salinas no solo com biofertilizante bovino e potássio. Rev. Bras. Engen. Agríc. Ambie 18(1):10-18.
Donagema GK, Campos DVB, Calderano SB, Teixeira WG, Viana JHM

(2011). (Org.). Manual de métodos de análise de solo. 2. ed. Rio de Janeiro: Embrapa Solos 225p.
Empresa Brasileira De Pesquisa Agropecuária (EMBRAPA) (2013). Sistema brasileiro de classificação de solos. 3a. ed. Brasília: Embrapa 353p.
Freire ALO, Saraiva VP, Miranda JRP, Bruno GB (2010). Crescimento, acúmulo de íons e produção de tomateiro irrigado com água salina. Semina: Ciênc. Agrár. 31(1):1133-1144.
Freire JLO, Dias TJ, Cavalcante LF, Fernandes PD, Lima Neto AJ (2014). Rendimento quântico e trocas gasosas em maracujazeiro amarelo sob salinidade hídrica, biofertilização e cobertura morta. Rev. Ciênc. Agron. 45(1):82-91.
Hunt GA (1990). Effect of styroblock design and cooper treatment on morfhology of conifer seedlings. In: Target Seedlings Syposium, Meeting of the Western Forest Nursery Associations, 1990, Roseburg. Proceedings…. Fort Collins: United States Department of Agriculture, Forest Service. pp. 218-222.
Maia GN (2004). Caatinga: Árvores e arbustos e suas utilidades. São Paulo: D & Z. 413p.
Marschner H (2012). Mineral Nutrition of Higher Plants. London 651 p. Matos FS, Rocha EC, Cruvinel CKL, Ribeiro RA, Ribeiro RP, Tinoco CF
(2013). Desenvolvimento de mudas de pinhão-manso irrigadas com água salina. Rev. Bras. Ciênc. Solo 37(4):947-954.
Mellek JE, Dieckow J. Silva VL, Favaretto N, Pauletti V, Vezzani FM, Souza JLM (2010). Dairy liquid manure and no-tillage: Physical and hydraulic properties and carbon stocks in a Cambisol of Southern Brazil. Soil Till. Res. 110(1): 69-76.
Mendonça AVR, Carneiro JGA, Freitas TAS, Barroso DG (2010). Características fisiológicas de mudas de Eucalyptus spp submetidas a estresse salino. Ciênc. Flor. 20(2):255-267.
Mesquita FO, Nunes JC, Lima Neto AJ, Souto AGL, Batista RO, Cavalcante LF (2015). Formação de mudas de nim sob salinidade da água, biofertilizante e drenagem do solo. Irrigation 20(2):193-203.
Mgbeze GC, Abu Y (2010). The effects of NPK and farm yard manure on the growth and development of the African yam bean (Sphenostylis stenocarpa Hochst ex. a rich). Afr. J. Biotechnol. 9(37):6085-6090.
Ndubuisinnaji UU, Adegoke AA, Ogbu HI, Ezenobi NO, Okoh AI (2011). Effect of long-term organic fertilizer application on soil microbial dynamics. Afr. J. Biotechnol. 10(4):556-559.
Nóbrega RSA, Paula AM, Boas RCV, Nóbrega JCA, Moreira F MS (2008). Parâmetros morfológicos de mudas de Sesbania virgata (Caz.) Pers e de Anadenanthera peregrina (L.) cultivadas em substrato fertilizado com composto de lixo urbano. Rev. Árvore 32(3):597-607.
Primo DC, Fadigas FS, Carvalho JCR, Schmidt CDS, Borges Filho ACS (2010). Avaliação da qualidade nutricional de composto orgânico produzido com resíduos de fumo. Rev. Bras. Engen. Agríc. Ambie. 14(7):742-746.
Roque AA, Loiola MIB (2013). Potencial de uso dos recursos vegetais em uma comunidade rural no semiárido potiguar. Rev. Caatin. 26(4):88-98.
Cavalcante et al. 2805 Sall SN, Ndour NYB, Diedhiou-Sall S, Dick R, Chotte JL (2015).
Microbial response to salinity stress in a tropical sandy soil amended with native shrub residues or inorganic fertilizer. J. Environ. Manage. 161(1):30-37.
Scalon SPQ, Mussury RM, Rigoni MR, Scalon Filho R (2003). Crescimento inicial de mudas de Bombacopsis glabra (Pasq.) A. Robyns sob condição de sombreamento. Rev. Árvore 27(60):753-758.
Silva ABF, Fernandes PD, Gheyi HR, Blanco FF (2008). Growth and yield of guava irrigated with saline water and addition of farmyard manure. Rev. Brasi. Ciênc. Agrár. 3(4):354-359.
Silva EN, Ribeiro RV, Ferreira-Silva SL, Viégas RA, Silveira JAG (2011). Salt stress induced damages on the photosynthesis of physic nut young plants. Sci. Agric. 68(1):62-68.
Silva FAZ, Azevedo CAV (2002). Versão do programa computacional Assistat para o sistema operacional Windows. Rev. Bras. Prod. Agroind. 4:71-78.
Souto AGL, Cavalcante LF, Gheyi HR, Nunes JC, Oliveira FIF, Oresca D (2015). Photosynthetic pigments and biomass in noni irrigated with saline waters with and without leaching. Rev. Bras. Engen. Agríc. Ambie. 19(11):1035-1041.
Souza MCMR, Lacerda CFde, Amorim AV, Menezes AS (2014). Influência da matéria orgânica e do ambiente no crescimento e acúmulo de solutos em Morinda citrifolia submetida à salinidade. Rev. Bras. Frutic. 36(3):704-712.
Sucre B, Suáres N (2011). Effect of salinity and PEG-induced water stress on water status, gas exchange, solute accumulation, and leaf growth in Ipomoea pes-caprae. Environ. Exp. Bot. 70:192-203.
Taiz L, Zeiger E (2013). Fisiologia vegetal. 5.ed. Porto Alegre: Artmed 954p.
Vol. 11(30), pp. 2806-2816, 28 July, 2016
DOI: 10.5897/AJAR2015.10587
Article Number: 3DE2F0259776
ISSN 1991-637X
Copyright ©2016
Author(s) retain the copyright of this article
http://www.academicjournals.org/AJAR
African Journal of Agricultural Research
Full Length Research Paper
Abscisic acid-mediated stomatal closure and antioxidant defenses in Jatropha curcas L. seedlings
submitted to moderate water deficit
Leandro Dias da Silva1*, Tessio Araujo de Santana1, Priscila Souza de Oliveira1, Bruno Galvêas Laviola2, Márcio Gilberto Cardoso da Costa1, Alex-Alan Furtado de Almeida1 and
Fábio Pinto Gomes1
1State University of Santa Cruz, Department of Biological Sciences, Ilhéus, Bahia, Brazil
2Brazilian Agricultural Research Corporation (EMBRAPA) - Agroenergy, Brasília, Distrito Federal, Brazil
Received 29 October, 2015; Accepted 17 March, 2016
The objective of this research was to evaluate the biochemical changes in leaves from different genotypes of J. curcas in order to extend knowledge regarding the mechanisms of tolerance to water deficit and its variation in different genotypes. Potted plants of three genotypes (CNPAE 126, 137 and 139) were cultivated under water deficit conditions for 66 days. Two watering regimes, as measured by the percentage of field capacity (FC), were imposed: Control plants (100% FC) and plants submitted to water deficit (70% FC). After 66 days, no significant effects of treatment and of genotype on leaf water potential (Ψw) were observed. While the water deficit treatment led to significant increments in foliar concentrations of proline and soluble sugars in all genotypes, no significant effects of genotype or treatment on K
+ concentration were detected. In addition, significant differences among treatments and
genotypes in the activity of antioxidant enzymes (SOD, CAT and POD) and [ABA] in leaf and root were demonstrated. The genotypes exhibited an effective mechanism of response against the effects of water deficit, involving accumulation of compatible osmolytes, and increased antioxidants enzymes and ABA. Taken together, that results configure a strategy for maintenance of leaf hydration under moderate water deficit. Key words: Abiotic stress, antioxidant enzymes, compatible osmolytes, Euphorbiaceae, gas exchange.
INTRODUCTION The development of human civilization and industrialization has long been based on fossil fuels utilization. However, oil reserves are running out at an
ever-increasing speed, this being accompanied by a sharp increase of CO2 in the atmosphere, one of the main greenhouse gases. In the quest for sustainable systems,
*Corresponding author: [email protected]. Tel: +55 75 98808-4480.
Author(s) agree that this article remain permanently open access under the terms of the Creative Commons Attribution
License 4.0 International License

coupled with gradual reduction of oil reserves, productive alternatives are being studied, and Jatropha curcas L. stands out due to its high oil productivity per hectare (Dias et al., 2007) and development in areas of low rainfall (Maes et al., 2009).
J. curcas, belonging to the Euphorbiaceae family, is native to the Americas and is widespread in tropical and subtropical regions of the globe, such as Asia, Africa and India (Divakara et al., 2010). Although it is considered to be a plant with the potential to provide raw material for fuel, this oilseed species is still in its domestication phase (Laviola et al., 2011). In recent years, a subject of special attention because of high oil content in seeds, which can easily be converted into biodiesel. Thus, J. curcas is being considered to be a source of energy and has attracted scientific and economic interest (Kumar and Sharma, 2008).
Water deficit is considered to be the environmental factor that most significantly influences plant growth and yield (Kramer and Boyer, 1995). Therefore, understand-ing the physiological and biochemical mechanisms that are involved with any level of plant response to water deficit is of uppermost interest (Slama et al., 2007). In order to increase their tolerance to dry conditions, some species develop some mechanisms such as, for example, accumulating osmotically active solutes in the cell cytoplasm, such as proline, soluble sugars and potassium (Silva et al., 2010a) as well as antioxidant enzymes such as superoxide dismutase (SOD; EC 1.15.1.1), peroxidase (POD; EC 1.11.1.7) and catalase (CAT; EC 1.11.1.6) (Pompelli et al., 2010a).
The mechanism of osmotic adjustment in plants has been considered as an important physiological strategy associated with drought tolerance (Hessine et al., 2009). It leads to increased water uptake and to increased cell growth of plants during drought stress associated with the partial opening of the stomata allowing CO2 assimilation at low water potential (Alves and Setter, 2004). According to Silva et al. (2010b), an efficient mechanism of osmotic adjustment was demonstrated in J. curcas in response to drought stress, which involved inorganic and organic osmolytes.
The activity of antioxidant enzymes such as SOD, POD and CAT may be an important mechanism in response to environmental stresses such as drought. Arcoverde et al. (2011), working with young plants of J. curcas in 10 L pots, found that the antioxidant mechanism has been effective thus increasing their activity from moderate stress.
The objective of the present work was to evaluate the biochemical responses in genotypes of J. curcas in order to generate additional information for the studies on physiological processes involved in plant tolerance to water deficit. We hypothesized that (1) accumulation of solutes osmotically active (osmotic adjustment) and stomatal control mediated by ABA are strategies used by J. curcas aimed at maintaining the hydration status
da Silva et al. 2807 under water stress conditions and (2) different genotypes show distinct responses to water deficit in terms of concentration of abscisic acid and antioxidant enzymes.
MATERIALS AND METHODS
Plant material and growing conditions
The experiment was performed in a greenhouse, at the State University of Santa Cruz (UESC) campus, located in Ilhéus, Bahia (14°47'00" S, 39°02'00" W), between July and September 2011. The maximum and minimum values of air temperature measured during the experimental period were 27 and 22°C, respectively. The mean relative air humidity was recorded at 77%. The mean daily value of photosynthetically active radiation was 11.7 mol photons m-
2 day-1. J. curcas seeds from the genotypes CNPAE 126, 137 and 139
were provided by the germplasm bank of EMBRAPA Agroenergia - Distrito Federal, Brazil. Seeds were germinated in pots containing 50 dm³ of a soil:sand (2:1) mixture, which was previously prepared according to chemical analysis of the substrate. After a germination period of 15 days, thinning was performed, leaving only one plant per pot. The pots were immediately covered with aluminum foil to prevent evaporation and heating of the soil and the water deficit treatment was set. Water deficit treatment was maintained for a period of 66 days.
The treatments were made up of two watering regimes, which were adjusted as a percentage of field capacity (FC): control plants (100% FC) and plants submitted to water deficit (70% FC). Throughout the experimental period the control plants were irrigated close to field capacity (matric potential of -7.4 to -9.8 kPa). Water deficit plants were kept in the range between -99.0 and -33.5 kPa. The water content and matric potential in the substrate were determined by use of the gravimetric method and of a characteristic water retention curve, respectively.
Water relations parameters
Pre-dawn (Ψpd) and midday (Ψmd) leaf water potential were measured weekly at 04:00 and 12:00, respectively. A PMS-1000 pressure Chamber (PMS Instrument Company, USA) was used in accordance with the methodology proposed by Scholander et al. (1956) with some modifications. After placing the sheet on the cylinder, we used absorbent paper pressing lightly on incision to extract the excess latex.
The leaf relative water content (RWC) was calculated using the formula: RWC = [(FW-DW)/(TW-DW)] × 100, where FW is the fresh weight, TW is the turgid weight measured after 24 h of saturation in deionized water in the dark, and DW is the dry weight determined after 48 h in an oven at 75°C.
Leaf gas exchanges
The leaf gas exchanges were evaluated 66 days after imposition of treatment (DAT) in fully mature leaves, between 8 and 11 h with a Li-6400 portable photosynthesis measurement system (Li-Cor, Inc., Lincoln, NE, USA) under artificial light saturating 1000 μmol photons m-2 s-1 and atmospheric CO2 concentration (CA) of 380 μmol mol-1. The photosynthetic rate (PN, μmol m-2 s-1), the stomatal conductance to water vapor (gS, mol m-2 s-1), the transpiration rate (E, mmol m-2 s-1) and the ratio between the internal and atmospheric concentrations of CO2 (CI/CA) were calculated using the values of the variations of the concentrations of CO2 and H2O vapor inside the chamber. Through the gas exchange data were

2808 Afr. J. Agric. Res. estimated photosynthetic efficiency of water use, intrinsic (PN /gS, μmol mol-1) and instant (PN /E, μmol mmol-1). Osmotic potential and osmotic adjustment Five leaf disks (5 mm in diameter) were collected at 66 DAT from the leaves of the middle third of the shoot of four randomly chosen plants from each treatment. The discs were frozen in liquid nitrogen, and after thawing and temperature stabilization were placed in the chamber to obtain the osmotic potential (Ψs) readings. Osmotic potential was measured using a thermocouple psychrometer (C-52 Chamber model, Wescor Inc., Logan, Utah, USA), connected to a dew point microvoltimeter (PsyPRO, Wescor Inc., Logan, USA) operating in a psychrometric method. The values Ψs were corrected to eliminate the effect of passive concentration of solutes caused by foliar dehydration, in accordance with Wilson et al. (1979). Osmotic adjustment was calculated as the difference in corrected Ψs of control and stressed plants. Antioxidant enzymes activities Antioxidant enzymes were determined at the end of the experiment (66 DAT). Leaf samples were collected from the third fully expanded mature leaf, immediately frozen in liquid nitrogen, lyophilized and stored in a freezer (-20°C) until the moment of analyses.
Peroxidase activity (POD; EC 1.11.1.7) was determined in accordance with the method by Rehem et al. (2011). Microplates with 96 wells and a 300 μL capacity were used, containing 140 µl of POD reaction buffer 2× [40 mmol L-1 of guaiacol, H2O2 at 0.06% and sodium phosphate (20 mmol L-1, pH 6.0)], 139 μL of phosphate buffer (50 mmol L-1, pH 6.0) and 1 µL of enzyme extract which was previously diluted. The absorbance variation at 470 ηm was monitored for 60 s of reaction at 25°C, in a microplate spectrophotometer (VERSAmax).
The superoxide dismutase (SOD; EC 1.15.1.1) was determined by measuring its ability to inhibit the photochemical reduction of nitro blue tetrazolium (NBT). 100 μL aliquots of the enzyme extraction were then transferred to test tubes and protected from light; these contained 50 mM of potassium phosphate buffer, pH 7.8, 0.1 mM of EDTA, 13 mM of L-methionine and 75 μM of NBT. The reaction was initiated through the addition of 2 μM of riboflavin and the concomitant transfer of the tubes to a chamber lit by a 30 Watt circular fluorescent lamp, for a 15 min period. Following this, the absorbance readings at 560 ηm were performed in a spectrophotometer. The activity was determined by calculating the amount of extract that inhibited 50% of NBT reduction (Beauchamp and Fridovich, 1971) and expressed in U kg-1 DM.
The enzyme catalase activity (CAT; EC 1.11.1.6) was determined according to the methodology as described by Madhusudhan et al. (2003), whose activity is defined by the amount of enzyme required to catalyze the decomposition of H2O2. For the test, 20 μL of the enzymatic extract was added to 0.98 mL of sodium phosphate buffer 0.05 M pH 7.0, H2O2 0.0125 M which was supplemented with hydrogen peroxide to a final concentration of 12.5 mM. CAT activity was determined through measuring the reduction in absorbance of samples at 240 ηm, this being a consequence of H2O2 consumption, using the molar extinction coefficient of 36 M-1 cm-1. Determination of organic and inorganic solutes At 66 DAT, concentrations of compatible osmolytes were determined. Concentrations of proline were analyzed using the acidic Ninhydrin method (Bates et al., 1973). The total soluble
sugar content was determined using the phenol-sulfuric method according to Clegg (1956) and potassium (K+), was analyzed by flame photometry, according to the methodology as described by Viégas et al. (2001). Abscisic acid concentration (ABA) ABA extraction was carried out at 66 DAT according to the method as described by Kato et al. (2006). ABA quantification in the extracts was performed by means of the ELISA test, using a commercial kit (Phytodetek® ABA Test Kit), in accordance with the manufacturers recommendations. Following this, optical density readings were taken by means of a microplate spectrophotometer (Biotek, ELX 800 Instruments, Inc, Winooski, VE, USA) using a wavelength of 405 ηm. Experimental design and statistical analysis The experimental design was completely randomized with a 2×3 factorial scheme, made up of two levels of water availability and three genotypes of J. curcas, with four repetitions per treatment. The results were submitted to an F-test at a 5% significance level, by factorial ANOVA and, when indicated, the mean comparisons were performed by means of a Tukey test at the same significance level. RESULTS Substrate water content was 9.8 and 6.3%, on average, in control (well-watered) and water deficit (WD) treatments, respectively. The substrate matric potential (Ψm) calculated using the characteristic curve of water retention, varied between -9.8 and -7.4 kPa and -98.6 and -33.5 kPa in control and WD, respectively.
There were the significant differences (P<0.05) in pre-dawn (Ψpd) and midday leaf water potential (Ψmd) and in RWC among genotypes after 66 DAT (Table 1). Despite non significant, plants of CNPAE-126 presented a smaller amplitude (-0.25 MPa) between the Ψpd and Ψmd when compared with other genotypes. On the other hand, a significant difference (P<0.05) between the genotypes for osmotic adjustment (OA) was detected. The genotypes CNPAE-126 and 139 showed no OA, as the values of Ψs were -0.80 and 0.02, respectively. However, the genotype CNPAE-137 showed a value 0.30, which may indicate some degree of OA, despite no significant effect of treatments has been detected (Table 1).
No significant differences were observed (P<0.05) among the genotypes of J. curcas for the foliar concentration of proline (Figure 1A). Water deficit led to a significant (P<0.05) increase (58%) in foliar concentration of proline when compared to control plants. Genotype CNPAE-126 was the only in which significant differences (P<0.05) between treatments for total soluble sugars (TSS) were observed. Interestingly, high concentration (160.0 mg g
-1) was measured in control, as compared to
water deficit plants (94.5 mg g-1
) (Figure 1B). There was no significant effect of genotype for TSS. In addition, no

da Silva et al. 2809
Table 1. Pre-dawn (Ψpd) and midday (Ψmd) leaf water pontential, corrected osmotic potential (Ψsc) and osmotic adjustment (OA) in plants of J.curcas under different water conditions, control (C) and water defict (WD) at 66 days after the imposition of treatment (DAT). Values are means (s.e.) of five replicates.
Genotypes CNPAE-126 CNPAE-137 CNPAE-139
Ψpd (- MPA)
C 0.47±0.04Aa
0.45±0.05Aa
0.46±0.03Aa
WD 0.50±0.08Aa
0.46±0.13Aa
0.55±0.05Aa
Ψmd(-MPa)
C 0.72±0.06Aa
0.81±0.04Aa
0.75±0.08Aa
WD 0.75±0.09Aa
0.87±0.06Aa
0.95±0.01Aa
Ψsc(-MPa)
C 2.40±1.26Aa
1.34±0.15Ba
1.41±0.14Ba
WD 1.60±0.31Ab
1.64±0.12Aa
1.43±0.10Aa
OA
-0.80±0.10b 0.30±0.03
a 0.02±0.07
a
Lower case letters indicate significant differences between treatments within each genotype and capital letters indicate significant differences by genotypes within each treatment by Tukey test (P<0.05).
significant (P<0.05) differences were observed neither among the genotypes, nor between the treatments for the concentration of K
+ in J. curcas leaves (Figure 1C).
The values of PN, gS, E, and CI/CA at 66 DAT were significantly (P<0.05) reduced in stressed as compared to control plants. Such reduction reached 81, 90, 86 and 37%, respectively (Figure 2). Moreover, the values of PN/gS and PN/E in WD plants increase of 52 and 74%, respectively, as compared to control plants (Figure 2).
Water deficit led to a significant increase in the SOD, POD and CAT enzymes in J. curcas leaves 66 DAT. Regarding SOD, the genotype CNPAE-137 differed from the others, showing a lower activity of this enzyme. The values of SOD activity in genotype CNPAE-137 were, on average, 0.06 and 0.04 U kg
-1 DM in WD and control
plants, respectively (Figure 3A). Significant (P<0.05) effects of genotype and of treatments in POD activity were detected. Water stress led to increases of 25, 35 and 2% in POD activity measured in WD plants of CNPAE-126, 137 and 139, respectively, as compared to their control plants (Figure 3B). Moreover, POD activity in WD plants was significantly (P<0.05) higher in CNPAE-137 (0.690 mmol h
-1 kg
-1 DM) than in CNPAE-126 (0.598
mmol h-1
kg-1
DM) and CNPAE-139 (0.604 mmol h-1
kg-1
DM). There were significant differences (P<0.05) among genotypes, as well as between treatments in CAT activity (Figure 3C). Water stress led to 32% increase, on average, in CAT activity, when compared to control plants. CAT activity was significantly higher in genotype CNPAE-126 of the two treatments, than in the other two genotypes. The values of CAT activity measured in WD plants were 39% higher than in control plants.
During the 66 DAT, there were significant differences (P<0.05) in ABA foliar concentration ([ABA]) among the water regimes, as well as among the genotypes. Water
stress led to an increase in [ABA], of 136.4, 21.8 and 15.7 for the genotypes CNPAE-126, 137 and 139, respectively. The higher [ABA] leaf was found in the genotype CNPAE-126 which showed 100.42 ng g
-1 DM
for WD leaves, when compared to their controls (Figure 4A). Upon comparison, the J. curcas roots presented a lower [ABA] in relation to the leaves, presenting average values of 11.14, 13.19 and 10.09 ng g
-1 DM for the
genotypes CNPAE-126, 137 and 139, respectively (Figure 4B). DISCUSSION The lack of variation on the Ψw in J. curcas plants is probable explained by the internal redistribution of the water stored in the succulent stems. Therefore, water supply and conservation in order to foster a water deficit tolerance could be suggested as an important role for the succulent stem, as quoted by Maes et al. (2009).
Water conservative behavior through an efficient stomatal regulation, as indicated by measurements of leaf RWC and Ψw, has been commonly observed in young and adult plants (Díaz-López et al., 2012; Fini et al., 2013; Sapeta et al., 2013). The water content in tissues in J. curcas reveals a conservation strategy for this species to tolerate dry periods. According to Silva et al. (2011), osmotic adjustment mechanism is responsible for maintaining a high RWC in J. curcas of tissues.
In the present study, even though a tissue water maintenance strategy has been demonstrated, no significant osmotic adjustment was found. The genotypes avoided the loss of water in leaves through an efficient stomatal control of transpiration (Silva et al., 2010b). Rather than acting as an osmoregulator, in the present
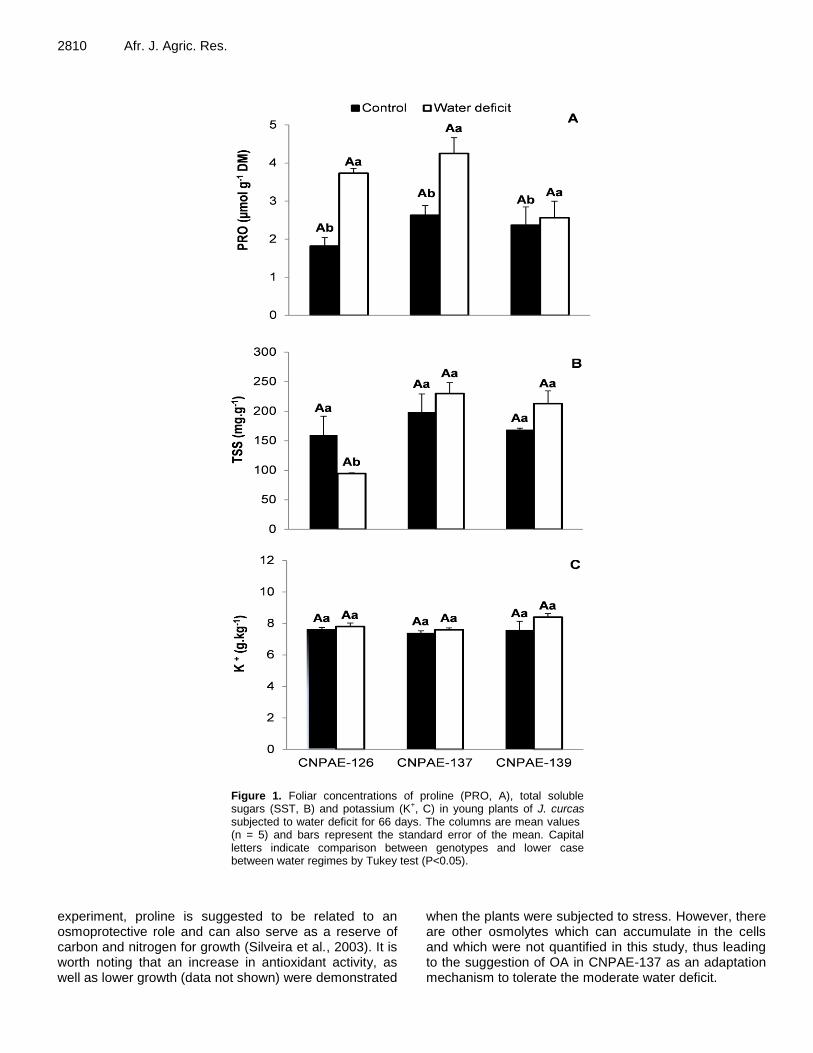
2810 Afr. J. Agric. Res.
Figure 1. Foliar concentrations of proline (PRO, A), total soluble sugars (SST, B) and potassium (K+, C) in young plants of J. curcas subjected to water deficit for 66 days. The columns are mean values (n = 5) and bars represent the standard error of the mean. Capital letters indicate comparison between genotypes and lower case between water regimes by Tukey test (P<0.05).
experiment, proline is suggested to be related to an osmoprotective role and can also serve as a reserve of carbon and nitrogen for growth (Silveira et al., 2003). It is worth noting that an increase in antioxidant activity, as well as lower growth (data not shown) were demonstrated
when the plants were subjected to stress. However, there are other osmolytes which can accumulate in the cells and which were not quantified in this study, thus leading to the suggestion of OA in CNPAE-137 as an adaptation mechanism to tolerate the moderate water deficit.

da Silva et al. 2811
Figure 2. Net photosynthetic rate (PN, A), stomatal conductance (gS, B), transpiration rate (E, C), intrinsic efficiency (PN / gS, D), instantaneous efficiency (PN/ E, E) e ratio of intercellular and atmospheric concentrations of CO2 (CI/CA, F) in young plants of J. curcas subjected to water deficit for 66 days. The columns are mean values (n = 4) and bars represent the standard error of the mean. Capital letters indicate comparison between genotypes and lower case between water regimes by Tukey test (P<0.05).
The accumulation of compatible osmolytes (TSS and proline) in J. curcas plants subjected to WD may be related to the mechanism that prevents the water loss. In another survey, Babita et al. (2010) detected increased
concentration of osmolytes such as proline and soluble sugars in a drought tolerant genotype Ricinus communis L. under water deficit. Although our data do not show significant differences in the concentration of TSS,

2812 Afr. J. Agric. Res.
Figure 3. Activities of the enzymes superoxide dismutase (SOD, A), peroxidase (POD, B) and catalase (CAT, C) in leaves of three genotypes of J. curcas subjected to water deficit for 66 days. The columns are mean values (n = 5) and bars represent the standard error of the mean. Capital letters indicate comparison between genotypes and lower case between water regimes by Tukey test (P<0.05).

da Silva et al. 2813
Figure 4. Concentration of ABA in leaves (A) and roots (B) in three genotypes of Jatropha curcas subjected to water deficit for 66 days. The columns are means (n = 5) and bars represent the standard error of the mean. Capital letters indicate comparison between genotypes and lower case between water regimes by Tukey test (P<0.05).

2814 Afr. J. Agric. Res. possibly by the stress applied, Silva et al. (2010b) report that the increase of this osmolyte is the largest contributor to OA.
Even though there were no changes in foliar concentration of K
+ in this research, this inorganic ion is
involved in osmotic regulation for both WD as well as control plants. It has been demonstrated that, despite non-significantly changed in leaves, the content of K
+
contributed to 25% of the osmotic potential in stressed as compared to control plants (Silva et al., 2010b).
Water deficit-induced stomatal closure, as observed in the present investigation, is a strong mechanism of response in J. curcas, being an important component of drought tolerance in this species. Similar studies were reported by Pompelli et al. (2010), Silva et al. (2012), Sapeta et al. (2013) and De Santana et al. (2015). Pompelli et al. (2010a) demonstrated a reduction of PN to values lower than 5 CO2 μmol m
-2 s
-1 when the water
content of the soil has reached the level of 5%. With the significant effect on PN, gS and E the intrinsic water use efficiency (PN/gS) and instant (PN/E) had increases in stressed plants, demonstrating that the limitation of PN was mainly stomatal. Higher PN/gs and PN/E in plants under WD have been demonstrated elsewhere, under several levels of water deficit (Diaz-Lopez et al., 2012; Fini et al., 2013).
Studies have shown a decline in the carbon cycle and increase of antioxidant enzymes when plants are water stressed (Da Matta et al., 2008). Among the several mechanisms of response to water deficit, the ability to maintain high levels of antioxidant enzymes such as SOD, POD and CAT, has been demonstrated (Zimmerman et al., 2006). The activity of one or more antioxidant enzymes generally increases in plants that are exposed to stress conditions, and this activity correlates with an increased tolerance to stress (Pilon et al., 2006). In this study, moderate water stress led to significant an increase in antioxidant enzymes.
Some studies have reported that water shortage produces oxidative stress as a result of an increase in ROS and also that many plants are able to cope with this by activating their antioxidant enzymes (Simova-Stoilova et al., 2009). Lower SOD activity was measured in leaves from the genotype CNPAE-137, thus the genotypes CNPAE-126 and 139 can be considered as more efficient at removing O2
•- toxic radicals. Various abiotic stresses
often led to an increase in ROS generation in which SOD has been an important enzyme for the plant stress tolerance, providing the first line of defense against the toxic effects of high levels of ROS (Gill and Tuteja, 2010).
It has been reported that the activity of POD in J. curcas is sensitive to water deficit (Kumar and Sharma, 2008). This means that the genotypes that were studied maintain a higher POD activity in plant leaves under WD, thereby giving rise to water deficit tolerance. The CAT antioxidant enzyme works to remove the H2O2 that is generated in peroxisomes by oxidases involved in the
β-oxidation of fatty acids, photorespiration, purine catabolism and during oxidative stress (Vellosillo et al., 2010). Our data show that CAT activity increased in plants subjected to WD, which suggest a more efficient system in the elimination of ROS and thus maintaining a balance between ROS production and antioxidant enzymes for preventing oxidative damage under water deficit. Pompelli et al. (2010a), studying J. curcas under two water regimes (control and water deficit) for 4, 8 and 18 days, found that the WD induced the increase of antioxidant enzymes such as SOD, CAT and POD in leaves. The authors also report that the activity of these enzymes were more significant at 8 and 18 days of stress.
In the present study, elevated activity of SOD (43.7%) have been demonstrated, which can be related to the regulation of the expression of isoforms of this enzyme. The POD increased by 19.5% in stressed plants, showing an efficient mechanism against the accumulation of ROS, especially H2O2 present in chloroplasts. CAT had already increased 33.3% in plants subjected to WD compared to control plants, support in the removal of H2O2 present in peroxisomes. Thus, our data show that the antioxidant enzymes are effective in the removal of ROS in leaves of J. curcas. Similar results were found by Pompelli et al. (2010a), studying J. curcas subjected to water deficit for 18 days was found to increase SOD activity by 72.7%, POD by 45.0% and CAT by 20.0%, thus indicating that antioxidant enzymes are involved in the defense mechanism against oxidative stress during water deficit.
ABA has a central role in plant responses to water deficit by means of a large number of processes, with signaling pathways that have not yet been completely understood, despite the discovery of putative ABA receptors (Pandey et al., 2009). At the cellular level it controls the enzyme synthesis that acts to protect cells under high stress, such as dehydration (Li et al., 2002), stomatal closure (Christmann et al., 2007), hydraulic conductivity (Parent et al., 2009) and also to protect the growth of roots and shoots (Sharp, 2002). Throughout this research, there was a buildup in leaf [ABA] in all J. curcas genotypes, thereby corroborating those results found in cassava (Alves and Setter, 2004) and castor beans (Jokhan et al., 1996) two other species of Euphorbiaceae.
The concentration of ABA increased substantially roots of WD plants of all genotypes. However, only in CNPAE-137 such increment corresponded to an increase of organic solutes such as sugars and proline. However, Wilkinson and Davies (2002) reported that once inside the root, ABA may be translocated by the symplast and then stored or degraded, or can be transferred from one cell to another through the vessels of xylem, or may be carried by the apoplast to the transpiration stream to the xylem. In this research, the [ABA] the roots may have contributed to the increase in hydraulic conductivity, occurring thus, increased water absorption in J. curcas of

tissues under conditions of moderate water deficit. Conclusion The results revealed an efficient system for protection against drought-induced oxidative stress, through increased activity of antioxidant enzymes. Such strategy, observed in all the three genotypes, is suggested to be an important component of drought tolerance in J. curcas. Osmotic adjustment was not observed despite the increase in proline which apparently acts as an osmoprotector. Drought-induced increased foliar [ABA] was demonstrated and may have influenced stomatal control leading to the maintenance of foliar water status.
Abbreviations
ABA, abscisic acid; [ABA], abscisic acid foliar concentration; CAT, catalase; DAT, days after treatment initiation; DM, dry matter; FC, field capacity; K
+,
potassium; NBT, nitroblue tetrazolium; OA, osmotic adjustment; POD, peroxidase; PRO, proline; ROS, reactive oxygen species; SOD, superoxide dismutase; TSS, total soluble sugar; WD, water deficit; Ψam, leaf water potential pre-dawn; Ψmd, leaf water potential midday; Ψm, substrate matric potential; Ψs, osmotic potential. Conflict of Interests The authors have not declared any conflict of interests. ACKNOWLEDGEMENTS Financial support for the investigation was provided by National Council for Scientific and Technological Development, CNPq (Grants 486218/2011-2). Fábio P. Gomes, Alex-Alan F. de Almeida and Márcio Gilberto C. Costa gratefully acknowledge the CNPq, Brazil, for the concession of a fellowship of scientific productivity. REFERENCES
Alves AAC, Setter TL (2004). Abscisic acid accumulation and osmotic
adjustment in cassava under water deficit. Environ. Exp. Bot. 51:259-271.
Arcoverde GB, Rodrigues BM, Pompelli MF, Santos MG (2011). Water relations and some aspects of leaf metabolism of Jatropha curcas young plants under two water deficit levels and recovery. Braz. J. Plant Physiol 23:123-130.
Bates LS, Waldern RP, Teare IK (1973). Rapid Determination of Free Proline for Water Stress Studies. Plant Soil 39:205-208.
Beauchamp C, Fridovich I (1971). Superoxide dismutase: Improved assays and an assay applicable to acrylamide gels. Anal. Biochem. 44:276-287.
da Silva et al. 2815 Christmann A, Weiler EW, Steudle E, Grill E (2007). A hydraulic signal
in root-to-shoot signalling of water shortage. Plant J. 52:167-174. Clegg KM (1956). The application of the anthrone reagente to the
estimation of starch in cereals. J. Sci. Food Agric. 3:40-44. Da Matta FM, Cunha RL, Antunes WC, Martins SCV, Araújo WL, Fernie
AR, Moraes GABK (2008). In field-grown coffee trees source-sink manipulation alters photosynthetic rates, independently of carbon metabolism, via alterations in stomatal function. New Phytol. 178(2):348-357.
De Santana TA, Oliveira PS, Silva LD, Laviola BG, Almeida A-AF, Gomes FP (2015). Water use efficiency and consumption in different Brazilian genotypes of Jatropha curcas L. subjected to soil water deficit. Biomass Bioenergy 75:119-125.
Dias LDS, Leme LP, Laviola BG, Pallini FA, Pereira OL, Carvalho M, Manfio CE, Santos AS, Sousa LCA, Oliveira TS, Dias DCFS (2007). Cultivo de pinhão-manso (Jatropha curcas L.) para produção de óleo combustível. Viçosa, MG. 1:1-40.
Díaz-López L, Gimeno V, Simón I, Martínez V, Rodríguez-Ortega WM, García-Sánchez F (2012). Jatropha curcas seedlings show a water conservation strategy under drought conditions based on decreasing leaf growth and stomatal conductance. Agric. Water Manag. 105:48-56.
Divakara BN, Upadhyaya HD, Wani SP, Laxmipathi Gowda CL (2010). Biology and genetic improvement of Jatropha curcas L.: A review. Appl. Energy 87:732-742.
Fini A, Bellasio C, Pollastri S, Tattini M, Ferrini F (2013). Water relations, growth, and leaf gas exchange as affected by water stress in Jatropha curcas. J. Arid Environ. 89:21-29.
Gill SS, Tuteja N (2010). Reactive oxygen species and antioxidant machinery in abiotic stress tolerance in crop plants. Plant Physiol. Biochem. 48:909-930.
Hessine K, Martínez JP, Gandour M, Albouchi A, Soltani, A, Abdelly C (2009). Effect of water stress on growth, osmotic adjustment, cell wall elasticity and water-use efficiency in Spartina alterniflora. Environ. Exp. Bot. 67:312-319.
Jokhan AD, Else MA, Jackson MB (1996). Delivery rates of abscisic acid in xylem sap of Ricinus communis L. plants subjected to part-drying of the soil. J. Exp. Bot. 47:1595-1599.
Kato M, Matsumoto, H, Ikoma Y, Okuda H, Yano M (2006). The role of carotenoid cleavage dioxygenases in the regulation of carotenoid profiles during maturation in citrus fruit. J. Exp. Bot. 57:2153-2164.
Kramer PJ, Boyer JS (1995). Water relations of plants and soils. San Diego: Academic Press. 495 p.
Kumar A, Sharma S (2008). An evaluation of multipurpose oil seed crop for industrial uses (Jatropha curcas L.): A review. Ind. Crop. Prod. 28:1-10.
Laviola BG, Bhering LL, Mendonça S, Rosado TB, Albrecht JC (2011). Caracterização morfo-agronômica do banco de germoplasma de pinhão-manso na fase jovem. Biosci. J. 27:371-379.
Li J, Kinoshita T, Pandey S, Ng CK, Gygi SP, Shimazaki K, Assmann SM (2002). Modulation of an RNA-binding protein by abscisic-acid-activated protein kinase. Nature 418:793-797.
Madhusudhan R, Ishikawa T, Sawa Y, Shigeoka S, Shibata H (2003). Characterization of an ascorbate peroxidase in plastids of tobacco BY-2 cells. Physiol. Plant. 117:550-557.
Maes WH, Achten WMJ, Reubens B, Raes D, Samson R, Muys B (2009). Plant–water relationships and growth strategies of Jatropha curcas L. seedlings under different levels of drought stress. J. Arid. Environ. 73:877-884.
Pandey S, Nelson DC, Assmann SM (2009). Two novel GPCR-type G proteins are abscisic acid receptors in Arabidopsis. Cell 136:136-148.
Parent B, Hachez C, Redondo E, Simonneau T, Chaumont F, Tardieu F (2009). Drought and abscisic acid effects on aquaporin content translate into changes in hydraulic conductivity and leaf growth rate: A trans-scale approach. Plant Physiol. 149:2000-2012.
Pilon M, Abdel-Ghany SE, Cohu CM, Gogolin KA, Ye H (2006). Copper cofactor delivery in plant cells. Curr. Opin. Plant Biol. 9:256-263.
Pompelli MF, Barata-Luís RM, Vitorino HS, Gonçalves ER, Rolim EV, Santos MG, Almeida-Cortez JS, Ferreira VM, Lemos EEP, Endres L (2010a). Photosynthesis, photoprotection and antioxidant activity or purging nut under drought deficit and recovery. Biomass Bioenergy 34:1207-1215.

2816 Afr. J. Agric. Res. Rehem BC, Almeida AAF, Santos IC, Gomes FP, Pirovani CP,
Mangabeira PAO, Corrêa RX, Yamada MM, Valle RR (2011). Photosynthesis, chloroplast ultrastructure, chemical composition and oxidative stress in Theobroma cacao hybrids with the lethal gene Luteus-Pamutant. Photosynthetica 49:127-139.
Sapeta H, Costa JM, Louren T, Maroco J, Van der Linde P, Oliveira MM (2013). Drought stress response in Jatropha curcas: Growth and physiology. Environ. Exp. Bot. 85:76-84.
Scholander PF, Hammer HT, Bradstreet ED, Haningsen EA (1956). Sap pressure in vascular plants. Science 148:339-346.
Sharp RE (2002). Interaction with ethylene: changing views on the role of abscisic acid in root and shoot growth responses to water stress. Plant Cell Environ. 25:211-222.
Silva EN, Ferreira-Silva SL, Fontenele AV, Ribeiro RV, Viégas RA, Silveira JAG (2010a). Photosynthetic changes and protective mechanisms against oxidative damage subjected to isolated and combined drought and heat stresses in Jatropha curcas plants. J Plant Physiol. 167:1157-1164.
Silva EN, Ferreira-Silva SL, Viégas RA, Silveira JAG (2010b). The role of organic and inorganic solutes in the osmotic adjustment of drought-stressed Jatropha curcas plants. Environ. Exp. Bot. 69:279-285.
Silva EN, Ribeiro RV, Ferreira-Silva SL, Viégas RA, Silveira JAG (2011). Salt stress induced damages on the photosynthesis of physic nut young plants. Sci. Agric. 68:62-68.
Silva EN, Ribeiro RV, Ferreira-Silva SL, Vieira AS, Ponte LAF, Silveira JAG (2012). Coordinate changes in photosynthesis, sugar accumulation and antioxidative enzymes improve the performance of Jatropha curcas plants under drought stress. Biomass Bioenergy 45:270-279.
Silveira JAG, Viégas RA, Rocha IMA, Moreira ACOM, Moreira RA, Oliveira JTA (2003). Proline accumulation and glutamine synthetase activity are increased by salt-induced proteolysis in cashew leaves. J. Plant Physiol. 160:115-123.
Simova-Stoilova L, Demirevska K, Petrova T, Tsenov N, Feller U (2009). Antioxidative protection and proteolytic activity in tolerant and sensitive wheat (Triticum aestivum L.) varieties subjected to long term field drought. Plant Growth Regul. 58:107-117.
Slama I, Ghnaya T, Hessini K, Messedi D, Savouré A, Abdelly C (2007). Comparative study of the effects of mannitol and PEG osmotic stress on growth and solute accumulation in Sesuvium portulacastrum. Environ. Exp. Bot. 61:10-17.
Vellosillo T, Vicente J, Kulasekaran S, Hamberg M, Castresana C
(2010). Emerging complexity in reactive oxygen species production and signaling during the response of plants to pathogens. Plant Physiol. 154:444-448.
Viégas RA, Silveira JAG, Lima Júnior AR, Queiroz JE, Fausto MJM (2001). Effects of NaCl-salinity on growth and inorganic solute accumulation in young cashew plants. Rev. Bras. Eng. Agríc. Ambient. 5:216-222.
Wilkinson S, Davies WJ (2002). ABA-based chemical signaling: The co-ordination of responses to stress in plants. Plant Cell Environ. 25:195-210.
Wilson JR, Fisher MJ, Schulze ED, Dolby GR, Ludlow MM (1979). Comparison between pressure–volume and dew point-hygrometry techniques for determining the water relations characteristics of grass and legume leaves. Oecologia 41:77-88.
Zimmerman P, Heinlein C, Orendi G, Zentgra U (2006). Senescence-specific regulation of catalases in Arabidopsis thaliana (L.) Heynh. Plant Cell Environ. 29(6):1049-60.

Vol. 11(30), pp. 2817-2824, 28 July, 2016
DOI: 10.5897/AJAR2014.9106
Article Number: 671A08559779
ISSN 1991-637X
Copyright ©2016
Author(s) retain the copyright of this article
http://www.academicjournals.org/AJAR
African Journal of Agricultural Research
Full Length Research Paper
Photosynthesis and water relations of sunflower cultivars under salinity conditions
Fátima Marques de A. Maia, Alan Carlos Costa*, Jônatas Neves de Castro, Clarice Aparecida Megguer and Frederico Antônio Loureiro Soares
Instituto Federal Goiano – (IF Goiano), Câmpus Rio Verde, Goiás, Brazil.
Received 31 August, 2014; Accepted 17 February, 2016
The study of photosynthetic responses in plants provides useful information for understanding the physiological processes involved in the salinity tolerance and susceptibility mechanisms of sunflower cultivars. The aim of the present study was to evaluate the gas exchange responses, water relations (stress hydric), and growth characteristics of two sunflower cultivars, Agrobel 963 and Aguará 4, subjected to different salt concentrations. The study was conducted in a randomized block experimental design through a 2 x 5 factorial arrangement, with the factors being two sunflower cultivars (Agrobel 963 and Aguará 4) and five salt concentrations (0, 25, 50, 100 and 150 mM NaCl) applied in Hoagland nutrient solution, with five replicates. Gas exchange, water relations and growth characteristics were evaluated. The gas exchange measurements showed that the two sunflower cultivars maintained the photosynthetic activity per unit of leaf area even at the highest NaCl concentration tested (150 mM). With the increasing salinity in the nutrient solution, the leaf water potential decreased, while the concentration of optically active substances increased in both the leaves and roots, which helped maintain the plant’s water status. Reduction on dry mass of sunflowers was response to decreasing on the leaf total area and not as effect of salinity on the photosynthetic rate by leaf area unity. Key words: Helianthus annuus L., gas exchange, NaCl, osmotic adjustment.
INTRODUCTION Agriculture in the midwest region of Brazil is mainly dedicated to grain production. Over the last few years, however, large-scale sugarcane plantations have been established in the agricultural areas of this region. This increase is mostly a consequence of incentives for the production of alcohol as biofuel by the Alcohol National Program (Programa Nacional do Álcool -Proálcool)
(Rodrigues and Ortiz, 2006). An increase in the production of vinasse, which is a
byproduct of alcohol production, occurs concomitantly with the increase in sugarcane production. Vinasse is currently being used in irrigation as a fertilizer. However, if applied in excess, vinasse can cause damage to crops of commercial interest due to nutritional imbalances and
*Corresponding author. E-mail: [email protected].
Author(s) agree that this article remain permanently open access under the terms of the Creative Commons Attribution
License 4.0 International License
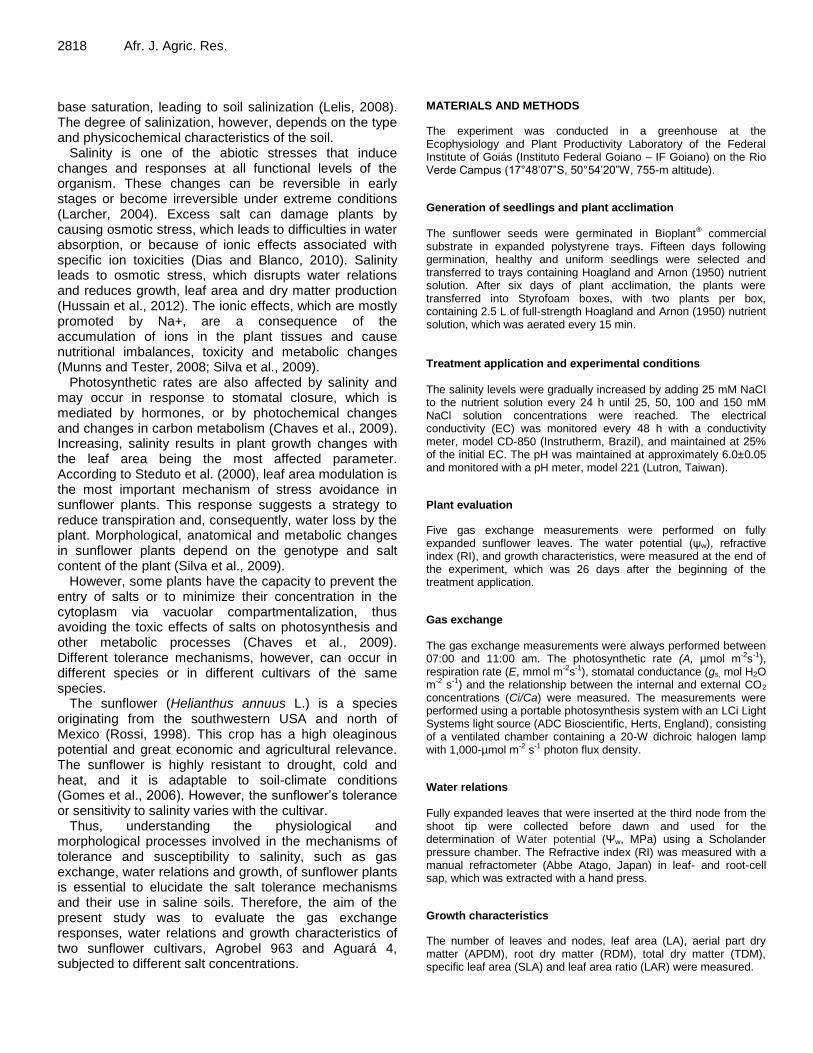
2818 Afr. J. Agric. Res. base saturation, leading to soil salinization (Lelis, 2008). The degree of salinization, however, depends on the type and physicochemical characteristics of the soil.
Salinity is one of the abiotic stresses that induce changes and responses at all functional levels of the organism. These changes can be reversible in early stages or become irreversible under extreme conditions (Larcher, 2004). Excess salt can damage plants by causing osmotic stress, which leads to difficulties in water absorption, or because of ionic effects associated with specific ion toxicities (Dias and Blanco, 2010). Salinity leads to osmotic stress, which disrupts water relations and reduces growth, leaf area and dry matter production (Hussain et al., 2012). The ionic effects, which are mostly promoted by Na+, are a consequence of the accumulation of ions in the plant tissues and cause nutritional imbalances, toxicity and metabolic changes (Munns and Tester, 2008; Silva et al., 2009).
Photosynthetic rates are also affected by salinity and may occur in response to stomatal closure, which is mediated by hormones, or by photochemical changes and changes in carbon metabolism (Chaves et al., 2009). Increasing, salinity results in plant growth changes with the leaf area being the most affected parameter. According to Steduto et al. (2000), leaf area modulation is the most important mechanism of stress avoidance in sunflower plants. This response suggests a strategy to reduce transpiration and, consequently, water loss by the plant. Morphological, anatomical and metabolic changes in sunflower plants depend on the genotype and salt content of the plant (Silva et al., 2009).
However, some plants have the capacity to prevent the entry of salts or to minimize their concentration in the cytoplasm via vacuolar compartmentalization, thus avoiding the toxic effects of salts on photosynthesis and other metabolic processes (Chaves et al., 2009). Different tolerance mechanisms, however, can occur in different species or in different cultivars of the same species.
The sunflower (Helianthus annuus L.) is a species originating from the southwestern USA and north of Mexico (Rossi, 1998). This crop has a high oleaginous potential and great economic and agricultural relevance. The sunflower is highly resistant to drought, cold and heat, and it is adaptable to soil-climate conditions (Gomes et al., 2006). However, the sunflower’s tolerance or sensitivity to salinity varies with the cultivar.
Thus, understanding the physiological and morphological processes involved in the mechanisms of tolerance and susceptibility to salinity, such as gas exchange, water relations and growth, of sunflower plants is essential to elucidate the salt tolerance mechanisms and their use in saline soils. Therefore, the aim of the present study was to evaluate the gas exchange responses, water relations and growth characteristics of two sunflower cultivars, Agrobel 963 and Aguará 4, subjected to different salt concentrations.
MATERIALS AND METHODS
The experiment was conducted in a greenhouse at the Ecophysiology and Plant Productivity Laboratory of the Federal Institute of Goiás (Instituto Federal Goiano – IF Goiano) on the Rio Verde Campus (17°48’07”S, 50°54’20”W, 755-m altitude).
Generation of seedlings and plant acclimation The sunflower seeds were germinated in Bioplant® commercial substrate in expanded polystyrene trays. Fifteen days following germination, healthy and uniform seedlings were selected and transferred to trays containing Hoagland and Arnon (1950) nutrient solution. After six days of plant acclimation, the plants were transferred into Styrofoam boxes, with two plants per box, containing 2.5 L of full-strength Hoagland and Arnon (1950) nutrient solution, which was aerated every 15 min. Treatment application and experimental conditions The salinity levels were gradually increased by adding 25 mM NaCl to the nutrient solution every 24 h until 25, 50, 100 and 150 mM NaCl solution concentrations were reached. The electrical conductivity (EC) was monitored every 48 h with a conductivity meter, model CD-850 (Instrutherm, Brazil), and maintained at 25% of the initial EC. The pH was maintained at approximately 6.0±0.05 and monitored with a pH meter, model 221 (Lutron, Taiwan).
Plant evaluation
Five gas exchange measurements were performed on fully expanded sunflower leaves. The water potential (ψw), refractive index (RI), and growth characteristics, were measured at the end of the experiment, which was 26 days after the beginning of the treatment application.
Gas exchange The gas exchange measurements were always performed between 07:00 and 11:00 am. The photosynthetic rate (A, µmol m-2s-1), respiration rate (E, mmol m-2s-1), stomatal conductance (gs, mol H2O m-2 s-1) and the relationship between the internal and external CO2 concentrations (Ci/Ca) were measured. The measurements were performed using a portable photosynthesis system with an LCi Light Systems light source (ADC Bioscientific, Herts, England), consisting of a ventilated chamber containing a 20-W dichroic halogen lamp with 1,000-µmol m-2 s-1 photon flux density.
Water relations Fully expanded leaves that were inserted at the third node from the shoot tip were collected before dawn and used for the determination of Water potential (Ψw, MPa) using a Scholander pressure chamber. The Refractive index (RI) was measured with a manual refractometer (Abbe Atago, Japan) in leaf- and root-cell sap, which was extracted with a hand press.
Growth characteristics
The number of leaves and nodes, leaf area (LA), aerial part dry matter (APDM), root dry matter (RDM), total dry matter (TDM), specific leaf area (SLA) and leaf area ratio (LAR) were measured.

Maia et al. 2819
Figure 1. Photosynthetic rate (A) (A), stomatal conductance (gs) (B), transpiration rate (E) (C) and water-use efficiency (WUE) (D) of sunflower plants of the Aguará 4 and Agrobel 963 cultivars grown under different NaCl (mM) concentrations in the nutrient solution. Upper case letters in the figure stand for significant differences between cultivars, according to the Tukey’s test (p≤0.05). The effect of salinity within each cultivar was better explained by a quadratic and a linear model in (C) and a quadratic and a square root model in (D). Significance: *p<0.05; **p<0.01.
The dry matter mass (g plant¹־) was obtained by drying the harvested material in a convection oven at 65°C until reaching a constant weight. The LA (cm2) was measured by scanning the leaf and using image-analysis software. The SLA and LAR were calculated using the following equations: SLA= LA/LDM and LAR= LA/TDM, respectively. Statistical analysis An analysis of variance was performed for the data obtained, and the means for different cultivars were compared using an F-test. When necessary, regression models were adjusted to the NaCl concentration levels using the Software Analysis and Experimentation Group (SAEG) 9.1 software (UFV, Viçosa, Brazil).
RESULTS Gas exchange The increasing NaCl concentration did not result in significant changes in A (Figure 1A) or gs (Figure 1B) in
either of the tested cultivars. However, a higher A (Figure 1A) and E (Figure 1C) and lower water-use efficiency (WUE) (Figure 1D) were observed for cultivar Agrobel 963 compared with Aguará 4. The Ci/Ca also did not change significantly with increasing salinity in the growth medium (Figure 2). A significant difference was only observed between cultivars, with Aguará 4 exhibiting the highest values for this ratio (Figure 2).
Water relations The ψw of both Aguará 4 and Agrobel 963 decreased with increasing salinity in the growth medium, especially at the highest NaCl concentration. This decrease reached up to 48% for Aguará 4 and up to 20% for Agrobel 963 compared with control plants (Figure 3). The RI of both the leaf and root increased with increasing NaCl concentrations (Figure 4A and B). There were increases of 102% in the leaf (Figure 4A) and 34% in the root (Figure 4B) in plants grown at 150-mM NaCl

2820 Afr. J. Agric. Res.
Figure 2. Relationship between the internal and external CO2 concentrations (Ci/Ca) in sunflower plants of the Aguará 4 and Agrobel 963 cultivars grown under different NaCl (mM) concentrations in the nutrient solution. Means followed by the same letter are not significantly different according to the F-test (p≤0.05).
Figure 3. Leaf water potential (ψw) in sunflower plants of the Aguará 4 and Agrobel 963 cultivars grown under different NaCl (mM) concentrations in the nutrient solution. For each NaCl concentration tested, different upper case letters inside the figure indicate significant differences between the cultivars, according to the F-test (p≤0.05). The effect of salinity was better explained by a square root model for the Aguará cultivar 4 and by a linear model for the Agrobel 963 cultivar. Significance: *p<0.05; **p<0.01.
concentration compared with control plants.
Growth characteristics The interaction between the NaCl concentration and the type of sunflower cultivar influenced the growth characteristics.
Increasing the NaCl concentration of the nutrient solution significantly reduced the number of leaves (Figure 5A) and nodes (Figure 5B), regardless of the cultivar. When evaluating the isolated effect of the cultivar on this characteristic, the reduction was more pronounced for the cultivar Agrobel 963 (Figure 6A and B). The SLA (Figure 7A), LAR (Figure 7B), LA (Figure 8A) and RDM (Figure 8C) of the plants from both cultivars drastically decreased with increasing NaCl concentrations in the nutrient solution. Similar results were observed for the APDM (Figure 8B) and TDM (Figure 8D) of the plants from the Agrobel 963 cultivar. However, low NaCl concentrations (≤0.25 mM) led to significant increases in the APDM (Figure 8B) and TDM (Figure 8D) of the plants from the Aguará 4 cultivar.
DISCUSSION
The growth characteristics measured in the present study, namely the LA, SLA, LAR, APDM, TDM and RDM of the plants, for both tested cultivars decreased with increasing NaCl concentrations in the nutrient solution. Decreased in growth is one of the most commonly observed symptoms in plants grown in saline environments and has been well documented for Barbados nut (Silva et al., 2009) and some sunflower cultivars (Steduto et al., 2000; Hussain et al., 2012). The changes in plant growth may occur as a result of the external increase in osmotic pressure and the accumulation of Na
+ in the leaves (Munns and Tester,
2008). In the present study, the decreased LA may be related
to an adaptation mechanism to salinity, allowing water conservation by reducing transpiration area. The decrease in leaf area has been observed in several plant species in response to increasing NaCl concentrations (Medeiros, et al., 2012; Araújo, et al., 2010; Neto and Tabosa, 2000). The lowest RDM values were observed for estimated concentrations of 106.7 and 100 mM NaCl in the nutrient solution for the Aguará 4 and Agrobel 963 cultivars, respectively. For the Aguará 4 cultivar, a similar behavior was observed for the APDM and TDM, which increased with the NaCl content up to concentrations of 22 and 13 mM, respectively. Júnior et al. (2011) and Nobre et al. (2010) had previously reported decreases in the APDM of 83 (9.0 dS m
-1 EC) and 55% (4.9 dS m
-1
EC), respectively, in sunflower plants maintained under different salt concentrations.
According to Nobre et al. (2010), salinity affects the plant dry matter production because the high salt concentrations at the root zone lead to decreased water availability. The growth decreases may therefore be associated with osmotic stress, resulting from an increase in solutes in the solution that hampers water absorption by the plant. The increase in solutes also led to a decreased leaf ψw and increased RI of leaf- and root-cell sap. As the water content decreased, the turgor
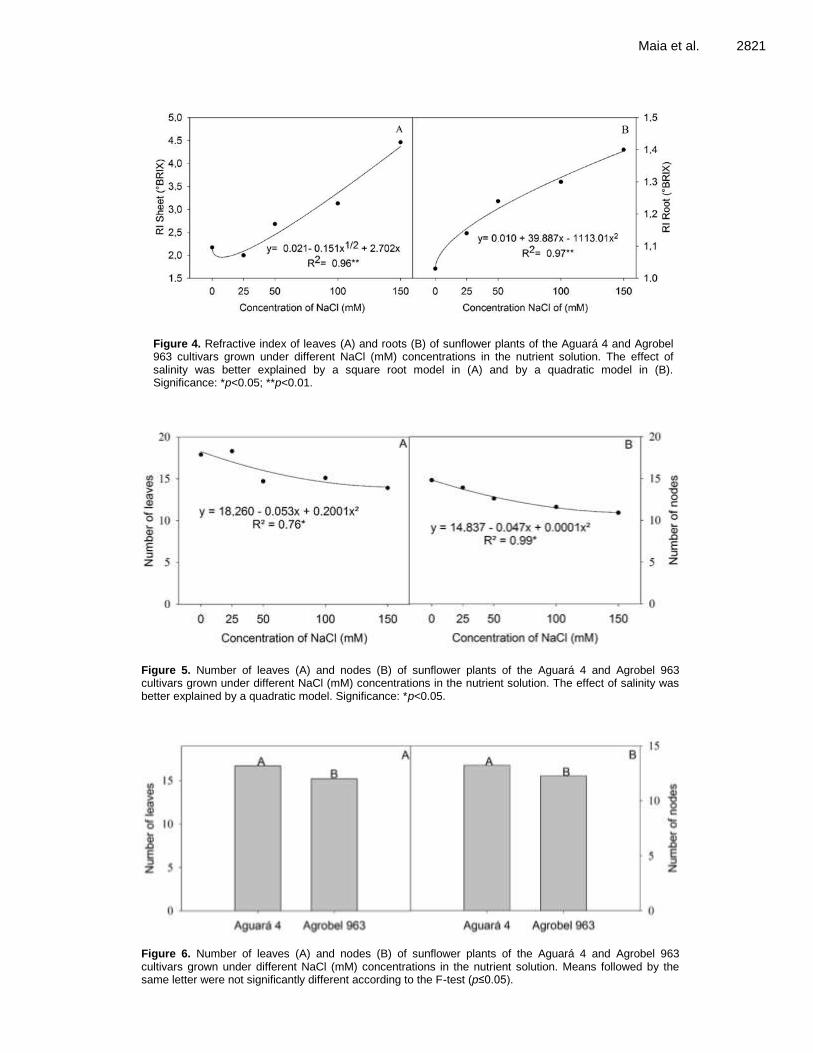
Maia et al. 2821
Figure 4. Refractive index of leaves (A) and roots (B) of sunflower plants of the Aguará 4 and Agrobel 963 cultivars grown under different NaCl (mM) concentrations in the nutrient solution. The effect of salinity was better explained by a square root model in (A) and by a quadratic model in (B). Significance: *p<0.05; **p<0.01.
Figure 5. Number of leaves (A) and nodes (B) of sunflower plants of the Aguará 4 and Agrobel 963 cultivars grown under different NaCl (mM) concentrations in the nutrient solution. The effect of salinity was better explained by a quadratic model. Significance: *p<0.05.
Figure 6. Number of leaves (A) and nodes (B) of sunflower plants of the Aguará 4 and Agrobel 963 cultivars grown under different NaCl (mM) concentrations in the nutrient solution. Means followed by the same letter were not significantly different according to the F-test (p≤0.05).
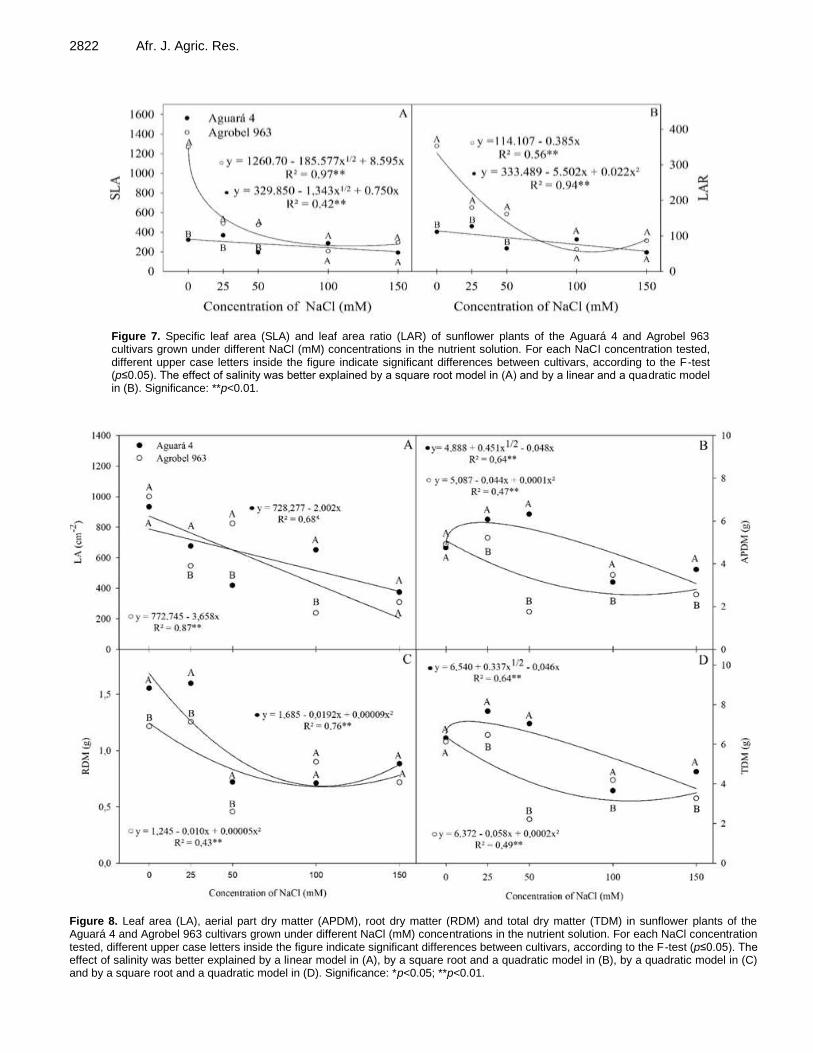
2822 Afr. J. Agric. Res.
Figure 7. Specific leaf area (SLA) and leaf area ratio (LAR) of sunflower plants of the Aguará 4 and Agrobel 963 cultivars grown under different NaCl (mM) concentrations in the nutrient solution. For each NaCl concentration tested, different upper case letters inside the figure indicate significant differences between cultivars, according to the F-test (p≤0.05). The effect of salinity was better explained by a square root model in (A) and by a linear and a quadratic model in (B). Significance: **p<0.01.
Figure 8. Leaf area (LA), aerial part dry matter (APDM), root dry matter (RDM) and total dry matter (TDM) in sunflower plants of the Aguará 4 and Agrobel 963 cultivars grown under different NaCl (mM) concentrations in the nutrient solution. For each NaCl concentration tested, different upper case letters inside the figure indicate significant differences between cultivars, according to the F-test (p≤0.05). The effect of salinity was better explained by a linear model in (A), by a square root and a quadratic model in (B), by a quadratic model in (C) and by a square root and a quadratic model in (D). Significance: *p<0.05; **p<0.01.

pressure also decreased, resulting in a decrease in the number of elongating cells and, consequently, growth (Willadino and Camara, 2010).
Thus, the results obtained indicate that the tested sunflower cultivars, Aguará 4 and Agrobel 963, underwent an osmotic adjustment, accumulating compatible solutes in the interior of the cells due to the increased RI and consequent reduction in ψw. This effect helped the maintenance of the ψw gradient between the medium and the interior of the plant (Taiz and Zeiger, 2012). Increases in RI were also observed by Queiroz and Büll (2001) in cotton plants up to 24 dSm
-1 soil
salinity. The increase in NaCl concentration in the present study
led to a reduction in the LAR, indicating that most of the photoassimilates were not translocated to the leaf area. Similar results were reported by Garcia et al. (2010) for bean genotypes under increasing salt concentrations. Silva et al. (2009) reported an increase in the LAR only at the early stages of ornamental sunflower cultivation, after which there was a decrease in the LAR.
The lowest observed SLA values for both cultivars tested in the present study indicate a larger investment in leaf thickness than in leaf expansion. Similar results were observed by Silva et al. (2009) for leaves of ornamental sunflower plants subjected to 6.5 dSm
-1 EC during
fertigation and by Porto et al. (2006) for melon plants grown at 4.5 dSm
-1 EC. The decrease in SLA observed in
the present study resulted from the more pronounced effect on LA than on LDM, which is in accordance with Porto et al. (2006). Therefore, the growth of both cultivars was negatively affected by salinity. The reduction in leaf area decreased transpiration surface, photosynthetic area and dry matter production compared with the control plants. The higher growth of the control plants of both cultivars was likely due to higher turgor pressure compared to the plants subjected to high NaCl concentrations.
Those results are also confirmed by the fact that the RI of both the leaf and root increased with increasing NaCl concentrations, thus indicating the presence of optically active substances, such as glucose and fructose. The determination of the concentration of these substances is usually performed through the RI, which is based on how a given substance deflects polarized light (Bagatin et al., 2005). The presence of optically active substances contributes to osmotic adjustment, to the maintenance of cell hydration and, consequently, to the protection of cell structures (Ashraf and Harris, 2004, Marcondes and Garcia, 2009).
Changes to the metabolism, which are induced by excess ions, are consequence of several plant physiological responses, such as changes in ion balance, stomatal changes or changes to the photosynthetic capacity (Zanandrea et al., 2006). Although there was no alterations on photosynthetic rate by leaf area, reduction on total leaf area of sunflower plants as response to
Maia et al. 2823 salinity was observed. As direct consequence, the small leaf area resulted to a small area water loss by transpiration, small area loss of carbon absorption on photosynthetic process, low values of dry mater mass and biometric measures of plants as observed in this study.
The increase in NaCl concentrations did not result in stomatal closure, as indicated by the gs, which indicates that both studied cultivars adopted metabolic strategies to minimize the effect of salt. Among these possible strategies, osmotic adjustment with synthesis of osmotically is compatible with organic solutes and ion compartmentalization at the vacuole or ion storage in older leaves (Silveira et al., 2009).
Steduto et al. (2000) found no changes in A or gs in sunflower hybrids under salinity conditions. The authors considered that CO2 assimilation in sunflower plants is controlled by leaf area modulation, that is, under saline conditions, sunflower plants adjust morphologically as opposed to physiologically. Conversely, the reduced LA led to a reduction in the total photosynthetic area, which negatively affected C accumulation, even though no decrease in the photosynthetic rate per leaf area was observed.
In addition to the reductions in leaf area and transpiration area, other mechanisms may have been used to avoid water loss and maintain the functionality of physiological activities. One of these mechanisms was the increase in WUE, as observed in the Aguará 4 cultivar for concentrations of up to 100 mM NaCl. The Aguará 4 cultivar exhibited better values than the Agrobel 963 cultivar for this parameter. In the Agrobel 963 cultivar, increasing the NaCl concentration led to decreased WUE and increased E at 50 mM NaCl, as compared with the control plants. By maintaining turgor, processes such as stomatal conductance, CO2 assimilation rates and tissue expansion are also maintained for longer periods under stress conditions (Ludlow, 1987; Nepomuceno et al., 1998; Nepomuceno et al., 2001). In young Barbados nut plants, after seven days of treatment with 100 mM NaCl, significant decreases were observed in gs and E (Silva et al., 2011). Salt ions reached high concentrations in leaves after 14 days, leading to pronounced photosynthetic damage (Silva et al., 2011).
Conclusion
The photosynthetic rates and the remaining gas exchange parameters remained constant in both the Aguará 4 and Agrobel 963 cultivars. The greater capacity of the Aguará 4 cultivar to reduce E and increase WUE indicates a higher tolerance of this cultivar to salt stress conditions compared to the Agrobel 963 cultivar. The increase in concentrations of optically active substances in Aguará 4 and Agrobel 963 was associated with the greater osmotic adjustment capacity of these plants,

2824 Afr. J. Agric. Res. favoring water absorption and the maintenance of the functionality of physiological activity. The decrease in dry matter accumulation in both cultivars was a result of the decrease in leaf area of the plants subjected to salt stress conditions and not due to a reduction in the photosynthetic activity by leaf area unity.
Conflict of Interests The authors have not declared any conflict of interests. ACKNOWLEDGMENTS
The authors wish to thank the Coordenação de Aperfeiçoamento de Pessoal de Nível Superior, Brazil (CAPES), the Conselho Nacional de Desenvolvimento Científico e Tecnológico, Brazil (CNPq), the Financiadora de Estudos e Projetos e Projetos (FINEP), and the Instituto Federal Goiano – Câmpus Rio Verde Câmpus, for the financial support. REFERENCES Araújo CAS, Ruiz HA, Cambraia J, Neves JCL, Freire MBGS, Freire FI
(2010). Seleção varietal de Phaseolus vulgaris quanto à tolerância ao estresse salino com base em variáveis de crescimento. Rev. Ceres 57(1):132-139.
Ashraf M, Harris PJC (2004). Potential biochemical indicators of salinity tolerance in plants. Plant Sci.166:3-16.
Bagatin O, Simplício FI, Santin SMO, Santin Filho O (2005). Rotação de luz polarizada por moléculas quirais: Uma abordagem histórica como proposta de trabalho em sala de aula. Química Nova na Escola 21:34-38.
Chaves MM, Flexas J, Pinheiro C (2009). Photosynthesis under drought and salt stress: regulation mechanisms from whole plant to cell. Ann. Bot.103:551-560.
Dias N, Blanco FF (2010). Efeitos dos sais no solo e na planta. In: Gheyi HR, Dias NS, Lacerda FL (Eds.). Manejo da salinidade na agricultura: Estudos Básicos e Aplicados. Instituto Nacional de Ciência e Tecnologia em Salinidade, Fortaleza, CE, pp. 130-132.
Garcia GO, Nazário AA, Moraes WB, Gonçalves IZ, Madalão JC (2010). Respostas de genótipos de feijoeiro à salinidade. Engenharia na Agricultura18(4):330-338.
Gomes DP, Bringel JMM, Moraes MFH, Gomes JJA, Leite RMVBC (2006). Qualidade fisiológica e sanitária de sementes de girassol produzidas na região de Timon, Maranhão. Summa Phytopathol. 32(3):291-292.
Hoagland DR, Arnon DI (1950). The water-culture method for growing plants without soil. Circular. California Agric. Exp. Stn, 347 (2nd edit).
Hussain M, Farooq M, Shehzad M, Khan MB, Wahid A, Shabir G (2012). Evaluating the performance of elite sunflower hybrids under saline conditions. Int. Agric. Biol. 14:131-135.
Junior JAS, Gheyi HR, Filho DHG, Dias NS, Soares AL (2011). Cultivo de girassol em sistema hidropônico sob diferentes níveis de salinidade. Rev. Ciênc. Agron. 42(4):842-849.
Larcher W (2004). Ecofisiologia vegetal [Plant ecophysiology]; Ed. Rima, P 531.
Lelis NJA (2008). Monitoramento de componentes químicos da vinhaça aplicados em diferentes tipos de solo. Piracicaba, 2008. Dissertação (Mestrado) [Master thesis] – Escola Superior de Agricultura Luiz de Queiroz [Luiz de Queiroz College of Agriculture]. P 89.
Ludlow M (1987). Contribution of osmotic adjustment to the maintenance of photosynthesis during water stress. In J. Biggens
(ed.) Progress in Photosynthesis Research. Martinus Nijhoff Publishers, Netherlands, pp. 161-168.
Marcondes J, Garcia AB (2009). Aspectos citomorfológicos do estresse salino em plântulas de arroz (Oryza sativa L.). Arquivo do Instituto Biológico. 76(2):187-194.
Medeiros ZMA, Oliveira FA, Medeiros JF, Lima LA, Bezerra FMS, Cavalcante ALG (2012). Efeito da salinidade da água de irrigação no desenvolvimento inicial da bucha vegetal. INOVAGRI International Meeting and IV WINOTEC – Workshop Internacional de Inovações Tecnológicas de Irrigação.
Munns R, Tester M (2008). Mechanism of salinity tolerance. Annu. Rev. Plant Physiol. 59:651-681.
Nepomuceno AL, Neumaler N, Farias JRB, Oyak T (2001). Tolerância á seca em plantas. Biotecnol. Ciênc. Desenvolv. 23(1):12-18.
Nepomuceno AL, Oosterhuis DM, Stewart JM (1998). Physiological responses of cotton leaves and roots to water deficit induced by polyethylene glycol. Environ. Exp. Bot. 40:29-41.
Neto-Azevedo AD, Tabosa JN (2000). Estresse salino em plântulas de milho: parte I: análise de crescimento. Rev. Bras. Engenharia Agríc. Ambient. 04(02):159-164.
Nobre RG, Gheyi HR, Correia KG, Soares FAL, Andrade LO (2010). Crescimento e floração do girassol sob estresse salino e adubação nitrogenada. Rev. Ciênc. Agron. 41(3):358-365.
Porto FFQ, Medeiros JF, Gheyi HR, Matos JA, Souza ER, Sousa Neto ER (2006). Crescimento do meloeiro irrigado com águas de diferentes salinidades. Hortic. Bras. 24:334-341.
Queiroz SOP, Büll LT (2001). Comportamento de genótipos de algodão herbáceo em função da salinidade do solo. Irrigação 6(2):124-133.
Rodrigues D, Ortiz L (2006) Em direção à sustentabilidade da produção de etanol de cana de açúcar no Brasil. Porto Alegre: Amigos da Terra Brasil.
Rossi RO (1998). Girassol, Curitiba: Tecnoagro, 333pp. Saeg 9.1. Sistema para Análises Estatísticas (2007) - SAEG. Viçosa:
Fundação Arthur Bernardes, Versão 9.1. Silva EN, Ribeiro RV, Silva SLF, Viégas RA, Silveira JAG (2011). Salt
stress induced damages on the photosynthesis of physic nut young plants. Sci. Agricola 68(1):62-68.
Silva TGF, Zolnier S, Grossi JAS, Barbosa JG, Moura CRW, Muniz MA (2009). Crescimento do girassol ornamental cultivado em ambiente protegido sob diferentes níveis de condutividade elétrica de fertirrigação. Rev. Ceres56(5):602-610.
Silveira JAG, Araújo SAM, Lima JPMS, Viégas RA (2009). Roots and leaves display contrasting osmotic adjustment mechanisms in response to NaCl-salinity in Atriplex nummularia. Environ. Exp. Bot. 66:1-8.
Steduto P, Albrisio R, Giorio P, Sorrentino G (2000). Gas-exchange response and stomatal and non-stomatal limitations to carbon assimilation of sunflower under salinity. Environ. Exp. Bot. 44:243-255.
Taiz L, Zeiger E (2012). Plant Physiology. Massachusetts: Sinauer Associates, P 690.
Willadino L, Camara TR (2010). Tolerância das plantas à salinidade: aspectos fisiológicos e bioquímicos. Enciclopédia Biosfera: Centro Científico Conhecer 6(11):2.
Zanandrea I, Nassi FL, Turchetto AC, Braga EJB, Peters JA, Bacarin MA (2006). Efeito da salinidade sob parâmetros de fluorescência em Phaseolus vulgaris. Rev. Bras. Agrociênc. 12(2):157-161.
Vol. 11(30), pp. 2825-2832, 28 July, 2016
DOI: 10.5897/AJAR2016.11102
Article Number: C931B4859778
ISSN 1991-637X
Copyright ©2016
Author(s) retain the copyright of this article
http://www.academicjournals.org/AJAR
African Journal of Agricultural Research
Full Length Research Paper
Physiological quality of sesame seed harvested at different plant positions and maturity stages
Cristiane Fernandes Lisboa1, Deyner Damas Aguiar Silva1, Itamar Rosa Teixeira1*, André José de Campos1, Ivano Alessandro Devilla1, and Alessandro Guerra da Silva2
1Universidade Estadual de Goiás, Brazil.
2Universidade de Rio Verde, Brazil.
Received 8 April, 2016; Accepted 2 June, 2016
Being peculiar for its unique chemical and nutritional characteristics, sesame (Sesamum indicum L.) is a good option for farmers. It is used as human food, animal feed and has great potential for the production of bio diesel. Despite these potentials, studies on ideal maturity stage for harvesting and physiological quality of sesame seeds in different parts of the plant are rare and also there is insufficient information on it. In this context, this study aims to evaluate the physiological quality of sesame seeds harvested at different maturity stages and plant positions. It employs complete randomized design consisting of factorial scheme 2 × 3 × 3, with four replications. Treatments are composed of two beige and black sesame seed cultivars, harvested at three maturity stages (50, 70 and 90%) and in three parts of the plant (superior, medial and inferior). The unproductive part was discharged and the productive part was divided into three equal parts. The evaluation of physiological quality of seeds in treatment was verified by the following tests: Standard Germination Test (TPG - Teste Padrão de Germinação), first count, plant length, speedy aging and electrical conductivity. The data were subjected to variation analysis, and when suitable, it was subjected to the Skott and Knott test at 5% probability. The results of physiological analysis indicated that the seeds harvested with 90% of mature capsules have higher percentages mean values for vigor and viability. Therefore, the realization of harvest in these conditions it is the most appropriate to obtain a high quality product. Key words: Sesamum indicum L., maturity stages, seed position viability, vigor.
INTRODUCTION The sesame (Sesamum indicum L.) is from the Pedaliaceae family and considered to be one of the oldest oil seeds used by humans. There have been registers of its cropping since 5,000 B.C., in Asia and it is widely grown in tropical and subtropical regions (Ashri, 1998; Banerjee and Kole, 2009). It thrives well in drained soil with moderate fertility at pH 5.4 to 6.7 and can
effectively use stored soil moisture (Morris, 2009). In 2011, there was a worldwide production of 3.3 million
tons in an area of 7.5 million hectare; India and Myanmar are the largest producers of sesame in the world, with a productivity of 443 kg ha
-1 (FAO, 2012). The crop
production can be considered poor, mainly attributed to low yield of the cultivars with an indeterminate growth
*Corresponding author. E-mail: [email protected].
Author(s) agree that this article remain permanently open access under the terms of the Creative Commons Attribution
License 4.0 International License

2826 Afr. J. Agric. Res. habit, high cost of sowing, pests and diseases occurrence, insufficient weed control, uneven ripening of capsules, seed shattering, susceptibility to environmental stresses, lack of mechanized harvest and lack of adequate research (Furat and Uzun, 2010; Azum et al., 2012). However, the potential yields of sesame as high as 6000 kg ha
-1, as reported by Raikwar and Srivastva
(2013). Its broad adaptability to edaphoclimatic conditions in
countries with hot weather and with a good level of resistance to drought as well as its easy harvesting makes the sesame culture an excellent option for agricultural diversification with a great economic viability (Ashri, 2007). It is featured as an annual or perennial plant, with variable height between 0.5 and 3 m, straight stalk, with or without branching. Sesame seeds are hairy capsules with longitudinal dehiscence and episodes of indehiscence (Ashi et al., 2007; Morris, 2009).
Its seeds vary in size between 2 and 8 cm long and 0.5 and 2 cm of diameter; 100-seed weight ranges from 0.11 to 0.46 g. The seed is a main source of edible oil and largely used as seasoning. It presents itself as a rich food source due to its high oil content that ranges from 34 to 59%, of excellent nutritional, medicinal and cosmetic quality (Ashri, 1998; Morris, 2009). Its oil is rich in unsaturated oil, such as oleic (47%) and linoleic (41%), and it portrays several secondary components which are the most important for the definition of its chemical properties, like sesamol, sesamin and sesamolin (Arslan et al., 2007; Uzun et al., 2008). Sesamol, with its high antioxidant properties, grants the oil prominent chemical stability avoiding rancidity; it has the greatest resistance to oxidation amongst other oils of vegetal origin (Erbas et al., 2009; Emamgholizadeh et al., 2015).
Most of the sesame traded in the world market is light seeded; only seed coats of landraces vary from white to black (Langham and Wiemers, 2008). In a study conducted by da Silva et al. (2011), comparing the chemical composition of beige and black sesame seeds, it was observed that black sesame seeds display the highest rates of soluble phenolic compounds and phytates, besides having a higher capacity of holding free radicals and having a potential related to a significantly greater antioxidant activity. According to Queiroga et al. (2010a), black sesame seeds stand out in relation to others (BRS silk and CNPA 4) white and beige, for they show a high concentration of calcium (Ca) and sulphur (S) minerals.
Amongst the developed operations with this culture, harvest is an operation of great relevance; product quality depends mostly on the careful way and the right moment of manual harvest of plants. The right harvest moment occurs when the seeds in the base of the stem start to open, yielding seeds in a greater number and size (Lago et al., 2001; Queiroga et al., 2009). This is the right harvesting time, because from this point the fruit located at the top of the plants (Doo et al., 2003).
It is also noteworthy that determining the ideal harvest moment for dehiscent sesame is hard because capsule maturity is uneven, for it is a plant that has undetermined growth (Banerjee and Kole, 2009). Regarding the cultivar, premature super BRS silk, the quality of seeds in the apical part of the plant can be harmed because they have not reached physiological maturity in this stage of harvest. This seed prematurity is characterized as the stage in which it stops getting nutrients from the plant (Queiroga et al., 2008).
A common feature in most cultivars, especially in dehiscent ones, is the speedy process of natural dehiscence of fruits (capsules), with eventual grain fall. This happens right after the best maturity stage, which, in case of late harvests, can mean great losses in production (Doo et al., 2003).
According to Weiss (1983), sesame seeds rapidly lose quality when handled without proper care. Unseasonal harvests (the best is to plan harvests in absence of rain), mechanic damage during fanning, inappropriate drying (high humidity) and storage temperature seem to be the main agents which affect food quality of stored seeds (Popinigis, 1985). Whatever is the drying method, the most important is not to alter seed quality, such as its physical integrity (high purity), taste and chemical characteristics (Queiroga et al., 2008).
Taking into account the aforementioned, one can assert that research on the physiological quality of beige and black sesame seeds, harvested with different maturity percentage and plant positioning, is of great relevance for technicians and producers. It will lead to a better data base on the correct procedures to obtain superior quality seeds. Currently, studies on ideal maturity percentage for harvesting and physiological quality of seeds are scarce. There is a need for a more detailed investigation which might transmit safety to producers in search of profit. MATERIALS AND METHODS
Seeds used in the experiment were produced in Emater’s trial area in Anapolis - Goias, from December 2013 to April 2014. The produced cultivars were: BRS6/CNPA (beige) and black. The black cultivar is a local matter from late cycle (120 days), and the seeds used in the crop came from the Northern of Goias. After the harvest, both cultivars were stored in cool chamber at 10 ± 2°C and 45% relative humidity, up to the kick off of tests.
Tests were developed in the Laboratório de Secagem e Armazenamento de Produtos Vegetais from the Agricultural Engineering course in Anápolis-GO, from November 2014 to December 2014. Treatments consisted of two beige and black sesame seed cultivars, harvested at three maturity stages (50, 70 and 90%) and in three parts of the plant (superior, medial and inferior). The unproductive part was discharged and the productive one was divided in three equal parts.
Simultaneously with the physiological evaluation, the amount of water in the seeds was determined according to the Seed Analysis Rule (RAS - Regra de Análise de Sementes), using standard greenhouse method, where seeds were subjected to dry at 105 ±

Lisboa et al. 2827 Table 1. Summary of the variation analysis from average germination sums (TPG), first count (PC), speedy aging (EV) electrical conductivity (CE) and plant length (CP) for sesame seeds (beige and black), harvested at different maturity stages and plant positioning.
Source of variation
LG Mean square
TPG PC EV CE CP
Cultivar (C) 1 323.8513** 323.8513** 1671.3830** 56.5339ns
144.0050**
Third (T) 2 129.5412* 129.5412* 71.4956ns
1005.8490** 97.1843**
Stage (E) 2 59.2917ns
59.2917ns
35.0068ns
593.2154** 5.7906ns
C x T 2 88.9054ns
88.9054ns
19.6622ns
97.0135* 27.5513*
C x E 2 113.2717* 113.2717* 179.5443* 435.6110** 8.5717ns
T x E 4 24.1692ns
24.1692ns
18.5116ns
65.7279* 37.3281**
C x T x E 4 22.8833ns
22.8833ns
100.3612ns
35.4968ns
17.9954ns
Error 54 34.7225 34.7225 42.4457 21.4745 6.7252
C.V.(%) - 7.1726 7.1726 8.1923 7.6967 15.714
L.G. Liberty grades; *Significant at 5% of probability by F test, ** Significant at 1% by F test; ns
Not meaningful.
3°C for 24 h. The results are displayed in percentage (Brasil, 2009). The evaluation of physiological quality of seeds in treatment was
verified by the following tests: Standard Germination Test (TPG - Teste Padrão de Germinação), first count, plant length, speedy aging and electrical conductivity.
With the Standard Germination Test (TPG), viability was evaluated, with four 50-seed replications placed in an acrylic box (gerbox), containing a substratum. The germitest paper, previously moisturized with distilled water, is equivalent to paper weight threefold. The gerboxes were stored in a germinator at 25°C. An evaluation was carried out on the sixth day after test performance. The percentage of normal plants was taken into account (Brasil, 2009).
The first count test for germinations was conducted with TPG, with the aim to evaluate vigor, considering the percentage of normal plants present in the third day after the beginning of tests.
In order to reinforce vigor outcomes, the length of the plants was measured (radicle + hypocotyl) with four 10-seed replications. It was distributed in a straight longitudinal line, on the superior part of the germitest paper. It was cut to fit the gerbox (11 × 11 cm), previously moisturized with distilled water in threefold paper weight. Previously, they were placed in a germinator at 45º inclination and at 25ºC. After the third day, each plant size was measured with a millimeter rule (Nakagawa, 1999).
The speedy aging test is also characterized as a vigor test, where a 100- seed/replication was distributed onto the surface of a metal net fixed inside the plastic box - gerbox containing 40 ml of water. It was kept at 42ºC inside a germinator (Krzyzanowski et al., 1999). After this period, seeds were subjected to TPG, previously mentioned, to determine the percentage of normal plants after the third day of the test.
In addition to vigor measures, procedures described by Krzyzanowski et al. (1999) were applied for electric conductivity test. Four 50-seed replications, previously weighted in precision scales at 0.01 g, were moisturized in plastic cups (200 ml) with 75 ml of deionized water and stored in a germinator with steady temperature at 25ºC for 24 h. Electrical conductivity reading was performed using a field meter DIGIMED CD-21 and the outcomes were expressed in µS cm-3 g-1 of seeds.
The data were subjected to variation analysis, and when suitable, it was subjected to the Skott and Knott test at 5% probability.
RESULTS AND DISCUSSION
It has been observed through variation analysis that the
cultivar factor (C) influenced the germination test (TPG), first count (PC), speedy aging (EV) and plant length (CP) at 1% probability; whereas the factor stage (E) influenced only the conductivity test (CE) at probability 1%. The factor third (T), influenced the test TPG and PC at 5% probability, CE and CP at 1% probability (Table 1). The interactions C x T and T x E present significant difference only in the electrical conductivity test (at 5% probability) and plant length (at 5 and 1% probability, respectively), whereas the interaction C x E influenced the standard germination tests, first count and speedy aging at 5% probability and electrical conductivity at 1% probability. The triple interaction C x T x E has not significantly influenced the outcomes in any of the tests (Table 1).
It was observed that seeds harvested with 90% of mature seed capsules, present a higher percentage average value for the test of first count (84.9%) (Table 2). Seeds harvested with 70 and 50% of mature seed capsules presented average figures for first count at 81.95 and 79.61%, respectively. Premature seed harvest causes termination of physiological maturity process, bringing about loss in physiological quality, damaging vigor and viability. Sesame seeds that stay longer in the fields reach a higher uniformity in physiological maturity, yielding higher percentage values of physiological maturity. Similar results were found by Vidigal et al. (2009) for pepper seeds.
The beige cultivar has not presented significant difference for the maturity stages in the study; on the other hand, the black cultivar differed statistically in relation to all maturity stages. There was a significant difference among cultivars for all maturity stages. The maturity stage where seeds were harvested with 90% of mature capsules could show higher average percentage germination figures than others. This is due to the fact that most seeds have reached physiological maturity; the higher the percentage of mature capsules, the lower is its seed immaturity (Langham and Wiemers, 2008).
The first count test was conducted simultaneously

2828 Afr. J. Agric. Res.
Table 2. Average percentage figures for first count of germination (%) applied to sesame seeds for interaction stage x cultivar.
Cultivar Maturity stage (percentage of mature capsules)
90% 70% 50%
Beige 86.79Aa
83.81Aa
82.22Aa
Black 83.00Ab
80.10Bb
77.00Cb
Averages 84.90 81.95 79.61
Averages followed by the same capital letter in line and lower case in column, do not differ statistically among themselves, by Scott and Knott test at 5% probability.
Table 3. Average for germination (%) applied to sesame seeds for the interaction stage x cultivar.
Cultivar Maturity stage (percentage of mature capsules)
90% 70% 50%
Beige 86.79Aa
83.81Aa
82.22Aa
Black 83.00Ab
80.10Bb
77.00Cb
Averagess 84.90 81.95 79.61
Averages followed by the same capital letter in line and lower case in column, do not differ statistically among themselves, by Scott and Knott test at 5% probability.
Table 4. Average percentage results for speeded aging (%) applied for sesame seed for the interaction stage x cultivar.
Cultivar Maturity stage (percentage of mature capsules)
90% 70% 50%
Beige 87.12Aa
80.70Aa
85.21Aa
Black 76.38Ab
71.66Bb
76.08Ab
Averages 81.75 76.18 80.64
Averages followed by the same capital letter in line and lower case in column, do not differ statistically among themselves, by Scott and Knott test at 5% probability.
along with standard germination test. After that, seeds germinated mostly in the first count. The ones that remained in the second count, and for the registration of the standard germination test, presented themselves moldy or hard, delivering equal average percentage values either for the first count or for the standard germination test and for the interaction Stage x Cultivar (Table 3). The three maturity stages in the study presented average percentage germination figures above 70%, highlighting that even seeds harvested with 50% of mature capsules could be commercialized. In Brazil, the legislation demands that the minimum percentage for sesame seed germination be at 70% (Brasil, 2009).
In Table 4 it was observed that seeds harvested with 90% of mature capsules presented higher percentage average figures for the speedy aging test (81.75%), followed by maturity stages at 50 and 70% with 80.64 and 76.18, respectively. This means that, seeds harvested with 90% of mature capsules deliver more
vigor, that is, higher potential in yielding normal plants, in relation to other maturity stages in the study (Pollock and Ross, 1972).
The seeds of the beige cultivar did not differ statistically in relation to maturity stages in the study. Now the black cultivar presented significant difference between the maturity stages at 70 and 90% and 70 and 50%. Maturity stages of 90 and 50% did not differ significantly. Regarding cultivars, there was a significant difference in this one than all other maturity stages in the study. Against the odds, the maturity stage at 50% presented higher measures than the maturity stage at 70%. Seeds harvested with 50% of mature capsules in the plant presented greater amount of immature seeds, yielding a less vigorous lot of seeds. This was not observed in this test.
For electrical conductivity tests (Table 5), it has been observed that the inferior part presented higher average results (67.59%), followed by the superior (57.33%) and

Lisboa et al. 2829
Table 5. Average percentage values for electrical conductivity (µS cm-1g-1) applied to sesame seeds in the interaction third x cultivar.
Cultivar Third
Superior Medial Inferior
Beige 55.85Bb
53.12Bb
68.99Ab
Black 59.21Ba
57.88Ca
69.19Aa
Averages 57.53 55.50 67.59
Averages followed by the same capital letter in line and lower case in column, do not differ statistically among themselves, by Scott and Knott test at 5% probability.
Table 6. Average percentage values for electrical conductivity (µS cm-1g-1) applied to sesame seeds in the interaction stage x cultivar.
Cultivar Maturity stage (percentage of mature capsules)
90% 70% 50%
Beige 51.08Cb
57.63Bb
69.26Ab
Black 60.22Ba
60.93Ba
62.13Aa
Averages 55.65 59.28 65.69
Averages followed by the same capital letter in line and lower case in column, do not differ statistically among themselves, by Scott and Knott test at 5% probability.
medial (55.5%) parts. From data presented in Table 5, it can be stated that seeds in the inferior part are less vigorous. The higher the value for electric conductivity, the lower is its seed vigor, revealing a higher intensity of membrane system disorder in the cells (Vieira et al., 2002). Seeds in the superior part presented intermediate average results. This shows that behavior in capsule maturity for sesame seeds (starts from bottom to top) ends up in a greater number of immature seeds in the superior part. Consequently, the malformation of the tegmen results in a lesser seed vigor (Queiroga et al., 2010b). This is due to the fact that seeds in the inferior part have matured first and undergone some kind of infield hazard while waiting for harvest; the superior part has a greater number of immature seeds. The medial part delivered more vigorous seeds; it presented the lowest average percentage values for electric conductivity test (Queiroga et al., 2009; Martins et al., 2009).
The beige cultivar seeds presented a significant difference between the inferior/superior and inferior/medial parts; on the other hand, the seeds of the black cultivar presented a significant difference among the parts in the study. The black cultivar presented a significant difference among the parts because this cultivar has a longer cycle, and harvest is performed three weeks after the beige one. In this period, there are drought and high temperatures, providing a sharp drop in humidity and seed breakage. This results in loss in their physiological quality (Lago et al., 2001).
Table 6 presents the average percentage values for
electrical conductivity, where the maturity stages at 50, 70, and 90% presented averages of 65.69, 59.28 and 55.65% respectively. It was observed that the maturity stage at 50% presented the highest average for electrical conductivity test, highlighting that premature harvests jeopardize sesame seed vigor due to an early interruption in nutrient delivery by the plant (Queiroga et al., 2010b).
The beige cultivar presented a significant difference for all maturity stages in the study, whereas the black ones differed significantly between maturity stage at 50 and 70%, and between 50 and 90%. However, maturity stages at 90 and 70% did not differ significantly for this cultivar. There was a significant difference among cultivars for all different maturity stages. Black sesame seeds are more sensitive when harvest is performed in the maturity stages. Seeds’ maturity behavior does not occur in comparison to beige cultivar, since it has undergone genetic enhancement, and it has a more uniform behavior in relation to capsule maturity.
Data presented in Table 7 indicated that seeds harvested at 50, 70 and 90% of mature capsules presented average percentage values for electrical conductivity at 65.70, 59.04 and 55.9% respectively. The maturity stage at 50% delivered the highest percentage value for electrical conductivity test, showing that seeds harvested in this stage are less vigorous than the others due to a higher intensity of disorder in the membrane system in the cells (Vieira et al., 2002).
The superior, medial and inferior parts presented a significant difference for all maturity stages in the study. The maturity stage at 90% was the only one that did not

2830 Afr. J. Agric. Res.
Table 7. Average percentage values for electrical conductivity (µS cm-1g-1) applied to sesame seeds in the interaction stage x third.
Third Maturity stage (percentage of mature capsules)
90% 70% 50%
Superior 54.14Cb
56.36Bb
62.09Ab
Medial 53.59Cb
53.90Bc
59.02Ac
Inferior 59.98Ca
66.86Ba
75.98Aa
Averages 55.9 59.04 65.70
Averages followed by the same capital letter in line and lower case in column, do not differ statistically among themselves, by Scott and Knott test at 5% probability.
Table 8. Average percentage values for plant length (mm) applied to sesame seeds in the interaction third x cultivar.
Cultivar Third
Superior Medial Inferior
Beige 19.71Aa
17.34Ba
16.23Ba
Black 17.27Ab
16.27Bb
12.19Cb
Averages 18.49 16.80 14.21
Averages followed by the same capital letter in line and lower case in column, do not differ statistically among themselves, by Scott and Knott test at 5% probability.
differ statistically in relation to superior and medial parts. This outcome can be explained due to the fact that seeds harvested with 90% of mature capsules present well formed tegmen and higher percentage of mature seeds in all parts, delivering more vigorous seeds than the other maturity stages in the study (França Neto and Potts, 1979).
In the plant length test (Table 8), seeds harvested in the superior, medial and inferior parts presented average percentage values of 19.49, 16.80 and 14.21 mm, respectively. The superior part presented the highest average percentage value for plant length, highlighting that seeds harvested in this part are more vigorous. Consequently, they will deliver plants with a higher growth rate, because they present a higher capacity of transformation in the storage tissue reserves and higher share by the embryo axel (Dan et al., 1987).
The seeds from the beige cultivar presented a significant difference between superior/medial and superior/inferior parts, whereas the black cultivar presented significant difference for all parts in the study. The black sesame seeds portrayed more sensitivity regarding positioning of capsules in the plant, since the lower the position, the shorter is the plant; consequently, the lower the vigor. The seeds of the beige cultivar also presented shortage in plant growth, provided that the capsule was closer to the inferior part. However, this shortage was smaller than that of the black cultivar, showing that they are more vigorous, independent of plant position. Capsules that develop in the inferior part of the plant are prematurely exposed to agents such as high
temperature and humidity, leading to seed deterioration in field and vigor depletion.
In Table 9 it has been observed that seeds harvested with 90, 50 and 70% of the capsules in mature plants presented average percentage values for plant length of 18..26, 16.17 and 15.08 mm, respectively. Seeds harvested with 90% of mature capsules presented the highest average percentage value for plant length, depicting that this maturity stage has more vigorous seeds. This is because plant growth test indicates that samples which present higher values of average length for normal plants or parts of them are considered to be more vigorous (Nakagawa, 1994). Against all odds, seeds harvested with 50% of mature capsules had higher averages than the ones harvested at 70%, because the higher the number of mature seeds, the better the chances of them to present higher vigor (Vidigal et al., 2009).
The superior, medial and inferior parts present significant differences for all maturity stages in the study; all maturity stages differ statistically among the parts. These results strengthen that there is sensitivity from seeds regarding positioning of capsules in the plant and maturity stages for plant length. Even with all external and intrinsic agents of the plant, the seeds harvested with 90% of mature capsules show higher vigor. Conclusions The maturity stage at 90% had the lowest vigor and

Lisboa et al. 2831
Table 9. Average percentage values for plant length (mm) applied to sesame seeds in the interaction stage x third.
Third Maturity stage (Percentage of mature capsules)
90% 70% 50%
Superior 20.66Aa
15.19Ca
18.11Ba
Medial 18.70Ab
16.51Cb
16.71Bb
Inferior 15.41Ac
13.53Cb
13.70Bc
Averages 18.26 15.08 16.17
Averages followed by the same capital letter in line and lower case in column, do not differ statistically among themselves, by Scott and Knott test at 5% probability.
viability loss for both cultivars. Beige cultivar seeds presented more viability than black cultivar seeds, independent of maturity stages. For speedy aging test, seeds harvested with 90% of mature capsules presented higher vigor than the remaining parts for both cultivars. The electrical conductivity test has pointed out the seeds of both cultivars are less vigorous when harvested in the inferior part and with 50% of mature capsules in the plant. Black sesame seeds showed more sensitivity to positioning of capsules in the plant, since the lower its positioning, the shorter the plant and therefore, lower vigor. The beige cultivar seeds also presented shortage in plant length, as the position of the capsule was closer to the inferior part; however, this shortage was lesser than that of the black cultivar, showing that those seeds are more vigorous, independent of plant positioning. Conflict of Interests The authors have not declared any conflict of interests. REFERENCES Arslan Ç, Uzun B, Ülger S, Çağirgan MI (2007). Determination of oil
content and fatty acid composition of sesame mutants suited for intensive management conditions. J. Am. Oil Chem. Soc. 84:917-920.
Ashri A (1998). Sesame breeding. In: Janick J (Ed.). Plant Breeding Review, 160. Wiley, Somerset. pp. 179-228.
Ashri A (2006). Sesame (Sesamum indicum L.). Genetic Resources, Chromosome Engineering and Crop Improvement. Oilseed Crops 4:231-280.
Banerjee PP, Kole EPC (2009). Analysis of Genotypic Diversity in Sesame (Sesamum indicum L.) Based on Some Physiological Characters. Czech J. Genet. Plant Breed. 45:72-78.
BRASIL - Ministério da Agricultura, Pecuária e Abastecimento (2009). Regras para análises de sementes. Ministério da Agricultura e relativa Reforma Agrária. Brasília, [In Portuguese] 398 p.
da Silva ER, Martino HSD, Moreira AVB, Arriel NHC, Silva AC, Ribeiro SMR (2011). Capacidade antioxidante e composição química de grãos integrais de gergelim creme e preto. Pesquisa Agropecuária Bras.
Dan EL, Mello VDC, Wetzel CT, Popinigis F, Souza EP (1987). Transferência de matéria seca como método de avaliação do vigor de sementes de soja. Rev. Bras. Sementes. 3:45-55.
Doo HS, Oh MK, Park KH, Suh DY, Ryu JH (2003). Growth analysis
between determinate and indeterminate growth types in sesame. Korean J. Breed. 35:66-71.
Emamgholizadeh S, Parsaeian M, Baradaran M (2015). Seed yield prediction of sesame using artificial neural network. Eur. J. Agron. 68:89-96.
Erbas M, Sekerci H, Gül S, Furat S, Yol E, Uzun B (2009). Changes in total antioxidant capacity of sesame (Sesamum sp.) by variety. Asian J. Chem. 21:5549-5555.
FAO – Food and Agriculture Organization (2012). Statistical data 2011. Available at: http://faostat.fao.org/faostat.
França Neto JB, Potts HC (1979). Efeitos da colheita mecânica e da secagem artificial sobre a qualidade da semente dura em soja. Rev. Bras. Sementes 1:64-77.
Furat S, Uzun B (2010). The use of agro-morphological characters for the assessment of genetic diversity in sesame (Sesamum indicum L). Plant Omics. 3(3)85.
Kryzanowski FC, Vieira RD, França NJB (1999), conceitos e testes. Londrina: ABRATES. P 218.
Lago AA, Camargo OBA, Savy FA, Maeda JA (2001). Maturação e produção de sementes de gergelim cultivar IAC-China. Rev. Agropecuária Bras. 36:363-369.
Langham R, Wiemers T (2008). Sesame production in Texas: january, 2007. Texas: Sesaco Corporation. Disponível em: www.sesaco.net/mecahanized- sesame.htm.
Martins MTCS, Bruno RLA, Gonçalves EP, Alves TI, Castro JP (2009). Qualidade fisiológica e sanitária de sementes de três cultivares de algodoeiro herbáceo armazenadas. Revista Caatinga, Mossoró, 22:144-149.
Morris JB (2009). Characterization of sesame (Sesamum indicum L.) germplasm regenerated in Georgia, USA. Genet. Resour. Crop Evol. 56:925-936.
Nakagawa J (1994). Testes de vigor baseados na avaliação das plântulas. In: Vieira RD.; Carvalho NM. (eds.). Testes de vigor em sementes. Jaboticabal: Ed. FUNEP. pp. 49-85.
Nakagawa J (1999). Testes de vigor baseados no desempenho das plântulas. In: Krzyzanowski FC, Vieira RD, França Neto JB (Ed.). Vigor de sementes: conceitos e testes. Londrina: ABRATES, Comitê de Vigor de Sementes. pp. 9-13.
Pollock BM, Ross E (1972). Seed and seedling vigour. In T. T. Kozlowski (Ed), Seed biology. Academic Press.
Popinigis F (1985). Fisiologia da semente. Brasília: AGIPLAN, pp.289. Queiroga VP, Borba FG, Almeida KV, Souza WJB, Jeronimo JF,
Queiroga DAN (2010). Qualidade fisiológica e composição química de sementes de gergelim com distintas cores. Rev. Agro@mbiente On-line 4:27-33.
Queiroga VP, Gondim TMS, Firmino PT, Silva AC, Queiroga DAN (2010). Colheita manual e diferentes formas de aproveitamento de grãos de gergelim. Rev. Agro@mbiente On-line 4:110-117.
Queiroga VP, Gondim TMS, Queiroga DAN (2009). Tecnologias sobre operações de semeadura e colheita para a cultura do gergelim.
Queiroga VP, Gondim TMS, Vale DG, Gereon HGM, Moura JA, Silva PJ, Souza FJF (2008). Produção de gergelim orgânico nas comunidades de produtores familiares de São Francisco de Assis do Piauí. Campina Grande: Embrapa Algodão. Documentos. P 127.

2832 Afr. J. Agric. Res.
Raikwar RS, Srivastva P (2013). Productivity enhancement of sesame (Sesamum indicum L.) through improved production Technologies. Afri. J. Agric. Res. 8:6073-6078.
Uzun B, Arslan C, Furat S (2008). Variation in fatty acid compositions, oil content and oil yield in a germplasm collection of sesame (Sesamum indicum L.). J. Am. Oil Chem. Soc. 85:1135-1142.
Uzun B, Cagirgan MI (2009). Identification of molecular markers linked to determinate growth habit in sesame. Euphytica 166:379-384.
Uzun B, Yol E, Furat S, Topakçi M, Çanakçi M, Karayel D (2012). The effects of different tillage methods on the post-wheat second crop sesame: seed yield, energy budget, and economic return. Turk J. Agric. For. 36:399-407.
Vidigal DS, Dias DCFS, Pinho EVRV, Dias LAS (2009). Alterações
fisiológicas e enzimáticas durante a maturação de sementes de pimenta (Capsicum annuum L.). Rev. Bras. Sementes. 31:129-136.
Vieira RD, Penariol AL, Perecin D, Panobianco M (2002). Condutividade elétrica e teor de água inicial das sementes de soja. Pesquisa Agropecuária Bras. 37:1333-1338.
Weiss EA (1983). Oilseed crops. London: Longman. 660 p.
African Journal of
Agricultural Research
Related Journals Published by Academic Journals
African Journal of Environmental Science & Technology
Biotechnology & Molecular Biology Reviews
African Journal of Biochemistry Research
African Journal of Microbiology Research
African Journal of Pure & Applied Chemistry
African Journal of Food Science
African Journal of Biotechnology
African Journal of Pharmacy & Pharmacology
African Journal of Plant Science
Journal of Medicinal Plant Research
International Journal of Physical Sciences
Scientific Research and Essays