Embed Size (px)
Citation preview

Agricultural Economics Report No. 366 October 1996
AGRICULTURAL LOAN OFFICERS’ ROLES IN COOPERATIVE INVESTMENT IN
NORTH DAKOTA
Brooks M. Wilson, Gary A. Goreham, Theron Kibbe, and David W. Cobia
Department of Agricultural EconomicsNorth Dakota State University
Fargo, North Dakota 58105

AGRICULTURAL LOAN OFFICERS’ ROLES IN COOPERATIVE INVESTMENT INNORTH DAKOTA
Brooks M. Wilson, Gary A. Goreham, Theron Kibbe, and David W. Cobia
Department of Agricultural EconomicsNorth Dakota State University
Fargo, ND 58105-5636
The analyses and views reported in this paper are those of the author. They are not necessarilyendorsed by the Department of Agriculture or by North Dakota State University.
North Dakota State University is committed to the policy that all persons shall have equal access toits programs, and employment without regard to race, color, creed, religion, national origin, sex, age,marital status, disability, public assistance status, veteran status, or sexual orientation.
Information on other titles in this series may be obtained from: Department of AgriculturalEconomics, North Dakota State University, P.O. Box 5636, Fargo, ND 58105. Telephone: 701-231-7441, Fax: 701-231-7400, or e-mail: [email protected].
Copyright © 1996 by Brooks M. Wilson, Gary A. Goreham, Theron Kibbe, and David Cobia. Allrights reserved. Readers may make verbatim copies of this document for non-commercial purposesby any means, provided that this copyright notice appears on all such copies.


ACKNOWLEDGMENTS
The Cooperative Marketing Division, United States Department of Agriculture funded thisresearch project. Thomas Stafford of that office provided helpful guidance as the USDA liaisonto this project through research agreement 43-3J31-4-0017. We received insights from manysources regarding survey design, data, and reporting. In particular, we thank the loan officerswho participated in the design and pretesting of the survey. We also appreciate the valuableassistance provided by Lee Esteson of the St. Paul Bank for Cooperatives, and Marilyn Foss andJames Laidlaw at the North Dakota State Department of Banking. Finally, we appreciate ourcolleagues and staff in the Department of Agricultural Economics and the Department ofSociology/Anthropology, North Dakota State University for their reviews and assistance inpreparing this report. In particular, we thank Frayne Olson and Sanjib Bhuyan for manycontributions throughout the research project, and Marvin Duncan, David Saxowsky, and ColeGustafson for thoughtful reviews of earlier drafts of the paper.

TABLE OF CONTENTS
LIST OF TABLES . . . . . . . . . . . . . . . . . . . . . . . . . . . . . . . . . . . . . . . . . . . . . . . . . . . . . . . . . . ii
LIST OF APPENDIX TABLES . . . . . . . . . . . . . . . . . . . . . . . . . . . . . . . . . . . . . . . . . . . . . . . iii
LIST OF FIGURES. . . . . . . . . . . . . . . . . . . . . . . . . . . . . . . . . . . . . . . . . . . . . . . . . . . . . . . . . . v
HIGHLIGHTS . . . . . . . . . . . . . . . . . . . . . . . . . . . . . . . . . . . . . . . . . . . . . . . . . . . . . . . . . . . . vi
ABSTRACT . . . . . . . . . . . . . . . . . . . . . . . . . . . . . . . . . . . . . . . . . . . . . . . . . . . . . . . . . . . . . . ix
INTRODUCTION . . . . . . . . . . . . . . . . . . . . . . . . . . . . . . . . . . . . . . . . . . . . . . . . . . . . . . . . . . 1
METHOD . . . . . . . . . . . . . . . . . . . . . . . . . . . . . . . . . . . . . . . . . . . . . . . . . . . . . . . . . . . . . . . . . 1Statistical Techniques. . . . . . . . . . . . . . . . . . . . . . . . . . . . . . . . . . . . . . . . . . . . . . . . . . . 3
RESULTS AND DISCUSSION. . . . . . . . . . . . . . . . . . . . . . . . . . . . . . . . . . . . . . . . . . . . . . . . 3Financial Institutions. . . . . . . . . . . . . . . . . . . . . . . . . . . . . . . . . . . . . . . . . . . . . . . . . . . 3Policy Regarding Loans. . . . . . . . . . . . . . . . . . . . . . . . . . . . . . . . . . . . . . . . . . . . . . . . 12
Loan Policy . . . . . . . . . . . . . . . . . . . . . . . . . . . . . . . . . . . . . . . . . . . . . . . . . . . 12Approval Mechanisms. . . . . . . . . . . . . . . . . . . . . . . . . . . . . . . . . . . . . . . . . . . 13Lending Criteria. . . . . . . . . . . . . . . . . . . . . . . . . . . . . . . . . . . . . . . . . . . . . . . . 22
Lending Practices. . . . . . . . . . . . . . . . . . . . . . . . . . . . . . . . . . . . . . . . . . . . . . . . . . . . . 24Attitudes Toward Lending and Cooperatives. . . . . . . . . . . . . . . . . . . . . . . . . . . . . . . . 27
Assessment of Farmers’ Investment Acumen. . . . . . . . . . . . . . . . . . . . . . . . . . 28Objectives Achieved by Cooperatives. . . . . . . . . . . . . . . . . . . . . . . . . . . . . . . . 28Attitudes Toward Cooperatives. . . . . . . . . . . . . . . . . . . . . . . . . . . . . . . . . . . . 34Risk and Return of Cooperatives. . . . . . . . . . . . . . . . . . . . . . . . . . . . . . . . . . . 37
Demographics. . . . . . . . . . . . . . . . . . . . . . . . . . . . . . . . . . . . . . . . . . . . . . . . . . . . . . . 44
CONCLUSIONS. . . . . . . . . . . . . . . . . . . . . . . . . . . . . . . . . . . . . . . . . . . . . . . . . . . . . . . . . . . 44
REFERENCES. . . . . . . . . . . . . . . . . . . . . . . . . . . . . . . . . . . . . . . . . . . . . . . . . . . . . . . . . . . . 49
APPENDICES . . . . . . . . . . . . . . . . . . . . . . . . . . . . . . . . . . . . . . . . . . . . . . . . . . . . . . . . . . . . 50

ii
LIST OF TABLESTable Page
1 Financial condition, institutional type, and geographic location variables of institutionsmaking agricultural loans, North Dakota, 1995. . . . . . . . . . . . . . . . . . . . . . . . . . . . . . . . 4
2 Crosstabulation tests for financial condition, institutional type, and geographic locationvariables of institutions making agricultural loans, North Dakota, 1995. . . . . . . . . . . . . 5
3 Approval mechanisms, and loan policy variables of financial institutions’, North Dakota,1995 . . . . . . . . . . . . . . . . . . . . . . . . . . . . . . . . . . . . . . . . . . . . . . . . . . . . . . . . . . . . . . 14
4 Loan policy variables. A comparison of the restrictiveness of policy regarding cooperativestock loans and other agricultural loans of similar size, North Dakota, 1995. . . . . . . . . . . . . . . . . . . . . . . . . . . . . . . . . . . . . . . . . . . . . . . . . . . . . . . . 15
5 Crosstabulation tests for approval mechanisms and loan policy variables of financialinstitutions, North Dakota, 1995. . . . . . . . . . . . . . . . . . . . . . . . . . . . . . . . . . . . . . . . . 15
6 Loan policy variables. Financial institutions that enacted a policy prior to receiving acooperative stock loan application, North Dakota, 1995. . . . . . . . . . . . . . . . . . . . . . . . 16
7 Crosstabulations tests for loan policy variables. Financial institutions that enacted a policyprior to receiving a cooperative stock loan application, North Dakota, 1995. . . . . . . . . 17
8 Lending criteria variables. Characteristics of the borrower and the cooperativeinvestment, North Dakota, 1995. . . . . . . . . . . . . . . . . . . . . . . . . . . . . . . . . . . . . . . . . . 19
9 Crosstabultion tests for an assessment of farmers’ investment acumen, and lending criteriaof the borrower variables, North Dakota, 1995. . . . . . . . . . . . . . . . . . . . . . . . . . . . . . . 20
10 Crosstabulations tests for lending criteria variables of the cooperative investment, NorthDakota, 1995. . . . . . . . . . . . . . . . . . . . . . . . . . . . . . . . . . . . . . . . . . . . . . . . . . . . . . . . 21
11 Lending practices variables, North Dakota, 1995. . . . . . . . . . . . . . . . . . . . . . . . . . . . . 24
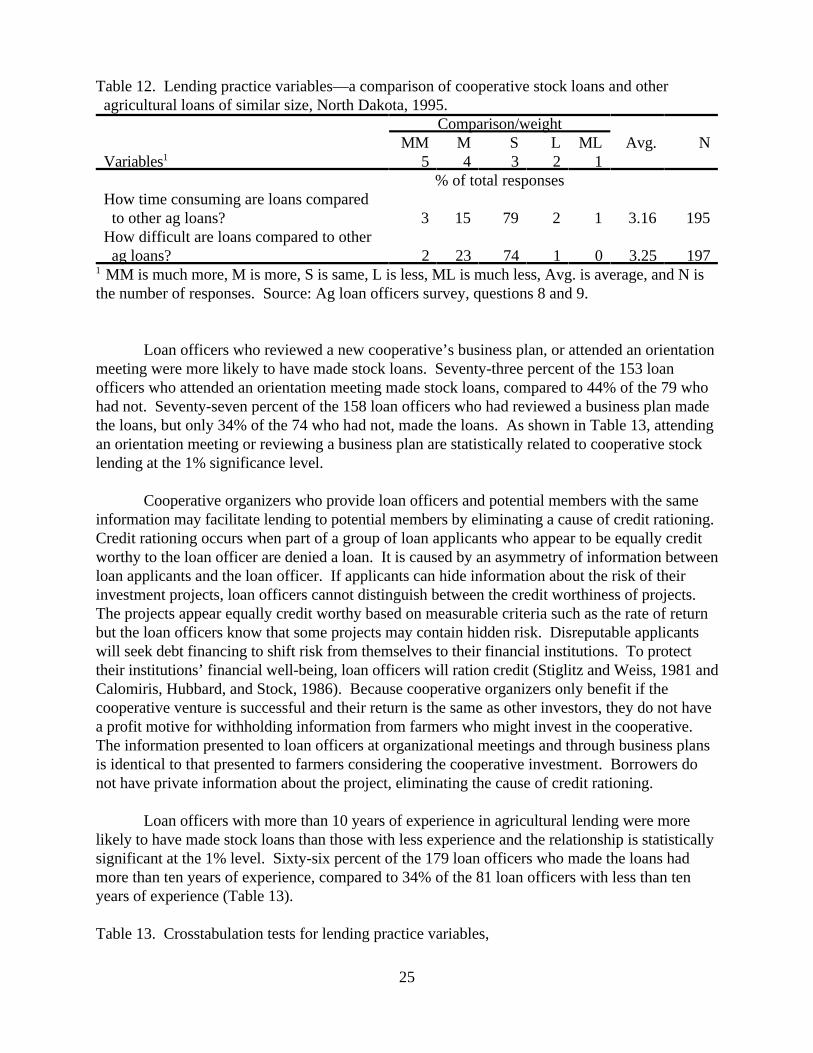
12 Lending practice variables—a comparison of cooperative stock loans and otheragricultural loans of similar size, North Dakota, 1995. . . . . . . . . . . . . . . . . . . . . . . . . . 25
13 Crosstabulation tests for lending practice variables, North Dakota 1995. . . . . . . . . . . . 26

iii
LIST OF TABLES (Cont'd.) Table Page
14 Assessment of farmers’ investment acumen variable by loan officers, North Dakota, 1995. . . . . . . . . . . . . . . . . . . . . . . . . . . . . . . . . . . . . . . . . . . . . . . . . . . . . . . 27
15 Objectives achieved by cooperatives variables, North Dakota, 1995. . . . . . . . . . . . . . . 29
16 Crosstabulation tests for objectives achieved by cooperatives variables—the loan officers’perceptions of farmers’ views, North Dakota, 1995. . . . . . . . . . . . . . . . . . . . . . . . . . . 31
17 Crosstabulation tests for objectives achieved by cooperatives variables—the loan officers’views, North Dakota, 1995. . . . . . . . . . . . . . . . . . . . . . . . . . . . . . . . . . . . . . . . . . . . . 32
18 Attitudes toward cooperatives variables—loan officers' responses to negative statementsabout agricultural cooperatives, North Dakota, 1995. . . . . . . . . . . . . . . . . . . . . . . . . . 34
19 Attitudes toward cooperatives—a comparison of the performance of new and traditionalcooperatives, North Dakota, 1995. . . . . . . . . . . . . . . . . . . . . . . . . . . . . . . . . . . . . . . . 35
20 Crosstabulation tests for attitudes toward cooperatives variables—a comparison of theperformance of new and traditional cooperatives, and responses to negative statementsabout new cooperatives, North Dakota, 1995. . . . . . . . . . . . . . . . . . . . . . . . . . . . . . . . 36
21 Risk and return variables—a comparison of the long-term return of cooperatives andalternative investments, North Dakota, 1995. . . . . . . . . . . . . . . . . . . . . . . . . . . . . . . . 38
22 Risk and return—reduction of long-term marketing risk, North Dakota, 1995. . . . . . . 38
23 Crosstabulation tests for risk and return variables—a comparison of the long-term returnof cooperatives and alternative investments, North Dakota. . . . . . . . . . . . . . . . . . . . . . 39
24 Crosstabulation tests for risk and return variables—a comparison of the long-term risk ofcooperatives and alternative investments, and reduction of long-term marketing risk,North Dakota, 1995. . . . . . . . . . . . . . . . . . . . . . . . . . . . . . . . . . . . . . . . . . . . . . . . . . . 40
25 Demographic variables, North Dakota, 1995. . . . . . . . . . . . . . . . . . . . . . . . . . . . . . . . 45
26 Crosstabulation tests for demographic variables, North Dakota, 1995. . . . . . . . . . . . . . 46

iv
LIST OF APPENDIX TABLESTable Page
A1 Crosstabulation tests for financial condition variables, including the Farm Credit Services,that made agricultural loans, North Dakota, 1995. . . . . . . . . . . . . . . . . . . . . . . . . . . . . 51
A2 Crosstabulation tests for capital as a percentage of total assets of the institutions,excluding the farm credit services, after controlling for return on equity and non-currentloans, North Dakota, 1995. . . . . . . . . . . . . . . . . . . . . . . . . . . . . . . . . . . . . . . . . . . . . . 52
A3 Market share comparison of banks, the farm credit services, and credit unions based onfinancial information, North Dakota 1994. . . . . . . . . . . . . . . . . . . . . . . . . . . . . . . . . . . 53
A4 Market share comparison of large, medium, and small banks and credit unions based onfinancial information, North Dakota 1994. . . . . . . . . . . . . . . . . . . . . . . . . . . . . . . . . . . 53
A5 Market share comparison based on the percentage of equity based on financialinformation, North Dakota 1994. . . . . . . . . . . . . . . . . . . . . . . . . . . . . . . . . . . . . . . . . 54
A6 Financial institutions’ loan activity with farmers seeking to fund investments in newagricultural cooperatives, North Dakota, 1995. . . . . . . . . . . . . . . . . . . . . . . . . . . . . . . 55
A7 Loan officer’s loan activity with farmers seeking to fund investments in new agriculturalcooperatives, North Dakota, 1995. . . . . . . . . . . . . . . . . . . . . . . . . . . . . . . . . . . . . . . . 56

v
LIST OF FIGURES
Figure Page
1 Combined crop reporting regions in North Dakota. . . . . . . . . . . . . . . . . . . . . . . . . . . . . 7
2 Market Share comparison of banks, FCS, and credit unions, North Dakota, 1994. . . . . . 9
3 Market Share comparison by size of banks and credit unions, North Dakota, 1994. . . . 10 4 Market Share comparison based on percentage of equity, North Dakota, 1994. . . . . . 11
5 Comparison of loan officers' views and loan officers' perception of farmers' views . . . 30 6 Average estimate of risk and return of co-op investments compared to alternative
investments by agricultural loan officers, North Dakota, 1995. . . . . . . . . . . . . . . . . . . 42
7 Average estimate of risk and return of co-op investments compared to alternativeinvestments by agricultural loan officers, members and non-members, NorthDakota, 1996. . . . . . . . . . . . . . . . . . . . . . . . . . . . . . . . . . . . . . . . . . . . . . . . . . . . . . . 43

vi
HIGHLIGHTS
The objective of this paper is to explain what factors influenced agricultural loan officersto make or not to make loans to farmers investing in new agricultural cooperatives. The factorsconsidered are the characteristics of the financial institutions, the loan policies of the institutions,the lending practices of loan officers, the attitudes of loan officers toward cooperatives, anddemographic characteristics of loan officers.
We conducted two surveys of the 388 agricultural loan officers and the 215 loansupervisors in North Dakota to generate the information needed in the evaluation. They wereasked to complete and return questionnaires that we had mailed to them. To assure a goodresponse rate, we made as many as three additional contacts with persons who had not returnedthe questionnaires. We used the crosstabulation technique to measure the relationship betweenthe factors and the decision to make or not to make a cooperative stock loan. Following are thehighlights of the paper.
! The Farm Credit Services dominated lending to farmers investing in cooperative stock. They held a larger percentage of cooperative stock loans than their market presence inagricultural lending would suggest. Despite holding only 26% of agricultural loans theFCS held approximately 64% of the value of stock loans.
! Institutions with more than $100 million in assets were more likely to have madecooperative stock loans than institutions less than $100 million in assets.
! Institutions with less than 7% capital were more likely to have made cooperative stockloans than institutions with 7% to 10% capital or more. Moderately capitalizedinstitutions were more likely to have made stock loans than highly capitalized institutions. The results only held for the most profitable institutions, and those with low, or moderatelevels of non-current loans.
! Institutions which aggressively marketed cooperative stock loans by offering special termsor conditions, such as lower interest rates or deferred principal payments, were more likelyto have made the loans than institutions offering loans under normal terms and conditions.
! Loan officers used conservative lending criteria that emphasized repayment from ongoingoperations, not from the investment project. For example, 83% and 79% believed that thedebt-equity position and the profitability of the farm enterprise were very important. Only66% and 56% believed that the marketing plan of the proposed cooperative or itsestimated return on investment were very important.
! Venture cooperatives may have an advantage over other venture agribusiness firms inraising funds form North Dakota financial institutions.

vii
Loans to cooperative investors allow institutions to maintain conservative lendingpractices because they are smaller and spread over more investors than loans toother agribusiness investors.
Loan officers may have more trust in the organizers of new cooperative ventures. The trust is based on the knowledge that the organizers do not have a profitincentive to hide information about the cooperative from investors or loan officers.
! Loan officers with extensive experience in agricultural lending were more likely to havemade cooperative stock loans.
Those with more than 10 years of experience in agricultural lending were morelikely to have made stock loans than those with less experience.
Those who attended a cooperative information meeting or reviewed a businessplan were more likely to have made stock loans than those who had not.
Those who spent more than 60% of their time in agricultural lending were morelikely to have made stock loans than those who spent less time.
! Attitudes about cooperatives were positive.The average loan officer believed that cooperatives generally met worthwhileeconomic and social objectives.
Loan officers believed that farmers were more positive than they were about theability of new cooperatives to achieve economic objectives.
They were more confident than they believed farmers were about the ability of newcooperatives to help farmers network and increase their knowledge base.
Although the average lender disagreed with most negative statements aboutcooperatives, a number felt that cooperatives benefited only the wealthy (34%),delivery contracts were too strict (19%), and required investments were too high(30%).
! Loan officers viewed new agricultural cooperatives as risky investments.On average, loan officers believed that cooperative investment is riskier thanalternative investments in stock, mutual funds, bonds, certificates of deposit, land,and other farm enterprises.
As stand alone investments, loan officers viewed cooperative stock as inferior tostock or mutual funds; the average loan officer believed that cooperative stockpays a lower rate of return and incurs greater risk.

viii
The average loan officer believed that investment in new agricultural cooperativeslowers marketing risk by a small amount.
! Loan officers’ attitudes toward cooperatives and the project in question, either positive ornegative, had little influence on the decision to approve loans.

ix
AGRICULTURAL LOAN OFFICERS’ ROLES IN COOPERATIVE INVESTMENT INNORTH DAKOTA
Brooks M. Wilson, Gary A. Goreham, Theron Kibbe, and David W. Cobia
ABSTRACT
We surveyed agricultural loan officers and their supervisors in North Dakota to learn whatfactors influenced the decision to make loans to farmers investing in new agriculturalcooperatives. We found that the Farm Credit Services and other large institutions made adisproportionately large share of the loans. Furthermore, institutions with minimal equity, butwith low levels of non-current loans and a high return on equity, were more likely than others tomake the loans. Experienced agricultural loan officers and those who attended a cooperative’sinformation meeting or reviewed the business plan were more likely to make loans. Loan officersgranted loans to applicants who met conservative lending criteria. The decision was not based onthe loan officer’s attitudes toward cooperatives. Attitudes of loan officers toward cooperativeswere generally positive. Most negative attitudes were expressed about the price of the stock, andthe delivery contracts required by the cooperatives. Finally, loan officers believed cooperativestock was a risky investment, inferior to stock and mutual funds as stand alone investments.
Keywords: cooperatives, cooperative stock loans, loan officers, financial institutions, NorthDakota
AGRICULTURAL LOAN OFFICERS’ ROLES IN COOPERATIVE INVESTMENT INNORTH DAKOTA
Brooks M. Wilson, Gary A. Goreham, Theron Kibbe, and David W. Cobia
I. INTRODUCTION
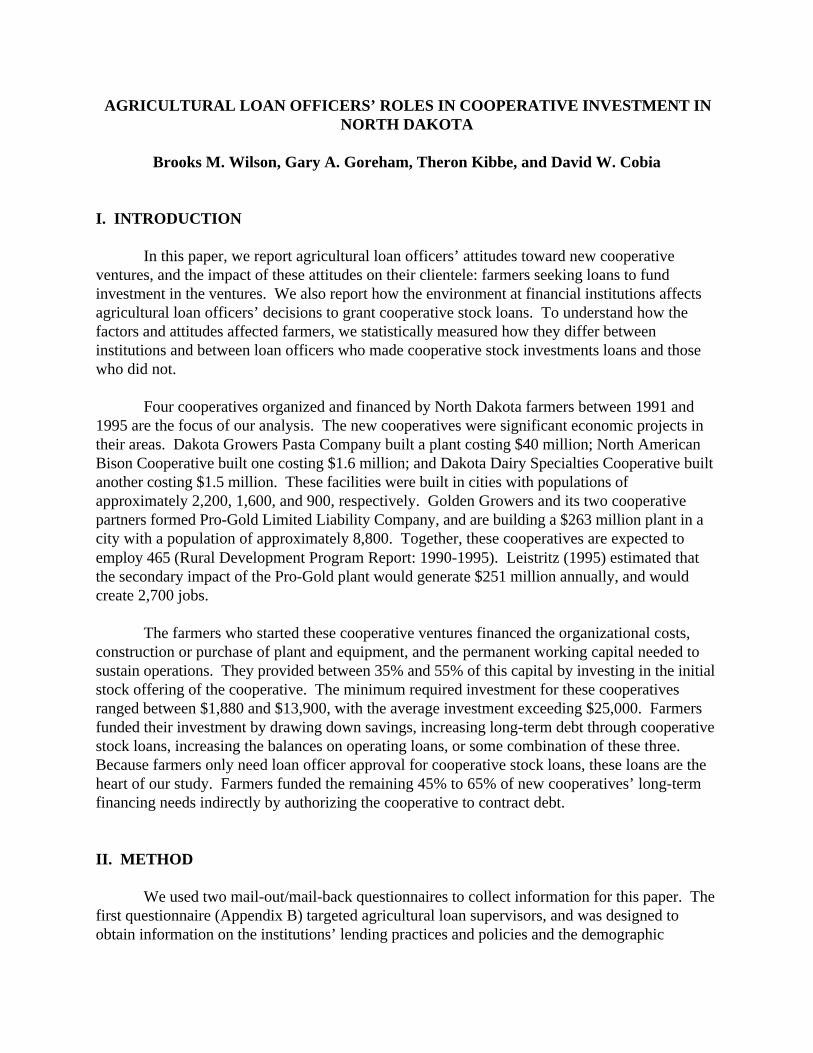
In this paper, we report agricultural loan officers’ attitudes toward new cooperativeventures, and the impact of these attitudes on their clientele: farmers seeking loans to fundinvestment in the ventures. We also report how the environment at financial institutions affectsagricultural loan officers’ decisions to grant cooperative stock loans. To understand how thefactors and attitudes affected farmers, we statistically measured how they differ betweeninstitutions and between loan officers who made cooperative stock investments loans and thosewho did not.
Four cooperatives organized and financed by North Dakota farmers between 1991 and1995 are the focus of our analysis. The new cooperatives were significant economic projects intheir areas. Dakota Growers Pasta Company built a plant costing $40 million; North AmericanBison Cooperative built one costing $1.6 million; and Dakota Dairy Specialties Cooperative built another costing $1.5 million. These facilities were built in cities with populations ofapproximately 2,200, 1,600, and 900, respectively. Golden Growers and its two cooperativepartners formed Pro-Gold Limited Liability Company, and are building a $263 million plant in acity with a population of approximately 8,800. Together, these cooperatives are expected toemploy 465 (Rural Development Program Report: 1990-1995). Leistritz (1995) estimated thatthe secondary impact of the Pro-Gold plant would generate $251 million annually, and wouldcreate 2,700 jobs.
The farmers who started these cooperative ventures financed the organizational costs,construction or purchase of plant and equipment, and the permanent working capital needed tosustain operations. They provided between 35% and 55% of this capital by investing in the initialstock offering of the cooperative. The minimum required investment for these cooperativesranged between $1,880 and $13,900, with the average investment exceeding $25,000. Farmersfunded their investment by drawing down savings, increasing long-term debt through cooperativestock loans, increasing the balances on operating loans, or some combination of these three. Because farmers only need loan officer approval for cooperative stock loans, these loans are theheart of our study. Farmers funded the remaining 45% to 65% of new cooperatives’ long-termfinancing needs indirectly by authorizing the cooperative to contract debt.
II. METHOD
We used two mail-out/mail-back questionnaires to collect information for this paper. Thefirst questionnaire (Appendix B) targeted agricultural loan supervisors, and was designed toobtain information on the institutions’ lending practices and policies and the demographic

2
characteristics of the supervisors. The second questionnaire (Appendix C) targeted agriculturalloan officers and loan supervisors. It was designed to learn their lending practices, attitudes anddemographic characteristics. To assure good rates of return we employed the Dillman TotalDesign method, which requires researchers to make as many as three additional contacts withpersons who have not returned the questionnaires. The contacts occurred on a weekly basis andended if the questionnaire was returned. The first two contacts were by mail, and the third bytelephone.
First, we surveyed the 215 agricultural loan supervisors working at 161 banks, 25 creditunions, and 29 Farm Credit Services ( FCS) in North Dakota. The North Dakota BankersAssociation, state agencies, and FCS provided the names of the supervisors. Our overall returnrate was 66%; the return rate was 65% for banks, 76% for credit unions, and 64% for FCS. Thequestionnaire included questions related to lending activity on cooperative stock loans, type ofinstitution, lending policy, and personal characteristics of the supervisors. The data on financialperformance for banks, credit unions, and FCS came from the Fedgazette, the North Dakota StateBanking Department, and annual reports.
Next we surveyed the 388 agricultural loan officers and loan supervisors working at thesame institutions. The loan supervisors were included in the second survey because they makeagricultural loans as well as supervise loan officers. The North Dakota Bankers Association, stateagencies, the FCS, and the loan supervisors provided the names of the loan officers. The overallreturn rate for loan officers was 69%; the return rate for banks was 67%, credit unions, 73%, andFCS, 74%. The questionnaire included questions related to lending activity on cooperative stockloans, lending practices, attitudes toward cooperatives, and demographic characteristics of theloan officers.
Response to questions and statements in the questionnaires provided the data for ourvariables. We statistically analyzed the differences in the variables between institutions or loanofficers who made at least one loan of any amount between 1991 and 1995, and those who didnot. Next, we grouped variables that are similar in subject, such as those related to financialperformance, into five clusters. Large clusters were further divided into sets of similar variables. We present an outline of the clusters and their divisions into sets prior to describing them morefully.
I. Financial institutions A. Financial conditionB. Institution typeC. Geographic location
II. Policy Regarding LoansA. Loan policyB. Approval mechanismsC. Lending criteria
3
III. Lending practices
IV. Attitudes toward lending and cooperativesA. Assessment of farmers’ investment acumenB. Objectives achieved by cooperativesC. Attitudes toward cooperativesD. Risk and return of cooperatives
V. Demographics
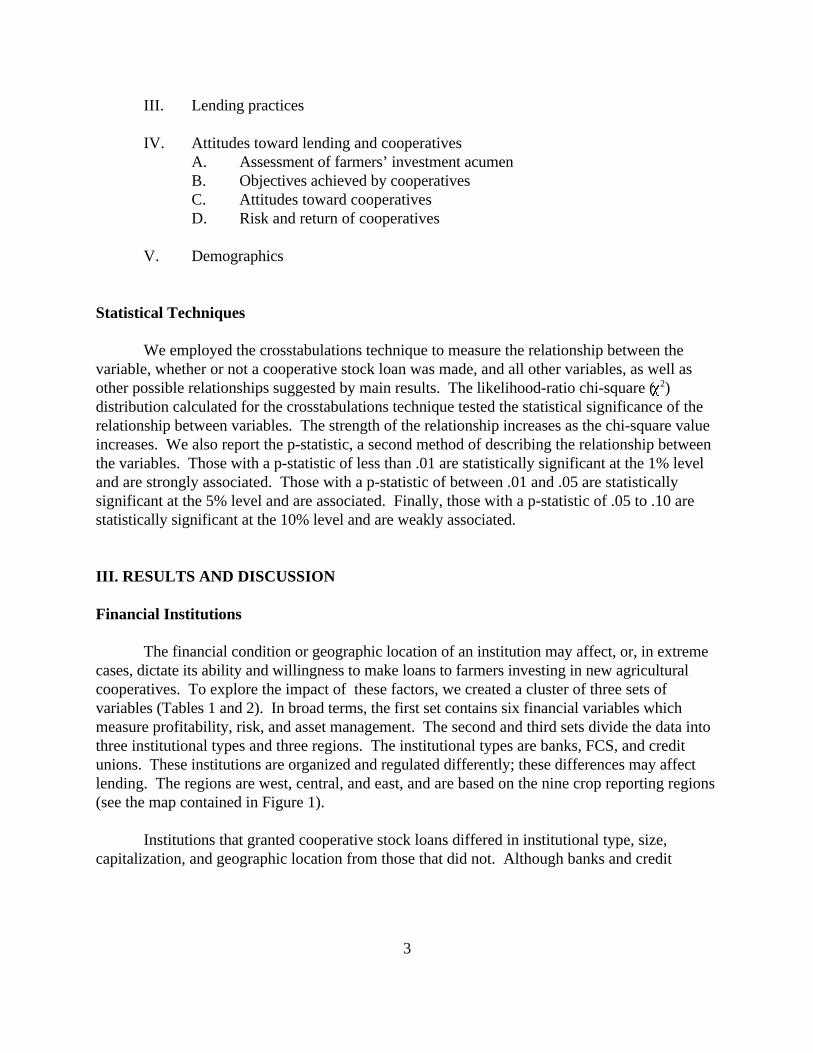
Statistical Techniques
We employed the crosstabulations technique to measure the relationship between thevariable, whether or not a cooperative stock loan was made, and all other variables, as well asother possible relationships suggested by main results. The likelihood-ratio chi-square (P )2
distribution calculated for the crosstabulations technique tested the statistical significance of therelationship between variables. The strength of the relationship increases as the chi-square valueincreases. We also report the p-statistic, a second method of describing the relationship betweenthe variables. Those with a p-statistic of less than .01 are statistically significant at the 1% leveland are strongly associated. Those with a p-statistic of between .01 and .05 are statisticallysignificant at the 5% level and are associated. Finally, those with a p-statistic of .05 to .10 arestatistically significant at the 10% level and are weakly associated.
III. RESULTS AND DISCUSSION
Financial Institutions
The financial condition or geographic location of an institution may affect, or, in extremecases, dictate its ability and willingness to make loans to farmers investing in new agriculturalcooperatives. To explore the impact of these factors, we created a cluster of three sets ofvariables (Tables 1 and 2). In broad terms, the first set contains six financial variables whichmeasure profitability, risk, and asset management. The second and third sets divide the data intothree institutional types and three regions. The institutional types are banks, FCS, and creditunions. These institutions are organized and regulated differently; these differences may affectlending. The regions are west, central, and east, and are based on the nine crop reporting regions(see the map contained in Figure 1).
Institutions that granted cooperative stock loans differed in institutional type, size,capitalization, and geographic location from those that did not. Although banks and credit

4
Table 1. Financial condition, institutional type, and geographic location variables of institutions making agricultural loans, North Dakota, 1995.Variables N %Financial condition1
Total Assets in $ millions< $25 68 42$25 to $100 78 48> $100 17 10
Total 163 100
Capital as a % of total assets< 7% 8 57% to 10% 84 52> 10% 70 43
Total 162 100
Ag loans as a % of total loans< 25 27 1725 to 65 84 52> 65 52 32
Total 163 100
Return on Equity< 8.0% 27 178.0 to 10.0% 47 29> 10.0% 86 54
Total 160 100
Loan-to-deposit ratio< 65% 110 6765% to 80% 26 16> 80% 27 17
Total 163 100
Non-current loans to total loans ratio< 1% 107 651% to 4% 50 31> 4% 6 4Total 163 100
Geographic locationCrop reporting regions
West 36 31

5
Table 1. Cont’d.Variables N %
Central 27 24East 52 45
Total 115 100
Institutional typeInstitution
Bank 93 79FCS 4 3Credit union 21 18
Total 118 100
Financial variables exclude information from the farm1
credit services. Sources: Fedgazette, Annual Statements ofthe Farm Credit Services, North Dakota State BankingDepartment.
Table 2. Crosstabulation tests for financial condition, institutional type, and geographic location variables of institutions making agricultural loans, North Dakota, 1995.
Made loansYes No
Variables N % N % P p2
Financial variables1
Total assets in $ millions< $25 13 32 28 68$25 to $100 36 67 18 33> $100 7 78 2 22
Total 56 54 48 46 14.06 0.00Capital as a % of assets
< 7% 5 71 2 297% to 10% 36 61 23 39> 10% 15 40 23 60
Total 56 54 48 46 5.29 0.07
Ag loans as a % of total loans< 25% 10 50 10 5025% to 65% 31 55 25 45> 65% 15 54 13 46
Total 56 54 48 46 0.17 0.92Return on equity
< 8.0% 7 41 10 598.0% to 12.0% 14 52 13 48> 12.0% 34 58 25 42
Total 55 53 48 47 1.47 0.48
6
Table 2. Cont’d.Made loans
Yes NoVariables N % N % P p2
Loan-to-deposit ratioLess 65% 34 51 33 4965% to 80% 15 68 7 32> 80% 7 47 8 53
Total 56 54 48 46 2.44 0.29
Non-current loans to totalloans ratio
< 1% 33 49 35 511% to 4% 21 68 10 32> 4% 2 40 3 60
Total 56 54 48 46 3.63 0.16Geographic variableCrop reporting regions
West 12 33 24 67Central 12 44 15 56East 37 71 15 29
Total 61 53 54 47 13.59 0.00
Intermediary variableIntermediary type
Banks 50 54 43 46FCS 4 100 0 0Credit unions
10 48 11 52Total 64 54 54 46 5.27 0.07
The financial statistics exclude information for the Farm Credit1
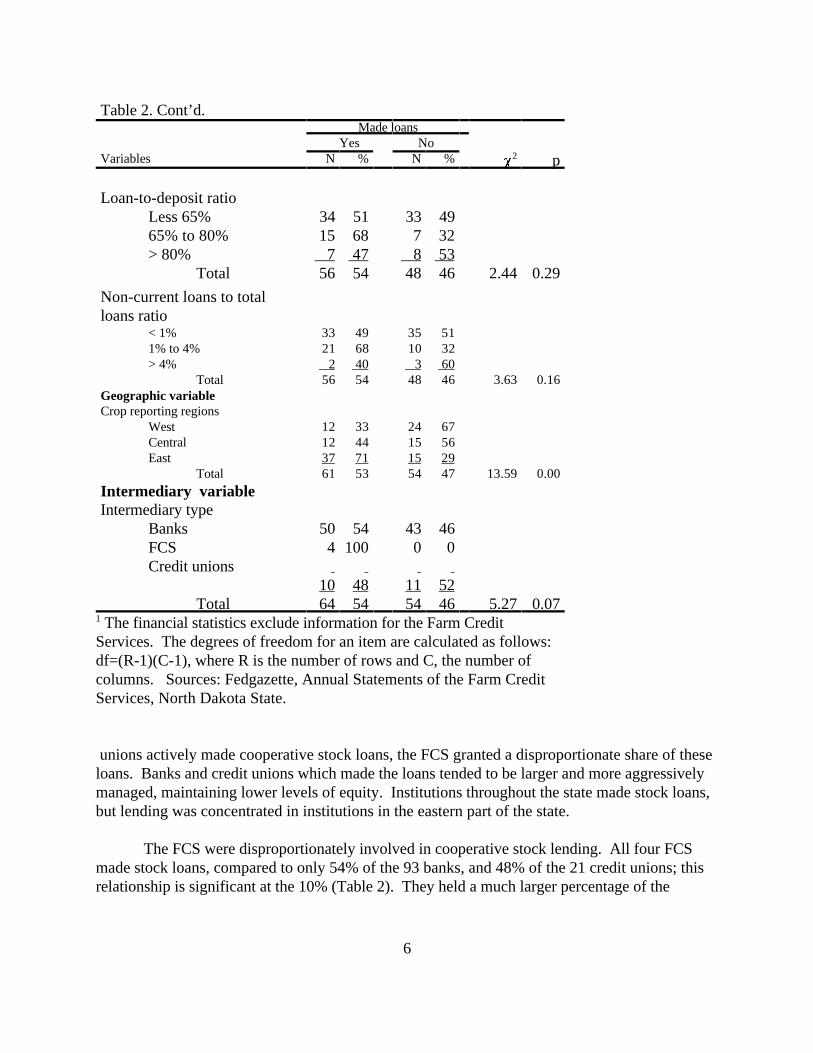
Services. The degrees of freedom for an item are calculated as follows:df=(R-1)(C-1), where R is the number of rows and C, the number ofcolumns. Sources: Fedgazette, Annual Statements of the Farm CreditServices, North Dakota State.
unions actively made cooperative stock loans, the FCS granted a disproportionate share of theseloans. Banks and credit unions which made the loans tended to be larger and more aggressivelymanaged, maintaining lower levels of equity. Institutions throughout the state made stock loans,but lending was concentrated in institutions in the eastern part of the state.
The FCS were disproportionately involved in cooperative stock lending. All four FCSmade stock loans, compared to only 54% of the 93 banks, and 48% of the 21 credit unions; thisrelationship is significant at the 10% (Table 2). They held a much larger percentage of the

Div
ide
Will
iam
s
McK
en
zie
Go
lde
nV
alle
y Slo
pe
Bo
wm
an
Bu
rke
Mo
un
tra
il
Du
nn
Sta
rk
Bill
ing
s
He
ttin
ge
r
Ad
am
s
Re
nvi
lle
Wa
rd
McL
ea
n
Me
rce
r
Oliv
er
Mo
rto
n
Gra
nt
Sio
ux
Bo
ttin
ea
u McH
en
ryP
ierc
e
Ro
llett
eT
ow
ne
rC
ava
lier
Pe
mb
ina
Wa
lsh
Ra
mse
y
Be
nso
n
Sh
eri
da
nW
ells
Ed
dy
Fo
ste
r
Stu
tsm
an
Kid
de
rB
url
eig
h
Em
mo
ns
Lo
ga
n
McI
nto
sh
La
Mo
ure
Dic
key
Sa
rge
nt
Ra
nso
m
Ba
rne
s
Gri
gg
sS
tee
leT
raill
Gra
nd
Fo
rks
Ne
lso
n
Ca
ss
Ric
hla
nd
We
st
Ce
ntr
al
Ea
st
7
Fig
ure
1. C
ombi
ned
crop
rep
ortin
g re
gion
s in
Nor
th D
akot
a

8
cooperative stock loans, 64%, than their 12% and 26% shares of total assets or agricultural loanswould suggest (Figure 2).
Because the FCS are small in number, large in size, and similar in operating performance,they had a large influence on the statistical testing of the financial variables that sometimesobscured important differences among the three types of institutions. To insure that thesedifferences are noted, we compiled two sets of statistical test results, one which excludes theinformation from the FCS (Table 2), and one which includes it (Table A1).
Even after excluding the FCS, the nine institutions with more than $100 million in assetswere more likely to have made stock loans than the 54 institutions with $25 to $100 million inassets or the 41 institutions with less than $25 million in assets. Seventy-eight percent of the largeinstitutions and 67% of the medium-sized institutions made cooperative stock loans. Only 32% ofthe small institutions made the loans. This relationship between cooperative stock lending andsize in total assets is strong as indicated by the crosstabulations test which was statisticallysignificant at the 1% level after excluding the FCS (Table 2). The relationship is stronger whenthe FCS are included (Table A1). Large institutions’ market share of stock loans isdisproportionately large compared to their market share of agricultural loans, but not to theirmarket share of total assets. Large institutions held 47% of the stock loan value of institutionsresponding to the survey (Figure 3 and Table A4). Correspondingly, they held only 16% of theagricultural loans, but 48% of the total assets.
Although small institutions were the least likely to have made cooperative stock loans,those that did were active lenders. Small institutions held 22% of the stock loan value whileholding only 11% of total assets and 16% of the agricultural loans (Figure 3). Many smallinstitutions did not experience cooperative activity in their lending area, particularly in the westernregion of the state where cooperative activity was lower. Financial institutions in eastern NorthDakota, including the FCS, were more likely than institutions in central or western regions tohave made stock loans. Only 34% of the institutions in the western region made stock loans,compared to 44% in the central region and 71% in the eastern region. The test is significant atthe 1% level (Table 2).
Not only were banks and credit unions making stock loans larger, they were also moreaggressively and successfully managed than the banks and credit unions that did not. The sevenminimally capitalized with less than 7% equity and 59 moderately capitalized with 7% to 10%equity institutions were more likely to have made stock loans than the 38 with more than 10%equity. Seventy-one percent of institutions with low capital levels, and 61% of those withmoderate capital levels made the loans. Only 40% of the well-capitalized institutions made theloans. Cooperative stock lending and the percentage of equity are weakly related as indicated bythe 10% significance level of the crosstabulations test (Table 2). Minimally capitalized institutionsheld a larger share of stock loans than they did of total assets or agricultural loans (Figure 4).

83%
12%
5%
Fig
ure
2.
Ma
rke
t S
hare
com
paris
on o
f b
anks
, F
CS
, a
nd c
redi
t un
ions
, N
orth
Dak
ota,
199
4.
Sou
rce
: T
ab
le A
3.
To
tal A
sset
s
70%
26%4%
Ban
ksF
CS
Cre
dit U
nio
ns
Agr
icul
tura
l Loa
ns
34%
64%
2%
Coo
per
ativ
e S
tock
Loa
ns

48% 41
%
11%
Fig
ure
3. M
arke
t S
hare
com
paris
on b
y si
ze o
f ba
nks
and
cred
it un
ions
, N
orth
Dak
ota,
199
4.
Sou
rce:
Tab
le A
4.
Tot
al A
sset
s
29%
55%
16%
Larg
eM
ediu
mS
mal
l
Agr
icul
tura
l Loa
ns
47%
31%
22%
Coo
pera
tive
Sto
ck L
oans
10
1010

25%
54%
21%
Tot
al A
sset
s
Fig
ure
4. M
arke
t Sha
re c
ompa
rison
bas
ed o
n pe
rcen
tage
of e
quity
, Nor
th D
akot
a, 1
994.
Sou
rce:
Tab
le A
5.
25%
60%
15%
Agr
icul
tura
l Loa
ns
Hig
h E
quity
Mod
erat
e E
quity
Low
Equ
ity
16%
55%
29%
Coo
pera
tive
Sto
ck L
oans
11
11

12
Since imprudently and aggressively managed institutions have low levels of equity, weconducted additional statistical tests controlling for levels of non-current loans, and return onequity. We find that only the minimally capitalized institutions with low or moderate levels ofnon-current loans and high returns on equity were more likely to make the loans (Table A2).
Other tests involving the agricultural loans as a percentage of total loans, the loan-to-deposit ratio and the return-on-equity did not statistically differentiate between institutions thatmade the loans and those that did not.
Policy Regarding Loans
Financial institutions implement policies directing loan officers to engage in appropriatelending activities. These policies describe the type of loan portfolio desired, how loans areapproved, and the lending criteria used in credit analysis. They can encourage loan officers toavoid risky loans or make valued loans. If financial institutions enact policies that grantdiscretionary power to loan officers, they create an environment in which the attitudes of loanofficers can exert more influence on lending.
To discover the impact of loan policy on cooperative stock lending, we created a three-set “loan policy” cluster. The first set describes the loan policy maintained by institutions whichimplemented a policy prior to receiving an application. The second describes the loan approvalmechanisms. Finally, the third set measures the importance of professional lending criteria, suchas the profitability of the borrower and the rate of return on investment.
The statistical analysis indicates that most institutions maintain a policy that encourages oris neutral to cooperative stock lending. Many institutions aggressively encouraged lending byarming loan officers with tools to market the loans to borrowers, such as low interest rates, ordeferred principal payments. Approximately one third of the institutions enacted a policyregarding cooperative stock loans prior to receiving an application, but the policies enacted hadno discernable influence on lending. Most institutions granted loan officers lending limits largeenough for them to approve stock loans without oversight, thereby creating an environment inwhich loan officers could be influenced by their attitudes. To maintain loan portfolio quality,institutions relied on easily verifiable measures used in credit analysis to police lending after theloans were granted.
Loan Policy
The widespread use of favorable terms—lower interest rates or deferred principalpayments—suggests that financial institutions maintained a benign to neutral posture towardcooperative stock loans. Statewide, one third of the institutions offered stock loans withfavorable terms. As expected, institutions that aggressively marketed stock loans by grantingfavorable terms were more likely to have made the loans than those that did not. The relationship

13
between cooperative stock lending and offering favorable terms is significant at the 1% level. Eighty-three percent of the institutions that offered favorable terms made stock loans. Only 43%of the institutions not offering favorable terms made the loans. Nevertheless, 52% of theinstitutions making the loans did not offer special terms (Tables 3 and 5). The aggressive use offavorable terms contradicts the assertion made in the North Dakota Vision 2000 Report thatfinancial institutions are reluctant to lend for new ventures.
Owners of financial institutions recognize that certain loans, such as loans to fund newventures, may be inherently riskier than other loans. Rather than prohibit loan officers frommaking them, institutions adopted higher credit standards, or more restrictive loan covenants. Respondents measured the restrictiveness of cooperative stock loan policy compared to otheragricultural loans of similar size. The variable created from their responses did not differentiatebetween institutions which did and did not make the loans (Table 5). Owners did not viewcooperative stock loans as different from other agricultural loans.
The remaining tests involving the loan policy variables also indicate that owners do notview cooperative stock loans as different from other agricultural loans. Only 32% of the financialinstitutions had a specific policy regarding stock loans prior to receiving an application. Having apolicy did not statistically distinguish institutions that made the loans and those that did not. Institutions which responded that they implemented a policy prior to receiving an application,answered an additional seven questions. None of the variables created from these questions issignificantly related to making cooperative stock loans (Table 7).
Approval Mechanisms
An institution can grant loan officers individual loan limits, or use consensus buildingapproval mechanisms, such as loan committees, informal discussions, management approval, andregional boards. The approval mechanisms are not mutually exclusive, and most supervisorsdescribed their institution as employing more than one.
Institutions that granted individual loan authority were more likely to have made loansthan those that did not, and the relationship is significant at the 1% level. Ninety-two percent ofthe institutions grant loan authority to loan officers. Fifty-seven percent of the institutionsgranting individual loan authority made the loans, but only 11% of the institutions not grantingindividual authority did. The size of the limit was also important. Institutions which granted atleast $100,000 of lending authority to a single loan officer were more likely to make cooperativestock loans than those that did not. Other policies governing the loan approval process, such asapproval through a loan committee or a regional board or cumulative lending limits, are notstatistically significant (Tables 2 and 10).
The large lending limits granted to some loan officers and the small size of mostcooperative stock loans suggests that many loan officers had sufficient approval authority to grantstock loans without oversight. Eighty-six percent of the institutions granted a loan officer
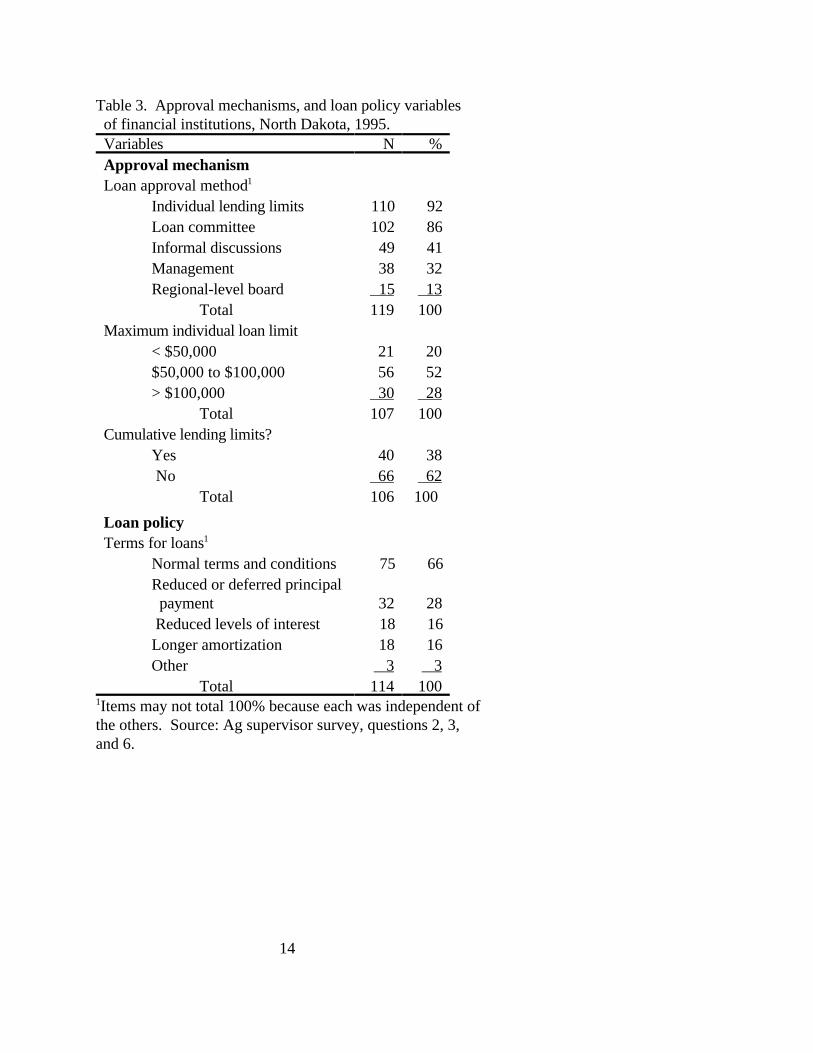
14
Table 3. Approval mechanisms, and loan policy variables of financial institutions, North Dakota, 1995.Variables N %Approval mechanismLoan approval method1
Individual lending limits 110 92Loan committee 102 86Informal discussions 49 41Management 38 32Regional-level board 15 13
Total 119 100Maximum individual loan limit < $50,000 21 20 $50,000 to $100,000 56 52 > $100,000 30 28
Total 107 100Cumulative lending limits? Yes 40 38 No 66 62
Total 106 100 Loan policyTerms for loans1
Normal terms and conditions 75 66 Reduced or deferred principal
payment 32 28 Reduced levels of interest 18 16 Longer amortization 18 16 Other 3 3
Total 114 100Items may not total 100% because each was independent of1
the others. Source: Ag supervisor survey, questions 2, 3,and 6.

15
Table 4. Loan policy variables. A comparison of the restrictiveness of policy regarding1
cooperative stock loans and other agricultural loans of similar size, North Dakota, 1995.Restrictiveness/weights2
MM M S L ML Avg. NVariable 5 4 3 2 1
% of total responsesLending policy compared to policy for other ag loans. 2 23 71 2 2 2.89 104Restrictive credit policy requires applicants to meet higher credit standards of more stringent1
loan covenants. MM is much more, M is more, S is same, L is less, ML is much less, Avg. is2
average, and N is the number of responses. Source: Ag supervisors survey, question 5.
Table 5. Crosstabulation tests for approval mechanisms and loan policy variables of financial institutions, North Dakota, 1995.
Made loansYes No
Variables N % N % P p2
Approval mechanism
Individual lending limitsYes 60 57 45 43No 1 11 8 89
Total 61 54 53 46 7.79 0.01
Loan committeeYes 54 56 43 44No 7 41 10 59
Total 61 54 53 46 1.22 0.27
Informal discussionsYes 28 57 21 43No 33 51 32 49
Total 61 54 53 46 0.46 0 .50
ManagementYes 19 50 19 50No 42 55 34 45
Total 61 54 53 46 0.28 0.60
Regional-level boardYes 10 71 4 29No 51 51 49 49
Total 61 54 53 46 2.06 0.15
Maximum individual loan limit< $50,000 12 60 8 40$50,000 to $100,000 27 48 29 52> $100,000 20 77 6 23
Total 59 58 43 42 6.05 0.05
Cumulative lending limitsYes 26 65 14 35No 34 55 28 45
Total 60 59 42 41 1.03 0.31

16
Table 5. Cont'd.Made loans
Yes NoVariables N % N % P p2
Loan Policy
Lending policy for ag co-ops compared to other ag loans
More restrictive 15 63 9 37About the same 41 57 31 43Less restrictive 4 100 0 0
Total 60 60 40 40 6.56 0.16
Terms for loansFavorable terms 29 83 6 17Normal terms 32 43 43 57
Total 61 56 49 44 16.76 0.00
The degrees of freedom for an item are calculated as follows: df=(R-1)(C-1), where R is the number of rows and C, the number of columns. Source: Ag supervisors survey, questions 2, 3, 5 and 6.
Table 6. Loan policy variables. Financial institutions that enacted a policy prior to receiving a cooperative stock loan application, North Dakota, 1995.Variables N %Loan committee determines policy before reviewing applications
Yes 36 32No 78 68
Total 114 100If the policy is predetermined, then...We focus on the specific characteristics of the borrower.
Yes 32 89No 4 11
Total 36 100We look at each new co-op on a case-by- case basis.
Yes 32 89No 4 11
Total 36 100We lend so as to reduce risks for ourselves and our borrowers.
Yes 31 86No 5 14
Total 36 100
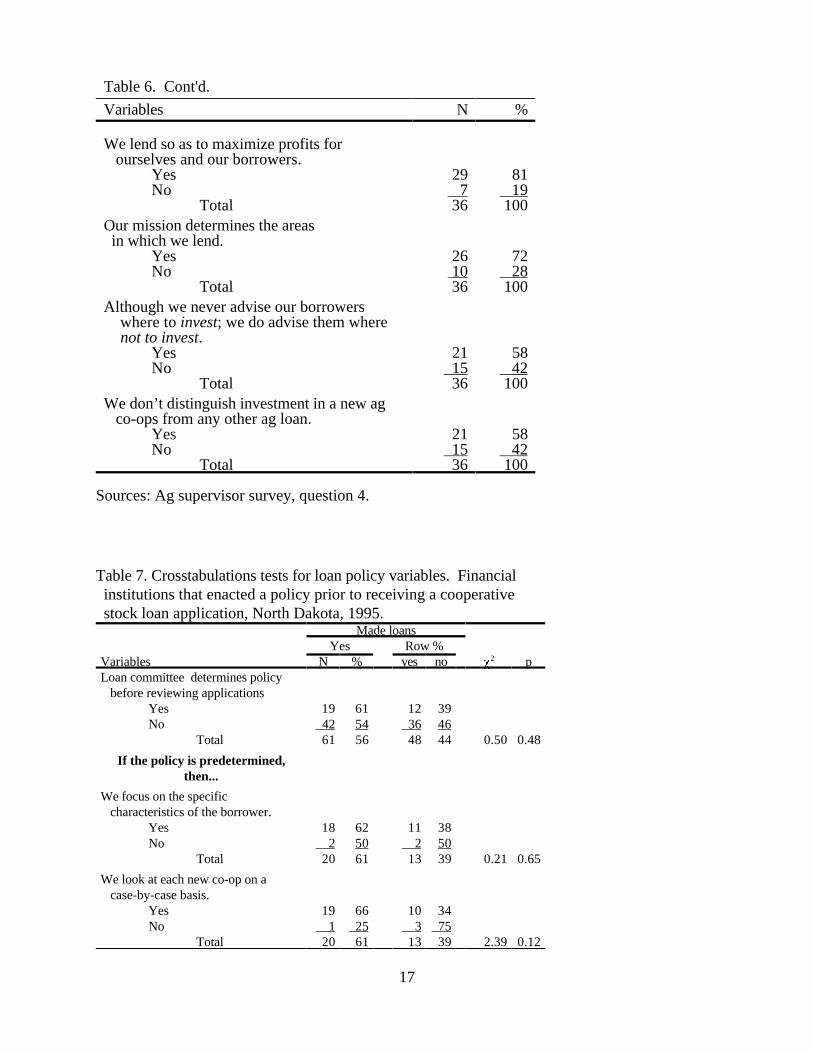
17
Table 6. Cont'd.
Variables N %
We lend so as to maximize profits for ourselves and our borrowers.
Yes 29 81No 7 19
Total 36 100 Our mission determines the areas in which we lend.
Yes 26 72No 10 28
Total 36 100Although we never advise our borrowers where to invest; we do advise them where not to invest.
Yes 21 58No 15 42
Total 36 100We don’t distinguish investment in a new ag co-ops from any other ag loan.
Yes 21 58No 15 42
Total 36 100
Sources: Ag supervisor survey, question 4.
Table 7. Crosstabulations tests for loan policy variables. Financial institutions that enacted a policy prior to receiving a cooperative stock loan application, North Dakota, 1995.
Made loansYes Row %
Variables N % yes no P p2
Loan committee determines policy before reviewing applications
Yes 19 61 12 39No 42 54 36 46
Total 61 56 48 44 0.50 0.48
If the policy is predetermined,then...
We focus on the specific characteristics of the borrower.
Yes 18 62 11 38No 2 50 2 50
Total 20 61 13 39 0.21 0.65
We look at each new co-op on a case-by-case basis.
Yes 19 66 10 34No 1 25 3 75
Total 20 61 13 39 2.39 0.12

18
Table 7. Cont’d.Made loans
Yes Row %Variables N % yes no P p2
We lend so as to reduce risk for our self and our borrowers.
Yes 17 59 12 41No 3 75 1 25
Total 20 61 13 39 0.42 0.52
We lend so as to maximize profits for ourselves and our borrowers.
Yes 16 59 11 41No 4 67 2 33
Total 20 61 13 39 0.11 0.73
Our mission determines the areas in which we lend.
Yes 13 57 10 43No 7 70 3 30
Total 20 61 13 39 0.54 0.46
Although we never advise borrowers where to invest, we do advise them where no to invest
Yes 12 63 7 37No 8 57 6 43
Total 20 61 13 39 0.12 0.73
We don’t distinguish investment in a new ag co-op from any other ag loan.
Yes 12 63 7 37No 8 57 6 43
Total 20 61 13 39 0.12 0.73
The degrees of freedom for an item are calculated as follows: df=(R-1)(C-1),where R is the number of rows and C, the number of columns. Source: Agsupervisor survey, question 4.
19
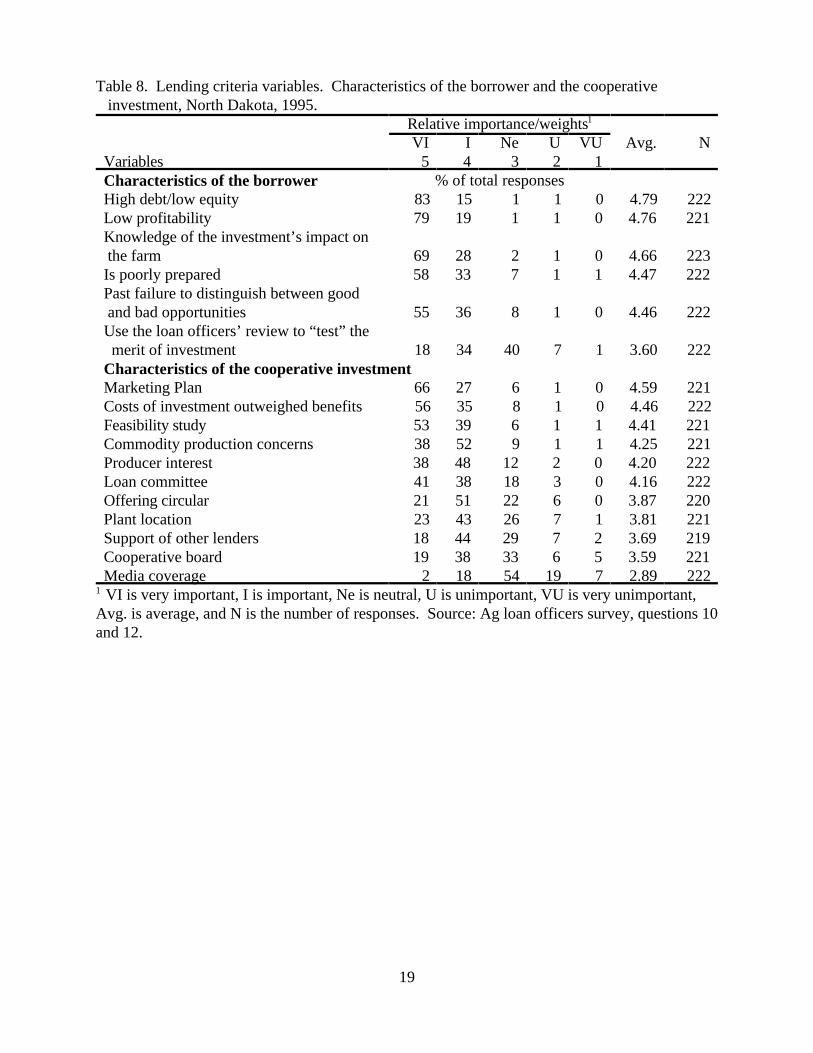
Table 8. Lending criteria variables. Characteristics of the borrower and the cooperative investment, North Dakota, 1995.
Relative importance/weights1
VI I Ne U VU Avg. NVariables 5 4 3 2 1Characteristics of the borrower % of total responsesHigh debt/low equity 83 15 1 1 0 4.79 222Low profitability 79 19 1 1 0 4.76 221Knowledge of the investment’s impact on the farm 69 28 2 1 0 4.66 223Is poorly prepared 58 33 7 1 1 4.47 222Past failure to distinguish between good and bad opportunities 55 36 8 1 0 4.46 222Use the loan officers’ review to “test” the merit of investment 18 34 40 7 1 3.60 222Characteristics of the cooperative investmentMarketing Plan 66 27 6 1 0 4.59 221Costs of investment outweighed benefits 56 35 8 1 0 4.46 222Feasibility study 53 39 6 1 1 4.41 221Commodity production concerns 38 52 9 1 1 4.25 221Producer interest 38 48 12 2 0 4.20 222Loan committee 41 38 18 3 0 4.16 222Offering circular 21 51 22 6 0 3.87 220Plant location 23 43 26 7 1 3.81 221Support of other lenders 18 44 29 7 2 3.69 219Cooperative board 19 38 33 6 5 3.59 221Media coverage 2 18 54 19 7 2.89 222VI is very important, I is important, Ne is neutral, U is unimportant, VU is very unimportant,1
Avg. is average, and N is the number of responses. Source: Ag loan officers survey, questions 10and 12.

20
Table 9. Crosstabulation tests for an assessment of farmers’ investment acumen, and lending criteria of the borrower variables, North Dakota, 1995.
made loansYes No
Variables N % N % P p2
Assessment of farmers’ business acumen% with a very good understanding of how the co-op will affect the farm enterprise.
< 40% 110 52 102 48> 40% 36 78 10 22
Total 146 57 112 43 11.41 0.00
Characteristics of the borrowerHigh debt/low equity
Unimportant 1 33 2 67Neutral 2 100 0 0Important 143 66 74 34
Total 146 66 76 34 2.98 0.22
Low profitabilityUnimportant 1 50 1 50Neutral 3 100 0 0Important 142 66 74 34
Total 146 66 75 34 2.72 0.26
Knowledge of the investment’s impact on the farm
Unimportant 2 100 0 0Neutral 3 75 1 25Important 142 65 75 35
Total 147 66 76 34 1.84 0.40
Is poorly preparedUnimportant 1 33 2 67Neutral 12 75 4 25Important 133 66 70 34
Total 146 66 76 34 1.95 0.38
Past failure to distinguish between good and bad opportunities
Unimportant 2 100 0 0Neutral 15 83 3 17Important 130 64 72 36
Total 147 66 75 34 4.62 0.10
Uses the loan officers’ review to “test” the merit of the investment
Unimportant 11 61 7 39Neutral 66 74 23 26Important 69 60 46 40
Total 146 66 76 34 4.74 0.09The degrees of freedom for an item are calculated as follows: df=(R-1)(C-1), where R is the number of rows and C, the number of columns. Source:Ag loan officers survey, questions 7 and 12.

21
Table 10. Crosstabulations tests for lending criteria variables of the cooperative investment, North Dakota, 1995.
made loansYes No
Variables N % N % P p2
Characteristics of the cooperative investment
Marketing planUnimportant 1 100 0 0Neutral 10 71 4 29Important 135 66 71 34
Total 146 66 75 34 1.04 0.59
Costs of investment outweighed benefits
Unimportant 1 50 1 50Neutral 10 56 8 44Important 134 67 66 33
Total 145 66 75 34 1.15 0.56
Feasibility studyUnimportant 4 80 1 20Neutral 11 79 3 21Important 130 64 72 36
Total 145 66 76 34 1.77 0.41
Commodity production concernsUnimportant 3 75 1 25Neutral 10 53 9 47Important 132 67 66 33
Total 145 66 76 34 1.62 0.45
Producer interestUnimportant 4 67 2 33Neutral 17 65 9 35Important 125 66 65 34
Total 146 66 76 34 0.00 1.00
Loan committeeUnimportant 6 86 1 14Neutral 29 73 11 27Important 111 63 64 37 2.69 0.26
Total 146 66 76 34
Offering circularUnimportant 8 62 5 38Neutral 29 60 19 40Important 108 68 51 32
Total 145 100 75 100 1.03 0.60
Plant locationUnimportant 16 94 1 6Neutral 42 72 16 28Important 89 60 59 40
Total 147 66 76 34 11.16 0.00

22
Table 10. Cont’d.made loans
Yes NoVariables N % N % P p2
Support of other loan officersUnimportant 16 80 4 20Neutral 37 58 27 42Important 92 68 43 32
Total 145 66 74 34 4.04 0.13
Co-op boardUnimportant 17 71 7 29Neutral 45 62 28 38Important 84 68 40 32
Total 146 66 75 34 1.03 0.60
Media coverageUnimportant 37 64 21 36Neutral 84 70 36 30Important 25 57 19 43
Total 146 66 76 34 2.59 0.27
The degrees of freedom for an item are calculated as follows: df=(R-1)(C-1), where R is the number of rows and C, the number of columns. Source: Ag loan officers survey, question 10.
a limit in excess of $50,000 and only 26% of the institutions granted a stock loan in excess of thisamount (Tables 3 and A6). This indicates that many loan officers had the freedom to beinfluenced by their attitudes toward cooperatives.
Lending Criteria
Owners regulate the quality of loans by requiring loan officers to approve loans based onrecognized criteria in loan analysis. If loan officers ignore those criteria and lend to an unqualifiedborrower they face possible discipline by their financial institution through a post approval loanreview. Reviews occur at regular intervals and cover all delinquent loans and a random selectionof other loans. Occasionally, institutions review applications that have been have been denied. Consequently, loan officers are disciplined more often for making bad loans than not making goodloans.
Loan officers determine if a borrower can repay a loan by a quantitative examination offinancial information, and a subjective evaluation of the borrower. They organize this informationinto a credit report which evaluates factors such as the borrowers’ financial condition, character,and collateral which influence the quality of a loan. Like Gustafson, Beyer, and Saxowsky(1991), who conducted a small sample oral survey of ten loan officers, we find that loan officersfollow conservative lending practices, emphasizing criteria that stress the importance ofrepayment from current operations first and from the investment second. This practice allowsborrowers who can repay the loan from other sources to make investments as they choose, butprecludes others from investing in projects with strong earnings potential.

23
Our variables which measure the importance of different criteria in loan evaluation aredivided into two classes. The first contains variables measuring the importance of the borrower’sfarm enterprise, and the second, variables measuring the importance of the cooperativeinvestment. Respondents ranked the importance of each on a scale of five to one, with five beingvery important, and one being very unimportant. The scores were averaged by criterion and arereported in order of perceived importance in Table 8.
Loan officers regarded all the criteria related to the borrower as important. The twowhich rated as most important form the backbone of standard credit analysis. The most importantcriterion was a low debt-equity position by the borrower. Scoring an average of 4.79, 85% ofthe loan officers thought that this criterion was “very important.” The second most importantcriterion was the farmer’s lack of profitability, scoring an average of 4.76 (Table 8).
Loan officers subjectively measure the last four criteria in credit analysis. The third andfourth most important criteria were the borrower’s knowledge of the impact of the investment onthe farm enterprise and poor preparation by the borrower. These criteria score an average of 4.66and 4.47 (Table 8). The average score of the former criteria indicates that loan officers believethe interaction of the farm enterprise with the investment is important, but not as important as theoverall financial condition of the borrower (Table 8). The two final criteria were the applicant’sinability to distinguish between good and bad opportunities in the past and use of the loanofficer’s review to test the merit of the investment. Both criteria are statistically significant at the10% level (Table 9). In both cases, the loan officers’ responses were intuitive. If they thoughtthat these were important criteria they were less likely to have made the loans. Yet in both casesthe majority, or the plurality of loan officers who made the loans came, from these groups.
In general, loan officers did not consider the criteria regarding the cooperative investmentas important as those of the borrower. The marketing plan has an average score of 4.59, thehighest score of the investment criteria, but this score would rank as only the fourth highest if thecriteria of the borrowers and the investment were combined. The quality of the investment, whichhas the second highest score among the investment criteria, tied the score of the sixth rankingcriteria of the borrowers. Nevertheless, the majority of respondents viewed all but one of thesecriteria, media coverage, as “very important” to “important” (Table 8).
As with the loan criteria of the borrower, those that are more easily quantified generallywere viewed as more important. The loan officers viewed the marketing plan, the quality of theinvestment, the feasibility study, and commodity production concerns as more important than lessquantifiable objectives such as producer interest and the names of the cooperative board members. Loan officers also placed less importance on characteristics that did not directly involve thefinances or management of the cooperative. The financial institution’s loan committee, support ofthe cooperative venture by other loan officers, and the media coverage ranked sixth, ninth, andeleventh in importance (Table 8).
Only one investment characteristic, the plant location, is statistically related to cooperativestock lending and the relationship is significant at the 1% level. Sixty percent of the 100 loanofficers who believed this criterion was important made stock loans, compared to 72% of 58 and

24
94% of 17 loan officers that were neutral or thought the characteristic was unimportant (Table10).
Lending Practices
Within policy guidelines loan officers have discretion in conducting their activities. Theway they spend their time and their skill in writing cooperative stock loans may affect lending tofarmers investing in new agricultural cooperatives. The third cluster measures the impact of thesepractices and skills on cooperative stock lending. The first variable separates loan officers intotwo groups based on the percentage of their time taken by agricultural loans. The second andthird compare the time and difficulty of loan preparation to other agricultural loans of similar size. The fourth and fifth variables separate loan officers who have reviewed a new cooperative’sbusiness plan or attended an orientation meeting from those who have not (Tables 11 and 12).
Table 11. Lending practices variables, North Dakota, 1995.Variables N %Years in ag lending (loan officers)
< 10 81 31>10 179 69
Total 260 100
% of time taken by ag loans< 60% 67 26> 60% 193 74
Total 260 100
Reviewed a new ag co-op’s business plans during .1
Yes 158 68No 74 32
Total 232 100
Attended an orientation meeting of a new ag co-op .1
Yes 153 66No 79 34
Total 232 100 The time period for the question was the past four years. 1
Source: Ag loan officers survey, questions 2, 3, 16, and 17. Agsupervisors survey, question 10.
25
Table 12. Lending practice variables—a comparison of cooperative stock loans and other agricultural loans of similar size, North Dakota, 1995.
Comparison/weightMM M S L ML Avg. N
Variables 5 4 3 2 11
% of total responsesHow time consuming are loans compared to other ag loans? 3 15 79 2 1 3.16 195How difficult are loans compared to other ag loans? 2 23 74 1 0 3.25 197MM is much more, M is more, S is same, L is less, ML is much less, Avg. is average, and N is1
the number of responses. Source: Ag loan officers survey, questions 8 and 9.
Loan officers who reviewed a new cooperative’s business plan, or attended an orientationmeeting were more likely to have made stock loans. Seventy-three percent of the 153 loanofficers who attended an orientation meeting made stock loans, compared to 44% of the 79 whohad not. Seventy-seven percent of the 158 loan officers who had reviewed a business plan madethe loans, but only 34% of the 74 who had not, made the loans. As shown in Table 13, attendingan orientation meeting or reviewing a business plan are statistically related to cooperative stocklending at the 1% significance level.
Cooperative organizers who provide loan officers and potential members with the sameinformation may facilitate lending to potential members by eliminating a cause of credit rationing. Credit rationing occurs when part of a group of loan applicants who appear to be equally creditworthy to the loan officer are denied a loan. It is caused by an asymmetry of information betweenloan applicants and the loan officer. If applicants can hide information about the risk of theirinvestment projects, loan officers cannot distinguish between the credit worthiness of projects. The projects appear equally credit worthy based on measurable criteria such as the rate of returnbut the loan officers know that some projects may contain hidden risk. Disreputable applicantswill seek debt financing to shift risk from themselves to their financial institutions. To protecttheir institutions’ financial well-being, loan officers will ration credit (Stiglitz and Weiss, 1981 andCalomiris, Hubbard, and Stock, 1986). Because cooperative organizers only benefit if thecooperative venture is successful and their return is the same as other investors, they do not havea profit motive for withholding information from farmers who might invest in the cooperative. The information presented to loan officers at organizational meetings and through business plansis identical to that presented to farmers considering the cooperative investment. Borrowers donot have private information about the project, eliminating the cause of credit rationing.
Loan officers with more than 10 years of experience in agricultural lending were morelikely to have made stock loans than those with less experience and the relationship is statisticallysignificant at the 1% level. Sixty-six percent of the 179 loan officers who made the loans hadmore than ten years of experience, compared to 34% of the 81 loan officers with less than tenyears of experience (Table 13).
Table 13. Crosstabulation tests for lending practice variables,

26
North Dakota 1995.made loans
Yes NoVariables N % N % P p2
Years of ag lending (loan officers)< 10 30 37 51 63> 10 118 66 61 34
Total 148 57 112 43 18.98 0.00
% of time taken by ag loans.< 60% 19 28 48 72> 60% 129 67 64 33
Total 148 57 112 43 30.30 0.00
How time consuming are loans compared with other ag loans?
Less 3 50 3 50Same 117 76 37 24More 26 74 9 26
Total 146 75 49 25 1.81 0.40
How difficult are loans compared to other ag loans?
Less 2 67 1 33Same 109 75 36 25More 35 71 14 29
Total 146 74 51 26 .350.84
Reviewed a new ag co-op’s business plans1
Yes 121 77 37 24No 25 34 49 66
Total 146 63 86 37 39.28 0.00
Attended an orientation meeting of a new ag co-op1
Yes 111 73 42 27No 35 44 44 56
Total 146 63 86 37 17.60 0.00
The time period for the question was the past four years. The degrees1
of freedom for an item are calculated as follows: df=(R-1)(C-1), whereR is the number of rows and C, the numbe of columns. Ag loanofficers survey, questions 2, 3, 8, 9, 16, and 17. Ag supervisors survey,question 10.

27
Table 14. Assessment of farmers’ investment acumen variable by loan officers, North Dakota, 1995.Variable N %% of farmers with a very good understanding about how the co-op will affect the farm enterprise.
< 40% 212 82> 40% 46 18
Total 258 100Source: Ag loan officers survey, question 7.
Loan officers who devoted most of their work day to agricultural lending, and whoevaluated a new cooperative proposal were more likely to have made loans than those who didnot. There is a stark difference in the willingness of loan officers to make stock loans based onthe percentage of time spent in agricultural lending. Sixty-seven percent of the 193 loan officerswho spent more than 60% of their time in agricultural lending made the loans, compared to 28%of the 67 who spent less time. This relationship between time spent in agricultural lending andcooperative stock lending is significant at the 1% level (Table 13).
Loan officers may avoid difficult or time-consuming loans. Two variables measure aproblem known as “shirking,” the avoidance of difficult assignments. The variables compare thetime needed to prepare a stock loan and the difficulty of that preparation to other agricultural loans. If loan officers were shirking, they would avoid making loans that are more timeconsuming, or more difficult to prepare. In both cases, we find no statistically significant evidenceof shirking (Table 13).
Attitudes Toward Lending and Cooperatives
When considering a cooperative stock loan request, loan officers analyze information inthe loan application using professional lending criteria that is both objective and subjective. Loanofficers’ attitudes toward cooperatives could bias their interpretation of the criteria, particularlythe subjective criteria, which may influence loan officers to make loans to unqualified borrowersor deny loans to qualified borrowers.
The fourth cluster measures attitudes of loan officers toward lending and cooperatives; ithas four sets. Each set measures different types of views or attitudes held by loan officers.
In general, loan officers had positive attitudes about new cooperative ventures. Nevertheless, their two most negative responses were to questions that most clearly differentiatenew from traditional cooperatives. Approximately half of the loan officers believed that the delivery contracts of new cooperatives were too strict and that the purchase price of the stockwas too high. Furthermore, the average loan officer believed that stocks and mutual funds offereda better risk adjusted rate of return as a stand alone investment than cooperative stock. Finally,the attitudes expressed by loan officers had relatively little impact on lending, reinforcing and
28
extending a conclusion reached earlier in the paper. Loan officers made loans that metconservative lending standards regardless of their opinion of the quality of the investment.
Assessment of Farmers’ Investment Acumen
Loan officers reported their assessment of the farmers’ investment acumen by stating thepercentage of farmers that they believed had a very good understanding of the impact of thecooperative investment on their farm enterprise. We report those who thought that more than40% of farmers had a very good understanding as having high assessments and others as havinglow assessments. Loan officers with high assessments were more likely to have made cooperativestock loans than those with low assessments, yet most loans were made by loan officers with lowassessments. Seventy-eight percent of the 46 loan officers with high assessments made stockloans. Only fifty-two percent of the 212 loan officers with low assessments made the loans. Therelationship between the loan officers’ assessment of the business acumen of farmers andcooperative stock lending is statistically significant at the 1% level (Table 9).
Objectives Achieved by Cooperatives
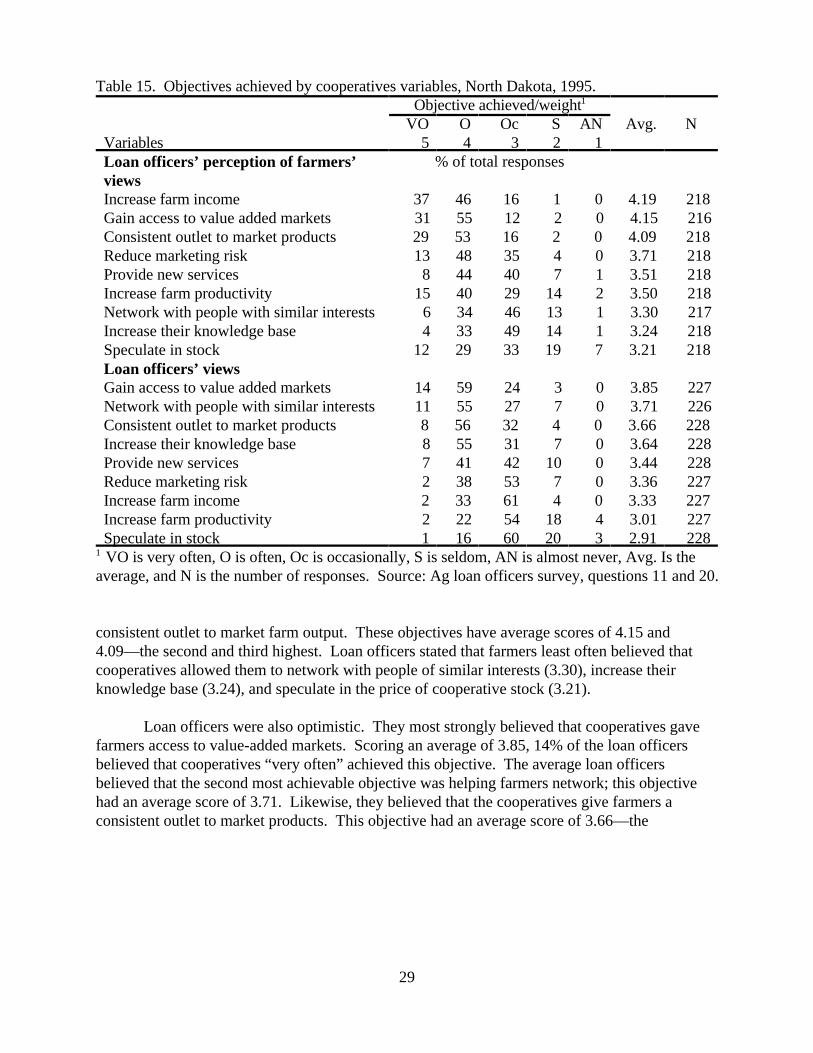
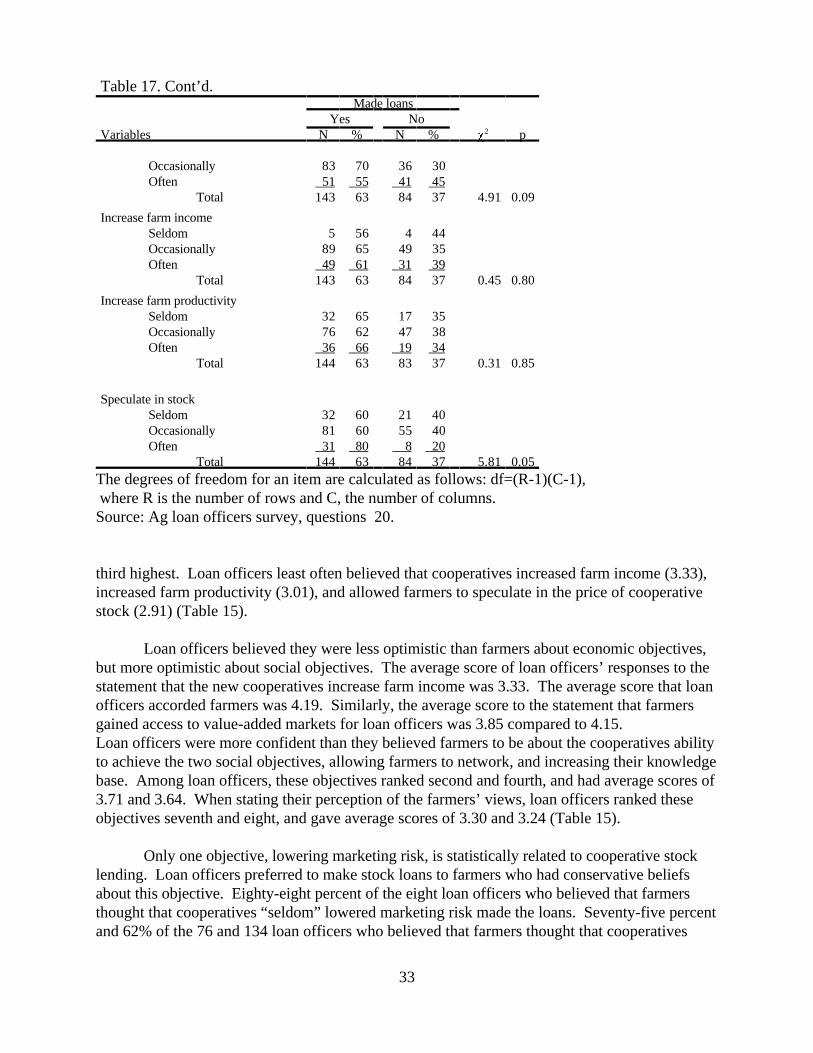
The “objectives achieved by cooperatives” set measures the likelihood that cooperativesachieve seven economic and two social objectives. In the questionnaire, loan officers identifiedhow often farmers believed that new agricultural cooperatives accomplish these objectives. Loanofficers also stated how often they believed that the cooperatives achieved them. Their responsesranged from “very often,” which was scored as a five, and “almost never,” which was scored as aone. An average score based on their responses was calculated (Table 15 and Figure 5).
Loan officers believed that farmers were more positive than they were about thecooperatives’ ability to achieve economic objectives and less positive about social objectives(Table 15 and Figure 5). Nevertheless, loan officers expressed positive attitudes aboutcooperatives. As with loan officers’ perceptions of borrower and investment criteria, both loanofficers that made the loans and those that did not have remarkably similar views. Only two of 18crosstabulation tests were statistically significant. These tests dealt with the loan officers’ view,and the loan officers’ perception of the farmers’ view of the cooperative’s ability to reducemarketing risk (Tables 16 and 17).
According to loan officers, farmers believed that cooperatives could achieve each of theobjectives listed in Table 15. In loan officers’ view, farmers most strongly believed that the newcooperatives increase farm income. Scoring an average of 4.19, 37% of the loan officers statedthat farmers believed that new cooperatives “very often” achieved this objective. Loan officersalso view farmers as believing that cooperatives gave them access to value-added markets, and a
29
Table 15. Objectives achieved by cooperatives variables, North Dakota, 1995.Objective achieved/weight1
VO O Oc S AN Avg. NVariables 5 4 3 2 1Loan officers’ perception of farmers’ views
% of total responses
Increase farm income 37 46 16 1 0 4.19 218Gain access to value added markets 31 55 12 2 0 4.15 216Consistent outlet to market products 29 53 16 2 0 4.09 218Reduce marketing risk 13 48 35 4 0 3.71 218Provide new services 8 44 40 7 1 3.51 218Increase farm productivity 15 40 29 14 2 3.50 218Network with people with similar interests 6 34 46 13 1 3.30 217Increase their knowledge base 4 33 49 14 1 3.24 218Speculate in stock 12 29 33 19 7 3.21 218Loan officers’ viewsGain access to value added markets 14 59 24 3 0 3.85 227Network with people with similar interests 11 55 27 7 0 3.71 226Consistent outlet to market products 8 56 32 4 0 3.66 228Increase their knowledge base 8 55 31 7 0 3.64 228Provide new services 7 41 42 10 0 3.44 228Reduce marketing risk 2 38 53 7 0 3.36 227Increase farm income 2 33 61 4 0 3.33 227Increase farm productivity 2 22 54 18 4 3.01 227Speculate in stock 1 16 60 20 3 2.91 228VO is very often, O is often, Oc is occasionally, S is seldom, AN is almost never, Avg. Is the1
average, and N is the number of responses. Source: Ag loan officers survey, questions 11 and 20.
consistent outlet to market farm output. These objectives have average scores of 4.15 and4.09—the second and third highest. Loan officers stated that farmers least often believed thatcooperatives allowed them to network with people of similar interests (3.30), increase theirknowledge base (3.24), and speculate in the price of cooperative stock (3.21).
Loan officers were also optimistic. They most strongly believed that cooperatives gavefarmers access to value-added markets. Scoring an average of 3.85, 14% of the loan officersbelieved that cooperatives “very often” achieved this objective. The average loan officersbelieved that the second most achievable objective was helping farmers network; this objectivehad an average score of 3.71. Likewise, they believed that the cooperatives give farmers aconsistent outlet to market products. This objective had an average score of 3.66—the
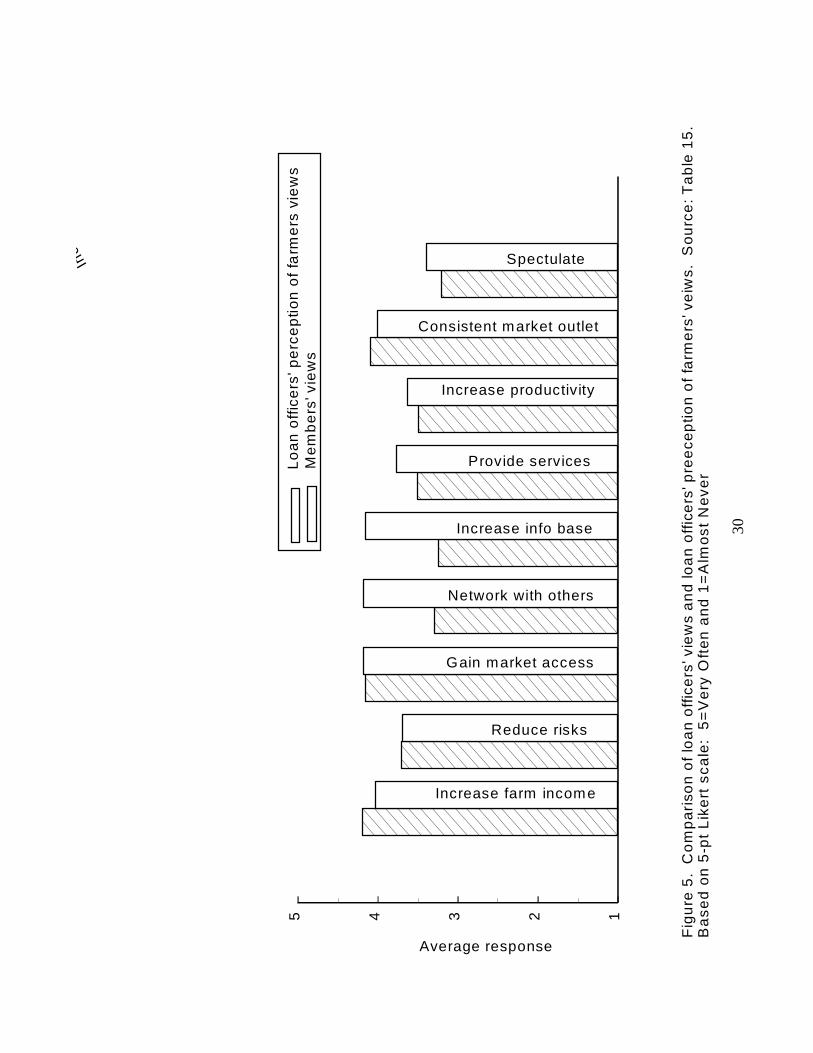
12345
Average response
Lo
an
off
ice
rs' p
erc
ep
tion
of
farm
ers
vie
ws
Me
mb
ers
' vie
ws
Increase farm income
Gain market access
Consistent market outlet
Reduce risks
Provide services
Inc
Increase info base
Spectulate
Increase productivity
Network with others
Fig
ure
5.
Co
mp
ari
son
of
loa
n o
ffic
ers
' vie
ws
an
d lo
an
off
ice
rs' p
ree
cep
tion
of
farm
ers
' ve
iws.
S
ou
rce
: T
ab
le 1
5.
Ba
se
d o
n 5
-pt
Lik
ert
sc
ale
: 5
=V
ery
Oft
en
an
d 1
=A
lmo
st
Ne
ve
r
30

31
Table 16. Crosstabulation tests for objectives achieved by cooperatives variables—the loan officers’ perceptions of farmers’ views, North Dakota, 1995.
made loansYes No
Variables N % N % P p2
Increase farm incomeSeldom 2 100 0 0Occasionally 24 69 11 31Often 121 67 50 33
Total 147 67 71 33 1.62 0.44Gain access to value added markets
Seldom 3 75 1 25Occasionally 16 62 10 38Often 127 68 59 32
Total 146 68 70 32 0.57 0.75
Consistent outlet to market productsSeldom 2 50 2 50Occasionally 24 69 11 31Often 121 68 58 32
Total 147 67 71 32 0.54 0.76
Reduce marketing riskSeldom 7 88 1 12Occasionally 57 75 19 25Often 83 62 51 38
Total 147 67 71 33 5.60 0.06
Provide new servicesSeldom 11 61 7 39Occasionally 58 67 29 33Often 78 69 35 31
Total 147 67 71 33 0.47 0.79
Increase farm productivitySeldom 28 78 8 22Occasionally 44 69 20 31Often 75 64 43 36
Total 147 67 71 33 2.72 0.26Network with people with similar interests 22 71 9 29
Seldom 73 73 27 27Occasionally 51 59 35 41Often 146 67 71 33 4.13 0.13
Total
Increase their knowledge baseSeldom 26 79 7 21Occasionally 68 64 38 36Often 53 67 26 33
Total 147 67 71 33 2.61 0.27

32
Table 16. Cont’d.made loans
Yes NoVariables N % N % P p2
Speculate in stockSeldom 33 59 23 41Occasionally 49 68 23 32Often 65 72 25 28
Total 147 67 71 33 2.75 0.25The degrees of freedom for an item are calculated as follows: df=(R-1)(C-1), where R is the number of rows and C, the number ofcolumns. Source: Ag loan officers survey, question 11.
Table 17. Crosstabulation tests for objectives achieved by cooperatives variables—the loan officers’ views, North Dakota, 1995.
Made loansYes No
Variables N % N % P p2
Gain access to value added marketsSeldom 5 83 1 17Occasionally 33 60 22 40Often 105 63 61 37
Total 143 63 84 37 1.42 0.49
Network with people with similar interests
Seldom 10 63 6 37Occasionally 41 68 19 32Often 91 61 59 39
Total 142 63 84 37 1.10 0.58
Consistent outlet to market productsSeldom 6 55 5 45Occasionally 49 68 23 32Often 89 61 56 39
Total 144 63 84 37 1.30 0.52
Increase their knowledge baseSeldom 9 60 6 40Occasionally 49 70 21 30Often 86 60 57 40
Total 144 63 84 37 2.07 0.36
Provide new servicesSeldom 14 61 9 39Occasionally 61 64 35 36Often 69 63 40 37
Total 144 63 84 37 0.06 0.97
Reduce marketing riskSeldom 9 56 7 44
33
Table 17. Cont’d.Made loans
Yes NoVariables N % N % P p2
Occasionally 83 70 36 30Often 51 55 41 45
Total 143 63 84 37 4.91 0.09
Increase farm incomeSeldom 5 56 4 44Occasionally 89 65 49 35Often 49 61 31 39
Total 143 63 84 37 0.45 0.80
Increase farm productivitySeldom 32 65 17 35Occasionally 76 62 47 38Often 36 66 19 34
Total 144 63 83 37 0.31 0.85
Speculate in stockSeldom 32 60 21 40Occasionally 81 60 55 40Often 31 80 8 20
Total 144 63 84 37 5.81 0.05The degrees of freedom for an item are calculated as follows: df=(R-1)(C-1), where R is the number of rows and C, the number of columns.Source: Ag loan officers survey, questions 20.
third highest. Loan officers least often believed that cooperatives increased farm income (3.33),increased farm productivity (3.01), and allowed farmers to speculate in the price of cooperativestock (2.91) (Table 15).
Loan officers believed they were less optimistic than farmers about economic objectives,but more optimistic about social objectives. The average score of loan officers’ responses to thestatement that the new cooperatives increase farm income was 3.33. The average score that loanofficers accorded farmers was 4.19. Similarly, the average score to the statement that farmersgained access to value-added markets for loan officers was 3.85 compared to 4.15.Loan officers were more confident than they believed farmers to be about the cooperatives abilityto achieve the two social objectives, allowing farmers to network, and increasing their knowledgebase. Among loan officers, these objectives ranked second and fourth, and had average scores of3.71 and 3.64. When stating their perception of the farmers’ views, loan officers ranked theseobjectives seventh and eight, and gave average scores of 3.30 and 3.24 (Table 15).
Only one objective, lowering marketing risk, is statistically related to cooperative stocklending. Loan officers preferred to make stock loans to farmers who had conservative beliefsabout this objective. Eighty-eight percent of the eight loan officers who believed that farmersthought that cooperatives “seldom” lowered marketing risk made the loans. Seventy-five percentand 62% of the 76 and 134 loan officers who believed that farmers thought that cooperatives

34
“occasionally” or “often” reduced marketing risk, made the loans (Table 16). Loan officers whobelieved cooperatives occasionally lower marketing risk were more likely than other loan officersto make stock loans (Table 17).
Attitudes Toward Cooperatives
The third set measures loan officers’ attitudes regarding nine potentially negative aspectsof the performance of new cooperatives. The questions from which these variables were createddistinguish between the performances of new and of traditional cooperatives. The newcooperatives link the level of patronage to stock ownership and rely on strictly enforced deliverycontracts. Loan officers scored their attitude on a scale from one to five, with five being “stronglyagree,” and one, “strongly disagree.” The statements are ordered from the least negative to themost negative, based on the average response (Table 18). The final two questions rank theperformance of the closed-membership and delivery proportional to stock ownership features ofthe new cooperatives. Loan officers ranked the performance from five to one with five being“much better” and one being “much worse” (Table 19).
Table 18. Attitudes toward cooperatives variables—loan officers responses to negativestatements about agricultural cooperatives, North Dakota, 1995.
Degree of agreement/weight1
SA A N D SD Avg. NVariables 5 4 3 2 1
% of total responsesCo-ops offer inferior quality products 0 2 10 41 47 1.69 228Farmers should not own food companies 1 3 15 34 47 1.77 228Co-ops are get-rich-quick schemes 0 6 14 33 47 1.82 228Farmers use these co-ops as last-ditch efforts to survive financially 1 11 15 39 34 2.05 228Co-ops cannot compete with investor owned firms 0 10 24 44 22 2.25 227Managers have too much control 2 7 46 34 11 2.56 228Co-ops benefit only the wealthy producers 4 30 27 32 7 2.91 228Delivery contracts are too strict 1 18 56 23 2 2.93 226Required investments are too high 3 27 54 12 4 3.13 226SA is strongly agree, A is agree, N is neutral, D is disagree, SD is strongly disagree, Avg. Is1
average, and N is the number of responses. Source: Ag loan officers survey, question 21.

35
Table 19. Attitudes toward cooperatives—a comparison of the performance of new andtraditional cooperatives, North Dakota, 1995.
Comparison/weight1
MB B S W MW Avg. NVariables 5 4 3 2 1
% of total responsesPerformance of closed-membership feature 12 45 37 6 0 3.61 199Delivery proportional to stock ownership 11 60 24 4 0 3.79 214MB is much better, B is better, S is same, W is worse, MW is much worse, Avg. is average, and1
N is the number of responses. Source: Ag loan officers survey, questions 18 and 19.
Like other variables measuring attitudes, these also demonstrate that loan officersgenerally had positive views of cooperatives. Statistical tests continue to show that loan officers’attitudes had little impact on lending (Table 20). Three variables dealt with competition betweencooperatives and investor-oriented firms. Loan officers indicated that cooperatives can effectivelycompete in the food processing industry. They strongly disagreed with the statementscooperatives offer inferior products, farmers should not own food companies, and cooperativescannot compete with investor-owned firms. The first two statements drew the least negativeresponses; the average responses are 1.69 and 1.77, placing them between “strongly disagree” and“disagree.” The variable created from the second statement, that farmers should not own foodcompanies, is the only one statistically related to cooperative stock lending. Seven of nine loanofficers who agreed with this statement did not make cooperative stock loans. The result issignificant at the 5% level (Table 20). The average response to the third statement, cooperativescannot compete with investor-owned firm, is 2.25 and indicates disagreement (Table 18).
Loan officers believed that cooperatives were legitimate and appropriately pricedinvestments. Four statements centered on the stock investment. Loan officers disagreed with thestatements that cooperatives are get-rich-quick schemes and last-ditch efforts of farmers tosurvive financially. These statements had average scores of 1.82 and 2.05. The statement thatthe cooperatives benefit only wealthy producers had the third most negative response with anaverage of 2.91. This response rate is best described as “neutral.” The final statement, that therequired investments are too high, had an average response rate of 3.13, the only response with anaverage higher than three. This is another “neutral” response indicating that the average loanofficer believed that cooperative investments were appropriately priced (Table 18).
Two statements, that managers have too much control and that delivery contracts are toostrict, describe the relationship between the cooperative and the farmer-investor. Respondentsdisagreed with the first statement with an average score of 2.56. They were neutral on the secondstatement with an average score of 2.93 (Table 18).
While the overall results are positive, the responses to the last two statements demonstratethat important elements of the new cooperatives are controversial. Loan officers

36
Table 20. Crosstabulation tests for attitudes toward cooperatives variables—a comparison of the performance of new and traditional cooperatives, and responses to negative statements about new cooperatives, North Dakota, 1995.
made loansYes No
Variables N % N % P p2
Performance of closed-membership feature
Better 72 64 40 36Same 49 66 25 34Worse 9 69 4 31
Total 130 65 69 35 0.17 0.93
Delivery proportional to stock ownershipBetter 98 64 55 36Same 34 65 18 35Worse 7 78 2 22
Total 139 65 75 35 0.76 0.68
Required investments are too highDisagree 26 72 10 28Neutral 74 60 49 40Agree 44 66 23 34
Total 144 65 82 35 1.95 0.38
Co-ops benefit only the wealthy producers
Disagree 56 63 33 37Neutral 37 61 24 39Agree 52 67 26 33
Total 145 64 83 36 0.56 0.75Delivery contracts are too strict
Disagree 36 64 20 36Neutral 85 67 42 33Agree 24 56 19 44
Total 145 64 81 36 1.70 0.43
Farmers should not own food companiesDisagree 122 66 63 34Neutral 21 62 13 38Agree 2 22 7 78
Total 145 64 83 36 6.92 0.03
Co-ops are get-rich-quick schemesDisagree 114 63 66 37Neutral 21 64 12 36Agree 10 67 5 33
Total 145 64 83 36 0.07 0.97
Farmers use these co-ops as last-ditch efforts to survive financially
Disagree 108 65 59 35Neutral 21 62 13 38Agree 16 59 11 41
Total 145 64 83 36 .35 .84
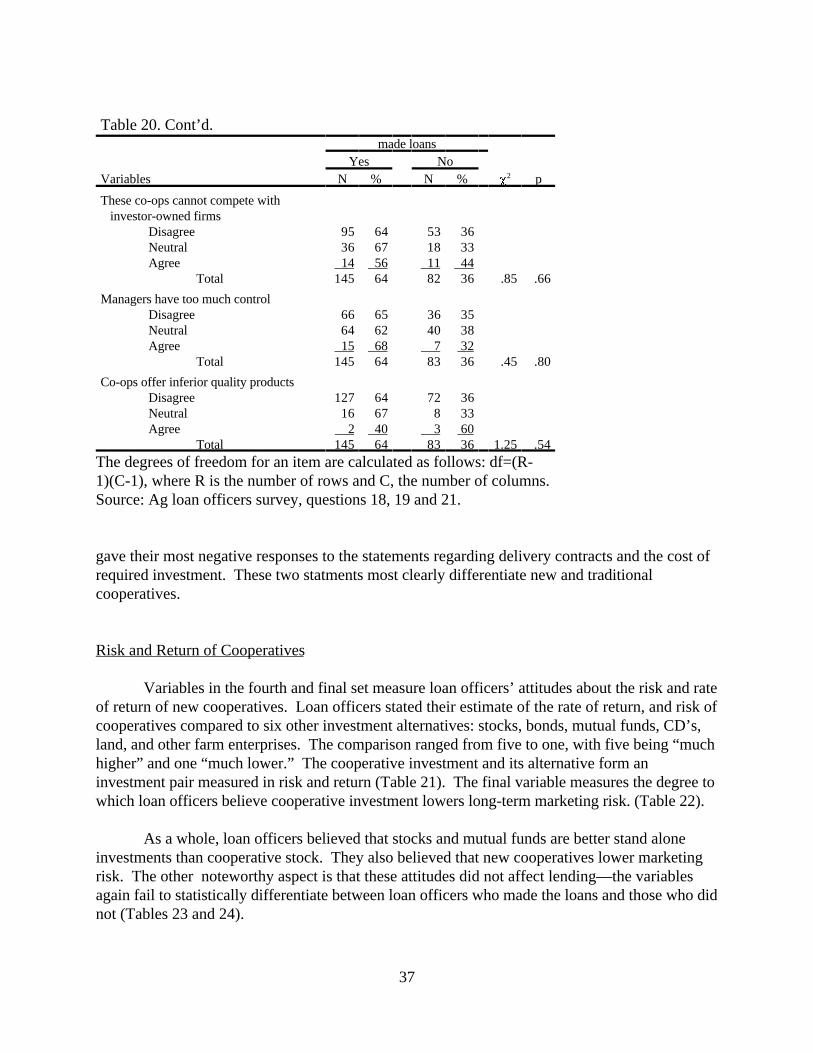
37
Table 20. Cont’d.made loans
Yes NoVariables N % N % P p2
These co-ops cannot compete with investor-owned firms
Disagree 95 64 53 36Neutral 36 67 18 33Agree 14 56 11 44
Total 145 64 82 36 .85 .66
Managers have too much controlDisagree 66 65 36 35Neutral 64 62 40 38Agree 15 68 7 32
Total 145 64 83 36 .45 .80
Co-ops offer inferior quality productsDisagree 127 64 72 36Neutral 16 67 8 33Agree 2 40 3 60
Total 145 64 83 36 1.25 .54The degrees of freedom for an item are calculated as follows: df=(R-1)(C-1), where R is the number of rows and C, the number of columns. Source: Ag loan officers survey, questions 18, 19 and 21.
gave their most negative responses to the statements regarding delivery contracts and the cost ofrequired investment. These two statments most clearly differentiate new and traditionalcooperatives.
Risk and Return of Cooperatives
Variables in the fourth and final set measure loan officers’ attitudes about the risk and rateof return of new cooperatives. Loan officers stated their estimate of the rate of return, and risk ofcooperatives compared to six other investment alternatives: stocks, bonds, mutual funds, CD’s,land, and other farm enterprises. The comparison ranged from five to one, with five being “muchhigher” and one “much lower.” The cooperative investment and its alternative form aninvestment pair measured in risk and return (Table 21). The final variable measures the degree towhich loan officers believe cooperative investment lowers long-term marketing risk. (Table 22).
As a whole, loan officers believed that stocks and mutual funds are better stand aloneinvestments than cooperative stock. They also believed that new cooperatives lower marketingrisk. The other noteworthy aspect is that these attitudes did not affect lending—the variablesagain fail to statistically differentiate between loan officers who made the loans and those who didnot (Tables 23 and 24).

38
Table 21. Risk and return variables—a comparison of the long-term return of cooperatives and alternative investments, North Dakota, 1995.
Comparison/weight1
MH H S L ML Avg. NVariables 5 4 3 2 1
% of total responses1
Return on investment of cooperatives compared to...Stocks 2 27 31 34 6 2.84 215Bonds 3 34 36 25 2 3.12 214Mutual funds 3 30 31 32 4 2.95 214CDS 11 39 27 20 3 3.36 215Land 5 32 39 21 3 3.15 215Other farm enterprises 2 26 54 17 1 3.10 213Perception of risk of cooperatives compared to...Stocks 7 50 34 9 0 3.56 217Bonds 27 48 17 7 1 3.95 217Mutual funds 16 50 26 7 1 3.72 217CDS 66 18 6 3 7 4.32 217Land 28 44 17 9 2 3.86 218Other farm enterprises 9 36 49 5 0 3.50 214MH is much higher, H is more, S is same, L is less, ML is much less, Avg. is average, and N is*
the number of responses. Source: Ag loan officers survey, questions 13 and 14.
Table 22. Risk and return—reduction of long-term marketing risk, North Dakota, 1995.Reduction/weight1
VL L S VS AN Avg. NVariable 5 4 3 2 1
% of total responses1
New ag co-ops lower long-term marketing risk 2 25 61 8 4 3.13 224VL is very large, L is large, S is small, VS is very small, AN is much almost never, Avg. Is1
average, and N is the number of responses. Source: Ag loan officers survey, question 15.
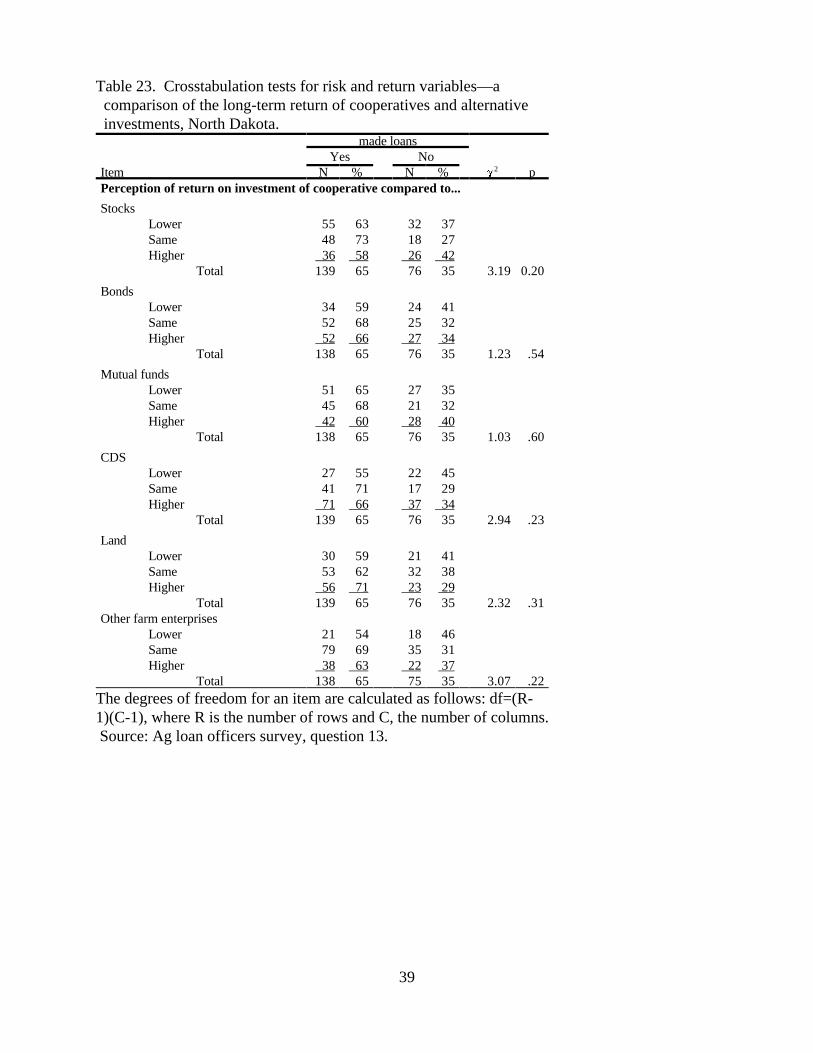
39
Table 23. Crosstabulation tests for risk and return variables—a comparison of the long-term return of cooperatives and alternative investments, North Dakota.
made loansYes No
Item N % N % P p2
Perception of return on investment of cooperative compared to...
StocksLower 55 63 32 37Same 48 73 18 27Higher 36 58 26 42
Total 139 65 76 35 3.19 0.20
BondsLower 34 59 24 41Same 52 68 25 32Higher 52 66 27 34
Total 138 65 76 35 1.23 .54
Mutual fundsLower 51 65 27 35Same 45 68 21 32Higher 42 60 28 40
Total 138 65 76 35 1.03 .60
CDSLower 27 55 22 45Same 41 71 17 29Higher 71 66 37 34
Total 139 65 76 35 2.94 .23
LandLower 30 59 21 41Same 53 62 32 38Higher 56 71 23 29
Total 139 65 76 35 2.32 .31Other farm enterprises
Lower 21 54 18 46Same 79 69 35 31Higher 38 63 22 37
Total 138 65 75 35 3.07 .22The degrees of freedom for an item are calculated as follows: df=(R-1)(C-1), where R is the number of rows and C, the number of columns. Source: Ag loan officers survey, question 13.

40
Table 24. Crosstabulation tests for risk and return variables—a comparison of the long-term risk of cooperatives and alternative investments, and reduction of long-term marketing risk, North Dakota, 1995.
made loansYes No
Item N % N % P p2
perception of risk of cooperatives compared to...
StocksLower 11 58 8 42Same 47 64 26 36Higher 82 66 43 34
Total 140 65 77 35 .42 .81
BondsLower 13 81 3 19Same 21 57 16 43Higher 106 65 58 35
Total 140 65 77 35 3.12 .21
Mutual FundsLower 10 56 8 44Same 36 63 21 37Higher 94 66 48 44
Total 140 65 77 35 .83 .66
CDSLower 13 59 9 41Same 6 43 8 57Higher 121 67 60 33
Total 140 65 77 35 3.43 .18
LandLower 14 58 10 42Same 25 66 13 34Higher 102 65 54 35
Total 141 65 77 35 .47 .79
Other farm enterprisesLower 7 64 4 36Same 63 60 42 40Higher 68 69 30 31
Total 138 65 76 35 1.96 .37
Degree to which investment lowers long-term marketing risk
Lower 17 61 10 39Same 92 68 44 32Higher 37 63 24 37
Total 146 65 78 35 0.97 0.62The degrees of freedom for an item are calculated as follows: df=(R-1)(C-1), where R is the number of rows and C, the number ofcolumns. Source: Ag loan officers survey, question 14.

41
Figure 6 is a graph of the loan officers’ views of return and risk for the cooperativescompared with the investment alternatives. The horizontal axis measures the average response forrisk and the vertical axis the average response for return. The graph is divided into four quadrantsat the point (3, 3). At this point a cooperative investment has the same risk and rate of return asthe investment to which it is compared; from the perspective of the loan officers they are identicalinvestments.
If an investment pair is situated in quadrant I, loan officers believed that cooperativeinvestment offered a higher return but more risk than the investment alternative. Typically, higherreturn can only be earned by incurring more risk, both investments, the cooperative investmentand its alternative, are logical alternatives, neither inferior to the other. Loan officers place bonds,CD’s, land, and other farm enterprises in this quadrant; they are acceptable alternatives toinvestments in cooperatives.
Any investment pair in quadrant II indicates that loan officers viewed the cooperativeinvestment as offering lower return and higher risk than the alternative investment. Thecombination of lower return and higher risk indicates that loan officers believed the cooperativeinvestment is inferior to the alternative investments of stocks and mutual funds as a stand aloneinvestment.
Points in quadrant III, like those in quadrant I, show that neither investment in the pair isclearly superior to the other. If an investment pair is located in this quadrant, the cooperativeinvestment offers both lower return and lower risk. Points in quadrant IV indicate that thecooperative investment is superior to its investment pair, offering both higher return and lowerrisk. None of the investment pairs lie in these quadrants.
Figure 7 shows the views of loan officers, of farmers who invested and of farmers who didnot invest in cooperative stock about return and risk for the cooperatives compared with theinvestment alternatives (Wilson, Goreham and Kibbe, 1996). Loan officers are risk aversecompared to both cooperative members and non-members. Loan officers viewed cooperativeinvestment as riskier relative to the alternatives than did members and non-members. Loanofficers thought that cooperative investment returned less relative to its alternative than did themembers. They thought that it returned more relative to its alternative than did the non-members. Even if they relied more heavily on the investment criteria when evaluating a cooperative stockloan, their conservative attitudes toward risk and return relative to those of cooperative stockloan applicants would limit the number of projects that they viewed as acceptable.
Cooperative investment is not held in isolation, and the risk of the farmers’ investmentportfolios, which are mainly composed of their farm enterprises, is affected by the investment in acooperative. Additional investments which do not have perfectly correlated income streamsreduce portfolio risk. To assess the loan officers’ view of the reduction of portfolio risk thatcooperative investment could provide, loan officers ranked from five to one the degree to whichcooperative investment lowers long-term marketing risk with one being “not at all,” and five being“very large.” The average response was 3.13, where three was to a “small degree.” The

2.6
2.8
3.0
3.2
3.4
3.6
3.8
4.0
4.2
4.4
Aver
age
resp
onse
for r
isk
2.6
2.7
2.8
2.9
3.0
3.1
3.2
3.3
3.4
Average response for return
Figu
re 6
. Av
erag
e es
timat
e of
risk
and
retu
rn o
f co-
op in
vest
men
ts c
ompa
red
to a
ltern
ativ
e in
vest
men
ts b
y ag
ricul
tura
l
Sto
cks
Bon
ds
Mut
ual
Fund
s
CD
s
Land
Oth
er
farm
sI II
IIIIV
loan
offi
cers
, Nor
th D
akot
a, 1
995.
Sou
rce:
Tab
le 2
1. B
ased
on
5-pt
Lik
ert s
cale
: 5=M
uch
Hig
her a
nd 1
=Muc
h Lo
wer
.
42
42

2.6
2.8
3.0
3.2
3.4
3.6
3.8
4.0
4.2
4.4
Ave
rage
resp
onse
for r
isk
2.6
2.8
3.0
3.2
3.4
3.6
3.8
4.0
Average response for return Figu
re 7
. A
vera
ge e
stim
ate
of ri
sk a
nd re
turn
of c
o-op
inve
stm
ents
cop
ared
to a
ltern
ativ
e in
vest
men
ts b
y ag
ricul
tura
l
Sto
cks
Bon
ds
Mut
ual F
unds
CD
s
Land
I IIIIIIV
Sto
ck
Bon
ds
Mut
ual F
unds
Sto
ck
Bon
dsM
utua
l Fun
ds
CD
s
CD
s
Land
Land
Lend
ers
Mem
bers
Non
-mem
bers
loan
offi
cers
, mem
bers
and
non
-mem
bers
, Nor
th D
akot
a, 1
996.
Sou
rce:
Wils
on, G
oreh
am, a
nd K
ibbe
. B
ased
on
5-pt
Lik
ert
Oth
er F
arm
s
Oth
er fa
rms
Oth
er F
arm
s
scal
e: 5
=Muc
h H
ighe
r and
1=M
uch
Low
er.
43
43

44
crosstabulations results indicate that there is no statistically significant difference between loanofficers that made the loans and those that did not (Table 22).
Demographics
Demographic characteristics may influence the loan decision. Variables in the fifth clustermeasure these characteristics. The first five variables measure loan officers’ gender, age, highesteducational degrees, if they grew up on farms or in rural communities, and if they had friends orfamily who had purchased cooperative stock. In addition to these variables, the final variablemeasures loan officers’ perception of their parents’ attitudes regarding cooperatives (Table 25).
Only two demographic variables were statistically related to lending. Loan officers withfriends and family that had purchased stock were more likely to have made stock loans, and therelationship is statistically significant at the 1% level. Seventy-seven percent of 145 loan officersmaking loans had friends or family who had purchased stock, compared to 38% of 85 loanofficers who did not (Table 26).
Men were more likely to make cooperative stock loans than women, and the relationshipis significant at the 5% level. However, only 18 women responded to the survey. The smallnumber of responses made additional testing controlling for factors such as the years ofexperience as an agricultural loan officer, unreliable.
Age, educational level, parents’ attitudes toward cooperatives, and farm background werenot statistically related to lending
V. CONCLUSIONS
The FCS made a disproportionately large share of cooperative stock loans. Excluding theFCS, large institutions which aggressively managed assets and marketed cooperative stock loanswere more likely to have made the loans. They are aggressively managed, with lower levels ofcapital, relatively low non-current loans, and higher returns on equity. They aggressively marketthe loans by offering lower interest rates or deferred principal payments. Research indicates thatthe larger institutions have the advantage of more diversified loan portfolios and economies ofsize.
North Dakota loan officers appear to be conservative, relying on current operations torepay loans, and not the profitability or cash flow of the investment. This practice givesfinancially strong borrowers the freedom to invest in projects as they choose, without loan officerssecond guessing their decisions. It limits financially weaker borrowers from investing in projectswhich indicate strong earnings potential.

45
Table 25. Demographic variables, North Dakota, 1995.Variables N %Sex
Male 170 90Female 18 10
Total 188 100
Age< 35 52 2235 to 50 153 64> 50 33 14
Total 238 100
Highest degreeHigh School 21 9College 197 83Graduate 19 8
Total 237 100
Grew up on farmYes 193 81No 46 19
Total 239 100
Parents’ attitude towards co-opsVery positive 33 14Positive 104 45Neutral 77 33Negative 18 8Very negative 0 0
Total 232 100
Friends and/or family have invested in new co-ops
Family 11 5Friends 93 40Family and friends 41 18None 85 37
Total 230 100Source: Ag loan officers survey, questions 22, 23, 24, 25 and 26.

46
Table 26. Crosstabulation tests for demographic variables, North Dakota, 1995.
made loansYes No
Variable/Response N % N % P * p2
SexMale 107 63 63 37Female 6 33 12 67
Total 113 60 75 40 5.82 0.02
Age< 35 26 50 26 5035 to 50 99 65 54 35> 50 19 58 14 42
Total 144 60 94 39 3.61 0.16
Highest degreeHigh School 13 62 8 38College 119 60 78 40Graduate degree 12 63 7 37
Total 144 61 93 39 0.07 0.97
Grew up on farmYes 120 62 73 38No 24 52 22 48
Total 144 60 95 40 1.53 0.22
Parents’ attitude toward co-opsPositive 90 66 47 34Neutral 42 55 35 45Negative 10 56 8 44
Total 142 61 90 39 2.83 0.24
Friends and/or family have invested in new co-ops
Yes 112 77 33 23No 30 35 55 65
Total 142 62 88 38 40.14 0.00The degrees of freedom for an item are calculated as follows: df=(R-1)(C-1), where R is the number of rows and C, the number of columns. Sources: Ag loan officers survey, questions 22, 23, 24 and 25.
The success of farmers in acquiring debt to fund their cooperatives may be due to thenature of the cooperative ownership. At the time of organization, cooperative ownership is morediffuse and the risk to any single investor more limited than other agribusiness concerns of similarsize. This advantage mitigates concern expressed in the North Dakota Vision 2000 Report thatconservative lending practices would limit access to initial seed capital. By lending to farmers andnot directly to the cooperative, loan officer maintained conservative lending standards and stillfunded the new cooperatives. Repayment was based on farmers’ profitability and asset base andnot that of the new cooperative. The risk of a large loan loss was small because loans were madeto many investors rather than directly to the new venture or a small number of investors.
The use of conservative lending standards may contribute to the commonly held, thoughnot majority belief among loan officers that cooperatives benefit only the wealthy. If loan officers
47
believe that cooperatives will increase the income of members, and they only make loans to thefinancially strong than many are likely to believe that cooperatives benefit only the wealthy. Thisbelief, if prevalent among farmers, could be socially and politically divisive since the stategovernment has initiated several programs which encourage the formation of new cooperatives.
Experienced loan officers made most of the cooperative stock loans. The experience ismultidimensional. Loan officers who made the loans are more likely to have more than ten yearsof experience as an agricultural lender, and spend more the 60% of their work day in agriculturallending. They are more likely to have friends or family who have purchased cooperative stock. Finally, they are more likely to have evaluated a new cooperative’s business plan or attended itsinformation meetings.
Cooperative ventures may engender more trust by the loan officers than other agribusinessventures of similar size. The trust is based on the motives of early organizers to provide accurateinformation to both investors and loan officers. Early organizers cannot enhance their profit bywithholding information from other farmers investing in cooperatives and loan officers receive thesame information as other investors. The importance of information is seen in the lendingresponse of loan officers who reviewed a business plan or attended cooperative informationmeetings, which were designed to give loan officers the same information provided potentialmembers. Those who attended an organizational meeting or examined a business plan were abouttwice as likely to have made stock loans.
Loan officers either displayed a high degree of professional ethics, or were subject tostrong review after stock loans were granted, or both. They did not avoid making cooperativestock loans because these loans were more difficult or time consuming.
Loan officers generally had positive attitudes about new cooperatives, but these attitudeshad little influence on lending. Most believed that new cooperatives were able to competeeffectively in the food processing industry. They also believed that new cooperatives couldachieve a number of objectives for the farmer, such as gaining access to value-added markets,allowing them to network with other farmers, and increasing their knowledge base.
A limited number of attitudes were associated with lending. Loan officers who felt thatfarmers understood the impact of the cooperative investment on their farms were more likely tohave made loans. To a loan officer, a proper understanding may include a modest appraisal of therisk reducing advantages of the new cooperatives. They were more likely to have made loans tofarmers who believed that new cooperatives “seldom” or “occasionally” reduced marketing risk.
Despite loan officers’ generally positive attitudes, there was a negative current. Theirconcerns that the delivery contracts are too strict and that the required investments are too highmay indicate that they do not understand that these characteristics differentiate new cooperativesfrom traditional cooperatives. It may also indicate an assessment of their own risks. Highinvestment cost for the initial stock purchase implies larger loans. Strict delivery contracts forcefarmers to continue deliveries to the cooperative even if they can market products more profitablyelsewhere.

48
Loan officers view cooperative stock investment as an inferior stand alone investment tostocks and mutual funds for farmers. Most loan officers believe that farmers can reducemarketing risk through cooperative stock investment. If these cooperatives significantly reducerisk then their members may form the nucleus of surviving farmers after the next farm crisis. Ifthey fail to reduce risk significantly or fail to earn a normal return on investment, then members,who are tied to the cooperatives through long-term delivery contracts, may be the first to exit theindustry. Additional testing should be conducted to determine if cooperative stock investmentincreases return or reduces risk sufficiently to justify investment by farmers seeking portfoliodiversification.

49
VI. REFERENCES
Annual Report. 1994. Farm Credit Services of Fargo, ACA, AgriBank, FCB and the SeventhDistrict Associations
Annual Report. 1994. Farm Credit Services of Grand Forks, FLCA, Farm Credit Services ofGrand Forks, PCA, AgriBank, FCB and the Seventh District Associations.
Annual Report. 1994. Farm Credit Services of Mandan, FLCA, Farm Credit Services of GrandForks, PCA, AgriBank, FCB and the Seventh District Associations.
Annual Report. 1994. Farm Credit Services of Northwest North Dakota, ACA, AgriBank, FCBand the Seventh District Associations.
Calomiris, Charles W., R. Glenn Hubbard, and James H. Stock. 1986. “Growing in Debt: The‘Farm Crisis’ and Public Policy,” National Bureau of Economic Research Working Paper No.2085, National Bureau of Economic Research, Cambridge, MA, Nov.
Fedgazette. 1995. Bank Directory, July, S9-S10.
Gustafson, Cole R., Ronald J. Beyer, and David M. Saxowsky. 1991. “Credit Evaluation:Investigating the Decision Processes of Agricultural Loan Officers.” Agricultural FinanceReview, 51, 55-63.
Leistritz, Larry F. 1995. Potential Local Socioeconomic Impacts of the Proposed ProGoldProcessing Plant. Agricultural Economics Report No. 328, North Dakota State University,Fargo.
Rural Development Program Report: 1990-1995. North Dakota Associations of Rural Electric &Telephone Cooperatives, Mandan, North Dakota.
Stiglitz, Joseph E. and Andrew Weiss. 1981. “Credit Rationing in Markets with ImperfectInformation.” The American Economic Review, 71, 3, 393-410.
Vision 2000: An 8-Point Action Agenda for Building a New North Dakota. 1990. DiscussionReport, North Dakota 2000 Committee, Fargo, North Dakota.
Wilson, Brooks M., Gary A Goreham, and Theron Kibbe. 1996. “The Formation of NewCooperatives and the Attitudes of Members, Non-members and Agricultural Loan Officers.” Working paper
APPENDIX TABLES

51
Table A1. Crosstabulation tests for financial condition variables, including the Farm Credit Services, that made agricultural loans, North Dakota, 1995.
Made loansYes No
Variable/Response N % N % P p2
Total assets in $ millions< $25 13 32 28 68$25 to $100 36 67 18 33> $100 11 85 2 15
Total 60 56 48 44 17.26 0.00Capital as a % of assets
< 7% 5 71 2 297% to 10% 36 61 23 39> 10% 19 45 23 55
Total 60 56 48 44 3.26 0.20
Ag loans as a % of total loans< 25% 10 50 10 5025% to 65% 31 55 25 45> 65% 19 59 13 41
Total 60 56 48 44 0.43 0.80Return on equity
< 8.0% 9 47 10 538.0% to 12.0% 17 57 13 43> 12.0% 34 58 25 42
Total 60 56 48 44 0.63 0.73
Loan-to-deposit ratioLess 65% 34 51 33 4965% to 80% 15 68 7 32> 80% 11 58 8 42
Total 60 56 48 44 2.13 0.34
Non-current loans to total loans ratio
< 1% 33 49 35 511% to 4% 25 71 10 29> 4% 2 40 3 60
Total 60 56 48 44 5.57 0.06* The degrees of freedom for an item are calculated as follows:df=(R-1)(C-1), where R is the number of rows and C, the number ofcolumns. Sources: Fedgazette, Annual Statements of the FarmCredit Services, North Dakota State

52
Table A2. Crosstabulation tests for capital as a percentage of total assets of the institutions, excluding the farm credit services, after controlling for return on equity and non-current loans, North Dakota, 1995.
Made loansYes No
Variable/Response N % N % P p2
Capital as a % of assets (ROE<8.0%)
< 7% 0 0 1 1007% to 10% 4 50 4 50> 10% 4 44 5 56
Total 8 56 10 44 1.27 0.52Capital as a % of assets (8.0%<ROE<12.0%)
< 7% 1 100 0 07% to 10% 5 50 5 50> 10% 8 50 8 50
Total 14 52 13 48 1.35 0.51
Capital as a % of assets (ROE>12.0%)
< 7% 4 80 1 207% to 10% 27 66 14 34> 10% 3 23 10 77
Total 34 58 25 42 8.72 0.1Capital as a % of assets (non-current<1%)
< 7% 5 83 1 177% to 10% 21 53 19 47> 10% 7 32 15 68
Total 33 49 35 44 5.93 0.05Capital as a % of assets (1%<non-current<4%)
< 7% 0 0 1 1007% to 10% 14 82 3 18> 10% 7 54 6 46
Total 21 56 9 44 5.20 0.07
Capital as a % of assets (non-current>4%)
7% to 10% 1 50 1 50> 10% 1 33 2 67
Total 2 40 3 60 0.13 0.71* The degrees of freedom for an item are calculated as follows:df=(R-1)(C-1), where R is the number of rows and C, the number ofcolumns. Sources: Fedgazette, Annual Statements of the FarmCredit Services, North Dakota State

53
Table A3. Market share comparison of banks, the farm credit services, and credit unions based on financial information, North Dakota 1994.
Institution Market shareAvg. N $ %
Total assets ($ 000)Banks 57,710 136 7,848,500 83Farm credit services 284,072 4 1,136,288 12Credit unions 21,041 23 483,953 5
Agricultural loans ($ 000)Banks 15,784 136 2,146,606 70Farm credit services 203,227 4 812,908 26Credit unions 5,005 23 115,125 4
Cooperative stock loansBanks 57,478 136 7,816,957 34Farm credit services 3,718,761 4 14,875,043 64Credit unions 22,284 23 512,534 2
Sources: Fedgazette, annual statements of the farm credit services, the North Dakota State Department of Banking, and the Ag Supervisors survey (Question 7).
Table A4. Market share comparison of large, medium, and small banks and credit unions based on financial information, North Dakota 1994.
Institution Market shareAvg. N $ %
Total assets ($ 000)Large 284,306 14 3,980,287 48Medium 43,516 79 3,437,747 41Small 13,252 69 914,418 11
Agricultural loans ($ 000)Large 28,926 14 433,889 29Medium 10,584 79 836,137 55Small 3,427 69 239,904 16
Cooperative stock loansLarge 242,360 14 3,635,399 47Medium 30,300 79 2,393,772 31Small 24,593 69 1,696,950 22
Sources: Fedgazette, the North Dakota State Department of Banking, and the Ag Supervisors survey (Question 7).

54
Table A5. Market share comparison based on the percentage of equity based on financial information, North Dakota 1994.
Institution Market shareAvg. N $ %
Total assets ($ 000)High 31,329 67 2,099,050 25Medium 52,921 85 4,498,249 54Low 192,388 9 1,731,494 21
Agricultural loans ($ 000)High 12,393 67 480,016 25Medium 30,931 85 1,143,154 60Low 114,483 9 277,508 15
Cooperative stock loansHigh 16,043 67 1,074,896 16Medium 43,927 85 3,733,763 55Low 219,373 9 1,974,356 29
Sources: Fedgazette, the North Dakota State Department of Banking, and the Ag Supervisors survey (Question 7).

55
Table A6. Financial institutions’ loan activity with farmers seeking to fund investments in new agricultural cooperatives, North Dakota, 1995.Selected variables N %Did the institution make these loans?
Yes 61 53No 54 47
Total 115 100
Number of applications received1 to 5 28 456 to 10 15 24> 10 19 31
Total 62 100
Number of loans granted1 to 5 80 726 to 10 14 13> 10 17 15
Total 101 100
Highest loan amount< $22,000 29 50$22,000 to $50,000 14 24> $50,000 15 26
Total 58 100
Lowest loan amount< $5,000 23 40$5,000 to $7,000 14 24> $7,000 21 36
Total 68 100
Average loan amount< $10,000 29 53$10,000 to $14,000 7 13> $14,000 19 34
Total 55 100Sources: Ag supervisor survey, questions 7.

56
Table A7. Loan officer’s loan activity with farmers seeking to fund investments in new agricultural cooperatives, North Dakota, 1995.Selected variables N %Did ag loan officer make these loans?
Yes 148 57No 112 43
Total 260 100
Number of farmers who talked about investment loan
1 to 5 125 486 to 10 57 22>10 78 30
Total 260 100
Number of applications received.1 to 5 177 686 to 10 51 20>10 32 12
Total 260 100
Number of loans granted1 to 5 185 716 to 10 43 17>10 32 12
Total 260 100Source: Ag lenders survey, questions 4.