Embed Size (px)
Citation preview
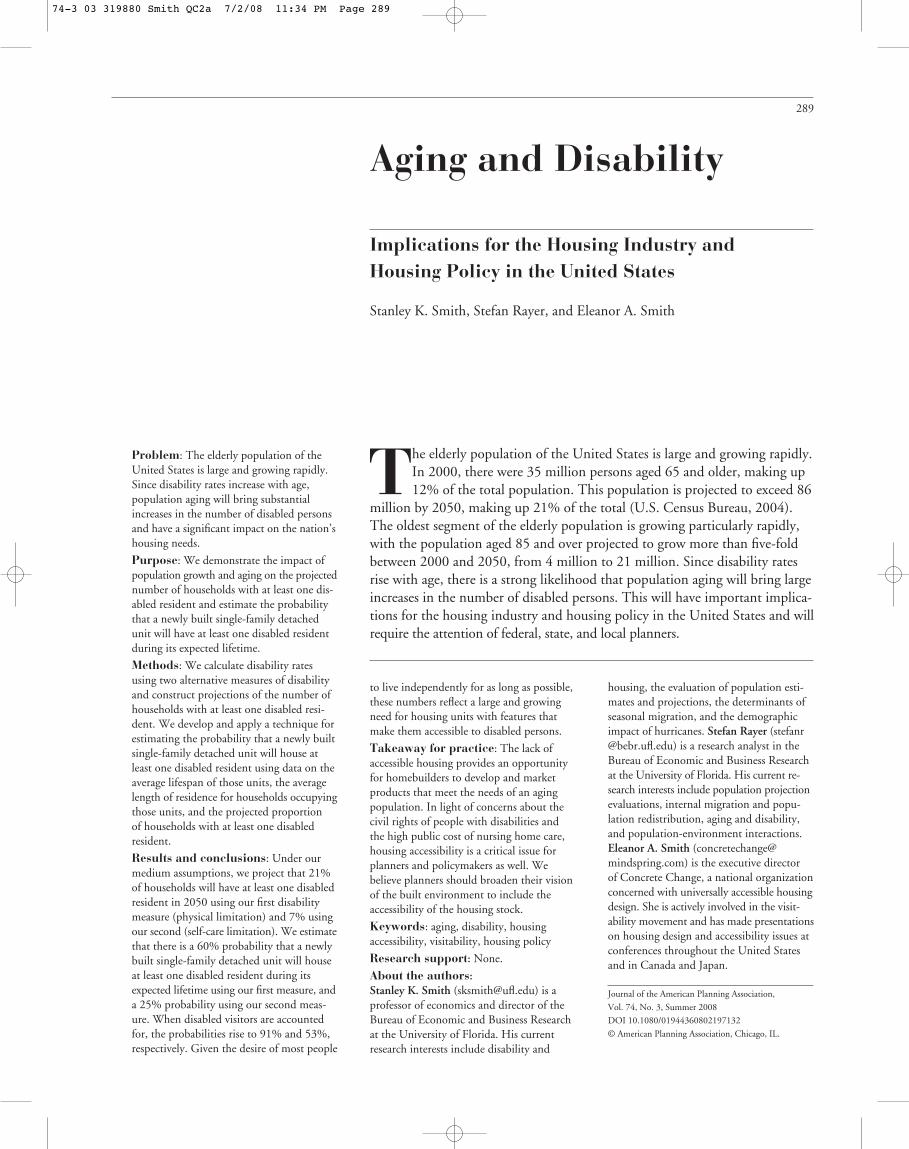
289
Problem: The elderly population of theUnited States is large and growing rapidly.Since disability rates increase with age,population aging will bring substantialincreases in the number of disabled personsand have a significant impact on the nation’shousing needs.
Purpose: We demonstrate the impact ofpopulation growth and aging on the projectednumber of households with at least one dis-abled resident and estimate the probabilitythat a newly built single-family detachedunit will have at least one disabled residentduring its expected lifetime.
Methods: We calculate disability ratesusing two alternative measures of disabilityand construct projections of the number ofhouseholds with at least one disabled resi-dent. We develop and apply a technique forestimating the probability that a newly builtsingle-family detached unit will house atleast one disabled resident using data on theaverage lifespan of those units, the averagelength of residence for households occupyingthose units, and the projected proportionof households with at least one disabledresident.
Results and conclusions: Under ourmedium assumptions, we project that 21%of households will have at least one disabledresident in 2050 using our first disabilitymeasure (physical limitation) and 7% usingour second (self-care limitation). We estimatethat there is a 60% probability that a newlybuilt single-family detached unit will houseat least one disabled resident during itsexpected lifetime using our first measure, anda 25% probability using our second meas-ure. When disabled visitors are accountedfor, the probabilities rise to 91% and 53%,respectively. Given the desire of most people
Aging and Disability
Implications for the Housing Industry and Housing Policy in the United States
Stanley K. Smith, Stefan Rayer, and Eleanor A. Smith
The elderly population of the United States is large and growing rapidly.In 2000, there were 35 million persons aged 65 and older, making up12% of the total population. This population is projected to exceed 86
million by 2050, making up 21% of the total (U.S. Census Bureau, 2004).The oldest segment of the elderly population is growing particularly rapidly,with the population aged 85 and over projected to grow more than five-foldbetween 2000 and 2050, from 4 million to 21 million. Since disability ratesrise with age, there is a strong likelihood that population aging will bring largeincreases in the number of disabled persons. This will have important implica-tions for the housing industry and housing policy in the United States and willrequire the attention of federal, state, and local planners.
to live independently for as long as possible,these numbers reflect a large and growingneed for housing units with features thatmake them accessible to disabled persons.
Takeaway for practice: The lack ofaccessible housing provides an opportunityfor homebuilders to develop and marketproducts that meet the needs of an agingpopulation. In light of concerns about thecivil rights of people with disabilities andthe high public cost of nursing home care,housing accessibility is a critical issue forplanners and policymakers as well. Webelieve planners should broaden their visionof the built environment to include theaccessibility of the housing stock.
Keywords: aging, disability, housingaccessibility, visitability, housing policy
Research support: None.
About the authors: Stanley K. Smith ([email protected]) is aprofessor of economics and director of theBureau of Economic and Business Researchat the University of Florida. His currentresearch interests include disability and
housing, the evaluation of population esti-mates and projections, the determinants ofseasonal migration, and the demographicimpact of hurricanes. Stefan Rayer ([email protected]) is a research analyst in theBureau of Economic and Business Researchat the University of Florida. His current re-search interests include population projectionevaluations, internal migration and popu-lation redistribution, aging and disability,and population-environment interactions.Eleanor A. Smith ([email protected]) is the executive directorof Concrete Change, a national organizationconcerned with universally accessible housingdesign. She is actively involved in the visit-ability movement and has made presentationson housing design and accessibility issues atconferences throughout the United Statesand in Canada and Japan.
Journal of the American Planning Association,
Vol. 74, No. 3, Summer 2008
DOI 10.1080/01944360802197132
© American Planning Association, Chicago, IL.
74-3 03 319880 Smith QC2a 7/2/08 11:34 PM Page 289
It was estimated that 51 million Americans (18% ofthe total population) had some type of disability in 2002;among those aged 65 or older, more than 52% had a dis-ability. Many of these disabilities reduced physical mobility.More than 9% of the population reported difficulty walk-ing and 9% reported difficulty using stairs; among thoseaged 65 or older, 32% reported difficulty walking and 31%reported difficulty using stairs (Steinmetz, 2006). In themid 1990s, almost seven million Americans living innoninstitutional settings were using assistive devices suchas scooters, wheelchairs, canes, crutches, and walkers (Kaye,Kang, & LaPlante, 2000). Due to population growth andaging, this number is undoubtedly higher today.
People with mobility impairments often need featureslike zero-step entrances and wide interior doorways inorder to reside safely and comfortably in their homes, butsuch features are generally missing in the U.S. housing stock.One study estimated that more than 90% of the housingunits in the United States are inaccessible to people withdisabilities (Steinfeld, Levine, & Shea, 1998); anotherestimated that the vast majority of newly built single-family homes have steps at all entrances and/or narrowinterior doorways (Maisel, Steinfeld, & Smith, in press).This situation is not unique to the United States; Imrie(2003) cited a study of newly built private sector homes inthe United Kingdom in which 98% of the units wereinaccessible to wheelchair users.
Consequently, there is a substantial gap between theneed for and the supply of accessible housing. Nishita,Liebig, Pynoos, Perelman, and Spegal (2007) reported thatonly 38% of U.S. households having at least one memberwith a permanent physical activity limitation had any typeof home modification. Hammel (2005) reported that lessthan one-third of elderly homeowners with activity limi-tations had even the most common home modifications.Louie (1999) reported that fewer than half the householdswith disabled elderly residents who expressed a need for aramp actually had one. Clearly, many people who wouldbenefit from such features do not have them.
The lack of accessible housing has seriousconsequences for individuals and for society as a whole.Disabled people living in units lacking adequate accessi-bility features face a greater risk of injury due to falls thanthose living in units with adequate features (Close et al.,1999). Indeed, the fear of falling itself reduces the well-being of many older people (Gitlin et al., 2006). Disabledpeople living in units without adequate features are morelikely to suffer from social isolation and loneliness (Hammel,2005). This has a negative impact on life satisfaction,health, and self-esteem, three factors that are critical tosuccessful aging (Maisel et al., in press). The lack of ade-
quate features also places a burden on caregivers, making itmore difficult for them to provide assistance and reducingtheir own well-being (Saville-Smith, James, Fraser, Ruan,& Travaglia, 2007). Furthermore, many people who becomedisabled due to injury or disease are forced to move intonursing homes or other institutions because their homeslack adequate accessibility features (Maisel et al., in press).This imposes high emotional and financial costs on theindividual, and most likely inflicts high economic costs ontaxpayers as well.
Most disabled people want to live independently for aslong as possible and strongly desire housing features thatwill allow them to do so. However, they are not the onlyones interested in accessibility features. Many people whoare not disabled would like to accommodate disabledfriends or relatives when they come to visit (Bayer & Harper,2000), and others have injuries or conditions that tem-porarily limit their mobility, even though they eventuallyreturn to full functionality (Crimmins, 2004). Perhapsmore important, many recognize the possibility that theythemselves may become disabled. A survey of Americansaged 45 and older found that nearly one-fourth of therespondents thought it likely that they or someone in theirhousehold would have difficulty getting around in theirhomes within the next five years (Bayer & Harper, 2000).
The vast majority of older people would like to con-tinue living in their current homes as they age. Kochera,Straight, and Guterbock (2005) reported that 78% ofpersons aged 50 to 64, 91% of persons aged 65 to 74, and95% of persons aged 75 and over expressed a desire toremain in their current homes for as long as possible.Other studies have reported similarly high proportions(Bayer & Harper, 2000; Kochera, 2002). Consequently,many have made structural modifications to their homessuch as widening doorways and installing ramps. Morethan two-thirds of those who have made such modifica-tions believe the changes will allow them or a member oftheir household to live in their residence longer than theycould have otherwise (Bayer & Harper, 2000).
The demand for accessible housing is determined bymarket conditions, government policies, and a variety ofpersonal and household characteristics. We believe thisdemand will increase in coming decades as the U.S. popu-lation grows and continues aging. To date, however, fewstudies have analyzed the determinants of this demand orprojected how those determinants might change over time.In this article, we construct projections of one major deter-minant of the demand for accessible housing; namely, thenumber of households with a disabled resident. Recognizingthat multiple households may occupy a given housing unitsequentially over time, we also develop estimates of the
290 Journal of the American Planning Association, Summer 2008, Vol. 74, No. 3
74-3 03 319880 Smith QC2a 7/2/08 11:34 PM Page 290
probability that a newly built unit will house at least onedisabled resident over its expected lifetime. We believethese estimates and projections will provide valuable infor-mation on the potential demand for accessible housing,and have important implications for homebuilders, planners,and policymakers.
We focus on long-lasting physical disabilities thatimpair a person’s ability to enter, leave, or get aroundeffectively at home. Thus, we use the term disability torefer solely to long-lasting mobility impairments. We donot consider short-term mobility impairments, vision orhearing impairments, or cognitive, emotional, or otherdisabling conditions.
We start by discussing a number of policy measuresand initiatives that have been designed to raise the supply ofaccessible housing in the United States. Then, we describeseveral measures of disability and the data we use to con-struct disability rates. We discuss recent trends in disabilityrates and explain our approach to projecting future rates.Using projected disability rates and projections of the U.S.population by age and sex, we project the number ofdisabled persons from 2000 to 2050. We follow a similarapproach to project the number of households with at leastone disabled resident.
Population and household projections provide usefulinformation on the potential demand for accessible housing,but do not tell the whole story because housing unitstypically last for many years and are occupied by a numberof different households over time. To address this issue, wedevelop estimates of the probability that a single-familydetached unit built in 2000 will have at least one disabledresident during its expected lifetime. We focus on single-family detached units because they constitute the majorityof housing units in the United States and have been largelyunaffected by federal accessibility legislation. We extendthe analysis to consider visitability, or whether a housingunit can accommodate visits by disabled persons withoutundue difficulty. We close with an evaluation of our esti-mates and projections, a brief discussion of the cost ofaccessibility features, an overview of further research needs,and several recommendations for planners and policymakers regarding housing accessibility.
A number of studies have analyzed links betweendemographic characteristics and housing (Masnick, 2002;Myers, Pitkin, & Park, 2002; Myers & Ryu, 2008; Nelson,2006). Several have focused specifically on the housingneeds of disabled residents (Imrie, 2003, 2004; Milner &Madigan, 2004). To our knowledge, however, this is thefirst study to project the number of households with dis-abled residents and the first to consider the prevalence ofdisability within housing units rather than within the
population. Both of these innovations are essential forestimating the impacts of population aging and risingdisability on the demand for housing and the formation ofhousing policy. Although our focus is on the United States,we believe our methods can be applied in other countriesas well.
Policy Measures and Initiatives
What has been done to promote the construction ofaccessible housing in the United States? At the federal level,Section 504 of the Rehabilitation Act of 1973 requiredthat at least 5% of multifamily housing units built orsubstantially rehabilitated using federal funds be accessibleto people with mobility impairments (Kochera, 2002). TheFair Housing Amendments Act of 1988 prohibited housingdiscrimination on the basis of disability; required landlordsto allow tenants to make reasonable modifications toaccommodate disabilities; and expanded the coverage offederal accessibility standards to include most new multi-family buildings with more units. These standards includeaccessible entrances; wide interior doors; bathroom wallsreinforced to accommodate grab bars; usable bathroomsand kitchens; and accessible light switches, electrical out-lets, and environmental controls (Kochera, 2002). TheAmericans with Disabilities Act of 1990 focused primarilyon access to public facilities, but reinforced the provisionsof Section 504 of the Rehabilitation Act of 1973 (Maiselet al., in press).
To date, federal accessibility legislation has primarilyaffected nonresidential buildings and multifamily housing,with the only exception being the requirement that 5% ofsingle-family units built using federal funds must be acces-sible to people with disabilities. However, this could bechanging. The Inclusive Home Design Act, first introducedin 2003 by Representative Jan Schakowsky (D-IL), wouldrequire a zero-step entrance, 32 inches of clearance forinterior doorways on the main floor, and a bathroom thatcan accommodate wheelchairs in all new single-familyhomes built using federal funds. As of November 2007,the bill had 16 cosponsors (Inclusive Home Design Act,2007).
The Inclusive Home Design Act was inspired by thevisitability movement that arose in Europe and the UnitedStates during the 1980s. A visitable home is one that isaccessible to visitors with mobility impairments (Kaminski,Mazumdar, DeMento, & Geis, 2006). This movement isbased on three fundamental principles: accessibility is acivil right that improves quality of life; accessibility fornew housing units can be achieved at minimal cost if good
Smith et al.: Aging and Disability 291
74-3 03 319880 Smith QC2a 7/2/08 11:34 PM Page 291
design practices are followed; and focusing on a limitednumber of features will speed their adoption. Althoughfeatures such as accessible electrical controls and lever-styledoor handles are sometimes included, the three key visit-ability features are a zero-step entrance, a bathroom or halfbath on the entry level, and interior doors with at least 32inches of clearance (Maisel, 2006). These features not onlymake it easier for disabled people to visit the homes ofothers, but also make it more likely that people who arenot disabled will be able to reside safely in their homes ifthey develop a disability.
The visitability movement was initiated in the UnitedStates by Concrete Change, a disability advocacy groupin Atlanta, Georgia promoting the inclusion of the threekey features in virtually all new housing units (ConcreteChange, 2007a). The movement has been influential. In1989, Concrete Change worked with the Atlanta affiliateof Habitat for Humanity to include the three key visitabil-ity features in virtually all their new houses; to date, morethan 800 visitable Habitat homes have been built in Atlanta.In 1992, the City of Atlanta passed the first local ordinancerequiring visitability features in private single-family homesbuilt with any type of financial benefit disbursed by thecity. Similar legislation has since been passed in otherplaces, including San Antonio, Texas, Chicago, Illinois,Lafayette, Colorado, and the states of Georgia, Texas, andKansas. Although most visitability legislation applies onlyto houses built with some degree of public funding, severallocal areas (e.g., Bolingbrook, Illinois and Tucson, Arizona)have passed legislation that applies to all new housing,including units built solely with private funds. In additionto mandatory requirements, several cities and states haveworked with developers and homebuilders to establishvoluntary programs. By the end of 2007, 57 state and localgovernments had mandatory or voluntary visitabilityprograms in place (Maisel et al., in press).
Visitability legislation is controversial because it raisesissues regarding the individual rights of property owners,the civil rights of disabled persons, and the proper role ofgovernment (Nishita et al., 2007). In the only lawsuit todate involving a visitability ordinance, the courts ruled infavor of the ordinance (Washburn v. Pima County, 2003).We return to these issues later in the article.
Visitability is part of a broader range of movementsconcerned with design that accommodates the needs of asmany people as possible. These movements are describedusing terms like universal design, inclusive design, and designfor all. The term universal design is the most widely used inthe United States, and refers to the general principle that,to the greatest extent possible, manufactured products andthe built environment should be designed to be usable by
all people, regardless of their experience, knowledge, lan-guage skills, and physical abilities (Center for UniversalDesign, 1997). Universal design principles may be appliedto a public park, a house, or an item as small as a vegetablepeeler. The concept of visitability arose separately fromthat of universal design and focuses solely on houses, butthe two movements are similar in that both aim to applytheir principles universally rather than only in specialcircumstances. In recent years, proponents of the twomovements have often worked together because many oftheir objectives overlap.
Another organization working on building designissues is the International Code Council (ICC), a private,nonprofit organization established in 1994 to developcomprehensive construction and safety codes for residentialand commercial buildings (International Code Council,2008). Its membership is drawn from federal, state, andlocal government agencies; the construction industry;advocacy groups; and other stakeholders. In 2006, the ICCinstituted a task force to develop model code guidelinesregarding visitability for housing types not covered by theFair Housing Amendments Act of 1988 (i.e., new one-,two-, and three-family dwellings). Task force recommen-dations for a zero-step entrance, minimum interior doorwidths, one accessible bathroom, and several other featuresreceived preliminary approval in January 2008, and will befinalized after a period of public comment.
Housing accessibility movements are active not only inthe United States, but also in Australia, Denmark, France,Greece, Italy, the Netherlands, Spain, Sweden, and severalother countries (Alonso, 2002; Kochera, 2002; Maisel etal., in press). The United Kingdom has the most extensivemandate of any country, requiring all new housing unitsto have a zero-step entrance, wide halls and doorways,a bathroom on the entry level, and accessible electricaloutlets and controls (Imrie, 2003). These requirementsapply to single-family as well as multifamily units and tothose built with private as well as public funding. As is trueunder most accessibility legislation in the United States,waivers in the United Kingdom may be granted based onthe topography of the construction site.
A number of programs have been designed to assistin the modification of existing housing units (Duncan,1998; Steinfeld et al., 1998). Many programs are targetedtoward specific disability groups such as the elderly, veterans,or low-income households. Assistance may come in theform of grants, loans, equipment (such as lifts), or services(such as the provision of architectural plans). Funding isprovided by federal agencies such as the Department ofHousing and Urban Development, the Department ofEnergy, the Administration on Aging, the Social Security
292 Journal of the American Planning Association, Summer 2008, Vol. 74, No. 3
74-3 03 319880 Smith QC2a 7/2/08 11:34 PM Page 292
Administration, and the Department of Veterans Affairs;a wide variety of state and local government agencies; andprivate organizations such as the Lions Club and RotaryInternational.
For those unable to pay for home modifications ontheir own, securing funds can be difficult due to the lackof a central information clearinghouse and the confusingarray of programs, each with its own rules and eligibilityrequirements (Pynoos & Nishita, 2003). Furthermore,many programs do not have sufficient financial resourcesto meet the needs of all who request assistance. As a result,many disabled people are unable to make modificationsand are forced either to remain in homes ill-equipped tomeet their needs or to move prematurely into institutionalhousing (Maisel et al., in press).
Although public and private initiatives have had somesuccess in promoting the construction of accessible housingand the renovation of existing units, the vast majority ofhousing in the United States remains inaccessible to peoplewith disabilities. We turn next to estimating the potentialneed for accessibility features and projecting that need intothe future.
Measures of Disability
A disability can be defined as “a physical or mentalimpairment that substantially limits one or more major lifeactivities” (Steinmetz, 2006). Although the concept is clear,there is no single, standard way to measure the prevalenceof disabilities within a population. Measures of significantdisability are often based on whether individuals canaccomplish Activities of Daily Living (ADLs), includingbathing, dressing, eating, getting out of a chair or bed,walking across a room, and using the toilet (Freedman etal., 2004; Lakdawalla et al., 2003; Manton & Gu, 2001).Measures of less severe disabilities are often based onwhether individuals can accomplish Instrumental Activitiesof Daily Living (IADLs), including doing housework,preparing meals, shopping for groceries, taking medications,managing money, and using the telephone (Crimmins &Saito, 2000; Spillman, 2004; Waidmann & Liu, 2000).
We use two such disability measures in this article,calculating each one for both individuals and households,using data from the 5% Public Use Microdata Sample(PUMS) files from Census 2000 (U.S. Census Bureau,2003). Census data provide detailed geographic and demo-graphic coverage and have been found to provide reliabledisability estimates (Calsyn, Winter, & Yonker, 2001).
We define individuals with physical limitations (DIS-1)as those with long-lasting conditions that substantially
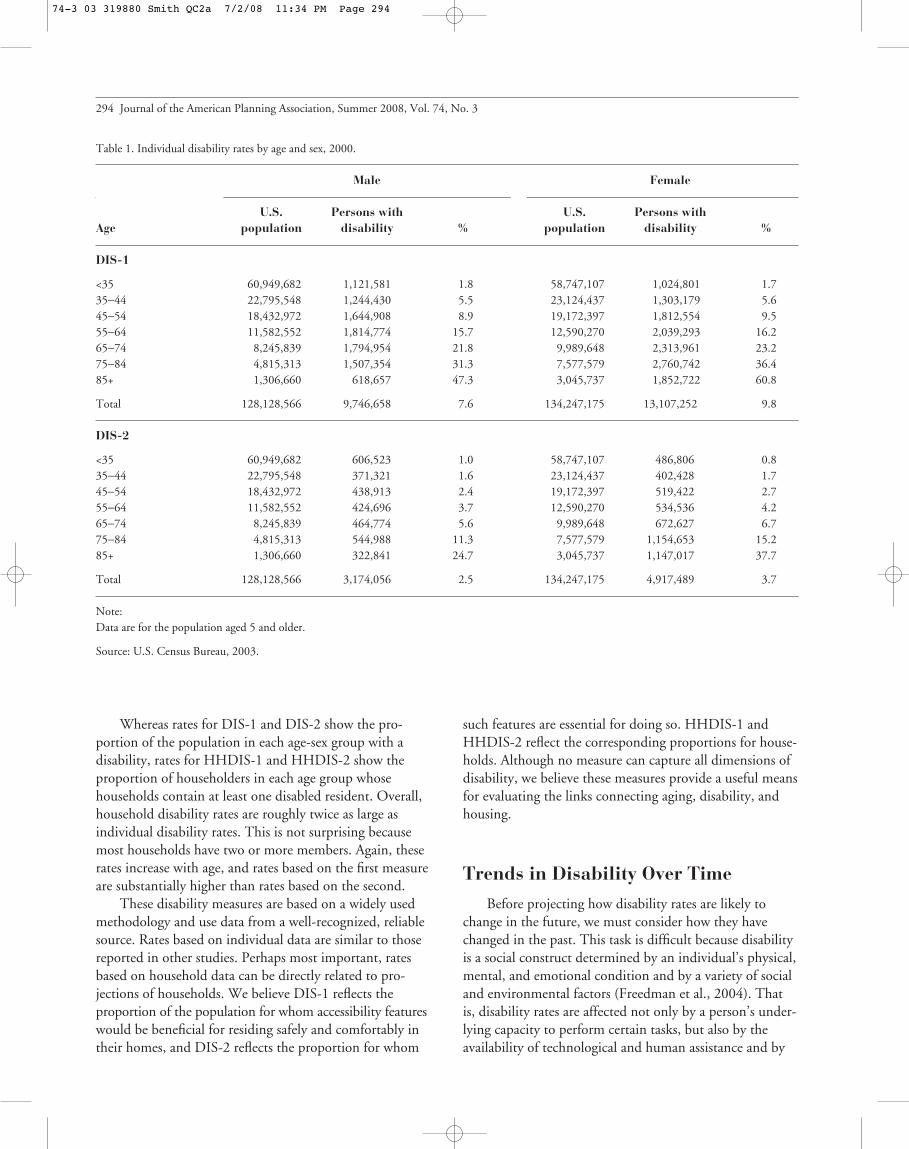
limit one or more physical activities such as walking,climbing stairs, reaching, lifting, or carrying. We defineindividuals with self-care limitations (DIS-2) as personswith conditions lasting six months or more that make itdifficult to dress, bathe, or get around inside the home.For both measures, we calculate disability rates for malesand females in each age group by dividing the number ofpersons with a disability by the total number of persons inthe group (see Table 1). These rates include persons livingin institutions as well as those living in households.
Both measures show disability rates to increase withage. This pattern has been reported frequently in theliterature (Bhattacharya et al., 2004; Kaye et al., 2000;Steinmetz, 2006). Both measures show slightly lower ratesfor females than males in the youngest group, but higherrates for females in all older groups, with the differencesbecoming larger as age increases. This pattern has also beennoted before (Kaye et al., 2000; Steinmetz, 2006). Ratesare substantially higher for DIS-1 than DIS-2, showingthat the latter reflects more severe disabilities. Although itis not shown in Table 1, about 83% of persons with a self-care limitation (DIS-2) also have a physical limitation(DIS-1), but only 29% of those with a physical limitationalso have a self-care limitation.
The rates obtained from these measures are consistentwith those obtained from several other commonly useddisability measures. Age- and sex-specific rates for DIS-1and DIS-2 are roughly similar to rates measuring severedisabilities and needs for personal assistance, respectively,using data from the U.S. Census Bureau’s Survey of In-come and Program Participation (Steinmetz, 2006). Also,age-specific rates for DIS-2 are roughly similar to thosereported for users of mobility devices such as wheelchairs,scooters, walkers, canes, or crutches (Kaye et al., 2000).
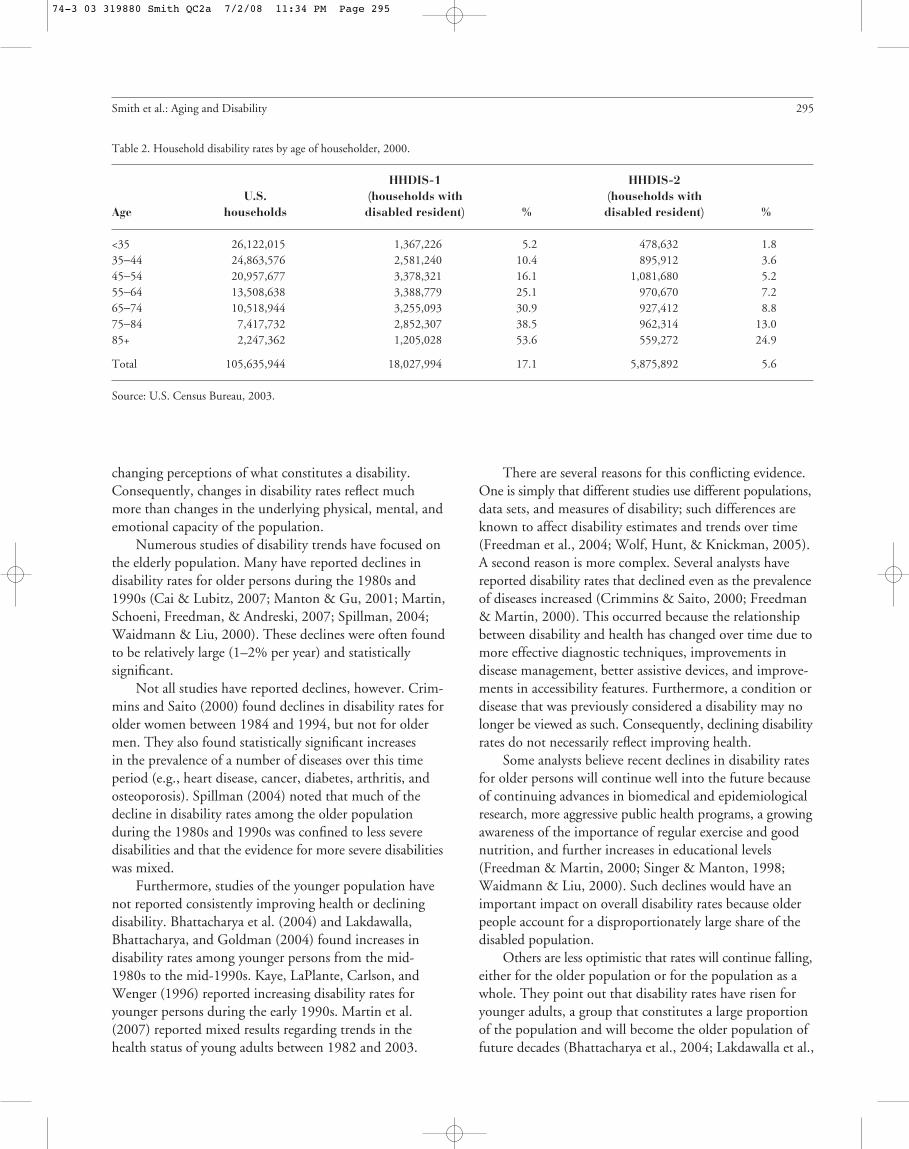
The first household measure, HHDIS-1, includeshouseholds in which any member has a long-lasting condi-tion that substantially limits one or more physical activitiessuch as walking, climbing stairs, reaching, lifting, or carrying.The second household measure, HHDIS-2, includeshouseholds in which any member has a condition lastingsix months or more that makes it difficult to dress, bathe,or get around inside the home. For each measure, wecalculate household disability rates by dividing the numberof households with at least one disabled resident by thetotal number of households for each age group. Age groupsare determined by the age of the householder, but theincidence of disability refers to anyone in the household,regardless of their age or sex. Disability rates for householdsare shown in Table 2. Because they are based solely onhousehold data, these rates do not include persons living ininstitutions.
Smith et al.: Aging and Disability 293
74-3 03 319880 Smith QC2a 7/2/08 11:34 PM Page 293
Whereas rates for DIS-1 and DIS-2 show the pro-portion of the population in each age-sex group with adisability, rates for HHDIS-1 and HHDIS-2 show theproportion of householders in each age group whosehouseholds contain at least one disabled resident. Overall,household disability rates are roughly twice as large asindividual disability rates. This is not surprising becausemost households have two or more members. Again, theserates increase with age, and rates based on the first measureare substantially higher than rates based on the second.
These disability measures are based on a widely usedmethodology and use data from a well-recognized, reliablesource. Rates based on individual data are similar to thosereported in other studies. Perhaps most important, ratesbased on household data can be directly related to pro-jections of households. We believe DIS-1 reflects theproportion of the population for whom accessibility featureswould be beneficial for residing safely and comfortably intheir homes, and DIS-2 reflects the proportion for whom
such features are essential for doing so. HHDIS-1 andHHDIS-2 reflect the corresponding proportions for house-holds. Although no measure can capture all dimensions ofdisability, we believe these measures provide a useful meansfor evaluating the links connecting aging, disability, andhousing.
Trends in Disability Over Time
Before projecting how disability rates are likely tochange in the future, we must consider how they havechanged in the past. This task is difficult because disabilityis a social construct determined by an individual’s physical,mental, and emotional condition and by a variety of socialand environmental factors (Freedman et al., 2004). Thatis, disability rates are affected not only by a person’s under-lying capacity to perform certain tasks, but also by theavailability of technological and human assistance and by
294 Journal of the American Planning Association, Summer 2008, Vol. 74, No. 3
Table 1. Individual disability rates by age and sex, 2000.
Male Female
U.S. Persons with U.S. Persons withAge population disability % population disability %
DIS-1
<35 60,949,682 1,121,581 1.8 58,747,107 1,024,801 1.735−44 22,795,548 1,244,430 5.5 23,124,437 1,303,179 5.645−54 18,432,972 1,644,908 8.9 19,172,397 1,812,554 9.555−64 11,582,552 1,814,774 15.7 12,590,270 2,039,293 16.265−74 8,245,839 1,794,954 21.8 9,989,648 2,313,961 23.275−84 4,815,313 1,507,354 31.3 7,577,579 2,760,742 36.485+ 1,306,660 618,657 47.3 3,045,737 1,852,722 60.8
Total 128,128,566 9,746,658 7.6 134,247,175 13,107,252 9.8
DIS-2
<35 60,949,682 606,523 1.0 58,747,107 486,806 0.835−44 22,795,548 371,321 1.6 23,124,437 402,428 1.745−54 18,432,972 438,913 2.4 19,172,397 519,422 2.755−64 11,582,552 424,696 3.7 12,590,270 534,536 4.265−74 8,245,839 464,774 5.6 9,989,648 672,627 6.775−84 4,815,313 544,988 11.3 7,577,579 1,154,653 15.285+ 1,306,660 322,841 24.7 3,045,737 1,147,017 37.7
Total 128,128,566 3,174,056 2.5 134,247,175 4,917,489 3.7
Note:Data are for the population aged 5 and older.
Source: U.S. Census Bureau, 2003.
74-3 03 319880 Smith QC2a 7/2/08 11:34 PM Page 294
changing perceptions of what constitutes a disability.Consequently, changes in disability rates reflect muchmore than changes in the underlying physical, mental, andemotional capacity of the population.
Numerous studies of disability trends have focused onthe elderly population. Many have reported declines indisability rates for older persons during the 1980s and1990s (Cai & Lubitz, 2007; Manton & Gu, 2001; Martin,Schoeni, Freedman, & Andreski, 2007; Spillman, 2004;Waidmann & Liu, 2000). These declines were often foundto be relatively large (1–2% per year) and statisticallysignificant.
Not all studies have reported declines, however. Crim-mins and Saito (2000) found declines in disability rates forolder women between 1984 and 1994, but not for oldermen. They also found statistically significant increasesin the prevalence of a number of diseases over this timeperiod (e.g., heart disease, cancer, diabetes, arthritis, andosteoporosis). Spillman (2004) noted that much of thedecline in disability rates among the older populationduring the 1980s and 1990s was confined to less severedisabilities and that the evidence for more severe disabilitieswas mixed.
Furthermore, studies of the younger population havenot reported consistently improving health or decliningdisability. Bhattacharya et al. (2004) and Lakdawalla,Bhattacharya, and Goldman (2004) found increases indisability rates among younger persons from the mid-1980s to the mid-1990s. Kaye, LaPlante, Carlson, andWenger (1996) reported increasing disability rates foryounger persons during the early 1990s. Martin et al.(2007) reported mixed results regarding trends in thehealth status of young adults between 1982 and 2003.
There are several reasons for this conflicting evidence.One is simply that different studies use different populations,data sets, and measures of disability; such differences areknown to affect disability estimates and trends over time(Freedman et al., 2004; Wolf, Hunt, & Knickman, 2005).A second reason is more complex. Several analysts havereported disability rates that declined even as the prevalenceof diseases increased (Crimmins & Saito, 2000; Freedman& Martin, 2000). This occurred because the relationshipbetween disability and health has changed over time due tomore effective diagnostic techniques, improvements indisease management, better assistive devices, and improve-ments in accessibility features. Furthermore, a condition ordisease that was previously considered a disability may nolonger be viewed as such. Consequently, declining disabilityrates do not necessarily reflect improving health.
Some analysts believe recent declines in disability ratesfor older persons will continue well into the future becauseof continuing advances in biomedical and epidemiologicalresearch, more aggressive public health programs, a growingawareness of the importance of regular exercise and goodnutrition, and further increases in educational levels(Freedman & Martin, 2000; Singer & Manton, 1998;Waidmann & Liu, 2000). Such declines would have animportant impact on overall disability rates because olderpeople account for a disproportionately large share of thedisabled population.
Others are less optimistic that rates will continue falling,either for the older population or for the population as awhole. They point out that disability rates have risen foryounger adults, a group that constitutes a large proportionof the population and will become the older population offuture decades (Bhattacharya et al., 2004; Lakdawalla et al.,
Smith et al.: Aging and Disability 295
Table 2. Household disability rates by age of householder, 2000.
HHDIS-1 HHDIS-2U.S. (households with (households with
Age households disabled resident) % disabled resident) %
<35 26,122,015 1,367,226 5.2 478,632 1.835−44 24,863,576 2,581,240 10.4 895,912 3.645−54 20,957,677 3,378,321 16.1 1,081,680 5.255−64 13,508,638 3,388,779 25.1 970,670 7.265−74 10,518,944 3,255,093 30.9 927,412 8.875−84 7,417,732 2,852,307 38.5 962,314 13.085+ 2,247,362 1,205,028 53.6 559,272 24.9
Total 105,635,944 18,027,994 17.1 5,875,892 5.6
Source: U.S. Census Bureau, 2003.
74-3 03 319880 Smith QC2a 7/2/08 11:34 PM Page 295
2004). They note that the prevalence of obesity, which isassociated with elevated disability rates, has increased sub-stantially among both older and younger adults (Arterburn,Crane, & Sullivan, 2004; Reynolds, Saito, & Crimmins,2005). Furthermore, although rapid educational improve-ment contributed significantly to declining disability ratesover the last several decades, the pace of that improvementis expected to slow in future decades (Freedman & Martin,1999). Also, the largest racial and ethnic minority groupshave relatively high disability rates (Schoeni, Martin,Andreski, & Freedman, 2005), and these groups are pro-jected to grow more rapidly than the rest of the population(U.S. Census Bureau, 2004). Consequently, a number ofanalysts have questioned the likelihood that future disabilityrates will continue to fall (Bhattacharya et al., 2004; Spill-man, 2004; Sturm, Ringel, & Andreyeva, 2004; Wang,Gu, & Yi, 2007; Wolf et al. 2005), and some have projectedthat rates will eventually rise (Lakdawalla, et al., 2003).
One can make plausible arguments for projecting eitherincreasing or declining disability rates. We believe that whenthere is substantial uncertainty regarding the direction offuture trends it is generally advisable to hold rates constantwhen making projections (Smith, Tayman, & Swanson,2001). Consequently, we base our medium projections onrates that remain constant at 2000 levels. We also evaluateprojections based on rates that rise or fall by 5% per decadebetween 2000 and 2050; we refer to these as our high andlow scenarios, respectively. Given the trends in disabilityrates observed over the last several decades, we believe thesescenarios provide a reasonable range of projections.
Projections
Our first objective is to project the number of disabledpersons and the number of households with at least onedisabled resident. We do this by applying the disabilityrates described above to a set of population and householdprojections. This is a standard and widely used approachfor making projections of demographic and socioeconomiccharacteristics (Siegel, 2002).
We use population and household projections fromthe ProFamy projection model. We chose these projectionsbecause they incorporate recent population trends, extendthrough 2050, and provide data on households as well aspopulation. In contrast, the most recent household projec-tions from the U.S. Census Bureau were published in themid-1990s and extended only through 2010. We believethe ProFamy projections provide a solid foundation for theempirical analysis. (See the Appendix for a description ofthe ProFamy model.)
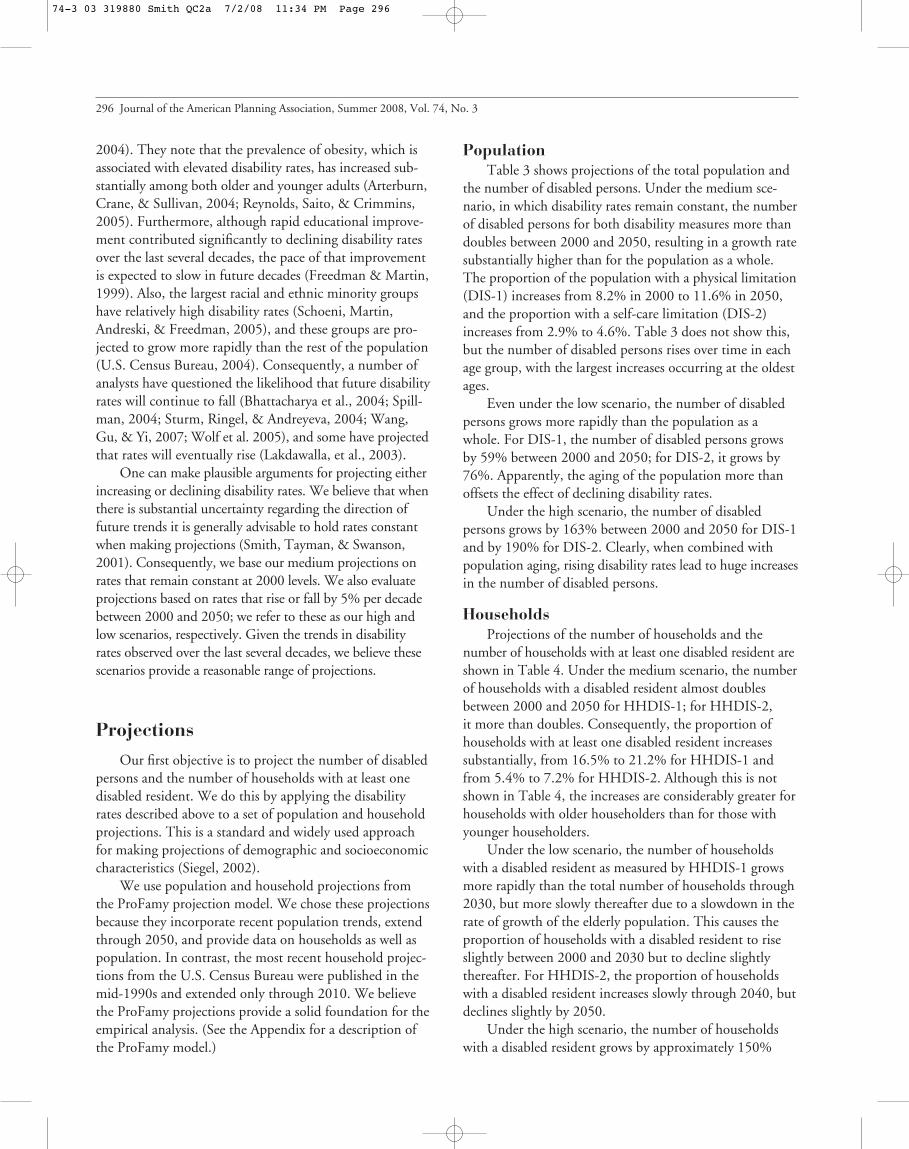
PopulationTable 3 shows projections of the total population and
the number of disabled persons. Under the medium sce-nario, in which disability rates remain constant, the numberof disabled persons for both disability measures more thandoubles between 2000 and 2050, resulting in a growth ratesubstantially higher than for the population as a whole.The proportion of the population with a physical limitation(DIS-1) increases from 8.2% in 2000 to 11.6% in 2050,and the proportion with a self-care limitation (DIS-2)increases from 2.9% to 4.6%. Table 3 does not show this,but the number of disabled persons rises over time in eachage group, with the largest increases occurring at the oldestages.
Even under the low scenario, the number of disabledpersons grows more rapidly than the population as awhole. For DIS-1, the number of disabled persons growsby 59% between 2000 and 2050; for DIS-2, it grows by76%. Apparently, the aging of the population more thanoffsets the effect of declining disability rates.
Under the high scenario, the number of disabledpersons grows by 163% between 2000 and 2050 for DIS-1and by 190% for DIS-2. Clearly, when combined withpopulation aging, rising disability rates lead to huge increasesin the number of disabled persons.
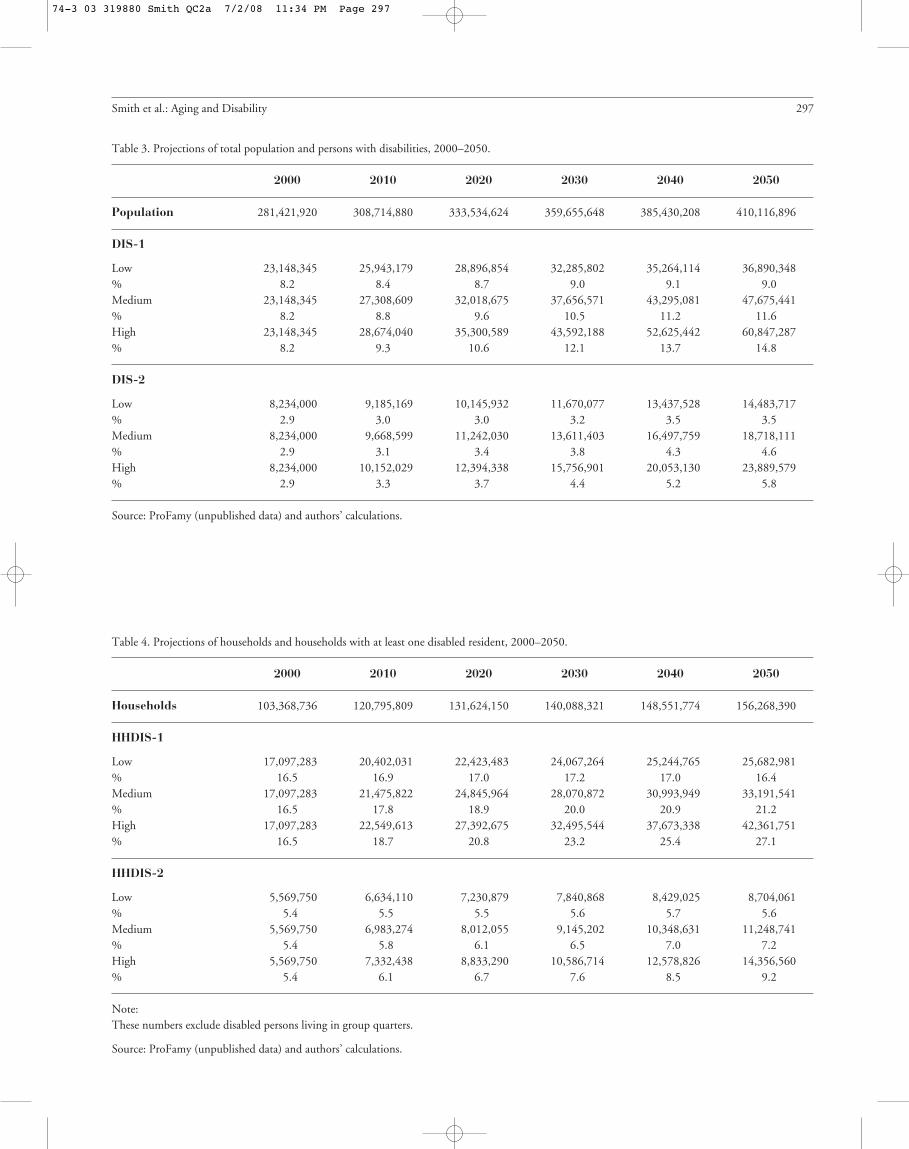
HouseholdsProjections of the number of households and the
number of households with at least one disabled resident areshown in Table 4. Under the medium scenario, the numberof households with a disabled resident almost doublesbetween 2000 and 2050 for HHDIS-1; for HHDIS-2,it more than doubles. Consequently, the proportion ofhouseholds with at least one disabled resident increasessubstantially, from 16.5% to 21.2% for HHDIS-1 andfrom 5.4% to 7.2% for HHDIS-2. Although this is notshown in Table 4, the increases are considerably greater forhouseholds with older householders than for those withyounger householders.
Under the low scenario, the number of householdswith a disabled resident as measured by HHDIS-1 growsmore rapidly than the total number of households through2030, but more slowly thereafter due to a slowdown in therate of growth of the elderly population. This causes theproportion of households with a disabled resident to riseslightly between 2000 and 2030 but to decline slightlythereafter. For HHDIS-2, the proportion of householdswith a disabled resident increases slowly through 2040, butdeclines slightly by 2050.
Under the high scenario, the number of householdswith a disabled resident grows by approximately 150%
296 Journal of the American Planning Association, Summer 2008, Vol. 74, No. 3
74-3 03 319880 Smith QC2a 7/2/08 11:34 PM Page 296
Smith et al.: Aging and Disability 297
Table 3. Projections of total population and persons with disabilities, 2000–2050.
2000 2010 2020 2030 2040 2050
Population 281,421,920 308,714,880 333,534,624 359,655,648 385,430,208 410,116,896
DIS-1
Low 23,148,345 25,943,179 28,896,854 32,285,802 35,264,114 36,890,348% 8.2 8.4 8.7 9.0 9.1 9.0Medium 23,148,345 27,308,609 32,018,675 37,656,571 43,295,081 47,675,441% 8.2 8.8 9.6 10.5 11.2 11.6High 23,148,345 28,674,040 35,300,589 43,592,188 52,625,442 60,847,287% 8.2 9.3 10.6 12.1 13.7 14.8
DIS-2
Low 8,234,000 9,185,169 10,145,932 11,670,077 13,437,528 14,483,717% 2.9 3.0 3.0 3.2 3.5 3.5Medium 8,234,000 9,668,599 11,242,030 13,611,403 16,497,759 18,718,111% 2.9 3.1 3.4 3.8 4.3 4.6High 8,234,000 10,152,029 12,394,338 15,756,901 20,053,130 23,889,579% 2.9 3.3 3.7 4.4 5.2 5.8
Source: ProFamy (unpublished data) and authors’ calculations.
Table 4. Projections of households and households with at least one disabled resident, 2000–2050.
2000 2010 2020 2030 2040 2050
Households 103,368,736 120,795,809 131,624,150 140,088,321 148,551,774 156,268,390
HHDIS-1
Low 17,097,283 20,402,031 22,423,483 24,067,264 25,244,765 25,682,981% 16.5 16.9 17.0 17.2 17.0 16.4Medium 17,097,283 21,475,822 24,845,964 28,070,872 30,993,949 33,191,541% 16.5 17.8 18.9 20.0 20.9 21.2High 17,097,283 22,549,613 27,392,675 32,495,544 37,673,338 42,361,751% 16.5 18.7 20.8 23.2 25.4 27.1
HHDIS-2
Low 5,569,750 6,634,110 7,230,879 7,840,868 8,429,025 8,704,061% 5.4 5.5 5.5 5.6 5.7 5.6Medium 5,569,750 6,983,274 8,012,055 9,145,202 10,348,631 11,248,741% 5.4 5.8 6.1 6.5 7.0 7.2High 5,569,750 7,332,438 8,833,290 10,586,714 12,578,826 14,356,560% 5.4 6.1 6.7 7.6 8.5 9.2
Note:These numbers exclude disabled persons living in group quarters.
Source: ProFamy (unpublished data) and authors’ calculations.
74-3 03 319880 Smith QC2a 7/2/08 11:34 PM Page 297
between 2000 and 2050 for both HHDIS-1 and HHDIS-2. As a result, the proportion of households with a disabledresident rises from 16.5% to 27.1% for HHDIS-1 andfrom 5.4% to 9.2% for HHDIS-2.
Estimated Probability That a UnitWill House a Disabled Resident
Our second objective is to estimate the probability thata newly built single-family detached unit will house at leastone disabled resident during its expected lifetime. Theseestimates are intended to account for the likelihood thatmost housing units will be occupied by a number of dif-ferent households over time, each with a different set ofcharacteristics. For the sake of simplicity, we assume thatall newly built single-family detached units have an equalprobability of being occupied by a household with a dis-abled resident. We discuss the implications of relaxing thisassumption later in this section. Although a small percent-age of units are vacant or used seasonally at any given time,we believe our estimates are representative of all newlybuilt single-family detached units. In 2005, 90% of single-family detached units were occupied, 7% were vacant, and3% were used seasonally (U.S. Census Bureau, 2006).
We focus on single-family detached units for tworeasons. First, they constitute the majority of housing unitsin the United States. In 2005, 63% of households and68% of householders aged 65 and older lived in single-family detached units (U.S. Census Bureau, 2006). Second,multiunit structures are already subject to a number offederal, state, and local accessibility requirements; thus,future policy changes are likely to be directed towardsingle-family units. Similar analyses could be done forother types of housing units.
In order to estimate the probability that a newly builtsingle-family detached unit will house at least one disabledresident during its expected lifetime, we must (a) projectthe proportion of households with at least one disabledresident for people living in single-family detached units, (b)estimate the average length of time households reside insuch units, and (c) estimate the average lifespan of such units.
For the projected proportion of households living insingle-family detached units with at least one disabledresident, we use the projected proportion of all householdswith at least one disabled resident (shown in Table 4). Webelieve this provides a reasonable proxy because disabilityrates for residents of single-family detached units are verysimilar to disability rates for all households (see Table 5).
We estimate the average length of residence in single-family detached units using data shown in Table 6. We
note that length of residence increases dramatically withage, rising from 4.3 years for householders under age 35 to30.2 for householders aged 85 or older. The average lengthof residence for all householders in 2000 was 13.7 years.
The lifespan of a housing unit (i.e., the period overwhich it provides dwelling services) is determined primarilyby the quality of its design and construction, its exposureto hazards, and the extent of maintenance and renovationit receives. Theoretically, the lifespan could be extendedalmost indefinitely if sufficient resources were devoted tothat end. In reality, that is seldom the case. Estimates ofthe average lifespan of single-family units in the UnitedStates generally range between 75 and 100 years (Baer,1990). Estimates for Europe are substantially higher(Bradley & Kohler, 2007; Johnstone, 2001). We use arange of 75 to 100 years and an average of 87.5 in ourcalculations.
If length of residence and disability rates were unrelatedto each other, we could estimate the probability that anewly built single-family detached unit will house at leastone disabled resident during its lifetime as:
PROB = 1 − [(1−r)x] (1)
where r is the proportion of households with at leastone disabled resident and x is the average number ofhouseholds occupying a single-family detached unit overits expected lifetime (a measure of housing turnover).
We can illustrate the probability defined in Equation 1using the medium projection scenario for HHDIS-1. Theproportion of households with at least one disabled residentis 20.9% in 2040, which is approximately the midpoint inthe average lifespan of a unit built in 2000 (see Table 4). Ifwe divide the average lifespan (87.5 years) by the averagelength of residence (13.7 years), we obtain an estimate of6.4 households occupying a single-family detached unitduring its expected lifetime. The probability that a single-family detached unit built in 2000 will house at least onedisabled resident can then be estimated as:
PROB = 1 − [(1−.209)6.4] = 1 − .223 = .777 or 77.7% (2)
This estimate will not be valid, however, if disabilityrates and length of residence are related to each other. Asshown in Tables 5 and 6, both disability rates and lengthof residence are strongly related to the age of the house-holder. Thus, Equation 2 overstates the probability that asingle-family detached unit will house at least one disabledresident because it does not account for the fact that housing
298 Journal of the American Planning Association, Summer 2008, Vol. 74, No. 3
74-3 03 319880 Smith QC2a 7/2/08 11:34 PM Page 298

turnover is lowest in the age groups with the highestdisability rates.
There is no perfect solution to this problem, but wecan improve the estimate substantially by calculating anadjusted length of residence for each projection year, withthe length of residence for each age group weighted by theage distribution of households with at least one disabledresident (using an average of the distributions for HHDIS-1 and HHDIS-2). This adjustment accounts for the factthat the age groups with the highest disability rates alsohave the lowest rates of housing turnover.
The results of the weighting process are shown inTable 7. The weighted average length of residence for2000 is 17.6 years, which is considerably longer than theunweighted average of 13.7. Furthermore, the weightedaverage increases over time, reaching 21.2 years in 2050.The adjusted estimates are thus found to be larger than theunadjusted estimates and to increase over time; both ofthese results are consistent with the aging and disabilitytrends noted previously.
We can now develop a more realistic estimate of theprobability that a newly built single-family detached unit
will house at least one disabled resident during its expectedlifetime. The estimates shown in Table 7 imply that anaverage of four households will occupy a newly built single-family detached unit over roughly an 80-year period.Using 2000 as the construction date for newly built units,we take the proportion of households with at least onedisabled resident from the medium projections for 2010,2030, 2050, and, by linear extrapolation, 2070; these yearsare approximately the midpoints of the four time periodsin the projection horizon. We then estimate the probabilitiesfor our two disability measures as:
PROB (HHDIS-1) = 1 − [(1−.178)(1−.200)(1−.212)(1−.224)] = 1−.402 = .598 or 59.8% (3)
PROB (HHDIS-2) = 1 − [(1−.058)(1−.065)(1−.072)(1−.079)] = 1−.753 = .247 or 24.7% (4)
Smith et al.: Aging and Disability 299
Table 5. Household disability rates by age of householder and housing type, 2000.
All housing Single-family Single-family Mobiletypes detached attached Multifamily homes
Age % % % % %
HHDIS-1
<35 5.2 5.4 5.3 4.4 8.435−44 10.4 9.3 10.2 11.4 17.645−54 16.1 14.6 14.6 18.4 28.155−64 25.1 23.3 21.0 28.4 37.565−74 30.9 29.6 26.8 33.8 38.975−84 38.5 37.6 34.3 40.2 43.285+ 53.6 53.4 49.0 54.3 54.9
Total 17.1 16.9 15.0 16.0 24.0
HHDIS-2
<35 1.8 1.9 2.1 1.6 2.735−44 3.6 3.2 3.9 4.1 5.645−54 5.2 4.6 5.1 6.1 8.455−64 7.2 6.6 6.3 8.5 10.065−74 8.8 8.4 7.8 10.0 10.175−84 13.0 12.8 11.4 13.8 13.385+ 24.9 25.2 22.1 25.0 23.1
Total 5.6 5.5 5.1 5.5 7.1
Source: U.S. Census Bureau, 2003.
74-3 03 319880 Smith QC2a 7/2/08 11:34 PM Page 299

That is, we estimate there is a 60% probability that asingle-family detached unit built in 2000 will house at leastone disabled resident using our first disability measure(HHDIS-1) and a 25% probability it will do so using oursecond (HHDIS-2). Following the same procedure for thelow and high projections, we estimate a range of probabilitiesfrom 51% to 69% for HHDIS-1 and from 20% to 30%for HHDIS-2. Clearly, the probability of housing a disabledresident is substantially greater when measured over thelifetime of a housing unit than when measured at a singlepoint in time.
Again, we note that these estimates are based on theassumption that all single-family detached units have anequal probability of being occupied by a household with adisabled resident. They are intended to show the likelihoodthat a randomly selected single-family detached unit willhouse at least one disabled resident during its expectedlifetime, given our assumptions regarding disability ratesand occupancy characteristics. In reality, probabilities willnot be the same for all units. We expect units with features
that improve their accessibility to have a higher probabilityof housing a disabled resident than is shown here, andunits lacking those features to have a lower probability.
Extension: AccommodatingDisabled Visitors
Many people would like to accommodate disabledfriends and relatives who come to visit them and manypeople with disabilities would like to participate in socialactivities in other people’s homes. We can estimate theprobability that a newly built single-family detached unitwill have no disabled residents but will have at least onedisabled visitor during its expected lifetime by making twoadditional assumptions. First, we assume that members ofall age groups have an equal probability of having disabledvisitors. Given the intergenerational nature of visits, webelieve this is a reasonable assumption: Although olderpeople have substantially higher disability rates thanyounger people, younger people often have older visitors(e.g., parents visiting adult children). Consequently, we usethe average length of residence in single-family detachedunits for all persons (13.7 years) rather than weighting itaccording to the distribution of persons with disabilities.Dividing the average lifespan of a unit (87.5 years) by 13.7implies that an average of 6.4 households will occupy asingle-family detached unit over its expected lifetime.
Second, we assume that one disabled person from eachhousehold with a disabled resident will visit one householdwith no disabled residents during each 13.7 year occupancyperiod, and that no household will receive more than onedisabled visitor during any period; this makes the propor-tion of households with a disabled visitor the same as theproportion with a disabled resident. To the extent thatdisabled people visit more than one household per period,the estimates would be higher than is shown here; to theextent that households with no disabled residents receivemore than one disabled visitor per period, the estimateswould be lower.
Using the medium projection of the proportion ofhouseholds with a disabled resident in 2040 (approximatelythe midpoint in the average lifespan of a unit built in2000), we estimate the probability that a newly builtsingle-family detached unit will have at least one disabledvisitor during its lifetime as:
PROB (HHDIS-1) = 1 − [(1−.209)6.4] = 1 − .223 = .777 or 77.7% (5)
300 Journal of the American Planning Association, Summer 2008, Vol. 74, No. 3
Table 6. Average length of residence by age of householder, single-family detached units, 2000.
Average length of residenceAge (years)
<35 4.335−44 8.045−54 12.855−64 19.065−74 24.775−84 28.085+ 30.2
Total 13.7
Source: U.S. Census Bureau, 2003.
Table 7. Average length of residence for single-family detached units,weighted by the age distribution of households with a disabled resident.
Average length of residenceYear (years)
2000 17.62010 18.42020 19.12030 20.12040 20.82050 21.2
74-3 03 319880 Smith QC2a 7/2/08 11:34 PM Page 300
PROB (HHDIS-2) = 1 − [(1−.070)6.4] = 1 − .628 = .372 or 37.2% (6)
As these estimates show, the proportion of units withat least one disabled visitor is substantially higher than theproportion with at least one disabled resident.
We can combine estimates of the probability of havingno disabled residents from Equations 3 and 4 with estimatesof the probability of having no disabled visitors fromEquations 5 and 6 to construct estimates of the probabilitythat a newly built single-family detached unit will have nodisabled residents or disabled visitors during its lifetime.Subtracting the combined estimates from 1 gives theprobability that a unit will have at least one disabled residentor disabled visitor:
PROB (HHDIS-1) = 1 − [(.402)(.223)] = 1 − .090 = .910 or 91.0% (7)
PROB (HHDIS-2) = 1 − [(.753)(.628)] = 1 − .473 = .527 or 52.7% (8)
Using the first measure (HHDIS-1), there is a 91%probability that a newly built single-family detached unitwill have at least one disabled resident or visitor during itsexpected lifetime. Even when disability is defined morerestrictively (HHDIS-2), the probability is 53%.
These estimates are speculative, of course, and futureresearch will help us refine our assumptions and techniques.On the average, how many friends and relatives does adisabled person have? How many might they visit if acces-sibility were not a problem? Should residents and visitorsbe weighted equally in calculating probabilities? If not,how should they be weighted? Some of these questionscould be answered objectively by collecting the appropriatedata, but others can be answered only subjectively. In spiteof their shortcomings, the estimates shown here illustratethe large potential need for accessibility features when weconsider both disabled visitors and disabled residents.
Discussion
Evaluating Estimates and ProjectionsAlthough several studies have developed projections of
the disabled population (Singer & Manton, 1998; Waid-mann & Liu, 2000; Wang et al., 2007), to our knowledgethis is the first study to project the number of householdswith at least one disabled resident and the first to estimatethe probability that a newly built housing unit will have atleast one disabled resident during its expected lifetime.We believe such estimates and projections are essential foranalyzing the links connecting aging, disability, and housing.
Under our medium assumptions, we project that in2050 21% of U.S. households will have at least one residentwith a physical limitation (our first disability measure) and7% will have at least one resident with a self-care limitation(our second disability measure). We estimate that there isa 60% probability that a single-family detached unit builtin 2000 will house at least one disabled resident duringits expected lifetime using our first measure and a 25%probability using our second. When disabled visitors areaccounted for, the probabilities rise to 91% and 53%,respectively. Given the desire of most older people toremain in their current homes for as long as possible, thesenumbers point to a large and growing need for housingunits with accessibility features.
Although these numbers are large, they most likelyunderstate the need for accessible housing because wemade several conservative assumptions: 1) We calculateddisability rates using disability status at a single point intime, thereby excluding the impact of persons who werepreviously disabled but had since recovered, and of personswho might become disabled in the future; 2) We calcu-lated probabilities using household disability rates, therebyexcluding the impact of nursing home residents who tendto have very high disability rates, and some of whom wouldhave remained in their homes if adequate accessibilityfeatures had been present; 3) We used the lower rather thanthe upper end of the average lifespan range for single-familydetached housing units, which resulted in four rather thanfive households occupying a unit over its expected lifetime;and 4) We assumed that each disabled person would visitthe home of only one nondisabled person during each timeperiod. Applying less conservative assumptions would haveraised the estimates and projections shown here.
Changing the assumptions regarding disability rates,housing turnover, occupancy characteristics, populationgrowth, and the lifespan of housing units would alter ourestimates and projections, of course. Regardless of thespecific assumptions used, however, two facts are beyond
Smith et al.: Aging and Disability 301
74-3 03 319880 Smith QC2a 7/2/08 11:34 PM Page 301
dispute: 1) The proportion of households with at least onedisabled resident is substantially higher than the proportionof persons with disabilities, and 2) Most housing units areoccupied by several households over their lifetimes. Thus,analyses that are based on households and that considerhousing turnover yield substantially larger, and in our viewmore realistic, estimates and projections of the prevalenceof disability than analyses focusing solely on individuals.
Cost of Accessible HousingThe need for accessibility features will be transformed
into effective demand only if the costs of those features areaffordable. The cost of accessible housing depends on thespecific features included and whether those features areincorporated in the construction of new units or added asmodifications to existing units. When incorporated in theconstruction of new units, key accessibility features typi-cally cost very little. If the unit is designed with at least ahalf bath on the entry level, adding a zero-step entranceand wide interior doorways usually costs less than $100for homes built on a concrete slab and $300 to $600 forhomes built over a basement (Concrete Change, 2007b).Additional features, such as universally designed kitchensand curbless showers, generally raise the cost of a new unitby a few thousand dollars. Costs are considerably higherwhen accessibility features are added to existing homes.Although installing a handrail may cost less than $100,major structural renovations often cost $50,000 or more(Duncan, 1998; Pynoos & Nishita, 2003). Features thatare very inexpensive when included in new units can bemuch more expensive when added to existing units.
When evaluating costs, it is important to consider notonly the cost of incorporating accessibility features in newunits or as modifications to existing units, but also the costof not doing so. As noted previously, disabled people livingin units without adequate features face a greater risk ofinjury and are more likely to suffer from social isolationand loneliness than those living in units with adequateaccessibility features. The lack of such features places aburden on caregivers and causes some people to enternursing homes earlier than they would have otherwise,imposing high emotional and financial costs on the indi-vidual and, in many instances, high economic costs onsociety as a whole.
The cost of nursing home care is particularly importantin an aging society. Cohen, Weinrobe, Miller, and Ingoldsby(2005) noted that, at current rates, 40−50% of peoplereaching age 65 will live in nursing homes at some pointduring their lifetimes. Total spending on nursing homecare was $122 billion in 2005, with Medicaid accountingfor 44% of those expenditures and Medicare for 16%
(U.S. Department of Health and Human Services, 2007).The average annual cost of nursing home care has beenestimated at $74,000 for a private room and $64,000 for asemiprivate room (MetLife, 2005). Numerous studies haveconcluded that costs of nursing home care are substantiallyhigher than the costs of home care even when the value ofassistive home care services is included (Chappell, Havens,Hollander, Miller, & McWilliam, 2004; LaPlante, Kaye,& Harrington, 2007; Redfoot, 1993). Helping peopleavoid or delay the need for nursing home care may be animportant benefit of raising the stock of accessible housing.
Further ResearchThis article presents a new perspective on aging,
disability, and housing, but many issues require furtherresearch. Our analysis focused on the nation as a whole;similar analyses could be done for specific regions, states,or metropolitan areas. Our estimate of the probability thata newly built home will house a disabled resident focusedon single-family detached units; estimates could also bemade for single-family attached units, multifamily units,and other types of housing. Our study touched only brieflyon the costs of accessibility features. More detailed analysesare needed, particularly as they relate to modifications toexisting units. Perhaps most important, careful cost-benefitanalyses are required before we can determine the extent towhich investing in accessible housing might provide a cost-effective alternative to nursing home care.
Many other questions remain to be answered as well.What are the primary determinants of disability rates andhow are they likely to change over time? What measures ofdisability are most closely related to the need for accessibilityfeatures? Are there better approaches than those used hereto estimating the lifetime probability that a housing unitwill be occupied by a disabled resident? How does theinclusion of disabled visitors affect this probability? Whichaccessibility features are most essential to people with dis-abilities? How much are new homebuyers and current home-owners willing to pay for accessibility features? What has beenthe experience of people who have asked homebuilders toincorporate accessibility features in the construction ofnew houses? To what extent does the lack of accessibilitycontribute to higher rates of institutionalization? Furtherresearch on these issues will have important implicationsfor planning and the formation of public policy.
Conclusions and Recommendations
Population growth and aging will substantially raisethe number of U.S. households with at least one disabled
302 Journal of the American Planning Association, Summer 2008, Vol. 74, No. 3
74-3 03 319880 Smith QC2a 7/2/08 11:34 PM Page 302
resident over the next several decades, spurring the needfor homes with accessibility features. People’s desires to agein place and to accommodate disabled visitors will add tothat need. Housing turnover will raise the probability thatany given unit will house a person with disabilities overtime. Viewing the issue from the perspective of householdsand housing units rather than individuals, we believe thereis a large and growing need for homes with accessibilityfeatures.
Several studies have concluded that many people valueaccessibility features and are willing to pay for them (Alonso,2002; Bayer & Harper, 2000; Kochera, 2002). Manyhomebuilders, however, have reported that relatively fewhomebuyers seem interested in those features (Lemmon,2007), and some researchers have found that people withmobility impairments often seem reluctant to make modifi-cations to their current homes (Gilderbloom & Markham,1996). Given the millions of people with mobility impair-ments and the strong desire of most people to live inde-pendently for as long as possible, how can we explain theseseemingly contradictory results? We believe there areseveral possible explanations.
Regarding the reported lack of interest in accessibilityfeatures among homebuyers, we note that disability ratesincrease with age, whereas the rate at which people movefrom one house to another declines with age; consequently,the people with the greatest immediate need for accessibilityfeatures are the ones least likely to buy a home. It is alsolikely that many homebuyers who are not disabled areunaware of the benefits of accessibility features, tend toover-estimate the cost of those features, or do not considerthe possibility that they themselves might become disabledsome day. The reluctance of people with mobility impair-ments to make modifications to their current homes maybe due to their lack of knowledge, organizational skills, orfinancial resources, or to their determination to overcomebarriers rather than alter their physical environment. Inaddition, some may be hesitant to add visible signs ofdisability such as a ramp because of negative societal mes-sages regarding disabilities. People in both groups may beconcerned about the aesthetics of an accessible home,believing that accessibility features make a house lookunattractive or reduce its resale value. Dealing with theseconcerns will require a thoughtful and creative responsefrom homebuilders and planners.
The vast majority of housing in the United Statesand many other countries is inaccessible to persons withdisabilities. We believe the gap between the supply ofaccessible housing and the need for such housing presentsa business opportunity to homebuilders. We urge them topursue this opportunity by offering housing designs that
are both accessible and attractive and to explore new waysto market homes based on those designs. There is a sub-stantial market for the three key visitability features of azero-step entrance, a bathroom or half bath on the entrylevel, and interior doors with at least 32 inches of clear-ance, and a smaller but growing market for upgrades suchas curbless showers and universally designed cabinetry.We believe both markets can be profitably exploited.
Emphasizing the benefits of accessibility features forhomebuyers who are not disabled may be a particularlysavvy marketing strategy. Many are unaware of the ad-vantages of features such as zero-step entrances and widerdoorways for common tasks such as moving furniture,pushing baby strollers, storing bicycles, and carrying groceriesin from the car. Others do not consider the likelihood ofhaving disabled visitors or of sustaining a disabling condi-tion themselves. Making homebuyers aware of the poten-tial benefits of accessibility features will further expand themarket for those features.
Koebel (2008) argued that planners should influencehomebuilders to adopt innovative practices that makehousing and communities more sustainable, durable, andaffordable. We believe planners should influence home-builders to make housing more accessible as well. We alsobelieve planners should encourage social service agencies toinform elderly and/or disabled people about programs thatcould help them make modifications to their currenthomes. Such programs can improve the quality of life ofdisabled persons and raise the overall stock of accessiblehousing.
Myers and Ryu (2008) noted that population aging islikely to lead to a slowdown in housing sales and a declinein housing prices in many places because older people arenet sellers rather than net buyers of homes. They suggestedthat planners should attempt to reduce the rate at whicholder people sell their homes by fostering communityamenities such as senior activity centers, parks that are easyto access, dial-a-ride transportation, and mobile mealsservices. Our study suggests that programs that promotethe construction of housing with accessibility features,and the addition of those features as modifications to thecurrent housing stock, could also play a role in reducingthe rate at which older people sell their homes.
Any discussion of accessibility policy must considerwhether standards should be mandatory or voluntary.Clearly, there are trade-offs between developing newbuilding standards and protecting the rights of propertyowners, but many safety, environmental, and aestheticstandards have already been implemented, establishing theprecedent that housing construction is not solely a privatematter. Furthermore, to the extent that accessibility features
Smith et al.: Aging and Disability 303
74-3 03 319880 Smith QC2a 7/2/08 11:34 PM Page 303
help people avoid or delay the need for nursing home care,the costs of which are frequently borne by the public as awhole, an economic argument can be made for requiringthat those features be incorporated in the construction ofnew units. We believe housing accessibility is not only animportant personal and civil rights issue, but a critical fiscalissue as well. We urge planners and policymakers to explorethe fiscal implications of increasing the stock of accessiblehousing.
With respect to visitability, mandatory requirementsappear to be more successful than voluntary programs inraising the stock of accessible housing. An estimated 33mandatory and 24 voluntary visitability programs havebeen established in the United States. To date, more than30,000 visitable homes have been built in places withmandatory programs; in contrast, apart from age-restrictedcommunities, fewer than 1,300 have been built in placeswith voluntary programs (Maisel et al., in press). Althoughreasonable people can disagree on this point, we believesuccessful visitability programs will generally require sometype of legal requirement. Planners can look for models inthe states and local areas mentioned earlier in this articlethat have already established such requirements. In manyinstances, requirements can be tied to existing programswithout the need to pass new laws or offer new incentives.For example, housing-related grants and other financialbenefits could be awarded based on the degree of compliancewith accessibility standards.
The needs of an aging population, combined withconcerns about the civil rights of people with disabilitiesand the high public cost of nursing home care, make thelack of accessible housing a critical issue for planners andpolicy makers. Although planners have traditionally focusedtheir efforts on the built and natural environment outsidethe home, the time has come for them to look more closelyat the environment inside the home as well. Efforts toimprove a community’s quality of life by promoting ameni-ties such as attractive public spaces, walkable destinations,and proximity to public transportation are highly desirable,but will be incomplete without efforts to improve housingaccessibility. Given the slow pace at which changes in thehousing stock occur, there is urgency to act now. Increasingthe supply of accessible housing will benefit not only cur-rently disabled people, but also their families and friends,those who become disabled in the future, and society asa whole.
AcknowledgmentsThe ProFamy population and household projections used in this articlewere funded by an NIH/NIA SBIR research grant. We thank ZhenglianWang, Zeng Yi, and Ken Land for providing these projections and
David Brown, H. Stephen Kaye, Ramon Littell, Laurie Ringaert, RichRomano, Katherine Seelman, Terry Sincich, Marc Smith, EdwardSteinfeld, the editors, and four anonymous reviewers for many helpfulcomments and suggestions.
ReferencesAlonso, F. (2002). The benefits of building barrier-free: A contingentvaluation of accessibility as an attribute of housing. European Journal ofHousing Policy, 2 (1), 25–44.Arterburn, D. E., Crane, P. K., & Sullivan, S. D. (2004). The comingepidemic of obesity in elderly Americans. Journal of the AmericanGeriatrics Society, 52 (11), 1907–1912.Baer, W. C. (1990). Aging of the housing stock and components ofinventory change. In D. Myers (Ed.), Housing demography (pp. 249–273). Madison: University of Wisconsin Press.Bayer, A.-H., & Harper, L. (2000). Fixing to stay: A national surveyof housing and home modification issues. Washington, DC: AARPKnowledge Management.Bhattacharya, J., Cutler, D. M., Goldman, D. P., Hurd, M. D., Joyce,G. F., Lakdawalla, D. N., et al. (2004). Disability forecasts and futureMedicare costs. NBER Frontiers in Health Policy Research, 7 (1), 75–94.Bradley, P. E., & Kohler, N. (2007). Methodology for the survivalanalysis of urban building stocks. Building Research & Information,35 (5), 529–542.Cai, L., & Lubitz, J. (2007). Was there compression of disability forolder Americans from 1992 to 2003? Demography, 44 (3), 479–495.Calsyn, R. J., Winter, J. P., & Yonker, R. D. (2001). Should disabilityitems in the census be used for planning services for elders? TheGerontologist, 41 (5), 583–588.Center for Universal Design. (1997). The principles of universal design.Raleigh: North Carolina State University. Retrieved January 17, 2008,from http://www.design.ncsu.edu./cud/about_ud/udprinciplestext.htmChappell, N. L., Havens, B., Hollander, M. J., Miller, J. A., &McWilliam, C. (2004). Comparative costs of home care and residentialcare. The Gerontologist, 44 (3), 389–400.Close, J., Ellis, M., Hooper, R., Glucksman, E., Jackson, S., & Swift, C.(1999). Prevention of falls in the elderly trial (PROFET): A randomizedcontrolled trial. The Lancet, 353 (1), 93–97.Cohen, M. A., Weinrobe, M., Miller, J., & Ingoldsby, A. (2005).Becoming disabled after 65: The expected lifetime costs of independentliving. Washington, DC: AARP Public Policy Institute.Concrete Change. (2007a). Visitability defined. Retrieved September 15,2007, from http://www.concretechange.org/Definition_of_Visitability.htm.Concrete Change. (2007b). Myths and facts. Retrieved September 15,2007, from http://www.concretechange.org/myth.htm.Crimmins, E. M. (2004). Trends in the health of the elderly. AnnualReview of Public Health, 25 (1), 79–98. Retrieved May 29, 2008, fromhttp://www.demographic-research.org/Volumes/Vol3/9/3-9.pdfCrimmins, E. M., & Saito, Y. (2000). Change in the prevalence ofdiseases among older Americans: 1984–1994. Demographic Research, 3 (9).Duncan, R. (1998). Funding, financing and other resources for homemodifications. Technology and Disability, 8 (1), 37–50.Freedman, V. A., Crimmins, E., Schoeni, R. F., Spillman, B. C.,Aykan, H., Kramarow, E., et al. (2004). Resolving inconsistencies intrends in old-age disability: Report from a technical working group.Demography, 41 (3), 417–441.Freedman, V. A., & Martin, L. G. (1999). The role of education inexplaining and forecasting trends in functional limitations among olderAmericans. Demography, 36 (4), 461–473.
304 Journal of the American Planning Association, Summer 2008, Vol. 74, No. 3
74-3 03 319880 Smith QC2a 7/2/08 11:34 PM Page 304
Freedman, V. A., & Martin, L. G. (2000). Contribution of chronicconditions to aggregate changes in old-age functioning. AmericanJournal of Public Health, 90 (11), 1755–1760.Gilderbloom, J. I. & Markham, J. P. (1996). Housing modificationneeds of the disabled elderly: What really matters? Environment andBehavior, 28 (4), 512–535.Gitlin, L. N., Winter, L., Dennis, M. P., Corcoran, M., Schinfeld, S.,& Hauck, W. W. (2006). A randomized trial of a multicomponenthome intervention to reduce functional difficulties in older adults.Journal of the American Geriatrics Society, 54(5), 809–816.Hammel, J. (2005). The impact of home modification services on communityliving and participation outcomes for people who are aging with disabilities:Final report (RRF Grant 2001-328). Chicago: University of Illinois atChicago.Imrie, R. (2003). Housing quality and the provision of accessiblehomes. Housing Studies, 18 (3), 387–408.Imrie, R. (2004). The role of the building regulations in achievinghousing quality. Environment and Planning B: Planning and Design,31 (3), 419–437.Inclusive Home Design Act of 2007, H.R. 4204, 110th Congress.(2007). Retrieved February 11, 2008, from http://www.govtrack.us/congress/bill.xpd?bill=h110-4202International Code Council. (2008). About ICC: Introduction to the ICC.Retrieved February 4, 2008, from http://www.iccsafe.org/news/aboutJohnstone, I. M. (2001). Energy and mass flows of housing: Estimatingmortality. Building and Environment, 36 (1): 43–51.Kaminski, S. E., Mazumdar, S., DeMento, J. F. C., & Geis, G. (2006).The viability of voluntary visitability: A case study of Irvine’s approach.Journal of Disability Policy Studies, 17 (1), 49–56.Kaye, H. S., Kang, T., & LaPlante, M. P. (2000). Mobility device use inthe United States (Disability Statistics Report 14). Washington, DC:National Institute on Disability and Rehabilitation Research.Kaye, H. S., LaPlante, M. P., Carlson, D., & Wenger, B. L. (1996).Trends in disability rates in the United States, 1970−1994 (DisabilityStatistics Abstract 17). Washington, DC: National Institute on Disabilityand Rehabilitation Research.Kochera, A. (2002). Accessibility and visitability features in single-familyhomes: A review of state and local activity. Washington, DC: AARPPublic Policy Institute.Kochera, A., Straight, A., & Guterbock, T. (2005). Beyond 50.05: Areport to the nation on livable communities. Washington, DC: AARPPublic Policy Institute.Koebel, C. T. (2008). Innovation in homebuilding and the future ofhousing. Journal of the American Planning Association, 74 (1), 45–58.Lakdawalla, D. N., Bhattacharya, J., & Goldman, D. P. (2004). Are theyoung becoming more disabled? Health Affairs, 23 (1), 168–176.Lakdawalla, D. N., Goldman, D. P., Bhattacharya, J., Hurd, M. D.,Joyce, G. F., & Panis, C. W. (2003). Forecasting the nursing homepopulation. Medical Care, 41 (1), 8–20.LaPlante, M. P., Kaye, H. S., & Harrington, C. (2007). Estimating theexpense of a mandatory home- and community-based personal assistanceservices benefit under Medicaid. Journal of Aging & Social Policy, 19 (3),47–64.Lemmon, W. (2007). Reality check from the homebuilder’s sales floor.Planning Commissioners Journal, Planners Web, April 19. RetrievedFebruary 5, 2008 from http://pcj.typepad.com/planning_commissioners_jo/2007/04/reality_check_f.htmlLouie, J. (1999). The housing modifications for disabled elderly households(Joint Center for Housing Studies Publication W99-8). Cambridge,MA: Harvard University.
Maisel, J. L. (2006). Toward inclusive housing and neighborhooddesign: A look at visitability. Community Development, 37 (3), 26–34.Maisel, J. L., Steinfeld, E., & Smith, E. (in press). Visitability: A reportfor AARP. Washington, DC: AARP.Manton, K. G., & Gu, X. (2001). Changes in the prevalence of chronicdisability in the United States black and nonblack population above age65 from 1982–1999. Proceedings of the National Academy of Sciences,98 (11), 6354–6359.Martin, L. G., Schoeni, R. F., Freedman, V. A., & Andreski, P. (2007).Feeling better? Trends in general health status. Journal of Gerontology:Social Sciences, 62B (1), S11–S21.Masnick, G. S. (2002). The new demographics of housing. HousingPolicy Debate, 13 (2), 275–321.MetLife. (2005). The MetLife market survey of nursing home & home carecosts. Westport, CT: MetLife Mature Market Institute.Milner, J., & Madigan, R. (2004). Regulation and innovation: Re-thinking “inclusive” housing design. Housing Studies, 19 (5), 727–744.Myers, D., Pitkin, J., & Park, J. (2002). Estimation of housing needs amidpopulation growth and change. Housing Policy Debate, 13 (3), 567–596.Myers, D., & Ryu, S. (2008). Aging baby boomers and the generationalhousing bubble: Foresight and the mitigation of an epic transition.Journal of the American Planning Association, 74 (1), 17–33.Nelson, A. C. (2006). Leadership in a new era. Journal of the AmericanPlanning Association, 72 (4), 393–409.Nishita, C. M., Liebig, P. S., Pynoos, J., Perelman, L., & Spegal, K.(2007). Promoting basic accessibility in the home. Journal of DisabilityPolicy Studies, 18 (1), 2–13.Pynoos, J., & Nishita, C. M. (2003). The cost of financing of homemodifications in the United States. Journal of Disability Policy Studies14 (2), 68–73.Redfoot, D. L. (1993). Long-term care reform and the role of housingfinance. Housing Policy Debate, 4 (4), 497–537.Reynolds, S. L., Saito, Y., & Crimmins, E. M. (2005). The impact ofobesity on active life expectancy in older American men and women.The Gerontologist, 45 (4), 438–444.Saville-Smith, K., James, B., Fraser, R., Ruan, B., & Travaglia, S.(2007). Housing and disability: Future proofing New Zealand’s housingstock for an inclusive society. Aotearoa, New Zealand: Centre for HousingResearch.Schoeni, R. F., Martin, L. G., Andreski, P. M., & Freedman, V. A.(2005). Persistent and growing socioeconomic disparities in disabilityamong the elderly: 1982–2002. American Journal of Public Health,95 (11), 2065–2070.Siegel, J. S. (2002). Applied demography. San Diego, CA: Academic Press.Singer, B. H., & Manton, K. G. (1998). The effects of health changeson projections of health service needs for the elderly population of theUnited States. Proceedings of the National Academy of Sciences, 95 (26):15618–15622.Smith, S. K., Tayman, J., & Swanson, D. A. (2001). State and localpopulation projections: Methodology and analysis. New York: KluwerAcademic/Plenum.Spillman, B. C. (2004). Changes in elderly disability rates and theimplications for health care utilization and cost. The Milbank Quarterly,82 (1), 157–194.Steinfeld, E., Levine, D. R., & Shea, S. M. (1998). Home modificationsand the fair housing law. Technology and Disability, 8 (1), 15–35.Steinmetz, E. (2006). Americans with disabilities: 2002 (CurrentPopulation Reports, P70-107). Washington, DC: U.S. Census Bureau.Sturm, R., Ringel, J. S., & Andreyeva, T. (2004). Increasing obesityrates and disability trends. Health Affairs, 23 (2), 199–205.
Smith et al.: Aging and Disability 305
74-3 03 319880 Smith QC2a 7/2/08 11:34 PM Page 305
The most widely used approach to making householdprojections is the headship-rate model, but it has beencriticized because it defines the household head arbitrarily,it does not allow for linking headship rates to demographicrates, it lumps all household members other than the headinto a single category, and it projects only a limited num-ber of household types and sizes. The ProFamy model wasdeveloped as an alternative to the headship-rate model. Itsdefining feature is the use of individuals as the basic unit,which permits the application of demographic rates thataffect household structure.
In the ProFamy model, demographic rates are calcu-lated from standard data sources such as the decennialcensus and applied to individuals. The model projectshouseholds differentiated by age, sex, race, marital status,number of coresiding children, and coresidence withparents. Household type and size are calculated withrespect to the characteristics of the reference person; this isusually a female adult, but can be a male adult when thereare no female adults in the household.
The basic structure of the model consists of a numberof demographic accounting equations that calculate thenumber of persons age x+1 with status i at time t+1, basedon the number of persons age x with status i at time t.Status characteristics include factors such as marriage anddivorce, cohabitation, number of children, living withchildren, and living with parents. Events causing changesin status include births, deaths, migration, marriage, di-vorce, and leaving or returning to a parental home. Fertil-ity assumptions depend on age, number of children, andmarital status. Assumptions regarding mortality, firstmarriage, widowhood, divorce, and remarriage depend on
age, sex, and marital status. Projections are made in one-year intervals for all the years in the projection horizon.A detailed description of the ProFamy model can be foundin Yi, Vaupel, and Wang (1998).
The major advantages of the ProFamy model for ourpurposes are that it is based on a sound methodology, itincorporates recent population data, it provides detailedprojections of households as well as population, and itcovers a long projection horizon. The ProFamy projectionsused in the present analysis were produced in 2007 andextended through 2050, whereas the most recent house-hold projections produced by the U.S. Census Bureau werepublished in 1996 and extended only through 2010.Furthermore, the short-range ProFamy household projec-tions are in line with recent data from the Current Popula-tion Survey and the long-range ProFamy populationprojections are consistent with those produced by theCensus Bureau. For 2050, for example, the ProFamy U.S.population projection of 410,116,896 falls midway be-tween the two most recent sets of Census Bureau projec-tions: 403,687,000 for the set released in 2000 and419,854,000 for the set released in 2004.
Evaluating the ProFamy household projection for 2050is difficult because no comparative benchmark is available.One can look, however, at the average number of personsper household (PPH), which is a measure linking populationand household data. PPH has changed little since 1990 andthere are no clear indications that it will change significantlyin the future; this high degree of stability is consistent withthe assumptions used in the ProFamy model. We believe theProFamy model provides a sound underpinning for thedisability projections discussed in the present article.
U.S. Census Bureau. (2003). 2000 census of population and housing.Washington, DC: Author. [Public use microdata sample files availableon DVD from http://www.census.gov/mp/www/cat/decennial_census_2000/005955.html]U.S. Census Bureau. (2004). U.S. interim projections by age, sex, race,and Hispanic origin. Retrieved October 10, 2004, from http://www.census.gov/ipc/www/usinterimproj/U.S. Census Bureau. (2006). American housing survey for the UnitedStates: 2005 (Current Housing Reports, Series H150/05). Washington,DC: Author.U.S. Department of Health and Human Services. (2007). Nationalhealth expenditures by type of service and source of funds. Centers forMedicare and Medicaid Services. Retrieved September 14, 2007,from http://www.cms.hhs.gov/NationalHealthExpendData/02_NationalHealthAccountsHistorical.asp.
Waidmann, T. A., & Liu, K. (2000). Disability trends among elderlypersons and implications for the future. Journal of Gerontology: SocialSciences, 55B (5), S298–S307.Wang, Z., Gu, D., & Yi, Z. (2007, March). Projections of elderlydisability, care needs, and care costs for the states of California, Florida,Minnesota, and North Carolina: A pilot study. Paper presented at theannual meeting of the Population Association of America, New York.Washburn v. Pima County, #2 CA-CV 2003-0107 (2003).Wolf, D. A., Hunt, K., & Knickman, J. (2005). Perspectives on therecent decline in disability at older ages. The Milbank Quarterly, 83 (5),365–395.Yi, Z., Vaupel, J. W., & Wang, Z. (1998). Household projection usingconventional demographic data. Population and Development Review,24 (Suppl.), 59–87.
306 Journal of the American Planning Association, Summer 2008, Vol. 74, No. 3
Appendix: ProFamy Household Projection Model
74-3 03 319880 Smith QC2a 7/2/08 11:34 PM Page 306