Embed Size (px)
Citation preview
Serial Number Prefixes:
Calibration Guide
Agilent TechnologiesESG Family Signal Generators
(Affix Label Here)
Part No. E4400-90325
Printed in USAMarch 2011
Supersedes July 2000
© Copyright 1999, 2000, 2011 Agilent Technologies
ii
Acknowledgements
UNIX® is a registered trademark of the Open Group.
Windows® and MS Windows® are U.S. registered trademarks of Microsoft Corporation.
Windows NT ® is a U.S. registered trademarks of Microsoft Corporation.

Contents
1. Equipment RequiredRequired Equipment . . . . . . . . . . . . . . . . . . . . . . . . . . . . . . . . . . . . . . . . . . . . . . . . . . . . . . . . .1-2
2. Operation VerificationVerification Procedures . . . . . . . . . . . . . . . . . . . . . . . . . . . . . . . . . . . . . . . . . . . . . . . . . . . . . . .2-2
3. Service SoftwareRequired Test Equipment . . . . . . . . . . . . . . . . . . . . . . . . . . . . . . . . . . . . . . . . . . . . . . . . . . . . .3-2Installing the ESG_B or ESG_APDP Service Software . . . . . . . . . . . . . . . . . . . . . . . . . . . . .3-3Uninstalling the Software . . . . . . . . . . . . . . . . . . . . . . . . . . . . . . . . . . . . . . . . . . . . . . . . . . . . .3-5ESG Family Support Software Administration . . . . . . . . . . . . . . . . . . . . . . . . . . . . . . . . . . . .3-6Running the Service Support Software. . . . . . . . . . . . . . . . . . . . . . . . . . . . . . . . . . . . . . . . . .3-20
4. Performance TestsSupport Software . . . . . . . . . . . . . . . . . . . . . . . . . . . . . . . . . . . . . . . . . . . . . . . . . . . . . . . . . . . .4-31. Internal FM Accuracy and Distortion . . . . . . . . . . . . . . . . . . . . . . . . . . . . . . . . . . . . . . . . . .4-92. Internal AM Accuracy and Distortion. . . . . . . . . . . . . . . . . . . . . . . . . . . . . . . . . . . . . . . . .4-103. Phase Modulation Accuracy and Distortion . . . . . . . . . . . . . . . . . . . . . . . . . . . . . . . . . . . .4-124. FM Frequency Response . . . . . . . . . . . . . . . . . . . . . . . . . . . . . . . . . . . . . . . . . . . . . . . . . . .4-135. AM Frequency Response . . . . . . . . . . . . . . . . . . . . . . . . . . . . . . . . . . . . . . . . . . . . . . . . . . .4-146. Phase Modulation Frequency Response . . . . . . . . . . . . . . . . . . . . . . . . . . . . . . . . . . . . . . .4-167. DCFM Frequency Offset Relative to CW . . . . . . . . . . . . . . . . . . . . . . . . . . . . . . . . . . . . . .4-178. Residual FM (ESG-A and ESG-D only). . . . . . . . . . . . . . . . . . . . . . . . . . . . . . . . . . . . . . . .4-189. Harmonic, Subharmonic, and Nonharmonic Spurious Signals . . . . . . . . . . . . . . . . . . . . .4-2010. Power Level Accuracy . . . . . . . . . . . . . . . . . . . . . . . . . . . . . . . . . . . . . . . . . . . . . . . . . . . .4-2111. Timebase Aging Rate (ESG-AP, ESG-DP or Option 1E5 only) . . . . . . . . . . . . . . . . . . . .4-2412. Digital Modulation Level Accuracy . . . . . . . . . . . . . . . . . . . . . . . . . . . . . . . . . . . . . . . . . .4-2713. Internal Digital Modulation Quality . . . . . . . . . . . . . . . . . . . . . . . . . . . . . . . . . . . . . . . . .4-2814. Custom I/Q RF Modulation Quality (Option UN8 only) . . . . . . . . . . . . . . . . . . . . . . . . .4-2915. I/Q Modulation Quality (Options UN3, UN4 & UN8) . . . . . . . . . . . . . . . . . . . . . . . . . . .4-3116. Pulse Modulation On/Off Ratio . . . . . . . . . . . . . . . . . . . . . . . . . . . . . . . . . . . . . . . . . . . . .4-3217. Burst Modulation On/Off Ratio (ESG-D only) . . . . . . . . . . . . . . . . . . . . . . . . . . . . . . . . .4-3318. CDMA Adjacent Channel Power (Option UN5 only) . . . . . . . . . . . . . . . . . . . . . . . . . . . .4-3419. Alternate Timeslot Power Settling Time (Option UNA only) . . . . . . . . . . . . . . . . . . . . .4-3520. Pulse Rise/Fall Time (Option 1E6 only) . . . . . . . . . . . . . . . . . . . . . . . . . . . . . . . . . . . . . .4-3621. Measuring Phase Noise and Residual FM(ESG-AP and ESG-DP Series Signal Generators) . . . . . . . . . . . . . . . . . . . . . . . . . . . . . . . . .4-3722. Dual Arbitrary Waveform Generator Check (Option UND only) . . . . . . . . . . . . . . . . . .4-4223. GSM Loopback BER Check (Option 300 only) . . . . . . . . . . . . . . . . . . . . . . . . . . . . . . . . .4-4424. Frac-N Check (ESG-AP, ESG-DP only) . . . . . . . . . . . . . . . . . . . . . . . . . . . . . . . . . . . . . . .4-4525. Sampler/YO Driver Check (ESG-AP, ESG-DP only). . . . . . . . . . . . . . . . . . . . . . . . . . . . .4-45Performance Test Records . . . . . . . . . . . . . . . . . . . . . . . . . . . . . . . . . . . . . . . . . . . . . . . . . . . .4-46
5. AdjustmentsAdjustment Relationships . . . . . . . . . . . . . . . . . . . . . . . . . . . . . . . . . . . . . . . . . . . . . . . . . . . . .5-2Internal Reference Oscillator Adjustment . . . . . . . . . . . . . . . . . . . . . . . . . . . . . . . . . . . . . . . .5-4Analog Bus ADC Calibration. . . . . . . . . . . . . . . . . . . . . . . . . . . . . . . . . . . . . . . . . . . . . . . . . . .5-5Pretune Calibration (ESG-AP and ESG-DP only) . . . . . . . . . . . . . . . . . . . . . . . . . . . . . . . . . .5-6
iii
Contents
Internal Source Calibration . . . . . . . . . . . . . . . . . . . . . . . . . . . . . . . . . . . . . . . . . . . . . . . . . . . 5-7VCO Bias Potentiometer Adjustment. . . . . . . . . . . . . . . . . . . . . . . . . . . . . . . . . . . . . . . . . . . . 5-8Lock Angle Potentiometer Adjustment . . . . . . . . . . . . . . . . . . . . . . . . . . . . . . . . . . . . . . . . . . 5-9KV versus Frequency Calibration . . . . . . . . . . . . . . . . . . . . . . . . . . . . . . . . . . . . . . . . . . . . . 5-10AM Audio Path Offset Calibration . . . . . . . . . . . . . . . . . . . . . . . . . . . . . . . . . . . . . . . . . . . . . 5-11Timebase DAC Calibration . . . . . . . . . . . . . . . . . . . . . . . . . . . . . . . . . . . . . . . . . . . . . . . . . . . 5-12FM Scale DAC Offset Calibration. . . . . . . . . . . . . . . . . . . . . . . . . . . . . . . . . . . . . . . . . . . . . . 5-13FM Path Offset Calibration . . . . . . . . . . . . . . . . . . . . . . . . . . . . . . . . . . . . . . . . . . . . . . . . . . 5-14FM In-Band DAC Offset Calibration . . . . . . . . . . . . . . . . . . . . . . . . . . . . . . . . . . . . . . . . . . . 5-15FM Inverting Amplifier Offset Calibration . . . . . . . . . . . . . . . . . . . . . . . . . . . . . . . . . . . . . . 5-16FM 1/2 Path Ratio Gain Calibration . . . . . . . . . . . . . . . . . . . . . . . . . . . . . . . . . . . . . . . . . . . 5-17Modulation Source Relative Gain Compression Calibration . . . . . . . . . . . . . . . . . . . . . . . . 5-18FM Out-of-Band Calibration (ESG-A and ESG-D only) . . . . . . . . . . . . . . . . . . . . . . . . . . . . 5-19FM Delay Potentiometer Adjustment (ESG-A and ESG-D only) . . . . . . . . . . . . . . . . . . . . . 5-20Wide Bandwidth Phase Modulation Calibration (ESG-A and ESG-D only) . . . . . . . . . . . . 5-21FM/PM Out-of-Band Calibration (ESG-AP and ESG-DP only) . . . . . . . . . . . . . . . . . . . . . . 5-22FM/PM YO Frequency Compensation Calibration (ESG-AP and ESG-DP only) . . . . . . . . 5-23DCFM Calibration . . . . . . . . . . . . . . . . . . . . . . . . . . . . . . . . . . . . . . . . . . . . . . . . . . . . . . . . . . 5-24Low Frequency (LF) Output Calibration . . . . . . . . . . . . . . . . . . . . . . . . . . . . . . . . . . . . . . . . 5-25External Input Peak Detector Calibration. . . . . . . . . . . . . . . . . . . . . . . . . . . . . . . . . . . . . . . 5-26Burst Modulator Calibration (ESG-D only) . . . . . . . . . . . . . . . . . . . . . . . . . . . . . . . . . . . . . . 5-27Burst Audio Path Gain Calibration . . . . . . . . . . . . . . . . . . . . . . . . . . . . . . . . . . . . . . . . . . . . 5-28Prelevel Calibration, Digital . . . . . . . . . . . . . . . . . . . . . . . . . . . . . . . . . . . . . . . . . . . . . . . . . . 5-29Prelevel Calibration, Analog (ESG-A only) . . . . . . . . . . . . . . . . . . . . . . . . . . . . . . . . . . . . . . 5-30Gain Adjust Calibration . . . . . . . . . . . . . . . . . . . . . . . . . . . . . . . . . . . . . . . . . . . . . . . . . . . . . 5-31Low Noise Floor Gain Adjust (ESG-AP and ESG-DP only). . . . . . . . . . . . . . . . . . . . . . . . . . 5-32ALC Modulation Driver Bias Calibration . . . . . . . . . . . . . . . . . . . . . . . . . . . . . . . . . . . . . . . 5-33VBLO Mixer Bias Calibration . . . . . . . . . . . . . . . . . . . . . . . . . . . . . . . . . . . . . . . . . . . . . . . . 5-34Power Level Accuracy . . . . . . . . . . . . . . . . . . . . . . . . . . . . . . . . . . . . . . . . . . . . . . . . . . . . . . . 5-35Level Meter Calibration . . . . . . . . . . . . . . . . . . . . . . . . . . . . . . . . . . . . . . . . . . . . . . . . . . . . . 5-38ALC Modulation Flatness Calibration . . . . . . . . . . . . . . . . . . . . . . . . . . . . . . . . . . . . . . . . . . 5-39AM Gain Calibration . . . . . . . . . . . . . . . . . . . . . . . . . . . . . . . . . . . . . . . . . . . . . . . . . . . . . . . . 5-40I/Q Gain/Offset/Quadrature Calibration (ESG-D only) . . . . . . . . . . . . . . . . . . . . . . . . . . . . . 5-41I/Q Impairment Adjustment (ESG-D only) . . . . . . . . . . . . . . . . . . . . . . . . . . . . . . . . . . . . . . 5-42Baseband Generator I/Q Gain and Offset Adjustment(ESG-A and ESG-D Options UN3 and UN4 only) . . . . . . . . . . . . . . . . . . . . . . . . . . . . . . . . . 5-43
6. Maintenance and ServicePreventive Maintenance Procedures . . . . . . . . . . . . . . . . . . . . . . . . . . . . . . . . . . . . . . . . . . . . 6-2Returning a Signal Generator for Service . . . . . . . . . . . . . . . . . . . . . . . . . . . . . . . . . . . . . . . . 6-2Sales and Service Offices. . . . . . . . . . . . . . . . . . . . . . . . . . . . . . . . . . . . . . . . . . . . . . . . . . . . . . 6-3
7. Safety and RegulatorySafety Notes . . . . . . . . . . . . . . . . . . . . . . . . . . . . . . . . . . . . . . . . . . . . . . . . . . . . . . . . . . . . . . . . 7-2Instrument Markings . . . . . . . . . . . . . . . . . . . . . . . . . . . . . . . . . . . . . . . . . . . . . . . . . . . . . . . . 7-3General Safety Considerations . . . . . . . . . . . . . . . . . . . . . . . . . . . . . . . . . . . . . . . . . . . . . . . . . 7-4Statement of Compliance . . . . . . . . . . . . . . . . . . . . . . . . . . . . . . . . . . . . . . . . . . . . . . . . . . . . . 7-5Electrostatic Discharge . . . . . . . . . . . . . . . . . . . . . . . . . . . . . . . . . . . . . . . . . . . . . . . . . . . . . . . 7-6
iv
Contents
Warranty . . . . . . . . . . . . . . . . . . . . . . . . . . . . . . . . . . . . . . . . . . . . . . . . . . . . . . . . . . . . . . . . . . .7-7Assistance . . . . . . . . . . . . . . . . . . . . . . . . . . . . . . . . . . . . . . . . . . . . . . . . . . . . . . . . . . . . . . . . . .7-8Certification . . . . . . . . . . . . . . . . . . . . . . . . . . . . . . . . . . . . . . . . . . . . . . . . . . . . . . . . . . . . . . . .7-9
v

Contents
vi
ESG Family Signal Generators
1 Equipment Required
This chapter contains a list of all the recommended equipment required to perform theperformance tests and adjustments for the ESG Family Signal Generators.
Calibration Guide 1-1
Equipment Required ESG Family Signal GeneratorsRequired Equipment
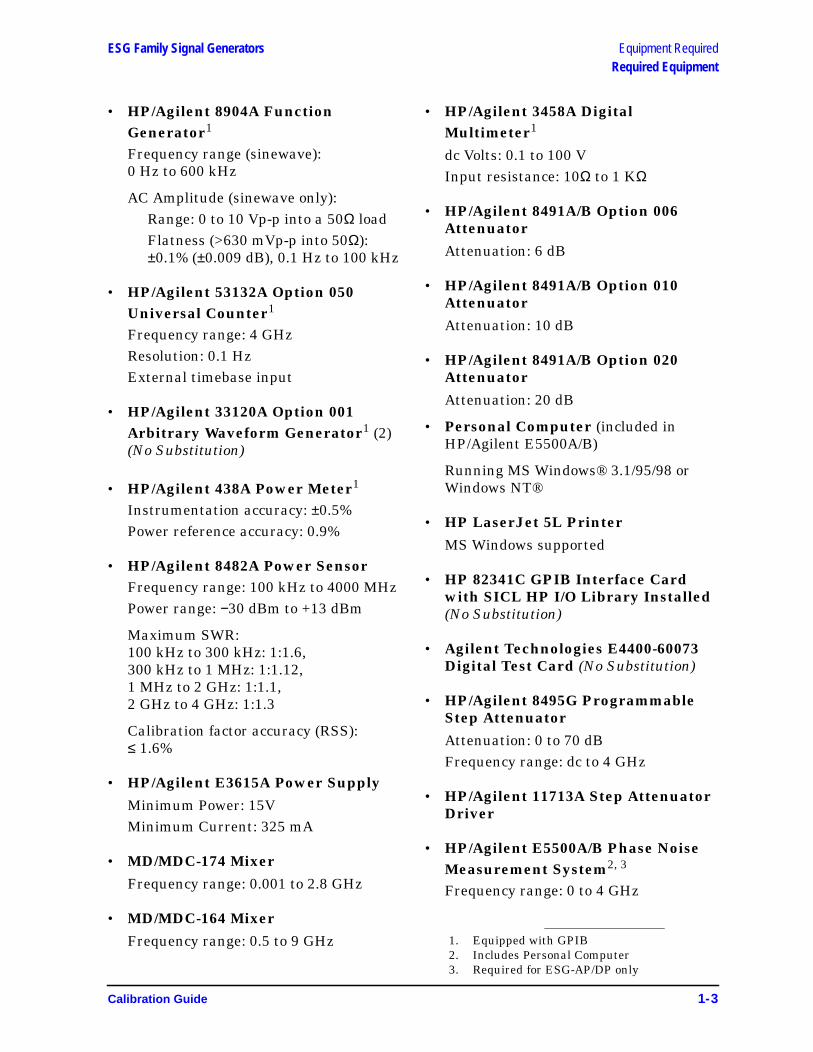
Required Equipment• HP/Agilent 8902A Measuring
Receiver1 Option 010
FM accuracy: ±2% of reading ±1 digitAM accuracy: ±2% of reading ±1 digitRange: 250 kHz to 1300 MHz
Filters: 300 Hz high pass and15 kHz and 3 kHz low pass
Detectors: Peak+
• HP/Agilent 54750A DigitizingOscilloscopeBandwidth: 20 GHz
• HP/Agilent 54751/2A OscilloscopePlug-inTwo 20 GHz bandwidth channels
• HP/Agilent 54610B DigitalOscilloscope1
Bandwidth: 500 MHz
• HP/Agilent 5071APrimary Frequency StandardFrequency: 10 MHzStability: > 1×10⁻¹⁰/year
• HP/Agilent 8903B Options 051, 010Audio Analyzer1
Distortion accuracy: ±1 dB
Residual distortion:−80 dB at 80 kHz BW
30 kHz low pass filterAC level accuracy: ±4%
• HP/Agilent 89441A Options AY7,AYA, AY9, UFG or UTH, and AYHVector Signal Analyzer1,2
(No Substitution)
• HP/Agilent 8563E Option E35Spectrum Analyzer (No Substitution)
Capable of W-CDMA ACPmeasurements from 1.2 to 3.0 GHz
Option E35 Comprises:
• HP/Agilent 8563E Option H35Spectrum Analyzer
• HP/Agilent 8563E Option K35Adjacent Channel Power Ratio TestSet for W-CDMA
NOTE HP/Agilent 8563E Option K37combines the Option K35 test setwith firmware ROM chips toupgrade existing HP/Agilent 8560E-series analyzers.
• HP/Agilent 8563E Options 001, 007Spectrum Analyzer1
Frequency range: 100 kHz to 4000 MHz
Relative level accuracy (harmonic andspurious measurements) ±2 dB
Displayed average noise level (1 Hz BW)−110 dBm at 100 kHz,−130 dBm at 1 to 10 MHz, and−134 dBm at 0.01 to 4 GHz
1 Hz digital resolution BW filter(required for power accuracy)
RF input VSWR: 1:1.5External timebase inputSecond IF output
• HP/Agilent 8663A Signal Generator1
Frequency Range: 11.5 to 2500 MHzOutput level: +16 dBm
Meets HP/Agilent 8663Asingle-sideband phase noisespecifications
1. Equipped with GPIB2. Used only with ESG-D models
1-2 Calibration Guide
ESG Family Signal Generators Equipment RequiredRequired Equipment
• HP/Agilent 8904A FunctionGenerator1
Frequency range (sinewave):0 Hz to 600 kHz
AC Amplitude (sinewave only):Range: 0 to 10 Vp-p into a 50Ω loadFlatness (>630 mVp-p into 50Ω):±0.1% (±0.009 dB), 0.1 Hz to 100 kHz
• HP/Agilent 53132A Option 050Universal Counter1
Frequency range: 4 GHzResolution: 0.1 HzExternal timebase input
• HP/Agilent 33120A Option 001Arbitrary Waveform Generator1 (2)(No Substitution)
• HP/Agilent 438A Power Meter1
Instrumentation accuracy: ±0.5%Power reference accuracy: 0.9%
• HP/Agilent 8482A Power SensorFrequency range: 100 kHz to 4000 MHzPower range: −30 dBm to +13 dBm
Maximum SWR:100 kHz to 300 kHz: 1:1.6,300 kHz to 1 MHz: 1:1.12,1 MHz to 2 GHz: 1:1.1,2 GHz to 4 GHz: 1:1.3
Calibration factor accuracy (RSS):≤ 1.6%
• HP/Agilent E3615A Power SupplyMinimum Power: 15VMinimum Current: 325 mA
• MD/MDC-174 MixerFrequency range: 0.001 to 2.8 GHz
• MD/MDC-164 MixerFrequency range: 0.5 to 9 GHz
• HP/Agilent 3458A DigitalMultimeter1
dc Volts: 0.1 to 100 VInput resistance: 10Ω to 1 KΩ
• HP/Agilent 8491A/B Option 006AttenuatorAttenuation: 6 dB
• HP/Agilent 8491A/B Option 010AttenuatorAttenuation: 10 dB
• HP/Agilent 8491A/B Option 020AttenuatorAttenuation: 20 dB
• Personal Computer (included inHP/Agilent E5500A/B)
Running MS Windows® 3.1/95/98 orWindows NT®
• HP LaserJet 5L PrinterMS Windows supported
• HP 82341C GPIB Interface Cardwith SICL HP I/O Library Installed(No Substitution)
• Agilent Technologies E4400-60073Digital Test Card (No Substitution)
• HP/Agilent 8495G ProgrammableStep AttenuatorAttenuation: 0 to 70 dBFrequency range: dc to 4 GHz
• HP/Agilent 11713A Step AttenuatorDriver
• HP/Agilent E5500A/B Phase NoiseMeasurement System2, 3
Frequency range: 0 to 4 GHz
1. Equipped with GPIB2. Includes Personal Computer3. Required for ESG-AP/DP only
Calibration Guide 1-3
Equipment Required ESG Family Signal GeneratorsRequired Equipment
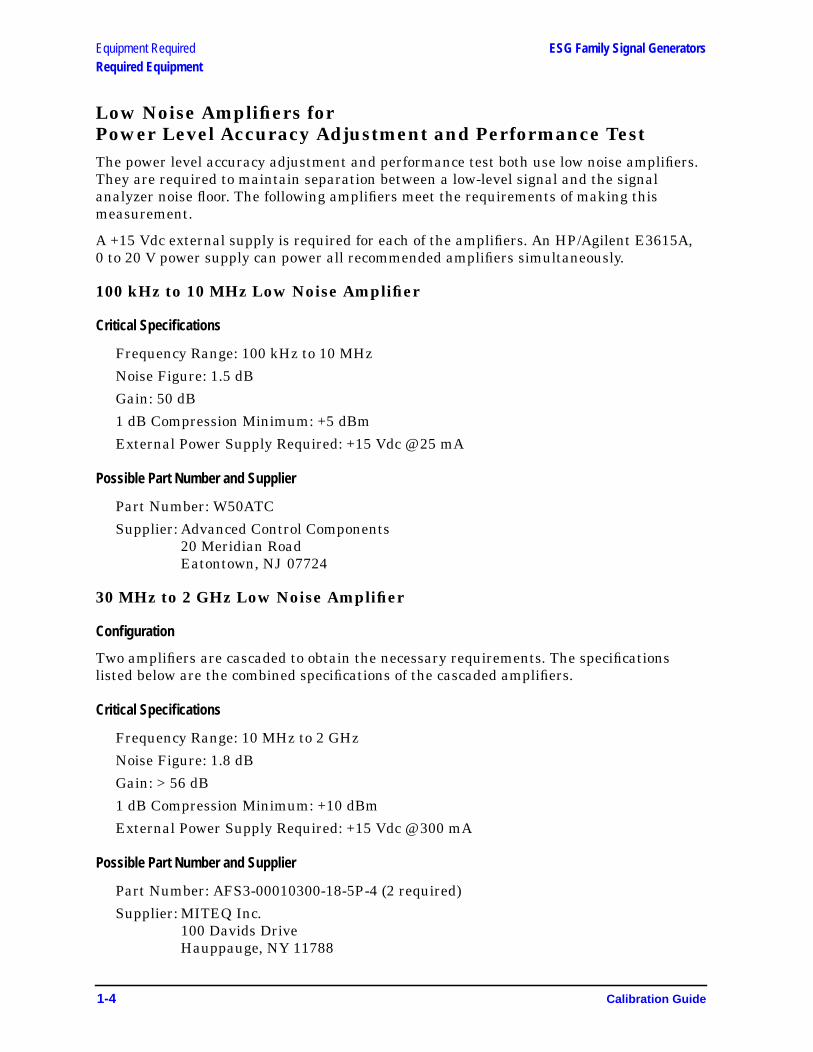
Low Noise Amplifiers forPower Level Accuracy Adjustment and Performance TestThe power level accuracy adjustment and performance test both use low noise amplifiers.They are required to maintain separation between a low-level signal and the signalanalyzer noise floor. The following amplifiers meet the requirements of making thismeasurement.
A +15 Vdc external supply is required for each of the amplifiers. An HP/Agilent E3615A,0 to 20 V power supply can power all recommended amplifiers simultaneously.
100 kHz to 10 MHz Low Noise Amplifier
Critical Specifications
Frequency Range: 100 kHz to 10 MHz
Noise Figure: 1.5 dB
Gain: 50 dB
1 dB Compression Minimum: +5 dBm
External Power Supply Required: +15 Vdc @ 25 mA
Possible Part Number and Supplier
Part Number: W50ATC
Supplier: Advanced Control Components20 Meridian RoadEatontown, NJ 07724
30 MHz to 2 GHz Low Noise Amplifier
Configuration
Two amplifiers are cascaded to obtain the necessary requirements. The specificationslisted below are the combined specifications of the cascaded amplifiers.
Critical Specifications
Frequency Range: 10 MHz to 2 GHz
Noise Figure: 1.8 dB
Gain: > 56 dB
1 dB Compression Minimum: +10 dBm
External Power Supply Required: +15 Vdc @ 300 mA
Possible Part Number and Supplier
Part Number: AFS3-00010300-18-5P-4 (2 required)
Supplier: MITEQ Inc.100 Davids DriveHauppauge, NY 11788
1-4 Calibration Guide
ESG Family Signal Generators
2 Operation Verification
This chapter provides procedures that will either ensure that the signal generator isoperating correctly or will help to point to problem areas if it is not. Operation verificationdoes not ensure performance to specifications, but should provide a level of confidence thatthe signal generator is operating correctly within a minimum amount of time. Operationverification is appropriate for incoming inspection, after repair when a full calibratedperformance is not required, or whenever the integrity of the signal generator is inquestion.
Calibration Guide 2-1
Operation Verification ESG Family Signal GeneratorsVerification Procedures
Verification ProceduresPerform the following procedures in the order they are presented. The tables referenced bythe tests are located in the back of the chapter where they can be copied easily.
1. Power On the Signal Generator on page 2-2
2. Check for Error Messages on page 2-3
3. Frequency Range and Accuracy Check on page 2-3
4. Power Level Accuracy Check on page 2-4
5. FM Accuracy Check on page 2-7
6. AM Accuracy Check on page 2-8
7. I/Q Modulation Check (ESG-D Only) on page 2-9
Equipment Required
• HP/Agilent 5350A Frequency Counter
• HP/Agilent 438A Power Meter
• HP/Agilent 8482A Power Sensor
• HP/Agilent 8563E Spectrum Analyzer
• HP/Agilent 8491A/B Option 006 Attenuator (6 dB)
• HP/Agilent 8491A/B Option 010 Attenuator (10 dB)
• HP/Agilent 8902A Measuring Receiver
1. Power On the Signal GeneratorThis procedure verifies that the signal generator powers up and that the internalinstrument check identifies no errors. The internal check evaluates the correctness ofoperation and returns an error message if a problem is detected.
1. Turn power on to the signal generator by pressing the power switch. The green LEDwill light. Let the signal generator warm up for one hour.
NOTE For ESG-AP or ESG-DP signal generators, or those with Option 1E5, ERROR514, Reference Oven Cold occurs whenever the signal generator is firstconnected to AC line power. The OVEN COLD annunciator and the ERRannunciator both turn on. The OVEN COLD annunciator automatically clearsafter approximately 5 minutes. The error queue cannot be cleared, however,until the OVEN COLD annunciator has turned off.
2. Cycle the power to the signal generator. The green LED should again be lit and thesignal generator will perform a check.
2-2 Calibration Guide

ESG Family Signal Generators Operation VerificationVerification Procedures
2. Check for Error Messages
1. When the display is lit, check to see if the ERR annunciator is turned on.
2. If the ERRannunciator is turned on, review the error messages in the queue by pressingUtility > Error Info > View Next Error Message . The first error message in the queue will beshown in the text area of the display. Refer to the error messages guide for informationabout the error message.
If there is more than one error message (each message will be designated as 1 of n),continue pressing the View Next Error Message softkey until you have seen all of themessages.
3. When you have resolved all of the error messages, press Clear Error Queue(s) to delete themessages. Cycle the power on the signal generator and then restart this procedure(Check for Error Messages) at step 1.
3. Frequency Range and Accuracy CheckFrequency range is tested by determining the frequency accuracy relative to the timebaseat the frequency limits.
Connect the Test Equipment
Figure 2-1 Frequency Range and Accuracy Equipment Setup
Configure the Signal Generator
1. Preset the signal generator to normal (factory-defined) preset conditions.
2. Press Mod On/Off . The MOD OFF annunciator is displayed.
3. For frequencies < 10 MHz:
a. Press Amplitude . Enter 10 using the numeric keypad and press the dBm terminatorsoftkey.
b. Press RF On/Off . The RF ON annunciator is displayed.
Calibration Guide 2-3
Operation Verification ESG Family Signal GeneratorsVerification Procedures
4. For frequencies ≥ 10 MHz:
a. Press Amplitude . Enter 0 using the numeric keypad and press the dBm terminatorsoftkey.
b. Check that the RF ON annunciator is displayed. If not, press RF On/Off.
Configure the Frequency Counter
1. For frequencies < 10 MHz use Input 2. Press 1 MΩ.
2. For frequencies ≥ 10 MHz and ≤ 500 MHz use Input 2. Press 50Ω.
3. For frequencies > 500 MHz use Input 1. Press AUTO.
NOTE Set the gate time of > 5 seconds for maximum counter accuracy. Verify thatthe counter is phase-locked to the 10 MHz external reference.
Measure the Frequency Accuracy
1. Set the signal generator to the frequencies shown in Table 2-1, “Frequency Accuracy,”on page 2-10 (to the maximum frequency of your signal generator).
2. Record the measured frequency in Table 2-1 and compare it to the corresponding limits.
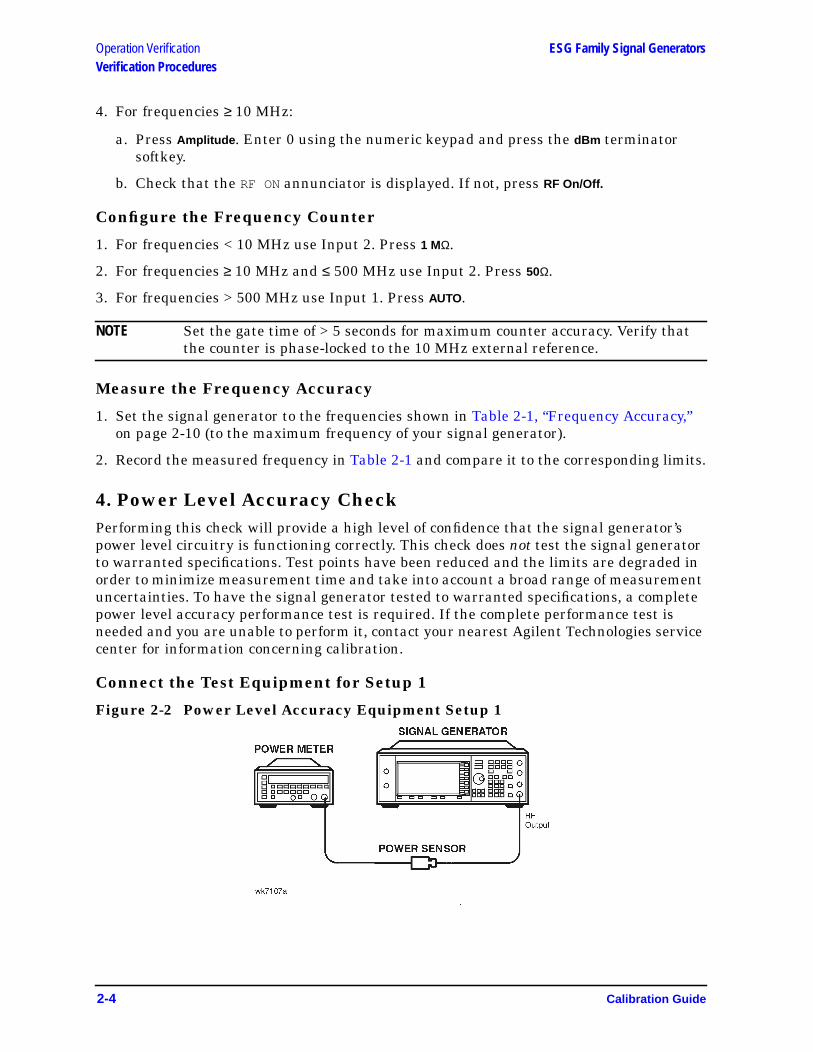
4. Power Level Accuracy CheckPerforming this check will provide a high level of confidence that the signal generator’spower level circuitry is functioning correctly. This check does not test the signal generatorto warranted specifications. Test points have been reduced and the limits are degraded inorder to minimize measurement time and take into account a broad range of measurementuncertainties. To have the signal generator tested to warranted specifications, a completepower level accuracy performance test is required. If the complete performance test isneeded and you are unable to perform it, contact your nearest Agilent Technologies servicecenter for information concerning calibration.
Connect the Test Equipment for Setup 1
Figure 2-2 Power Level Accuracy Equipment Setup 1
2-4 Calibration Guide

ESG Family Signal Generators Operation VerificationVerification Procedures
Configure the Signal Generator
1. Preset the signal generator to normal (factory-defined) preset conditions.
2. Press Frequency . Enter 277 using the numeric keypad and press the kHz terminatorsoftkey.
3. Press Amplitude . Enter 13 using the numeric keypad and press the dBm terminatorsoftkey.
4. Press Mod On/Off . The MOD OFF annunciator is displayed.
5. Press RF On/Off . The RF ON annunciator is displayed.
Configure the Power Meter
1. Zero and calibrate the power meter to the sensor’s reference calibration factor.
2. Set the power meter to measure absolute log power (dBm).
Measure the Power Level Accuracy
1. Set the power levels and frequencies for the signal generator (to the maximumfrequency of your signal generator). Refer to the appropriate table in the following list:
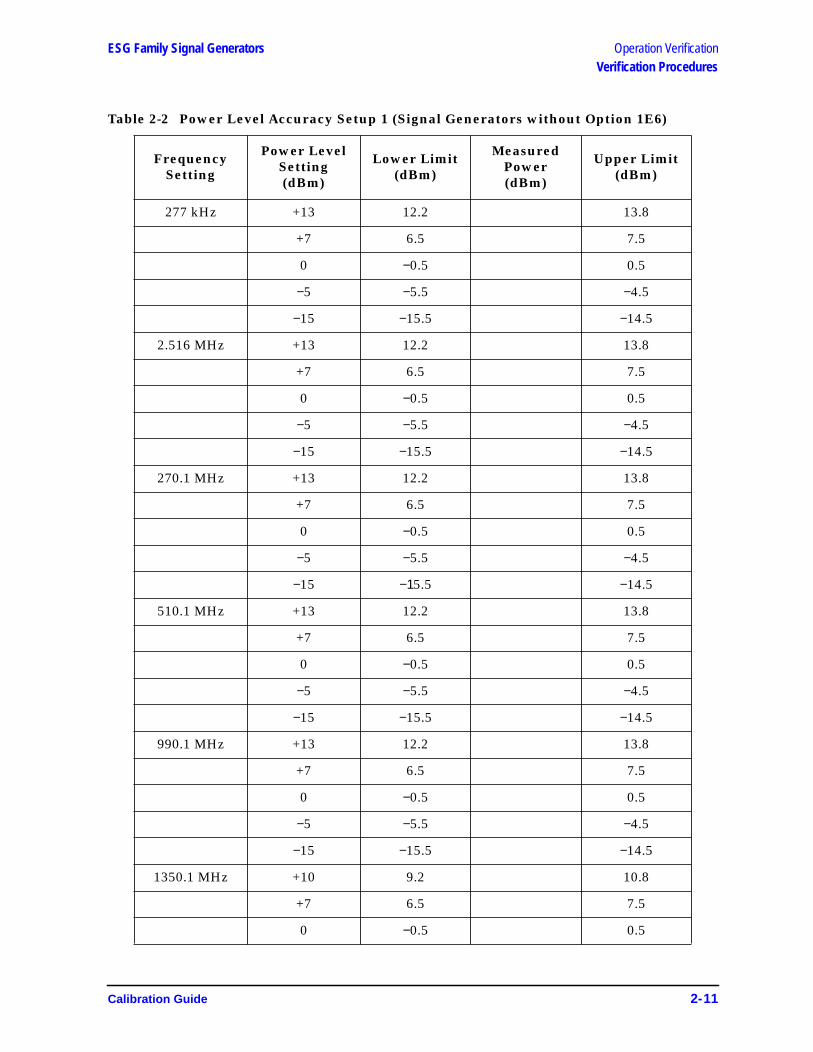
• Table 2-2, “Power Level Accuracy Setup 1 (Signal Generators without Option 1E6),”on page 2-11
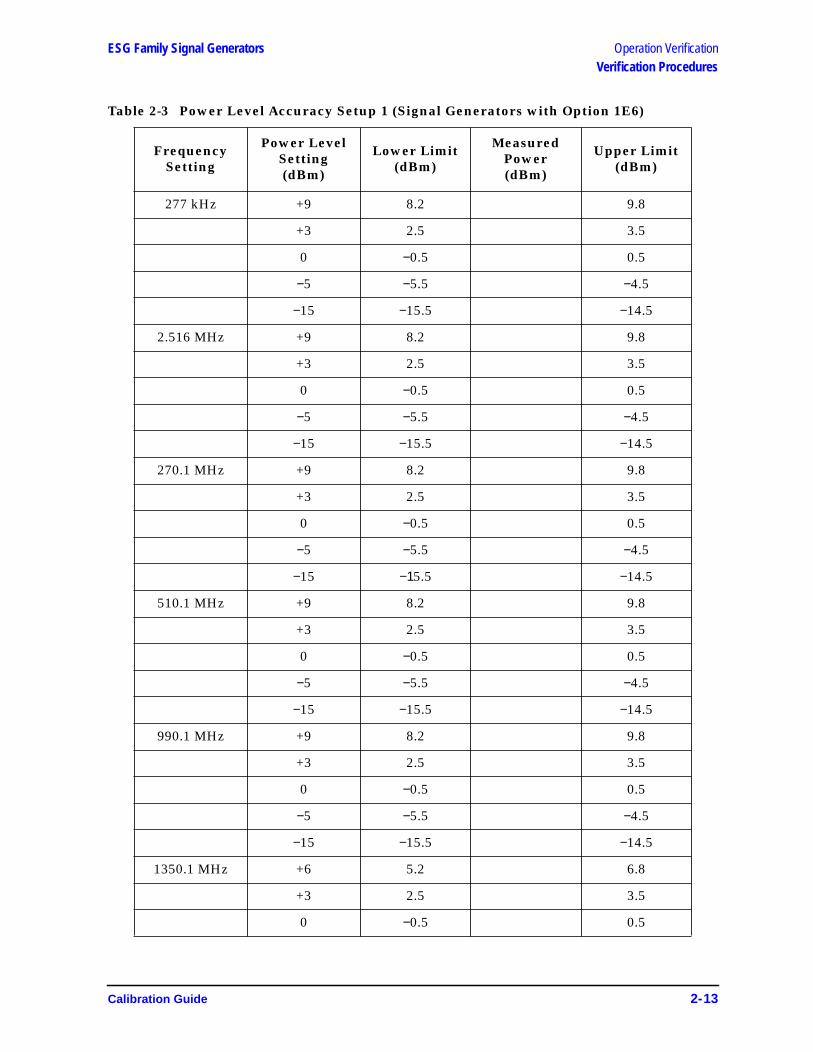
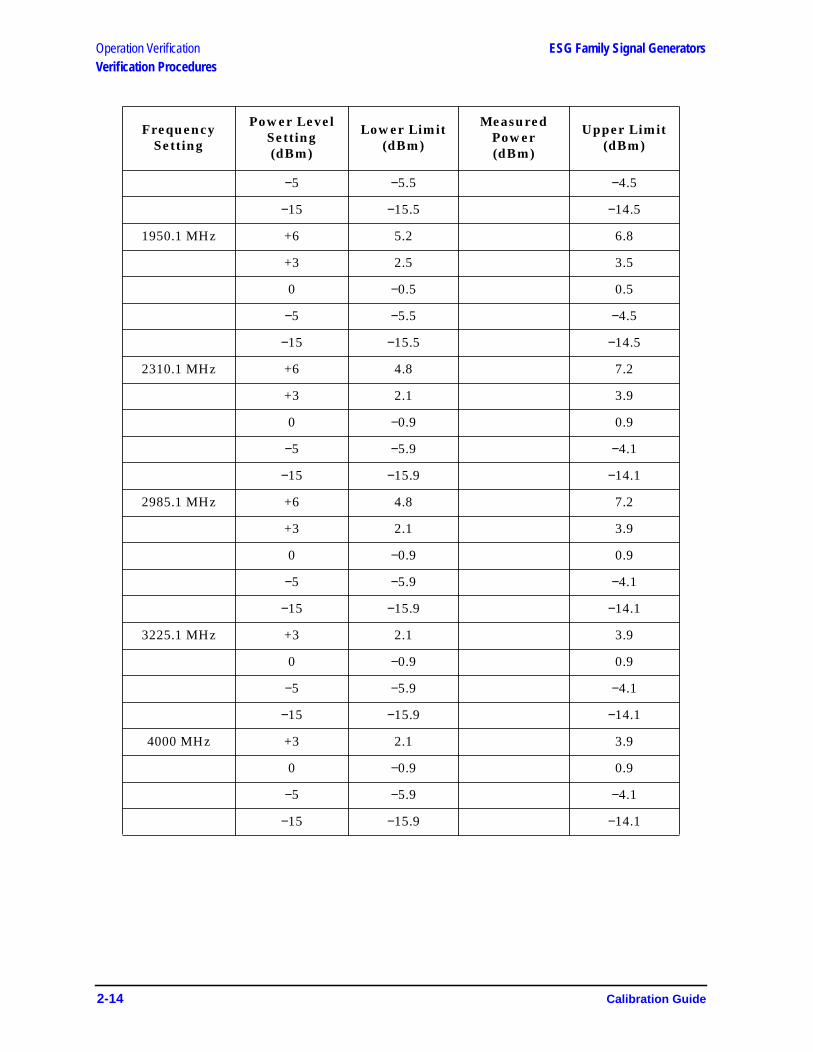
• Table 2-3, “Power Level Accuracy Setup 1 (Signal Generators with Option 1E6),” onpage 2-13.
2. Set the power sensor’s calibration factor for each frequency.
3. Record the measured power level in the appropriate table (Table 2-2 or Table 2-3) andcompare it to the corresponding limits.
Connect the Test Equipment for Setup 2
Figure 2-3 Power Level Accuracy Equipment Setup 2
Calibration Guide 2-5
Operation Verification ESG Family Signal GeneratorsVerification Procedures
Configure the Signal Generator
1. Press Frequency . Enter 277 using the numeric keypad and press the kHz terminatorsoftkey.
2. Press Amplitude . Enter −15 using the numeric keypad and press the dBm terminatorsoftkey.
Configure the Spectrum Analyzer
1. Preset the spectrum analyzer.
2. Set the analyzer to external 10 MHz reference.
3. Set the center frequency to 277 kHz.
4. Set the frequency span to 100 Hz. (This will result in a 1 Hz resolution bandwidth witha digital filter.)
Measure the Power Level Accuracy
1. Connect the signal generator’s RF OUTPUT through the 6 dB attenuator to thespectrum analyzer’s RF input.
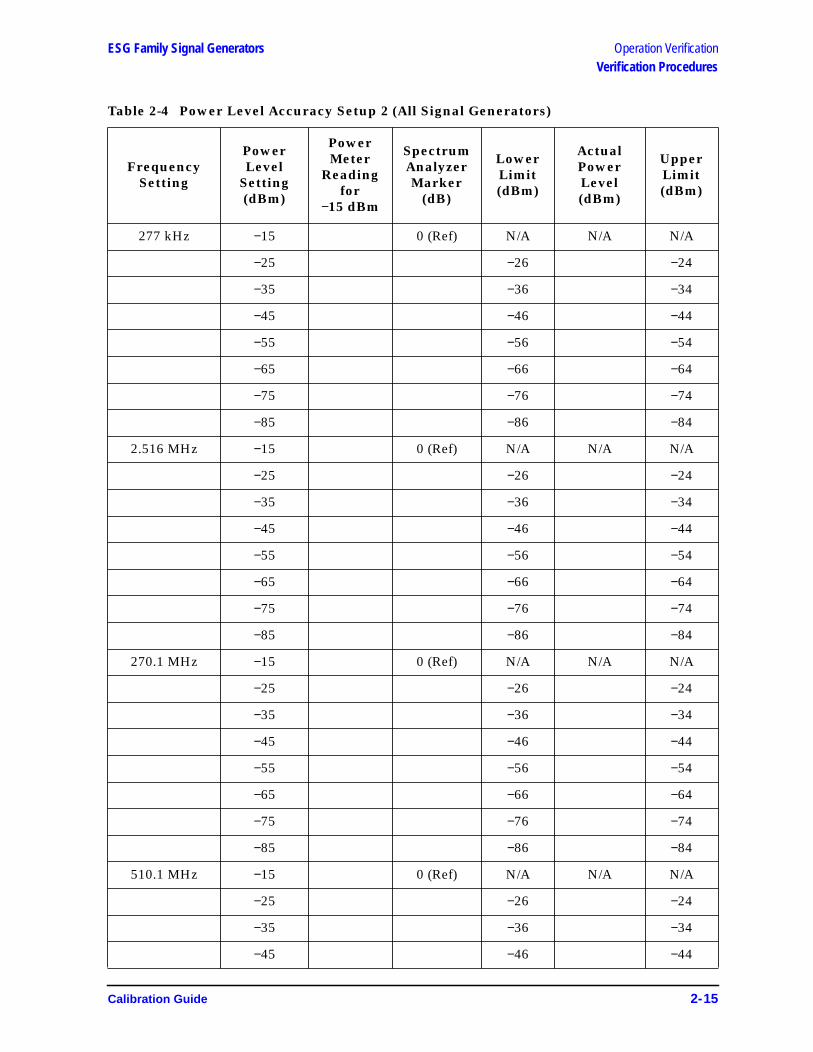
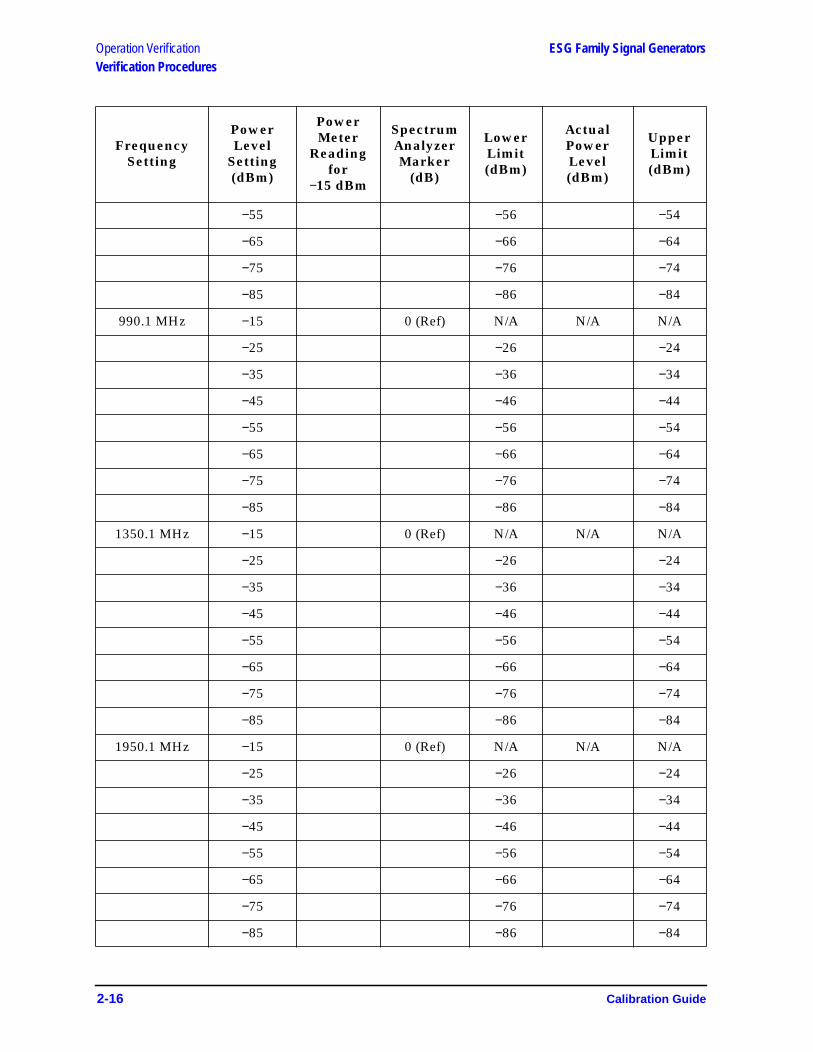
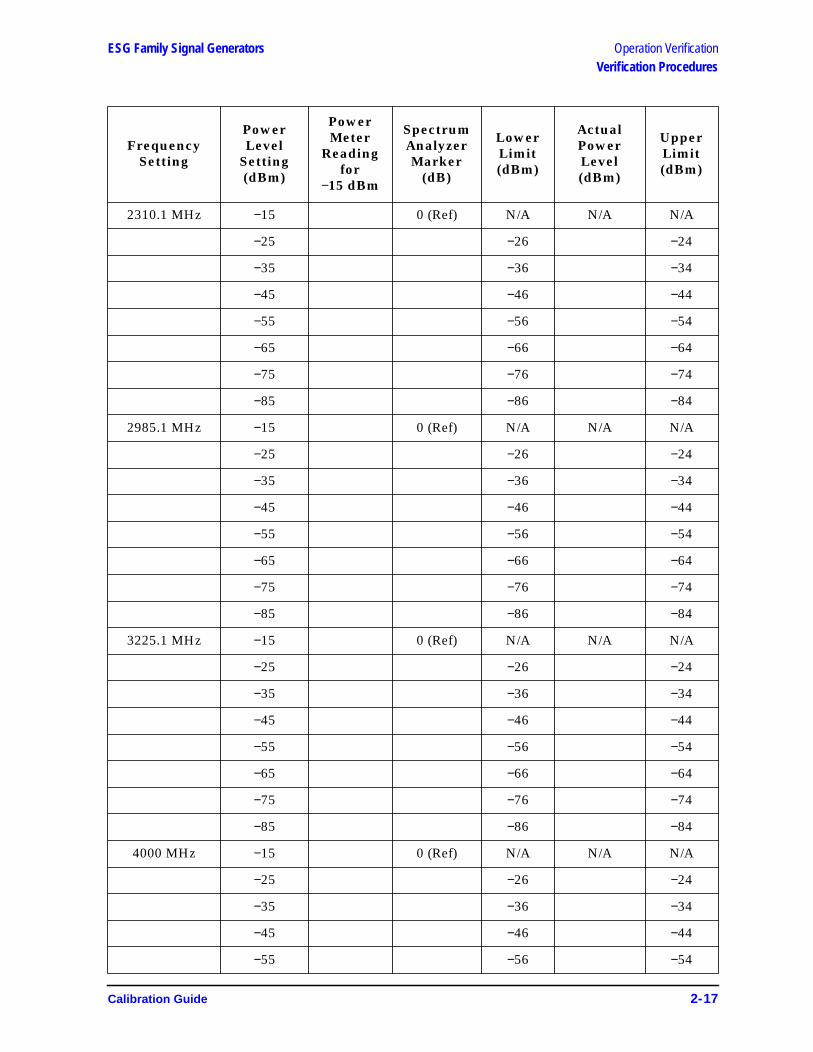
2. Transfer the power level results for each frequency at −15 dBm from the MeasuredPower column in Table 2-2 or Table 2-3 as appropriate, to the Power Meter Reading for−15 dBm column in Table 2-4, “Power Level Accuracy Setup 2 (All Signal Generators),”on page 2-15.
3. On the spectrum analyzer, select Marker Normal Mode and then select the Peak Searchfunction. This activates the marker and sets it to the signal peak.
4. On the spectrum analyzer, ensure that the marker is at the signal peak and use theMKR-> menu to set the marker to the reference level. If necessary, select Peak Search toensure that the marker is at the signal peak.
5. With the marker at signal peak, select the Marker Delta function. This will set the markerto measure relative amplitude from a reference of 0 dB. If the marker does not read0 dB, press Marker Normal > Peak Search > Marker Delta until the marker reads 0 dB.
6. Decrease the signal generator amplitude in 10 dB steps as shown in Table 2-4. At each10 dB step, select Peak Search to ensure that the marker is at the signal peak.
7. Measure the power levels shown in the Power Level Setting (dBm) column of Table 2-4for the current frequency, and record the values in the Spectrum Analyzer Marker (dB)column.
8. Return the spectrum analyzer reference level and the signal generator amplitude to−15 dBm. Set the signal generator frequency and the spectrum analyzer’s centerfrequency to the next frequency listed in Table 2-4 and repeat the process from step 3.Continue until all of the frequencies have been measured and recorded (to themaximum frequency of your signal generator).
2-6 Calibration Guide
ESG Family Signal Generators Operation VerificationVerification Procedures
Calculate the Actual Power Level
1. Calculate and record the Actual Power Level, in Table 2-4, as the sum of the PowerMeter Reading for −15 dBm and the Spectrum Analyzer Marker (dB) value.
For example:
• Power Meter Reading for −15 dBm at 2.516 MHz = −14.95 dBm
• Spectrum Analyzer Marker (dB) at 2.516 MHz and Power Level Setting at−85 dBm = −70.17 dB
• Actual Power Level at 2.516 MHz and −85 dBm: (−14.95) + (−70.17) = −85.12 dBm
2. Compare the calculated Actual Power Level value to the corresponding limits.
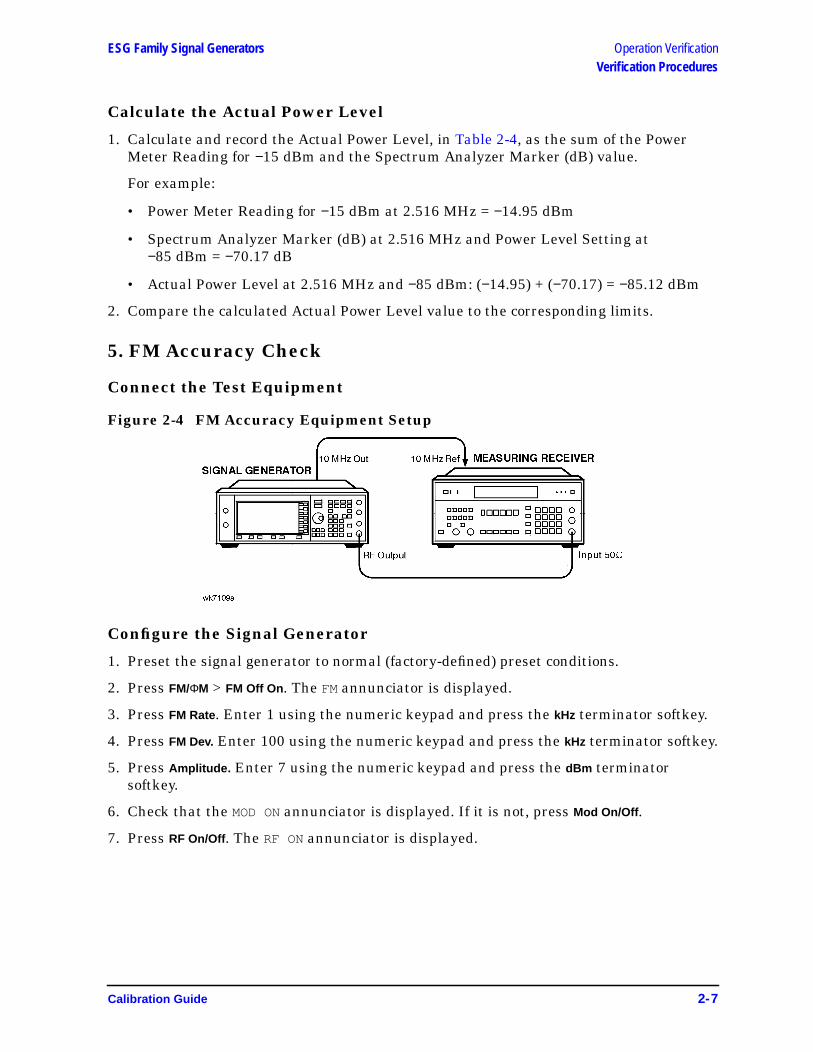
5. FM Accuracy Check
Connect the Test Equipment
Figure 2-4 FM Accuracy Equipment Setup
Configure the Signal Generator
1. Preset the signal generator to normal (factory-defined) preset conditions.
2. Press FM/ΦM > FM Off On . The FM annunciator is displayed.
3. Press FM Rate. Enter 1 using the numeric keypad and press the kHz terminator softkey.
4. Press FM Dev. Enter 100 using the numeric keypad and press the kHz terminator softkey.
5. Press Amplitude. Enter 7 using the numeric keypad and press the dBm terminatorsoftkey.
6. Check that the MOD ON annunciator is displayed. If it is not, press Mod On/Off .
7. Press RF On/Off . The RF ON annunciator is displayed.
Calibration Guide 2-7
Operation Verification ESG Family Signal GeneratorsVerification Procedures
Configure the Measuring Receiver
1. Reset the measuring receiver.
2. Set the measuring receiver to FM mode.
3. Turn on Peak+ detector.
4. Turn on the 300 Hz high-pass filter.
5. Turn on the 3 kHz low-pass filter.
Measure the Deviations
1. Set the signal generator to the frequencies shown in Table 2-5, “FM Accuracy,” onpage 2-19.
2. Record the deviations measured and compare them to the limits shown in Table 2-5.
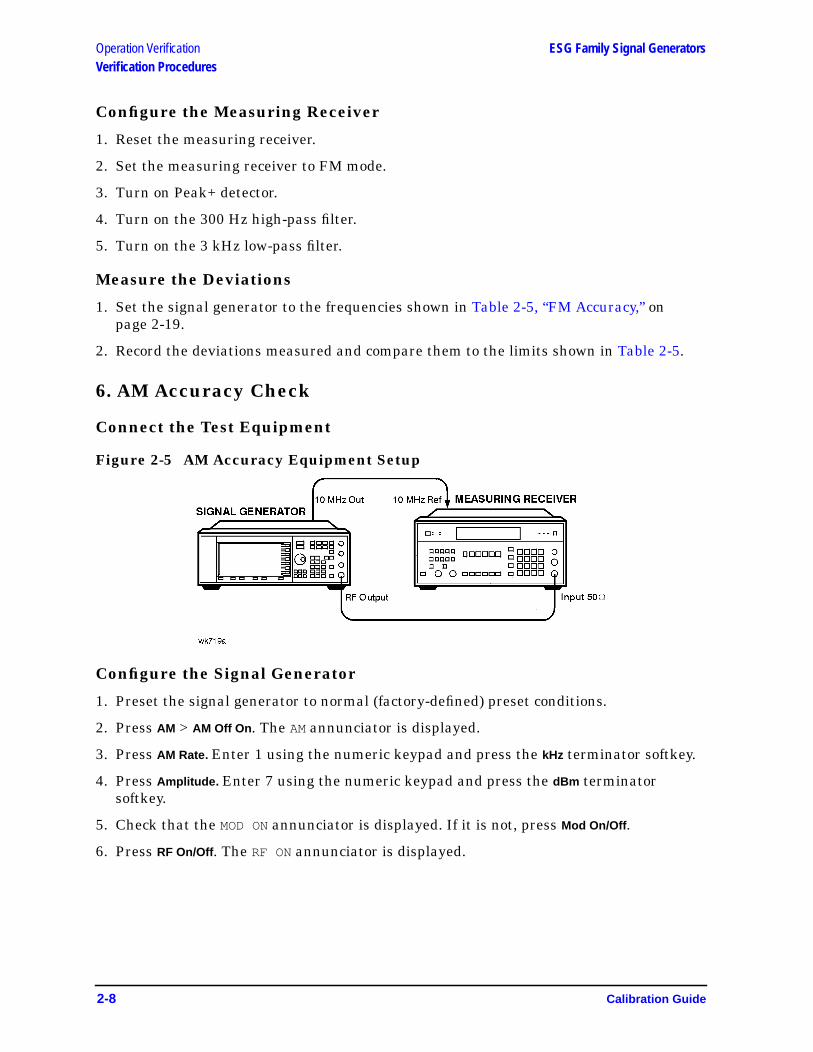
6. AM Accuracy Check
Connect the Test Equipment
Figure 2-5 AM Accuracy Equipment Setup
Configure the Signal Generator
1. Preset the signal generator to normal (factory-defined) preset conditions.
2. Press AM > AM Off On . The AM annunciator is displayed.
3. Press AM Rate. Enter 1 using the numeric keypad and press the kHz terminator softkey.
4. Press Amplitude. Enter 7 using the numeric keypad and press the dBm terminatorsoftkey.
5. Check that the MOD ON annunciator is displayed. If it is not, press Mod On/Off .
6. Press RF On/Off . The RF ON annunciator is displayed.
2-8 Calibration Guide
ESG Family Signal Generators Operation VerificationVerification Procedures
Configure the Measuring Receiver
1. Reset the measuring receiver.
2. Set the measuring receiver to AM mode.
3. Turn on Peak+ detector.
4. Turn on the 300 Hz high-pass filter.
5. Turn on the 3 kHz low-pass filter.
Measure the Deviations
1. Set the signal generator to the frequencies and depths shown in Table 2-6, “AMAccuracy,” on page 2-19.
2. Record the AM depths measured and compare them to the limits shown in Table 2-6.
7. I/Q Modulation Check (ESG-D Only)
1. Preset the signal generator to normal (factory-defined) preset conditions.
2. Press I/Q > I/Q Calibration . Check that Full is highlighted on the Calibration Type User Fullsoftkey. If not, press Calibration Type User Full .
3. Press Execute Cal to begin an I/Q calibration for the signal generator’s full frequencyrange. The message I/Q Calibration in Progress is displayed until the calibration iscomplete.
Calibration Guide 2-9
Operation Verification ESG Family Signal GeneratorsVerification Procedures
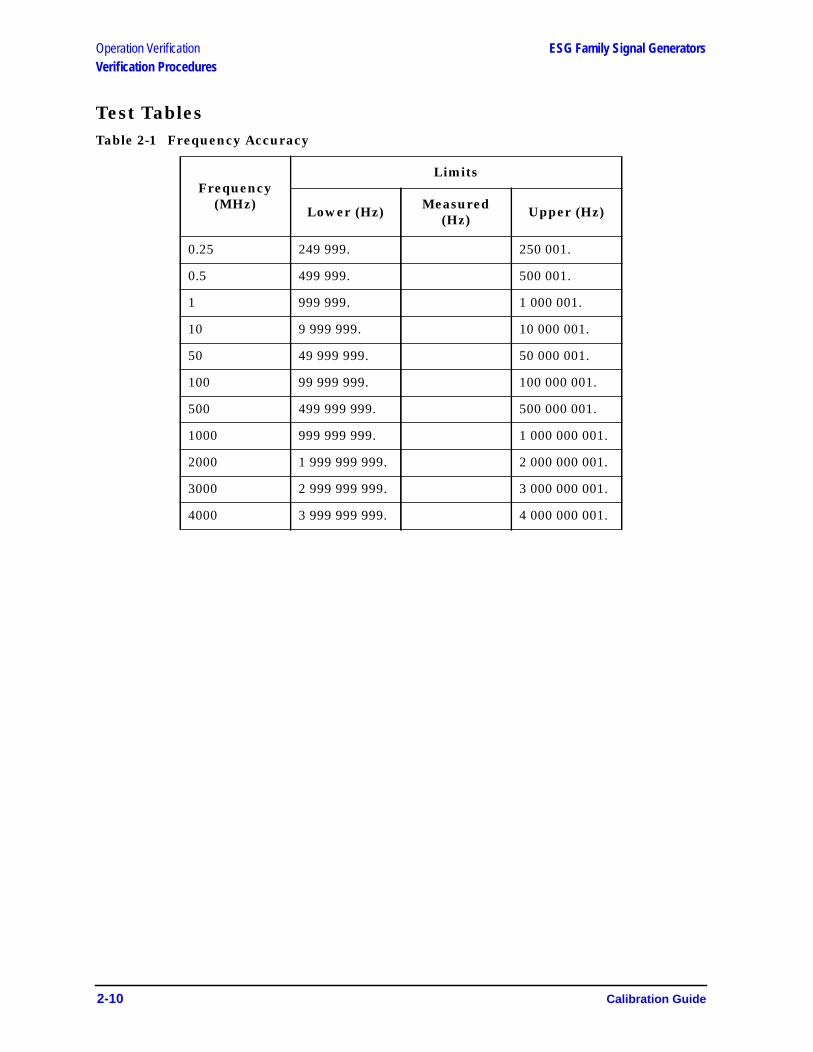
Test TablesTable 2-1 Frequency Accuracy
Frequency(MHz)
Limits
Lower (Hz) Measured(Hz) Upper (Hz)
0.25 249 999. 250 001.
0.5 499 999. 500 001.
1 999 999. 1 000 001.
10 9 999 999. 10 000 001.
50 49 999 999. 50 000 001.
100 99 999 999. 100 000 001.
500 499 999 999. 500 000 001.
1000 999 999 999. 1 000 000 001.
2000 1 999 999 999. 2 000 000 001.
3000 2 999 999 999. 3 000 000 001.
4000 3 999 999 999. 4 000 000 001.
2-10 Calibration Guide
ESG Family Signal Generators Operation VerificationVerification Procedures
Table 2-2 Power Level Accuracy Setup 1 (Signal Generators without Option 1E6)
FrequencySetting
Power LevelSetting(dBm)
Lower Limit(dBm)
MeasuredPower(dBm)
Upper Limit(dBm)
277 kHz +13 12.2 13.8
+7 6.5 7.5
0 −0.5 0.5
−5 −5.5 −4.5
−15 −15.5 −14.5
2.516 MHz +13 12.2 13.8
+7 6.5 7.5
0 −0.5 0.5
−5 −5.5 −4.5
−15 −15.5 −14.5
270.1 MHz +13 12.2 13.8
+7 6.5 7.5
0 −0.5 0.5
−5 −5.5 −4.5
−15 −15.5 −14.5
510.1 MHz +13 12.2 13.8
+7 6.5 7.5
0 −0.5 0.5
−5 −5.5 −4.5
−15 −15.5 −14.5
990.1 MHz +13 12.2 13.8
+7 6.5 7.5
0 −0.5 0.5
−5 −5.5 −4.5
−15 −15.5 −14.5
1350.1 MHz +10 9.2 10.8
+7 6.5 7.5
0 −0.5 0.5
Calibration Guide 2-11

Operation Verification ESG Family Signal GeneratorsVerification Procedures
−5 −5.5 −4.5
−15 −15.5 −14.5
1950.1 MHz +10 9.2 10.8
+7 6.5 7.5
0 −0.5 0.5
−5 −5.5 −4.5
−15 −15.5 −14.5
2310.1 MHz +10 8.8 11.2
+7 6.1 7.9
0 −0.9 0.9
−5 −5.9 −4.1
−15 −15.9 −14.1
2985.1 MHz +10 8.8 11.2
+7 6.1 7.9
0 −0.9 0.9
−5 −5.9 −4.1
−15 −15.9 −14.1
3225.1 MHz +7 6.1 7.9
0 −0.9 0.9
−5 −5.9 −4.1
−15 −15.9 −14.1
4000 MHz +7 6.1 7.9
0 −0.9 0.9
−5 −5.9 −4.1
−15 −15.9 −14.1
FrequencySetting
Power LevelSetting(dBm)
Lower Limit(dBm)
MeasuredPower(dBm)
Upper Limit(dBm)
2-12 Calibration Guide
ESG Family Signal Generators Operation VerificationVerification Procedures
Table 2-3 Power Level Accuracy Setup 1 (Signal Generators with Option 1E6)
FrequencySetting
Power LevelSetting(dBm)
Lower Limit(dBm)
MeasuredPower(dBm)
Upper Limit(dBm)
277 kHz +9 8.2 9.8
+3 2.5 3.5
0 −0.5 0.5
−5 −5.5 −4.5
−15 −15.5 −14.5
2.516 MHz +9 8.2 9.8
+3 2.5 3.5
0 −0.5 0.5
−5 −5.5 −4.5
−15 −15.5 −14.5
270.1 MHz +9 8.2 9.8
+3 2.5 3.5
0 −0.5 0.5
−5 −5.5 −4.5
−15 −15.5 −14.5
510.1 MHz +9 8.2 9.8
+3 2.5 3.5
0 −0.5 0.5
−5 −5.5 −4.5
−15 −15.5 −14.5
990.1 MHz +9 8.2 9.8
+3 2.5 3.5
0 −0.5 0.5
−5 −5.5 −4.5
−15 −15.5 −14.5
1350.1 MHz +6 5.2 6.8
+3 2.5 3.5
0 −0.5 0.5
Calibration Guide 2-13
Operation Verification ESG Family Signal GeneratorsVerification Procedures
−5 −5.5 −4.5
−15 −15.5 −14.5
1950.1 MHz +6 5.2 6.8
+3 2.5 3.5
0 −0.5 0.5
−5 −5.5 −4.5
−15 −15.5 −14.5
2310.1 MHz +6 4.8 7.2
+3 2.1 3.9
0 −0.9 0.9
−5 −5.9 −4.1
−15 −15.9 −14.1
2985.1 MHz +6 4.8 7.2
+3 2.1 3.9
0 −0.9 0.9
−5 −5.9 −4.1
−15 −15.9 −14.1
3225.1 MHz +3 2.1 3.9
0 −0.9 0.9
−5 −5.9 −4.1
−15 −15.9 −14.1
4000 MHz +3 2.1 3.9
0 −0.9 0.9
−5 −5.9 −4.1
−15 −15.9 −14.1
FrequencySetting
Power LevelSetting(dBm)
Lower Limit(dBm)
MeasuredPower(dBm)
Upper Limit(dBm)
2-14 Calibration Guide
ESG Family Signal Generators Operation VerificationVerification Procedures
Table 2-4 Power Level Accuracy Setup 2 (All Signal Generators)
FrequencySetting
PowerLevel
Setting(dBm)
PowerMeter
Readingfor
−15 dBm
SpectrumAnalyzerMarker
(dB)
LowerLimit(dBm)
ActualPowerLevel(dBm)
UpperLimit(dBm)
277 kHz −15 0 (Ref) N/A N/A N/A
−25 −26 −24
−35 −36 −34
−45 −46 −44
−55 −56 −54
−65 −66 −64
−75 −76 −74
−85 −86 −84
2.516 MHz −15 0 (Ref) N/A N/A N/A
−25 −26 −24
−35 −36 −34
−45 −46 −44
−55 −56 −54
−65 −66 −64
−75 −76 −74
−85 −86 −84
270.1 MHz −15 0 (Ref) N/A N/A N/A
−25 −26 −24
−35 −36 −34
−45 −46 −44
−55 −56 −54
−65 −66 −64
−75 −76 −74
−85 −86 −84
510.1 MHz −15 0 (Ref) N/A N/A N/A
−25 −26 −24
−35 −36 −34
−45 −46 −44
Calibration Guide 2-15
Operation Verification ESG Family Signal GeneratorsVerification Procedures
−55 −56 −54
−65 −66 −64
−75 −76 −74
−85 −86 −84
990.1 MHz −15 0 (Ref) N/A N/A N/A
−25 −26 −24
−35 −36 −34
−45 −46 −44
−55 −56 −54
−65 −66 −64
−75 −76 −74
−85 −86 −84
1350.1 MHz −15 0 (Ref) N/A N/A N/A
−25 −26 −24
−35 −36 −34
−45 −46 −44
−55 −56 −54
−65 −66 −64
−75 −76 −74
−85 −86 −84
1950.1 MHz −15 0 (Ref) N/A N/A N/A
−25 −26 −24
−35 −36 −34
−45 −46 −44
−55 −56 −54
−65 −66 −64
−75 −76 −74
−85 −86 −84
FrequencySetting
PowerLevel
Setting(dBm)
PowerMeter
Readingfor
−15 dBm
SpectrumAnalyzerMarker
(dB)
LowerLimit(dBm)
ActualPowerLevel(dBm)
UpperLimit(dBm)
2-16 Calibration Guide
ESG Family Signal Generators Operation VerificationVerification Procedures
2310.1 MHz −15 0 (Ref) N/A N/A N/A
−25 −26 −24
−35 −36 −34
−45 −46 −44
−55 −56 −54
−65 −66 −64
−75 −76 −74
−85 −86 −84
2985.1 MHz −15 0 (Ref) N/A N/A N/A
−25 −26 −24
−35 −36 −34
−45 −46 −44
−55 −56 −54
−65 −66 −64
−75 −76 −74
−85 −86 −84
3225.1 MHz −15 0 (Ref) N/A N/A N/A
−25 −26 −24
−35 −36 −34
−45 −46 −44
−55 −56 −54
−65 −66 −64
−75 −76 −74
−85 −86 −84
4000 MHz −15 0 (Ref) N/A N/A N/A
−25 −26 −24
−35 −36 −34
−45 −46 −44
−55 −56 −54
FrequencySetting
PowerLevel
Setting(dBm)
PowerMeter
Readingfor
−15 dBm
SpectrumAnalyzerMarker
(dB)
LowerLimit(dBm)
ActualPowerLevel(dBm)
UpperLimit(dBm)
Calibration Guide 2-17

Operation Verification ESG Family Signal GeneratorsVerification Procedures
−65 −66 −64
−75 −76 −74
−85 −86 −84
FrequencySetting
PowerLevel
Setting(dBm)
PowerMeter
Readingfor
−15 dBm
SpectrumAnalyzerMarker
(dB)
LowerLimit(dBm)
ActualPowerLevel(dBm)
UpperLimit(dBm)
2-18 Calibration Guide

ESG Family Signal Generators Operation VerificationVerification Procedures
Table 2-5 FM Accuracy
Table 2-6 AM Accuracy
Frequency(MHz)
Deviation(kHz)
Limits (kHz)
Lower Measured Upper
500.001 100 kHz 96.48 103.52
750 100 kHz 96.48 103.52
1000 100 kHz 96.48 103.52
Frequency(MHz) Depth (%)
Limits (%)
Lower Measured Upper
200 30 27.5 32.5
200 90 84.5 95.5
300 30 27.5 32.5
300 90 84.5 95.5
501 30 27.5 32.5
501 90 84.5 95.5
750 30 27.5 32.5
750 90 84.5 95.5
1000 30 27.5 32.5
1000 90 84.5 95.5
Calibration Guide 2-19
Operation Verification ESG Family Signal GeneratorsVerification Procedures
2-20 Calibration Guide
ESG Family Signal Generators
3 Service Software
The ESG Family Support Software contains the program and supporting files necessary torun the automated performance tests and adjustments for your signal generator. Thischapter lists the equipment required to run the software, and gives instructions forinstalling, administering, using and un-installing the software. For a description of theindividual performance tests and adjustments, refer to Chapter 4, “Performance Tests,”and Chapter 5, “Adjustments.”
Calibration Guide 3-1

Service Software ESG Family Signal GeneratorsRequired Test Equipment
Required Test EquipmentThe following equipment is required to run the software:
• Personal computer with the following specifications:
• 386/33 MHz CPU, or better
• 8 Mbytes of RAM
• Hard drive with at least 350 Mbytes free
• 16-color VGA monitor
• 3.5-inch disk drive
• MS Windows 3.x, MS Windows 95, or MS Windows NT.
• 2 Button Mouse (optional)
• Printer, MS Windows-supported (for test results documentation)
• HP 82341C/D GPIB Interface Card
• HP SICL Libraries must be installed and configured.
NOTE No other MS Windows programs may be running during installation. Closeany MS Windows programs that are currently running prior to starting theinstallation.
3-2 Calibration Guide
ESG Family Signal Generators Service SoftwareInstalling the ESG_B or ESG_APDP Service Software
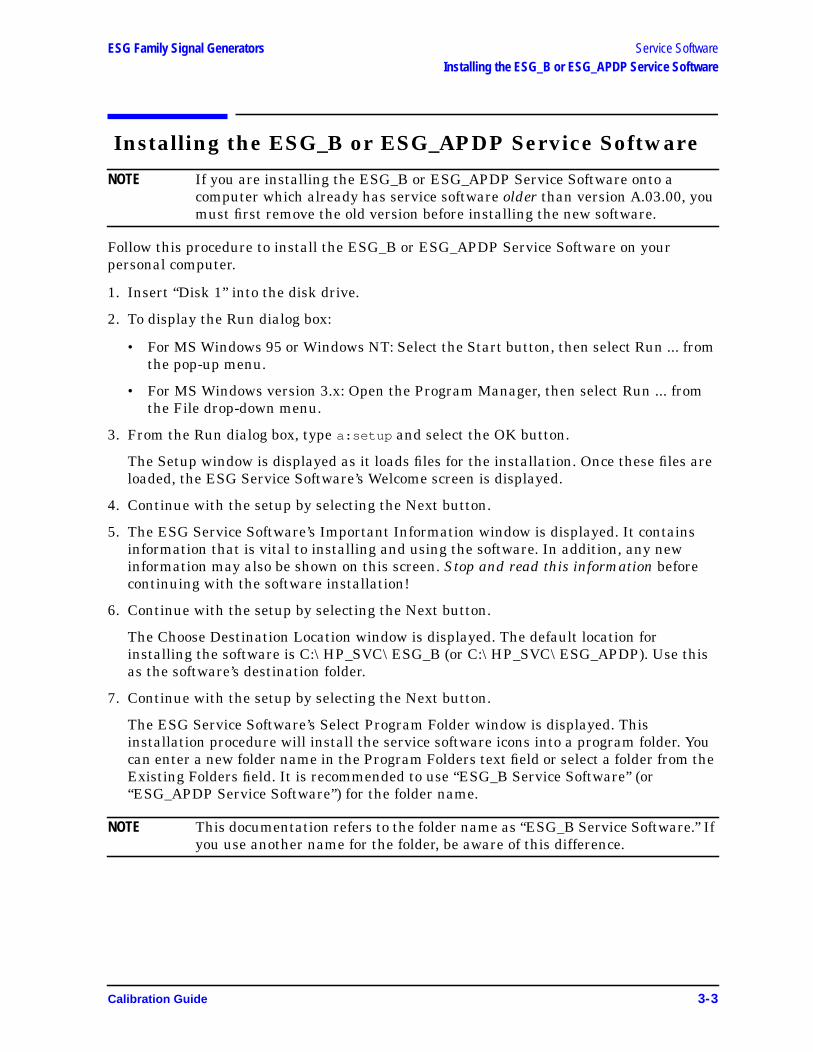
Installing the ESG_B or ESG_APDP Service Software
NOTE If you are installing the ESG_B or ESG_APDP Service Software onto acomputer which already has service software older than version A.03.00, youmust first remove the old version before installing the new software.
Follow this procedure to install the ESG_B or ESG_APDP Service Software on yourpersonal computer.
1. Insert “Disk 1” into the disk drive.
2. To display the Run dialog box:
• For MS Windows 95 or Windows NT: Select the Start button, then select Run ... fromthe pop-up menu.
• For MS Windows version 3.x: Open the Program Manager, then select Run ... fromthe File drop-down menu.
3. From the Run dialog box, type a:setup and select the OK button.
The Setup window is displayed as it loads files for the installation. Once these files areloaded, the ESG Service Software’s Welcome screen is displayed.
4. Continue with the setup by selecting the Next button.
5. The ESG Service Software’s Important Information window is displayed. It containsinformation that is vital to installing and using the software. In addition, any newinformation may also be shown on this screen. Stop and read this information beforecontinuing with the software installation!
6. Continue with the setup by selecting the Next button.
The Choose Destination Location window is displayed. The default location forinstalling the software is C:\HP_SVC\ESG_B (or C:\HP_SVC\ESG_APDP). Use thisas the software’s destination folder.
7. Continue with the setup by selecting the Next button.
The ESG Service Software’s Select Program Folder window is displayed. Thisinstallation procedure will install the service software icons into a program folder. Youcan enter a new folder name in the Program Folders text field or select a folder from theExisting Folders field. It is recommended to use “ESG_B Service Software” (or“ESG_APDP Service Software”) for the folder name.
NOTE This documentation refers to the folder name as “ESG_B Service Software.” Ifyou use another name for the folder, be aware of this difference.
Calibration Guide 3-3
Service Software ESG Family Signal GeneratorsInstalling the ESG_B or ESG_APDP Service Software
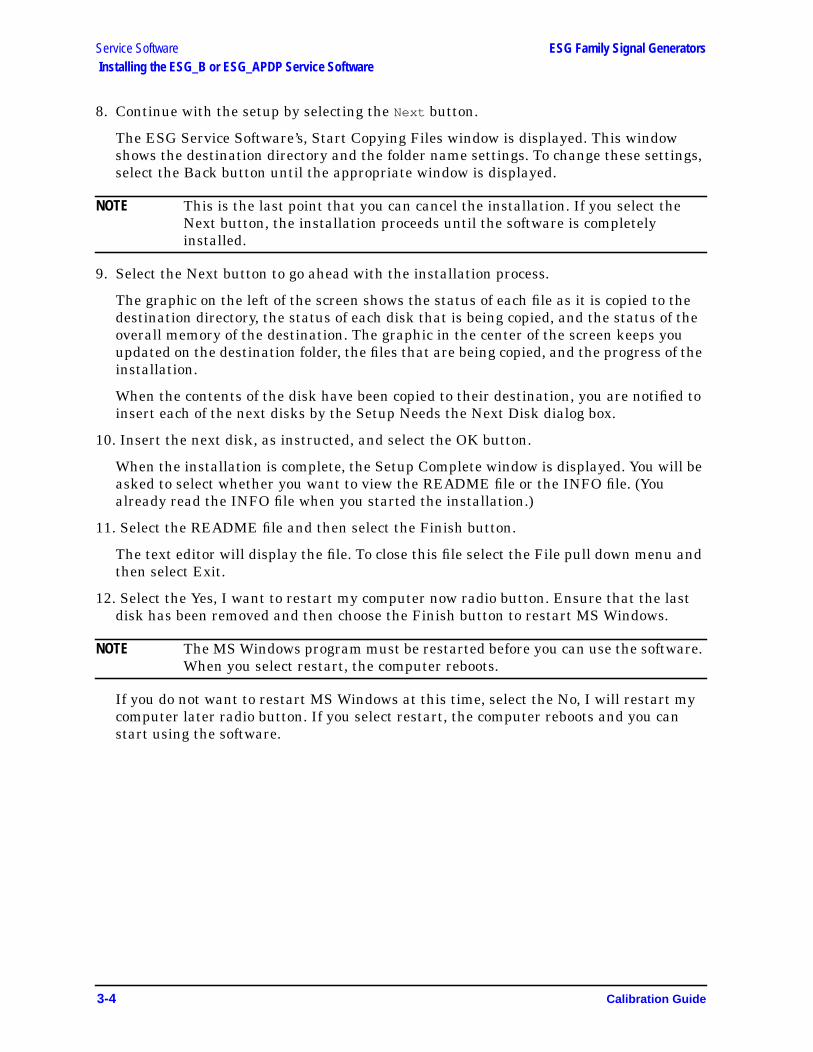
8. Continue with the setup by selecting the Next button.
The ESG Service Software’s, Start Copying Files window is displayed. This windowshows the destination directory and the folder name settings. To change these settings,select the Back button until the appropriate window is displayed.
NOTE This is the last point that you can cancel the installation. If you select theNext button, the installation proceeds until the software is completelyinstalled.
9. Select the Next button to go ahead with the installation process.
The graphic on the left of the screen shows the status of each file as it is copied to thedestination directory, the status of each disk that is being copied, and the status of theoverall memory of the destination. The graphic in the center of the screen keeps youupdated on the destination folder, the files that are being copied, and the progress of theinstallation.
When the contents of the disk have been copied to their destination, you are notified toinsert each of the next disks by the Setup Needs the Next Disk dialog box.
10. Insert the next disk, as instructed, and select the OK button.
When the installation is complete, the Setup Complete window is displayed. You will beasked to select whether you want to view the README file or the INFO file. (Youalready read the INFO file when you started the installation.)
11. Select the README file and then select the Finish button.
The text editor will display the file. To close this file select the File pull down menu andthen select Exit.
12. Select the Yes, I want to restart my computer now radio button. Ensure that the lastdisk has been removed and then choose the Finish button to restart MS Windows.
NOTE The MS Windows program must be restarted before you can use the software.When you select restart, the computer reboots.
If you do not want to restart MS Windows at this time, select the No, I will restart mycomputer later radio button. If you select restart, the computer reboots and you canstart using the software.
3-4 Calibration Guide
ESG Family Signal Generators Service SoftwareUninstalling the Software
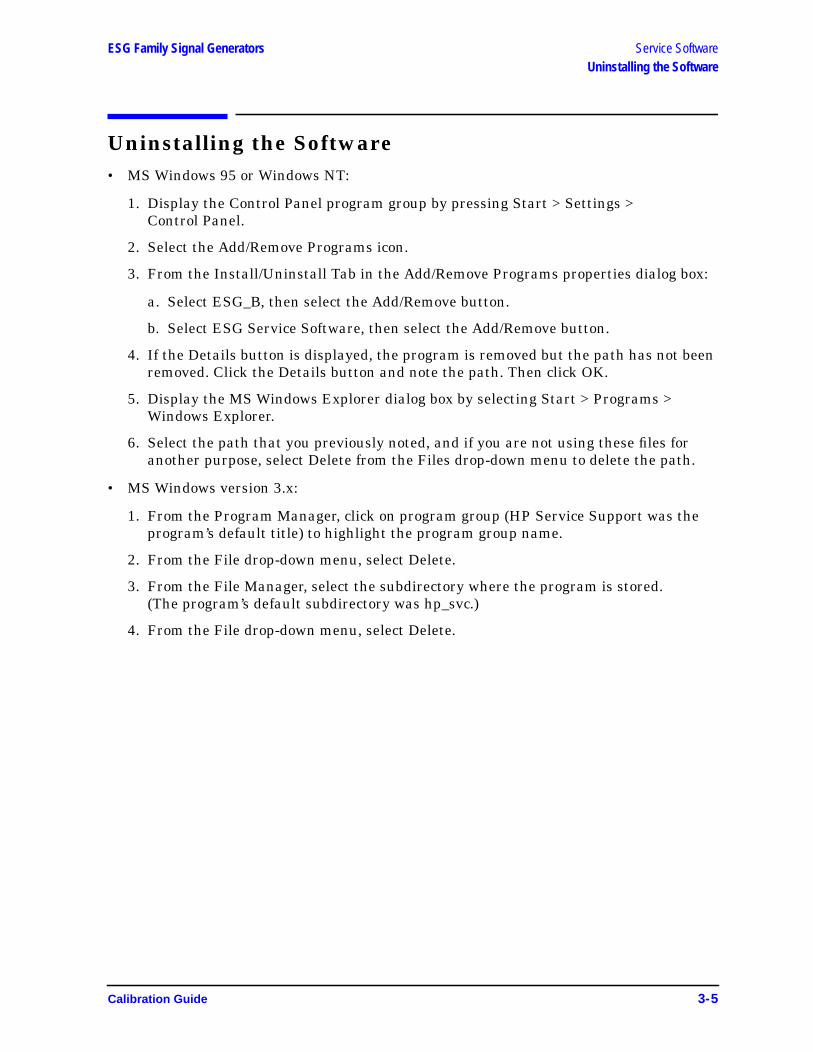
Uninstalling the Software• MS Windows 95 or Windows NT:
1. Display the Control Panel program group by pressing Start > Settings >Control Panel.
2. Select the Add/Remove Programs icon.
3. From the Install/Uninstall Tab in the Add/Remove Programs properties dialog box:
a. Select ESG_B, then select the Add/Remove button.
b. Select ESG Service Software, then select the Add/Remove button.
4. If the Details button is displayed, the program is removed but the path has not beenremoved. Click the Details button and note the path. Then click OK.
5. Display the MS Windows Explorer dialog box by selecting Start > Programs >Windows Explorer.
6. Select the path that you previously noted, and if you are not using these files foranother purpose, select Delete from the Files drop-down menu to delete the path.
• MS Windows version 3.x:
1. From the Program Manager, click on program group (HP Service Support was theprogram’s default title) to highlight the program group name.
2. From the File drop-down menu, select Delete.
3. From the File Manager, select the subdirectory where the program is stored.(The program’s default subdirectory was hp_svc.)
4. From the File drop-down menu, select Delete.
Calibration Guide 3-5

Service Software ESG Family Signal GeneratorsESG Family Support Software Administration
ESG Family Support Software AdministrationThe following section shows you how to administer and run the ESG Family SupportSoftware. The software’s administrative functions allow for the addition or removal of allnecessary test equipment, software drivers, and test procedures. This would includeadditional software drivers (as they are released) to extend the range of tests andequipment supported by the ESG family test set, or maintenance releases of the currentdrivers.
Software ConfigurationFollow the instructions below to configure the software to run in either User Mode orAdministration Mode.
Start the software using the steps appropriate for the version of MS Windows that isinstalled on your PC.
• For MS Windows version 3.x:
1. Open the Program Manager window.
2. Open the HP Service Support program group.
3. Open the HP Service Software icon.
• For MS Windows 95 or Windows NT:
1. Select Start.
2. Select HP Service Software for PC’s.
3. Select HP Service Software.
The service support software has two configurations: User and Administration. Thefollowing sections explain the difference between the two configurations.
Figure 3-1 The User Information Window
3-6 Calibration Guide
ESG Family Signal Generators Service SoftwareESG Family Support Software Administration
The User ConfigurationLogging on in User Configuration only allows access to the instrument’s performance testsand adjustments. Refer to “Starting the Software” on page 3-20.
The Administration ConfigurationLogging on in Administration Configuration supports all administrative functions,including the addition of new equipment and the installation of test procedures and devicedrivers.
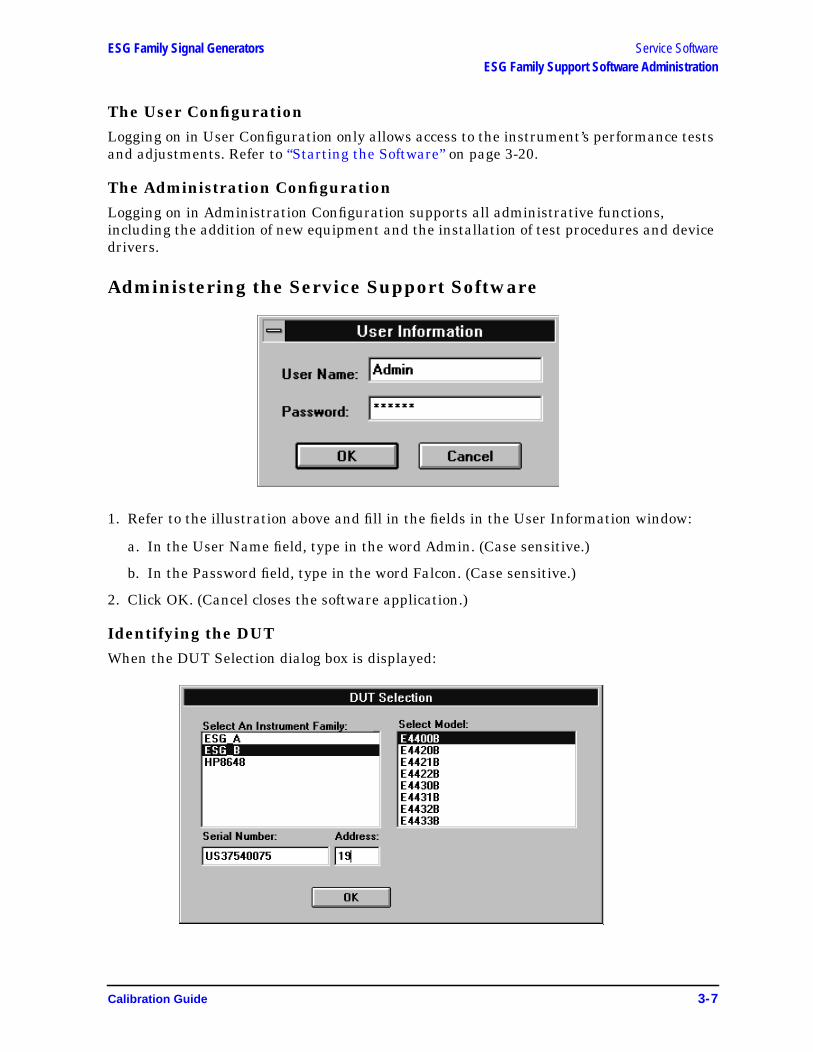
Administering the Service Support Software
1. Refer to the illustration above and fill in the fields in the User Information window:
a. In the User Name field, type in the word Admin. (Case sensitive.)
b. In the Password field, type in the word Falcon. (Case sensitive.)
2. Click OK. (Cancel closes the software application.)
Identifying the DUTWhen the DUT Selection dialog box is displayed:
Calibration Guide 3-7
Service Software ESG Family Signal GeneratorsESG Family Support Software Administration
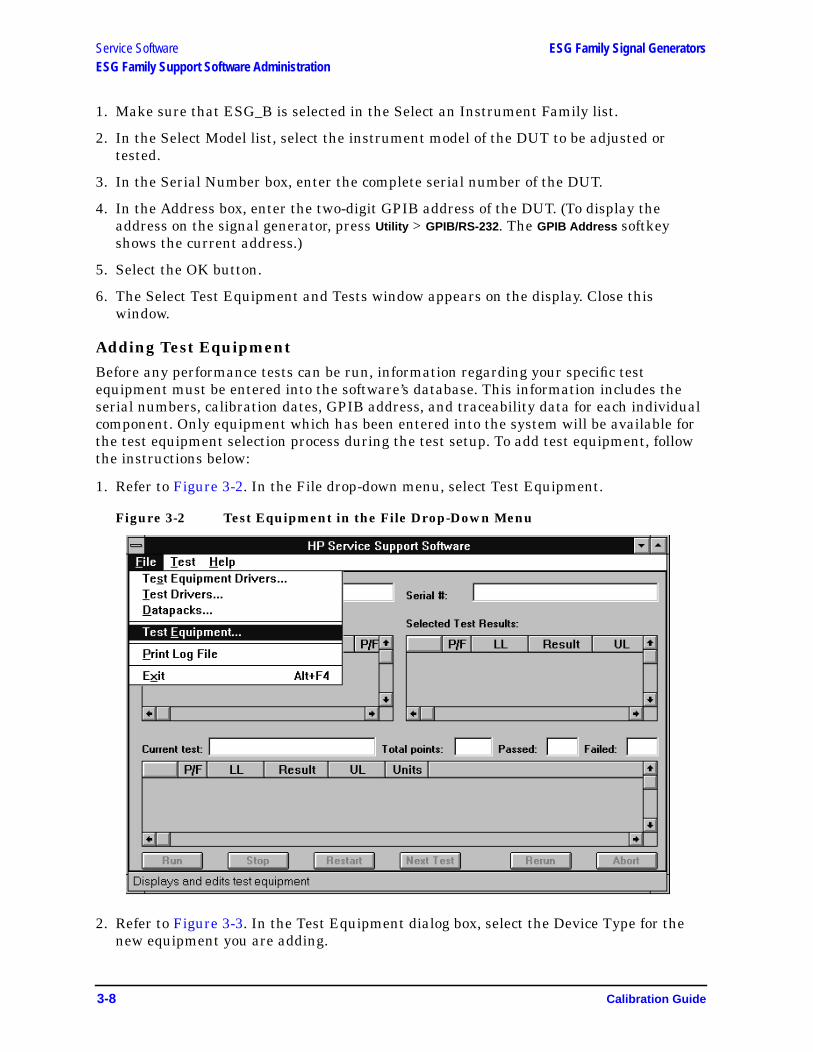
1. Make sure that ESG_B is selected in the Select an Instrument Family list.
2. In the Select Model list, select the instrument model of the DUT to be adjusted ortested.
3. In the Serial Number box, enter the complete serial number of the DUT.
4. In the Address box, enter the two-digit GPIB address of the DUT. (To display theaddress on the signal generator, press Utility > GPIB/RS-232. The GPIB Address softkeyshows the current address.)
5. Select the OK button.
6. The Select Test Equipment and Tests window appears on the display. Close thiswindow.
Adding Test EquipmentBefore any performance tests can be run, information regarding your specific testequipment must be entered into the software’s database. This information includes theserial numbers, calibration dates, GPIB address, and traceability data for each individualcomponent. Only equipment which has been entered into the system will be available forthe test equipment selection process during the test setup. To add test equipment, followthe instructions below:
1. Refer to Figure 3-2. In the File drop-down menu, select Test Equipment.
Figure 3-2 Test Equipment in the File Drop-Down Menu
2. Refer to Figure 3-3. In the Test Equipment dialog box, select the Device Type for thenew equipment you are adding.
3-8 Calibration Guide
ESG Family Signal Generators Service SoftwareESG Family Support Software Administration
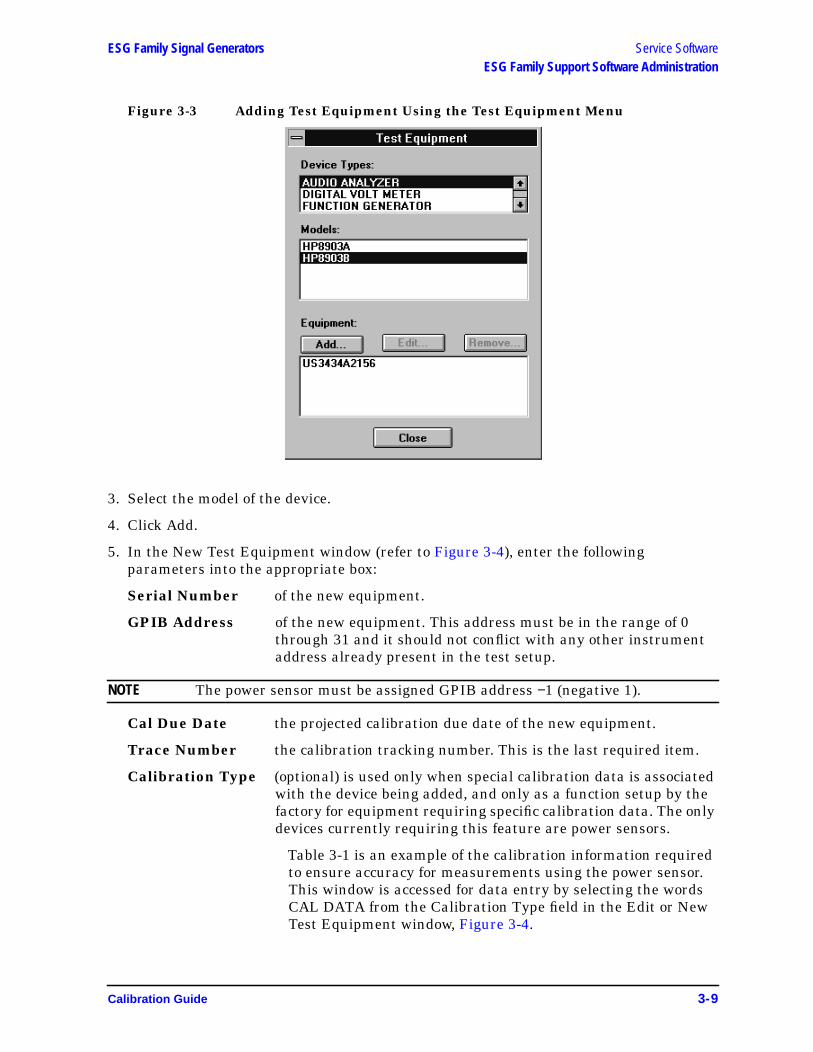
Figure 3-3 Adding Test Equipment Using the Test Equipment Menu
3. Select the model of the device.
4. Click Add.
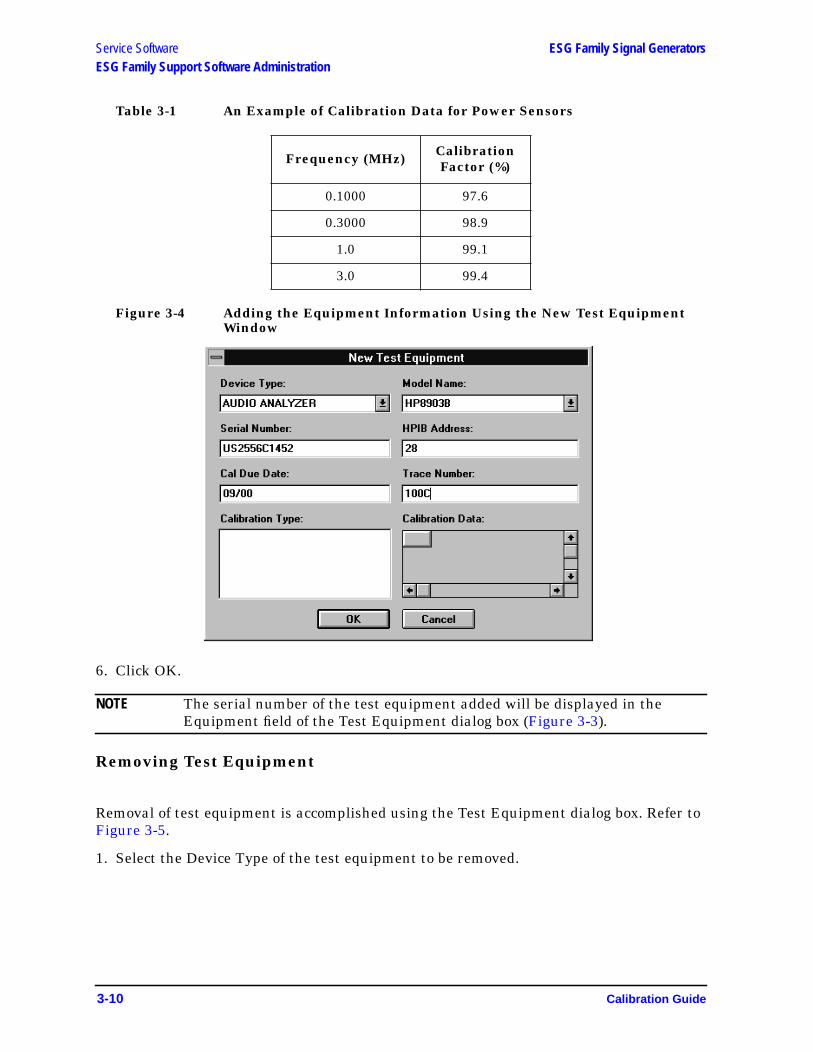
5. In the New Test Equipment window (refer to Figure 3-4), enter the followingparameters into the appropriate box:
Serial Number of the new equipment.
GPIB Address of the new equipment. This address must be in the range of 0through 31 and it should not conflict with any other instrumentaddress already present in the test setup.
NOTE The power sensor must be assigned GPIB address −1 (negative 1).
Cal Due Date the projected calibration due date of the new equipment.
Trace Number the calibration tracking number. This is the last required item.
Calibration Type (optional) is used only when special calibration data is associatedwith the device being added, and only as a function setup by thefactory for equipment requiring specific calibration data. The onlydevices currently requiring this feature are power sensors.
Table 3-1 is an example of the calibration information requiredto ensure accuracy for measurements using the power sensor.This window is accessed for data entry by selecting the wordsCAL DATA from the Calibration Type field in the Edit or NewTest Equipment window, Figure 3-4.
Calibration Guide 3-9
Service Software ESG Family Signal GeneratorsESG Family Support Software Administration
Table 3-1 An Example of Calibration Data for Power Sensors
Figure 3-4 Adding the Equipment Information Using the New Test EquipmentWindow
6. Click OK.
NOTE The serial number of the test equipment added will be displayed in theEquipment field of the Test Equipment dialog box (Figure 3-3).
Removing Test Equipment
Removal of test equipment is accomplished using the Test Equipment dialog box. Refer toFigure 3-5.
1. Select the Device Type of the test equipment to be removed.
Frequency (MHz) CalibrationFactor (%)
0.1000 97.6
0.3000 98.9
1.0 99.1
3.0 99.4
3-10 Calibration Guide
ESG Family Signal Generators Service SoftwareESG Family Support Software Administration
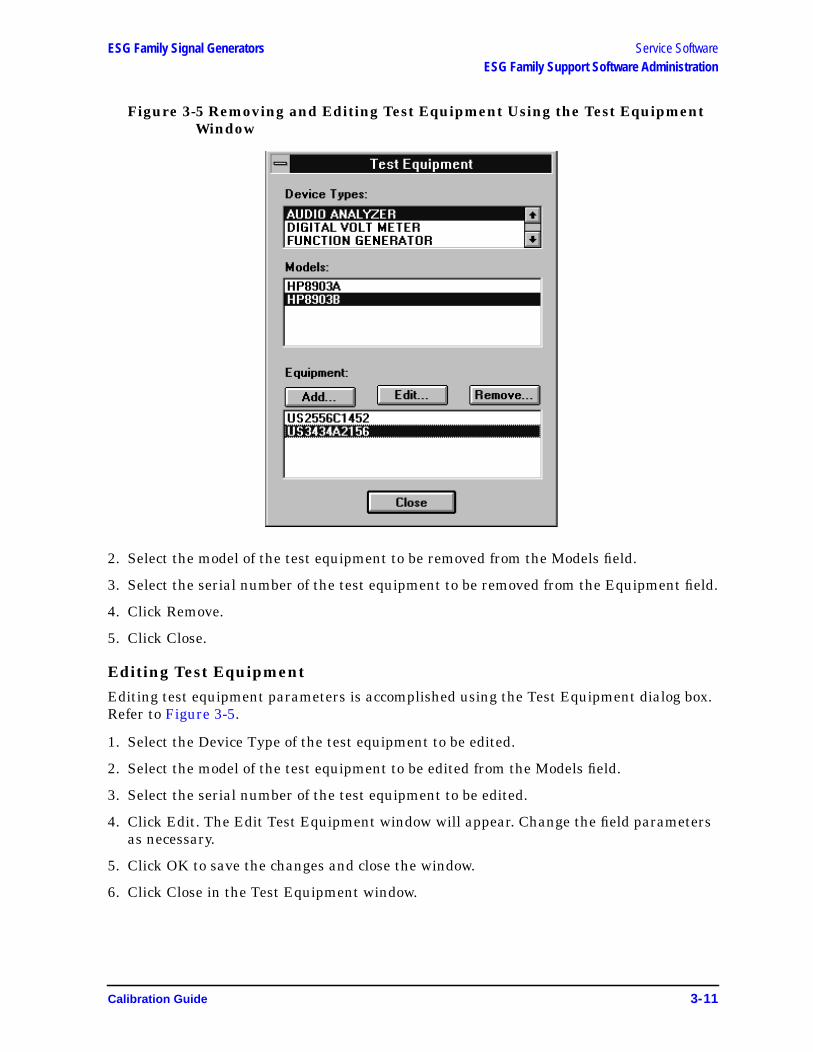
Figure 3-5 Removing and Editing Test Equipment Using the Test EquipmentWindow
2. Select the model of the test equipment to be removed from the Models field.
3. Select the serial number of the test equipment to be removed from the Equipment field.
4. Click Remove.
5. Click Close.
Editing Test EquipmentEditing test equipment parameters is accomplished using the Test Equipment dialog box.Refer to Figure 3-5.
1. Select the Device Type of the test equipment to be edited.
2. Select the model of the test equipment to be edited from the Models field.
3. Select the serial number of the test equipment to be edited.
4. Click Edit. The Edit Test Equipment window will appear. Change the field parametersas necessary.
5. Click OK to save the changes and close the window.
6. Click Close in the Test Equipment window.
Calibration Guide 3-11
Service Software ESG Family Signal GeneratorsESG Family Support Software Administration
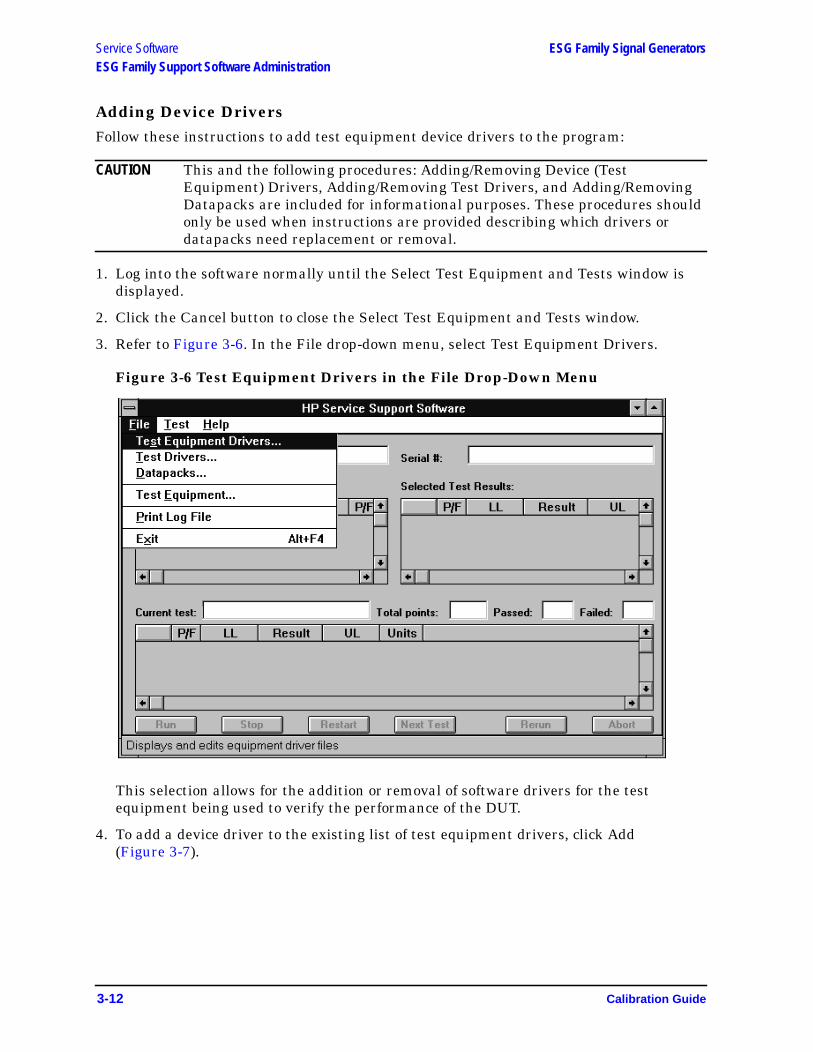
Adding Device DriversFollow these instructions to add test equipment device drivers to the program:
CAUTION This and the following procedures: Adding/Removing Device (TestEquipment) Drivers, Adding/Removing Test Drivers, and Adding/RemovingDatapacks are included for informational purposes. These procedures shouldonly be used when instructions are provided describing which drivers ordatapacks need replacement or removal.
1. Log into the software normally until the Select Test Equipment and Tests window isdisplayed.
2. Click the Cancel button to close the Select Test Equipment and Tests window.
3. Refer to Figure 3-6. In the File drop-down menu, select Test Equipment Drivers.
Figure 3-6 Test Equipment Drivers in the File Drop-Down Menu
This selection allows for the addition or removal of software drivers for the testequipment being used to verify the performance of the DUT.
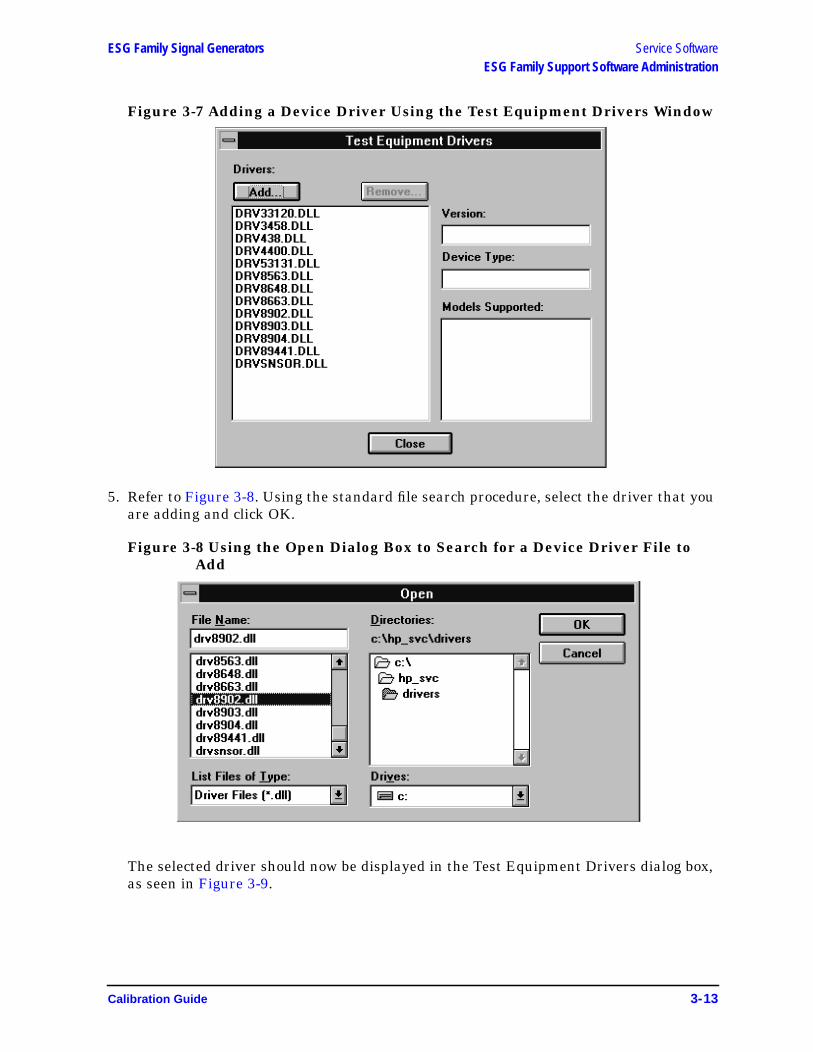
4. To add a device driver to the existing list of test equipment drivers, click Add(Figure 3-7).
3-12 Calibration Guide
ESG Family Signal Generators Service SoftwareESG Family Support Software Administration
Figure 3-7 Adding a Device Driver Using the Test Equipment Drivers Window
5. Refer to Figure 3-8. Using the standard file search procedure, select the driver that youare adding and click OK.
Figure 3-8 Using the Open Dialog Box to Search for a Device Driver File toAdd
The selected driver should now be displayed in the Test Equipment Drivers dialog box,as seen in Figure 3-9.
Calibration Guide 3-13

Service Software ESG Family Signal GeneratorsESG Family Support Software Administration
Removing Device DriversRemoving device drivers is accomplished using the Test Equipment Drivers dialog box.Refer to Figure 3-9.
1. Select the driver (.dll) file to be removed.
Figure 3-9 Removing a Device Driver Using the Test Equipment DriversWindow
2. Ensure that the information displayed in the Version, Device Type, and ModelsSupported fields reflects the correct information for the selected driver being removed.
3. Click Remove.
4. Click Close.
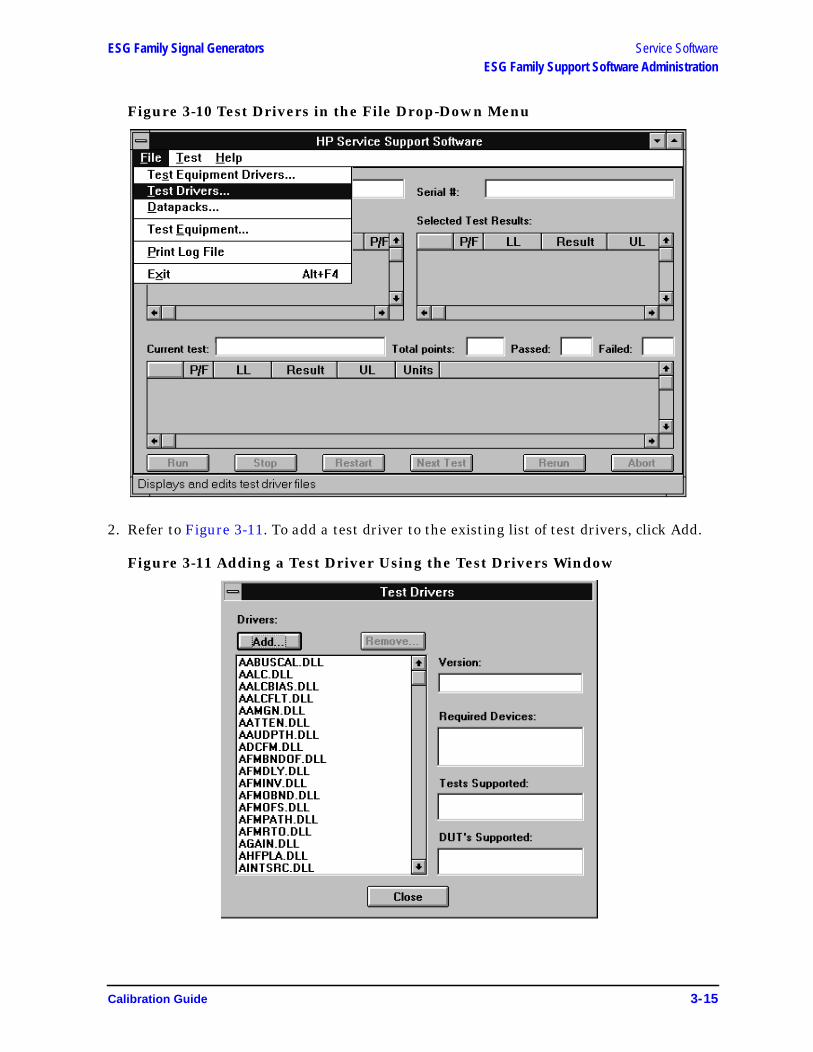
Adding Test DriversAdding software drivers is accomplished using the Test Drivers window.
1. Refer to Figure 3-10. In the File drop-down menu, select Test Drivers.
3-14 Calibration Guide
ESG Family Signal Generators Service SoftwareESG Family Support Software Administration
Figure 3-10 Test Drivers in the File Drop-Down Menu
2. Refer to Figure 3-11. To add a test driver to the existing list of test drivers, click Add.
Figure 3-11 Adding a Test Driver Using the Test Drivers Window
Calibration Guide 3-15
Service Software ESG Family Signal GeneratorsESG Family Support Software Administration
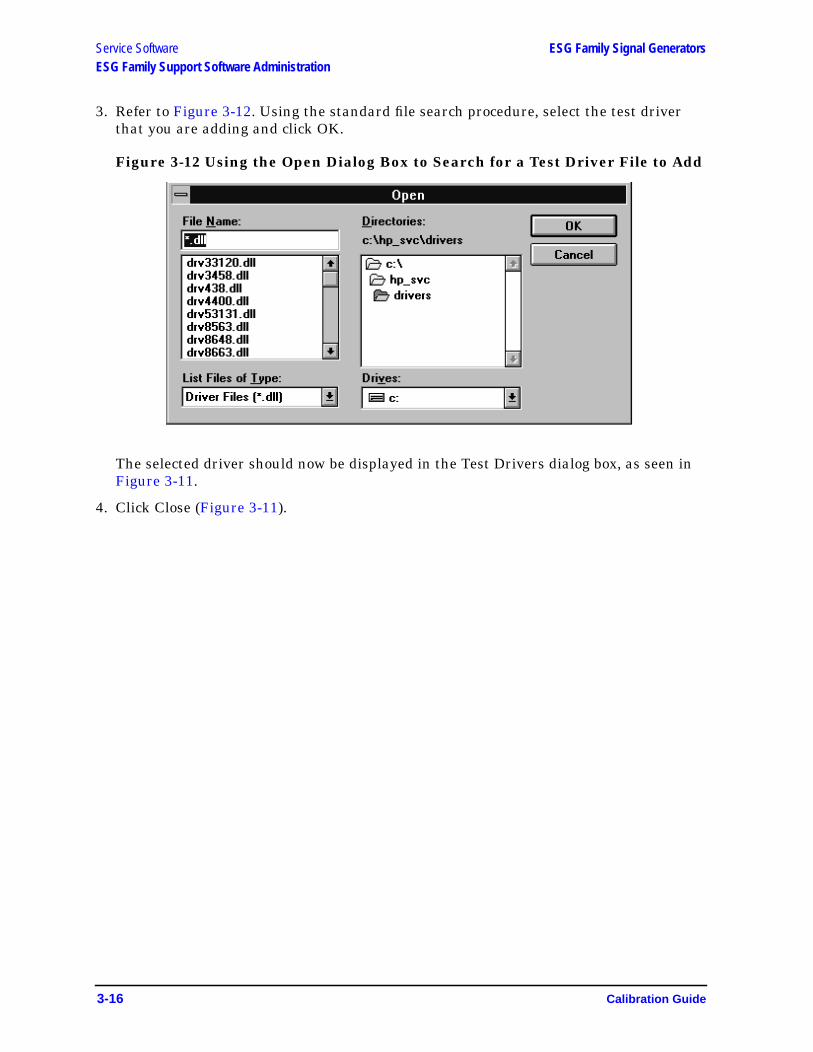
3. Refer to Figure 3-12. Using the standard file search procedure, select the test driverthat you are adding and click OK.
Figure 3-12 Using the Open Dialog Box to Search for a Test Driver File to Add
The selected driver should now be displayed in the Test Drivers dialog box, as seen inFigure 3-11.
4. Click Close (Figure 3-11).
3-16 Calibration Guide
ESG Family Signal Generators Service SoftwareESG Family Support Software Administration
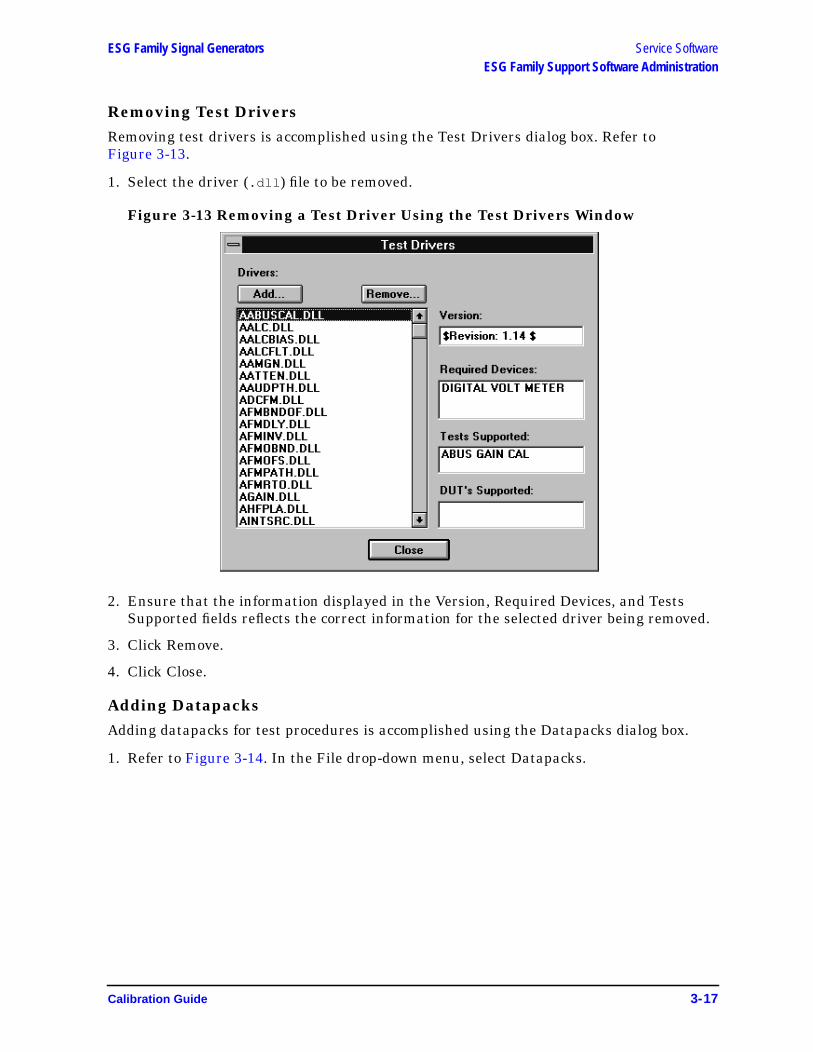
Removing Test DriversRemoving test drivers is accomplished using the Test Drivers dialog box. Refer toFigure 3-13.
1. Select the driver (.dll ) file to be removed.
Figure 3-13 Removing a Test Driver Using the Test Drivers Window
2. Ensure that the information displayed in the Version, Required Devices, and TestsSupported fields reflects the correct information for the selected driver being removed.
3. Click Remove.
4. Click Close.
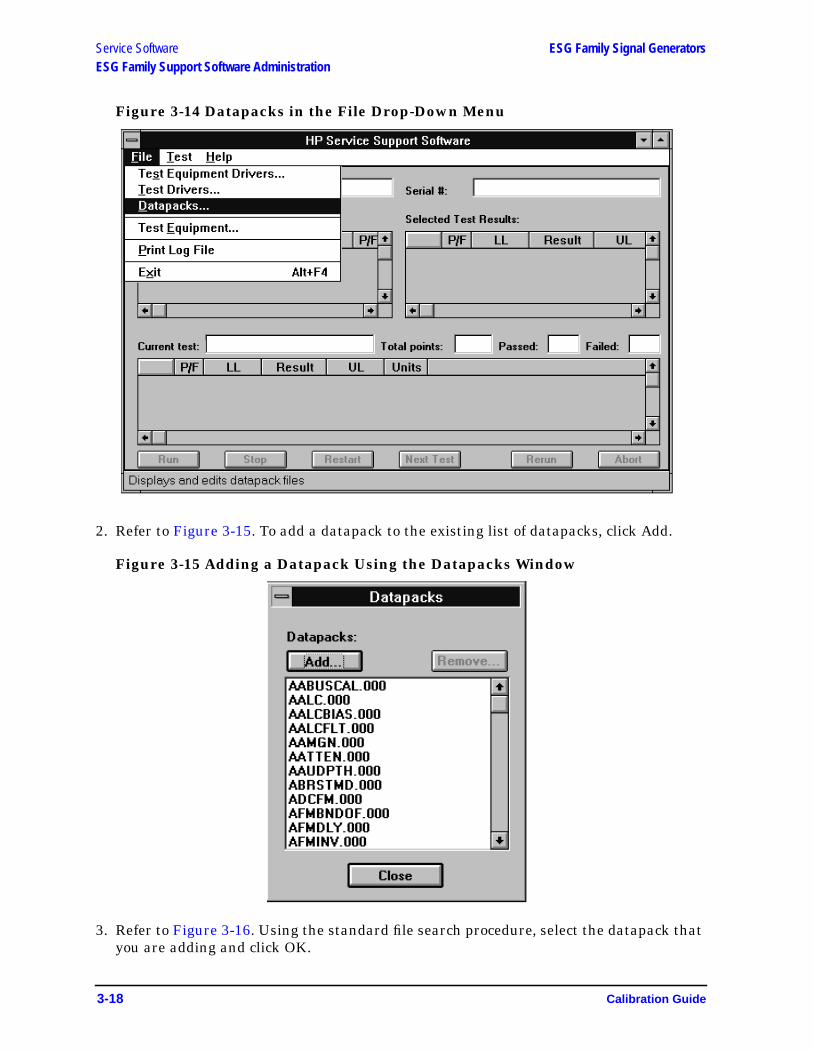
Adding DatapacksAdding datapacks for test procedures is accomplished using the Datapacks dialog box.
1. Refer to Figure 3-14. In the File drop-down menu, select Datapacks.
Calibration Guide 3-17
Service Software ESG Family Signal GeneratorsESG Family Support Software Administration
Figure 3-14 Datapacks in the File Drop-Down Menu
2. Refer to Figure 3-15. To add a datapack to the existing list of datapacks, click Add.
Figure 3-15 Adding a Datapack Using the Datapacks Window
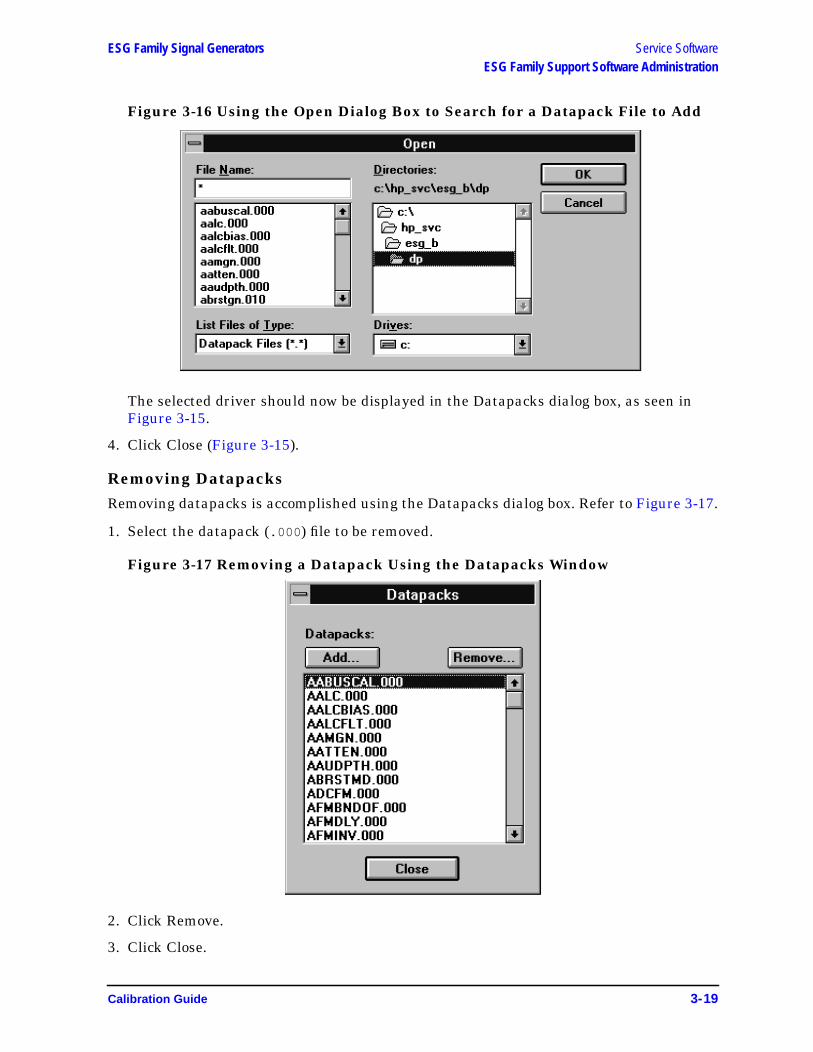
3. Refer to Figure 3-16. Using the standard file search procedure, select the datapack thatyou are adding and click OK.
3-18 Calibration Guide
ESG Family Signal Generators Service SoftwareESG Family Support Software Administration
Figure 3-16 Using the Open Dialog Box to Search for a Datapack File to Add
The selected driver should now be displayed in the Datapacks dialog box, as seen inFigure 3-15.
4. Click Close (Figure 3-15).
Removing DatapacksRemoving datapacks is accomplished using the Datapacks dialog box. Refer to Figure 3-17.
1. Select the datapack (.000 ) file to be removed.
Figure 3-17 Removing a Datapack Using the Datapacks Window
2. Click Remove.
3. Click Close.
Calibration Guide 3-19

Service Software ESG Family Signal GeneratorsRunning the Service Support Software
Running the Service Support Software
Starting the Software
1. Start the software using the steps appropriate for the version of MS Windows that isinstalled on your PC.
• For MS Windows 95:
a. Select Start.
b. Select HP Service Support for PC’s.
c. Select HP Service Software.
• For MS Windows version 3.x:
a. Open the Program Manager window.
b. Open the HP Service Support program group.
c. Select the HP Service Support icon.
2. Once the User Information dialog box is displayed, enter the user name and thepassword.
a. In the User Name box, enter User. (Case sensitive.)
b. In the Password box, enter User. (Case sensitive.)
c. Click OK.
3-20 Calibration Guide
ESG Family Signal Generators Service SoftwareRunning the Service Support Software
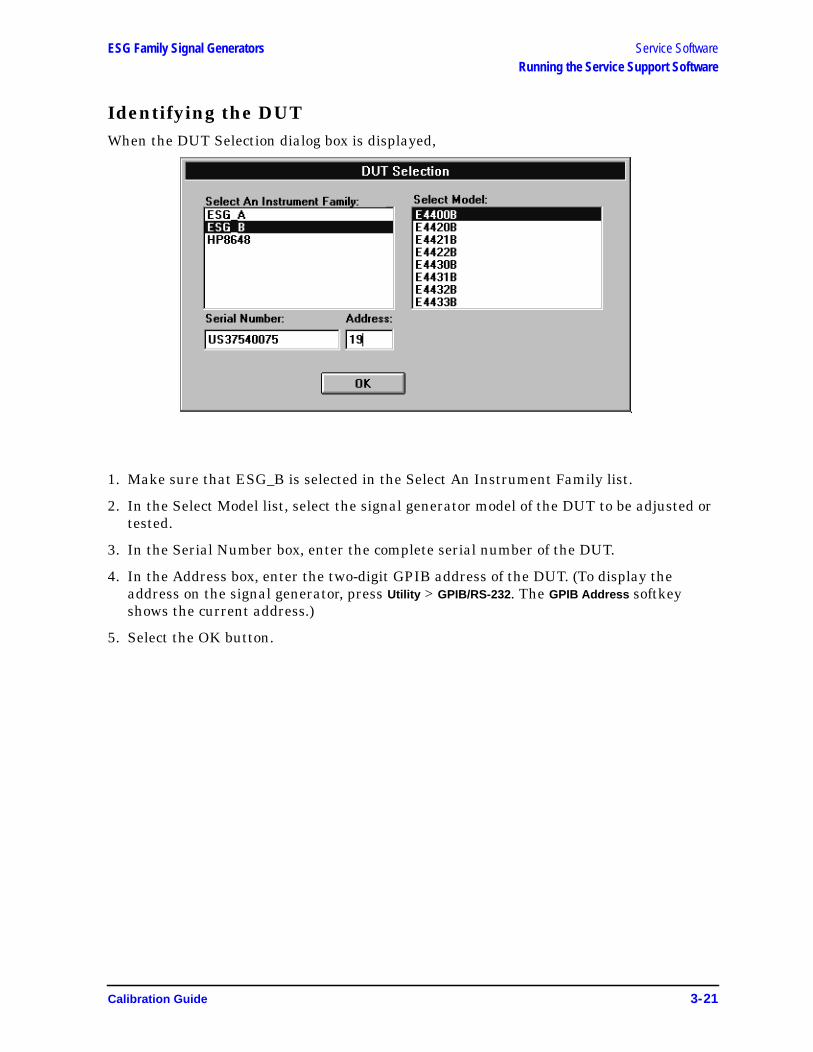
Identifying the DUTWhen the DUT Selection dialog box is displayed,
1. Make sure that ESG_B is selected in the Select An Instrument Family list.
2. In the Select Model list, select the signal generator model of the DUT to be adjusted ortested.
3. In the Serial Number box, enter the complete serial number of the DUT.
4. In the Address box, enter the two-digit GPIB address of the DUT. (To display theaddress on the signal generator, press Utility > GPIB/RS-232. The GPIB Address softkeyshows the current address.)
5. Select the OK button.
Calibration Guide 3-21

Service Software ESG Family Signal GeneratorsRunning the Service Support Software
Selecting Performance Tests or Adjustments and the TestEquipmentWhen the Select Test Equipment and Tests window is displayed,
1. Select either the Performance Tests radio button to display the list of automatedperformance tests or the Adjustments radio button to display the list of automatedadjustments.
2. From the list of performance tests or adjustments, select the tests or adjustments thatwill be performed on the DUT. Select a test name by clicking on it (the DCFMFREQUENCY OFFSET test will be selected for the sections following). The selectedtest will be highlighted.
Select all of the performance tests or adjustments by selecting the Select All button.Unselect all of the selected tests or adjustments by choosing the Unselect button.
As each test or adjustment is selected, the test equipment required to perform the testor adjustment is listed in the Required Test Equipment box. As each test or adjustmentis removed from the list, the test equipment required to perform the test or adjustmentis removed from the list. Only the test equipment for the highlighted tests is displayedin the list.
3-22 Calibration Guide
ESG Family Signal Generators Service SoftwareRunning the Service Support Software
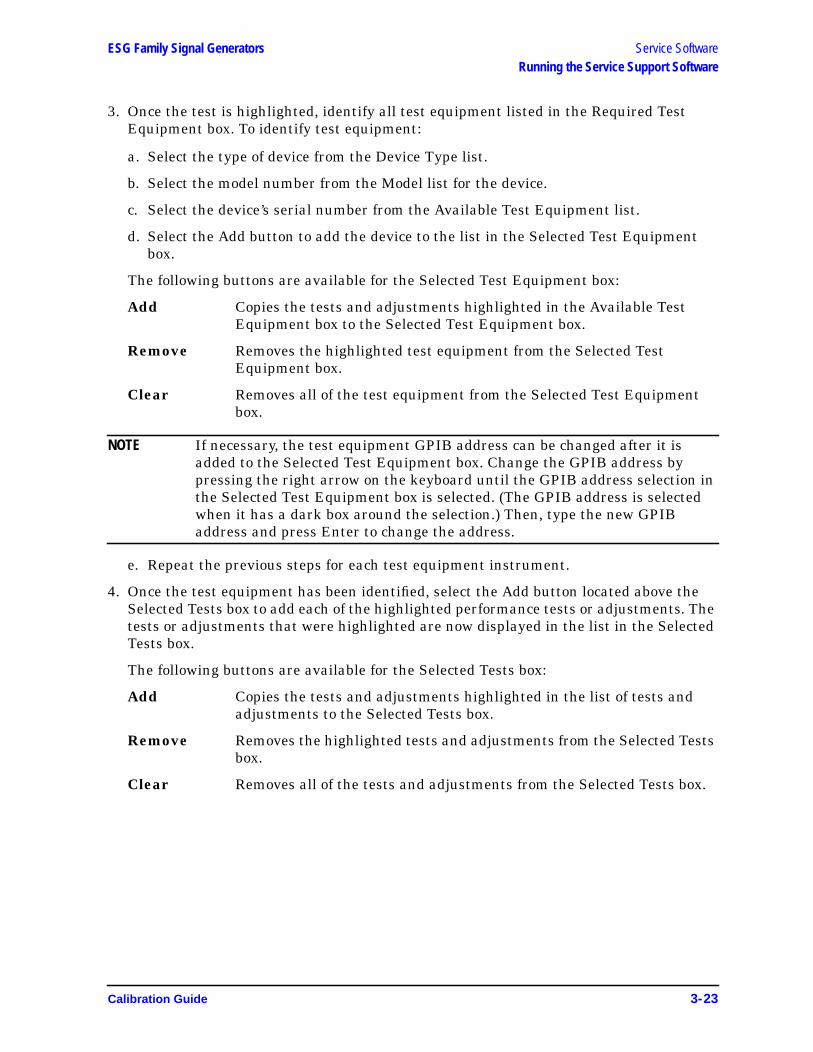
3. Once the test is highlighted, identify all test equipment listed in the Required TestEquipment box. To identify test equipment:
a. Select the type of device from the Device Type list.
b. Select the model number from the Model list for the device.
c. Select the device’s serial number from the Available Test Equipment list.
d. Select the Add button to add the device to the list in the Selected Test Equipmentbox.
The following buttons are available for the Selected Test Equipment box:
Add Copies the tests and adjustments highlighted in the Available TestEquipment box to the Selected Test Equipment box.
Remove Removes the highlighted test equipment from the Selected TestEquipment box.
Clear Removes all of the test equipment from the Selected Test Equipmentbox.
NOTE If necessary, the test equipment GPIB address can be changed after it isadded to the Selected Test Equipment box. Change the GPIB address bypressing the right arrow on the keyboard until the GPIB address selection inthe Selected Test Equipment box is selected. (The GPIB address is selectedwhen it has a dark box around the selection.) Then, type the new GPIBaddress and press Enter to change the address.
e. Repeat the previous steps for each test equipment instrument.
4. Once the test equipment has been identified, select the Add button located above theSelected Tests box to add each of the highlighted performance tests or adjustments. Thetests or adjustments that were highlighted are now displayed in the list in the SelectedTests box.
The following buttons are available for the Selected Tests box:
Add Copies the tests and adjustments highlighted in the list of tests andadjustments to the Selected Tests box.
Remove Removes the highlighted tests and adjustments from the Selected Testsbox.
Clear Removes all of the tests and adjustments from the Selected Tests box.
Calibration Guide 3-23
Service Software ESG Family Signal GeneratorsRunning the Service Support Software
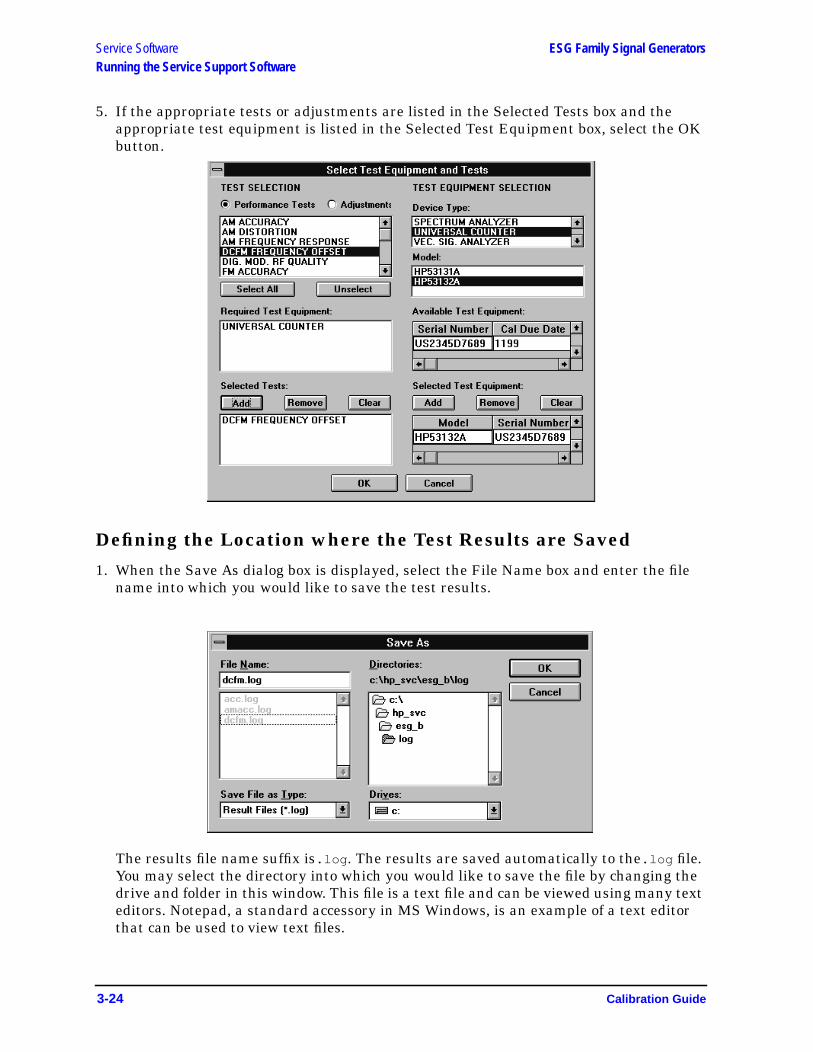
5. If the appropriate tests or adjustments are listed in the Selected Tests box and theappropriate test equipment is listed in the Selected Test Equipment box, select the OKbutton.
Defining the Location where the Test Results are Saved
1. When the Save As dialog box is displayed, select the File Name box and enter the filename into which you would like to save the test results.
The results file name suffix is.log . The results are saved automatically to the.log file.You may select the directory into which you would like to save the file by changing thedrive and folder in this window. This file is a text file and can be viewed using many texteditors. Notepad, a standard accessory in MS Windows, is an example of a text editorthat can be used to view text files.
3-24 Calibration Guide
ESG Family Signal Generators Service SoftwareRunning the Service Support Software
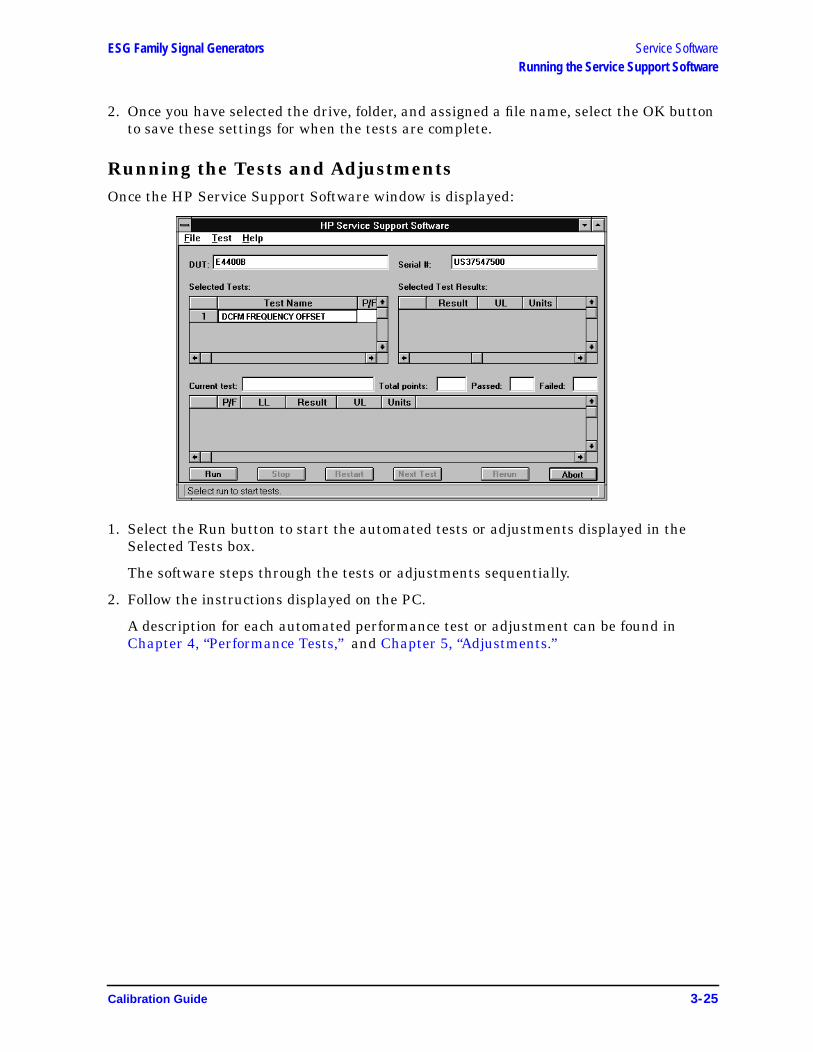
2. Once you have selected the drive, folder, and assigned a file name, select the OK buttonto save these settings for when the tests are complete.
Running the Tests and AdjustmentsOnce the HP Service Support Software window is displayed:
1. Select the Run button to start the automated tests or adjustments displayed in theSelected Tests box.
The software steps through the tests or adjustments sequentially.
2. Follow the instructions displayed on the PC.
A description for each automated performance test or adjustment can be found inChapter 4, “Performance Tests,” and Chapter 5, “Adjustments.”
Calibration Guide 3-25
Service Software ESG Family Signal GeneratorsRunning the Service Support Software
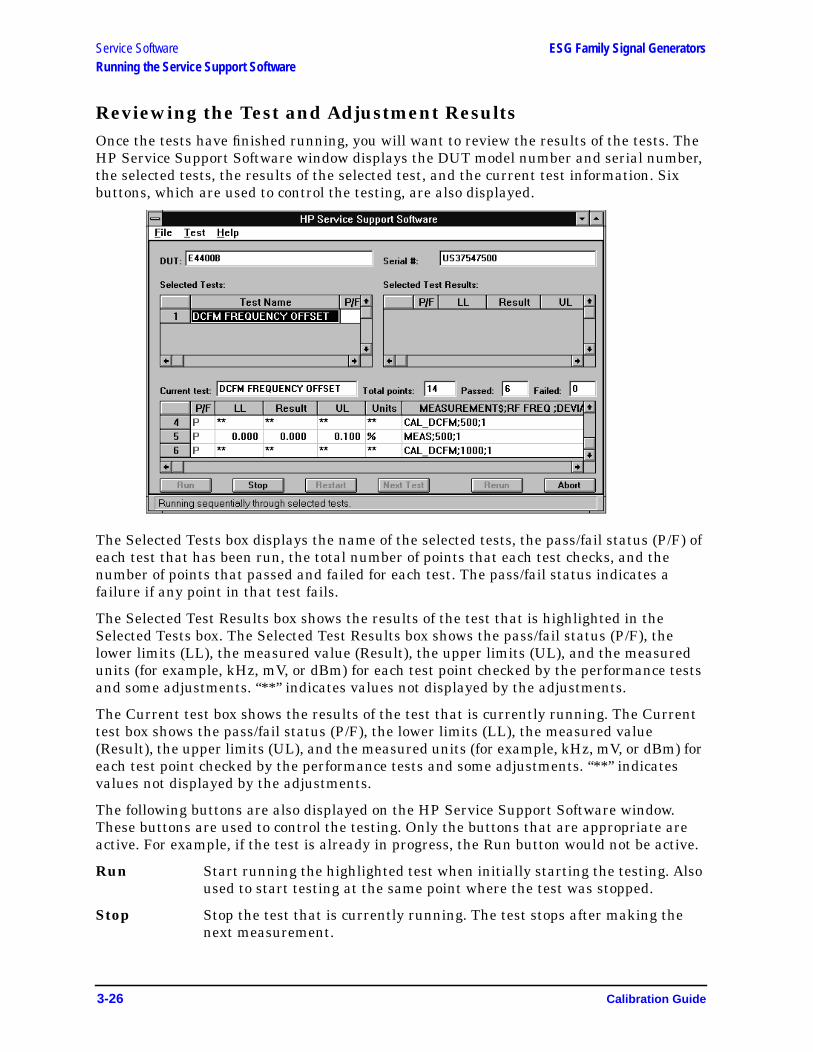
Reviewing the Test and Adjustment ResultsOnce the tests have finished running, you will want to review the results of the tests. TheHP Service Support Software window displays the DUT model number and serial number,the selected tests, the results of the selected test, and the current test information. Sixbuttons, which are used to control the testing, are also displayed.
The Selected Tests box displays the name of the selected tests, the pass/fail status (P/F) ofeach test that has been run, the total number of points that each test checks, and thenumber of points that passed and failed for each test. The pass/fail status indicates afailure if any point in that test fails.
The Selected Test Results box shows the results of the test that is highlighted in theSelected Tests box. The Selected Test Results box shows the pass/fail status (P/F), thelower limits (LL), the measured value (Result), the upper limits (UL), and the measuredunits (for example, kHz, mV, or dBm) for each test point checked by the performance testsand some adjustments. “**” indicates values not displayed by the adjustments.
The Current test box shows the results of the test that is currently running. The Currenttest box shows the pass/fail status (P/F), the lower limits (LL), the measured value(Result), the upper limits (UL), and the measured units (for example, kHz, mV, or dBm) foreach test point checked by the performance tests and some adjustments. “**” indicatesvalues not displayed by the adjustments.
The following buttons are also displayed on the HP Service Support Software window.These buttons are used to control the testing. Only the buttons that are appropriate areactive. For example, if the test is already in progress, the Run button would not be active.
Run Start running the highlighted test when initially starting the testing. Alsoused to start testing at the same point where the test was stopped.
Stop Stop the test that is currently running. The test stops after making thenext measurement.
3-26 Calibration Guide
ESG Family Signal Generators Service SoftwareRunning the Service Support Software
Restart Rerun a test that was running when the testing was stopped. This restartsthe test from the beginning.
Next Test Quit running the current test and give it a Fail status. Then, continuetesting with the next test.
Rerun Restart the testing at the beginning of the first test.
Abort Quit testing. Abort all tests.
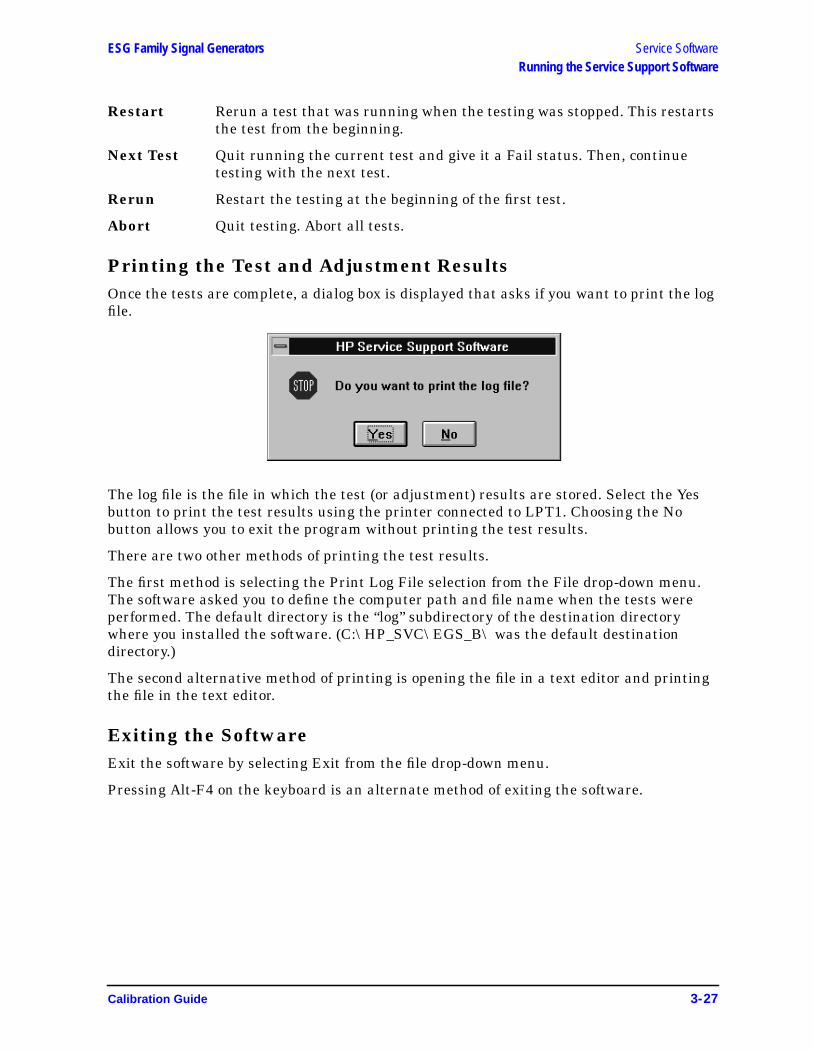
Printing the Test and Adjustment ResultsOnce the tests are complete, a dialog box is displayed that asks if you want to print the logfile.
The log file is the file in which the test (or adjustment) results are stored. Select the Yesbutton to print the test results using the printer connected to LPT1. Choosing the Nobutton allows you to exit the program without printing the test results.
There are two other methods of printing the test results.
The first method is selecting the Print Log File selection from the File drop-down menu.The software asked you to define the computer path and file name when the tests wereperformed. The default directory is the “log” subdirectory of the destination directorywhere you installed the software. (C:\HP_SVC\EGS_B\ was the default destinationdirectory.)
The second alternative method of printing is opening the file in a text editor and printingthe file in the text editor.
Exiting the SoftwareExit the software by selecting Exit from the file drop-down menu.
Pressing Alt-F4 on the keyboard is an alternate method of exiting the software.
Calibration Guide 3-27

Service Software ESG Family Signal GeneratorsRunning the Service Support Software
3-28 Calibration Guide
ESG Family Signal Generators
4 Performance Tests
Unless stated otherwise, the procedures in this chapter enable you to test the electricalperformance of the signal generator to its specifications.
Calibration Guide 4-1
Performance Tests ESG Family Signal Generators
Calibration Cycle
This instrument requires periodic verification of performance. Under normal use andenvironmental conditions, the instrument should be calibrated every two years. Normaluse is defined as about 2,000 hours of use per year.
Performance Test Records
Unless stated differently, the ESG Family Support Software can print a test record thatcontains the results of the automated performance tests. For each of the two manualperformance tests, “Timebase Aging Rate (ESG-AP, ESG-DP or Option 1E5 only)” and“Measuring Phase Noise and Residual FM (ESG-AP and ESG-DP Series SignalGenerators),” a performance test record is located at the end of this chapter so it can bephotocopied for use.
Recommended Test Equipment
The recommended test equipment table, located in Chapter 1, “Equipment Required,” isthe complete list of equipment required to perform the procedures in this chapter. Testequipment is also listed with each test and is shown in the test setup. However, to avoidclutter in the figures, the controller required to run the support software is not shown inthe test setup for each automated test. The controller must be connected via GPIB to all ofthe test equipment in the currently selected automated tests. For performance tests, otherequipment can be substituted for the recommended models if it meets or exceeds thecritical specifications listed in Chapter 1, “Equipment Required.” For the adjustmentprocedures, no equipment substitutions are available.
4-2 Calibration Guide
ESG Family Signal Generators Performance TestsSupport Software
Support SoftwareThe ESG Family Support Software runs performance tests and where applicable,generates reports of the results for the tests. The following manual tests are not listed inthe software:
This chapter shows how to run the software to test and verify the performance of a signalgenerator. Chapter 3, “Service Software,” explains how to set up the software for aparticular set of test instruments and interfaced components in a test environment.
Running the Performance Tests
1. Load the support software into the personal computer. Refer to Chapter 3, “ServiceSoftware,” for installation instructions.
2. Click on the installed support software icon.
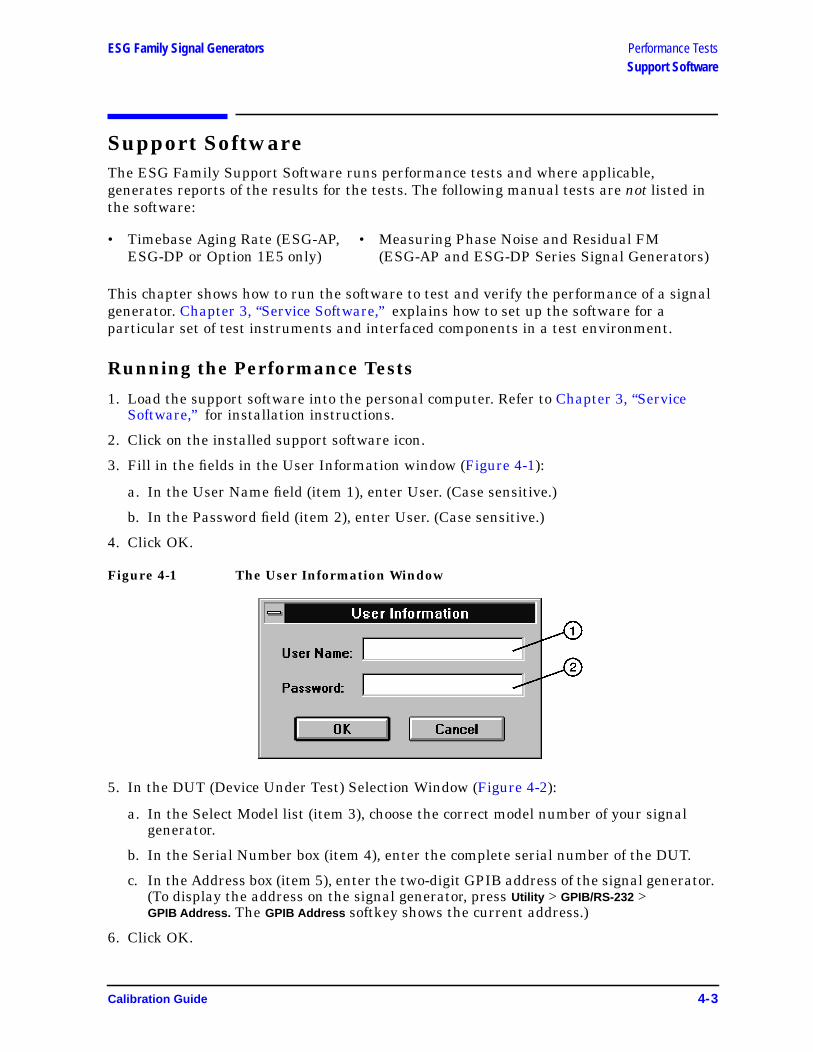
3. Fill in the fields in the User Information window (Figure 4-1):
a. In the User Name field (item 1), enter User. (Case sensitive.)
b. In the Password field (item 2), enter User. (Case sensitive.)
4. Click OK.
Figure 4-1 The User Information Window
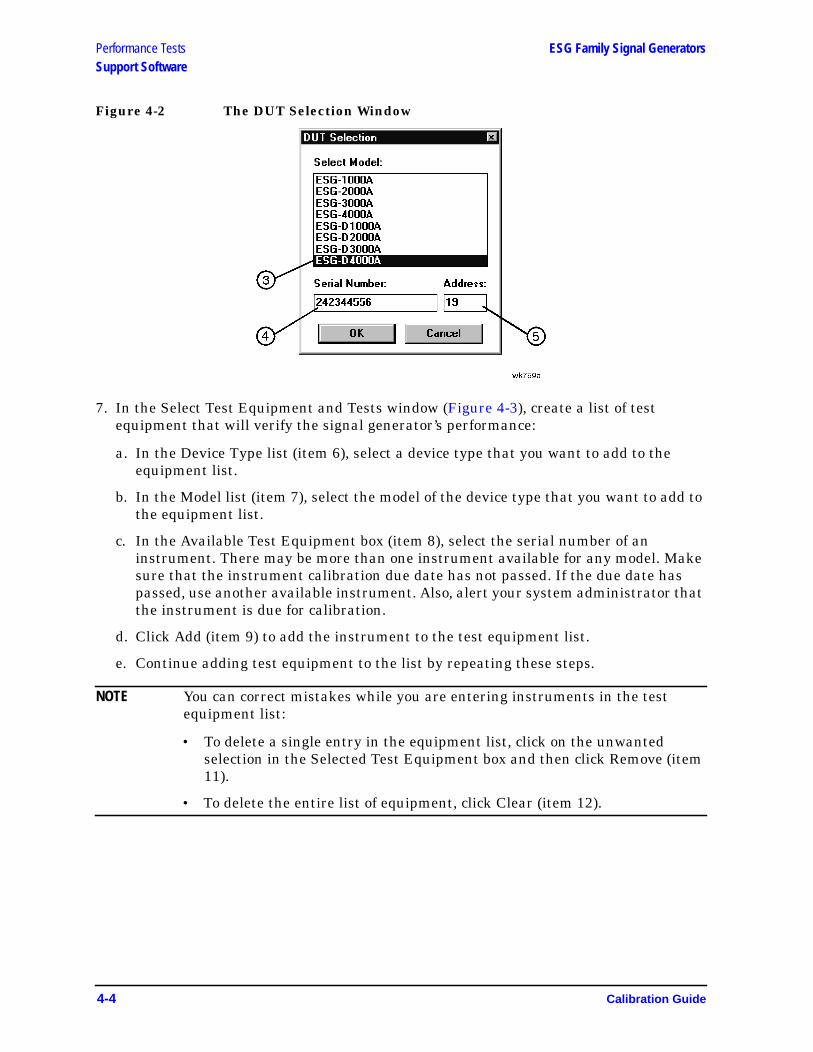
5. In the DUT (Device Under Test) Selection Window (Figure 4-2):
a. In the Select Model list (item 3), choose the correct model number of your signalgenerator.
b. In the Serial Number box (item 4), enter the complete serial number of the DUT.
c. In the Address box (item 5), enter the two-digit GPIB address of the signal generator.(To display the address on the signal generator, press Utility > GPIB/RS-232 >GPIB Address. The GPIB Address softkey shows the current address.)
6. Click OK.
• Timebase Aging Rate (ESG-AP,ESG-DP or Option 1E5 only)
• Measuring Phase Noise and Residual FM(ESG-AP and ESG-DP Series Signal Generators)
Calibration Guide 4-3
Performance Tests ESG Family Signal GeneratorsSupport Software
Figure 4-2 The DUT Selection Window
7. In the Select Test Equipment and Tests window (Figure 4-3), create a list of testequipment that will verify the signal generator’s performance:
a. In the Device Type list (item 6), select a device type that you want to add to theequipment list.
b. In the Model list (item 7), select the model of the device type that you want to add tothe equipment list.
c. In the Available Test Equipment box (item 8), select the serial number of aninstrument. There may be more than one instrument available for any model. Makesure that the instrument calibration due date has not passed. If the due date haspassed, use another available instrument. Also, alert your system administrator thatthe instrument is due for calibration.
d. Click Add (item 9) to add the instrument to the test equipment list.
e. Continue adding test equipment to the list by repeating these steps.
NOTE You can correct mistakes while you are entering instruments in the testequipment list:
• To delete a single entry in the equipment list, click on the unwantedselection in the Selected Test Equipment box and then click Remove (item11).
• To delete the entire list of equipment, click Clear (item 12).
4-4 Calibration Guide

ESG Family Signal Generators Performance TestsSupport Software
Figure 4-3 The Select Test Equipment and Tests Window
8. Create a list of performance tests that you want the software to run (Figure 4-3):
a. In the Available Tests list (item 13), select a performance test.
b. Click Add (item 14) to add the test to the list of tests that the software will run.
You can view the Required Test Equipment list (item 15) for a performance test byclicking on the test title in the Available Tests (item 13) box.
c. Continue adding performance tests to the list by repeating these steps.
NOTE You can correct mistakes while you are entering tests in the performance testlist:
• To delete a single entry in the test list, select the unwanted test in theSelected Tests box (item 16) and then click Remove (item 17).
• To delete the entire list of equipment, click Clear (item 18).
9. When you are done, click OK (item 19).
Calibration Guide 4-5
Performance Tests ESG Family Signal GeneratorsSupport Software
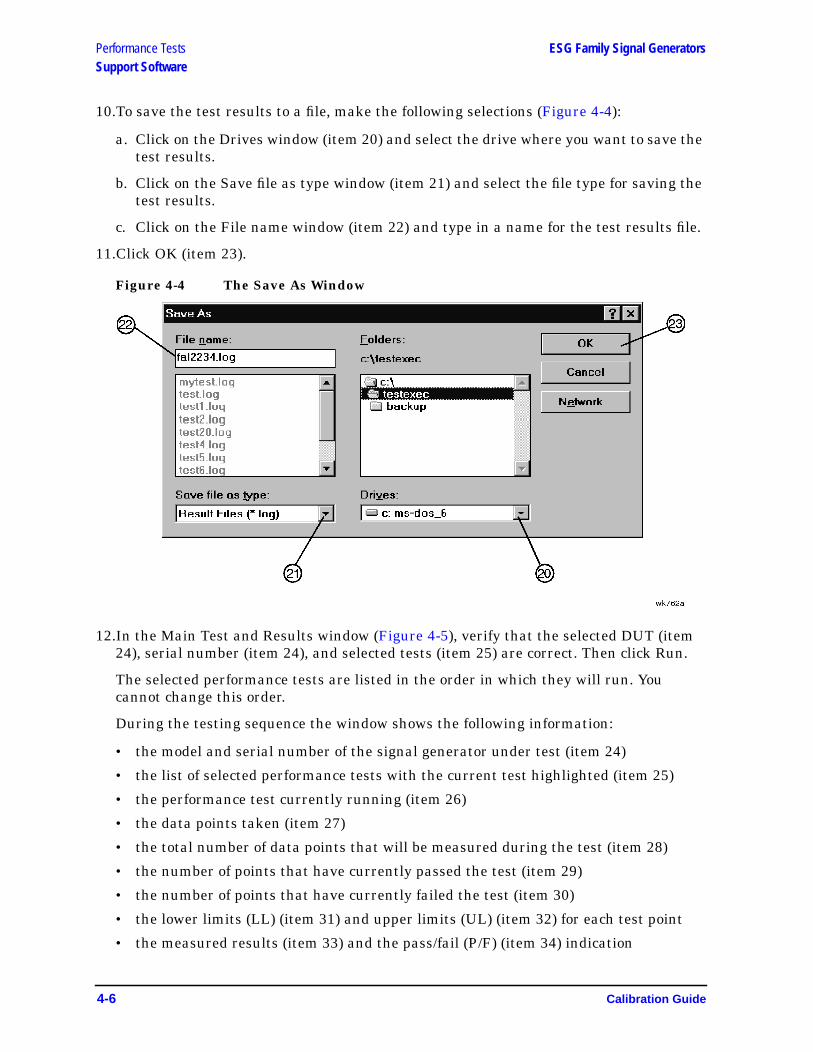
10.To save the test results to a file, make the following selections (Figure 4-4):
a. Click on the Drives window (item 20) and select the drive where you want to save thetest results.
b. Click on the Save file as type window (item 21) and select the file type for saving thetest results.
c. Click on the File name window (item 22) and type in a name for the test results file.
11.Click OK (item 23).
Figure 4-4 The Save As Window
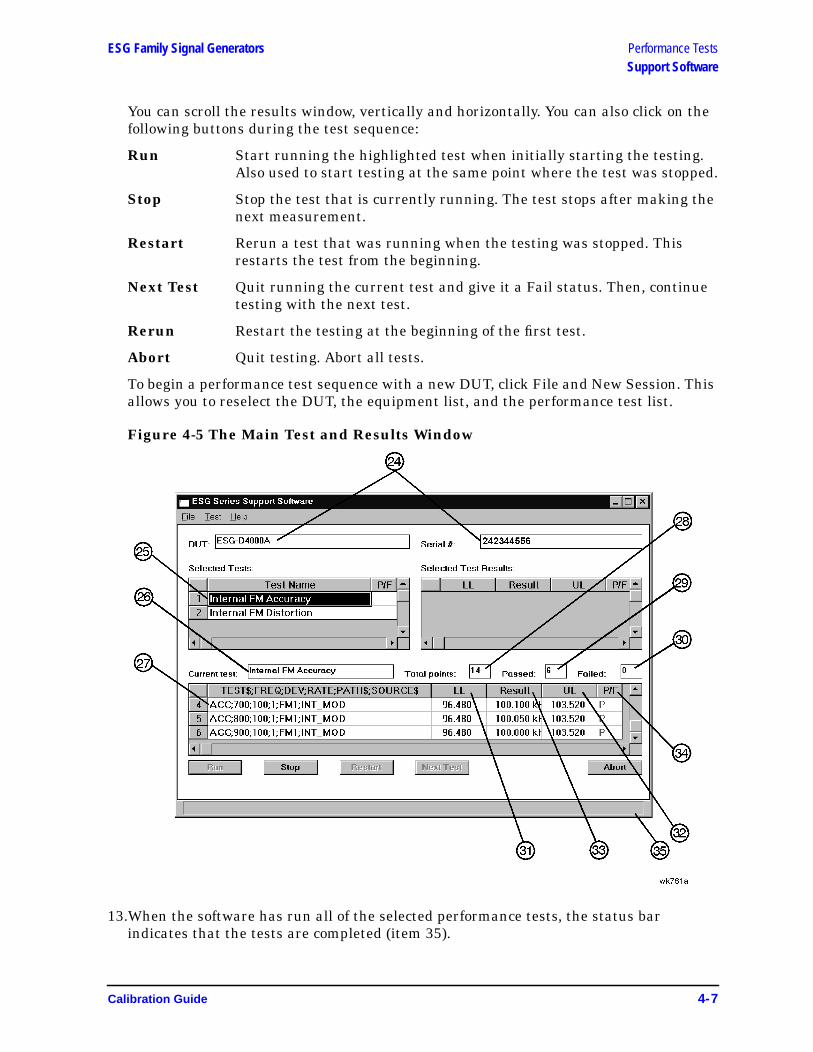
12.In the Main Test and Results window (Figure 4-5), verify that the selected DUT (item24), serial number (item 24), and selected tests (item 25) are correct. Then click Run.
The selected performance tests are listed in the order in which they will run. Youcannot change this order.
During the testing sequence the window shows the following information:
• the model and serial number of the signal generator under test (item 24)
• the list of selected performance tests with the current test highlighted (item 25)
• the performance test currently running (item 26)
• the data points taken (item 27)
• the total number of data points that will be measured during the test (item 28)
• the number of points that have currently passed the test (item 29)
• the number of points that have currently failed the test (item 30)
• the lower limits (LL) (item 31) and upper limits (UL) (item 32) for each test point
• the measured results (item 33) and the pass/fail (P/F) (item 34) indication
4-6 Calibration Guide
ESG Family Signal Generators Performance TestsSupport Software
You can scroll the results window, vertically and horizontally. You can also click on thefollowing buttons during the test sequence:
Run Start running the highlighted test when initially starting the testing.Also used to start testing at the same point where the test was stopped.
Stop Stop the test that is currently running. The test stops after making thenext measurement.
Restart Rerun a test that was running when the testing was stopped. Thisrestarts the test from the beginning.
Next Test Quit running the current test and give it a Fail status. Then, continuetesting with the next test.
Rerun Restart the testing at the beginning of the first test.
Abort Quit testing. Abort all tests.
To begin a performance test sequence with a new DUT, click File and New Session. Thisallows you to reselect the DUT, the equipment list, and the performance test list.
Figure 4-5 The Main Test and Results Window
13.When the software has run all of the selected performance tests, the status barindicates that the tests are completed (item 35).
Calibration Guide 4-7

Performance Tests ESG Family Signal GeneratorsSupport Software
Printing the Performance Test Results
1. To print all the results of the entire test sequence, click File and Print.
Exiting the Support Software Program
1. To exit the performance tests program, click File and Exit.
4-8 Calibration Guide
ESG Family Signal Generators Performance Tests1. Internal FM Accuracy and Distortion
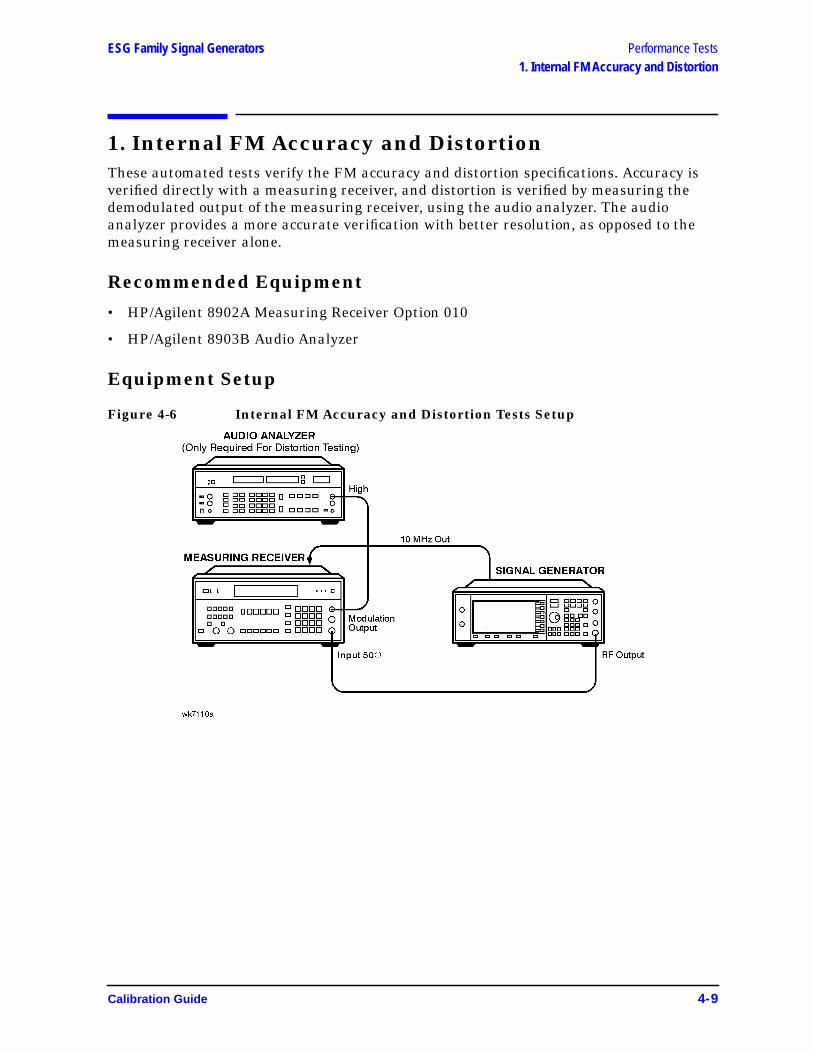
1. Internal FM Accuracy and DistortionThese automated tests verify the FM accuracy and distortion specifications. Accuracy isverified directly with a measuring receiver, and distortion is verified by measuring thedemodulated output of the measuring receiver, using the audio analyzer. The audioanalyzer provides a more accurate verification with better resolution, as opposed to themeasuring receiver alone.
Recommended Equipment
• HP/Agilent 8902A Measuring Receiver Option 010
• HP/Agilent 8903B Audio Analyzer
Equipment Setup
Figure 4-6 Internal FM Accuracy and Distortion Tests Setup
Calibration Guide 4-9

Performance Tests ESG Family Signal Generators2. Internal AM Accuracy and Distortion
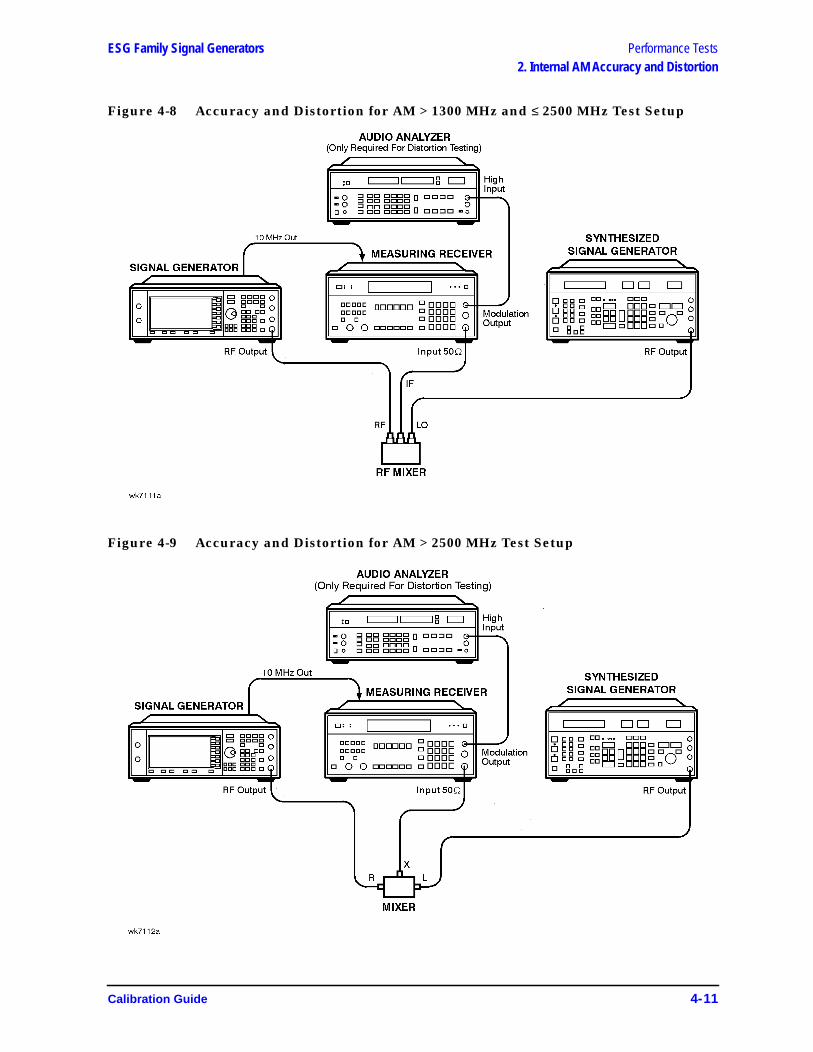
2. Internal AM Accuracy and DistortionThese automated tests verify the AM accuracy and distortion specifications.
For frequencies at or below 1300 MHz, accuracy is verified directly with a measuringreceiver, and distortion is verified by measuring the demodulated output from themeasuring receiver with an audio analyzer. The audio analyzer provides a more accurateverification with better resolution than using the measuring receiver alone.
For frequencies above 1300 MHz, the RF output from the signal generator is mixed withthe output from another signal generator (local oscillator) to produce a suitable inputfrequency for the measuring receiver.
For a frequency of 4 GHz, verification is accomplished by covering two different frequencyspans through the use of two mixers.
Recommended Equipment
• HP/Agilent 8902A Measuring Receiver Option 010
• HP/Agilent 8903B Audio Analyzer
• HP/Agilent 8663A Signal Generator
• MD/MDC-174 Mixer (1 to 2800 MHz)
• MD/MDC-164 Mixer (0.5 to 9 GHz)
Equipment Setups
Figure 4-7 Accuracy and Distortion for AM ≤ 1300 MHz Test Setup
4-10 Calibration Guide
ESG Family Signal Generators Performance Tests2. Internal AM Accuracy and Distortion
Figure 4-8 Accuracy and Distortion for AM > 1300 MHz and ≤ 2500 MHz Test Setup
Figure 4-9 Accuracy and Distortion for AM > 2500 MHz Test Setup
Calibration Guide 4-11
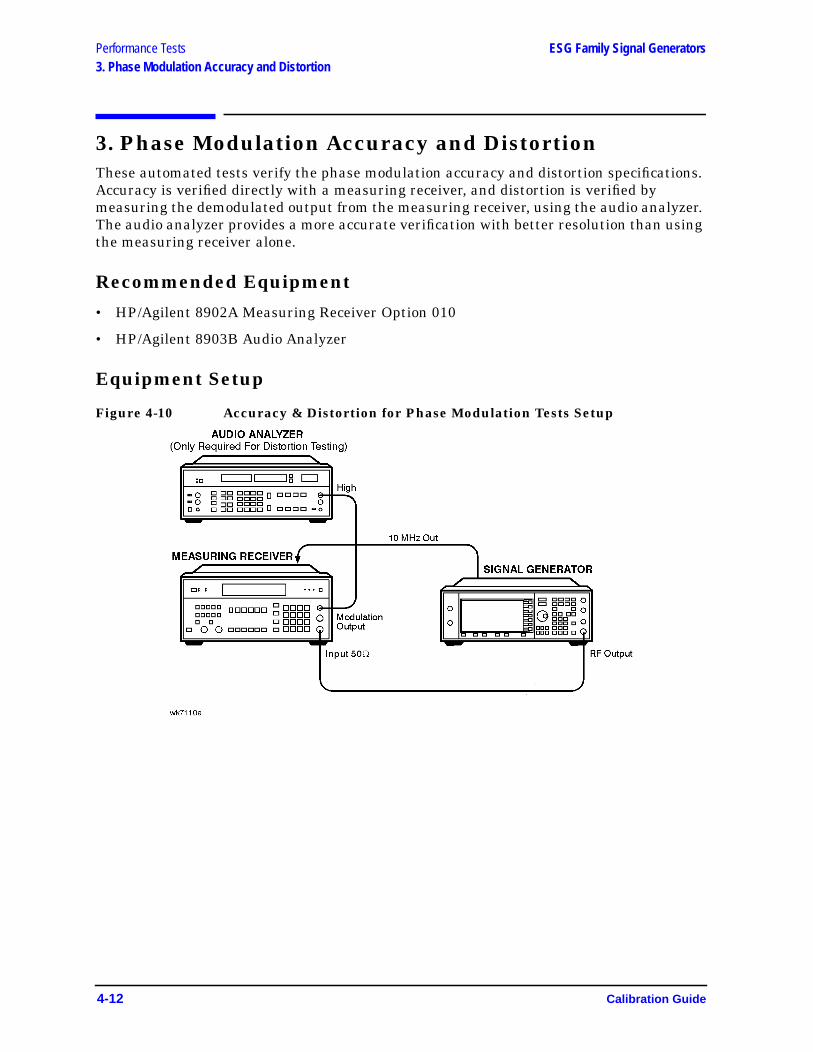
Performance Tests ESG Family Signal Generators3. Phase Modulation Accuracy and Distortion
3. Phase Modulation Accuracy and DistortionThese automated tests verify the phase modulation accuracy and distortion specifications.Accuracy is verified directly with a measuring receiver, and distortion is verified bymeasuring the demodulated output from the measuring receiver, using the audio analyzer.The audio analyzer provides a more accurate verification with better resolution than usingthe measuring receiver alone.
Recommended Equipment
• HP/Agilent 8902A Measuring Receiver Option 010
• HP/Agilent 8903B Audio Analyzer
Equipment Setup
Figure 4-10 Accuracy & Distortion for Phase Modulation Tests Setup
4-12 Calibration Guide
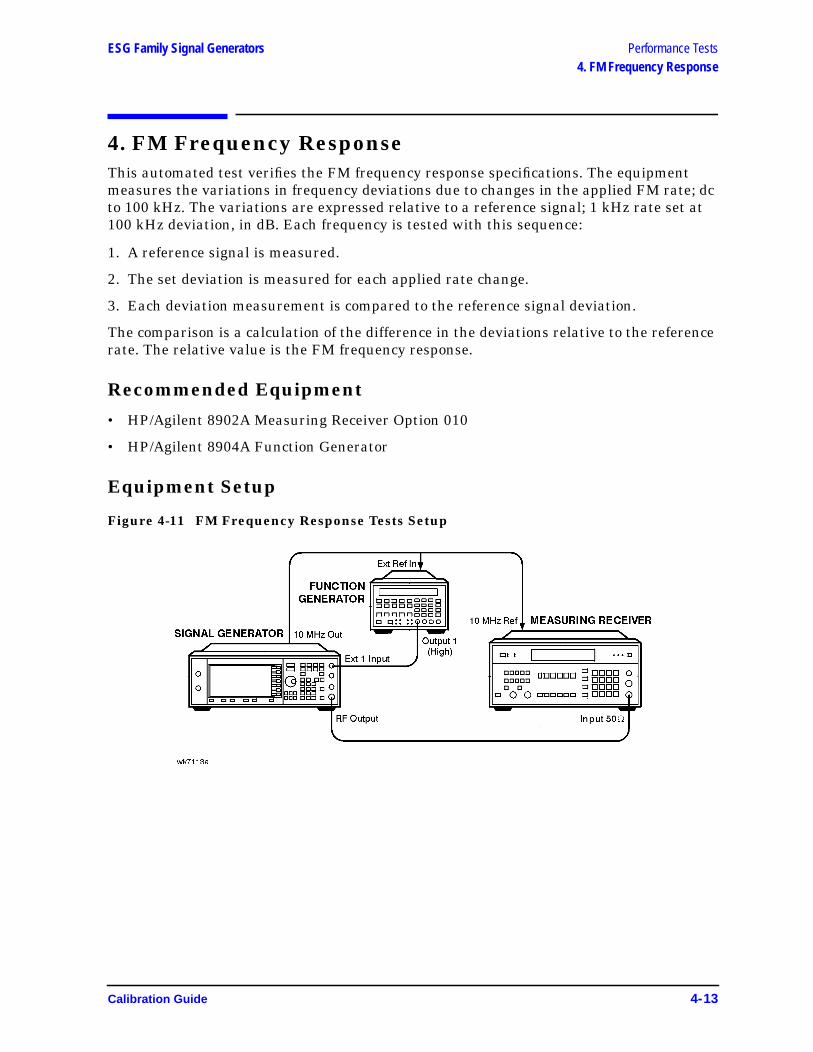
ESG Family Signal Generators Performance Tests4. FM Frequency Response
4. FM Frequency ResponseThis automated test verifies the FM frequency response specifications. The equipmentmeasures the variations in frequency deviations due to changes in the applied FM rate; dcto 100 kHz. The variations are expressed relative to a reference signal; 1 kHz rate set at100 kHz deviation, in dB. Each frequency is tested with this sequence:
1. A reference signal is measured.
2. The set deviation is measured for each applied rate change.
3. Each deviation measurement is compared to the reference signal deviation.
The comparison is a calculation of the difference in the deviations relative to the referencerate. The relative value is the FM frequency response.
Recommended Equipment
• HP/Agilent 8902A Measuring Receiver Option 010
• HP/Agilent 8904A Function Generator
Equipment Setup
Figure 4-11 FM Frequency Response Tests Setup
Calibration Guide 4-13

Performance Tests ESG Family Signal Generators5. AM Frequency Response
5. AM Frequency ResponseThis automated test verifies the AM frequency response specifications. The equipmentmeasures the variations in modulation depth due to changes in the applied AM rate; dc to10 kHz. The response is relative to a 1 kHz rate set at the test depth, and expressed in dB.Each frequency is tested with the following sequence:
1. A reference signal is measured.
2. The set depth is measured for each applied rate change.
3. Each depth measurement is compared to the reference signal depth.
The comparison is a calculation of the difference in the depths relative to the referencerate. The relative value is the AM Frequency Response.
Recommended Equipment
• HP/Agilent 8902A Measuring Receiver Option 010
• HP/Agilent 8904A Function Generator
• HP/Agilent 8663A Signal Generator
• MD/MDC-164 Mixer (0.5 to 9 GHz)
Equipment Setups
Figure 4-12 Frequency Response for AM ≤ 1300 MHz Test Setup
4-14 Calibration Guide
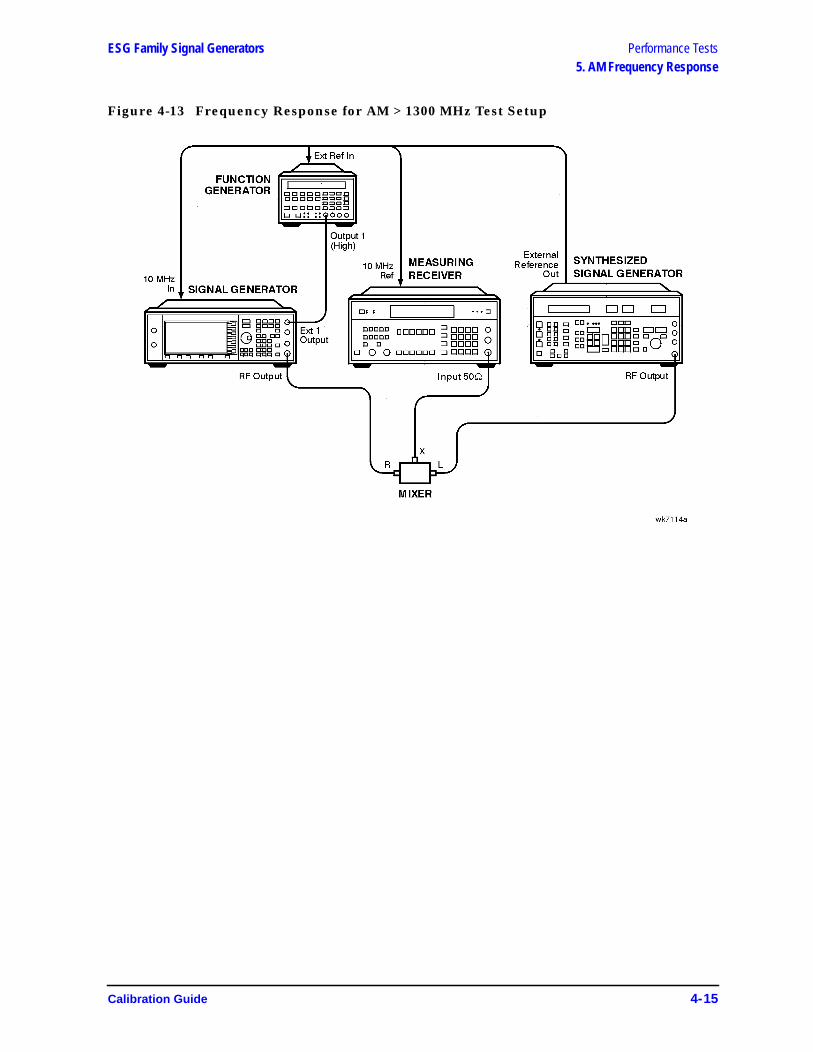
ESG Family Signal Generators Performance Tests5. AM Frequency Response
Figure 4-13 Frequency Response for AM > 1300 MHz Test Setup
Calibration Guide 4-15
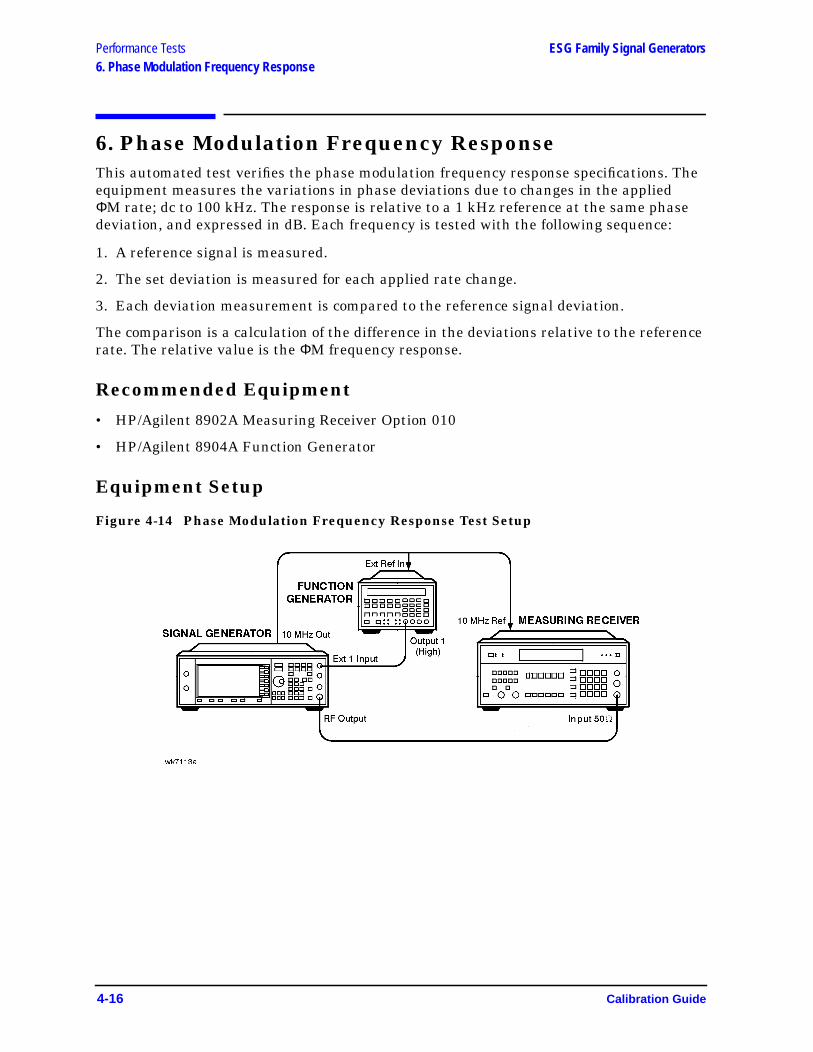
Performance Tests ESG Family Signal Generators6. Phase Modulation Frequency Response
6. Phase Modulation Frequency ResponseThis automated test verifies the phase modulation frequency response specifications. Theequipment measures the variations in phase deviations due to changes in the appliedΦM rate; dc to 100 kHz. The response is relative to a 1 kHz reference at the same phasedeviation, and expressed in dB. Each frequency is tested with the following sequence:
1. A reference signal is measured.
2. The set deviation is measured for each applied rate change.
3. Each deviation measurement is compared to the reference signal deviation.
The comparison is a calculation of the difference in the deviations relative to the referencerate. The relative value is the ΦM frequency response.
Recommended Equipment
• HP/Agilent 8902A Measuring Receiver Option 010
• HP/Agilent 8904A Function Generator
Equipment Setup
Figure 4-14 Phase Modulation Frequency Response Test Setup
4-16 Calibration Guide
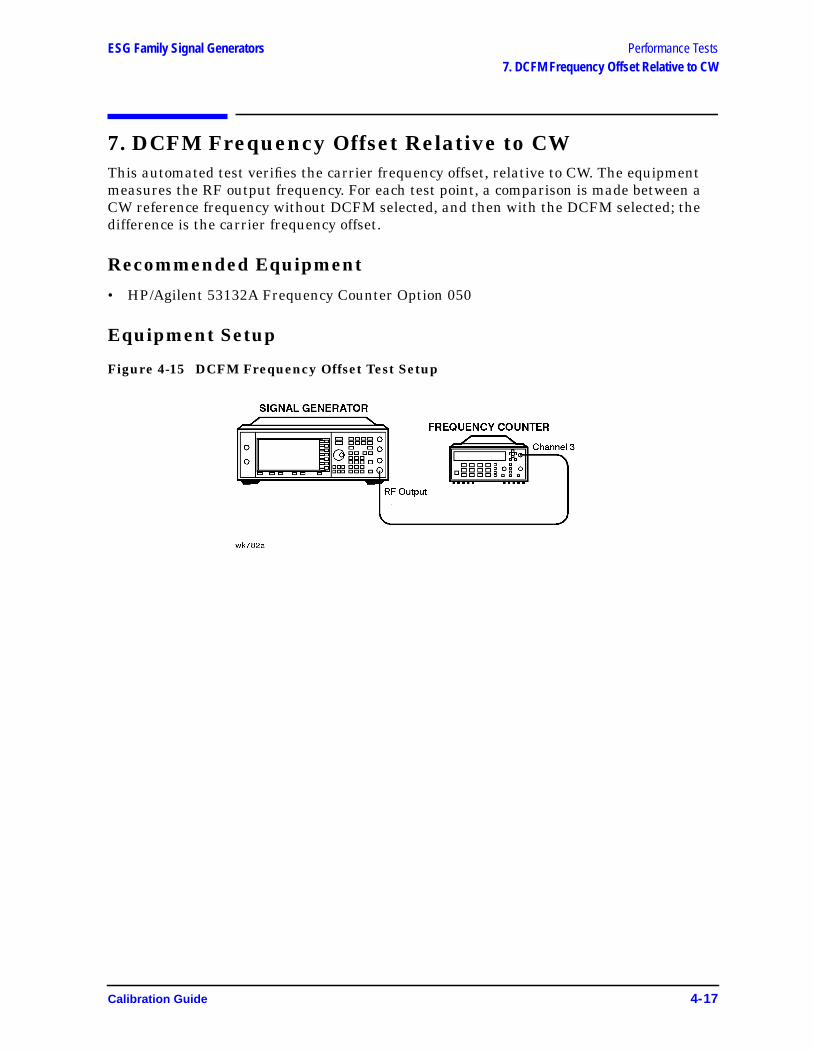
ESG Family Signal Generators Performance Tests7. DCFM Frequency Offset Relative to CW
7. DCFM Frequency Offset Relative to CWThis automated test verifies the carrier frequency offset, relative to CW. The equipmentmeasures the RF output frequency. For each test point, a comparison is made between aCW reference frequency without DCFM selected, and then with the DCFM selected; thedifference is the carrier frequency offset.
Recommended Equipment
• HP/Agilent 53132A Frequency Counter Option 050
Equipment Setup
Figure 4-15 DCFM Frequency Offset Test Setup
Calibration Guide 4-17
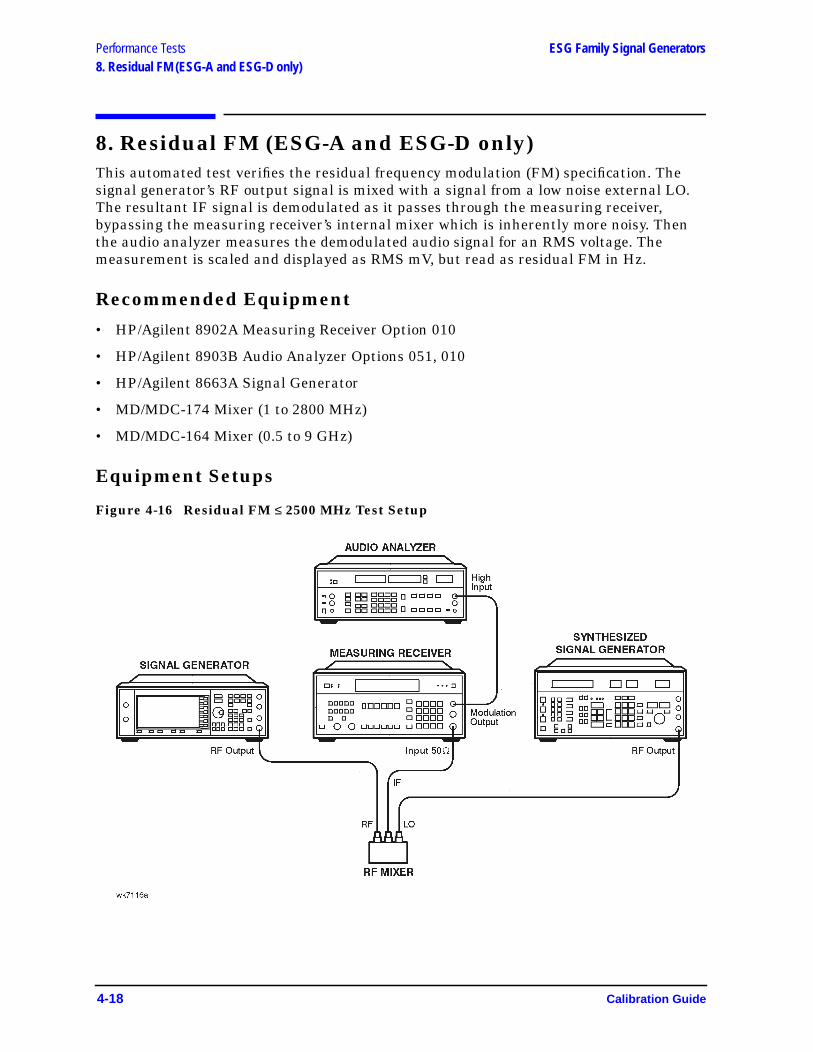
Performance Tests ESG Family Signal Generators8. Residual FM (ESG-A and ESG-D only)
8. Residual FM (ESG-A and ESG-D only)This automated test verifies the residual frequency modulation (FM) specification. Thesignal generator’s RF output signal is mixed with a signal from a low noise external LO.The resultant IF signal is demodulated as it passes through the measuring receiver,bypassing the measuring receiver’s internal mixer which is inherently more noisy. Thenthe audio analyzer measures the demodulated audio signal for an RMS voltage. Themeasurement is scaled and displayed as RMS mV, but read as residual FM in Hz.
Recommended Equipment
• HP/Agilent 8902A Measuring Receiver Option 010
• HP/Agilent 8903B Audio Analyzer Options 051, 010
• HP/Agilent 8663A Signal Generator
• MD/MDC-174 Mixer (1 to 2800 MHz)
• MD/MDC-164 Mixer (0.5 to 9 GHz)
Equipment Setups
Figure 4-16 Residual FM ≤ 2500 MHz Test Setup
4-18 Calibration Guide
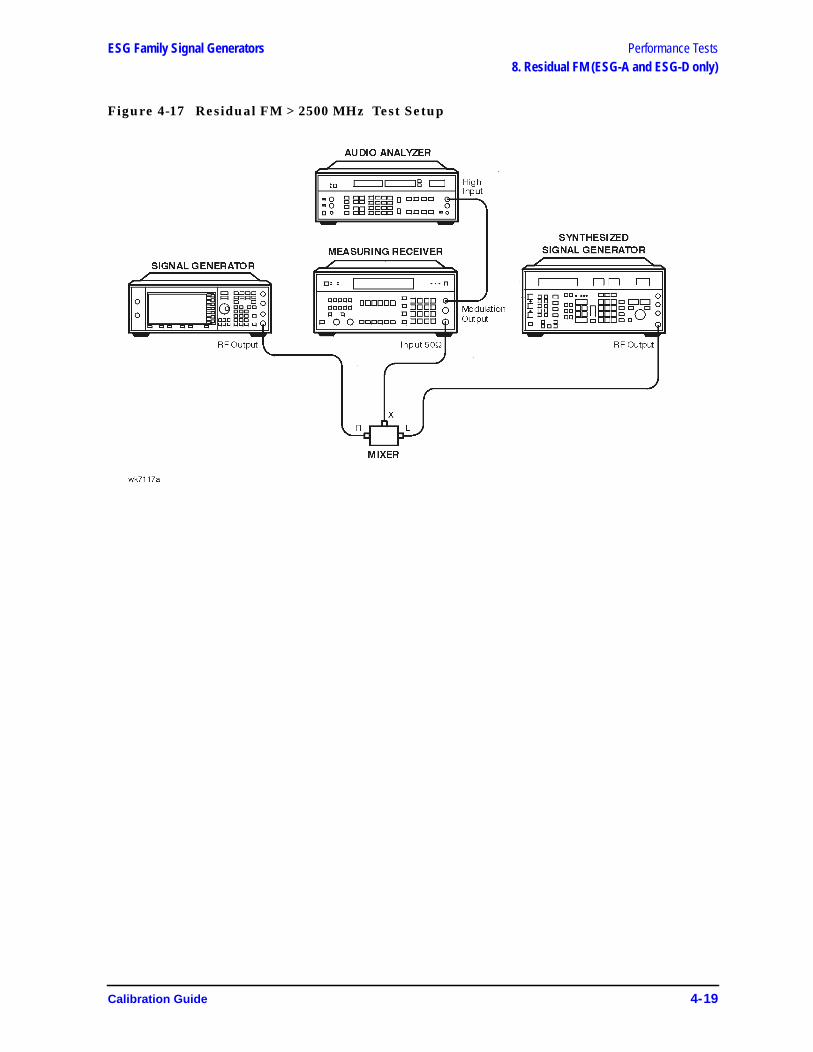
ESG Family Signal Generators Performance Tests8. Residual FM (ESG-A and ESG-D only)
Figure 4-17 Residual FM > 2500 MHz Test Setup
Calibration Guide 4-19

Performance Tests ESG Family Signal Generators9. Harmonic, Subharmonic, and Nonharmonic Spurious Signals
9. Harmonic, Subharmonic, andNonharmonic Spurious SignalsThese automated tests verify that the harmonic, subharmonic, and nonharmonic spurioussignals are within specifications. The signal generator’s output signal is set to valueswhere harmonic and spurious signal performance problems are most likely to occur. Thenthe spectrum analyzer checks the level of the various harmonic and spurious signals andcompares each measurement to a signal of known frequency and amplitude.
Recommended Equipment
• HP/Agilent 8563E Spectrum Analyzer
• HP/Agilent 8491A/B Attenuator (10 dB) Option 010
Equipment Setup
Figure 4-18 Harmonic, Subharmonic, and Nonharmonic Spurious Signals Tests Setup
4-20 Calibration Guide
ESG Family Signal Generators Performance Tests10. Power Level Accuracy
10. Power Level AccuracyA power meter is used to verify performance over the +13 to –15 dBm range. The absolutepower level measured at –10 dBm is used as a reference for all lower level measurements.
For power levels below −15 dBm, a vector signal analyzer is used to make relative powermeasurements. A low noise amplifier (LNA) and step attenuator are connected in series tocontrol the absolute power level input to the signal analyzer. For power level settings≥ –60 dBm, the step attenuator is set to approximately cancel the gain of the LNA. Below–60 dBm, the step attenuator is set to 0 dB, which keeps the signal level well above thesignal analyzer’s noise floor.
Relative measurements are accomplished by setting the DUT amplitude. For example:
Set the DUT to a specific frequency, and an amplitude of –10 dBm. For the purpose of thisexample, assume the power meter measures –10.1 dBm at these settings. The signalanalyzer does a peak search, sets the reference level, and sets the marker to delta mode(0 dB). The DUT amplitude then changes to –20 dBm, and the signal analyzer makes arelative power measurement (assume it to be –10.15 dB). The absolute power measured is–10.1 dBm + (–10.15 dB), or –20.25 dBm.
To determine power level accuracy below –60 dBm, the signal analyzer makes the 0 dBmarker delta measurement with the amplitude set to –60 dBm, and all lower levelmeasurements are made relative to this reference. The previously measured error for the–60 dBm setting is then accounted for in the measurement.
For frequencies above 2 GHz, an HP/Agilent 8563E signal analyzer is used to downconvertthe frequency to 321.4 MHz.
Recommended Equipment
• HP/Agilent 438A Power Meter
• HP/Agilent 8482A Power Sensor
• HP/Agilent 89441A Vector Signal Analyzer
• HP/Agilent 8563E Option 001 Signal Analyzer
• HP/Agilent 8491A/B Option 006 Attenuator (6 dB)
• HP/Agilent 8495G Programmable Step Attenuator (0 to 70 dB)
• HP/Agilent 11713A Step Attenuator Driver
See page 1-4 for Details on the following:
• Low Frequency Noise Amplifier (LNA)
• High Frequency Low Noise Amplifier (LNA)
Calibration Guide 4-21
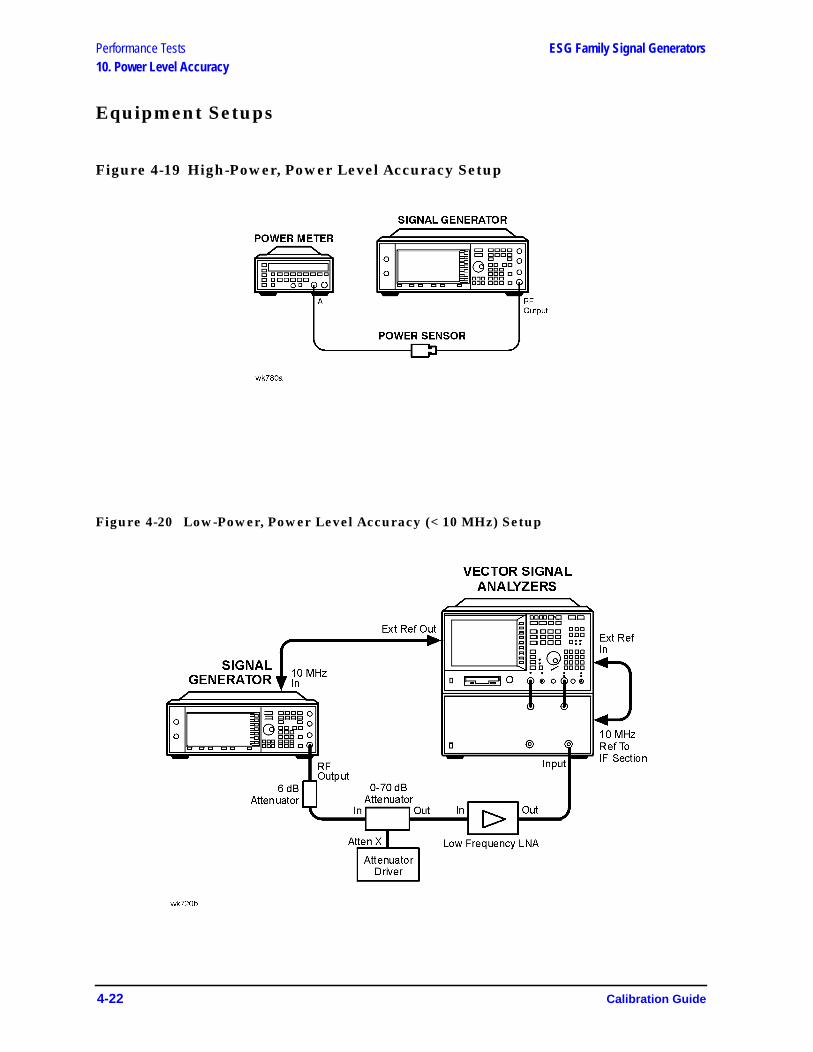
Performance Tests ESG Family Signal Generators10. Power Level Accuracy
Equipment Setups
Figure 4-19 High-Power, Power Level Accuracy Setup
Figure 4-20 Low-Power, Power Level Accuracy (< 10 MHz) Setup
4-22 Calibration Guide

ESG Family Signal Generators Performance Tests10. Power Level Accuracy
Figure 4-21 Low-Power, Power Level Accuracy (≥ 10 MHz and ≤ 2 GHz) Setup
Figure 4-22 Low-Power, Power Level Accuracy (> 2 GHz) Setup
Calibration Guide 4-23
Performance Tests ESG Family Signal Generators11. Timebase Aging Rate (ESG-AP, ESG-DP or Option 1E5 only)
11. Timebase Aging Rate(ESG-AP, ESG-DP or Option 1E5 only)This manual test verifies the accuracy of the signal generator’s internal timebase. Thetime required for a 360° phase change is measured both before and after a specifiedwaiting period. The aging rate is inversely proportional to the absolute value of thedifference in the measured times. The results of this test can be recorded on the test recordprovided on page 4-48.
The overall accuracy of the internal timebase is a function of:
TBC ±AR ±TE ±LE where:
TBC = timebase calibration
AR = aging rate
TE = temperature effects
LE = line effects
After the timebase is adjusted, the timebase frequency should stay within the aging ratefor the following situations:
• The timebase oven does not cool down.
• The instrument keeps the same orientation, with respect to the earth’s magnetic field.
• The instrument stays at the same altitude.
• The instrument does not receive any mechanical shock.
If the timebase oven cools (the instrument power switch is set to off), you may have toreadjust the timebase frequency after a new warm-up cycle. Typically, however, thetimebase frequency returns to within ±1 Hz of the original frequency.
NOTE The internal timebase can be tested after the AC power is reconnected for 10minutes. For best accuracy, retest after the instrument has been on for 24hours.
Frequency changes due to either a change in orientation, with respect to the earth’smagnetic field, or to a change in altitude usually go away when the instrument is returnedto its original position. A frequency change due to mechanical shock usually appears as afixed frequency error.
Recommended Equipment
• HP/Agilent 54610B Digital Oscilloscope
• HP/Agilent 5071A Primary Frequency Standard
4-24 Calibration Guide
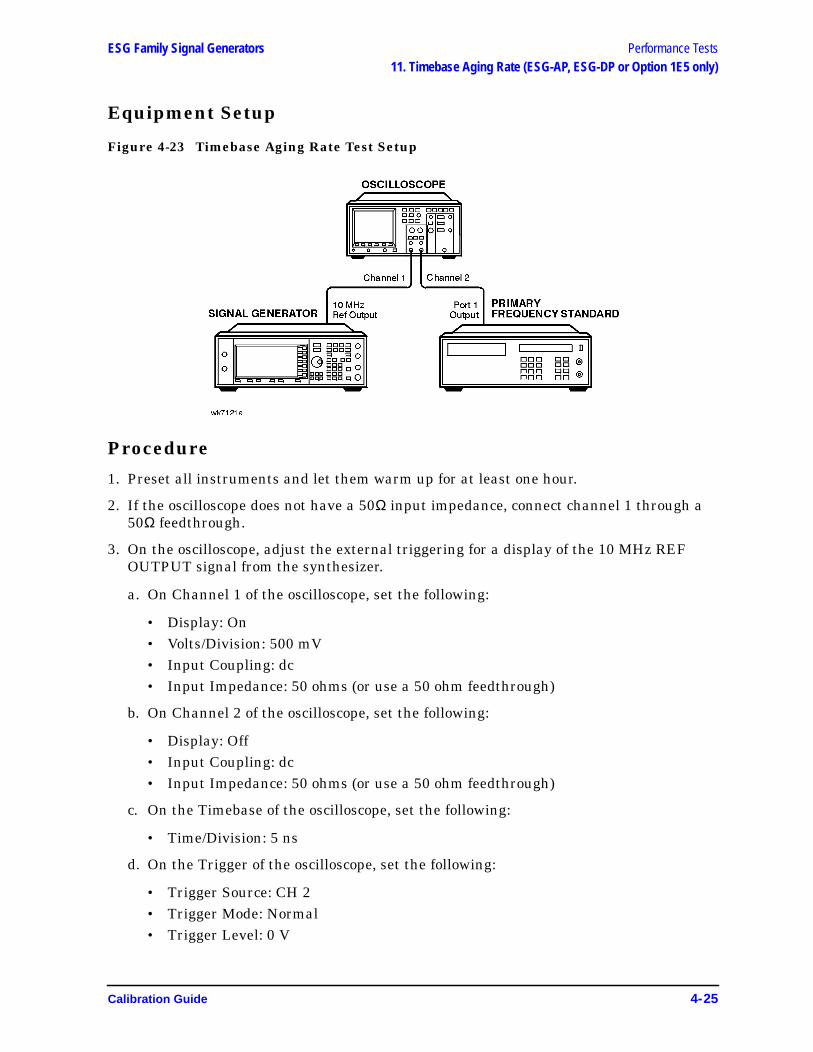
ESG Family Signal Generators Performance Tests11. Timebase Aging Rate (ESG-AP, ESG-DP or Option 1E5 only)
Equipment Setup
Figure 4-23 Timebase Aging Rate Test Setup
Procedure
1. Preset all instruments and let them warm up for at least one hour.
2. If the oscilloscope does not have a 50Ω input impedance, connect channel 1 through a50Ω feedthrough.
3. On the oscilloscope, adjust the external triggering for a display of the 10 MHz REFOUTPUT signal from the synthesizer.
a. On Channel 1 of the oscilloscope, set the following:
• Display: On• Volts/Division: 500 mV• Input Coupling: dc• Input Impedance: 50 ohms (or use a 50 ohm feedthrough)
b. On Channel 2 of the oscilloscope, set the following:
• Display: Off• Input Coupling: dc• Input Impedance: 50 ohms (or use a 50 ohm feedthrough)
c. On the Timebase of the oscilloscope, set the following:
• Time/Division: 5 ns
d. On the Trigger of the oscilloscope, set the following:
• Trigger Source: CH 2• Trigger Mode: Normal• Trigger Level: 0 V
Calibration Guide 4-25
Performance Tests ESG Family Signal Generators11. Timebase Aging Rate (ESG-AP, ESG-DP or Option 1E5 only)
4. If the signal drifts a full cycle (360°) in less than 2 minutes, refer to Chapter 5,“Adjustments,” and perform the “Internal Reference Oscillator Adjustment.” After theadjustment, restart this performance test.
5. Watch the oscilloscope display and monitor the time. Notice the time required for a 360°phase change and record this time as T1.
6. Wait 3 to 24 hours. Record the time that you waited as T2.
7. Repeat steps 1 through 6. Notice the time required for a 360° phase change and recordthis time as T3.
8. Calculate the aging rate as follows:
Aging Rate = (1 cycle/10 MHz) (1/T1 − 1/T3) (24 hours/T2)
Example:
T1 = 351 seconds
T2 = 3 hours
T3 = 349 seconds
= (1 cycle/10 MHz) (1/351s − 1/349s) (24h/3h)(1.306 × 10-11 per day)
9. Write the test results on the performance test record located at the end of this chapter.Compare the results to the limits in the test record.
NOTE If the absolute frequency of the standard and the timebase oscillator areextremely close, you can reduce the measurement time (T1 and T3) bymeasuring the time required for a phase change of less than 360°. In step 4,change 1 cycle to 0.5 cycle for 180°, or 0.25 cycle for 90°.
4-26 Calibration Guide
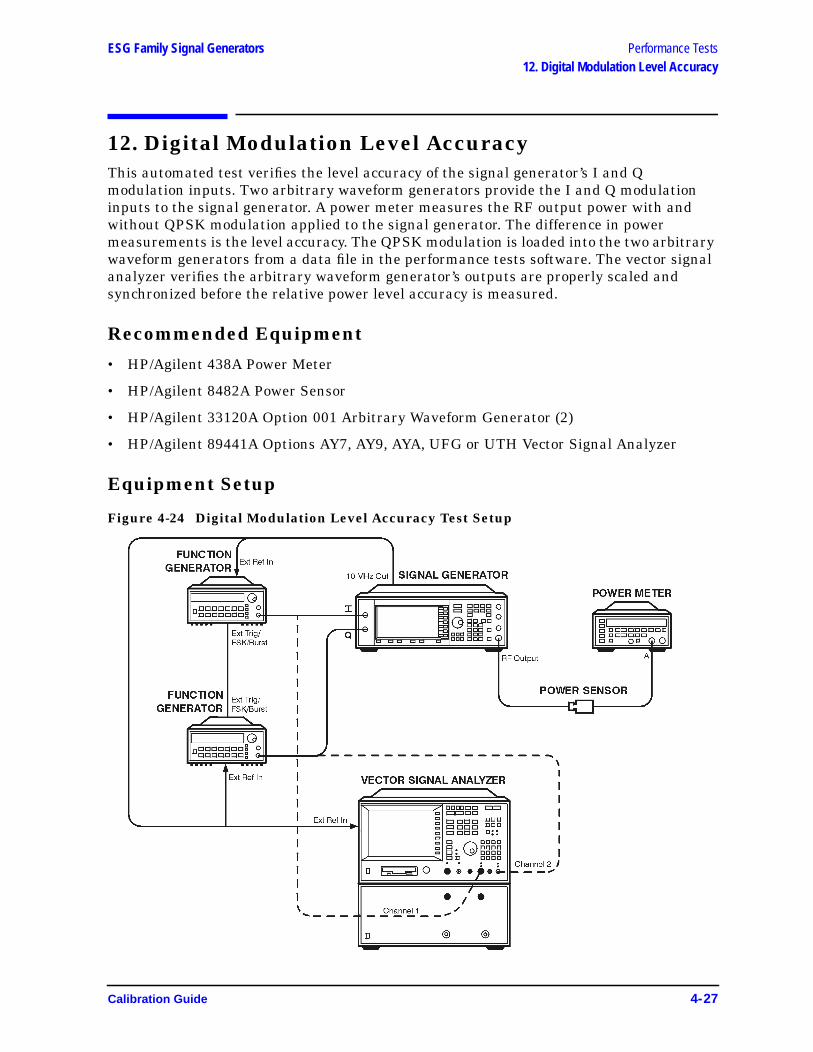
ESG Family Signal Generators Performance Tests12. Digital Modulation Level Accuracy
12. Digital Modulation Level AccuracyThis automated test verifies the level accuracy of the signal generator’s I and Qmodulation inputs. Two arbitrary waveform generators provide the I and Q modulationinputs to the signal generator. A power meter measures the RF output power with andwithout QPSK modulation applied to the signal generator. The difference in powermeasurements is the level accuracy. The QPSK modulation is loaded into the two arbitrarywaveform generators from a data file in the performance tests software. The vector signalanalyzer verifies the arbitrary waveform generator’s outputs are properly scaled andsynchronized before the relative power level accuracy is measured.
Recommended Equipment
• HP/Agilent 438A Power Meter
• HP/Agilent 8482A Power Sensor
• HP/Agilent 33120A Option 001 Arbitrary Waveform Generator (2)
• HP/Agilent 89441A Options AY7, AY9, AYA, UFG or UTH Vector Signal Analyzer
Equipment Setup
Figure 4-24 Digital Modulation Level Accuracy Test Setup
Calibration Guide 4-27
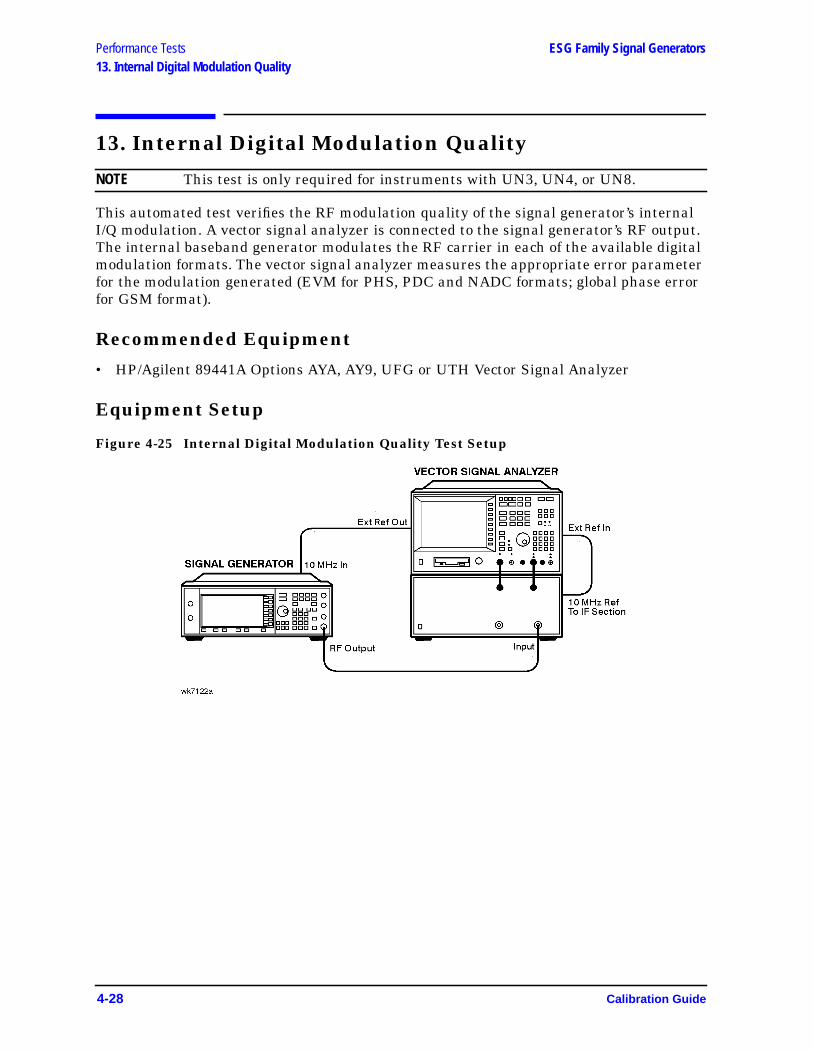
Performance Tests ESG Family Signal Generators13. Internal Digital Modulation Quality
13. Internal Digital Modulation Quality
NOTE This test is only required for instruments with UN3, UN4, or UN8.
This automated test verifies the RF modulation quality of the signal generator’s internalI/Q modulation. A vector signal analyzer is connected to the signal generator’s RF output.The internal baseband generator modulates the RF carrier in each of the available digitalmodulation formats. The vector signal analyzer measures the appropriate error parameterfor the modulation generated (EVM for PHS, PDC and NADC formats; global phase errorfor GSM format).
Recommended Equipment
• HP/Agilent 89441A Options AYA, AY9, UFG or UTH Vector Signal Analyzer
Equipment Setup
Figure 4-25 Internal Digital Modulation Quality Test Setup
4-28 Calibration Guide
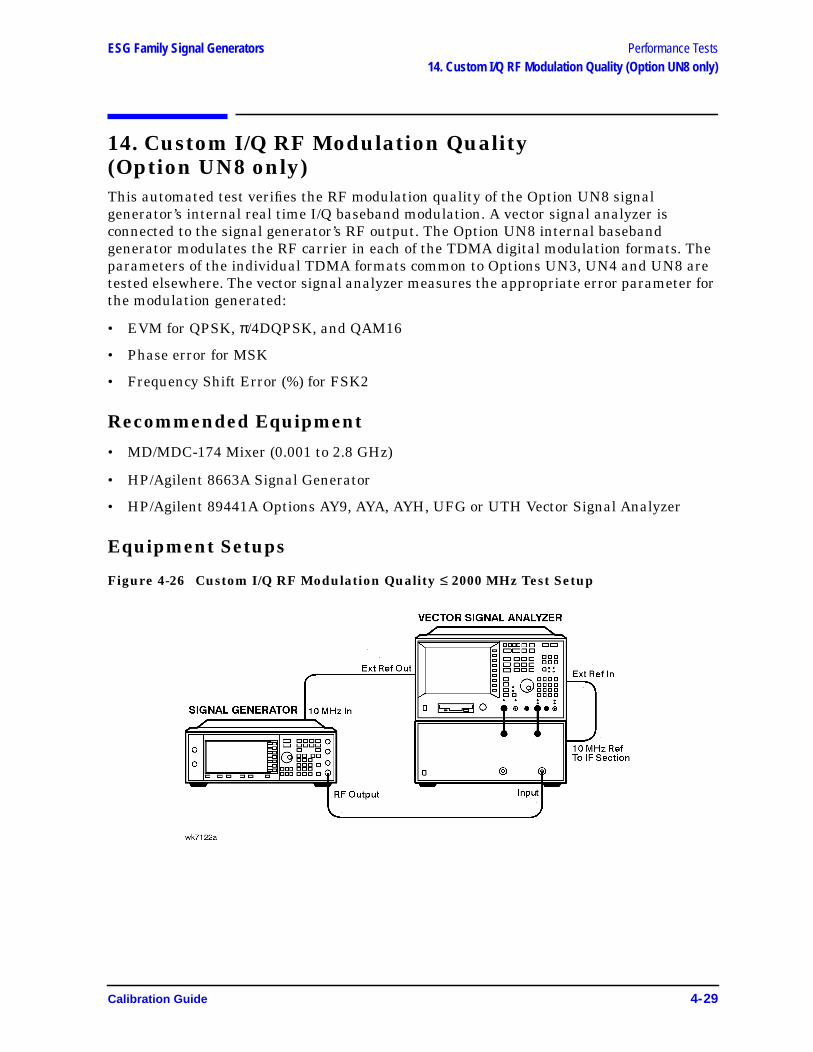
ESG Family Signal Generators Performance Tests14. Custom I/Q RF Modulation Quality (Option UN8 only)
14. Custom I/Q RF Modulation Quality(Option UN8 only)This automated test verifies the RF modulation quality of the Option UN8 signalgenerator’s internal real time I/Q baseband modulation. A vector signal analyzer isconnected to the signal generator’s RF output. The Option UN8 internal basebandgenerator modulates the RF carrier in each of the TDMA digital modulation formats. Theparameters of the individual TDMA formats common to Options UN3, UN4 and UN8 aretested elsewhere. The vector signal analyzer measures the appropriate error parameter forthe modulation generated:
• EVM for QPSK, π/4DQPSK, and QAM16
• Phase error for MSK
• Frequency Shift Error (%) for FSK2
Recommended Equipment
• MD/MDC-174 Mixer (0.001 to 2.8 GHz)
• HP/Agilent 8663A Signal Generator
• HP/Agilent 89441A Options AY9, AYA, AYH, UFG or UTH Vector Signal Analyzer
Equipment Setups
Figure 4-26 Custom I/Q RF Modulation Quality ≤ 2000 MHz Test Setup
Calibration Guide 4-29
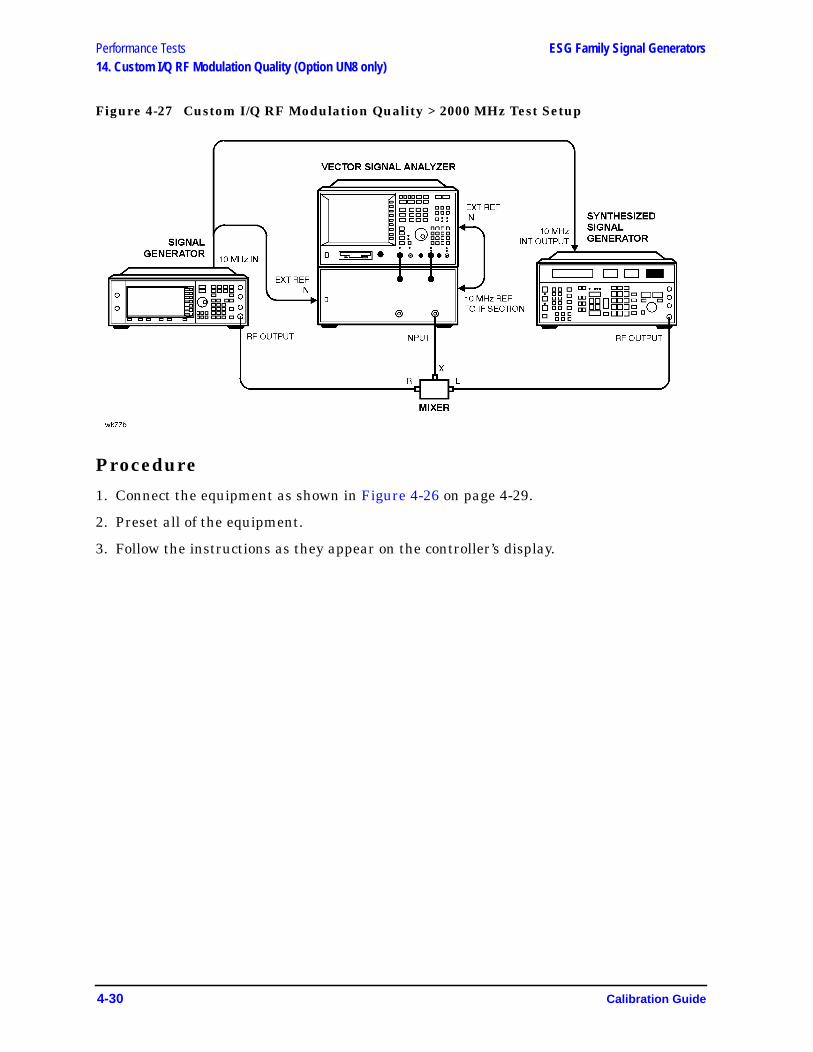
Performance Tests ESG Family Signal Generators14. Custom I/Q RF Modulation Quality (Option UN8 only)
Figure 4-27 Custom I/Q RF Modulation Quality > 2000 MHz Test Setup
Procedure
1. Connect the equipment as shown in Figure 4-26 on page 4-29.
2. Preset all of the equipment.
3. Follow the instructions as they appear on the controller’s display.
4-30 Calibration Guide
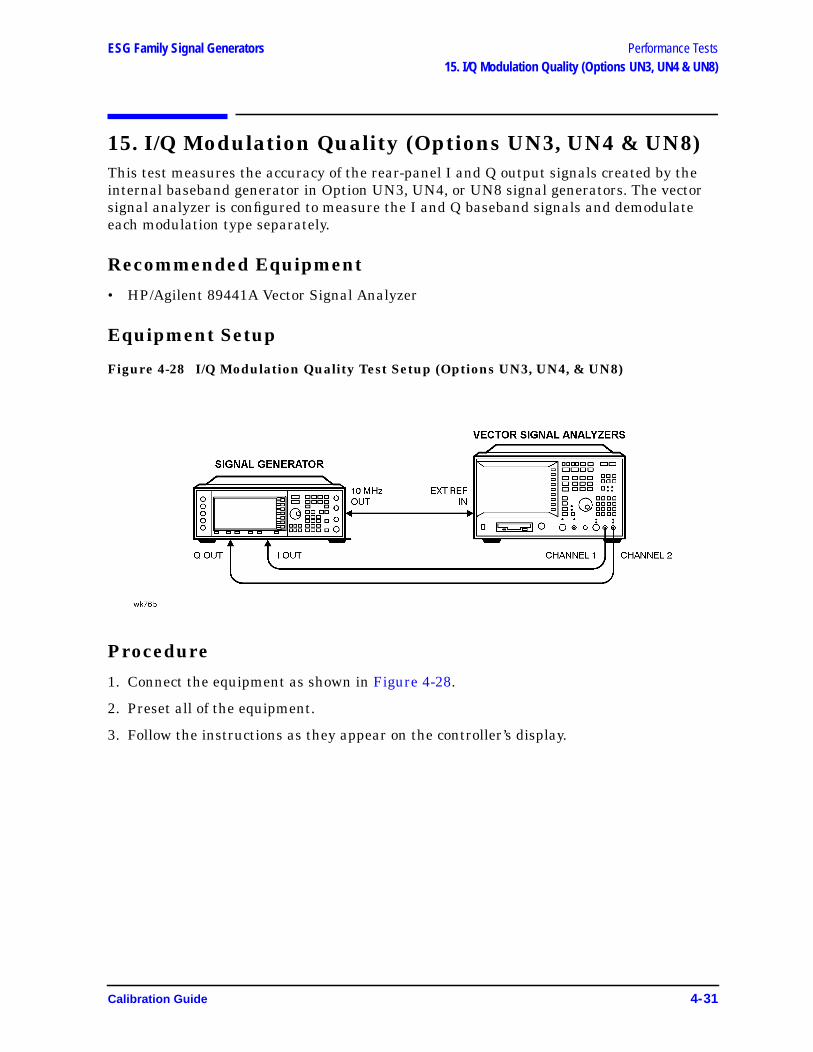
ESG Family Signal Generators Performance Tests15. I/Q Modulation Quality (Options UN3, UN4 & UN8)
15. I/Q Modulation Quality (Options UN3, UN4 & UN8)This test measures the accuracy of the rear-panel I and Q output signals created by theinternal baseband generator in Option UN3, UN4, or UN8 signal generators. The vectorsignal analyzer is configured to measure the I and Q baseband signals and demodulateeach modulation type separately.
Recommended Equipment
• HP/Agilent 89441A Vector Signal Analyzer
Equipment Setup
Figure 4-28 I/Q Modulation Quality Test Setup (Options UN3, UN4, & UN8)
Procedure
1. Connect the equipment as shown in Figure 4-28.
2. Preset all of the equipment.
3. Follow the instructions as they appear on the controller’s display.
Calibration Guide 4-31

Performance Tests ESG Family Signal Generators16. Pulse Modulation On/Off Ratio
16. Pulse Modulation On/Off RatioThis automated test verifies the pulse modulation on/off ratio. The signal generator isconfigured for an external pulse input. The spectrum analyzer measures the RF outputpower with and without the external pulse applied. The power difference is the on/off ratio.
NOTE This test does not test the high performance pulse circuitry used inOption 1E6 instruments. See “20. Pulse Rise/Fall Time (Option 1E6 only)” onpage 4-36.
Recommended Equipment
• HP/Agilent 8563E Spectrum Analyzer
• HP/Agilent 8491A/B Option 010 Attenuator (10 dB)
• HP/Agilent 33120A Arbitrary Waveform Generator
Equipment Setup
Figure 4-29 Pulse Modulation On/Off Ratio Test Setup
4-32 Calibration Guide
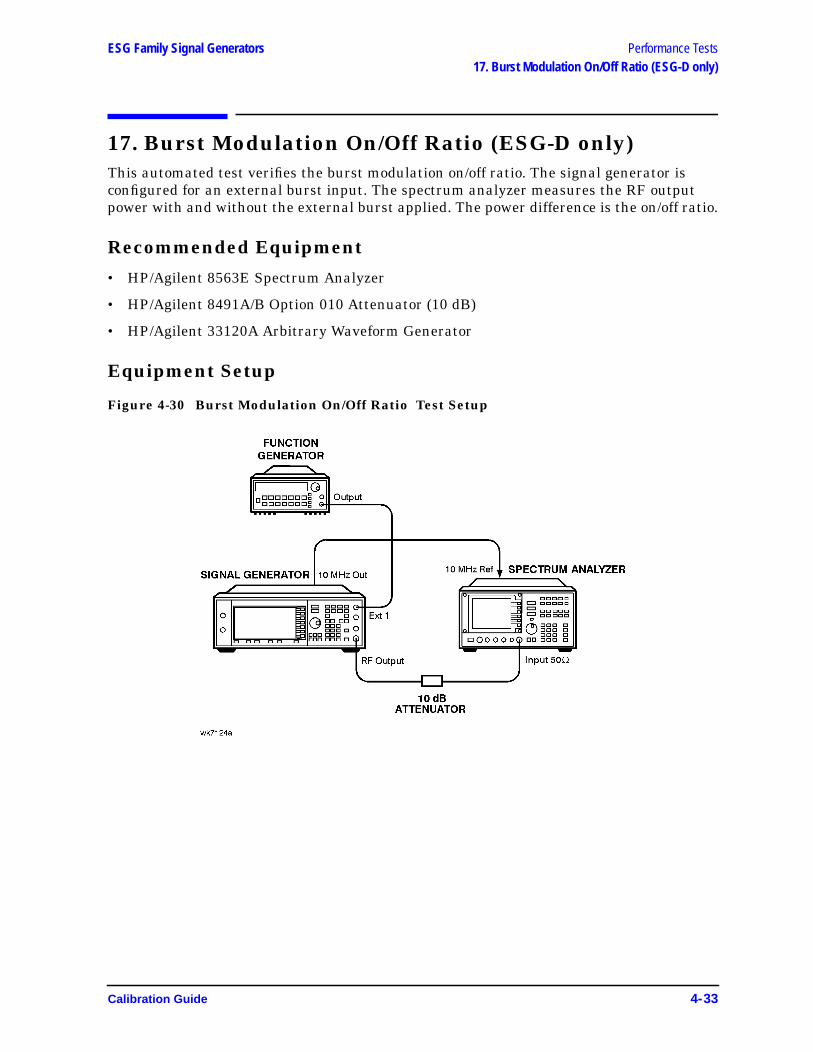
ESG Family Signal Generators Performance Tests17. Burst Modulation On/Off Ratio (ESG-D only)
17. Burst Modulation On/Off Ratio (ESG-D only)This automated test verifies the burst modulation on/off ratio. The signal generator isconfigured for an external burst input. The spectrum analyzer measures the RF outputpower with and without the external burst applied. The power difference is the on/off ratio.
Recommended Equipment
• HP/Agilent 8563E Spectrum Analyzer
• HP/Agilent 8491A/B Option 010 Attenuator (10 dB)
• HP/Agilent 33120A Arbitrary Waveform Generator
Equipment Setup
Figure 4-30 Burst Modulation On/Off Ratio Test Setup
Calibration Guide 4-33
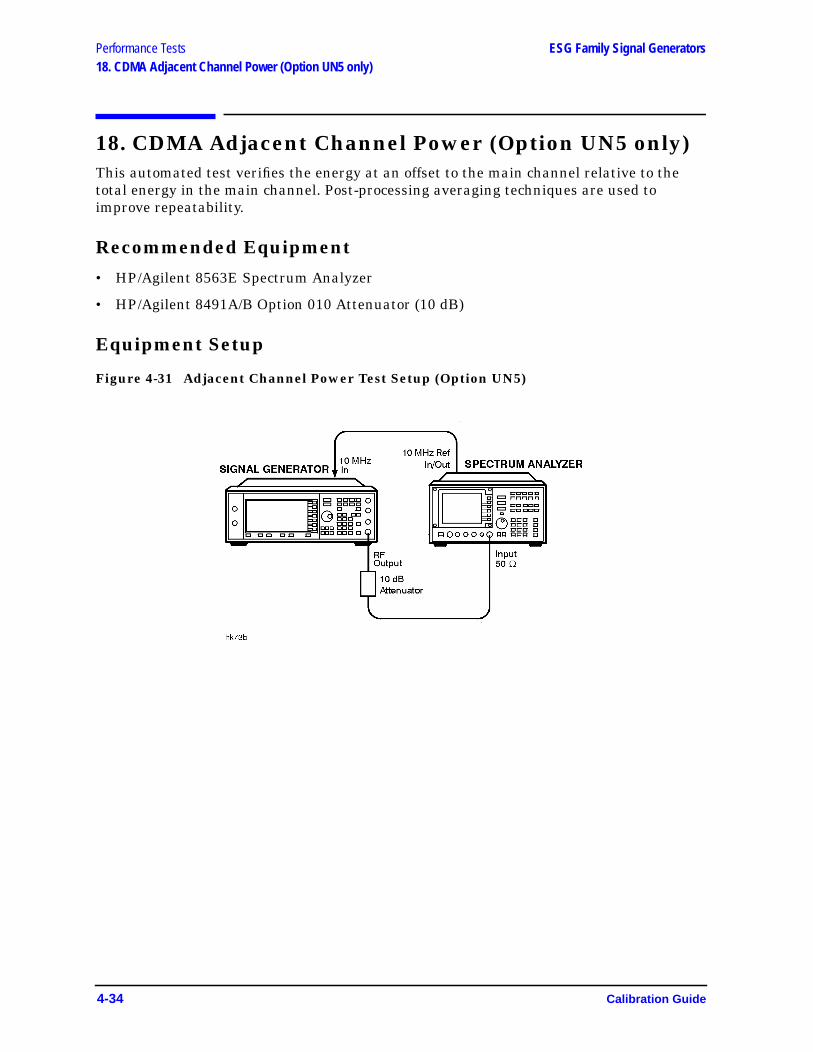
Performance Tests ESG Family Signal Generators18. CDMA Adjacent Channel Power (Option UN5 only)
18. CDMA Adjacent Channel Power (Option UN5 only)This automated test verifies the energy at an offset to the main channel relative to thetotal energy in the main channel. Post-processing averaging techniques are used toimprove repeatability.
Recommended Equipment
• HP/Agilent 8563E Spectrum Analyzer
• HP/Agilent 8491A/B Option 010 Attenuator (10 dB)
Equipment Setup
Figure 4-31 Adjacent Channel Power Test Setup (Option UN5)
4-34 Calibration Guide

ESG Family Signal Generators Performance Tests19. Alternate Timeslot Power Settling Time (Option UNA only)
19. Alternate Timeslot Power Settling Time(Option UNA only)This test measures the time required for a waveform envelope to settle within thetolerance of its final amplitude after a sharp amplitude transition provided by theAlternate Timeslot Power feature (Option UNA). Settling time is the result of heating andcooling effects in the step attenuator and ALC loop. The rise and fall response times of theALC loop and each attenuator segment is characterized and combined to construct thesettling curve for any arbitrary transition.
Recommended Equipment
• HP/Agilent 8563E Option 007 Spectrum Analyzer
• HP/Agilent 8491A/B Option 010 Attenuator (10 dB)
Equipment Setup
Figure 4-32 Alternate Timeslot Power Settling Time Test Setup (Option UNA)
Procedure
1. Connect the equipment as shown in Figure 4-32.
2. Preset all of the equipment.
3. Follow the instructions as they appear on the controller’s display.
Calibration Guide 4-35

Performance Tests ESG Family Signal Generators20. Pulse Rise/Fall Time (Option 1E6 only)
20. Pulse Rise/Fall Time (Option 1E6 only)This test checks the rise/fall time performance of the RF carrier when pulse modulated byway of the PULSE IN path. The oscilloscope captures the rising or falling edge of the RFpulse envelope, and calculations are made from the digitized data. Transition timecalculated is for the 10% to 90% portion of the envelope.
Recommended Equipment
• HP/Agilent 54750A Digitizing Oscilloscope
• HP/Agilent 54751A or 54752A Plug-in
• HP/Agilent 33120A Function Generator
• HP/Agilent 8491A/B Opt 010 Attenuator (10 dB)
• HP/Agilent 8491A/B Opt 020 Attenuator (20 dB)
Equipment Setup
Figure 4-33 Pulse Rise/Fall Time Setup (Option 1E6)
4-36 Calibration Guide

ESG Family Signal Generators Performance Tests21. Measuring Phase Noise and Residual FM (ESG-AP and ESG-DP Series Signal Generators)
21. Measuring Phase Noise and Residual FM(ESG-AP and ESG-DP Series Signal Generators)The signal generator’s automated performance tests do not include a test for either phasenoise or residual FM. These tests must be done separately and the results attached to thetest results obtained with the performance test software. Either output a plot for eachmeasured frequency, or copy the data onto the test record provided on page 4-48.
Measure phase noise and residual FM on an HP/Agilent E5500 system or its equivalent, at0.5, 1, 2, 3, and 4 GHz as applicable to the model under test.
Measuring Phase NoiseBecause of the excellent phase noise performance of ESG-P series signal generators, aspecial procedure and extensive equipment is required. The recommended method is to usean HP/Agilent E5500 series phase noise measurement system. This system isrecommended over the older HP/Agilent 3048 system due to speed issues and the fact thatthe older system can not directly measure residual FM. Most of the rest of this discussionrefers to the E5500 system, although the principles apply to both.
The limitation of any measurement of phase noise is that the resulting measurement cannever be better than the phase noise of the source used to down-convert the signal. In anE5500 system this source is typically either an HP/Agilent 8644B or anHP/Agilent 8662A/63A. Both have advantages and disadvantages. The 8644B has betterphase noise above 10 kHz from the carrier, while the 8662/3 has better close-in phasenoise, but is worse above 10 kHz. Other sources may have different characteristics. To fullycharacterize a signal generator to a high degree of accuracy, both sources may be needed.
The following sections illustrate three different measurements of the same device undertest (DUT):
• “Using an HP/Agilent 8644B” on page 4-38
• “Using an HP/Agilent 8663A Synthesizer” on page 4-39
• “Using Electronic Frequency Locking (EFC)” on page 4-40
Calibration Guide 4-37

Performance Tests ESG Family Signal Generators21. Measuring Phase Noise and Residual FM (ESG-AP and ESG-DP Series Signal Generators)
Using an HP/Agilent 8644BFigure 4-34 shows the phase noise results of the DUT using the 8644B as thedown-converting source. Note that while it has excellent phase noise above 10 kHz, theresults below 10 kHz rapidly degrade. The 60 Hz related noise spikes are typically due tothe DCFM method of phase locking the DUT to the E5500.
Figure 4-34
4-38 Calibration Guide
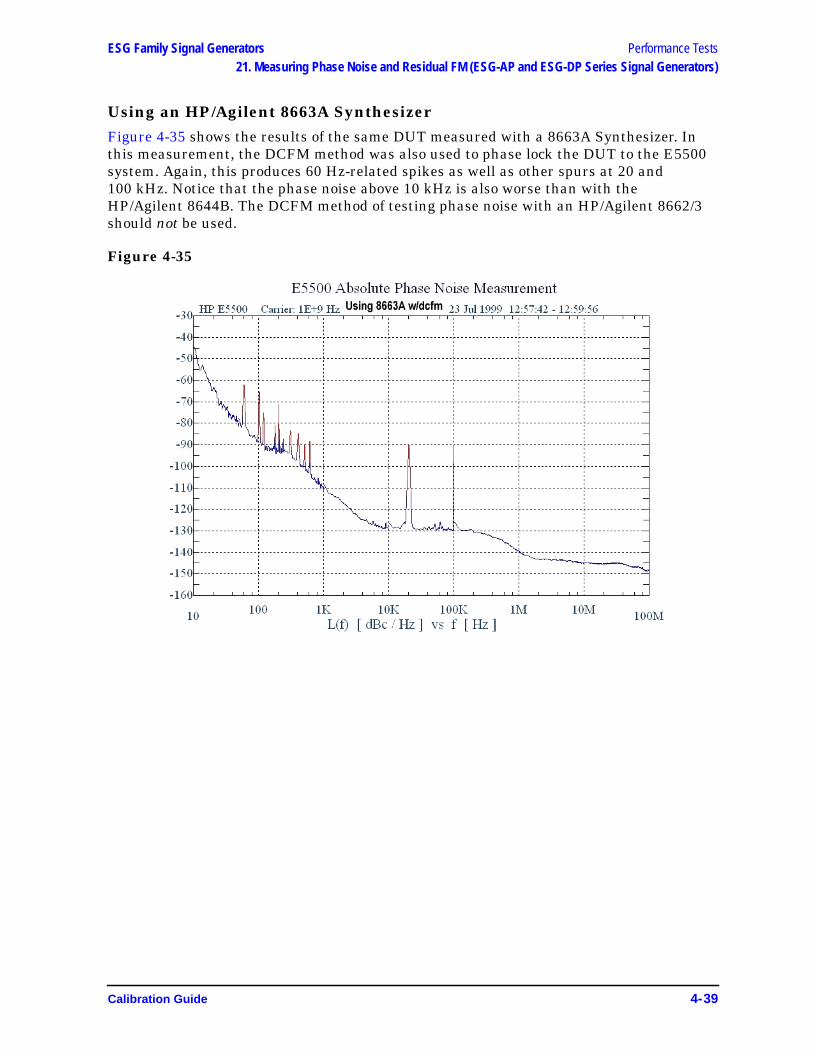
ESG Family Signal Generators Performance Tests21. Measuring Phase Noise and Residual FM (ESG-AP and ESG-DP Series Signal Generators)
Using an HP/Agilent 8663A SynthesizerFigure 4-35 shows the results of the same DUT measured with a 8663A Synthesizer. Inthis measurement, the DCFM method was also used to phase lock the DUT to the E5500system. Again, this produces 60 Hz-related spikes as well as other spurs at 20 and100 kHz. Notice that the phase noise above 10 kHz is also worse than with theHP/Agilent 8644B. The DCFM method of testing phase noise with an HP/Agilent 8662/3should not be used.
Figure 4-35
Calibration Guide 4-39
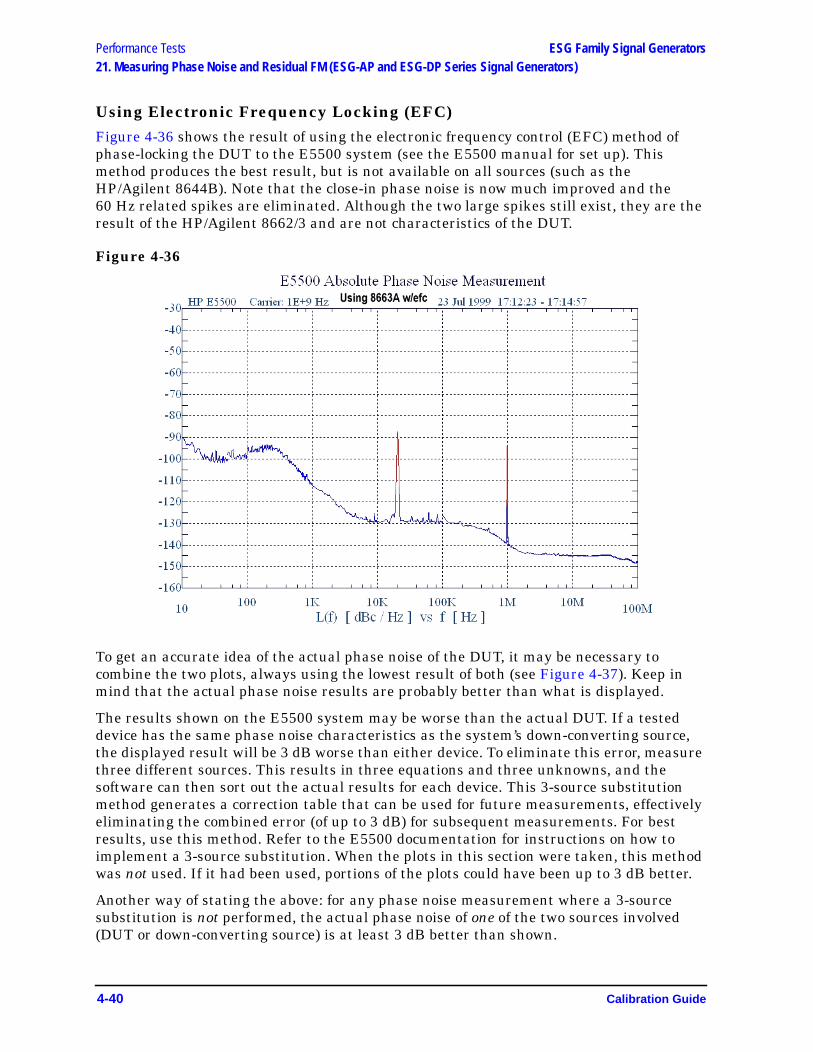
Performance Tests ESG Family Signal Generators21. Measuring Phase Noise and Residual FM (ESG-AP and ESG-DP Series Signal Generators)
Using Electronic Frequency Locking (EFC)Figure 4-36 shows the result of using the electronic frequency control (EFC) method ofphase-locking the DUT to the E5500 system (see the E5500 manual for set up). Thismethod produces the best result, but is not available on all sources (such as theHP/Agilent 8644B). Note that the close-in phase noise is now much improved and the60 Hz related spikes are eliminated. Although the two large spikes still exist, they are theresult of the HP/Agilent 8662/3 and are not characteristics of the DUT.
Figure 4-36
To get an accurate idea of the actual phase noise of the DUT, it may be necessary tocombine the two plots, always using the lowest result of both (see Figure 4-37). Keep inmind that the actual phase noise results are probably better than what is displayed.
The results shown on the E5500 system may be worse than the actual DUT. If a testeddevice has the same phase noise characteristics as the system’s down-converting source,the displayed result will be 3 dB worse than either device. To eliminate this error, measurethree different sources. This results in three equations and three unknowns, and thesoftware can then sort out the actual results for each device. This 3-source substitutionmethod generates a correction table that can be used for future measurements, effectivelyeliminating the combined error (of up to 3 dB) for subsequent measurements. For bestresults, use this method. Refer to the E5500 documentation for instructions on how toimplement a 3-source substitution. When the plots in this section were taken, this methodwas not used. If it had been used, portions of the plots could have been up to 3 dB better.
Another way of stating the above: for any phase noise measurement where a 3-sourcesubstitution is not performed, the actual phase noise of one of the two sources involved(DUT or down-converting source) is at least 3 dB better than shown.
4-40 Calibration Guide
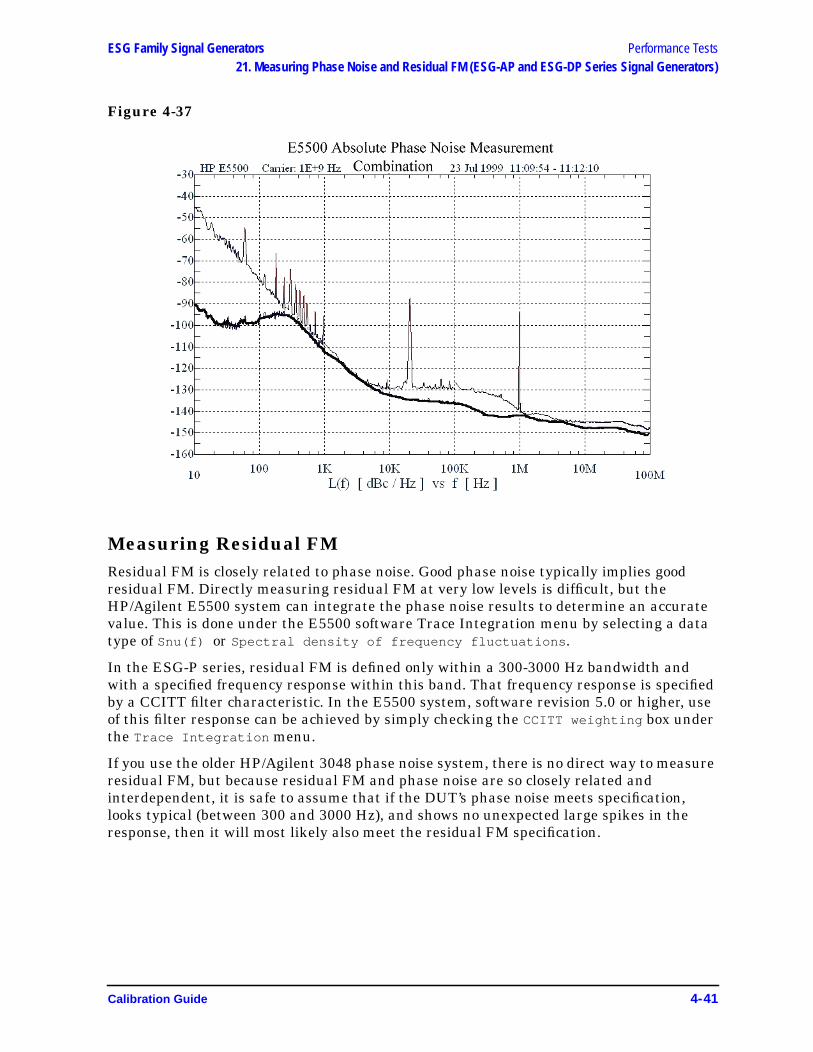
ESG Family Signal Generators Performance Tests21. Measuring Phase Noise and Residual FM (ESG-AP and ESG-DP Series Signal Generators)
Figure 4-37
Measuring Residual FMResidual FM is closely related to phase noise. Good phase noise typically implies goodresidual FM. Directly measuring residual FM at very low levels is difficult, but theHP/Agilent E5500 system can integrate the phase noise results to determine an accuratevalue. This is done under the E5500 software Trace Integration menu by selecting a datatype of Snu(f) or Spectral density of frequency fluctuations .
In the ESG-P series, residual FM is defined only within a 300-3000 Hz bandwidth andwith a specified frequency response within this band. That frequency response is specifiedby a CCITT filter characteristic. In the E5500 system, software revision 5.0 or higher, useof this filter response can be achieved by simply checking the CCITT weighting box underthe Trace Integration menu.
If you use the older HP/Agilent 3048 phase noise system, there is no direct way to measureresidual FM, but because residual FM and phase noise are so closely related andinterdependent, it is safe to assume that if the DUT’s phase noise meets specification,looks typical (between 300 and 3000 Hz), and shows no unexpected large spikes in theresponse, then it will most likely also meet the residual FM specification.
Calibration Guide 4-41
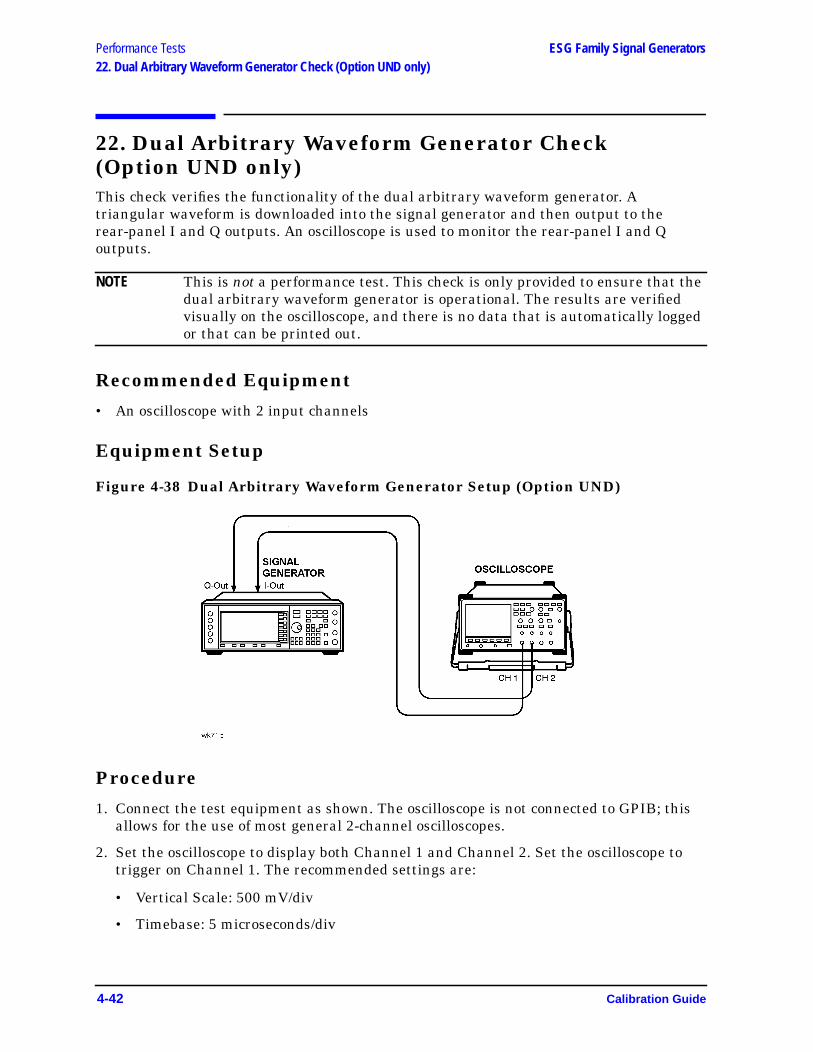
Performance Tests ESG Family Signal Generators22. Dual Arbitrary Waveform Generator Check (Option UND only)
22. Dual Arbitrary Waveform Generator Check(Option UND only)This check verifies the functionality of the dual arbitrary waveform generator. Atriangular waveform is downloaded into the signal generator and then output to therear-panel I and Q outputs. An oscilloscope is used to monitor the rear-panel I and Qoutputs.
NOTE This is not a performance test. This check is only provided to ensure that thedual arbitrary waveform generator is operational. The results are verifiedvisually on the oscilloscope, and there is no data that is automatically loggedor that can be printed out.
Recommended Equipment
• An oscilloscope with 2 input channels
Equipment Setup
Figure 4-38 Dual Arbitrary Waveform Generator Setup (Option UND)
Procedure
1. Connect the test equipment as shown. The oscilloscope is not connected to GPIB; thisallows for the use of most general 2-channel oscilloscopes.
2. Set the oscilloscope to display both Channel 1 and Channel 2. Set the oscilloscope totrigger on Channel 1. The recommended settings are:
• Vertical Scale: 500 mV/div
• Timebase: 5 microseconds/div
4-42 Calibration Guide
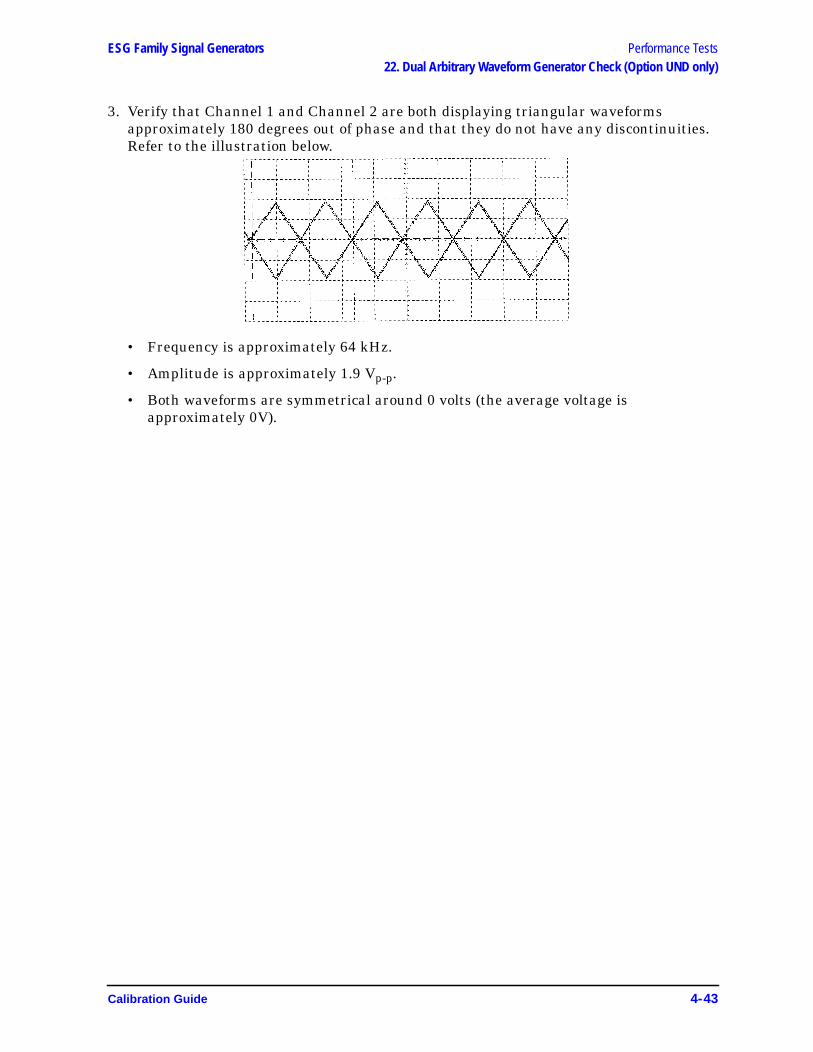
ESG Family Signal Generators Performance Tests22. Dual Arbitrary Waveform Generator Check (Option UND only)
3. Verify that Channel 1 and Channel 2 are both displaying triangular waveformsapproximately 180 degrees out of phase and that they do not have any discontinuities.Refer to the illustration below.
• Frequency is approximately 64 kHz.
• Amplitude is approximately 1.9 Vp-p.
• Both waveforms are symmetrical around 0 volts (the average voltage isapproximately 0V).
Calibration Guide 4-43

Performance Tests ESG Family Signal Generators23. GSM Loopback BER Check (Option 300 only)
23. GSM Loopback BER Check (Option 300 only)This test is a functionality check of the Option 300 GSM BER hardware, and does not testany specifications. The instrument’s RF output is connected to the rear panel 321.4 MHzIF input. The test is made with the RF signal set to 321.4 MHz at 0 dBm. The instrumentis specially configured to emulate a GSM base station (transmitting BCH then TCHsignals for synchronization). A BER measurement is made with an expected result of 0%error. A second BER measurement is made where known errors are added to thebitstream.
Recommended EquipmentNo equipment is required.
Equipment Setup
Figure 4-39 GSM Loopback BER Check Setup (Option 300)
4-44 Calibration Guide
ESG Family Signal Generators Performance Tests24. Frac-N Check (ESG-AP, ESG-DP only)
24. Frac-N Check (ESG-AP, ESG-DP only)This test uses the internal analog bus (ABUS) to verify proper operation of theFractional-N assembly. It also checks for unlocked conditions at frequencies across thetune range. Use this test as a diagnostic tool; it does not verify actual instrumentperformance.
Recommended EquipmentNo equipment is required.
25. Sampler/YO Driver Check (ESG-AP, ESG-DP only)This test uses the internal analog bus (ABUS) to verify proper operation of the Samplerand YO Driver assemblies. It also checks for unlocked conditions at frequencies across thetune range. Use this test as a diagnostic tool; it does not verify actual instrumentperformance.
Recommended EquipmentNo equipment is required.
Calibration Guide 4-45

Performance Tests ESG Family Signal GeneratorsPerformance Test Records
Performance Test RecordsThe test records at the end of this chapter are provided as masters for you to photocopy.
Table 4-1 on page 4-47 provides a place to record the equipment used for the tests in thischapter.
Table 4-2 and Table 4-3 on page 4-48 are provided for recording the results of manualtests:
• Timebase aging rate (page 4-24)
• Phase noise and Residual FM (page 4-37)
Where applicable, use the ESG Family Support Software to print out a test record of theresults obtained from the automated performance tests.
4-46 Calibration Guide

ESG Family Signal Generators Performance TestsPerformance Test Records
Table 4-1 ESG Family Signal Generators Performance Test Record
Test Equipment Used Model Number Trace Number Cal Due Date
Model ___________________ Report Number_________________________
Date___________
Arbitrary Waveform Generator
Attenuator (6 dB)
Attenuator (10 dB)
Audio Analyzer
Frequency Counter
Function Generator
Low Noise Amp (0.1–10 MHz)
Low Noise Amp (0.03–2 GHz)
Measuring Receiver
Mixer (0.5–9 GHz)
Mixer (0.001–2.8 GHz)
Oscilloscope, Digital
Oscilloscope, Digitizing
Oscilloscope Plug-in
Power Meter
Power Sensor
Power Splitter
Primary Frequency Standard
Signal Generator
Spectrum Analyzer
Vector Signal Analyzer
W-CDMA Spectrum Analyzer
______________________
______________________
______________
______________
______________
______________
______________
______________
______________
______________
______________
______________
______________
______________
______________
______________
______________
______________
______________
______________
______________
______________
______________
______________
______________
______________
______________
______________
______________
______________
______________
______________
______________
______________
______________
______________
______________
______________
______________
______________
______________
______________
______________
______________
______________
______________
______________
______________
______________
______________
______________
______________
______________
______________
______________
______________
______________
______________
______________
______________
______________
______________
______________
______________
______________
______________
______________
______________
______________
______________
______________
______________
______________
______________
Calibration Guide 4-47

Performance Tests ESG Family Signal GeneratorsPerformance Test Records
Table 4-2 ESG Family Signal Generators Timebase Aging RatePerformance Test Record
Table 4-3 ESG-AP and ESG-DP Series Signal Generators Phase Noise andResidual FM Performance Test Record
Model _____________ Report Number ____________________________ Date ___________
Test Description Results Specification MeasurementUncertainty
Timebase Aging RateESG-AP, ESG-DP, orOption 1E5 only _____________________ < ±0.0005 ppm/day 5.6 × 10⁻¹¹ per day
Model___________________
Serial No.__________________
Date___________________
Tester____________________
Phase Noise (20kHz Offset)
Frequency (GHz) Specification(dBc/Hz) Measurement Pass/Fail?
0.5 < –134
1.0 < –130
2.0 < –123
3.0 < –120
4.0 < –118
Residual FM (CCITT Weighting)
Frequency (GHz) Specification (Hz) Measurement Pass/Fail?
0.5 < 0.5
1.0 < 1
2.0 < 2
3.0 < 3
4.0 < 4
4-48 Calibration Guide
ESG Family Signal Generators
5 Adjustments
This chapter contains the adjustment procedures that may be required for the signalgenerator.
Calibration Guide 5-1

Adjustments ESG Family Signal GeneratorsAdjustment Relationships
Adjustment RelationshipsAnytime an adjustment is made to the signal generator other related adjustments may beaffected. For optimal performance, whenever an adjustment is performed, the relatedadjustments should also be performed.
Analog Bus Related AdjustmentsThe following adjustments are optimized if the Analog Bus ADC Calibration has been run:
• VCO Bias Potentiometer Adjustment
• FM Inverting Amplifier Offset Calibration
• ALC Modulation Drive Bias Calibration
• VBLO Mixer Bias Calibration
• Level Meter Calibration
• I/Q Gain/Offset/Quadrature Calibration (ESG-D only)
• I/Q Impairment Adjustment (ESG-D only)
Synthesizer Potentiometer Related AdjustmentsThe Lock Angle potentiometer is preset fully counter-clockwise in the VCO BiasAdjustment. Both adjustments should always be performed together.
• VCO Bias Potentiometer Adjustment
• Lock Angle Adjustment
AM Accuracy Related Adjustments
• AM Audio Path Offset Calibration
• AM Gain Calibration
I/Q Modulation Accuracy Related Adjustments
• VBLO Mixer Bias Calibration
• I/Q Gain/Offset/Quadrature Calibration (ESG-D only)
• I/Q Impairment Adjustment (ESG-D only)
• Baseband Generator I/Q Gain and Offset Adjustment (Options UN3 or UN4 only)
Burst Modulation Accuracy Related Adjustments
• Burst Modulator Calibration (ESG-D only)
• Burst Audio Path Gain Calibration (ESG-D only)
5-2 Calibration Guide
ESG Family Signal Generators AdjustmentsAdjustment Relationships
FM Accuracy Related Adjustments
• KV versus Frequency Calibration
• FM Scale DAC Offset Adjustment
• FM Path Offset Adjustment
• FM In-Band DAC Offset Adjustment
• FM Inverting Amplifier Offset Calibration
• FM 1/2 Path Ratio Adjustment
• Modulation Source Relative Gain Calibration
• FM Out-of-Band Calibration
• FM Delay Potentiometer Adjustment
• FM/PM YO Frequency Compensation Calibration (ESG-AP and ESG-DP only)
• FM/PM OB Cal (ESG-AP and ESG-DP only)
• DCFM Calibration
Power Level Range and Accuracy Related Adjustments
• Prelevel Calibration
• Gain Adjustment
• Low Noise Floor Gain Adjustment (ESG-AP and ESG-DP only)
• ALC Modulation Driver Bias Calibration
• VBLO Mixer Bias Calibration
• Power Level Accuracy
• Level Meter Calibration
• ALC Modulation Flatness Calibration
Calibration Guide 5-3
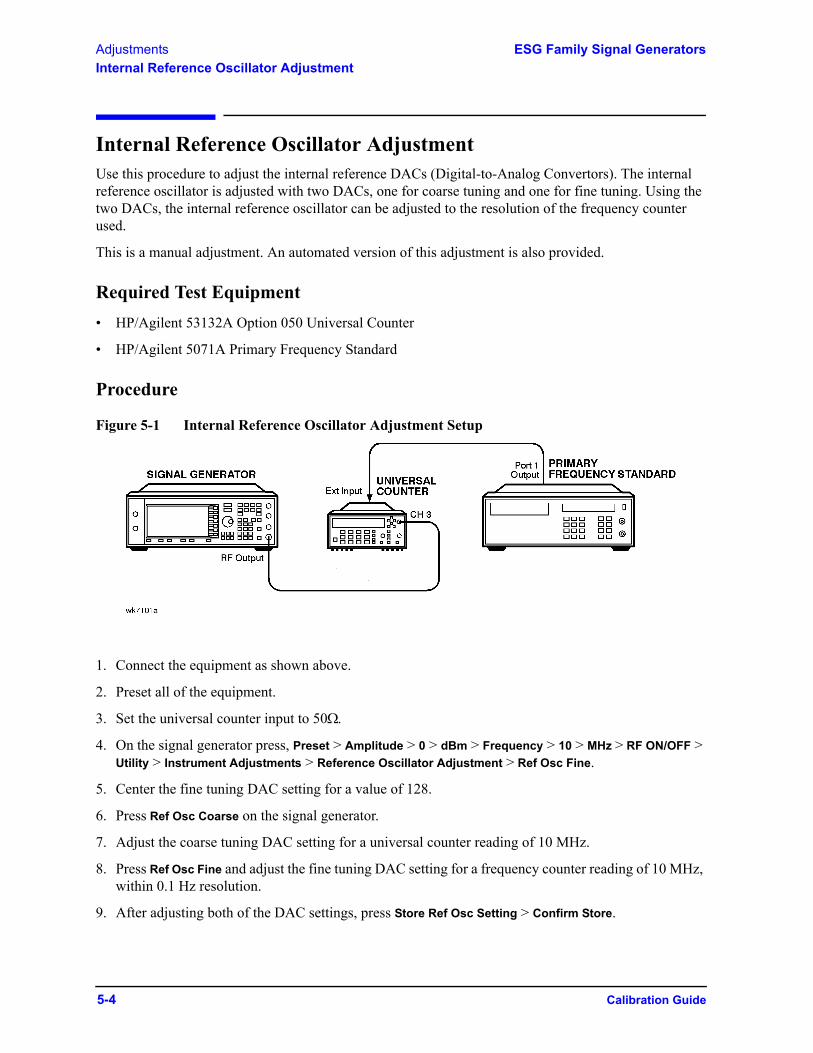
Adjustments ESG Family Signal GeneratorsInternal Reference Oscillator Adjustment
Internal Reference Oscillator AdjustmentUse this procedure to adjust the internal reference DACs (Digital-to-Analog Convertors). The internal reference oscillator is adjusted with two DACs, one for coarse tuning and one for fine tuning. Using the two DACs, the internal reference oscillator can be adjusted to the resolution of the frequency counter used.
This is a manual adjustment. An automated version of this adjustment is also provided.
Required Test Equipment• HP/Agilent 53132A Option 050 Universal Counter
• HP/Agilent 5071A Primary Frequency Standard
Procedure
Figure 5-1 Internal Reference Oscillator Adjustment Setup
1. Connect the equipment as shown above.
2. Preset all of the equipment.
3. Set the universal counter input to 50Ω.
4. On the signal generator press, Preset > Amplitude > 0 > dBm > Frequency > 10 > MHz > RF ON/OFF > Utility > Instrument Adjustments > Reference Oscillator Adjustment > Ref Osc Fine.
5. Center the fine tuning DAC setting for a value of 128.
6. Press Ref Osc Coarse on the signal generator.
7. Adjust the coarse tuning DAC setting for a universal counter reading of 10 MHz.
8. Press Ref Osc Fine and adjust the fine tuning DAC setting for a frequency counter reading of 10 MHz, within 0.1 Hz resolution.
9. After adjusting both of the DAC settings, press Store Ref Osc Setting > Confirm Store.
5-4 Calibration Guide
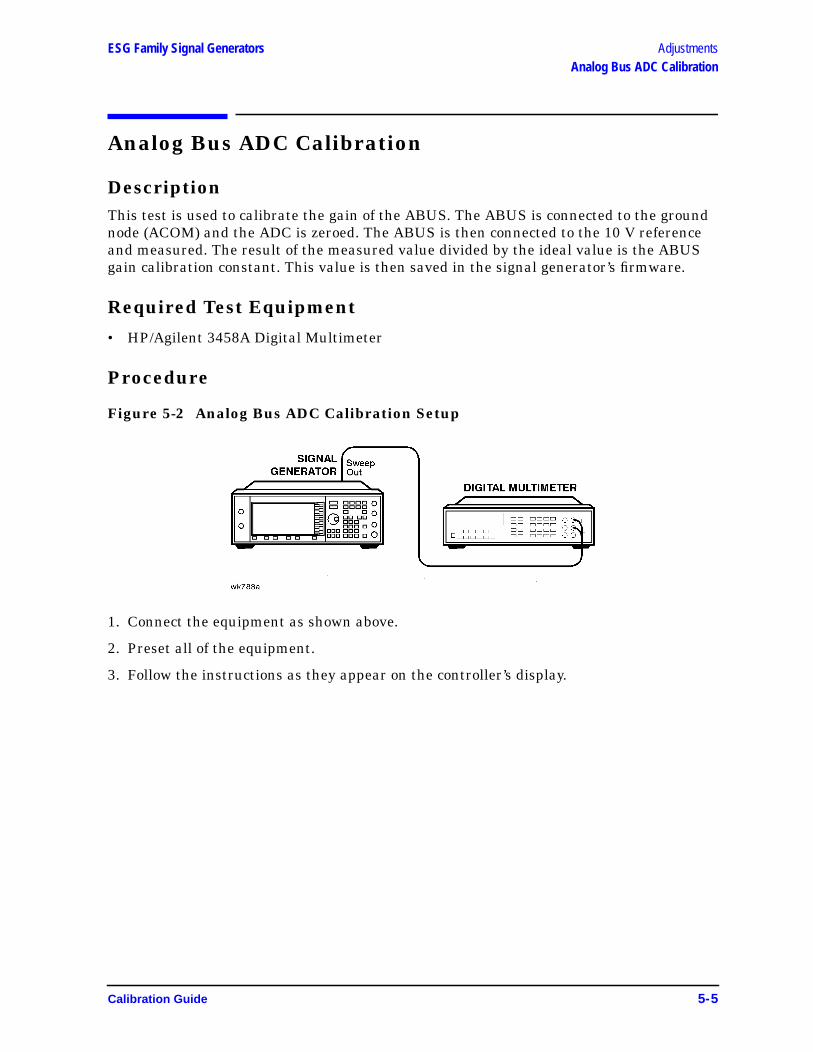
ESG Family Signal Generators AdjustmentsAnalog Bus ADC Calibration
Analog Bus ADC Calibration
DescriptionThis test is used to calibrate the gain of the ABUS. The ABUS is connected to the groundnode (ACOM) and the ADC is zeroed. The ABUS is then connected to the 10 V referenceand measured. The result of the measured value divided by the ideal value is the ABUSgain calibration constant. This value is then saved in the signal generator’s firmware.
Required Test Equipment
• HP/Agilent 3458A Digital Multimeter
Procedure
Figure 5-2 Analog Bus ADC Calibration Setup
1. Connect the equipment as shown above.
2. Preset all of the equipment.
3. Follow the instructions as they appear on the controller’s display.
Calibration Guide 5-5
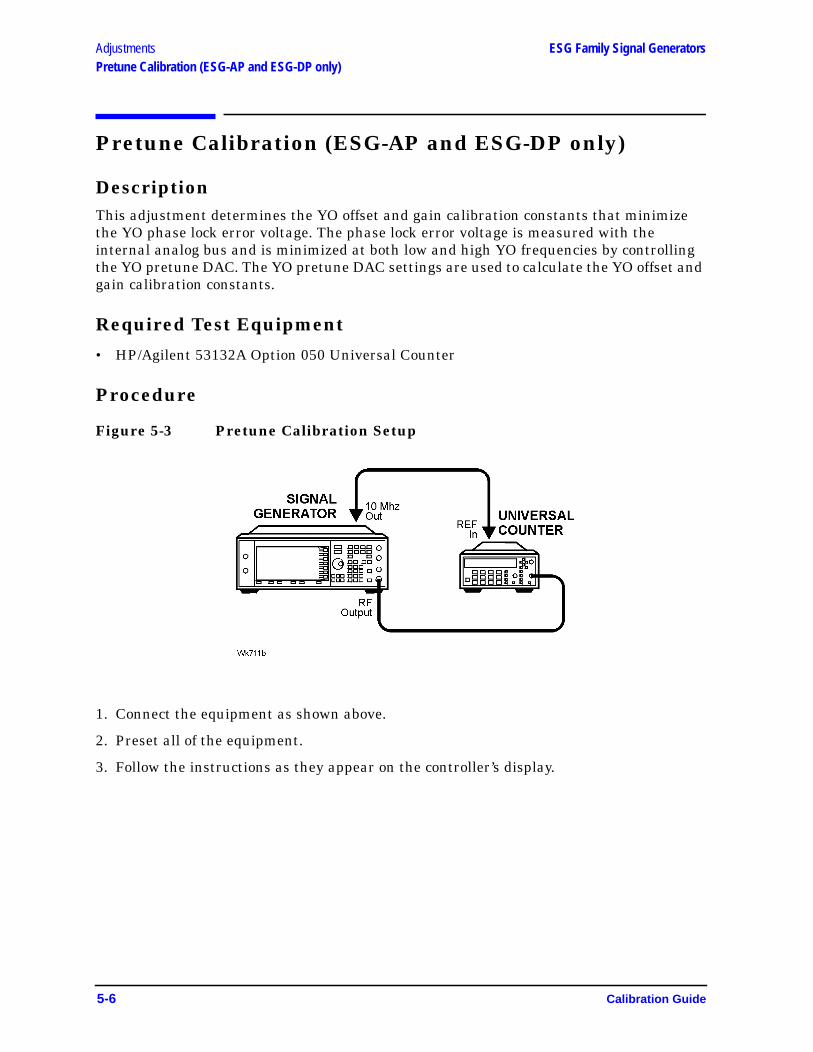
Adjustments ESG Family Signal GeneratorsPretune Calibration (ESG-AP and ESG-DP only)
Pretune Calibration (ESG-AP and ESG-DP only)
DescriptionThis adjustment determines the YO offset and gain calibration constants that minimizethe YO phase lock error voltage. The phase lock error voltage is measured with theinternal analog bus and is minimized at both low and high YO frequencies by controllingthe YO pretune DAC. The YO pretune DAC settings are used to calculate the YO offset andgain calibration constants.
Required Test Equipment
• HP/Agilent 53132A Option 050 Universal Counter
Procedure
Figure 5-3 Pretune Calibration Setup
1. Connect the equipment as shown above.
2. Preset all of the equipment.
3. Follow the instructions as they appear on the controller’s display.
5-6 Calibration Guide
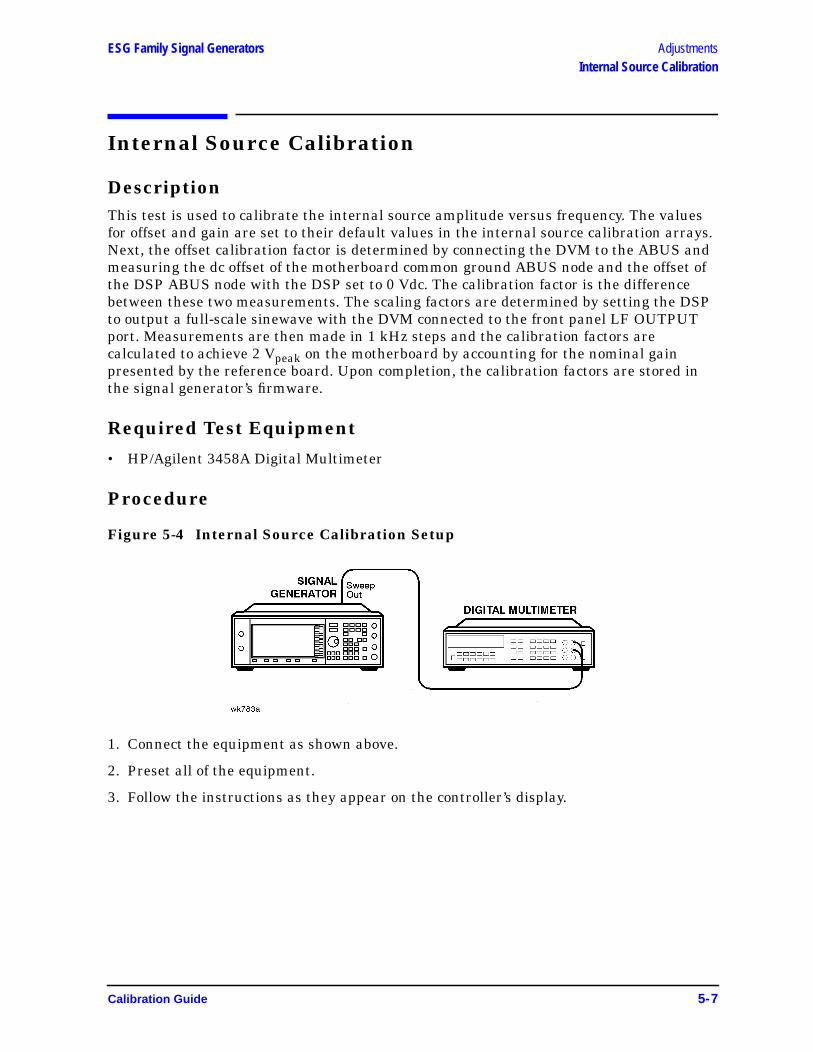
ESG Family Signal Generators AdjustmentsInternal Source Calibration
Internal Source Calibration
DescriptionThis test is used to calibrate the internal source amplitude versus frequency. The valuesfor offset and gain are set to their default values in the internal source calibration arrays.Next, the offset calibration factor is determined by connecting the DVM to the ABUS andmeasuring the dc offset of the motherboard common ground ABUS node and the offset ofthe DSP ABUS node with the DSP set to 0 Vdc. The calibration factor is the differencebetween these two measurements. The scaling factors are determined by setting the DSPto output a full-scale sinewave with the DVM connected to the front panel LF OUTPUTport. Measurements are then made in 1 kHz steps and the calibration factors arecalculated to achieve 2 Vpeak on the motherboard by accounting for the nominal gainpresented by the reference board. Upon completion, the calibration factors are stored inthe signal generator’s firmware.
Required Test Equipment
• HP/Agilent 3458A Digital Multimeter
Procedure
Figure 5-4 Internal Source Calibration Setup
1. Connect the equipment as shown above.
2. Preset all of the equipment.
3. Follow the instructions as they appear on the controller’s display.
Calibration Guide 5-7
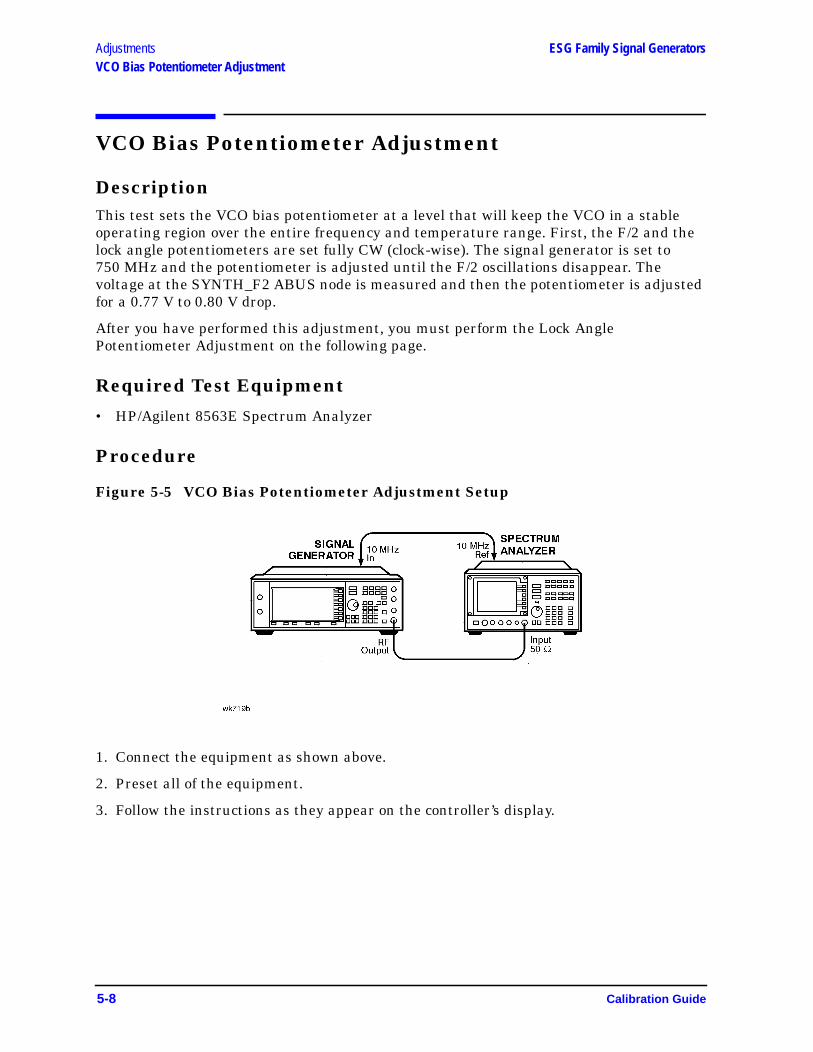
Adjustments ESG Family Signal GeneratorsVCO Bias Potentiometer Adjustment
VCO Bias Potentiometer Adjustment
DescriptionThis test sets the VCO bias potentiometer at a level that will keep the VCO in a stableoperating region over the entire frequency and temperature range. First, the F/2 and thelock angle potentiometers are set fully CW (clock-wise). The signal generator is set to750 MHz and the potentiometer is adjusted until the F/2 oscillations disappear. Thevoltage at the SYNTH_F2 ABUS node is measured and then the potentiometer is adjustedfor a 0.77 V to 0.80 V drop.
After you have performed this adjustment, you must perform the Lock AnglePotentiometer Adjustment on the following page.
Required Test Equipment
• HP/Agilent 8563E Spectrum Analyzer
Procedure
Figure 5-5 VCO Bias Potentiometer Adjustment Setup
1. Connect the equipment as shown above.
2. Preset all of the equipment.
3. Follow the instructions as they appear on the controller’s display.
5-8 Calibration Guide
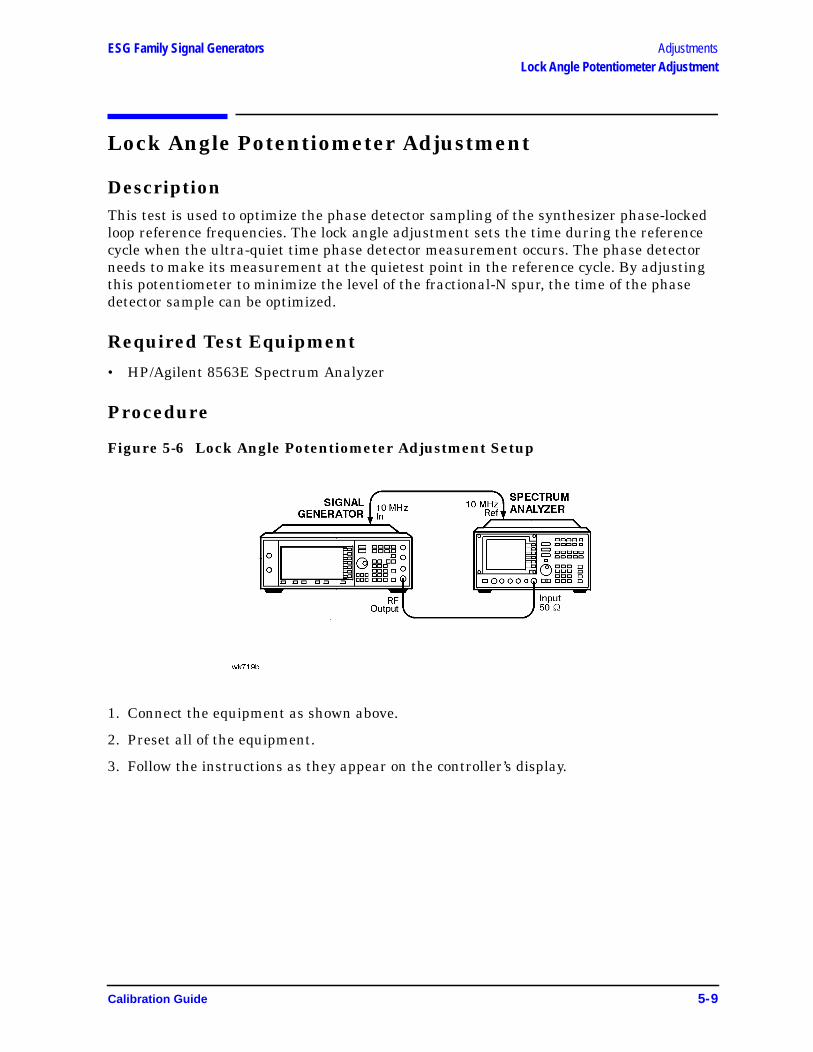
ESG Family Signal Generators AdjustmentsLock Angle Potentiometer Adjustment
Lock Angle Potentiometer Adjustment
DescriptionThis test is used to optimize the phase detector sampling of the synthesizer phase-lockedloop reference frequencies. The lock angle adjustment sets the time during the referencecycle when the ultra-quiet time phase detector measurement occurs. The phase detectorneeds to make its measurement at the quietest point in the reference cycle. By adjustingthis potentiometer to minimize the level of the fractional-N spur, the time of the phasedetector sample can be optimized.
Required Test Equipment
• HP/Agilent 8563E Spectrum Analyzer
Procedure
Figure 5-6 Lock Angle Potentiometer Adjustment Setup
1. Connect the equipment as shown above.
2. Preset all of the equipment.
3. Follow the instructions as they appear on the controller’s display.
Calibration Guide 5-9
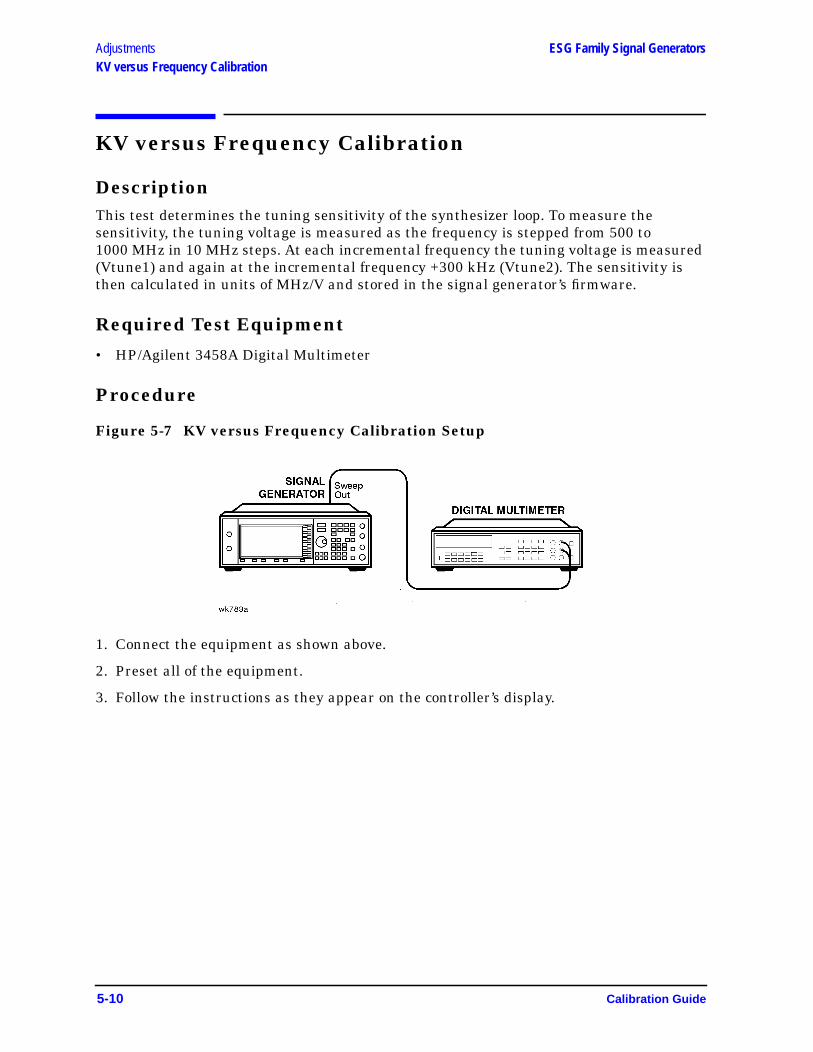
Adjustments ESG Family Signal GeneratorsKV versus Frequency Calibration
KV versus Frequency Calibration
DescriptionThis test determines the tuning sensitivity of the synthesizer loop. To measure thesensitivity, the tuning voltage is measured as the frequency is stepped from 500 to1000 MHz in 10 MHz steps. At each incremental frequency the tuning voltage is measured(Vtune1) and again at the incremental frequency +300 kHz (Vtune2). The sensitivity isthen calculated in units of MHz/V and stored in the signal generator’s firmware.
Required Test Equipment
• HP/Agilent 3458A Digital Multimeter
Procedure
Figure 5-7 KV versus Frequency Calibration Setup
1. Connect the equipment as shown above.
2. Preset all of the equipment.
3. Follow the instructions as they appear on the controller’s display.
5-10 Calibration Guide
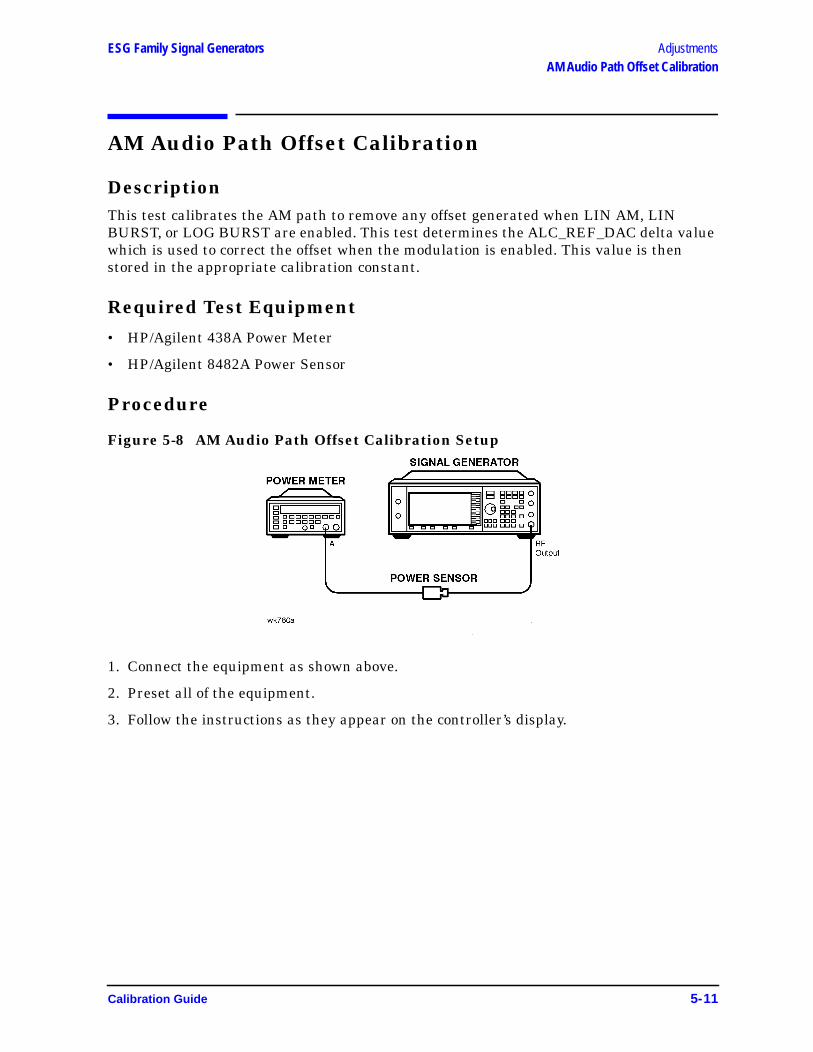
ESG Family Signal Generators AdjustmentsAM Audio Path Offset Calibration
AM Audio Path Offset Calibration
DescriptionThis test calibrates the AM path to remove any offset generated when LIN AM, LINBURST, or LOG BURST are enabled. This test determines the ALC_REF_DAC delta valuewhich is used to correct the offset when the modulation is enabled. This value is thenstored in the appropriate calibration constant.
Required Test Equipment
• HP/Agilent 438A Power Meter
• HP/Agilent 8482A Power Sensor
Procedure
Figure 5-8 AM Audio Path Offset Calibration Setup
1. Connect the equipment as shown above.
2. Preset all of the equipment.
3. Follow the instructions as they appear on the controller’s display.
Calibration Guide 5-11

Adjustments ESG Family Signal GeneratorsTimebase DAC Calibration
Timebase DAC Calibration
DescriptionThis test ensures that the signal generator has warmed-up sufficiently and then adjuststhe coarse and fine reference timebase DACs for minimum internal reference frequencyerror. The coarse and fine DAC calibration factors are then stored in the signal generator’sfirmware.
Required Test Equipment
• HP/Agilent 53132A Option 050 Universal Counter
• HP/Agilent 5071A Primary Frequency Standard
Procedure
Figure 5-9 Timebase DAC Calibration Setup
1. Connect the equipment as shown above.
2. Preset all of the equipment.
3. Follow the instructions as they appear on the controller’s display.
5-12 Calibration Guide
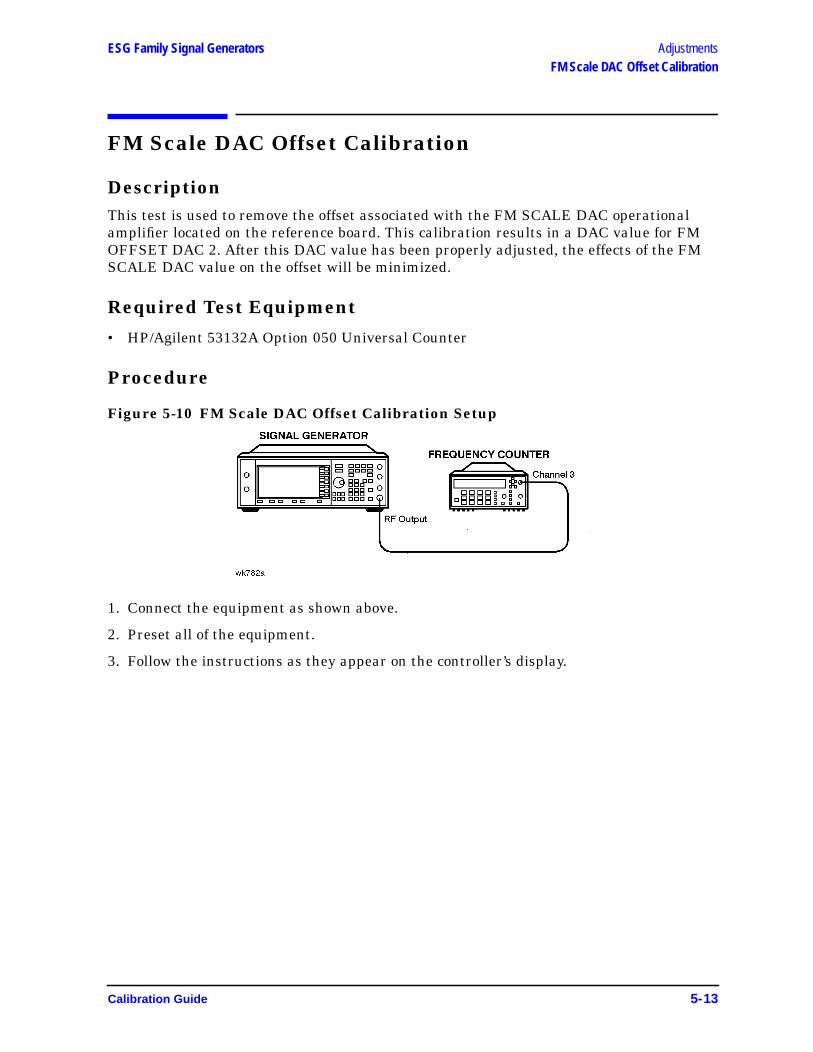
ESG Family Signal Generators AdjustmentsFM Scale DAC Offset Calibration
FM Scale DAC Offset Calibration
DescriptionThis test is used to remove the offset associated with the FM SCALE DAC operationalamplifier located on the reference board. This calibration results in a DAC value for FMOFFSET DAC 2. After this DAC value has been properly adjusted, the effects of the FMSCALE DAC value on the offset will be minimized.
Required Test Equipment
• HP/Agilent 53132A Option 050 Universal Counter
Procedure
Figure 5-10 FM Scale DAC Offset Calibration Setup
1. Connect the equipment as shown above.
2. Preset all of the equipment.
3. Follow the instructions as they appear on the controller’s display.
Calibration Guide 5-13
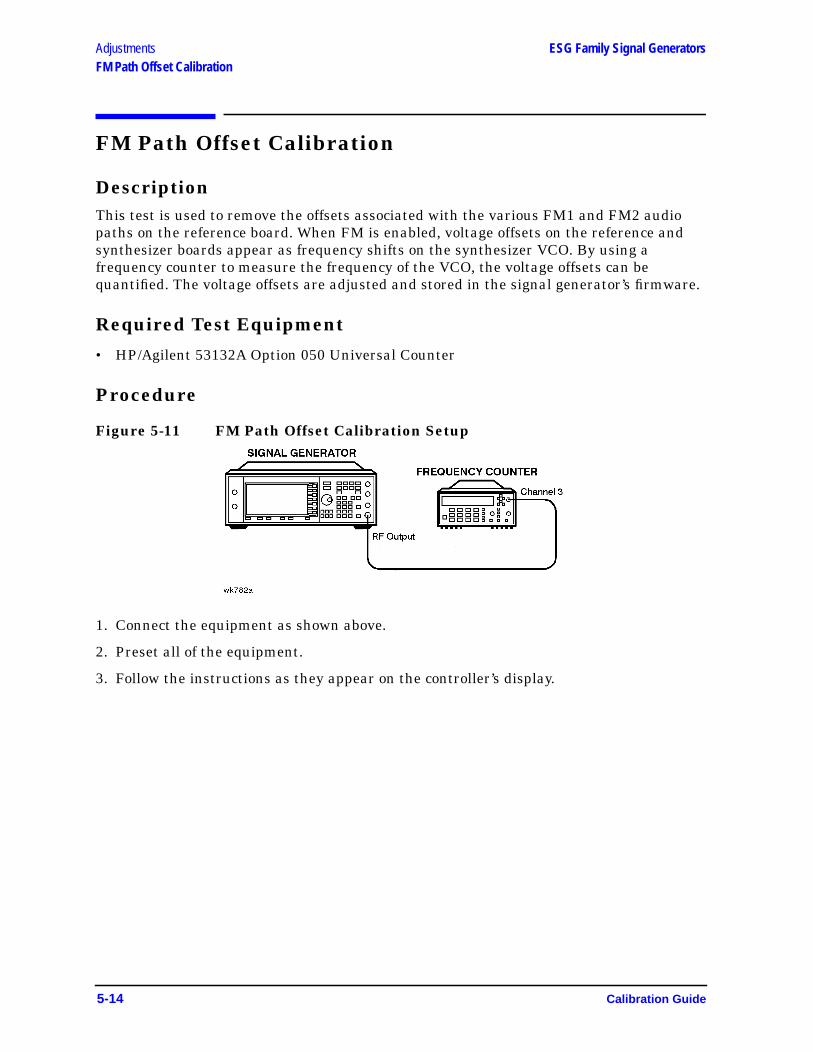
Adjustments ESG Family Signal GeneratorsFM Path Offset Calibration
FM Path Offset Calibration
DescriptionThis test is used to remove the offsets associated with the various FM1 and FM2 audiopaths on the reference board. When FM is enabled, voltage offsets on the reference andsynthesizer boards appear as frequency shifts on the synthesizer VCO. By using afrequency counter to measure the frequency of the VCO, the voltage offsets can bequantified. The voltage offsets are adjusted and stored in the signal generator’s firmware.
Required Test Equipment
• HP/Agilent 53132A Option 050 Universal Counter
Procedure
Figure 5-11 FM Path Offset Calibration Setup
1. Connect the equipment as shown above.
2. Preset all of the equipment.
3. Follow the instructions as they appear on the controller’s display.
5-14 Calibration Guide
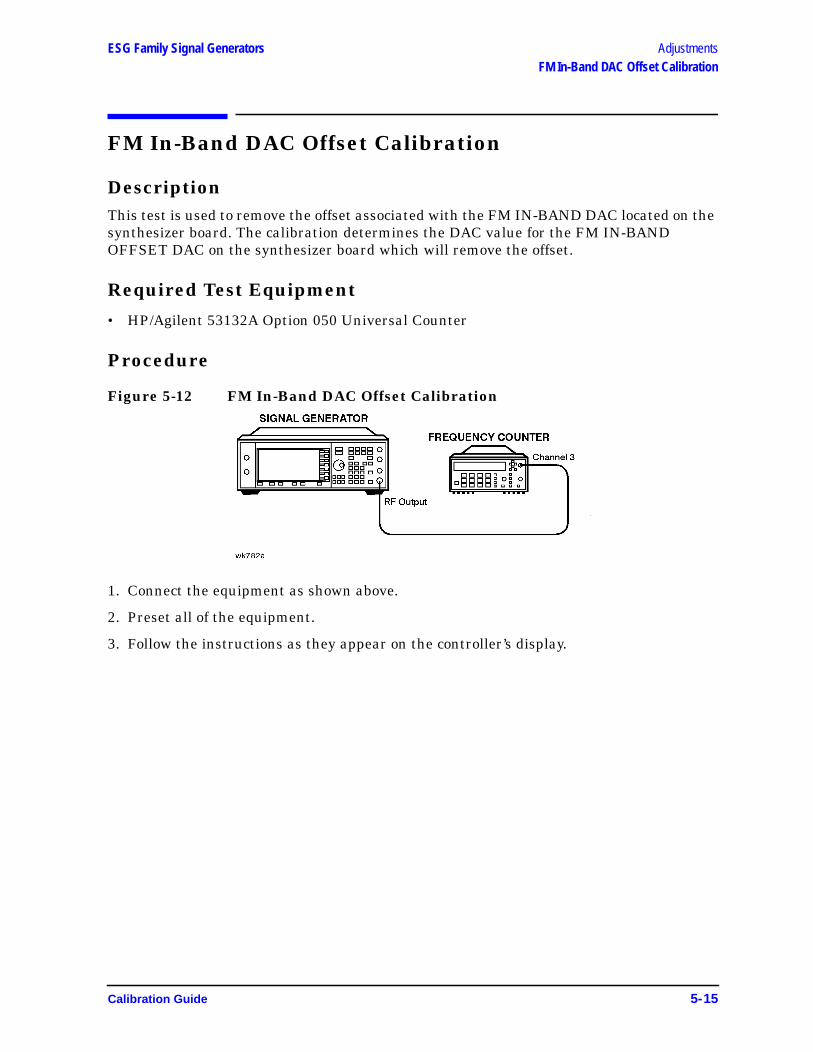
ESG Family Signal Generators AdjustmentsFM In-Band DAC Offset Calibration
FM In-Band DAC Offset Calibration
DescriptionThis test is used to remove the offset associated with the FM IN-BAND DAC located on thesynthesizer board. The calibration determines the DAC value for the FM IN-BANDOFFSET DAC on the synthesizer board which will remove the offset.
Required Test Equipment
• HP/Agilent 53132A Option 050 Universal Counter
Procedure
Figure 5-12 FM In-Band DAC Offset Calibration
1. Connect the equipment as shown above.
2. Preset all of the equipment.
3. Follow the instructions as they appear on the controller’s display.
Calibration Guide 5-15
Adjustments ESG Family Signal GeneratorsFM Inverting Amplifier Offset Calibration
FM Inverting Amplifier Offset Calibration
DescriptionThis test is used to remove the offset associated with the differential inverting amplifier onthe FM input of the synthesizer board. The calibration determines the DAC value for theFM OFFSET DAC 1 on the reference board which will remove the offset associated withthe amplifier.
Required Test Equipment
• None
Procedure
1. Preset the signal generator.
2. Follow the instructions as they appear on the controller’s display.
5-16 Calibration Guide
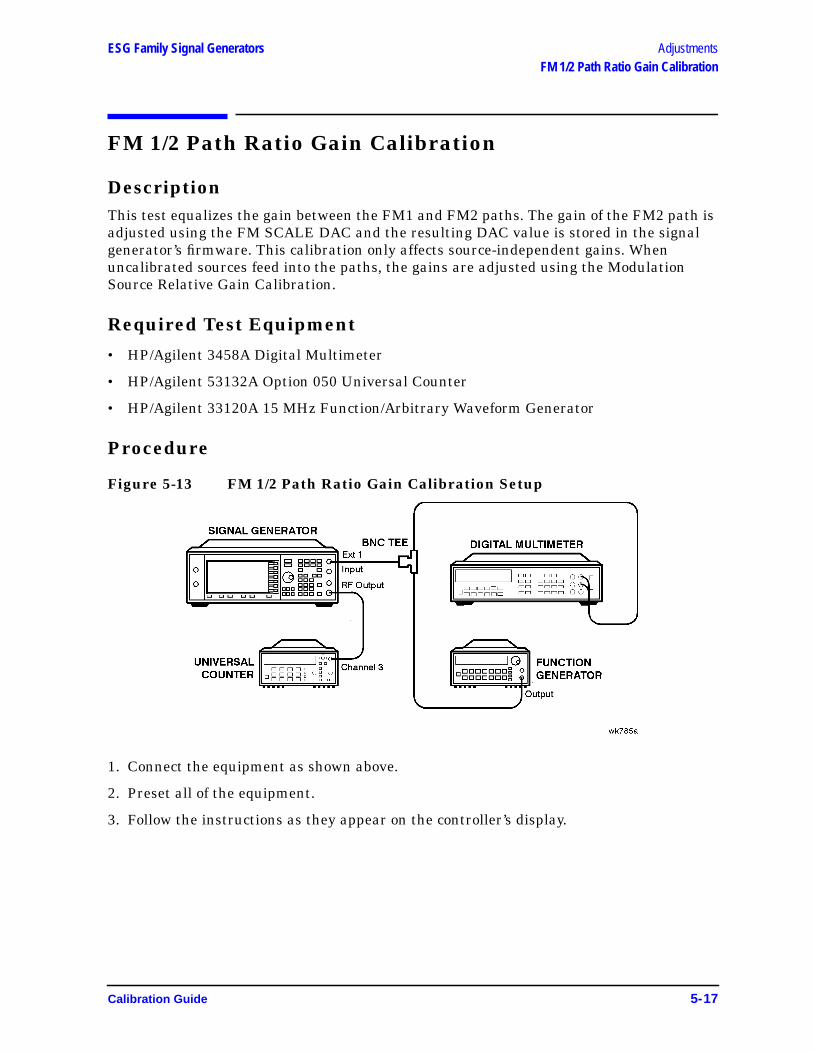
ESG Family Signal Generators AdjustmentsFM 1/2 Path Ratio Gain Calibration
FM 1/2 Path Ratio Gain Calibration
DescriptionThis test equalizes the gain between the FM1 and FM2 paths. The gain of the FM2 path isadjusted using the FM SCALE DAC and the resulting DAC value is stored in the signalgenerator’s firmware. This calibration only affects source-independent gains. Whenuncalibrated sources feed into the paths, the gains are adjusted using the ModulationSource Relative Gain Calibration.
Required Test Equipment
• HP/Agilent 3458A Digital Multimeter
• HP/Agilent 53132A Option 050 Universal Counter
• HP/Agilent 33120A 15 MHz Function/Arbitrary Waveform Generator
Procedure
Figure 5-13 FM 1/2 Path Ratio Gain Calibration Setup
1. Connect the equipment as shown above.
2. Preset all of the equipment.
3. Follow the instructions as they appear on the controller’s display.
Calibration Guide 5-17
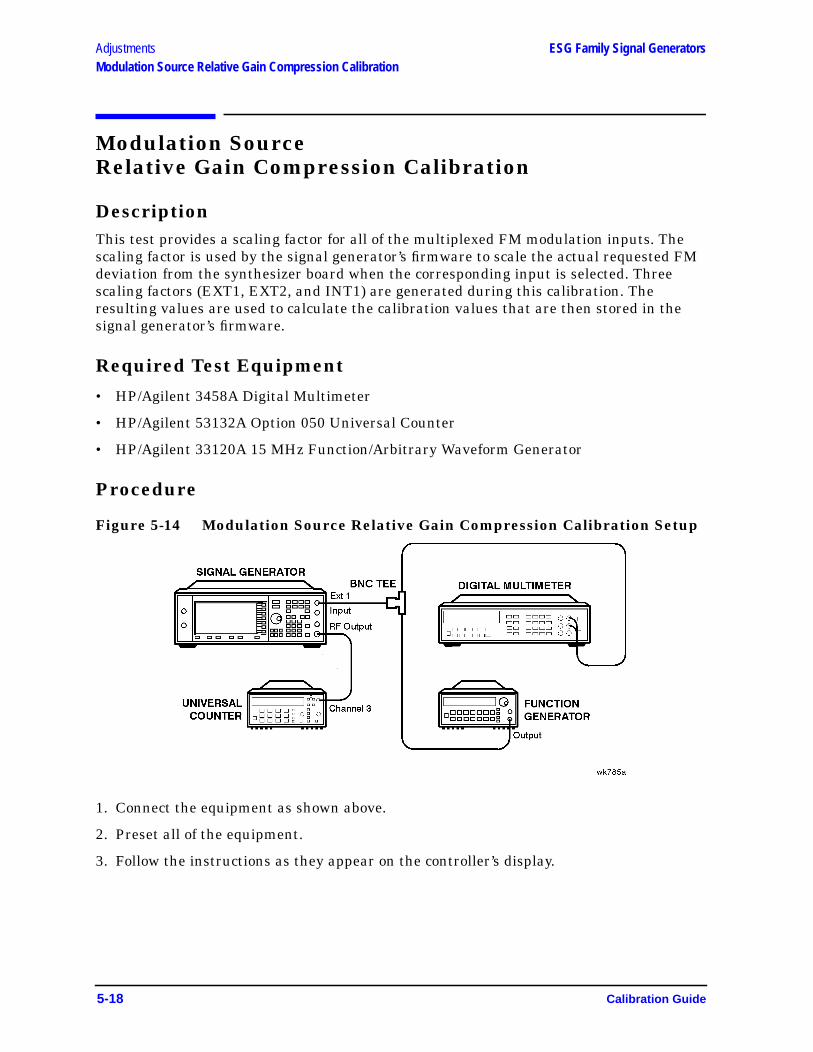
Adjustments ESG Family Signal GeneratorsModulation Source Relative Gain Compression Calibration
Modulation SourceRelative Gain Compression Calibration
DescriptionThis test provides a scaling factor for all of the multiplexed FM modulation inputs. Thescaling factor is used by the signal generator’s firmware to scale the actual requested FMdeviation from the synthesizer board when the corresponding input is selected. Threescaling factors (EXT1, EXT2, and INT1) are generated during this calibration. Theresulting values are used to calculate the calibration values that are then stored in thesignal generator’s firmware.
Required Test Equipment
• HP/Agilent 3458A Digital Multimeter
• HP/Agilent 53132A Option 050 Universal Counter
• HP/Agilent 33120A 15 MHz Function/Arbitrary Waveform Generator
Procedure
Figure 5-14 Modulation Source Relative Gain Compression Calibration Setup
1. Connect the equipment as shown above.
2. Preset all of the equipment.
3. Follow the instructions as they appear on the controller’s display.
5-18 Calibration Guide
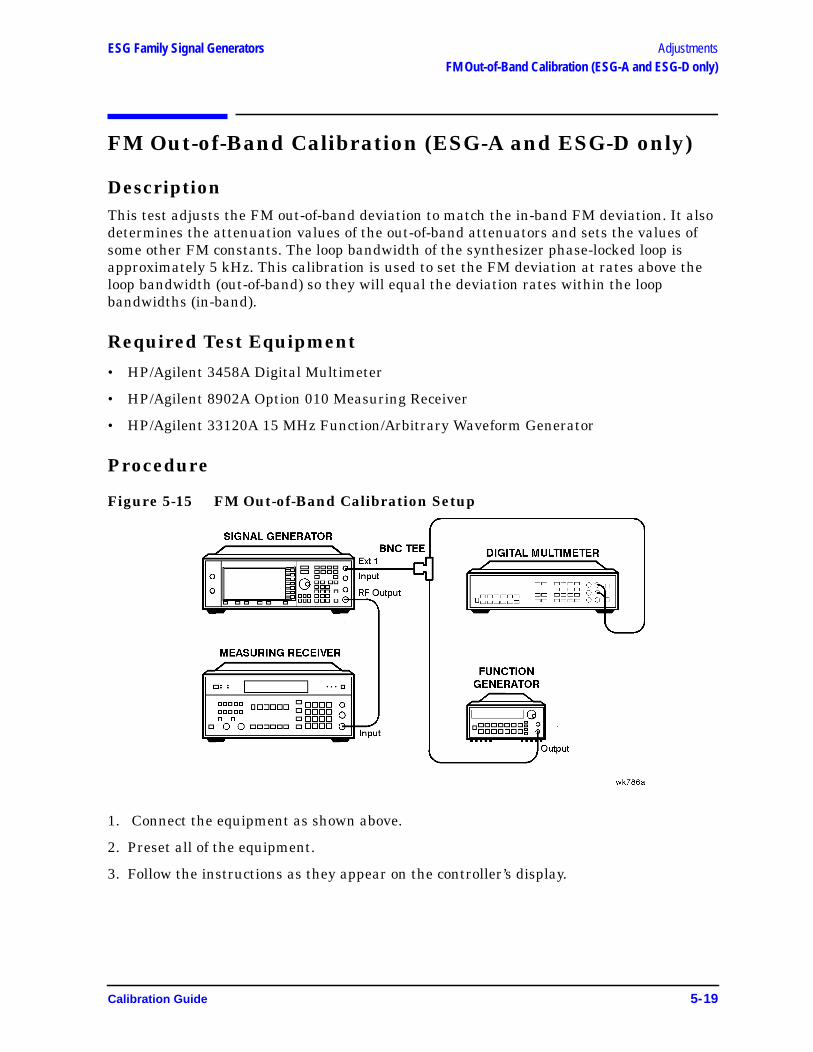
ESG Family Signal Generators AdjustmentsFM Out-of-Band Calibration (ESG-A and ESG-D only)
FM Out-of-Band Calibration (ESG-A and ESG-D only)
DescriptionThis test adjusts the FM out-of-band deviation to match the in-band FM deviation. It alsodetermines the attenuation values of the out-of-band attenuators and sets the values ofsome other FM constants. The loop bandwidth of the synthesizer phase-locked loop isapproximately 5 kHz. This calibration is used to set the FM deviation at rates above theloop bandwidth (out-of-band) so they will equal the deviation rates within the loopbandwidths (in-band).
Required Test Equipment
• HP/Agilent 3458A Digital Multimeter
• HP/Agilent 8902A Option 010 Measuring Receiver
• HP/Agilent 33120A 15 MHz Function/Arbitrary Waveform Generator
Procedure
Figure 5-15 FM Out-of-Band Calibration Setup
1. Connect the equipment as shown above.
2. Preset all of the equipment.
3. Follow the instructions as they appear on the controller’s display.
Calibration Guide 5-19

Adjustments ESG Family Signal GeneratorsFM Delay Potentiometer Adjustment (ESG-A and ESG-D only)
FM Delay Potentiometer Adjustment(ESG-A and ESG-D only)
DescriptionThis test adjusts the match between the delay of the signal passing through the FMin-band path to the delay of the signal passing through the FM out-of-band path. Thiscalibration is the final adjustment required to achieve good FM performance over a widerange of different rates. The FM delay potentiometer forms part of an RC network on theinput of the FM out-of-band circuit. The adjustment is used to flatten the delay of the FMresponse from low rates to high rates. The delay affects the deviation accuracy. Bymonitoring the deviation, the delay can be adjusted.
Required Test Equipment
• HP/Agilent 3458A Digital Multimeter
• HP/Agilent 8902A Option 010 Measuring Receiver
• HP/Agilent 33120A 15 MHz Function/Arbitrary Waveform Generator
Procedure
Figure 5-16 FM Delay Potentiometer Adjustment Setup
1. Connect the equipment as shown above.
2. Preset all of the equipment.
3. Follow the instructions as they appear on the controller’s display.
5-20 Calibration Guide
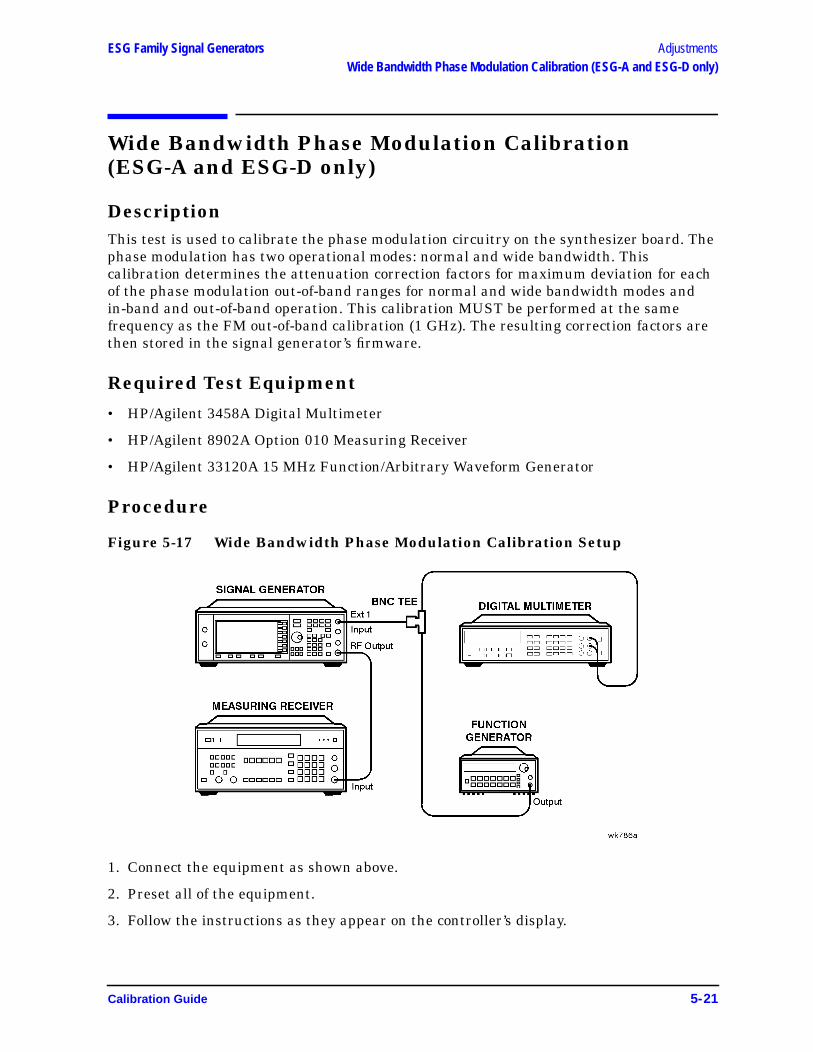
ESG Family Signal Generators AdjustmentsWide Bandwidth Phase Modulation Calibration (ESG-A and ESG-D only)
Wide Bandwidth Phase Modulation Calibration(ESG-A and ESG-D only)
DescriptionThis test is used to calibrate the phase modulation circuitry on the synthesizer board. Thephase modulation has two operational modes: normal and wide bandwidth. Thiscalibration determines the attenuation correction factors for maximum deviation for eachof the phase modulation out-of-band ranges for normal and wide bandwidth modes andin-band and out-of-band operation. This calibration MUST be performed at the samefrequency as the FM out-of-band calibration (1 GHz). The resulting correction factors arethen stored in the signal generator’s firmware.
Required Test Equipment
• HP/Agilent 3458A Digital Multimeter
• HP/Agilent 8902A Option 010 Measuring Receiver
• HP/Agilent 33120A 15 MHz Function/Arbitrary Waveform Generator
Procedure
Figure 5-17 Wide Bandwidth Phase Modulation Calibration Setup
1. Connect the equipment as shown above.
2. Preset all of the equipment.
3. Follow the instructions as they appear on the controller’s display.
Calibration Guide 5-21

Adjustments ESG Family Signal GeneratorsFM/PM Out-of-Band Calibration (ESG-AP and ESG-DP only)
FM/PM Out-of-Band Calibration (ESG-AP and ESG-DPonly)
DescriptionThis adjustment calibrates the FM/PM out-of-band paths on the Fractional-N and YOdriver modules. The internal ABUS is connected to the phase lock loop integrator node oneach board, and the attenuators and DAC are adjusted to minimize the voltage. Thisensures that the in-band and out-of-band paths are matched. The “FM In-Band DACOffset Calibration” on page 5-15 must be performed prior to this adjustment.
Required Test Equipment
• HP/Agilent 3458A Digital Multimeter
• HP/Agilent 33120A 15 MHz Function/Arbitrary Waveform Generator
Procedure
Figure 5-18 FM/PM Out-of-Band Calibration Setup
1. Connect the equipment as shown above.
2. Preset all of the equipment.
3. Follow the instructions as they appear on the controller’s display.
5-22 Calibration Guide
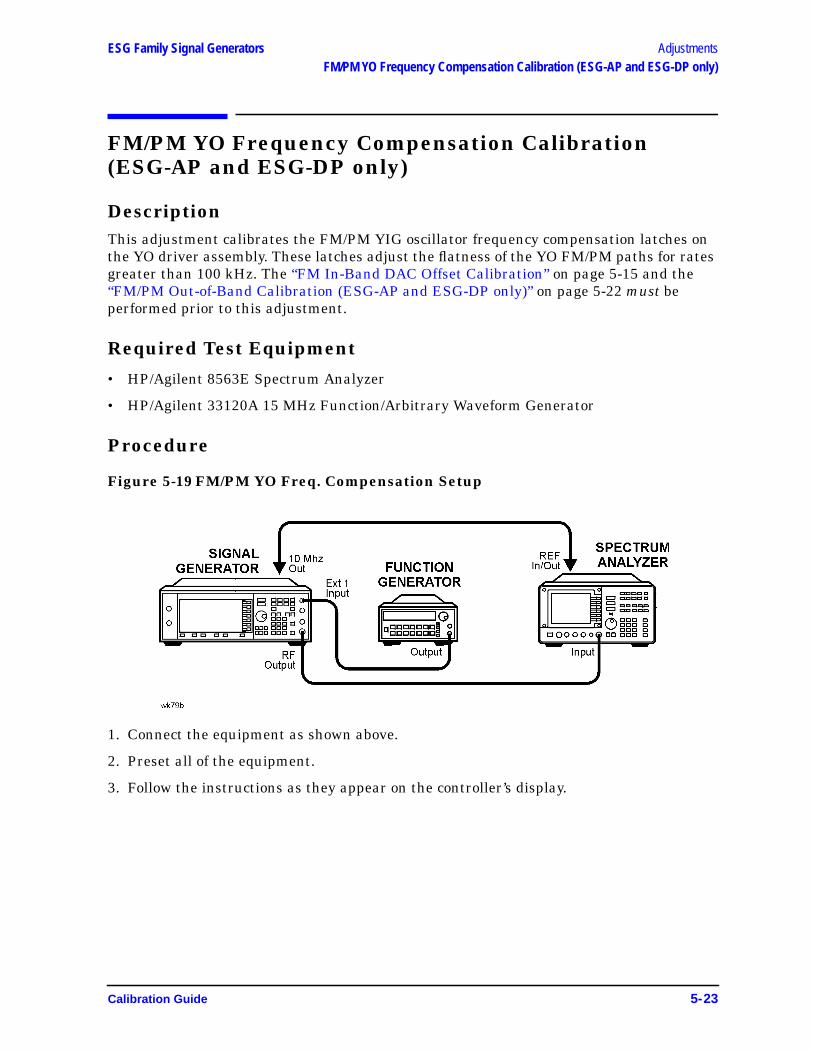
ESG Family Signal Generators AdjustmentsFM/PM YO Frequency Compensation Calibration (ESG-AP and ESG-DP only)
FM/PM YO Frequency Compensation Calibration(ESG-AP and ESG-DP only)
DescriptionThis adjustment calibrates the FM/PM YIG oscillator frequency compensation latches onthe YO driver assembly. These latches adjust the flatness of the YO FM/PM paths for ratesgreater than 100 kHz. The “FM In-Band DAC Offset Calibration” on page 5-15 and the“FM/PM Out-of-Band Calibration (ESG-AP and ESG-DP only)” on page 5-22 must beperformed prior to this adjustment.
Required Test Equipment
• HP/Agilent 8563E Spectrum Analyzer
• HP/Agilent 33120A 15 MHz Function/Arbitrary Waveform Generator
Procedure
Figure 5-19 FM/PM YO Freq. Compensation Setup
1. Connect the equipment as shown above.
2. Preset all of the equipment.
3. Follow the instructions as they appear on the controller’s display.
Calibration Guide 5-23
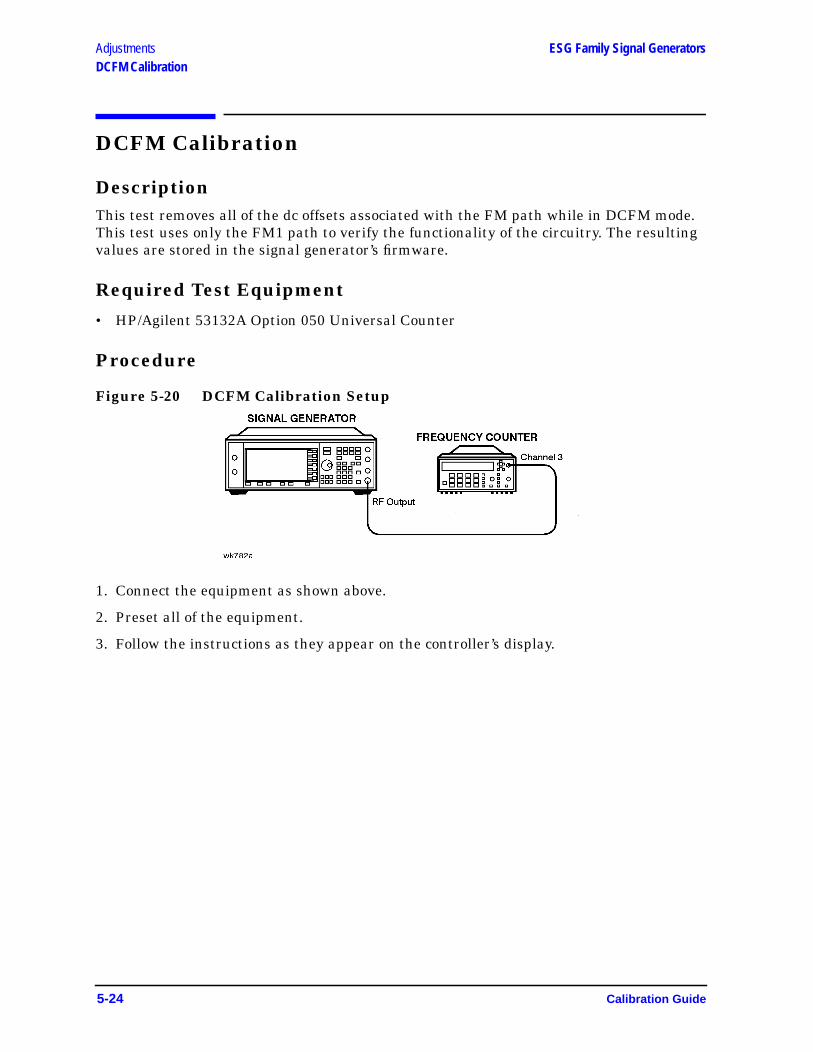
Adjustments ESG Family Signal GeneratorsDCFM Calibration
DCFM Calibration
DescriptionThis test removes all of the dc offsets associated with the FM path while in DCFM mode.This test uses only the FM1 path to verify the functionality of the circuitry. The resultingvalues are stored in the signal generator’s firmware.
Required Test Equipment
• HP/Agilent 53132A Option 050 Universal Counter
Procedure
Figure 5-20 DCFM Calibration Setup
1. Connect the equipment as shown above.
2. Preset all of the equipment.
3. Follow the instructions as they appear on the controller’s display.
5-24 Calibration Guide
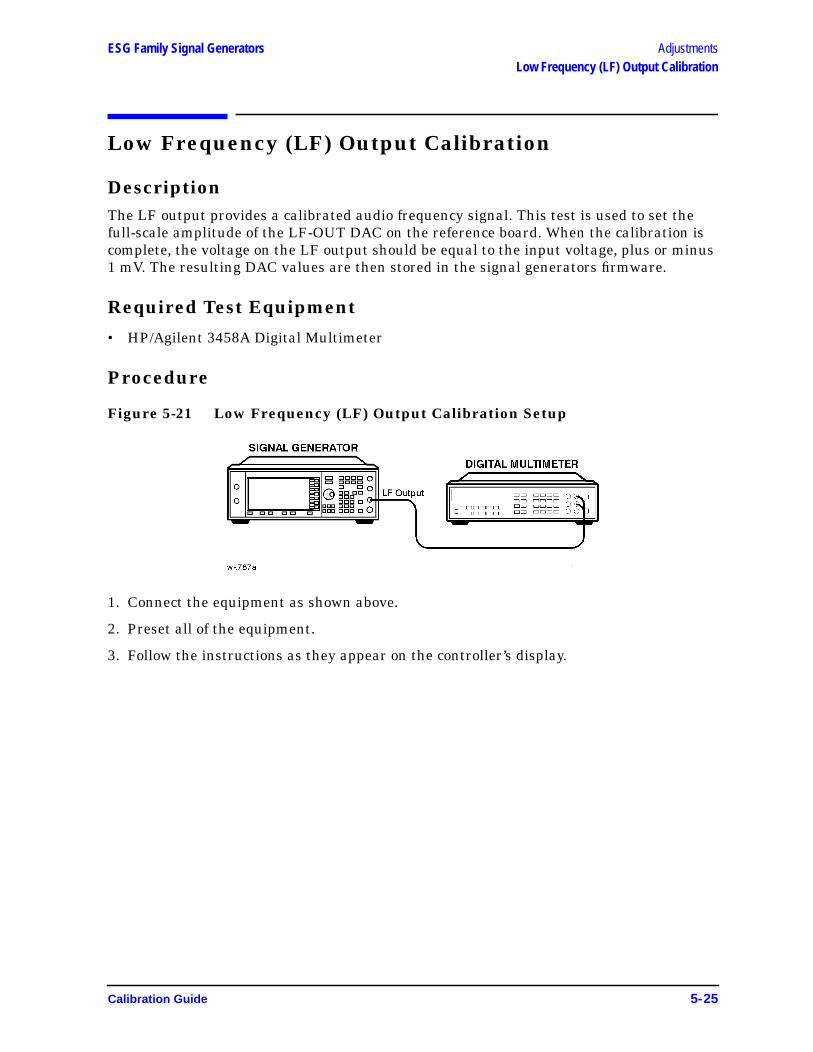
ESG Family Signal Generators AdjustmentsLow Frequency (LF) Output Calibration
Low Frequency (LF) Output Calibration
DescriptionThe LF output provides a calibrated audio frequency signal. This test is used to set thefull-scale amplitude of the LF-OUT DAC on the reference board. When the calibration iscomplete, the voltage on the LF output should be equal to the input voltage, plus or minus1 mV. The resulting DAC values are then stored in the signal generators firmware.
Required Test Equipment
• HP/Agilent 3458A Digital Multimeter
Procedure
Figure 5-21 Low Frequency (LF) Output Calibration Setup
1. Connect the equipment as shown above.
2. Preset all of the equipment.
3. Follow the instructions as they appear on the controller’s display.
Calibration Guide 5-25
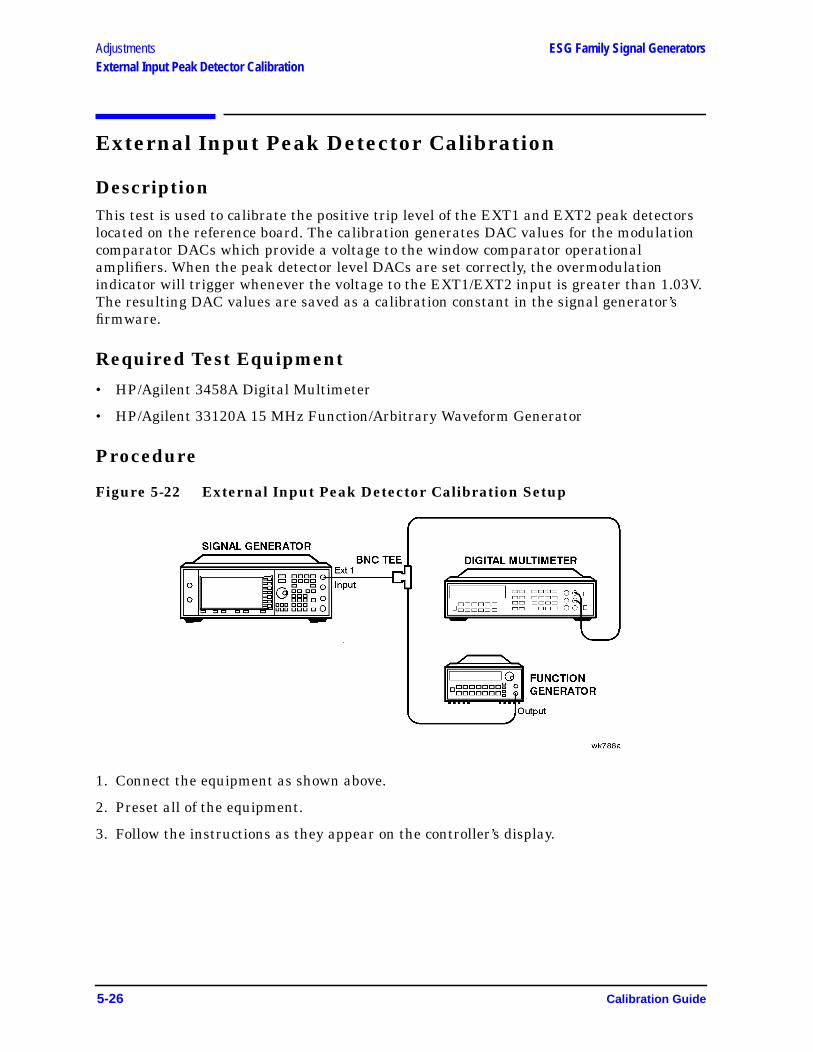
Adjustments ESG Family Signal GeneratorsExternal Input Peak Detector Calibration
External Input Peak Detector Calibration
DescriptionThis test is used to calibrate the positive trip level of the EXT1 and EXT2 peak detectorslocated on the reference board. The calibration generates DAC values for the modulationcomparator DACs which provide a voltage to the window comparator operationalamplifiers. When the peak detector level DACs are set correctly, the overmodulationindicator will trigger whenever the voltage to the EXT1/EXT2 input is greater than 1.03V.The resulting DAC values are saved as a calibration constant in the signal generator’sfirmware.
Required Test Equipment
• HP/Agilent 3458A Digital Multimeter
• HP/Agilent 33120A 15 MHz Function/Arbitrary Waveform Generator
Procedure
Figure 5-22 External Input Peak Detector Calibration Setup
1. Connect the equipment as shown above.
2. Preset all of the equipment.
3. Follow the instructions as they appear on the controller’s display.
5-26 Calibration Guide
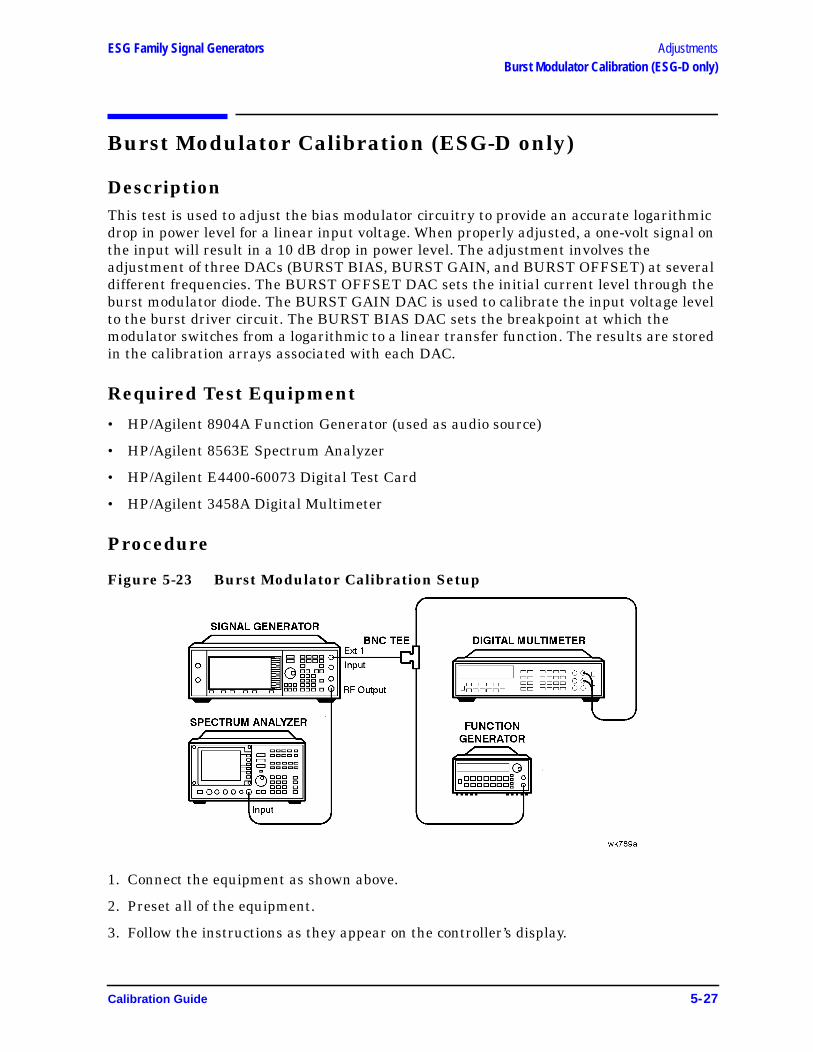
ESG Family Signal Generators AdjustmentsBurst Modulator Calibration (ESG-D only)
Burst Modulator Calibration (ESG-D only)
DescriptionThis test is used to adjust the bias modulator circuitry to provide an accurate logarithmicdrop in power level for a linear input voltage. When properly adjusted, a one-volt signal onthe input will result in a 10 dB drop in power level. The adjustment involves theadjustment of three DACs (BURST BIAS, BURST GAIN, and BURST OFFSET) at severaldifferent frequencies. The BURST OFFSET DAC sets the initial current level through theburst modulator diode. The BURST GAIN DAC is used to calibrate the input voltage levelto the burst driver circuit. The BURST BIAS DAC sets the breakpoint at which themodulator switches from a logarithmic to a linear transfer function. The results are storedin the calibration arrays associated with each DAC.
Required Test Equipment
• HP/Agilent 8904A Function Generator (used as audio source)
• HP/Agilent 8563E Spectrum Analyzer
• HP/Agilent E4400-60073 Digital Test Card
• HP/Agilent 3458A Digital Multimeter
Procedure
Figure 5-23 Burst Modulator Calibration Setup
1. Connect the equipment as shown above.
2. Preset all of the equipment.
3. Follow the instructions as they appear on the controller’s display.
Calibration Guide 5-27
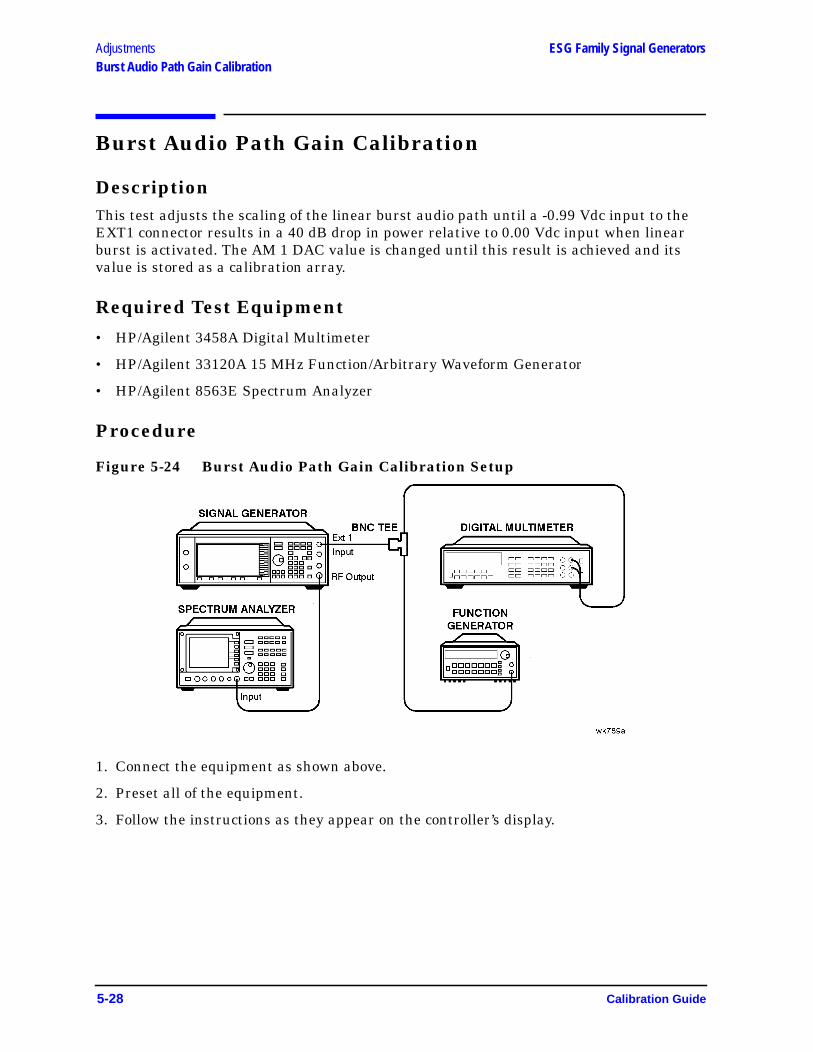
Adjustments ESG Family Signal GeneratorsBurst Audio Path Gain Calibration
Burst Audio Path Gain Calibration
DescriptionThis test adjusts the scaling of the linear burst audio path until a -0.99 Vdc input to theEXT1 connector results in a 40 dB drop in power relative to 0.00 Vdc input when linearburst is activated. The AM 1 DAC value is changed until this result is achieved and itsvalue is stored as a calibration array.
Required Test Equipment
• HP/Agilent 3458A Digital Multimeter
• HP/Agilent 33120A 15 MHz Function/Arbitrary Waveform Generator
• HP/Agilent 8563E Spectrum Analyzer
Procedure
Figure 5-24 Burst Audio Path Gain Calibration Setup
1. Connect the equipment as shown above.
2. Preset all of the equipment.
3. Follow the instructions as they appear on the controller’s display.
5-28 Calibration Guide
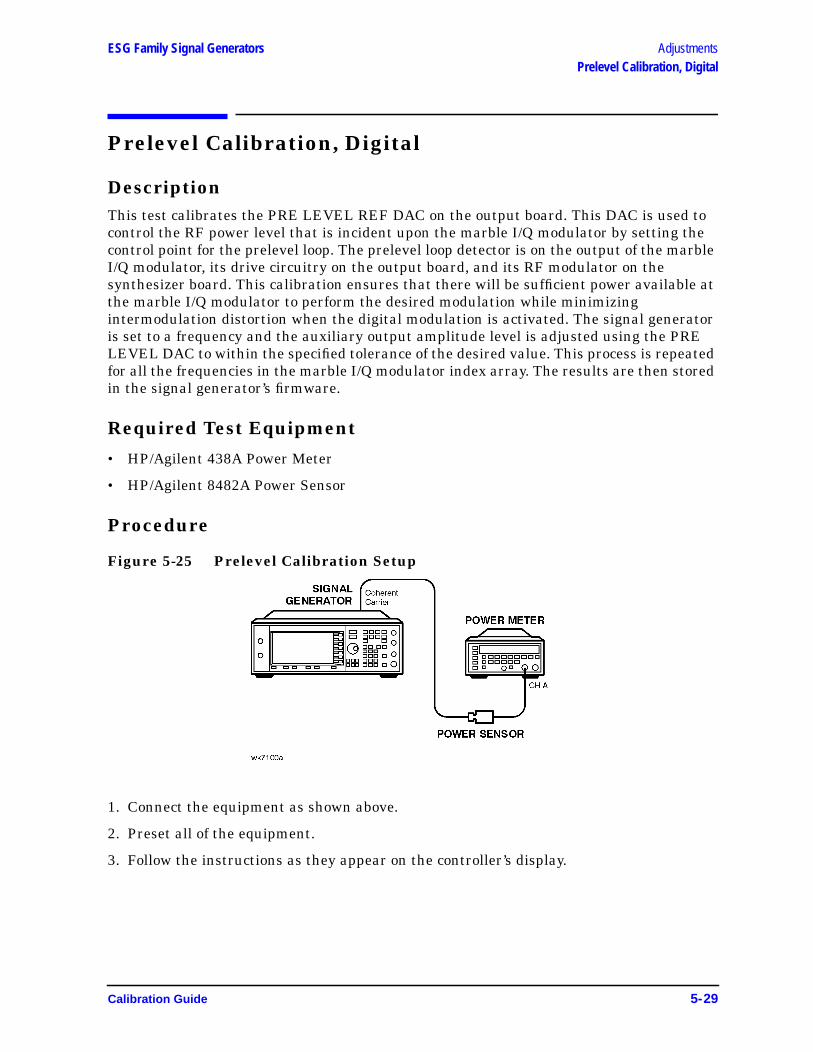
ESG Family Signal Generators AdjustmentsPrelevel Calibration, Digital
Prelevel Calibration, Digital
DescriptionThis test calibrates the PRE LEVEL REF DAC on the output board. This DAC is used tocontrol the RF power level that is incident upon the marble I/Q modulator by setting thecontrol point for the prelevel loop. The prelevel loop detector is on the output of the marbleI/Q modulator, its drive circuitry on the output board, and its RF modulator on thesynthesizer board. This calibration ensures that there will be sufficient power available atthe marble I/Q modulator to perform the desired modulation while minimizingintermodulation distortion when the digital modulation is activated. The signal generatoris set to a frequency and the auxiliary output amplitude level is adjusted using the PRELEVEL DAC to within the specified tolerance of the desired value. This process is repeatedfor all the frequencies in the marble I/Q modulator index array. The results are then storedin the signal generator’s firmware.
Required Test Equipment
• HP/Agilent 438A Power Meter
• HP/Agilent 8482A Power Sensor
Procedure
Figure 5-25 Prelevel Calibration Setup
1. Connect the equipment as shown above.
2. Preset all of the equipment.
3. Follow the instructions as they appear on the controller’s display.
Calibration Guide 5-29
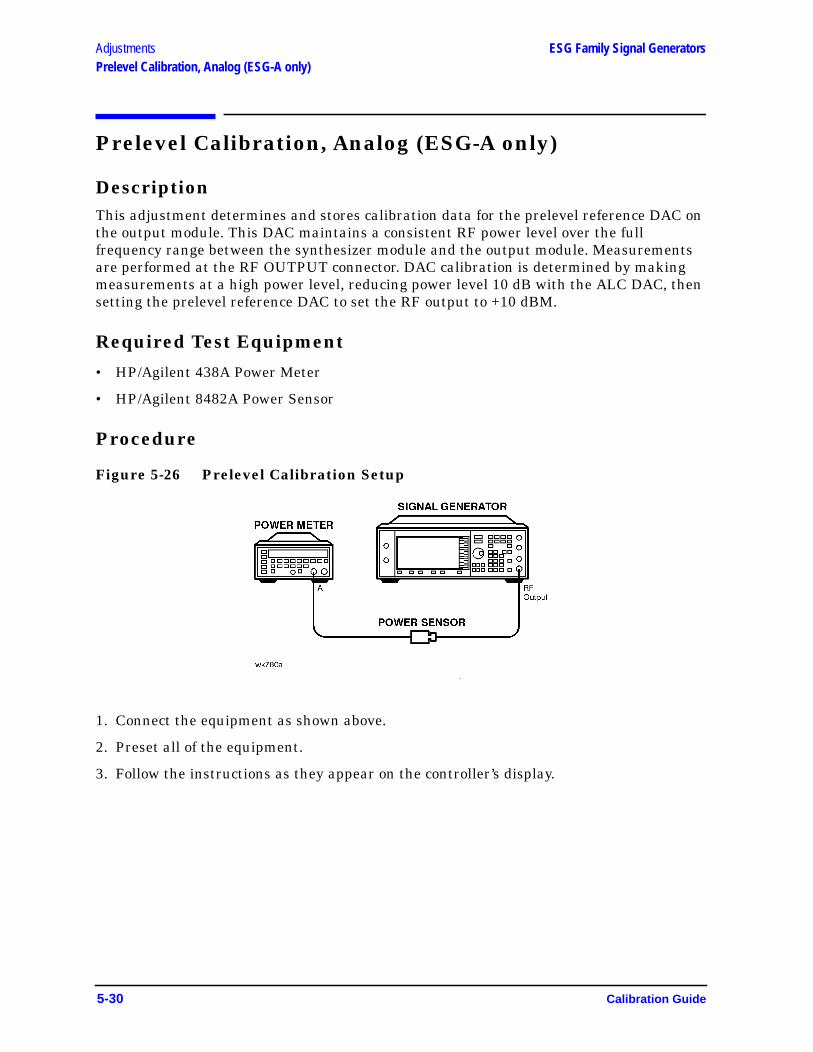
Adjustments ESG Family Signal GeneratorsPrelevel Calibration, Analog (ESG-A only)
Prelevel Calibration, Analog (ESG-A only)
DescriptionThis adjustment determines and stores calibration data for the prelevel reference DAC onthe output module. This DAC maintains a consistent RF power level over the fullfrequency range between the synthesizer module and the output module. Measurementsare performed at the RF OUTPUT connector. DAC calibration is determined by makingmeasurements at a high power level, reducing power level 10 dB with the ALC DAC, thensetting the prelevel reference DAC to set the RF output to +10 dBM.
Required Test Equipment
• HP/Agilent 438A Power Meter
• HP/Agilent 8482A Power Sensor
Procedure
Figure 5-26 Prelevel Calibration Setup
1. Connect the equipment as shown above.
2. Preset all of the equipment.
3. Follow the instructions as they appear on the controller’s display.
5-30 Calibration Guide
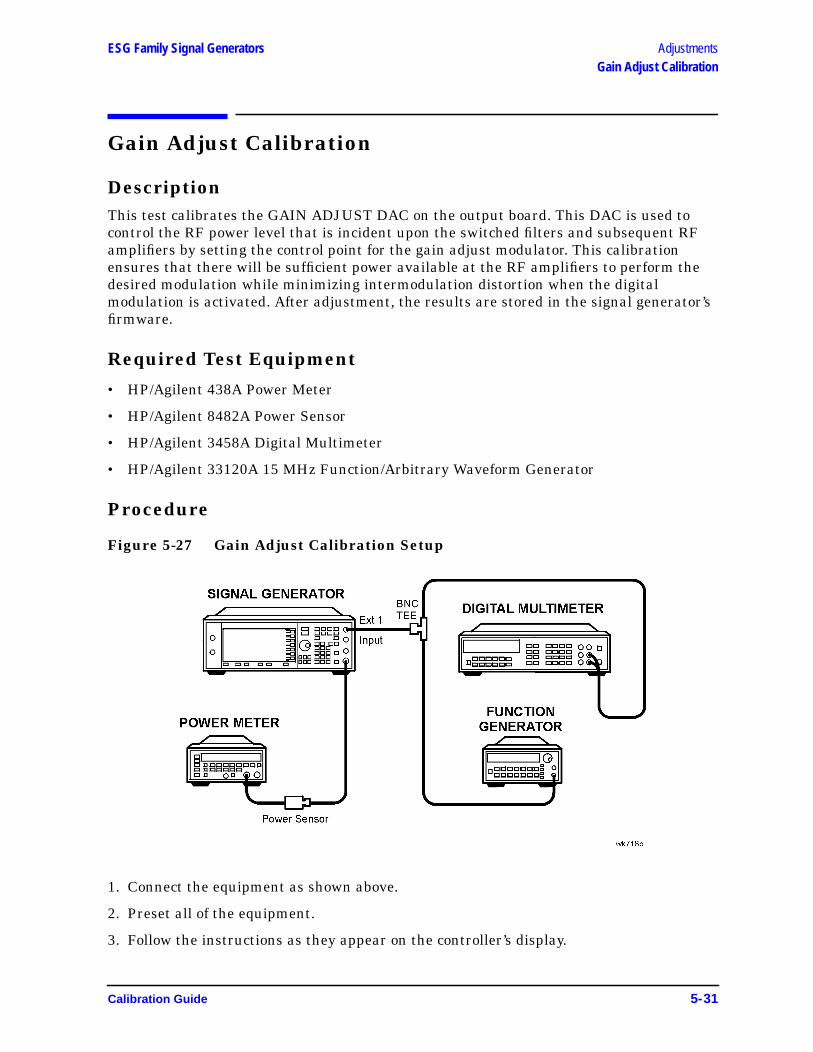
ESG Family Signal Generators AdjustmentsGain Adjust Calibration
Gain Adjust Calibration
DescriptionThis test calibrates the GAIN ADJUST DAC on the output board. This DAC is used tocontrol the RF power level that is incident upon the switched filters and subsequent RFamplifiers by setting the control point for the gain adjust modulator. This calibrationensures that there will be sufficient power available at the RF amplifiers to perform thedesired modulation while minimizing intermodulation distortion when the digitalmodulation is activated. After adjustment, the results are stored in the signal generator’sfirmware.
Required Test Equipment
• HP/Agilent 438A Power Meter
• HP/Agilent 8482A Power Sensor
• HP/Agilent 3458A Digital Multimeter
• HP/Agilent 33120A 15 MHz Function/Arbitrary Waveform Generator
Procedure
Figure 5-27 Gain Adjust Calibration Setup
1. Connect the equipment as shown above.
2. Preset all of the equipment.
3. Follow the instructions as they appear on the controller’s display.
Calibration Guide 5-31

Adjustments ESG Family Signal GeneratorsLow Noise Floor Gain Adjust (ESG-AP and ESG-DP only)
Low Noise Floor Gain Adjust(ESG-AP and ESG-DP only)
DescriptionThis adjustment calibrates the gain adjust DAC on the output module for low noise floor(LNF) mode. The instrument is set up with attenuation applied by way of the burstmodulator. This ensures that the RF chain is not in compression. The gain adjust DAC isthen set for a specific RF output power, as measured with a power meter.
Required Test Equipment
• HP/Agilent 438A Power Meter
• HP/Agilent 8482A Power Sensor
Procedure
Figure 5-28 LNF Gain Adjust Setup
1. Connect the equipment as shown above.
2. Preset all of the equipment.
3. Follow the instructions as they appear on the controller’s display.
5-32 Calibration Guide
ESG Family Signal Generators AdjustmentsALC Modulation Driver Bias Calibration
ALC Modulation Driver Bias Calibration
DescriptionThis test adjusts the ALC MOD DRV BIAS DAC on the output board. This DAC is used tocontrol the bias current to the ALC modulator driver. It is primarily used to accommodateunmatched VBE values in the drives, but has a strong influence on modulator gain. Thistest adjusts the DAC until the ALC modulator gain is balanced around its nominal designcenter. The results are stored as a calibration array in the signal generator’s firmware.
Required Test Equipment
• None
Procedure
1. Preset the signal generator.
2. Follow the instructions as they appear on the controller’s display.
Calibration Guide 5-33

Adjustments ESG Family Signal GeneratorsVBLO Mixer Bias Calibration
VBLO Mixer Bias Calibration
DescriptionThis test calibrates the VBLO MIXER BIAS DAC on the output board. This DAC is used tocontrol the bias voltage to the internal marble mixers. This DAC is primarily used toadjust the mixer bias for optimum I/Q modulation linearity, but it has a secondaryinfluence on mixer gain. This calibration ensures that there will be sufficient poweravailable through the marble mixers to perform the desired modulation while minimizingintermodulation distortion when the digital modulation is activated. After adjustment, theresults are stored in the signal generator’s firmware.
Required Test Equipment
• None
Procedure
1. Preset the signal generator.
2. Follow the instructions as they appear on the controller’s display.
5-34 Calibration Guide
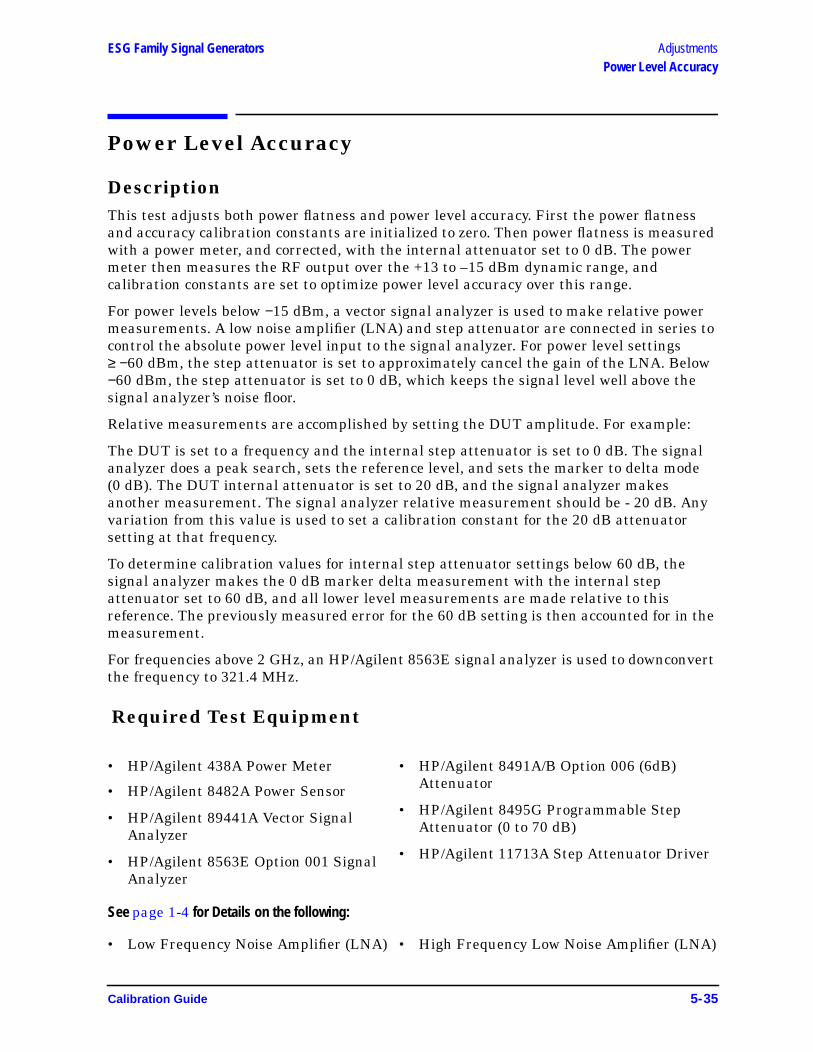
ESG Family Signal Generators AdjustmentsPower Level Accuracy
Power Level Accuracy
DescriptionThis test adjusts both power flatness and power level accuracy. First the power flatnessand accuracy calibration constants are initialized to zero. Then power flatness is measuredwith a power meter, and corrected, with the internal attenuator set to 0 dB. The powermeter then measures the RF output over the +13 to –15 dBm dynamic range, andcalibration constants are set to optimize power level accuracy over this range.
For power levels below −15 dBm, a vector signal analyzer is used to make relative powermeasurements. A low noise amplifier (LNA) and step attenuator are connected in series tocontrol the absolute power level input to the signal analyzer. For power level settings≥ −60 dBm, the step attenuator is set to approximately cancel the gain of the LNA. Below−60 dBm, the step attenuator is set to 0 dB, which keeps the signal level well above thesignal analyzer’s noise floor.
Relative measurements are accomplished by setting the DUT amplitude. For example:
The DUT is set to a frequency and the internal step attenuator is set to 0 dB. The signalanalyzer does a peak search, sets the reference level, and sets the marker to delta mode(0 dB). The DUT internal attenuator is set to 20 dB, and the signal analyzer makesanother measurement. The signal analyzer relative measurement should be - 20 dB. Anyvariation from this value is used to set a calibration constant for the 20 dB attenuatorsetting at that frequency.
To determine calibration values for internal step attenuator settings below 60 dB, thesignal analyzer makes the 0 dB marker delta measurement with the internal stepattenuator set to 60 dB, and all lower level measurements are made relative to thisreference. The previously measured error for the 60 dB setting is then accounted for in themeasurement.
For frequencies above 2 GHz, an HP/Agilent 8563E signal analyzer is used to downconvertthe frequency to 321.4 MHz.
Required Test Equipment
See page 1-4 for Details on the following:
• HP/Agilent 438A Power Meter
• HP/Agilent 8482A Power Sensor
• HP/Agilent 89441A Vector SignalAnalyzer
• HP/Agilent 8563E Option 001 SignalAnalyzer
• HP/Agilent 8491A/B Option 006 (6dB)Attenuator
• HP/Agilent 8495G Programmable StepAttenuator (0 to 70 dB)
• HP/Agilent 11713A Step Attenuator Driver
• Low Frequency Noise Amplifier (LNA) • High Frequency Low Noise Amplifier (LNA)
Calibration Guide 5-35
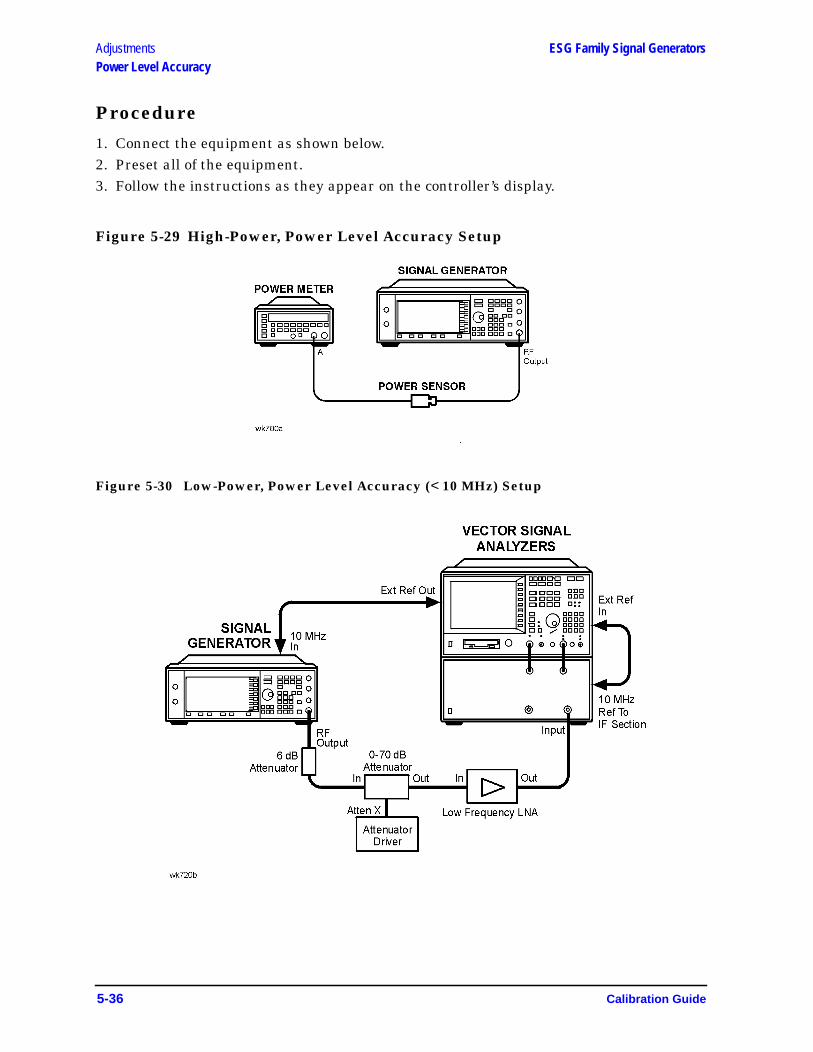
Adjustments ESG Family Signal GeneratorsPower Level Accuracy
Procedure
1. Connect the equipment as shown below.2. Preset all of the equipment.3. Follow the instructions as they appear on the controller’s display.
Figure 5-29 High-Power, Power Level Accuracy Setup
Figure 5-30 Low-Power, Power Level Accuracy (< 10 MHz) Setup
5-36 Calibration Guide
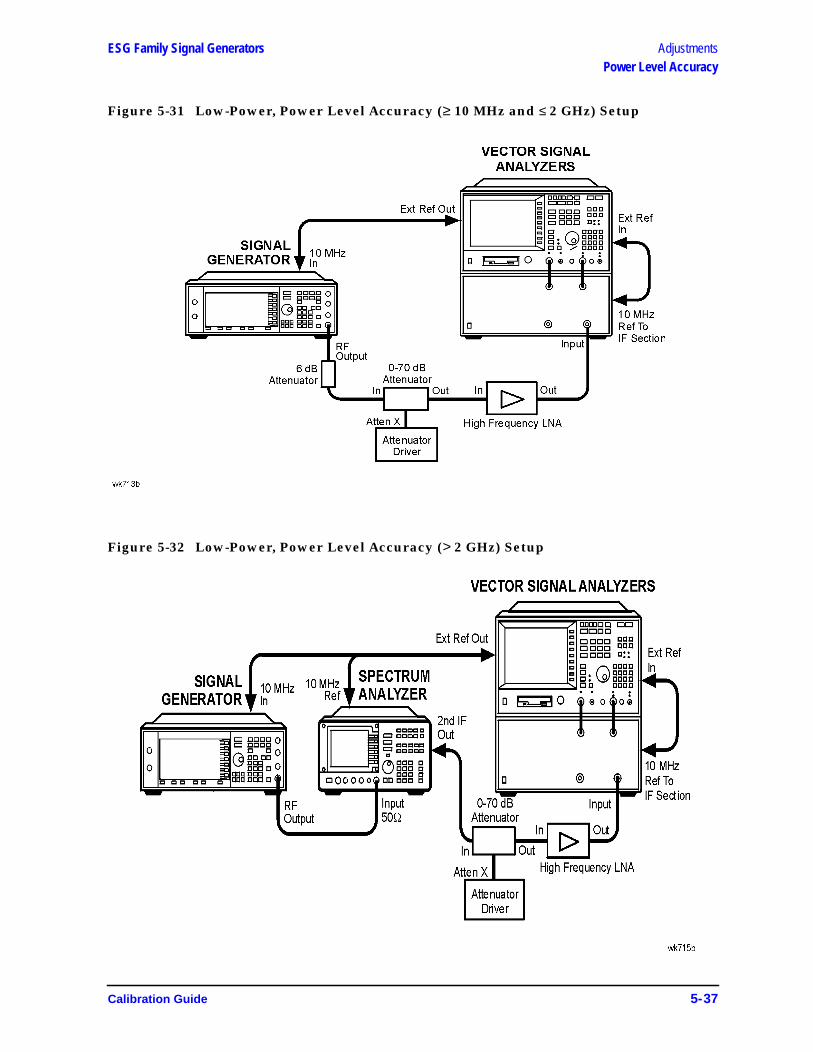
ESG Family Signal Generators AdjustmentsPower Level Accuracy
Figure 5-31 Low-Power, Power Level Accuracy (≥ 10 MHz and ≤ 2 GHz) Setup
Figure 5-32 Low-Power, Power Level Accuracy (> 2 GHz) Setup
Calibration Guide 5-37
Adjustments ESG Family Signal GeneratorsLevel Meter Calibration
Level Meter Calibration
DescriptionThis test determines the level meter gain and offset calibration constants on the outputboard. The level meter function is used when the ALC loop is open. It allows the outputpower of the signal generator to be monitored and controlled without using the ALC loop.After the level meter gain and offsets are measured, a calibration constant is calculatedand stored in the appropriate calibration array.
Required Test Equipment
• None
Procedure
1. Preset the signal generator.
2. Follow the instructions as they appear on the controller’s display.
5-38 Calibration Guide
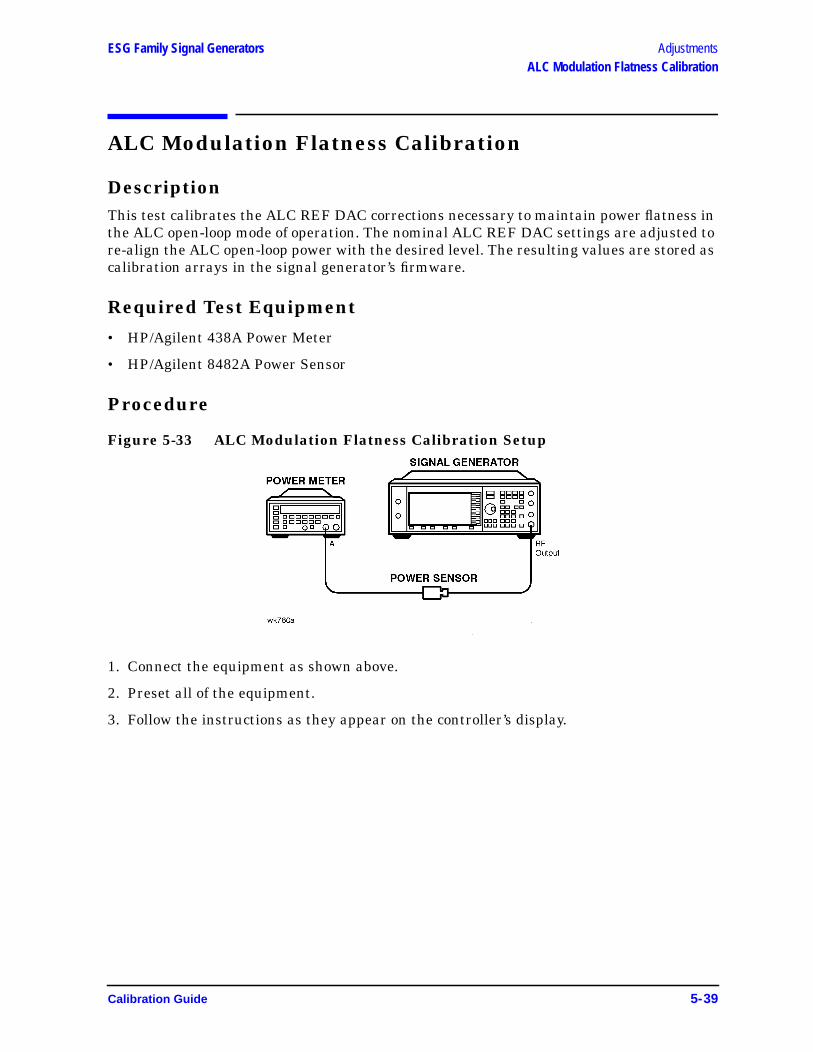
ESG Family Signal Generators AdjustmentsALC Modulation Flatness Calibration
ALC Modulation Flatness Calibration
DescriptionThis test calibrates the ALC REF DAC corrections necessary to maintain power flatness inthe ALC open-loop mode of operation. The nominal ALC REF DAC settings are adjusted tore-align the ALC open-loop power with the desired level. The resulting values are stored ascalibration arrays in the signal generator’s firmware.
Required Test Equipment
• HP/Agilent 438A Power Meter
• HP/Agilent 8482A Power Sensor
Procedure
Figure 5-33 ALC Modulation Flatness Calibration Setup
1. Connect the equipment as shown above.
2. Preset all of the equipment.
3. Follow the instructions as they appear on the controller’s display.
Calibration Guide 5-39
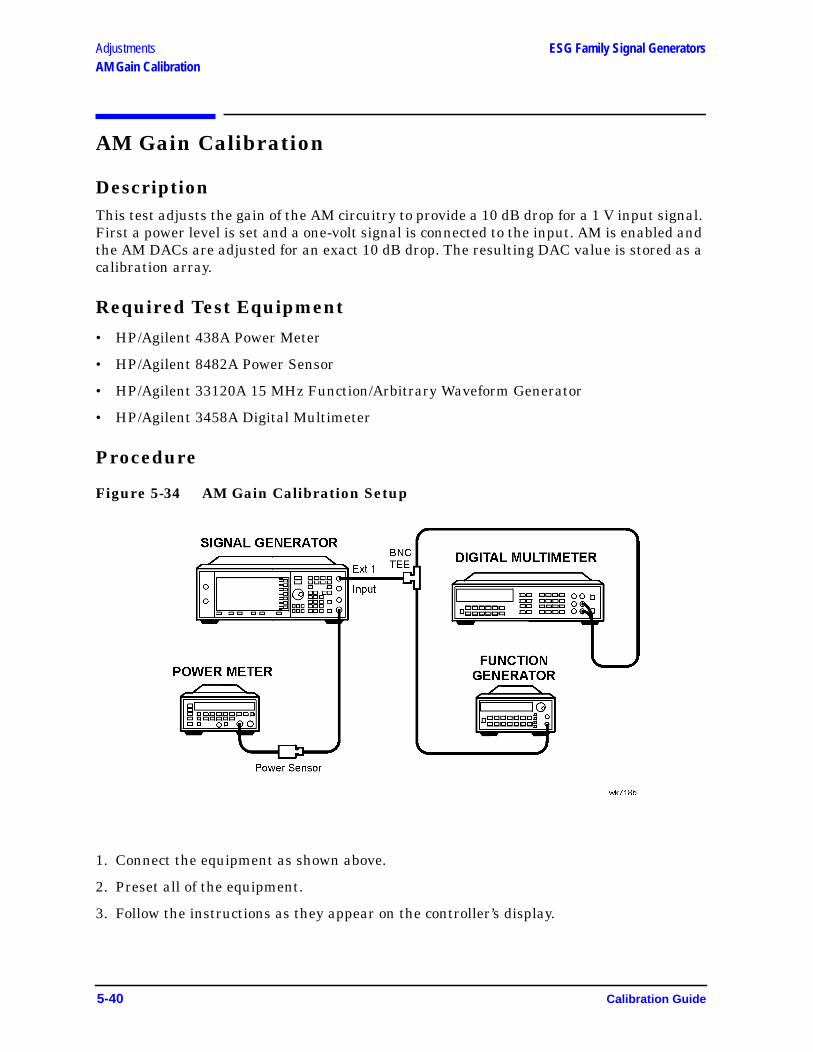
Adjustments ESG Family Signal GeneratorsAM Gain Calibration
AM Gain Calibration
DescriptionThis test adjusts the gain of the AM circuitry to provide a 10 dB drop for a 1 V input signal.First a power level is set and a one-volt signal is connected to the input. AM is enabled andthe AM DACs are adjusted for an exact 10 dB drop. The resulting DAC value is stored as acalibration array.
Required Test Equipment
• HP/Agilent 438A Power Meter
• HP/Agilent 8482A Power Sensor
• HP/Agilent 33120A 15 MHz Function/Arbitrary Waveform Generator
• HP/Agilent 3458A Digital Multimeter
Procedure
Figure 5-34 AM Gain Calibration Setup
1. Connect the equipment as shown above.
2. Preset all of the equipment.
3. Follow the instructions as they appear on the controller’s display.
5-40 Calibration Guide
ESG Family Signal Generators AdjustmentsI/Q Gain/Offset/Quadrature Calibration (ESG-D only)
I/Q Gain/Offset/Quadrature Calibration (ESG-D only)
DescriptionThis test determines the required I/Q gain, offset, and quadrature calibrationconstants/arrays that will minimize the I/Q modulation imperfections on the output board.Several calibration constants are determined and then the I/Q gain, offset, and quadratureDACs are adjusted over frequency to minimize the static vector modulation errors. Theresults are stored in the signal generator as calibration arrays.
Required Test Equipment
• None
Procedure
1. Preset the signal generator.
2. Follow the instructions as they appear on the controller’s display.
Calibration Guide 5-41
Adjustments ESG Family Signal GeneratorsI/Q Impairment Adjustment (ESG-D only)
I/Q Impairment Adjustment (ESG-D only)
DescriptionThis adjustment sets internal calibration array values to minimize errors in the I/Qadjustments (I/Q gain, I offset, Q offset, and quadrature skew) in the I/Q menu.
NOTE This adjustment assumes the I/Q Gain/Offset/Quadrature calibration hasalready been performed.
Required Test Equipment
• None
Procedure
1. Preset the signal generator.
2. Follow the instructions as they appear on the controller’s display.
5-42 Calibration Guide
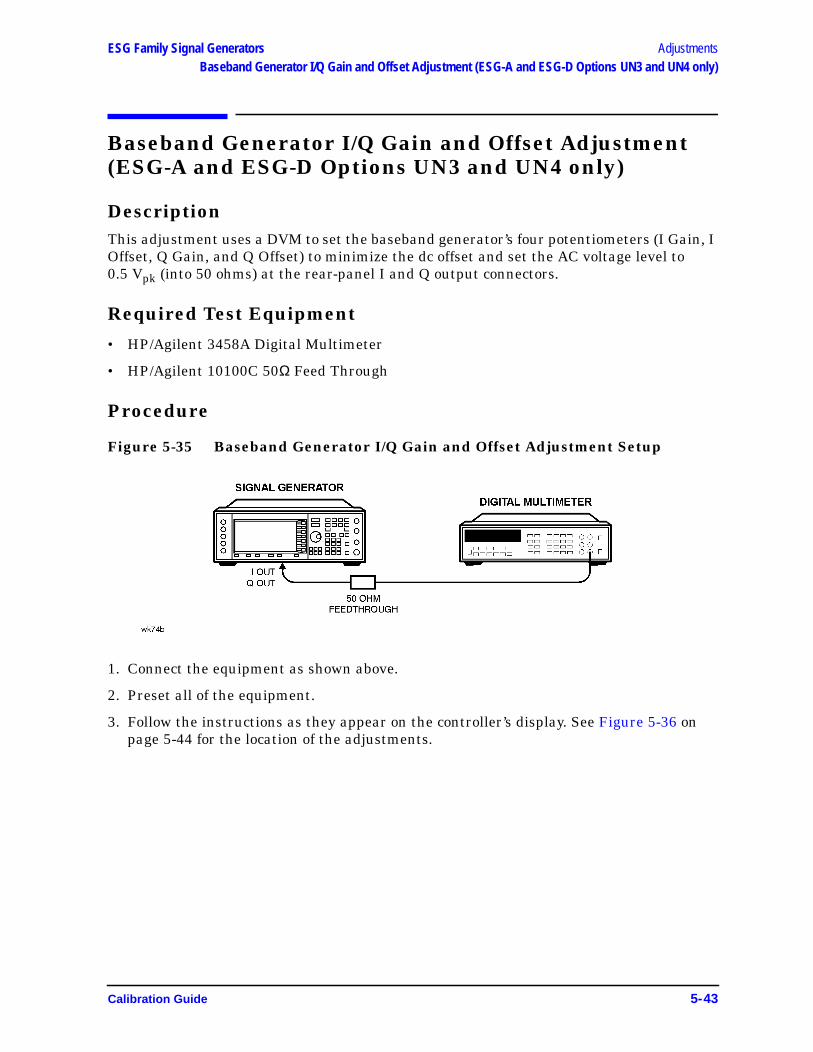
ESG Family Signal Generators AdjustmentsBaseband Generator I/Q Gain and Offset Adjustment (ESG-A and ESG-D Options UN3 and UN4 only)
Baseband Generator I/Q Gain and Offset Adjustment(ESG-A and ESG-D Options UN3 and UN4 only)
DescriptionThis adjustment uses a DVM to set the baseband generator’s four potentiometers (I Gain, IOffset, Q Gain, and Q Offset) to minimize the dc offset and set the AC voltage level to0.5 Vpk (into 50 ohms) at the rear-panel I and Q output connectors.
Required Test Equipment
• HP/Agilent 3458A Digital Multimeter
• HP/Agilent 10100C 50Ω Feed Through
Procedure
Figure 5-35 Baseband Generator I/Q Gain and Offset Adjustment Setup
1. Connect the equipment as shown above.
2. Preset all of the equipment.
3. Follow the instructions as they appear on the controller’s display. See Figure 5-36 onpage 5-44 for the location of the adjustments.
Calibration Guide 5-43
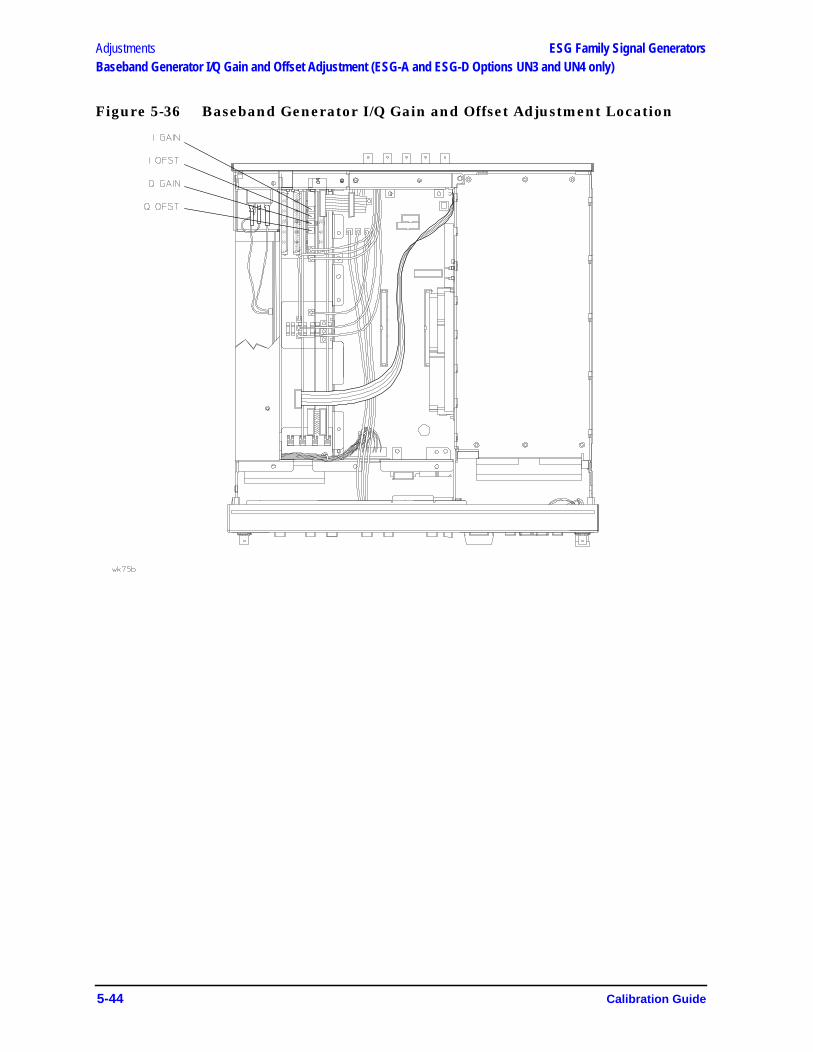
Adjustments ESG Family Signal GeneratorsBaseband Generator I/Q Gain and Offset Adjustment (ESG-A and ESG-D Options UN3 and UN4 only)
Figure 5-36 Baseband Generator I/Q Gain and Offset Adjustment Location
5-44 Calibration Guide
ESG Family Signal Generators
6 Maintenance and Service
This chapter contains preventive maintenance procedures, and it explains how to return asignal generator to Agilent Technologies for service.
Calibration Guide 6-1
Maintenance and Service ESG Family Signal GeneratorsPreventive Maintenance Procedures
Preventive Maintenance ProceduresThe ESG Family Signal Generators require no regular maintenance. This section containscleaning procedures for the signal generator.
Cleaning the CabinetUse a damp cloth to clean the exterior of the instrument. Do not use any cleaning products.
WARNING To prevent electrical shock, disconnect the signal generator frommains before cleaning. Use a dry cloth or one slightly dampened withwater to clean the external case parts. Do not attempt to cleaninternally.
Cleaning the DisplayUse a soft cloth to clean the window in front of the display assembly. Isopropyl alcohol canalso be used on the window for dirt that is difficult to remove. Do not use these products onthe display assembly. Refer to the service guide, if the display assembly requires cleaning.
Returning a Signal Generator for ServiceIf you are returning your signal generator to Agilent Technologies for servicing, fill out andattach a blue repair tag to the instrument. Repair tags are located at the end of thischapter.
Include as much information as possible about the problem: record any error messagesthat appeared on the display, and include performance test results or any other specificdata on the performance of the signal generator.
Ship the instrument in the original factory packaging materials, if they are available. Ifnot, use similar packaging to properly protect the instrument.
Return the instrument to the nearest Agilent Technologies sales and service office. A list ofsales and service offices follows on the next page.
6-2 Calibration Guide
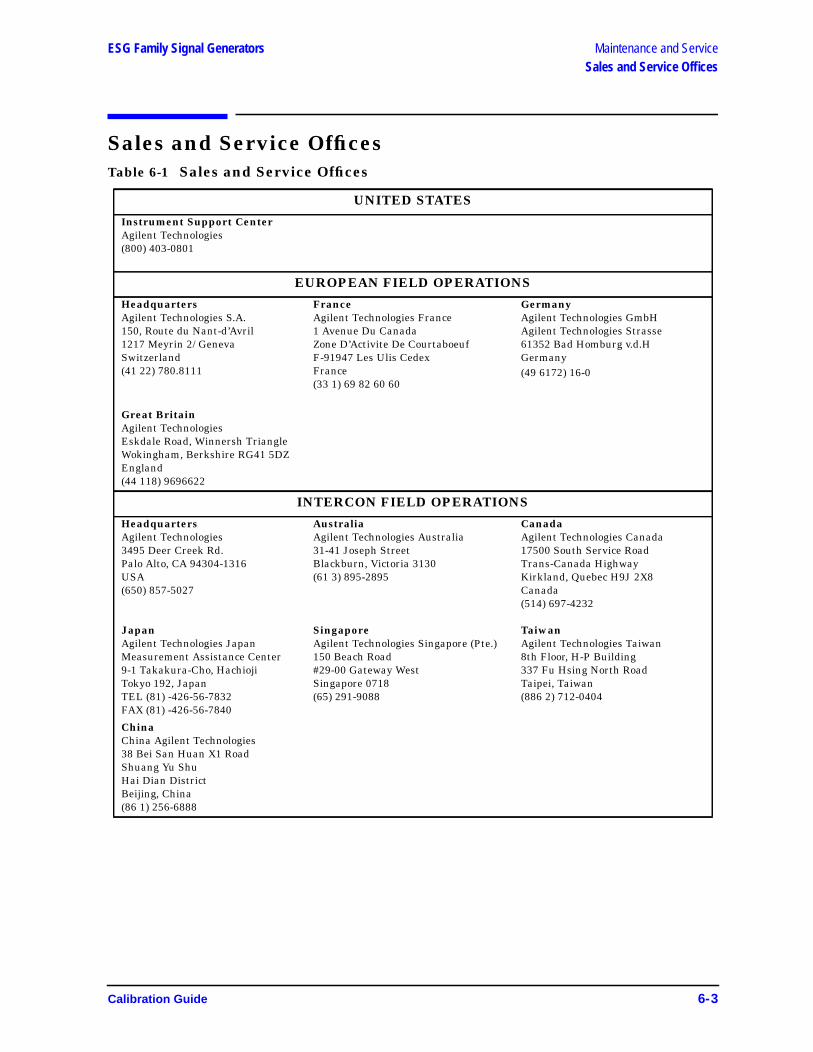
ESG Family Signal Generators Maintenance and ServiceSales and Service Offices
Sales and Service OfficesTable 6-1 Sales and Service Offices
UNITED STATES
Instrument Support CenterAgilent Technologies(800) 403-0801
EUROPEAN FIELD OPERATIONS
HeadquartersAgilent Technologies S.A.150, Route du Nant-d’Avril1217 Meyrin 2/ GenevaSwitzerland(41 22) 780.8111
FranceAgilent Technologies France1 Avenue Du CanadaZone D’Activite De CourtaboeufF-91947 Les Ulis CedexFrance(33 1) 69 82 60 60
GermanyAgilent Technologies GmbHAgilent Technologies Strasse61352 Bad Homburg v.d.HGermany(49 6172) 16-0
Great BritainAgilent TechnologiesEskdale Road, Winnersh TriangleWokingham, Berkshire RG41 5DZEngland(44 118) 9696622
INTERCON FIELD OPERATIONS
HeadquartersAgilent Technologies3495 Deer Creek Rd.Palo Alto, CA 94304-1316USA(650) 857-5027
JapanAgilent Technologies JapanMeasurement Assistance Center9-1 Takakura-Cho, HachiojiTokyo 192, JapanTEL (81) -426-56-7832FAX (81) -426-56-7840
AustraliaAgilent Technologies Australia31-41 Joseph StreetBlackburn, Victoria 3130(61 3) 895-2895
SingaporeAgilent Technologies Singapore (Pte.)150 Beach Road#29-00 Gateway WestSingapore 0718(65) 291-9088
CanadaAgilent Technologies Canada17500 South Service RoadTrans-Canada HighwayKirkland, Quebec H9J 2X8Canada(514) 697-4232
TaiwanAgilent Technologies Taiwan8th Floor, H-P Building337 Fu Hsing North RoadTaipei, Taiwan(886 2) 712-0404
ChinaChina Agilent Technologies38 Bei San Huan X1 RoadShuang Yu ShuHai Dian DistrictBeijing, China(86 1) 256-6888
Calibration Guide 6-3

Maintenance and Service ESG Family Signal GeneratorsSales and Service Offices
6-4 Calibration Guide
ESG Family Signal Generators
7 Safety and Regulatory
This chapter provides product warranty information, regulatory declarations, informationabout ESD and restricted materials, and explanations of caution and warning statementsmarked on the instrument.
Calibration Guide 7-1
Safety and Regulatory ESG Family Signal GeneratorsSafety Notes
Safety NotesThe following safety notes are used throughout this manual. Familiarize yourself witheach of the notes and its meaning before operating this instrument.
CAUTION Caution denotes a hazard. It calls attention to a procedure that, if notcorrectly performed or adhered to, would result in damage to or destruction ofthe product. Do not proceed beyond a caution sign until the indicatedconditions are fully understood and met.
WARNING Warning denotes a hazard. It calls attention to a procedure which, ifnot correctly performed or adhered to, could result in injury or lossof life. Do not proceed beyond a warning note until the indicatedconditions are fully understood and met.
7-2 Calibration Guide
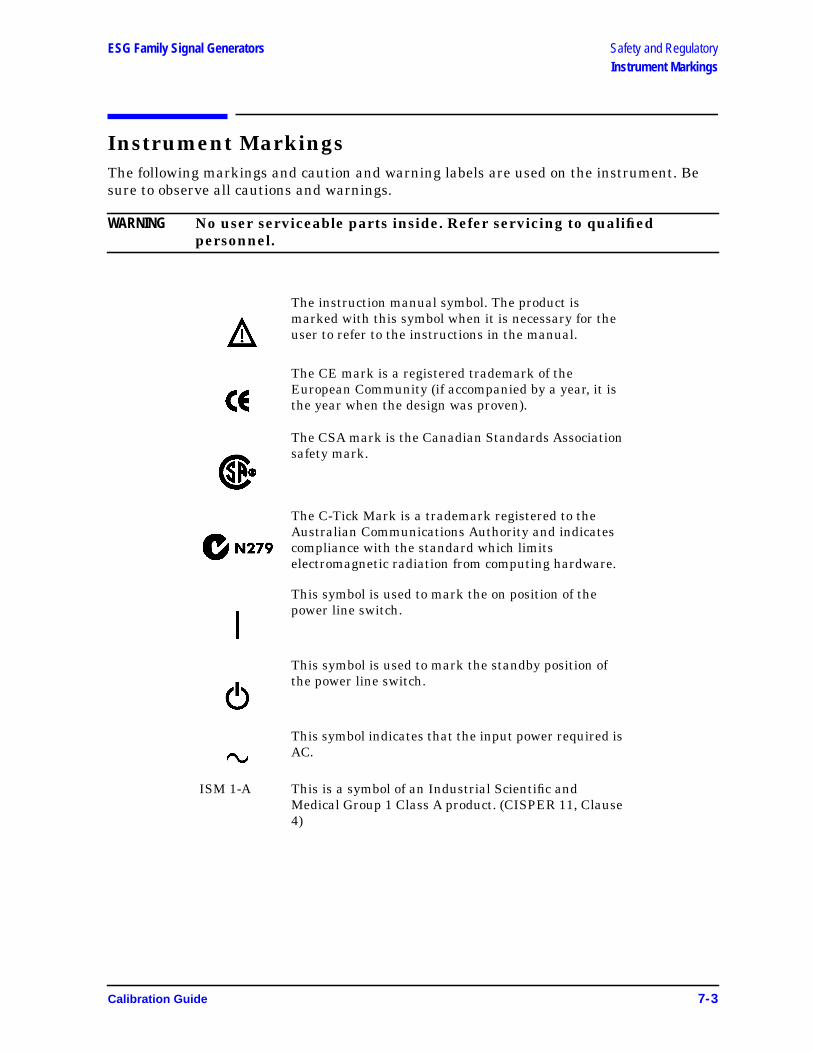
ESG Family Signal Generators Safety and RegulatoryInstrument Markings
Instrument MarkingsThe following markings and caution and warning labels are used on the instrument. Besure to observe all cautions and warnings.
WARNING No user serviceable parts inside. Refer servicing to qualifiedpersonnel.
The instruction manual symbol. The product ismarked with this symbol when it is necessary for theuser to refer to the instructions in the manual.
The CE mark is a registered trademark of theEuropean Community (if accompanied by a year, it isthe year when the design was proven).
The CSA mark is the Canadian Standards Associationsafety mark.
The C-Tick Mark is a trademark registered to theAustralian Communications Authority and indicatescompliance with the standard which limitselectromagnetic radiation from computing hardware.
This symbol is used to mark the on position of thepower line switch.
This symbol is used to mark the standby position ofthe power line switch.
This symbol indicates that the input power required isAC.
ISM 1-A This is a symbol of an Industrial Scientific andMedical Group 1 Class A product. (CISPER 11, Clause4)
Calibration Guide 7-3

Safety and Regulatory ESG Family Signal GeneratorsGeneral Safety Considerations
General Safety Considerations
WARNING No operator serviceable parts inside. Refer servicing to qualifiedpersonnel. To prevent electrical shock do not remove covers.
WARNING This is a Safety Class 1 Product (provided with a protective earthingground incorporated in the power cord). The mains plug shall onlybe inserted in a socket outlet provided with a protective earthcontact. Any interruption of the protective conductor inside oroutside of the product is likely to make the product dangerous.Intentional interruption is prohibited.
7-4 Calibration Guide

ESG Family Signal Generators Safety and RegulatoryStatement of Compliance
Statement of ComplianceThis product has been designed and tested in accordance with IEC Publication 1010,Safety Requirements for Electronic Measuring Apparatus, and has been supplied in a safecondition. The instruction documentation contains information and warnings which mustbe followed by the user to ensure safe operation and to maintain the product in a safecondition.
Calibration Guide 7-5
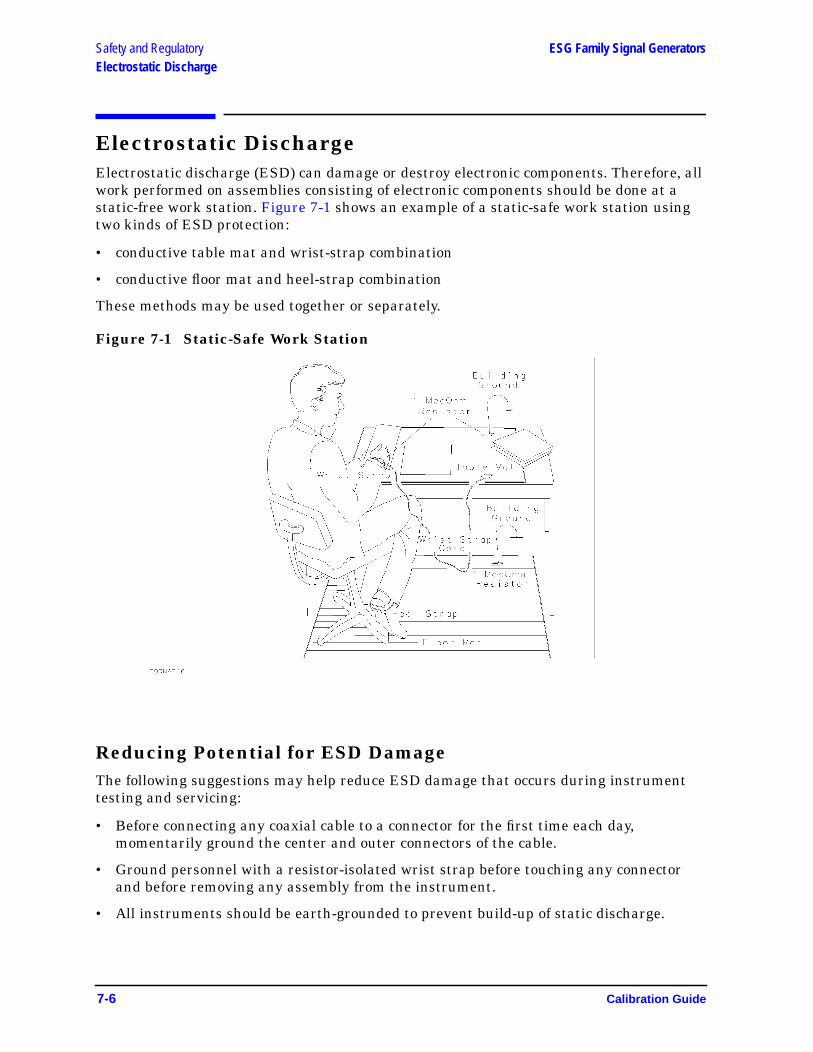
Safety and Regulatory ESG Family Signal GeneratorsElectrostatic Discharge
Electrostatic DischargeElectrostatic discharge (ESD) can damage or destroy electronic components. Therefore, allwork performed on assemblies consisting of electronic components should be done at astatic-free work station. Figure 7-1 shows an example of a static-safe work station usingtwo kinds of ESD protection:
• conductive table mat and wrist-strap combination
• conductive floor mat and heel-strap combination
These methods may be used together or separately.
Figure 7-1 Static-Safe Work Station
Reducing Potential for ESD DamageThe following suggestions may help reduce ESD damage that occurs during instrumenttesting and servicing:
• Before connecting any coaxial cable to a connector for the first time each day,momentarily ground the center and outer connectors of the cable.
• Ground personnel with a resistor-isolated wrist strap before touching any connectorand before removing any assembly from the instrument.
• All instruments should be earth-grounded to prevent build-up of static discharge.
7-6 Calibration Guide

ESG Family Signal Generators Safety and RegulatoryWarranty
WarrantyThis Agilent Technologies instrument product is warranted against defects in materialand workmanship for a period of three years from date of shipment. During the warrantyperiod, Agilent Technologies will, at its option, either repair or replace products whichprove to be defective.
For warranty service or repair, this product must be returned to a service facilitydesignated by Agilent Technologies. Buyer shall prepay shipping charges to AgilentTechnologies and Agilent Technologies shall pay shipping charges to return the product toBuyer. However, Buyer shall pay all shipping charges, duties, and taxes for productsreturned to Agilent Technologies from another country.
Agilent Technologies warrants that its software and firmware designated by AgilentTechnologies for use with an instrument will execute its programming instructions whenproperly installed on that instrument. Agilent Technologies does not warrant that theoperation of the instrument, or software, or firmware will be uninterrupted or error-free.
LIMITATION OF WARRANTY
The foregoing warranty shall not apply to defects resulting from improper or inadequatemaintenance by Buyer, Buyer-supplied software or interfacing, unauthorized modificationor misuse, operation outside of the environmental specifications for the product, orimproper site preparation or maintenance.
NO OTHER WARRANTY IS EXPRESSED OR IMPLIED. AGILENT TECHNOLOGIESSPECIFICALLY DISCLAIMS THE IMPLIED WARRANTIES OF MERCHANTABILITYAND FITNESS FOR A PARTICULAR PURPOSE.
EXCLUSIVE REMEDIES
THE REMEDIES PROVIDED HEREIN ARE BUYER’S SOLE AND EXCLUSIVEREMEDIES. AGILENT TECHNOLOGIES SHALL NOT BE LIABLE FOR ANY DIRECT,INDIRECT, SPECIAL, INCIDENTAL, OR CONSEQUENTIAL DAMAGES, WHETHERBASED ON CONTRACT, TORT, OR ANY OTHER LEGAL THEORY.
Calibration Guide 7-7
Safety and Regulatory ESG Family Signal GeneratorsAssistance
AssistanceProduct maintenance agreements and other customer assistance agreements are availablefor Agilent Technologies products. For any assistance, contact your nearest AgilentTechnologies sales and service office. (See “Sales and Service Offices” on page 6-3.)
7-8 Calibration Guide

ESG Family Signal Generators Safety and RegulatoryCertification
CertificationAgilent Technologies certifies that this product met its published specifications at the timeof shipment from the factory. Agilent Technologies further certifies that its calibrationmeasurements are traceable to the United States National Institute of Standards andTechnology, to the extent allowed by the Institute’s calibration facility, and to thecalibration facilities of other International Standards Organization members.
Calibration Guide 7-9
Safety and Regulatory ESG Family Signal GeneratorsCertification
7-10 Calibration Guide
Index
AAC symbol, 7-3add/remove programs, 3-5adding datapacks, 3-17adjustments, 5-1
ALC modulation driver bias, 5-33ALC modulation flatness, 5-39AM audio path offset, 5-11AM gain, 5-40analog bus ADC, 5-5baseband generator I/Q gain and offset, 5-43burst audio path gain, 5-28burst modulator, 5-27DCFM, 5-24external input peak detector, 5-26FM 1/2 path ratio gain, 5-17FM delay potentiometer, 5-20FM in-band DAC offset, 5-15FM inverting amplifier offset, 5-16FM out-of-band, 5-19FM path offset, 5-14FM scale DAC offset, 5-13FM/PM OB cal and delay potentiometer, 5-22FM/PM YO frequency compensation calibration,
5-23gain adjust, 5-31I/Q gain/offset/quadrature, 5-41I/Q impairment, 5-42internal reference oscillator, 5-4internal source, 5-7KV versus frequency, 5-10level meter, 5-38LNF gain adjust, 5-32lock angle potentiometer, 5-9low frequency output, 5-25modulation source relative gain compression, 5-18power level accuracy, 5-35prelevel, 5-29, 5-30pretune calibration, 5-6relationships between adjustments, 5-2timebase DAC, 5-12VBLO mixer bias, 5-34VCO bias potentiometer, 5-8wide bandwidth phase modulation, 5-21
administration configurationservice software, 3-7
administration of service software, 3-6ALC
calibrationsmodulation driver bias, 5-33modulation flatness, 5-39power level accuracy (4-point fit), 5-35
alternate timeslot power settling time performancetest, 4-35
AMaccuracy, 4-10
AM accuracy check, 2-8AM audio path offset calibration, 5-11AM frequency response performance test, 4-14AM gain calibration, 5-40analog bus ADC calibration, 5-5analyzer
audio, 1-2spectrum, 1-2vector signal, 1-2
arbitrary waveform generator, 1-3assistance, 7-8attenuator, 1-3audio analyzer, 1-2automatic leveling control calibration, 5-35
Bbaseband generator I/Q gain and offset adjustment,
5-43burst audio path gain calibration, 5-28burst modulation on/off ratio performance test, 4-33burst modulator calibration, 5-27
Ccalibration cycle, 4-2calibration due date, 3-9calibration tracking number, 3-9calibration type, 3-9Canadian Standards Association, 7-3carrier frequency offset, 4-17caution sign, 7-2CDMA adjacent channel power performance test,
4-34CE mark, 7-3certification, 7-9
specifications, 7-9choose destination location screen, 3-3compliance
statement of, 7-5configuring the software, 3-6counter
universal, 1-3CSA mark, 7-3custom I/Q RF modulation quality performance test,
4-29
Ddatapacks
adding, 3-17
Index I-1
Index
datapacks (Continued)removing, 3-19
DCFM calibration, 5-24DCFM frequency offset relative to CW performance
test, 4-17destination folder, 3-3device drivers
adding, 3-12device type, 3-8digital
multimeter, 1-3oscilloscope, 1-2
digital modulation level accuracy performance test,4-27
digitizing oscilloscope, 1-2drivers
device, 3-12test
adding, 3-14removing, 3-17
dual arbitrary waveform generator check, 4-42DUT
identifying, 3-7, 3-21DUT selection window, 4-4
Eelectrostatic discharge, 7-6
reducing potential for damage, 7-6equipment required
adjustments, 1-2performance tests, 1-2service software, 3-2verification procedures, 2-2
equipment serial numberin software, 3-9
error messagescheck for, 2-3
ESD, 7-6European Community trademark, 7-3exiting service software, 3-27exiting support software, 4-8external input peak detector calibration, 5-26
FFM, 4-9
accuracy, 4-9residual performance test, 4-18
FM 1/2 path ratio gain calibration, 5-17FM accuracy check, 2-7
FM delay potentiometer adjustment, 5-20FM frequency response, 4-13FM in-band DAC offset calibration, 5-15FM inverting amplifier offset calibration, 5-16FM out-of-band calibration, 5-19FM path offset calibration, 5-14FM scale DAC offset calibration, 5-13FM/PM OB cal and delay potentiometer, 5-22FM/PM YO frequency compensation calibration, 5-23Frac-N/Divider assembly check, 4-45frequency
standard, 1-2frequency offset, 4-17frequency range and accuracy check, 2-3function generator, 1-3
Ggain adjust calibration, 5-31generator
arbitrary waveform, 1-3function, 1-3signal, 1-2
GPIBinterface card, 1-3
GPIB addressin software, 3-9
Hharmonic spurious signals, 4-20harmonic, subharmonic, and nonharmonic spurious
signals performance test, 4-20
II/Q gain/offset/quadrature calibration, 5-41I/Q impairment adjustment, 5-42I/Q modulation check, 2-9I/Q modulation quality performance test, 4-31identifying the DUT, 3-7, 3-21IEC Publication 1010, 7-5important information screen, 3-3info file, 3-4installation
service software, 3-3instruction manual symbol, 7-3instrument markings, 7-3interface card, 1-3internal
timebase, 4-24
I-2 Index
Index
internal AM accuracy and distortion test, 4-10internal digital modulation quality performance test,
4-28internal reference oscillator adjustment, 5-4internal source calibration, 5-7ISM 1-A symbol, 7-3
KKV versus frequency calibration, 5-10
Llevel meter calibration, 5-38list, 4-5lock angle potentiometer adjustment, 5-9low frequency output calibration, 5-25low noise floor (LNF) gain adjust, 5-32
Mmain test and results window, 4-7maintenance agreements, 7-8maintenance and service, 6-1maintenance procedures
cleaning the cabinet, 6-2cleaning the display, 6-2
measuring receiver, 1-2meter
power, 1-3mixer, 1-3modulation, 4-2
burst on/off ratio performance test, 4-33internal digital quality performance test, 4-28
modulation source relative gain compressioncalibration, 5-18
multimeter digital, 1-3
Nnew test equipment window, 3-9nonharmonic spurious signals, 4-20
Ooperation verification, 2-1option 1E6
pulse rise/fall time test, 4-36oscilloscope
digital, 1-2digitizing, 1-2plug-in, 1-2
output power level check, 2-4
Ppassword
service software, 3-20performance tests
alternate timeslot power settling time, 4-35AM frequency response, 4-14burst modulation on/off ratio, 4-33CDMA adjacent channel power, 4-34custom I/Q RF modulation quality, 4-29DCFM frequency offset relative to CW, 4-17digital modulation level accuracy, 4-27dual arbitrary waveform generator check, 4-42FM frequency response, 4-13Frac-N/Divider assembly check, 4-45GSM loopback BER check, 4-44harmonic, subharmonic, and nonharmonic spurious
signals, 4-20I/Q modulation quality, 4-31internal AM accuracy and distortion, 4-10internal digital modulation quality, 4-28internal FM accuracy and distortion, 4-9list, 4-5measuring phase noise and residual FM, 4-37modulation source frequency accuracy, 4-2phase modulation accuracy and distortion, 4-12phase modulation frequency response, 4-16power level accuracy, 4-21pulse modulation on/off ratio, 4-32pulse rise/fall time (option 1E6), 4-36records, 4-2, 4-46, 4-47residual FM, 4-18sampler/YO driver check, 4-45timebase aging rate, 4-2, 4-24
phase modulation accuracy and distortionperformance test, 4-12
phase modulation frequency response performancetest, 4-16
plug-in, oscilloscope, 1-2power
meter, 1-3sensor, 1-3
power flatness calibration, 5-35power level accuracy performance test, 4-21power on symbol, 7-3prelevel calibration, 5-29, 5-30pretune calibration, 5-6preventive maintenance procedures, 6-2printer, 1-3printing test results, 4-8
Index I-3

Index
pulse modulation on/off ratio performance test, 4-32pulse rise/fall time performance test, 4-36
QQSPK modulation, 4-27
Rreadme file, 3-4receiver
measuring, 1-2recommended test equipment, 4-2records, 2-10, 4-2, 4-46, 4-47, 4-48removing datapacks, 3-19removing test drivers, 3-17removing test equipment, 3-10required test equipment
adjustments, 1-2performance tests, 1-2service software, 3-2verification procedures, 2-2
residual FM performance test, 4-18returning your signal generator, 6-2running tests and adjustments
service software, 3-25running the performance tests, 4-3
Ssafety, 7-1sales and service offices, 6-3sampler/YO driver check performance test, 4-45save as window, 4-6saving test results, 4-6
service software, 3-24select test equipment and tests window, 4-5sensor, 1-3serial number
in software, 3-9service software, 3-1
adding test equipment, 3-8equipment required, 3-2installing, 3-3password, 3-7, 3-20running, 3-20starting, 3-20uninstalling, 3-5user name, 3-20
signal generator, 1-2returning, 6-2
softwareadding test equipment, 3-8administration, 3-6administration configuration, 3-7configuration, 3-6equipment required, 3-2exiting, 3-27GPIB address, 3-9installing, 3-3password, 3-7, 3-20printing test results, 3-27running, 3-20running adjustments, 3-25running tests, 3-25saving test results, 3-24selecting test equipment, 3-22service, 3-1uninstalling, 3-5user configuration, 3-7user name, 3-20viewing test results, 3-26
software, support, 4-3spectrum analyzer, 1-2spurious signals, 4-20standby symbol, 7-3starting the software, 3-20statement of compliance, 7-5static-safe work station, 7-6subharmonic spurious signals, 4-20support software, 4-3
exiting, 4-8
Ttables
verification procedures, 2-10test drivers
adding, 3-14removing, 3-17window, 3-14
test equipmentadjustments, 1-2editing, 3-11list, 4-5performance tests, 1-2recommended, 4-2removing, 3-10service software, 3-2verification procedures, 2-2
test equipment dialog box, 3-8, 3-10test equipment drivers dialog box, 3-14
I-4 Index
Index
test equipment selectionservice software, 3-22
test records, 4-2, 4-46, 4-47, 4-48test results
printing, 3-27, 4-8saving, 4-6viewing, 3-26
test tables, 2-10timebase aging rate, 4-2timebase aging rate performance test, 4-24timebase DAC calibration, 5-12trace number, 3-9
Uuninstalling the software, 3-5universal counter, 1-3user configuration
service software, 3-7user information window, 4-3user name
service software, 3-20
VVBLO mixer bias calibration, 5-34VCO bias potentiometer adjustment, 5-8vector signal analyzer, 1-2verification procedure tables, 2-10verification procedures, 2-2
test tables/records, 2-10verifying operation, 2-1
Wwarning sign, 7-2warranty, 7-7waveform generator, 1-3welcome screen, 3-3wide bandwidth phase modulation calibration, 5-21window
DUT, 4-4main test and results, 4-7save as, 4-6select test equipment and tests, 4-5user information, 4-3
YYO
sampler driver check performance test, 4-45
Index I-5

Index
I-6 Index