Embed Size (px)
Citation preview
Seahorse XF Cell Mito Stress Test ProfileMitochondrial Respiration
TIME (minutes)
Oxyg
en C
onsu
mpt
ion
Rate
(OCR
)(p
mol
/min
)
Oligomycin FCCPRotenone &antimycin A
0
40
80
160
240
120
200
280
320
360
0 20 40 60 8010 30 50 70 90 110100
Non-mitochondrial Oxygen Consumption
BasalRespiration
ATPProduction
MaximalRespiration
Proton Leak
SpareCapacity
Agilent Seahorse XF Live-Cell Metabolism Solutions for Stem Cell Research
2
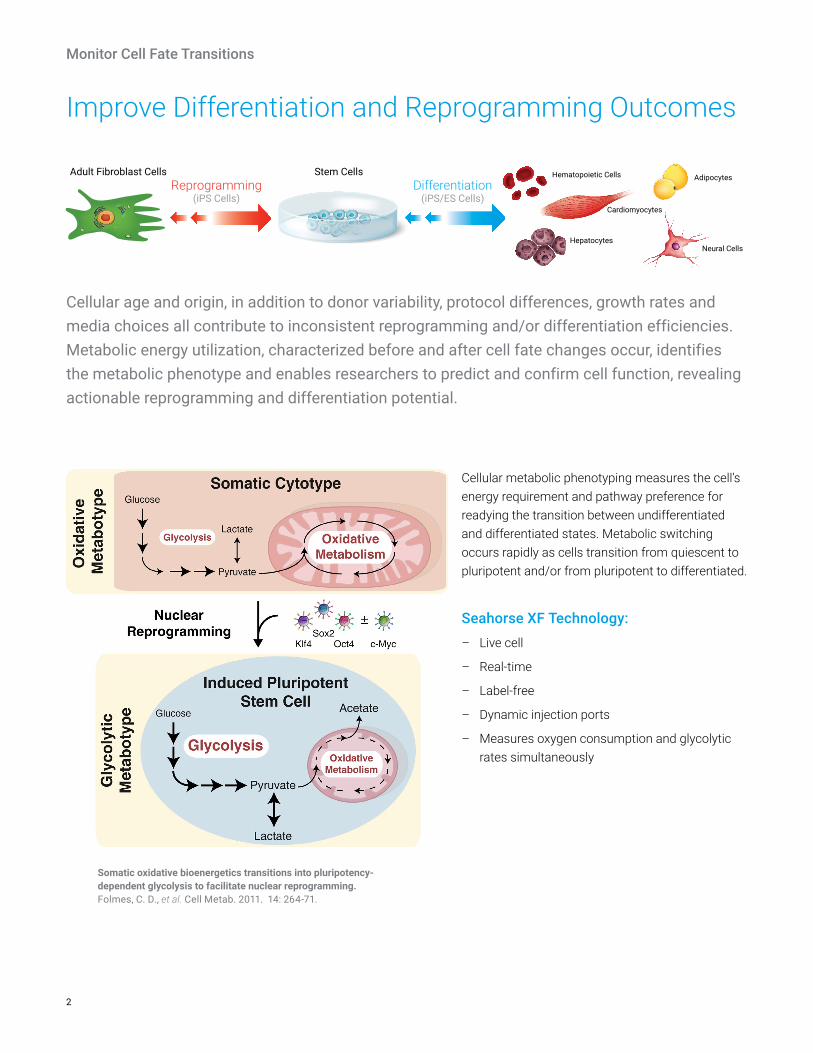
Cellular age and origin, in addition to donor variability, protocol differences, growth rates and media choices all contribute to inconsistent reprogramming and/or differentiation efficiencies. Metabolic energy utilization, characterized before and after cell fate changes occur, identifies the metabolic phenotype and enables researchers to predict and confirm cell function, revealing actionable reprogramming and differentiation potential.
Cellular metabolic phenotyping measures the cell’s energy requirement and pathway preference for readying the transition between undifferentiated and differentiated states. Metabolic switching occurs rapidly as cells transition from quiescent to pluripotent and/or from pluripotent to differentiated.
Seahorse XF Technology: – Live cell
– Real-time
– Label-free
– Dynamic injection ports
– Measures oxygen consumption and glycolytic rates simultaneously
Somatic oxidative bioenergetics transitions into pluripotency-dependent glycolysis to facilitate nuclear reprogramming. Folmes, C. D., et al. Cell Metab. 2011. 14: 264-71.
Improve Differentiation and Reprogramming Outcomes
Adult Fibroblast Cells Stem Cells Hematopoietic Cells Adipocytes
Hepatocytes
Cardiomyocytes
Neural Cells
Differentiation(iPS/ES Cells)
Reprogramming(iPS Cells)
Monitor Cell Fate Transitions
3
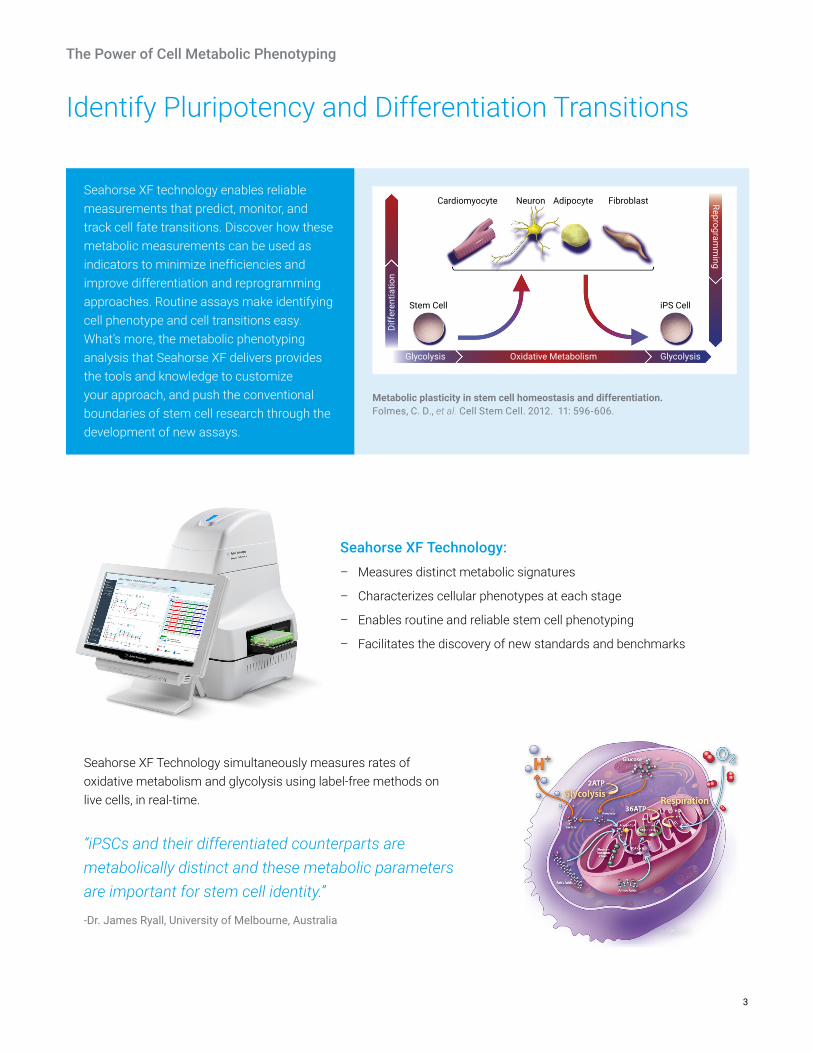
Identify Pluripotency and Differentiation Transitions
Seahorse XF technology enables reliable measurements that predict, monitor, and track cell fate transitions. Discover how these metabolic measurements can be used as indicators to minimize inefficiencies and improve differentiation and reprogramming approaches. Routine assays make identifying cell phenotype and cell transitions easy. What’s more, the metabolic phenotyping analysis that Seahorse XF delivers provides the tools and knowledge to customize your approach, and push the conventional boundaries of stem cell research through the development of new assays.
Cardiomyocyte
Stem Cell
Glycolysis
Diff
eren
tiatio
n
Reprogramm
ing
Oxidative Metabolism Glycolysis
iPS Cell
Neuron Adipocyte Fibroblast
Seahorse XF Technology: – Measures distinct metabolic signatures
– Characterizes cellular phenotypes at each stage
– Enables routine and reliable stem cell phenotyping
– Facilitates the discovery of new standards and benchmarks
Seahorse XF Technology simultaneously measures rates of oxidative metabolism and glycolysis using label-free methods on live cells, in real-time.
“iPSCs and their differentiated counterparts are metabolically distinct and these metabolic parameters are important for stem cell identity.”
-Dr. James Ryall, University of Melbourne, Australia
Metabolic plasticity in stem cell homeostasis and differentiation. Folmes, C. D., et al. Cell Stem Cell. 2012. 11: 596-606.
The Power of Cell Metabolic Phenotyping
4
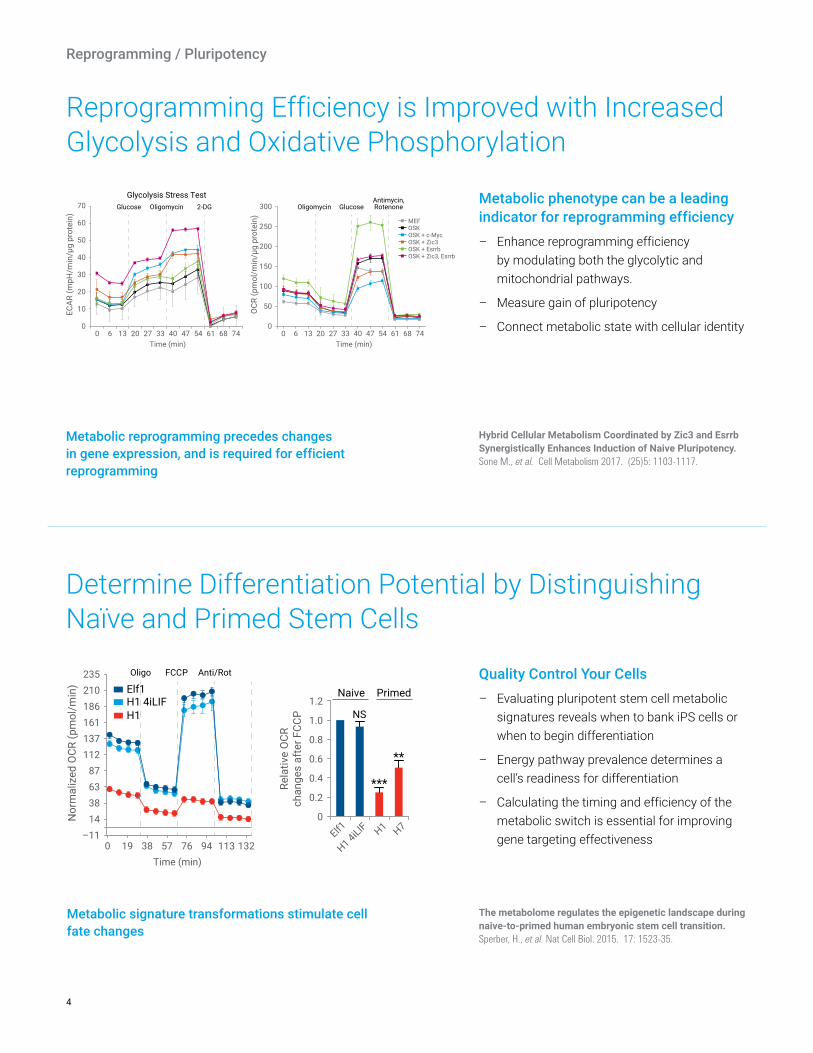
Reprogramming Efficiency is Improved with Increased Glycolysis and Oxidative Phosphorylation
Determine Differentiation Potential by Distinguishing Naïve and Primed Stem Cells
Metabolic phenotype can be a leading indicator for reprogramming efficiency
– Enhance reprogramming efficiency by modulating both the glycolytic and mitochondrial pathways.
– Measure gain of pluripotency
– Connect metabolic state with cellular identity
Quality Control Your Cells – Evaluating pluripotent stem cell metabolic
signatures reveals when to bank iPS cells or when to begin differentiation
– Energy pathway prevalence determines a cell’s readiness for differentiation
– Calculating the timing and efficiency of the metabolic switch is essential for improving gene targeting effectiveness
Time (min)
0
10
20
30
40
50
60
70
0 6 13 20 27 33 40 47 54 61 68 74
ECAR
(mpH
/min
/µg
prot
ein)
Glycolysis Stress TestGlucose Oligomycin 2-DG
MEFOSKOSK + c-MycOSK + Zic3OSK + EsrrbOSK + Zic3, Esrrb
Time (min)
0
50
100
150
200
250
300
0 6 13 20 27 33 40 47 54 61 68 74
OCR
(pm
ol/m
in/µ
g pr
otei
n)
GlucoseOligomycinAntimycin,Rotenone
H1 4iLIFH1
Elf1
NS
Naive Primed
0
0.2
0.4
0.6
0.8
1.0
1.2
Rela
tive
OCR
chan
ges
afte
r FCC
P
Elf1
H1 4iLIF H1 H7
Time (min)
235210186161137112
87633814
–110 19 38 57 76 94 113 132
Nor
mal
ized
OCR
(pm
ol/m
in)
Oligo FCCP Anti/Rot
**
***
Metabolic reprogramming precedes changes in gene expression, and is required for efficient reprogramming
Metabolic signature transformations stimulate cell fate changes
Hybrid Cellular Metabolism Coordinated by Zic3 and Esrrb Synergistically Enhances Induction of Naive Pluripotency. Sone M., et al. Cell Metabolism 2017. (25)5: 1103-1117.
The metabolome regulates the epigenetic landscape during naive-to-primed human embryonic stem cell transition. Sperber, H., et al. Nat Cell Biol. 2015. 17: 1523-35.
Reprogramming / Pluripotency
5
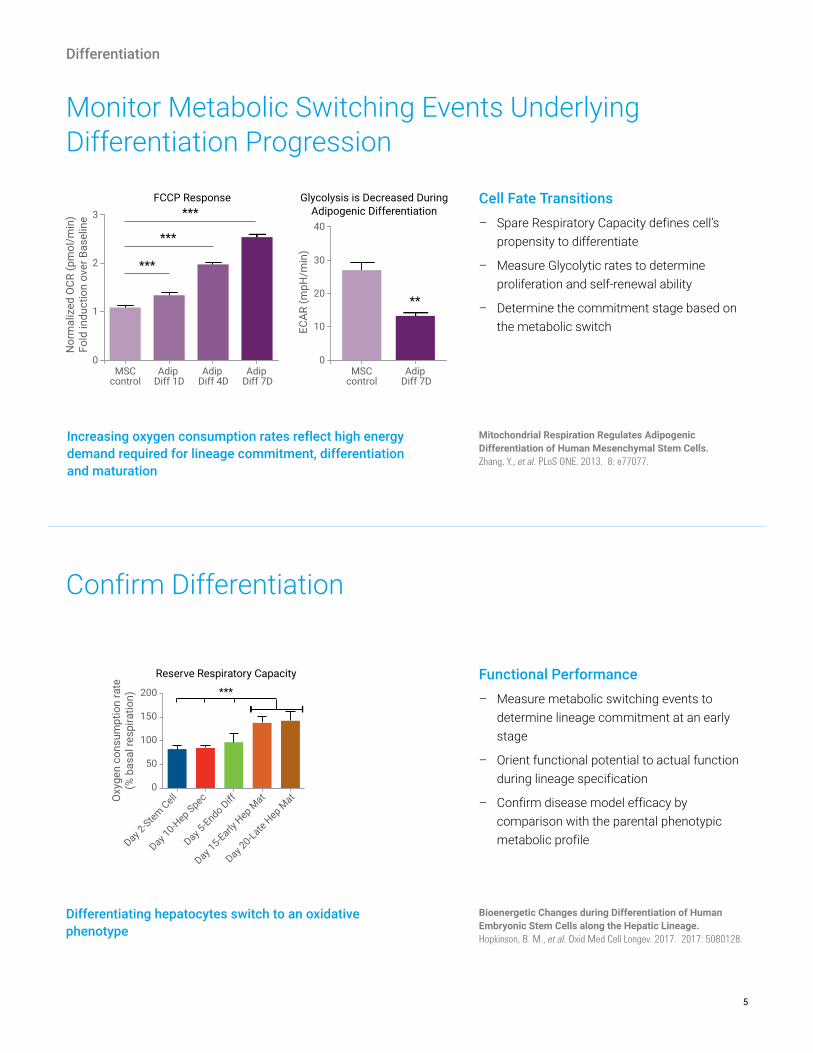
Monitor Metabolic Switching Events Underlying Differentiation Progression
Cell Fate Transitions – Spare Respiratory Capacity defines cell’s
propensity to differentiate
– Measure Glycolytic rates to determine proliferation and self-renewal ability
– Determine the commitment stage based on the metabolic switch
Increasing oxygen consumption rates reflect high energy demand required for lineage commitment, differentiation and maturation
Confirm Differentiation
Functional Performance – Measure metabolic switching events to
determine lineage commitment at an early stage
– Orient functional potential to actual function during lineage specification
– Confirm disease model efficacy by comparison with the parental phenotypic metabolic profile
Differentiating hepatocytes switch to an oxidative phenotype
***
Oxy
gen
cons
umpt
ion
rate
(% b
asal
resp
iratio
n)
Reserve Respiratory Capacity
0
50
100
150
200
Day 2-Stem Cell
Day 10-H
ep Spec
Day 5-Endo Diff
Day 15-Early
Hep M
at
Day 20-Late H
ep Mat
FCCP Response Glycolysis is Decreased DuringAdipogenic Differentiation***
***
***
**
0
1
2
3
Nor
mal
ized
OCR
(pm
ol/m
in)
Fold
indu
ctio
n ov
er B
asel
ine
ECAR
(mpH
/min
)
MSCcontrol
Adip Diff 1D
Adip Diff 4D
Adip Diff 7D
0
20
10
30
40
MSCcontrol
Adip Diff 7D
Mitochondrial Respiration Regulates Adipogenic Differentiation of Human Mesenchymal Stem Cells. Zhang, Y., et al. PLoS ONE. 2013. 8: e77077.
Bioenergetic Changes during Differentiation of Human Embryonic Stem Cells along the Hepatic Lineage. Hopkinson, B. M., et al. Oxid Med Cell Longev. 2017. 2017: 5080128.
Differentiation
6
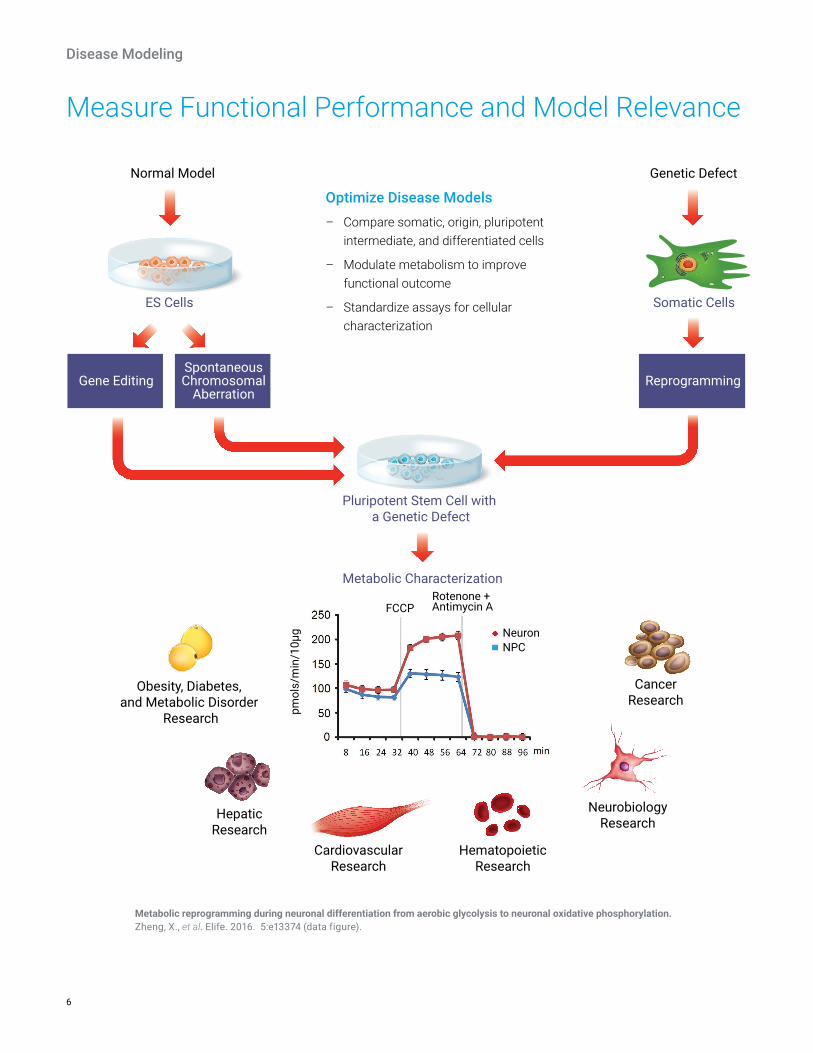
Normal Model Genetic Defect
Gene Editing ReprogrammingSpontaneousChromosomal
Aberration
Pluripotent Stem Cell with a Genetic Defect
ES Cells Somatic Cells
Metabolic Characterization
CancerResearch
HepaticResearch
CardiovascularResearch
HematopoieticResearch
NeurobiologyResearch
Obesity, Diabetes, and Metabolic Disorder
Research
Rotenone + Antimycin A
pmol
s/m
in/1
0µg
FCCP
NeuronNPC
Optimize Disease Models – Compare somatic, origin, pluripotent
intermediate, and differentiated cells
– Modulate metabolism to improve functional outcome
– Standardize assays for cellular characterization
Metabolic reprogramming during neuronal differentiation from aerobic glycolysis to neuronal oxidative phosphorylation. Zheng, X., et al. Elife. 2016. 5:e13374 (data figure).
Measure Functional Performance and Model Relevance
Disease Modeling
7
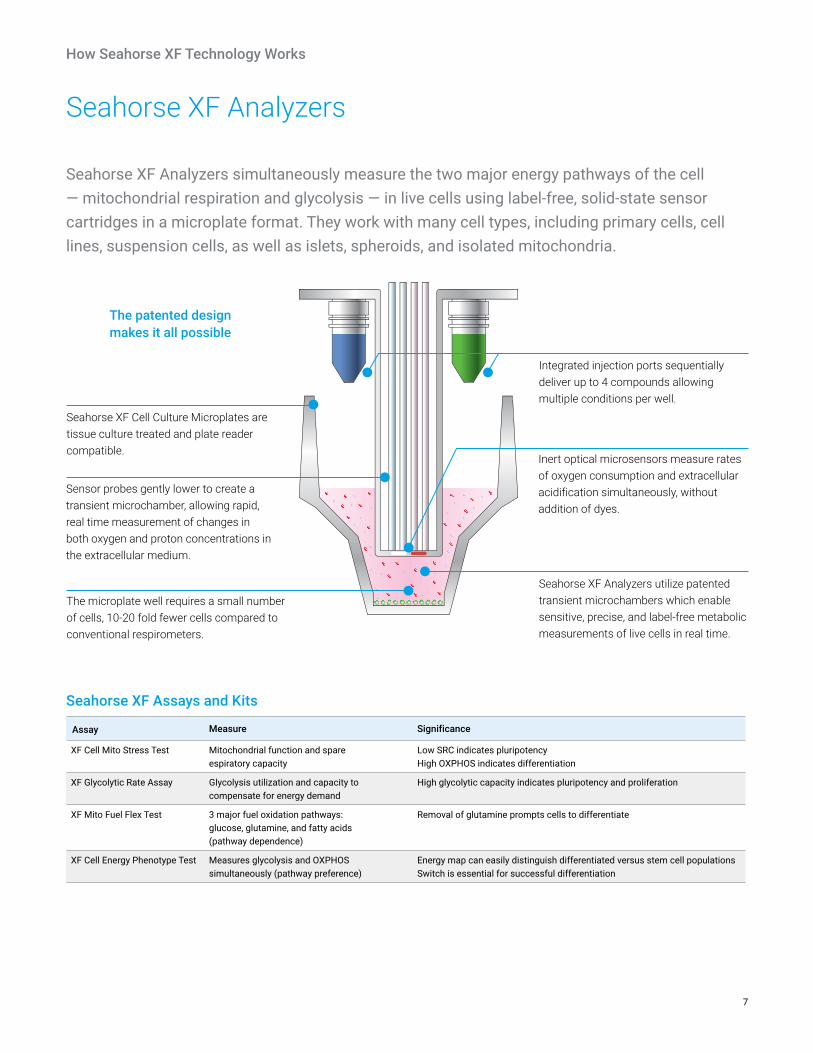
Seahorse XF Analyzers simultaneously measure the two major energy pathways of the cell — mitochondrial respiration and glycolysis — in live cells using label-free, solid-state sensor cartridges in a microplate format. They work with many cell types, including primary cells, cell lines, suspension cells, as well as islets, spheroids, and isolated mitochondria.
The patented design makes it all possible
Seahorse XF Analyzers utilize patented transient microchambers which enable sensitive, precise, and label-free metabolic measurements of live cells in real time.
Integrated injection ports sequentially deliver up to 4 compounds allowing multiple conditions per well.
Sensor probes gently lower to create a transient microchamber, allowing rapid, real time measurement of changes in both oxygen and proton concentrations in the extracellular medium.
Seahorse XF Cell Culture Microplates are tissue culture treated and plate reader compatible.
Inert optical microsensors measure rates of oxygen consumption and extracellular acidification simultaneously, without addition of dyes.
The microplate well requires a small number of cells, 10-20 fold fewer cells compared to conventional respirometers.
Seahorse XF Assays and Kits
Assay Measure Significance
XF Cell Mito Stress Test Mitochondrial function and spare espiratory capacity
Low SRC indicates pluripotency High OXPHOS indicates differentiation
XF Glycolytic Rate Assay Glycolysis utilization and capacity to compensate for energy demand
High glycolytic capacity indicates pluripotency and proliferation
XF Mito Fuel Flex Test 3 major fuel oxidation pathways: glucose, glutamine, and fatty acids (pathway dependence)
Removal of glutamine prompts cells to differentiate
XF Cell Energy Phenotype Test Measures glycolysis and OXPHOS simultaneously (pathway preference)
Energy map can easily distinguish differentiated versus stem cell populations Switch is essential for successful differentiation
Seahorse XF Analyzers
How Seahorse XF Technology Works
For Research Use Only. Not for use in diagnostic procedures.
This information is subject to change without notice.
© Agilent Technologies, Inc. 2018 Published in the USA, June 12, 2018 5991-8167EN Rev. B
Learn MoreMore about stem cells www.agilent.com/chem/StemCells
Buy online www.agilent.com/chem/store
Application notes www.agilent.com/cs/library/ applications/5991-7130EN.pdf
Bibliographies citing Seahorse XF data on stem cell research www.agilent.com/cs/pubimages/misc/StemCells_2017_April_BiblioPage.pdf
Publications Database www.agilent.com/publications-database/
Find a local Agilent customer center in your country www.agilent.com/chem/contactus
USA and Canada 1-800-227-9770 [email protected]
Europe [email protected]
Asia Pacific [email protected]
Measure What's Important to Your CellWith over 20,000 genes, 200,000 proteins and thousands of pathways, you can’t measure everything in a cell at once, but you can measure what provides the energy that drives them—metabolism.
Agilent Seahorse XF technology detects changes in cell bioenergetics in real-time, providing a window into the critical functions driving cell signaling, proliferation, activation, toxicity and biosynthesis.
Move beyond analyzing what your cells are, and reveal a clearer picture of what they do.
Agilent Seahorse Wave SoftwareWave, the primary Seahorse software program, enables the transformation of raw kinetic data into powerful results. Wave provides preloaded templates and protocols for each Seahorse XF assay kit, reducing time for assay design, as well as several analysis views and export options that facilitate Seahorse XF data analysis and interpretation.