Embed Size (px)
Citation preview

Agilent Mass Hunter Software
Quick Start Guide
Use this guide to get started with the Mass Hunter software.
What is Mass Hunter Software?
Mass Hunter is an integral part of Agilent TOF software (version A.02.00). Mass Hunter operates on chromatographic and electrophoretic mass spectral data to extract information to reduce data complexity, eliminate potential interferences, and generate a list of molecular features.
Working with the extracted information
A feature is a discrete molecularentity defined by the combination
of retention time and mass.
You can use the feature information from Mass Hunter to perform many different tasks. Here are a few examples:
• Compare the original (raw data) total ion chromatogram (TIC) with the processed TIC
• Compare the original and processed mass spectra at a specific retention time (RT), or averaged over an RT range, on the TIC
• Show extracted ion chromatograms based on a mass spectral range.
• View the species clusters (isotopic, dimers, adducts) for each feature
For a complete list of tasks, see the Mass Hunter online help.
Agilent Technologies
Getting started with the Mass Hunter software
Start the Mass Hunter software
This section tells you how to start the Mass Hunter software.
• Either do this:
a Double-click the Agilent TOF Software folder icon on the desktop, or
Select Start > Programs > Agilent > TOF Software from the desktop.
b In the Agilent TOF Software folder, double-click the Mass Hunter icon .
• Or do this:
Select Start > Programs > Agilent > TOF Software > Mass Hunter from the desktop.
The system displays the Mass Hunter main window.
Learn how to access Mass Hunter functions
You can use the toolbar or the menus to perform many of the Mass Hunter tasks:
HINT To access other functions, double-click or Ctrl-click a plot or table row number. You may use the middle mouse button click for Ctrl-click in the Mass Hunter software
2 Agilent Mass Hunter Software Quick Start Guide

Learn how to use Mass Hunter
Try these exercises to familiarize yourself with the Mass Hunter application. Try the Steps on the left in the exercises on the next pages without the Detailed Instructions. If you need more help, follow the detailed instructions.
If you want to do this: Refer to this section or exercise:
Extract feature information “Exercises: Extracting feature information” on page 4
Extract feature information for a single file “Exercise 1—Extract feature information for a single file” on page 4
Extract feature information for a batch “Exercise 2—Extract feature information for a batch” on page 9
Reprocess a file with different parameters “Exercise 3—Reprocess files with different parameters” on page 11
Display specific feature information or export and save information
“Exercises: Reviewing and saving feature information” on page 14
Show species clusters, mass spectra and extracted ion chromatograms (EIC) for features
“Exercise 4—Show species clusters, EIC and mass spectra for features” on page 14.
Show possible feature compositions “Exercise 5—Show possible feature compositions” on page 17
Export and save feature information “Exercise 6—Export and save feature information” on page 19
Work with chromatograms, mass spectra and contour plots
“Exercises: Working with plots” on page 22
Show mass spectra from chromatograms and show and hide other plots
“Exercise 7—Working with processed chromatograms (TICs or EICs)” on page 22
Show EICs from mass spectra “Exercise 8—Working with mass spectra” on page 24
Learn to use contour plots “Exercise 9—Working with contour plots” on page 25
Agilent Mass Hunter Software Quick Start Guide 3

Exercises: Extracting feature information
Exercise 1—Extract feature information for a single file
This exercise guides you through the process to extract feature information from a TOF .wiff file.
CAUTION To process Agilent TOF data files (.wiff files) with the Mass Hunter software, the .wiff files must be local to the software. That is, the files must reside on the computer where the Mass Hunter software is running. Also, the files must not be read-only. Use Windows Explorer to check and change the file attributes.
Steps Detailed Instructions Comments
1 Open UrineNeg 1027_9_1A.wiff.• Copy the example Mass Hunter
files that come with the TOF software to a folder that only you will use.
a Select File > Open File. b Go to your folder that contains the
Mass Hunter example TOF data files.c Select UrineNeg 1027_9_1A.wiff.d Click Open.
The data file appears in the Raw Data Window. (See Figure 1.)
Figure 1 Raw Data Window
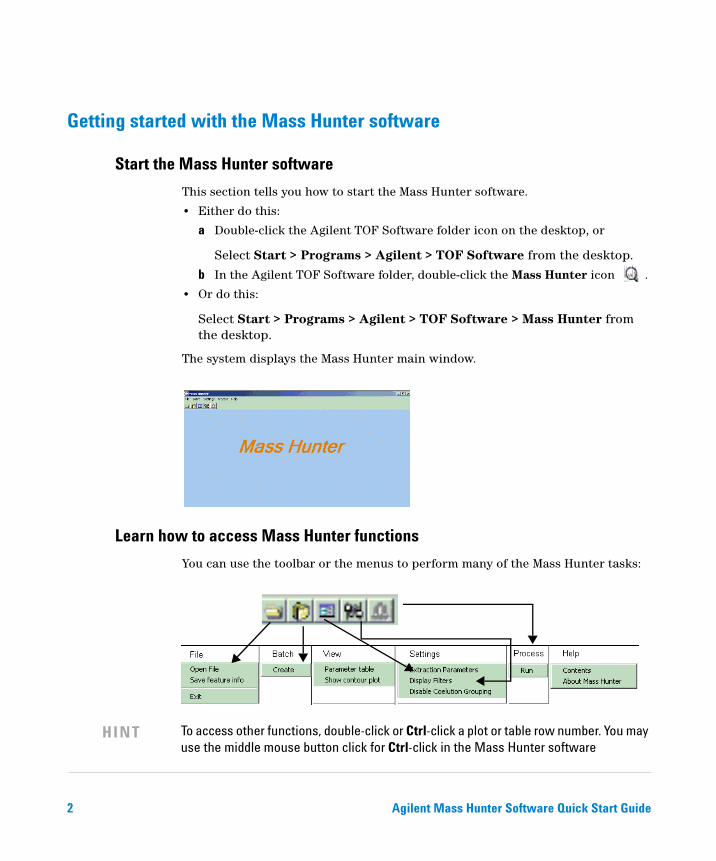
• This example file contains a single sample time segment and scan data. When you open a data file that contains multiple data sets, the Select Data Set dialog box (Figure 2) appears. You must then select one combination of sample, time segment and scan segment to extract before the Raw Data Window appears.
4 Agilent Mass Hunter Software Quick Start Guide
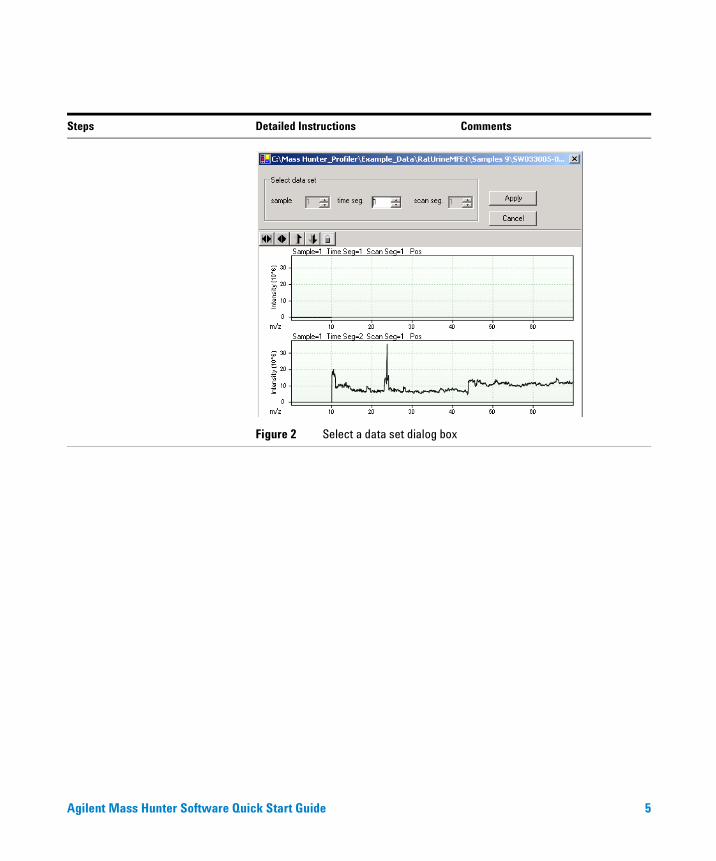
Figure 2 Select a data set dialog box
Steps Detailed Instructions Comments
Agilent Mass Hunter Software Quick Start Guide 5
2 View the mass spectra and peak information of the raw data at retention time of 8.9 min.
• Double-click the TIC at 8.9 minutes.Two mass spectra for that RT appear below the TIC, and the peak information for the mass spectrum appears in the Raw Data Peak Viewer on the left.
• One mass spectrum shows the baseline, and the other shows the threshold level, which can be changed by the user (see “Exercise 3—Reprocess files with different parameters” on page 11).
Steps Detailed Instructions Comments
6 Agilent Mass Hunter Software Quick Start Guide
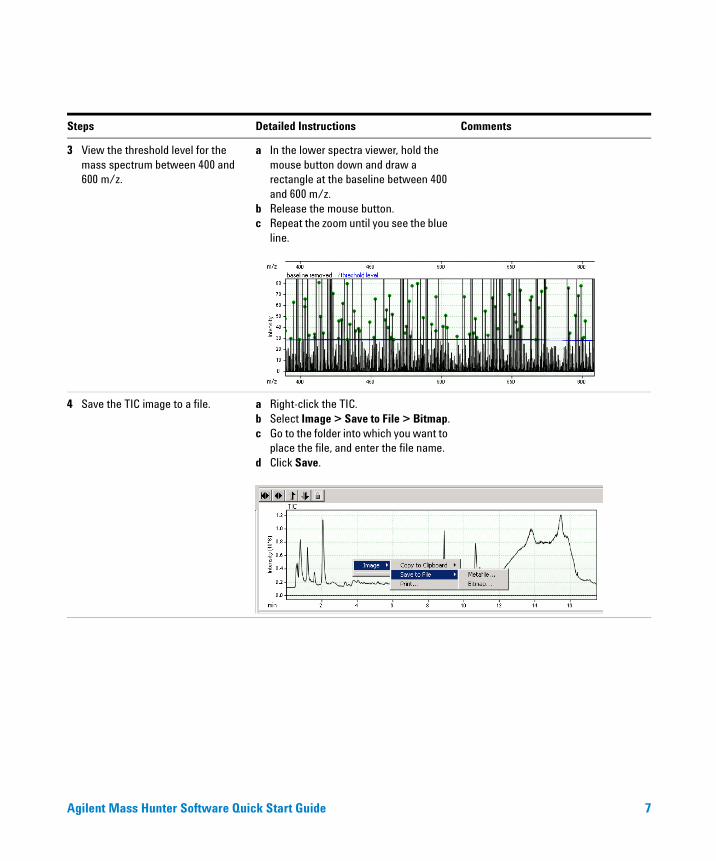
3 View the threshold level for the mass spectrum between 400 and 600 m/z.
a In the lower spectra viewer, hold the mouse button down and draw a rectangle at the baseline between 400 and 600 m/z.
b Release the mouse button.c Repeat the zoom until you see the blue
line.
4 Save the TIC image to a file. a Right-click the TIC.b Select Image > Save to File > Bitmap.c Go to the folder into which you want to
place the file, and enter the file name.d Click Save.
Steps Detailed Instructions Comments
Agilent Mass Hunter Software Quick Start Guide 7
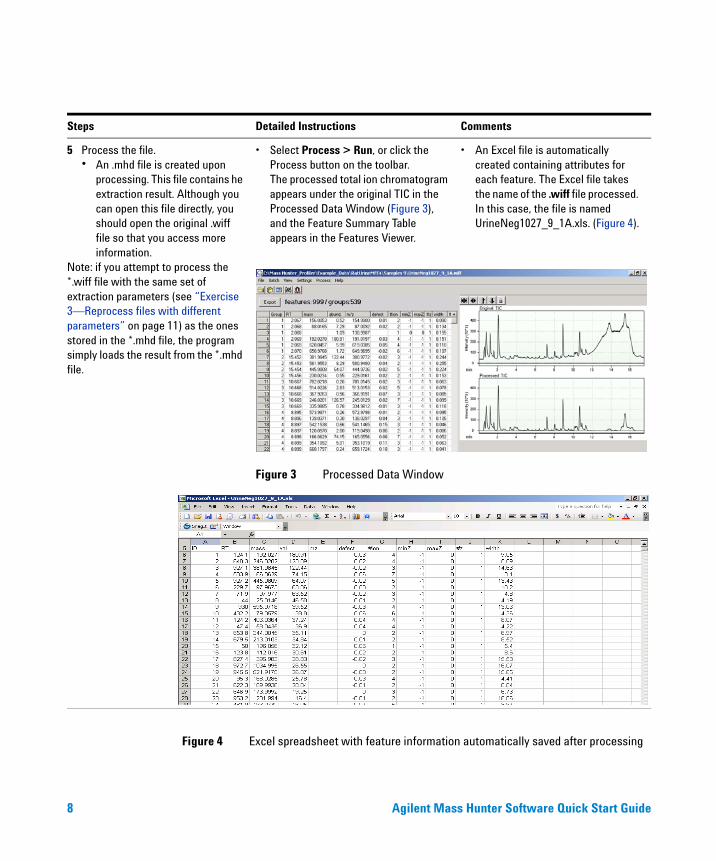
Figure 4 Excel spreadsheet with feature information automatically saved after processing
5 Process the file.• An .mhd file is created upon
processing. This file contains he extraction result. Although you can open this file directly, you should open the original .wiff file so that you access more information.
Note: if you attempt to process the *.wiff file with the same set of extraction parameters (see “Exercise 3—Reprocess files with different parameters” on page 11) as the ones stored in the *.mhd file, the program simply loads the result from the *.mhd file.
• Select Process > Run, or click the Process button on the toolbar.The processed total ion chromatogram appears under the original TIC in the Processed Data Window (Figure 3), and the Feature Summary Table appears in the Features Viewer.
Figure 3 Processed Data Window
• An Excel file is automatically created containing attributes for each feature. The Excel file takes the name of the .wiff file processed. In this case, the file is named UrineNeg1027_9_1A.xls. (Figure 4).
Steps Detailed Instructions Comments
8 Agilent Mass Hunter Software Quick Start Guide
Exercise 2—Extract feature information for a batch
This exercise shows you how to automatically extract feature information for a batch of TOF data files for downstream use or later review.
CAUTION To process Agilent TOF data files (.wiff files) with the Mass Hunter software, the .wiff files must be local to the software. That is, the files must reside on the computer where the Mass Hunter software is running. Also, the files must not be read-only. Use Windows Explorer to check and change the file attributes.
Steps Detailed Instructions Comments
1 Create a batch of files to extract.Use the following files:• All three sample 9 .wiff files:
UrineNeg1027_0_3A.wiff, UrineNeg1027_9_2A.wiff, and UrineNeg1027_9_1A.wiff.
• The first file in the sample 10 folder: UrineNeg1027_10_2A.wiff
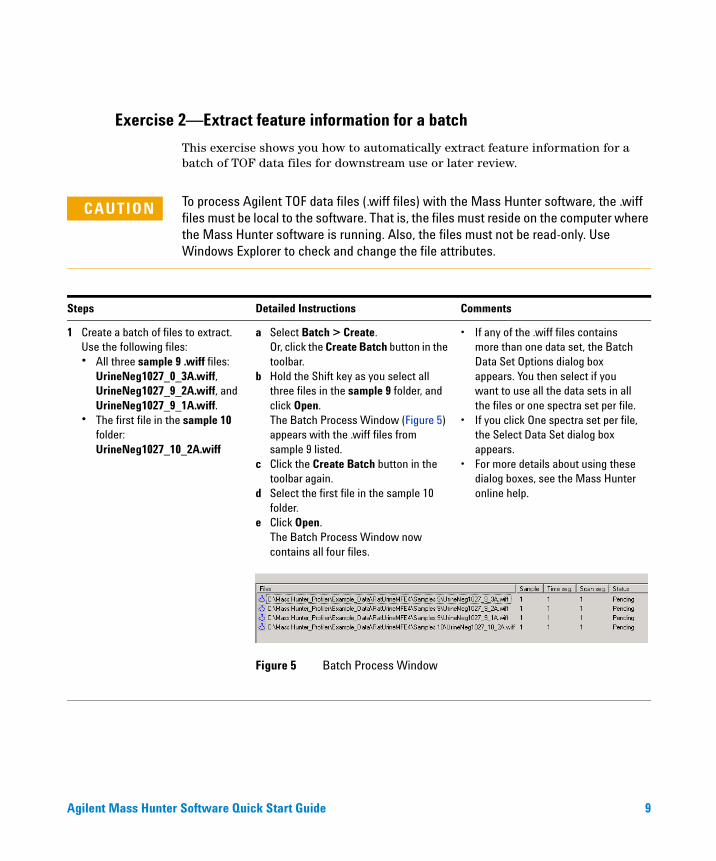
a Select Batch > Create.Or, click the Create Batch button in the toolbar.
b Hold the Shift key as you select all three files in the sample 9 folder, and click Open.The Batch Process Window (Figure 5) appears with the .wiff files from sample 9 listed.
c Click the Create Batch button in the toolbar again.
d Select the first file in the sample 10 folder.
e Click Open.The Batch Process Window now contains all four files.
Figure 5 Batch Process Window
• If any of the .wiff files contains more than one data set, the Batch Data Set Options dialog box appears. You then select if you want to use all the data sets in all the files or one spectra set per file.
• If you click One spectra set per file, the Select Data Set dialog box appears.
• For more details about using these dialog boxes, see the Mass Hunter online help.
Agilent Mass Hunter Software Quick Start Guide 9
2 Process the files. • Select Process > Execute Batch, or click the Process button in the toolbar.
• Notice the Progress bar on the left. When the runs are complete for all data files, you see a message saying that the batch run is complete.
• To see the features, groups and mass spectra for each of the processed .mhd files in the batch, you must open each individually and work with it in the Processed Data Window.
Steps Detailed Instructions Comments
10 Agilent Mass Hunter Software Quick Start Guide
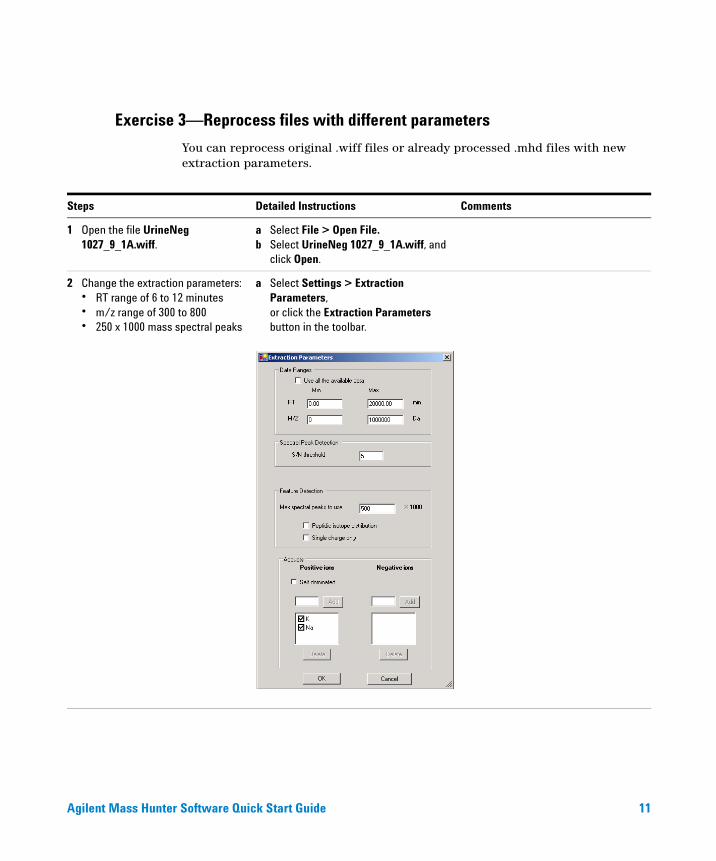
Exercise 3—Reprocess files with different parameters
You can reprocess original .wiff files or already processed .mhd files with new extraction parameters.
Steps Detailed Instructions Comments
1 Open the file UrineNeg 1027_9_1A.wiff.
a Select File > Open File.b Select UrineNeg 1027_9_1A.wiff, and
click Open.
2 Change the extraction parameters:• RT range of 6 to 12 minutes• m/z range of 300 to 800• 250 x 1000 mass spectral peaks
a Select Settings > Extraction Parameters, or click the Extraction Parameters button in the toolbar.
Agilent Mass Hunter Software Quick Start Guide 11
b To set the RT range, enter 6 as the Min RT and 12 as the Max RT.
c To set the m/z range, enter 300 as the Min M/Z and 800 as the Max M/Z.
d For the Max spectral peaks to use, enter 250.
e Click OK.
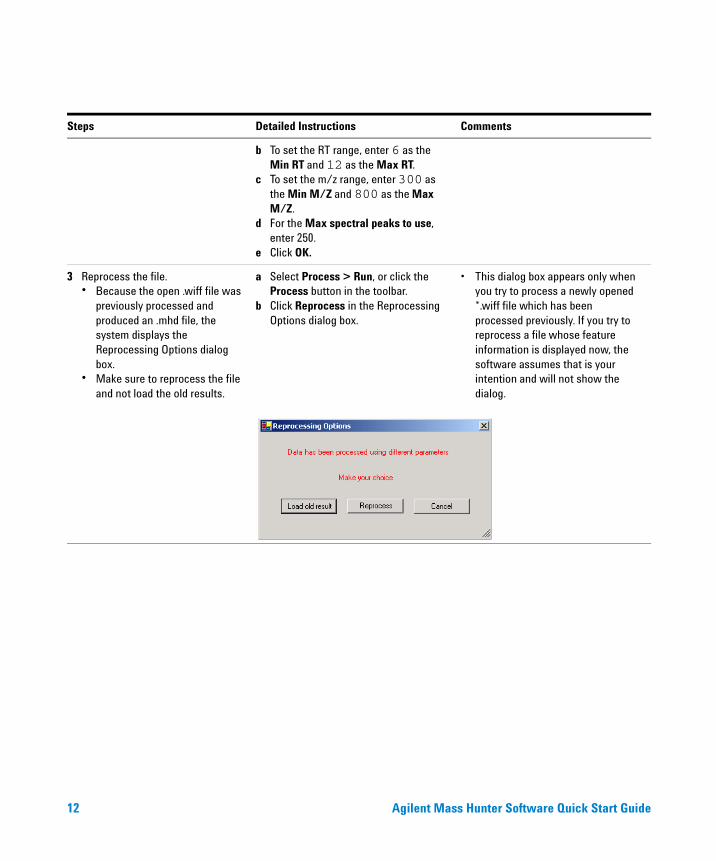
3 Reprocess the file.• Because the open .wiff file was
previously processed and produced an .mhd file, the system displays the Reprocessing Options dialog box.
• Make sure to reprocess the file and not load the old results.
a Select Process > Run, or click the Process button in the toolbar.
b Click Reprocess in the Reprocessing Options dialog box.
• This dialog box appears only when you try to process a newly opened *.wiff file which has been processed previously. If you try to reprocess a file whose feature information is displayed now, the software assumes that is your intention and will not show the dialog.
Steps Detailed Instructions Comments
12 Agilent Mass Hunter Software Quick Start Guide

4 Review the extraction parameters used for the current result.
a Select View > Parameter Table.b Close the table after review.
• You may want to occasionally review the parameters used to display the currently displayed results.
Steps Detailed Instructions Comments
Agilent Mass Hunter Software Quick Start Guide 13
Exercises: Reviewing and saving feature information
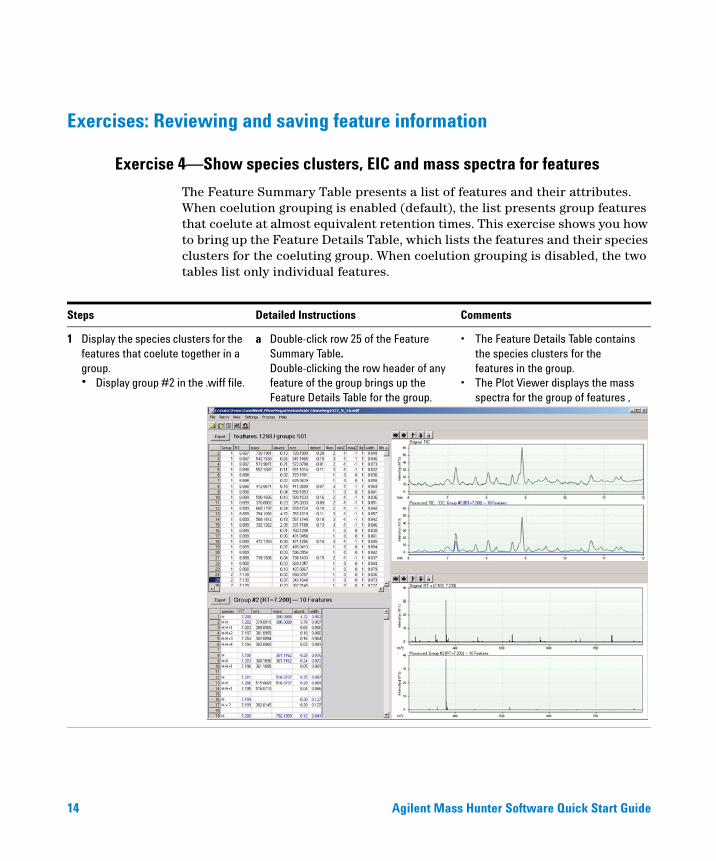
Exercise 4—Show species clusters, EIC and mass spectra for features
The Feature Summary Table presents a list of features and their attributes. When coelution grouping is enabled (default), the list presents group features that coelute at almost equivalent retention times. This exercise shows you how to bring up the Feature Details Table, which lists the features and their species clusters for the coeluting group. When coelution grouping is disabled, the two tables list only individual features.
Steps Detailed Instructions Comments
1 Display the species clusters for the features that coelute together in a group.• Display group #2 in the .wiff file.
a Double-click row 25 of the Feature Summary Table.Double-clicking the row header of any feature of the group brings up the Feature Details Table for the group.
• The Feature Details Table contains the species clusters for the features in the group.
• The Plot Viewer displays the mass spectra for the group of features , as well as the EIC for the group.
14 Agilent Mass Hunter Software Quick Start Guide
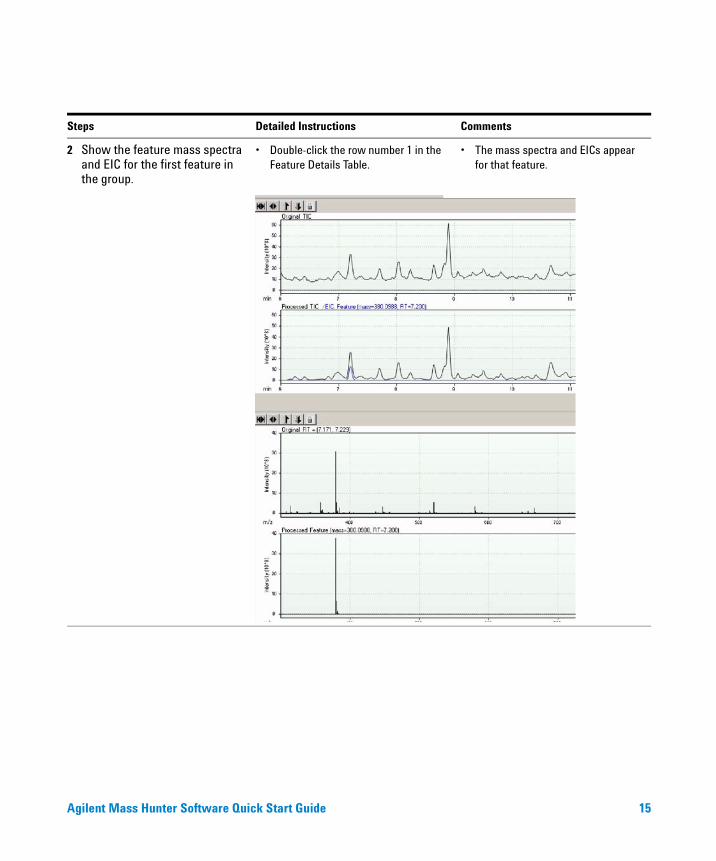
2 Show the feature mass spectra and EIC for the first feature in the group.
• Double-click the row number 1 in the Feature Details Table.
• The mass spectra and EICs appear for that feature.
Steps Detailed Instructions Comments
Agilent Mass Hunter Software Quick Start Guide 15

3 Show ion mass spectra and EICs for the M+H ion of the second feature in the group.
• Double-click the row #9 in the Feature Details table.
• The Plot Viewer displays the mass spectrum and EIC for the original data, and a mass spectrum and EIC for the processed ion specified in row 9.
4 Show feature mass spectra for a feature when coelution grouping is disabled.
a Select Settings > Disable Coelution Grouping.
b Click the Process icon to bring up the Feature Summary Table with a listing of features and no groups.
c Double-click the row #2.You now see the Feature Details Table with species cluster information for only that feature.
• The mass spectra for the selected feature appear in the Plot Viewer, and the species clusters for that feature only appear in the Feature Details Table.
5 Re-enable Coelution Grouping. a Select Settings > Enable Coelution Grouping.
b Click the Process icon.
Steps Detailed Instructions Comments
16 Agilent Mass Hunter Software Quick Start Guide
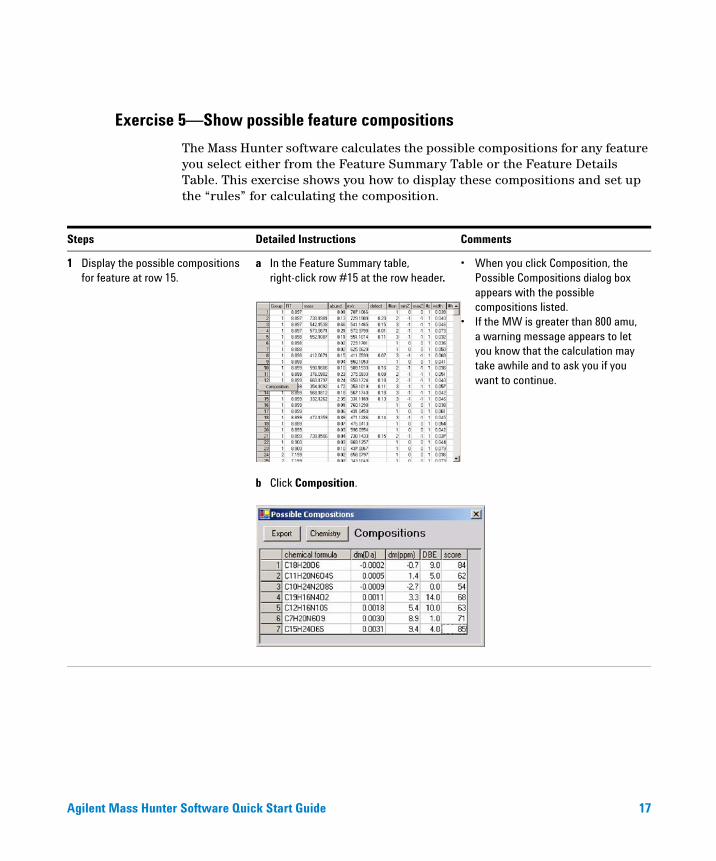
Exercise 5—Show possible feature compositions
The Mass Hunter software calculates the possible compositions for any feature you select either from the Feature Summary Table or the Feature Details Table. This exercise shows you how to display these compositions and set up the “rules” for calculating the composition.
Steps Detailed Instructions Comments
1 Display the possible compositions for feature at row 15.
a In the Feature Summary table, right-click row #15 at the row header.
b Click Composition.
• When you click Composition, the Possible Compositions dialog box appears with the possible compositions listed.
• If the MW is greater than 800 amu, a warning message appears to let you know that the calculation may take awhile and to ask you if you want to continue.
Agilent Mass Hunter Software Quick Start Guide 17
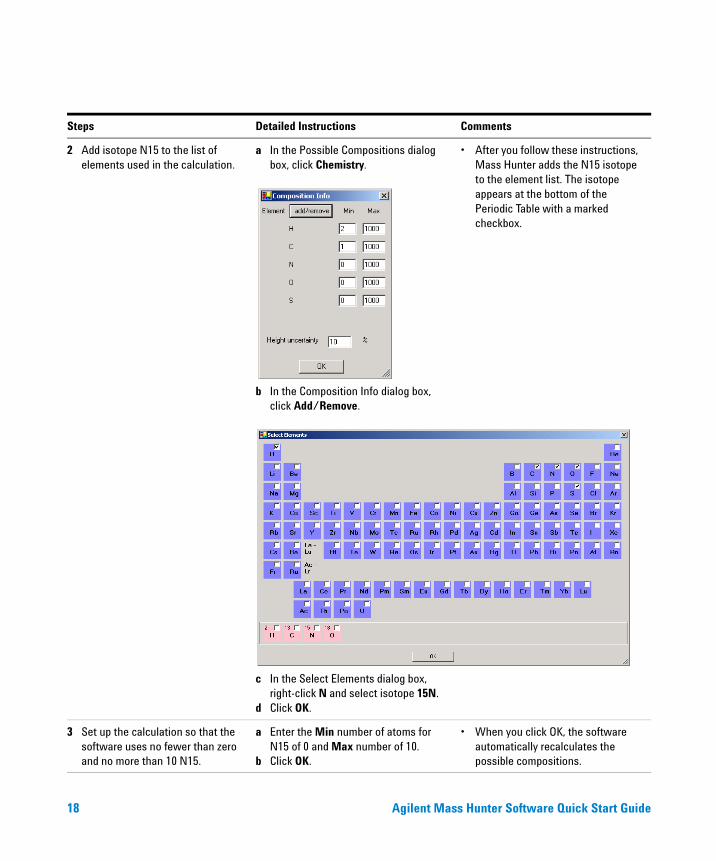
2 Add isotope N15 to the list of elements used in the calculation.
a In the Possible Compositions dialog box, click Chemistry.
b In the Composition Info dialog box, click Add/Remove.
c In the Select Elements dialog box, right-click N and select isotope 15N.
d Click OK.
• After you follow these instructions, Mass Hunter adds the N15 isotope to the element list. The isotope appears at the bottom of the Periodic Table with a marked checkbox.
3 Set up the calculation so that the software uses no fewer than zero and no more than 10 N15.
a Enter the Min number of atoms for N15 of 0 and Max number of 10.
b Click OK.
• When you click OK, the software automatically recalculates the possible compositions.
Steps Detailed Instructions Comments
18 Agilent Mass Hunter Software Quick Start Guide
Exercise 6—Export and save feature information
You can export the information in each Mass Hunter table to an Excel file:
• Feature Summary Table
• Feature Details Table
• Possible Compositions Table
• Parameter View
You can also save molecular ion peak information for all the features.
Steps Detailed Instructions Comments
1 Export the Feature Composition table to a Microsoft Excel file.• If you are already in the
Possible Compositions dialog box after Exercise 5, skip to step b.
• View the Excel file.
a Right-click any feature in the Feature Summary Table, and click Composition.
b Click Export.c Specify a destination folder.d Specify a file name.e Click OK.f Close the Possible Compositions
dialog box.g Go to the folder containing the Excel
file, and open the file.
• If you are in the Mass Hunter main window, open the file UrineNeg1027_9_1A_1_1_1.mhd. Then follow the instructions in this step.
2 Export the Feature Summary table to a Microsoft Excel file.• View the Excel file.
a At the top of the Feature Summary Table, click Export.
b Specify a destination folder.c Specify a file name.d Click OK.e Go to the folder containing the Excel
file, and open the file.
• See Figure 6, “Feature Summary Table in Excel,” on page 20.
3 Export the Feature Details table.• View the Excel file.
f At the top of the Feature Details Table, click Export.
g Specify a destination folder.h Specify a file name.i Click OK.j Go to the folder containing the Excel
file, and open the file.
• See Figure 7, “Feature Details Table in Excel,” on page 21.
• If the Feature Details Table is not present, double-click the row number of the group or feature of interest in the Feature Summary Table.
Agilent Mass Hunter Software Quick Start Guide 19
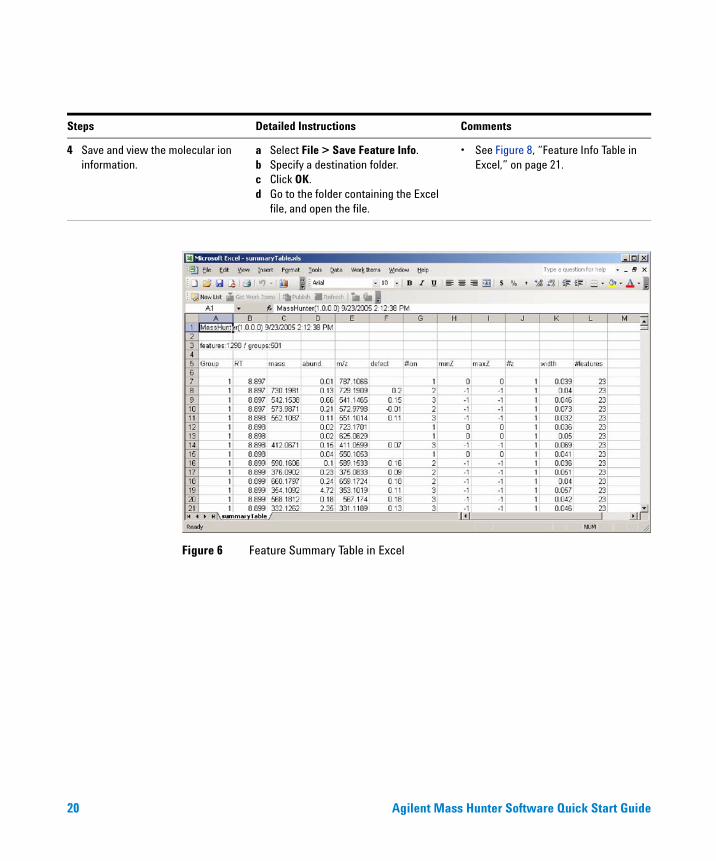
Figure 6 Feature Summary Table in Excel
4 Save and view the molecular ion information.
a Select File > Save Feature Info.b Specify a destination folder.c Click OK.d Go to the folder containing the Excel
file, and open the file.
• See Figure 8, “Feature Info Table in Excel,” on page 21.
Steps Detailed Instructions Comments
20 Agilent Mass Hunter Software Quick Start Guide

Figure 7 Feature Details Table in Excel
Figure 8 Feature Info Table in Excel
Agilent Mass Hunter Software Quick Start Guide 21
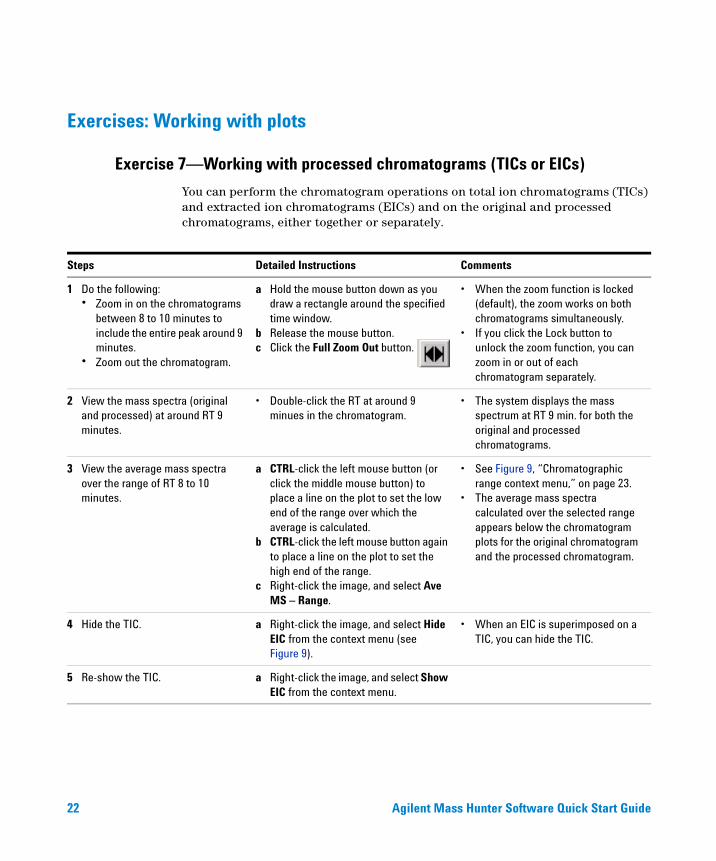
Exercises: Working with plots
Exercise 7—Working with processed chromatograms (TICs or EICs)
You can perform the chromatogram operations on total ion chromatograms (TICs) and extracted ion chromatograms (EICs) and on the original and processed chromatograms, either together or separately.
Steps Detailed Instructions Comments
1 Do the following:• Zoom in on the chromatograms
between 8 to 10 minutes to include the entire peak around 9 minutes.
• Zoom out the chromatogram.
a Hold the mouse button down as you draw a rectangle around the specified time window.
b Release the mouse button.c Click the Full Zoom Out button.
• When the zoom function is locked (default), the zoom works on both chromatograms simultaneously.
• If you click the Lock button to unlock the zoom function, you can zoom in or out of each chromatogram separately.
2 View the mass spectra (original and processed) at around RT 9 minutes.
• Double-click the RT at around 9 minues in the chromatogram.
• The system displays the mass spectrum at RT 9 min. for both the original and processed chromatograms.
3 View the average mass spectra over the range of RT 8 to 10 minutes.
a CTRL-click the left mouse button (or click the middle mouse button) to place a line on the plot to set the low end of the range over which the average is calculated.
b CTRL-click the left mouse button again to place a line on the plot to set the high end of the range.
c Right-click the image, and select Ave MS – Range.
• See Figure 9, “Chromatographic range context menu,” on page 23.
• The average mass spectra calculated over the selected range appears below the chromatogram plots for the original chromatogram and the processed chromatogram.
4 Hide the TIC. a Right-click the image, and select Hide EIC from the context menu (see Figure 9).
• When an EIC is superimposed on a TIC, you can hide the TIC.
5 Re-show the TIC. a Right-click the image, and select Show EIC from the context menu.
22 Agilent Mass Hunter Software Quick Start Guide
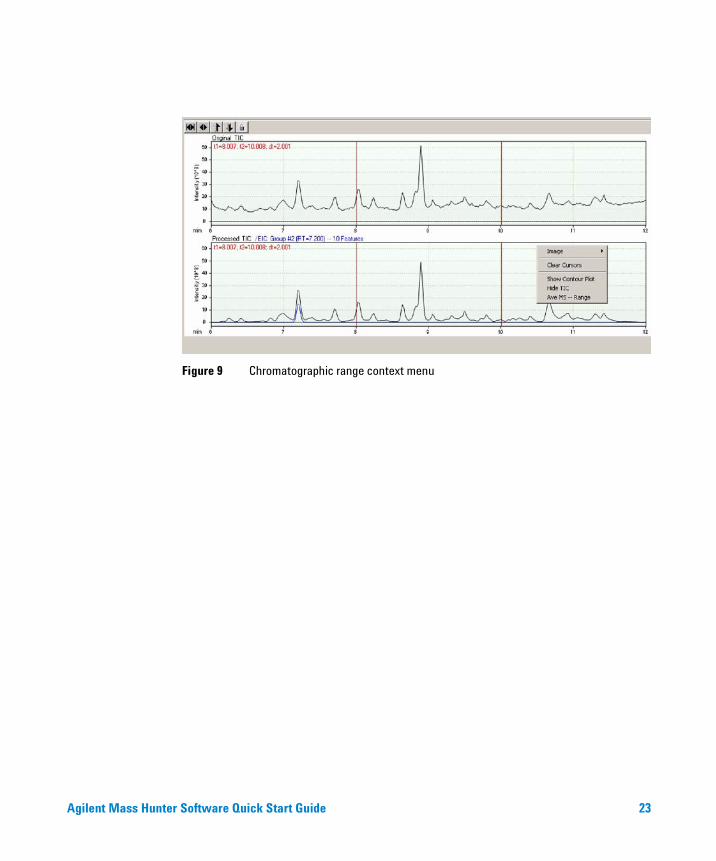
Figure 9 Chromatographic range context menu
Agilent Mass Hunter Software Quick Start Guide 23

Exercise 8—Working with mass spectra
Steps Detailed Instructions Comments
1 Show an extracted ion chromatogram at about 500 m/z (highest peak)
1 Double-click the highest peak in the mass spectrum.
• The Plot Viewer displays the EIC for this RT in both the original and processed chromatogram windows.
2 Show an extracted ion chromatogram for the m/z range of 500 to 550 m/z (approximate).
a CTRL-click the left mouse button (or click the middle mouse button) to place a line on the mass spectrum to set the low end of the range over which the chromatogram is extracted.
b CTRL-click the left mouse button again to place a line on the mass spectrum to set the high end of the range.
c Right-click the image, and select Show EIC from the context menu.
• The EICs appear superimposed on the TICs.
24 Agilent Mass Hunter Software Quick Start Guide

Exercise 9—Working with contour plots
The contour plot is a two-dimensional representation of 3D data, with m/z as the x-axis, RT as the y-axis and intensity as the z-axis (the darkness or lightness of the image on the plot). Two plots are shown, one for the original data and the other, for the processed data.
Steps Detailed Instructions Comments
1 Show the contour plots. a Right-click any one of the chromatograms, and select Show Contour Plot.
• See Figure 9, “Chromatographic range context menu,” on page 23.
• The contour plots appear for the original and processed chromatograms.
2 Zoom into and out of the contour plot.
a Hold down the mouse button and draw a rectangle around the area of interest.
b Release the mouse button.c To zoom out, click the Zoom Out button
next to the coordinates text field.
3 Find the position of m/z= 500 and RT=9.
a CTRL-click the left mouse button (or click the middle mouse button).Two perpendicular blue lines (cross-hair cursor) appear in the plot.
b With the mouse button held down, move the cross-hair cursor to the point specified in step 3.
c Double-click the plot to remove the cross-hair cursor.
• You can see the coordinates of the position in the box to the left and below the left contour plot. (Figure 10)
4 Hide the contour plot. a Right-click the plot, and select Hide Counter Plot.
Agilent Mass Hunter Software Quick Start Guide 25
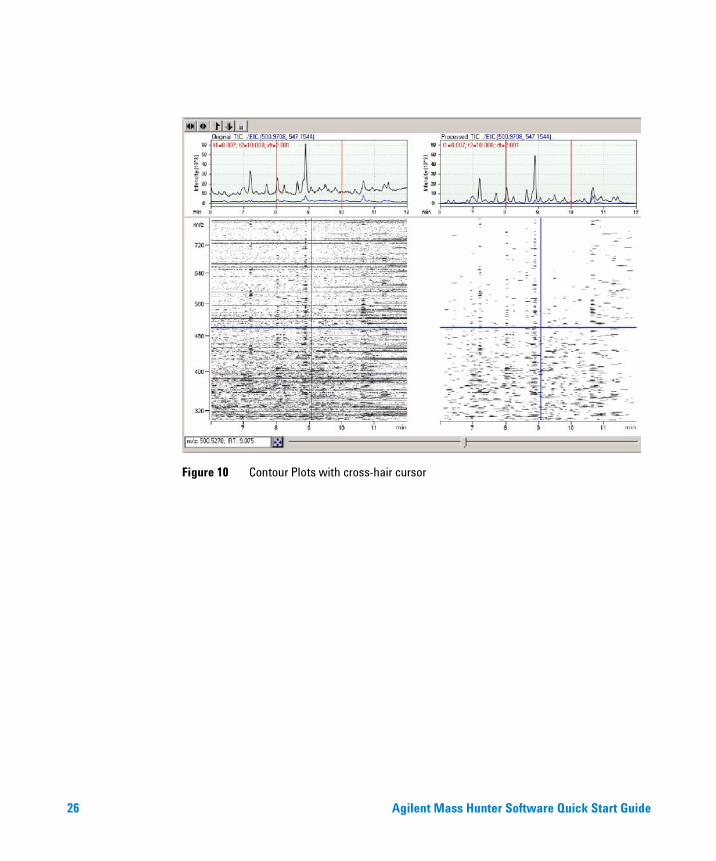
Figure 10 Contour Plots with cross-hair cursor
26 Agilent Mass Hunter Software Quick Start Guide


Agilent Technologies
© Agilent Technologies, Inc. 2005
Printed in USA First edition, September 2005
*G3297-90000*
G3297-90000
www.agilent.com
In this guide
This Quick Start Guide includes an overview of the Mass Hunter software, quick reference information to get started using the software, and a set of tutorials to learn how to use the software.