Embed Size (px)
Citation preview
M A R C H 3, 1849U
.S.
DE
PARTMENT OF THE
INTER
IOR
Aggregates from Natural and Recycled Sources
Economic Assessments for Construction Applications—A Materials Flow Analysis
By
David R. Wilburn and Thomas G. Goonan
U.S. GEOLOGICAL SURVEY CIRCULAR 1176
Any use of trade, product, or firm names in this publication is for descriptive purposes only anddoes not imply endorsement by the U.S. Government
U.S. DEPARTMENT OF THE INTERIOR
BRUCE BABBITT, Secretary
U.S. GEOLOGICAL SURVEY
Thomas J. Casadevall, Acting Director
This report is only available on-line.
http://greenwood.cr.usgs.gov/pub/circulars/c1176/c1176.html
Published in the Central Region, Denver, ColoradoManuscript approved for publication June 1, 1998Edited by Lorna CarterGraphics by David R. Wilburn and Thomas G. GoonanOn-line composition by Joan G. Nadeau
III
CONTENTS
Abstract........................................................................................................................... 1Executive Summary........................................................................................................ 1Introduction .................................................................................................................... 3Structure of the Aggregates Industry.............................................................................. 3Aggregates Processing Technology................................................................................ 6
Technical Factors Affecting Aggregates Recycling............................................... 8Transportation Factors............................................................................................ 11Locating an Aggregates Recycling Facility............................................................ 12
Costs of Producing Recycled Aggregates ...................................................................... 13Methodology........................................................................................................... 13Costs ....................................................................................................................... 13Sensitivity Analysis ................................................................................................ 19
Public Policy................................................................................................................... 24Conclusions .................................................................................................................... 26Selected References........................................................................................................ 27Appendix 1. State Concrete Recycling Activity............................................................. 29Appendix 2. Aggregates Production Technology........................................................... 31
FIGURES
1. Construction aggregates flow system .................................................................................................................... 42. Pie charts showing consumption of aggregates by source and market sector ....................................................... 53. Generalized flow diagram for an aggregates recycling operation ......................................................................... 94. Diagram illustrating locating a concrete recycling facility ................................................................................... 12
5–7. Histograms showing:5. Estimated 1996 costs for a 110,000 t/yr recycled aggregates operation........................................................ 166. Estimated 1996 costs for a 253,000 t/yr recycled aggregates operation........................................................ 17 7. Estimated 1996 costs for a 312,000 t/yr recycled aggregates operation........................................................ 18
8. Diagram showing estimated costs and revenues of recycled aggregates............................................................... 209–11. Graphs showing:
9. Profitability of a 110,000 t/yr recycled aggregates operation........................................................................ 2110. Profitability of a 253,000 t/yr recycled aggregates operation........................................................................ 2211. Profitability of a 312,000 t/yr recycled aggregates operation........................................................................ 23
12. Photograph showing typical natural aggregates operation .................................................................................... 3113. Photograph showing typical recycled aggregates operation.................................................................................. 35
TABLES
1. Significant technological aspects of natural and recycled aggregates .................................................................. 72. Material requirements for a typical highway project............................................................................................ 113. Assumptions used in this evaluation..................................................................................................................... 144. Estimated 1996 costs for recycled aggregate operations...................................................................................... 155. Crusher combinations commonly used in concrete and asphalt recycling........................................................... 36
AGGREGATES FROM NATURAL ANDRECYCLED SOURCES
Economic Assessments for Construction Applications—A Materials Flow Study
By David R. Wilburn and Thomas G. Goonan
ABSTRACT
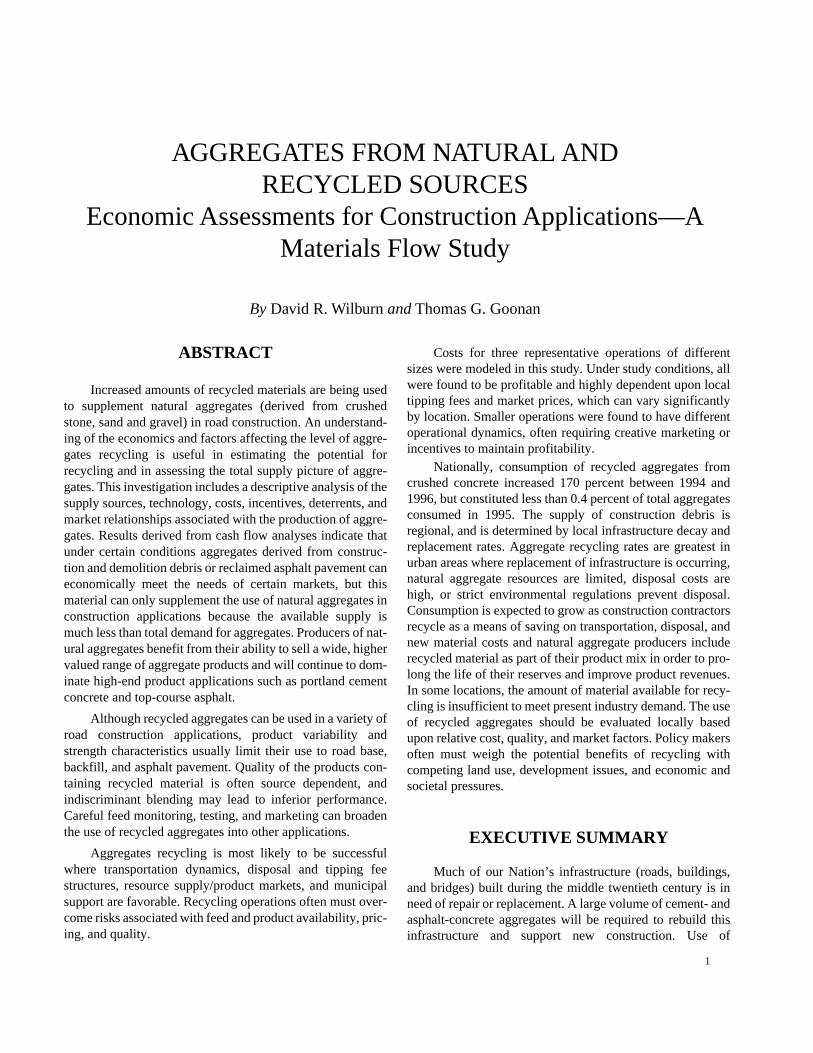
Increased amounts of recycled materials are being usedto supplement natural aggregates (derived from crushedstone, sand and gravel) in road construction. An understand-ing of the economics and factors affecting the level of aggre-gates recycling is useful in estimating the potential forrecycling and in assessing the total supply picture of aggre-gates. This investigation includes a descriptive analysis of thesupply sources, technology, costs, incentives, deterrents, andmarket relationships associated with the production of aggre-gates. Results derived from cash flow analyses indicate thatunder certain conditions aggregates derived from construc-tion and demolition debris or reclaimed asphalt pavement caneconomically meet the needs of certain markets, but thismaterial can only supplement the use of natural aggregates inconstruction applications because the available supply ismuch less than total demand for aggregates. Producers of nat-ural aggregates benefit from their ability to sell a wide, highervalued range of aggregate products and will continue to dom-inate high-end product applications such as portland cementconcrete and top-course asphalt.
Although recycled aggregates can be used in a variety ofroad construction applications, product variability andstrength characteristics usually limit their use to road base,backfill, and asphalt pavement. Quality of the products con-taining recycled material is often source dependent, andindiscriminant blending may lead to inferior performance.Careful feed monitoring, testing, and marketing can broadenthe use of recycled aggregates into other applications.
Aggregates recycling is most likely to be successfulwhere transportation dynamics, disposal and tipping feestructures, resource supply/product markets, and municipalsupport are favorable. Recycling operations often must over-come risks associated with feed and product availability, pric-ing, and quality.
Costs for three representative operations of differentsizes were modeled in this study. Under study conditions, allwere found to be profitable and highly dependent upon localtipping fees and market prices, which can vary significantlyby location. Smaller operations were found to have differentoperational dynamics, often requiring creative marketing orincentives to maintain profitability.
Nationally, consumption of recycled aggregates fromcrushed concrete increased 170 percent between 1994 and1996, but constituted less than 0.4 percent of total aggregatesconsumed in 1995. The supply of construction debris isregional, and is determined by local infrastructure decay andreplacement rates. Aggregate recycling rates are greatest inurban areas where replacement of infrastructure is occurring,natural aggregate resources are limited, disposal costs arehigh, or strict environmental regulations prevent disposal.Consumption is expected to grow as construction contractorsrecycle as a means of saving on transportation, disposal, andnew material costs and natural aggregate producers includerecycled material as part of their product mix in order to pro-long the life of their reserves and improve product revenues.In some locations, the amount of material available for recy-cling is insufficient to meet present industry demand. The useof recycled aggregates should be evaluated locally basedupon relative cost, quality, and market factors. Policy makersoften must weigh the potential benefits of recycling withcompeting land use, development issues, and economic andsocietal pressures.
EXECUTIVE SUMMARY
Much of our Nation’s infrastructure (roads, buildings,and bridges) built during the middle twentieth century is inneed of repair or replacement. A large volume of cement- andasphalt-concrete aggregates will be required to rebuild thisinfrastructure and support new construction. Use of
1

AGGREGATES FROM NATURAL AND RECYCLED SOURCES—ECONOMIC ASSESSMENTS
2
construction and demolition debris and reclaimed asphaltpavement as sources of aggregates is increasing. What arethe factors that influence the aggregates recycling industry?How much does it cost to produce recycled aggregates?What are the incentives and deterrents for recycling? Whereis the niche for recycled aggregates? These are some of thequestions addressed in this study.
What are the factors that influence the aggregatesrecycling industry?
Urbanization has generated a high demand for construc-tion aggregates and increased quantities of constructiondebris that may provide an additional source for aggregates.Recycling is impacted by local and regional conditions andmarket specifications. Relative transportation distances andcosts among construction and demolition sites, recyclers,competing natural aggregate producers, local landfills, andmarkets influence how much material is available for recy-cling and set local pricing and fee structures. Plant location,design, and efficiency can have significant impact on eco-nomic performance. The quantity, consistency, quality offeed material and a skilled labor force also affect plant effi-ciency and market options available to the recycler. Costsassociated with equipment, labor, and overhead are impor-tant to operational economics, but revenues generated byproduct pricing and tipping fees are even more significant.There will continue to be opportunities for new entrants, butadding new recycling capacity to a market with limitedresources impacts the profitability of all participants.
How much does it cost to produce recycled aggregates?Entry into the aggregates recycling business requires a
capital investment of $4 to $8 per metric ton of annual capac-ity, a cost that is most significant for a small producerbecause of economies of scale. Processing costs for theaggregates recycler range from about $2.50 to $6 per metricton. Operating rate and revenues generated from tippingcharges and product prices are the most important factorsaffecting profitability, but can vary considerably by opera-tion and region. Transportation costs associated with feed-stock acquisition, while significant to regional dynamics ofthe industry, were assumed to indirectly affect profitabilityof a recycler, because such costs are typically incurred by aconstruction contractor that supplies material rather than therecycler, which processes that material.
Cash flow analyses indicate that all operations exceptthe small recycler could achieve at least a 12 percent rate ofreturn on total investment. Most larger recyclers are moreprofitable under study conditions because of economies ofscale. Recycling operations benefit from tipping fee revenuesand relatively low net production costs. Where market forcespermit, smaller recyclers can, for example, increase theireconomic viability by increasing tipping fees or charginghigher product prices, or by positioning themselves to gaintransportation cost advantages over competitors, acting as
subcontractors, operating ad-hoc supplementary businesses,or receiving government subsidies or recycling mandates.Economic benefits for a natural aggregates producer to beginrecycling are substantial.
What are the incentives and deterrents for recycling?The success of aggregates recycling varies by region
and municipality. Recycling may reduce the amount of con-struction debris disposed of in landfills, may reduce the rateof natural resource depletion and environmental disturbance,and has the potential to provide energy and cost savings.Mobile, job-site recycling is becoming common for largerconstruction projects as a means of avoiding high transporta-tion, disposal, and new material costs. Successful operationsmust have a favorable transportation and tipping fee structurewhen compared to alternatives. An abundant local supplyand varied markets make it easy and financially attractive forthe supplier and construction contractor, and can provide anincrease in economic activity to the local community.
A recycling operation may not be the most appropriatealternative in all situations. Without proper site design andlayout, equipment and operator efficiency, and creative mar-keting, many recycling operations could easily fail. An abun-dant supply of consistent feed material is essential. Highcapital requirements, inadequate public support, and qualityproblems or perceptions can also make it difficult for a recy-cler to compete effectively. Recyclers often have little con-trol over product demand and pricing, which are influencedby the amount of natural aggregates locally available.
Where is the niche for recycled aggregates?Natural aggregate producers benefit from their ability to
sell a wide, higher valued range of aggregate products andwill continue to dominate high-end product applications suchas portland cement concrete and top-course asphalt. Pres-ently the recycling rate for asphalt pavement is approxi-mately 85 percent. Recycled aggregates are, however,increasingly being used to supplement natural aggregates inroad construction in a variety of applications; 44 States allowtheir use in road base applications, 15 States for backfill, 8States for portland cement mix, and 7 States for top-courseasphalt and selected other applications. Recycled aggregatesare commonly used in lower quality product applicationssuch as road base, where recycled aggregates meet or exceedState specifications. This material is presently often not con-sidered acceptable for higher quality product applicationssuch as high-strength concrete because of performance con-siderations and perception of some decision makers.
Aggregate recycling rates are greatest in urban areaswhere replacement of infrastructure is occurring, naturalaggregate resources are limited, disposal costs are high, orstrict environmental regulations prevent disposal. Consump-tion is expected to grow as construction contractors recycleas a means of saving on transportation, disposal, and newmaterial costs and aggregate producers include recycled
3
STRUCTURE OF THE AGGREGATES INDUSTRY
material in order to prolong the life of their reserves andimprove product mix. In some locations, the amount ofmaterial available for recycling is insufficient to meetpresent industry demand. Although recycled aggregates area supplement or substitution for natural aggregates inselected road applications, their use should be evaluatedlocally based upon relative cost, quality, and market factors.Policy makers often must weigh the potential benefits ofrecycling with competing land use, development issues, andsocietal pressures.
This study is intended to provide insights for resourcedecision making and provide a framework for future studieson construction materials, a vital sector in the U.S. economy.Further research is needed to improve quality or expand mar-kets of recycled aggregates, but limits to locally availableconstruction debris could restrict significant growth in theuse of recycled aggregates in construction. Additional workis also needed to determine local future supply of such mate-rial. Improved technology in combination with expandededucation, specification changes, or legislative mandatescould make the use of recycled aggregates a more attractiveoption and broaden product markets.
INTRODUCTION
Since the beginning of the twentieth century, ourNation’s infrastructure has grown tremendously. Much ofthe core infrastructure, including roads, bridges, water sys-tems, and sewers, was put in place during the first half of thiscentury. The Interstate Highway System was constructedduring the 1950’s, 1960’s, and 1970’s. Much of this infra-structure has now deteriorated to a point that extensive repairor replacement is required. In areas of rapid populationgrowth, new infrastructure is necessary to meet growingneeds.
Construction materials in general, and aggregates inparticular, are important components of infrastructure.Development and extraction of natural aggregate resources(primarily crushed stone and sand and gravel) are increas-ingly being constrained by urbanization, zoning regulations,increased costs, and environmental concerns, while use ofrecycled materials from roads and buildings is growing as asupplement to natural aggregates in road construction. Recy-cling represents one way to convert a waste product into aresource. It has the potential to (1) extend the life of naturalresources by supplementing resource supply, (2) reduceenvironmental disturbance around construction sites, and (3)enhance sustainable development of our natural resources.
This study was undertaken to provide an understandingof the options for aggregates supply in construction. Techni-cal and economic information on the aggregates recyclingindustry is developed in order to analyze the factors influ-encing aggregates recycling, determine why recycling isoccurring, and assess the effects of recycling on the natural
aggregates industry. Although data on aggregates recyclingare available, no concise data source exists for this importantemerging industry. A discussion of the technological, social,and economic factors influencing this industry is intended toprovide background information for informed decisions bythose interacting with this industry (operators, suppliers,consumers, or regulators), and for those interested in devel-oping sustainable U.S. natural resource and land-use plan-ning and policies.
Related work currently being conducted by the U.S.Geological Survey (USGS) includes the Aggregates Auto-mation conference, the Construction Debris Recycling con-ference, Construction Materials Flow studies, the Mid-Atlantic Geology and Infrastructure Case Study, Infrastruc-ture project studies, and the Front Range Corridor Initiative.For information on any of these projects access the WorldWide Web (WWW) at:
http://minerals.er.usgs.gov/minerals/pubs/commodity/aggregates
or direct inquiries to the Minerals Information Team, 983National Center, U.S. Geological Survey, Reston, VA20192; telephone 703-648-6941.
Information for this study was gathered from a varietyof published sources, site visits, and personal contacts. Costdata were developed from representative industry data.Appreciation is conveyed to Russel Hawkins of Allied Recy-cled Aggregates, Larry Horwedel of Excel Recycling &Manufacturing, Inc., William Langer, USGS, and GregoryNorris of Sylvatica Inc. for their contributions of data andtechnical reviews of this paper.
Specific cost assumptions are documented. Costs andprices for the Denver, Colo., metropolitan area were used insome cases to represent the industry. Although costs andprices in other regions of the country may differ from thoseassumed in this study, inferences using values different fromthose used in this study are presented.
STRUCTURE OF THEAGGREGATES INDUSTRY
Aggregates are defined in this study as materials, eithernatural or manufactured, that are either crushed and com-bined with a binding agent to form bituminous or cementconcrete, or treated alone to form products such as railroadballast, filter beds, or fluxed material (Langer, 1988). Themost common forms of concrete are prepared using portlandcement and asphalt as binding agents. About 87 percent ofportland cement concrete and about 95 percent of asphalticconcrete are composed of aggregates (Herrick, 1994).
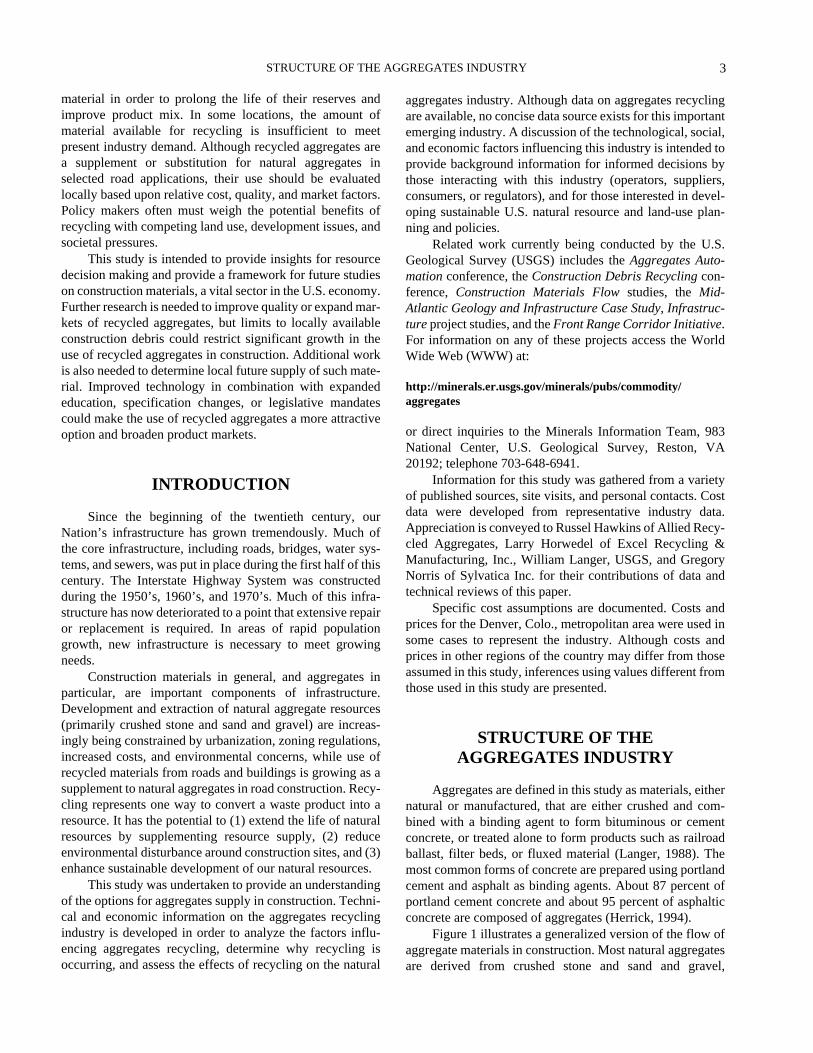
Figure 1 illustrates a generalized version of the flow ofaggregate materials in construction. Most natural aggregatesare derived from crushed stone and sand and gravel,
AG
GR
EG
AT
ES FR
OM
NA
TU
RA
L A
ND
RE
CY
CL
ED
SOU
RC
ES—
EC
ON
OM
IC A
SSESSM
EN
TS
4
Naturalaggregates
Supply
Recycledaggregates
Demand
Roads&
bridges
Residual
Recycle
Dissipativelosses
Air
Water
Soils
Landfill
Residentialconstruction
Commercialconstruction
Figure 1.
Construction aggregates flow system.
5
STRUCTURE OF THE AGGREGATES INDUSTRY
recovered from widespread, naturally occurring mineraldeposits. Vertical arrows represent losses to the environ-ment, which occur throughout the flow system. More than 2billion metric tons (tons1) of crushed stone and sand andgravel were consumed as aggregates in the United States in1996, much of which was used in road construction andmaintenance (Tepordei, 1997a; Bolen, 1997). Recycledmaterial used to produce construction aggregates for con-crete comes from two primary sources: (1) road constructionand maintenance debris, and (2) structural construction anddemolition debris (for example, from demolished buildings,
1For this study, all figures have been reported in metric units in accor-dance with USGS practice. The term “tons” is used to refer to the metric tonunit of 2,205 pounds.
27%
22%
18%
26%
7%
43%
4%
3%
50%
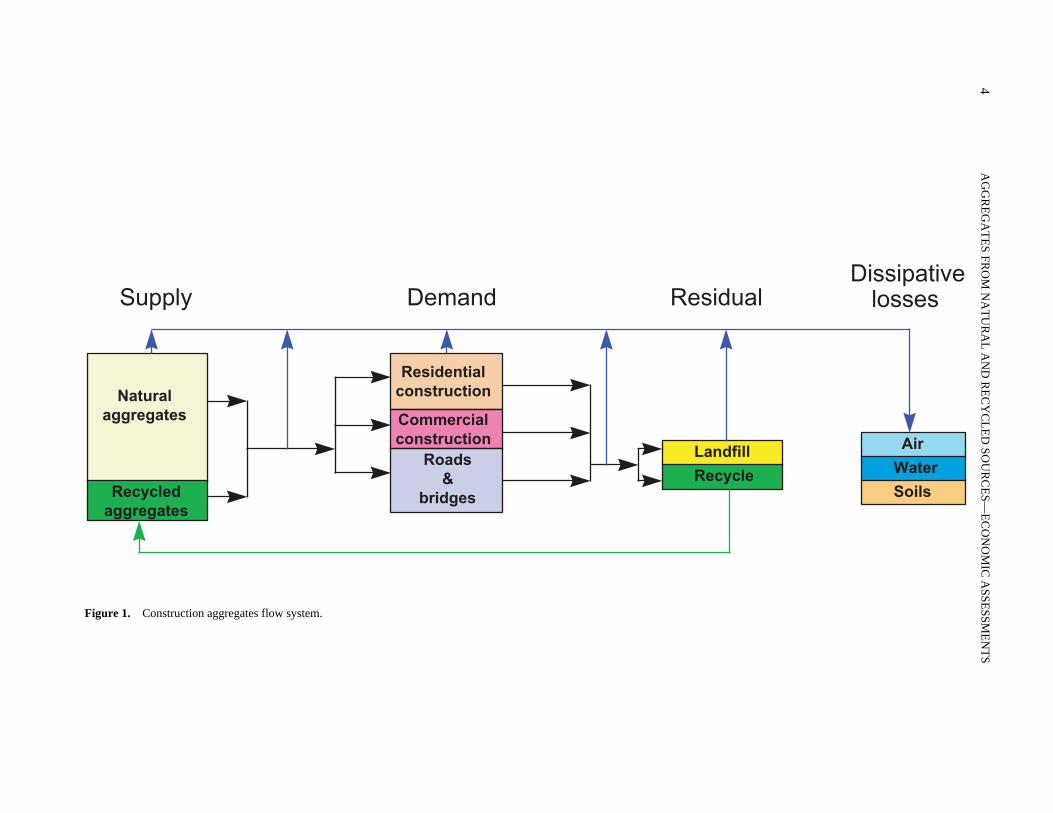
Crushed stone1.11 billion tons1 (1996)
Cement concrete debris14.5 million tons2 (1996)
Portlandcement
concrete
Roadbase
Asphalticconcrete
1 Data reported in metric tons and derived fr2 Estimates reported in metric tons derived fr
Figure 2. Consumption of aggregates by source and market secto
bridges, and airport runways). Virtually all the asphalt forrecycling comes from roads and parking lots. Some asphalticconcrete is milled and relaid as base material in place, butmost recycled material goes through the process of recovery(demolition, breaking, and collecting), transportation (to alocal collection point), processing (crushing, screening, sep-arating, and stockpiling), and marketing (as sized productswith multiple uses). Recycled aggregates currently accountfor less than 1 percent of the total demand for constructionaggregates, but the amount recycled is thought to be increas-ing. Precise consumption statistics for the recycled materialsare not available, but estimates for each source and marketsector are shown in figure 2. A more detailed analysis of con-struction aggregates substitution is currently being con-ducted by the USGS.
23%
14%
45%
5%
13%
8%
72%
20%
Sand and gravel859 million tons1 (1996)
Asphalt pavement debris91 million tons2 (1996)
Generalfill
Other To landfill
om Tepordei, 1997a; Bolen, 1997.om various USGS and industry sources.
r.
AGGREGATES FROM NATURAL AND RECYCLED SOURCES—ECONOMIC ASSESSMENTS
6
As shown in figure 2, most of the demand for aggregatesis supplied by sand and gravel or crushed stone producers.Aggregates derived from crushed stone are consumed inportland cement concrete, road base, asphaltic concrete, andother applications, whereas almost half of the aggregatesderived from sand and gravel is consumed in portland cementconcrete. Currently, more than 50 percent of all cement con-crete debris and about 20 percent of all asphalt pavementdebris end up in landfills. An estimated 85 percent of allcement concrete debris that is recycled is used as road base,with minor amounts used in asphaltic concrete and fill mate-rial. About 90 percent of asphalt pavement debris that is recy-cled is reused to make asphaltic concrete.
As costs, regulations, land-use policies, and socialacceptance of more sustainable natural resource practiceshave a greater impact on the natural aggregates industry,increased aggregates recycling in urban areas is likely tooccur. Producers of natural aggregates and independententrepreneurs are beginning to consider the recycling of con-struction and demolition debris as one option for materialuse, as it has the potential to (1) extend the life of naturalresources by supplementing resource supply, (2) reduceenvironmental disturbance around construction sites, and (3)enhance sustainable development of our naturalresources—yet it can be profitable. In some urban areas,recycling of concrete and asphalt has reduced the flow ofwaste to landfill areas and reduced road construction andmaintenance costs. In less urbanized areas, aggregates recy-cling is expensive or impractical on a large scale. Because ofthe high transportation cost associated with disposal of con-struction waste materials and the demand for this material innew construction, the aggregates recycling industry has
developed locally or regionally, most often in urban areas. Aseach region has its own particular needs, a thorough under-standing of factors affecting the aggregates industry in a par-ticular area is necessary to determine whether aggregatesrecycling is advantageous.
Because the aggregates industry is a high-volume, low-unit-value industry, a small variation in operation economicscan have a significant impact on the profitability of an oper-ation. Entry into this business often requires significant cap-ital investment, particularly for small operators, andequipment suitable for processing natural aggregates maynot be suitable for processing recycled aggregates. The rela-tive distance and associated cost of transporting materialbetween construction, mining, processing, and disposal(landfill) sites influence production site location.
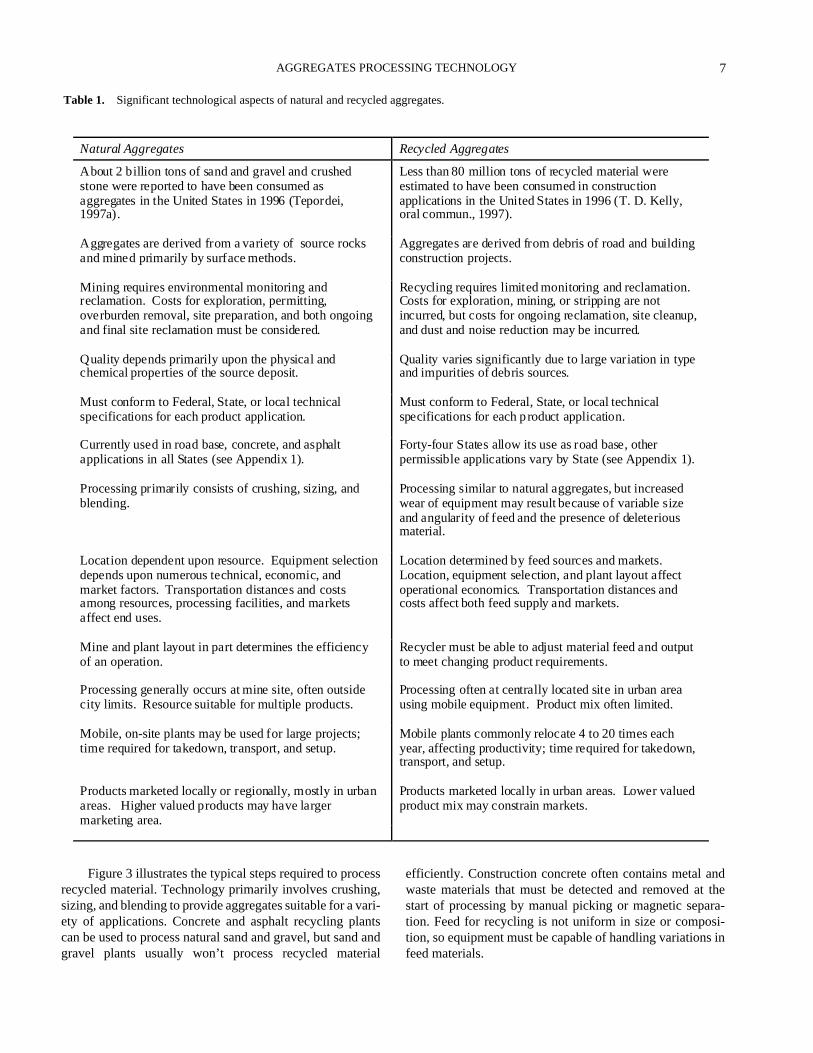
AGGREGATES PROCESSING TECHNOLOGY
The technology required for raw material acquisitionand processing of aggregates from both natural and recycledsources is summarized in table 1, which focuses on technicalfactors that provide both incentives and deterrents to aggre-gates recycling. A detailed description of processing technol-ogy and the technical factors influencing equipmentselection are reported in Appendix 2 for the production ofaggregates from crushed stone, sand and gravel, recycledaggregates from concrete, and recycled aggregates fromreclaimed asphalt pavement.
7
AGGREGATES PROCESSING TECHNOLOGY
Natural Aggregates Recycled Aggregates
About 2 billion tons of sand and gravel and crushedstone were reported to have been consumed asaggregates in the United States in 1996 (Tepordei,1997a).
Less than 80 million tons of recycled material wereestimated to have been consumed in constructionapplications in the United States in 1996 (T. D. Kelly,oral commun., 1997).
Aggregates are derived from a variety of source rocksand mined primarily by surface methods.
Aggregates are derived from debris of road and buildingconstruction projects.
Mining requires environmental monitoring andreclamation. Costs for exploration, permitting,overburden removal, site preparation, and both ongoingand final site reclamation must be considered.
Recycling requires limited monitoring and reclamation.Costs for exploration, mining, or stripping are notincurred, but costs for ongoing reclamation, site cleanup,and dust and noise reduction may be incurred.
Quality depends primarily upon the physical andchemical properties of the source deposit.
Quality varies significantly due to large variation in typeand impurities of debris sources.
Must conform to Federal, State, or local technicalspecifications for each product application.
Must conform to Federal, State, or local technicalspecifications for each product application.
Currently used in road base, concrete, and asphaltapplications in all States (see Appendix 1).
Forty-four States allow its use as road base, otherpermissible applications vary by State (see Appendix 1).
Processing primarily consists of crushing, sizing, andblending.
Processing similar to natural aggregates, but increasedwear of equipment may result because of variable sizeand angularity of feed and the presence of deleteriousmaterial.
Location dependent upon resource. Equipment selectiondepends upon numerous technical, economic, andmarket factors. Transportation distances and costsamong resources, processing facilities, and marketsaffect end uses.
Location determined by feed sources and markets.Location, equipment selection, and plant layout affectoperational economics. Transportation distances andcosts affect both feed supply and markets.
Mine and plant layout in part determines the efficiencyof an operation.
Recycler must be able to adjust material feed and outputto meet changing product requirements.
Processing generally occurs at mine site, often outsidecity limits. Resource suitable for multiple products.
Processing often at centrally located site in urban areausing mobile equipment. Product mix often limited.
Mobile, on-site plants may be used for large projects;time required for takedown, transport, and setup.
Mobile plants commonly relocate 4 to 20 times eachyear, affecting productivity; time required for takedown,transport, and setup.
Products marketed locally or regionally, mostly in urbanareas. Higher valued products may have largermarketing area.
Products marketed locally in urban areas. Lower valuedproduct mix may constrain markets.
Table 1.
Significant technological aspects of natural and recycled aggregates.
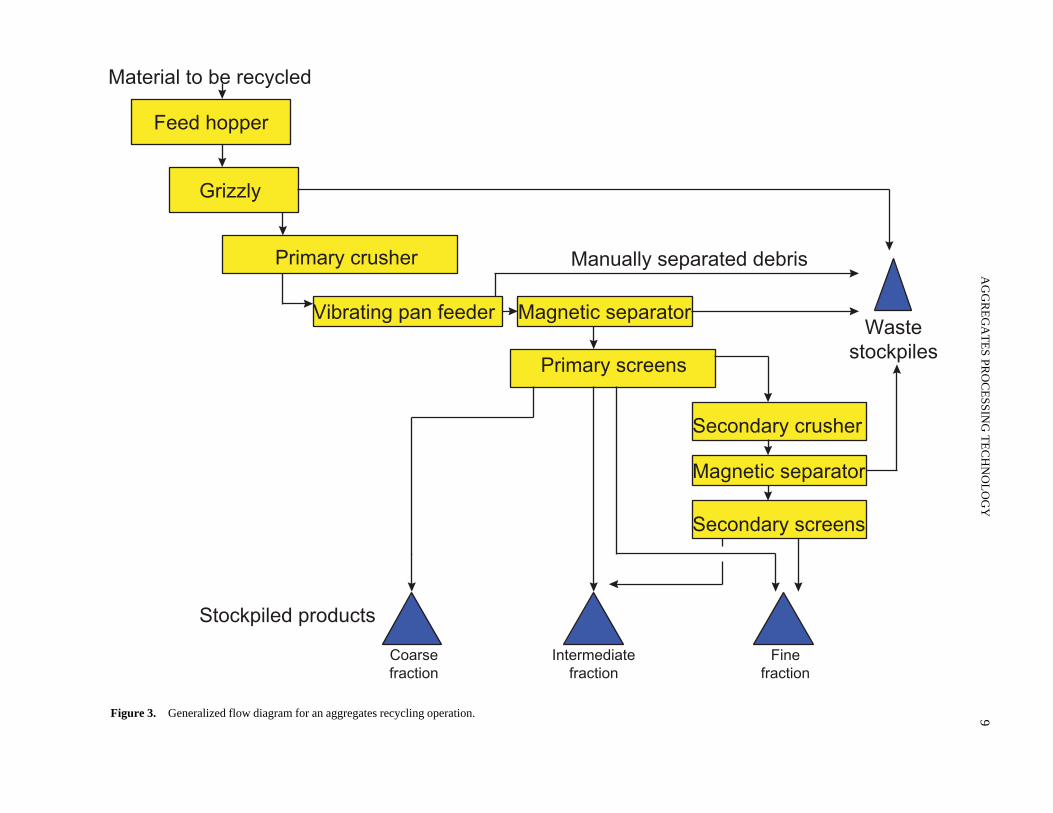
Figure 3 illustrates the typical steps required to processrecycled material. Technology primarily involves crushing,sizing, and blending to provide aggregates suitable for a vari-ety of applications. Concrete and asphalt recycling plantscan be used to process natural sand and gravel, but sand andgravel plants usually won’t process recycled material
efficiently. Construction concrete often contains metal andwaste materials that must be detected and removed at thestart of processing by manual picking or magnetic separa-tion. Feed for recycling is not uniform in size or composi-tion, so equipment must be capable of handling variations infeed materials.
AGGREGATES FROM NATURAL AND RECYCLED SOURCES—ECONOMIC ASSESSMENTS
8
TECHNICAL FACTORS AFFECTINGAGGREGATES RECYCLING
Based upon data from reference documents, personalcommunications, and site visits, the following technical fac-tors were determined to affect the profitability of anaggregates recycling operation. All factors don’t alwaysapply, but they have been found to apply in many cases.
Product Sizes:
Screen product-size distributions determinethe amount of each product available for sale. Regional sup-ply and demand considerations often dictate local prices forvarious size products. Because different products have dif-ferent values in any given market, the operation that is ableto market high-value size distributions is likely to improve itscash flow position. Screen configuration can be adjustable toreflect changing market conditions for different size prod-ucts. Experienced operators have the ability to maximizeproduction of high-value products and to respond to changesin product requirements.
Operational Design:
In order to maximize efficiency andprofitability, careful consideration must be given to opera-
tional layout and design, production capacity, and equipmentsizing. Although economy-of-scale efficiencies benefitlarger operations, the higher capital cost of equipment andthe limited availability of feed material may limit the size ofan operation. Equipment configuration also affects productmix (what products are produced; mixes of products) andplant efficiency. Equipment selection is influenced by thedecision on whether to be a fixed or mobile recycler. Mobileplants must meet roadway restrictions to be allowed to movefrom site to site. Fixed site equipment can be somewhatlarger and perhaps more durable, thereby trading off lowerunit production costs with reduced transportation costs forthe mobile unit. Busse (1993, p. 52) explained, “The smallerprocessing plants are a great concept. They work well forasphalt recycling. But for concrete, the preparation cost isenormous when using small crushers because the materialneeds to be broken down tremendously. If only flat work orroadwork is being processed, perhaps it can be done. Ifbridges, parapets, demolition debris, or building columns arebeing processed, the small plants won’t work. The wear costis too high.”
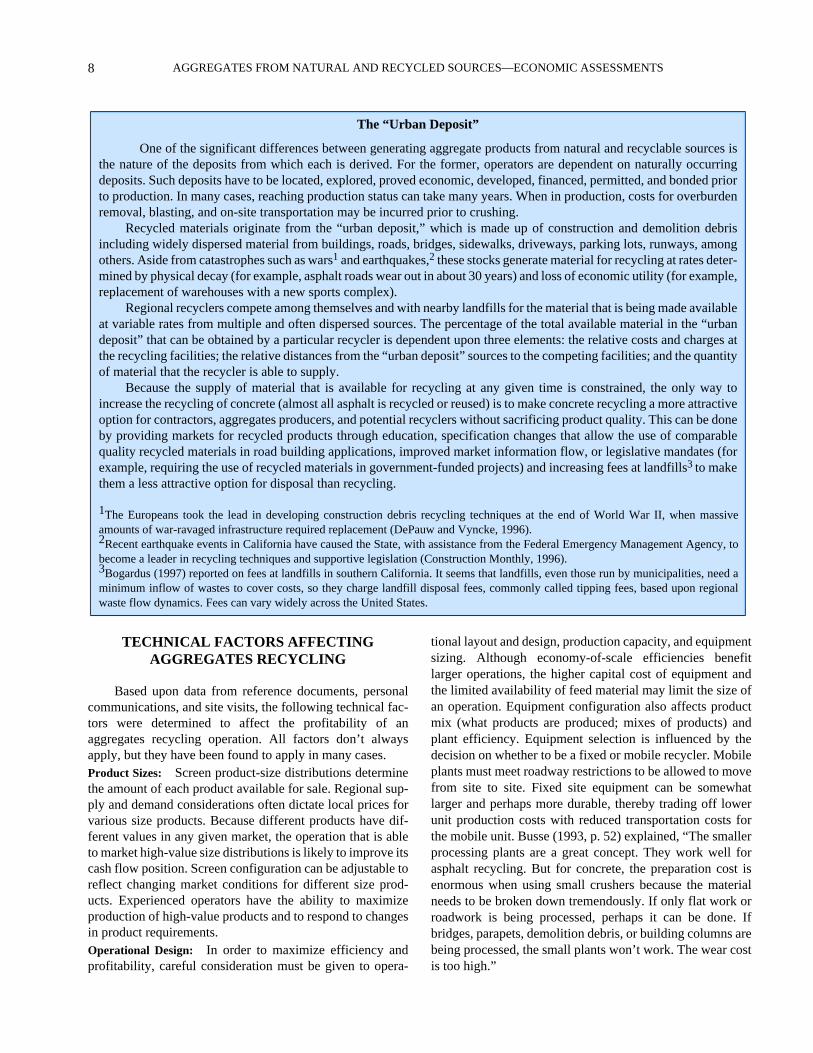
The “Urban Deposit”
One of the significant differences between generating aggregate products from natural and recyclable sources isthe nature of the deposits from which each is derived. For the former, operators are dependent on naturally occurringdeposits. Such deposits have to be located, explored, proved economic, developed, financed, permitted, and bonded priorto production. In many cases, reaching production status can take many years. When in production, costs for overburdenremoval, blasting, and on-site transportation may be incurred prior to crushing.
Recycled materials originate from the “urban deposit,” which is made up of construction and demolition debrisincluding widely dispersed material from buildings, roads, bridges, sidewalks, driveways, parking lots, runways, amongothers. Aside from catastrophes such as wars
1
and earthquakes,
2
these stocks generate material for recycling at rates deter-mined by physical decay (for example, asphalt roads wear out in about 30 years) and loss of economic utility (for example,replacement of warehouses with a new sports complex).
Regional recyclers compete among themselves and with nearby landfills for the material that is being made availableat variable rates from multiple and often dispersed sources. The percentage of the total available material in the “urbandeposit” that can be obtained by a particular recycler is dependent upon three elements: the relative costs and charges atthe recycling facilities; the relative distances from the “urban deposit” sources to the competing facilities; and the quantityof material that the recycler is able to supply.
Because the supply of material that is available for recycling at any given time is constrained, the only way toincrease the recycling of concrete (almost all asphalt is recycled or reused) is to make concrete recycling a more attractiveoption for contractors, aggregates producers, and potential recyclers without sacrificing product quality. This can be doneby providing markets for recycled products through education, specification changes that allow the use of comparablequality recycled materials in road building applications, improved market information flow, or legislative mandates (forexample, requiring the use of recycled materials in government-funded projects) and increasing fees at landfills
3
to makethem a less attractive option for disposal than recycling.
1The Europeans took the lead in developing construction debris recycling techniques at the end of World War II, when massiveamounts of war-ravaged infrastructure required replacement (DePauw and Vyncke, 1996).2Recent earthquake events in California have caused the State, with assistance from the Federal Emergency Management Agency, tobecome a leader in recycling techniques and supportive legislation (Construction Monthly, 1996).3Bogardus (1997) reported on fees at landfills in southern California. It seems that landfills, even those run by municipalities, need aminimum inflow of wastes to cover costs, so they charge landfill disposal fees, commonly called tipping fees, based upon regionalwaste flow dynamics. Fees can vary widely across the United States.
9
AG
GR
EG
AT
ES PR
OC
ESSIN
G T
EC
HN
OL
OG
Y
Grizzly
Feed hopper
Primary crusher
Magnetic separator
Primary screens
Secondary crusher
Stockpiled products
Material to be recycled
Wastestockpiles
Secondary screens
Coarsefraction
Intermediatefraction
Finefraction
Vibrating pan feeder
Magnetic separator
Manually separated debris
Figure 3.
Generalized flow diagram for an aggregates recycling operation.
AGGREGATES FROM NATURAL AND RECYCLED SOURCES—ECONOMIC ASSESSMENTS
10
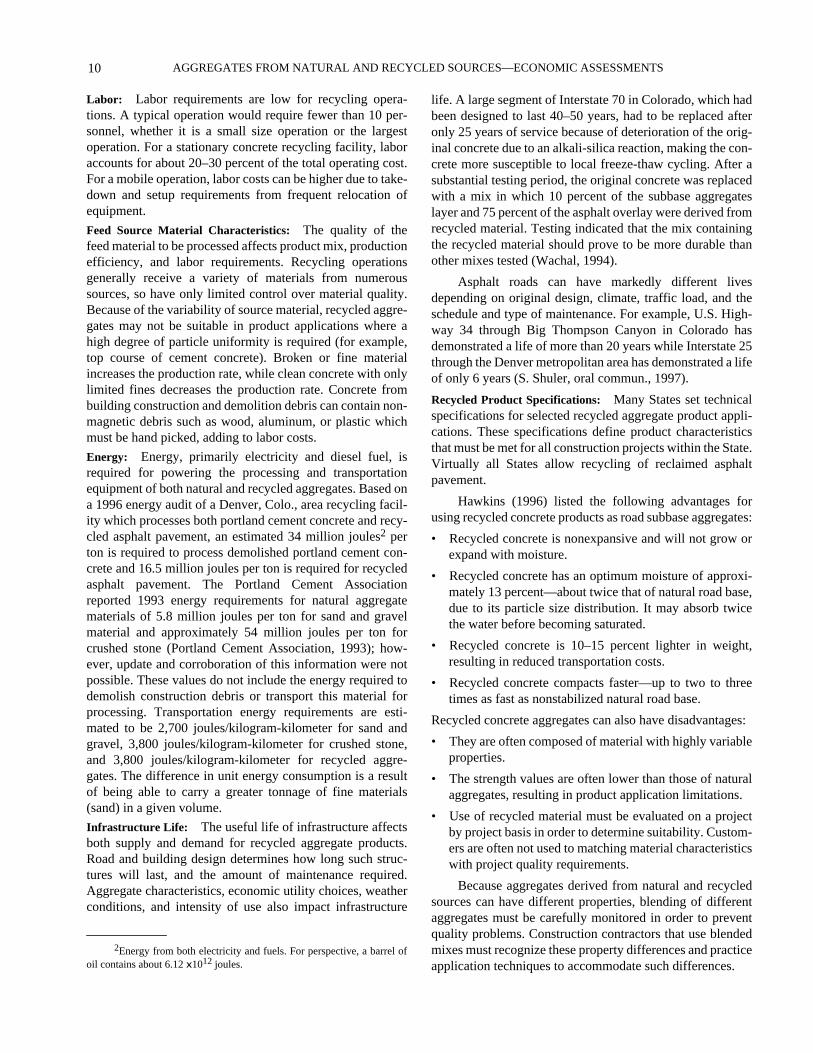
Labor: Labor requirements are low for recycling opera-tions. A typical operation would require fewer than 10 per-sonnel, whether it is a small size operation or the largestoperation. For a stationary concrete recycling facility, laboraccounts for about 20–30 percent of the total operating cost.For a mobile operation, labor costs can be higher due to take-down and setup requirements from frequent relocation ofequipment.
Feed Source Material Characteristics: The quality of thefeed material to be processed affects product mix, productionefficiency, and labor requirements. Recycling operationsgenerally receive a variety of materials from numeroussources, so have only limited control over material quality.Because of the variability of source material, recycled aggre-gates may not be suitable in product applications where ahigh degree of particle uniformity is required (for example,top course of cement concrete). Broken or fine materialincreases the production rate, while clean concrete with onlylimited fines decreases the production rate. Concrete frombuilding construction and demolition debris can contain non-magnetic debris such as wood, aluminum, or plastic whichmust be hand picked, adding to labor costs.
Energy: Energy, primarily electricity and diesel fuel, isrequired for powering the processing and transportationequipment of both natural and recycled aggregates. Based ona 1996 energy audit of a Denver, Colo., area recycling facil-ity which processes both portland cement concrete and recy-cled asphalt pavement, an estimated 34 million joules2 perton is required to process demolished portland cement con-crete and 16.5 million joules per ton is required for recycledasphalt pavement. The Portland Cement Associationreported 1993 energy requirements for natural aggregatematerials of 5.8 million joules per ton for sand and gravelmaterial and approximately 54 million joules per ton forcrushed stone (Portland Cement Association, 1993); how-ever, update and corroboration of this information were notpossible. These values do not include the energy required todemolish construction debris or transport this material forprocessing. Transportation energy requirements are esti-mated to be 2,700 joules/kilogram-kilometer for sand andgravel, 3,800 joules/kilogram-kilometer for crushed stone,and 3,800 joules/kilogram-kilometer for recycled aggre-gates. The difference in unit energy consumption is a resultof being able to carry a greater tonnage of fine materials(sand) in a given volume.
Infrastructure Life: The useful life of infrastructure affectsboth supply and demand for recycled aggregate products.Road and building design determines how long such struc-tures will last, and the amount of maintenance required.Aggregate characteristics, economic utility choices, weatherconditions, and intensity of use also impact infrastructure
2Energy from both electricity and fuels. For perspective, a barrel ofoil contains about 6.12 x10¹² joules.
life. A large segment of Interstate 70 in Colorado, which hadbeen designed to last 40–50 years, had to be replaced afteronly 25 years of service because of deterioration of the orig-inal concrete due to an alkali-silica reaction, making the con-crete more susceptible to local freeze-thaw cycling. After asubstantial testing period, the original concrete was replacedwith a mix in which 10 percent of the subbase aggregateslayer and 75 percent of the asphalt overlay were derived fromrecycled material. Testing indicated that the mix containingthe recycled material should prove to be more durable thanother mixes tested (Wachal, 1994).
Asphalt roads can have markedly different livesdepending on original design, climate, traffic load, and theschedule and type of maintenance. For example, U.S. High-way 34 through Big Thompson Canyon in Colorado hasdemonstrated a life of more than 20 years while Interstate 25through the Denver metropolitan area has demonstrated a lifeof only 6 years (S. Shuler, oral commun., 1997).
Recycled Product Specifications: Many States set technicalspecifications for selected recycled aggregate product appli-cations. These specifications define product characteristicsthat must be met for all construction projects within the State.Virtually all States allow recycling of reclaimed asphaltpavement.
Hawkins (1996) listed the following advantages forusing recycled concrete products as road subbase aggregates:
• Recycled concrete is nonexpansive and will not grow orexpand with moisture.
• Recycled concrete has an optimum moisture of approxi-mately 13 percent—about twice that of natural road base,due to its particle size distribution. It may absorb twicethe water before becoming saturated.
• Recycled concrete is 10–15 percent lighter in weight,resulting in reduced transportation costs.
• Recycled concrete compacts faster—up to two to threetimes as fast as nonstabilized natural road base.
Recycled concrete aggregates can also have disadvantages:
• They are often composed of material with highly variableproperties.
• The strength values are often lower than those of naturalaggregates, resulting in product application limitations.
• Use of recycled material must be evaluated on a projectby project basis in order to determine suitability. Custom-ers are often not used to matching material characteristicswith project quality requirements.
Because aggregates derived from natural and recycledsources can have different properties, blending of differentaggregates must be carefully monitored in order to preventquality problems. Construction contractors that use blendedmixes must recognize these property differences and practiceapplication techniques to accommodate such differences.
11
AGGREGATES PROCESSING TECHNOLOGY
Layer thicknessof typical 1.6-kmlength of 4-lanehighway
Amount ofmaterial perkilometer ofconstruction(tons)1
Average f.o.b.2
price ($/ton)Total materialcost ($)
Transportationcost (56 km;$0.13/ton/km)
Total cost($/ton)
Percent of totalcost related totransportation
12.7 cm asphalt 8,700 $28.66 $249,000 $63,000 $312,000 20%
130 cm crushedgravel
14,400 $7.72 $111,000 $105,000 $216,000 49%
30 cm gravel 14,900 $5.51 $82,000 $108,000 $190,000 57%
15-61 cm sand 27,900 $5.51 $154,000 $203,000 $357,000 57%
Base course(borrow)
TOTAL
≤6,900
72,700
NA3
NA
NA
$596,000
NA
$479,000
NA
$1,075,000
NA
45%
1 The term “tons” refers to the metric ton unit of 2,205 pounds.2 f.o.b., Free on board, processing plant.3 NA, Not available.Adapted from Socolow, 1995.
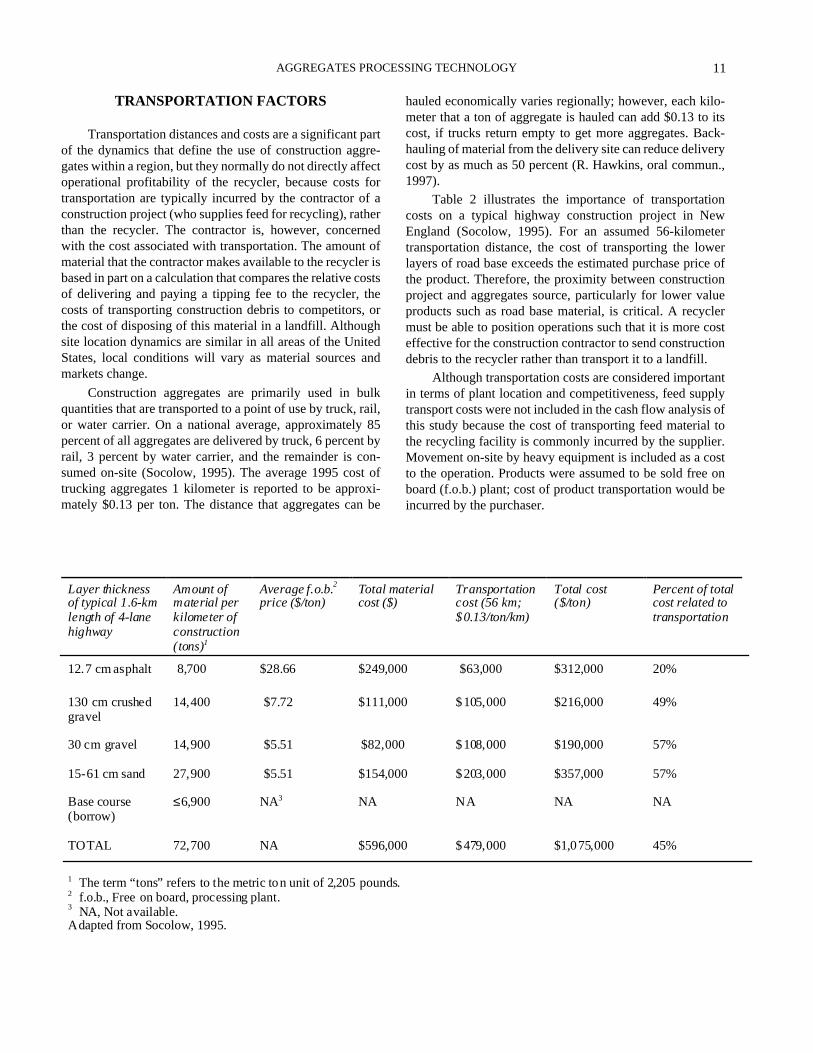
TRANSPORTATION FACTORS
Transportation distances and costs are a significant partof the dynamics that define the use of construction aggre-gates within a region, but they normally do not directly affectoperational profitability of the recycler, because costs fortransportation are typically incurred by the contractor of aconstruction project (who supplies feed for recycling), ratherthan the recycler. The contractor is, however, concernedwith the cost associated with transportation. The amount ofmaterial that the contractor makes available to the recycler isbased in part on a calculation that compares the relative costsof delivering and paying a tipping fee to the recycler, thecosts of transporting construction debris to competitors, orthe cost of disposing of this material in a landfill. Althoughsite location dynamics are similar in all areas of the UnitedStates, local conditions will vary as material sources andmarkets change.
Construction aggregates are primarily used in bulkquantities that are transported to a point of use by truck, rail,or water carrier. On a national average, approximately 85percent of all aggregates are delivered by truck, 6 percent byrail, 3 percent by water carrier, and the remainder is con-sumed on-site (Socolow, 1995). The average 1995 cost oftrucking aggregates 1 kilometer is reported to be approxi-mately $0.13 per ton. The distance that aggregates can be
hauled economically varies regionally; however, each kilo-meter that a ton of aggregate is hauled can add $0.13 to itscost, if trucks return empty to get more aggregates. Back-hauling of material from the delivery site can reduce deliverycost by as much as 50 percent (R. Hawkins, oral commun.,1997).
Table 2 illustrates the importance of transportationcosts on a typical highway construction project in NewEngland (Socolow, 1995). For an assumed 56-kilometertransportation distance, the cost of transporting the lowerlayers of road base exceeds the estimated purchase price ofthe product. Therefore, the proximity between constructionproject and aggregates source, particularly for lower valueproducts such as road base material, is critical. A recyclermust be able to position operations such that it is more costeffective for the construction contractor to send constructiondebris to the recycler rather than transport it to a landfill.
Although transportation costs are considered importantin terms of plant location and competitiveness, feed supplytransport costs were not included in the cash flow analysis ofthis study because the cost of transporting feed material tothe recycling facility is commonly incurred by the supplier.Movement on-site by heavy equipment is included as a costto the operation. Products were assumed to be sold free onboard (f.o.b.) plant; cost of product transportation would beincurred by the purchaser.
AGGREGATES FROM NATURAL AND RECYCLED SOURCES—ECONOMIC ASSESSMENTS
12
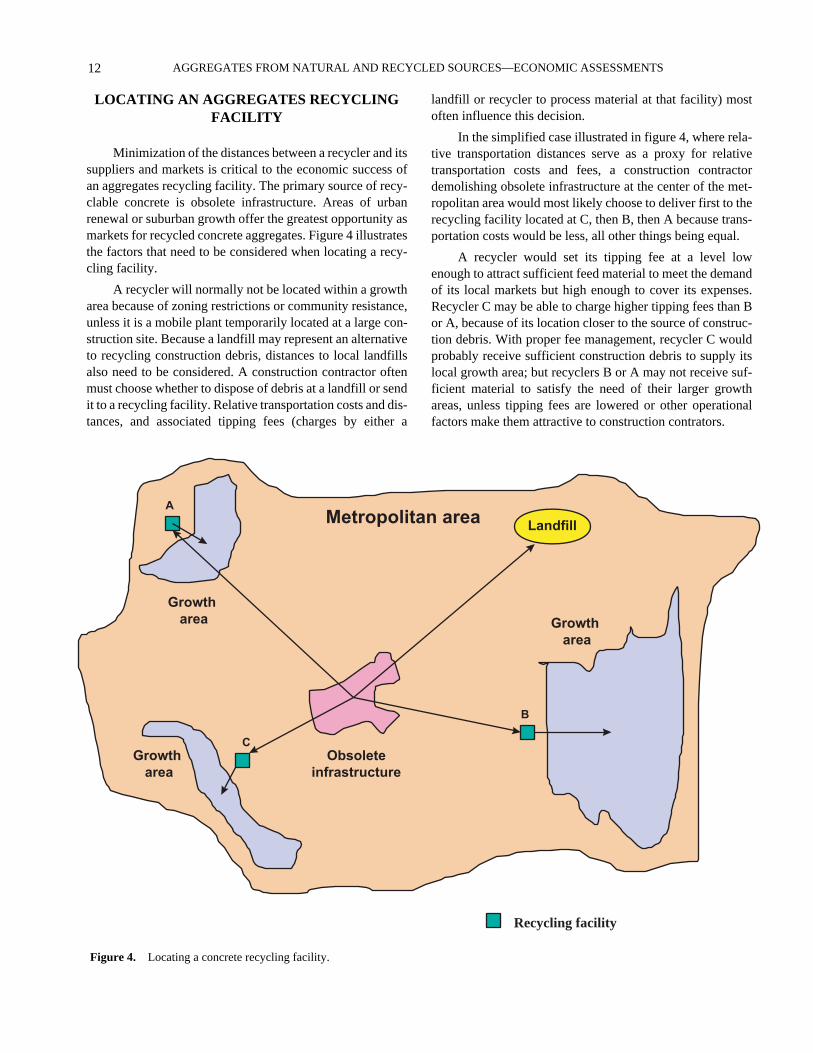
LOCATING AN AGGREGATES RECYCLING FACILITY
Minimization of the distances between a recycler and itssuppliers and markets is critical to the economic success ofan aggregates recycling facility. The primary source of recy-clable concrete is obsolete infrastructure. Areas of urbanrenewal or suburban growth offer the greatest opportunity asmarkets for recycled concrete aggregates. Figure 4 illustratesthe factors that need to be considered when locating a recy-cling facility.
A recycler will normally not be located within a growtharea because of zoning restrictions or community resistance,unless it is a mobile plant temporarily located at a large con-struction site. Because a landfill may represent an alternativeto recycling construction debris, distances to local landfillsalso need to be considered. A construction contractor oftenmust choose whether to dispose of debris at a landfill or sendit to a recycling facility. Relative transportation costs and dis-tances, and associated tipping fees (charges by either a
Metropolita
Obsoleteinfrastructure
Growth area
Growth area
A
C
Figure 4. Locating a concrete recycling facility.
landfill or recycler to process material at that facility) mostoften influence this decision.
In the simplified case illustrated in figure 4, where rela-tive transportation distances serve as a proxy for relativetransportation costs and fees, a construction contractordemolishing obsolete infrastructure at the center of the met-ropolitan area would most likely choose to deliver first to therecycling facility located at C, then B, then A because trans-portation costs would be less, all other things being equal.
A recycler would set its tipping fee at a level lowenough to attract sufficient feed material to meet the demandof its local markets but high enough to cover its expenses.Recycler C may be able to charge higher tipping fees than Bor A, because of its location closer to the source of construc-tion debris. With proper fee management, recycler C wouldprobably receive sufficient construction debris to supply itslocal growth area; but recyclers B or A may not receive suf-ficient material to satisfy the need of their larger growthareas, unless tipping fees are lowered or other operationalfactors make them attractive to construction contrators.
n area Landfill
Growth area
B
Recycling facility

13
COSTS OF PRODUCING RECYCLED AGGREGATES
In the case where the distance from the infrastructure toA is about equal to the distance to the landfill, and recyclersB and C are not accepting material for whatever reason, thentipping fee differences between the landfill and recycler Awill most likely determine where the construction debris issent. Further discussion of tipping fees is given in the costsection of this report.
COSTS OF PRODUCING RECYCLED AGGREGATES
Of the costs associated with the production of recycledaggregates, product price and tipping fee were found to havethe greatest effect on operational economics; variations ofthese parameters were analyzed. A method of economicevaluation presented here can be used for making informedplanning and policy decisions related to aggregate produc-tion from recycled sources.
METHODOLOGY
Costs for producing recycled aggregates were devel-oped based on data from the Denver, Colo., area. Costs inother regions of the United States may differ due to rawmaterial supply, operational, competition, or demand varia-tions. The methodology used in this study allows for varia-tion in costs and revenues to be evaluated and analyzed.
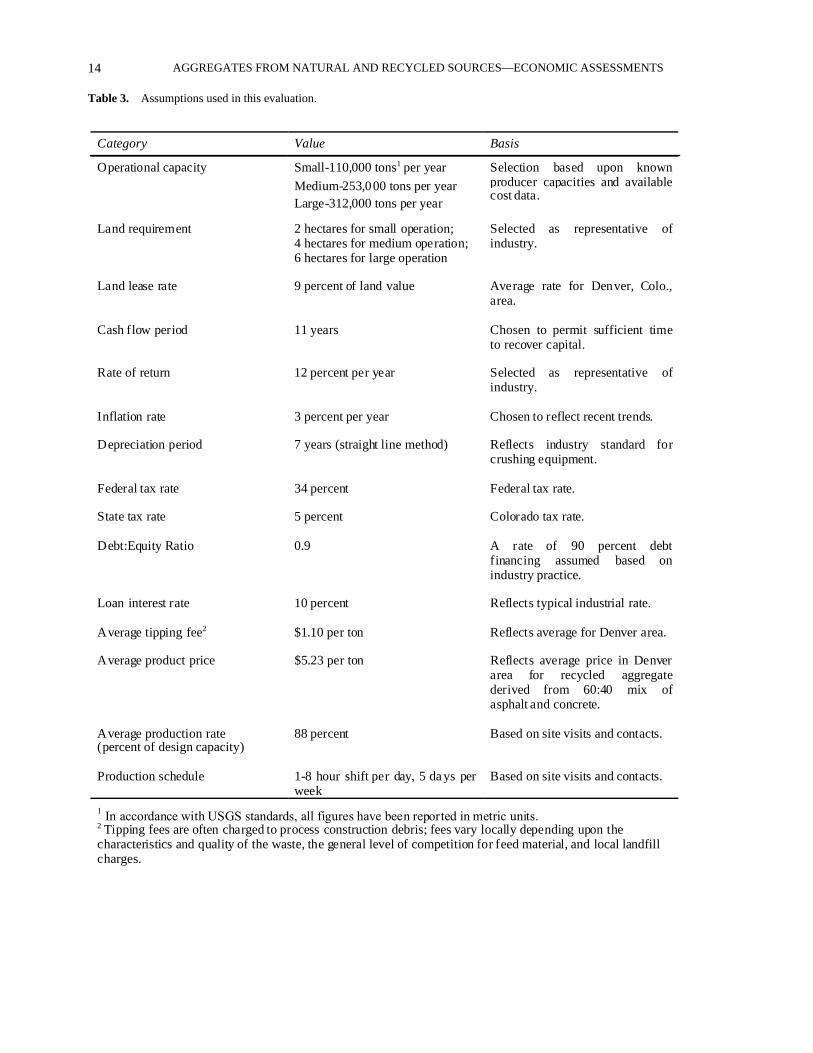
Production cost information for three representativefixed-site recycling operations is presented. Costs used inthis evaluation were developed from data collected frompublished literature, personal contacts, and site visits. Basedon these data, cost models were built to represent small(110,000 tons/year), medium (253,000 tons/year), and large(312,000 tons/year) capacity aggregates recycling opera-tions. The recycling models represent facilities processing a60:40 percent mix (tonnage basis) of recovered asphalt pave-ment to cement concrete debris. Assumptions for the recy-cling models are shown in table 3.
For each size model, capital expenditures for the pro-cessing plant and associated equipment, as well as all neces-sary reinvestments, were estimated. Investments includemobile and stationary equipment, construction, engineering,infrastructure, and working capital. Infrastructure includesthe cost for construction and installation of access and haul-age roads, water facilities, power supply, and personnelaccommodations. Working capital was estimated at 15 per-cent of the variable operating cost.
Land requirements for recycling operations are typi-cally small (generally 2–6 hectares). Consequently, manyoperations lease land rather than purchase it. In this study,land was assumed to be leased. Based upon reported leasefees3 for comparable industrial land in the Denver area, anaverage annual cost of land of about $97,000 per hectare was
assumed. Lease rates in the Denver metropolitan area rangedfrom 8 to 10 percent of the property value; a value of 9 per-cent was assumed for this study. Based upon these data, aleased land charge of approximately $19,000 was assumedfor the small operation, $43,000 for the medium operation,and $53,000 for the large operation. These charges wereincluded in the fixed operating costs.
Operating costs are a combination of variable and fixedcosts. Variable operating costs include production and main-tenance labor, operating supplies, and utilities. Fixed operat-ing costs include technical and clerical labor, payrolloverhead, land lease costs, administrative costs, facilitiesmaintenance and supplies, advertising, and sales. Taxes,insurance, depreciation, permitting costs, and other localfees are also included in this analysis.
A range of different size products is typically producedby recycling operations to meet the varying needs of localmarkets. Prices for each product can vary regionally due todemand and market considerations. An average price of$5.23 per ton was assumed for this study, based upon anassumed throughput ratio of asphalt to cement concrete of60:40 and a weighted average of reported 1996 prices forknown products in the Denver area. Products containing dif-ferent proportions of cement/asphalt concrete would gener-ate different prices depending upon the prices of theseproducts for the area of the United States in question. Recov-ery of byproducts such as rebar from recycling operationswas not considered in the evaluations.
After production parameters and cost estimates weredetermined for each model, the production data were enteredinto PCMINSIM, a software package developed by theformer U.S. Bureau of Mines to perform discounted-cash-flow rate of return (DCFROR) analyses of mineral properties(Fraser, 1990). The DCFROR is commonly defined as therate of return that makes the present worth of cash flow froman investment equal to the present worth of all after-taxinvestments (refer to Davidoff, 1980). For this study, a 12percent rate of return was considered the necessary rate ofreturn for operations to cover the opportunity cost of capitalplus risk.
COSTS
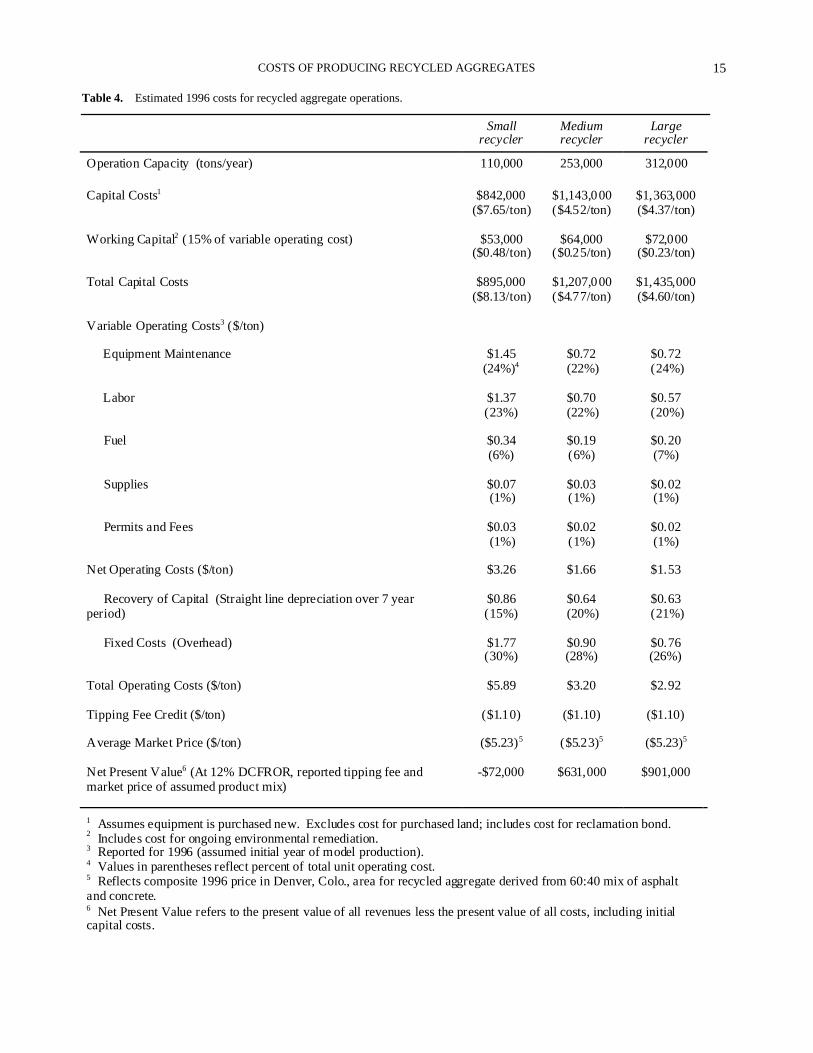
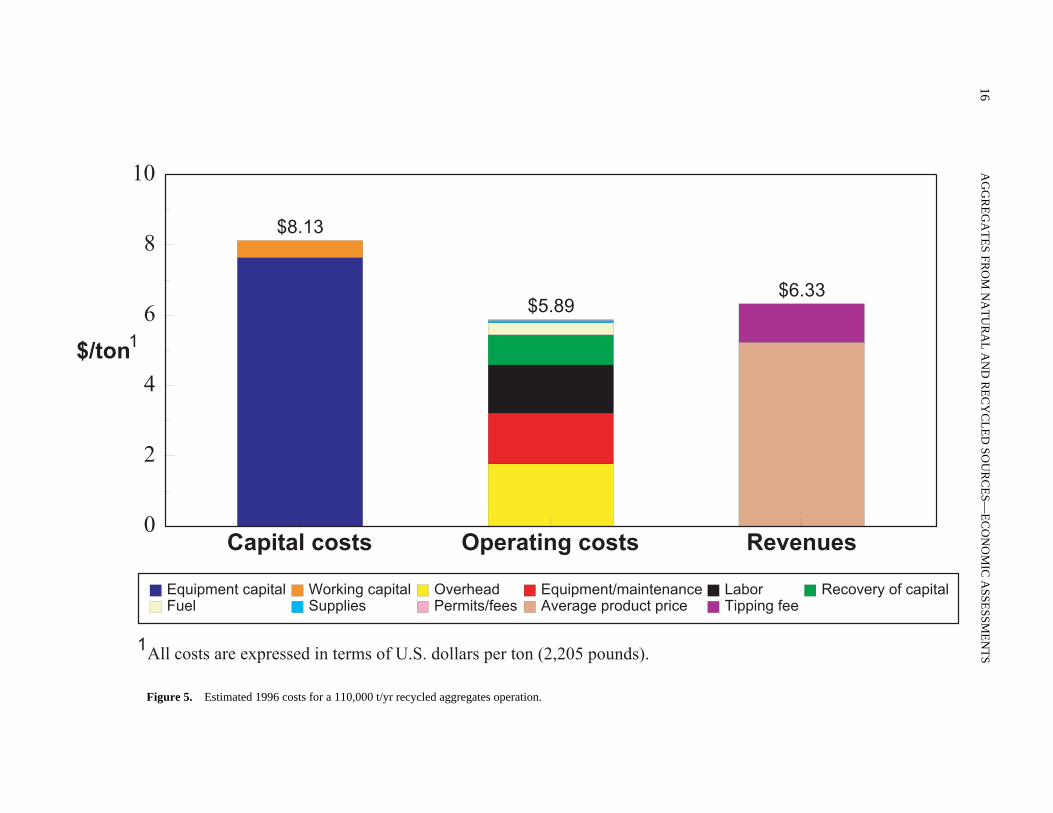
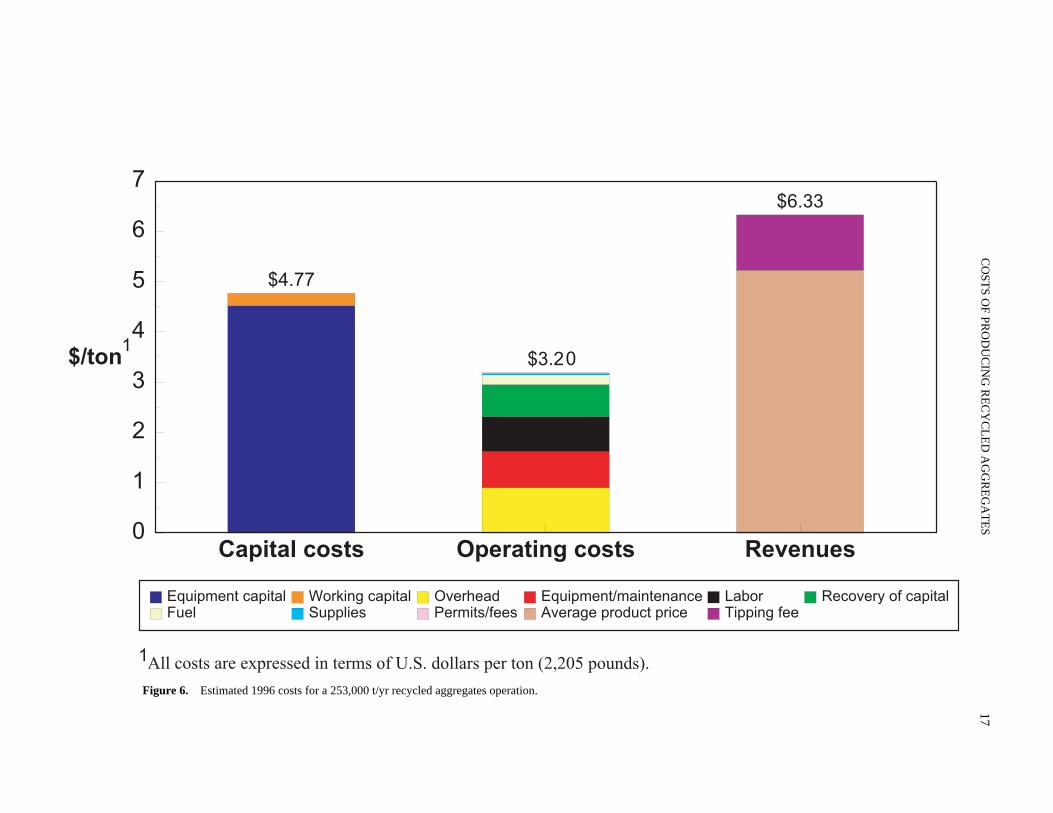
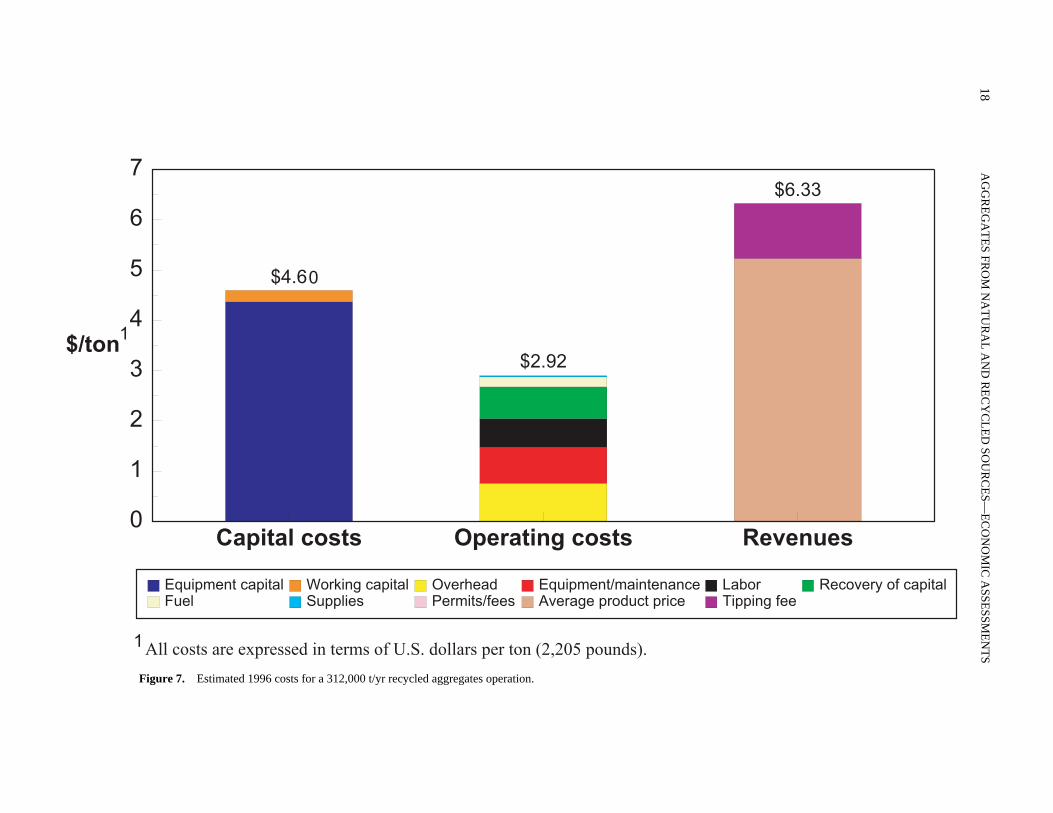
Cost models for the three size operations are given intable 4 and shown in figures 5, 6, and 7. Capital costs, oper-ating costs, and revenues are represented for each model.
From these data, the costs associated with equipment(such as equipment capital, equipment maintenance, andrecovery of capital) clearly are a significant contributor tototal production costs for a recycling operation, particularly
3Based upon data provided by Fuller and Company, Denver, Colo.,August 31, 1997.
AGGREGATES FROM NATURAL AND RECYCLED SOURCES—ECONOMIC ASSESSMENTS
14
Table 3.
Assumptions used in this evaluation.
Category Value Basis
Operational capacity Small-110,000 tons1 per year
Medium-253,000 tons per yearLarge-312,000 tons per year
Selection based upon knownproducer capacities and availablecost data.
Land requirement 2 hectares for small operation;4 hectares for medium operation;6 hectares for large operation
Selected as representative ofindustry.
Land lease rate 9 percent of land value Average rate for Denver, Colo.,area.
Cash flow period 11 years Chosen to permit sufficient timeto recover capital.
Rate of return 12 percent per year Selected as representative ofindustry.
Inflation rate 3 percent per year Chosen to reflect recent trends.
Depreciation period 7 years (straight line method) Reflects industry standard forcrushing equipment.
Federal tax rate 34 percent Federal tax rate.
State tax rate 5 percent Colorado tax rate.
Debt:Equity Ratio 0.9 A rate of 90 percent debtfinancing assumed based onindustry practice.
Loan interest rate 10 percent Reflects typical industrial rate.
Average tipping fee2 $1.10 per ton Reflects average for Denver area.
Average product price $5.23 per ton Reflects average price in Denverarea for recycled aggregatederived from 60:40 mix ofasphalt and concrete.
Average production rate(percent of design capacity)
88 percent Based on site visits and contacts.
Production schedule 1-8 hour shift per day, 5 da ys perweek
Based on site visits and contacts.
1 In accordance with USGS standards, all figures have been reported in metric units.2 Tipping fees are often charged to process construction debris; fees vary locally depending upon thecharacteristics and quality of the waste, the general level of competition for feed material, and local landfillcharges.
15
COSTS OF PRODUCING RECYCLED AGGREGATES
Smallrecycler
Mediumrecycler
Largerecycler
Operation Capacity (tons/year) 110,000 253,000 312,000
Capital Costs1 $842,000($7.65/ton)
$1,143,000($4.52/ton)
$1,363,000($4.37/ton)
Working Capital2 (15% of variable operating cost) $53,000($0.48/ton)
$64,000($0.25/ton)
$72,000($0.23/ton)
Total Capital Costs $895,000($8.13/ton)
$1,207,000($4.77/ton)
$1,435,000($4.60/ton)
Variable Operating Costs3 ($/ton)
Equipment Maintenance $1.45(24%)4
$0.72 (22%)
$0.72 (24%)
Labor $1.37(23%)
$0.70 (22%)
$0.57 (20%)
Fuel $0.34(6%)
$0.19(6%)
$0.20(7%)
Supplies $0.07 (1%)
$0.03(1%)
$0.02(1%)
Permits and Fees $0.03 (1%)
$0.02(1%)
$0.02(1%)
Net Operating Costs ($/ton) $3.26 $1.66 $1.53
Recovery of Capital (Straight line depreciation over 7 yearperiod)
$0.86(15%)
$0.64 (20%)
$0.63 (21%)
Fixed Costs (Overhead) $1.77(30%)
$0.90(28%)
$0.76(26%)
Total Operating Costs ($/ton) $5.89 $3.20 $2.92
Tipping Fee Credit ($/ton) ($1.10) ($1.10) ($1.10)
Average Market Price ($/ton) ($5.23)5 ($5.23)5 ($5.23)5
Net Present Value6 (At 12% DCFROR, reported tipping fee andmarket price of assumed product mix)
-$72,000 $631,000 $901,000
1 Assumes equipment is purchased new. Excludes cost for purchased land; includes cost for reclamation bond.2 Includes cost for ongoing environmental remediation.3 Reported for 1996 (assumed initial year of model production).4 Values in parentheses reflect percent of total unit operating cost.5 Reflects composite 1996 price in Denver, Colo., area for recycled aggregate derived from 60:40 mix of asphaltand concrete.6 Net Present Value refers to the present value of all revenues less the present value of all costs, including initialcapital costs.
Table 4.
Estimated 1996 costs for recycled aggregate operations.
AG
GR
EG
AT
ES FR
OM
NA
TU
RA
L A
ND
RE
CY
CL
ED
SOU
RC
ES—
EC
ON
OM
IC A
SSESSM
EN
TS
16
$/ton
Capital costs Operating costs Revenues0
2
4
6
8
10
$8.13
$5.89$6.33
Equipment capital Working capital Overhead Equipment/maintenance Labor Recovery of capitalFuel Supplies Permits/fees Average product price Tipping fee
1
1All costs are expressed in terms of U.S. dollars per ton (2,205 pounds).
Figure 5.
Estimated 1996 costs for a 110,000 t/yr recycled aggregates operation.
17
CO
STS O
F PRO
DU
CIN
G R
EC
YC
LE
D A
GG
RE
GA
TE
S
Capital costs Operating costs Revenues0
1
2
3
4
5
6
7
$4.77
$3.2
$6.33
Equipment capital Working capital Overhead Equipment/maintenance Labor Recovery of capitalFuel Supplies Permits/fees Average product price Tipping fee
$/ton1
1All costs are expressed in terms of U.S. dollars per ton (2,205 pounds).
0
Figure 6.
Estimated 1996 costs for a 253,000 t/yr recycled aggregates operation.
AG
GR
EG
AT
ES FR
OM
NA
TU
RA
L A
ND
RE
CY
CL
ED
SOU
RC
ES—
EC
ON
OM
IC A
SSESSM
EN
TS
18
Capital costs Operating costs Revenues0
1
2
3
4
5
6
7
$4.6
$2.92
$6.33
Equipment capital Working capital Overhead Equipment/maintenance Labor Recovery of capitalFuel Supplies Permits/fees Average product price Tipping fee
$/ton
1
1
All costs are expressed in terms of U.S. dollars per ton (2,205 pounds).
0
Figure 7.
Estimated 1996 costs for a 312,000 t/yr recycled aggregates operation.
19
COSTS OF PRODUCING RECYCLED AGGREGATES
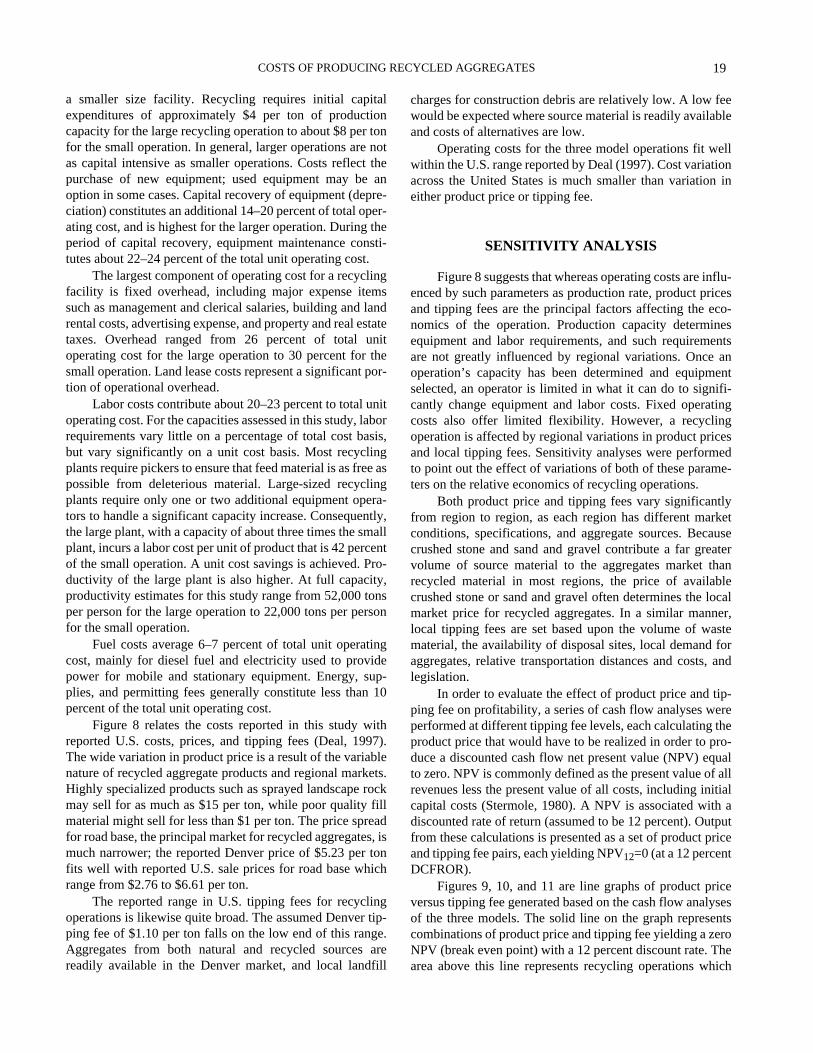
a smaller size facility. Recycling requires initial capitalexpenditures of approximately $4 per ton of productioncapacity for the large recycling operation to about $8 per tonfor the small operation. In general, larger operations are notas capital intensive as smaller operations. Costs reflect thepurchase of new equipment; used equipment may be anoption in some cases. Capital recovery of equipment (depre-ciation) constitutes an additional 14–20 percent of total oper-ating cost, and is highest for the larger operation. During theperiod of capital recovery, equipment maintenance consti-tutes about 22–24 percent of the total unit operating cost.
The largest component of operating cost for a recyclingfacility is fixed overhead, including major expense itemssuch as management and clerical salaries, building and landrental costs, advertising expense, and property and real estatetaxes. Overhead ranged from 26 percent of total unitoperating cost for the large operation to 30 percent for thesmall operation. Land lease costs represent a significant por-tion of operational overhead.
Labor costs contribute about 20–23 percent to total unitoperating cost. For the capacities assessed in this study, laborrequirements vary little on a percentage of total cost basis,but vary significantly on a unit cost basis. Most recyclingplants require pickers to ensure that feed material is as free aspossible from deleterious material. Large-sized recyclingplants require only one or two additional equipment opera-tors to handle a significant capacity increase. Consequently,the large plant, with a capacity of about three times the smallplant, incurs a labor cost per unit of product that is 42 percentof the small operation. A unit cost savings is achieved. Pro-ductivity of the large plant is also higher. At full capacity,productivity estimates for this study range from 52,000 tonsper person for the large operation to 22,000 tons per personfor the small operation.
Fuel costs average 6–7 percent of total unit operatingcost, mainly for diesel fuel and electricity used to providepower for mobile and stationary equipment. Energy, sup-plies, and permitting fees generally constitute less than 10percent of the total unit operating cost.
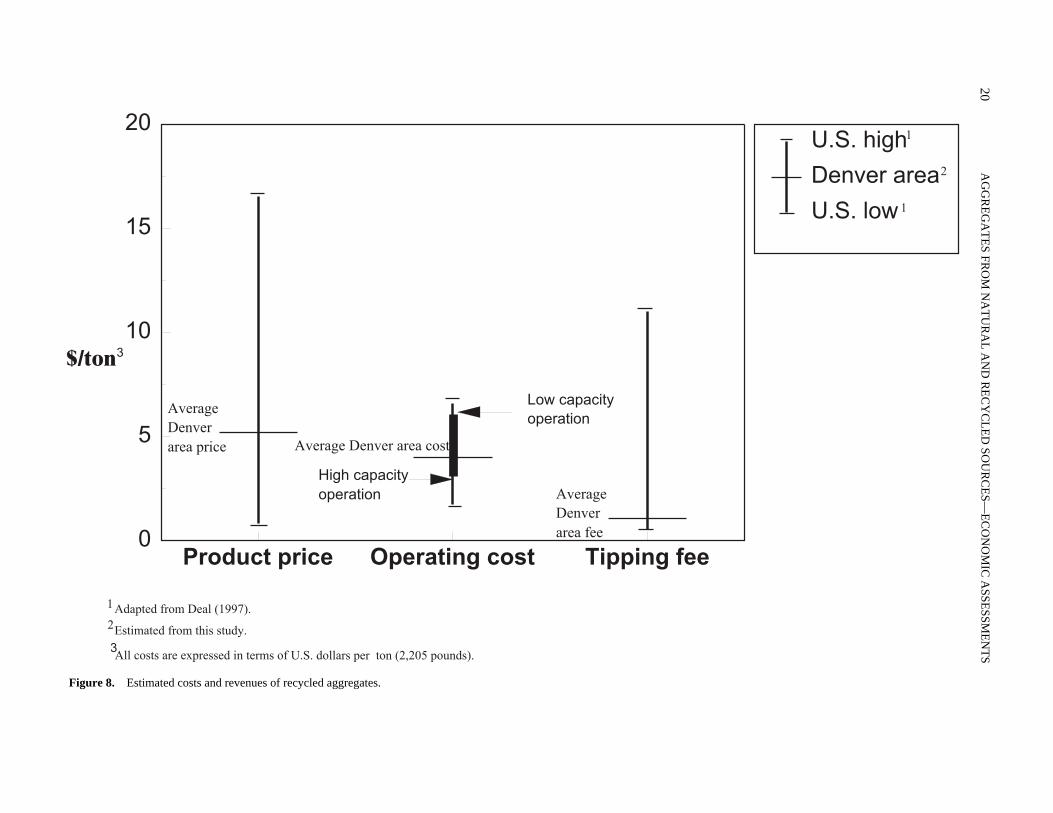
Figure 8 relates the costs reported in this study withreported U.S. costs, prices, and tipping fees (Deal, 1997).The wide variation in product price is a result of the variablenature of recycled aggregate products and regional markets.Highly specialized products such as sprayed landscape rockmay sell for as much as $15 per ton, while poor quality fillmaterial might sell for less than $1 per ton. The price spreadfor road base, the principal market for recycled aggregates, ismuch narrower; the reported Denver price of $5.23 per tonfits well with reported U.S. sale prices for road base whichrange from $2.76 to $6.61 per ton.
The reported range in U.S. tipping fees for recyclingoperations is likewise quite broad. The assumed Denver tip-ping fee of $1.10 per ton falls on the low end of this range.Aggregates from both natural and recycled sources arereadily available in the Denver market, and local landfill
charges for construction debris are relatively low. A low feewould be expected where source material is readily availableand costs of alternatives are low.
Operating costs for the three model operations fit wellwithin the U.S. range reported by Deal (1997). Cost variationacross the United States is much smaller than variation ineither product price or tipping fee.
SENSITIVITY ANALYSIS
Figure 8 suggests that whereas operating costs are influ-enced by such parameters as production rate, product pricesand tipping fees are the principal factors affecting the eco-nomics of the operation. Production capacity determinesequipment and labor requirements, and such requirementsare not greatly influenced by regional variations. Once anoperation’s capacity has been determined and equipmentselected, an operator is limited in what it can do to signifi-cantly change equipment and labor costs. Fixed operatingcosts also offer limited flexibility. However, a recyclingoperation is affected by regional variations in product pricesand local tipping fees. Sensitivity analyses were performedto point out the effect of variations of both of these parame-ters on the relative economics of recycling operations.
Both product price and tipping fees vary significantlyfrom region to region, as each region has different marketconditions, specifications, and aggregate sources. Becausecrushed stone and sand and gravel contribute a far greatervolume of source material to the aggregates market thanrecycled material in most regions, the price of availablecrushed stone or sand and gravel often determines the localmarket price for recycled aggregates. In a similar manner,local tipping fees are set based upon the volume of wastematerial, the availability of disposal sites, local demand foraggregates, relative transportation distances and costs, andlegislation.
In order to evaluate the effect of product price and tip-ping fee on profitability, a series of cash flow analyses wereperformed at different tipping fee levels, each calculating theproduct price that would have to be realized in order to pro-duce a discounted cash flow net present value (NPV) equalto zero. NPV is commonly defined as the present value of allrevenues less the present value of all costs, including initialcapital costs (Stermole, 1980). A NPV is associated with adiscounted rate of return (assumed to be 12 percent). Outputfrom these calculations is presented as a set of product priceand tipping fee pairs, each yielding NPV12=0 (at a 12 percentDCFROR).
Figures 9, 10, and 11 are line graphs of product priceversus tipping fee generated based on the cash flow analysesof the three models. The solid line on the graph representscombinations of product price and tipping fee yielding a zeroNPV (break even point) with a 12 percent discount rate. Thearea above this line represents recycling operations which
AG
GR
EG
AT
ES FR
OM
NA
TU
RA
L A
ND
RE
CY
CL
ED
SOU
RC
ES—
EC
ON
OM
IC A
SSESSM
EN
TS
20
Product price Operating cost Tipping fee0
5
10
15
20U.S. high
Denver area
U.S. low
High capacityoperation
Low capacityoperation
$/ton
AverageDenverarea price Average Denver area cost
AverageDenverarea fee
1
1
2
3
Adapted from Deal (1997).
Estimated from this study.
1
2
3All costs are expressed in terms of U.S. dollars per ton (2,205 pounds).
Figure 8.
Estimated costs and revenues of recycled aggregates.
21
COSTS OF PRODUCING RECYCLED AGGREGATES
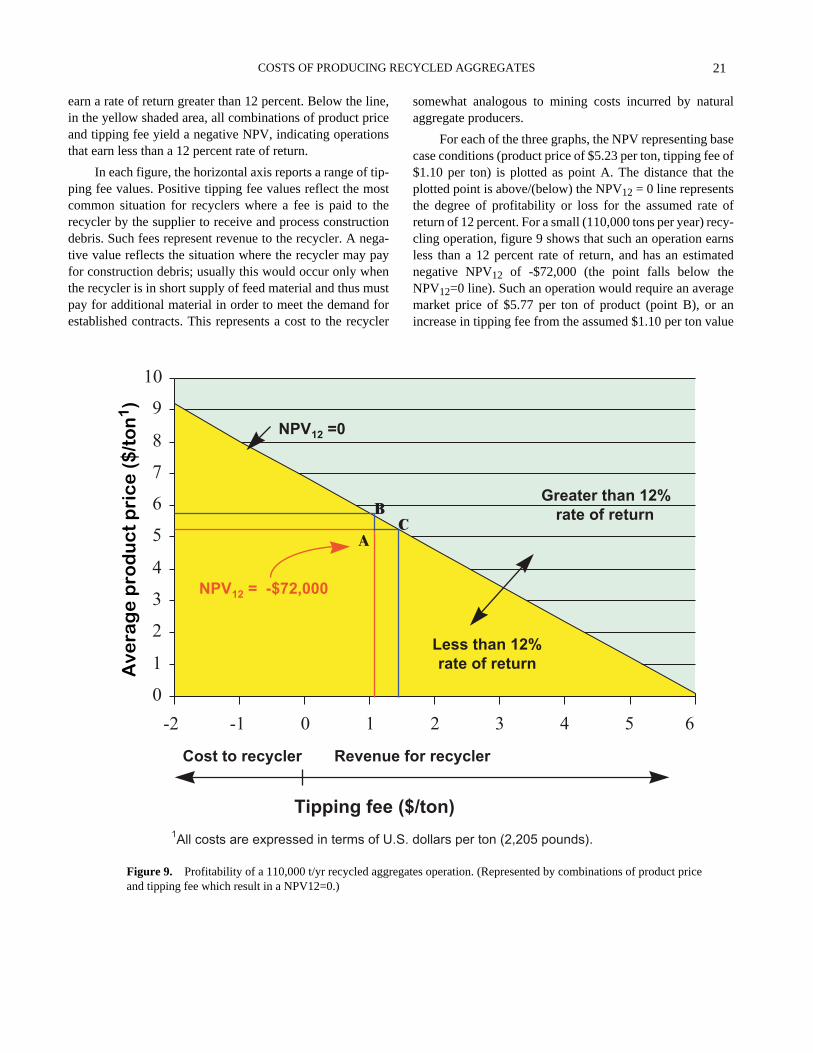
earn a rate of return greater than 12 percent. Below the line,in the yellow shaded area, all combinations of product priceand tipping fee yield a negative NPV, indicating operationsthat earn less than a 12 percent rate of return.
In each figure, the horizontal axis reports a range of tip-ping fee values. Positive tipping fee values reflect the mostcommon situation for recyclers where a fee is paid to therecycler by the supplier to receive and process constructiondebris. Such fees represent revenue to the recycler. A nega-tive value reflects the situation where the recycler may payfor construction debris; usually this would occur only whenthe recycler is in short supply of feed material and thus mustpay for additional material in order to meet the demand forestablished contracts. This represents a cost to the recycler
0
1
2
3
4
5
6
7
8
9
10
Tipping fee (
-2 -1 0 1
Cost to recycler Revenue
NPV12 = -$72,000
NPV12 =0
A
BC
1All costs are expressed in terms of U.S
Ave
rag
e p
rod
uc
t p
ric
e (
$/t
on
1)
Figure 9. Profitability of a 110,000 t/yr recycled aggregand tipping fee which result in a NPV12=0.)
somewhat analogous to mining costs incurred by naturalaggregate producers.
For each of the three graphs, the NPV representing basecase conditions (product price of $5.23 per ton, tipping fee of$1.10 per ton) is plotted as point A. The distance that theplotted point is above/(below) the NPV12 = 0 line representsthe degree of profitability or loss for the assumed rate ofreturn of 12 percent. For a small (110,000 tons per year) recy-cling operation, figure 9 shows that such an operation earnsless than a 12 percent rate of return, and has an estimatednegative NPV12 of -$72,000 (the point falls below theNPV12=0 line). Such an operation would require an averagemarket price of $5.77 per ton of product (point B), or anincrease in tipping fee from the assumed $1.10 per ton value
$/ton)
2 3 4 5 6
Less than 12%rate of return
Greater than 12%rate of return
for recycler
. dollars per ton (2,205 pounds).
ates operation. (Represented by combinations of product price

AGGREGATES FROM NATURAL AND RECYCLED SOURCES—ECONOMIC ASSESSMENTS
22
to about $1.71 per ton (point C), or a combination of these toachieve a rate of return of 12 percent.
The medium size (253,000 tons per year) base caseoperation model, however, plots above the NPV12=0 line(NPV12= $631,000), showing a level of profit above theassigned 12 percent rate of return. Figure 10 indicates thatfor this model, the average product price could fall to $2.69per ton (point B), and the operation would still achieve a rateof return of 12 percent (assuming a charge of $1.10 per tontipping fee). Alternatively, the tipping fee could be elimi-nated (at a product price of $5.23 per ton) and the recyclercould pay up to $1.38 per ton of material (point C) and stillachieve a rate of return of 12 percent. A combination of thesewould also result in achieving a rate of return of 12 percent.
Figure 11 indicates that under the base conditions, thelarge (312,000 tons per year) operation model would bemore profitable, with an estimated NPV12= $901,000. For
Tipping
-2 -1 0
Cost to recycler
NPV12 = 7
0
1
2
3
4
5
6
7
Lessrate
C
NPV12 = 0
1All costs are expressed in terms
Ave
rag
e p
rod
uc
t p
ric
e (
$/t
on
1)
Figure 10. Profitability of a 253,000 t/yr recycled product price and tipping fee which result in a NPV1
the large operation, the average product price could fall to$2.31 per ton (point B) before the operation would no longerachieve a rate of return greater than 12 percent (at $1.10 perton tipping fee). Alternatively, the tipping fee could be elim-inated (at a product price of $5.23 per ton) and the recyclercould pay up to $1.69 per ton of material (point C) and stillachieve a rate of return of 12 percent. A combination of thesewould also result in achieving a rate of return of 12 percent.Therefore, larger sized operations have more leeway than thesmaller sized operations to absorb product price decreasesand (or) tipping fee decreases before becoming unprofitable.
This analysis indicated that under the base case sce-nario, with a product price of $5.23 per ton and a $1.10 perton tipping fee, both the medium and large recycling opera-tion models do not need a tipping fee to achieve a rate ofreturn of 12 percent. For the 253,000 ton-per-year operation,the operating cost could increase by $2.55 per ton, and the
fee ($/ton)
1 2 3
Revenue for recycler
2,000
Greater than 12%rate of return
than 12% of return
NPV12 = $631,000
A
B
of U.S. dollars per ton (2,205 pounds).
aggregates operation. (Represented by combinations of
2=0.)

23
COSTS OF PRODUCING RECYCLED AGGREGATES
Tipping fee ($/ton)
-2 -1 0 1 2 3
Cost to recycler Revenue for recycler
NPV12 = 72,000
0
1
2
3
4
5
6
Greater than 12%rate of return
Less than 12%rate of return
NPV12 = $901,000
A
B
C
NPV12 = 0
1All costs are expressed in terms of U.S. dollars per ton (2,205 pounds).
Ave
rag
e p
rod
uc
t p
ric
e (
$/t
on
1)
Figure 11.
Profitability of a 312,000 t/yr recycled aggregates operation. (Represented by combinations of product price and tipping fee which result in a NPV12=0.)
operation would still achieve a 12 percent rate of return. Forthe 312,000 ton-per-year operation, the operating cost couldincrease by $2.92 per ton under the stated conditions and stillachieve a 12 percent rate of return.
Figures 9, 10, and 11 were developed based on Denverarea costs, product prices, and tipping fees. These figures,however, can be used to represent the product price/tippingfee combinations reported in other areas of the United Statesto provide an indication of profitability of a recycling opera-tion. Once an appropriate size model is chosen, a particularcombination of price and tipping fee can be located on thegraph representing that model. For a recycling operation, apositive tipping fee would normally be selected. The inter-section point of these two factors would indicate a relativelevel of profitability one could expect from that operation,depending on whether the point fell to above or below theNPV
12
= 0 line and the proximity of that point to the line. If
the point fell below the NPV
12
= 0 line, the modeled opera-tion would likely not be profitable, whereas a point fallingabove the line would indicate the likelihood of earning atleast a 12 percent rate of return.
Note that these graphs are based on an assumption thatthe facility would operate at 88 percent of maximum capac-ity. Typically, recycling operations seldom operate at a sus-tained full capacity level, because of periodic shutdowns toremove deleterious material or (if using a mobile plant) torelocate the plant to a new site. Consequently, the level ofreported profitability reported by figures 9 through 11 mayvary if productivity differs significantly from the assumedrate of 88 percent. In order to determine the relative impactof productivity variation on operational economics, reducedcapacity runs for the large-size operation were generated.These showed that a large operation running at about 72 per-cent of capacity produced the same NPV
12
= $587,000 value

AGGREGATES FROM NATURAL AND RECYCLED SOURCES—ECONOMIC ASSESSMENTS
24
as a mid-size operation operating at 88 percent of capacity.The closer to its rated production capacity a recycled aggre-gate facility operates, the higher rate of return it could earn,all other things being equal.
Consequently, one factor affecting the viability of anaggregates recycler is the availability of feed material. If con-struction debris or other sources of feed are not consistentlyavailable, or if there is some seasonality to the availability oflocal feed material that limits the ability of the recycler tooperate at or near capacity, this would reduce the profitabilityof an operation. The amount of material available for recy-cling is limited by the size and changing conditions of the“urban deposit.” Often recycle supply fails to meet demandfor aggregates, so natural aggregates production continues tobe the primary source of aggregates in road construction inapplications where they can substitute. At best, the contribu-tion of recycled material will grow gradually until all of theavailable supply is consumed.
Product pricing is often controlled by factors outside thedirect control of the recycler. The amount of materialpresently available from natural aggregate deposits oftensubstantially overshadows the amount of material availablefrom recycling. In the Denver area, for example, recycledaggregates only account for about 1–2 percent of the aggre-gates market and about 20 percent of the road base market;consequently, prices for road base or asphaltic concrete, theprincipal end uses of recycled aggregates, are often largely afunction of the amount of natural aggregates locallyavailable.
Product quality and uniformity can also pose a risk tothe potential recycler. Natural aggregate producers continueto supply the bulk of the material for building and road con-struction because they are able to supply sufficient high-quality material for a wide variety of higher valued productapplications. Unless the recycler has established long-termcontracts for consistent, high-quality feed material, it may bedifficult for the recycler to maintain a predictable revenuestream because of uncertainty related to future feed availabil-ity and quality or market price fluctuations.
The analysis suggests that a small operation (operatingat or below a level of 110,000 tons per year) might have dif-ficulty operating profitably as a fixed-site operation (NPV
12
= -$72,000 under market conditions of product price = $5.23per ton and tipping fee = $1.10 per ton). Smaller operationsappear to be more constrained by negative changes in pro-ductivity or market conditions, so must adjust their methodsof operation to increase their chances of success. The follow-ing examples illustrate methods recyclers have used to dothis:1. They can increase tipping fees or charge higher product
prices to increase the amount of revenue generated in markets that can absorb these higher amounts.
2. They can geographically reposition themselves to gain a transportation cost advantage over their fixed-site com-petitors.
3. They can act as subcontractors to the principal contrac-tor on a job site, operating on land that does not require payment for use. This reduces the operating cost for the recycler and reduces the disposal cost for the principal contractor, thus allowing the contractor to pay a higher fee for recycling. The job-site recycler may then be able to offset the additional costs of relocation and setup.
4. While operating on the site of the prime contractor, the small operator could take on supplementary business on an ad hoc basis, which would spread the costs over a larger output, improve efficiency, and increase revenue to the recycler.
5. When recycling is mandated by States or municipalities (as in California after recent earthquakes) the guaran-teed market for the recycler’s product removes some of the risk of doing business. In this situation, a contractor must use a specified proportion of recycled material. This may result in higher prices for recycled aggregates than would otherwise be the case.
Increasingly, recyclers are developing creative cooper-ative agreements with municipalities to ensure a stable sup-ply of material or establish long term markets. Examples ofsuch agreements follow.
PUBLIC POLICY
A complete picture of the aggregates recycling industrycannot be presented without considering the effect of Gov-ernment policy on this sector. Societal concern for the envi-ronment has in recent years resulted in increased emphasis onpromoting a more sustainable use of our natural resources.Recycling is considered by many to be one program contrib-uting to such a goal. Local, State, and Federal officials haveimplemented different methods to promote recycling efforts,contributing to the development of a new and expandingindustry. The Texas Department of Transportation (TxDOT)has developed an extensive database recording State recy-cling activities and incentive programs (Texas Department ofTransportation, 1996). Although policies and regulationsvary across the United States, all affect the industry by shap-ing new markets and helping to determine costs. Specificareas of government activity are covered in the followingdiscussion.
Federal Legislation:
Several pieces of Federal legislationenacted in recent years have affected the aggregates recy-cling industry. Such legislation has in effect provided man-dates to recycle. The effect of such mandates has been tocreate new businesses and markets, reduce the risk of uncer-tainty for the growing industry, and increase competition forexisting recyclers.
DeGroot and others (1995) listed examples of Federallegislation that has contributed to the emergence of theaggregates recycling industry:

25PUBLIC POLICY
1. The Solid Waste Disposal Act (1965), as amended bythe Resource Conservation and Recovery Act (RCRA,1970) called for the Federal procurement of productswith recycled material content. As a result, most Feder-ally funded construction projects require incorporationof a set percentage of recycled material.
2. The Resource Conservation and Recovery Act (1976):RCRA explicitly recognized that dumping of recover-able materials is a national problem and acknowledgedthe importance of recycling as part of the Nation’s solidwaste management efforts. Specifications for secondarymaterials (such as recycled concrete and asphalt) andrevision of existing specifications to include such mate-rials were called for under the Act.
3. The Strategic Highway Research Program (1987): TheStrategic Highway Research Program (SHRP) is part ofthe Surface Transportation and Urban Relocation Assis-tance Act of 1987. SHRP is a project-oriented programthat is targeted to produce performance-based specifica-tions, improved equipment, advanced-technologies testprocedures, and training aids that highway agencies canuse in the short term to improve the performance ofpavements and enhance highway construction andmaintenance. The program sponsored efforts to developtechnologies to enhance recycling of asphalt and con-crete pavement.
4. Intermodal Surface Transportation Efficiency Act(ISTEA) (1991): The U.S. Congress explicitly dealtwith the use of recycled materials in transportationthrough Section 1038 of the ISTEA, which was passedin 1991. This Act is mainly concerned with issuesrelated to asphalt.
State and Local Incentives: In some areas, States and localmunicipalities are encouraging recycling activities in a vari-ety of ways, while receiving financial benefits. The follow-ing summarizes four agreements that serve as recyclingincentives.
In 1995, the city of Sunnyvale, Calif., entered into a 5-year contract with Raisch Products to recycle constructiondebris. The nearest landfill is 43 kilometers from town andcharges a tipping fee of $46 per ton. Raisch charges a fee of$11 per ton to process this material (includes materials otherthan concrete), and produces a product suitable for roadbase, which is used on municipal road contracts. Under thisarrangement, the company has an assured source of feedmaterial while the city receives $120,000 per year plus a per-centage of revenue over a certain threshold. The city alsobenefits from a cost savings of $35 per ton in transportationand disposal charges. Sunnyvale residents are able to disposeof waste driveway concrete free of charge under this agree-ment (Mark Bowers, City Manager, Sunnyvale, Calif., oralcommun., 1997).
The town of Epping, N.H., established a contract withthe Environmental Resource Return Corporation (ERRCO)in 1997 under which the town’s public works department
and local residents supply ERRCO with construction refusefree of charge and purchase end products at discountedprices. The town receives a fee beginning at $0.55 per ton ofproduct, which should generate revenues of about $87,000per year when the facility reaches full production (Prokopy,1996).
The State of Iowa, in an effort to increase recycling to50 percent, awarded a $500,000 grant to a concrete/asphaltrecycling operation to demonstrate that it could significantlyreduce the amount of construction and demolition debris sentto State landfills. Previously, economics for such an opera-tion were questionable because of the area’s relatively lowtipping fee of $33 per ton charged by the landfill. Today thelandfill diverts 50 percent of its incoming waste to recycling,providing a 32.5 percent reduction in the amount of materialthat is disposed of at the site. Recycled aggregates are soldfor about $1.10 per ton less than locally available naturalaggregates (Turley, 1997b).
Flexible contracts have also been used to provide aneconomic incentive for aggregates recycling. An agreementwas reached between a recycler and a contractor in Califor-nia to supply recycled road base at approximately $1.96 percubic meter below market price. In return, the recycler wasallowed to set up a mobile recycling plant on the contractor’sland for free. The contractor was able to obtain aggregates ata discounted rate and could place orders on an as-neededbasis, while the recycler was able to set up operations closeto ready markets while incurring no land costs. As a result ofthis agreement, the contractor was able to exceed the 25 per-cent minimum California recycling mandate.
Local Tax Revenues: The amount of local tax revenueavailable for infrastructure renewal and local transportationimprovement can impact the quantity and extent of aggre-gates production from both natural and recycled sources.Such revenues and their distribution determine whether therewill be enough money to support rebuilding of roads and (or)construction of additional infrastructure, or whether onlyspot repairs are possible. Spot repair jobs, being small, gen-erally do not meet the job-size requirements to support arecycling operation.
Permits and Fees: Regulatory costs affect the cost of doingbusiness and the competitiveness of recycled aggregateswith natural aggregates. Such costs apply to both sectors indifferent ways, perhaps with less of an effect for the recy-cling industry.
Federal Highway Budgets: The amount of Federal fundingavailable to supplement local infrastructure budgets and pro-vide funding for research impacting the recycling industry(for example, to create specifications for recycled aggregateproducts) appears to be increasingly scarce as money andpriorities shift. The current trend is to shift responsibility forroad construction and maintenance to the States. It is up toState highway departments (with or without Federal grants)to promulgate standards and specifications for the industry.
AGGREGATES FROM NATURAL AND RECYCLED SOURCES—ECONOMIC ASSESSMENTS
26
CONCLUSIONS
The trend towards urbanization in the United States hasprovided, and probably will continue to provide, a strongdemand for high-volume, low-cost aggregates material forrepair and development of additional infrastructure. The totaldemand for aggregates, driven by demographics, urbaniza-tion, and the economy, is expected to remain strong in theshort term (Tepordei, 1997b).
Recycling of construction materials has grown alongwith demand for aggregates. Recycled aggregates competefavorably with natural aggregates in many local markets asroad base material. Recycling has the potential to reduce theamount of waste disposed of in landfills, preserve naturalresources, and provide energy and cost savings while limit-ing environmental disturbance. Potential sources for recy-cled material grow as maintenance or replacement of theNation’s infrastructure continues. Because of the finite life ofsuch infrastructure, this “urban deposit” may be considered arenewable resource. The relative costs and charges (tippingfees) of recyclers, their competitors, and landfills determinethe amount of material ultimately available for recycling. Atapproximately $0.13/ton/kilometer, the cost of transportationhas a significant impact on the economics of constructionoperations. It is not surprising that mobile, job-site recyclingis becoming common for larger construction projects, as ameans of avoiding high transportation, disposal, and newmaterial costs. Even so, the amount of material availableoverall for recycling is insufficient to meet present industrydemand. On a national basis, it is unlikely that recycling willever completely replace natural aggregates as road base inroad construction.
Transportation costs are part of the dynamics that definethe market for recycled material, but they most often do notdirectly affect the profitability of the recycling operation.The supplier of material from the “urban deposit” to the recy-cler is aware of transportation costs. The amount of materialthat the supplier will make available to the recycler is basedon a calculation that compares delivering and paying a tip-ping fee to the recycler, to any competitor of the recycler, orto the landfill. Transportation distance and costs are very sig-nificant factors in determining the optimum location of arecycler when assessed alongside sources of material, com-petitors, and customers. General site location dynamics aresimilar in all areas of the United States, but specific localconditions must be assessed by a potential recycler whendeveloping a business plan.
Based upon economic considerations alone, aggregaterecycling should continue. Product pricing and tipping feesare the most significant factors influencing the competitive-ness of a recycling operation. Under the conditions specifiedin this analysis, both medium and large recycling operationscan operate profitably because of the tipping fee and loweroverall costs. Even so, a combination of economic, social,and legislative factors tend to restrict the use of recycled
material to lower valued product applications in roadconstruction.
Slight variations in revenues generated by productprices or tipping fees can affect operational profitability sig-nificantly. Equipment capital, operating, and maintenancecosts, coupled with plant layout and efficiency, also have sig-nificant impact on economic performance. Operator experi-ence in crushing technology, material handling, and efficientplant design are important to success. Although land require-ments are typically small for recycling operations, land costscan have a significant impact on economics, particularly forsmaller operations.
Aggregate recycling operations often must overcomerisks associated with feed and product availability, pricing,and quality. A facility that is able to maintain a high level ofsustained production and secure consistent, long-termsources of feed material has a greater chance of success. Sim-ilarly, a facility that produces consistent, quality productssuitable for diverse markets has a greater opportunity for suc-cess.
Recycling operations that would normally not be profit-able as fixed-site operations must use creative methods toestablish a market niche for themselves. Examples of suc-cessful approaches that are being used include (1) operatingas a mobile, job-site operation; (2) geographic repositioningto gain competitive advantage; (3) job-site subcontracting;(4) establishing supplemental businesses; (5) State or munic-ipal contracting; and (6) mutually beneficial or flexible pric-ing contracts. Such entrepreneurial operations appear to begrowing in number.
Natural aggregate producers, however, continue to sup-ply the bulk of material for building and road construction,because they are able to supply sufficient high-quality mate-rial for a wide variety of higher valued product applicationsin established markets. Commonly, recycled material doesnot meet specifications for high-quality applications such asportland cement concrete and top-course pavement, and nat-ural aggregates will continue to dominate these markets. Therevenue (tipping fee) that is received for processing construc-tion waste material does, however, enhance the competitiveposition of the recycler, often allowing new recyclers to suc-cessfully enter selected markets such as road base. Recyclingoperations will not be able to effectively compete as suppli-ers of these higher quality products unless recycling is madea more attractive option for contractors, either throughimproved education and awareness, specification changes, orlegislative mandates.
The economic benefit for a producer of natural aggre-gates, which generally relies on its own resource, has adeeper market penetration, and has demonstrated the abilityto produce quality products, to begin recycling is substantial.The producer is already supplying a large portion of the roadaggregates market. It has the necessary processing equip-ment and expertise in place to process recycled material (per-haps with minor modifications). Recycled material can
27
SELECTED REFERENCES
supplement natural sources and prolong the life of naturalaggregate deposits, thus sustaining the life of the operation.Recycling appears to be profitable and in most cases canmeet demand requirements of lower value product applica-tions such as road base, thereby freeing up higher qualitymaterial for higher value applications.
Opportunities for new entrants will continue to emerge,but adding new recycling capacity to a market with a limitedlevel of feed material impacts the profitability of all compet-itors in a given area as downward pressures on product pricesand tipping fees are created. A given location has a finiteamount of material on which to draw for recycling at onetime, and as costs or local regulations limit the distance thismaterial can be transported, recyclers compete for this mate-rial, thereby drawing prices and tipping fees down. A newoperation coming on line in the same territory might reduceits tipping fee to generate feed supply. If demand is fixed,prices would be expected to remain stable until the total levelof local production reached the maximum amount of feedmaterial available, at which time prices would be expected todecline and the less competitive operation would begin tolose market share.
In today’s urban setting, a policy maker often mustweigh the potential benefits of recycling with competingland-use and development issues. The economic climate forrecycling can be improved by making waste disposal in land-fills less attractive (imposing higher tipping fees), increasingmarkets for recycled materials, educating the public as to thebenefits of recycling, increasing research and developmentto improve recycled aggregates quality or show consumerswhere recycled products are competitive with natural mate-rials, expanding specifications to accept more recycled mate-rial where it has demonstrated its ability to competetechnically, and facilitating the flow of market information.
Data gaps still remain in assessing aggregates recy-cling. Reliable data on how much recyclable material isavailable and how much recycling is actually occurring byindustry are needed to quantify future market potential andindustry impact. Further quantitative studies of the flow ofconstruction materials such as aggregates are also neededin order to anticipate future economic activity and com-modity use.
SELECTED REFERENCES
Bogardus, E.R., 1997, Bargain basement tipping fees create chaosin California: World Wastes, February 1997, p. 40-44.
Bolen, W.P., 1995, Construction sand and gravel: U.S. Bureau ofMines Mineral Commodity Summaries 1995, p. 144.
———1996, Construction sand and gravel: U.S. Bureau of Minesand U.S. Geological Survey Mineral Commodity Summaries1996, p. 142.
———1997, Construction sand and gravel, Chapter in U.S. Geo-logical Survey 1996 Minerals Yearbook, p. 144.
Bourne, H.L. 1993, What it’s worth—A review of mineral royaltyinformation: Mining Engineering, v. 45, no. 7, p. 710-713.
Brickner, R.H., and Winzinger, H., 1994, What it costs to set up arecycling plant: C&D Debris Recycling, July 1994, p. 9-15.
Brooks, Kevin, Torone, Brian, and Adams, Cassandra, 1996, Turn-ing c&d waste from liability into profit: C&D Debris Recy-cling, Spring 1996, p. 5-7.
Bush, A.L., and Hayes, T.S., eds., 1995, Industrial minerals of theMidcontinent—Proceedings of the Midcontinent industrialminerals workshop: U.S. Geological Survey Bulletin 2111,126 p.
Busse, R., 1993, Tips for recycling concrete: Rock Products, v. 96,no. 9, p. 51-56.
Construction Monthly, 1996, California earthquake debris recov-ery, a case study in responsible recycling efforts: ConstructionMonthly, Sept. 1996, p. 64-65.
Daley, S.F., 1994, Low budget recycling: C&D Debris Recycling,October 1994, p. 8-10.
Davidoff, R.L., 1980, Supply analysis model (SAM)—A MineralsAvailability System methodology: U.S. Bureau of Mines Infor-mation Circular 8820, 24 p.
Deal, T.A., 1997, What it costs to recycle concrete: C&D DebrisRecycling, v. 4, no. 6, p. 10-13.
DeGroot, D.J., Shelburne, W.M., and Switzenbaum, M.S., 1995,Use of recycled materials and recycled products in highwayconstruction: Boston, Mass., University of Massachusetts,Research report UMTC-95-1 for Massachusetts Department ofTransportation, August 1995, 208 p.
DePauw, C., and Vyncke, J., 1996, European C&D recy-clers—Developing new standards for aggregate use: C&DDebris Recycling, Winter 1996, p. 12-13.
Fraser, S.J., 1990, Documentation for PCMINSIM: U.S. Bureau ofMines, 31 p.
Gibboney, W.B., 1995, Flexible and rigid pavement costs on theOhio Interstate Highway System: Asphalt, v. 9, no. 3, 6 p.
Goldman, H.B., 1994, Sand and gravel, in Carr, D.D., ed., Industrialminerals and rocks, Sixth Edition: Littleton, Colo., Society forMining, Metallurgy, and Exploration, Inc., p. 869-877.
Grayson, R.L., and Wilson, J.W., 1997, Mining operations—Issuesand impacts maintaining a competitive edge, in Symposium,International Center for Aggregates Research, Fifth Edition,Austin, Texas, April 21-23, 1997, Proceedings: Austin, Tex.,International Center for Aggregates Research, p. B1-1-1 to H-6-6.
Harler, C., 1995, New ideas for recycled pavement: RecyclingToday, v. 33, no. 11, p. 70-74.
Hawkins, R., 1996, Recycling concrete and asphalt, an approach toprofit,
in
Conference on Used Building Materials, September1996, Winnipeg, Man., Proceedings: Winnipeg, Man., UsedBuilding Materials Association, p. 37.
Herrick, D.H., 1994, Crushed stone, in Carr, D.D., ed., Industrialminerals and rocks, Sixth Edition: Littleton, Colo., Society forMining, Metallurgy, and Exploration, Inc., p. 975-986.
Intertec Publishing Corp.,1994, Industry news: C&D Debris Recy-cling, October 1994, p. 6.
———1994, 1994 operating costs for crushed stone plants: RockProducts, v. 97, no. 6, p. 25-36.
Judy, Scott, 1997, Aggregates and material production: RockyMountain Construction, v. 78, no. 14, p. 12-34.
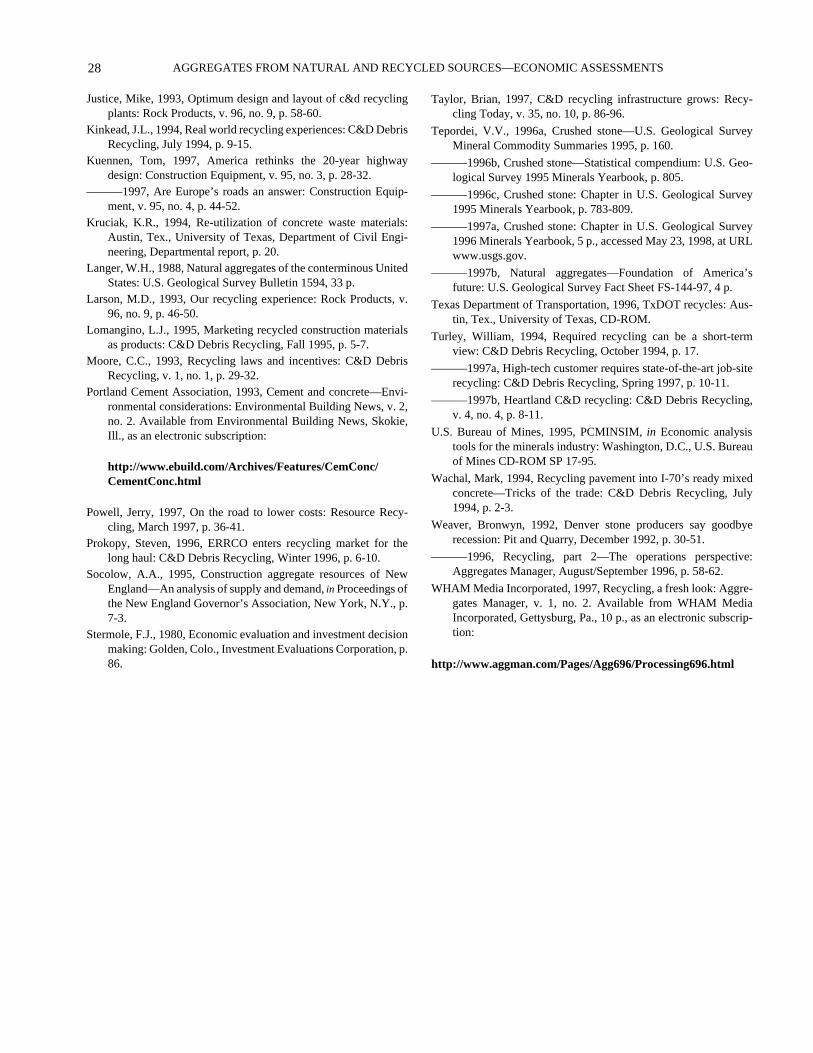
AGGREGATES FROM NATURAL AND RECYCLED SOURCES—ECONOMIC ASSESSMENTS
28
Justice, Mike, 1993, Optimum design and layout of c&d recyclingplants: Rock Products, v. 96, no. 9, p. 58-60.
Kinkead, J.L., 1994, Real world recycling experiences: C&D DebrisRecycling, July 1994, p. 9-15.
Kuennen, Tom, 1997, America rethinks the 20-year highwaydesign: Construction Equipment, v. 95, no. 3, p. 28-32.
———1997, Are Europe’s roads an answer: Construction Equip-ment, v. 95, no. 4, p. 44-52.
Kruciak, K.R., 1994, Re-utilization of concrete waste materials:Austin, Tex., University of Texas, Department of Civil Engi-neering, Departmental report, p. 20.
Langer, W.H., 1988, Natural aggregates of the conterminous UnitedStates: U.S. Geological Survey Bulletin 1594, 33 p.
Larson, M.D., 1993, Our recycling experience: Rock Products, v.96, no. 9, p. 46-50.
Lomangino, L.J., 1995, Marketing recycled construction materialsas products: C&D Debris Recycling, Fall 1995, p. 5-7.
Moore, C.C., 1993, Recycling laws and incentives: C&D DebrisRecycling, v. 1, no. 1, p. 29-32.
Portland Cement Association, 1993, Cement and concrete—Envi-ronmental considerations: Environmental Building News, v. 2,no. 2. Available from Environmental Building News, Skokie,Ill., as an electronic subscription:
http://www.ebuild.com/Archives/Features/CemConc/CementConc.html
Powell, Jerry, 1997, On the road to lower costs: Resource Recy-cling, March 1997, p. 36-41.
Prokopy, Steven, 1996, ERRCO enters recycling market for thelong haul: C&D Debris Recycling, Winter 1996, p. 6-10.
Socolow, A.A., 1995, Construction aggregate resources of NewEngland—An analysis of supply and demand,
in
Proceedings ofthe New England Governor’s Association, New York, N.Y., p.7-3.
Stermole, F.J., 1980, Economic evaluation and investment decisionmaking: Golden, Colo., Investment Evaluations Corporation, p.86.
Taylor, Brian, 1997, C&D recycling infrastructure grows: Recy-cling Today, v. 35, no. 10, p. 86-96.
Tepordei, V.V., 1996a, Crushed stone—U.S. Geological SurveyMineral Commodity Summaries 1995, p. 160.
———1996b, Crushed stone—Statistical compendium: U.S. Geo-logical Survey 1995 Minerals Yearbook, p. 805.
———1996c, Crushed stone: Chapter in U.S. Geological Survey1995 Minerals Yearbook, p. 783-809.
———1997a, Crushed stone: Chapter in U.S. Geological Survey1996 Minerals Yearbook, 5 p., accessed May 23, 1998, at URLwww.usgs.gov.
———1997b, Natural aggregates—Foundation of America’sfuture: U.S. Geological Survey Fact Sheet FS-144-97, 4 p.
Texas Department of Transportation, 1996, TxDOT recycles: Aus-tin, Tex., University of Texas, CD-ROM.
Turley, William, 1994, Required recycling can be a short-termview: C&D Debris Recycling, October 1994, p. 17.
———1997a, High-tech customer requires state-of-the-art job-siterecycling: C&D Debris Recycling, Spring 1997, p. 10-11.
———1997b, Heartland C&D recycling: C&D Debris Recycling,v. 4, no. 4, p. 8-11.
U.S. Bureau of Mines, 1995, PCMINSIM,
in
Economic analysistools for the minerals industry: Washington, D.C., U.S. Bureauof Mines CD-ROM SP 17-95.
Wachal, Mark, 1994, Recycling pavement into I-70’s ready mixedconcrete—Tricks of the trade: C&D Debris Recycling, July1994, p. 2-3.
Weaver, Bronwyn, 1992, Denver stone producers say goodbyerecession: Pit and Quarry, December 1992, p. 30-51.
———1996, Recycling, part 2—The operations perspective:Aggregates Manager, August/September 1996, p. 58-62.
WHAM Media Incorporated, 1997, Recycling, a fresh look: Aggre-gates Manager, v. 1, no. 2. Available from WHAM MediaIncorporated, Gettysburg, Pa., 10 p., as an electronic subscrip-tion:
http://www.aggman.com/Pages/Agg696/Processing696.html
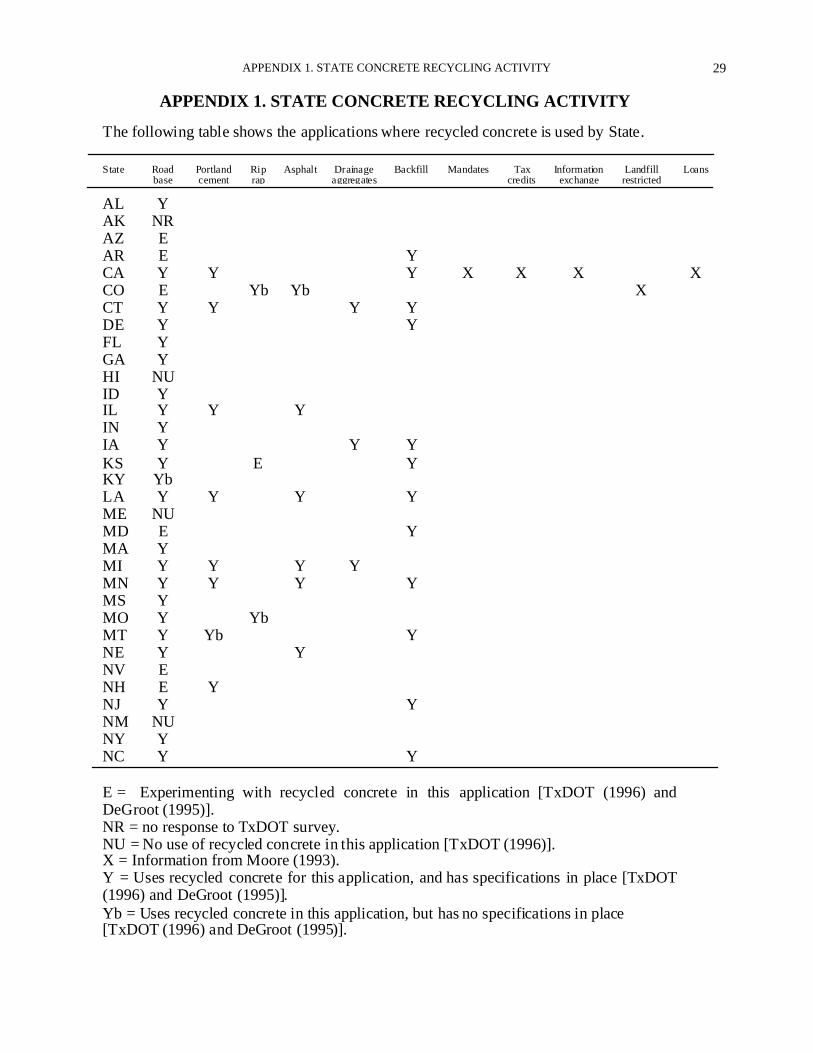
29
APPENDIX 1. STATE CONCRETE RECYCLING ACTIVITY
The following table shows the applications where recycled concrete is used by State.
State Roadbase
Portlandcement
Riprap
Asphalt Drainageaggregates
Backfill Mandates Taxcredits
Informationexchange
Landfillrestricted
Loans
AL YAK NRAZ EAR E YCA Y Y Y X X X XCO E Yb Yb XCT Y Y Y YDE Y YFL YGA YHI NUID YIL Y Y YIN YIA Y Y YKS Y E YKY YbLA Y Y Y YME NUMD E YMA YMI Y Y Y YMN Y Y Y YMS YMO Y YbMT Y Yb YNE Y YNV ENH E YNJ Y YNM NUNY YNC Y Y
E = Experimenting with recycled concrete in this application [TxDOT (1996) andDeGroot (1995)].NR = no response to TxDOT survey.NU = No use of recycled concrete in this application [TxDOT (1996)].X = Information from Moore (1993).Y = Uses recycled concrete for this application, and has specifications in place [TxDOT(1996) and DeGroot (1995)].Yb = Uses recycled concrete in this application, but has no specifications in place[TxDOT (1996) and DeGroot (1995)].
APPENDIX 1. STATE CONCRETE RECYCLING ACTIVITY
AGGREGATES FROM NATURAL AND RECYCLED SOURCES—ECONOMIC ASSESSMENTS
30
State Roadb ase
Portlandcement
Rip
rap
Asphalt Drainage
aggregates
Backfill Mandates Tax
credits
Information
exchange
Landfillrestricted
Loans
ND YOH EOK EOR Yb YPA YRI Y YSC YbSD NUTN NRTX EUT NUVT NUVA YWA Y Y YWV NUWI YbWY E Yb
E = Experimenting with recycled concrete in this application [TxDOT (1996) andDeGroot (1995)].NR = no response to TxDOT survey.NU = No use of recycled concrete in this application [TxDOT (1996)].X = Information from Moore (1993).Y = Uses recycled concrete for this application, and has specifications in place [TxDOT(1996) and DeGroot (1995)].Yb = Uses recycled concrete in this application, but has no specifications in place[TxDOT (1996) and DeGroot (1995)].

31APPENDIX 2. AGGREGATES PRODUCTION TECHNOLOGY
APPENDIX 2. AGGREGATES PRODUCTION TECHNOLOGY
PRODUCTION PROCESSES
Natural aggregates are produced principally from crushed stone or sand and gravel deposits similar to the one picturedhere.
Figure 12. Typical natural aggregates operation.(Courtesy of Rocky Mountain Construction, Inc.)
AGGREGATES FROM NATURAL AND RECYCLED SOURCES—ECONOMIC ASSESSMENTS32
CRUSHED STONE
USE
More than 80 percent of the 1.33 billion tons of crushedstone consumed in 1996 was used as construction aggre-gates, mostly for highway construction and road mainte-nance (Tepordei, 1997a). Crushed stone is also used in themanufacture of concrete for road, building, and bridge con-struction, and nonconstruction applications. Approximately72 percent of the crushed stone produced came from lime-stone, about 15 percent from granite, 7 percent from basalt,and the remainder from a variety of other rock types (Tepor-dei, 1997a).
Construction aggregates are hard materials suitable forforming concrete when a cementing or binding material isadded, or used alone in other applications. Aggregatesderived from sand and gravel, crushed stone, or recycledsources generally make up the bulk of the volume of the con-crete being produced. Although deposits from which crushedstone can be produced are widespread in the United States,they are not available everywhere. Factors such as marketavailability, transportation distances, local environmentalimpact, and permitting factors must be considered in siteselection. Deposits suitable for concrete aggregates produc-tion must meet strict technical specifications related to qual-ity and quantity.
Specifications for crushed stone are developed by orga-nizations such as:
The American Society for Testing and Materials (ASTM)
http://www.astm.org
American Association of State Highway and TransportationOfficials (AASHTO)
http://www.aashto.org
U.S. Department of Transportation, Federal HighwayAdministration (FHWA)
http://www.fhwa.dot.gov
U.S. Army Corps of Engineers
http://www.usace.army.mil
and the various State departments of transportation (DOTs).Product specifications are often mandated for all State orFederal construction projects. Local transportation districtsmay select specifications suitable for their needs, generallybased on State guidelines. Crushed stone specifications maybe modified regionally to reflect local climatic conditionsand availability of materials.
TECHNOLOGY
Stone suitable for producing a crushed stone product ismost often recovered by standard quarrying techniques.Underground operations are occasionally used where suit-able and in areas where community resistance to surface min-ing is high. For most surface operations, once a suitabledeposit is selected and acquired, the stone is often recoveredby removing any overburden, loosening of the rock by blast-ing, crushing the rock to the desired size, separation of dele-terious material, stockpiling of marketable material ofvarious sizes and grades, and transporting products to mar-ket. Depending upon nature of the deposit and rock type, notall of these steps may be required. The capacity of a crushedstone operation in the United States ranges from less than 25thousand tons to over 5 million tons per year.
The relative layout of the primary and secondary crush-ers, screening plant, stockpiles, and ancillary equipmentdetermines how efficiently materials can move throughoutthe operation. Because transportation among resource, pro-cessing plant, and markets is one of the most important fac-tors in site profitability, efficient site location and design arecritical.
Most crushed stone operations employ surface miningmethods to recover the resource. Trucks and shovels arecommonly used at larger operations or where material mustbe moved longer distances or over public roads. Front-endloaders or scrapers are used at smaller operations or whereshorter haulage distances are necessary. Draglines may beused where material to be moved is under water and hydrau-lic shovels may be used where the rock surface is irregular.
The nature and geometry of the deposit determine thedrilling and blasting requirements. Operation size may deter-mine whether company or contract drilling is used. Environ-mental, regulatory, and social considerations also affect typeof drilling and scheduling of blasting, particularly if the siteis located in or near an urban area.
Crushed stone plants are generally classified as eitherwet or dry plants, depending upon stone classification, thetypes of contaminants present, availability of water and landarea, zoning, and environmental considerations. In the wetprocess, clay and contaminants are removed by washing andwaste water is sent to settling ponds. Wet plants do not havethe dust problems often associated with dry plants, butrequire a larger site area in order to accommodate the spacerequired for settling ponds. Dry plants often require dust col-lectors or other dust suppression systems to reduce theamount of dust generated in processing.
Both permanent and portable plants or a combination ofthe two types may be used, depending upon such things asplant capacity, deposit life, product mix, equipment andspace availability, and time constraints. Portable plants areoften used to supply stone for specific construction projects,and may be sited at the project rather than at the resourcelocation. Such plants are designed to travel on public roads
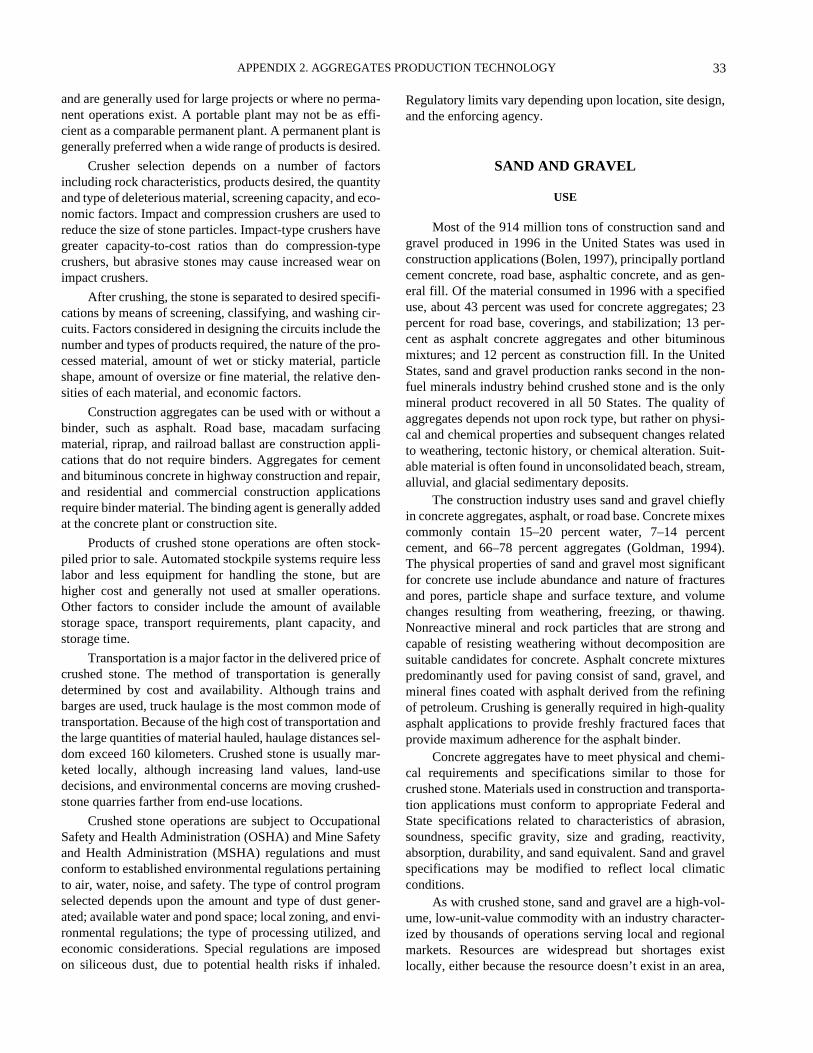
33
APPENDIX 2. AGGREGATES PRODUCTION TECHNOLOGY
and are generally used for large projects or where no perma-nent operations exist. A portable plant may not be as effi-cient as a comparable permanent plant. A permanent plant isgenerally preferred when a wide range of products is desired.
Crusher selection depends on a number of factorsincluding rock characteristics, products desired, the quantityand type of deleterious material, screening capacity, and eco-nomic factors. Impact and compression crushers are used toreduce the size of stone particles. Impact-type crushers havegreater capacity-to-cost ratios than do compression-typecrushers, but abrasive stones may cause increased wear onimpact crushers.
After crushing, the stone is separated to desired specifi-cations by means of screening, classifying, and washing cir-cuits. Factors considered in designing the circuits include thenumber and types of products required, the nature of the pro-cessed material, amount of wet or sticky material, particleshape, amount of oversize or fine material, the relative den-sities of each material, and economic factors.
Construction aggregates can be used with or without abinder, such as asphalt. Road base, macadam surfacingmaterial, riprap, and railroad ballast are construction appli-cations that do not require binders. Aggregates for cementand bituminous concrete in highway construction and repair,and residential and commercial construction applicationsrequire binder material. The binding agent is generally addedat the concrete plant or construction site.
Products of crushed stone operations are often stock-piled prior to sale. Automated stockpile systems require lesslabor and less equipment for handling the stone, but arehigher cost and generally not used at smaller operations.Other factors to consider include the amount of availablestorage space, transport requirements, plant capacity, andstorage time.
Transportation is a major factor in the delivered price ofcrushed stone. The method of transportation is generallydetermined by cost and availability. Although trains andbarges are used, truck haulage is the most common mode oftransportation. Because of the high cost of transportation andthe large quantities of material hauled, haulage distances sel-dom exceed 160 kilometers. Crushed stone is usually mar-keted locally, although increasing land values, land-usedecisions, and environmental concerns are moving crushed-stone quarries farther from end-use locations.
Crushed stone operations are subject to OccupationalSafety and Health Administration (OSHA) and Mine Safetyand Health Administration (MSHA) regulations and mustconform to established environmental regulations pertainingto air, water, noise, and safety. The type of control programselected depends upon the amount and type of dust gener-ated; available water and pond space; local zoning, and envi-ronmental regulations; the type of processing utilized, andeconomic considerations. Special regulations are imposedon siliceous dust, due to potential health risks if inhaled.
Regulatory limits vary depending upon location, site design,and the enforcing agency.
SAND AND GRAVEL
USE
Most of the 914 million tons of construction sand andgravel produced in 1996 in the United States was used inconstruction applications (Bolen, 1997), principally portlandcement concrete, road base, asphaltic concrete, and as gen-eral fill. Of the material consumed in 1996 with a specifieduse, about 43 percent was used for concrete aggregates; 23percent for road base, coverings, and stabilization; 13 per-cent as asphalt concrete aggregates and other bituminousmixtures; and 12 percent as construction fill. In the UnitedStates, sand and gravel production ranks second in the non-fuel minerals industry behind crushed stone and is the onlymineral product recovered in all 50 States. The quality ofaggregates depends not upon rock type, but rather on physi-cal and chemical properties and subsequent changes relatedto weathering, tectonic history, or chemical alteration. Suit-able material is often found in unconsolidated beach, stream,alluvial, and glacial sedimentary deposits.
The construction industry uses sand and gravel chieflyin concrete aggregates, asphalt, or road base. Concrete mixescommonly contain 15–20 percent water, 7–14 percentcement, and 66–78 percent aggregates (Goldman, 1994).The physical properties of sand and gravel most significantfor concrete use include abundance and nature of fracturesand pores, particle shape and surface texture, and volumechanges resulting from weathering, freezing, or thawing.Nonreactive mineral and rock particles that are strong andcapable of resisting weathering without decomposition aresuitable candidates for concrete. Asphalt concrete mixturespredominantly used for paving consist of sand, gravel, andmineral fines coated with asphalt derived from the refiningof petroleum. Crushing is generally required in high-qualityasphalt applications to provide freshly fractured faces thatprovide maximum adherence for the asphalt binder.
Concrete aggregates have to meet physical and chemi-cal requirements and specifications similar to those forcrushed stone. Materials used in construction and transporta-tion applications must conform to appropriate Federal andState specifications related to characteristics of abrasion,soundness, specific gravity, size and grading, reactivity,absorption, durability, and sand equivalent. Sand and gravelspecifications may be modified to reflect local climaticconditions.
As with crushed stone, sand and gravel are a high-vol-ume, low-unit-value commodity with an industry character-ized by thousands of operations serving local and regionalmarkets. Resources are widespread but shortages existlocally, either because the resource doesn’t exist in an area,
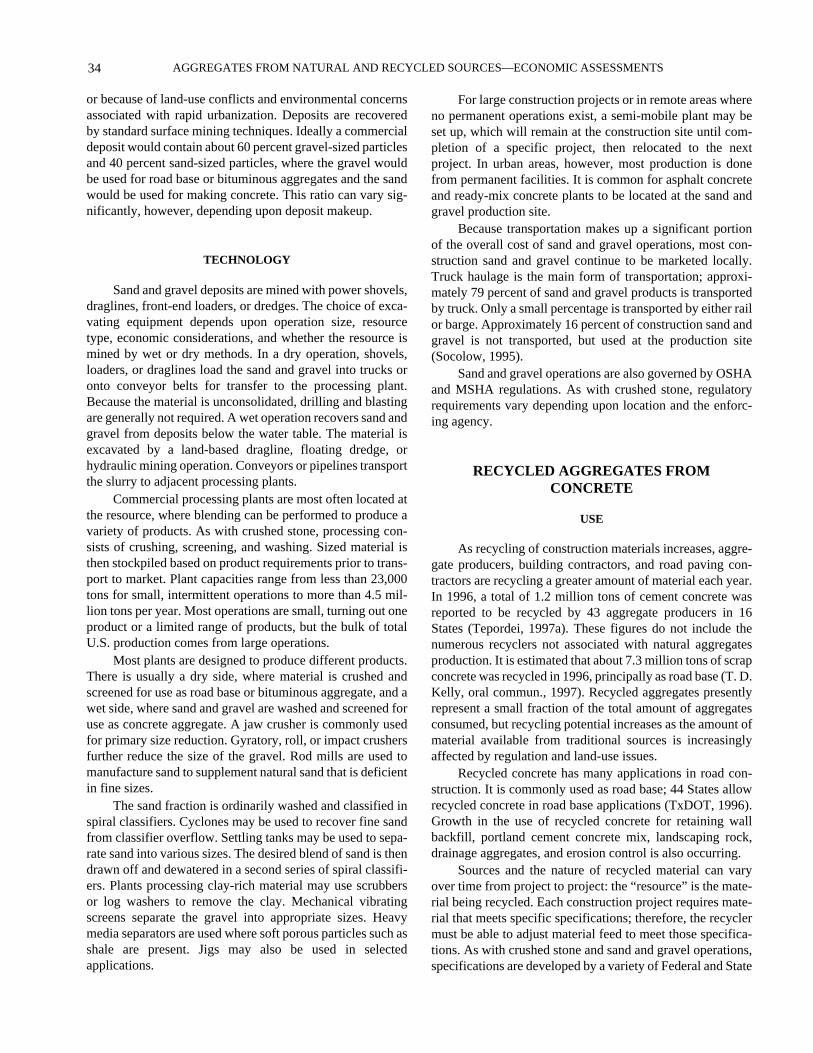
AGGREGATES FROM NATURAL AND RECYCLED SOURCES—ECONOMIC ASSESSMENTS
34
or because of land-use conflicts and environmental concernsassociated with rapid urbanization. Deposits are recoveredby standard surface mining techniques. Ideally a commercialdeposit would contain about 60 percent gravel-sized particlesand 40 percent sand-sized particles, where the gravel wouldbe used for road base or bituminous aggregates and the sandwould be used for making concrete. This ratio can vary sig-nificantly, however, depending upon deposit makeup.
TECHNOLOGY
Sand and gravel deposits are mined with power shovels,draglines, front-end loaders, or dredges. The choice of exca-vating equipment depends upon operation size, resourcetype, economic considerations, and whether the resource ismined by wet or dry methods. In a dry operation, shovels,loaders, or draglines load the sand and gravel into trucks oronto conveyor belts for transfer to the processing plant.Because the material is unconsolidated, drilling and blastingare generally not required. A wet operation recovers sand andgravel from deposits below the water table. The material isexcavated by a land-based dragline, floating dredge, orhydraulic mining operation. Conveyors or pipelines transportthe slurry to adjacent processing plants.
Commercial processing plants are most often located atthe resource, where blending can be performed to produce avariety of products. As with crushed stone, processing con-sists of crushing, screening, and washing. Sized material isthen stockpiled based on product requirements prior to trans-port to market. Plant capacities range from less than 23,000tons for small, intermittent operations to more than 4.5 mil-lion tons per year. Most operations are small, turning out oneproduct or a limited range of products, but the bulk of totalU.S. production comes from large operations.
Most plants are designed to produce different products.There is usually a dry side, where material is crushed andscreened for use as road base or bituminous aggregate, and awet side, where sand and gravel are washed and screened foruse as concrete aggregate. A jaw crusher is commonly usedfor primary size reduction. Gyratory, roll, or impact crushersfurther reduce the size of the gravel. Rod mills are used tomanufacture sand to supplement natural sand that is deficientin fine sizes.
The sand fraction is ordinarily washed and classified inspiral classifiers. Cyclones may be used to recover fine sandfrom classifier overflow. Settling tanks may be used to sepa-rate sand into various sizes. The desired blend of sand is thendrawn off and dewatered in a second series of spiral classifi-ers. Plants processing clay-rich material may use scrubbersor log washers to remove the clay. Mechanical vibratingscreens separate the gravel into appropriate sizes. Heavymedia separators are used where soft porous particles such asshale are present. Jigs may also be used in selectedapplications.
For large construction projects or in remote areas whereno permanent operations exist, a semi-mobile plant may beset up, which will remain at the construction site until com-pletion of a specific project, then relocated to the nextproject. In urban areas, however, most production is donefrom permanent facilities. It is common for asphalt concreteand ready-mix concrete plants to be located at the sand andgravel production site.
Because transportation makes up a significant portionof the overall cost of sand and gravel operations, most con-struction sand and gravel continue to be marketed locally.Truck haulage is the main form of transportation; approxi-mately 79 percent of sand and gravel products is transportedby truck. Only a small percentage is transported by either railor barge. Approximately 16 percent of construction sand andgravel is not transported, but used at the production site(Socolow, 1995).
Sand and gravel operations are also governed by OSHAand MSHA regulations. As with crushed stone, regulatoryrequirements vary depending upon location and the enforc-ing agency.
RECYCLED AGGREGATES FROMCONCRETE
USE
As recycling of construction materials increases, aggre-gate producers, building contractors, and road paving con-tractors are recycling a greater amount of material each year.In 1996, a total of 1.2 million tons of cement concrete wasreported to be recycled by 43 aggregate producers in 16States (Tepordei, 1997a). These figures do not include thenumerous recyclers not associated with natural aggregatesproduction. It is estimated that about 7.3 million tons of scrapconcrete was recycled in 1996, principally as road base (T. D.Kelly, oral commun., 1997). Recycled aggregates presentlyrepresent a small fraction of the total amount of aggregatesconsumed, but recycling potential increases as the amount ofmaterial available from traditional sources is increasinglyaffected by regulation and land-use issues.
Recycled concrete has many applications in road con-struction. It is commonly used as road base; 44 States allowrecycled concrete in road base applications (TxDOT, 1996).Growth in the use of recycled concrete for retaining wallbackfill, portland cement concrete mix, landscaping rock,drainage aggregates, and erosion control is also occurring.
Sources and the nature of recycled material can varyover time from project to project: the “resource” is the mate-rial being recycled. Each construction project requires mate-rial that meets specific specifications; therefore, the recyclermust be able to adjust material feed to meet those specifica-tions. As with crushed stone and sand and gravel operations,specifications are developed by a variety of Federal and State
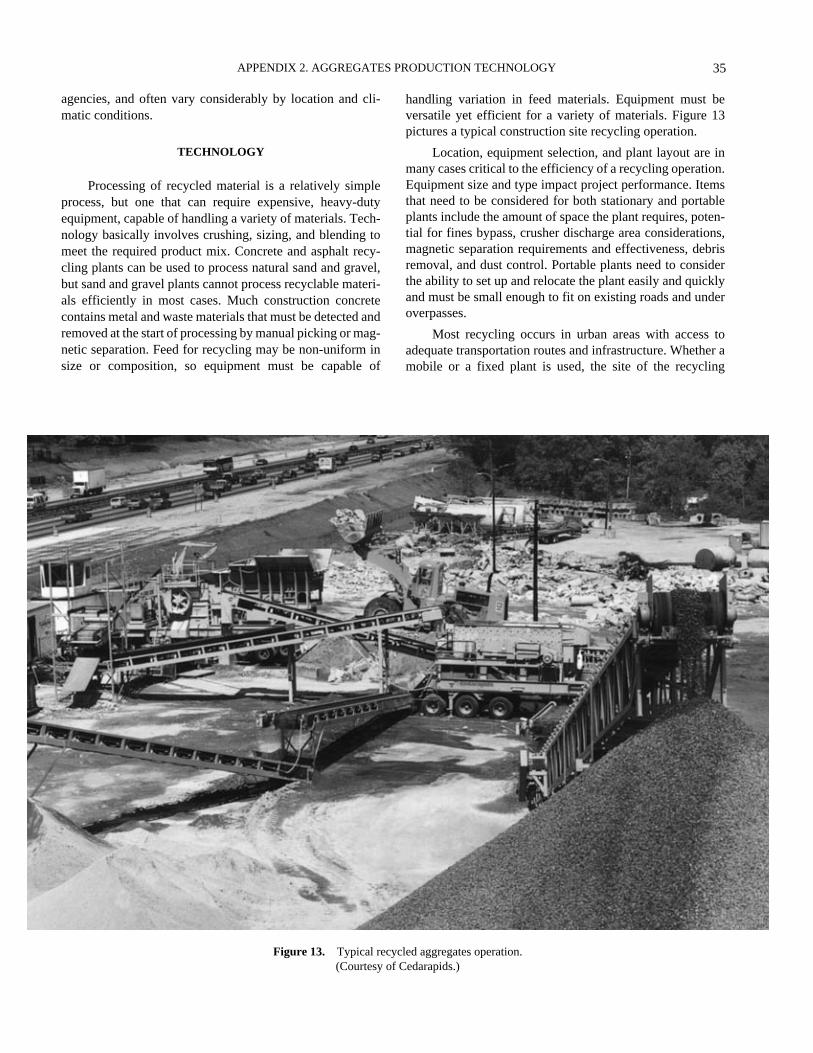
35APPENDIX 2. AGGREGATES PRODUCTION TECHNOLOGY
agencies, and often vary considerably by location and cli-matic conditions.
TECHNOLOGY
Processing of recycled material is a relatively simpleprocess, but one that can require expensive, heavy-dutyequipment, capable of handling a variety of materials. Tech-nology basically involves crushing, sizing, and blending tomeet the required product mix. Concrete and asphalt recy-cling plants can be used to process natural sand and gravel,but sand and gravel plants cannot process recyclable materi-als efficiently in most cases. Much construction concretecontains metal and waste materials that must be detected andremoved at the start of processing by manual picking or mag-netic separation. Feed for recycling may be non-uniform insize or composition, so equipment must be capable of
Figure 13. Typical recy(Courtesy of
handling variation in feed materials. Equipment must beversatile yet efficient for a variety of materials. Figure 13pictures a typical construction site recycling operation.
Location, equipment selection, and plant layout are inmany cases critical to the efficiency of a recycling operation.Equipment size and type impact project performance. Itemsthat need to be considered for both stationary and portableplants include the amount of space the plant requires, poten-tial for fines bypass, crusher discharge area considerations,magnetic separation requirements and effectiveness, debrisremoval, and dust control. Portable plants need to considerthe ability to set up and relocate the plant easily and quicklyand must be small enough to fit on existing roads and underoverpasses.
Most recycling occurs in urban areas with access toadequate transportation routes and infrastructure. Whether amobile or a fixed plant is used, the site of the recycling
cled aggregates operation. Cedarapids.)
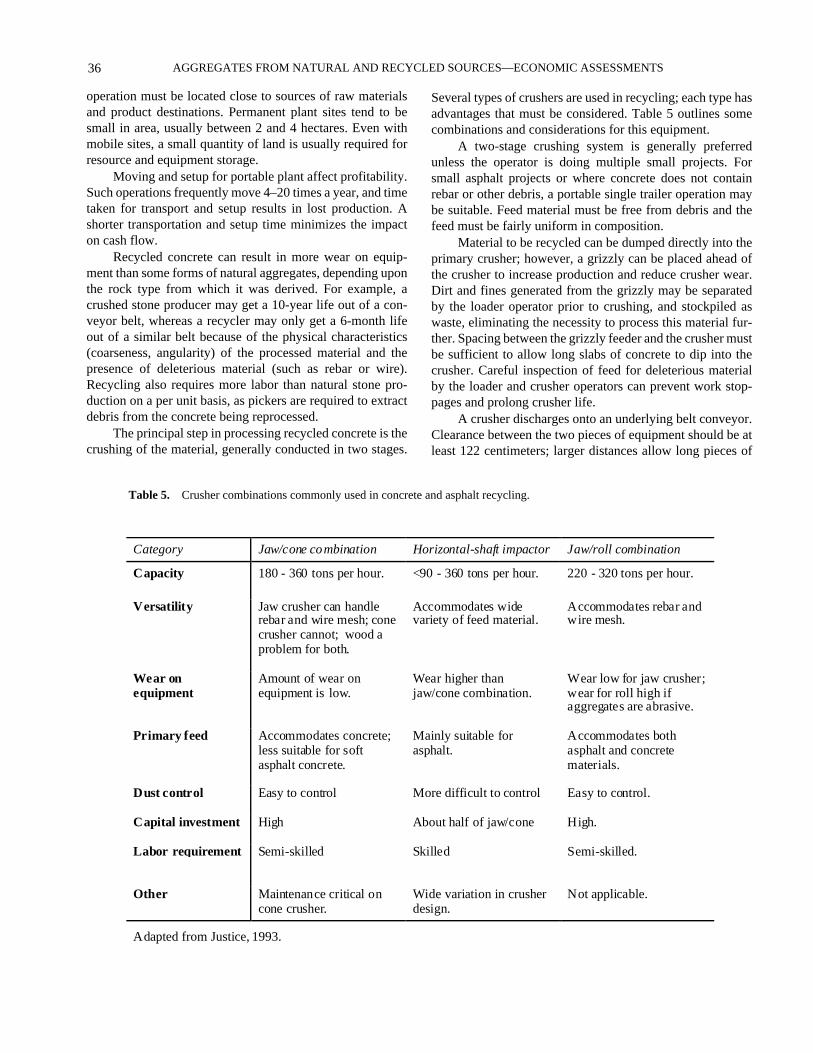
AGGREGATES FROM NATURAL AND RECYCLED SOURCES—ECONOMIC ASSESSMENTS36
operation must be located close to sources of raw materialsand product destinations. Permanent plant sites tend to besmall in area, usually between 2 and 4 hectares. Even withmobile sites, a small quantity of land is usually required forresource and equipment storage.
Moving and setup for portable plant affect profitability.Such operations frequently move 4–20 times a year, and timetaken for transport and setup results in lost production. Ashorter transportation and setup time minimizes the impacton cash flow.
Recycled concrete can result in more wear on equip-ment than some forms of natural aggregates, depending uponthe rock type from which it was derived. For example, acrushed stone producer may get a 10-year life out of a con-veyor belt, whereas a recycler may only get a 6-month lifeout of a similar belt because of the physical characteristics(coarseness, angularity) of the processed material and thepresence of deleterious material (such as rebar or wire).Recycling also requires more labor than natural stone pro-duction on a per unit basis, as pickers are required to extractdebris from the concrete being reprocessed.
The principal step in processing recycled concrete is thecrushing of the material, generally conducted in two stages.
Category Jaw/cone combination H
Capacity 180 - 360 tons per hour. <
Versatility Jaw crusher can handlerebar and wire mesh; conecrusher cannot; wood aproblem for both.
Av
Wear onequipment
Amount of wear onequipment is low.
Wja
Primary feed Accommodates concrete;less suitable for softasphalt concrete.
Mas
Dust control Easy to control M
Capital investment High A
Labor requirement Semi-skilled S
Other Maintenance critical oncone crusher.
Wd
Adapted from Justice, 1993.
Table 5. Crusher combinations commonly used in concrete
Several types of crushers are used in recycling; each type hasadvantages that must be considered. Table 5 outlines somecombinations and considerations for this equipment.
A two-stage crushing system is generally preferredunless the operator is doing multiple small projects. Forsmall asphalt projects or where concrete does not containrebar or other debris, a portable single trailer operation maybe suitable. Feed material must be free from debris and thefeed must be fairly uniform in composition.
Material to be recycled can be dumped directly into theprimary crusher; however, a grizzly can be placed ahead ofthe crusher to increase production and reduce crusher wear.Dirt and fines generated from the grizzly may be separatedby the loader operator prior to crushing, and stockpiled aswaste, eliminating the necessity to process this material fur-ther. Spacing between the grizzly feeder and the crusher mustbe sufficient to allow long slabs of concrete to dip into thecrusher. Careful inspection of feed for deleterious materialby the loader and crusher operators can prevent work stop-pages and prolong crusher life.
A crusher discharges onto an underlying belt conveyor.Clearance between the two pieces of equipment should be atleast 122 centimeters; larger distances allow long pieces of
orizontal-shaft impactor Jaw/roll combination
90 - 360 tons per hour. 220 - 320 tons per hour.
ccommodates wideariety of feed material.
Accommodates rebar andwire mesh.
ear higher thanw/cone combination.
Wear low for jaw crusher;wear for roll high ifaggregates are abrasive.
ainly suitable forphalt.
Accommodates bothasphalt and concretematerials.
ore difficult to control Easy to control.
bout half of jaw/cone High.
killed Semi-skilled.
ide variation in crusheresign.
Not applicable.
and asphalt recycling.
37
APPENDIX 2. AGGREGATES PRODUCTION TECHNOLOGY
rebar to fall free of the crusher without jamming themachine. A smaller clearance height may be necessary onportable plants to allow for transport and bridge clearance.Material is often hand picked at this point to remove wastematerial.
Magnets are an important piece of equipment whenrecycling concrete, as they aid in the removal of rebar andwire mesh commonly found in concrete demolition debris.Separator design and layout are important; separators com-monly used in other mining applications often have features(pulley design, metal belt, for example) that are costly inrecycling (Busse, 1993). For optimum efficiency, the con-veyor beneath the magnetic separator should be running atthe same speed as the separator belt.
Once the material has undergone primary crushing, itgenerally is screened to separate usable sizes of materialfrom waste. Screens that maximize open area are generallythe most efficient but wear out rapidly in recycling opera-tions. Screened material is either sent to a secondary crusher,conveyed to stockpiles, or sent directly to the constructionproject as feed.
Debris removal at a recycling facility can be minimizedbut not eliminated. Operators at permanent plants can beselective in the materials accepted, but portable operationsaccept most of what is available for reprocessing on-site. Forboth plant types, manual picking stations located both priorto crushing and during screening separate out rags, paper,wood, and other debris. At sites that process various materi-als, the loader and crusher operators can also serve to sort,blend, and keep the feeder properly filled, improving theproductivity of the operation.
Because recycling operations are often located nearconstruction sites in urban areas, the need for good dust con-trol becomes increasingly important. An engineered waterspray system with a wetting agent can meet most regulatoryagency requirements for dust control. For dusty crushers, abaghouse may be used. Small baghouses designed for porta-ble crushers and smaller stationary operations have beenshown to meet regulatory requirements.
RECYCLED AGGREGATES FROMRECLAIMED ASPHALT PAVEMENT
USE
In 1995, a total of 1.6 million tons of asphalt concretewas reported as being recycled by 62 companies in 26 States(Tepordei, 1996c). Although only a small fraction of the
total material available is reported to be recycled, itrepresented a 92 percent increase over the amount recycledin 1994. An estimated 45.4 million tons of scrap asphaltpavement was recycled in 1996 (T.D. Kelly, oral commun.,1997). Asphalt plants allow up to 45 percent of the productto contain recycled material from reclaimed asphalt pave-ment; recycled material typically makes up 20–25 percent ofthe asphalt concrete mix in most U.S. locations. Parking lotsmay utilize up to 100 percent of recycled asphalt material inselected hot-mix applications.
Applications for recycled asphalt concrete in road con-struction include pavement hot-mixes, road base, parking lotand residential driveway surfacing, and road shoulder work.Technical specifications for recycling asphalt concrete aresimilar to those of primary asphalt concrete; local or Statespecifications must be met for each construction project.Often, specifications are different depending upon locationor application.
TECHNOLOGY
Site location and equipment selection criteria are simi-lar to those reported for recycled concrete operations. Muchof the equipment has been adapted from rock crushing appli-cations, with modifications for efficiently handling the oil-based asphalt mixture. As with concrete recycling, technol-ogy basically involves crushing, sizing, and blending to meetthe required product mix. Crusher types used for asphalt con-crete recycling are reported in table 5. As with concrete recy-cling, much feed material is not uniform in characteristic andcomposition, so the equipment must be able to treat a widevariety of materials and remove nonrecyclable debris.Although smaller jaw crushers have been used at some oper-ations, it is generally agreed that unless the operation is aportable one, the bigger units provide better wear and pro-ductivity than smaller units (R. Hawkins, oral commun.,1996). For portable operations, the size of the unit shouldgenerally be as large as local movement restrictions allow.
When recycling asphalt concrete, operators make pro-visions for removing dirt from the feed material. A grizzlyfeeder located prior to the crusher can accomplish this task.Dirt removal can also reduce the moisture content of theasphalt concrete and reduce the amount of asphalt thatadheres to the machinery.
Asphalt is often cleaner and easier to separate thancement concrete debris. In many operations, loads of asphaltare processed separately from loads of cement concretedebris, using the same equipment.


![Adopting recycled aggregates as sustainable construction ... · aggregates, call for the utilization of recycled alternatives to meet the construction industry needs [6]. The increasing](https://img.dokumen.tips/doc/110x75/5f08c25b7e708231d4239576/adopting-recycled-aggregates-as-sustainable-construction-aggregates-call-for.jpg)