Embed Size (px)
Citation preview


AGENDA Commonwealth of Virginia Treasury Board
February 20, 2019 9:00 a.m.
James Monroe Building, 3rd Floor Treasury Board Room
Call to Order
1. Approval of November 15, 2018 Minutes Public Comment
Action Item
2. A Resolution Authorizing Equipment Financing Under a Proposed Master Equipment Lease Agreement for Virginia Port Authority
3. A Resolution Approving the Plan of Finance for the Virginia Public Building Authority of its
Public Facilities Revenue Bonds
4. Motion on Treasury Board Financial Advisory Procurement Board Briefing
5. Optimal Services Group of Wells Fargo Advisors Briefing on the 4th Quarter Performance Reports for the Extended Duration Credit Portfolio and TICR Investment Portfolio
Staff Reports
6. Debt Management a. Debt Calendar
b. Master Equipment Leasing Program c. Virginia Energy Leasing Program d. Final Financing Summary, Virginia College Building Authority
7. Security for Public Deposits 8. State Non-Arbitrage Program
9. Investments
a. General Account b. LGIP
Next Board Meeting Date – March 20, 2019 Adjourn

TREASURY BOARD COMMONWEALTH OF VIRGINIA
November 15, 2018 9:00 a.m.
Treasury Board Conference Room James Monroe Building
101 N. 14th Street, 3rd Floor Richmond, Virginia
Members Present: Manju S. Ganeriwala, Chairwoman
James Carney Douglas Densmore Lou Mejia
David Von Moll Members Absent: Neil Amin
Craig Burns Others Present:
Don Ferguson Office of the Attorney General Katie Collins Auditor of Public Accounts Kevin Larkin Bank of America Douglas Hornsby Christopher Newport University Real Estate
Foundation Megan Gilliland Kaufman and Canoles Bill Zuk JP Morgan Bryce Lee Optimal Service Group Karen Logan Optimal Service Group Brian Moore Optimal Service Group Page Allen Wells Fargo Patrick Dixon Wells Fargo Janet Aylor Department of the Treasury Neil Boege Department of the Treasury Vernita Boone Department of the Treasury Leslie English Department of the Treasury Debora Greene Department of the Treasury Kathy Green Department of the Treasury Laura Lingo Department of the Treasury Jay Mahone Department of the Treasury Kristin Reiter Department of the Treasury Sandra Stanley Department of the Treasury Mike Tutor Department of the Treasury
Bill Watt Department of the Treasury Tim Wilhide Department of the Treasury

2
Call to Order and Approval of Minutes Chairwoman Ganeriwala welcomed Board members and called the meeting to order at 9:06 a.m. Chairwoman Ganeriwala asked if there were any changes or revisions to the October 17 meeting minutes. Mr. Von Moll moved for approval of the minutes. Mr. Densmore seconded and the motion carried unanimously. Public Comment None Action Items Resolution Approving the Proposed Terms and Structure of a Bond to Refinance a Student Housing Facility Owned by Christopher Newport University Education Foundation and Leased to Christopher Newport University Janet Aylor introduced Douglas Hornsby, CFO of the Christopher Newport University Education and Real Estate Foundations and Megan Gilliland, of Kaufman and Canoles, Bond Counsel to the Foundations. Ms. Aylor presented the Preliminary Financing Summary for the refinance at final maturity (as of December 1, 2018): (1) the Industrial Development Authority of Richmond County, Virginia, Revenue Bond (Christopher Newport University Student Housing Project), Series 2013, in the original principal amount of $4.2 billion, which refinanced the Industrial Development Authority of New Kent County, Virginia, $5.5 million Revenue Bond (Christopher Newport University Project), Series 2002, which financed a portion of the costs of constructing and equipping a student housing complex (the “CNU Apartments”); and (ii) the Economic Development Authority of the City of Poquoson, Virginia, Revenue Bond (Christopher Newport University Student Housing Project), Series 2013, in the original principal amount of $7.4 billion, which refinanced the Industrial Development Authority of New Kent County, Virginia, $10 million Revenue Bond (Christopher Newport University Project), Series 2001, which also financed a portion of the costs of constructing and equipping such CNU Apartments. The Bonds are scheduled for direct placement with Bank of America, National Association on the closing date prior to December 1, 2018 (the maturity date of the 2013 Bonds) and will be consolidated into one note. The Bond will be priced as a tax-exempt bank-qualified bond at a current fixed interest rate per annum of 3.85%; subject to yield protection in the event of change in maximum federal corporate tax rate, determination of taxability, loss of bank-qualified status, or change in laws or regulations relating to capital adequacy. The bond is not to exceed $9.5 million in the aggregate. The Bond will amortize principal at the rate of $50,000 per month over the next five years. The Board can expect CNU Foundation to be back in five years to finance the debt. Megan Gilliland reviewed the resolution. Discussion ensued.

3
Chairwoman Ganeriwala asked for a motion to approve the Resolution. Mr. Carney moved that the Resolution be adopted. Mr. Densmore seconded and the motion carried unanimously. Motion to Procure a Line of Credit for the Master Equipment Leasing Program Janet Aylor reviewed the Motion to Procure a Line of Credit for the Master Equipment Leasing Program. The current lease expires at the end of February 2019. Ms. Aylor explained that this was a routine procurement. Approval of the Motion will allow Treasury staff to move forward with the procurement. Chairwoman Ganeriwala asked for a motion to approve the Resolution. Mr. Von Moll moved that the Resolution be adopted. Mr. Mejia seconded and the motion carried unanimously. Board Briefing Brian Moore and Karen Logan briefed the Board on the General Account External Managers’ investment performance and the Quarterly Investment Manager Performance of the TICR Endowment for taxable and tax-exempt portfolios for the 3rd quarter of 2018. Mr. Moore briefed the Board on the General Account External Manager’s portfolio. The portfolio was valued at $1.26 billion and had earned income of $9.1 million. The portfolio return in the 3rd quarter was 0.2% net of fees, matching the benchmark net of fees. Discussion ensued. Ms. Logan briefed the Board on the TICR tax exempt and TICR taxable portfolios. The TICR taxable portfolio was valued at $229 million and had earned income of $1.8 million. The portfolio return in the 3rd quarter was 0.3% net of fees, 0.2% over the benchmark. The TICR tax-exempt portfolio was valued at $185.6 million, earned income of $1.1 million and an unrealized loss of $1.3 million. The 3rd quarter return net of fees was 0.1% net of fees, matching the benchmark net of fees. Discussion ensued. Staff Reports Debt Management Ms. Aylor reviewed the Debt Calendar as of November 1, 2018 and the leasing reports as of October 31, 2018. She informed the Board that several new leases were provided in October for equipment. She also informed the Board that roughly $18 million was used to date under the Master Lease Program leaving a line of credit balance of $22.5 million. In addition, $19.3 million was previously provided under the Energy Lease Program and the line of credit balance is $40.7 million. There were no new activity in the Energy Lease Program. Ms. Aylor reviewed the Virginia College Building Authority’s Final Financing Summary for $211.2 million of 2018A and 2018B Bonds ($134.5 million tax-exempt and $76.7 million taxable) that will be

4
used to finance the cost of specified capital projects at various public institutions of higher education in the Commonwealth of Virginia. The Bonds were sold on November 6, 2018 and will be delivered on December 4, 2018. Security for Public Deposits Kristin Reiter reviewed the Security for Public Deposits Report for the month ended September 30, 2018. Ms. Reiter reported that one bank (HomeTrust Bank) was under-collateralized for the month. Ms. Reiter noted that the IDC ratings have been updated using IDC’s 2nd Quarter 2018 ratings. One pooled bank (Virginia Commonwealth Bank) was removed from the below average list. Two pooled banks (Blue Grass Valley Bank and Carter Bank & Trust) were ranked below average this month. Two banks, Bank of Fincastle and Highlands Union Bank, are opt-out banks that were also ranked below average. Ms. Reiter then reviewed the quarterly statistics reports. As of September 30, 94 public depositories held public deposit balances (net of FDIC) of $7.3 billion; $4.9 billion of these deposits were held by 29 opt-out depositories. A total of $2.4 billion was held by 65 pooled depositories. Our four largest public depositories held $3.5 billion or 48% of total public deposit balances net of FDIC. There were no significant changes in deposit balances of our largest depositories between June and September. A summary of the types of securities pledged as collateral at September 30 by pooled and opt-out banks was also provided. There were no significant changes in the types of securities pledged between this quarter and last quarter. Next, banks holding Virginia public deposits were categorized based on where and how the banks are chartered. Banks chartered in Virginia hold 95% of pooled public deposits whereas 93% of public deposits held by opt-out banks are held by out-of-state banks. In total, 63% of public deposits net of FDIC are held by out-of-state banks. Ms. Reiter then reported that Chairwoman Ganeriwala had sent a memorandum to each pooled public depository in November to assist them with fully understanding the contingent liability exposure associated with using the pooled collateral method. Each pooled depository was provided their projected contingent liability under three scenarios assuming the failure of a pooled public depository and the loss of public funds. The memorandum coincided with November’s open election period when qualified public depositories can choose between the pooled and dedicated collateral methods for the upcoming year. Discussion ensued. State Non-Arbitrage Program Neil Boege provided a portfolio overview. Rates increased in September. The fund’s assets were valued at $3.8 billion. The monthly yield was 2.33%, twelve basis points higher than the month prior. The weighted average maturity of the fund was 38 days. Mr. Boege reported that PFM recently rolled-out its multifactor authentication on their website; 88 of their 587 users are registered to date.

5
Investments Neil Boege reviewed the Investment reports for the month ended October 31, 2018. Market rates continued to move upward. The General Account portfolio was valued at $7.4 billion. The average yield on the Primary Liquidity portion of the General Account was 2.31%, up fourteen basis points from the month prior. The Extended Duration portion of the portfolio had a yield to maturity of 3.44%. This resulted in the composite yield being 2.50% for the month. Mr. Boege then reviewed the LGIP portfolio. The LGIP portfolio was in compliance for all measures for the month of October. The LGIP portfolio was valued at $4.0 billion. The average yield on the portfolio was 2.33%, up eleven basis points from the month prior. The average maturity was 50 days, the same as the previous month. Mr. Boege then reviewed the LGIP Extended Maturity portfolio. The LGIP Extended Maturity portfolio was in compliance for all measures for the month of October. The net asset value yield to maturity was 2.24%, up five points from the month prior. The average duration was 0.77 years. Other Business Chairwoman Ganeriwala stated that the next meeting of Treasury Board is scheduled for December 19, 2018. The meeting adjourned at 10:14 a.m. Respectfully submitted, ____________________________ Vernita Boone, Secretary Commonwealth of Virginia Treasury Board

Preliminary Financing Summary Virginia Port Authority
$30,000,000 2019 Extension of Master Equipment Lease Purchase
Dated as of February 5, 2019
*Preliminary, subject to change.
Agency Submitting Request:
Virginia Port Authority (the “Authority”)
Amount: Not-to-exceed $30 million Project to be financed:
Certain equipment including Ship to Shore Container Cranes, Rail Mounted Gantry Cranes, Rubber Tire Gantry Cranes, Shuttle Carriers, Reach Stackers, Top Picks, Empty Container Handlers, Yard Hustlers (UTRs), Bomb Carts and other such similar equipment in connection with the ongoing renovation of Norfolk International Terminals, but that also may be used at Portsmouth Marine Terminal, Richmond Marine Terminal, Virginia Inland Port and Virginia International Gateway Terminal.
Financing provided by:
Bank of America Public Capital Corp (“BAPCC”)
Estimated Interest Rate:*
Interest rates on each draw will be set based on the agreed upon formula and prevailing market rates at the time of draw.
*As of February 1, 2019, subject to change.
Structure: The Authority is seeking to increase the funding amount under an existing Master Equipment Lease Agreement (the “Agreement”) by an additional $30 million and extend the procurement period of the Agreement by an additional year, to September 30, 2021. The Authority and BAPCC initially entered into a Master Equipment Lease Agreement (the “Agreement”) on October 27, 2017, which provided access to funding up to $37 million in terminal operating equipment. The Authority has previously financed equipment under the Agreement in the aggregate principal amount of $29,937,422.90, leaving a remaining balance of $7,062,577.10 for additional equipment financings. The Agreement permits the Authority and BAPCC to increase the funding amount up to an additional $30 million and also extend the procurement period of the Agreement by an additional year, to September 30, 2021. Lease Payments under the Agreement are Subordinate Obligations under the Authority’s Bond Resolution 16-9. This lien within VPA’s terminal revenue bond program is unrated and obligations issued under Bond Resolution 16-9 are payable from Net
Term of Loan 5-year 7-year 10-year 15-year
Interest Rate* (Tax-exempt,
subject to AMT)
2.38%
64.1% of 3yr SWAP
index + 0.7072%
2.46%
64.1% of 4yr SWAP
index + 0.8048%
2.79%
64.1% of 5yr SWAP
index + 1.1293%
3.05%
64.1% of 9yr SWAP
index + 1.3279%
Interest Rate* (Taxable)
3.72%
100% of 3yr SWAP index +
1.1112%
3.85%
100% of 4yr SWAP index +
1.2641%
4.36%
100% of 5yr SWAP
index + 1.7721%
4.77%
100% of 9yr SWAP index +
2.0835%

Preliminary Financing Summary Virginia Port Authority
$30,000,000 2019 Extension of Master Equipment Lease Purchase
Dated as of February 5, 2019
*Preliminary, subject to change.
Revenue of the Authority derived from terminal operations. Payment on Subordinate Obligations are junior as to payment and security to Senior Obligations (consisting solely of a capitalized lease obligation between the Authority and the private landlord for the Virginia International Gateway Terminal) and the Authority’s outstanding Port Facilities Revenue Bonds in the aggregate principal amount of $224,665,000 and any other Bonds which may be issued in the future under Resolution 16-9. Currently, the Authority has $28.4 million of Subordinate Obligations outstanding.
Mode: Interest rates on each draw will be set based on the agreed upon formula and the
applicable index at the time of draw. At the time of draw, interest rate will be fixed for the life of each draw/loan.
Comparable Master Lease Rate:*
Below is the estimated interest rate under for comparable terms under the Treasury Board’s Master Equipment Lease Program, assuming a semi-annual payment structure.
*As of February 1, 2019, subject to change.
Term of Loan 5-year 7-year 10-year 15-year
Interest Rate* (Tax-exempt, Not subject to
AMT)
2.70%
79% of 5yr SWAP index + 0.6581%
2.81%
79% of 7yr SWAP index + 0.7335%
2.92%
79% of 10yr SWAP index +
0.7753%
Not Available
Interest Rate* (Taxable) Not Available Not Available Not Available Not
Available
Amortization Period*:
Each Lease shall amortize with a term of 5, 7, 10 or 15 years to match the useful life of the financed equipment, with level annual debt service and ability to prepay.
Payments:* Semi-annual payments. Payment dates may vary.


KUTAK ROCK LLP DRAFT 2/8/19
FIRST AMENDMENT TO MASTER EQUIPMENT LEASE AGREEMENT
This First Amendment to Master Equipment Lease Agreement is dated as of _____________, 2019 (“Amendment”) between VIRGINIA PORT AUTHORITY (the “Lessee”), and BANC OF AMERICA PUBLIC CAPITAL CORP (the “Lessor”).
The Lessee and the Lessor entered a Master Equipment Lease Agreement (the
“Agreement”), between the Lessee and the Lessor, dated as of October 27, 2017 wherein the Lessee was provided access to funding to finance the acquisition of up to $37,000,000 in terminal operating Equipment (as defined in the Master Agreement”).
The Lessee has previously financed Equipment under the Agreement in two separate
Leases (as defined in the Agreement) in the aggregate principal amount of $29,937,422.90, leaving a remaining balance of $7,062,577.10 for additional Equipment financings.
The Lessee desires to finance the acquisition of additional Equipment under the
Agreement with a total estimated cost in excess of the remaining balance, making it necessary to increase the amount of acquisition financing available thereunder and to extend the term during which Equipment may be acquired.
Section 7(c) of the Agreement permits the Procurement Period (as defined in the
Agreement) initially ending on September 30, 2020, to be extended for an additional 12-month period and the Procurement Amount (as defined in the Master Agreement) to be increased up to an additional $30,000,000 upon mutually satisfactory written agreement between Lessor and Lessee executed prior to the end of the initial term of the Procurement Period, and the Lessor and Lessee desire to enter into this Amendment to effectuate the extension and increase permitted by such section.
NOW, THEREFORE, in consideration of the foregoing premises and the mutual agreements herein contained and other good and valuable consideration, the receipt and sufficiency of which are hereby acknowledged, the parties agree as follows:
1. Amendment to Section 1, Definitions. The following defined terms in Section 1 of the Agreement are hereby redefined with the following meanings:
“Authorizing Resolution” means the Resolution of Lessee dated September 26, 2017, by which the Agreement was approved by Lessee’s Board, together with the Certificate of Consents dated February 15, 2019 executed and delivered by each of the Chairman of the Board and Chairman of the Finance and Audit Committee approving this Amendment on behalf of the Board as permitted by the Lessee’s Bylaws.
“Bond Counsel” means any law firm or individual attorney nationally recognized
in the practice of municipal public finance generally acceptable to the Lessor.
2
“Expiration Date” means September 30, 2021. “Procurement Amount” means an amount not to exceed $67,000,000.
“Procurement Period” means the period during which Lessee may enter into new Leases for the purchase of Equipment which shall be from the commencement of the Agreement to the Expiration Date (which was extended to September 30, 2021pursuant to Section 7 (c) of the Agreement); provided that Lessor’s obligation to continue to enter into Leases during the Procurement Period is subject to annual credit review.
2. Opinion of General Counsel. Notwithstanding Section 2(c) of the Agreement,
in connection with any Lease entered into pursuant to the $30,000,000 increase in Procurement Amount and one year extension of the Procurement Period established in this Amendment, the requirement for an opinion of Bond Counsel to address matters in clause (iii) of such section with respect to due authorization, execution and delivery, may be addressed by an opinion of the Lessee’s General Counsel upon which the opinion of Bond Counsel may rely; provided all other matters required by such Section 2(c) are addressed by the opinion of Bond Counsel.
3. No Further Amendments. Except as herein amended, the terms of the Master Agreement remain in full force and effect.
4. Counterparts. This Amendment may be executed in several counterparts, each of which will be regarded as an original and all of which will constitute one and the same document.
5. Governing Law. This Amendment shall be governed by and construed in accordance with the laws of the Commonwealth of Virginia.

3
IN WITNESS WHEREOF, the parties have executed and delivered this First
Amendment to Master Equipment Lease Agreement as of the day and year written above.
VIRGINIA PORT AUTHORITY By Name: Title:
BANC OF AMERICA PUBLIC CAPITAL
CORP By Name: ___________________________ Title: ___________________________ 4813-0581-5174.3

1 4827-6830-4518.2
CHAIRMAN’S CERTIFICATE OF APPROVAL AND CONSENT AUTHORIZING THE EXTENSION OF THE TERM AND INCREASE IN AMOUNT OF A PREVIOUSLY APPROVED MASTER LEASE EQUIPMENT FINANCING PROGRAM WITH BANC OF AMERICA PUBLIC CAPITAL CORP FOR THE ACQUISITION OF TERMINAL OPERATING EQUIPMENT IN THE AGGREGATE PRINCIPAL AMOUNT UP TO AN ADDITIONAL $30,000,000, AND DELEGATING TO THE EXECUTIVE DIRECTOR OF THE AUTHORITY RESPONSIBILITY FOR FIXING THE PRINCIPAL AMOUNT, THE TERM, THE INTEREST RATES, THE REPAYMENT PROVISIONS AND OTHER DETAILS THEREOF, AND AUTHORIZING THE EXECUTION AND DELIVERY OF SUCH DOCUMENTATION IN CONNECTION THEREWITH.
WHEREAS, the Virginia Port Authority (the “Authority”) acting by its Board of
Commissioners (the “Board”) has heretofore adopted Resolution No. 17-12 (the “Master Lease Resolution”), authorizing a Master Lease Financing Agreement (the “Master Lease”) with Banc of America Public Capital Corp (the “Lessor”) to implement a financing plan to finance the acquisition of up to $37,000,000 in terminal operating equipment; and
WHEREAS, the Authority has previously financed equipment under the Master Lease in
two separate financings in the aggregate principal amount of $29,937,422.90, leaving a remaining balance of $7,062,577.10 for additional equipment financings; and
WHEREAS, the Authority desires to finance the acquisition of additional equipment under
the Master Lease with a total estimated cost in excess of the remaining balance, making it necessary increase the amount of acquisition financing available thereunder and the term thereof; and
WHEREAS, the Master Lease by its terms permits an increase in the amount of acquisition
financing thereunder in an amount up to an additional $30,000,000 and permits the extension of the term of the procurement period for up to one year; and
WHEREAS, pursuant to Item C-40, Chapter 2 of the 2018 Virginia Acts of Assembly the General Assembly of the Commonwealth of Virginia has authorized the acquisition by the Authority of terminal operating equipment at a total cost of $37,000,000, such amount is in addition to the $37,000,000 previously authorized by the General Assembly in connection with the Master Lease; and
WHEREAS, payments made by the Authority pursuant to the Master Lease have been
designated as Subordinate Obligations under the Resolution No. 16-9 (the “Bond Resolution”) and, as such, subordinate as to payment from the Authority’s Net Revenue to the Senior Obligations outstanding from time to time under the Bond Resolution; and
WHEREAS, Section 3.4.1 of the Authority’s Bylaws, amended and restated as of
November 1, 2016, permits the Executive Director to enter into contracts, agreements or
2 4827-6830-4518.2
arrangements on the Authority’s behalf in excess of $2,500,000 without the written consent of the Board if the Executive Director has obtained the prior written consent of the Chairman of the Board and the Chairman of the Finance and Audit Committee.
WHEREAS, the Chairman of the Board and the Chairman of the Finance and Audit Committee have determined that it is necessary to delegate to the Executive Director the authority to approve the documentation required to evidence the increase in amount and extension of the Master Lease, execute and deliver such documentation and approve the aggregate principal amount, the term, the interest rates, the repayment provisions and other details thereof subject to the parameters established hereby.
NOW, THEREFORE, the Undersigned Chairman of the Board hereby approves and
consents on behalf of the Board of the Authority, as follows:
Section 1. Authorization and Increase of Amount and Extension of Term. (a) The Authority is hereby authorized to acquire additional equipment pursuant to the
financing plan evidenced by the Master Lease in the principal amount up to an additional $30,000,000 above the prior authorization under the Master Lease Resolution.
(b) As previously designated by the Board in the Master Lease Resolution, the Master
Lease obligations will be Subordinate Obligations under the Bond Resolution.
Section 2. Terms of Extension. The Executive Director is hereby authorized, if the Authority’s Financial Advisor shall so recommend, to:
(a) Extend the procurement period under the Master Lease for an additional one year from the September 30, 2020 initial termination date to September 30, 2021; and
(b) Provide for the interest portion of the payments made thereunder to be calculated
using a rate per annum not to exceed 4.50% for tax-exempt lease payments and 6.0% for taxable lease payments.
Section 3. Approval of Documents. The Executive Director is hereby authorized to approve the form of the documentation required to evidence the increase and extension under the Master Lease herein authorized, including any amendments or modifications to the Master Lease and any related agreements. The execution and delivery of such documentation is hereby authorized.
Section 4. Official Intent. The Authority intends that the proceeds from the Master Lease
be used to pay or reimburse the Authority for the payment of any expenditures made after the effective date of this authorization with regard to expenditures incurred in connection with the equipment. The execution of this Certificate confirms the “official intent” of the Authority within the meaning of Treasury Regulations Section 1.150-2 promulgated under the Internal Revenue Code of 1986, as amended.

3 4827-6830-4518.2
Section 5. Tax Covenant. The Authority covenants that it will comply with the provisions of the Internal Revenue Code of 1986, as amended (the “Code”), so that interest portion of the payments on tax-exempt lease payments made to the Lessor pursuant to the Agreement do not become includable in gross income of the Lessor for federal income tax purposes under the Code.
Section 6. Ratification; Further Action. The actions previously taken by the officers and
staff of the Authority are hereby ratified and confirmed. The officers and staff of the Authority are hereby authorized to take such actions, and deliver such additional documents and certificates, as they may in their discretion deem necessary or proper in connection with the increase and extension Master Lease herein authorized.
Section 7. Treasury Board Approval. The Authority requests the Treasury Board of the
Commonwealth of Virginia to approve the financing lease terms and structure in accordance with Section 2.2-2416.5 of the Code of Virginia of 1950, as amended. Staff is authorized and directed to apply for such approval.
Section 8. Effective Date. This authorization herein provided shall take effect immediately
on the date hereof.

4 4827-6830-4518.2
Date: February 15, 2019
By: Name: (Printed)
Title: Chairman of the Board

1 4838-0816-7559.1
CHAIRMAN’S CERTIFICATE OF APPROVAL AND CONSENT AUTHORIZING THE EXTENSION OF THE TERM AND INCREASE IN AMOUNT OF A PREVIOUSLY APPROVED MASTER LEASE EQUIPMENT FINANCING PROGRAM WITH BANC OF AMERICA PUBLIC CAPITAL CORP FOR THE ACQUISITION OF TERMINAL OPERATING EQUIPMENT IN THE AGGREGATE PRINCIPAL AMOUNT UP TO AN ADDITIONAL $30,000,000, AND DELEGATING TO THE EXECUTIVE DIRECTOR OF THE AUTHORITY RESPONSIBILITY FOR FIXING THE PRINCIPAL AMOUNT, THE TERM, THE INTEREST RATES, THE REPAYMENT PROVISIONS AND OTHER DETAILS THEREOF, AND AUTHORIZING THE EXECUTION AND DELIVERY OF SUCH DOCUMENTATION IN CONNECTION THEREWITH.
WHEREAS, the Virginia Port Authority (the “Authority”) acting by its Board of
Commissioners (the “Board”) has heretofore adopted Resolution No. 17-12 (the “Master Lease Resolution”), authorizing a Master Lease Financing Agreement (the “Master Lease”) with Banc of America Public Capital Corp (the “Lessor”) to implement a financing plan to finance the acquisition of up to $37,000,000 in terminal operating equipment; and
WHEREAS, the Authority has previously financed equipment under the Master Lease in
two separate financings in the aggregate principal amount of $29,937,422.90, leaving a remaining balance of $7,062,577.10 for additional equipment financings; and
WHEREAS, the Authority desires to finance the acquisition of additional equipment under
the Master Lease with a total estimated cost in excess of the remaining balance, making it necessary increase the amount of acquisition financing available thereunder and the term thereof; and
WHEREAS, the Master Lease by its terms permits an increase in the amount of acquisition
financing thereunder in an amount up to an additional $30,000,000 and permits the extension of the term of the procurement period for up to one year; and
WHEREAS, pursuant to Item C-40, Chapter 2 of the 2018 Virginia Acts of Assembly the General Assembly of the Commonwealth of Virginia has authorized the acquisition by the Authority of terminal operating equipment at a total cost of $37,000,000, such amount is in addition to the $37,000,000 previously authorized by the General Assembly in connection with the Master Lease; and
WHEREAS, payments made by the Authority pursuant to the Master Lease have been
designated as Subordinate Obligations under the Resolution No. 16-9 (the “Bond Resolution”) and, as such, subordinate as to payment from the Authority’s Net Revenue to the Senior Obligations outstanding from time to time under the Bond Resolution; and
WHEREAS, Section 3.4.1 of the Authority’s Bylaws, amended and restated as of
November 1, 2016, permits the Executive Director to enter into contracts, agreements or

2 4838-0816-7559.1
arrangements on the Authority’s behalf in excess of $2,500,000 without the written consent of the Board if the Executive Director has obtained the prior written consent of the Chairman of the Board and the Chairman of the Finance and Audit Committee.
WHEREAS, the Chairman of the Board and the Chairman of the Finance and Audit Committee have determined that it is necessary to delegate to the Executive Director the authority to approve the documentation required to evidence the increase in amount and extension of the Master Lease, execute and deliver such documentation and approve the aggregate principal amount, the term, the interest rates, the repayment provisions and other details thereof subject to the parameters established hereby.
NOW, THEREFORE, the Undersigned Chairman of the Finance and Audit Committee
hereby approves and consents on behalf of the Board of the Authority, as follows:
Section 1. Authorization and Increase of Amount and Extension of Term. (a) The Authority is hereby authorized to acquire additional equipment pursuant to the
financing plan evidenced by the Master Lease in the principal amount up to an additional $30,000,000 above the prior authorization under the Master Lease Resolution.
(b) As previously designated by the Board in the Master Lease Resolution, the Master
Lease obligations will be Subordinate Obligations under the Bond Resolution.
Section 2. Terms of Extension. The Executive Director is hereby authorized, if the Authority’s Financial Advisor shall so recommend, to:
(a) Extend the procurement period under the Master Lease for an additional one year from the September 30, 2020 initial termination date to September 30, 2021; and
(b) Provide for the interest portion of the payments made thereunder to be calculated
using a rate per annum not to exceed 4.50% for tax-exempt lease payments and 6.0% for taxable lease payments.
Section 3. Approval of Documents. The Executive Director is hereby authorized to approve the form of the documentation required to evidence the increase and extension under the Master Lease herein authorized, including any amendments or modifications to the Master Lease and any related agreements. The execution and delivery of such documentation is hereby authorized.
Section 4. Official Intent. The Authority intends that the proceeds from the Master Lease
be used to pay or reimburse the Authority for the payment of any expenditures made after the effective date of this authorization with regard to expenditures incurred in connection with the equipment. The execution of this Certificate confirms the “official intent” of the Authority within the meaning of Treasury Regulations Section 1.150-2 promulgated under the Internal Revenue Code of 1986, as amended.

3 4838-0816-7559.1
Section 5. Tax Covenant. The Authority covenants that it will comply with the provisions of the Internal Revenue Code of 1986, as amended (the “Code”), so that interest portion of the payments on tax-exempt lease payments made to the Lessor pursuant to the Agreement do not become includable in gross income of the Lessor for federal income tax purposes under the Code.
Section 6. Ratification; Further Action. The actions previously taken by the officers and
staff of the Authority are hereby ratified and confirmed. The officers and staff of the Authority are hereby authorized to take such actions, and deliver such additional documents and certificates, as they may in their discretion deem necessary or proper in connection with the increase and extension Master Lease herein authorized.
Section 7. Treasury Board Approval. The Authority requests the Treasury Board of the
Commonwealth of Virginia to approve the financing lease terms and structure in accordance with Section 2.2-2416.5 of the Code of Virginia of 1950, as amended. Staff is authorized and directed to apply for such approval.
Section 8. Effective Date. This authorization herein provided shall take effect immediately
on the date hereof.

4 4838-0816-7559.1
Date: February 15, 2019
By: Name: (Printed)
Title: Chairman of the Finance and Audit Committee
4829-9198-8614.3
RESOLUTION APPROVING AN INCREASE AND EXTENSION OF AN EXISTING MASTER EQUIPMENT LEASE
PURCHASE PROGRAM FOR THE VIRGINIA PORT AUTHORITYAND DELEGATING TO THE STATE TREASURER AUTHORITY TO
APPROVE THE TERMS THEREOF
WHEREAS, the Treasury Board of the Commonwealth of Virginia (the “Board”) is required, pursuant to Sections 2.2-2416 and 2.2-2417 of the Code of Virginia of 1950, as amended (the “Virginia Code”), to approve the terms and structure of financing arrangements, including financing leases, executed by or for the benefit of state agencies, boards and authorities, where payments are expected to be made by appropriations from the Commonwealth;
WHEREAS, on October 18, 2017, the Board by resolution previously approved a $37 million master equipment lease/purchase financing program for the Authority with Banc of America Public Capital Corp pursuant to a Master Equipment Lease Agreement (the “Agreement”), after approval thereof by the Board of Commissioners of the Virginia Port Authority (the “Authority”) by resolution 17-12 adopted on September 26, 2017 pursuant to authorization provided in the 2015 Virginia Acts of Assembly;
WHEREAS, the Authority has financed $29.9 million in equipment under the Agreement and now desires to acquire additional equipment thereunder, the cost of which exceeds the remaining amount that may be funded, and to extend the term under which equipment may be acquired under the Agreement;
WHEREAS, the Agreement by its terms permits additional funding thereunder up to $30 million and the extension of up to one year from September 30, 2020 to September 30, 2021 of the term under which equipment may be acquired with such funding;
WHEREAS, payments under the Agreement are to be paid from net revenues derived from the operation of the Authority’s port facilities, which payments from net revenues are subordinate to payments on the Authority Port Facility Revenue Bonds and other Senior Obligations now in existence or to be issued under the Authority’s master bond resolution, and such payments are also subject to appropriation by the Virginia General Assembly;
WHEREAS, under authority granted by the Bylaws of the Authority pursuant to written consents of the Chairman of the Board of Commissioners of the Authority and the Chairman of the Finance and Audit Committee, such officers have on behalf of the Authority Board authorized a First Amendment (the “Amendment”) to the Agreement to permit the increase in funding thereunder in an amount up to $30 million and the extension of the equipment acquisition period thereunder for up to an additional year to September 30, 2021, and delegated to the Executive Director of the Authority approval of the form of the Amendment and the final terms and details thereof within parameters established by the consents of such officers;
WHEREAS, pursuant to Item C-40, Chapter 2 of the 2018 Virginia Acts of Assembly, Virginia General Assembly has authorized the acquisition by the Authority of terminal operating equipment at a total cost of up to $37 million, such authorization being in

24829-9198-8614.3
addition to the $37 million authorized in 2015 Virginia General Assembly; and
WHEREAS, the terms and structure of the proposed financing are described in a Preliminary Financing Summary (the “Preliminary Financing Summary”), copies of which, together with copies of the Agreement and the Amendment, have been presented to this meeting and the members of the Board.
NOW, THEREFORE, BE IT RESOLVED BY THE BOARD THAT:
1. The plan of financing proposed by the Authority to increase the equipment funding amount and to extend the funding term under the Agreement pursuant to the Amendment as outlined in the Preliminary Financing Summary presented to this meeting, is hereby approved, subject to further approval by the State Treasurer pursuant to Section 2 of this Resolution.
2. Pursuant to Section 2.2-2416(9) of the Virginia Code, the Board deems it proper and delegates to the State Treasurer authority to act for and on behalf of the Board and to take such action as the State Treasurer, in the State Treasurer's sole discretion, may deem necessary or appropriate to approve the final terms and structure of the Agreement as amended pursuant to the Amendment, provided, however, (i) the maximum amount of equipment that may be financed thereunder shall not exceed $30,000,000, which amount is in addition to the amount authorized by the Board on October 18, 2017 (ii) the interest portion of lease payments thereunder may not exceed an annual rate of 4.50% for tax-exempt lease payments and 6.00% for taxable lease payments; and (iii) the term thereunder for acquiring equipment shall be not later than September 30, 2021. The Authority may enter into one or more leases under the Agreement as amended pursuant to the Amendment within the parameters herein established, and as is the case with lease payments under the Agreement as currently in existence, such lease payments made in connection with the Amendment shall be subject to appropriation by the Virginia General Assembly.
3. The State Treasurer is authorized to take such further action as isnecessary to carry out the purposes and intent of this Resolution.
4. This Resolution shall take effect immediately upon its adoption, and shall remain in effect for a period of one year after the date of adoption.

34829-9198-8614.3
The undersigned Chairman of the Treasury Board of the Commonwealth of Virginia certifies that the foregoing is a true and correct copy of a Resolution adopted by the Treasury Board at a duly called meeting held on February 20, 2019.
Date: February ___, 2019
_________________________________________Chairman, Treasury Board of the
Commonwealth of Virginia
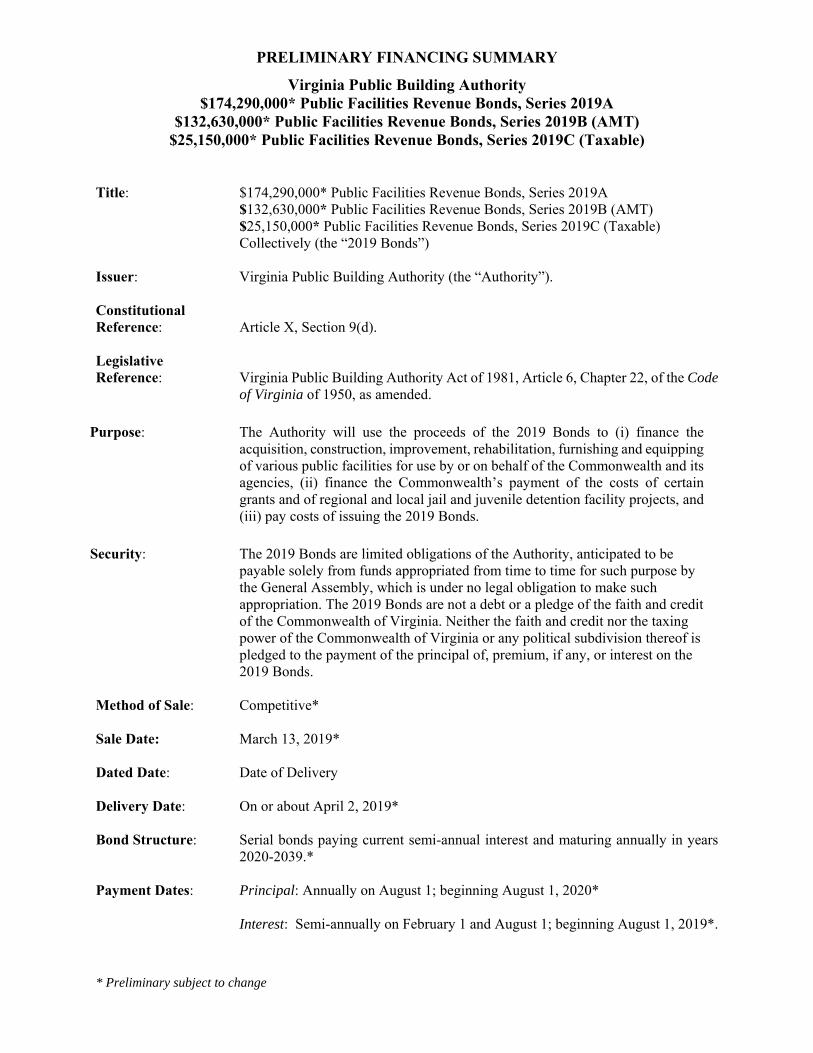
PRELIMINARY FINANCING SUMMARY
Virginia Public Building Authority $174,290,000* Public Facilities Revenue Bonds, Series 2019A
$132,630,000* Public Facilities Revenue Bonds, Series 2019B (AMT) $25,150,000* Public Facilities Revenue Bonds, Series 2019C (Taxable)
* Preliminary subject to change
Title: $174,290,000* Public Facilities Revenue Bonds, Series 2019A $132,630,000* Public Facilities Revenue Bonds, Series 2019B (AMT) $25,150,000* Public Facilities Revenue Bonds, Series 2019C (Taxable) Collectively (the “2019 Bonds”) Issuer: Virginia Public Building Authority (the “Authority”). Constitutional Reference: Article X, Section 9(d). Legislative Reference: Virginia Public Building Authority Act of 1981, Article 6, Chapter 22, of the Code
of Virginia of 1950, as amended.
Purpose: The Authority will use the proceeds of the 2019 Bonds to (i) finance the acquisition, construction, improvement, rehabilitation, furnishing and equipping of various public facilities for use by or on behalf of the Commonwealth and its agencies, (ii) finance the Commonwealth’s payment of the costs of certain grants and of regional and local jail and juvenile detention facility projects, and (iii) pay costs of issuing the 2019 Bonds.
Security: The 2019 Bonds are limited obligations of the Authority, anticipated to be
payable solely from funds appropriated from time to time for such purpose by the General Assembly, which is under no legal obligation to make such appropriation. The 2019 Bonds are not a debt or a pledge of the faith and credit of the Commonwealth of Virginia. Neither the faith and credit nor the taxing power of the Commonwealth of Virginia or any political subdivision thereof is pledged to the payment of the principal of, premium, if any, or interest on the 2019 Bonds.
Method of Sale: Competitive* Sale Date: March 13, 2019* Dated Date: Date of Delivery Delivery Date: On or about April 2, 2019* Bond Structure: Serial bonds paying current semi-annual interest and maturing annually in years
2020-2039.* Payment Dates: Principal: Annually on August 1; beginning August 1, 2020* Interest: Semi-annually on February 1 and August 1; beginning August 1, 2019*.

PRELIMINARY FINANCING SUMMARY
Virginia Public Building Authority $174,290,000* Public Facilities Revenue Bonds, Series 2019A
$132,630,000* Public Facilities Revenue Bonds, Series 2019B (AMT) $25,150,000* Public Facilities Revenue Bonds, Series 2019C (Taxable)
* Preliminary subject to change
Optional Redemption Provision: The 2019 Bonds maturing on or before August 1, 2029* are not subject to
redemption prior to maturity. The 2019 Bonds maturing on or after August 1, 2030* may be redeemed prior to their respective maturities at the sole option of the Authority on or after August 1, 2029*, in whole or in part at any time, at a redemption price equal to 100% of the principal amount of the 2019 Bonds to be redeemed, plus accrued interest to the redemption date. *
Denomination: $5,000 or multiples thereof. Registration Provisions: Book-entry-only through the facilities of The Depository Trust Company. Estimated True Interest Cost: TBD Day of Sale. Estimates as of February 5 shown below:
2019A All-in TIC: 3.213% 2019B All-in TIC: 3.455% 2019C All-in TIC: 3.812% Combined All-in TIC: 3.350%
Expected Ratings: Fitch Ratings: AA+ Moody’s Investors Service: Aa1 Standard & Poor’s: AA+ Underwriter: TBD Bond Counsel: Kaufman & Canoles, P.C., Richmond, Virginia Financial Advisor: Frasca & Associates, LLC Trustee: The Bank of New York Mellon Trust Company, N.A., Pittsburg, Pennsylvania Estimated Costs Of Issuance: $292,000 excluding underwriters’ discount. (Please see attached chart)

PRELIMINARY FINANCING SUMMARY
Virginia Public Building Authority $174,290,000* Public Facilities Revenue Bonds, Series 2019A
$132,630,000* Public Facilities Revenue Bonds, Series 2019B (AMT) $25,150,000* Public Facilities Revenue Bonds, Series 2019C (Taxable)
* Preliminary subject to change
Estimated Costs of Issuance
Role Firm Fees 2019A 2019B 2019C
Bond Counsel Kaufman & Canoles, P.C. $70,000 $36,740 $27,958 $5,302
Financial Advisor Frasca & Associates, LLC 35,000 18,370 13,979 2,651
Ratings Moody's Investor's Service 58,500 30,704 23,365 4,431
Ratings Standard & Poor's 45,000 23,619 17,973 3,408
Ratings Fitch Ratings 55,000 28,867 21,967 4,166
Trustee Bank of New York Mellon 5,500 2,025 1,899 1,576
Trustee's Counsel Williams Mullen 5,000 2,624 1,997 379
Competitive Bid Platform I‐Deal 1,500 787 599 114
Website Bondlink 5,000 2,624 1,997 379
Printing & Mailing Financial Press 1,500 787 599 114
Misc. N/A 10,000 5,249 3,994 757
Total $292,000 $152,397 $116,329 $23,274

KC Draft: 02/07/19 PRELIMINARY OFFICIAL STATEMENT DATED __________, 2019
NEW ISSUE – BOOK ENTRY ONLY RATINGS: Fitch: _____ Moody’s: _____
S&P: _____
(See “RATINGS” herein)
In the opinion of Bond Counsel, under existing law and subject to the conditions described in “TAX MATTERS” herein, (a) interest on the 2019A Bonds (i) is not included in gross income for federal income tax purposes, and (ii) is not an item of tax preference for purposes of the federal alternative minimum tax imposed on individuals and corporations, (b) interest on the 2019B Bonds (i) is not included in gross income for federal income tax purposes, except when held by a “substantial user” of the facilities to be financed by the 2019B Bonds or a “related person” within the meaning of Section 147(a) of the Internal Revenue Code of 1986, as amended, and (ii) is an item of tax preference for purposes of the federal alternative minimum tax imposed on individuals and corporations, and (c) interest on the 2019C Bonds is includable in gross income for federal tax purposes. Further, in the opinion of Bond Counsel, the 2019 Bonds, their transfer and the income therefrom (including any profit made on the sale thereof) are exempt from taxation within the Commonwealth of Virginia. See “TAX MATTERS” herein.
$_____* VIRGINIA PUBLIC BUILDING AUTHORITY
$_____* Public Facilities Revenue Bonds,
Series 2019A
$_____* Public Facilities Revenue Bonds,
Series 2019B (AMT)
$_____* Public Facilities Revenue Bonds,
Series 2019C (Taxable) Dated: Date of Delivery Due: August 1, as shown on the inside cover
This Official Statement has been prepared by the Virginia Public Building Authority (the “Authority”) to provide information on its Public Facilities Revenue Bonds, Series 2019A (the “2019A Bonds”), Public Facilities Revenue Bonds, Series 2019B (AMT) (the “2019B Bonds”) and Public Facilities Revenue Bonds, Series 2019C (Taxable) (the “2019C Bonds,” and together with the 2019A Bonds and the 2019B Bonds, the “2019 Bonds”). Selected information is presented on this cover page for the user’s convenience. To make an informed investment decision regarding the 2019 Bonds, a prospective investor should read this Official Statement in its entirety.
Security The 2019 Bonds are limited obligations of the Authority, anticipated to be payable solely from funds appropriated from time to time for such purpose by the General Assembly, which is under no legal obligation to make such appropriation. The 2019 Bonds are not a debt or a pledge of the faith and credit of the Commonwealth of Virginia. Neither the faith and credit nor the taxing power of the Commonwealth of Virginia or any political subdivision thereof is pledged to the payment of the principal of, premium, if any, or interest on the 2019 Bonds. See “SOURCES OF PAYMENT AND SECURITY FOR THE BONDS.”
Redemption See inside cover and “THE 2019 BONDS - Redemption Provisions.”
Issued Pursuant to The 2019 Bonds are issued pursuant to a Master Indenture of Trust, dated as of April 15, 1997, as previously supplemented and amended, and as further supplemented by the Thirty-Seventh Supplemental Indenture of Trust, dated as of _____ 1, 2019.
Purpose The Authority will use the proceeds of the 2019 Bonds to (i) finance the acquisition, construction, improvement, rehabilitation, furnishing and equipping of various public facilities for use by or on behalf of the Commonwealth and its agencies, (ii) finance the Commonwealth’s payment of the costs of certain grants and of regional and local jail and juvenile detention facility projects, and (iii) pay costs of issuing the 2019 Bonds. See “THE PROJECTS.”
Interest Rates/Yields See inside cover.
Interest Payment Dates February 1 and August 1, commencing [August 1, 2019].
Regular Record Dates January 15 and July 15.
Denomination $5,000 or integral multiples thereof.
Closing/Delivery Date On or about __________, 2019.*
Registration Book-entry-only; The Depository Trust Company. See “THE 2019 BONDS - Book-Entry-Only System.”
Trustee/Paying Agent The Bank of New York Mellon Trust Company, N.A., Pittsburgh, Pennsylvania.
Financial Advisor Frasca & Associates, LLC, New York, New York.
Bond Counsel Kaufman & Canoles, P.C., Richmond, Virginia.
Issuer Contact Director of Debt Management, Virginia Department of the Treasury, (804) 225-2142.
The 2019 Bonds will be awarded pursuant to electronic competitive bidding to be held via PARITY® on __________, 2019*, unless changed, as set forth in the Notices of Sale contained in Appendix F to this Official Statement and as described under “SALE AT COMPETITIVE BIDDING.”
Dated: __________, 2019
* Preliminary, subject to change.
Thi
s Pr
elim
inar
y O
ffic
ial S
tate
men
t and
the
info
rmat
ion
cont
aine
d he
rein
are
sub
ject
to c
ompl
etio
n an
d am
endm
ent.
The
201
9 B
onds
may
not
be
sold
nor
may
an
offe
r to
buy
be
acce
pted
pri
or to
the
time
the
Off
icia
l Sta
tem
ent i
s de
live
red
in f
inal
for
m.
Und
er n
o ci
rcum
stan
ces
shal
l thi
s P
reli
min
ary
Off
icia
l Sta
tem
ent c
onst
itut
e an
off
er to
sel
l or
a so
lici
tati
on o
f an
off
er to
buy
, nor
sha
ll th
ere
be a
ny s
ale
of th
e 20
19
Bon
ds in
any
juri
sdic
tion
in w
hich
suc
h of
fer,
sol
icit
atio
n or
sal
e w
ould
be
unla
wfu
l pri
or to
reg
istr
atio
n or
qua
lifi
cati
on u
nder
the
secu
riti
es la
ws
of s
uch
juri
sdic
tion
.

$_____* VIRGINIA PUBLIC BUILDING AUTHORITY
(Base CUSIP Number 928172) **
Dated: Date of Delivery Due: August 1, as shown below
MATURITIES, AMOUNTS, INTEREST RATES AND YIELDS (OR PRICES)
$_____* Public Facilities Revenue Bonds,
Series 2019A
Year of Principal Interest Yield/ CUSIP Year of Principal Interest Yield/ CUSIP
Maturity* Amount* Rate Price Suffix** Maturity* Amount* Rate Price Suffix**
* Preliminary, subject to change. ** CUSIP numbers have been assigned by an organization not affiliated with the Authority or the Commonwealth and are included solely for the convenience of the holders of the 2019 Bonds. Neither the Authority nor the Commonwealth is responsible for the selection or uses of these CUSIP numbers, nor is any representation made as to their correctness on the 2019 Bonds or as indicated above.

$_____* Public Facilities Revenue Bonds,
Series 2019B (AMT)
Year of Principal Interest Yield/ CUSIP Year of Principal Interest Yield/ CUSIP
Maturity* Amount* Rate Price Suffix** Maturity* Amount* Rate Price Suffix**
$_____* Public Facilities Revenue Bonds,
Series 2019C (Taxable)
Year of Principal Interest Yield/ CUSIP Year of Principal Interest Yield/ CUSIP
Maturity* Amount* Rate Price Suffix** Maturity* Amount* Rate Price Suffix**
* Preliminary, subject to change. ** CUSIP numbers have been assigned by an organization not affiliated with the Authority or the Commonwealth and are included solely for the convenience of the holders of the 2019 Bonds. Neither the Authority nor the Commonwealth is responsible for the selection or uses of these CUSIP numbers, nor is any representation made as to their correctness on the 2019 Bonds or as indicated above.

OPTIONAL REDEMPTION*
The 2019A Bonds maturing on or before August 1, 20__* are not subject to redemption prior to maturity. The 2019A Bonds maturing on or after August 1, 20__* may be redeemed prior to their respective maturities at the sole option of the Authority on or after August 1, 20__*, in whole or in part at any time, at a redemption price equal to 100% of the principal amount of the 2019A Bonds to be redeemed, plus accrued interest to the redemption date, as described more fully in “THE 2019 BONDS - Redemption Provisions.” The 2019B Bonds maturing on or before August 1, 20__* are not subject to redemption prior to maturity. The 2019B Bonds maturing on or after August 1, 20__* may be redeemed prior to their respective maturities at the sole option of the Authority on or after August 1, 20__*, in whole or in part at any time, at a redemption price equal to 100% of the principal amount of the 2019B Bonds to be redeemed, plus accrued interest to the redemption date, as described more fully in “THE 2019 BONDS - Redemption Provisions.”
[The 2019C Bonds maturing on or before August 1, 20__* are not subject to redemption prior to maturity. The 2019C Bonds maturing on or after August 1, 20__* may be redeemed prior to their respective maturities at the sole option of the Authority on or after August 1, 20__*, in whole or in part at any time, at a redemption price equal to 100% of the principal amount of the 2019C Bonds to be redeemed, plus accrued interest to the redemption date, as described more fully in “THE 2019 BONDS - Redemption Provisions.”]
[MANDATORY REDEMPTION
Mandatory sinking fund redemption provisions will be included in the final Official Statement only if the successful bidder elects to combine, in accordance with the Notices of Sale, serial maturities into one or more term bonds. See “THE 2019 BONDS - Redemption Provisions.”]
* Preliminary, subject to change.

i
COMMONWEALTH OF VIRGINIA OFFICIALS
GOVERNOR RALPH S. NORTHAM
LIEUTENANT GOVERNOR JUSTIN E. FAIRFAX
ATTORNEY GENERAL MARK R. HERRING
SECRETARY OF FINANCE
AUBREY L. LAYNE, JR.
STATE TREASURER MANJU S. GANERIWALA
STATE COMPTROLLER DAVID A. VON MOLL
VIRGINIA PUBLIC BUILDING AUTHORITY
MEMBERS
CHAIRMAN SUZANNE S. LONG
SECRETARY/TREASURER MANJU S. GANERIWALA
DAVID A. VON MOLL
VICE CHAIRMAN JOHN A. MAHONE
CAROLYN L. BISHOP
SARAH B. WILLIAMS
STAFF
ANN H. SHAWVER
VPBA ASSISTANT SECRETARY/TREASURER #1
Director of Debt Management JANET A. AYLOR
VPBA ASSISTANT
SECRETARY/TREASURER #2 Assistant Director of Debt Management
BRADLEY L. JONES
Senior Public Finance Analyst SHERWANDA R. CAWTHORN
____________________________________________________________________________________
FINANCIAL ADVISOR FRASCA & ASSOCIATES, LLC
New York, New York
BOND COUNSEL KAUFMAN & CANOLES, P.C.
Richmond, Virginia
TRUSTEE AND PAYING AGENT THE BANK OF NEW YORK MELLON TRUST
COMPANY, N.A. Pittsburgh, Pennsylvania
COUNSEL TO VPBA AND TREASURY BOARD ATTORNEY GENERAL’S OFFICE
Richmond, Virginia

ii
The 2019 Bonds are exempt from registration under the Securities Act of 1933, as amended. As obligations of the Commonwealth of Virginia, the 2019 Bonds are exempt from registration under the securities laws of the Commonwealth.
No dealer, broker, salesman or other person has been authorized by the Authority or the Commonwealth to give any information or to make any representation with respect to the 2019 Bonds other than those contained in this Official Statement. If given or made, such other information and/or representations must not be relied upon as having been authorized by the Authority or the Commonwealth. This Official Statement does not constitute an offer to sell or the solicitation of any offer to buy, nor shall there be any sale of the 2019 Bonds by any person in any jurisdiction in which it is unlawful for such person to make such offer, solicitation or sale. This Official Statement is not to be construed as a contract or agreement between the Authority or the Commonwealth and the purchasers or owners of any of the 2019 Bonds.
The electronic distribution of this Official Statement does not constitute an offer to sell or the solicitation of an offer to buy the 2019 Bonds described herein to the residents of any particular state and is not specifically directed to the residents of any particular jurisdiction. The 2019 Bonds shall not be offered or sold in any jurisdiction unless and until they are either registered pursuant to the laws of such state or qualified pursuant to an appropriate exemption from registration in such jurisdiction.
References to web site addresses presented herein are for informational purposes only and may be in the form of a hyperlink solely for the reader's convenience. Unless specified otherwise, such web sites and the information or links contained therein are not incorporated into, and are not part of, this final official statement for purposes of, as that term is defined in, Rule 15c2-12 under the Securities Exchange Act of 1934, as amended.
The information set forth herein has been obtained from the Authority, the Commonwealth and other sources deemed to be reliable. The information and any expression of opinion herein is subject to change without notice, and neither the delivery of this Official Statement nor any sale made hereunder, under any circumstances, shall create any implication that there has been no change in the affairs of the Authority or the Commonwealth since the date hereof. Any statements in this Official Statement involving matters of opinion or estimates, whether or not expressly stated, are intended as such and not as representations of fact. No representation is made that any such opinion or estimate will be realized.
TABLE OF CONTENTS
[To Be Updated]
INTRODUCTION ................................................................................................................................................ 1 THE AUTHORITY .............................................................................................................................................. 4 THE PROJECTS ................................................................................................................................................... 5 SOURCES AND USES OF PROCEEDS ............................................................................................................. 7 SOURCES OF PAYMENT AND SECURITY FOR THE BONDS .................................................................... 7 THE 2019 BONDS ............................................................................................................................................. 10 AUTHORITY DEBT SERVICE REQUIREMENTS ........................................................................................ 16 THE PAYMENT AGREEMENT ....................................................................................................................... 16 THE MASTER INDENTURE ............................................................................................................................ 18 OTHER COMMONWEALTH FINANCINGS .................................................................................................. 22 RATINGS ........................................................................................................................................................... 22 LEGAL MATTERS ............................................................................................................................................ 22 TAX MATTERS ................................................................................................................................................. 23 CONTINUING DISCLOSURE .......................................................................................................................... 26 SALE AT COMPETITIVE BIDDING ............................................................................................................... 27 FINANCIAL ADVISOR .................................................................................................................................... 27 LITIGATION ...................................................................................................................................................... 28 LEGALITY FOR INVESTMENT AND SECURITY FOR PUBLIC DEPOSITS ............................................ 28 CERTIFICATES OF AUTHORITY AND COMMONWEALTH..................................................................... 28 MISCELLANEOUS ........................................................................................................................................... 29 APPENDIX A - FINANCIAL STATEMENTS OF THE COMMONWEALTH FOR THE FISCAL YEAR
ENDED JUNE 30, 2018 APPENDIX B - COMMONWEALTH OF VIRGINIA--FINANCIAL AND OTHER INFORMATION APPENDIX C - COMMONWEALTH OF VIRGINIA--DEMOGRAPHIC AND ECONOMIC INFORMATION APPENDIX D - PROPOSED FORMS OF BOND COUNSEL OPINIONS APPENDIX E - CONTINUING DISCLOSURE AGREEMENTS OF THE VIRGINIA PUBLIC BUILDING
AUTHORITY AND THE COMMONWEALTH OF VIRGINIA APPENDIX F - NOTICES OF SALE

iii
This Preliminary Official Statement in its entirety, including all appendices, is available electronically from the Authority by arrangement between the Authority and Financial Press, LLC by contacting the Authority at [(804) 225-4929] or Financial Press, LLC at (804) 928-6366, and via the Internet at http://finpressllc.com. This Preliminary Official Statement in its entirety, including all appendices, is also available on the Authority’s investor relations website at https://www.VPBABonds.com.

1
OFFICIAL STATEMENT
$_____* VIRGINIA PUBLIC BUILDING AUTHORITY
$_____* Public Facilities Revenue
Bonds, Series 2019A
$_____* Public Facilities Revenue
Bonds, Series 2019B (AMT)
$_____* Public Facilities Revenue
Bonds, Series 2019C (Taxable)
INTRODUCTION
Purpose
The purpose of this Official Statement, including its cover and appendices, is to provide certain information relating to the Virginia Public Building Authority (the “Authority”) and the issuance of its $_____* Public Facilities Revenue Bonds, Series 2019A (the “2019A Bonds”), $_____* Public Facilities Revenue Bonds, Series 2019B (AMT) (the “2019B Bonds”) and $_____* Public Facilities Revenue Bonds, Series 2019C (Taxable) (the “2019C Bonds,” and together with the 2019A Bonds and the 2019B Bonds, the “2019 Bonds”). The Authority is issuing the 2019 Bonds to (i) finance the acquisition, construction, improvement, rehabilitation, furnishing and equipping of various public facilities for use by or on behalf of the Commonwealth and its agencies, (ii) finance the Commonwealth’s payment of the costs of certain grants and of regional and local jail and juvenile detention facility projects, and (iii) pay costs of issuing the 2019 Bonds. See “THE PROJECTS.” The 2019 Bonds are expected to be offered for sale at competitive bidding on __________, 2019.* See “SALE AT COMPETITIVE BIDDING.” This introduction contains certain summary information regarding the 2019 Bonds and is not a complete summary of the 2019 Bonds or the security therefor. All such information is qualified in its entirety by reference to the more detailed descriptions appearing in this Official Statement, including the appendices hereto. Investors should read this entire Official Statement to obtain information necessary to the making of an informed investment decision. The Authority The Authority is a political subdivision of the Commonwealth. The Authority is authorized to issue bonds or notes to (i) construct, improve, furnish, maintain, acquire, finance and refinance certain public facilities for the use of the Commonwealth, its agencies and instrumentalities, (ii) finance or refinance capital projects that benefit the Commonwealth and any of its authorities, agencies, instrumentalities or regional or local authorities, and (iii) finance or refinance reimbursements to localities or governmental entities of the Commonwealth’s share of the capital costs for certain authorized projects. The Authority has no taxing power. The Authority is created under the Virginia Public Building Authority Act of 1981, Article 6, Chapter 22, Title 2.2, Code of Virginia of 1950, as amended (the “Act”). The Authority’s offices are located at 101 North 14th Street, James Monroe Building, Third Floor, Richmond, Virginia 23219, its mailing address is P.O. Box 1879, Richmond, Virginia 23218-1879, and it may be reached by telephone at (804) 225-2142. See “THE AUTHORITY.”
* Preliminary, subject to change.

2
Authorization The 2019 Bonds will be issued pursuant to the Act, a resolution adopted by the Authority on February 14, 2019, and a resolution adopted by the Treasury Board of the Commonwealth (the “Treasury Board”) on February 20, 2019. The issuance of the 2019 Bonds is subject to the consent of the Governor of the Commonwealth, as required by the Act.
The 2019 Bonds will also be issued pursuant to a Master Indenture of Trust (the “Master Indenture”) dated as of April 15, 1997, as previously supplemented and amended, and as further supplemented by a Thirty-Seventh Supplemental Indenture of Trust (the “Thirty-Seventh Supplemental Indenture”), dated as of _____ 1, 2019, between the Authority and The Bank of New York Mellon Trust Company, N.A., as successor trustee (the “Trustee”) and paying agent (the “Paying Agent”). Together, the Master Indenture, the Thirty-Seventh Supplemental Indenture and any previous or further supplements are referred to in this Official Statement as the “Indenture.” The bonds currently outstanding under the Indenture are collectively referred to as the “Prior Bonds.” The 2019A Bonds, the 2019B Bonds and the 2019C Bonds will be the forty-ninth, fiftieth and fifty-first series of parity bonds issued under the Indenture. The 2019 Bonds, the Prior Bonds, and all other parity or additional bonds hereafter issued from time to time under and secured equally and ratably by the Indenture (the “Additional Bonds”) are collectively called the “Bonds.” The 2019 Bonds The 2019 Bonds will be issued in the aggregate principal amount of $_____.* The 2019 Bonds will be dated the date of their original issuance and delivery, and will mature on August 1 in the years and amounts set forth on the inside front cover page of this Official Statement. The 2019 Bonds will be issued in authorized denominations of $5,000 and integral multiples thereof and will be held through the facilities of The Depository Trust Company, New York, New York (“DTC”) or by its nominee as securities depository with respect to the 2019 Bonds. See “THE 2019 BONDS - Book-Entry-Only System.” Interest on the 2019 Bonds will be payable on February 1 and August 1, commencing [August 1, 2019], until the earlier of maturity or redemption. As long as the 2019 Bonds are held by DTC or its nominee, interest will be paid to Cede & Co., as nominee of DTC in same-day funds on each interest payment date. Authority Financing Program The Authority was initially created under the Act for the purpose of financing, refinancing, constructing, improving, furnishing, maintaining, acquiring and operating public buildings for the use of the Commonwealth and its agencies, instrumentalities and political subdivisions. The Authority issues revenue bonds under Article X, Section 9(d) of the Virginia Constitution, for projects that have been specifically authorized by the General Assembly. Since its inception in 1981, the Authority has issued 58 series of bonds, 10 of which were issued under the Authority’s prior master indenture with Signet Trust Company (predecessor to The Bank of New York Mellon Trust Company, N.A.), as Trustee and Paying Agent, dated as of October 1, 1988, as supplemented and amended, under which the Authority took legal title to projects and leased them to the Commonwealth. The Commonwealth’s lease payments under the leases, in turn, provided for debt service payments on the related bonds.
* Preliminary, subject to change.

3
In 1996, the General Assembly authorized the Authority to finance or refinance all or any portion of the Commonwealth’s share of the costs, including certain interest accrued during construction, of local or regional jail facilities that have been approved by the General Assembly, in addition to traditional Authority facilities approved by the General Assembly for the Commonwealth and its agencies. In 1998, the General Assembly authorized the Authority to refinance obligations issued by other state and local authorities or political subdivisions of the Commonwealth where such obligations are secured by a lease or other payment agreement with the Commonwealth and to refinance the Commonwealth’s obligations under such leases or payment agreements. In 2002, the General Assembly further authorized the Authority to finance or refinance capital projects that benefit the Commonwealth, or its agencies, authorities or instrumentalities, and regional or local authorities, and also extended the Authority’s finance powers to include the refinancing of reimbursements to governmental entities of the Commonwealth’s share of the costs of capital projects authorized by applicable Virginia law. The authorized projects for Authority financing from time to time are referred to in this Official Statement as “Projects.”
To simplify its financing structure and to finance the Commonwealth’s share of regional and local jail costs and other capital facilities, the Authority authorized the issuance of bonds under a structure provided for by the Master Indenture. This structure utilizes a single payment agreement with the Treasury Board to provide for debt service payments on the Bonds. Payments under such payment agreement are subject to General Assembly appropriations therefor. See “THE PAYMENT AGREEMENT” and “THE MASTER INDENTURE.”
Under this financing structure, the Authority generally finances the cost of authorized Projects as
funding is needed on a “cash flow” basis. Anticipated costs to be incurred on Projects over a short-term period, usually less than one year, are included when determining the size of an issue. Bond proceeds are available to pay the costs of approved Projects. Accordingly, the Authority anticipates the issuance of Additional Bonds from time to time, although neither the size nor the timing of any additional series of Bonds is known at this time. Proceeds from such Additional Bonds will be used to pay the costs of Projects that require additional funding, as well as for additional Projects. See “AUTHORITY DEBT SERVICE REQUIREMENTS” for amounts outstanding under the Authority’s Master Indenture.
See “SOURCES OF PAYMENT AND SECURITY FOR THE BONDS - Additional Bonds.”
Security for the 2019 Bonds The 2019 Bonds will be payable from and secured by funds, if any, appropriated from time to time for such purpose by the General Assembly. See “SOURCES OF PAYMENT AND SECURITY FOR THE BONDS.” THE 2019 BONDS ARE LIMITED OBLIGATIONS OF THE AUTHORITY PAYABLE SOLELY FROM FUNDS TO BE APPROPRIATED FROM TIME TO TIME FOR SUCH PURPOSE BY THE GENERAL ASSEMBLY, WHICH IS UNDER NO LEGAL OBLIGATION TO MAKE SUCH APPROPRIATION. THE 2019 BONDS ARE NOT A DEBT OF THE COMMONWEALTH OR OF ANY POLITICAL SUBDIVISION THEREOF, OTHER THAN THE AUTHORITY. NEITHER THE FAITH AND CREDIT NOR THE TAXING POWER OF THE COMMONWEALTH OR OF ANY POLITICAL SUBDIVISION THEREOF IS PLEDGED TO THE PAYMENT OF THE PRINCIPAL OF, PREMIUM, IF ANY, OR INTEREST ON THE 2019 BONDS. THE AUTHORITY HAS NO TAXING POWER. Appendix A contains the financial statements of the Commonwealth for its fiscal year ending June 30, 2018. Appendices B and C contain, respectively, certain financial and demographic/economic information pertaining to the Commonwealth. See “SOURCES OF PAYMENT AND SECURITY FOR THE BONDS - Information Pertaining to the Commonwealth.”

4
THE AUTHORITY
The Authority is governed by a seven-member board (the “Board”). Five members of the Board are appointed for five-year terms by the Governor of Virginia (the “Governor”), subject to General Assembly confirmation. The Governor designates one member of the Board as chairman. The State Treasurer and the State Comptroller serve as ex officio members of the Board. The following sets forth the Board’s current membership, the expiration dates of the members’ terms and the business or government affiliations of such members:
David A. Von Moll Ex officio State Comptroller, Richmond, Virginia
Sarah B. Williams
June 30, 2022 UnBound RVA, Richmond, Virginia
* Subject to confirmation by the General Assembly. Upon the issuance of the 2019 Bonds, there will be approximately $_____* in authorized but unissued
Bonds for Projects authorized to be financed by the Authority. Prior to the issuance of the 2019 Bonds, the Authority will have outstanding $_____ principal amount of Bonds. Prior to the issuance of the 2019 Bonds,
the maximum annual debt service on such outstanding Bonds will be $_____**. Debt service on the Authority’s Bonds is payable from Commonwealth appropriations. See “SOURCES OF PAYMENT AND SECURITY FOR THE BONDS.”
* Preliminary, subject to change. ** Maximum annual debt service includes debt service on the Authority’s $50,000,000 Variable Rate Public Facilities Revenue Bonds Series 2005D. This debt service is based on an assumed rate of interest of 4.00% for budgeting purposes and does not reflect current rates as of any particular date. Further, maximum annual debt service is gross of the subsidy payment from the federal government on the Authority’s $256,710,000 Public Facilities Revenue Bonds, Series 2010A-2 (Taxable Build America Bonds) and $195,310,000 Public Facilities Revenue Bonds, Series 2010B-2 (Federally Taxable Build America Bonds), which totaled $_____ in the fiscal year ended June 30, 2018.
Name Expiration of Term Business Affiliation
Suzanne S. Long Chairman
June 30, 2020 (June 30, 2019 as Chairman)
Meyer, Baldwin, Long & Moore, LLP Richmond, Virginia
John A. Mahone Vice Chairman
June 30, 2021 Commonwealth of Virginia, Retired
Manju S. Ganeriwala Secretary/Treasurer
Ex officio State Treasurer, Richmond, Virginia
Carolyn L. Bishop June 30, 2019 Federal Reserve Bank of Richmond, Richmond, Virginia
Ann H. Shawver* June 30, 2023 Ann Harrity Shawver, Certified Public Accountant, PLLC Roanoke, Virginia
5
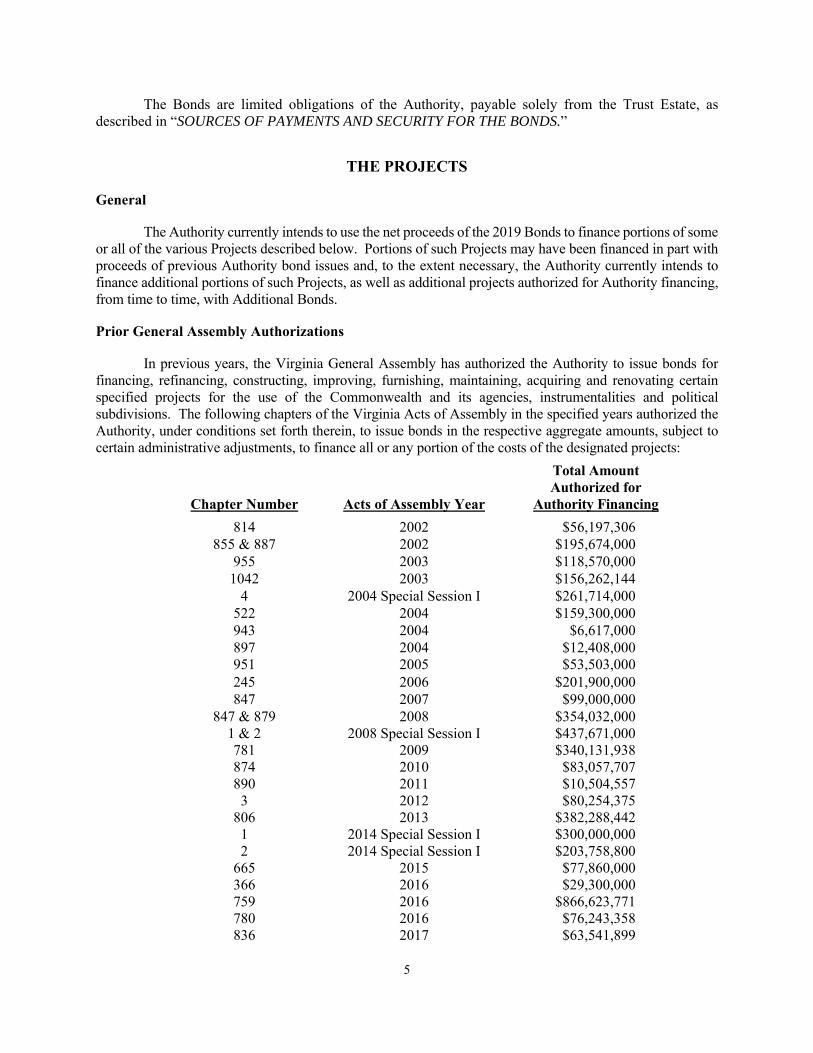
The Bonds are limited obligations of the Authority, payable solely from the Trust Estate, as described in “SOURCES OF PAYMENTS AND SECURITY FOR THE BONDS.”
THE PROJECTS
General The Authority currently intends to use the net proceeds of the 2019 Bonds to finance portions of some or all of the various Projects described below. Portions of such Projects may have been financed in part with proceeds of previous Authority bond issues and, to the extent necessary, the Authority currently intends to finance additional portions of such Projects, as well as additional projects authorized for Authority financing, from time to time, with Additional Bonds. Prior General Assembly Authorizations In previous years, the Virginia General Assembly has authorized the Authority to issue bonds for financing, refinancing, constructing, improving, furnishing, maintaining, acquiring and renovating certain specified projects for the use of the Commonwealth and its agencies, instrumentalities and political subdivisions. The following chapters of the Virginia Acts of Assembly in the specified years authorized the Authority, under conditions set forth therein, to issue bonds in the respective aggregate amounts, subject to certain administrative adjustments, to finance all or any portion of the costs of the designated projects:
Chapter Number
Acts of Assembly Year
Total Amount Authorized for
Authority Financing
814 2002 $56,197,306 855 & 887 2002 $195,674,000
955 2003 $118,570,000 1042 2003 $156,262,144
4 2004 Special Session I $261,714,000 522 2004 $159,300,000 943 2004 $6,617,000 897 2004 $12,408,000 951 2005 $53,503,000 245 2006 $201,900,000 847 2007 $99,000,000
847 & 879 2008 $354,032,000 1 & 2 2008 Special Session I $437,671,000 781 2009 $340,131,938 874 2010 $83,057,707 890 2011 $10,504,557 3 2012 $80,254,375
806 2013 $382,288,442 1 2014 Special Session I $300,000,000 2 2014 Special Session I $203,758,800
665 2015 $77,860,000 366 2016 $29,300,000 759 2016 $866,623,771 780 2016 $76,243,358 836 2017 $63,541,899

6
1 2018 Special Session I $3,140,000 2 2018 Special Session I $671,829,438
The foregoing summary description does not include those particular local or regional jail facilities for which the General Assembly has authorized the Authority to finance the Commonwealth’s obligated share of the costs thereof. [The Authority currently anticipates that the General Assembly will authorize additional projects for financing by the Authority through amendments to the 2018-2020 biennial appropriation act. See SOURCES OF PAYMENT AND SECURITY FOR THE BONDS - Current Budget Appropriations Status” below, and for general discussion of the 2018-2020 budget see “2019 Amendments to the 2018 Appropriation Act” in Appendix B attached hereto.]
Subject to the foregoing, the Authority anticipates that the proceeds of the sale of the 2019 Bonds
will be used for some or all of the following categories of projects, with the amounts listed below being the amounts expected for such categories:
Type of Project Amount*
General governmental facilities [$_____ Conservation projects _____ Public safety facilities _____ Education and cultural facilities _____ Public/mental health projects _____ Port facilities _____]
* Preliminary, subject to change.

7
SOURCES AND USES OF PROCEEDS
The following table sets forth estimates of the sources and uses of proceeds of the 2019 Bonds.
SOURCES
Par Amount of 2019A Bonds…………………………………………………………… $
Par Amount of 2019B Bonds……………………………………………………………
Par Amount of 2019C Bonds……………………………………………………………
[Net] Original Issue [Premium][Discount] for 2019 Bonds……...……...……...……... __________
Total Sources of Funds………………………………………………………... $
USES
Deposit to Construction Fund for 2019A Bonds………………………………………... $
Deposit to Construction Fund for 2019B Bonds………………………………………...
Deposit to Construction Fund for 2019C Bonds………………………………………...
Costs of Issuance*………………………………………………………………………. __________
Total Uses of Funds…………………………………………………………… $ _____________________ * Includes Underwriters’ discount of $__________.
SOURCES OF PAYMENT AND SECURITY FOR THE BONDS
THE 2019 BONDS ARE LIMITED OBLIGATIONS OF THE AUTHORITY PAYABLE SOLELY FROM FUNDS TO BE APPROPRIATED FROM TIME TO TIME FOR SUCH PURPOSE BY THE GENERAL ASSEMBLY, WHICH IS UNDER NO LEGAL OBLIGATION TO MAKE SUCH APPROPRIATION. THE 2019 BONDS ARE NOT A DEBT OF THE COMMONWEALTH OR OF ANY POLITICAL SUBDIVISION THEREOF, OTHER THAN THE AUTHORITY. NEITHER THE FAITH AND CREDIT NOR THE TAXING POWER OF THE COMMONWEALTH OR OF ANY POLITICAL SUBDIVISION THEREOF IS PLEDGED TO THE PAYMENT OF THE PRINCIPAL OF, PREMIUM, IF ANY, OR INTEREST ON THE 2019 BONDS. THE AUTHORITY HAS NO TAXING POWER. The revenues, receipts and funds pledged to the payment of the Bonds, including the 2019 Bonds, are as follows: (i) amounts on deposit from time to time in the Bond Fund created under the Master Indenture; (ii) amounts, if any, appropriated by the General Assembly to the Treasury Board and forwarded by the Treasury Board to the Authority, in accordance with the provisions of the Payment Agreement (as defined herein), for the payment of debt service on the Bonds; and (iii) other property of any kind from time to time pledged to the payment of the Bonds (together, the “Trust Estate”). The General Assembly has no legal obligation to make appropriations for the payment of debt service on the Bonds. The 2019A Bonds, the 2019B Bonds and the 2019C Bonds are the forty-ninth, fiftieth and fifty-first series of Bonds issued under the Master Indenture. The Master Indenture authorizes the issuance of Additional Bonds upon the terms and conditions set forth in the Master Indenture. As to the security listed above, the 2019 Bonds will be secured equally and ratably with the Prior Bonds and any Additional Bonds. See “THE MASTER INDENTURE.” Although the Master Indenture permits any series of Bonds to be additionally secured by certain types of credit or liquidity support, there is no credit or liquidity facility for the 2019 Bonds, nor is there a debt service reserve fund for the 2019 Bonds.

8
Payment Agreement The Authority has entered into a Payment Agreement, dated as of April 15, 1997 (the “Payment Agreement”), with the Treasury Board. The Payment Agreement provides, among other things, the procedures for specifying the amount of funds required to pay debt service due or expected to become due on the Bonds (including certain administrative and rebate expenses), requesting General Assembly appropriations of funds sufficient to pay such amounts, and for the payment of such amounts, if any. The General Assembly is not required, and is under no legal obligation, to make an appropriation for any amount or payment under the Payment Agreement or otherwise in respect of any Bonds. The Payment Agreement requires the Authority and the Treasury Board to use their best efforts to have (i) the Governor include, among other things, the amount so specified in each biennial or any supplemental budget of the Commonwealth, and (ii) the General Assembly appropriate the amount requested by the Governor.
Once the amounts for debt service on the Bonds are appropriated by the General Assembly, the
Payment Agreement requires the Authority and the Treasury Board to process the necessary requisitions and documents for payment to the Trustee of debt service on the Bonds and any other amounts required by the Indenture, including certain administrative amounts and rebate expenses. See “THE PAYMENT AGREEMENT.” Notwithstanding any failure to complete Projects partially funded with Bonds or to issue Additional Bonds therefor, the Commonwealth is obligated, subject to appropriations by the General Assembly, to make payments under the Payment Agreement in an amount sufficient, together with other available funds, to pay the principal of, premium, if any, and interest due on the Bonds.
The Commonwealth has never failed to perform its obligations to budget, appropriate and pay pursuant to the Payment Agreement or any similar agreement whereby the Commonwealth and its officers are bound to exercise their best efforts to budget and appropriate amounts sufficient to pay debt service when due. Appropriation Matters The Payment Agreement requires the Treasury Board, acting as fiscal agent on behalf of the Authority (the “Fiscal Agent”), to submit annually by December 1 to the Governor and the Director of the Department of Planning and Budget of the Commonwealth a statement setting forth the amount of debt service due or expected to become due on the Bonds for the next succeeding annual or biennial period. The Payment Agreement requires the Fiscal Agent to use its best efforts each legislative session during the term of the Payment Agreement to have (i) the Governor include the amount so certified in the biennial or any supplemental budget of the Commonwealth, and (ii) the General Assembly appropriate such amount. The General Assembly’s current practice is to make a single direct appropriation to the Treasury Board for certain Commonwealth-related debt service obligations, including the Commonwealth’s general obligation bonds, all bonds issued by the Authority, and certain other obligations with respect to the Commonwealth. Although there is no legal requirement that debt service obligations on the Authority’s bonds be included with other Commonwealth debt obligations in a single appropriation, the Authority currently anticipates that all debt service obligations for Authority bonds would be contained in the same appropriation. As Fiscal Agent for the Authority, the Treasury Board directly pays the Trustee that portion of any appropriation consisting of payments under the Payment Agreement for debt service on Bonds.

9
To the extent that the payments under the Payment Agreement included in the Commonwealth’s budget are appropriated by the General Assembly and approved by the Governor, the Fiscal Agent is required under the Payment Agreement to pay amounts due under the Indenture to the Trustee. It is expected that the Bonds, including the 2019 Bonds, will be paid solely from amounts, if any, appropriated by the General Assembly for the payment of the Bonds, as described in this section. The General Assembly is not required, and is under no legal obligation, to make an appropriation for any amount or payment under the Payment Agreement or otherwise in respect of any Bonds. Further, the General Assembly may amend its appropriation acts to reduce or delete a previous appropriation, and the General Assembly has no obligation to make any appropriations to pay debt service on the Bonds in future years. However, the General Assembly has never failed to make an appropriation to the Authority for payment of debt service on the Authority’s bonds. Current Budget Appropriation Status
[2018-2020 Appropriation Act. The General Assembly adopts a biennial budget in even-numbered years and has traditionally amended the budget in odd-numbered years. On June 7, 2018, Governor Northam signed Chapter 2, 2018 Special Session I of the Acts of Assembly (the “2018-2020 Appropriation Act”). The 2018-2020 Appropriation Act includes appropriations to the Treasury Board of $_____ and $_____ for payments allocable to debt service on all of the Authority’s bonds for the fiscal years ending June 30, 2019 and June 30, 2020, respectively. This amount is expected to be sufficient to provide for scheduled debt service payments on the 2019 Bonds. For further discussion of the 2018-2020 Appropriation Act, see the subsection entitled “The 2018 Appropriation Act” in Appendix B, and “Recent Financial Information” below.
Amendments to the 2018-2020 Appropriation Act.] For further discussion, see the subsection entitled “Budgetary Process” in Appendix B. The Virginia Constitution provides that no funds are to be paid out of the state treasury unless
appropriated by law by the General Assembly. The General Assembly has never failed to adopt a biennial budget in a timely fashion. There is no definitive guidance from the courts of the Commonwealth as to whatever emergency or implied executive spending powers the Governor of the Commonwealth may have, if any, including the power to make debt service payments that are subject to appropriation, in the absence of a budget or other appropriation therefor having been enacted by the General Assembly. Additional Bonds The Authority intends to issue Additional Bonds to pay the costs of completing certain Projects initially funded with bonds previously issued by the Authority, including Prior Bonds, and to undertake additional Projects. See “INTRODUCTION - Authority Financing Program.” Any Additional Bonds issued by the Authority under the Indenture will be equally and ratably secured and payable pursuant to the Indenture with the 2019 Bonds and the Prior Bonds. See “THE MASTER INDENTURE - Pledge of Revenues and Funds and Parity of Bonds.” Neither the size nor the timing of any series of Additional Bonds is known at this time.

10
Information Pertaining to the Commonwealth Appendix A contains the comprehensive financial statements of the Commonwealth for its fiscal year ended June 30, 2018 and Appendices B and C contain, respectively, certain financial and demographic/economic information pertaining to the Commonwealth.
THE 2019 BONDS
General Terms The 2019 Bonds will be issued in the principal amounts set forth on the inside front cover page of this Official Statement. The 2019 Bonds will be dated the date of their original issuance and delivery, will bear interest from such date at the rates set forth on the inside front cover page of this Official Statement, payable on each February 1 and August 1, commencing [August 1, 2019], and will mature as set forth on the inside front cover page of this Official Statement. Interest on the 2019 Bonds will be calculated on a 30/360 day basis. Payments will be made on each interest payment date to the bondholders shown as owners on the registration books kept by the Trustee on the 15th day of the month preceding each interest payment date. The 2019 Bonds will be issued only as fully registered bonds in book-entry only form, in denominations of $5,000 or any integral multiple thereof, and initially will be held by DTC or its nominee as securities depository for the 2019 Bonds. Purchases and sales of the 2019 Bonds by Beneficial Owners, defined below, are to be made in book-entry only form only and purchasers will not receive certificates representing their interest in 2019 Bonds so purchased. See the subsection “Book-Entry-Only System” below. If the book-entry system is discontinued, bond certificates will be delivered as described in the Indenture, and Beneficial Owners will become the registered owners. Principal of, and premium, if any, and interest on the 2019 Bonds will be payable at the corporate trust office of the Bond Registrar, initially, the Trustee, except that, for so long as Cede & Co. or such other nominee of DTC is the registered owner of all of the 2019 Bonds, principal of and premium, if any, and interest on the Bonds will be payable in accordance with certain procedures of DTC. Redemption Provisions* 2019A Bonds. The 2019A Bonds maturing on or before August 1, 20__* are not subject to redemption prior to maturity. The 2019A Bonds maturing on or after August 1, 20__* may be redeemed prior to their respective maturities at the sole option of the Authority on or after August 1, 20__*, in whole or in part (in any integral multiple of $5,000) at any time, upon payment of a redemption price equal to 100% of the principal amount of the 2019A Bonds to be redeemed, plus accrued interest to the redemption date. 2019B Bonds. The 2019B Bonds maturing on or before August 1, 20__* are not subject to redemption prior to maturity. The 2019B Bonds maturing on or after August 1, 20__* may be redeemed prior to their respective maturities at the sole option of the Authority on or after August 1, 20__*, in whole or in part (in any integral multiple of $5,000) at any time, upon payment of a redemption price equal to
* Preliminary, subject to change.

11
100% of the principal amount of the 2019B Bonds to be redeemed, plus accrued interest to the redemption date. [2019C Bonds. The 2019C Bonds maturing on or before August 1, 20__* are not subject to redemption prior to maturity. The 2019C Bonds maturing on or after August 1, 20__* may be redeemed prior to their respective maturities at the sole option of the Authority on or after August 1, 20__*, in whole or in part (in any integral multiple of $5,000) at any time, upon payment of a redemption price equal to 100% of the principal amount of the 2019C Bonds to be redeemed, plus accrued interest to the redemption date.]
[Mandatory Sinking Fund Redemption. Mandatory redemption provisions will be included in the final Official Statement only if the successful bidder elects to combine, in accordance with the Notices of Sale, serial maturities into one or more term bonds.
The 2019_ Bonds maturing on August 1, 20__, are subject to mandatory sinking fund redemption
on August 1 of the years and in the principal amounts plus accrued interest to the redemption date, without premium, as follows:
Year Amount Year Amount At its option, to be exercised on or before the seventieth day preceding any such mandatory
redemption date, the Authority may: (1) deliver to the Trustee 2019_ Bonds for cancellation; or
(2) receive a credit for any 2019_ Bonds of such maturity which prior to such date have been redeemed (otherwise than by mandatory redemption) and cancelled by the Trustee and not therefore applied as credit against any mandatory redemption obligations. Each such 2019_ Bond so delivered or previously redeemed will be credited by the Trustee at 100% of the principal amount thereof against the sinking fund requirement on such redemption date and any excess over such obligation will be credited against future mandatory redemption obligations in chronological order, unless the Authority instructs the Trustee otherwise, and the principal amount of 2019_ Bonds to be redeemed by mandatory redemption will be reduced accordingly.]
Manner of Redemption. If less than all of any series of the 2019 Bonds is to be called for redemption, the maturities to be called will be as directed by the Authority in such manner as the Authority may determine to be in its best interests.
If less than all of any maturity of any series of 2019 Bonds is to be called for redemption, such
series of 2019 Bonds within each maturity to be called will be selected by DTC or a successor securities depository pursuant to its rules and procedures or, if the book-entry system is discontinued, will be selected by the Trustee by lot in such manner as the Trustee in its discretion may determine. The portion of any 2019 Bond to be redeemed shall be in the principal amount of $5,000 or some integral multiple thereof. In selecting such 2019 Bonds for redemption, each 2019 Bond shall be considered as representing that number of 2019 Bonds that is obtained by dividing the principal amount of such 2019 Bond by $5,000. If a portion of a 2019 Bond shall be called for redemption, a new 2019 Bond in principal amount equal to the unredeemed portion thereof shall be issued to the registered owner upon the surrender thereof.

12
Notice of Redemption. Whenever 2019 Bonds are to be redeemed, the Authority shall cause notice of the call for redemption to be sent by the Trustee, by overnight delivery or registered or certified first class mail, not less than 30 nor more than 60 days before the redemption date, identifying the 2019 Bonds or portions thereof to be redeemed to DTC or its nominee as the registered owner thereof. Notice of redemption shall be mailed to the registered owners of the 2019 Bonds to be redeemed. During the period that DTC or its nominee is registered owner of the 2019 Bonds, the Authority shall not be responsible for mailing notices of redemption to the Beneficial Owners, as defined herein. See the subsection “Book-Entry-Only System.”
Any notice of optional redemption of the 2019 Bonds may state that it is conditioned upon there being available an amount of money sufficient to pay the redemption price, as described above, and any conditional notice so given may be rescinded at any time before the payment of the redemption price if any such condition so specified is not satisfied. If a redemption does not occur after a conditional notice is given due to an insufficient amount of funds on deposit by the Authority, the corresponding notice of redemption shall be deemed to be revoked.
If the Authority gives an unconditional notice of redemption, then on the redemption date the 2019
Bonds called for redemption will become due and payable. If the Authority gives a conditional notice of redemption, and if money to pay the redemption price of the affected 2019 Bonds shall have been set aside with the Trustee for the purpose of paying such 2019 Bonds, then on the redemption date the 2019 Bonds will become due and payable. In either case, if on the redemption date the Trustee holds money to pay the 2019 Bonds called for redemption, thereafter, no interest will accrue on those 2019 Bonds, and a bondholder’s right will be to receive payment of the redemption price upon surrender of those 2019 Bonds. Book-Entry-Only System The description that follows of the procedures and recordkeeping with respect to beneficial ownership interests in the 2019 Bonds, payments of redemption proceeds, distributions, and dividend payments on the 2019 Bonds to DTC, its nominee, Direct and Indirect Participants (as defined below) or Beneficial Owners, confirmation and transfer of beneficial ownership interests in the 2019 Bonds and other bond-related transactions by and between DTC, Direct and Indirect Participants and Beneficial Owners is based solely on information furnished by DTC. None of the Authority, the Commonwealth or the Trustee assumes any responsibility for the accuracy or adequacy of the information included in such description. DTC will act as securities depository for the 2019 Bonds. The 2019 Bonds will be issued as fully-registered securities registered in the name of Cede & Co. (DTC’s partnership nominee) or such other name as may be requested by an authorized representative of DTC. One fully-registered 2019 Bond certificate will be issued for each maturity of the 2019 Bonds, respectively, each in the aggregate principal amount of such maturity, and will be deposited with DTC. DTC, the world’s largest securities depository, is a limited-purpose trust company organized under the New York Banking Law, a “banking organization” within the meaning of the New York Banking Law, a member of the Federal Reserve System, a “clearing corporation” within the meaning of the New York Uniform Commercial Code, and a “clearing agency” registered pursuant to the provisions of Section 17A of the Securities Exchange Act of 1934. DTC holds and provides asset servicing for over 3.5 million issues of U.S. and non-U.S. equity issues, corporate and municipal debt issues, and money market instruments (from over 100 countries) that DTC’s participants (“Direct Participants”) deposit with DTC. DTC also facilitates the post-trade settlement among Direct Participants of sales and other securities transactions in deposited securities, through electronic computerized book-entry transfers and pledges between Direct Participants’ accounts. This eliminates the need for physical movement of securities certificates. Direct Participants

13
include both U.S. and non-U.S. securities brokers and dealers, banks, trust companies, clearing corporations, and certain other organizations. DTC is a wholly-owned subsidiary of The Depository Trust & Clearing Corporation (“DTCC”). DTCC is the holding company for DTC, National Securities Clearing Corporation and Fixed Income Clearing Corporation, all of which are registered clearing agencies. DTCC is owned by the users of its regulated subsidiaries. Access to the DTC system is also available to others such as both U.S. and non-U.S. securities brokers and dealers, banks, trust companies, and clearing corporations that clear through or maintain a custodial relationship with a Direct Participant, either directly or indirectly (“Indirect Participants”). DTC has a Standard & Poor’s rating of AA+. The DTC Rules applicable to its Participants are on file with the Securities and Exchange Commission. More information about DTC can be found at www.dtcc.com. Purchases of the 2019 Bonds under the DTC system must be made by or through Direct Participants, which will receive a credit for the 2019 Bonds on DTC’s records. The ownership interest of each actual purchaser of each 2019 Bond (“Beneficial Owner”) is in turn to be recorded on the Direct and Indirect Participants’ records. Beneficial Owners will not receive written confirmations from DTC of their purchase. Beneficial Owners are, however, expected to receive written confirmation providing details of the transaction, as well as periodic statements of their holdings, from the Direct or Indirect Participant through which the Beneficial Owner entered into the transaction. Transfers of ownership interests in the 2019 Bonds are to be accomplished by entries made on the books of Direct and Indirect Participants acting on behalf of Beneficial Owners. Beneficial Owners will not receive certificates representing their ownership interests in the 2019 Bonds, except in the event that use of the book-entry system for the 2019 Bonds is discontinued. To facilitate subsequent transfers, all 2019 Bonds deposited by Direct Participants with DTC are registered in the name of DTC’s partnership nominee, Cede & Co., or such other name as may be requested by an authorized representative of DTC. The deposit of 2019 Bonds with DTC and their registration in the name of Cede & Co. or such other DTC nominee do not effect any change in beneficial ownership. DTC has no knowledge of the actual Beneficial Owners of the 2019 Bonds; DTC’s records reflect only the identity of the Direct Participants to whose accounts such 2019 Bonds are credited, which may or may not be the Beneficial Owners. The Direct and Indirect Participants will remain responsible for keeping account of their holdings on behalf of their customers. Conveyance of notices and other communications by DTC to Direct Participants, by Direct Participants to Indirect Participants, and by Direct Participants and Indirect Participants to Beneficial Owners will be governed by arrangements among them, subject to any statutory or regulatory requirements as may be in effect from time to time. Beneficial Owners of the 2019 Bonds may wish to take certain steps to augment transmission to them of notices of significant events with respect to the 2019 Bonds, such as redemptions, tenders, defaults and proposed amendments to the 2019 Bond documents. For example, Beneficial Owners of the 2019 Bonds may wish to ascertain that the nominee holding the 2019 Bonds for their benefit has agreed to obtain and transmit notices to Beneficial Owners. In the alternative, Beneficial Owners may wish to provide their names and addresses to the registrar and request that copies of the notices be provided directly to them. Redemption notices shall be sent to DTC. If less than all of the 2019 Bonds within a maturity are being redeemed, DTC’s practice is to determine by lot the amount of the interest of each Direct Participant in such maturity to be redeemed. Neither DTC nor Cede & Co. (nor any other DTC nominee) will consent or vote with respect to the 2019 Bonds unless authorized by a Direct Participant in accordance with DTC’s MMI procedures. Under its usual procedures, DTC mails an Omnibus Proxy to the Authority as soon as possible after the record date. The Omnibus Proxy assigns Cede & Co.’s consenting or voting rights to those Direct

14
Participants to whose accounts the 2019 Bonds are credited on the record date (identified in a listing attached to the Omnibus Proxy). BECAUSE DTC IS TREATED AS THE OWNER OF THE 2019 BONDS FOR SUBSTANTIALLY ALL PURPOSES UNDER THE INDENTURE, BENEFICIAL OWNERS MAY HAVE A RESTRICTED ABILITY TO INFLUENCE IN A TIMELY FASHION REMEDIAL ACTION OR THE GIVING OR WITHHOLDING OF REQUESTED CONSENTS OR OTHER DIRECTIONS. IN ADDITION, BECAUSE THE IDENTITY OF BENEFICIAL OWNERS IS UNKNOWN TO THE AUTHORITY, THE COMMONWEALTH OR DTC, IT MAY BE DIFFICULT TO TRANSMIT INFORMATION OF POTENTIAL INTEREST TO BENEFICIAL OWNERS IN AN EFFECTIVE AND TIMELY MANNER. BENEFICIAL OWNERS SHOULD MAKE APPROPRIATE ARRANGEMENTS WITH THEIR BROKER OR DEALER REGARDING DISTRIBUTION OF INFORMATION REGARDING THE 2019 BONDS THAT MAY BE TRANSMITTED BY OR THROUGH DTC. Redemption proceeds, distributions, and dividend payments on the 2019 Bonds will be made to Cede & Co., or such other nominee as may be requested by an authorized representative of DTC. DTC’s practice is to credit Direct Participants’ accounts upon DTC’s receipt of funds and corresponding detail information from the Authority or the Trustee, on payable date in accordance with their respective holdings shown on DTC’s records. Payments by Participants to Beneficial Owners will be governed by standing instructions and customary practices, as is the case with securities held for the accounts of customers in bearer form or registered in “street name,” and will be the responsibility of such Participant and not of DTC, the Trustee, or the Authority, subject to any statutory or regulatory requirements as may be in effect from time to time. Payment of redemption proceeds, distributions, and dividend payments to Cede & Co. (or such other nominee as may be requested by an authorized representative of DTC) is the responsibility of the Authority or the Trustee, disbursement of such payments to Direct Participants will be the responsibility of DTC, and disbursement of such payments to Beneficial Owners will be the responsibility of Direct and Indirect Participants. THE AUTHORITY AND THE COMMONWEALTH CAN GIVE NO ASSURANCES THAT DIRECT AND INDIRECT PARTICIPANTS WILL PROMPTLY TRANSFER PAYMENT TO BENEFICIAL OWNERS.
DTC may discontinue providing its services as depository with respect to the 2019 Bonds at any time by giving reasonable notice to the Authority or the Trustee. Under such circumstances, in the event that a successor depository is not obtained, 2019 Bond certificates are required to be printed and delivered to DTC.
The Authority may decide to discontinue use of the system of book-entry-only transfers through
DTC (or a successor securities depository). In that event, 2019 Bond certificates will be printed and delivered. The foregoing information concerning DTC and DTC’s book-entry system has been obtained from sources that the Authority believes to be reliable. None of the Authority, the Commonwealth or the Trustee takes any responsibility for the accuracy thereof. So long as Cede & Co., as nominee for DTC, is the sole bondholder, the Authority and the Trustee shall treat Cede & Co. as the only bondholder for all purposes under the Master Indenture, including receipt of all redemption proceeds, distributions, and dividend payments on the 2019 Bonds, receipt of notices, voting and requesting or directing the Authority and the Trustee to take or not to take, or consenting to, certain actions under the Master Indenture. The Authority and the Trustee have no responsibility or obligation to the Direct and Indirect Participants or the Beneficial Owners with respect to (a) the accuracy of any records maintained by

15
DTC or any Direct and Indirect Participant; (b) the payment by any Direct or Indirect Participant of any amount due to any Beneficial Owner in respect of the redemption proceeds, distributions, and dividend payments on the 2019 Bonds in the sending of any transaction statements; (c) the delivery or timeliness of delivery by DTC or any participant of any notice to any Beneficial Owner which is required or permitted under the terms of the Master Indenture to be given to bondholders; (d) the selection of the Beneficial Owners to receive payments upon any partial redemption of 2019 Bonds, or (e) other action taken by DTC or Cede & Co., as bondholder, including the effectiveness of any action taken pursuant to an Omnibus Proxy. The Authority or the Trustee may enter into amendments to the agreement with DTC or successor agreements with a successor securities depository, relating to the book-entry system to be maintained with respect to the 2019 Bonds without the consent of Beneficial Owners or bondholders. Use of Certain Terms in Other Sections of this Official Statement. In reading this Official Statement it should be understood while the 2019 Bonds are in the book-entry-only system, references in other sections of this Official Statement to registered owners should be read to include the person for which the Participant acquires an interest in the 2019 Bonds, but (i) all rights of ownership must be exercised through DTC and the book-entry-only system, and (ii) except as described above, notices that are to be given to registered owners under the Indenture will be given only to DTC.

16
AUTHORITY DEBT SERVICE REQUIREMENTS
The following table sets forth the debt service requirements for all Authority bonds that will be outstanding as of the issuance of the 2019 Bonds on a fiscal year basis through 203[9].
* Preliminary, subject to change.
** Totals may not add due to rounding.
(1) Assumes an interest rate of 4.0% per annum on the Authority’s Variable Rate Public Facilities Revenue Bonds, Series 2005D. This rate is an assumed rate of interest for budgeting purposes and does not reflect current rates as of any particular date. Further, debt service on the Authority’s Public Facilities Revenue Bonds, Series 2010A-2 (Federally Taxable Build America Bonds) and Public Facilities Revenue Bonds, Series 2010B-2 (Taxable Build America Bonds) is gross of the expected federal debt service subsidy, which totaled [$_____] in the fiscal year ended June 30, 2018.
(2) To be completed upon the sale of the 2019 Bonds.
(3) The final debt service amounts will be set forth in the final Official Statement.
THE PAYMENT AGREEMENT
In addition to the information presented in “SOURCES OF PAYMENT AND SECURITY FOR THE BONDS,” the following summarizes certain provisions of the Payment Agreement. This summary does not purport to be comprehensive or definitive and is qualified by reference to the Payment Agreement in its entirety, copies of which may be obtained at the respective offices of the Treasury Board, the Trustee or the Authority.
Fiscal Year
Prior Bonds Total Debt Service on Authority
Bonds Ending Outstanding* 2019 Bonds (2) Outstanding
June 30 (Principal & Interest)(1) Principal Interest Total (Principal & Interest)(3)
Total** $

17
The Payment Agreement requires the Treasury Board to submit annually by December 1 to the Governor and the Director of the Department of Planning and Budget of the Commonwealth a statement of the amount of principal and interest coming due or expected to be coming due on the Bonds and all other amounts required to be paid under the Indenture during the next succeeding fiscal or biennial period, as applicable, and to request that the Governor include in his budget to be delivered to the next session of the General Assembly a provision that there be appropriated such amount for such purpose from legally available funds. The Authority will use its best efforts to have (i) the Governor include in each biennial or any supplemental budget he presents to the General Assembly the amounts so requested, and (ii) the General Assembly deposit, appropriate and reappropriate, as applicable, such amounts. The General Assembly is not required, and is under no legal obligation, to make an appropriation for any amount or payment under the Payment Agreement or otherwise in respect of any Bonds. The Treasury Board will use its best efforts to have (i) the Governor include in each biennial or supplemental budget he presents to the General Assembly the amounts described above, and (ii) the General Assembly deposit, appropriate and reappropriate, as applicable, such amounts. Under the Payment Agreement, both the Authority and the Treasury Board will notify the Trustee and the other party thereto promptly upon becoming aware of any failure by the General Assembly to appropriate, in the next succeeding fiscal or biennial period, all principal and interest coming due or expected to be coming due on the Bonds and all other amounts required to be paid under the Indenture. The Authority will provide to the Treasury Board, by January 1 and July 1 of each year, all required requisitions and documents and take all actions necessary to have paid to the Treasury Board from legally available funds, all amounts due under the Payment Agreement for principal and interest payments due or expected to be coming due under the Indenture and all other amounts required to be paid under the Indenture, including certain administrative expenses and rebate amounts, and to request the Treasury Board to make such payment to the Trustee. The Authority will take all action necessary to have such payments, which are made from legally available funds charged against the proper appropriation made by the General Assembly. The Treasury Board will use its best efforts to obtain by January 1 and July 1 of each year the appropriate requisitions and documents needed from the Authority to make all payments due under the Indenture to the Trustee. The Treasury Board, as Fiscal Agent for the Authority, will receive appropriation by the General Assembly for the payment of principal of, redemption premium, if any, interest on and all other amounts payable with respect to the Bonds, including administrative expenses and rebate amounts, and will transfer such amounts to the Trustee as necessary for the Trustee to make such payments when due. The term of the Payment Agreement continues until the earlier of the date of payment in full of the Bonds or the date on which the Bonds are no longer outstanding. The Trustee is a third party beneficiary of the Payment Agreement and is entitled to enforce, on behalf of the holders of the Bonds, all of the obligations and the rights of the parties thereto to the same extent as if the Trustee were one of the contracting parties.

18
THE MASTER INDENTURE
The 2019 Bonds are being issued pursuant to a Master Indenture of Trust, dated as of April 15, 1997, as amended and supplemented, and a Thirty-Seventh Supplemental Indenture of Trust dated as of _____ 1, 2019, each between the Authority and The Bank of New York Mellon Trust Company, N.A., as successor trustee (the “Trustee”). The Master Indenture of Trust as supplemented from time to time is hereinafter referred to as the “Indenture.” The following, in addition to the information presented in “THE 2019 BONDS,” summarizes certain provisions of the Indenture. This summary does not purport to be comprehensive or definitive and is qualified by references to the Indenture, including all supplemental indentures thereto, in its entirety. All capitalized terms not otherwise defined herein shall have the same meaning as given to those terms in the Indenture, copies of which may be obtained at the offices of the Authority or the Trustee. The 2019A Bonds, the 2019B Bonds, and 2019C Bonds will be the forty-ninth, fiftieth and fifty-first series of bonds issued under the Master Indenture. The 2019 Bonds will be equally and ratably secured by the Indenture with the Prior Bonds and with any Additional Bonds (together, the “Bonds”), without preference, priority or distinction on account of the actual time or times of their authentication, delivery or maturity, except as noted in “SOURCES OF PAYMENT AND SECURITY FOR THE BONDS.” The Bonds are limited obligations of the Authority. Principal, premium, if any, and interest on the Bonds, including the 2019 Bonds, are payable solely from and secured by appropriations anticipated to be made by the General Assembly and by the funds and accounts held by the Trustee pursuant to the Indenture, except that a Credit or Liquidity Facility may be provided for one or more series of Bonds. See “SOURCES OF PAYMENT AND SECURITY FOR THE BONDS.” There is no Credit or Liquidity Facility (as defined below) in respect of the 2019 Bonds. Pledge of Revenues and Funds and Parity of Bonds The Indenture constitutes a continuing, irrevocable pledge of the Trust Estate to secure payment of the principal of and premium, if any, and interest on all Bonds which may, from time to time, be executed, authenticated and delivered under the Indenture, subject only to the right of the Authority to make application thereof to other purposes as provided therein. All Bonds shall in all respects be equally and ratably secured under the Indenture without preference, priority or distinction on account of the actual time or times of their authentication, delivery or maturity, so that all Bonds at any time outstanding under the Indenture shall have the same right, lien and preference under and by virtue of the Indenture with like effect as if they had all been executed, authenticated and delivered simultaneously, except that a Credit or Liquidity Facility (as defined below) provided for one or more series of Bonds shall secure or provide liquidity only for the applicable series of Bonds. The Trust Estate includes:
A. Amounts on deposit from time to time in the funds and accounts created under the Indenture, including the earnings thereon, subject to the provisions of the Indenture permitting the application thereof for the purposes and on the terms and conditions set forth therein and excluding any amount on deposit in the Rebate Fund;
B. Amounts constituting revenues (including all amounts receivable by the Authority in respect
of a Project and all amounts receivable under the Payment Agreement);
C. Amounts received from or on behalf of the providers of any Credit or Liquidity Facilities; and

19
D. Any and all other property of any kind from time to time by delivery or by writing of any kind
specifically conveyed, pledged, assigned or transferred, as and for any additional security for the Bonds, by the Authority or by anyone on its behalf or with its written consent in favor of the Trustee.
Establishment of Funds and Cash Flow The Master Indenture establishes the following Funds:
(1) Bond Fund. The Trustee shall deposit in the Bond Fund any amounts transferred from the Construction Fund or the Costs of Issuance Fund, all payments or prepayments received by the Trustee from any appropriations made by the General Assembly (excluding the Trustee’s fees and expenses), and any other amounts authorized to be deposited in the Bond Fund.
(2) Construction Fund and Costs of Issuance Fund. Moneys deposited in the Construction Fund
or the Costs of Issuance Fund from the proceeds of the Bonds will be used to pay costs incurred with respect to the development or implementation of a Project or the costs incurred with respect to the issuance of the respective series of Bonds.
(3) Other Funds and Accounts. The Authority may establish other funds, accounts and
subaccounts, as the Authority may deem desirable. Credit and Liquidity Facilities The Master Indenture permits any series of Bonds issued thereunder to be secured by a line of credit, a standby bond purchase agreement, a letter of credit, a reserve fund, a policy of bond insurance, a guaranty, a surety bond or any other similar type of credit or liquidity support issued for the benefit of the Authority or the Trustee to secure or to provide liquidity for one or more series of Bonds (a “Credit or Liquidity Facility”). Each Credit or Liquidity Facility will secure or provide liquidity only for that series of Bonds for which such Credit or Liquidity Facility was provided. There is no Credit or Liquidity Facility for the 2019 Bonds. There is no debt service reserve fund for the 2019 Bonds. Events of Default and Remedies The following are Events of Default under the Master Indenture:
(1) If payment by the Authority with respect to any installment of interest on any Bond is not made
in full when the same becomes due and payable; (2) If payment by the Authority with respect to the principal of any Bond is not made in full when
the same becomes due and payable, whether at maturity or by proceedings for redemption or otherwise;
(3) If the Authority fails to observe or perform any covenant or agreement on its part under the
Indenture for a period of 60 days after the date on which written notice of such failure, requiring the same to be remedied, is given to the Authority by the Trustee, or to the Authority and the Trustee by the holders of at least 25% in aggregate principal amount of Bonds then Outstanding; provided, however, that if the breach of covenant or agreement is one that cannot be completely remedied within such 60-day period, it shall not be an Event

20
of Default as long as the Authority has taken active steps within such 60-day period to remedy the failure and is diligently pursuing such remedy; and
(4) If the Authority institutes proceedings to be adjudicated as a bankrupt or insolvent, or consents
to the institution of bankruptcy or insolvency proceedings against it, or files a petition or answer or consent seeking reorganization or relief under the Federal Bankruptcy Code or any other similar applicable federal or state law, or consents to the filing of any such petition or to the appointment of a receiver, liquidator, assignee, trustee or sequestrator (or other similar official) of the Authority or of any substantial part of its property, or makes an assignment for the benefit of creditors, or admits in writing its inability to pay its debts generally as they become due.
If an event of default occurs and has not been remedied, the Trustee may, and if required by the holders of not less than 25% in aggregate principal amount of Bonds outstanding and if indemnified for expenses will, declare the entire principal of and interest on the Bonds due and payable and take such action as the Trustee deems most effective to enforce any of its rights or to perform any of its duties under the Indenture. Except to enforce certain rights set forth in the Indenture, no holder of any Bond will have any right to institute any action, suit or proceeding at law or in equity for the enforcement of the Indenture, unless (a) an event of default has occurred and is continuing of which the Trustee has been notified in the manner required by the Indenture, (b) the holders of at least 25% in aggregate amount of the Bonds then outstanding have made a request to the Trustee and will have offered it reasonable opportunity either to proceed to exercise the powers granted by the Indenture or to institute such action, suit or proceeding in its own name or their name, (c) they have offered to the Trustee security and indemnity as provided in the Indenture, and (d) the Trustee has failed or refused to exercise the powers granted by the Indenture within 60 days after receipt by it of such request and offer of indemnity. Amendments and Supplemental Indentures The Authority and Trustee may, without consent of or notice to any of the holders, enter into one or more Supplemental Indentures to:
(1) Cure any ambiguity or formal defect or omission; (2) Correct or supplement any provision which may be inconsistent with any other provision;
(3) Grant or confer upon the holders any additional rights, remedies, powers, or authority that may
lawfully be granted or conferred upon them;
(4) Secure additional revenues or provide additional security or reserves for payment of the Bonds; (5) Preserve the excludability of interest on any tax-exempt Bonds from gross income for purposes
of federal income taxes; (6) Modify, amend or supplement the Indenture to permit the qualification thereof under the Trust
Indenture Act of 1939, as amended, or any similar federal statute hereafter in effect or any state securities (Blue Sky) law;
(7) Modify, amend or supplement the Indenture in such a manner as required to permit the
Authority to comply with the provisions of the Internal Revenue Code of 1986, as amended

21
(the “Code”) relating to the rebate of certain earnings on the proceeds of any tax-exempt Bonds;
(8) Modify, amend or supplement the Indenture in such a manner as required by the Rating
Agencies to maintain their respective ratings on the Bonds; (9) Authorize the issuance of and to secure one or more series of Additional Bonds; (10) Remove the Trustee; and (11) Modify, amend or supplement the Indenture in any manner as will not, in the opinion of
the Trustee, prejudice in any material respect the rights of the holders of the Bonds then Outstanding.
The holders of not less than a majority in aggregate principal amount of the Bonds may consent to or approve, from time to time, the execution by the Authority and the Trustee of such Supplemental Indentures for the purpose of modifying, altering, amending, adding to or rescinding any of the provisions contained in the Indenture except:
(1) Extending the stated maturity of or time for paying the interest on any Bond or reducing the principal amount of or the redemption premium or rate of interest payable on any Bond without the consent of the holder of such Bond;
(2) Giving preference or priority to any Bond over any other Bond without the consent of the
holders of each Bond not receiving such preference or priority; or
(3) Reducing the percentage of the holders of the aggregate principal amount of Bonds then outstanding required for any consent to any such Supplemental Indenture without the consent of the holders of all Bonds then outstanding.
Defeasance If the Authority shall pay or cause to be paid from an irrevocable escrow of cash and direct and general, non-callable obligations of, or obligations the timely payments of principal and interest on which are unconditionally guaranteed by, the United States of America, the principal of and premium, if any, and interest on all (or less than all) of such Bonds, then in that case, the right, title and interest of the owners of such Bonds in the security pledged to the payment of the Bonds shall cease. Bonds will be deemed to have been paid for purposes of the foregoing sentence when there shall have been deposited with a depository either moneys in an amount which, or non-callable, direct and general obligations of, or obligations the timely payments of principal and interest on which are unconditionally guaranteed by, the United States of America, or evidence of ownership of such obligations, the principal and interest on which shall be sufficient to pay when due the principal, redemption premium, if any, and interest on such Bonds to their maturity or earlier redemption date, and the other requirements of the Indenture are met. Enforceability of Remedies The remedies available to the Trustee, the Authority, or the owners of the Bonds upon an Event of Default under the Indenture are in many respects dependent upon judicial actions, which are often subject to discretion and delay. Under existing constitutional and statutory law and judicial decisions, the remedies

22
provided in the Indenture may not be readily available or may be limited. The various legal opinions to be delivered concurrently with the delivery of the Bonds and the Indenture will be qualified as to the enforceability of the various legal instruments by limitations imposed by bankruptcy, reorganization, insolvency or other similar laws affecting the rights of creditors generally. Certain actions may be taken and certain consents may be given under the Indenture by the owners of specified percentages of the Bonds. The Authority has issued the Prior Bonds and may issue Additional Bonds. Depending upon the outstanding principal balances of such Prior Bonds and Additional Bonds, the owners of such Prior Bonds and Additional Bonds may be able to take actions or give consents without obtaining the approval of any of the owners of the 2019 Bonds.
OTHER COMMONWEALTH FINANCINGS
[To come]
RATINGS
Fitch Ratings (“Fitch”), Moody’s Investors Service, Inc. (“Moody's”) and S&P Global Ratings, a division of The McGraw-Hill Companies, Inc. (“S&P”), have assigned the ratings of “___,” “___,” and “___,” respectively, to the 2019 Bonds. Such ratings reflect only the views of the respective rating agencies and an explanation of the significance of such ratings may be obtained only from the respective rating agency. A securities rating is not a recommendation to buy, sell or hold the 2019 Bonds, and there can be no assurance given that such ratings will be continued for any given period of time or that they will not be revised downward or withdrawn entirely by such rating agencies if, in their judgment, the circumstances so warrant. Any such downward revision or withdrawal of any of such ratings may have an adverse effect on the liquidity and market price of the 2019 Bonds.
Neither the Authority nor the Commonwealth has undertaken any responsibility after issuance of the 2019 Bonds to assure maintenance of such ratings or to oppose any proposed revision or withdrawal of such ratings.
LEGAL MATTERS
Certain legal matters relating to the authorization and validity of the 2019 Bonds will be subject to the approving opinions of Kaufman & Canoles, P.C., Bond Counsel, Richmond, Virginia, which will be furnished at the expense of the Authority upon delivery of the 2019 Bonds (the “Bond Opinions”). The forms of the Bond Opinions are set forth in Appendix D. The Bond Opinions will be limited to matters relating to the authorization and validity of the 2019 Bonds and to the tax status of interest thereon as described in “TAX MATTERS.” Bond Counsel has not been engaged to investigate the financial resources of the Authority or the Commonwealth, or their respective ability or willingness to provide for payment of the 2019 Bonds, and the Bond Opinions will make no statement as to such matters or as to the accuracy or completeness of this Official Statement or of any other information that may have been relied on by anyone in making the decision to purchase the 2019 Bonds.
Bond Counsel’s opinions are based on existing law, which is subject to change. Such opinions are further based on factual representations made to Bond Counsel as of the date thereof. Bond Counsel assumes no duty to update or supplement its opinions to reflect any facts or circumstances that may

23
thereafter come to Bond Counsel’s attention, or to reflect any changes in law that may thereafter occur or become effective. The legal opinions to be delivered concurrently with the delivery of the 2019 Bonds express the professional judgment of the attorneys rendering the opinions regarding the legal issues expressly addressed therein. By rendering a legal opinion, the opinion giver does not become an insurer or guarantor of the result indicated by that expression of professional judgment, of the transaction on which the opinion is rendered, or of the future performance of the parties to the transaction. Nor does the rendering of an opinion guarantee the outcome of any legal dispute that may arise out of the transaction.
Certain legal matters will be passed upon for the Authority, the Treasury Board and the
Commonwealth by the Office of the Attorney General of Virginia.
TAX MATTERS
Federal Tax Matters – 2019A Bonds and 2019B Bonds
In the opinion of Kaufman & Canoles, P.C., Richmond, Virginia, Bond Counsel, under existing law, interest on the 2019A Bonds (a) is not included in gross income for federal income tax purposes, and (b) is not an item of tax preference for purposes of the federal alternative minimum tax.
Further, in the opinion of Bond Counsel, under existing law, interest on the 2019B Bonds (a) is not
included in gross income for federal income tax purposes, except when held by a “substantial user” of the facilities to be financed by the Series 2019B Bonds or a “related person” within the meaning of Section 147(a) of the Code, and (b) is an item of tax preference for purposes of the federal alternative minimum tax imposed on individuals and corporations.
Except as set forth below under “Virginia Tax Matters,” no other opinion will be expressed by Bond Counsel regarding the tax consequences of the ownership of, or the receipt or accrual of interest on, the 2019A Bonds or the 2019B Bonds (collectively, the “Tax-Exempt Bonds”). Bond Counsel’s opinion will be given in reliance upon certifications by representatives of the Authority and the governmental entities that use or benefit from the Projects (“Users”) as to certain facts relevant to both the opinion and requirements of the Code, and Bond Counsel’s opinion is also subject to the condition that there is compliance subsequent to the issuance of the Tax-Exempt Bonds with all requirements of the Code that must be satisfied in order for interest income to remain excludable from gross income for federal income tax purposes. The Authority and the Users have covenanted to comply with the provisions of the Code regarding, among other matters, the use, expenditure, and investment of proceeds of the Tax-Exempt Bonds and the timely payment of any arbitrage rebate amounts in respect to the Tax-Exempt Bonds to the United States Treasury. Failure of the Authority or such Users to comply with such covenants could cause interest, on the Tax-Exempt Bonds to be included in gross income for federal income tax purposes retroactively to their date of issue. Appendix D to this Official Statement contains the proposed forms of the approving opinions of Bond Counsel. Prospective purchasers of the Tax-Exempt Bonds should review such forms to determine the assumptions relevant to such opinion and the relevant qualifications thereto. Bond Counsel’s opinions represent its legal judgment based in part upon the representations and covenants referenced therein and its review of existing law, but is not a guarantee of result or binding on the Internal Revenue Service (the “Service”) or the courts. Bond Counsel assumes no duty to update or supplement its opinions to reflect any facts or circumstances that may thereafter come to Bond Counsel’s attention or to reflect any changes in law or the interpretation thereof that may thereafter occur or become effective.

24
In addition to the matters addressed above, prospective purchasers of the Tax-Exempt Bonds should be aware that the ownership of tax-exempt obligations may result in collateral federal income tax consequences to certain taxpayers, including, without limitation, financial institutions, property and casualty insurance companies, S corporations, foreign corporations subject to the branch profits tax, corporations subject to the environmental tax, recipients of Social Security or Railroad Retirement benefits and taxpayers who may be deemed to have incurred or continued indebtedness to purchase or carry tax-exempt obligations. Prospective purchasers of the Tax-Exempt Bonds should consult their tax advisors as to the applicability and impact of such consequences. Bond Counsel will not render any opinion as to these collateral federal income tax matters. Future legislative proposals, if enacted into law, clarification of the Code or court decisions may cause interest on the Tax-Exempt Bonds to be subject, directly or indirectly, in whole or in part, to federal or state income taxation, or otherwise prevent owners of the Tax-Exempt Bonds from realizing the full current benefit of the tax status of such interest. The introduction or enactment of any such legislative proposals, clarification of the Code or court decisions may also affect, perhaps significantly, the market price for, or marketability of, the Tax-Exempt Bonds. Additionally, investors in the Tax-Exempt Bonds should be aware that future legislative actions (including federal income tax reform) may retroactively change the treatment of all or a portion of the interest on the Tax-Exempt Bonds for federal income tax purposes for all or certain taxpayers. Prospective purchasers of the Tax-Exempt Bonds should consult their own tax advisors regarding the potential impact of any pending or proposed federal or state tax legislation, regulation or litigation as to which Bond Counsel expresses no opinion. Many events could affect the value and liquidity or marketability of the Tax-Exempt Bonds after their issuance, including but not limited to public knowledge of an audit of the Tax-Exempt Bonds by the Service, a general change in interest rates for comparable securities, a change in Federal or state income tax rates, legislative or regulatory proposals as described above and changes in the judicial interpretation of existing law. In addition, certain tax considerations relevant to owners of Tax-Exempt Bonds who purchase Tax-Exempt Bonds after their issuance may be different from those relevant to purchase upon issuance. Neither the opinion of Bond Counsel nor this Official Statement addresses the likelihood or effect of any such potential events or such other tax considerations. Further, the Service has a program to audit obligations to determine whether the interest thereon is includable in gross income for federal income tax purposes. If the Service does audit the Tax-Exempt Bonds , under current Service procedures, the Service would likely treat the Authority as the taxpayer and the owners of the Tax-Exempt Bonds would have limited rights, if any, to participate. Original Issue Discount
The Tax-Exempt Bonds that have an original yield above their respective interest rates, as shown on the inside cover of this Official Statement (collectively, the “OID Bonds”), are being sold at an original issue discount. The difference between the initial public offering prices of such OID Bonds and their stated amounts to be paid at maturity constitutes original issue discount treated in the same manner for federal income tax purposes as interest, as described above.
The amount of original issue discount that is treated as having accrued with respect to a OID Bond is added to the cost basis of the owner of the bond in determining, for federal income tax purposes, gain or loss upon disposition of such OID Bond (including its sale, redemption or payment at maturity). Amounts received on disposition of such OID Bond that are attributable to accrued original issue discount will be treated as tax-exempt interest, rather than as taxable gain, for federal income tax purposes.

25
Original issue discount is treated as compounding semiannually, at a rate determined by reference to the yield to maturity of each individual OID Bond, on days that are determined by reference to the maturity date of such OID Bond. The amount treated as original issue discount on such OID Bond for a particular semiannual accrual period is equal to (a) the product of (i) the yield to maturity for such OID Bond (determined by compounding at the close of each accrual period) and (ii) the amount that would have been the tax basis of such OID Bond at the beginning of the particular accrual period if held by the original purchaser, (b)less the amount of any interest payable for such OID Bond during the accrual period. The tax basis for purposes of the preceding sentence is determined by adding to the initial public offering price on such OID Bond the sum of the amounts that have been treated as original issue discount for such purposes during all prior periods. If such OID Bond is sold between semiannual compounding dates, original issue discount that would have been accrued for that semiannual compounding period for federal income tax purposes is to be apportioned in equal amounts among the days in such compounding period. Owners of OID Bonds should consult their tax advisors with respect to the determination and treatment of original issue discount accrued as of any date and with respect to the state and local tax consequences of owning a OID Bond. Subsequent purchasers of OID Bonds that purchase such bonds for a price that is higher or lower than the “adjusted issue price” of the bonds at the time of purchase should consult their tax advisors as to the effect on the accrual of original issue discount. Original Issue Premium The Tax-Exempt Bonds that have an original yield below their respective interest rates, as shown on the inside cover of this Official Statement (collectively, the “Premium Bonds”), are being sold at a premium. An amount equal to the excess of the issue price of a Premium Bond over its stated redemption price at maturity constitutes premium on such Premium Bond. A purchaser of a Premium Bond must amortize any premium over such Premium Bond’s term using constant yield principles, based on the purchaser’s yield to maturity (or, in the case of Premium Bonds callable prior to their maturity, generally by amortizing the premium to the call date, based on the purchaser’s yield to the call date and giving effect to any call premium). As premium is amortized, the amount of the amortization offsets a corresponding amount of interest for the period, and the purchaser’s basis in such Premium Bond is reduced by a corresponding amount resulting in an increase in the gain (or decrease in the loss) to be recognized for federal income tax purposes upon a sale or disposition of such Premium Bond prior to its maturity. Even though the purchaser’s basis may be reduced, no federal income tax deduction is allowed. Purchasers of the Premium Bonds should consult their tax advisors with respect to the determination and treatment of premium for federal income tax purposes and with respect to the state and local tax consequences of owning a Premium Bond. Market Discount A purchaser (other than a person who purchases a Tax-Exempt Bond upon issuance at the issue price) who buys a Tax-Exempt Bond at a discount from its principal amount will be subject to the market discount rules of the Code. In general, the market discount rules of the Code treat principal payments and gain on disposition of a debt instrument as ordinary income to the extent of accrued market discount. Each potential investor should consult his tax advisor concerning the application of the market discount rules to the Tax-Exempt Bonds. Information Reporting and Backup Withholding Interest paid on the Tax-Exempt Bonds is subject to information reporting in a manner similar to interest paid on taxable obligations. While this reporting requirement does not by itself affect the excludability of interest on the Tax-Exempt Bonds from gross income for federal income tax purposes, the

26
reporting requirement causes the payment of interest on the Tax-Exempt Bonds to be subject to backup withholding if such interest is paid to beneficial owners who (i) are not “exempt recipients,” and (ii) fail to provide certain identifying information (such as the beneficial owner’s taxpayer identification number) in the required manner or have been identified by the Service as having failed to report all interest and dividends required to be shown on their income tax returns. Generally, individuals are not exempt recipients, whereas corporations and certain other entities generally are exempt recipients. Amounts withheld under the backup withholding rules from a payment to a beneficial owner would be allowed as a refund or a credit against such beneficial owner’s federal income tax liability provided the required information is furnished to the Service. Federal Tax Matters – 2019C Bonds
Bond Counsel is of the opinion that interest on the 2019C Bonds is includable in gross income for federal tax purposes. Except as set forth below under “Virginia Tax Matters,” no other opinion will be expressed by Bond Counsel regarding the tax consequences of the ownership of, or the receipt or accrual of interest on, the 2019C Bonds. The Code contains a number of provisions relating to the taxation of securities such as the 2019C Bonds that may affect the taxation of certain owners, depending on their particular tax situations, including original issue discount, market discount, bond premium and withholding requirements (which topics are briefly discussed above), as well as determining taxable gain or loss from the sale, exchange or other disposition of such securities. As regards taxable gain or loss, investors should note that the legal defeasance of any 2019C Bonds, if undertaken by the Authority, may result in a deemed sale or exchange of such 2019C Bonds under certain circumstances, and owners of the 2019C Bonds should consult their tax advisors as to the federal tax consequences of such an event.
Any federal tax advice contained in this Official Statement respecting the 2019C Bonds was written to support the marketing of the 2019C Bonds and is not intended or written to be used, and cannot be used, by a taxpayer for the purpose of avoiding any penalties that may be imposed under the Code. All taxpayers should seek advice based on such taxpayers’ particular circumstances from an independent tax advisor. This disclosure is provided to comply with Treasury Circular 230. Virginia Tax Matters In the opinion of Bond Counsel, under existing law, the 2019 Bonds, their transfer and the income therefrom (including any profit made on the sale thereof) are exempt from taxation within the Commonwealth of Virginia. Each prospective purchaser of the 2019 Bonds should consult his own tax advisor as to the tax status of interest in the 2019 Bonds under the tax laws of any state other than the Commonwealth of Virginia.
CONTINUING DISCLOSURE
Rule 15c2-12 under the Securities Exchange Act of 1934, as amended (the “Rule 15c2-12”), prohibits an underwriter from purchasing or selling municipal securities such as the 2019 Bonds, unless it has determined that the issuer of such securities and/or other persons deemed to be “material obligated persons” (hereinafter referred to as “MOPs”) have committed to provide (i) on an annual basis, certain financial information and operating data (“Annual Reports”), and, if available, audited financial statements, to the Municipal Securities Rulemaking Board (“MSRB”) via the MSRB’s Electronic Municipal Market Access System (“EMMA”), as described in 1934 Act Release No. 59062, and (ii) notice of various events described in Rule 15c2-12 (“Event Notices”), to the MSRB via EMMA.

27
The covenants that follow have been made to assist the successful bidder of the 2019 Bonds in complying with Rule 15c2-12.
Authority Continuing Disclosure. The Authority will covenant, by executing a Continuing Disclosure Agreement prior to issuance of the 2019 Bonds, to provide to the MSRB via EMMA annually, not later than May 1 of each year, commencing May 1, 2019, Annual Reports and such annual financial statements as may be required by Rule 15c2-12 with respect to itself, as issuer. The Authority also has covenanted to provide Event Notices with respect to the 2019 Bonds to the MSRB via EMMA. The form of the Authority’s Continuing Disclosure Agreement is set forth in Appendix E.
Commonwealth Continuing Disclosure. The Commonwealth, which the Authority has determined to be a MOP for purposes of Rule 15c2-12, will covenant, by executing a Continuing Disclosure Agreement prior to issuance of the 2019 Bonds, to provide to the MSRB via EMMA annually, not later than January 31 of each year, commencing January 31, 2020, Annual Reports and such annual financial statements as may be required by Rule 15c2-12 with respect to itself. In addition, the Commonwealth will covenant to provide notice to the Authority and to the MSRB via EMMA of any changes in the ratings of the Commonwealth’s general obligation bonds. The form of the Commonwealth’s Continuing Disclosure Agreement is set forth in Appendix E. [In making timely filings of its Annual Reports for Fiscal Year 2013, the CUSIP information necessary to link such filings to each series of the Virginia Resources Authority's Infrastructure Revenue Bonds and Moral Obligation Bonds was inadvertently omitted from such filings. In making timely filings of its Annual Reports for Fiscal Years 2013-2014, the CUSIP information necessary to link such filings to the Virginia Biotechnology Research Park Authority's Lease Revenue Refunding Bonds (Consolidated Laboratories Project), Series 2009 was also inadvertently omitted from such filings. All such filings were otherwise available from the MSRB with respect to other Commonwealth undertakings.] The Commonwealth has taken steps to ensure future compliance with its undertakings regarding Rule 15c2-12.
SALE AT COMPETITIVE BIDDING
The 2019 Bonds will be awarded pursuant to electronic competitive bidding to be held via the PARITY® Competitive Bidding System (PARITY®) on [___day], __________, 2019 unless changed, as set forth in the Notices of Sale contained in Appendix F to this Preliminary Official Statement.
This Preliminary Official Statement has been deemed final as of its date by the State Treasurer in accordance with the meaning and requirements of Rule 15c2-12, except for the omission of certain pricing and other information permitted to be omitted pursuant to Rule 15c2-12. After the award of the 2019 Bonds, the State Treasurer will complete the Official Statement so as to be a “final official statement” with the meaning of Rule 15c2-12. The final Official Statement will include, among other matters, the identity of the winning bidders and the managers of the syndicates, if any, submitting the winning bids, the expected selling compensation to underwriters of the 2019 Bonds and other information on the interest rates, CUSIPs and offering prices or yields of the 2019 Bonds, as supplied by the winning bidders.
FINANCIAL ADVISOR
Frasca & Associates, LLC, New York, New York, has served as financial advisor to the Authority with respect to the issuance and sale of the 2019 Bonds. Frasca & Associates, LLC is a financial advisory and consulting organization and is not engaged in the business of underwriting, marketing, or trading of municipal or any other negotiable instruments.

28
LITIGATION
The Authority is not a party to any current litigation. The Authority has no knowledge of any litigation, pending or threatened, to restrain or enjoin the issuance, sale, execution or delivery of the 2019 Bonds, or in any way contesting or affecting the validity of the 2019 Bonds or the Payment Agreement, any proceeding of the Authority taken with respect to the issuance or sale of the 2019 Bonds, or the existence or powers of the Authority or the title of any officers of the Authority with respect to his or her office. See the section entitled “LITIGATION” in Appendix B for a description of litigation involving the Commonwealth.
LEGALITY FOR INVESTMENT AND SECURITY FOR PUBLIC DEPOSITS
Under the Act, the 2019 Bonds are made securities in which all public officers and public bodies of the Commonwealth and its political subdivisions, all insurance companies, trust companies, banking associations, investment companies, executors, administrators, trustees and other fiduciaries in the Commonwealth may properly and legally invest funds, including capital in their control or belonging to them. No representation is made as to the eligibility of the 2019 Bonds for investment or for any other purpose under the laws of any other state. The 2019 Bonds are securities that may be deposited with and received by any state or municipal officer or any agency or political subdivision of the Commonwealth for any purpose for which the deposit of bonds or obligations of the Commonwealth is now or may hereafter be authorized by law.
CERTIFICATES OF AUTHORITY AND COMMONWEALTH
Concurrently with the delivery of the 2019 Bonds, an officer of the Authority will certify that, to the best of his or her knowledge, this Official Statement (except for the statements and information contained in “LEGAL MATTERS,” “TAX MATTERS,” “FINANCIAL ADVISOR,” and “LEGALITY FOR INVESTMENT AND SECURITY FOR PUBLIC DEPOSITS,” the last paragraph in “CONTINUING DISCLOSURE,” “THE 2019 BONDS - Book-Entry-Only System,” and Appendices A, B and C, and Appendix E insofar as such pertains to the continuing disclosure obligations of the Commonwealth, all of the foregoing as to which the Authority will express no representation) did not as of its date, and does not as of the date of delivery of the 2019 Bonds, contain any untrue statement of a material fact or omit to state a material fact necessary in order to make the statements contained herein, in the light of the circumstances under which they were made, not misleading. Such certificate will state that such Authority officer did not independently verify the information in this Official Statement from sources other than the Authority and its officers, but that he or she has no reason to believe that such information contains any untrue statement of a material fact or omits to state a material fact that should be included herein for the purpose for which this Official Statement is to be used, or which is necessary in order to make the statements contained herein, in the light of the circumstance under which they were made, not misleading. The State Treasurer (who is also the Secretary/Treasurer of the Authority) will certify as of the date of delivery of the 2019 Bonds that, to the best of her knowledge, Appendices A, B and C, except for the information in the section entitled “LITIGATION” in Appendix B as to which the State Treasurer will make no representation, Appendix E insofar as such pertains to the continuing disclosure obligations of the

29
Commonwealth, and the last paragraph in “CONTINUING DISCLOSURE” of this Official Statement do not, as of the date of delivery of the 2019 Bonds, contain any untrue statement of a material fact or omit to state a material fact relating to the Commonwealth necessary in order to make such statements, in the light of the circumstances under which they were made, not misleading.
MISCELLANEOUS
The references, excerpts and summaries of all documents referred to herein do not purport to be complete statements of all matters of fact relating to the 2019 Bonds, the security for the payment of the 2019 Bonds and the rights and obligations of the registered owners thereof. Copies of the documents referred to herein are available for inspection at the corporate trust office of The Bank of New York Mellon Trust Company, N.A., 500 Ross Street, 12th Floor, Pittsburgh, Pennsylvania 15262.
This Official Statement has been authorized by the Authority for use in connection with the sale of the 2019 Bonds. Its purpose is to supply information to prospective buyers of the 2019 Bonds. Financial and other information contained in this Official Statement has been prepared by the Authority and the Department of the Treasury of the Commonwealth from their records, except where other sources are noted. The information is not intended to indicate future or continuing trends in the financial or economic position of the Authority or the Commonwealth. The information contained in this Official Statement has been compiled from official and other sources deemed to be reliable, and while not guaranteed as to completeness or accuracy, is believed by the Authority to be correct as of this date. Any statements made in this Official Statement involving matters of opinion or of estimates, whether or not so expressly stated, are set forth as such and not as representations of fact, and no representation is made that any of the estimates will be realized. The Commonwealth’s audited Financial Statements for the year ended June 30, 2018, as audited by the Auditor of Public Accounts of the Commonwealth, are included as Appendix A. These financial statements, along with the related Notes to Financial Statements, (i) have been examined, to the extent set forth in such report by the Auditor of Public Accounts and are included in reliance upon the report of such Auditor, and (ii) are intended to provide a broad overview of the financial position and operating results of the Commonwealth’s various funds and account groups as of such date. See “SOURCES OF PAYMENT AND SECURITY FOR THE BONDS - Information Pertaining to the Commonwealth.”
The Authority has deemed this Preliminary Official Statement final as of its date within the meaning of Rule 15c2-12, except for the omission of certain pricing and other information permitted to be omitted pursuant to Rule 15c2-12. VIRGINIA PUBLIC BUILDING AUTHORITY BY: Chairman

APPENDIX A
FINANCIAL STATEMENTS OF THE COMMONWEALTH
FOR THE FISCAL YEAR ENDED JUNE 30, 2018

APPENDIX B
COMMONWEALTH OF VIRGINIA
FINANCIAL AND OTHER INFORMATION

APPENDIX C
COMMONWEALTH OF VIRGINIA
DEMOGRAPHIC AND ECONOMIC INFORMATION

APPENDIX D
PROPOSED FORMS OF BOND COUNSEL OPINIONS

APPENDIX D
Table of Contents
Page Proposed Form of Bond Counsel Opinion – D-__ 2019A Bonds and 2019B Bonds Proposed Form of Bond Counsel Opinion – D-__ 2019C Bonds

APPENDIX E
CONTINUING DISCLOSURE AGREEMENTS OF THE VIRGINIA PUBLIC BUILDING AUTHORITY
AND THE COMMONWEALTH OF VIRGINIA

APPENDIX E
Table of Contents
Page Form of Continuing Disclosure Agreement – E-__ Virginia Public Building Authority Form of Continuing Disclosure Agreement – E-__ Commonwealth of Virginia

E-1
Virginia Public Building Authority
CONTINUING DISCLOSURE AGREEMENT
This Continuing Disclosure Agreement dated __________, 2019 (the “Disclosure Agreement”), is executed and delivered by the Virginia Public Building Authority (the “Authority”) of the Commonwealth of Virginia (the “Commonwealth”) in connection with the issuance by the Authority of its $________ Public Facilities Revenue Bonds, Series 2019A (the “2019A Bonds”), $________ Public Facilities Revenue Bonds, Series 2019B (AMT) (the “2019B Bonds”) and $________ Public Facilities Revenue Bonds, Series 2019C (Taxable) (the “2019C Bonds,” and together with the 2019A Bonds and the 2019B Bonds, the “2019 Bonds”). The 2019 Bonds are being issued pursuant to the provisions of the Master Indenture of Trust, dated as of April 15, 1997 (the “Master Indenture”), between the Authority and The Bank of New York Mellon Trust Company, N.A., as successor trustee (the “Trustee”), as amended and supplemented from time to time, including as supplemented by the Thirty-Seventh Supplemental Indenture of Trust dated as of _____ 1, 2019 (the “Supplemental Indenture,” and the Master Indenture as so amended and supplemented from time to time, the “Indenture”), between the Authority and the Trustee, relating to the 2019 Bonds. The proceeds of the 2019 Bonds are being used by the Authority to: (i) finance the acquisition, construction, improvement, rehabilitation, furnishing and equipping of various public facilities for use by or on behalf of the Commonwealth and its agencies, (ii) finance the Commonwealth’s share of the costs of certain grants and of regional and local jail and juvenile detention facility projects, and (iii) pay costs of issuing the 2019 Bonds. The Authority hereby covenants and agrees as follows:
SECTION 1. Purpose of the Disclosure Agreement. This Disclosure Agreement is being executed
and delivered by the Authority for the benefit of the Holders and in order to assist the Participating Underwriters in complying with the Rule. The Authority acknowledges that it is undertaking primary responsibility for any reports, notices or disclosures that may be required under this Disclosure Agreement.
SECTION 2. Definitions. In addition to the definitions used for purposes of the Indenture, which
apply to any capitalized term used in this Disclosure Agreement unless otherwise defined in this Section, the following capitalized terms shall have the following meanings: “Annual Report” shall mean any Annual Report provided by the Authority pursuant to, and as described in, Sections 3 and 4 of this Disclosure Agreement. “Dissemination Agent” shall mean the Authority, acting in its capacity as Dissemination Agent hereunder, or any successor Dissemination Agent designated in writing by the Authority and which has filed with the Authority a written acceptance of such designation. “EMMA” shall mean the MSRB’s Electronic Municipal Market Access System, the internet address of which is http://emma.msrb.org/, and any successor thereto. “Fiscal Year” shall mean the twelve-month period, at the end of which the financial position of the Authority and results of its operations for such period are determined. Currently, the Authority’s Fiscal Year begins July 1 and continues through June 30 of the next year. “Holder” shall mean, for purposes of this Disclosure Agreement, any person who is a record owner or beneficial owner of a 2019 Bond.
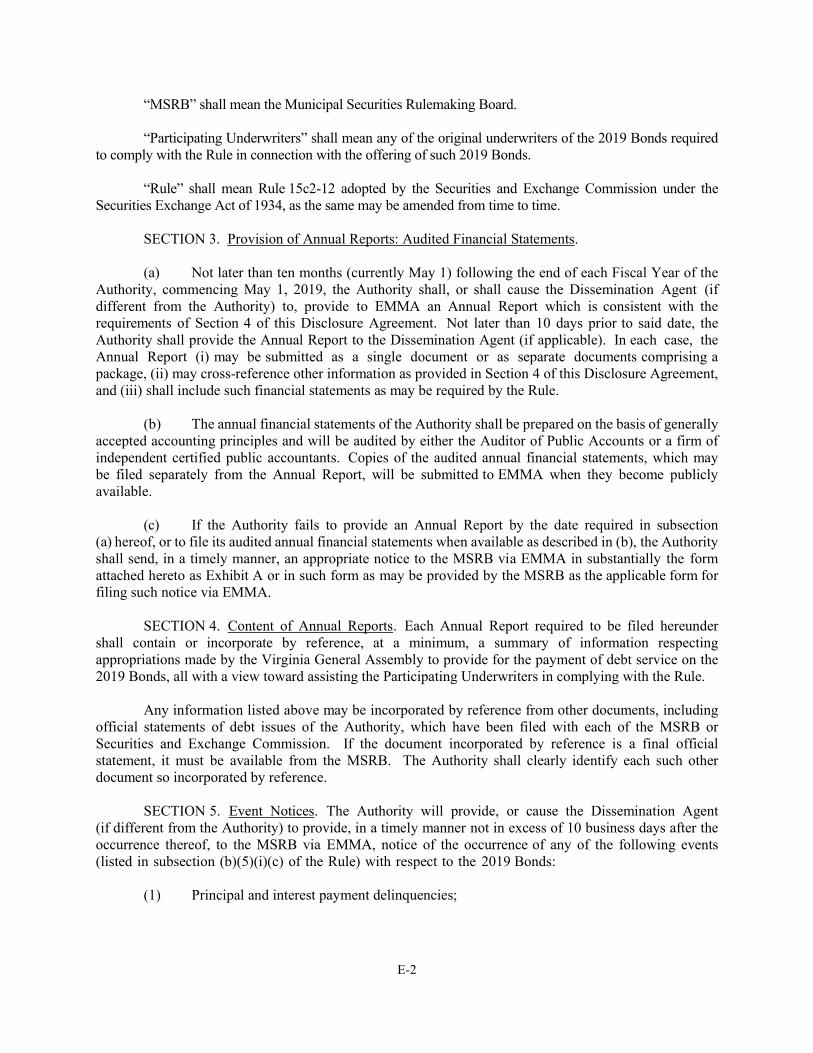
E-2
“MSRB” shall mean the Municipal Securities Rulemaking Board. “Participating Underwriters” shall mean any of the original underwriters of the 2019 Bonds required to comply with the Rule in connection with the offering of such 2019 Bonds. “Rule” shall mean Rule 15c2-12 adopted by the Securities and Exchange Commission under the Securities Exchange Act of 1934, as the same may be amended from time to time.
SECTION 3. Provision of Annual Reports: Audited Financial Statements. (a) Not later than ten months (currently May 1) following the end of each Fiscal Year of the Authority, commencing May 1, 2019, the Authority shall, or shall cause the Dissemination Agent (if different from the Authority) to, provide to EMMA an Annual Report which is consistent with the requirements of Section 4 of this Disclosure Agreement. Not later than 10 days prior to said date, the Authority shall provide the Annual Report to the Dissemination Agent (if applicable). In each case, the Annual Report (i) may be submitted as a single document or as separate documents comprising a package, (ii) may cross-reference other information as provided in Section 4 of this Disclosure Agreement, and (iii) shall include such financial statements as may be required by the Rule. (b) The annual financial statements of the Authority shall be prepared on the basis of generally accepted accounting principles and will be audited by either the Auditor of Public Accounts or a firm of independent certified public accountants. Copies of the audited annual financial statements, which may be filed separately from the Annual Report, will be submitted to EMMA when they become publicly available. (c) If the Authority fails to provide an Annual Report by the date required in subsection (a) hereof, or to file its audited annual financial statements when available as described in (b), the Authority shall send, in a timely manner, an appropriate notice to the MSRB via EMMA in substantially the form attached hereto as Exhibit A or in such form as may be provided by the MSRB as the applicable form for filing such notice via EMMA. SECTION 4. Content of Annual Reports. Each Annual Report required to be filed hereunder shall contain or incorporate by reference, at a minimum, a summary of information respecting appropriations made by the Virginia General Assembly to provide for the payment of debt service on the 2019 Bonds, all with a view toward assisting the Participating Underwriters in complying with the Rule. Any information listed above may be incorporated by reference from other documents, including official statements of debt issues of the Authority, which have been filed with each of the MSRB or Securities and Exchange Commission. If the document incorporated by reference is a final official statement, it must be available from the MSRB. The Authority shall clearly identify each such other document so incorporated by reference.
SECTION 5. Event Notices. The Authority will provide, or cause the Dissemination Agent (if different from the Authority) to provide, in a timely manner not in excess of 10 business days after the occurrence thereof, to the MSRB via EMMA, notice of the occurrence of any of the following events (listed in subsection (b)(5)(i)(c) of the Rule) with respect to the 2019 Bonds:
(1) Principal and interest payment delinquencies;

E-3
(2) Non-payment related defaults, if material; (3) Unscheduled draws on debt service reserves reflecting financial difficulties; (4) Unscheduled draws on credit enhancements reflecting financial difficulties; (5) Substitution of credit or liquidity providers, or their failure to perform; (6) Adverse tax opinions, the issuance by the Internal Revenue Service of proposed or final
determinations of taxability, Notices of Proposed Issue (IRS Form 5701 TEB) or other material notices or determinations with respect to the tax status of the 2019 Bonds or other material events affecting the tax status of the 2019 Bonds;
(7) Modifications to rights of Holders of the 2019 Bonds, if material; (8) 2019 Bond calls, if material, and tender offers; (9) Defeasances; (10) Release, substitution, or sale of property securing repayment of the 2019 Bonds, if material; (11) Rating changes; (12) Bankruptcy, insolvency, receivership or similar event with respect to the Authority; (13) The consummation of a merger, consolidation or acquisition involving the Authority or
sale of all or substantially all of the assets of the Authority, other than in the ordinary course of business, the entry into a definitive agreement to undertake such an action or the termination of a definitive agreement relating to any such actions, other than pursuant to its terms, if material; and
(14) Appointment of a successor or additional trustee under the Indenture or the change of name
of a trustee under the Indenture, if material.

E-4
(15) Incurrence of a financial obligation* of the Authority, if material, or agreement to
covenants, events of default, remedies, priority rights, or other similar terms of a financial obligation of the Authority, any of which affect security holders, if material; and
(16) Default, event of acceleration, termination event, modification of terms, or other similar events under the terms of a financial obligation2 of the Authority, any of which reflect financial difficulties.
The Authority does not undertake to provide the above-described notice in the event of a mandatory, scheduled redemption, not otherwise contingent upon the occurrence of an event, if (i) the terms, dates and amounts of redemption are set forth in detail in the official statement for the 2019 Bonds, (ii) the only open issue is when t h e 2019 Bonds will be redeemed in the case of a partial redemption, (iii) notice of redemption is given to the bondholders under the terms of the Indenture, and (iv) public notice of the redemption is given pursuant to 1934 Act Release No. 23856 of the Securities and Exchange Commission, even if the originally scheduled amounts may be reduced by prior optional redemption or 2019 Bond purchases.
SECTION 6. Termination of Reporting Obligation. The obligations of the Authority under this Disclosure Agreement shall terminate upon the earlier to occur of the legal defeasance or final retirement of the 2019 Bonds. SECTION 7. Dissemination Agent. The Authority may, from time to time, appoint or engage a Dissemination Agent to assist it in carrying out its obligations under this Disclosure Agreement and may discharge any such Agent, with or without appointing a successor Dissemination Agent. If at any time there is not any other designated Dissemination Agent, the Authority shall be the Dissemination Agent. SECTION 8. Amendment. Notwithstanding any other provision of this Disclosure Agreement, the Authority may amend this Disclosure Agreement, if such amendment is supported by an opinion of independent counsel with expertise in federal securities laws to the effect that such amendment is permitted or required by the Rule. SECTION 9. Additional Information. Nothing in this Disclosure Agreement shall be deemed to prevent the Authority from disseminating any other information, using the means of dissemination set forth in this Disclosure Agreement or any other means of communication, or including any other information in any Annual Report or notice described in Section 5 above, in addition to that which is required by this Disclosure Agreement. If the Authority chooses to include any information in any Annual Report or notice described in Section 5 above, in addition to that which is specifically required by
* For purposes of the events identified in subparagraphs (b)(5)(i)(C)(15) and (16) of the Rule, the term
“financial obligation” is defined to mean a (A) debt obligation; (B) derivative instrument entered into in connection with, or pledged as security or a source of payment for, an existing or planned debt obligation; or (C) a guarantee of (A) or (B). The term “financial obligation” does not include municipal securities as to which a final official statement has been otherwise provided to the MSRB consistent with the Rule. Numerous other terms contained in these subsections and/or in the definition of “financial obligation” are not defined in the Rule; SEC Release No. 34-83885 contains a discussion of the current SEC interpretation of those terms. For example, in the Release, the SEC provides guidance that the term “debt obligation” generally should be considered to include only lease arrangements that operate as vehicles to borrow money.
E-5
this Disclosure Agreement, the Authority shall have no obligation under this Disclosure Agreement to update such information or include it in any future Annual Report or notice. SECTION 10. Default. Any person referred to in Section 11 (other than the Authority) may take such action as may be permitted by law against the appropriate public official to secure compliance with the obligation of the Authority to file its Annual Report or to give notice as described in Section 5 hereinabove. In addition, the Holders of not less than a majority in aggregate principal amount of the 2019 Bonds outstanding may take such actions as may be permitted by law to challenge the adequacy of any information provided pursuant to this Disclosure Agreement, or to enforce any other obligation of the Authority hereunder. A default under this Disclosure Agreement shall not be deemed an event of default under the Indenture or the 2019 Bonds, and the sole remedy under this Disclosure Agreement in the event of any failure of the Authority to comply herewith shall be an action to compel performance. Nothing in this provision shall be deemed to restrict the rights or remedies of any holder pursuant to the Securities Exchange Act of 1934, the rules and regulations promulgated thereunder, or other applicable laws. SECTION 11. Beneficiaries. This Disclosure Agreement shall inure solely to the benefit of the Authority, the Participating Underwriters, and Holders from time to time of the 2019 Bonds, and shall create no rights in any other person or entity. SECTION 12. Obligated Person. The Authority has determined that the Commonwealth is an “obligated person”, within the meaning of the Rule, that is or may be material to the 2019 Bonds. The Commonwealth has concurred in such determination and has covenanted and agreed to provide its Annual Reports, its annual financial statements and certain Event Notices. SECTION 13. EMMA. All filings made pursuant to the Rule under this Disclosure Agreement shall be made solely by transmitting such filings to the MSRB via EMMA, as described in 1934 Act Release No. 59062. Should the Securities and Exchange Commission approve any additional or subsequent internet-based electronic filing system for satisfying the continuing disclosure filing requirements of the Rule, any filings required under this Disclosure Agreement may be made by transmitting such filing to such system, as described in the applicable Securities and Exchange Commission regulation or release approving such filing system.
IN WITNESS WHEREOF, the Authority has caused this Continuing Disclosure Agreement to be executed in its corporate name by its duly authorized officer, all as of the date first written above.
VIRGINIA PUBLIC BUILDING AUTHORITY
By: Secretary/Treasurer

E-6
Attachments: Exhibit A - Notice of Failure to File Annual Report [Audited Annual Financial Statements]

E-7
EXHIBIT A NOTICE OF FAILURE TO FILE ANNUAL REPORT [AUDITED ANNUAL FINANCIAL STATEMENTS] VIRGINIA PUBLIC BUILDING AUTHORITY in connection with Virginia Public Building Authority’s
$______ Public Facilities Revenue Bonds, Series 2019A $______ Public Facilities Revenue Bonds, Series 2019B (AMT)
$______ Public Facilities Revenue Bonds, Series 2019C (Taxable) CUSIP Numbers: 928172 _____ to _____ Dated Date of 2019 Bonds: __________, 2019 NOTICE IS HEREBY GIVEN that the Virginia Public Building Authority (the “Authority”) has not provided an Annual Report [Audited Annual Financial Statements] for the fiscal year ended __________ as required by the Continuing Disclosure Agreement dated __________ , 2019 (the “Disclosure Agreement”) as executed and delivered by the Authority. The Authority anticipates that the Annual Report [Audited Annual Financial Statements] will be filed by ____________________. Dated:_______________ VIRGINIA PUBLIC BUILDING AUTHORITY By: Its:

E-8
Commonwealth of Virginia [Virginia Public Building Authority]
CONTINUING DISCLOSURE AGREEMENT
This Continuing Disclosure Agreement dated __________, 2019 (this “Disclosure Agreement”), is executed and delivered by the Commonwealth of Virginia (the “Commonwealth”) in connection with the issuance by the Virginia Public Building Authority (the “Authority”) of its $________ Public Facilities Revenue Bonds, Series 2019A (the “2019A Bonds”), $________ Public Facilities Revenue Bonds, Series 2019B (AMT) (the “2019B Bonds”) and $________ Public Facilities Revenue Bonds, Series 2019C (Taxable) (the “2019C Bonds,” and together with the 2019A Bonds and the 2019B Bonds, the “2019 Bonds”) pursuant to the provisions of the Master Indenture of Trust, dated as of April 15, 1997 (the “Master Indenture”), between the Authority and The Bank of New York Mellon Trust Company, N.A., as successor trustee (the “Trustee”), as amended and supplemented from time to time, including as supplemented by the Thirty-Seventh Supplemental Indenture of Trust dated as of _____ 1, 2019 (the “Supplemental Indenture,” and the Master Indenture as so amended and supplemented from time to time, the “Indenture”), between the Authority and the Trustee, relating to the 2019 Bonds. The proceeds of the 2019 Bonds are being used by the Authority to: (i) finance the acquisition, construction, improvement, rehabilitation, furnishing and equipping of various public facilities for use by or on behalf of the Commonwealth and its agencies, (ii) finance the Commonwealth’s share of the costs of certain grants and of regional and local jail and juvenile detention facility projects, and (iii) pay costs of issuing the 2019 Bonds. The Authority has advised the Commonwealth that it has determined that the Commonwealth constitutes an “obligated person” within the meaning of the Rule (as defined below) in respect of the 2019 Bonds and the Commonwealth concurs in such determination. The Commonwealth hereby covenants and agrees as follows:
SECTION 1. Purpose of the Disclosure Agreement. This Disclosure Agreement is being
executed and delivered by the Commonwealth for the benefit of the Holders and in order to assist the Participating Underwriters in complying with the Rule. The Commonwealth acknowledges that it is undertaking primary responsibility for any reports, notices or disclosures that may be required under this Disclosure Agreement.
SECTION 2. Definitions. In addition to the definitions set forth in the Indenture, which apply
to any capitalized term used in this Disclosure Agreement unless otherwise defined in this Section, the following capitalized terms shall have the following meanings: “Annual Report” shall mean any Annual Report provided by the Commonwealth pursuant to, and as described in, Sections 3 and 4 of this Disclosure Agreement. “Dissemination Agent” shall mean the Commonwealth, acting in its capacity as Dissemination Agent hereunder, or any successor Dissemination Agent designated in writing by the Commonwealth and which has filed with the Commonwealth a written acceptance of such designation. “EMMA” shall mean the MSRB’s Electronic Municipal Market Access System, the internet address of which is http://emma.msrb.org/, and any successor thereto.

E-9
“Fiscal Year” shall mean the twelve-month period, at the end of which the financial position of the Commonwealth and results of its operations for such period are determined. Currently, the Commonwealth’s Fiscal Year begins July 1 and continues through June 30 of the next year. “Holder” shall mean, for purposes of this Disclosure Agreement, any person who is a record owner or beneficial owner of a 2019 Bond. “MSRB” shall mean the Municipal Securities Rulemaking Board. “Participating Underwriters” shall mean any of the original underwriters of the 2019 Bonds required to comply with the Rule in connection with the offering of such 2019 Bonds. “Rule” shall mean Rule 15c2-12 adopted by the Securities and Exchange Commission under the Securities Exchange Act of 1934, as the same may be amended from time to time.
SECTION 3. Provision of Annual Reports; Audited Financial Statements.
(a) Not later than seven months following the end of each Fiscal Year of the Commonwealth, commencing with the Fiscal Year ending June 30, 2019 the Commonwealth shall, or shall cause the Dissemination Agent (if different from the Commonwealth) to, submit to EMMA an Annual Report which is consistent with the requirements of Section 4 of this Disclosure Agreement. Not later than 10 days prior to said date, the Commonwealth shall provide the Annual Report to the Dissemination Agent (if applicable). In each case, the Annual Report (i) may be submitted as a single document or as separate documents comprising a package, (ii) may cross-reference other information as provided in Section 4 of this Disclosure Agreement, and (iii) shall include such financial statements as may be required by the Rule.
(b) The annual financial statements of the Commonwealth shall be prepared on the basis of
generally accepted accounting principles and will be audited. Copies of the audited annual financial statements, which may be filed separately from the Annual Report, will be submitted to EMMA when they become publicly available.
(c) If the Commonwealth fails to submit an Annual Report to EMMA by the date required in
subsection (a) hereof, or to submit its audited annual financial statements to EMMA when they become publicly available, the Commonwealth shall send, in a timely manner, an appropriate notice to the MSRB in substantially the form attached hereto as Exhibit A or in such form as may be provided by the MSRB as the applicable form for filing such notice via EMMA.
SECTION 4. Content of Annual Reports. Each Annual Report required to be filed hereunder
shall include, at a minimum, the information referred to in Exhibit B as it relates to the Commonwealth, all with a view toward assisting Participating Underwriters in complying with the Rule. Any or all of such information may be incorporated by reference from other documents, including official statements containing information with respect to the Commonwealth, which have been filed with the MSRB or the Securities and Exchange Commission. If the document incorporated by reference is a final official statement, it must be available from the MSRB. The Commonwealth shall clearly identify each such other document so incorporated by reference.
SECTION 5. Notice of Rating Changes. The Commonwealth will provide in a timely manner not
in excess of ten business days after the occurrence of the event to the Authority and to EMMA notice of any

E-10
changes in the ratings of the Commonwealth’s general obligation bonds by the rating agencies requested by the Commonwealth to rate such bonds.
SECTION 6. Notice of Bankruptcy, Insolvency, Receivership or Similar Event. The Commonwealth will provide in a timely manner not in excess of ten business days after the occurrence of the event to the Authority and to EMMA notice of any bankruptcy, insolvency, receivership or similar event of the Commonwealth. For purposes of this Section, a bankruptcy, insolvency, receivership or similar event of the Commonwealth is considered to occur when any of the following occur: the appointment of a receiver, fiscal agent or similar officer for the Commonwealth in a proceeding under the U.S. Bankruptcy Code or in any other proceeding under state or federal law in which a court or governmental authority has assumed jurisdiction over substantially all of the assets or business of the Commonwealth, or if such jurisdiction has been assumed by leaving the existing governing body and officials or officers in possession but subject to the supervision and orders of a court or governmental authority, or the entry of an order confirming a plan of reorganization, arrangement or liquidation by a court or governmental authority having supervision or jurisdiction over substantially all of the assets or business of the Commonwealth. SECTION 7. Notice of Merger, Consolidation, Acquisition or Similar Event. The Commonwealth will provide in a timely manner not in excess of ten business days after the occurrence of the event to the Authority and to EMMA notice of any consummation of a merger, consolidation, or acquisition involving the Commonwealth or the sale of all or substantially all of the assets of the Commonwealth, other than in the ordinary course of business, the entry into a definitive agreement to undertake such an action or the termination of a definitive agreement relating to any such actions, other than pursuant to its terms, if material.
SECTION 8. Termination of Reporting Obligation. The obligations of the Commonwealth
under this Disclosure Agreement shall terminate upon the earlier to occur of the legal defeasance or final retirement of the 2019 Bonds, and the Authority shall notify the Commonwealth promptly upon the occurrence of either such event.
SECTION 9. Dissemination Agent. The Commonwealth may, from time to time, appoint or
engage a Dissemination Agent to assist it in carrying out its obligations under this Disclosure Agreement and may discharge any such Agent, with or without appointing a successor Dissemination Agent. If at any time there is not any other designated Dissemination Agent, the Commonwealth shall be the Dissemination Agent.
SECTION 10. Amendment. Notwithstanding any other provision of this Disclosure Agreement,
the Commonwealth may amend this Disclosure Agreement, if such amendment is supported by an opinion of independent counsel with expertise in federal securities laws to the effect that such amendment is permitted or required by the Rule.
SECTION 11. Additional Information. Nothing in this Disclosure Agreement shall be deemed to
prevent the Commonwealth from disseminating any other information, using the means of dissemination set forth in this Disclosure Agreement or any other means of communication, or including any other information in any Annual Report or notices described in Section 5, Section 6 and Section 7 above, in addition to that which is required by this Disclosure Agreement. If the Commonwealth chooses to include any information in any Annual Report or notice described in Section 5, Section 6 and Section 7 above, in addition to that which is specifically required by this Disclosure Agreement, the Commonwealth shall have no obligation under this Disclosure Agreement to update such information or include it in any future Annual Report or notice.

E-11
SECTION 12. Default. Any person referred to in Section 13 (other than the Commonwealth) may take such action as may be permitted by law against the appropriate public official to secure compliance with the obligation of the Commonwealth to file its Annual Report or to give notices as described in Section 5 and Section 6 hereinabove. In addition, Holders of not less than a majority in aggregate principal amount of Bonds outstanding may take such actions as may be permitted by law to challenge the adequacy of any information provided pursuant to this Disclosure Agreement, or to enforce any other obligation of the Commonwealth hereunder. A default under this Disclosure Agreement shall not be deemed an event of default under any applicable resolution or other debt authorization of the Commonwealth, and the sole remedy under this Disclosure Agreement in the event of any failure of the Commonwealth to comply herewith shall be an action to compel performance. Nothing in this provision shall be deemed to restrict the rights or remedies of any Holder pursuant to the Securities Exchange Act of 1934, the rules and regulations promulgated thereunder, or other applicable laws.
SECTION 13. Beneficiaries. This Disclosure Agreement shall inure solely to the benefit of the Commonwealth, the Authority, the Participating Underwriters, and Holders from time to time of the 2019 Bonds, and shall create no rights in any other person or entity.
SECTION 14. Counterparts. This Disclosure Agreement may be executed in several
counterparts, each of which shall be an original and all of which shall constitute but one and the same instrument.
SECTION 15. EMMA. All filings under this Disclosure Agreement shall be made solely by
transmitting such filings to the MSRB via EMMA, as described in 1934 Act Release No. 59062. Should the Securities and Exchange Commission approve any additional or subsequent internet-based electronic filing system for satisfying the continuing disclosure filing requirements of the Rule, any filings required under this Disclosure Agreement may be made by transmitting such filing to such system, as described in the applicable Securities and Exchange Commission regulation or release approving such filing system.
Date: __________, 2019 COMMONWEALTH OF VIRGINIA By: ______________________________ State Treasurer AGREED TO & ACKNOWLEDGED: VIRGINIA PUBLIC BUILDING AUTHORITY By: ______________________________ Assistant Secretary/Treasurer
Attachments:

E-12
Exhibit A - Notice of Failure to File Annual Report [Audited Annual Financial Statements] Exhibit B - Content of Annual Report

E-13
EXHIBIT A NOTICE OF FAILURE TO FILE ANNUAL REPORT [AUDITED ANNUAL FINANCIAL STATEMENT] COMMONWEALTH OF VIRGINIA in connection with
Virginia Public Building Authority’s $______ Public Facilities Revenue Bonds, Series 2019A
$______ Public Facilities Revenue Bonds, Series 2019B (AMT) $______ Public Facilities Revenue Bonds, Series 2019C (Taxable)
CUSIP Numbers: 928172 _____ to _____
Dated Date of Series 2019 Bonds: __________, 2019
NOTICE IS HEREBY GIVEN that the Commonwealth of Virginia (the “Commonwealth”) has not provided an Annual Report [Audited Annual Financial Statements] as required by Section 3 of the Continuing Disclosure Agreement, which was entered into in connection with the above-named bonds issued pursuant to the Thirty-Seventh Supplemental Indenture dated as of _____ 1, 2019, between the Virginia Public Building Authority and The Bank of New York Mellon Trust Company, N.A., as successor trustee. The Commonwealth anticipates that the Annual Report [Audited Annual Financial Statements] will be filed by _____. Dated: ________ COMMONWEALTH OF VIRGINIA By: ______________________________ State Treasurer
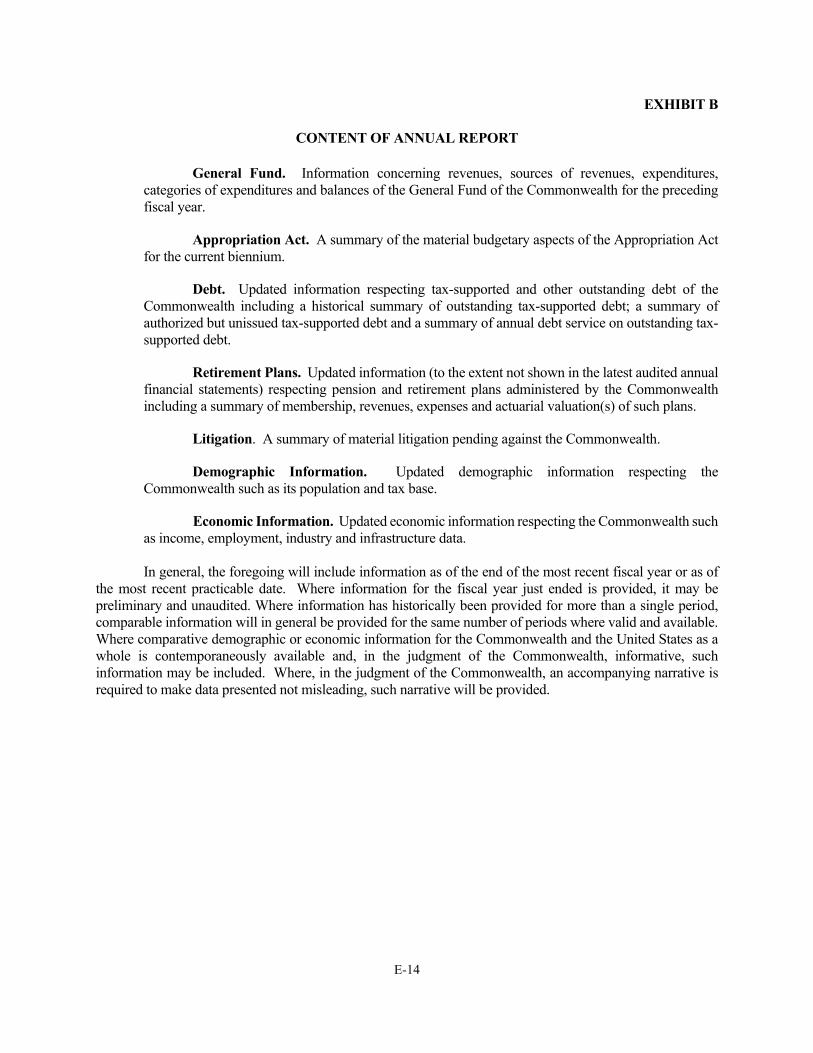
E-14
EXHIBIT B CONTENT OF ANNUAL REPORT
General Fund. Information concerning revenues, sources of revenues, expenditures, categories of expenditures and balances of the General Fund of the Commonwealth for the preceding fiscal year.
Appropriation Act. A summary of the material budgetary aspects of the Appropriation Act for the current biennium.
Debt. Updated information respecting tax-supported and other outstanding debt of the Commonwealth including a historical summary of outstanding tax-supported debt; a summary of authorized but unissued tax-supported debt and a summary of annual debt service on outstanding tax-supported debt.
Retirement Plans. Updated information (to the extent not shown in the latest audited annual financial statements) respecting pension and retirement plans administered by the Commonwealth including a summary of membership, revenues, expenses and actuarial valuation(s) of such plans.
Litigation. A summary of material litigation pending against the Commonwealth.
Demographic Information. Updated demographic information respecting the Commonwealth such as its population and tax base.
Economic Information. Updated economic information respecting the Commonwealth such as income, employment, industry and infrastructure data.
In general, the foregoing will include information as of the end of the most recent fiscal year or as of the most recent practicable date. Where information for the fiscal year just ended is provided, it may be preliminary and unaudited. Where information has historically been provided for more than a single period, comparable information will in general be provided for the same number of periods where valid and available. Where comparative demographic or economic information for the Commonwealth and the United States as a whole is contemporaneously available and, in the judgment of the Commonwealth, informative, such information may be included. Where, in the judgment of the Commonwealth, an accompanying narrative is required to make data presented not misleading, such narrative will be provided.
F-1
APPENDIX F
NOTICES OF SALE

F-2
17123787v3
APPENDIX F
Table of Contents
Page Notice of Sale – F-_ Series 2019A Bonds Notice of Sale – F-__ Series 2019B Bonds Notice of Sale – F-__ Series 2019C Bonds

KC Draft: 02/07/19
[__]-1
NOTICE OF SALE
VIRGINIA PUBLIC BUILDING AUTHORITY $_____*
Public Facilities Revenue Bonds, Series 2019A
Electronic Bids, via the PARITY® Competitive Bidding System (“PARITY®”) only, for the purchase of all, and not less than all, of the $_____* Virginia Public Building Authority Public Facilities Revenue Bonds, Series 2019A (the “2019A Bonds”) will be received until [_____] A.M., RICHMOND, VIRGINIA TIME, on _____, __________, 2019 (unless postponed or changed as described herein), by the Virginia Public Building Authority (the “Authority”).
Preliminary Official Statement
The Authority has authorized the preparation and distribution of a Preliminary Official Statement dated __________, 2019 (the “Preliminary Official Statement”) containing information relating to the 2019A Bonds, the Authority’s Public Facilities Revenue Bonds, Series 2019B Bonds (AMT) and the Authority’s Public Facilities Revenue Bonds, Series 2019C Bonds (Taxable), which are not described in or covered by this Notice of Sale. This Notice of Sale and the Preliminary Official Statement referred to above are available on the Internet at finpressllc.com. The Preliminary Official Statement in its entirety is available in physical form and may be obtained as provided under the caption “Additional Information” herein.
The 2019A Bonds
Authorization and Security The 2019A Bonds will be issued pursuant to a Master Indenture of Trust (as previously supplemented and amended, the “Master Indenture”), dated as of April 15, 1997, as supplemented by the Thirty-Seventh Supplemental Indenture of Trust (the “Supplemental Indenture”), dated as of _____ 1, 2019, between the Authority and The Bank of New York Mellon Trust Company, N.A., as successor trustee (the “Trustee”). Together, the Master Indenture, the Thirty-Seventh Supplemental Indenture and any further supplements are referred to collectively as the “Indenture.” All Bonds currently outstanding under the Indenture are collectively referred to as the “Prior Bonds.” The 2019A Bonds, the Prior Bonds, and all other parity or additional bonds hereafter issued from time to time under and secured equally and ratably by the Indenture (the “Additional Bonds”) are collectively called the “Bonds.” THE 2019A BONDS WILL BE LIMITED OBLIGATIONS OF THE AUTHORITY PAYABLE SOLELY FROM THE REVENUES, RECEIPTS AND FUNDS PLEDGED OR AVAILABLE FOR THE PAYMENT THEREOF AND ARE NOT A DEBT OR A PLEDGE OF THE FULL FAITH AND CREDIT OF THE COMMONWEALTH OR OF ANY POLITICAL SUBDIVISION THEREOF, OTHER THAN THE AUTHORITY. THE GENERAL ASSEMBLY IS NOT REQUIRED, AND IS UNDER NO LEGAL OBLIGATION, TO MAKE AN APPROPRIATION FOR ANY AMOUNTS DUE UNDER THE PAYMENT AGREEMENT.
* Preliminary, subject to change.

[__]-2
Bid Parameters for the 2019A Bonds
INTEREST PROCEDURAL
Dated Date: Date of Delivery Sale Date and Time: Bids due _____, 2019 at [____] A.M., Richmond, VA Time
Anticipated Delivery Date:
_____, 2019 Bid Submission: Electronic bids through PARITY Only
Interest Payment Dates: February 1 and August 1 All or None? Yes
First Interest Payment Date:
August 1, 20__ Bid Award Method: Lowest TIC
Coupon Multiples: [1/8 or 1/20 of 1%] Good Faith Deposit: 1% of the Preliminary Aggregate Principal Amount
Zero Coupons: Not Permitted
Optional Redemption:
Due on and after August 1, 20__, callable on August 1, 20__ and thereafter at par
Split Coupons: Not Permitted
PRINCIPAL PRICING
Post-bid Principal Increases in Aggregate:
[10%] Max. Aggregate Bid Price: [No Limit]
Post-bid Principal Reductions in Aggregate:
[10%] Min. Aggregate Bid Price: [100%]
Term Bonds: Any two or more consecutive maturities may be designated as term bonds
Max. Price per Maturity: [No Limit]
Min. Price per Maturity: [No Limit]
High Coupon per Maturity: [5.0%]
Low Coupon per Maturity: [No Limit]
Details of 2019A Bonds; Book Entry Only The 2019A Bonds will be dated the date of their original issuance and delivery (the “Dated Date”). Interest on the 2019A Bonds from the Dated Date will be calculated on a 30/360 day basis and will be payable semiannually on February 1 and August 1, commencing _____ 1, 2019. The 2019A Bonds will be issued as fully registered bonds in book entry form, payable to the nominee of The Depository Trust Company, New York, New York, (“DTC”), as securities depository for the 2019A Bonds. Reference is made to the Preliminary Official Statement relating to the 2019A Bonds for the applicable provisions relating to the transfer of beneficial ownership, manner of redemption, the responsibilities of DTC participants and the right of the Authority to discontinue the book entry only system.

[__]-3
Maturity Schedule Principal on the 2019A Bonds will be due (subject to the right of prior redemption, if any, as hereafter set forth) through serial maturities or term maturities as provided below on the following dates and in the following amounts:
August 1 2019A Bonds*
————— * Preliminary, subject to adjustment both before and after award of the 2019A Bonds as described herein under “Changes to Preliminary Principal Amount.”
Serial and/or Term Bonds; Mandatory Sinking Fund Redemption The successful bidder may provide in the bid form for all of the 2019A Bonds to be issued as serial bonds or may designate consecutive annual principal amounts of the 2019A Bonds to be combined into term bonds. Each such term bond shall be subject to mandatory sinking fund redemption commencing on August 1 of the first year which has been combined to form such term bond and continuing on August 1 in each year thereafter until the stated maturity date of that term bond. The amount redeemed in any year shall be equal to the principal amount for such year set forth in the appropriate amortization schedule, as adjusted in accordance with the provisions described above under the caption “Changes to Preliminary Principal Amount.” The 2019A Bonds to be redeemed in any year by mandatory sinking fund redemption shall be redeemed at par and shall be selected by lot or otherwise according to DTC procedures from among the 2019A Bonds of the same maturity. Optional Redemption Provisions The 2019A Bonds maturing on or before August 1, 20__* are not subject to redemption prior to maturity. The 2019A Bonds maturing on or after August 1, 20__* may be redeemed prior to their respective maturities at the sole option of the Authority on or after August 1, 20__*, in whole or in part at any time, at a redemption price equal to 100% of the principal amount of the 2019A Bonds to be redeemed, plus accrued interest to the redemption date, as described in the Preliminary Official Statement.
Preliminary, subject to change.

[__]-4
Changes to Bid Date, Closing Date, and Principal Amounts Change of Bid Date and Closing Date
The Authority reserves the right to change, from time to time, the date and/or time established for the receipt of bids and will undertake to notify registered prospective bidders via notification published on www.tm3.com (“TM3”). Prospective bidders may request notification of any such changes in the date or time for the receipt of bids by so advising Frasca & Associates, LLC at [(___) ___-____] by no later than [_____], RICHMOND, VIRGINIA TIME, on the day prior to the announced date for receipt of bids.
A change of the bid date and/or time will be announced in accordance with the timing and process described under “Amendments.” An alternative sale date and time will be announced via TM3 at least 18 hours prior to such alternative date and/or time for receipt of bids. On any such alternative date and/or time for receipt of bids, the Authority will accept electronic bids for the purchase of the 2019A Bonds, such bids to conform in all respects to the provisions of this Notice of Sale, except for the changes in the date and/or time for receipt of bids and any other changes announced via TM3 at the time the date and time for receipt of bids are announced. The Authority may change the scheduled delivery date for the 2019A Bonds by notice given in the same manner as that set forth for a change in the date for the receipt of bids. See “Delivery of the 2019A Bonds” below. Changes to Preliminary Principal Amounts The preliminary aggregate principal amount of the 2019A Bonds and the preliminary annual principal amounts as set forth in this Notice of Sale (the “Preliminary Aggregate Principal Amount” and the “Preliminary Annual Principal Amounts,” respectively; collectively, the “Preliminary Amounts”) may be revised before the viewing of electronic bids for the purchase of the 2019A Bonds. Any such revisions (the “Revised Aggregate Principal Amount” and the “Revised Annual Principal Amounts,” respectively; collectively, the “Revised Amounts”) WILL BE ANNOUNCED IN ACCORDANCE WITH THE TIMING AND PROCESS DESCRIBED UNDER “AMENDMENTS.” In the event that no such revisions are made, the Preliminary Amounts will constitute the Revised Amounts. BIDDERS SHALL SUBMIT BIDS BASED ON THE REVISED AMOUNTS. Prospective bidders may request notification of any revisions in Preliminary Amounts by so advising Frasca & Associates, LLC at [(___) ___-____] by [_____], RICHMOND, VIRGINIA TIME, at least one day prior to the receipt of bids. Changes to Revised Principal Amounts After selecting the winning bid, the Authority reserves the right to change the final aggregate principal amount of the 2019A Bonds and each final annual principal amount (the “Final Aggregate Principal Amounts” and the “Final Annual Principal Amounts,” respectively; collectively, the “Final Amounts”). In determining the Final Amounts, the Authority will not reduce or increase the Revised Aggregate Principal Amount by more than 10% of such amount. THE SUCCESSFUL BIDDER MAY NOT WITHDRAW ITS BID OR CHANGE THE INTEREST RATES BID OR THE INITIAL REOFFERING PRICES (AS HEREIN DEFINED) AS A RESULT OF ANY CHANGES MADE TO THE REVISED AMOUNTS WITHIN THESE LIMITS. The dollar amount bid by the successful bidder will be adjusted to reflect any adjustment in the aggregate principal amount of the 2019A Bonds. Such adjusted bid price will reflect changes in the dollar amount of the underwriter’s discount and original issue discount/premium, if any, but will not change the selling compensation per $1,000 of par amount of bonds from the selling compensation that would have been received based on the purchase price in the winning bid and the Initial Reoffering Prices. The interest rate specified by the successful bidder for each maturity and the Initial Reoffering Prices will not change. The Authority anticipates that the Final Amounts and the adjusted bid prices will be communicated to the successful bidder no later than 24 hours after the bids are received.
Electronic Bidding and Bidding Procedures Registration to Bid All prospective bidders must be contracted customers of PARITY®. If you do not have a contract with PARITY®, call (212) 404-8102 to become a customer. By submitting a bid for the 2019A Bonds, a prospective

[__]-5
bidder represents and warrants to the Authority that such bidder’s bid for the purchase of the 2019A Bonds is submitted for and on behalf of such prospective bidder by an officer or agent who is duly authorized to bind the prospective bidder to a legal, valid and enforceable contract for the purchase of the 2019A Bonds. By registering to bid for the 2019A Bonds, a prospective bidder is not obligated to submit a bid in connection with the sale. IF ANY PROVISIONS OF THIS NOTICE OF SALE SHALL CONFLICT WITH INFORMATION PROVIDED BY PARITY® AS APPROVED PROVIDER OF ELECTRONIC BIDDING SERVICES, THIS NOTICE OF SALE (INCLUDING ANY AMENDMENTS OR SUPPLEMENTS) SHALL CONTROL. Further information about PARITY®, including qualification, registration, rules and any fee charged, may be obtained from PARITY®, telephone (212) 404-8102, email at [email protected]. Disclaimer Each prospective bidder shall be solely responsible to register to bid via PARITY®. Each qualified prospective bidder shall be solely responsible to make necessary arrangements to access PARITY® for purposes of submitting its bid in a timely manner and in compliance with the requirements of the Notice of Sale. Neither the Authority nor PARITY® shall have any duty or obligation to undertake such registration to bid for any prospective bidder or to provide or assure such access to any qualified prospective bidder, and neither the Authority nor PARITY® shall be responsible for a bidder’s failure to register to bid or for proper operation of, or have any liability for any delays or interruptions of, or any damages caused by PARITY®. The Authority is using PARITY® as a communication mechanism, and not as the Authority’s agent, to conduct the electronic bidding for the 2019A Bonds. The Authority is not bound by any advice and determination of PARITY® to the effect that any particular bid complies with the terms of this Notice of Sale and in particular the “Bid Specifications” hereinafter set forth. All costs and expenses incurred by prospective bidders in connection with their registration and submission of bids via PARITY® are the sole responsibility of the bidders; and the Authority is not responsible, directly or indirectly, for any of such costs or expenses. If a prospective bidder encounters any difficulty in registering to bid or submitting, modifying or withdrawing a bid for the 2019A Bonds, it should telephone PARITY® at (212) 404-8102 and notify Frasca & Associates, LLC at [(___) ___-____]. After receipt of bids is closed, the Authority, through PARITY® will indicate the apparent successful bidder. Such message is a courtesy only for viewers, and does not constitute the award of the 2019A Bonds. Each bid will remain subject to review by the Authority to determine its true interest cost rate and compliance with the terms of this Notice of Sale and to award the 2019A Bonds. Good Faith Deposit A good faith deposit in the amount of 1% of the Preliminary Aggregate Principal Amount (the “Deposit”) is required in connection with the sale and bid for the 2019A Bonds. The Deposit shall be provided for by a Federal funds wire transfer to be submitted to the Authority by the successful bidder not later than [4:00 P.M.] (Richmond Time) on the date of sale (the “Wire Transfer Deadline”) as set forth below under “Wire Transfers.” The Deposit of the successful bidder will be collected and the proceeds thereof retained by the Authority to be applied in partial payment for the 2019A Bonds and no interest will be allowed or paid upon the amount thereof, but in the event the successful bidder shall fail to comply with the terms of the respective bid, the proceeds thereof will be retained as and for full liquidated damages. Wire Transfers. The Authority will distribute wiring instructions for the Deposit to the successful bidder upon verification of the bids submitted by the bidders and prior to the Wire Transfer Deadline. If the Deposit is not received by the Wire Transfer Deadline, the award of the sale of the 2019A Bonds to the successful bidder may be cancelled by the Authority in its discretion without any financial liability of the Authority to the successful bidder or any limitation whatsoever on the Authority’s right to sell the 2019A Bonds to a different purchaser upon such terms and conditions as the Authority shall deem appropriate. Bidding Procedures Bids must be submitted electronically for the purchase of the 2019A Bonds (all or none) by means of the Virginia Public Building Authority AON Bid Form (the “Bid Form”) via PARITY® by [____] A.M., RICHMOND, VIRGINIA TIME, on _____, __________, 2019 unless postponed as described herein (see “Change of Bid Date and Closing Date”). Prior to that time, a prospective bidder may input and save the proposed terms of its bid in PARITY®. Once the final bid has been saved in PARITY®, the bidder may select the final bid button in PARITY® to submit the bid to PARITY®. Once the bids are communicated electronically via PARITY® to the State Treasurer, each bid will constitute an irrevocable offer to purchase the 2019A Bonds on the terms therein and herein provided. For purposes of the electronic bidding process, the time as maintained on

[__]-6
PARITY® shall constitute the official RICHMOND, VIRGINIA TIME. For information purposes only, bidders are requested to state in their bids the true interest cost to the Authority, as described under “Award of the 2019A Bonds” below, represented by the rate or rates of interest and the bid price specified in their respective bids. No bids will be accepted in written form, by facsimile transmission or in any other medium or on any system other than by means of the Bid Form via PARITY®. No bid will be received after the time for receiving such bids specified above. Award of the 2019A Bonds The Authority will notify the apparent successful bidder electronically (via PARITY®), as soon as possible after the receipt of bids, that such bidder’s bid appears to be the lowest and best bid received that conforms to the requirements of this Notice of Sale, subject to verification. Upon such notice, such successful bidder shall advise the Authority of the initial reoffering prices and yields to the public of the various maturities of the 2019A Bonds as described below. Such reoffering prices and yields, among other things, will be used by the Authority to calculate the Final Annual Principal Amounts and the Final Aggregate Principal Amount of the 2019A Bonds. ALL BIDS SHALL REMAIN FIRM UNTIL [4:00 P.M.], RICHMOND, VIRGINIA TIME, ON THE DATE OF RECEIPT OF BIDS. An award of the 2019A Bonds, if made, will be made by the Authority within such period of time. Unless all bids are rejected, the 2019A Bonds will be awarded to the bidder whose bid results in the lowest true interest cost to the Authority, based on the Revised Amounts described above. The true interest cost (expressed as an annual interest rate) will be determined as being twice that factor or discount rate, compounded semi-annually, that, when applied against each semi-annual debt service payment (interest, or principal and interest, as due, including any mandatory sinking fund payment) will equate the sum of such discounted semi-annual payments to the total purchase price. The true interest cost shall be calculated from the Dated Date. In case of a tie, the Authority, in its sole discretion, may select the successful bidder. THE AUTHORITY RESERVES THE RIGHT TO WAIVE IRREGULARITIES IN ANY BID AND TO REJECT ANY OR ALL BIDS.
Closing; Miscellaneous Undertakings of the Successful Bidder The successful bidder shall make a bona fide public offering of all of the 2019A Bonds to the general public and shall, within 30 minutes after being notified that such bidder’s bid appears to be the apparent winning bid, subject to verification, advise the Authority in writing of the initial public offering prices of the 2019A Bonds (the “Initial Reoffering Prices”). The successful bidder must provide the initial public offering prices, as the Authority will not include in the Official Statement an “NRO” (“not reoffered”) designation to or for any maturity of the 2019A Bonds. The successful bidder will be responsible to the Authority in all respects for the accuracy and completeness of any information it provides with respect to such reoffering. The successful bidder must, within 24 hours after notification of the Final Amounts, furnish the following information to the Authority to complete the Official Statement in final form, as described below:
A. Selling compensation (aggregate total anticipated compensation to the underwriters expressed in dollars, based on the expectation that all 2019A Bonds are sold at the prices or yields at which the successful bidder advised the Authority that the 2019A Bonds were initially offered to the public).
B. The identity of the other underwriters if the successful bidder is part of a group or syndicate. It is the
policy of the Commonwealth of Virginia pursuant to Executive Order 20 (2014) to ensure that small businesses and businesses owned by women and minorities receive every opportunity to compete for the Commonwealth’s business. Accordingly, the winning bidder’s list of syndicate members should note any minority, women or disadvantaged business enterprises participating in the syndicate.
C. Any other material information that the Authority determines is necessary or desirable to complete the
Official Statement in final form. The Authority expects the successful bidder to deliver copies of such Official Statement in final form (the “final Official Statement”) to persons to whom such bidder initially sells the 2019A Bonds, the Municipal Securities Rulemaking Board (“MSRB”) and to the MSRB’s Electronic Municipal Market Access System (“EMMA”). The successful bidder will be required to acknowledge receipt of such final Official Statement, to certify that it has made delivery of the final Official Statement to such repositories, to acknowledge that the Authority expects the successful

[__]-7
bidder to deliver copies of such final Official Statement to persons to whom such bidder initially sells the 2019A Bonds and to certify that the 2019A Bonds will only be offered pursuant to the final Official Statement and only in states where the offer is legal.
Issue Price Certificate
The successful bidder shall assist the Authority in establishing the issue price of the 2019A Bonds and shall execute and deliver to the Authority on or prior to the Closing Date (as defined below) an “issue price” or similar certificate setting forth the reasonably expected initial offering prices to the public or the actual sales price or prices of the 2019A Bonds, together with the supporting pricing wires or equivalent communications, substantially in the applicable form attached hereto as Exhibit 1, with such modifications as may be appropriate or necessary, in the reasonable judgment of the successful bidder, the Authority and Bond Counsel. All actions to be taken by the Authority under this Notice of Sale to establish the issue price of the 2019A Bonds may be taken on behalf of the Authority by Frasca & Associates, LLC (the “Financial Advisor”) and any notice or report to be provided to the Authority may be provided to the Financial Advisor.
The Authority intends that the provisions of Treasury Regulation Section 1.148-1(f)(3)(i) (defining “competitive sale” for purposes of establishing the issue price of the 2019A Bonds) will apply to the initial sale of the 2019A Bonds (“competitive sale requirements”) because:
(1) the Authority has disseminated this Notice of Sale to potential underwriters in a manner that is reasonably designed to reach potential underwriters;
(2) all bidders will have an equal opportunity to bid;
(3) the Authority may receive bids from at least three underwriters of municipal bonds who have established industry reputations for underwriting new issuances of municipal bonds; and
(4) the Authority anticipates awarding the sale of the 2019A Bonds to the bidder who submits a firm offer to purchase the 2019A Bonds at the highest price (or lowest interest cost), as set forth in this Notice of Sale.
Any bid submitted pursuant to this Notice of Sale shall be considered a firm bid for the purchase of the 2019A Bonds, as specified in the bid. By submitting a bid for the 2019A Bonds, a bidder represents and warrants to the Authority that the bidder has an established industry reputation for underwriting new issuances of municipal bonds, that it will be an “underwriter” (as defined below) that intends to reoffer the 2019A Bonds to the public, and that such bidder’s bid is submitted for and on behalf of such bidder by an officer or agent who is duly authorized to bind the bidder to a legal, valid and enforceable contract for the purchase of the 2019A Bonds. Once the bids are communicated electronically via PARITY® to the Authority, each bid will constitute an irrevocable offer to purchase the 2019A Bonds on the terms herein and therein provided.
Bids will not be subject to cancellation in the event that the competitive sale requirements are not
satisfied. In the event that the competitive sale requirements are not satisfied, the Authority shall so advise the successful bidder. In this event, the successful bidder may use either Option A or Option B, set forth below.
Failure to Meet the Competitive Sale Requirements - Option A - The 10% Test to Apply. If the competitive
sale requirements are not satisfied, the successful bidder may, at its option, use the first price at which 10% of a maturity of the 2019A Bonds (the “10% test”) is sold to the public as the issue price of that maturity, applied on a maturity-by-maturity basis, of the 2019A Bonds. The successful bidder shall advise the Financial Advisor if any maturity of the 2019A Bonds satisfies the 10% test as of the date and time of the award of the 2019A Bonds.
If the competitive sale requirements are not satisfied, then until the 10% test has been satisfied as to each
maturity of the 2019A Bonds or all of the 2019A Bonds are sold to the public, the successful bidder agrees to promptly report to the Financial Advisor the prices at which the unsold 2019A Bonds of each maturity have been sold to the public, which reporting obligation shall continue, whether or not the Closing Date has occurred, until the 10% test has been satisfied for each maturity of the 2019A Bonds or until all the 2019A Bonds of a maturity have been sold. The successful bidder shall be obligated to report each sale of 2019A Bonds to the Financial Advisor until notified in writing by the Authority or the Financial Advisor that it no longer needs to do so. If the successful bidder uses Option A, the successful bidder shall provide to the Authority on or before the Closing Date the certificate attached to this Notice of Sale as Exhibit 2 - Option A.

[__]-8
Failure to Meet the Competitive Sale Requirements - Option B - The Successful Bidder Agrees to Hold the Price of Maturities of Bonds for Which the 10% Test in Option A Is Not Met as of the Sale Date. The successful bidder may, at its option, notify the Financial Advisor in writing, which may be by email (the “Hold the Price Notice”), not later than 4:00 p.m. on the Sale Date, that it has not sold 10% of the maturities of the 2019A Bonds listed in the Hold the Price Notice (the “Hold-the-Offering-Price Maturities”) and that the successful bidder will not offer the Hold-the-Offering-Price Maturities to any person at a price that is higher than the initial offering price to the public during the period starting on the Sale Date and ending on the earlier of (i) the close of the fifth business day after the Sale Date, or (ii) the date on which the successful bidder has sold at least 10% of the applicable Hold-the-Offering-Price Maturity to the public at a price that is no higher than the initial offering price to the public. If the successful bidder uses Option B and delivers a Hold the Price Notice to the Financial Advisor, the successful bidder shall provide to the Authority on or before the Closing Date the certificate attached to this Notice of Sale as Exhibit 2 - Option B.
By submitting a bid and if the competitive sale requirements are not met, each bidder confirms that: (i) any
agreement among underwriters, any selling group agreement and each retail distribution agreement (to which the bidder is a party) relating to the initial sale of the 2019A Bonds to the public, together with the related pricing wires, contains or will contain language obligating each underwriter, each dealer who is a member of the selling group, and each broker-dealer that is a party to such retail distribution agreement, as applicable, to report the prices at which it sells to the public the unsold 2019A Bonds of each maturity allotted to it until it is notified by the successful bidder that either the 10% test has been satisfied as to the 2019A Bonds of that maturity or all 2019A Bonds of that maturity have been sold to the public, if and for so long as directed by the successful bidder and as set forth in the related pricing wires, and (ii) any agreement among underwriters relating to the initial sale of the 2019A Bonds to the public, together with the related pricing wires, contains or will contain language obligating each underwriter that is a party to a retail distribution agreement to be employed in connection with the initial sale of the 2019A Bonds to the public to require each broker-dealer that is a party to such retail distribution agreement to report the prices at which it sells to the public the unsold 2019A Bonds of each maturity allotted to it until it is notified by the successful bidder or such underwriter that either the 10% test has been satisfied as to the 2019A Bonds of that maturity or all 2019A Bonds of that maturity have been sold to the public if and for so long as directed by the successful bidder or such underwriter and as set forth in the related pricing wires.
Sales of any 2019A Bonds to any person that is a related party to an underwriter shall not constitute sales to the public for purposes of this Notice of Sale. Further, for purposes of this Notice of Sale:
(1) “public” means any person other than an underwriter or a related party,
(2) “underwriter” means (A) any person that agrees pursuant to a written contract with the Authority (or with the lead underwriter to form an underwriting syndicate) to participate in the initial sale of the 2019A Bonds to the public, and (B) any person that agrees pursuant to a written contract directly or indirectly with a person described in clause (A) to participate in the initial sale of the 2019A Bonds to the public (including a member of a selling group or a party to a retail distribution agreement participating in the initial sale of the 2019A Bonds to the public),
(3) a purchaser of any of the 2019A Bonds is a “related party” to an underwriter if the underwriter and the purchaser are subject, directly or indirectly, to (i) at least 50% common ownership of the voting power or the total value of their stock, if both entities are corporations (including direct ownership by one corporation of another), (ii) more than 50% common ownership of their capital interests or profits interests, if both entities are partnerships (including direct ownership by one partnership of another), or (iii) more than 50% common ownership of the value of the outstanding stock of the corporation or the capital interests or profit interests of the partnership, as applicable, if one entity is a corporation and the other entity is a partnership (including direct ownership of the applicable stock or interests by one entity of the other), and
(4) “sale date” means the date that the 2019A Bonds are awarded by the Authority to the successful bidder.
Delivery of the 2019A Bonds
The 2019A Bonds are expected to be delivered on or about __________, 2019 (UNLESS A NOTICE OF A CHANGE IN THE DELIVERY DATE IS ANNOUNCED IN ACCORDANCE WITH THE TIMING AND

[__]-9
PROCESS DESCRIBED UNDER “AMENDMENTS”) in New York, New York, through the facilities at DTC against payment of the purchase price therefor (less the amount of the Deposit) in Federal Funds. There will also be furnished the usual closing papers, including certificates signed by appropriate Authority officers stating that (i) no litigation of any kind is now pending or, to their information, knowledge or belief, threatened to restrain or enjoin the issuance or delivery of the 2019A Bonds or in any manner questioning the proceedings and authority under which the 2019A Bonds are issued, or affecting the validity of the 2019A Bonds, and (ii) relating to the Official Statement, as described in the Preliminary Official Statement. Legal Opinion
The approving opinion of Kaufman & Canoles, P.C., Richmond, Virginia, Bond Counsel, in substantially the form set forth in the Preliminary Official Statement, will be furnished without cost to the successful bidder. The Preliminary Official Statement contains a discussion of the effect of the Internal Revenue Code of 1986, as amended, on the exclusion from gross income of interest on the 2019A Bonds and a discussion of Bond Counsel’s opinion insofar as it concerns such exclusion. CUSIP Numbers
CUSIP numbers will be applied for by the successful bidder with respect to the 2019A Bonds, but the Authority will assume no obligation for the assignment or printing of such numbers on the 2019A Bonds or for the correctness of such numbers, and neither the failure to print such numbers on any of the 2019A Bonds nor any error with respect thereto shall constitute cause for a failure or refusal by the successful bidder to accept delivery of and make payment for the 2019A Bonds. Amendments
In addition to any changes in the bid date, time or amounts of the 2019A Bonds provided for herein, the Authority otherwise reserves the right to amend this Notice of Sale. The Authority expects it would publish notification of such amendment via TM3 NOT LATER THAN 4:00 P.M. RICHMOND, VIRGINIA TIME ON THE DAY PRIOR TO THE ANNOUNCED DATE FOR RECEIPT OF BIDS; however, any notice may be provided as late as one hour prior to any announced time for receipt of bids, and would provide notification to prospective bidders who have so requested such notification to Frasca & Associates, LLC. Official Statement
The Preliminary Official Statement and the information contained therein have been deemed final by the Authority as of its date within the meaning of Rule 15c2-12 of the Securities and Exchange Commission (“Rule 15c2-12”) with permitted omissions, but is subject to change without notice and to completion or amendment in the final Official Statement. The Authority, at its expense, will make available to the successful bidder a reasonable number of final Official Statements, for delivery to each potential investor requesting a copy of the final Official Statement and to each person to whom such bidder and members of its bidding group initially sell the 2019A Bonds, within seven (7) business days of the award of the 2019A Bonds, provided that the successful bidder cooperates in a timely manner providing the information required to complete the final Official Statement. The successful bidder shall comply with the requirements of Rule 15c2-12 and the rules of the MSRB, including an obligation to provide information to the Authority on a timely basis for the final Official Statement. Continuing Disclosure In order to assist bidders in complying with Rule 15c2-12, the Authority and the Commonwealth will undertake to provide certain annual financial information and operating data and notices of the occurrence of certain events, if material. A description of such undertakings is set forth in the Preliminary Official Statement and will also be set forth in the final Official Statement. As of the date hereof and except as otherwise may be described in the Preliminary Official Statement (to the extent that any described instance constitutes a material failure), neither the Authority nor the Commonwealth is aware of any failure in the previous five years to comply in any material respect with its respective undertakings regarding Rule 15c2-12.

[__]-10
Additional Information
For further information relating to the 2019A Bonds, reference is made to the Preliminary Official Statement, dated __________, 2019 prepared for and authorized by the Authority. The Preliminary Official Statement may be obtained via the Internet at finpressllc.com. Physical copies are available upon request by calling Financial Press, LLC at (804) 928-6366 or from the Authority through the Office of the State Treasurer, Third Floor, James Monroe Building, 101 North 14th Street, Richmond, VA 23219 (telephone [(804) 225-____]), or from the financial advisor, Frasca & Associates, LLC (telephone [(___) ___-____]. This Preliminary Official Statement is also available as public information on the Authority’s investor relations website at http://www.VPBABonds.com. Dated: __________, 2019 Virginia Public Building Authority By: Suzanne S. Long, Chairman

[__]-11
Form of Issue Price Certificates
EXHIBIT 1
Issue Price Certificate for Use if the Competitive Sale Requirements are Met
$
VIRGINIA PUBLIC BUILDING AUTHORITY Public Facilities Revenue Bonds, Series 2019A
ISSUE PRICE CERTIFICATE
The undersigned, on behalf of ____________________ (the “Initial Purchaser”) [and other Underwriters, as defined below], hereby certifies as set forth below with respect to the sale and issuance of the above-captioned obligations (the “2019A Bonds”).
1. Reasonably Expected Initial Offering Price.
(a) As of the Sale Date, the reasonably expected initial offering prices of the 2019A Bonds to the Public by the Initial Purchaser are the prices listed in Schedule A (the “Expected Offering Prices”). The Expected Offering Prices are the prices for the Maturities of the 2019A Bonds used by the Initial Purchaser in formulating its bid to purchase the 2019A Bonds. Attached as Schedule B is a true and correct copy of the bid provided by the Initial Purchaser to purchase the 2019A Bonds.
(b) The Initial Purchaser was not given the opportunity to review other bids prior to submitting its bid.
(c) The bid submitted by the Initial Purchaser constituted a firm offer to purchase the 2019A Bonds.
2. Defined Terms. (a) “Authority” means the Virginia Public Building Authority. (b) “Maturity” means 2019A Bonds with the same credit and payment terms. 2019A
Bonds with different maturity dates, or 2019A Bonds with the same maturity date but different stated interest rates, are treated as separate Maturities.
(c) “Public” means any person (including an individual, trust, estate, partnership,
association, company, or corporation) other than an Underwriter or a related party to an Underwriter. The term “related party” for purposes of this certificate generally means any two or more persons who have (i) at least 50% common ownership of the voting power or the total value of their stock, if both entities are corporations (including direct ownership by one corporation of another), (ii) more than 50% common ownership of their capital interests or profits interests, if both entities are partnerships (including direct ownership by one partnership of another), or (iii) more than 50% common ownership of the value of the outstanding stock of the corporation or the capital interests or profit interests of the partnership, as applicable, if one entity is a corporation and the other entity is a partnership (including direct ownership of the applicable stock or interests by one entity of the other).
(d) “Sale Date” means the date that the 2019A Bonds are awarded by the Authority to
the successful bidder. The Sale Date of the 2019A Bonds is [DATE].
(e) “Underwriter” means (i) any person that agrees pursuant to a written contract with the Authority (or with the lead underwriter to form an underwriting syndicate) to participate in the initial sale of the 2019A Bonds to the Public, and (ii) any person that agrees pursuant to a written contract directly or indirectly with a person described in clause (i) of this paragraph to participate in the initial sale of the 2019A Bonds to the Public (including a member of a selling group or a party to a retail distribution agreement participating in the initial sale of the 2019A Bonds to the Public).

[__]-12
The representations set forth in this certificate are limited to factual matters only. Nothing in this
certificate represents the Initial Purchaser’s interpretation of any laws, including specifically Sections 103 and 148 of the Internal Revenue Code of 1986, as amended, and the Treasury Regulations thereunder. The undersigned understands that the foregoing information will be relied upon by the Authority with respect to certain of the representations set forth in the Non-Arbitrage Certificate and Tax Compliance Agreement and with respect to compliance with the federal income tax rules affecting the 2019A Bonds, and by Kaufman & Canoles, P.C. in connection with rendering its opinion that the interest on the 2019A Bonds is excluded from gross income for federal income tax purposes, the preparation of Internal Revenue Service Form 8038-G, and other federal income tax advice that it may give to the Authority from time to time relating to the 2019A Bonds.
[INITIAL PURCHASER]
By:
Name:
Dated: [ISSUE DATE]
[SCHEDULE A]
REASONABLY EXPECTED INITIAL OFFERING PRICES
(To Be Attached)
[SCHEDULE B]
PRICING WIRE OR EQUIVALENT COMMUNICATION
(To Be Attached)

[__]-13
EXHIBIT 2 - OPTION A
Issue Price Certificate for Use if the Competitive Sale Requirements are Not
Met and the Hold the Price Rule Is Not Used
$ VIRGINIA PUBLIC BUILDING AUTHORITY Public Facilities Revenue Bonds, Series 2019A
ISSUE PRICE CERTIFICATE
The undersigned, on behalf of ____________________ (the “Initial Purchaser”) [and other Underwriters, as defined below], hereby certifies as set forth below with respect to the sale and issuance of the above-captioned obligations (the “2019A Bonds”).
1. Sale of the 2019A Bonds. As of the date of this certificate, [except as set forth in paragraph 2 below,] for each Maturity of the 2019A Bonds, the first price at which at least 10% of such Maturity of the 2019A Bonds was sold to the Public on the Sale Date is the respective price listed in Schedule A.
[Only use the next paragraph if the 10% test has not been met or all of the 2019A Bonds have not been sold for one or more Maturities as of the Closing Date.]
[2. For each Maturity of the 2019A Bonds as to which no price is listed in Schedule A, as set forth in the Notice of Sale for the 2019A Bonds, until the 10% test has been satisfied as to each Maturity of the 2019A Bonds or all of the 2019A Bonds are sold to the Public, the Successful Bidder agrees to promptly report to the Issuer’s financial advisor, Frasca & Associates, LLC (the “Financial Advisor”), the prices at which the unsold 2019A Bonds of each Maturity have been sold to the Public, which reporting obligation shall continue after the date hereof until the 10% test has been satisfied for each Maturity of the 2019A Bonds or until all the 2019A Bonds of a Maturity have been sold. The Initial Purchaser shall continue to report each sale of 2019A Bonds to the Financial Advisor until notified by email or in writing by the Issuer or the Financial Advisor that it no longer needs to do so.]
[2.][3.] Defined Terms.
(a) “Authority” means the Virginia Public Building Authority.
(b) “Maturity” means 2019A Bonds with the same credit and payment terms. 2019A Bonds with different maturity dates, or 2019A Bonds with the same maturity date but different stated interest rates, are treated as separate Maturities.
(c) “Public” means any person (including an individual, trust, estate, partnership, association, company, or corporation) other than an Underwriter or a related party to an Underwriter. The term “related party” for purposes of this certificate generally means any two or more persons who have (i) at least 50% common ownership of the voting power or the total value of their stock, if both entities are corporations (including direct ownership by one corporation of another), (ii) more than 50% common ownership of their capital interests or profits interests, if both entities are partnerships (including direct ownership by one partnership of another), or (iii) more than 50% common ownership of the value of the outstanding stock of the corporation or the capital interests or profit interests of the partnership, as applicable, if one entity is a corporation and the other entity is a partnership (including direct ownership of the applicable stock or interests by one entity of the other).
(d) “Underwriter” means (i) any person that agrees pursuant to a written contract with the Authority (or with the lead underwriter to form an underwriting syndicate) to participate in the initial sale of the 2019A Bonds to the Public, and (ii) any person that agrees pursuant to a written contract directly or indirectly with a person described in clause (i) of this paragraph to participate in the initial sale of the 2019A Bonds to the Public (including a member of a selling group or a party to a retail distribution agreement participating in the initial sale of the 2019A Bonds to the Public).

[__]-14
The representations set forth in this certificate are limited to factual matters only. Nothing in this certificate represents the Initial Purchaser’s interpretation of any laws, including specifically Sections 103 and 148 of the Internal Revenue Code of 1986, as amended, and the Treasury Regulations thereunder. The undersigned understands that the foregoing information will be relied upon by the Authority with respect to certain of the representations set forth in the Non-Arbitrage Certificate and Tax Compliance Agreement and with respect to compliance with the federal income tax rules affecting the 2019A Bonds, and by Kaufman & Canoles, P.C. in connection with rendering its opinion that the interest on the 2019A Bonds is excluded from gross income for federal income tax purposes, the preparation of Internal Revenue Service Form 8038-G, and other federal income tax advice that it may give to the Authority from time to time relating to the 2019A Bonds.
[INITIAL PURCHASER]
By:
Name: Dated: [ISSUE DATE]
SCHEDULE A
SALE PRICES OF THE GENERAL RULE MATURITIES
(To Be Attached)

[__]-15
EXHIBIT 2 - OPTION B
Issue Price Certificate for Use if the Competitive Sale Requirements are Not Met and the Hold the Price Rule Is Used
$
VIRGINIA PUBLIC BUILDING AUTHORITY Public Facilities Revenue Bonds, Series 2019A
ISSUE PRICE CERTIFICATE
The undersigned, on behalf of ____________________ (the “Initial Purchaser”) [and other Underwriters, as defined below], hereby certifies as set forth below with respect to the sale and issuance of the above-captioned obligations (the “2019A Bonds”).
A. Issue Price. 1. Sale of the General Rule Maturities. As of the date of this certificate, for each Maturity of the
General Rule Maturities, the first price at which at least 10% of such Maturity of the 2019A Bonds was sold to the Public is the respective price listed in Schedule A.
[2. Initial Offering Price of the Hold-the Offering-Price Maturities.
(a) The Initial Purchaser offered the Hold-the-Offering-Price Maturities to the Public for purchase at the respective initial offering prices listed in Schedule A (the “Initial Offering Prices”) on or before the Sale Date, which correspond to the yields shown on Schedule A and on the inside cover of the Official Statement relating to the 2019A Bonds dated the Sale Date. A copy of the pricing wire or equivalent communication for the 2019A Bonds is attached to this certificate as Schedule B.
(b) The Initial Purchaser agrees that (i) for each Maturity of the Hold-the-Offering-Price
Maturities it will neither offer nor sell any of the unsold 2019A Bonds of such Maturity to any person at a price that is higher than the Initial Offering Price for such Maturity during the Holding Period for such Maturity (the “hold-the-offering-price rule”), and (ii) any selling group agreement shall contain the agreement of each dealer who is a member of the selling group, and any retail distribution agreement shall contain the agreement of each broker-dealer who is a party to the retail distribution agreement, to comply with the hold-the-offering-price rule. Pursuant to such agreement, no Underwriter (as defined below) has offered or sold any unsold 2019A Bonds of a Maturity of the Hold-the-Offering-Price Maturities at a price that is higher than the respective Initial Offering Price for that Maturity of the 2019A Bonds during the Holding Period.]
[2.][3.] Defined Terms, [keep applicable definitions, depending on sale outcome]
(a) “General Rule Maturities” means those Maturities of the 2019A Bonds listed in Schedule
A hereto as the “General Rule Maturities.” (b) “Hold-the-Offering-Price Maturities” means those Maturities of the 2019A Bonds listed
in Schedule A hereto as the “Hold-the-Offering-Price Maturities.” (c) “Holding Period” means, with respect to a Hold-the-Offering-Price Maturity, the period
starting on the Sale Date and ending on the earlier of (a) the close of the fifth business day after the Sale Date, or (ii) the date on which the Underwriters have sold at least 10% of such Hold-the-Offering-Price Maturity to the Public at prices that are no higher than the Initial Offering Price for such Hold-the-Offering- Price Maturity.
(d) “Authority” means the Virginia Public Building Authority.

[__]-16
(e) “Maturity” means 2019A Bonds with the same credit and payment terms. 2019A Bonds
with different maturity dates, or 2019A Bonds with the same maturity date but different stated interest rates, are treated as separate Maturities.
(f) “Public” means any person (including an individual, trust, estate, partnership, association,
company, or corporation) other than an Underwriter or a related party to an Underwriter. The term “related party” for purposes of this certificate generally means any two or more persons who have (i) at least 50% common ownership of the voting power or the total value of their stock, if both entities are corporations (including direct ownership by one corporation of another), (ii) more than 50% common ownership of their capital interests or profits interests, if both entities are partnerships (including direct ownership by one partnership of another), or (iii) more than 50% common ownership of the value of the outstanding stock of the corporation or the capital interests or profit interests of the partnership, as applicable, if one entity is a corporation and the other entity is a partnership (including direct ownership of the applicable stock or interests by one entity of the other).
(g) “Sale Date” means the first day on which there is a binding contract in writing for the sale
of a Maturity of the 2019A Bonds. The Sale Date of the 2019A Bonds is [DATE]. (h) “Underwriter” means (i) any person that agrees pursuant to a written contract with the
Authority (or with the lead underwriter to form an underwriting syndicate) to participate in the initial sale of the 2019A Bonds to the Public, and (ii) any person that agrees pursuant to a written contract directly or indirectly with a person described in clause (i) of this paragraph to participate in the initial sale of the 2019A Bonds to the Public (including a member of a selling group or a party to a retail distribution agreement participating in the initial sale of the 2019A Bonds to the Public).
B. Reliance.
The representations set forth in this certificate are limited to factual matters only. Nothing in this certificate represents the Initial Purchaser’s interpretation of any laws, including specifically Sections 103 and 148 of the Internal Revenue Code of 1986, as amended, and the Treasury Regulations thereunder. The undersigned understands that the foregoing information will be relied upon by the Authority with respect to certain of the representations set forth in the Non-Arbitrage Certificate and Tax Compliance Agreement and with respect to compliance with the federal income tax rules affecting the 2019A Bonds, and by Kaufman & Canoles, P.C. in connection with rendering its opinion that the interest on the 2019A Bonds is excluded from gross income for federal income tax purposes, the preparation of Internal Revenue Service Form 8038-G, and other federal income tax advice that it may give to the Authority from time to time relating to the 2019A Bonds.
[INITIAL PURCHASER]
By:
Name: Dated: [ISSUE DATE]
SCHEDULE A
SALE PRICES OF THE GENERAL RULE MATURITIES AND INITIAL OFFERING PRICES OF THE HOLD-THE-OFFERING-PRICE MATURITIES
(To Be Attached)

[__]-17
17132951v2
SCHEDULE B
PRICING WIRE OR EQUIVALENT COMMUNICATION
(To Be Attached)

KC Draft: 02/07/19
[__]-1
NOTICE OF SALE
VIRGINIA PUBLIC BUILDING AUTHORITY $_____*
Public Facilities Revenue Bonds, Series 2019B (AMT)
Electronic Bids, via the PARITY® Competitive Bidding System (“PARITY®”) only, for the purchase of all, and not less than all, of the $_____* Virginia Public Building Authority Public Facilities Revenue Bonds, Series 2019B (AMT) (the “2019B Bonds”) will be received until [_____] A.M., RICHMOND, VIRGINIA TIME, on _____, __________, 2019 (unless postponed or changed as described herein), by the Virginia Public Building Authority (the “Authority”).
Preliminary Official Statement
The Authority has authorized the preparation and distribution of a Preliminary Official Statement dated __________, 2019 (the “Preliminary Official Statement”) containing information relating to the 2019B Bonds, the Authority’s Public Facilities Revenue Bonds, Series 2019A Bonds and the Authority’s Public Facilities Revenue Bonds, Series 2019C Bonds (Taxable), which are not described in or covered by this Notice of Sale. This Notice of Sale and the Preliminary Official Statement referred to above are available on the Internet at finpressllc.com. The Preliminary Official Statement in its entirety is available in physical form and may be obtained as provided under the caption “Additional Information” herein.
The 2019B Bonds
Authorization and Security The 2019B Bonds will be issued pursuant to a Master Indenture of Trust (as previously supplemented and amended, the “Master Indenture”), dated as of April 15, 1997, as supplemented by the Thirty-Seventh Supplemental Indenture of Trust (the “Supplemental Indenture”), dated as of _____ 1, 2019, between the Authority and The Bank of New York Mellon Trust Company, N.A., as successor trustee (the “Trustee”). Together, the Master Indenture, the Thirty-Seventh Supplemental Indenture and any further supplements are referred to collectively as the “Indenture.” All Bonds currently outstanding under the Indenture are collectively referred to as the “Prior Bonds.” The 2019B Bonds, the Prior Bonds, and all other parity or additional bonds hereafter issued from time to time under and secured equally and ratably by the Indenture (the “Additional Bonds”) are collectively called the “Bonds.” THE 2019B BONDS WILL BE LIMITED OBLIGATIONS OF THE AUTHORITY PAYABLE SOLELY FROM THE REVENUES, RECEIPTS AND FUNDS PLEDGED OR AVAILABLE FOR THE PAYMENT THEREOF AND ARE NOT A DEBT OR A PLEDGE OF THE FULL FAITH AND CREDIT OF THE COMMONWEALTH OR OF ANY POLITICAL SUBDIVISION THEREOF, OTHER THAN THE AUTHORITY. THE GENERAL ASSEMBLY IS NOT REQUIRED, AND IS UNDER NO LEGAL OBLIGATION, TO MAKE AN APPROPRIATION FOR ANY AMOUNTS DUE UNDER THE PAYMENT AGREEMENT.
* Preliminary, subject to change.

[__]-2
Bid Parameters for the 2019B Bonds
INTEREST PROCEDURAL
Dated Date: Date of Delivery Sale Date and Time: Bids due _____, 2019 at [____] A.M., Richmond, VA Time
Anticipated Delivery Date:
_____, 2019 Bid Submission: Electronic bids through PARITY Only
Interest Payment Dates: February 1 and August 1 All or None? Yes
First Interest Payment Date:
August 1, 20__ Bid Award Method: Lowest TIC
Coupon Multiples: [1/8 or 1/20 of 1%] Good Faith Deposit: 1% of the Preliminary Aggregate Principal Amount
Zero Coupons: Not Permitted
Optional Redemption:
Due on and after August 1, 20__, callable on August 1, 20__ and thereafter at par
Split Coupons: Not Permitted
PRINCIPAL PRICING
Post-bid Principal Increases in Aggregate:
[10%] Max. Aggregate Bid Price: [No Limit]
Post-bid Principal Reductions in Aggregate:
[10%] Min. Aggregate Bid Price: [100%]
Term Bonds: Any two or more consecutive maturities may be designated as term bonds
Max. Price per Maturity: [No Limit]
Min. Price per Maturity: [No Limit]
High Coupon per Maturity: [5.0%]
Low Coupon per Maturity: [No Limit]
Details of 2019B Bonds; Book Entry Only The 2019B Bonds will be dated the date of their original issuance and delivery (the “Dated Date”). Interest on the 2019B Bonds from the Dated Date will be calculated on a 30/360 day basis and will be payable semiannually on February 1 and August 1, commencing _____ 1, 2019. The 2019B Bonds will be issued as fully registered bonds in book entry form, payable to the nominee of The Depository Trust Company, New York, New York, (“DTC”), as securities depository for the 2019B Bonds. Reference is made to the Preliminary Official Statement relating to the 2019B Bonds for the applicable provisions relating to the transfer of beneficial ownership, manner of redemption, the responsibilities of DTC participants and the right of the Authority to discontinue the book entry only system.

[__]-3
Maturity Schedule Principal on the 2019B Bonds will be due (subject to the right of prior redemption, if any, as hereafter set forth) through serial maturities or term maturities as provided below on the following dates and in the following amounts:
August 1 2019B Bonds*
————— * Preliminary, subject to adjustment both before and after award of the 2019B Bonds as described herein under “Changes to Preliminary Principal Amount.”
Serial and/or Term Bonds; Mandatory Sinking Fund Redemption The successful bidder may provide in the bid form for all of the 2019B Bonds to be issued as serial bonds or may designate consecutive annual principal amounts of the 2019B Bonds to be combined into term bonds. Each such term bond shall be subject to mandatory sinking fund redemption commencing on August 1 of the first year which has been combined to form such term bond and continuing on August 1 in each year thereafter until the stated maturity date of that term bond. The amount redeemed in any year shall be equal to the principal amount for such year set forth in the appropriate amortization schedule, as adjusted in accordance with the provisions described above under the caption “Changes to Preliminary Principal Amount.” The 2019B Bonds to be redeemed in any year by mandatory sinking fund redemption shall be redeemed at par and shall be selected by lot or otherwise according to DTC procedures from among the 2019B Bonds of the same maturity. Optional Redemption Provisions The 2019B Bonds maturing on or before August 1, 20__* are not subject to redemption prior to maturity. The 2019B Bonds maturing on or after August 1, 20__* may be redeemed prior to their respective maturities at the sole option of the Authority on or after August 1, 20__*, in whole or in part at any time, at a redemption price equal to 100% of the principal amount of the 2019B Bonds to be redeemed, plus accrued interest to the redemption date, as described in the Preliminary Official Statement.
Preliminary, subject to change.

[__]-4
Changes to Bid Date, Closing Date, and Principal Amounts Change of Bid Date and Closing Date
The Authority reserves the right to change, from time to time, the date and/or time established for the receipt of bids and will undertake to notify registered prospective bidders via notification published on www.tm3.com (“TM3”). Prospective bidders may request notification of any such changes in the date or time for the receipt of bids by so advising Frasca & Associates, LLC at [(___) ___-____] by no later than [_____], RICHMOND, VIRGINIA TIME, on the day prior to the announced date for receipt of bids.
A change of the bid date and/or time will be announced in accordance with the timing and process described under “Amendments.” An alternative sale date and time will be announced via TM3 at least 18 hours prior to such alternative date and/or time for receipt of bids. On any such alternative date and/or time for receipt of bids, the Authority will accept electronic bids for the purchase of the 2019B Bonds, such bids to conform in all respects to the provisions of this Notice of Sale, except for the changes in the date and/or time for receipt of bids and any other changes announced via TM3 at the time the date and time for receipt of bids are announced. The Authority may change the scheduled delivery date for the 2019B Bonds by notice given in the same manner as that set forth for a change in the date for the receipt of bids. See “Delivery of the 2019B Bonds” below. Changes to Preliminary Principal Amounts The preliminary aggregate principal amount of the 2019B Bonds and the preliminary annual principal amounts as set forth in this Notice of Sale (the “Preliminary Aggregate Principal Amount” and the “Preliminary Annual Principal Amounts,” respectively; collectively, the “Preliminary Amounts”) may be revised before the viewing of electronic bids for the purchase of the 2019B Bonds. Any such revisions (the “Revised Aggregate Principal Amount” and the “Revised Annual Principal Amounts,” respectively; collectively, the “Revised Amounts”) WILL BE ANNOUNCED IN ACCORDANCE WITH THE TIMING AND PROCESS DESCRIBED UNDER “AMENDMENTS.” In the event that no such revisions are made, the Preliminary Amounts will constitute the Revised Amounts. BIDDERS SHALL SUBMIT BIDS BASED ON THE REVISED AMOUNTS. Prospective bidders may request notification of any revisions in Preliminary Amounts by so advising Frasca & Associates, LLC at [(___) ___-____] by [_____], RICHMOND, VIRGINIA TIME, at least one day prior to the receipt of bids. Changes to Revised Principal Amounts After selecting the winning bid, the Authority reserves the right to change the final aggregate principal amount of the 2019B Bonds and each final annual principal amount (the “Final Aggregate Principal Amounts” and the “Final Annual Principal Amounts,” respectively; collectively, the “Final Amounts”). In determining the Final Amounts, the Authority will not reduce or increase the Revised Aggregate Principal Amount by more than 10% of such amount. THE SUCCESSFUL BIDDER MAY NOT WITHDRAW ITS BID OR CHANGE THE INTEREST RATES BID OR THE INITIAL REOFFERING PRICES (AS HEREIN DEFINED) AS A RESULT OF ANY CHANGES MADE TO THE REVISED AMOUNTS WITHIN THESE LIMITS. The dollar amount bid by the successful bidder will be adjusted to reflect any adjustment in the aggregate principal amount of the 2019B Bonds. Such adjusted bid price will reflect changes in the dollar amount of the underwriter’s discount and original issue discount/premium, if any, but will not change the selling compensation per $1,000 of par amount of bonds from the selling compensation that would have been received based on the purchase price in the winning bid and the Initial Reoffering Prices. The interest rate specified by the successful bidder for each maturity and the Initial Reoffering Prices will not change. The Authority anticipates that the Final Amounts and the adjusted bid prices will be communicated to the successful bidder no later than 24 hours after the bids are received.
Electronic Bidding and Bidding Procedures Registration to Bid All prospective bidders must be contracted customers of PARITY®. If you do not have a contract with PARITY®, call (212) 404-8102 to become a customer. By submitting a bid for the 2019B Bonds, a prospective
[__]-5
bidder represents and warrants to the Authority that such bidder’s bid for the purchase of the 2019B Bonds is submitted for and on behalf of such prospective bidder by an officer or agent who is duly authorized to bind the prospective bidder to a legal, valid and enforceable contract for the purchase of the 2019B Bonds. By registering to bid for the 2019B Bonds, a prospective bidder is not obligated to submit a bid in connection with the sale. IF ANY PROVISIONS OF THIS NOTICE OF SALE SHALL CONFLICT WITH INFORMATION PROVIDED BY PARITY® AS APPROVED PROVIDER OF ELECTRONIC BIDDING SERVICES, THIS NOTICE OF SALE (INCLUDING ANY AMENDMENTS OR SUPPLEMENTS) SHALL CONTROL. Further information about PARITY®, including qualification, registration, rules and any fee charged, may be obtained from PARITY®, telephone (212) 404-8102, email at [email protected]. Disclaimer Each prospective bidder shall be solely responsible to register to bid via PARITY®. Each qualified prospective bidder shall be solely responsible to make necessary arrangements to access PARITY® for purposes of submitting its bid in a timely manner and in compliance with the requirements of the Notice of Sale. Neither the Authority nor PARITY® shall have any duty or obligation to undertake such registration to bid for any prospective bidder or to provide or assure such access to any qualified prospective bidder, and neither the Authority nor PARITY® shall be responsible for a bidder’s failure to register to bid or for proper operation of, or have any liability for any delays or interruptions of, or any damages caused by PARITY®. The Authority is using PARITY® as a communication mechanism, and not as the Authority’s agent, to conduct the electronic bidding for the 2019B Bonds. The Authority is not bound by any advice and determination of PARITY® to the effect that any particular bid complies with the terms of this Notice of Sale and in particular the “Bid Specifications” hereinafter set forth. All costs and expenses incurred by prospective bidders in connection with their registration and submission of bids via PARITY® are the sole responsibility of the bidders; and the Authority is not responsible, directly or indirectly, for any of such costs or expenses. If a prospective bidder encounters any difficulty in registering to bid or submitting, modifying or withdrawing a bid for the 2019B Bonds, it should telephone PARITY® at (212) 404-8102 and notify Frasca & Associates, LLC at [(___) ___-____]. After receipt of bids is closed, the Authority, through PARITY® will indicate the apparent successful bidder. Such message is a courtesy only for viewers, and does not constitute the award of the 2019B Bonds. Each bid will remain subject to review by the Authority to determine its true interest cost rate and compliance with the terms of this Notice of Sale and to award the 2019B Bonds. Good Faith Deposit A good faith deposit in the amount of 1% of the Preliminary Aggregate Principal Amount (the “Deposit”) is required in connection with the sale and bid for the 2019B Bonds. The Deposit shall be provided for by a Federal funds wire transfer to be submitted to the Authority by the successful bidder not later than [4:00 P.M.] (Richmond Time) on the date of sale (the “Wire Transfer Deadline”) as set forth below under “Wire Transfers.” The Deposit of the successful bidder will be collected and the proceeds thereof retained by the Authority to be applied in partial payment for the 2019B Bonds and no interest will be allowed or paid upon the amount thereof, but in the event the successful bidder shall fail to comply with the terms of the respective bid, the proceeds thereof will be retained as and for full liquidated damages. Wire Transfers. The Authority will distribute wiring instructions for the Deposit to the successful bidder upon verification of the bids submitted by the bidders and prior to the Wire Transfer Deadline. If the Deposit is not received by the Wire Transfer Deadline, the award of the sale of the 2019B Bonds to the successful bidder may be cancelled by the Authority in its discretion without any financial liability of the Authority to the successful bidder or any limitation whatsoever on the Authority’s right to sell the 2019B Bonds to a different purchaser upon such terms and conditions as the Authority shall deem appropriate. Bidding Procedures Bids must be submitted electronically for the purchase of the 2019B Bonds (all or none) by means of the Virginia Public Building Authority AON Bid Form (the “Bid Form”) via PARITY® by [____] A.M., RICHMOND, VIRGINIA TIME, on _____, __________, 2019 unless postponed as described herein (see “Change of Bid Date and Closing Date”). Prior to that time, a prospective bidder may input and save the proposed terms of its bid in PARITY®. Once the final bid has been saved in PARITY®, the bidder may select the final bid button in PARITY® to submit the bid to PARITY®. Once the bids are communicated electronically via PARITY® to the State Treasurer, each bid will constitute an irrevocable offer to purchase the 2019B Bonds on the terms therein and herein provided. For purposes of the electronic bidding process, the time as maintained on

[__]-6
PARITY® shall constitute the official RICHMOND, VIRGINIA TIME. For information purposes only, bidders are requested to state in their bids the true interest cost to the Authority, as described under “Award of the 2019B Bonds” below, represented by the rate or rates of interest and the bid price specified in their respective bids. No bids will be accepted in written form, by facsimile transmission or in any other medium or on any system other than by means of the Bid Form via PARITY®. No bid will be received after the time for receiving such bids specified above. Award of the 2019B Bonds The Authority will notify the apparent successful bidder electronically (via PARITY®), as soon as possible after the receipt of bids, that such bidder’s bid appears to be the lowest and best bid received that conforms to the requirements of this Notice of Sale, subject to verification. Upon such notice, such successful bidder shall advise the Authority of the initial reoffering prices and yields to the public of the various maturities of the 2019B Bonds as described below. Such reoffering prices and yields, among other things, will be used by the Authority to calculate the Final Annual Principal Amounts and the Final Aggregate Principal Amount of the 2019B Bonds. ALL BIDS SHALL REMAIN FIRM UNTIL [4:00 P.M.], RICHMOND, VIRGINIA TIME, ON THE DATE OF RECEIPT OF BIDS. An award of the 2019B Bonds, if made, will be made by the Authority within such period of time. Unless all bids are rejected, the 2019B Bonds will be awarded to the bidder whose bid results in the lowest true interest cost to the Authority, based on the Revised Amounts described above. The true interest cost (expressed as an annual interest rate) will be determined as being twice that factor or discount rate, compounded semi-annually, that, when applied against each semi-annual debt service payment (interest, or principal and interest, as due, including any mandatory sinking fund payment) will equate the sum of such discounted semi-annual payments to the total purchase price. The true interest cost shall be calculated from the Dated Date. In case of a tie, the Authority, in its sole discretion, may select the successful bidder. THE AUTHORITY RESERVES THE RIGHT TO WAIVE IRREGULARITIES IN ANY BID AND TO REJECT ANY OR ALL BIDS.
Closing; Miscellaneous Undertakings of the Successful Bidder The successful bidder shall make a bona fide public offering of all of the 2019B Bonds to the general public and shall, within 30 minutes after being notified that such bidder’s bid appears to be the apparent winning bid, subject to verification, advise the Authority in writing of the initial public offering prices of the 2019B Bonds (the “Initial Reoffering Prices”). The successful bidder must provide the initial public offering prices, as the Authority will not include in the Official Statement an “NRO” (“not reoffered”) designation to or for any maturity of the 2019B Bonds. The successful bidder will be responsible to the Authority in all respects for the accuracy and completeness of any information it provides with respect to such reoffering. The successful bidder must, within 24 hours after notification of the Final Amounts, furnish the following information to the Authority to complete the Official Statement in final form, as described below:
A. Selling compensation (aggregate total anticipated compensation to the underwriters expressed in dollars, based on the expectation that all 2019B Bonds are sold at the prices or yields at which the successful bidder advised the Authority that the 2019B Bonds were initially offered to the public).
B. The identity of the other underwriters if the successful bidder is part of a group or syndicate. It is the
policy of the Commonwealth of Virginia pursuant to Executive Order 20 (2014) to ensure that small businesses and businesses owned by women and minorities receive every opportunity to compete for the Commonwealth’s business. Accordingly, the winning bidder’s list of syndicate members should note any minority, women or disadvantaged business enterprises participating in the syndicate.
C. Any other material information that the Authority determines is necessary or desirable to complete the
Official Statement in final form. The Authority expects the successful bidder to deliver copies of such Official Statement in final form (the “final Official Statement”) to persons to whom such bidder initially sells the 2019B Bonds, the Municipal Securities Rulemaking Board (“MSRB”) and to the MSRB’s Electronic Municipal Market Access System (“EMMA”). The successful bidder will be required to acknowledge receipt of such final Official Statement, to certify that it has made delivery of the final Official Statement to such repositories, to acknowledge that the Authority expects the successful
[__]-7
bidder to deliver copies of such final Official Statement to persons to whom such bidder initially sells the 2019B Bonds and to certify that the 2019B Bonds will only be offered pursuant to the final Official Statement and only in states where the offer is legal.
Issue Price Certificate
The successful bidder shall assist the Authority in establishing the issue price of the 2019B Bonds and shall execute and deliver to the Authority on or prior to the Closing Date (as defined below) an “issue price” or similar certificate setting forth the reasonably expected initial offering prices to the public or the actual sales price or prices of the 2019B Bonds, together with the supporting pricing wires or equivalent communications, substantially in the applicable form attached hereto as Exhibit 1, with such modifications as may be appropriate or necessary, in the reasonable judgment of the successful bidder, the Authority and Bond Counsel. All actions to be taken by the Authority under this Notice of Sale to establish the issue price of the 2019B Bonds may be taken on behalf of the Authority by Frasca & Associates, LLC (the “Financial Advisor”) and any notice or report to be provided to the Authority may be provided to the Financial Advisor.
The Authority intends that the provisions of Treasury Regulation Section 1.148-1(f)(3)(i) (defining “competitive sale” for purposes of establishing the issue price of the 2019B Bonds) will apply to the initial sale of the 2019B Bonds (“competitive sale requirements”) because:
(1) the Authority has disseminated this Notice of Sale to potential underwriters in a manner that is reasonably designed to reach potential underwriters;
(2) all bidders will have an equal opportunity to bid;
(3) the Authority may receive bids from at least three underwriters of municipal bonds who have established industry reputations for underwriting new issuances of municipal bonds; and
(4) the Authority anticipates awarding the sale of the 2019B Bonds to the bidder who submits a firm offer to purchase the 2019B Bonds at the highest price (or lowest interest cost), as set forth in this Notice of Sale.
Any bid submitted pursuant to this Notice of Sale shall be considered a firm bid for the purchase of the 2019B Bonds, as specified in the bid. By submitting a bid for the 2019B Bonds, a bidder represents and warrants to the Authority that the bidder has an established industry reputation for underwriting new issuances of municipal bonds, that it will be an “underwriter” (as defined below) that intends to reoffer the 2019B Bonds to the public, and that such bidder’s bid is submitted for and on behalf of such bidder by an officer or agent who is duly authorized to bind the bidder to a legal, valid and enforceable contract for the purchase of the 2019B Bonds. Once the bids are communicated electronically via PARITY® to the Authority, each bid will constitute an irrevocable offer to purchase the 2019B Bonds on the terms herein and therein provided.
Bids will not be subject to cancellation in the event that the competitive sale requirements are not
satisfied. In the event that the competitive sale requirements are not satisfied, the Authority shall so advise the successful bidder. In this event, the successful bidder may use either Option A or Option B, set forth below.
Failure to Meet the Competitive Sale Requirements - Option A - The 10% Test to Apply. If the competitive
sale requirements are not satisfied, the successful bidder may, at its option, use the first price at which 10% of a maturity of the 2019B Bonds (the “10% test”) is sold to the public as the issue price of that maturity, applied on a maturity-by-maturity basis, of the 2019B Bonds. The successful bidder shall advise the Financial Advisor if any maturity of the 2019B Bonds satisfies the 10% test as of the date and time of the award of the 2019B Bonds.
If the competitive sale requirements are not satisfied, then until the 10% test has been satisfied as to each
maturity of the 2019B Bonds or all of the 2019B Bonds are sold to the public, the successful bidder agrees to promptly report to the Financial Advisor the prices at which the unsold 2019B Bonds of each maturity have been sold to the public, which reporting obligation shall continue, whether or not the Closing Date has occurred, until the 10% test has been satisfied for each maturity of the 2019B Bonds or until all the 2019B Bonds of a maturity have been sold. The successful bidder shall be obligated to report each sale of 2019B Bonds to the Financial Advisor until notified in writing by the Authority or the Financial Advisor that it no longer needs to do so. If the successful bidder uses Option A, the successful bidder shall provide to the Authority on or before the Closing Date the certificate attached to this Notice of Sale as Exhibit 2 - Option A.

[__]-8
Failure to Meet the Competitive Sale Requirements - Option B - The Successful Bidder Agrees to Hold the Price of Maturities of Bonds for Which the 10% Test in Option A Is Not Met as of the Sale Date. The successful bidder may, at its option, notify the Financial Advisor in writing, which may be by email (the “Hold the Price Notice”), not later than 4:00 p.m. on the Sale Date, that it has not sold 10% of the maturities of the 2019B Bonds listed in the Hold the Price Notice (the “Hold-the-Offering-Price Maturities”) and that the successful bidder will not offer the Hold-the-Offering-Price Maturities to any person at a price that is higher than the initial offering price to the public during the period starting on the Sale Date and ending on the earlier of (i) the close of the fifth business day after the Sale Date, or (ii) the date on which the successful bidder has sold at least 10% of the applicable Hold-the-Offering-Price Maturity to the public at a price that is no higher than the initial offering price to the public. If the successful bidder uses Option B and delivers a Hold the Price Notice to the Financial Advisor, the successful bidder shall provide to the Authority on or before the Closing Date the certificate attached to this Notice of Sale as Exhibit 2 - Option B.
By submitting a bid and if the competitive sale requirements are not met, each bidder confirms that: (i) any
agreement among underwriters, any selling group agreement and each retail distribution agreement (to which the bidder is a party) relating to the initial sale of the 2019B Bonds to the public, together with the related pricing wires, contains or will contain language obligating each underwriter, each dealer who is a member of the selling group, and each broker-dealer that is a party to such retail distribution agreement, as applicable, to report the prices at which it sells to the public the unsold 2019B Bonds of each maturity allotted to it until it is notified by the successful bidder that either the 10% test has been satisfied as to the 2019B Bonds of that maturity or all 2019B Bonds of that maturity have been sold to the public, if and for so long as directed by the successful bidder and as set forth in the related pricing wires, and (ii) any agreement among underwriters relating to the initial sale of the 2019B Bonds to the public, together with the related pricing wires, contains or will contain language obligating each underwriter that is a party to a retail distribution agreement to be employed in connection with the initial sale of the 2019B Bonds to the public to require each broker-dealer that is a party to such retail distribution agreement to report the prices at which it sells to the public the unsold 2019B Bonds of each maturity allotted to it until it is notified by the successful bidder or such underwriter that either the 10% test has been satisfied as to the 2019B Bonds of that maturity or all 2019B Bonds of that maturity have been sold to the public if and for so long as directed by the successful bidder or such underwriter and as set forth in the related pricing wires.
Sales of any 2019B Bonds to any person that is a related party to an underwriter shall not constitute sales to the public for purposes of this Notice of Sale. Further, for purposes of this Notice of Sale:
(1) “public” means any person other than an underwriter or a related party,
(2) “underwriter” means (A) any person that agrees pursuant to a written contract with the Authority (or with the lead underwriter to form an underwriting syndicate) to participate in the initial sale of the 2019B Bonds to the public, and (B) any person that agrees pursuant to a written contract directly or indirectly with a person described in clause (A) to participate in the initial sale of the 2019B Bonds to the public (including a member of a selling group or a party to a retail distribution agreement participating in the initial sale of the 2019B Bonds to the public),
(3) a purchaser of any of the 2019B Bonds is a “related party” to an underwriter if the underwriter and the purchaser are subject, directly or indirectly, to (i) at least 50% common ownership of the voting power or the total value of their stock, if both entities are corporations (including direct ownership by one corporation of another), (ii) more than 50% common ownership of their capital interests or profits interests, if both entities are partnerships (including direct ownership by one partnership of another), or (iii) more than 50% common ownership of the value of the outstanding stock of the corporation or the capital interests or profit interests of the partnership, as applicable, if one entity is a corporation and the other entity is a partnership (including direct ownership of the applicable stock or interests by one entity of the other), and
(4) “sale date” means the date that the 2019B Bonds are awarded by the Authority to the successful bidder.
Delivery of the 2019B Bonds
The 2019B Bonds are expected to be delivered on or about __________, 2019 (UNLESS A NOTICE OF A CHANGE IN THE DELIVERY DATE IS ANNOUNCED IN ACCORDANCE WITH THE TIMING AND

[__]-9
PROCESS DESCRIBED UNDER “AMENDMENTS”) in New York, New York, through the facilities at DTC against payment of the purchase price therefor (less the amount of the Deposit) in Federal Funds. There will also be furnished the usual closing papers, including certificates signed by appropriate Authority officers stating that (i) no litigation of any kind is now pending or, to their information, knowledge or belief, threatened to restrain or enjoin the issuance or delivery of the 2019B Bonds or in any manner questioning the proceedings and authority under which the 2019B Bonds are issued, or affecting the validity of the 2019B Bonds, and (ii) relating to the Official Statement, as described in the Preliminary Official Statement. Legal Opinion
The approving opinion of Kaufman & Canoles, P.C., Richmond, Virginia, Bond Counsel, in substantially the form set forth in the Preliminary Official Statement, will be furnished without cost to the successful bidder. The Preliminary Official Statement contains a discussion of the effect of the Internal Revenue Code of 1986, as amended, on the exclusion from gross income of interest on the 2019B Bonds and a discussion of Bond Counsel’s opinion insofar as it concerns such exclusion. CUSIP Numbers
CUSIP numbers will be applied for by the successful bidder with respect to the 2019B Bonds, but the Authority will assume no obligation for the assignment or printing of such numbers on the 2019B Bonds or for the correctness of such numbers, and neither the failure to print such numbers on any of the 2019B Bonds nor any error with respect thereto shall constitute cause for a failure or refusal by the successful bidder to accept delivery of and make payment for the 2019B Bonds. Amendments
In addition to any changes in the bid date, time or amounts of the 2019B Bonds provided for herein, the Authority otherwise reserves the right to amend this Notice of Sale. The Authority expects it would publish notification of such amendment via TM3 NOT LATER THAN 4:00 P.M. RICHMOND, VIRGINIA TIME ON THE DAY PRIOR TO THE ANNOUNCED DATE FOR RECEIPT OF BIDS; however, any notice may be provided as late as one hour prior to any announced time for receipt of bids, and would provide notification to prospective bidders who have so requested such notification to Frasca & Associates, LLC. Official Statement
The Preliminary Official Statement and the information contained therein have been deemed final by the Authority as of its date within the meaning of Rule 15c2-12 of the Securities and Exchange Commission (“Rule 15c2-12”) with permitted omissions, but is subject to change without notice and to completion or amendment in the final Official Statement. The Authority, at its expense, will make available to the successful bidder a reasonable number of final Official Statements, for delivery to each potential investor requesting a copy of the final Official Statement and to each person to whom such bidder and members of its bidding group initially sell the 2019B Bonds, within seven (7) business days of the award of the 2019B Bonds, provided that the successful bidder cooperates in a timely manner providing the information required to complete the final Official Statement. The successful bidder shall comply with the requirements of Rule 15c2-12 and the rules of the MSRB, including an obligation to provide information to the Authority on a timely basis for the final Official Statement. Continuing Disclosure In order to assist bidders in complying with Rule 15c2-12, the Authority and the Commonwealth will undertake to provide certain annual financial information and operating data and notices of the occurrence of certain events, if material. A description of such undertakings is set forth in the Preliminary Official Statement and will also be set forth in the final Official Statement. As of the date hereof and except as otherwise may be described in the Preliminary Official Statement (to the extent that any described instance constitutes a material failure), neither the Authority nor the Commonwealth is aware of any failure in the previous five years to comply in any material respect with its respective undertakings regarding Rule 15c2-12.

[__]-10
Additional Information
For further information relating to the 2019B Bonds, reference is made to the Preliminary Official Statement, dated __________, 2019 prepared for and authorized by the Authority. The Preliminary Official Statement may be obtained via the Internet at finpressllc.com. Physical copies are available upon request by calling Financial Press, LLC at (804) 928-6366 or from the Authority through the Office of the State Treasurer, Third Floor, James Monroe Building, 101 North 14th Street, Richmond, VA 23219 (telephone [(804) 225-____]), or from the financial advisor, Frasca & Associates, LLC (telephone [(___) ___-____]. This Preliminary Official Statement is also available as public information on the Authority’s investor relations website at http://www.VPBABonds.com. Dated: __________, 2019 Virginia Public Building Authority By: Suzanne S. Long, Chairman

[__]-11
Form of Issue Price Certificates
EXHIBIT 1
Issue Price Certificate for Use if the Competitive Sale Requirements are Met
$
VIRGINIA PUBLIC BUILDING AUTHORITY Public Facilities Revenue Bonds, Series 2019B
ISSUE PRICE CERTIFICATE
The undersigned, on behalf of ____________________ (the “Initial Purchaser”) [and other Underwriters, as defined below], hereby certifies as set forth below with respect to the sale and issuance of the above-captioned obligations (the “2019B Bonds”).
1. Reasonably Expected Initial Offering Price.
(a) As of the Sale Date, the reasonably expected initial offering prices of the 2019B Bonds to the Public by the Initial Purchaser are the prices listed in Schedule A (the “Expected Offering Prices”). The Expected Offering Prices are the prices for the Maturities of the 2019B Bonds used by the Initial Purchaser in formulating its bid to purchase the 2019B Bonds. Attached as Schedule B is a true and correct copy of the bid provided by the Initial Purchaser to purchase the 2019B Bonds.
(b) The Initial Purchaser was not given the opportunity to review other bids prior to submitting its bid.
(c) The bid submitted by the Initial Purchaser constituted a firm offer to purchase the 2019B Bonds.
2. Defined Terms. (a) “Authority” means the Virginia Public Building Authority. (b) “Maturity” means 2019B Bonds with the same credit and payment terms. 2019B
Bonds with different maturity dates, or 2019B Bonds with the same maturity date but different stated interest rates, are treated as separate Maturities.
(c) “Public” means any person (including an individual, trust, estate, partnership,
association, company, or corporation) other than an Underwriter or a related party to an Underwriter. The term “related party” for purposes of this certificate generally means any two or more persons who have (i) at least 50% common ownership of the voting power or the total value of their stock, if both entities are corporations (including direct ownership by one corporation of another), (ii) more than 50% common ownership of their capital interests or profits interests, if both entities are partnerships (including direct ownership by one partnership of another), or (iii) more than 50% common ownership of the value of the outstanding stock of the corporation or the capital interests or profit interests of the partnership, as applicable, if one entity is a corporation and the other entity is a partnership (including direct ownership of the applicable stock or interests by one entity of the other).
(d) “Sale Date” means the date that the 2019B Bonds are awarded by the Authority to
the successful bidder. The Sale Date of the 2019B Bonds is [DATE].
(e) “Underwriter” means (i) any person that agrees pursuant to a written contract with the Authority (or with the lead underwriter to form an underwriting syndicate) to participate in the initial sale of the 2019B Bonds to the Public, and (ii) any person that agrees pursuant to a written contract directly or indirectly with a person described in clause (i) of this paragraph to participate in the initial sale of the 2019B Bonds to the Public (including a member of a selling group or a party to a retail distribution agreement participating in the initial sale of the 2019B Bonds to the Public).

[__]-12
The representations set forth in this certificate are limited to factual matters only. Nothing in this
certificate represents the Initial Purchaser’s interpretation of any laws, including specifically Sections 103 and 148 of the Internal Revenue Code of 1986, as amended, and the Treasury Regulations thereunder. The undersigned understands that the foregoing information will be relied upon by the Authority with respect to certain of the representations set forth in the Non-Arbitrage Certificate and Tax Compliance Agreement and with respect to compliance with the federal income tax rules affecting the 2019B Bonds, and by Kaufman & Canoles, P.C. in connection with rendering its opinion that the interest on the 2019B Bonds is excluded from gross income for federal income tax purposes, the preparation of Internal Revenue Service Form 8038-G, and other federal income tax advice that it may give to the Authority from time to time relating to the 2019B Bonds.
[INITIAL PURCHASER]
By:
Name:
Dated: [ISSUE DATE]
[SCHEDULE A]
REASONABLY EXPECTED INITIAL OFFERING PRICES
(To Be Attached)
[SCHEDULE B]
PRICING WIRE OR EQUIVALENT COMMUNICATION
(To Be Attached)

[__]-13
EXHIBIT 2 - OPTION A
Issue Price Certificate for Use if the Competitive Sale Requirements are Not
Met and the Hold the Price Rule Is Not Used
$ VIRGINIA PUBLIC BUILDING AUTHORITY Public Facilities Revenue Bonds, Series 2019B
ISSUE PRICE CERTIFICATE
The undersigned, on behalf of ____________________ (the “Initial Purchaser”) [and other Underwriters, as defined below], hereby certifies as set forth below with respect to the sale and issuance of the above-captioned obligations (the “2019B Bonds”).
1. Sale of the 2019B Bonds. As of the date of this certificate, [except as set forth in paragraph 2 below,] for each Maturity of the 2019B Bonds, the first price at which at least 10% of such Maturity of the 2019B Bonds was sold to the Public on the Sale Date is the respective price listed in Schedule A.
[Only use the next paragraph if the 10% test has not been met or all of the 2019B Bonds have not been sold for one or more Maturities as of the Closing Date.]
[2. For each Maturity of the 2019B Bonds as to which no price is listed in Schedule A, as set forth in the Notice of Sale for the 2019B Bonds, until the 10% test has been satisfied as to each Maturity of the 2019B Bonds or all of the 2019B Bonds are sold to the Public, the Successful Bidder agrees to promptly report to the Issuer’s financial advisor, Frasca & Associates, LLC (the “Financial Advisor”), the prices at which the unsold 2019B Bonds of each Maturity have been sold to the Public, which reporting obligation shall continue after the date hereof until the 10% test has been satisfied for each Maturity of the 2019B Bonds or until all the 2019B Bonds of a Maturity have been sold. The Initial Purchaser shall continue to report each sale of 2019B Bonds to the Financial Advisor until notified by email or in writing by the Issuer or the Financial Advisor that it no longer needs to do so.]
[2.][3.] Defined Terms.
(a) “Authority” means the Virginia Public Building Authority.
(b) “Maturity” means 2019B Bonds with the same credit and payment terms. 2019B Bonds with different maturity dates, or 2019B Bonds with the same maturity date but different stated interest rates, are treated as separate Maturities.
(c) “Public” means any person (including an individual, trust, estate, partnership, association, company, or corporation) other than an Underwriter or a related party to an Underwriter. The term “related party” for purposes of this certificate generally means any two or more persons who have (i) at least 50% common ownership of the voting power or the total value of their stock, if both entities are corporations (including direct ownership by one corporation of another), (ii) more than 50% common ownership of their capital interests or profits interests, if both entities are partnerships (including direct ownership by one partnership of another), or (iii) more than 50% common ownership of the value of the outstanding stock of the corporation or the capital interests or profit interests of the partnership, as applicable, if one entity is a corporation and the other entity is a partnership (including direct ownership of the applicable stock or interests by one entity of the other).
(d) “Underwriter” means (i) any person that agrees pursuant to a written contract with the Authority (or with the lead underwriter to form an underwriting syndicate) to participate in the initial sale of the 2019B Bonds to the Public, and (ii) any person that agrees pursuant to a written contract directly or indirectly with a person described in clause (i) of this paragraph to participate in the initial sale of the 2019B Bonds to the Public (including a member of a selling group or a party to a retail distribution agreement participating in the initial sale of the 2019B Bonds to the Public).

[__]-14
The representations set forth in this certificate are limited to factual matters only. Nothing in this certificate represents the Initial Purchaser’s interpretation of any laws, including specifically Sections 103 and 148 of the Internal Revenue Code of 1986, as amended, and the Treasury Regulations thereunder. The undersigned understands that the foregoing information will be relied upon by the Authority with respect to certain of the representations set forth in the Non-Arbitrage Certificate and Tax Compliance Agreement and with respect to compliance with the federal income tax rules affecting the 2019B Bonds, and by Kaufman & Canoles, P.C. in connection with rendering its opinion that the interest on the 2019B Bonds is excluded from gross income for federal income tax purposes, the preparation of Internal Revenue Service Form 8038-G, and other federal income tax advice that it may give to the Authority from time to time relating to the 2019B Bonds.
[INITIAL PURCHASER]
By:
Name: Dated: [ISSUE DATE]
SCHEDULE A
SALE PRICES OF THE GENERAL RULE MATURITIES
(To Be Attached)
[__]-15
EXHIBIT 2 - OPTION B
Issue Price Certificate for Use if the Competitive Sale Requirements are Not Met and the Hold the Price Rule Is Used
$
VIRGINIA PUBLIC BUILDING AUTHORITY Public Facilities Revenue Bonds, Series 2019B
ISSUE PRICE CERTIFICATE
The undersigned, on behalf of ____________________ (the “Initial Purchaser”) [and other Underwriters, as defined below], hereby certifies as set forth below with respect to the sale and issuance of the above-captioned obligations (the “2019B Bonds”).
A. Issue Price. 1. Sale of the General Rule Maturities. As of the date of this certificate, for each Maturity of the
General Rule Maturities, the first price at which at least 10% of such Maturity of the 2019B Bonds was sold to the Public is the respective price listed in Schedule A.
[2. Initial Offering Price of the Hold-the Offering-Price Maturities.
(a) The Initial Purchaser offered the Hold-the-Offering-Price Maturities to the Public for purchase at the respective initial offering prices listed in Schedule A (the “Initial Offering Prices”) on or before the Sale Date, which correspond to the yields shown on Schedule A and on the inside cover of the Official Statement relating to the 2019B Bonds dated the Sale Date. A copy of the pricing wire or equivalent communication for the 2019B Bonds is attached to this certificate as Schedule B.
(b) The Initial Purchaser agrees that (i) for each Maturity of the Hold-the-Offering-Price
Maturities it will neither offer nor sell any of the unsold 2019B Bonds of such Maturity to any person at a price that is higher than the Initial Offering Price for such Maturity during the Holding Period for such Maturity (the “hold-the-offering-price rule”), and (ii) any selling group agreement shall contain the agreement of each dealer who is a member of the selling group, and any retail distribution agreement shall contain the agreement of each broker-dealer who is a party to the retail distribution agreement, to comply with the hold-the-offering-price rule. Pursuant to such agreement, no Underwriter (as defined below) has offered or sold any unsold 2019B Bonds of a Maturity of the Hold-the-Offering-Price Maturities at a price that is higher than the respective Initial Offering Price for that Maturity of the 2019B Bonds during the Holding Period.]
[2.][3.] Defined Terms, [keep applicable definitions, depending on sale outcome]
(a) “General Rule Maturities” means those Maturities of the 2019B Bonds listed in Schedule
A hereto as the “General Rule Maturities.” (b) “Hold-the-Offering-Price Maturities” means those Maturities of the 2019B Bonds listed
in Schedule A hereto as the “Hold-the-Offering-Price Maturities.” (c) “Holding Period” means, with respect to a Hold-the-Offering-Price Maturity, the period
starting on the Sale Date and ending on the earlier of (a) the close of the fifth business day after the Sale Date, or (ii) the date on which the Underwriters have sold at least 10% of such Hold-the-Offering-Price Maturity to the Public at prices that are no higher than the Initial Offering Price for such Hold-the-Offering- Price Maturity.
(d) “Authority” means the Virginia Public Building Authority.

[__]-16
(e) “Maturity” means 2019B Bonds with the same credit and payment terms. 2019B Bonds with
different maturity dates, or 2019B Bonds with the same maturity date but different stated interest rates, are treated as separate Maturities.
(f) “Public” means any person (including an individual, trust, estate, partnership, association,
company, or corporation) other than an Underwriter or a related party to an Underwriter. The term “related party” for purposes of this certificate generally means any two or more persons who have (i) at least 50% common ownership of the voting power or the total value of their stock, if both entities are corporations (including direct ownership by one corporation of another), (ii) more than 50% common ownership of their capital interests or profits interests, if both entities are partnerships (including direct ownership by one partnership of another), or (iii) more than 50% common ownership of the value of the outstanding stock of the corporation or the capital interests or profit interests of the partnership, as applicable, if one entity is a corporation and the other entity is a partnership (including direct ownership of the applicable stock or interests by one entity of the other).
(g) “Sale Date” means the first day on which there is a binding contract in writing for the sale
of a Maturity of the 2019B Bonds. The Sale Date of the 2019B Bonds is [DATE]. (h) “Underwriter” means (i) any person that agrees pursuant to a written contract with the
Authority (or with the lead underwriter to form an underwriting syndicate) to participate in the initial sale of the 2019B Bonds to the Public, and (ii) any person that agrees pursuant to a written contract directly or indirectly with a person described in clause (i) of this paragraph to participate in the initial sale of the 2019B Bonds to the Public (including a member of a selling group or a party to a retail distribution agreement participating in the initial sale of the 2019B Bonds to the Public).
B. Reliance.
The representations set forth in this certificate are limited to factual matters only. Nothing in this certificate represents the Initial Purchaser’s interpretation of any laws, including specifically Sections 103 and 148 of the Internal Revenue Code of 1986, as amended, and the Treasury Regulations thereunder. The undersigned understands that the foregoing information will be relied upon by the Authority with respect to certain of the representations set forth in the Non-Arbitrage Certificate and Tax Compliance Agreement and with respect to compliance with the federal income tax rules affecting the 2019B Bonds, and by Kaufman & Canoles, P.C. in connection with rendering its opinion that the interest on the 2019B Bonds is excluded from gross income for federal income tax purposes, the preparation of Internal Revenue Service Form 8038-G, and other federal income tax advice that it may give to the Authority from time to time relating to the 2019B Bonds.
[INITIAL PURCHASER]
By:
Name: Dated: [ISSUE DATE]
SCHEDULE A
SALE PRICES OF THE GENERAL RULE MATURITIES AND INITIAL OFFERING PRICES OF THE HOLD-THE-OFFERING-PRICE MATURITIES
(To Be Attached)

[__]-17
17133943v2
SCHEDULE B
PRICING WIRE OR EQUIVALENT COMMUNICATION
(To Be Attached)

KC Draft: 02/07/19
[__]-18
NOTICE OF SALE
VIRGINIA PUBLIC BUILDING AUTHORITY
$_____* Public Facilities Revenue Bonds,
Series 2019C (Taxable)
Electronic Bids, via the PARITY® Competitive Bidding System (“PARITY®”) only, for the purchase of all, and not less than all, of the $_____* Virginia Public Building Authority Public Facilities Revenue Bonds, Series 2019C (Taxable) (the “2019C Bonds”) will be received until ____ [A.M.][P.M.], RICHMOND, VIRGINIA TIME, on _____, __________, 2019 (unless postponed or changed as described herein), by the Virginia Public Building Authority (the “Authority”).
Preliminary Official Statement
The Authority has authorized the preparation and distribution of a Preliminary Official Statement dated __________, 2019 (the “Preliminary Official Statement”) containing information relating to the 2019C Bonds, the Authority’s Public Facilities Revenue Bonds, Series 2019A and the Authority’s Public Facilities Revenue Bonds, Series 2019B (AMT), which are not described in or covered by this Notice of Sale. This Notice of Sale and the Preliminary Official Statement referred to above are available on the Internet at finpressllc.com. The Preliminary Official Statement in its entirety is available in physical form and may be obtained as provided under the caption “Additional Information” herein.
The 2019C Bonds
Authorization and Security The 2019C Bonds will be issued pursuant to a Master Indenture of Trust (as previously supplemented and amended, the “Master Indenture”), dated as of April 15, 1997, as supplemented by the Thirty-Seventh Supplemental Indenture of Trust (the “Supplemental Indenture”), dated as of _____ 1, 2019, between the Authority and The Bank of New York Mellon Trust Company, N.A., as successor trustee (the “Trustee”). Together, the Master Indenture, the Thirty-Seventh Supplemental Indenture and any further supplements are referred to collectively as the “Indenture.” All Bonds currently outstanding under the Indenture are collectively referred to as the “Prior Bonds.” The 2019C Bonds, the Prior Bonds, and all other parity or additional bonds hereafter issued from time to time under and secured equally and ratably by the Indenture (the “Additional Bonds”) are collectively called the “Bonds.” THE 2019C BONDS WILL BE LIMITED OBLIGATIONS OF THE AUTHORITY PAYABLE SOLELY FROM THE REVENUES, RECEIPTS AND FUNDS PLEDGED OR AVAILABLE FOR THE PAYMENT THEREOF AND ARE NOT A DEBT OR A PLEDGE OF THE FULL FAITH AND CREDIT OF THE COMMONWEALTH OR OF ANY POLITICAL SUBDIVISION THEREOF, OTHER THAN THE AUTHORITY. THE GENERAL ASSEMBLY IS NOT REQUIRED, AND IS UNDER NO LEGAL OBLIGATION, TO MAKE AN APPROPRIATION FOR ANY AMOUNTS DUE UNDER THE PAYMENT AGREEMENT.
* Preliminary, subject to change.

[__]-19
Bid Parameters for the 2019C Bonds
INTEREST PROCEDURAL
Dated Date: Date of Delivery Sale Date and Time:
Bids due _____, 2019 at [____] [A.M.][P.M.], Richmond, VA Time
Anticipated Delivery Date:
__________, 2019 Bid Submission: Electronic bids through PARITY Only
Interest Payment Dates: February 1 and August 1 All or None? Yes
First Interest Payment Date:
August 1, 20__ Bid Award Method: Lowest TIC
Coupon Multiples: 1/8 or 1/100 of 1% Good Faith Deposit: 1% of the Preliminary Aggregate Principal Amount
Zero Coupons: Not Permitted
Optional Redemption:
Due on and after August 1, 20__, callable on August 1, 20__ and thereafter at par
Split Coupons: Not Permitted
PRINCIPAL PRICING
Post-bid Principal Increases in Aggregate:
__% Max. Aggregate Bid Price: No Limit
Post-bid Principal Reductions in Aggregate:
__% Min. Aggregate Bid Price: ___%
Term Bonds: Any two or more consecutive maturities may be designated as term bonds
Max. Price per Maturity: No Limit
Min. Price per Maturity: No Limit
High Coupon per Maturity: __%
Low Coupon per Maturity: No Limit
Details of 2019C Bonds; Book Entry Only The 2019C Bonds will be dated the date of their original issuance and delivery (the “Dated Date”). Interest on the 2019C Bonds from the Dated Date will be calculated on a 30/360 day basis and will be payable semiannually on February 1 and August 1, commencing August 1, 20__. The 2019C Bonds will be issued as fully registered bonds in book entry form, payable to the nominee of The Depository Trust Company, New York, New York, (“DTC”), as securities depository for the 2019C Bonds. Reference is made to the Preliminary Official Statement relating to the 2019C Bonds for the applicable provisions relating to the transfer of beneficial ownership, manner of redemption, the responsibilities of DTC participants and the right of the Authority to discontinue the book entry only system.

[__]-20
Maturity Schedule Principal on the 2019C Bonds will be due (subject to the right of prior redemption, if any, as hereafter set forth) through serial maturities or term maturities as provided below on the following dates and in the following amounts:
August 1 2019C Bonds*
—————— * Preliminary, subject to adjustment both before and after award of the 2019C Bonds as described herein under “Changes to Preliminary Principal Amount.”
Serial and/or Term Bonds; Mandatory Sinking Fund Redemption The successful bidder may provide in the bid form for all of the 2019C Bonds to be issued as serial bonds or may designate consecutive annual principal amounts of the 2019C Bonds to be combined into term bonds. Each such term bond shall be subject to mandatory sinking fund redemption commencing on August 1 of the first year which has been combined to form such term bond and continuing on August 1 in each year thereafter until the stated maturity date of that term bond. The amount redeemed in any year shall be equal to the principal amount for such year set forth in the appropriate amortization schedule, as adjusted in accordance with the provisions described above under the caption “Changes to Preliminary Principal Amount.” The 2019C Bonds to be redeemed in any year by mandatory sinking fund redemption shall be redeemed at par and shall be selected by lot or otherwise according to DTC procedures from among the 2019C Bonds of the same maturity.

[__]-21
Optional Redemption Provisions [The 2019C Bonds maturing on or before August 1, 20__* are not subject to redemption prior to maturity. The 2019C Bonds maturing on or after August 1, 20__* may be redeemed prior to their respective maturities at the sole option of the Authority on or after August 1, 20__*, in whole or in part at any time, at a redemption price equal to 100% of the principal amount of the 2019C Bonds to be redeemed, plus accrued interest to the redemption date, as described in the Preliminary Official Statement.]
Changes to Bid Date, Closing Date, and Principal Amounts Change of Bid Date and Closing Date
The Authority reserves the right to change, from time to time, the date and/or time established for the receipt of bids and will undertake to notify registered prospective bidders via notification published on www.tm3.com (“TM3”). Prospective bidders may request notification of any such changes in the date or time for the receipt of bids by so advising Frasca & Associates, LLC at [(___) ___-____] by no later than [_____], RICHMOND, VIRGINIA TIME, on the day prior to the announced date for receipt of bids.
A change of the bid date and/or time will be announced in accordance with the timing and process described under “Amendments.” An alternative sale date and time will be announced via TM3 at least 18 hours prior to such alternative date and/or time for receipt of bids. On any such alternative date and/or time for receipt of bids, the Authority will accept electronic bids for the purchase of the 2019C Bonds, such bids to conform in all respects to the provisions of this Notice of Sale, except for the changes in the date and/or time for receipt of bids and any other changes announced via TM3 at the time the date and time for receipt of bids are announced. The Authority may change the scheduled delivery date for the 2019C Bonds by notice given in the same manner as that set forth for a change in the date for the receipt of bids. See “Delivery of the 2019C Bonds” below. Changes to Preliminary Principal Amounts The preliminary aggregate principal amount of the 2019C Bonds and the preliminary annual principal amounts as set forth in this Notice of Sale (the “Preliminary Aggregate Principal Amount” and the “Preliminary Annual Principal Amounts,” respectively; collectively, the “Preliminary Amounts”) may be revised before the viewing of electronic bids for the purchase of the 2019C Bonds. Any such revisions (the “Revised Aggregate Principal Amount” and the “Revised Annual Principal Amounts,” respectively; collectively, the “Revised Amounts”) WILL BE ANNOUNCED IN ACCORDANCE WITH THE TIMING AND PROCESS DESCRIBED UNDER “AMENDMENTS.” In the event that no such revisions are made, the Preliminary Amounts will constitute the Revised Amounts. BIDDERS SHALL SUBMIT BIDS BASED ON THE REVISED AMOUNTS. Prospective bidders may request notification of any revisions in Preliminary Amounts by so advising Frasca & Associates, LLC at [(___)___-____] by [_____], RICHMOND, VIRGINIA TIME, at least one day prior to the receipt of bids. Changes to Revised Principal Amounts After selecting the winning bid, the Authority reserves the right to change the final aggregate principal amount of the 2019C Bonds and each final annual principal amount (the “Final Aggregate Principal Amounts” and the “Final Annual Principal Amounts,” respectively; collectively, the “Final Amounts”). In determining the Final Amounts, the Authority will not reduce or increase the Revised Aggregate Principal Amount by more than 10% of such amount. THE SUCCESSFUL BIDDER MAY NOT WITHDRAW ITS BID OR CHANGE THE INTEREST RATES BID OR THE
Preliminary, subject to change.

[__]-22
INITIAL REOFFERING PRICES (AS HEREIN DEFINED) AS A RESULT OF ANY CHANGES MADE TO THE REVISED AMOUNTS WITHIN THESE LIMITS. The dollar amount bid by the successful bidder will be adjusted to reflect any adjustment in the aggregate principal amount of the 2019C Bonds. Such adjusted bid price will reflect changes in the dollar amount of the underwriter’s discount and original issue discount/premium, if any, but will not change the selling compensation per $1,000 of par amount of bonds from the selling compensation that would have been received based on the purchase price in the winning bid and the Initial Reoffering Prices. The interest rate specified by the successful bidder for each maturity and the Initial Reoffering Prices will not change. The Authority anticipates that the Final Amounts and the adjusted bid prices will be communicated to the successful bidder no later than 24 hours after the bids are received.
Electronic Bidding and Bidding Procedures Registration to Bid All prospective bidders must be contracted customers of PARITY®. If you do not have a contract with PARITY®, call (212) 404-8102 to become a customer. By submitting a bid for the 2019C Bonds, a prospective bidder represents and warrants to the Authority that such bidder’s bid for the purchase of the 2019C Bonds is submitted for and on behalf of such prospective bidder by an officer or agent who is duly authorized to bind the prospective bidder to a legal, valid and enforceable contract for the purchase of the 2019C Bonds. By registering to bid for the 2019C Bonds, a prospective bidder is not obligated to submit a bid in connection with the sale. IF ANY PROVISIONS OF THIS NOTICE OF SALE SHALL CONFLICT WITH INFORMATION PROVIDED BY PARITY® AS APPROVED PROVIDER OF ELECTRONIC BIDDING SERVICES, THIS NOTICE OF SALE (INCLUDING ANY AMENDMENTS OR SUPPLEMENTS) SHALL CONTROL. Further information about PARITY®, including qualification, registration, rules and any fee charged, may be obtained from PARITY®, telephone (212) 404-8102, email at [email protected]. Disclaimer Each prospective bidder shall be solely responsible to register to bid via PARITY®. Each qualified prospective bidder shall be solely responsible to make necessary arrangements to access PARITY® for purposes of submitting its bid in a timely manner and in compliance with the requirements of the Notice of Sale. Neither the Authority nor PARITY® shall have any duty or obligation to undertake such registration to bid for any prospective bidder or to provide or assure such access to any qualified prospective bidder, and neither the Authority nor PARITY® shall be responsible for a bidder’s failure to register to bid or for proper operation of, or have any liability for any delays or interruptions of, or any damages caused by PARITY®. The Authority is using PARITY® as a communication mechanism, and not as the Authority’s agent, to conduct the electronic bidding for the 2019C Bonds. The Authority is not bound by any advice and determination of PARITY® to the effect that any particular bid complies with the terms of this Notice of Sale and in particular the “Bid Specifications” hereinafter set forth. All costs and expenses incurred by prospective bidders in connection with their registration and submission of bids via PARITY® are the sole responsibility of the bidders; and the Authority is not responsible, directly or indirectly, for any of such costs or expenses. If a prospective bidder encounters any difficulty in registering to bid or submitting, modifying or withdrawing a bid for the 2019C Bonds, it should telephone PARITY® at (212) 404-8102 and notify Frasca & Associates, LLC at [(___) ___-____]. After receipt of bids is closed, the Authority, through PARITY® will indicate the apparent successful bidder. Such message is a courtesy only for viewers, and does not constitute the award of the 2019C Bonds. Each bid will remain subject to review by the Authority to determine its true interest cost rate and compliance with the terms of this Notice of Sale and to award the 2019C Bonds. Good Faith Deposit A good faith deposit in the amount of 1% of the Preliminary Aggregate Principal Amount (the “Deposit”) is required in connection with the sale and bid for the 2019C Bonds. The Deposit shall be provided for by a Federal funds wire transfer to be submitted to the Authority by the successful bidder not later than 4:00 P.M. (Richmond Time) on the date of sale (the “Wire Transfer Deadline”) as set forth below under “Wire Transfers.” The Deposit of

[__]-23
the successful bidder will be collected and the proceeds thereof retained by the Authority to be applied in partial payment for the 2019C Bonds and no interest will be allowed or paid upon the amount thereof, but in the event the successful bidder shall fail to comply with the terms of the respective bid, the proceeds thereof will be retained as and for full liquidated damages.
Wire Transfers. The Authority will distribute wiring instructions for the Deposit to the successful bidder upon verification of the bids submitted by the bidders and prior to the Wire Transfer Deadline. If the Deposit is not received by the Wire Transfer Deadline, the award of the sale of the 2019C Bonds to the successful bidder may be cancelled by the Authority in its discretion without any financial liability of the Authority to the successful bidder or any limitation whatsoever on the Authority’s right to sell the 2019C Bonds to a different purchaser upon such terms and conditions as the Authority shall deem appropriate. Bidding Procedures Bids must be submitted electronically for the purchase of the 2019C Bonds (all or none) by means of the Virginia Public Building Authority AON Bid Form (the “Bid Form”) via PARITY® by [___] [A.M.][P.M.], RICHMOND, VIRGINIA TIME, on ____, __________, 2019 unless postponed as described herein (see “Change of Bid Date and Closing Date”). Prior to that time, a prospective bidder may input and save the proposed terms of its bid in PARITY®. Once the final bid has been saved in PARITY®, the bidder may select the final bid button in PARITY® to submit the bid to PARITY®. Once the bids are communicated electronically via PARITY® to the State Treasurer, each bid will constitute an irrevocable offer to purchase the 2019C Bonds on the terms therein and herein provided. For purposes of the electronic bidding process, the time as maintained on PARITY® shall constitute the official RICHMOND, VIRGINIA TIME. For information purposes only, bidders are requested to state in their bids the true interest cost to the Authority, as described under “Award of the 2019C Bonds” below, represented by the rate or rates of interest and the bid price specified in their respective bids. No bids will be accepted in written form, by facsimile transmission or in any other medium or on any system other than by means of the Bid Form via PARITY®. No bid will be received after the time for receiving such bids specified above. Award of the 2019C Bonds The Authority will notify the apparent successful bidder electronically (via PARITY®), as soon as possible after the receipt of bids, that such bidder’s bid appears to be the lowest and best bid received that conforms to the requirements of this Notice of Sale, subject to verification. Upon such notice, such successful bidder shall advise the Authority of the initial reoffering prices and yields to the public of the various maturities of the 2019C Bonds as described below. Such reoffering prices and yields, among other things, will be used by the Authority to calculate the Final Annual Principal Amounts and the Final Aggregate Principal Amount of the 2019C Bonds. ALL BIDS SHALL REMAIN FIRM UNTIL 4:00 P.M., RICHMOND, VIRGINIA TIME, ON THE DATE OF RECEIPT OF BIDS. An award of the 2019C Bonds, if made, will be made by the Authority within such period of time. Unless all bids are rejected, the 2019C Bonds will be awarded to the bidder whose bid results in the lowest true interest cost to the Authority, based on the Revised Amounts described above. The true interest cost (expressed as an annual interest rate) will be determined as being twice that factor or discount rate, compounded semi-annually, that, when applied against each semi-annual debt service payment (interest, or principal and interest, as due, including any mandatory sinking fund payment) will equate the sum of such discounted semi-annual payments to the total purchase price. The true interest cost shall be calculated from the Dated Date. In case of a tie, the Authority, in its sole discretion, may select the successful bidder. THE AUTHORITY RESERVES THE RIGHT TO WAIVE IRREGULARITIES IN ANY BID AND TO REJECT ANY OR ALL BIDS.
[__]-24
Closing; Miscellaneous Undertakings of the Successful Bidder The successful bidder shall make a bona fide public offering of all of the 2019C Bonds to the general public and shall, within 30 minutes after being notified that such bidder’s bid appears to be the apparent winning bid, subject to verification, advise the Authority in writing of the initial public offering prices of the 2019C Bonds (the “Initial Reoffering Prices”). The successful bidder must provide the initial public offering prices, as the Authority will not include in the Official Statement an “NRO” (“not reoffered”) designation to or for any maturity of the 2019C Bonds. The successful bidder will be responsible to the Authority in all respects for the accuracy and completeness of any information it provides with respect to such reoffering. The successful bidder must, within 24 hours after notification of the Final Amounts, furnish the following information to the Authority to complete the Official Statement in final form, as described below:
A. Selling compensation (aggregate total anticipated compensation to the underwriters expressed in dollars, based on the expectation that all 2019C Bonds are sold at the prices or yields at which the successful bidder advised the Authority that the 2019C Bonds were initially offered to the public).
B. The identity of the other underwriters if the successful bidder is part of a group or syndicate. It is the policy
of the Commonwealth of Virginia pursuant to Executive Order 20 (2014) to ensure that small businesses and businesses owned by women and minorities receive every opportunity to compete for the Commonwealth’s business. Accordingly, the winning bidder’s list of syndicate members should note any minority, women or disadvantaged business enterprises participating in the syndicate.
C. Any other material information that the Authority determines is necessary or desirable to complete the
Official Statement in final form. The Authority expects the successful bidder to deliver copies of such Official Statement in final form (the “final Official Statement”) to persons to whom such bidder initially sells the 2019C Bonds, the Municipal Securities Rulemaking Board (“MSRB”) and to the MSRB’s Electronic Municipal Market Access System (“EMMA”). The successful bidder will be required to acknowledge receipt of such final Official Statement, to certify that it has made delivery of the final Official Statement to such repositories, to acknowledge that the Authority expects the successful bidder to deliver copies of such final Official Statement to persons to whom such bidder initially sells the 2019C Bonds and to certify that the 2019C Bonds will only be offered pursuant to the final Official Statement and only in states where the offer is legal. Delivery of the 2019C Bonds The 2019C Bonds are expected to be delivered on or about __________, 2019 (UNLESS A NOTICE OF A CHANGE IN THE DELIVERY DATE IS ANNOUNCED IN ACCORDANCE WITH THE TIMING AND PROCESS DESCRIBED UNDER “AMENDMENTS”) in New York, New York, through the facilities at DTC against payment of the purchase price therefor (less the amount of the Deposit) in Federal Funds. There will also be furnished the usual closing papers, including certificates signed by appropriate Authority officers stating that (i) no litigation of any kind is now pending or, to their information, knowledge or belief, threatened to restrain or enjoin the issuance or delivery of the 2019C Bonds or in any manner questioning the proceedings and authority under which the 2019C Bonds are issued, or affecting the validity of the 2019C Bonds, and (ii) relating to the Official Statement, as described in the Preliminary Official Statement. Legal Opinion The approving opinion Kaufman & Canoles P.C., Richmond, Virginia, Bond Counsel, in substantially the form set forth in the Preliminary Official Statement, will be furnished without cost to the successful bidder.
[__]-25
Federal Tax Status of 2019C Bonds Interest on the 2019C Bonds is includable in gross income of the owners hereof for federal income tax purposes. CUSIP Numbers CUSIP numbers will be applied for by the successful bidder with respect to the 2019C Bonds, but the Authority will assume no obligation for the assignment or printing of such numbers on the 2019C Bonds or for the correctness of such numbers, and neither the failure to print such numbers on any of the 2019C Bonds nor any error with respect thereto shall constitute cause for a failure or refusal by the successful bidder to accept delivery of and make payment for the 2019C Bonds. Amendments In addition to any changes in the bid date, time or amounts of the 2019C Bonds provided for herein, the Authority otherwise reserves the right to amend this Notice of Sale. The Authority expects it would publish notification of such amendment via TM3 NOT LATER THAN 4:00 P.M. RICHMOND, VIRGINIA TIME ON THE DAY PRIOR TO THE ANNOUNCED DATE FOR RECEIPT OF BIDS; however, any notice may be provided as late as one hour prior to any announced time for receipt of bids, and would provide notification to prospective bidders who have so requested such notification to Frasca & Associates, LLC. Official Statement The Preliminary Official Statement and the information contained therein have been deemed final by the Authority as of its date within the meaning of Rule 15c2-12 of the Securities and Exchange Commission (“Rule 15c2-12”) with permitted omissions, but is subject to change without notice and to completion or amendment in the final Official Statement. The Authority, at its expense, will make available to the successful bidder a reasonable number of final Official Statements, for delivery to each potential investor requesting a copy of the final Official Statement and to each person to whom such bidder and members of its bidding group initially sell the 2019C Bonds, within seven (7) business days of the award of the 2019C Bonds, provided that the successful bidder cooperates in a timely manner providing the information required to complete the final Official Statement. The successful bidder shall comply with the requirements of Rule 15c2-12 and the rules of the MSRB, including an obligation to provide information to the Authority on a timely basis for the final Official Statement. Continuing Disclosure In order to assist bidders in complying with Rule 15c2-12, the Authority and the Commonwealth will undertake to provide certain annual financial information and operating data and notices of the occurrence of certain events, if material. A description of such undertakings is set forth in the Preliminary Official Statement and will also be set forth in the final Official Statement. As of the date hereof and except as otherwise may be described in the Preliminary Official Statement (to the extent that any described instance constitutes a material failure), neither the Authority nor the Commonwealth is aware of any failure in the previous five years to comply in any material respect with its respective undertakings regarding Rule 15c2-12. Additional Information For further information relating to the 2019C Bonds, reference is made to the Preliminary Official Statement, dated __________, 2019 prepared for and authorized by the Authority. The Preliminary Official Statement may be obtained via the Internet at finpressllc.com. Physical copies are available upon request by calling Financial Press, LLC at (804) 928-6366 or from the Authority through the Office of the State Treasurer, Third Floor, James Monroe Building, 101 North 14th Street, Richmond, VA 23219 (telephone [(804) 225-____]), or from the financial advisor, Frasca & Associates,

[__]-26
17133741v3
LLC (telephone [(___) ___-____]. This Preliminary Official Statement is also available as public information on the Authority’s investor relations website at http://www.VPBABonds.com. Dated: __________, 2019 Virginia Public Building Authority By: Suzanne S. Long, Chairman

RESOLUTION APPROVING PLAN OF FINANCE FOR ISSUANCE BY THE VIRGINIA PUBLIC BUILDING AUTHORITY OF ITS PUBLIC FACILITIES
REVENUE BONDS, AND DELEGATING AUTHORITY TO THE STATE TREASURER TO APPROVE THE FINAL
TERMS AND STRUCTURE OF THE BONDS WHEREAS, the Treasury Board (the “Treasury Board”) of the Commonwealth of Virginia (the “Commonwealth”) is required pursuant to Section 2.2-2416(7) of the Code of Virginia of 1950, as amended (the “Code”), to approve the terms and structure of all proposed bond issues by state authorities where the debt service payments on such bonds are expected to be so made, in whole or in part, from appropriations of the Commonwealth; WHEREAS, the Virginia Public Building Authority Act of 1981, as amended, authorizes the Virginia Public Building Authority (the “Authority”) to finance certain projects authorized by the General Assembly from time to time and to refund bonds previously issued by the Authority; WHEREAS, under the terms of a Payment Agreement, dated as of April 15, 1997 (the “Payment Agreement”), between the Authority and the Treasury Board, the debt service on the Bonds (as defined herein), and all other bonds of the Authority issued under the Master Indenture, as defined therein, will be paid primarily from revenues and receipts derived from general fund appropriations made by the General Assembly to the Treasury Board and transferred to the Authority under the terms of the Payment Agreement; WHEREAS, by resolution adopted on February 14, 2019, the Authority has determined to issue its Public Facilities Revenue Bonds, in one or more series or sub-series with appropriate year and series designations and from time to time (collectively, the “Bonds”), to (i) finance the acquisition, construction, improvement, rehabilitation, furnishing and equipping of various public facilities for use by the Commonwealth and its agencies, (ii) finance the Commonwealth’s payment of the costs of certain grants and of regional and local jail and juvenile detention facility projects, and (iii) pay costs of issuance of the Bonds; and WHEREAS, the plan of finance proposed by the Authority and the proposed terms and structure of the Bonds are described in a draft of the Preliminary Official Statement for the Bonds (the “Preliminary Official Statement”) and a Preliminary Financing Summary (the “Financing Summary”), attached hereto as Attachment A, copies of which have been presented at this meeting to the members of the Treasury Board. NOW, THEREFORE, BE IT RESOLVED BY THE TREASURY BOARD OF THE COMMONWEALTH OF VIRGINIA THAT: 1. The plan of financing proposed by the Authority for the issuance of the Bonds and their terms and structure, as outlined in the Preliminary Official Statement and the Financing Summary presented at this meeting, is hereby approved, subject to final approval by the State Treasurer of the Commonwealth (the “State Treasurer”) pursuant to Section 2 of this Resolution.

-2-
2. Pursuant to Section 2.2-2416(9) of the Code, the Treasury Board deems it proper and delegates to the State Treasurer the authority to act for and on behalf of the Treasury Board and to take such action as she, in her sole discretion, may deem necessary and appropriate in connection with (i) the issuance and sale of the Bonds from time to time by the Authority, including approval of the manner of sale of the Bonds in one or more series through either a competitive or negotiated sale or a combination of both and selection of Underwriters and the issuance of a series of Bonds the interest on which will be includable in gross income of the holders thereof for federal tax purposes, if applicable, and (ii) the approval of the Authority’s issuance of the Bonds, the plan of finance for the Bonds as set forth in the Financing Summary and the final terms and structure of the Bonds; provided, however, that: (a) the aggregate stated principal amount of the Bonds shall not exceed $400 million,
whether issued as federally tax-exempt bonds, taxable bonds or a combination of both; (b) the final stated maturity of the Bonds is not later than August 1, 2039; (c) the “true” interest cost of any series of the Bonds shall not exceed (A) 4.80% for Bonds
issued on a taxable basis, or (B) 4.50% for Bonds issued on a tax-exempt basis, taking into account original issue discount or premium, if any;
(d) if sold through a competitive sale, the Bonds shall be sold at a price not less than (i)
99.0% of the aggregate principal amount thereof for the Bonds issued on a taxable basis, or (ii) 98.0% of the aggregate principal amount thereof for the Bonds issued on a tax-exempt basis; and
(e) if sold through a negotiated sale, the Bonds shall not be sold to the Underwriters with
an underwriter’s discount in excess of 1.0% of their aggregate principal amount. 3. The Treasury Board ratifies and confirms the Payment Agreement. 4. The State Treasurer is authorized to take such further actions as necessary to carry out the purposes and intent of this Resolution, including the approval and execution of a continuing disclosure agreement in respect of the Commonwealth’s obligations as an “obligated person,” within the meaning of SEC Rule 15c2-12, with respect to the Bonds.
5. This Resolution shall take effect immediately upon its adoption.

-3-
The undersigned Chairman of the Treasury Board of the Commonwealth of Virginia certifies that the foregoing is a true and correct copy of a Resolution adopted by the Treasury Board at a duly called meeting held on February 20, 2019, at which a quorum was present and acting throughout. Such Resolution has not been repealed, revoked, rescinded or amended and is in full force and effect on the date hereof. Dated: __________, 2019 __________________________________
Chairman, Treasury Board of the Commonwealth of Virginia

17123744v2
Attachment A
Financing Summary

MOTION RELATED TO THE REQUEST FOR PROPOSAL FOR FINANCIAL ADVISOR TO THE TREASURY BOARD
I move that staff be directed to develop and issue a Request for Proposals for Financial Advisor to the Treasury Board, and that staff be authorized to review the proposals received; to select those firms deemed most qualified and responsive; and to negotiate and select one or more firms for final approval by the State Treasurer. The current contract to provide Financial Advisory Services to the Virginia Treasury Board expires on April 30, 2019. Under the current contract, Public Resources Advisory Group serves as primary financial advisor to the Board. Hilltop Securities Inc. serves as secondary financial advisor to the Board.
_________________________________________ Chairman, Treasury Board of the
Commonwealth of Virginia Date: February _____, 2019

Joseph W. Montgomery, CFP®, AIF® Brian T. Moore, CIMA®, AIF® Robin S. Wilcox, AIF®Managing Director - Investments Senior Institutional Consultant Vice President - Investments
[email protected] [email protected] [email protected]
R. Bryce Lee, CFA, CIMA®, CAIA, FRM, AIF® Karen H. Logan, CIMA®, AIF® H. James Johnson, III, AIF®Senior Institutional Consultant Senior Institutional Consultant Associate Vice President- Investments
[email protected] [email protected] [email protected]
428 McLaws Circle Williamsburg, Virginia 23185 888-465-8422
Extended Duration and Credit Portfolio Evaluation for Periods Ending December 31, 2018
Wells Fargo Advisors is the trade name under which Wells Fargo & Company provides brokerage services through two registered broker/dealers: Wells Fargo Advisors, LLC, member NYSE/SIPC, and Wells Fargo Advisors Financial Network, Inc., member NASD/SIPC. Each broker/dealer is a separate non-bank affiliate of Wells Fargo & Company.
Commonwealth of VirginiaDepartment of the Treasury
SectionI.II.
III.
Executive SummaryFixed Income Manager Review
Short Duration PortfolioIntermediate Duration PortfolioLong Duration Portfolio
Investment Policy Statement
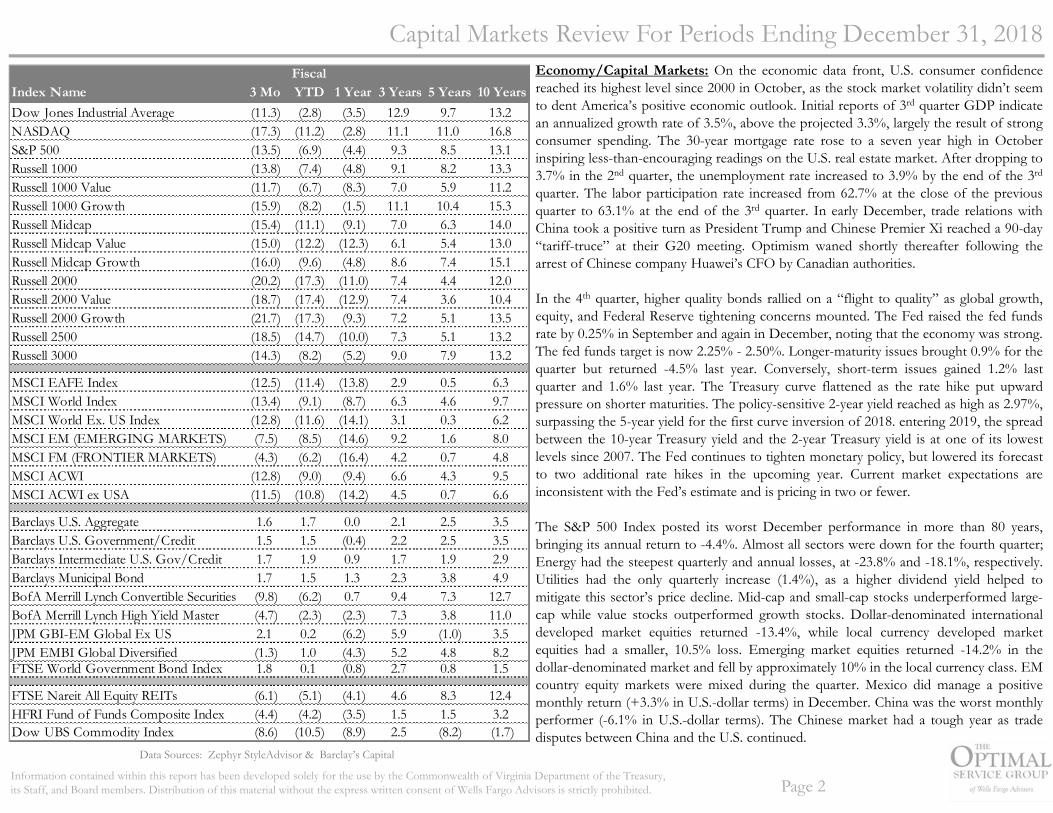
Information contained within this report has been developed solely for the use by the Commonwealth of Virginia Department of the Treasury,its Staff, and Board members. Distribution of this material without the express written consent of Wells Fargo Advisors is strictly prohibited.
Data Sources: Zephyr StyleAdvisor & Barclay’s Capital
Capital Markets Review For Periods Ending December 31, 2018Economy/Capital Markets: On the economic data front, U.S. consumer confidencereached its highest level since 2000 in October, as the stock market volatility didn’t seemto dent America’s positive economic outlook. Initial reports of 3rd quarter GDP indicatean annualized growth rate of 3.5%, above the projected 3.3%, largely the result of strongconsumer spending. The 30-year mortgage rate rose to a seven year high in Octoberinspiring less-than-encouraging readings on the U.S. real estate market. After dropping to3.7% in the 2nd quarter, the unemployment rate increased to 3.9% by the end of the 3rd
quarter. The labor participation rate increased from 62.7% at the close of the previousquarter to 63.1% at the end of the 3rd quarter. In early December, trade relations withChina took a positive turn as President Trump and Chinese Premier Xi reached a 90-day“tariff-truce” at their G20 meeting. Optimism waned shortly thereafter following thearrest of Chinese company Huawei’s CFO by Canadian authorities.
In the 4th quarter, higher quality bonds rallied on a “flight to quality” as global growth,equity, and Federal Reserve tightening concerns mounted. The Fed raised the fed fundsrate by 0.25% in September and again in December, noting that the economy was strong.The fed funds target is now 2.25% - 2.50%. Longer-maturity issues brought 0.9% for thequarter but returned -4.5% last year. Conversely, short-term issues gained 1.2% lastquarter and 1.6% last year. The Treasury curve flattened as the rate hike put upwardpressure on shorter maturities. The policy-sensitive 2-year yield reached as high as 2.97%,surpassing the 5-year yield for the first curve inversion of 2018. entering 2019, the spreadbetween the 10-year Treasury yield and the 2-year Treasury yield is at one of its lowestlevels since 2007. The Fed continues to tighten monetary policy, but lowered its forecastto two additional rate hikes in the upcoming year. Current market expectations areinconsistent with the Fed’s estimate and is pricing in two or fewer.
The S&P 500 Index posted its worst December performance in more than 80 years,bringing its annual return to -4.4%. Almost all sectors were down for the fourth quarter;Energy had the steepest quarterly and annual losses, at -23.8% and -18.1%, respectively.Utilities had the only quarterly increase (1.4%), as a higher dividend yield helped tomitigate this sector’s price decline. Mid-cap and small-cap stocks underperformed large-cap while value stocks outperformed growth stocks. Dollar-denominated internationaldeveloped market equities returned -13.4%, while local currency developed marketequities had a smaller, 10.5% loss. Emerging market equities returned -14.2% in thedollar-denominated market and fell by approximately 10% in the local currency class. EMcountry equity markets were mixed during the quarter. Mexico did manage a positivemonthly return (+3.3% in U.S.-dollar terms) in December. China was the worst monthlyperformer (-6.1% in U.S.-dollar terms). The Chinese market had a tough year as tradedisputes between China and the U.S. continued.
Page 2
Index Name 3 MoFiscal YTD 1 Year 3 Years 5 Years 10 Years
Dow Jones Industrial Average (11.3) (2.8) (3.5) 12.9 9.7 13.2NASDAQ (17.3) (11.2) (2.8) 11.1 11.0 16.8S&P 500 (13.5) (6.9) (4.4) 9.3 8.5 13.1Russell 1000 (13.8) (7.4) (4.8) 9.1 8.2 13.3Russell 1000 Value (11.7) (6.7) (8.3) 7.0 5.9 11.2Russell 1000 Growth (15.9) (8.2) (1.5) 11.1 10.4 15.3Russell Midcap (15.4) (11.1) (9.1) 7.0 6.3 14.0Russell Midcap Value (15.0) (12.2) (12.3) 6.1 5.4 13.0Russell Midcap Growth (16.0) (9.6) (4.8) 8.6 7.4 15.1Russell 2000 (20.2) (17.3) (11.0) 7.4 4.4 12.0Russell 2000 Value (18.7) (17.4) (12.9) 7.4 3.6 10.4Russell 2000 Growth (21.7) (17.3) (9.3) 7.2 5.1 13.5Russell 2500 (18.5) (14.7) (10.0) 7.3 5.1 13.2Russell 3000 (14.3) (8.2) (5.2) 9.0 7.9 13.2
MSCI EAFE Index (12.5) (11.4) (13.8) 2.9 0.5 6.3MSCI World Index (13.4) (9.1) (8.7) 6.3 4.6 9.7MSCI World Ex. US Index (12.8) (11.6) (14.1) 3.1 0.3 6.2MSCI EM (EMERGING MARKETS) (7.5) (8.5) (14.6) 9.2 1.6 8.0MSCI FM (FRONTIER MARKETS) (4.3) (6.2) (16.4) 4.2 0.7 4.8MSCI ACWI (12.8) (9.0) (9.4) 6.6 4.3 9.5MSCI ACWI ex USA (11.5) (10.8) (14.2) 4.5 0.7 6.6
Barclays U.S. Aggregate 1.6 1.7 0.0 2.1 2.5 3.5Barclays U.S. Government/Credit 1.5 1.5 (0.4) 2.2 2.5 3.5Barclays Intermediate U.S. Gov/Credit 1.7 1.9 0.9 1.7 1.9 2.9Barclays Municipal Bond 1.7 1.5 1.3 2.3 3.8 4.9BofA Merrill Lynch Convertible Securities (9.8) (6.2) 0.7 9.4 7.3 12.7BofA Merrill Lynch High Yield Master (4.7) (2.3) (2.3) 7.3 3.8 11.0JPM GBI-EM Global Ex US 2.1 0.2 (6.2) 5.9 (1.0) 3.5JPM EMBI Global Diversified (1.3) 1.0 (4.3) 5.2 4.8 8.2FTSE World Government Bond Index 1.8 0.1 (0.8) 2.7 0.8 1.5
FTSE Nareit All Equity REITs (6.1) (5.1) (4.1) 4.6 8.3 12.4HFRI Fund of Funds Composite Index (4.4) (4.2) (3.5) 1.5 1.5 3.2Dow UBS Commodity Index (8.6) (10.5) (8.9) 2.5 (8.2) (1.7)

Information contained within this report has been developed solely for the use by the Commonwealth of Virginia Department of the Treasury,its Staff, and Board members. Distribution of this material without the express written consent of Wells Fargo Advisors is strictly prohibited.
I. EDCP: Executive SummaryTotal Extended Duration and Credit Portfolio: The Extended Duration andCredit Portfolio (p. 16-20) gained 1.4% during the fourth quarter whichunderperformed the benchmark by 16 bps. For the fiscal YTD period, the portfoliotrailed by 9 bps (1.6% v. 1.7%) and by 9 bps over the calendar year 0.6% v. 0.7%). Allreturns are net of fees. Over the calendar year, security selection added 7 bps of excessreturn while duration/yield curve positioning added 1 bps. Sector allocation detracted 2bps and other residual factors had minimal impact. Attribution is based on gross returns.
Global fixed income sectors generated mixed returns during the fourth quarter.Sovereign yields declined across most markets amid a spike in equity market volatilityand increasing concerns about slowing global growth. Geopolitical uncertainty remainedelevated despite some seemingly positive developments, including US and China tradetruce, survived confidence vote by UK Prime Minister May, and compromised budgetplan between Italy and the European Union. Corporate bonds underperformed by awide margin, owing to lack of progress on key political issues in Europe and sharp selloffin energy prices. The Japanese yen and the US dollar gained versus most developedmarket currencies. Global monetary policies continued along an incrementally hawkishpath in aggregate during the period. In addition to the Fed raising its target rate by 25bps, the Bank of Canada and Bank of Korea also each hiked rates by 25 bps. The ECBconcluded its asset purchase program but announced it would continue reinvestmentsfor an extended period after the first rate hike, slated for the second half of 2019.
Short Duration Portfolio: The Short Duration Portfolio managed by MerganserCapital Management underperformed the benchmark by 16 bps (1.0% v. 1.2%) overthe fourth quarter. Over the trailing one-year, the portfolio matched the benchmark witha gain of 1.6%. All returns are on a net of fees basis. Security selection added 11 bps ofexcess return over the trailing year while sector allocation added 9 bps. Duration/yieldcurve positioning detracted 5 bps over the same period. Specific security selectionswithin RMBS and CMBS helped performance by 4.1 bps and 3.2 bps, respectively. Anoverweight to Financials and ABS contributed to performance by 3.1 bps and 2.7 bps,respectively. An underweight to Treasuries contributed 1.9 bps of excess return whileyield curve positioning detracted from performance for the period by 4.6 bps. Out ofindex exposure to the 3- to 5-year part of the curve was a drag on performance
Intermediate Duration Portfolio: The Wellington Management portfolio finishedthe quarter with a gain of 1.5% which underperformed the benchmark by 26 bps. Overthe trailing year, the portfolio underperformed the benchmark by 20 bps (0.7% v. 0.9%).Both returns are net of fees. Over the trailing year, sector allocation added 2 bps ofexcess return while security selection detracted 8 bps and duration/yield curvepositioning detracted 3 bps. Portfolio underperformance was due to an overweight to
credit, short duration, and overweight TIPS vs nominal Treasuries. They maintained anoverweight to credit throughout the quarter but continued to prefer securitized sectorswhere valuations and their outlook are more favorable. They were primarily positionedshort duration, which overall had a negative impact on performance as rates fell amid aflight-to-quality. They also positioned the portfolio for rising inflation expectations asthey continued to believe the TIPS market was underpricing inflation expectations. Anallocation to TIPS detracted from results as TIPS underperformed.
The portfolio managed by Income Research + Management (IR+M) fell short of thebenchmark during the quarter by 12 bps with a gain of 1.6%. For the trailing year, theportfolio advanced 0.8% and trailed by 14 bps. From an attribution perspective, durationdetracted 4 bps, sector allocation detracted 13 bps while security selection added 17 bpsover the trailing year. Residual factors combined to add 3 bps. In the corporate market,fundamentals remained healthy, with an estimated earnings growth rate of 12.4%.However, weaker credit sentiment took over in the fourth quarter, and pushedinvestment-grade spreads wider. Issuance decelerated as idiosyncratic headlines andwider spreads kept many issuers on the sidelines. In the face of heightened volatility, thesecuritized market was generally insulated from the corporate market’s weakness.Investors turned to high-quality, shorter duration bonds which broadly helpedsecuritized sectors, particularly ABS, outperform corporates in the fourth quarter.
Long Duration Portfolio: Earnest Partners gained 2.3% during the quarter whichbeat the benchmark by 75 bps. For the trailing one-year, the portfolio outperformed thebenchmark by 95 bps with a gain of 0.2%. Security selection added 77 bps over the year,sector allocation added 43 bps and duration/yield curve positioning added 9 bps. Otherresidual factors combined to detract 7 bps. Rising interest rates was the primaryheadwind encountered by both the portfolio and the benchmark in 2018. Spread sectorswidely underperformed matched duration Treasuries. An overweight to spread sectorswas the largest headwind faced by the portfolio. However, not all spread sectors wereaffected alike. Investment choices across spread sectors combined with security selectionprovided tailwinds for the portfolio. US Credit trailed matched duration Treasuries by -280 bps during the year. A slight underweight to credit, along with a preference to investin less volatile issuers created tailwinds for the portfolio.
Dodge & Cox underperformed the benchmark over the quarter by 25 bps (1.3% v.1.5%) and fell short of the benchmark for the one-year period by 40 bps with a declineof 1.2%. Sector allocation detracted 19 bps and security selection detracted 18 bps overthe trailing year. Duration added 20 bps over the same period.
Page 3

Information contained within this report has been developed solely for the use by the Commonwealth of Virginia Department of the Treasury,its Staff, and Board members. Distribution of this material without the express written consent of Wells Fargo Advisors is strictly prohibited.
Short20%
Interm60%
Long20% Merganser
23%
Goldman0%
IR+M29%
Wellington27%
Dodge & Cox15%
Earnest6%
EDCP: Summary
Page 4Footnote disclosures on next page.
% of Portfolio Market Value 4Q18 FYTD 1 Yr 3 Yr2 5 Yr2 10 Yr2 Inception3
Inception
Benchmark3Average Duration
Average Maturity
Average Quality
100% 1,284,289,316$ TOTAL EDCP 1.4 1.6 0.6 1.7 2.0 3.3 4.9 5.2 4.02 5.12 AA
Target Benchmark 4 1.6 1.7 0.7 1.9 2.2 3.0 4.25 5.33 AA+
23% 294,995,669$ Total Short Duration 1.0 1.5 1.6 1.4 1.2 2.2 4.1 3.9 1.76 1.95 AA+
BC 1-3 Year Gov't/Credit 5 1.2 1.5 1.6 1.4 1.2 1.4 1.84 1.91 AA+23% 294,995,669$ Merganser Capital Management 1.0 1.5 1.6 1.4 1.2 2.2 4.1 3.9 1.76 1.95 AA+
57% 730,114,443$ Total Intermediate Duration6 1.5 1.7 0.7 1.6 2.0 3.4 4.9 5.3 3.89 4.72 AA
Intermediate Duration Benchmark7 1.7 1.9 0.9 1.9 2.2 3.2 4.00 4.61 AA29% 378,808,322$ Income Research + Management 1.6 1.8 0.8 1.6 2.1 3.8 4.6 4.6 3.95 4.77 AA27% 349,722,874$ Wellington Management Co. 1.5 1.7 0.7 1.7 1.9 3.2 5.0 5.3 3.82 4.66 AA
20% 259,179,204$ Total Long Duration8 1.5 1.5 (0.8) 2.3 3.1 4.4 5.7 6.1 6.99 9.86 AA
Long Duration Benchmark 9 1.5 1.4 (0.8) 2.6 3.3 4.2 7.42 10.92 AA15% 187,966,634$ Dodge & Cox 1.3 1.4 (1.2) 2.2 3.0 4.5 5.3 5.5 6.92 10.13 AA6% 71,212,570$ EARNEST Partners 2.3 1.8 0.2 2.3 3.4 4.2 4.6 4.7 7.17 9.14 AA+
Periods Ending December 31, 2018 (Net of Fees)

Information contained within this report has been developed solely for the use by the Commonwealth of Virginia Department of the Treasury,its Staff, and Board members. Distribution of this material without the express written consent of Wells Fargo Advisors is strictly prohibited.
EDCP: Summary1 Returns are reported by JP Morgan Chase and may or may not reconcile exactly with those returns calculated by Wells Fargo Advisors, LLC.2 Annualized3 Total Fund, Merganser and Wellington = 01/95; Dodge & Cox = 04/2000; IR+M = 07/2000; EARNEST = 1/1/06; Goldman = 2/1/074 20% Short, 60% Intermediate and 20% Extended Duration Benchmarks5 Short Duration Target inception through 4/2000: ML 1-3 Year TSY + 20bps, 4/2000 – 7/2005: BC 1-3 Year TSY + 30bps, 7/2005 – 10/2009: BC 1-3 Year TSY + 30bps,11/2009 – 12/2017: BC 1-3 Year Gov’t/Credit +15bps, 1/2018 – Present: BC 1-3 Year Gov’t/Credit6 Total Intermediate Duration includes Western Asset Management which was terminated in the fourth quarter of 2008.7 Intermediate Duration Target inception through 4/00: BC Int. G/C+30bps, 4/00–7/05: BC 3-5 Year TSY+50bps, 7/05–10/09: 85% BC Interm. G/C, 15% BCMBS+50bps, 11/09–12/17: 85% BC Interm. G/C, 15% BC MBS Fixed Rate+25bps, 1/18 – Present: 85% BC Interm. G/C, 15% BC MBS Fixed Rate8 Long Duration Target inception through 4/00: BC Agg+50bps., 4/00–7/05: 50% BC 5-7 TSY, 50% BC 7-10 TSY+50bps, 7/05–10/09: 83% BC Agg, 17% BC LongG/C+ 50bps, 11/09–12/17: 83% BC Agg., 17% BC Long G/C+30bps, 1/18–Present: 83% BC Agg., 17% BC Long G/C9 Total Long Duration includes Aberdeen Asset Management which was terminated in the first quarter of 2010.
Page 5
% of UnrealizedFixed Income Cash Equiv. Market Value Total Pool Cost Value Gain/(Loss)
Merganser 291,895,671 3,099,998 294,995,669 22.97% 296,415,457 (1,419,788) Short Duration Portfolio 291,895,671 3,099,998 294,995,669 22.97% 296,415,457 (1,419,788)
Goldman Sachs 1 1,583,246 1,583,247 0.12% 1,583,247 - IR+M 372,623,121 6,185,201 378,808,322 29.50% 384,584,248 (5,775,927) Wellington 354,239,155 (4,516,281) 349,722,874 27.23% 352,244,694 (2,521,820) Intermediate Duration Portfolio 726,862,277 3,252,166 730,114,443 56.85% 738,412,190 (8,297,747)
Dodge & Cox 184,722,514 3,244,120 187,966,634 14.64% 189,231,672 (1,265,038) EARNEST Partners 68,044,464 3,168,106 71,212,570 5.54% 70,354,535 858,035 Long Duration Portfolio 252,766,978 6,412,226 259,179,204 20.18% 259,586,208 (407,004)
Total EDC Portfolio 1,271,524,926 12,764,390 1,284,289,316 100% 1,294,413,854 (10,124,538) 99.0% 1.0% 100.0%

Information contained within this report has been developed solely for the use by the Commonwealth of Virginia Department of the Treasury,its Staff, and Board members. Distribution of this material without the express written consent of Wells Fargo Advisors is strictly prohibited.
Source: JP Morgan Chase Please note that values include accruals for each account.
Page 6
EDCP: Financial ReconciliationB
y M
anag
erB
y D
ura
tion
Short Duration
Merganser Goldman IR+M Wellington Dodge & CoxEARNEST
Partners EDCP
Market Value (06/30/18) 290,694,590 164,259,130 290,785,194 262,567,214 185,294,645 69,966,241 1,263,567,014
Contributions/Other Receipts 0 117,419 81,366,258 81,381,574 0 0 162,865,251Withdrawals/Other Disbursements 0 (162,747,832) 0 (117,419) 0 0 (162,865,251)Expenses (194,725) (70,186) (219,585) (203,667) (154,651) (89,028) (931,842)Net Cash Flow (194,725) (162,700,599) 81,146,672 81,060,489 (154,651) (89,028) (931,842)
Earned Income 3,368,773 24,716 6,185,697 4,642,660 3,235,573 1,309,963 18,767,383Net Realized Gain/(Loss) (900,151) (3,172,610) (2,766,757) (752,327) (233,885) (166,556) (7,992,287)Change in Unrealized Gain/(Loss) 2,027,182 3,172,610 3,457,516 2,204,838 (175,048) 191,950 10,879,048Total Investment Gain/(Loss) 4,495,804 24,716 6,876,456 6,095,171 2,826,640 1,335,356 21,654,144
Market Value (12/31/18) 294,995,669 1,583,247 378,808,322 349,722,874 187,966,634 71,212,570 1,284,289,316
Intermediate Duration Long Duration
Short Duration EDCPMarket Value (06/30/18) 290,694,590 717,611,538 1,263,567,014
Contributions/Other Receipts 0 162,865,251 162,865,251Withdrawals/Other Disbursements 0 (162,865,251) (162,865,251)Expenses (194,725) (493,438) (931,842)Net Cash Flow (194,725) (493,438) (931,842)
Earned Income 3,368,773 10,853,073 18,767,383Net Realized Gain/(Loss) (900,151) (6,691,695) (7,992,287)Change in Unrealized Gain/(Loss) 2,027,182 8,834,964 10,879,048Total Investment Gain/(Loss) 4,495,804 12,996,343 21,654,144
Market Value (12/31/18) 294,995,669 730,114,443 1,284,289,316
4,161,997
259,179,204
00
(243,679)(243,679)
4,545,536(400,441)
Intermediate Duration Long Duration255,260,886
16,902

Information contained within this report has been developed solely for the use by the Commonwealth of Virginia Department of the Treasury,its Staff, and Board members. Distribution of this material without the express written consent of Wells Fargo Advisors is strictly prohibited.
Zephyr StyleADVISORZephyr StyleADVISOR: Wells Fargo Advisors
Manager vs Zephyr Medium Duration High Credit Universe (Morningstar): Return RankJanuary 1995 - December 2018 (60-Month Moving Windows, Computed Monthly)
Retu
rn R
ank
100%
75%
Median
25%
0%
Dec 1999 Dec 2004 Dec 2009 Dec 2014 Dec 2018
Total Fund (Gross)Total Fund (Net)EDCP Total Fund Benchmark5th to 25th Percentile25th Percentile to MedianMedian to 75th Percentile75th to 95th Percentile
Manager vs Zephyr Medium Duration High Credit Universe (Morningstar): Return RankJanuary 1995 - December 2018 (60-Month Moving Windows, Computed Monthly)
Total Fund (Gross)
Total Fund (Net)
EDCP Total Fund Benchmark
Jul 2001
74 mng
Feb 2003
87 mng
Sep 2004
101 mng
Apr 2006
113 mng
Nov 2007
120 mng
Jun 2009
121 mng
Jan 2011
127 mng
Aug 2012
136 mng
Mar 2014
141 mng
Oct 2015
148 mng
May 2017
152 mng
Dec 2018
162 mng
26.73% 6.03% 33.81% 48.27% 65.53% 53.05% 69.60% 79.05% 68.65% 67.16% 63.33% 67.52%
36.88% 8.69% 48.53% 58.16% 77.18% 58.32% 71.35% 82.98% 70.96% 75.92% 73.03% 76.32%
23.98% 4.02% 28.52% 48.14% 63.54% 27.83% 44.22% 72.00% 83.88% 77.94% 69.01% 66.92%
Zephyr StyleADVISORZephyr StyleADVISOR: Wells Fargo Advisors
Manager vs Benchmark: ReturnJanuary 1995 - December 2018 (not annualized if less than 1 year)
Retu
rn
0
1
2
3
4
5
6
1 quarter 6 months 1 year 3 years 5 years 10 years 24 years
Total Fund (Gross)Total Fund (Net)EDCP Total Fund Benchmark
Manager vs Benchmark: ReturnJanuary 1995 - December 2018 (not annualized if less than 1 year)
Total Fund (Gross)
Total Fund (Net)
EDCP Total Fund Benchmark
1 quarter 6 months 1 year 3 years 5 years 10 years
1.45% 1.71% 0.77% 1.85% 2.16% 3.45%
1.41% 1.64% 0.63% 1.71% 2.01% 3.30%
1.57% 1.73% 0.72% 1.91% 2.18% 3.04%
24 years
5.06%
4.90%
5.17%
EDCP: Performance
Data Sources: Zephyr
Calendar Years Trailing Results
Universe: Rolling Five-Year Results
Zephyr StyleADVISORZephyr StyleADVISOR: Wells Fargo Advisors
Calendar Year ReturnAs of December 2018
-2%
0%
2%
4%
6%
8%
10%
2018 2017 2016 2015 2014 2013 2012 2011 2010 2009 2008 2007 2006 2005
Total Fund (Gross)Total Fund (Net)EDCP Total Fund Benchmark
Total Fund (Gross)
Total Fund (Net)
EDCP Total Fund Benchmark
2018 2017 2016 2015 2014 2013 2012 2011 2010 2009 2008 2007 2006 2005
0.77% 2.58% 2.22% 1.12% 4.15% -0.85% 4.88% 5.95% 5.86% 8.14% 1.53% 6.56% 4.49% 2.32%
0.63% 2.44% 2.07% 0.97% 4.00% -1.00% 4.74% 5.81% 5.73% 7.98% 1.38% 6.42% 4.31% 2.18%
0.72% 2.66% 2.37% 1.04% 4.15% -0.84% 3.72% 6.12% 5.75% 4.89% 6.39% 7.74% 4.63% 2.02%
Page 7
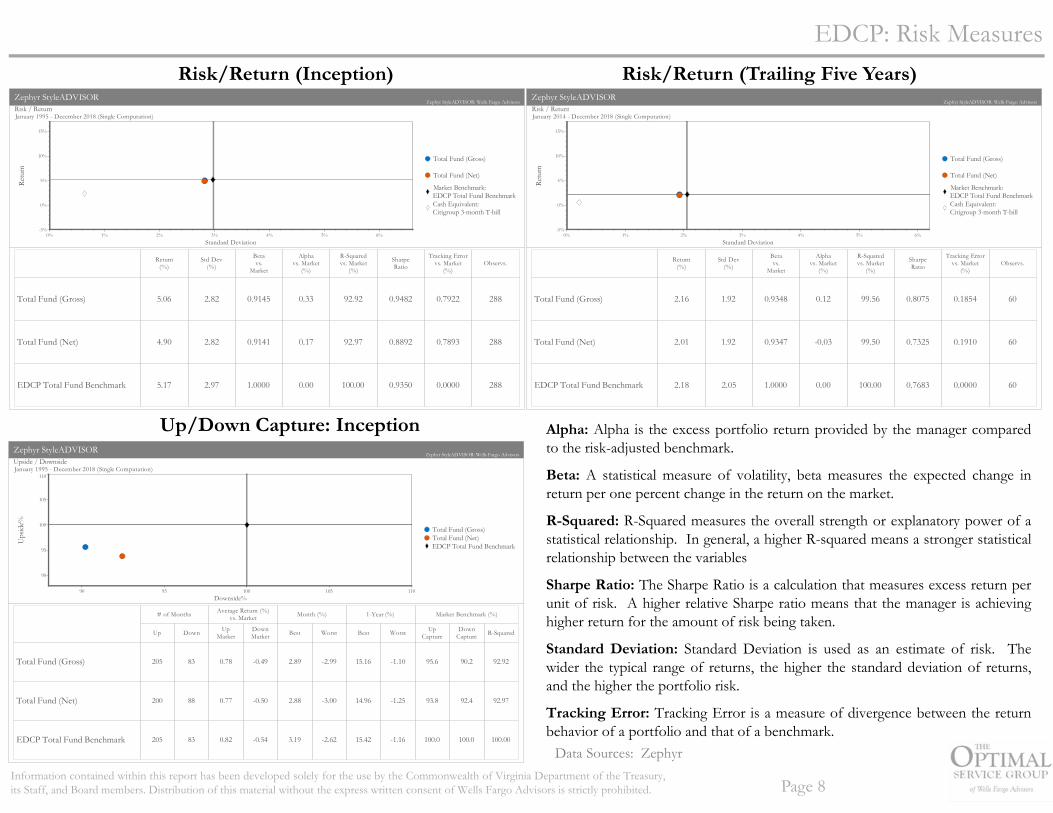
Information contained within this report has been developed solely for the use by the Commonwealth of Virginia Department of the Treasury,its Staff, and Board members. Distribution of this material without the express written consent of Wells Fargo Advisors is strictly prohibited.
Zephyr StyleADVISORZephyr StyleADVISOR: Wells Fargo Advisors
Upside / DownsideJanuary 1995 - December 2018 (Single Computation)
Ups
ide%
90
95
100
105
110
Downside%90 95 100 105 110
Total Fund (Gross)Total Fund (Net)EDCP Total Fund Benchmark
# of Months Average Return (%)vs. Market Month (%) 1-Year (%) Market Benchmark (%)
Total Fund (Gross)
Total Fund (Net)
EDCP Total Fund Benchmark
Up Down UpMarket
DownMarket Best Worst Best Worst Up
CaptureDown
Capture R-Squared
205 83 0.78 -0.49 2.89 -2.99 15.16 -1.10 95.6 90.2 92.92
200 88 0.77 -0.50 2.88 -3.00 14.96 -1.25 93.8 92.4 92.97
205 83 0.82 -0.54 3.19 -2.62 15.42 -1.16 100.0 100.0 100.00
Zephyr StyleADVISORZephyr StyleADVISOR: Wells Fargo Advisors
Risk / ReturnJanuary 1995 - December 2018 (Single Computation)
Retu
rn
-5%
0%
5%
10%
15%
Standard Deviation0% 1% 2% 3% 4% 5% 6%
Total Fund (Gross)
Total Fund (Net)
Market Benchmark:EDCP Total Fund BenchmarkCash Equivalent:Citigroup 3-month T-bill
Total Fund (Gross)
Total Fund (Net)
EDCP Total Fund Benchmark
Return(%)
Std Dev(%)
Betavs.
Market
Alphavs. Market
(%)
R-Squaredvs. Market
(%)
SharpeRatio
Tracking Errorvs. Market
(%)Observs.
5.06 2.82 0.9145 0.33 92.92 0.9482 0.7922 288
4.90 2.82 0.9141 0.17 92.97 0.8892 0.7893 288
5.17 2.97 1.0000 0.00 100.00 0.9350 0.0000 288
Zephyr StyleADVISORZephyr StyleADVISOR: Wells Fargo Advisors
Risk / ReturnJanuary 2014 - December 2018 (Single Computation)
Retu
rn
-5%
0%
5%
10%
15%
Standard Deviation0% 1% 2% 3% 4% 5% 6%
Total Fund (Gross)
Total Fund (Net)
Market Benchmark:EDCP Total Fund BenchmarkCash Equivalent:Citigroup 3-month T-bill
Total Fund (Gross)
Total Fund (Net)
EDCP Total Fund Benchmark
Return(%)
Std Dev(%)
Betavs.
Market
Alphavs. Market
(%)
R-Squaredvs. Market
(%)
SharpeRatio
Tracking Errorvs. Market
(%)Observs.
2.16 1.92 0.9348 0.12 99.56 0.8075 0.1854 60
2.01 1.92 0.9347 -0.03 99.50 0.7325 0.1910 60
2.18 2.05 1.0000 0.00 100.00 0.7683 0.0000 60
EDCP: Risk Measures
Data Sources: Zephyr
Risk/Return (Inception) Risk/Return (Trailing Five Years)
Up/Down Capture: Inception Alpha: Alpha is the excess portfolio return provided by the manager comparedto the risk-adjusted benchmark.
Beta: A statistical measure of volatility, beta measures the expected change inreturn per one percent change in the return on the market.
R-Squared: R-Squared measures the overall strength or explanatory power of astatistical relationship. In general, a higher R-squared means a stronger statisticalrelationship between the variables
Sharpe Ratio: The Sharpe Ratio is a calculation that measures excess return perunit of risk. A higher relative Sharpe ratio means that the manager is achievinghigher return for the amount of risk being taken.
Standard Deviation: Standard Deviation is used as an estimate of risk. Thewider the typical range of returns, the higher the standard deviation of returns,and the higher the portfolio risk.
Tracking Error: Tracking Error is a measure of divergence between the returnbehavior of a portfolio and that of a benchmark.
Page 8

Information contained within this report has been developed solely for the use by the Commonwealth of Virginia Department of the Treasury,its Staff, and Board members. Distribution of this material without the express written consent of Wells Fargo Advisors is strictly prohibited.
EDCP: Risk Measures
Data Sources: Zephyr
Multi-Statistic: Inception
Zephyr StyleADVISORZephyr StyleADVISOR: Wells Fargo Advisors
Manager vs Benchmark: Multi-StatisticJanuary 1995 - December 2018 (not annualized if less than 1 year)
Shar
pe R
atio
-0.50
0.00
0.50
1.00
1.50
1 year 3 years 5 years 10 years 24 years
Total Fund (Gross)Total Fund (Net)EDCP Total Fund Benchmark
Sorti
no R
atio
(MA
R =
Cas
h E
q.)
-1.00
-0.50
0.00
0.50
1.00
1.50
2.00
2.503.00
1 year 3 years 5 years 10 years 24 years
Total Fund (Gross)Total Fund (Net)EDCP Total Fund Benchmark
Info
rmat
ion
Ratio
-1.00
-0.50
0.00
0.50
1.00
1 year 3 years 5 years 10 years 24 years
Total Fund (Gross)Total Fund (Net)EDCP Total Fund Benchmark
Sharpe Ratio: The SharpeRatio is a calculation thatmeasures excess return per unitof risk. A higher relativeSharpe ratio means that themanager is achieving higherreturn for the amount of riskbeing taken.
Sortino Ratio: The SortinoRatio is a modification of theSharpe Ratio that differentiatesharmful volatility from generalvolatility by taking into accountthe standard deviation ofnegative returns, calleddownside deviation. A largeSortino Ratio indicates there isa low probability of a large loss.
Information Ratio: Ameasurement of the value amanager adds against anindexed benchmark. It iscalculated by taking themanager's excess return overthe benchmark, and dividing itby the tracking error. It is usedto measure active management.
Page 9

Information contained within this report has been developed solely for the use by the Commonwealth of Virginia Department of the Treasury,its Staff, and Board members. Distribution of this material without the express written consent of Wells Fargo Advisors is strictly prohibited.
EDCP: Attribution/Characteristics
Page 10
Average Duration (yrs)
Average Maturity (yrs)
Average Quality Average YTM
Weighted Avg Cpn Convexity
Tracking Error
Short Duration Portfolio 1.76 1.95 AA+ 2.99 2.52 0.03 0.16
Intermediate Duration Portfolio 3.89 4.72 AA 3.19 3.00 0.02 0.31
Long Duration Portfolio 6.99 9.86 AA 3.55 3.84 0.52 0.51
Total EDCP 4.02 5.12 AA 3.21 3.06 0.13 0.32
Benchmark 4.25 5.33 AA+ 3.06 2.85 0.14 0.00
Difference (0.23) (0.21) 0.15 0.21 (0.02) 0.32
Policy Duration Target 4.25 Policy Duration Range 3.83 - 4.68
As of December 31, 2018
Total Portfolio 1Q18 2Q18 3Q18 4Q18
Gross Return (0.96) 0.03 0.26 1.45 0.77Benchmark Return (0.99) 0.01 0.15 1.57 0.72Alpha 0.03 0.02 0.11 (0.12) 0.05
Country 0.00 0.00 0.00 0.00 0.00Allocation (0.02) 0.02 0.08 (0.10) (0.02)Security Selection 0.04 0.03 (0.01) 0.02 0.07Duration/Yield Curve 0.01 (0.01) 0.03 (0.02) 0.01Intraday Trans/Pricing/Residual (0.00) (0.01) 0.00 0.00 (0.00)Other 0.00 (0.01) 0.01 (0.02) (0.02)
Rolling 1-Year

Information contained within this report has been developed solely for the use by the Commonwealth of Virginia Department of the Treasury,its Staff, and Board members. Distribution of this material without the express written consent of Wells Fargo Advisors is strictly prohibited.
EDCP: Characteristics
Page 11
Short Intermediate Long Policy Over/(Under)Sector Allocation Duration Duration Duration Max. Bench vs. BenchU.S. Treasury/Agency 26.7 37.2 34.4 34.2 100.0 54.1 (20.0)Corporates 37.5 32.0 27.4 32.4 50.0 29.0 3.4Mortgage-Backed 4.8 15.7 26.7 15.4 44.0 13.3 2.2Asset-Backed 19.1 7.0 0.0 8.4 12.0 0.1 8.3CMBS 9.8 5.8 3.3 6.2 10.0 0.3 5.9CMO 1.6 0.7 3.4 1.4 10.0 0.0 1.4 PACs 0.0 0.0 0.0 0.0 20.0 0.0 0.0Cash Equiv. 0.6 0.5 1.7 0.8 10.0 0.0 0.8Other 0.0 1.2 3.1 1.3 3.2 (1.9)
100.0 100.0 100.0 100.0 100.0
MBS, CMBS, CMO, PAC 16.1 22.1 33.4 23.0 50.0
Short Intermediate Long Quality Distribution Duration Duration Duration BenchTreasury/Agency 31.4 38.5 66.7 42.6 58.3Aaa 31.1 28.9 1.5 23.8 13.2Aa 6.5 2.6 4.8 3.9 3.6A 24.6 20.5 17.5 20.8 11.0Baa 6.4 9.6 9.5 8.8 13.9Other 0.0 0.0 0.0 0.0 0.0
100.0 100.0 100.0 100.0 100.0
Total EDCP
Total EDCP
As of December 31, 2018
0.39.9(5.1)0.0
Over/UnderWeight(15.7)10.6

Information contained within this report has been developed solely for the use by the Commonwealth of Virginia Department of the Treasury,its Staff, and Board members. Distribution of this material without the express written consent of Wells Fargo Advisors is strictly prohibited.
This page intentionally left blank.
Page 12

Information contained within this report has been developed solely for the use by the Commonwealth of Virginia Department of the Treasury,its Staff, and Board members. Distribution of this material without the express written consent of Wells Fargo Advisors is strictly prohibited.
Zephyr StyleADVISORZephyr StyleADVISOR: Wells Fargo Advisors
Manager vs Zephyr Short Duration High Credit (Morningstar): Return RankJanuary 1995 - December 2018 (60-Month Moving Windows, Computed Monthly)
Retu
rn R
ank
100%
75%
Median
25%
0%
Dec 1999 Dec 2004 Dec 2009 Dec 2014 Dec 2018
Merganser (Gross)Merganser (Net)BC 1-3 Year Gov't/Credit +15bps5th to 25th Percentile25th Percentile to MedianMedian to 75th Percentile75th to 95th Percentile
Manager vs Zephyr Short Duration High Credit (Morningstar): Return RankJanuary 1995 - December 2018 (60-Month Moving Windows, Computed Monthly)
Merganser (Gross)
Merganser (Net)
BC 1-3 Year Gov't/Credit +15bps
Jul 2001
49 mng
Feb 2003
53 mng
Sep 2004
55 mng
Apr 2006
59 mng
Nov 2007
63 mng
Jun 2009
67 mng
Jan 2011
69 mng
Aug 2012
74 mng
Mar 2014
76 mng
Oct 2015
79 mng
May 2017
83 mng
Dec 2018
94 mng
12.88% 5.60% 26.27% 24.33% 33.90% 9.08% 27.45% 34.35% 62.51% 40.82% 35.95% 36.66%
25.59% 9.73% 33.47% 31.43% 37.82% 15.00% 32.53% 38.48% 69.14% 51.68% 45.21% 45.62%
22.67% 11.05% 41.66% 40.62% 35.33% 18.20% 35.27% 61.15% 85.47% 63.31% 52.92% 48.75%
Zephyr StyleADVISORZephyr StyleADVISOR: Wells Fargo Advisors
Manager vs Benchmark: ReturnJanuary 1995 - December 2018 (not annualized if less than 1 year)
Retu
rn
0
0.5
1
1.5
2
2.5
3
3.5
44.5
1 quarter 6 months 1 year 3 years 5 years 10 years 24 years
Merganser (Gross)Merganser (Net)BC 1-3 Year Gov't/Credit +15bps
Manager vs Benchmark: ReturnJanuary 1995 - December 2018 (not annualized if less than 1 year)
Merganser (Gross)
Merganser (Net)
BC 1-3 Year Gov't/Credit +15bps
1 quarter 6 months 1 year 3 years 5 years 10 years
1.06% 1.55% 1.76% 1.55% 1.34% 2.29%
1.02% 1.48% 1.62% 1.41% 1.20% 2.15%
1.18% 1.52% 1.61% 1.35% 1.15% 1.40%
24 years
4.25%
4.08%
3.92%
II. EDCP: Short Duration Performance
Data Sources: Zephyr
Calendar Years Trailing Results
Universe: Rolling Five-Year Results
Zephyr StyleADVISORZephyr StyleADVISOR: Wells Fargo Advisors
Calendar Year ReturnAs of December 2018
0%
1%
2%
3%
4%
5%
6%
7%
8%
2018 2017 2016 2015 2014 2013 2012 2011 2010 2009 2008 2007 2006 2005
Merganser (Gross)Merganser (Net)BC 1-3 Year Gov't/Credit +15bps
Merganser (Gross)
Merganser (Net)
BC 1-3 Year Gov't/Credit +15bps
2018 2017 2016 2015 2014 2013 2012 2011 2010 2009 2008 2007 2006 2005
1.76% 1.30% 1.59% 0.91% 1.15% 0.66% 2.51% 2.03% 3.50% 7.67% 3.51% 6.12% 4.79% 2.25%
1.62% 1.16% 1.45% 0.76% 1.00% 0.52% 2.36% 1.88% 3.39% 7.51% 3.38% 5.97% 4.66% 2.13%
1.61% 1.00% 1.44% 0.81% 0.92% 0.80% 1.41% 1.74% 2.95% 1.31% 6.97% 7.64% 4.24% 1.93%
Page 13
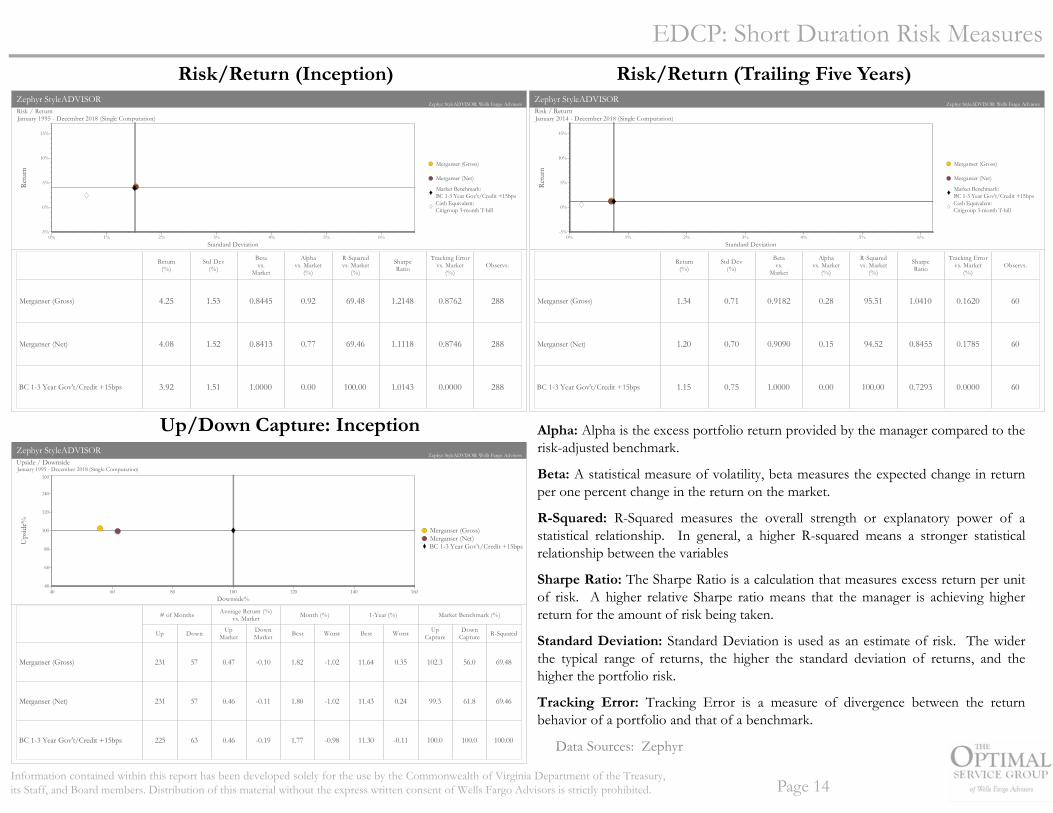
Information contained within this report has been developed solely for the use by the Commonwealth of Virginia Department of the Treasury,its Staff, and Board members. Distribution of this material without the express written consent of Wells Fargo Advisors is strictly prohibited.
Zephyr StyleADVISORZephyr StyleADVISOR: Wells Fargo Advisors
Upside / DownsideJanuary 1995 - December 2018 (Single Computation)
Ups
ide%
40
60
80
100
120
140
160
Downside%40 60 80 100 120 140 160
Merganser (Gross)Merganser (Net)BC 1-3 Year Gov't/Credit +15bps
# of Months Average Return (%)vs. Market Month (%) 1-Year (%) Market Benchmark (%)
Merganser (Gross)
Merganser (Net)
BC 1-3 Year Gov't/Credit +15bps
Up Down UpMarket
DownMarket Best Worst Best Worst Up
CaptureDown
Capture R-Squared
231 57 0.47 -0.10 1.82 -1.02 11.64 0.35 102.3 56.0 69.48
231 57 0.46 -0.11 1.80 -1.02 11.43 0.24 99.3 61.8 69.46
225 63 0.46 -0.19 1.77 -0.98 11.30 -0.11 100.0 100.0 100.00
Zephyr StyleADVISORZephyr StyleADVISOR: Wells Fargo Advisors
Risk / ReturnJanuary 2014 - December 2018 (Single Computation)
Retu
rn
-5%
0%
5%
10%
15%
Standard Deviation0% 1% 2% 3% 4% 5% 6%
Merganser (Gross)
Merganser (Net)
Market Benchmark:BC 1-3 Year Gov't/Credit +15bpsCash Equivalent:Citigroup 3-month T-bill
Merganser (Gross)
Merganser (Net)
BC 1-3 Year Gov't/Credit +15bps
Return(%)
Std Dev(%)
Betavs.
Market
Alphavs. Market
(%)
R-Squaredvs. Market
(%)
SharpeRatio
Tracking Errorvs. Market
(%)Observs.
1.34 0.71 0.9182 0.28 95.51 1.0410 0.1620 60
1.20 0.70 0.9090 0.15 94.52 0.8455 0.1785 60
1.15 0.75 1.0000 0.00 100.00 0.7293 0.0000 60
Zephyr StyleADVISORZephyr StyleADVISOR: Wells Fargo Advisors
Risk / ReturnJanuary 1995 - December 2018 (Single Computation)
Retu
rn
-5%
0%
5%
10%
15%
Standard Deviation0% 1% 2% 3% 4% 5% 6%
Merganser (Gross)
Merganser (Net)
Market Benchmark:BC 1-3 Year Gov't/Credit +15bpsCash Equivalent:Citigroup 3-month T-bill
Merganser (Gross)
Merganser (Net)
BC 1-3 Year Gov't/Credit +15bps
Return(%)
Std Dev(%)
Betavs.
Market
Alphavs. Market
(%)
R-Squaredvs. Market
(%)
SharpeRatio
Tracking Errorvs. Market
(%)Observs.
4.25 1.53 0.8445 0.92 69.48 1.2148 0.8762 288
4.08 1.52 0.8413 0.77 69.46 1.1118 0.8746 288
3.92 1.51 1.0000 0.00 100.00 1.0143 0.0000 288
EDCP: Short Duration Risk Measures
Data Sources: Zephyr
Risk/Return (Inception) Risk/Return (Trailing Five Years)
Up/Down Capture: Inception Alpha: Alpha is the excess portfolio return provided by the manager compared to therisk-adjusted benchmark.
Beta: A statistical measure of volatility, beta measures the expected change in returnper one percent change in the return on the market.
R-Squared: R-Squared measures the overall strength or explanatory power of astatistical relationship. In general, a higher R-squared means a stronger statisticalrelationship between the variables
Sharpe Ratio: The Sharpe Ratio is a calculation that measures excess return per unitof risk. A higher relative Sharpe ratio means that the manager is achieving higherreturn for the amount of risk being taken.
Standard Deviation: Standard Deviation is used as an estimate of risk. The widerthe typical range of returns, the higher the standard deviation of returns, and thehigher the portfolio risk.
Tracking Error: Tracking Error is a measure of divergence between the returnbehavior of a portfolio and that of a benchmark.
Page 14

Information contained within this report has been developed solely for the use by the Commonwealth of Virginia Department of the Treasury,its Staff, and Board members. Distribution of this material without the express written consent of Wells Fargo Advisors is strictly prohibited.
EDCP: Short Duration Risk Measures
Data Sources: Zephyr
Multi-Statistic: Inception
Zephyr StyleADVISORZephyr StyleADVISOR: Wells Fargo Advisors
Manager vs Benchmark: Multi-StatisticJanuary 1995 - December 2018 (not annualized if less than 1 year)
Shar
pe R
atio
-0.50
0.00
0.50
1.00
1.50
2.00
1 year 3 years 5 years 10 years 24 years
Merganser (Gross)Merganser (Net)BC 1-3 Year Gov't/Credit +15bps
Sorti
no R
atio
(MA
R =
Cas
h E
q.)
-1.00
0.00
1.00
2.00
3.00
4.00
5.00
6.00
1 year 3 years 5 years 10 years 24 years
Merganser (Gross)Merganser (Net)BC 1-3 Year Gov't/Credit +15bps
Info
rmat
ion
Ratio
0.00
0.20
0.40
0.60
0.80
1.00
1.201.40
1 year 3 years 5 years 10 years 24 years
Merganser (Gross)Merganser (Net)BC 1-3 Year Gov't/Credit +15bps
Page 15
Sharpe Ratio: The SharpeRatio is a calculation thatmeasures excess return per unitof risk. A higher relativeSharpe ratio means that themanager is achieving higherreturn for the amount of riskbeing taken.
Sortino Ratio: The SortinoRatio is a modification of theSharpe Ratio that differentiatesharmful volatility from generalvolatility by taking into accountthe standard deviation ofnegative returns, calleddownside deviation. A largeSortino Ratio indicates there isa low probability of a large loss.
Information Ratio: Ameasurement of the value amanager adds against anindexed benchmark. It iscalculated by taking themanager's excess return overthe benchmark, and dividing itby the tracking error. It is usedto measure active management.

Information contained within this report has been developed solely for the use by the Commonwealth of Virginia Department of the Treasury,its Staff, and Board members. Distribution of this material without the express written consent of Wells Fargo Advisors is strictly prohibited.
EDCP: Short Duration Characteristics
Data Sources: Merganser, Barclays
Page 16
Average Duration (yrs)
Effective Maturity (yrs)
Average Quality
Average YTM
Weighted Avg Cpn Convexity
Tracking Error (5y)
Merganser 1.76 1.95 AA+ 2.99 2.52 0.03 0.16
Short Duration Portfolio 1.76 1.95 AA+ 2.99 2.52 0.03 0.16
Benchmark 1.84 1.91 AA+ 2.75 2.38 0.05 n/a
Difference (0.08) 0.04 0.24 0.14 (0.02)
Policy Duration Target 1.84 Policy Duration Range 1.66 - 2.02
As of December 31, 2018
MerganserQuarterly Attribution 1Q18 2Q18 3Q18 4Q18
Gross Return (0.22) 0.43 0.48 1.06 1.76Benchmark Return (0.19) 0.28 0.33 1.18 1.61Alpha (0.03) 0.15 0.15 (0.12) 0.15
Country 0.00 0.00 0.00 0.00 0.00Allocation (0.06) 0.13 0.17 (0.15) 0.09Security Selection 0.04 0.09 (0.05) 0.02 0.11Duration/Yield Curve (0.00) (0.08) 0.02 0.01 (0.05)Intraday Trans/Pricing/Residu 0.00 0.00 0.00 0.00 0.00Other (0.01) 0.01 0.00 (0.01) (0.01)
Rolling 1-Year

Information contained within this report has been developed solely for the use by the Commonwealth of Virginia Department of the Treasury,its Staff, and Board members. Distribution of this material without the express written consent of Wells Fargo Advisors is strictly prohibited.
EDCP: Short Duration Characteristics
Data Sources: Merganser, Barclays
Page 17
US Treasury 10.62%US Treasury 10.41%US Treasury 1.78%Chase Issuance Trust 1.45%Morgan Stanley 1.27%Svenska Handelsbanken 1.11%BB&T Corp 1.09%AmEx Master Trust 1.09%Bank of America 1.02%Federal Home Loan Bank 1.02%
Morgan Stanley 1.27%Svenska Handelsbanken 1.11%BB&T Corp 1.09%Bank of America 1.02%The Goldman Sachs Group 1.00%Citigroup Inc 0.99%HSBC USA Inc 0.98%UBS AG 0.97%GM Financial 0.95%Cisco Systems Inc 0.95%
Top 10 Overall Holdings
Top 10 Corporate Holdings
Policy Over/(Under)Sector Allocation Merganser Max. Bench (vs Bench)U.S. Treasury/Agency 26.7 100.0 68.7 (42.0)Corporates 37.5 50.0 31.3 6.2Mortgage-Backed 4.8 20.0 0.0 4.8Asset-Backed 19.1 20.0 0.0 19.1CMBS 9.8 10.0 0.0 9.8CMOs 1.6 10.0 0.0 1.6 PACs 0.0 20.0 0.0 0.0Cash Equiv. 0.6 10.0 0.0 0.6Other 0.0 0.0 0.0
100.0 100.0
MBS, CMBS, CMO, PAC 16.1 60.0
Quality Distribution Merganser BenchTreasury/Agency 31.4 68.8Aaa 31.1 5.6Aa 6.5 4.7A 24.6 10.3Baa 6.4 10.7Other 0.0 0.0
100.0 100.0
(4.4)
Over/UnderWeight
0.0
As of December 31, 2018
(37.3)25.51.8
14.4

Information contained within this report has been developed solely for the use by the Commonwealth of Virginia Department of the Treasury,its Staff, and Board members. Distribution of this material without the express written consent of Wells Fargo Advisors is strictly prohibited.
Zephyr StyleADVISORZephyr StyleADVISOR: Wells Fargo Advisors
Manager vs Benchmark: ReturnJanuary 1995 - December 2018 (not annualized if less than 1 year)
Retu
rn
0
1
2
3
4
5
6
1 quarter 6 months 1 year 3 years 5 years 10 years 24 years
Income Research (Net)Wellington (Net)85% BCIGC/15% BCMBS +25bps
Manager vs Benchmark: ReturnJanuary 1995 - December 2018 (not annualized if less than 1 year)
Income Research (Net)
Wellington (Net)
85% BCIGC/15% BCMBS +25bps
1 quarter 6 months 1 year 3 years 5 years 10 years
1.60% 1.79% 0.78% 1.60% 2.09% 3.83%
1.46% 1.71% 0.72% 1.74% 1.92% 3.24%
1.72% 1.89% 0.92% 1.86% 2.16% 3.19%
24 years
N/A
4.99%
5.26%
Zephyr StyleADVISOR Zephyr StyleADVISOR: Wells Fargo AdvisorsManager vs Zephyr Medium Duration High Credit Universe (Morningstar): Return RankJanuary 1995 - December 2018 (36-Month Moving Windows, Computed Monthly)
Retu
rn R
ank
100%
75%
Median
25%
0%
Dec 1997 Dec 1999 Dec 2004 Dec 2009 Dec 2014 Dec 2018
Income Research (Net)Wellington (Net)85% BCIGC/15% BCMBS +25bps5th to 25th Percentile25th Percentile to MedianMedian to 75th Percentile75th to 95th Percentile
Manager vs Zephyr Medium Duration High Credit Universe (Morningstar): Return RankJanuary 1995 - December 2018 (36-Month Moving Windows, Computed Monthly)
Income Research (Net)
Wellington (Net)
85% BCIGC/15% BCMBS +25bps
Sep 1999
74 mng
Jun 2001
89 mng
Mar 2003
103 mng
Dec 2004
117 mng
Sep 2006
120 mng
Jun 2008
123 mng
Mar 2010
135 mng
Dec 2011
140 mng
Sep 2013
148 mng
Jun 2015
152 mng
Mar 2017
163 mng
Dec 2018
172 mng
N/A N/A N/A 63.88% 76.38% 16.08% 35.15% 51.97% 52.83% 59.72% 68.61% 74.50%
27.90% 9.97% 18.82% 80.88% 86.62% 16.19% 58.21% 80.50% 65.72% 69.33% 83.92% 64.99%
25.70% 6.97% 6.44% 51.62% 90.20% 4.09% 31.22% 85.64% 66.01% 56.78% 67.45% 54.83%
EDCP: Intermediate Duration Performance
Data Sources: Zephyr
Calendar Years Trailing Results
Universe: Rolling Three-Year Results
Zephyr StyleADVISORZephyr StyleADVISOR: Wells Fargo Advisors
Calendar Year ReturnAs of December 2018
-2%
0%
2%
4%
6%
8%
10%
12%
2018 2017 2016 2015 2014 2013 2012 2011 2010 2009 2008 2007 2006 2005
Income Research (Net)Wellington (Net)85% BCIGC/15% BCMBS +25bps
Income Research (Net)
Wellington (Net)
85% BCIGC/15% BCMBS +25bps
2018 2017 2016 2015 2014 2013 2012 2011 2010 2009 2008 2007 2006 2005
0.78% 2.22% 1.82% 1.69% 3.99% -1.35% 5.24% 6.55% 5.98% 11.99% 1.10% 6.63% 4.22% 2.67%
0.72% 2.29% 2.21% 0.93% 3.47% -0.82% 4.59% 5.87% 6.29% 7.11% 3.35% 6.82% 4.32% 2.07%
0.92% 2.43% 2.24% 1.39% 3.83% -0.70% 3.96% 6.14% 6.10% 5.81% 6.14% 7.88% 4.76% 1.70%
Page 18
Zephyr StyleADVISORZephyr StyleADVISOR: Wells Fargo Advisors
Manager vs Zephyr Medium Duration High Credit Universe (Morningstar): Return RankJanuary 1995 - December 2018 (36-Month Moving Windows, Computed Monthly)
Retu
rn R
ank
100%
75%
Median
25%
0%
Dec 1997 Dec 1999 Dec 2004 Dec 2009 Dec 2014 Dec 2018
Income Research (Net)Wellington (Net)85% BCIGC/15% BCMBS +25bps5th to 25th Percentile25th Percentile to MedianMedian to 75th Percentile75th to 95th Percentile
Manager vs Zephyr Medium Duration High Credit Universe (Morningstar): Return RankJanuary 1995 - December 2018 (36-Month Moving Windows, Computed Monthly)
Income Research (Net)
Wellington (Net)
85% BCIGC/15% BCMBS +25bps
Sep 1999
74 mng
Jun 2001
89 mng
Mar 2003
103 mng
Dec 2004
117 mng
Sep 2006
120 mng
Jun 2008
123 mng
Mar 2010
135 mng
Dec 2011
140 mng
Sep 2013
148 mng
Jun 2015
152 mng
Mar 2017
163 mng
Dec 2018
172 mng
N/A N/A N/A 63.88% 76.38% 16.08% 35.15% 51.97% 52.83% 59.72% 68.61% 74.50%
27.90% 9.97% 18.82% 80.88% 86.62% 16.19% 58.21% 80.50% 65.72% 69.33% 83.92% 64.99%
25.70% 6.97% 6.44% 51.62% 90.20% 4.09% 31.22% 85.64% 66.01% 56.78% 67.45% 54.83%

Information contained within this report has been developed solely for the use by the Commonwealth of Virginia Department of the Treasury,its Staff, and Board members. Distribution of this material without the express written consent of Wells Fargo Advisors is strictly prohibited.
Zephyr StyleADVISORZephyr StyleADVISOR: Wells Fargo Advisors
Upside / DownsideJuly 2000 - December 2018 (Single Computation)
Ups
ide%
85
90
95
100
105
110
115
120
Downside%85 90 95 100 105 110 115 120
Income Research (Net)Wellington (Net)85% BCIGC/15% BCMBS +25bps
# of Months Average Return (%)vs. Market Month (%) 1-Year (%) Market Benchmark (%)
Income Research (Net)
Wellington (Net)
85% BCIGC/15% BCMBS +25bps
Up Down UpMarket
DownMarket Best Worst Best Worst Up
CaptureDown
Capture R-Squared
157 65 0.78 -0.49 3.44 -3.80 17.71 -2.07 93.9 85.6 83.03
154 68 0.78 -0.56 2.80 -3.31 14.42 -1.42 94.6 97.9 95.59
152 70 0.82 -0.58 3.45 -2.78 15.07 -1.20 100.0 100.0 100.00
Zephyr StyleADVISORZephyr StyleADVISOR: Wells Fargo Advisors
Risk / ReturnJanuary 2014 - December 2018 (Single Computation)
Retu
rn
-5%
0%
5%
10%
15%
Standard Deviation0% 1% 2% 3% 4% 5% 6%
Income Research (Net)
Wellington (Net)
Market Benchmark:85% BCIGC/15% BCMBS +25bpsCash Equivalent:Citigroup 3-month T-bill
Income Research (Net)
Wellington (Net)
85% BCIGC/15% BCMBS +25bps
Return(%)
Std Dev(%)
Betavs.
Market
Alphavs. Market
(%)
R-Squaredvs. Market
(%)
SharpeRatio
Tracking Errorvs. Market
(%)Observs.
2.09 1.93 0.9364 0.07 98.16 0.7725 0.2918 60
1.92 1.97 0.9577 -0.14 98.07 0.6663 0.2875 60
2.16 2.04 1.0000 0.00 100.00 0.7604 0.0000 60
Zephyr StyleADVISORZephyr StyleADVISOR: Wells Fargo Advisors
Risk / ReturnJuly 2000 - December 2018 (Single Computation)
Retu
rn
-5%
0%
5%
10%
15%
Standard Deviation0% 1% 2% 3% 4% 5% 6%
Income Research (Net)
Wellington (Net)
Market Benchmark:85% BCIGC/15% BCMBS +25bpsCash Equivalent:Citigroup 3-month T-bill
Income Research (Net)
Wellington (Net)
85% BCIGC/15% BCMBS +25bps
Return(%)
Std Dev(%)
Betavs.
Market
Alphavs. Market
(%)
R-Squaredvs. Market
(%)
SharpeRatio Observs.
4.56 3.00 0.8722 0.52 83.03 1.0026 222
4.32 2.98 0.9306 0.01 95.59 0.9269 222
4.63 3.13 1.0000 0.00 100.00 0.9816 222
EDCP: Intermediate Duration Risk Measures
Data Sources: Zephyr
Risk/Return (From July 2000) Risk/Return (Trailing Five Years)
Up/Down Capture: Inception
Alpha: Alpha is the excess portfolio return provided by the manager comparedto the risk-adjusted benchmark.Beta: A statistical measure of volatility, beta measures the expected change inreturn per one percent change in the return on the market.R-Squared: R-Squared measures the overall strength or explanatory power of astatistical relationship. In general, a higher R-squared means a stronger statisticalrelationship between the variablesSharpe Ratio: The Sharpe Ratio is a calculation that measures excess return perunit of risk. A higher relative Sharpe ratio means that the manager is achievinghigher return for the amount of risk being taken.Standard Deviation: Standard Deviation is used as an estimate of risk. Thewider the typical range of returns, the higher the standard deviation of returns,and the higher the portfolio risk.Tracking Error: Tracking Error is a measure of divergence between the returnbehavior of a portfolio and that of a benchmark.
Page 19

Information contained within this report has been developed solely for the use by the Commonwealth of Virginia Department of the Treasury,its Staff, and Board members. Distribution of this material without the express written consent of Wells Fargo Advisors is strictly prohibited.
EDCP: Intermediate Duration Risk Measures
Data Sources: Zephyr
Multi-Statistic: Inception
Zephyr StyleADVISORZephyr StyleADVISOR: Wells Fargo Advisors
Manager vs Benchmark: Multi-StatisticJanuary 1995 - December 2018 (not annualized if less than 1 year)
Shar
pe R
atio
-0.50
0.00
0.50
1.00
1.50
1 year 3 years 5 years 10 years 24 years
Income Research (Net)Wellington (Net)85% BCIGC/15% BCMBS +25bps
Sorti
no R
atio
(MA
R =
Cas
h E
q.)
-1.00
-0.50
0.00
0.50
1.00
1.50
2.00
2.503.00
1 year 3 years 5 years 10 years 24 years
Income Research (Net)Wellington (Net)85% BCIGC/15% BCMBS +25bps
Info
rmat
ion
Ratio
-1.50
-1.00
-0.50
0.00
0.50
1.00
1 year 3 years 5 years 10 years 24 years
Income Research (Net)Wellington (Net)85% BCIGC/15% BCMBS +25bps
Page 20
Sharpe Ratio: The SharpeRatio is a calculation thatmeasures excess return per unitof risk. A higher relativeSharpe ratio means that themanager is achieving higherreturn for the amount of riskbeing taken.
Sortino Ratio: The SortinoRatio is a modification of theSharpe Ratio that differentiatesharmful volatility from generalvolatility by taking into accountthe standard deviation ofnegative returns, calleddownside deviation. A largeSortino Ratio indicates there isa low probability of a large loss.
Information Ratio: Ameasurement of the value amanager adds against anindexed benchmark. It iscalculated by taking themanager's excess return overthe benchmark, and dividing itby the tracking error. It is usedto measure active management.

Information contained within this report has been developed solely for the use by the Commonwealth of Virginia Department of the Treasury,its Staff, and Board members. Distribution of this material without the express written consent of Wells Fargo Advisors is strictly prohibited.
EDCP: Intermediate Duration Characteristics
Data Sources: IR+M, Wellington, Barclays
Page 21
Intermediate DurationQuarterly Attribution - IR+M 1Q18 2Q18 3Q18 4Q18 Rolling 1-Year Rolling 1-Year
Gross Return (1.01) 0.09 0.25 1.64 0.91 0.87Benchmark Return (0.99) 0.04 0.17 1.72 0.92 0.92Alpha (0.02) 0.05 0.08 (0.08) (0.01) (0.05)
Country 0.00 0.00 0.00 0.00 0.00 0.00Allocation (0.06) (0.01) 0.07 (0.13) (0.13) (0.06)Security Selection 0.06 0.05 (0.06) 0.12 0.17 0.05Duration/Yield Curve 0.02 0.02 0.01 (0.09) (0.04) (0.03)Intraday Trans/Pricing/Residual (0.02) (0.01) 0.01 0.01 (0.01) (0.01)Other (0.02) 0.00 0.05 0.01 0.00 (0.01)
Quarterly Attribution - Well 1Q18 2Q18 3Q18 4Q18 Rolling 1-Year
Gross Return (1.05) 0.11 0.29 1.48 0.81Benchmark Return (0.99) 0.04 0.17 1.72 0.92Alpha (0.06) 0.07 0.12 (0.24) (0.11)
Country 0.00 0.00 0.00 0.00 0.00Allocation 0.05 0.04 0.06 (0.13) 0.02Security Selection (0.06) 0.01 0.04 (0.07) (0.08)Duration/Yield Curve (0.01) 0.00 0.02 (0.04) (0.03)Intraday Trans/Pricing/Residual 0.00 0.00 0.00 0.00 0.00Other (0.04) 0.02 0.00 0.00 (0.02)

Information contained within this report has been developed solely for the use by the Commonwealth of Virginia Department of the Treasury,its Staff, and Board members. Distribution of this material without the express written consent of Wells Fargo Advisors is strictly prohibited.
EDCP: Intermediate Duration Characteristics
Data Sources: IR+M, Wellington, Barclays
Page 22
Average Duration (yrs)
Effective Maturity (yrs)
Average Quality Average YTM
Weighted Avg Cpn Convexity
Tracking Error (5y)
Income Research + Management 3.95 4.77 AA 3.22 3.31 0.14 0.32
Wellington 3.82 4.66 AA 3.15 2.67 (0.10) 0.30
Intermediate Duration Portfolio 3.89 4.72 AA 3.19 3.00 0.02 0.31
Benchmark 4.00 4.61 AA 3.05 2.83 (0.02) n/a
Difference (0.11) 0.11 0.14 0.17 0.04
Policy Duration Target 4.00 Policy Duration Range 3.60 - 4.40
As of December 31, 2018

Information contained within this report has been developed solely for the use by the Commonwealth of Virginia Department of the Treasury,its Staff, and Board members. Distribution of this material without the express written consent of Wells Fargo Advisors is strictly prohibited.
EDCP: Intermediate Duration Characteristics
Data Sources: IR+M, Wellington, Barclays
Page 23
Sector Allocation IR+M WellingtonTotal
PortfolioPolicy Max Bench
Over/(Under) (vs Bench)
U.S. Treasury/Agency 31.9 42.8 37.2 100.0 53.0 (15.8)Corporates 35.2 28.7 32.0 50.0 26.4 5.6Mortgage-Backed 16.5 14.9 15.7 50.0 15.0 0.7Asset-Backed 7.5 6.5 7.0 10.0 0.0 7.0CMBS 6.5 5.0 5.8 10.0 0.0 5.8CMO 0.0 1.4 0.7 10.0 0.0 0.7 PACs 0.0 0.0 0.0 20.0 0.0 0.0Cash Equiv. 0.9 0.0 0.5 10.0 0.0 0.5Other 1.5 0.8 1.2 5.6 (4.4)
100.0 100.0 100.0 100.0
MBS, CMBS, CMO, PAC 23.0 21.3 22.1 60.0
Income Total Over/UnderQuality Distribution Research Wellington Portfolio Bench WeightTreasury/Agency 32.9 44.6 38.5 52.8 (14.3)Aaa 31.2 26.4 28.9 18.7 10.2Aa 2.8 2.4 2.6 3.3 (0.7)A 23.8 16.8 20.5 11.0 9.5Baa 9.3 9.9 9.6 14.2 (4.6)Other 0.0 0.0 0.0 0.0 0.0
100.0 100.0 100.0 100.0
As of December 31, 2018

Information contained within this report has been developed solely for the use by the Commonwealth of Virginia Department of the Treasury,its Staff, and Board members. Distribution of this material without the express written consent of Wells Fargo Advisors is strictly prohibited.
EDCP: Intermediate Duration Characteristics
Data Sources: IR+M, Wellington,
Page 24
Name % of Portfolio Name % of PortfolioUS Treasury 8.36% US Treasury 40.99%US Treasury 4.21% Fannie Mae Pool 7.83%US Treasury 3.08% Invesco Trsy Port 6.58%US Treasury 2.63% Freddie Mac Gold Pool 3.50%US Treasury 2.41% Ginnie Mae II Pool 3.17%FN BF0099 1.98% US Treasury Inflation 2.29%US Treasury 1.53% The Goldman Sachs Group 1.35%
US Treasury 1.42% Morgan Stanley 1.26%US Treasury 1.34% Fannie Mae REMICs 1.24%US Treasury 1.27% Bank of America Corp 1.22%
Name % of Portfolio Name % of PortfolioJP Morgan Chase & Co 1.13% The Goldman Sachs Group 1.35%Anheuser-Busch Inbev 1.05% Morgan Stanley 1.26%Comcast Cable Communications 0.86% Bank of America Corp 1.22%Simon Property Group LP 0.81% JP Morgan Chase & Co 1.14%Morgan Stanley 0.67% Wells Fargo & Co 0.91%Duke Energy Carolinas 0.67% CVS Health Corp 0.86%Ace INA Holdings 0.65% Cigna Holding Co 0.74%Kroger Co 0.60% UnitedHealth Group 0.67%UnitedHealth Group 0.59% Reynolds American Inc 0.59%AT&T Inc 0.58% United Technologies 0.59%
Top Ten Overall Portfolio Holdings
Top Ten Overall Corporate Holdings
WellingtonIncome Research + Management
Income Research + Management Wellington

Information contained within this report has been developed solely for the use by the Commonwealth of Virginia Department of the Treasury,its Staff, and Board members. Distribution of this material without the express written consent of Wells Fargo Advisors is strictly prohibited.
Zephyr StyleADVISORZephyr StyleADVISOR: Wells Fargo Advisors
Manager vs Zephyr Medium Duration High Credit Universe (Morningstar): Return RankApril 2000 - December 2018 (36-Month Moving Windows, Computed Monthly)
Retu
rn R
ank
100%
75%
Median
25%
0%
Mar 2003 Dec 2004 Dec 2009 Dec 2014 Dec 2018
Dodge & Cox (Net)Earnest (Net)Long Duration Benchmark5th to 25th Percentile25th Percentile to MedianMedian to 75th Percentile75th to 95th Percentile
Manager vs Zephyr Medium Duration High Credit Universe (Morningstar): Return RankApril 2000 - December 2018 (36-Month Moving Windows, Computed Monthly)
Dodge & Cox (Net)
Earnest (Net)
Long Duration Benchmark
Jun 2004
114 mng
Oct 2005
120 mng
Feb 2007
121 mng
Jun 2008
123 mng
Oct 2009
131 mng
Jan 2011
139 mng
May 2012
141 mng
Sep 2013
148 mng
Jan 2015
152 mng
May 2016
156 mng
Sep 2017
165 mng
Dec 2018
172 mng
13.56% 52.34% 28.98% 26.78% 24.59% 33.22% 34.03% 21.38% 6.51% 2.24% 16.96% 29.64%
N/A N/A N/A N/A 43.63% 68.05% 35.61% 40.31% 17.62% 0.97% 7.97% 25.07%
8.12% 74.99% 25.76% 12.77% 24.23% 42.03% 32.70% 33.45% 22.47% 1.25% 5.60% 11.65%
Zephyr StyleADVISORZephyr StyleADVISOR: Wells Fargo Advisors
Manager vs Benchmark: ReturnApril 2000 - December 2018 (not annualized if less than 1 year)
Retu
rn
-1
0
1
2
3
4
5
6
1 quarter 6 months 1 year 3 years 5 years 10 years 18 years 3 quarters
Dodge & Cox (Net)Earnest (Net)Long Duration Benchmark
Manager vs Benchmark: ReturnApril 2000 - December 2018 (not annualized if less than 1 year)
Dodge & Cox (Net)
Earnest (Net)
Long Duration Benchmark
1 quarter 6 months 1 year 3 years 5 years 10 years
1.25% 1.44% -1.16% 2.23% 2.99% 4.54%
2.25% 1.78% 0.19% 2.31% 3.44% 4.24%
1.50% 1.44% -0.76% 2.62% 3.28% 4.21%
18 years 3 quarters
5.30%
N/A
5.51%
EDCP: Long Duration Performance
Data Sources: Zephyr
Calendar Years Trailing Results
Universe: Rolling Three-Year Results
Zephyr StyleADVISORZephyr StyleADVISOR: Wells Fargo Advisors
Calendar Year ReturnAs of December 2018
-4%
-2%
0%
2%
4%
6%
8%
10%
12%
2018 2017 2016 2015 2014 2013 2012 2011 2010 2009 2008 2007 2006 2005
Dodge & Cox (Net)Earnest (Net)Long Duration Benchmark
Dodge & Cox (Net)
Earnest (Net)
Long Duration Benchmark
2018 2017 2016 2015 2014 2013 2012 2011 2010 2009 2008 2007 2006 2005
-1.16% 4.76% 3.18% -0.06% 8.51% -1.96% 7.56% 8.03% 7.02% 10.36% 3.30% 6.46% 4.26% 2.99%
0.19% 4.28% 2.52% 1.02% 9.47% -3.77% 5.45% 11.13% 7.03% 5.96% 4.26% 6.84% 4.68% N/A
-0.76% 5.04% 3.67% 0.23% 8.47% -2.90% 5.32% 10.59% 7.50% 5.77% 6.41% 7.44% 4.59% 3.04%
Page 25

Information contained within this report has been developed solely for the use by the Commonwealth of Virginia Department of the Treasury,its Staff, and Board members. Distribution of this material without the express written consent of Wells Fargo Advisors is strictly prohibited.
Zephyr StyleADVISORZephyr StyleADVISOR: Wells Fargo Advisors
Upside / DownsideDecember 2005 - December 2018 (Single Computation)
Ups
ide%
80
85
90
95
100
105
110
115
120
Downside%80 85 90 95 100 105 110 115 120
Dodge & Cox (Net)Earnest (Net)Long Duration Benchmark
# of Months Average Return (%)vs. Market Month (%) 1-Year (%) Market Benchmark (%)
Dodge & Cox (Net)
Earnest (Net)
Long Duration Benchmark
Up Down UpMarket
DownMarket Best Worst Best Worst Up
CaptureDown
Capture R-Squared
102 55 0.95 -0.62 4.16 -2.85 18.35 -2.88 91.0 83.2 89.37
101 56 0.95 -0.62 3.54 -2.80 13.30 -3.77 90.5 84.0 88.26
100 57 1.04 -0.75 5.05 -3.14 16.55 -3.35 100.0 100.0 100.00
Zephyr StyleADVISORZephyr StyleADVISOR: Wells Fargo Advisors
Risk / ReturnJanuary 2014 - December 2018 (Single Computation)
Retu
rn
-5%
0%
5%
10%
15%
Standard Deviation0% 1% 2% 3% 4% 5% 6%
Dodge & Cox (Net)
Earnest (Net)
Market Benchmark:Long Duration BenchmarkCash Equivalent:Citigroup 3-month T-bill
Dodge & Cox (Net)
Earnest (Net)
Long Duration Benchmark
Return(%)
Std Dev(%)
Betavs.
Market
Alphavs. Market
(%)
R-Squaredvs. Market
(%)
SharpeRatio
Tracking Errorvs. Market
(%)Observs.
2.99 3.42 0.9491 -0.12 99.10 0.6964 0.3733 60
3.44 3.65 0.9860 0.21 94.07 0.7775 0.8907 60
3.28 3.59 1.0000 0.00 100.00 0.7439 0.0000 60
Zephyr StyleADVISORZephyr StyleADVISOR: Wells Fargo Advisors
Risk / ReturnJanuary 2006 - December 2018 (Single Computation)
Retu
rn
-5%
0%
5%
10%
15%
Standard Deviation0% 1% 2% 3% 4% 5% 6%
Dodge & Cox (Net)
Earnest (Net)
Market Benchmark:Long Duration BenchmarkCash Equivalent:Citigroup 3-month T-bill
Dodge & Cox (Net)
Earnest (Net)
Long Duration Benchmark
Return(%)
Std Dev(%)
Betavs.
Market
Alphavs. Market
(%)
R-Squaredvs. Market
(%)
SharpeRatio Observs.
4.57 3.64 0.8452 0.62 89.37 0.9449 156
4.47 3.80 0.8752 0.40 88.24 0.8817 156
4.65 4.07 1.0000 0.00 100.00 0.8658 156
EDCP: Long Duration Risk Measures
Data Sources: Zephyr
Risk/Return (From January 2006) Risk/Return (Trailing Five Years)
Up/Down Capture: Inception Alpha: Alpha is the excess portfolio return provided by the manager comparedto the risk-adjusted benchmark.
Beta: A statistical measure of volatility, beta measures the expected change inreturn per one percent change in the return on the market.
R-Squared: R-Squared measures the overall strength or explanatory power of astatistical relationship. In general, a higher R-squared means a stronger statisticalrelationship between the variables
Sharpe Ratio: The Sharpe Ratio is a calculation that measures excess return perunit of risk. A higher relative Sharpe ratio means that the manager is achievinghigher return for the amount of risk being taken.
Standard Deviation: Standard Deviation is used as an estimate of risk. Thewider the typical range of returns, the higher the standard deviation of returns,and the higher the portfolio risk.
Tracking Error: Tracking Error is a measure of divergence between the returnbehavior of a portfolio and that of a benchmark.
Page 26

Information contained within this report has been developed solely for the use by the Commonwealth of Virginia Department of the Treasury,its Staff, and Board members. Distribution of this material without the express written consent of Wells Fargo Advisors is strictly prohibited.
EDCP: Long Duration Risk Measures
Data Sources: Zephyr
Multi-Statistic: Inception
Zephyr StyleADVISORZephyr StyleADVISOR: Wells Fargo Advisors
Manager vs Benchmark: Multi-StatisticApril 2000 - December 2018 (not annualized if less than 1 year)
Shar
pe R
atio
-1.00
-0.50
0.00
0.50
1.00
1.50
1 year 3 years 5 years 10 years 18 years 3 quarters
Dodge & Cox (Net)Earnest (Net)Long Duration Benchmark
Sorti
no R
atio
(MA
R =
Cas
h E
q.)
-1.00
-0.50
0.00
0.50
1.00
1.50
2.002.50
1 year 3 years 5 years 10 years 18 years 3 quarters
Dodge & Cox (Net)Earnest (Net)Long Duration Benchmark
Info
rmat
ion
Ratio
-1.00
-0.50
0.00
0.50
1.00
1.50
1 year 3 years 5 years 10 years 18 years 3 quarters
Dodge & Cox (Net)Earnest (Net)Long Duration Benchmark
Page 27
Sharpe Ratio: The SharpeRatio is a calculation thatmeasures excess return per unitof risk. A higher relativeSharpe ratio means that themanager is achieving higherreturn for the amount of riskbeing taken.
Sortino Ratio: The SortinoRatio is a modification of theSharpe Ratio that differentiatesharmful volatility from generalvolatility by taking into accountthe standard deviation ofnegative returns, calleddownside deviation. A largeSortino Ratio indicates there isa low probability of a large loss.
Information Ratio: Ameasurement of the value amanager adds against anindexed benchmark. It iscalculated by taking themanager's excess return overthe benchmark, and dividing itby the tracking error. It is usedto measure active management.

Information contained within this report has been developed solely for the use by the Commonwealth of Virginia Department of the Treasury,its Staff, and Board members. Distribution of this material without the express written consent of Wells Fargo Advisors is strictly prohibited.
EDCP: Long Duration Attribution/Characteristics
Data Sources: JP Morgan Chase, Dodge & Cox, EARNEST, Barclays
Page 28
Average Duration (yrs)
Average Maturity (yrs)
Average Quality Avg YTM
Weighted Avg Cpn Convexity
Tracking Error (5y)
Dodge & Cox 6.92 10.13 AA 3.57 4.00 0.42 0.37
EARNEST 7.17 9.14 AA+ 3.48 3.40 0.77 0.90
Long Duration Portfolio 6.99 9.86 AA 3.55 3.84 0.52 0.51
Benchmark 7.42 10.92 AA 3.41 3.39 0.72 n/a
Difference (0.43) (1.06) 0.14 0.45 (0.20)
Policy Duration Target 7.42 Policy Duration Range 6.68 - 8.16
As of December 31, 2018
Quarterly Attribution - D&C 1Q18 2Q18 3Q18 4Q18 Rolling 1-Year Rolling 1-Year
Gross Return (1.75) (0.75) 0.23 1.30 (0.99) (0.60)Benchmark Return (1.80) (0.37) (0.07) 1.50 (0.76) (0.76)Alpha 0.05 (0.38) 0.30 (0.20) (0.23) 0.16
Country 0.00 0.00 0.00 0.00 0.00 0.00Allocation (0.04) (0.19) 0.12 (0.08) (0.19) (0.02)Security Selection 0.02 (0.11) 0.07 (0.16) (0.18) 0.08Duration/Yield Curve 0.04 0.00 0.10 0.06 0.20 0.17Intraday Trans/Pricing/Residual 0.00 0.00 0.00 0.00 0.00 (0.01)Other 0.03 (0.08) 0.01 (0.02) (0.06) (0.06)
Quarterly Attribution - Earnest 1Q18 2Q18 3Q18 4Q18 Rolling 1-Year
Gross Return (1.31) (0.13) (0.39) 2.31 0.44Benchmark Return (1.80) (0.37) (0.07) 1.50 (0.76)Alpha 0.49 0.24 (0.32) 0.81 1.20
Country 0.00 0.00 0.00 0.00 0.00Allocation 0.11 0.17 (0.21) 0.36 0.43Security Selection 0.38 0.13 (0.10) 0.36 0.77Duration/Yield Curve 0.07 0.03 (0.03) 0.02 0.09Intraday Trans/Pricing/Residual 0.00 0.00 0.00 0.00 0.00Other (0.07) (0.09) 0.02 0.07 (0.09)
Long Duration

Information contained within this report has been developed solely for the use by the Commonwealth of Virginia Department of the Treasury,its Staff, and Board members. Distribution of this material without the express written consent of Wells Fargo Advisors is strictly prohibited.
EDCP: Long Duration Characteristics
Data Sources: JP Morgan Chase, Dodge & Cox, EARNEST, Barclays
Page 29
Total Policy Over/(Under)Sector Allocation Dodge & Cox EARNEST Portfolio Max. Bench (vs Bench)U.S. Treasury/Agency 31.5 41.8 34.4 100.0 40.9 (6.5)Corporates 28.8 23.7 27.4 50.0 33.7 (6.3)Mortgage-Backed 26.6 27.1 26.7 50.0 23.5 3.3Asset-Backed 0.0 0.0 0.0 10.0 0.4 (0.4)CMBS 4.5 0.0 3.3 10.0 1.6 1.7CMO 4.7 0.1 3.4 10.0 0.0 3.4 PACs 0.0 0.0 0.0 20.0 0.0 0.0Cash Equiv. 1.0 3.5 1.7 10.0 0.0 1.7Other 2.9 3.8 3.1 0.0 3.1
100.0 100.0 100.0 100.0
MBS, CMBS, CMO, PAC 35.8 27.1 33.4 60.0
Total Quality Distribution Dodge & Cox EARNEST Portfolio BenchTreasury/Agency 66.3 67.8 66.7 64.3Aaa 0.7 3.6 1.5 4.4Aa 4.7 5.0 4.8 3.5A 18.7 14.3 17.5 11.6Baa 9.6 9.3 9.5 16.3Other 0.0 0.0 0.0 0.0
100.0 100.0 100.0 100.0
As of December 31, 2018
1.35.9(6.8)0.0
Over/UnderWeight
2.5(2.9)

Information contained within this report has been developed solely for the use by the Commonwealth of Virginia Department of the Treasury,its Staff, and Board members. Distribution of this material without the express written consent of Wells Fargo Advisors is strictly prohibited.
EDCP: Long Duration Characteristics
Data Sources: Dodge & Cox, EARNEST
Page 30
Name % of Portfolio Name % of Portfolio
US Treasury 5.58% STRIP PRIN 2.00%
US Treasury 4.42% SBAP 18-20B 1 1.91%
US Treasury 4.14% Aid-Israel 1.84%
US Treasury 3.79% FN BH5752 1.80%
US Treasury 3.24% FN 471938 1.71%
Freddie Mac Gold 2.67% FN 464065 1.65%
US Treasury 2.30% FN AU1628 1.64%
Fannie Mae 2.02% STRIP PRIN 1.62%
Fannie Mae 2.02% SBAP 16-20A 1 1.60%
Freddie Mac Gold 1.89% SBAP 13-20H 1 1.54%
FN AU1628
Name % of Portfolio Name % of Portfolio
Wells Fargo & Co 1.40% Norfolk Southern Corp 1.15%
United Healthcare 1.38% United Air 14-2 A 0.98%
HSBC 1.37% South Carolina Energy & Gas 0.97%
Bank of America 1.36% Carolina Power & Light 0.97%
JP Morgan Chase & Co 1.35% Entergy LA LLC 0.97%
Burlington Northern Santa Fe 1.27% GATX Corp 0.96%
Verizon Communications 1.25% Nat'l Rural Utility 0.95%
Dow Chemical 1.24% American Water 0.94%
Comcast Corp 1.15% Nevada Power Co 0.93%
Anheuser-Busch Inbev 1.14% US Bancorp 0.93%
Dodge & Cox
Dodge & Cox
Top Ten Overall Portfolio Holdings
Top Ten Overall Corporate Holdings
EARNEST
EARNEST

Information contained within this report has been developed solely for the use by the Commonwealth of Virginia Department of the Treasury,its Staff, and Board members. Distribution of this material without the express written consent of Wells Fargo Advisors is strictly prohibited.
FIRM: Wells Fargo Advisors is the trade name used by two separate registered broker-dealers: Wells Fargo Advisors, LLC., and Wells FargoFinancial Network, LLC, Members SIPC, non-bank affiliates of Wells Fargo & Company. Investment and Insurance products are: NOT FDIC-INSURED/NOT BANK-GUARANTEED/MAY LOSE VALUE.
CONFLICTS OF INTEREST: To review important information about certain relationships and potential conflicts of interest that may existbetween Wells Fargo Advisors, its affiliates, and the companies that are mentioned in this report, please visit the our research disclosure page athttps://www.wellsfargoadvisors.com/disclosures/research.htm or call your Financial Advisor.
STATEMENT OF OPINION: This and/or the accompanying information was prepared by or obtained from sources which Wells FargoAdvisors believes to be reliable but does not guarantee its accuracy. Any opinions expressed or implied herein are not necessarily the same asthose of Wells Fargo Advisors or its affiliates and are subject to change without notice. The report herein is not a complete analysis of everymaterial fact in respect to any company, industry or security. Any market prices are only indications of market values and are subject to change.The material has been prepared or is distributed solely for information purposes and is not a solicitation or an offer to buy any security orinstrument or to participate in any trading strategy. Additional information is available upon request.
ASSET CLASS SUITABILITY: Stocks of small companies are typically more volatile than stocks of larger companies. They often involvehigher risks because they may lack the management expertise, financial resources, product diversification and competitive strengths to endureadverse economic conditions. High-yield, non-investment grade bonds are only suitable for aggressive investors willing to take greater risks,which could result in loss of principal and interest payments. Global/International investing involves risks not typically associated with USinvesting, including currency fluctuations, political instability, uncertain economic conditions and different accounting standards. Because thefutures and commodity markets can be highly unpredictable – often swinging dramatically – investing in currency and commodities is notsuitable for all investors. You may lose your entire investment , and in some cases, more than you invested.
PAST PERFORMANCE: Past performance is not an indication of future results.
Disclosures
Page 31

Joseph W. Montgomery, CFP®, AIF® Brian T. Moore, CIMA®, AIF® Robin S. Wilcox, AIF®Managing Director - Investments Senior Institutional Consultant Vice President - Investments
[email protected] [email protected] [email protected]
R. Bryce Lee, CFA, CIMA®, CAIA, FRM, AIF® Karen H. Logan, CIMA®, AIF® H. James Johnson, III, AIF®Managing Director- Investments Senior Institutional Consultant Associate Vice President- Investments
[email protected] [email protected] [email protected]
428 McLaws Circle Williamsburg, Virginia 23185 888-465-8422
Wells Fargo Advisors is the trade name under which Wells Fargo & Company provides brokerage services through two registered broker/dealers: Wells Fargo Advisors, LLC, member NYSE/SIPC, and Wells Fargo Advisors Financial Network, Inc., member NASD/SIPC. Each broker/dealer is a separate non-bank affiliate of Wells Fargo & Company.
Tobacco Indemnification and Community Revitalization Endowment (TICR Taxable & Tax-Exempt)
Portfolio Evaluation for Periods Ending December 31, 2018
TICR - TaxableTICR - Tax-ExemptInvestment Policy Guidelines
SectionI.II.III.

Information contained within this report has been developed for the Commonwealth of Virginia Department of the Treasury, its Staff,and Board members. Distribution of this material without the express written consent of Wells Fargo Advisors is strictly prohibited.
Data Sources: Zephyr StyleAdvisor & Barclay’s Capital
Capital Markets Review: For Periods Ending December 31, 2018Economy/Capital Markets: On the economic data front, U.S. consumer confidencereached its highest level since 2000 in October, as the stock market volatility didn’t seemto dent America’s positive economic outlook. Initial reports of 3rd quarter GDP indicatean annualized growth rate of 3.5%, above the projected 3.3%, largely the result of strongconsumer spending. The 30-year mortgage rate rose to a seven year high in Octoberinspiring less-than-encouraging readings on the U.S. real estate market. After dropping to3.7% in the 2nd quarter, the unemployment rate increased to 3.9% by the end of the 3rdquarter. The labor participation rate increased from 62.7% at the close of the previousquarter to 63.1% at the end of the 3rd quarter. In early December, trade relations withChina took a positive turn as President Trump and Chinese Premier Xi reached a 90-day“tariff-truce” at their G20 meeting. Optimism waned shortly thereafter following thearrest of Chinese company Huawei’s CFO by Canadian authorities.
In the 4th quarter, higher quality bonds rallied on a “flight to quality” as global growth,equity, and Federal Reserve tightening concerns mounted. The Fed raised the fed fundsrate by 0.25% in September and again in December, noting that the economy wasstrong. The fed funds target is now 2.25% - 2.50%. Longer-maturity issues brought 0.9%for the quarter but returned -4.5% last year. Conversely, short-term issues gained 1.2%last quarter and 1.6% last year. The Treasury curve flattened as the rate hike put upwardpressure on shorter maturities. The policy-sensitive 2-year yield reached as high as2.97%, surpassing the 5-year yield for the first curve inversion of 2018. entering 2019,the spread between the 10-year Treasury yield and the 2-year Treasury yield is at one ofits lowest levels since 2007. The Fed continues to tighten monetary policy, but loweredits forecast to two additional rate hikes in the upcoming year. Current marketexpectations are inconsistent with the Fed’s estimate and is pricing in two or fewer.
The S&P 500 Index posted its worst December performance in more than 80 years,bringing its annual return to -4.4%. Almost all sectors were down for the fourth quarter;Energy had the steepest quarterly and annual losses, at -23.8% and -18.1%, respectively.Utilities had the only quarterly increase (1.4%), as a higher dividend yield helped tomitigate this sector’s price decline. Mid-cap and small-cap stocks underperformed large-cap while value stocks outperformed growth stocks. Dollar-denominated internationaldeveloped market equities returned -13.4%, while local currency developed marketequities had a smaller, 10.5% loss. Emerging market equities returned -14.2% in thedollar-denominated market and fell by approximately 10% in the local currency class.EM country equity markets were mixed during the quarter. Mexico did manage a positivemonthly return (+3.3% in U.S.-dollar terms) in December. China was the worst monthlyperformer (-6.1% in U.S.-dollar terms). The Chinese market had a tough year as tradedisputes between China and the U.S. continued.
Page 2
Index Name 3 MoFiscal YTD 1 Year 3 Years 5 Years 10 Years
Dow Jones Industrial Average (11.3) (2.8) (3.5) 12.9 9.7 13.2NASDAQ (17.3) (11.2) (2.8) 11.1 11.0 16.8S&P 500 (13.5) (6.9) (4.4) 9.3 8.5 13.1Russell 1000 (13.8) (7.4) (4.8) 9.1 8.2 13.3Russell 1000 Value (11.7) (6.7) (8.3) 7.0 5.9 11.2Russell 1000 Growth (15.9) (8.2) (1.5) 11.1 10.4 15.3Russell Midcap (15.4) (11.1) (9.1) 7.0 6.3 14.0Russell Midcap Value (15.0) (12.2) (12.3) 6.1 5.4 13.0Russell Midcap Growth (16.0) (9.6) (4.8) 8.6 7.4 15.1Russell 2000 (20.2) (17.3) (11.0) 7.4 4.4 12.0Russell 2000 Value (18.7) (17.4) (12.9) 7.4 3.6 10.4Russell 2000 Growth (21.7) (17.3) (9.3) 7.2 5.1 13.5Russell 2500 (18.5) (14.7) (10.0) 7.3 5.1 13.2Russell 3000 (14.3) (8.2) (5.2) 9.0 7.9 13.2
MSCI EAFE Index (12.5) (11.4) (13.8) 2.9 0.5 6.3MSCI World Index (13.4) (9.1) (8.7) 6.3 4.6 9.7MSCI World Ex. US Index (12.8) (11.6) (14.1) 3.1 0.3 6.2MSCI EM (EMERGING MARKETS) (7.5) (8.5) (14.6) 9.2 1.6 8.0MSCI FM (FRONTIER MARKETS) (4.3) (6.2) (16.4) 4.2 0.7 4.8MSCI ACWI (12.8) (9.0) (9.4) 6.6 4.3 9.5MSCI ACWI ex USA (11.5) (10.8) (14.2) 4.5 0.7 6.6
Barclays U.S. Aggregate 1.6 1.7 0.0 2.1 2.5 3.5Barclays U.S. Government/Credit 1.5 1.5 (0.4) 2.2 2.5 3.5Barclays Intermediate U.S. Gov/Credit 1.7 1.9 0.9 1.7 1.9 2.9Barclays Municipal Bond 1.7 1.5 1.3 2.3 3.8 4.9BofA Merrill Lynch Convertible Securities (9.8) (6.2) 0.7 9.4 7.3 12.7BofA Merrill Lynch High Yield Master (4.7) (2.3) (2.3) 7.3 3.8 11.0JPM GBI-EM Global Ex US 2.1 0.2 (6.2) 5.9 (1.0) 3.5JPM EMBI Global Diversified (1.3) 1.0 (4.3) 5.2 4.8 8.2FTSE World Government Bond Index 1.8 0.1 (0.8) 2.7 0.8 1.5
FTSE Nareit All Equity REITs (6.1) (5.1) (4.1) 4.6 8.3 12.4HFRI Fund of Funds Composite Index (4.4) (4.2) (3.5) 1.5 1.5 3.2Dow UBS Commodity Index (8.6) (10.5) (8.9) 2.5 (8.2) (1.7)
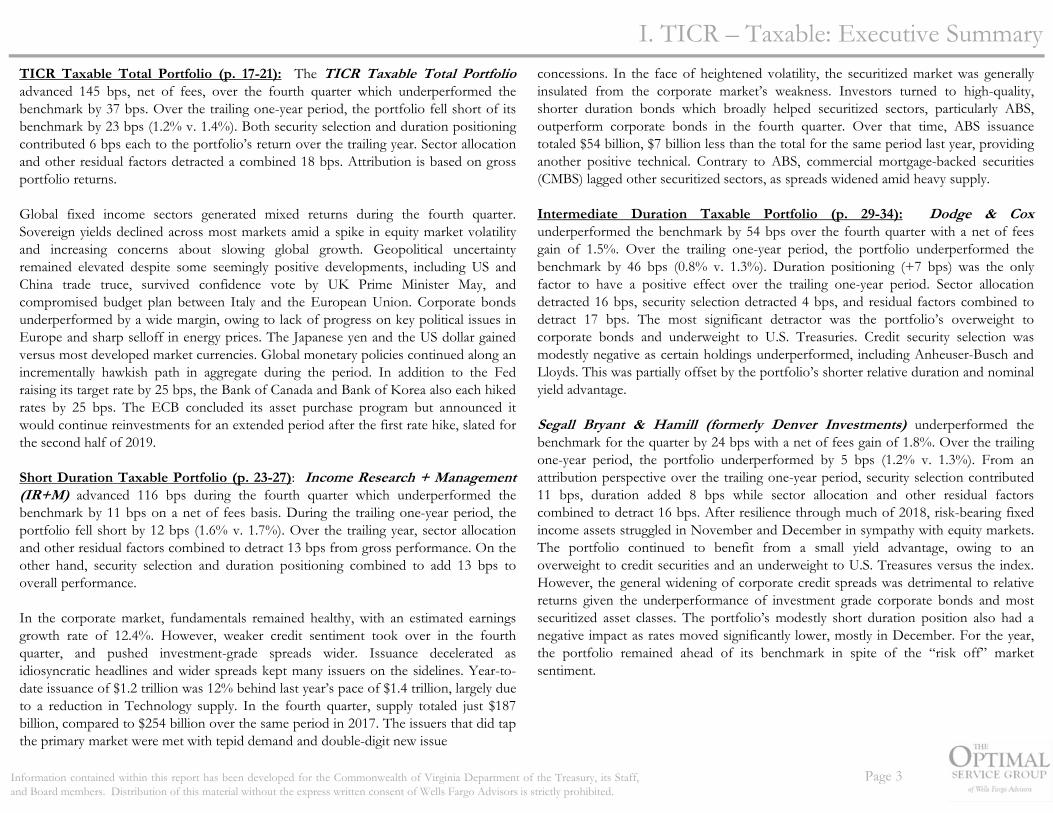
Information contained within this report has been developed for the Commonwealth of Virginia Department of the Treasury, its Staff,and Board members. Distribution of this material without the express written consent of Wells Fargo Advisors is strictly prohibited.
concessions. In the face of heightened volatility, the securitized market was generallyinsulated from the corporate market’s weakness. Investors turned to high-quality,shorter duration bonds which broadly helped securitized sectors, particularly ABS,outperform corporate bonds in the fourth quarter. Over that time, ABS issuancetotaled $54 billion, $7 billion less than the total for the same period last year, providinganother positive technical. Contrary to ABS, commercial mortgage-backed securities(CMBS) lagged other securitized sectors, as spreads widened amid heavy supply.
Intermediate Duration Taxable Portfolio (p. 29-34): Dodge & Coxunderperformed the benchmark by 54 bps over the fourth quarter with a net of feesgain of 1.5%. Over the trailing one-year period, the portfolio underperformed thebenchmark by 46 bps (0.8% v. 1.3%). Duration positioning (+7 bps) was the onlyfactor to have a positive effect over the trailing one-year period. Sector allocationdetracted 16 bps, security selection detracted 4 bps, and residual factors combined todetract 17 bps. The most significant detractor was the portfolio’s overweight tocorporate bonds and underweight to U.S. Treasuries. Credit security selection wasmodestly negative as certain holdings underperformed, including Anheuser-Busch andLloyds. This was partially offset by the portfolio’s shorter relative duration and nominalyield advantage.
Segall Bryant & Hamill (formerly Denver Investments) underperformed thebenchmark for the quarter by 24 bps with a net of fees gain of 1.8%. Over the trailingone-year period, the portfolio underperformed by 5 bps (1.2% v. 1.3%). From anattribution perspective over the trailing one-year period, security selection contributed11 bps, duration added 8 bps while sector allocation and other residual factorscombined to detract 16 bps. After resilience through much of 2018, risk-bearing fixedincome assets struggled in November and December in sympathy with equity markets.The portfolio continued to benefit from a small yield advantage, owing to anoverweight to credit securities and an underweight to U.S. Treasures versus the index.However, the general widening of corporate credit spreads was detrimental to relativereturns given the underperformance of investment grade corporate bonds and mostsecuritized asset classes. The portfolio’s modestly short duration position also had anegative impact as rates moved significantly lower, mostly in December. For the year,the portfolio remained ahead of its benchmark in spite of the “risk off” marketsentiment.
I. TICR – Taxable: Executive SummaryTICR Taxable Total Portfolio (p. 17-21): The TICR Taxable Total Portfolioadvanced 145 bps, net of fees, over the fourth quarter which underperformed thebenchmark by 37 bps. Over the trailing one-year period, the portfolio fell short of itsbenchmark by 23 bps (1.2% v. 1.4%). Both security selection and duration positioningcontributed 6 bps each to the portfolio’s return over the trailing year. Sector allocationand other residual factors detracted a combined 18 bps. Attribution is based on grossportfolio returns.
Global fixed income sectors generated mixed returns during the fourth quarter.Sovereign yields declined across most markets amid a spike in equity market volatilityand increasing concerns about slowing global growth. Geopolitical uncertaintyremained elevated despite some seemingly positive developments, including US andChina trade truce, survived confidence vote by UK Prime Minister May, andcompromised budget plan between Italy and the European Union. Corporate bondsunderperformed by a wide margin, owing to lack of progress on key political issues inEurope and sharp selloff in energy prices. The Japanese yen and the US dollar gainedversus most developed market currencies. Global monetary policies continued along anincrementally hawkish path in aggregate during the period. In addition to the Fedraising its target rate by 25 bps, the Bank of Canada and Bank of Korea also each hikedrates by 25 bps. The ECB concluded its asset purchase program but announced itwould continue reinvestments for an extended period after the first rate hike, slated forthe second half of 2019.
Short Duration Taxable Portfolio (p. 23-27): Income Research + Management(IR+M) advanced 116 bps during the fourth quarter which underperformed thebenchmark by 11 bps on a net of fees basis. During the trailing one-year period, theportfolio fell short by 12 bps (1.6% v. 1.7%). Over the trailing year, sector allocationand other residual factors combined to detract 13 bps from gross performance. On theother hand, security selection and duration positioning combined to add 13 bps tooverall performance.
In the corporate market, fundamentals remained healthy, with an estimated earningsgrowth rate of 12.4%. However, weaker credit sentiment took over in the fourthquarter, and pushed investment-grade spreads wider. Issuance decelerated asidiosyncratic headlines and wider spreads kept many issuers on the sidelines. Year-to-date issuance of $1.2 trillion was 12% behind last year’s pace of $1.4 trillion, largely dueto a reduction in Technology supply. In the fourth quarter, supply totaled just $187billion, compared to $254 billion over the same period in 2017. The issuers that did tapthe primary market were met with tepid demand and double-digit new issue
Page 3

Information contained within this report has been developed for the Commonwealth of Virginia Department of the Treasury, its Staff,and Board members. Distribution of this material without the express written consent of Wells Fargo Advisors is strictly prohibited.
TICR – Taxable: Summary
* Returns are reported by JP Morgan Chase1 Annualized2 November 1, 20073 25% Short Duration Benchmark, 75% Intermediate Duration Benchmark4 Western Asset Management was terminated in the first quarter of 2009.
TICR - Taxable Target Allocation (ex-LGIP YR) Allocation as of December 31, 2018 (ex-LGIP YR)
Page 4
% of Portfolio Market Value 4Q18 FYTD 1 Yr 3 Yr1 5 Yr1 10 Yr1
Inception2Inception
Benchmark
Average Duration
Average Maturity
Average Quality
100% 228,269,927$ Total TICR - Taxable(ex-Yield Restricted) 1.5 1.7 1.2 1.5 1.7 2.8 2.9 2.9 3.01 4.17 AA
Target Benchmark3 1.8 2.0 1.4 1.5 1.7 2.4 3.42 3.92 AA+
31% 70,285,563$ Total Short Duration 1.2 1.5 1.6 1.3 1.1 2.5 2.5 1.8 1.77 1.88 AABarclays 1-3 Gov't/Credit Index A-Rated and Above + 10bps 1.3 1.6 1.7 1.2 1.0 1.2 1.90 1.98 AA
31% 70,285,563$ IR+M 1.2 1.5 1.6 1.3 1.1 2.5 2.5 1.8 1.77 1.88 AA
69% 157,970,208$ Total Intermediate Duration4 1.6 1.8 1.0 1.6 2.0 2.9 3.1 3.3 3.56 5.19 AA85% BCIGC A-Rated and Above/15% BC Fixed Rate MBS + 10bps 2.0 2.1 1.3 1.6 1.9 2.9 3.92 4.57 AA+
37% 83,585,279$ Dodge & Cox 1.5 1.7 0.8 1.6 2.1 3.3 3.7 3.3 3.53 5.08 AA+33% 74,384,929$ Segall Bryant & Hamill (formerly Denver) 1.8 2.0 1.2 1.6 1.9 -- 2.8 3.0 3.59 5.32 AA
0% 14,156$ Money Market Fund 0.5 1.0 1.7 0.9 0.6 0.4 0.40% 14,156$ Invesco Treasury Portfolio Institutional Shares Fund 0.5 1.0 1.7 0.9 0.6 0.4 0.4
Periods Ending December 31, 2018 (Net of Fees)

Information contained within this report has been developed for the Commonwealth of Virginia Department of the Treasury, its Staff,and Board members. Distribution of this material without the express written consent of Wells Fargo Advisors is strictly prohibited.
Source: JP Morgan Chase* Please note that values include accruals for each account.
TICR – Taxable: Financial Reconciliation
Fiscal Year To Date 2019
Current Financial Reconciliation
Total portfolio market value does not include money
market funds.
Page 5
Short Duration
IR+M Dodge & CoxSegall Bryant
& Hamill Total PortfolioMarket Value (6/30/18) 72,740,331 86,376,277 76,728,785 235,845,394 Net Contributions/Other Receipts 0 0 0 0Net Withdrawals/Other Payouts (3,525,000) (4,183,000) (3,714,000) (11,422,000)Expenses (46,346) (69,702) (60,631) (176,679)Net Cash Flow (3,571,346) (4,252,702) (3,774,631) (11,598,679) Earned Income 864,369 1,512,843 1,255,481 3,632,693Net Realized Gain/(Loss) (384,692) (994,311) (1,069,207) (2,448,210)Change in Unrealized Gain/(Loss) 636,902 943,172 1,244,500 2,824,574Total Investment Gain/(Loss) 1,116,578 1,461,704 1,430,774 4,009,056 Market Value (12/31/18) 70,285,563 83,585,279 74,384,929 228,255,771
Intermediate Duration
UnrealizedFixed Income Cash Equiv. Market Value % of Total Cost Value Gain/(Loss)
IR+M 69,634,991 650,571 70,285,563 30.8% 70,627,811 (342,248)Short Duration Portfolio 69,634,991 650,571 70,285,563 30.8% 70,627,811 (342,248)
Dodge & Cox 81,804,874 1,780,406 83,585,279 36.6% 84,199,730 (614,451) Segall Bryant & Hamill (fomerly Denver) 73,887,580 497,349 74,384,929 32.6% 76,276,308 (1,891,379)Intermediate Duration Portfolio 155,692,453 2,277,755 157,970,208 69.2% 160,476,038 (2,505,830)
Total Short & Intermediate 225,327,445 2,928,326 228,255,771 100.0% 231,103,849 (2,848,078)
Invesco Treasury Portfolio Inst. Shares Fund - 14,156 14,156 0.0% 14,156 -
Total Portfolio 225,327,445 2,942,482 228,269,927 100% 231,118,005 (2,848,078) 98.7% 1.3% 100.0%

Information contained within this report has been developed for the Commonwealth of Virginia Department of the Treasury, its Staff,and Board members. Distribution of this material without the express written consent of Wells Fargo Advisors is strictly prohibited.
TICR – Taxable: Account History
$549,839,000
$228,270,000
Page 6

Information contained within this report has been developed for the Commonwealth of Virginia Department of the Treasury, its Staff,and Board members. Distribution of this material without the express written consent of Wells Fargo Advisors is strictly prohibited.
TICR – Taxable: Total Characteristics
Page 7
Average Duration (yrs)
Average Maturity (yrs)
Average Quality Taxable YTM
Weighted Avg Cpn Convexity
Tracking Error
Short Duration Taxable 1.77 1.88 AA 2.85 2.65 0.03 0.13
Intermediate Duration Taxable 3.56 5.19 AA 3.24 3.50 (0.17) 0.30
Total Fund 3.01 4.17 AA 3.12 3.23 (0.11) 0.25
Benchmark 3.42 3.92 AA+ 2.78 2.50 (0.01) n/a
Difference (0.41) 0.25 0.34 0.74 (0.09)
Policy Duration Target 3.42 Policy Duration Range 3.08 - 3.76
As of December 31, 2018
Total Portfolio 1Q18 2Q18 3Q18 4Q18 Rolling 1-Year
Gross Return (0.66) 0.21 0.29 1.49 1.32Benchmark Return (0.72) 0.17 0.13 1.82 1.39Alpha 0.06 0.03 0.16 (0.33) (0.07)
Country 0.00 0.00 0.00 0.00 0.00Allocation (0.04) (0.06) 0.17 (0.14) (0.07)Security Selection 0.02 0.01 0.00 0.03 0.06Duration/Yield Curve 0.06 0.14 0.01 (0.15) 0.06Intraday Trans/Pricing/Residual 0.00 0.00 0.00 0.00 0.01Other 0.02 (0.06) (0.02) (0.07) (0.11)

Information contained within this report has been developed for the Commonwealth of Virginia Department of the Treasury, its Staff,and Board members. Distribution of this material without the express written consent of Wells Fargo Advisors is strictly prohibited.
TICR – Taxable: Total Characteristics
Page 8
Short Intermediate Total Policy Sector Allocation Duration Duration Fund Max. BenchTreasury 40.7 26.2 30.6 100.0 64.3Agency 1.8 1.5 1.6 100.0 2.6Corporate 32.7 30.1 30.9 50.0 19.9MBS 4.2 24.4 18.1 50.0 11.3CMBS 4.4 0.4 1.7 10.0 0.0CMO 0.0 3.1 2.1 10.0 0.0PAC 0.0 0.0 0.0 20.0 0.0ABS 12.9 8.5 9.8 20.0 0.0Cash & Equiv. 0.3 0.8 0.7 0.0Other 3.0 5.0 4.4 1.9
100.0 100.0 100.0 100.0
Short Intermediate Total Quality Distribution Duration Duration Fund BenchTreasury/Agency 42.4 56.0 51.8 78.2Aaa 22.7 10.3 14.1 4.8Aa 9.9 12.6 11.8 4.3A 24.6 20.1 21.5 12.8Baa 0.0 0.9 0.6 0.0Other 0.3 0.0 0.1 0.0
100.0 100.0 100.0 100.0
6.9
Over/Under
Over/(Under)vs. Bench
(33.7)
8.80.60.1
As of December 31, 2018
Weight(26.3)9.37.5
(1.0)11.0

Information contained within this report has been developed for the Commonwealth of Virginia Department of the Treasury, its Staff,and Board members. Distribution of this material without the express written consent of Wells Fargo Advisors is strictly prohibited.
Zephyr StyleADVISORZephyr StyleADVISOR: Wells Fargo Advisors
Manager vs Benchmark: ReturnNovember 2007 - December 2018 (not annualized if less than 1 year)
Retu
rn
0
0.5
1
1.5
2
2.5
3
3.5
1 quarter 6 months 1 year 3 years 5 years 10 years 11 years 2 months
TICR Taxable Total Fund (gross)TICR Taxable Total Fund (net)TICR Taxable Total Fund Benchmark
Manager vs Benchmark: ReturnNovember 2007 - December 2018 (not annualized if less than 1 year)
TICR Taxable Total Fund (gross)
TICR Taxable Total Fund (net)
TICR Taxable Total Fund Benchmark
1 quarter 6 months 1 year 3 years 5 years 10 years
1.49% 1.78% 1.32% 1.63% 1.86% 2.92%
1.45% 1.70% 1.16% 1.48% 1.70% 2.76%
1.82% 1.95% 1.39% 1.48% 1.70% 2.44%
11 years 2 months
3.08%
2.92%
2.90%
TICR – Taxable: Total Performance
Data Sources: Zephyr
Calendar Years Trailing Results
Universe: Rolling Twelve-Month ResultsZephyr StyleADVISOR
Zephyr StyleADVISOR: Wells Fargo AdvisorsManager vs Zephyr Medium Duration High Credit Universe (Morningstar): Return RankNovember 2007 - December 2018 (36-Month Moving Windows, Computed Monthly)
Ret
urn
Rank
100%
75%
Median
25%
0%
Oct 2010 Dec 2011 Dec 2013 Dec 2015 Dec 2017 Dec 2018
TICR Taxable Total Fund (gross)TICR Taxable Total Fund (net)TICR Taxable Total Fund Benchmark5th to 25th Percentile25th Percentile to MedianMedian to 75th Percentile75th to 95th Percentile
Manager vs Zephyr Medium Duration High Credit Universe (Morningstar): Return RankNovember 2007 - December 2018 (36-Month Moving Windows, Computed Monthly)
TICR Taxable Total Fund (gross)
TICR Taxable Total Fund (net)
TICR Taxable Total Fund Benchmark
Jun 2011
140 mng
Feb 2012
141 mng
Oct 2012
143 mng
Jun 2013
147 mng
Mar 2014
151 mng
Nov 2014
152 mng
Jul 2015
152 mng
Mar 2016
156 mng
Dec 2016
162 mng
Aug 2017
163 mng
Apr 2018
168 mng
Dec 2018
172 mng
88.09% 91.12% 91.11% 76.26% 79.41% 75.32% 61.54% 71.55% 88.96% 86.54% 53.49% 72.45%
89.63% 93.50% 92.73% 80.56% 82.16% 79.69% 68.55% 80.63% 90.43% 89.80% 68.57% 80.45%
89.09% 98.10% 98.50% 90.77% 93.38% 90.20% 83.01% 82.06% 91.24% 89.38% 79.12% 80.40%
Zephyr StyleADVISORZephyr StyleADVISOR: Wells Fargo Advisors
Calendar Year ReturnAs of December 2018
-1%
0%
1%
2%
3%
4%
5%
6%
7%
2018 2017 2016 2015 2014 2013 2012 2011 2010 2009 2008
TICR Taxable Total Fund (gross)TICR Taxable Total Fund (net)TICR Taxable Total Fund Benchmark
TICR Taxable Total Fund (gross)
TICR Taxable Total Fund (net)
TICR Taxable Total Fund Benchmark
2018 2017 2016 2015 2014 2013 2012 2011 2010 2009 2008
1.32% 1.83% 1.74% 1.42% 2.99% -0.09% 4.22% 4.69% 5.21% 6.04% 3.47%
1.16% 1.67% 1.60% 1.26% 2.81% -0.24% 4.08% 4.53% 5.08% 5.87% 3.30%
1.39% 1.57% 1.47% 1.28% 2.77% -0.57% 2.65% 4.89% 4.39% 4.66% 5.89%
Page 9

Information contained within this report has been developed for the Commonwealth of Virginia Department of the Treasury, its Staff,and Board members. Distribution of this material without the express written consent of Wells Fargo Advisors is strictly prohibited.
Data Sources: Zephyr
Up/Down Capture: InceptionRisk/Return (From 11/1/07)
TICR – Taxable: Total Risk Measures
Zephyr StyleADVISORZephyr StyleADVISOR: Wells Fargo Advisors
Upside / DownsideNovember 2007 - December 2018 (Single Computation)
Ups
ide%
80
90
100
110
120
130
Downside%80 90 100 110 120 130
TICR Taxable Total Fund (gross)TICR Taxable Total Fund (net)TICR Taxable Total Fund Benchmark
# of Months Average Return (%)vs. Market Month (%) 1-Year (%) Market Benchmark (%)
TICR Taxable Total Fund (gross)
TICR Taxable Total Fund (net)
TICR Taxable Total Fund Benchmark
Up Down UpMarket
DownMarket Best Worst Best Worst Up
CaptureDown
Capture R-Squared
89 45 0.57 -0.28 2.67 -1.64 11.06 -0.38 96.0 78.8 90.32
87 47 0.56 -0.29 2.67 -1.64 10.88 -0.51 93.7 81.8 90.28
84 50 0.59 -0.36 2.86 -1.36 10.19 -0.90 100.0 100.0 100.00
Zephyr StyleADVISORZephyr StyleADVISOR: Wells Fargo Advisors
Risk / ReturnNovember 2007 - December 2018 (Single Computation)
Retu
rn
-5%
0%
5%
10%
15%
Standard Deviation0% 1% 2% 3% 4% 5% 6%
TICR Taxable Total Fund (gross)
TICR Taxable Total Fund (net)
Market Benchmark:TICR Taxable Total Fund BenchmarkCash Equivalent:Citigroup 3-month T-bill
TICR Taxable Total Fund (gross)
TICR Taxable Total Fund (net)
TICR Taxable Total Fund Benchmark
Return(%)
Std Dev(%)
Betavs.
Market
Alphavs. Market
(%)
R-Squaredvs. Market
(%)
SharpeRatio
Tracking Errorvs. Market
(%)Observs.
3.08 2.10 0.8938 0.48 90.32 1.2124 0.6954 134
2.92 2.10 0.8927 0.33 90.28 1.1399 0.6966 134
2.90 2.23 1.0000 0.00 100.00 1.0599 0.0000 134
Page 10

Information contained within this report has been developed for the Commonwealth of Virginia Department of the Treasury, its Staff,and Board members. Distribution of this material without the express written consent of Wells Fargo Advisors is strictly prohibited.
Data Sources: Zephyr
Multi-Statistic: Inception
TICR – Taxable: Total Risk Measures
Zephyr StyleADVISORZephyr StyleADVISOR: Wells Fargo Advisors
Manager vs Benchmark: Multi-StatisticNovember 2007 - December 2018 (not annualized if less than 1 year)
Shar
pe R
atio
-0.50
0.00
0.50
1.00
1.50
2.00
1 year 2 years 3 years 5 years 10 years
TICR Taxable Total Fund (gross)TICR Taxable Total Fund (net)TICR Taxable Total Fund Benchmark
Sorti
no R
atio
(MA
R =
Cas
h Eq
.)
-0.50
0.00
0.50
1.00
1.50
2.00
2.503.00
1 year 2 years 3 years 5 years 10 years
TICR Taxable Total Fund (gross)TICR Taxable Total Fund (net)TICR Taxable Total Fund Benchmark
Info
rmat
ion
Ratio
-0.60-0.40
-0.20
0.000.20
0.40
0.60
0.801.00
1 year 2 years 3 years 5 years 10 years
TICR Taxable Total Fund (gross)TICR Taxable Total Fund (net)TICR Taxable Total Fund Benchmark
Page 11

Information contained within this report has been developed for the Commonwealth of Virginia Department of the Treasury, its Staff,and Board members. Distribution of this material without the express written consent of Wells Fargo Advisors is strictly prohibited.
Data Sources: IR+M, Barclays
TICR – Taxable: Short Duration Characteristics
Page 12
Average Duration (yrs)
Effective Maturity (yrs)
Average Quality YTM
Weighted Avg Cpn Convexity
Tracking Error (5y)
IR+M 1.77 1.88 AA 2.85 2.65 0.03 0.13
Short Duration Taxable 1.77 1.88 AA 2.85 2.65 0.03 0.13
Benchmark 1.90 1.98 AA 2.63 2.24 0.04 n/a
Difference (0.13) (0.10) 0.22 0.41 (0.01)
Policy Duration Target 1.90 Policy Duration Range 1.71 - 2.09
As of December 31, 2018
Quarterly Attribution - IR+M 1Q18 2Q18 3Q18 4Q18 Rolling 1-Year
Gross Return (0.23) 0.36 0.40 1.19 1.73Benchmark Return (0.16) 0.28 0.31 1.27 1.71Alpha (0.07) 0.08 0.09 (0.08) 0.02
Country 0.00 0.00 0.00 0.00 0.00Allocation (0.05) 0.03 0.07 (0.07) (0.02)Security Selection 0.00 0.03 0.04 0.04 0.11Duration/Yield Curve 0.00 0.03 0.01 (0.02) 0.02Intraday Trans/Pricing/Residual 0.00 0.01 0.00 0.01 0.02Other (0.02) (0.02) (0.03) (0.04) (0.11)

Information contained within this report has been developed for the Commonwealth of Virginia Department of the Treasury, its Staff,and Board members. Distribution of this material without the express written consent of Wells Fargo Advisors is strictly prohibited.
TICR – Taxable: Short Duration Characteristics
Data Sources: IR+M, Barclays
Sector Allocation Other includes: Non-US Sovereign, Supranational, and Foreign Agencies
Page 13
Name % of PortfolioUS Treasury 14.72%US Treasury 14.42%US Treasury 10.93%CNH 15-A A4 1.64%The Goldman Sachs Group 1.42%TAOT 17-B A4 1.41%WFRBS 13-C18 A3 1.37%Wells Fargo Bank NA 1.28%Morgan Stanley 1.27%Caterpillar Financial 1.26%
Name % of PortfolioThe Goldman Sachs Group 1.42%Wells Fargo Bank NA 1.28%Morgan Stanley 1.27%Caterpillar Financial 1.26%Shell International Finance 1.07%Citigroup Inc 1.05%Wisconsin Public Services 0.92%Lloyds Bank Plc 0.90%Bank of New York Mellon 0.86%JP Morgan Chase & Co 0.86%
Top 10 Corporate Exposure
Top 10 Overall Holdings
Policy Over/(Under)Sector Allocation IR+M Max. Bench (vs Bench)Treasury 40.7 100.0 73.0 (32.4)Agency 1.8 100.0 4.0 (2.3)Corporate 32.7 50.0 15.2 17.5MBS 4.2 20.0 0.0 4.2CMBS 4.4 10.0 0.0 4.4CMO 0.0 10.0 0.0 0.0PAC 0.0 10.0 0.0 0.0ABS 12.9 20.0 0.0 12.9Cash & Equiv. 0.3 0.0 0.3Other 3.0 7.8 (4.7) Total 100.0 100.0
Quality Distribution IR+M BenchTreasury/Agency 42.4 76.8Aaa 22.7 6.5Aa 9.9 5.1A 24.6 11.6Baa 0.0 0.0Other 0.3 0.0 Total 100.0 100.0
Over/UnderWeight
0.00.3
As of December 31, 2018
(34.4)16.24.8
13.1

Information contained within this report has been developed for the Commonwealth of Virginia Department of the Treasury, its Staff,and Board members. Distribution of this material without the express written consent of Wells Fargo Advisors is strictly prohibited.
Zephyr StyleADVISORZephyr StyleADVISOR: Wells Fargo Advisors
Manager vs Benchmark: ReturnNovember 2007 - December 2018 (not annualized if less than 1 year)
Retu
rn
0
0.5
1
1.5
2
2.5
3
1 quarter 6 months 1 year 3 years 5 years 10 years 11 years 2 months
IR&M (gross)IR&M (net)Short Duration Index
Manager vs Benchmark: ReturnNovember 2007 - December 2018 (not annualized if less than 1 year)
IR&M (gross)
IR&M (net)
Short Duration Index
1 quarter 6 months 1 year 3 years 5 years 10 years
1.19% 1.60% 1.73% 1.38% 1.24% 2.61%
1.16% 1.53% 1.59% 1.25% 1.10% 2.48%
1.27% 1.58% 1.71% 1.21% 1.04% 1.19%
11 years 2 months
2.63%
2.50%
1.84%
Zephyr StyleADVISORZephyr StyleADVISOR: Wells Fargo Advisors
Manager vs Morningstar Short-Term Bond: Return RankNovember 2007 - December 2018 (36-Month Moving Windows, Computed Monthly)
Ret
urn
Rank
100%
75%
Median
25%
0%
Oct 2010 Dec 2011 Dec 2013 Dec 2015 Dec 2017 Dec 2018
IR&M (gross)IR&M (net)Short Duration Index5th to 25th Percentile25th Percentile to MedianMedian to 75th Percentile75th to 95th Percentile
Manager vs Morningstar Short-Term Bond: Return RankNovember 2007 - December 2018 (36-Month Moving Windows, Computed Monthly)
IR&M (gross)
IR&M (net)
Short Duration Index
Jun 2011
384 mng
Feb 2012
391 mng
Oct 2012
392 mng
Jun 2013
395 mng
Mar 2014
398 mng
Nov 2014
400 mng
Jul 2015
429 mng
Mar 2016
444 mng
Dec 2016
461 mng
Aug 2017
478 mng
Apr 2018
482 mng
Dec 2018
498 mng
31.71% 53.11% 60.13% 49.04% 45.58% 59.22% 46.54% 22.82% 47.94% 49.33% 52.79% 52.86%
35.55% 55.65% 62.60% 55.17% 51.80% 63.71% 54.28% 31.68% 57.65% 58.11% 60.42% 62.20%
82.74% 95.32% 90.85% 87.46% 82.22% 84.63% 64.00% 34.77% 65.87% 64.39% 66.85% 65.17%
Zephyr StyleADVISORZephyr StyleADVISOR: Wells Fargo Advisors
Calendar Year ReturnAs of December 2018
0%
2%
4%
6%
8%
10%
12%
2018 2017 2016 2015 2014 2013 2012 2011 2010 2009 2008
IR&M (gross)IR&M (net)Short Duration Index
IR&M (gross)
IR&M (net)
Short Duration Index
2018 2017 2016 2015 2014 2013 2012 2011 2010 2009 2008
1.73% 0.99% 1.43% 1.04% 0.99% 0.84% 2.82% 2.52% 3.73% 10.37% 1.95%
1.59% 0.87% 1.30% 0.89% 0.86% 0.71% 2.69% 2.39% 3.59% 10.24% 1.84%
1.71% 0.78% 1.14% 0.77% 0.82% 0.62% 1.14% 1.50% 2.51% 0.90% 6.77%
TICR – Taxable: Short Duration Performance
Data Sources: Zephyr
Calendar Years Trailing Results
Universe: Rolling Twelve-Month Results
Page 14

Information contained within this report has been developed for the Commonwealth of Virginia Department of the Treasury, its Staff,and Board members. Distribution of this material without the express written consent of Wells Fargo Advisors is strictly prohibited.
Data Sources: Zephyr
Up/Down Capture: InceptionRisk/Return (From 11/1/07)
TICR – Taxable: Short Duration Risk Measures
Zephyr StyleADVISORZephyr StyleADVISOR: Wells Fargo Advisors
Upside / DownsideNovember 2007 - December 2018 (Single Computation)
Ups
ide%
0
50
100
150
200
Downside%0 50 100 150 200
IR&M (gross)IR&M (net)Short Duration Index
# of Months Average Return (%)vs. Market Month (%) 1-Year (%) Market Benchmark (%)
IR&M (gross)
IR&M (net)
Short Duration Index
Up Down UpMarket
DownMarket Best Worst Best Worst Up
CaptureDown
Capture R-Squared
99 35 0.32 -0.00 1.91 -2.55 12.92 0.05 106.8 1.4 12.87
98 36 0.31 -0.01 1.91 -2.55 12.78 -0.06 103.4 9.0 13.05
90 44 0.30 -0.16 1.75 -0.88 6.99 -0.04 100.0 100.0 100.00
Zephyr StyleADVISORZephyr StyleADVISOR: Wells Fargo Advisors
Risk / ReturnNovember 2007 - December 2018 (Single Computation)
Retu
rn
-5%
0%
5%
10%
15%
Standard Deviation0% 0.5% 1% 1.5% 2% 2.5%
IR&M (gross)
IR&M (net)
Market Benchmark:Short Duration IndexCash Equivalent:Citigroup 3-month T-bill
IR&M (gross)
IR&M (net)
Short Duration Index
Return(%)
Std Dev(%)
Betavs.
Market
Alphavs. Market
(%)
R-Squaredvs. Market
(%)
SharpeRatio
Tracking Errorvs. Market
(%)Observs.
2.63 1.69 0.4923 1.72 12.87 1.2422 1.6932 134
2.50 1.69 0.4953 1.59 13.05 1.1656 1.6896 134
1.84 1.23 1.0000 0.00 100.00 1.0638 0.0000 134
Page 15

Information contained within this report has been developed for the Commonwealth of Virginia Department of the Treasury, its Staff,and Board members. Distribution of this material without the express written consent of Wells Fargo Advisors is strictly prohibited.
Data Sources: Zephyr
Multi-Statistic: Inception
TICR – Taxable: Short Duration Risk Measures
Zephyr StyleADVISORZephyr StyleADVISOR: Wells Fargo Advisors
Manager vs Benchmark: Multi-StatisticNovember 2007 - December 2018 (not annualized if less than 1 year)
Shar
pe R
atio
-0.50
0.00
0.50
1.00
1.50
2.00
1 year 2 years 3 years 5 years 10 years
IR&M (gross)IR&M (net)Short Duration Index
Sorti
no R
atio
(MA
R =
Cas
h Eq
.)
-1.00
0.00
1.00
2.00
3.00
4.00
5.00
6.007.00
1 year 2 years 3 years 5 years 10 years
IR&M (gross)IR&M (net)Short Duration Index
Info
rmat
ion
Ratio
-0.50
0.00
0.50
1.00
1.50
2.00
1 year 2 years 3 years 5 years 10 years
IR&M (gross)IR&M (net)Short Duration Index
Page 16
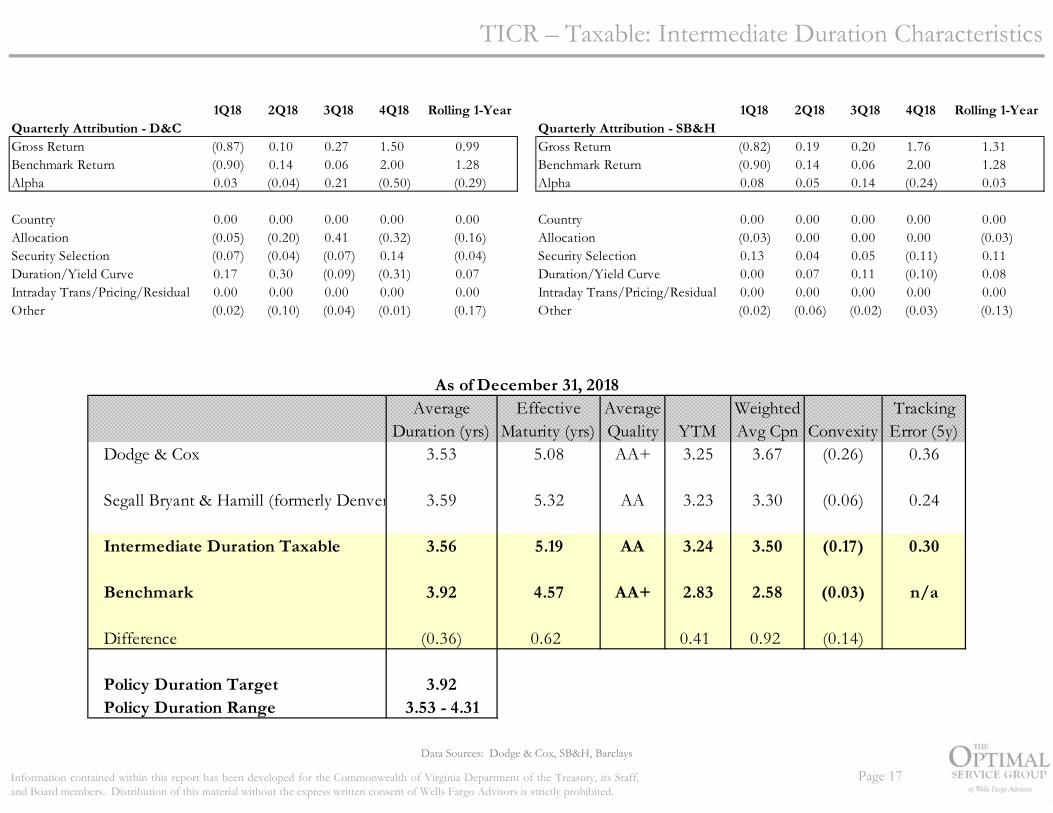
Information contained within this report has been developed for the Commonwealth of Virginia Department of the Treasury, its Staff,and Board members. Distribution of this material without the express written consent of Wells Fargo Advisors is strictly prohibited.
Data Sources: Dodge & Cox, SB&H, Barclays
TICR – Taxable: Intermediate Duration Characteristics
Page 17
1Q18 2Q18 3Q18 4Q18 Rolling 1-Year
Gross Return (0.87) 0.10 0.27 1.50 0.99Benchmark Return (0.90) 0.14 0.06 2.00 1.28Alpha 0.03 (0.04) 0.21 (0.50) (0.29)
Country 0.00 0.00 0.00 0.00 0.00Allocation (0.05) (0.20) 0.41 (0.32) (0.16)Security Selection (0.07) (0.04) (0.07) 0.14 (0.04)Duration/Yield Curve 0.17 0.30 (0.09) (0.31) 0.07Intraday Trans/Pricing/Residual 0.00 0.00 0.00 0.00 0.00Other (0.02) (0.10) (0.04) (0.01) (0.17)
Quarterly Attribution - D&C
Average Duration (yrs)
Effective Maturity (yrs)
Average Quality YTM
Weighted Avg Cpn Convexity
Tracking Error (5y)
Dodge & Cox 3.53 5.08 AA+ 3.25 3.67 (0.26) 0.36
Segall Bryant & Hamill (formerly Denver 3.59 5.32 AA 3.23 3.30 (0.06) 0.24
Intermediate Duration Taxable 3.56 5.19 AA 3.24 3.50 (0.17) 0.30
Benchmark 3.92 4.57 AA+ 2.83 2.58 (0.03) n/a
Difference (0.36) 0.62 0.41 0.92 (0.14)
Policy Duration Target 3.92 Policy Duration Range 3.53 - 4.31
As of December 31, 2018
1Q18 2Q18 3Q18 4Q18 Rolling 1-Year
Gross Return (0.82) 0.19 0.20 1.76 1.31Benchmark Return (0.90) 0.14 0.06 2.00 1.28Alpha 0.08 0.05 0.14 (0.24) 0.03
Country 0.00 0.00 0.00 0.00 0.00Allocation (0.03) 0.00 0.00 0.00 (0.03)Security Selection 0.13 0.04 0.05 (0.11) 0.11Duration/Yield Curve 0.00 0.07 0.11 (0.10) 0.08Intraday Trans/Pricing/Residual 0.00 0.00 0.00 0.00 0.00Other (0.02) (0.06) (0.02) (0.03) (0.13)
Quarterly Attribution - SB&H

Information contained within this report has been developed for the Commonwealth of Virginia Department of the Treasury, its Staff,and Board members. Distribution of this material without the express written consent of Wells Fargo Advisors is strictly prohibited.
Data Sources: Dodge & Cox, SB&H, Barclays
TICR – Taxable: Intermediate Duration Characteristics
Page 18
Dodge Total Policy Over/ (Under)
& Cox Portfolio Max. Bench (vs Bench)Treasury 18.1 35.2 26.2 100.0 61.4 (35.3)Agency 2.9 0.0 1.5 100.0 2.2 (0.6)Corporate 27.9 32.6 30.1 50.0 21.4 8.7MBS 31.8 16.1 24.4 50.0 15.0 9.4CMBS 0.1 0.8 0.4 10.0 0.0 0.4CMO 5.8 0.0 3.1 10.0 0.0 3.1PAC 0.0 0.0 0.0 10.0 0.0 0.0ABS 9.7 7.2 8.5 10.0 0.0 8.5Cash & Equiv. 1.5 0.0 0.8 0.0 0.8Other 2.3 8.0 5.0 0.0 5.0
100.0 100.0 100.0 100.0
Dodge Total & Cox Portfolio Bench
Treasury/Agency 59.5 52.1 56.0 78.6Aaa 10.3 10.2 10.3 4.3Aa 8.6 17.2 12.6 4.0A 19.8 20.5 20.1 13.2Baa 1.8 0.0 0.9 0.0Other 0.0 0.0 0.0 0.0
100.0 100.0 100.0 100.0
As of December 31, 2018Segall
Bryant & Hamill
(22.6)
Segall Bryant &
Hamill
Sector Allocation
Quality Distribution
Over/UnderWeight
0.0
8.76.0
7.00.9
US Treasury 4.07% US Treasury 9.95%US Treasury 3.12% US Treasury 9.85%US Treasury 3.07% US Treasury 5.30%Fannie Mae 2.60% US Treasury 3.33%SLC Student Loan Trust 2.55% US Treasury 2.49%SLM Student Loan Trust 2.54% US Treasury 2.23%US Treasury 2.39% US Treasury 2.08%Freddie Mac Gold 2.28% Berkshire Hathaway 1.89%US Treasury 2.26% AMXCA 17-1 A 1.66%Freddie Mac Gold 2.04% Alabama Power Co 1.42%
Segall Bryant & Hamill as of December 31, 2018
Top Ten Overall Positions
Dodge & Cox
AmEx Credit Master Trust 2.80% Berkshire Hathaway 1.89%SLC Student Loan Trust 2.55% Alabama Power Co 1.42%SLM Student Loan Trust 2.54% Charles Schwab Corp 1.37%Wells Fargo & Co 2.16% Toronto Dominion Bank 1.34%Burlington Northern Santa Fe 1.88% Pacificorp 1.23%HSBC 1.84% DTE Electric Co 1.20%Caterpillar 1.70% Occidental Petroleum 1.18%Bank of New York Mellon 1.68% Toyota Motor Credit 1.18%Aegon Funding Co 1.64% US Bank NA 1.17%Union Pacific 1.62% American Express Credit 1.14%
as of December 31, 2018Segall Bryant & HamillDodge & Cox
Top Ten Overall Corporate Positions
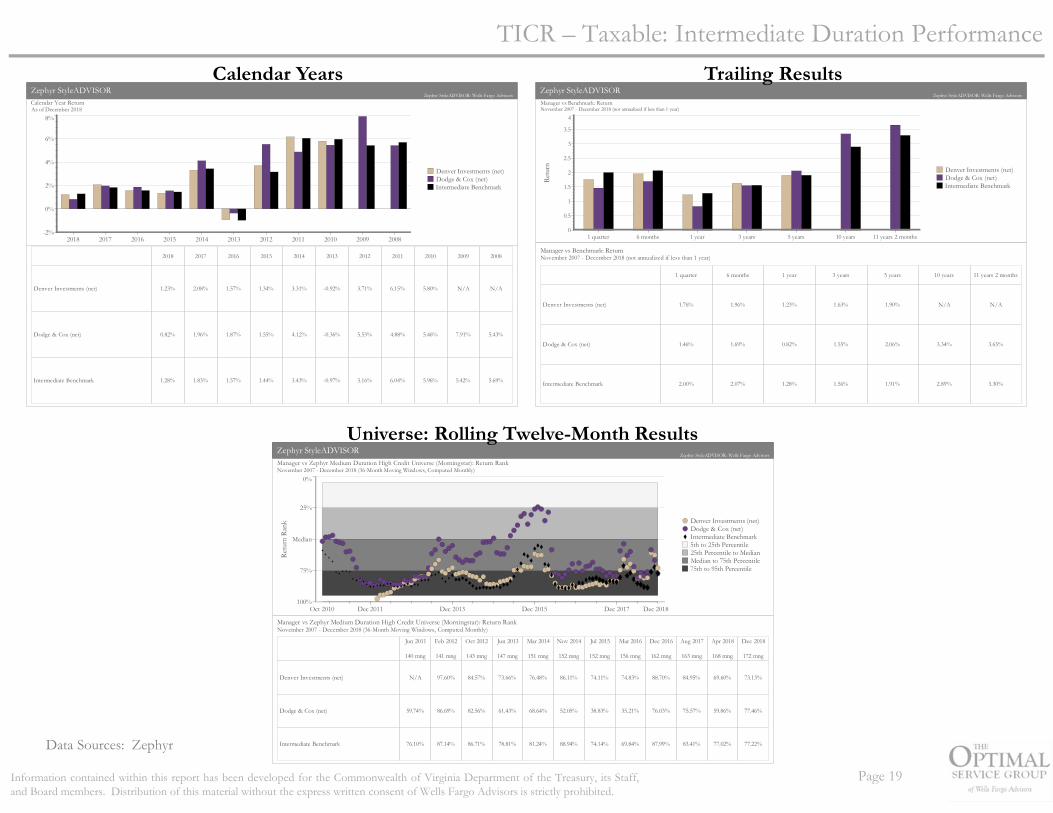
Information contained within this report has been developed for the Commonwealth of Virginia Department of the Treasury, its Staff,and Board members. Distribution of this material without the express written consent of Wells Fargo Advisors is strictly prohibited.
Zephyr StyleADVISORZephyr StyleADVISOR: Wells Fargo Advisors
Manager vs Zephyr Medium Duration High Credit Universe (Morningstar): Return RankNovember 2007 - December 2018 (36-Month Moving Windows, Computed Monthly)
Retu
rn R
ank
100%
75%
Median
25%
0%
Oct 2010 Dec 2011 Dec 2013 Dec 2015 Dec 2017 Dec 2018
Denver Investments (net)Dodge & Cox (net)Intermediate Benchmark5th to 25th Percentile25th Percentile to MedianMedian to 75th Percentile75th to 95th Percentile
Manager vs Zephyr Medium Duration High Credit Universe (Morningstar): Return RankNovember 2007 - December 2018 (36-Month Moving Windows, Computed Monthly)
Denver Investments (net)
Dodge & Cox (net)
Intermediate Benchmark
Jun 2011
140 mng
Feb 2012
141 mng
Oct 2012
143 mng
Jun 2013
147 mng
Mar 2014
151 mng
Nov 2014
152 mng
Jul 2015
152 mng
Mar 2016
156 mng
Dec 2016
162 mng
Aug 2017
163 mng
Apr 2018
168 mng
Dec 2018
172 mng
N/A 97.60% 84.57% 73.66% 76.48% 86.11% 74.11% 74.83% 88.70% 84.95% 69.60% 73.13%
59.74% 86.69% 82.56% 61.43% 68.64% 52.05% 38.83% 35.21% 76.03% 75.57% 59.86% 77.46%
76.10% 87.14% 86.71% 78.81% 81.24% 88.94% 74.14% 69.84% 87.99% 83.41% 77.02% 77.22%
Zephyr StyleADVISORZephyr StyleADVISOR: Wells Fargo Advisors
Manager vs Benchmark: ReturnNovember 2007 - December 2018 (not annualized if less than 1 year)
Retu
rn
0
0.5
1
1.5
2
2.5
3
3.5
4
1 quarter 6 months 1 year 3 years 5 years 10 years 11 years 2 months
Denver Investments (net)Dodge & Cox (net)Intermediate Benchmark
Manager vs Benchmark: ReturnNovember 2007 - December 2018 (not annualized if less than 1 year)
Denver Investments (net)
Dodge & Cox (net)
Intermediate Benchmark
1 quarter 6 months 1 year 3 years 5 years 10 years
1.76% 1.96% 1.23% 1.63% 1.90% N/A
1.46% 1.69% 0.82% 1.55% 2.06% 3.34%
2.00% 2.07% 1.28% 1.56% 1.91% 2.89%
11 years 2 months
N/A
3.65%
3.30%
Data Sources: Zephyr
Calendar Years Trailing Results
Universe: Rolling Twelve-Month Results
Zephyr StyleADVISORZephyr StyleADVISOR: Wells Fargo Advisors
Calendar Year ReturnAs of December 2018
-2%
0%
2%
4%
6%
8%
2018 2017 2016 2015 2014 2013 2012 2011 2010 2009 2008
Denver Investments (net)Dodge & Cox (net)Intermediate Benchmark
Denver Investments (net)
Dodge & Cox (net)
Intermediate Benchmark
2018 2017 2016 2015 2014 2013 2012 2011 2010 2009 2008
1.23% 2.08% 1.57% 1.34% 3.31% -0.92% 3.71% 6.15% 5.80% N/A N/A
0.82% 1.96% 1.87% 1.55% 4.12% -0.36% 5.53% 4.88% 5.46% 7.91% 5.43%
1.28% 1.83% 1.57% 1.44% 3.43% -0.97% 3.16% 6.04% 5.96% 5.42% 5.69%
Page 19
TICR – Taxable: Intermediate Duration Performance

Information contained within this report has been developed for the Commonwealth of Virginia Department of the Treasury, its Staff,and Board members. Distribution of this material without the express written consent of Wells Fargo Advisors is strictly prohibited.
Data Sources: Zephyr
Up/Down Capture: InceptionRisk/Return (From 11/1/07)Zephyr StyleADVISOR
Zephyr StyleADVISOR: Wells Fargo Advisors
Upside / DownsideMarch 2009 - December 2018 (Single Computation)
Ups
ide%
70
80
90
100
110
120
130
Downside%70 80 90 100 110 120 130
Denver Investments (net)Dodge & Cox (net)Intermediate Benchmark
# of Months Average Return (%)vs. Market Month (%) 1-Year (%) Market Benchmark (%)
Denver Investments (net)
Dodge & Cox (net)
Intermediate Benchmark
Up Down UpMarket
DownMarket Best Worst Best Worst Up
CaptureDown
Capture R-Squared
72 46 0.56 -0.38 1.43 -1.68 7.62 -1.33 91.8 93.8 94.57
81 37 0.59 -0.29 1.35 -1.50 9.02 -0.94 96.6 73.3 88.47
76 42 0.61 -0.40 1.53 -1.68 8.30 -1.33 100.0 100.0 100.00
Zephyr StyleADVISORZephyr StyleADVISOR: Wells Fargo Advisors
Risk / ReturnNovember 2007 - December 2018 (Single Computation)
Retu
rn
-5%
0%
5%
10%
15%
Standard Deviation0% 1% 2% 3% 4% 5% 6%
Dodge & Cox (net)
Market Benchmark:Intermediate BenchmarkCash Equivalent:Citigroup 3-month T-bill
Dodge & Cox (net)
Intermediate Benchmark
Return(%)
Std Dev(%)
Betavs.
Market
Alphavs. Market
(%)
R-Squaredvs. Market
(%)
SharpeRatio
Tracking Errorvs. Market
(%)Observs.
3.65 2.21 0.7795 1.07 88.93 1.4149 0.9413 134
3.30 2.67 1.0000 0.00 100.00 1.0351 0.0000 134
TICR – Taxable: Intermediate Duration Risk Measures
Page 20
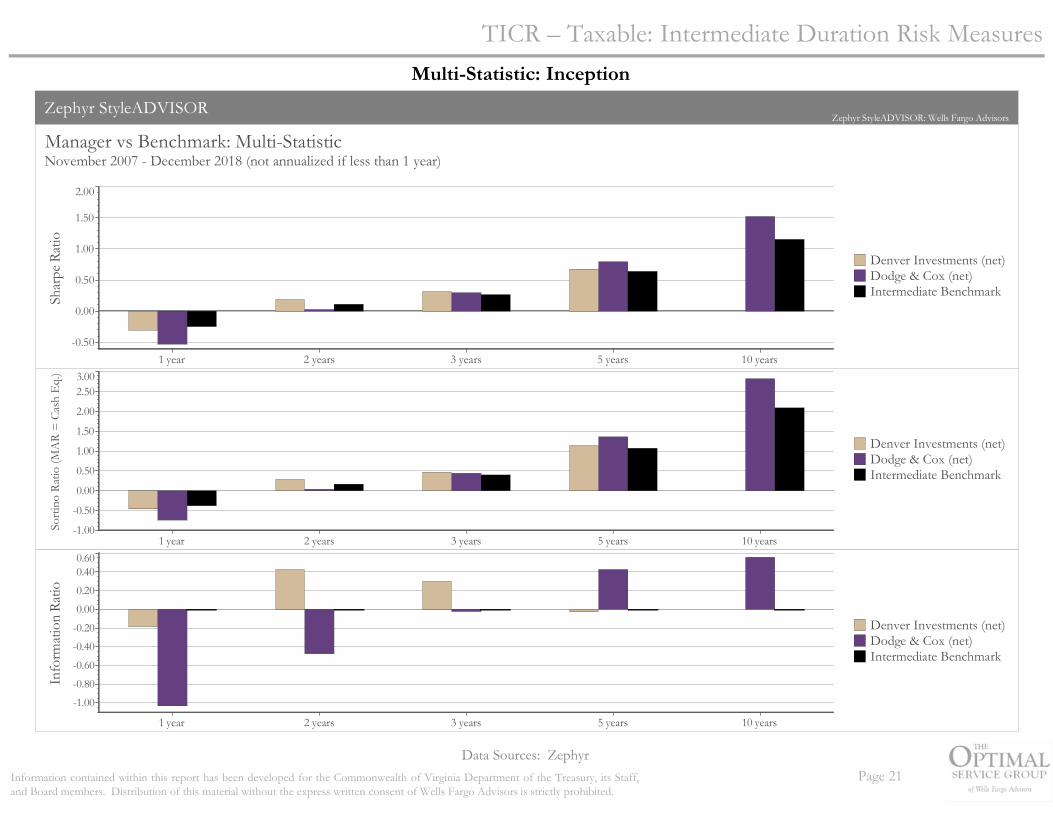
Information contained within this report has been developed for the Commonwealth of Virginia Department of the Treasury, its Staff,and Board members. Distribution of this material without the express written consent of Wells Fargo Advisors is strictly prohibited.
Data Sources: Zephyr
Multi-Statistic: Inception
Zephyr StyleADVISORZephyr StyleADVISOR: Wells Fargo Advisors
Manager vs Benchmark: Multi-StatisticNovember 2007 - December 2018 (not annualized if less than 1 year)
Shar
pe R
atio
-0.50
0.00
0.50
1.00
1.50
2.00
1 year 2 years 3 years 5 years 10 years
Denver Investments (net)Dodge & Cox (net)Intermediate Benchmark
Sorti
no R
atio
(MA
R =
Cas
h E
q.)
-1.00
-0.50
0.00
0.50
1.00
1.50
2.00
2.503.00
1 year 2 years 3 years 5 years 10 years
Denver Investments (net)Dodge & Cox (net)Intermediate Benchmark
Info
rmat
ion
Ratio
-1.00-0.80
-0.60-0.40-0.20
0.000.200.400.60
1 year 2 years 3 years 5 years 10 years
Denver Investments (net)Dodge & Cox (net)Intermediate Benchmark
Page 21
TICR – Taxable: Intermediate Duration Risk Measures

Information contained within this report has been developed for the Commonwealth of Virginia Department of the Treasury, its Staff,and Board members. Distribution of this material without the express written consent of Wells Fargo Advisors is strictly prohibited.
This page intentionally left blank.
Page 22

Information contained within this report has been developed for the Commonwealth of Virginia Department of the Treasury, its Staff,and Board members. Distribution of this material without the express written consent of Wells Fargo Advisors is strictly prohibited.
II. TICR - Tax-Exempt: Executive SummaryTICR Tax-Exempt Total Portfolio (p. 43-47): The TICR Tax-Exempt TotalPortfolio gained 171 bps during the fourth quarter which outperformed thebenchmark by 5 bps. For the trailing one-year, the portfolio advanced 131 bpscompared to a gain of 161 bps for the benchmark. All returns are net of fees. Froman attribution perspective over the one-year period, security selection, sectorallocation and duration positioning each had minimal impact on returns while otherresidual factors combined to detract 12 bps.
The passage of the Tax Jobs and Cuts Act in December 2017 derailed staterevenues estimates, in a good way. The preliminary findings for FY2018 (whichended June 30th for the majority of states) showed 40 states exceeding theiroriginal revenue projections; the highest number since 2006. Just seven statesreported making mid-year budget cuts. While analysts are at work to determinehow much of the increase is one-time versus on-going, states are squirreling thiswindfall into their reserves. According to a report from the National Association ofState Budget Officers, 35 states surpassed their Rainy Day Fund goals for the year.Overall, states are predicting more modest increases for FY2019, which is morethan halfway through for most states.
Coming off a strong budget year and looking at the current environment markedby a volatile stock market, trade wars, and a budget shutdown, states are seizing theopportunity to strengthen budget practices and policies to give officials better toolsto address upcoming budgets.
There is never an opportune time to shut the government down but fortunately,this government shutdown is occurring when states are in a strong and improvingfinancial position to withstand this period of uncertainty. With states showing acontinued movement towards fiscal responsibly by addressing long-term expensesand increasing savings overall, they are in a better position to withstand paymentdelays now than five years ago. In addition, despite the high reliance on federal aid,because most of it is not considered discretionary, payments will be made for thelargest programs ensuring consistent, uninterrupted healthcare and education. Withreserves up and sounder fiscal policies in place, state budgets are better positionedto assist their citizens.
Short Duration Tax-Exempt Portfolio (p. 49-53): The BlackRock portfoliogained 96 bps over the quarter which outperformed the benchmark by 6 bps. Forthe trailing one-year period, the portfolio underperformed by 31 bps (1.5% v.1.9%). Security selection detracted 15 bps over the trailing one-year while sectorallocation detracted 3 bps. Duration/yield curve positioning added 5 bps andresidual factors combined to detract 3 bps. The portfolio management teamlengthened portfolio duration in order to pick up some income accrual inanticipation of a favorable supply/demand dynamic. Duration and yield curvepositioning were the largest contributors to the performance for the period,especially overweight in the 4+ year maturities as the municipal yield curveflattened. Sector allocation, overweight to local tax backed securities also werepositive to the performance, however security selection within tax backed statesand transportations sector slightly hindered performance. There continues to be abias toward higher quality in their portfolio.
Intermediate Duration Tax-Exempt Portfolio (p. 55-59): IR+Munderperformed the benchmark during the fourth quarter by 11 bps (1.9% v.2.0%). For the trailing one-year period, the portfolio gained 1.3% which trailed thebenchmark by 31 bps. All returns are net of fees. Security selection contributed 6bps over the trailing one-year. Duration/yield curve positioning detracted 2 bpswhile intraday pricing and other residual factors combined to detract 23 bps overthe same time period. The municipal market underperformed in the first part of2018, largely due to strong economic data and economic policies viewed asinflationary. There was a palpable optimistic undertone, fortified by the Fed, taxcuts and revenue growth that led to record multiples for US stocks. In the latterhalf of the year, however, ongoing trade concerns, geopolitical tensions andweakening economic indicators tripped up markets, despite the Fed’s doggednessto move ahead with more rate hikes. While most fixed income and equity marketsunderperformed due to the late-year volatility, tax-exempt municipals were one ofthe best performing asset classes in 2018.
Page 23

Information contained within this report has been developed for the Commonwealth of Virginia Department of the Treasury, its Staff,and Board members. Distribution of this material without the express written consent of Wells Fargo Advisors is strictly prohibited.
TICR – Tax Exempt: Summary
1 Annualized 2 September 30, 20053 25% Barclays 1-3 Muni Bond Index, 70% Barclays 5-10 Muni Bond Index, 5% Federated Tax-Free Obligation Fund.
* Returns are reported by JP Morgan Chase
Page 24
Actual Allocation as of December 31, 2018TICR – Tax Exempt Target Allocation
Policy Range:(10-40%)
Policy Range:(60-80%)
Policy Range:(0-25%)
% of Portfolio Market Value 4Q18 FYTD 1 Yr 3 Yr1 5 Yr1 10 Yr1 Inception2
Inception Benchmark
Average Duration
Average Maturity
Average Quality
100% 187,620,858$ Total Fund 1.7 1.6 1.4 1.5 2.2 3.1 3.2 3.6 4.38 5.19 AA
Target Benchmark3 1.7 1.6 1.6 1.7 2.5 3.4 3.99 6.27 AA+
22% 41,913,696$ Total Short Duration Tax-Exempt 1.0 0.9 1.5 0.8 0.7 1.2 1.8 2.3 1.92 2.09 AA+Barclays 1-3 Muni Bond Index + 10bps 0.9 0.9 1.9 1.1 1.0 1.7 1.83 2.02 AA
22% 41,913,696$ BlackRock 1.0 0.9 1.5 0.8 0.7 1.2 1.8 2.3 1.92 2.09 AA+
78% 145,703,819$ Total Intermediate Duration Tax-Exempt 1.9 1.8 1.3 1.7 2.9 3.8 3.7 4.2 5.09 6.08 AABarclays 5-10 Muni Bond Index + 10 bps 2.0 2.0 1.6 1.9 3.1 4.2 5.05 8.24 AA
78% 145,703,819$ IR+M 1.9 1.8 1.3 1.7 2.9 -- 3.2 3.3 5.09 6.08 AA
0.00% 3,343$ Total Tax-Exempt Short-Term Fund 0.4 0.7 1.2 0.8 0.5 -- 1.0 1.00.00% 3,343$ BlackRock MuniCash Fund #015 0.4 0.7 1.2 0.8 0.5 -- 1.0 1.0
Periods Ending December 31, 2018 (Net of Fees)

Information contained within this report has been developed for the Commonwealth of Virginia Department of the Treasury, its Staff,and Board members. Distribution of this material without the express written consent of Wells Fargo Advisors is strictly prohibited.
TICR - Tax Exempt: Financial Reconciliation
Source: JP Morgan Chase
* Please note that values include accruals for each account.
Page 25
Current Financial Reconciliation
Fiscal Year To Date 2019Short Intermediate
Duration Duration Cash
BlackRock IR+M Money Market Total PortfolioMarket Value (6/30/18) 43,898,042 143,128,710 27,625 187,054,377
Net Contributions/Other Receipts 0 0 2,369,000 2,369,000Net Withdrawals/Other Payouts (2,369,000) 0 (2,393,379) (4,762,379)Expenses (26,649) (91,208) 0 (117,857)Net Cash Flow (2,395,649) (91,208) (24,379) (2,511,235)
Earned Income 364,736 1,877,049 89 2,241,875Net Realized Gain/(Loss) (44,421) 81,357 (1) 36,936Change in Unrealized Gain/(Loss) 90,987 707,910 8 798,905Total Investment Gain/(Loss) 411,302 2,666,317 96 3,077,716
Market Value (12/31/18) 41,913,696 145,703,819 3,343 187,620,858
Total Portfolio Inception
0
1,272,634,285(1,181,832,464)
(5,239,193)85,562,629
111,021,99714,562,315
(23,526,083)102,058,229
187,620,858
% of UnrealizedFixed Income Cash Equiv. Market Value Total Cost Value Gain/(Loss)
BlackRock 41,329,296 584,400 41,913,696 22.3% 42,011,813 (98,118)Short Duration Portfolio 41,329,296 584,400 41,913,696 22.3% 42,011,813 (98,118)
IR+M 143,809,396 1,894,423 145,703,819 77.7% 146,028,900 (325,081)Intermediate Duration Portfolio 143,809,396 1,894,423 145,703,819 77.7% 146,028,900 (325,081)
Money Market Fund - 3,343 3,343 0.0% 3,343 -
Total Portfolio 185,138,691 2,482,166 187,620,858 100% 188,044,056 (423,199) 98.7% 1.3% 100.0%

Information contained within this report has been developed for the Commonwealth of Virginia Department of the Treasury, its Staff,and Board members. Distribution of this material without the express written consent of Wells Fargo Advisors is strictly prohibited.
TICR – Tax Exempt: Account History
Source: JP Morgan Chase
Page 26
$187,621,000
$330,625,000

Information contained within this report has been developed for the Commonwealth of Virginia Department of the Treasury, its Staff,and Board members. Distribution of this material without the express written consent of Wells Fargo Advisors is strictly prohibited.
Zephyr StyleADVISORZephyr StyleADVISOR: Wells Fargo Advisors
Manager vs Morningstar Muni National Interm: Return RankOctober 2005 - December 2018 (36-Month Moving Windows, Computed Monthly)
Retu
rn R
ank
100%
75%
Median
25%
0%
Sep 2008 Dec 2009 Dec 2011 Dec 2013 Dec 2015 Dec 2017 Dec 2018
Total Fund (gross)Total Fund (net)Total Fund Benchmark5th to 25th Percentile25th Percentile to MedianMedian to 75th Percentile75th to 95th Percentile
Manager vs Morningstar Muni National Interm: Return RankOctober 2005 - December 2018 (36-Month Moving Windows, Computed Monthly)
Total Fund (gross)
Total Fund (net)
Total Fund Benchmark
Jul 2009
190 mng
May 2010
196 mng
Apr 2011
206 mng
Feb 2012
208 mng
Dec 2012
213 mng
Nov 2013
219 mng
Sep 2014
234 mng
Jul 2015
248 mng
Jun 2016
266 mng
Apr 2017
272 mng
Feb 2018
276 mng
Dec 2018
288 mng
7.23% 16.71% 22.91% 91.56% 87.48% 82.85% 92.37% 72.35% 87.37% 70.34% 67.94% 56.19%
11.54% 33.86% 36.91% 93.89% 92.13% 88.93% 94.57% 79.23% 90.41% 79.05% 77.95% 64.46%
1.12% 5.09% 8.66% 90.92% 86.32% 75.78% 91.03% 57.65% 86.36% 67.47% 61.55% 48.52%
Zephyr StyleADVISORZephyr StyleADVISOR: Wells Fargo Advisors
Manager vs Benchmark: ReturnOctober 2005 - December 2018 (not annualized if less than 1 year)
Retu
rn
0
0.5
1
1.5
2
2.5
3
3.5
4
1 quarter 6 months 1 year 3 years 5 years 10 years 13 years 1 quarter
Total Fund (gross)Total Fund (net)Total Fund Benchmark
Manager vs Benchmark: ReturnOctober 2005 - December 2018 (not annualized if less than 1 year)
Total Fund (gross)
Total Fund (net)
Total Fund Benchmark
1 quarter 6 months 1 year 3 years 5 years 10 years
1.73% 1.67% 1.49% 1.63% 2.39% 3.29%
1.71% 1.60% 1.35% 1.49% 2.24% 3.11%
1.66% 1.60% 1.61% 1.71% 2.47% 3.37%
13 years 1 quarter
3.34%
3.15%
3.55%
TICR – Tax Exempt: Total Performance
Data Sources: Zephyr
Calendar Years Trailing Results
Universe: Rolling Twelve-Month Results
Zephyr StyleADVISORZephyr StyleADVISOR: Wells Fargo Advisors
Calendar Year ReturnAs of December 2018
-2%
0%
2%
4%
6%
8%
2018 2017 2016 2015 2014 2013 2012 2011 2010 2009 2008 2007 2006
Total Fund (gross)Total Fund (net)Total Fund Benchmark
Total Fund (gross)
Total Fund (net)
Total Fund Benchmark
2018 2017 2016 2015 2014 2013 2012 2011 2010 2009 2008 2007 2006
1.49% 3.37% 0.05% 2.51% 4.62% -0.66% 3.43% 7.65% 3.07% 7.72% 2.21% 4.23% 3.98%
1.35% 3.22% -0.09% 2.36% 4.43% -0.86% 3.22% 7.45% 2.81% 7.48% 1.97% 4.00% 3.77%
1.61% 3.59% -0.04% 2.63% 4.61% -0.30% 3.37% 7.91% 3.32% 7.36% 4.12% 4.82% 3.88%
Page 27

Information contained within this report has been developed for the Commonwealth of Virginia Department of the Treasury, its Staff,and Board members. Distribution of this material without the express written consent of Wells Fargo Advisors is strictly prohibited.
Data Sources: Zephyr
Up/Down Capture: InceptionRisk/Return (From 10/1/05)
TICR – Tax Exempt: Total Risk Measures
Zephyr StyleADVISORZephyr StyleADVISOR: Wells Fargo Advisors
Risk / ReturnOctober 2005 - December 2018 (Single Computation)
Retu
rn
-5%
0%
5%
10%
15%
Standard Deviation0% 1% 2% 3% 4% 5% 6%
Total Fund (gross)
Total Fund (net)
Market Benchmark:Total Fund BenchmarkCash Equivalent:Citigroup 3-month T-bill
Total Fund (gross)
Total Fund (net)
Total Fund Benchmark
Return(%)
Std Dev(%)
Betavs.
Market
Alphavs. Market
(%)
R-Squaredvs. Market
(%)
SharpeRatio
Tracking Errorvs. Market
(%)Observs.
3.34 2.84 0.9779 -0.13 96.42 0.7618 0.5414 159
3.15 2.83 0.9741 -0.30 96.31 0.6973 0.5487 159
3.55 2.85 1.0000 0.00 100.00 0.8334 0.0000 159
Zephyr StyleADVISORZephyr StyleADVISOR: Wells Fargo Advisors
Upside / DownsideOctober 2005 - December 2018 (Single Computation)
Ups
ide%
92
94
96
98
100
102
104
106
108
Downside%92 94 96 98 100 102 104 106 108
Total Fund (gross)Total Fund (net)Total Fund Benchmark
# of Months Average Return (%)vs. Market Month (%) 1-Year (%) Market Benchmark (%)
Total Fund (gross)
Total Fund (net)
Total Fund Benchmark
Up Down UpMarket
DownMarket Best Worst Best Worst Up
CaptureDown
Capture R-Squared
104 55 0.69 -0.56 2.81 -2.98 10.77 -1.42 96.1 99.6 96.42
103 56 0.67 -0.57 2.75 -2.98 10.53 -1.62 93.7 101.8 96.31
107 52 0.71 -0.56 3.17 -2.83 10.82 -1.05 100.0 100.0 100.00
Page 28

Information contained within this report has been developed for the Commonwealth of Virginia Department of the Treasury, its Staff,and Board members. Distribution of this material without the express written consent of Wells Fargo Advisors is strictly prohibited.
Data Sources: Zephyr
Multi-Statistic: InceptionZephyr StyleADVISOR
Zephyr StyleADVISOR: Wells Fargo Advisors
Manager vs Benchmark: Multi-StatisticOctober 2005 - December 2018 (not annualized if less than 1 year)
Shar
pe R
atio
-0.20
0.00
0.20
0.40
0.60
0.80
1.001.20
1 year 3 years 5 years 7 years 10 years 13 years 1 quarter
Total Fund (gross)Total Fund (net)Total Fund Benchmark
Sorti
no R
atio
(MA
R =
Cas
h E
q.)
-0.50
0.00
0.50
1.00
1.50
2.00
1 year 3 years 5 years 7 years 10 years 13 years 1 quarter
Total Fund (gross)Total Fund (net)Total Fund Benchmark
Info
rmat
ion
Ratio
-1.20
-1.00
-0.80
-0.60
-0.40
-0.20
0.00
1 year 3 years 5 years 7 years 10 years 13 years 1 quarter
Total Fund (gross)Total Fund (net)Total Fund Benchmark
Page 29
TICR – Tax Exempt: Total Risk Measures

Information contained within this report has been developed for the Commonwealth of Virginia Department of the Treasury, its Staff,and Board members. Distribution of this material without the express written consent of Wells Fargo Advisors is strictly prohibited.
Page 30
TICR – Tax Exempt: Total Characteristics
Average Duration (yrs)
Average Maturity (yrs)
Average Quality YTM
Tax-Equiv YTM
Weighted Avg Cpn Convexity
Tracking Error
Short Duration Tax-Exempt 1.92 2.09 AA+ 1.82 2.80 4.58 0.07 0.25
Intermediate Duration tax-Exempt 5.09 6.08 AA 2.35 3.62 4.81 0.26 0.29
Total Fund 4.38 5.19 AA 2.23 3.43 4.76 0.22 0.28
Benchmark 3.99 6.27 AA+ 2.07 3.18 4.56 0.15 n/a
Difference 0.39 (1.08) 0.17 0.25 0.20 0.07
Policy Duration Target 3.99 Policy Duration Range 3.59 - 4.39
As of December 31, 2018
Total Portfolio 1Q18 2Q18 3Q18 4Q18
Gross Return (0.90) 0.74 (0.07) 1.73 1.49Benchmark Return (0.79) 0.80 (0.06) 1.66 1.61Alpha (0.11) (0.07) (0.01) 0.07 (0.12)
Country 0.00 0.00 0.00 0.00 0.00Allocation (0.01) (0.00) (0.00) 0.01 (0.01)Security Selection 0.01 (0.02) (0.01) 0.04 0.01Duration/Yield Curve 0.01 0.00 (0.00) (0.02) (0.01)Intraday Trans/Pricing/Residual (0.02) (0.05) 0.06 (0.07) (0.09)Other (0.10) 0.01 (0.05) 0.11 (0.03)
Rolling 1-Year

Information contained within this report has been developed for the Commonwealth of Virginia Department of the Treasury, its Staff,and Board members. Distribution of this material without the express written consent of Wells Fargo Advisors is strictly prohibited.
Page 31
TICR – Tax Exempt: Total Characteristics
Short Intermediate Money Total Policy Over/(Under)Sector Allocation Duration Duration Market Fund Max. Bench vs. BenchGeneral Obligation 49.0 45.4 0.0 46.2 75.0 32.0 14.2Revenue Bonds 50.4 50.0 0.0 50.1 60.0 53.8 (3.7)Money Market 0.0 0.2 100.0 0.1 25.0 5.0 (4.9)Other Tax-Exempt 0.6 4.4 0.0 3.6 10.0 9.2 (5.6) Total 100.0 100.0 100.0 100.0 100.0
Short Intermediate Money Total Quality Distribution Duration Duration Market Fund BenchTreasury/Agency 0.0 0.0 100.0 0.0 5.0Aaa 39.0 17.6 0.0 22.4 17.1Aa 49.4 58.2 0.0 56.2 53.1A 0.0 24.2 0.0 18.8 23.2Baa 0.0 0.0 0.0 0.0 0.0Other 11.6 0.0 0.0 2.6 1.6 Total 100.0 100.0 100.0 100.0 100.0
As of December 31, 2018
0.01.0
Over/UnderWeight(5.0)5.33.1(4.4)

Information contained within this report has been developed for the Commonwealth of Virginia Department of the Treasury, its Staff,and Board members. Distribution of this material without the express written consent of Wells Fargo Advisors is strictly prohibited.
Zephyr StyleADVISORZephyr StyleADVISOR: Wells Fargo Advisors
Manager vs Morningstar Muni National Short: Return RankOctober 2005 - December 2018 (36-Month Moving Windows, Computed Monthly)
Ret
urn
Rank
100%
75%
Median
25%
0%
Sep 2008 Dec 2009 Dec 2011 Dec 2013 Dec 2015 Dec 2017 Dec 2018
BlackRock (gross)BlackRock (net)BC 1-3 Muni + 10bps5th to 25th Percentile25th Percentile to MedianMedian to 75th Percentile75th to 95th Percentile
Manager vs Morningstar Muni National Short: Return RankOctober 2005 - December 2018 (36-Month Moving Windows, Computed Monthly)
BlackRock (gross)
BlackRock (net)
BC 1-3 Muni + 10bps
Jul 2009
136 mng
May 2010
136 mng
Apr 2011
139 mng
Feb 2012
144 mng
Dec 2012
153 mng
Nov 2013
160 mng
Sep 2014
166 mng
Jul 2015
171 mng
Jun 2016
179 mng
Apr 2017
183 mng
Feb 2018
183 mng
Dec 2018
192 mng
4.88% 35.02% 60.84% 79.53% 74.98% 74.60% 77.05% 52.84% 67.55% 43.00% 42.85% 40.39%
16.91% 41.45% 69.54% 85.79% 83.36% 83.36% 89.10% 68.50% 75.37% 56.56% 63.60% 58.03%
1.71% 8.30% 22.71% 71.75% 70.80% 60.35% 69.50% 34.51% 56.62% 39.40% 28.33% 30.68%
Zephyr StyleADVISORZephyr StyleADVISOR: Wells Fargo Advisors
Manager vs Benchmark: ReturnOctober 2005 - December 2018 (not annualized if less than 1 year)
Retu
rn
0
0.5
1
1.5
2
2.5
1 quarter 6 months 1 year 3 years 5 years 10 years 13 years 1 quarter
BlackRock (gross)BlackRock (net)BC 1-3 Muni + 10bps
Manager vs Benchmark: ReturnOctober 2005 - December 2018 (not annualized if less than 1 year)
BlackRock (gross)
BlackRock (net)
BC 1-3 Muni + 10bps
1 quarter 6 months 1 year 3 years 5 years 10 years
0.96% 0.98% 1.69% 0.99% 0.89% 1.38%
0.96% 0.92% 1.54% 0.84% 0.72% 1.18%
0.92% 0.86% 1.85% 1.11% 0.99% 1.67%
13 years 1 quarter
2.00%
1.80%
2.29%
TICR – Tax Exempt: Short Duration Performance
Data Sources: Zephyr
Calendar Years Trailing Results
Universe: Rolling Twelve-Month Results
Zephyr StyleADVISORZephyr StyleADVISOR: Wells Fargo Advisors
Calendar Year ReturnAs of December 2018
0%
1%
2%
3%
4%
5%
6%
2018 2017 2016 2015 2014 2013 2012 2011 2010 2009 2008 2007 2006
BlackRock (gross)BlackRock (net)BC 1-3 Muni + 10bps
BlackRock (gross)
BlackRock (net)
BC 1-3 Muni + 10bps
2018 2017 2016 2015 2014 2013 2012 2011 2010 2009 2008 2007 2006
1.69% 0.95% 0.35% 0.81% 0.64% 0.65% 1.02% 2.20% 1.38% 4.13% 4.77% 4.59% 3.12%
1.54% 0.78% 0.19% 0.66% 0.45% 0.41% 0.78% 2.02% 1.15% 3.88% 4.51% 4.34% 2.88%
1.85% 1.15% 0.33% 0.86% 0.79% 1.16% 1.23% 2.55% 1.69% 5.14% 5.31% 4.90% 3.20%
Page 32
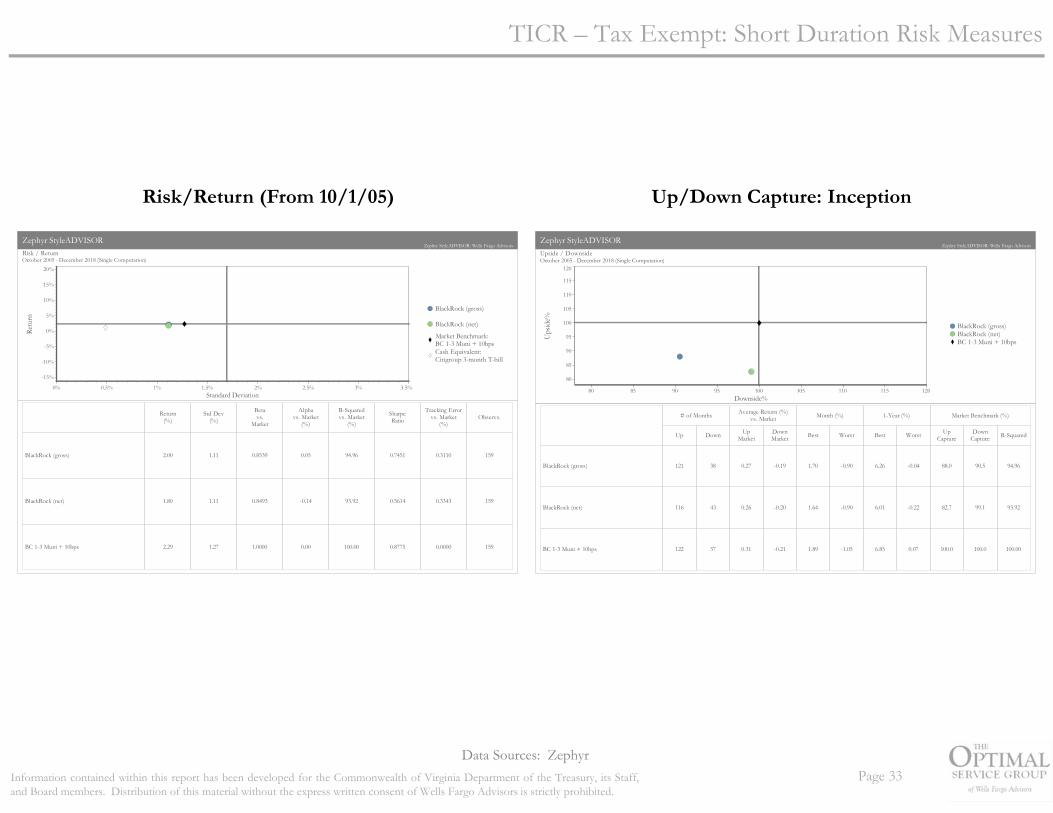
Information contained within this report has been developed for the Commonwealth of Virginia Department of the Treasury, its Staff,and Board members. Distribution of this material without the express written consent of Wells Fargo Advisors is strictly prohibited.
Zephyr StyleADVISORZephyr StyleADVISOR: Wells Fargo Advisors
Upside / DownsideOctober 2005 - December 2018 (Single Computation)
Ups
ide%
80
85
90
95
100
105
110
115
120
Downside%80 85 90 95 100 105 110 115 120
BlackRock (gross)BlackRock (net)BC 1-3 Muni + 10bps
# of Months Average Return (%)vs. Market Month (%) 1-Year (%) Market Benchmark (%)
BlackRock (gross)
BlackRock (net)
BC 1-3 Muni + 10bps
Up Down UpMarket
DownMarket Best Worst Best Worst Up
CaptureDown
Capture R-Squared
121 38 0.27 -0.19 1.70 -0.90 6.26 -0.04 88.0 90.5 94.96
116 43 0.26 -0.20 1.64 -0.90 6.01 -0.22 82.7 99.1 93.92
122 37 0.31 -0.21 1.89 -1.05 6.85 0.07 100.0 100.0 100.00
Data Sources: Zephyr
Up/Down Capture: InceptionRisk/Return (From 10/1/05)
Zephyr StyleADVISORZephyr StyleADVISOR: Wells Fargo Advisors
Risk / ReturnOctober 2005 - December 2018 (Single Computation)
Retu
rn
-15%
-10%
-5%
0%
5%
10%
15%
20%
Standard Deviation0% 0.5% 1% 1.5% 2% 2.5% 3% 3.5%
BlackRock (gross)
BlackRock (net)
Market Benchmark:BC 1-3 Muni + 10bpsCash Equivalent:Citigroup 3-month T-bill
BlackRock (gross)
BlackRock (net)
BC 1-3 Muni + 10bps
Return(%)
Std Dev(%)
Betavs.
Market
Alphavs. Market
(%)
R-Squaredvs. Market
(%)
SharpeRatio
Tracking Errorvs. Market
(%)Observs.
2.00 1.11 0.8539 0.05 94.96 0.7451 0.3110 159
1.80 1.11 0.8493 -0.14 93.92 0.5614 0.3343 159
2.29 1.27 1.0000 0.00 100.00 0.8775 0.0000 159
Page 33
TICR – Tax Exempt: Short Duration Risk Measures
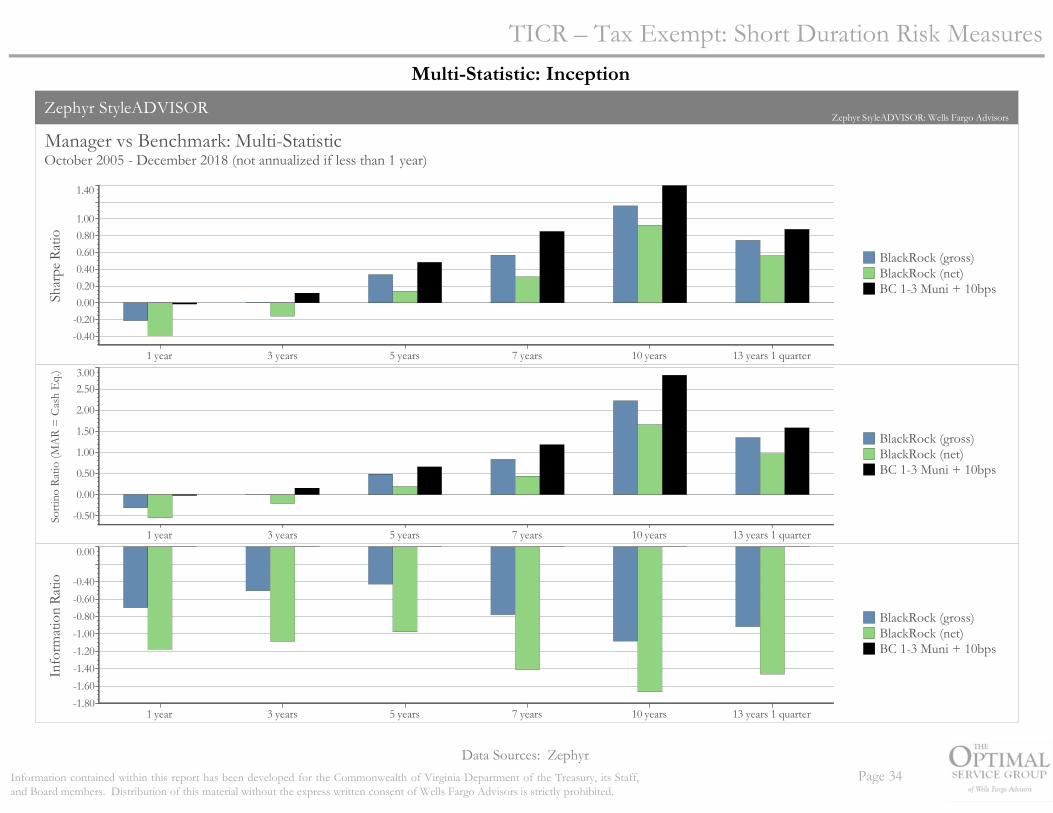
Information contained within this report has been developed for the Commonwealth of Virginia Department of the Treasury, its Staff,and Board members. Distribution of this material without the express written consent of Wells Fargo Advisors is strictly prohibited.
Data Sources: Zephyr
Multi-Statistic: Inception
Zephyr StyleADVISORZephyr StyleADVISOR: Wells Fargo Advisors
Manager vs Benchmark: Multi-StatisticOctober 2005 - December 2018 (not annualized if less than 1 year)
Shar
pe R
atio
-0.40-0.200.000.200.400.600.801.00
1.40
1 year 3 years 5 years 7 years 10 years 13 years 1 quarter
BlackRock (gross)BlackRock (net)BC 1-3 Muni + 10bps
Sorti
no R
atio
(MA
R =
Cas
h Eq
.)
-0.50
0.00
0.50
1.00
1.50
2.00
2.503.00
1 year 3 years 5 years 7 years 10 years 13 years 1 quarter
BlackRock (gross)BlackRock (net)BC 1-3 Muni + 10bps
Info
rmat
ion
Ratio
-1.80-1.60-1.40-1.20-1.00-0.80-0.60-0.40
0.00
1 year 3 years 5 years 7 years 10 years 13 years 1 quarter
BlackRock (gross)BlackRock (net)BC 1-3 Muni + 10bps
Page 34
TICR – Tax Exempt: Short Duration Risk Measures

Information contained within this report has been developed for the Commonwealth of Virginia Department of the Treasury, its Staff,and Board members. Distribution of this material without the express written consent of Wells Fargo Advisors is strictly prohibited.
Data Sources: BlackRock, BarclaysPage 35
TICR – Tax Exempt: Short Duration Characteristics
Average Duration (yrs)
Effective Maturity (yrs)
Average Quality YTM
Tax-Equiv YTM
Weighted Avg Cpn Convexity
Tracking Error (5y)
BlackRock 1.92 2.09 AA+ 1.82 2.80 4.58 0.07 0.25
Short Duration Tax-Exempt 1.92 2.09 AA+ 1.82 2.80 4.58 0.07 0.25
Benchmark 1.83 2.02 AA 1.88 2.89 4.77 -0.01 n/a
Difference 0.09 0.07 (0.06) (0.09) (0.19) 0.08
Policy Duration Target 1.83 Policy Duration Range 1.65 - 2.01
As of December 31, 2018
Quarterly Attribution - BlackRock 1Q18 2Q18 3Q18 4Q18
Gross Return 0.16 0.54 0.02 0.96 1.69Benchmark Return 0.35 0.64 (0.06) 0.92 1.85Alpha (0.19) (0.10) 0.08 0.05 (0.16)
Country 0.00 0.00 0.00 0.00 0.00Allocation (0.00) (0.02) (0.01) 0.01 (0.03)Security Selection (0.04) (0.07) (0.02) (0.02) (0.15)Duration/Yield Curve (0.02) 0.01 0.02 0.03 0.05Intraday Trans/Pricing/Residual (0.10) 0.00 0.11 0.03 0.04Other (0.03) (0.03) (0.02) 0.01 (0.07)
Rolling 1-Year

Information contained within this report has been developed for the Commonwealth of Virginia Department of the Treasury, its Staff,and Board members. Distribution of this material without the express written consent of Wells Fargo Advisors is strictly prohibited.
Data Sources: BlackRock, Barclays
*Other includes: MIG1/SP-1+ rated short-term municipal securities as well as cash and STIF
Page 36
TICR – Tax Exempt: Short Duration Characteristics
Policy Sector Allocation BlackRock Max. BenchGeneral Obligation 49.0 75.0 26.9Revenue Bonds 50.4 60.0 42.7Money Market 0.0 10.0 0.0Other Tax-Exempt 0.6 10.0 30.3 Total 100.0 100.0
Quality Distribution BlackRock BenchTreasury/Agency 0.0 0.0Aaa 39.0 18.7Aa 49.4 52.6A 0.0 22.2Baa 0.0 0.0Other 11.6 6.5 Total 100.0 100.0
7.7
(0.0)
5.20.0
(0.0)
(22.2)
As of December 31, 2018
22.0
20.3
Over/Under
Over/(Under)
(29.7)
(3.3)
(vs. Bench)
0.0
(vs Bench)
0.0
Name % of PortfolioIowa St Fin Auth 4.15%District of Columbia 4.14%Texas St Water Dev Bd 3.87%South Carolina St 3.82%NYC, NY Trans Fin 3.80%Georgia St 3.75%Metropolitan Wtr Dist 3.64%West Virginia St 3.49%Mississippi Business Fin Corp 3.34%Minnesota St 3.27%
Name % of PortfolioNew York 11.29%North Carolina 10.90%Massachusetts 9.64%California 6.19%Kansas 5.77%Maryland 5.33%Georgia 4.41%Iowa 4.15%District of Columbia 4.14%Texas 3.87%
Top 10 State Exposure
Top 10 Overall Holdings

Information contained within this report has been developed for the Commonwealth of Virginia Department of the Treasury, its Staff,and Board members. Distribution of this material without the express written consent of Wells Fargo Advisors is strictly prohibited.
Zephyr StyleADVISORZephyr StyleADVISOR: Wells Fargo Advisors
Manager vs Morningstar Muni National Interm: Return RankNovember 2010 - December 2018 (36-Month Moving Windows, Computed Monthly)
Ret
urn
Rank
100%
75%
Median
25%
0%
Oct 2013 Dec 2014 Dec 2015 Dec 2016 Dec 2017 Dec 2018
IR&M (net)BC 5-10 Muni + 10bps5th to 25th Percentile25th Percentile to MedianMedian to 75th Percentile75th to 95th Percentile
Manager vs Morningstar Muni National Interm: Return RankNovember 2010 - December 2018 (36-Month Moving Windows, Computed Monthly)
IR&M (net)
BC 5-10 Muni + 10bps
Mar 2014
226 mng
Aug 2014
234 mng
Jan 2015
240 mng
Jun 2015
248 mng
Dec 2015
257 mng
May 2016
266 mng
Oct 2016
266 mng
Mar 2017
270 mng
Sep 2017
272 mng
Feb 2018
276 mng
Jul 2018
282 mng
Dec 2018
288 mng
69.45% 80.41% 52.73% 44.00% 26.02% 28.57% 56.45% 35.45% 37.23% 51.68% 54.38% 45.89%
46.13% 60.73% 41.12% 31.27% 22.59% 23.77% 51.40% 33.85% 28.14% 42.76% 44.61% 32.93%Data Sources: Zephyr
Calendar Years
Trailing Results
Universe: Rolling Twelve-Month Results
TICR – Tax Exempt: Intermediate Duration Performance
Zephyr StyleADVISORZephyr StyleADVISOR: Wells Fargo Advisors
Calendar Year ReturnAs of December 2018
-2%
0%
2%
4%
6%
8%
10%
12%
2018 2017 2016 2015 2014 2013 2012 2011
IR&M (net)BC 5-10 Muni + 10bps
IR&M (net)
BC 5-10 Muni + 10bps
2018 2017 2016 2015 2014 2013 2012 2011
1.26% 4.20% -0.21% 3.25% 6.25% -0.86% 3.82% 10.02%
1.57% 4.59% -0.36% 3.41% 6.36% -0.83% 4.39% 10.48%
Page 37
Zephyr StyleADVISORZephyr StyleADVISOR: Wells Fargo Advisors
Manager vs Benchmark: ReturnNovember 2010 - December 2018 (not annualized if less than 1 year)
Retu
rn
0
0.5
1
1.5
2
2.5
3
3.5
1 quarter 6 months 1 year 3 years 5 years 8 years 2 months
IR&M (net)IR&M (gross)BC 5-10 Muni + 10bps
Manager vs Benchmark: ReturnNovember 2010 - December 2018 (not annualized if less than 1 year)
IR&M (net)
IR&M (gross)
BC 5-10 Muni + 10bps
1 quarter 6 months 1 year 3 years 5 years
1.92% 1.80% 1.26% 1.73% 2.93%
1.95% 1.86% 1.39% 1.86% 3.06%
2.03% 1.95% 1.57% 1.91% 3.09%
8 years 2 months
3.18%
3.31%
3.25%
Trailing Results

Information contained within this report has been developed for the Commonwealth of Virginia Department of the Treasury, its Staff,and Board members. Distribution of this material without the express written consent of Wells Fargo Advisors is strictly prohibited.
Data Sources: Zephyr
Up/Down Capture: InceptionRisk/Return (From 11/1/10)
Zephyr StyleADVISORZephyr StyleADVISOR: Wells Fargo Advisors
Upside / DownsideNovember 2010 - December 2018 (Single Computation)
Ups
ide%
94
96
98
100
102
104
106
Downside%94 96 98 100 102 104 106
IR&M (net)BC 5-10 Muni + 10bps
# of Months Average Return (%)vs. Market Month (%) 1-Year (%) Market Benchmark (%)
IR&M (net)
BC 5-10 Muni + 10bps
Up Down UpMarket
DownMarket Best Worst Best Worst Up
CaptureDown
Capture R-Squared
62 36 0.80 -0.61 2.03 -3.56 11.44 -2.05 96.0 94.5 97.74
61 37 0.83 -0.65 2.21 -3.82 12.26 -1.77 100.0 100.0 100.00
Zephyr StyleADVISORZephyr StyleADVISOR: Wells Fargo Advisors
Risk / ReturnNovember 2010 - December 2018 (Single Computation)
Retu
rn
-5%
0%
5%
10%
15%
Standard Deviation0% 1% 2% 3% 4% 5% 6% 7%
IR&M (net)
Market Benchmark:BC 5-10 Muni + 10bpsCash Equivalent:Citigroup 3-month T-bill
IR&M (net)
BC 5-10 Muni + 10bps
Return(%)
Std Dev(%)
Betavs.
Market
Alphavs. Market
(%)
R-Squaredvs. Market
(%)
SharpeRatio
Tracking Errorvs. Market
(%)Observs.
3.18 3.20 0.9568 0.07 97.74 0.8694 0.5020 98
3.25 3.31 1.0000 0.00 100.00 0.8619 0.0000 98
Page 38
TICR – Tax Exempt: Intermediate Duration Risk Measures
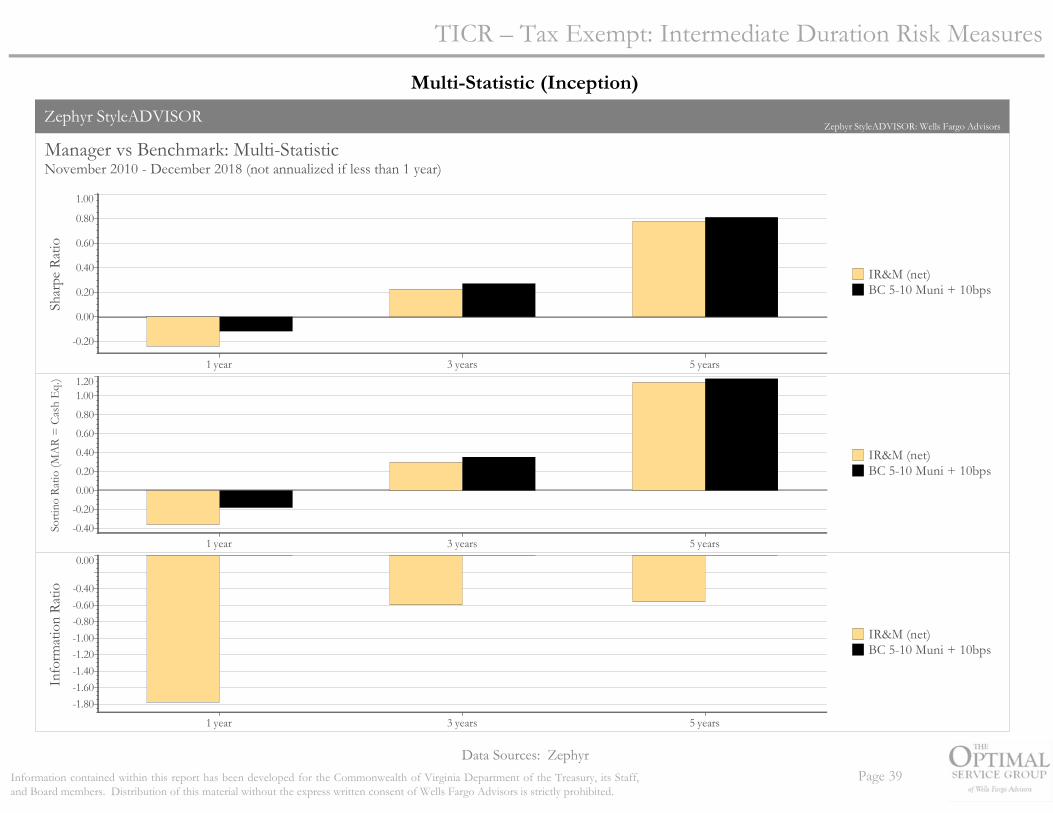
Information contained within this report has been developed for the Commonwealth of Virginia Department of the Treasury, its Staff,and Board members. Distribution of this material without the express written consent of Wells Fargo Advisors is strictly prohibited.
Data Sources: Zephyr
Multi-Statistic (Inception)
Zephyr StyleADVISORZephyr StyleADVISOR: Wells Fargo Advisors
Manager vs Benchmark: Multi-StatisticNovember 2010 - December 2018 (not annualized if less than 1 year)
Shar
pe R
atio
-0.20
0.00
0.20
0.40
0.60
0.80
1.00
1 year 3 years 5 years
IR&M (net)BC 5-10 Muni + 10bps
Sorti
no R
atio
(MA
R =
Cas
h Eq
.)
-0.40
-0.20
0.00
0.20
0.40
0.60
0.80
1.001.20
1 year 3 years 5 years
IR&M (net)BC 5-10 Muni + 10bps
Info
rmat
ion
Ratio
-1.80-1.60-1.40-1.20-1.00-0.80-0.60-0.40
0.00
1 year 3 years 5 years
IR&M (net)BC 5-10 Muni + 10bps
Page 39
TICR – Tax Exempt: Intermediate Duration Risk Measures

Information contained within this report has been developed for the Commonwealth of Virginia Department of the Treasury, its Staff,and Board members. Distribution of this material without the express written consent of Wells Fargo Advisors is strictly prohibited.
Data Sources: IR+M, BarclaysPage 40
TICR – Tax Exempt: Intermediate Duration Characteristics
Quarterly Attribution - IR+M 1Q18 2Q18 3Q18 4Q18
Gross Return (1.25) 0.80 (0.09) 1.95 1.39Benchmark Return (1.26) 0.90 (0.08) 2.03 1.57Alpha 0.01 (0.11) (0.01) (0.08) (0.18)
Country 0.00 0.00 0.00 0.00 0.00Allocation (0.01) 0.00 0.00 0.01 0.00Security Selection 0.02 (0.01) (0.01) 0.06 0.06Duration/Yield Curve 0.02 0.00 (0.01) (0.03) (0.02)Intraday Trans/Pricing/Residual 0.00 (0.07) 0.04 (0.10) (0.13)Other (0.02) (0.03) (0.03) (0.02) (0.10)
Rolling 1-Year
Average Duration (yrs)
Effective Maturity (yrs)
Average Quality YTM
Tax-Equiv YTM
Weighted Avg Cpn Convexity
Tracking Error
IR+M 5.09 6.08 AA 2.35 3.62 4.81 0.26 0.29
Intermediate Duration Tax-Exempt 5.09 6.08 AA 2.35 3.62 4.81 0.26 0.29
Benchmark 5.05 8.24 AA 2.28 3.51 4.81 0.22 n/a
Difference 0.04 (2.16) 0.07 0.11 0.00 0.04
Policy Duration Target 5.05 Policy Duration Range 4.55 - 5.56
As of December 31, 2018

Information contained within this report has been developed for the Commonwealth of Virginia Department of the Treasury, its Staff,and Board members. Distribution of this material without the express written consent of Wells Fargo Advisors is strictly prohibited.
Data Sources: IR+M, Barclays
Page 41
TICR – Tax Exempt: Intermediate Duration Characteristics
IN Fin Auth 2.50%Hawaii St 2.48%New York St Urban Dev 2.40%Wisconsin St 2.31%TX, Lower Co Riv-Unref 2.25%Mississippi St 2.21%WA Washington 2.20%CA State University 2.20%PA Commonwealth 2.19%California St 2.12%
Illinois 11.84%New York 11.51%Texas 10.48%Pennsylvania 7.92%California 6.89%District of Columbia 5.00%Hawaii 4.70%Florida 4.22%Washington 4.00%Nevada 3.81%
as of December 31, 2018
Top Ten Overall State Positionsas of December 31, 2018
Top Ten Overall Portfolio Holdings
Total Policy Over/(Under)Sector Allocation IR+M Portfolio Max. Bench (vs Bench)General Obligation 45.4 45.4 75.0 36.1 9.3Revenue Bonds 50.0 50.0 60.0 61.6 (11.6)Money Market 0.2 0.2 10.0 0.0 0.2Other Tax-Exempt 4.4 4.4 10.0 2.3 2.2 Total 100.0 100.0 100.0
Total Quality Distribution IR+M Portfolio BenchTreasury/Agency 0.0 0.0 0.0Aaa 11.2 11.2 17.7Aa 65.5 65.5 57.1A 23.2 23.2 25.3Baa 0.0 0.0 0.0Other 0.2 0.2 0.0 Total 100.0 100.0 100.0
Over/UnderWeight
As of December 31, 2018
0.0(6.5)8.4(2.1)0.00.2

Information contained within this report has been developed for the Commonwealth of Virginia Department of the Treasury, its Staff,and Board members. Distribution of this material without the express written consent of Wells Fargo Advisors is strictly prohibited.
FIRM: Wells Fargo Advisors is the trade name used by two separate registered broker-dealers: Wells Fargo Advisors, LLC., and Wells FargoFinancial Network, LLC, Members SIPC, non-bank affiliates of Wells Fargo & Company. Investment and Insurance products are: NOT FDIC-INSURED/NOT BANK-GUARANTEED/MAY LOSE VALUE.
CONFLICTS OF INTEREST: To review important information about certain relationships and potential conflicts of interest that may existbetween Wells Fargo Advisors, its affiliates, and the companies that are mentioned in this report, please visit the our research disclosure page athttps://www.wellsfargoadvisors.com/disclosures/research.htm or call your Financial Advisor.
STATEMENT OF OPINION: This and/or the accompanying information was prepared by or obtained from sources which Wells FargoAdvisors believes to be reliable but does not guarantee its accuracy. Any opinions expressed or implied herein are not necessarily the same asthose of Wells Fargo Advisors or its affiliates and are subject to change without notice. The report herein is not a complete analysis of everymaterial fact in respect to any company, industry or security. Any market prices are only indications of market values and are subject to change.The material has been prepared or is distributed solely for information purposes and is not a solicitation or an offer to buy any security orinstrument or to participate in any trading strategy. Additional information is available upon request.
ASSET CLASS SUITABILITY: Stocks of small companies are typically more volatile than stocks of larger companies. They often involvehigher risks because they may lack the management expertise, financial resources, product diversification and competitive strengths to endureadverse economic conditions. High-yield, non-investment grade bonds are only suitable for aggressive investors willing to take greater risks,which could result in loss of principal and interest payments. Global/International investing involves risks not typically associated with USinvesting, including currency fluctuations, political instability, uncertain economic conditions and different accounting standards. Because thefutures and commodity markets can be highly unpredictable – often swinging dramatically – investing in currency and commodities is notsuitable for all investors. You may lose your entire investment , and in some cases, more than you invested.
PAST PERFORMANCE: Past performance is not an indication of future results.
Disclosures
Page 42

FINAL METHOD
SALE DATE ISSUER PURPOSE AMOUNT MATURITY OF SALE
February 2019
26 ** Virginia Housing Development Authority Rental Housing Bonds, 2019 Series A $81,000,000 ** 2054 Negotiated
March 2019
13 ** Virginia Public Building Authority Public Facilities Revenue Bonds, Series 2019A (Tax-exempt) and $332,070,000 ** 2039 Competitive
Series 2019B AMT and Series C (Taxable)
April 2019
9 ** Commonwealth Transportation Board Transportation Capital Projects Revenue Bonds, Series 2019 $255,000,000 ** 2044 Competitive
23 ** Virginia Public School Authority School Financing Bonds (1997 Resolution) Series 2019A TBD ** TBD Competitive
30 ** Virginia Public School Authority School Technology and Security Notes Series VII $55,000,000 ** 2054 TBD
30 ** Virginia Housing Development Authority Rental Housing Bonds, 2019 Series B Non-AMT
May 2019
8 ** Virginia Resources Authority Virginia Pooled Financing Program, Series 2019A TBD ** TBD Negotiated
15 ** Virginia College Building Authority Educational Facilities Revenue Bonds (21st Century College and Equipment TBD ** TBD Competitive
Programs), Series 2019A
June 2019
July 2019
31 ** Virginia Resources Authority Virginia Pooled Financing Program, Series 2019B TBD ** TBD Negotiated
TBD ** Commonwealth of Virginia General Obligation Bonds, Series 2019A TBD ** TBD Competitive
* Division of Debt Management participating
** Preliminary, subject to change
Prepared for the Commonwealth Treasury Board.
This Calendar may be found on the Department of the Treasury's Web Site "www.trs.virginia.gov"
COMMONWEALTH OF VIRGINIA
TREASURY BOARD
VIRGINIA DEBT CALENDAR
As of February 1, 2019
The information contained herein, while not guaranteed by the Commonwealth of Virginia Treasury Board, has been obtained from sources which the Treasury Board believes to be reliable and accurate.
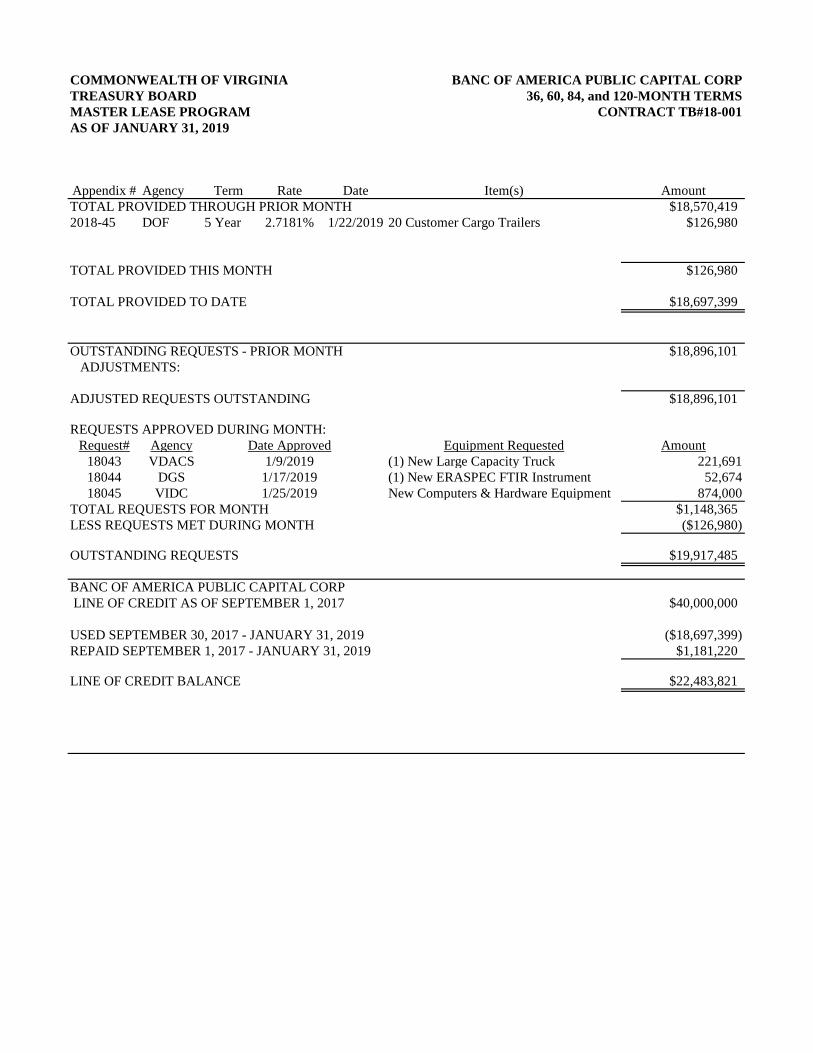
COMMONWEALTH OF VIRGINIA BANC OF AMERICA PUBLIC CAPITAL CORP
TREASURY BOARD 36, 60, 84, and 120-MONTH TERMS
MASTER LEASE PROGRAM CONTRACT TB#18-001
AS OF JANUARY 31, 2019
Appendix # Agency Term Rate Date Item(s) Amount
TOTAL PROVIDED THROUGH PRIOR MONTH $18,570,419
2018-45 DOF 5 Year 2.7181% 1/22/2019 20 Customer Cargo Trailers $126,980
TOTAL PROVIDED THIS MONTH $126,980
TOTAL PROVIDED TO DATE $18,697,399
OUTSTANDING REQUESTS - PRIOR MONTH $18,896,101
ADJUSTMENTS:
ADJUSTED REQUESTS OUTSTANDING $18,896,101
REQUESTS APPROVED DURING MONTH:
Request# Agency Date Approved Equipment Requested Amount
18043 VDACS 1/9/2019 (1) New Large Capacity Truck 221,691
18044 DGS 1/17/2019 (1) New ERASPEC FTIR Instrument 52,674
18045 VIDC 1/25/2019 New Computers & Hardware Equipment 874,000
TOTAL REQUESTS FOR MONTH $1,148,365
LESS REQUESTS MET DURING MONTH ($126,980)
OUTSTANDING REQUESTS $19,917,485
BANC OF AMERICA PUBLIC CAPITAL CORP
LINE OF CREDIT AS OF SEPTEMBER 1, 2017 $40,000,000
USED SEPTEMBER 30, 2017 - JANUARY 31, 2019 ($18,697,399)
REPAID SEPTEMBER 1, 2017 - JANUARY 31, 2019 $1,181,220
LINE OF CREDIT BALANCE $22,483,821

COMMONWEALTH OF VIRGINIA APPROVED REQUESTS - BANC OF AMERICA PUBLIC CAPITAL CORP
TREASURY BOARD
MASTER LEASING PROGRAM
AS OF JANUARY 31, 2019
Date Payment Request Lease Appendix Partial/ Remaining
Request # Agency Approved Equipment Requested Term Mode Amount Amount Number Final Authorization
18001 VSP 10/17/2017 Quantar Site Repeaters 10 Year Monthly 5,336,980.00 5,336,980.00 2018-04 Final 0.00
18002 DGS 10/13/2017 ANKOM A200 Analyzer 5 Year Semi-Annual 16,841.00 16,841.00 2018-10 Final 0.00
18003 DGS 10/13/2017 Lab Density Meter 5 Year Semi-Annual 40,653.00 40,653.00 2018-07 Final 0.00
18004 DGS 10/13/2017 Gas Chromotograph 5 Year Semi-Annual 122,366.77 122,366.77 2018-02 Final 0.00
18005 DGS 10/13/2017 ANKOM HCI Hydrolysis 5 Year Semi-Annual 36,442.25 35,982.25 2018-11 Final 0.00
18006 DGS 10/13/2017 Mini Flash 5 Year Semi-Annual 47,320.00 47,320.00 2018-20 Final 0.00
18007 DGS 10/13/2017 Environmental Analyzer 5 Year Semi-Annual 53,797.93 53,797.92 2018-01 Final 0.00
18008 VCUHSA 10/26/2017 New MRI 5 Year Monthly 2,450,000.00 0.00 2,450,000.00
18009 DGS 11/30/2017 181 Vehicle Fleet 7 Year Monthly 3,231,359.33 229,499.61 2018-05 Partial
286,559.95 2018-08 Partial
402,480.72 2018-09 Partial
261,032.86 2018-14 Partial
235,695.00 2018-15 Partial
329,973.00 2018-16 Partial
377,112.00 2018-17 Partial
377,112.00 2018-18 Partial
259,505.68 2018-21 Partial
74,094.36 2018-28 Partial
172,947.03 2018-30 Partial
54,407.14 2018-35 Partial
149,775.80 2018-37 Partial 21,164.18
18010 CNU 11/30/2017 L6060 HSTC Tractor 5 Year Monthly 37,350.00 37,350.00 2018-32 Partial 0.00
18011 VDEP 12/21/2017 XEROX Copier 5 Year Monthly 119,533.00 119,533.00 2018-33 Final 0.00
18012 DOF 1/11/2018 23 - 10 Wheel Cab Chassis & 23 Bulldozers 10 Year Monthly 6,700,000.00 1,813,044.00 2018-03 Partial
542,820.00 2018-06 Partial
812,100.00 2018-12 Partial
144,261.39 2018-13 Partial
329,740.32 2018-19 Partial
1,422,005.00 2018-25 Partial
247,371.00 2018-26 Partial 1,388,658.29
18013 DOF 1/11/2018 34 3/4 Ton Pickup Vehicle Outfitting 5 Year Monthly 74,284.56 47,697.90 2018-23 Partial
26,586.66 2018-40 Final 0.00
18014 DGS 1/11/2018 62 Vehicle Fleet 7 Year Monthly 1,431,073.27 386,407.46 2018-22 Partial
321,592.59 2018-24 Partial
385,557.99 2018-29 Partial
285,213.40 2018-31 Partial
24,369.00 2018-36 Partial 27,932.83
18015 DOF 3/20/2018 (9) 1/2 Ton Pick-up Trucks 5 Year Monthly 305,000.00 170,867.90 2018-42 Partial
68,347.16 2018-43 Partial 65,784.94
18016 DOF 3/20/2018 (4) Fire Plows 10 Year Monthly 72,500.00 70,780.00 2018-32 Final 0.00
18017 VEDM 5/10/2018 (2) 2018 Chevrolet Tahoe Truck 5 Year Semi-Annual 75,193.81 75,193.81 2018-27 Final 0.00
18018 DFS 6/11/2018 (4) New Quadrupole Time of Flight 7 Year Semi-Annual 1,638,145.12 1,638,145.12 2018-39 Final 0.00
18019 DOF 6/11/2018 (20) Utility Task Vehicles (UTV) w/ trailers 5 Year Monthly 400,000.00 126,980.00 2018-45 Partial 273,020.00
Page 1

COMMONWEALTH OF VIRGINIA APPROVED REQUESTS - BANC OF AMERICA PUBLIC CAPITAL CORP
TREASURY BOARD
MASTER LEASING PROGRAM
AS OF JANUARY 31, 2019
Date Payment Request Lease Appendix Partial/ Remaining
Request # Agency Approved Equipment Requested Term Mode Amount Amount Number Final Authorization
18020 DOF 6/14/2018 (4) 3/4 Ton pick-ups 5 Year Monthly 150,000.00 123,419.56 2018-44 Partial 26,580.44
18021 DGS 7/16/2018 (2) Applied Biosystems Genetic Analyzers 5 Year Semi-Annual 569,958.40 569,958.40 2018-41 Final 0.00
18022 VDEM 8/1/2018 (1) Ford F-350 Super Duty Truck 5 Year Semi-Annual 43,921.00 43,921.00 2018-38 Final 0.00
18023 NSU 8/23/2018 Football Stadium Turf & Storm Drainage System 5 Year Semi-Annual 1,200,895.00 0.00 1,200,895.00
18024 DGS 9/19/2018 New Gas Chromatograph & Mass Spectrometer 3 Year Semi-Annual 93,029.85 0.00 93,029.85
18025 DGS 10/19/2018 New Gas Chromatograph & Mass Spectrometer 5 Year Monthly 181,101.97 0.00 181,101.97
18026 DGS 10/19/2018 Liquid Chromatograph with Diade Array Detector 5 Year Monthly 72,478.86 0.00 72,478.86
18027 DGS 10/19/2018 Liquid Chromatograph with Post Column Reactor 5 Year Monthly 109,920.44 0.00 109,920.44
18028 DGS 10/19/2018 New Gas Chromatograph & Mass Spectrometer 5 Year Monthly 181,101.97 0.00 181,101.97
18029 DGS 10/19/2018 Gas Chromatograph with Dual Electron Detectors 5 Year Monthly 63,068.94 0.00 63,068.94
18030 DGS 10/19/2018 Gas Chromatograph with Dual Electron Detectors 5 Year Monthly 63,068.94 0.00 63,068.94
18031 DGS 10/19/2018 LB 4200 Alpha/Beta Counter 5 Year Monthly 113,572.80 0.00 113,572.80
18032 DGS 10/19/2018 HACH Micro-Dist System w/Cyanide Analysis Manifold 5 Year Monthly 13,585.00 0.00 13,585.00
18033 DGS 10/19/2018 Integrion Ion Chromatograph 5 Year Monthly 65,081.00 0.00 65,081.00
18034 DGS 10/19/2018 Total Organix Carbon Analyzer 5 Year Monthly 33,396.50 0.00 33,396.50
18035 DGS 10/19/2018 LB 4200 Alpha/Beta Counter 5 Year Monthly 113,572.80 0.00 113,572.80
18036 DGS 10/19/2018 Metrohm Omnis System 5 Year Monthly 116,557.00 0.00 116,557.00
18037 DGS 10/24/2018 New ERAVAP Vapor Pressure Tester 3 Year Semi-Annual 37,413.71 0.00 37,413.71
18038 VDAC 10/25/2018 (2) Life Technologies 7500 Real-Time PCR System 3 Year Annual 84,630.00 0.00 84,630.00
18039 CNU 11/15/2018 New Video Wall 5 Year Monthly 120,009.04 0.00 120,009.04
18040 DGS 11/28/2018 Vehicle Fleet 7 Year Monthly 7,364,402.11 0.00 7,364,402.11
18041 UVAW 11/28/2018 IT Infrastructure 5 Year Monthly 3,295,091.03 0.00 3,295,091.03
18042 DGS 11/29/2018 Vehicle Fleet 7 Year Monthly 1,194,002.97 0.00 1,194,002.97
18043 VDACS 1/9/2019 (1) New Large Capacity Truck 5 Year Annually 221,691.00 0.00 221,691.00
18044 DGS 1/17/2019 (1) New ERASPEC FTIR Instrument 5 Year Semi-Annual 52,673.71 0.00 52,673.71
18045 VIDC 1/25/2019 Computer Equipment and Hardware 5 Year Annually 874,000.00 0.00 874,000.00
TOTALS 38,617,064 18,697,399 19,917,485
Page 2

COMMONWEALTH OF VIRGINIA BANC OF AMERICA PUBLIC CAPITAL CORP
TREASURY BOARD 144-MONTH TERMS
ENERGY LEASE PROGRAM 180-MONTH TERMS
AS OF JANUARY 31, 2019 Contract TB18-002
Appendix # Agency Term Rate Date Item(s) Amount
TOTAL PROVIDED THROUGH PRIOR MONTH $19,362,660
TOTAL PROVIDED THIS MONTH $0
TOTAL PROVIDED TO DATE $19,362,660
OUTSTANDING REQUESTS - PRIOR MONTH $0
ADJUSTMENTS:
$0
ADJUSTED REQUESTS OUTSTANDING $0
REQUESTS APPROVED DURING MONTH:
Request# Agency Date Approved Equipment Requested Amount
TOTAL REQUESTS FOR MONTH $0
LESS REQUESTS MET DURING MONTH $0
OUTSTANDING REQUESTS $0
BANC OF AMERICA PUBLIC CAPITAL CORP
LINE OF CREDIT AS OF OCTOBER 1, 2017 $40,000,000
USED OCTOBER 1, 2017 - JANUARY 31, 2019 ($19,362,660)
REPAID OCTOBER 1, 2017 - JANUARY 31, 2019 76,270.56
LINE OF CREDIT BALANCE $20,713,611

COMMONWEALTH OF VIRGINIA APPROVED REQUESTS - BANC OF AMERICA PUBLIC CAPITAL CORP
TREASURY BOARD
ENERGY LEASING PROGRAM
AS OFJANUARY 31, 2019
Date Payment Request Lease Appendix Partial/ Remaining
Request # Agency Approved Equipment Requested Term Mode Amount Amount Number Final Authorization
18001 DGS 2/9/2018 Energy Efficiency Equipment 15 Years Semi-annual $2,812,940 $2,812,940 2018-01 Final $0
18002 DOC 6/27/2018 Energy Efficiency Equipment 15 Years Annual $14,489,720 $14,489,720 2018-02 TE Final $0
18002 DOC 6/27/2018 Energy Efficiency Equipment 15 Years Annual $2,060,000 $2,060,000 2018-02 TAX Final $0
$0
TOTALS $19,362,660 $19,362,660 $0
Page 1
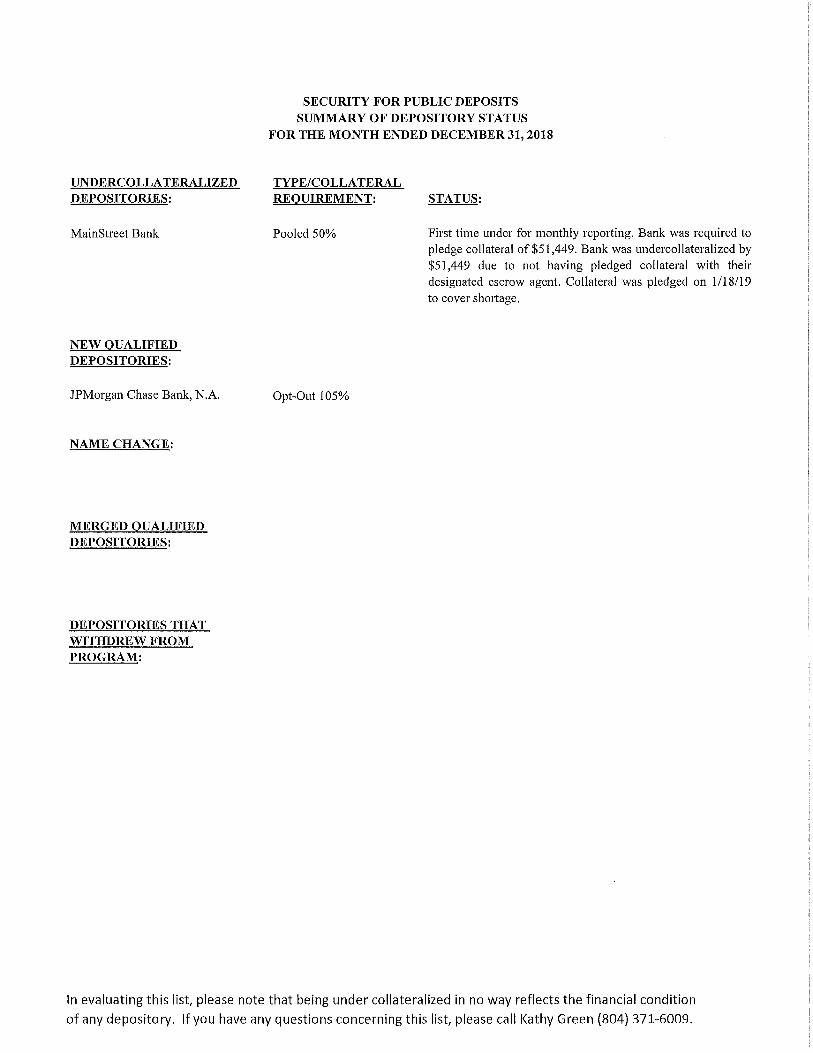
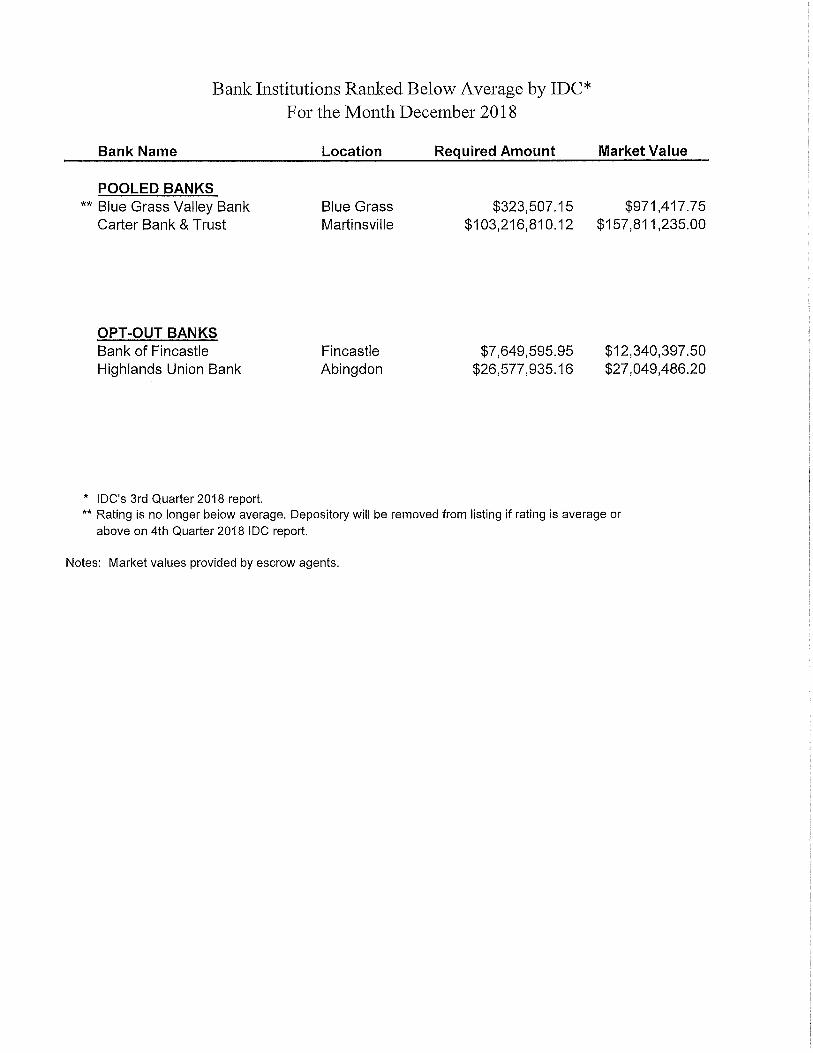


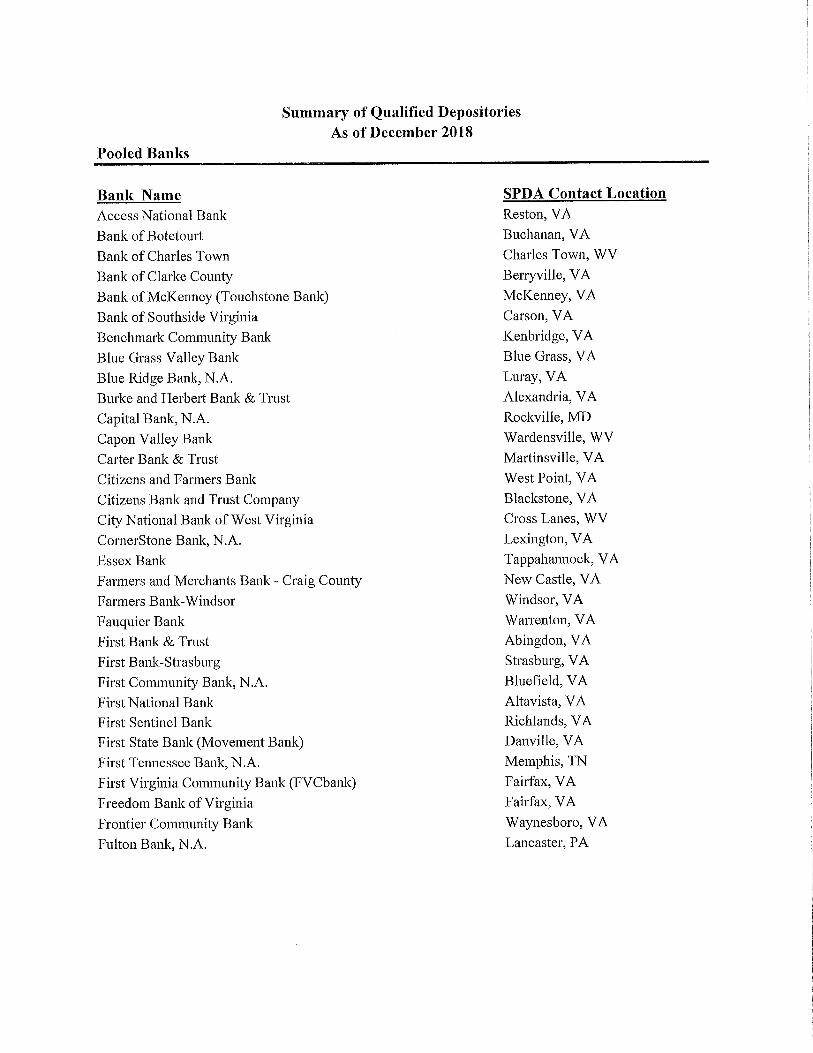


February 12, 2019
Members of the Virginia Treasury Board Commonwealth of Virginia Department of Treasury 101 North 14th Street Richmond, Virginia 23219 Ladies and Gentlemen: PFM is pleased to provide you with the Virginia State Non-Arbitrage Program (“Program”) Report for the month ended January 31, 2019. Attached you will find various reports and information designed to aid you in your review of the Program.
Economic Summary & Portfolio Strategy Update
The Bureau of Economic Analysis’ third reading of U.S. Gross Domestic Product (“GDP”) growth indicated that the U.S. economy grew at an annual rate of 3.4% in the third quarter, slightly decreasing the second estimate of 3.5%. The government stated that the growth rate of the U.S. economy in the fourth quarter will be released on February 28, 2019. The delay in the report was due to the recently ended partial government shutdown. January’s labor market report suggests continued strength in the US economy. The market recorded its 100th straight month of job creation and the 304,000 measure of job growth exceeded the market’s expectation of 165,000 jobs. The slight rise in the unemployment rate from 3.9% to 4.0% coincided with the labor participation rate up tick from 63.1% to 63.2% During the Federal Open Market Committee’s (“FOMC’s”) meeting on January 29-30, the Federal Reserve chose to maintain the current level of the target rate at a range of 2.25% to 2.50%. The January 2019 Federal Reserve Press Release stated “in light of global economic and financial developments and muted inflation pressures, the Committee will be patient as it determines what future adjustments to the target range for the federal funds rate may be appropriate to support these outcomes.” The market has interpreted this statement and other recent comments from Fed Chairman Jerome Powell to mean that the Federal Reserve intends to maintain the federal funds target rate at its current level with no additional rate hikes occurring in the foreseeable future Portfolio strategy during January was positioned around the unlikelihood of the FOMC raising rates as they shifted their approach to be more data dependent with a patient stance. Short term credit rates decreased significantly and with spreads narrowing, it was difficult to find relative value in the market. We have identified value in repurchase agreements due to the additional yield pickup in comparison to lower yielding securities such as U.S. Treasuries and federal agencies.

Virginia Treasury Board February 12, 2019
Page 2 of 3
Performance* The monthly distribution yield for the SNAP Fund was 2.65% in January, increasing from December’s yield of 2.50%. At the end of January, the seven-day average yield was 2.66%, increasing from the 2.57% seven-day average at the end of December. During the month of January, the SNAP Fund outperformed its benchmark, the iMoneyNet First Tier Institutional-Only Average index, gross and net of expenses. Performance statistics, on both a net and gross return basis, are shown below.
Returns Net of Expenses Monthly Yield January 2019
Monthly Yield December 2018
Total Return for
12 Months Ended
January 2019 SNAP Fund (Distribution Yield) 2.65% 2.50% 2.18% iMoneyNet First Tier Institutional-Only Average 2.33% 2.22% 1.88%
Returns Gross of Expenses SNAP Fund 2.72% 2.58% 2.26% iMoneyNet First Tier Institutional-Only Average
2.69%
2.56%
2.23%
The weighted average maturity (WAM) and weighted average life (WAL) of the portfolio on January 31, 2019, were 29 days and 74 days respectively. At the end of December, the WAM and WAL were 32 days and 82 days respectively. SNAP Program Activity
Program assets as of January 31, 2019 were $3.9 billion. The detail of a new bond issue invested through the Program is shown below.
Investor Bond Issue Name Investment
Date Investment
Amount
Greene County Lease Revenue Bond Anticipation Note,
Series 2019 1/16/2019
$1,960,063
Total New Bond Issue Invested $1,960,063

Virginia Treasury Board February 12, 2019
Page 3 of 3
Additional Information
PFM continues to provide oversight over the financial institutions that provide service to the Program and will keep Treasury Staff and the Treasury Board informed of any deviation in level of service. Please feel free to contact me if you have any questions. Sincerely, PFM Asset Management LLC
Nelson L. Bush Managing Director * The gross performance information represents the investment returns of the SNAP Fund before deducting fees and expenses, and does not reflect actual investment returns that investors in the SNAP Fund would experience. Gross performance is shown solely for purposes of comparison to the gross performance of certain indices. All of the yields and returns represent past performance, which is not a guarantee of future results that may be achieved by the SNAP Fund. The yield for a stable value fund more closely reflects the current earnings of the fund than its total return.

*Percentages may not total to 100% due to rounding.
Portfolio Composition*
Portfolio Ratings Breakdown*
U.S. Treasuries5.6%
Federal Agencies1.9%
Commercial Paper13.8%
Certificates of Deposit51.9%
Repurchase Agreements
26.8%
AA+1.2%
A‐1+ (Short‐term)28.4%
A‐1 (Short‐term)70.4%
Virginia SNAP® Program - SNAP Fund Portfolio
Portfolio Composition and RatingsJanuary 31, 2019

*Floating rate obligations are shown to their next reset date. All other securities are shown to their final maturity date.
Maturity Distribution*
0%
5%
10%
15%
20%
25%
30%
35%
40%
1 day 2 ‐ 7 days 8 ‐ 30 days 31 ‐ 90 days 91 ‐ 180 days 180+ days
January 31, 2019 December 31, 2018
Virginia SNAP® Program - SNAP Fund Portfolio
Portfolio Maturity DistributionJanuary 31, 2019

January 31, 2019 December 31, 2018 Net ChangeDistribution Yield (Gross) 2.72% 2.58% 0.14%Distribution Yield (Net) 2.65% 2.50% 0.15%Average Maturity* 29 days 32 days (3) daysNet Assets $3,863,234,904 $4,031,844,994 ($168,610,091)Number of Accounts 841 866 (25)
1. MMKT is iMoneyNet U.S. Prime First Tier Institutional Average Money Market Funds Net Yields
2. SNAP Fund Net Monthly Distribution Yield
*Average Maturity of SNAP Fund
Net Performance Comparison
0.00%
0.50%
1.00%
1.50%
2.00%
2.50%
3.00%
Feb-17 Mar-17 Apr-17 May-17 Jun-17 Jul-17 Aug-17 Sep-17 Oct-17 Nov-17 Dec-17 Jan-18 Feb-18 Mar-18 Apr-18 May-18 Jun-18 Jul-18 Aug-18 Sep-18 Oct-18 Nov-18 Dec-18 Jan-19
MMKT ¹ SNAP ²
Virginia SNAP® Program - SNAP Fund Portfolio
Investment OverviewJanuary 31, 2019

Assets
Investments 4,030,273,921.55$ Cash 273,698.03 Accrued Interest 7,640,871.28
Total Assets 4,038,188,490.86
Liabilities
Payable for Securities Purchased 174,676,308.00 Investment Management Fees Payable 227,025.63 Treasury Oversight Fee Payable 8,903.50 Other Operating Expenses Payable 41,350.13
Total Liabilities 174,953,587.26
Net Position 3,863,234,903.60$
Net Asset Value per Share 1.00$
Virginia SNAP® Program - SNAP Fund Portfolio
Statement of Net PositionJanuary 31, 2019
(unaudited)

Income
Investment Income 9,091,760.96$
Total Income 9,091,760.96
Expenses
Investment Management Fees 227,025.63 Treasury Oversight Fee 8,493.07 Other Operating Expenses 13,405.94
Total Expenses 248,924.64
Net Investment Income 8,842,836.32
Net Realized Gain on Investment Securities Sold 23,042.57
Net Increase from Investment Operations Before Capital Share Transactions 8,865,878.89
Shares Issued 49,813,458.10 Shares Redeemed (227,289,427.50)
Total Increase (Decrease) in Net Position (168,610,090.51)
Net Position -- December 31, 2018 4,031,844,994.11
Net Position -- January 31, 2019 3,863,234,903.60$
Virginia SNAP® Program - SNAP Fund Portfolio
Statement of Changes in Net PositionFor the Month Ended January 31, 2019
(unaudited)

Page 1
To: Virginia Treasury Board Members
From: PFM Asset Management LLC
Subject: Virginia SNAP Fund (the “Fund”) Compliance Checklist for the Month Ended January 31, 2019
I. Determination of Amortized Cost-Based and Market-Based Net Asset Value (NAVs)
A. Have the net asset values per share of each portfolio security been computed based upon available market quotations (or an appropriate substitute which reflects current market conditions) at least weekly?
Date of Pricing 1/3/2019 1/10/2019 1/17/2019 1/24/2019 1/31/2019
Average Maturity
32.3 Days 32.6 Days 34.7 Days 32.9 Days 28.9 Days
Net Assets at Market 4,021.81 3,987.22 3,923.24 3,869.57 3,863.89 Shares Outstanding
4,022.05 3,986.98 3,922.85 3,869.03 3,863.23
NAV as of Pricing Date
0.99994 1.00006 1.00010 1.00014 1.00017
Deviation from $1.00
-0.00006 0.00006 0.00010 0.00014 0.00017
B. Did the deviation of the market-based net asset value per share exceed 0.25%?
Yes No
If deviation was in excess of 0.25%:
1. Was the market-based NAV computation performed on a daily basis until thedeviation fell below 0.25%?
Yes No Not Applicable
2. Was the Board informed of the situation and told what action, if any, was beingtaken?
Yes No Not Applicable

Page 2
C. Did deviation of the market-based net asset value per share exceed 0.3750%?
Yes No
If the deviation was in excess of 0.3750%, was a meeting of the Board was held to determine what action, if any, should be initiated by the Board? Please note action below.
D. Was the portfolio periodically stress tested?
Yes No
E. Is the Advisor completing a periodic stress test of the Fund and reporting any deviation of the market-based net asset value per share that exceeds 0.3750%?
Yes No II. Credit Quality
A. Were all corporate notes and bonds rated AA or above by both Standard & Poor’s (“S&P”)
and Moody’s Investors Services (“Moody’s”)? Yes No Not Applicable
B. Was all commercial paper rated in the top short term rating category by at least two
nationally recognized statistical ratings organizations?
Yes No Not Applicable
C. Were all bankers’ acceptances rated in the top short-term category by at least two nationally recognized statistical ratings organizations?
Yes No Not Applicable
D. Were all bank deposit notes and certificates of deposit, whether maturing in one year or
less (short-term rating applies) or greater than one year but not to exceed 13 months (long-term rating applies), rated in one of the two highest rating categories by both S&P and Moody’s?
Yes No Not Applicable
E. Was at least 50% of the portfolio composed of securities rated at least A-1+ by S&P? (Note: Securities rated A-1 that mature within 5 business days are considered A-1+ for S&P’s AAAm requirements.)
Yes No Not Applicable

Page 3
F. Were all securities held in the portfolio analyzed by the Advisor and deemed to present minimal credit risk?
Yes No
G. Were any securities in the portfolio downgraded to below eligible security quality within the month?
Yes No
H. Were any securities in the portfolio in default for the month?
Yes No
If so, explain what action has been taken: I Were all repurchase agreements collateralized with only permitted securities? Yes No J. Were all repurchase counterparties deemed credit worthy in accordance with the
procedures governing repurchase agreements? Yes No
III. Diversification A. Did commercial paper represent more than 35% of the portfolio’s total assets at the time
of purchase?
Yes No Not Applicable B. Did any issuer at the time of purchase, other than the U.S. Government, represent more
than 5% of the portfolio’s assets? Yes No
C. Did any Federal Agency issuer at the time of purchase, represent more than 33% of the
Fund’s assets (final maturities of 30 days or less are excluded from this limit per S&P Fund Rating Criteria)?
Yes No Not Applicable

Page 4
IV. Maturity A. Did the dollar weighted average maturity of the portfolio exceed 60 days?
Yes No
B. Did the dollar weighted average life of the portfolio exceed 120 calendar days? Yes No
C. The maximum remaining maturity of all securities in the portfolio does not exceed 397 calendar days, other than U.S. Government or federal agency obligations under repurchase agreements, or unless subject at the time of purchase to an irrevocable agreement on the part of the responsible person to purchase the security within 397 days.
Yes No
D. The maximum maturity of any single issue of commercial paper in the portfolio did not exceed 270 days at the time of purchase.
Yes No Not Applicable
E. The maximum maturity of any single banker’s acceptance in the portfolio did not exceed
180 days at the time of purchase.
Yes No Not Applicable F. Did the Fund acquire any security other than a Daily Liquid Asset, if immediately after
the acquisition, the Fund would have been invested in less than 10% Daily Liquid Assets?
Yes No
G. Did the Fund acquire any security other than a Weekly Liquid Asset, if immediately after
the acquisition, the Fund would have been invested in less than 30% Weekly Liquid Assets?
Yes No
H. Did the Fund acquire any security, when at the time of purchase; the security represented
more than 5% in illiquid securities?
Yes No

SNAP Fund Shares Outstanding 3,863,234,904
Individual PortfoliosCity of Norfolk 2008 Water Revenue DSRF 935,925 City of Norfolk 2010 Water Revenue DSRF 1,317,682 Henrico County 2016 Construction Fund 4,368,997 Northern Virginia Transportation Authority 2014 DSRF 2,168,560 Northern Virginia Transportation Commission 2018 VRA DSRF 2,015,117 City of Virginia Beach Storm Water DSRF 3,340,986 Prince William County 2018 VPSA Construction Fund 28,023,607 Spotsylvania County 2010A W&S DSRF 2,822,457 Spotsylvania County 2010B W&S DSRF 2,536,546
47,529,877$
TOTAL 3,910,764,781$
Virginia SNAP® Program
Summary of AssetsJanuary 31, 2019

Date7-Day Yield Fund Purchases Fund Redemptions
Net Fund Activity Fund Balance
1/1/2019 2.58% $0 $0 $0 $4,031,844,994
1/2/2019 2.60% $250,000 $8,007,962 -$7,757,962 $4,024,087,033
1/3/2019 2.61% $0 $2,039,689 -$2,039,689 $4,022,047,344
1/4/2019 2.62% $311,999 $4,915,297 -$4,603,298 $4,017,444,046
1/7/2019 2.63% $0 $3,263,586 -$3,263,586 $4,014,180,460
1/8/2019 2.63% $7,920,137 $1,585,799 $6,334,338 $4,020,514,798
1/9/2019 2.62% $6 $3,151,848 -$3,151,842 $4,017,362,956
1/10/2019 2.61% $0 $30,386,903 -$30,386,903 $3,986,976,053
1/11/2019 2.62% $347,850 $9,135,403 -$8,787,553 $3,978,188,500
1/14/2019 2.62% $0 $2,062,327 -$2,062,327 $3,976,126,173
1/15/2019 2.63% $131,465 $17,021,584 -$16,890,119 $3,959,236,054
1/16/2019 2.63% $1,960,063 $24,448,305 -$22,488,243 $3,936,747,812
1/17/2019 2.63% $277,600 $14,177,792 -$13,900,192 $3,922,847,620
1/18/2019 2.63% $0 $14,648,338 -$14,648,338 $3,908,199,282
1/21/2019 2.64% $0 $0 $0 $3,908,199,282
1/22/2019 2.64% $0 $3,351,975 -$3,351,975 $3,904,847,307
1/23/2019 2.65% $0 $25,941,846 -$25,941,846 $3,878,905,461
1/24/2019 2.65% $0 $9,877,430 -$9,877,430 $3,869,028,031
1/25/2019 2.65% $32,386,558 $4,364,021 $28,022,537 $3,897,050,568
1/28/2019 2.65% $0 $16,311,033 -$16,311,033 $3,880,739,535
1/29/2019 2.65% $0 $22,309,734 -$22,309,734 $3,858,429,801
1/30/2019 2.65% $3,870,000 $2,497,576 $1,372,424 $3,859,802,225
1/31/2019 2.66% $11,223,659 $7,790,981 $3,432,679 $3,863,234,904
TOTALS: $58,679,337 $227,289,428 -$168,610,091
Average Fund Balance: $3,945,045,228
Average Net Fund Activity: -$7,330,874
Total Fund Purchases $58,679,337Total Fund Redemptions $227,289,428
Fund Flows
Virginia SNAP® Program - SNAP Fund PortfolioMonth Ended January 31, 2019
SNAP Fund Trade Activity
$0$500,000,000$1,000,000,000$1,500,000,000$2,000,000,000$2,500,000,000$3,000,000,000$3,500,000,000$4,000,000,000$4,500,000,000
$0
$5,000,000
$10,000,000
$15,000,000
$20,000,000
$25,000,000
$30,000,000
$35,000,000
$40,000,000
1/1 1/3 1/5 1/7 1/9 1/11 1/13 1/15 1/17 1/19 1/21 1/23 1/25 1/27 1/29 1/31
Fu
nd
Ba
lan
ce
Pu
rch
ase
s a
nd
Re
de
mpt
ion
s
Fund Balance Fund Purchases Fund Redemptions

Schedule of Investments January 31, 2019For the Month Ending
SNAP® Fund Portfolio Virginia State Non-Arbitrage Program®
{VA SNAP POOL_2019-01-31}
Yield to Date for Date for(1) (2)
Maturity
Maturity
DateWALWAMMaturityCUSIP Category of Investment / Issuer Principal Value(3)
Maturity Final
(4)
U.S. Treasury Repurchase Agreement
RP1D3SFQ0 2.55% 02/01/2019 02/01/2019 172,000,000.00CREDIT AGRICOLE CIB/US 02/01/2019 172,000,000.00
RPQD0OYY7 2.42% 02/07/2019 02/07/2019 200,000,000.00CREDIT AGRICOLE CIB/US 02/15/2019 200,000,000.00
372,000,000.00 372,000,000.00 Category of Investment Sub-Total
U.S. Treasury Debt
912796UR8 2.38% 03/05/2019 03/05/2019 175,000,000.00UNITED STATES TREASURY 03/05/2019 174,676,308.00
912828ST8 2.52% 04/30/2019 04/30/2019 50,000,000.00UNITED STATES TREASURY 04/30/2019 49,846,672.77
225,000,000.00 224,522,980.77 Category of Investment Sub-Total
U.S. Government Agency Repurchase Agreement
RP1D3Q5W2 2.44% 02/07/2019 02/07/2019 100,000,000.00CREDIT AGRICOLE CIB/US 02/21/2019 100,000,000.00
RP1D3SFF4 2.43% 02/07/2019 02/07/2019 50,000,000.00GOLDMAN SACHS & CO 02/07/2019 50,000,000.00
RPQD0P906 2.40% 02/07/2019 02/07/2019 200,000,000.00GOLDMAN SACHS & CO 03/01/2019 200,000,000.00
RP1D3SFI8 2.57% 02/01/2019 02/01/2019 361,500,000.00MERRILL LYNCH PIERCE FENNER & SMITH INC 02/01/2019 361,500,000.00
711,500,000.00 711,500,000.00 Category of Investment Sub-Total
U.S. Government Agency Debt
313384BX6 2.41% 02/15/2019 02/15/2019 75,000,000.00FEDERAL HOME LOAN BANKS 02/15/2019 74,930,029.24
75,000,000.00 74,930,029.24 Category of Investment Sub-Total
Financial Company Commercial Paper
44988KES4 2.79% 02/15/2019 02/15/2019 40,000,000.00(5)ING (US) FUNDING LLC 02/15/2019 40,000,000.00
44988KFG9 2.81% 02/15/2019 03/15/2019 50,000,000.00(5)ING (US) FUNDING LLC 03/15/2019 50,000,000.00
44988KFY0 2.66% 02/04/2019 05/03/2019 10,000,000.00(5)ING (US) FUNDING LLC 05/03/2019 10,000,000.00
44988KGX1 2.81% 02/05/2019 07/05/2019 25,000,000.00(5)ING (US) FUNDING LLC 07/05/2019 25,000,000.00
46640QS10 2.84% 05/01/2019 05/01/2019 50,000,000.00JP MORGAN SECURITIES LLC 05/01/2019 49,653,889.00
46640EHW1 2.82% 02/11/2019 07/09/2019 45,000,000.00(5)JP MORGAN SECURITIES LLC 07/09/2019 45,000,000.00
46640EHX9 2.92% 04/11/2019 10/11/2019 25,000,000.00(5)JP MORGAN SECURITIES LLC 10/11/2019 25,000,000.00
Page 1

Schedule of Investments January 31, 2019For the Month Ending
SNAP® Fund Portfolio Virginia State Non-Arbitrage Program®
{VA SNAP POOL_2019-01-31}
Yield to Date for Date for(1) (2)
Maturity
Maturity
DateWALWAMMaturityCUSIP Category of Investment / Issuer Principal Value(3)
Maturity Final
(4)
Financial Company Commercial Paper
62479MQU0 2.82% 03/28/2019 03/28/2019 64,000,000.00MUFG BANK LTD/NY 03/28/2019 63,726,222.25
63873LBW4 2.76% 02/13/2019 05/13/2019 60,000,000.00(5)NATIXIS NY BRANCH 05/13/2019 60,000,000.00
63873LCB9 2.84% 02/07/2019 06/05/2019 15,000,000.00(5)NATIXIS NY BRANCH 06/05/2019 15,000,000.00
63873KU88 2.85% 07/08/2019 07/08/2019 50,000,000.00NATIXIS NY BRANCH 07/08/2019 49,387,263.90
89233HQ80 2.77% 03/08/2019 03/08/2019 60,000,000.00TOYOTA MOTOR CREDIT CORP 03/08/2019 59,839,583.23
89233AG86 2.85% 04/18/2019 04/18/2019 65,000,000.00(5)TOYOTA MOTOR CREDIT CORP 04/18/2019 65,000,000.00
559,000,000.00 557,606,958.38 Category of Investment Sub-Total
Certificate of Deposit
05252WQN6 2.91% 03/13/2019 09/13/2019 25,000,000.00(5)AUST & NZ BANKING GRP NY 09/13/2019 25,000,000.00
06370RLR8 2.67% 02/04/2019 05/03/2019 25,000,000.00(5)BANK OF MONTREAL CHICAGO 05/03/2019 24,999,356.42
06370RNX3 2.83% 02/01/2019 05/09/2019 50,000,000.00(5)BANK OF MONTREAL CHICAGO 05/09/2019 50,000,000.00
06370RQV4 2.87% 03/11/2019 06/10/2019 50,000,000.00(5)BANK OF MONTREAL CHICAGO 06/10/2019 50,000,000.00
06417GT81 2.78% 02/06/2019 03/06/2019 25,000,000.00(5)BANK OF NOVA SCOTIA HOUSTON 03/06/2019 25,000,000.00
06417G2H0 2.88% 04/02/2019 07/02/2019 35,000,000.00(5)BANK OF NOVA SCOTIA HOUSTON 07/02/2019 35,000,000.00
05586FHA8 2.80% 02/07/2019 05/07/2019 50,000,000.00(5)BNP PARIBAS NY BRANCH 05/07/2019 50,000,000.00
05586FGA9 2.82% 02/08/2019 05/08/2019 50,000,000.00(5)BNP PARIBAS NY BRANCH 05/08/2019 50,000,000.00
05586FPW1 2.97% 04/08/2019 10/08/2019 30,000,000.00(5)BNP PARIBAS NY BRANCH 10/08/2019 30,000,000.00
13606BXG6 2.78% 02/05/2019 03/05/2019 15,000,000.00(5)CANADIAN IMP BK COMM NY 03/05/2019 15,000,000.00
20271EQE2 2.80% 02/07/2019 06/07/2019 50,000,000.00(5)COMMONWEALTH BANK OF AUSTRALIA NY 06/07/2019 50,000,000.00
21684B5B6 2.80% 03/12/2019 03/12/2019 25,000,000.00COOPERATIEVE RABOBANK U.A. 03/12/2019 25,004,731.97
21684B7H1 2.78% 02/28/2019 05/29/2019 25,000,000.00(5)COOPERATIEVE RABOBANK U.A. 05/29/2019 25,000,000.00
22532XKP2 2.79% 02/19/2019 05/20/2019 40,000,000.00(5)CREDIT AGRICOLE CIB NY 05/20/2019 40,000,000.00
22532XKV9 2.94% 03/20/2019 06/20/2019 40,000,000.00(5)CREDIT AGRICOLE CIB NY 06/20/2019 40,000,000.00
22549LPE9 2.66% 04/09/2019 04/09/2019 50,000,000.00CREDIT SUISSE NEW YORK 04/09/2019 50,000,000.00
22549LUJ2 2.87% 03/11/2019 06/10/2019 30,000,000.00(5)CREDIT SUISSE NEW YORK 06/10/2019 30,000,000.00
22549LVJ1 2.95% 03/19/2019 06/19/2019 45,000,000.00(5)CREDIT SUISSE NEW YORK 06/19/2019 45,000,000.00
40054PAJ4 2.77% 02/13/2019 08/09/2019 40,000,000.00(5)GOLDMAN SACHS GROUP INC 08/09/2019 40,000,000.00
55379WWD4 2.84% 02/12/2019 08/12/2019 50,000,000.00(5)MITSUBISHI UFJ FIN GRP 08/12/2019 50,000,000.00
Page 2

Schedule of Investments January 31, 2019For the Month Ending
SNAP® Fund Portfolio Virginia State Non-Arbitrage Program®
{VA SNAP POOL_2019-01-31}
Yield to Date for Date for(1) (2)
Maturity
Maturity
DateWALWAMMaturityCUSIP Category of Investment / Issuer Principal Value(3)
Maturity Final
(4)
Certificate of Deposit
60700A3M4 2.82% 03/15/2019 03/15/2019 15,000,000.00MIZUHO BANK LTD/NY 03/15/2019 15,000,000.00
60700AX25 2.91% 04/03/2019 04/03/2019 76,000,000.00(5)MIZUHO BANK LTD/NY 04/03/2019 76,000,000.00
60700AZ98 2.92% 04/23/2019 04/23/2019 35,000,000.00(5)MIZUHO BANK LTD/NY 04/23/2019 35,000,000.00
55379WBH8 2.66% 04/17/2019 04/17/2019 15,000,000.00MUFG BANK LTD/NY 04/17/2019 14,999,747.27
65558TCE3 2.82% 04/01/2019 04/01/2019 25,000,000.00NORDEA BANK AB NEW YORK 04/01/2019 25,000,000.00
65590AH41 2.65% 02/05/2019 04/05/2019 40,000,000.00(5)NORDEA BANK AB NEW YORK 04/05/2019 40,000,000.00
65590AUR5 3.00% 04/05/2019 04/05/2019 30,000,000.00(5)NORDEA BANK AB NEW YORK 04/05/2019 30,000,000.00
65590AD37 2.68% 02/15/2019 05/15/2019 30,000,000.00(5)NORDEA BANK AB NEW YORK 05/15/2019 30,000,000.00
65602VFK7 2.75% 04/08/2019 04/08/2019 50,000,000.00NORINCHUKIN BANK NY 04/08/2019 50,000,000.00
78012UAS4 2.67% 02/20/2019 02/20/2019 40,000,000.00ROYAL BANK OF CANADA NY 02/20/2019 40,001,246.40
78012UBX2 3.10% 03/22/2019 03/22/2019 31,000,000.00(5)ROYAL BANK OF CANADA NY 03/22/2019 31,009,131.67
78012UEP6 2.88% 04/02/2019 04/02/2019 10,657,000.00(5)ROYAL BANK OF CANADA NY 04/02/2019 10,655,739.73
78012UFT7 2.72% 02/01/2019 05/01/2019 40,000,000.00(5)ROYAL BANK OF CANADA NY 05/01/2019 40,000,000.00
83050F3D1 2.70% 02/19/2019 04/17/2019 25,000,000.00(5)SKANDINAVISKA ENSKILDA BANKEN AB 04/17/2019 25,000,000.00
83050F2P5 2.87% 03/28/2019 06/28/2019 50,000,000.00(5)SKANDINAVISKA ENSKILDA BANKEN AB 06/28/2019 49,998,833.41
83369YZW9 2.77% 02/28/2019 02/28/2019 20,000,000.00SOCIETE GENERALE NY 02/28/2019 20,001,972.38
83369YV29 2.90% 04/17/2019 04/17/2019 25,000,000.00(5)SOCIETE GENERALE NY 04/17/2019 25,000,000.00
83369YW77 2.72% 02/07/2019 05/07/2019 30,000,000.00(5)SOCIETE GENERALE NY 05/07/2019 30,000,000.00
83369YX50 2.81% 02/11/2019 05/09/2019 50,000,000.00(5)SOCIETE GENERALE NY 05/09/2019 50,000,000.00
8574P1LW4 2.78% 02/15/2019 05/15/2019 25,000,000.00(5)STATE STREET BANK & TR 05/15/2019 25,000,000.00
86563YXB4 3.21% 03/05/2019 06/05/2019 30,000,000.00(5)SUMITOMO MITSUI BANK NY 06/05/2019 30,031,276.30
86565BSV4 2.82% 02/08/2019 07/08/2019 60,000,000.00(5)SUMITOMO MITSUI BANK NY 07/08/2019 60,000,000.00
86958JT82 2.66% 02/08/2019 04/08/2019 45,000,000.00(5)SVENSKA HANDELSBANKEN NY 04/08/2019 45,000,000.00
86958J2E8 2.82% 02/25/2019 06/24/2019 47,000,000.00(5)SVENSKA HANDELSBANKEN NY 06/24/2019 47,000,000.00
86958J3A5 2.95% 04/02/2019 10/02/2019 20,000,000.00(5)SVENSKA HANDELSBANKEN NY 10/02/2019 20,000,000.00
87019VSW8 2.81% 02/01/2019 08/01/2019 20,000,000.00(5)SWEDBANK (NEW YORK) 08/01/2019 20,000,000.00
89113XG81 2.94% 04/17/2019 04/17/2019 20,000,000.00(5)TORONTO DOMINION BANK 04/17/2019 20,000,000.00
89114MKX4 2.79% 02/07/2019 05/07/2019 25,000,000.00(5)TORONTO DOMINION BANK 05/07/2019 25,000,000.00
89114MLU9 2.79% 02/14/2019 05/14/2019 30,000,000.00(5)TORONTO DOMINION BANK 05/14/2019 30,000,000.00
89114MQL4 2.77% 03/13/2019 03/13/2019 50,000,000.00TORONTO DOMINION BANK NY 03/13/2019 50,000,000.00
Page 3

Schedule of Investments January 31, 2019For the Month Ending
SNAP® Fund Portfolio Virginia State Non-Arbitrage Program®
{VA SNAP POOL_2019-01-31}
Yield to Date for Date for(1) (2)
Maturity
Maturity
DateWALWAMMaturityCUSIP Category of Investment / Issuer Principal Value(3)
Maturity Final
(4)
Certificate of Deposit
90275DJF8 2.79% 02/11/2019 07/11/2019 40,000,000.00(5)UBS AG STAMFORD CT 07/11/2019 40,000,000.00
90333VZL7 2.81% 05/23/2019 05/23/2019 40,000,000.00US BANK NA CINCINNATI 05/23/2019 40,000,000.00
94989RD62 3.05% 04/05/2019 04/05/2019 25,000,000.00(5)WELLS FARGO BANK NA 04/05/2019 25,005,939.72
94989RE20 3.03% 04/12/2019 04/12/2019 60,000,000.00(5)WELLS FARGO BANK NA 04/12/2019 60,000,000.00
94989R4B1 2.98% 04/02/2019 10/02/2019 25,000,000.00(5)WELLS FARGO BANK NA 10/02/2019 25,000,000.00
94989R3Q9 2.88% 02/25/2019 12/20/2019 15,000,000.00(5)WELLS FARGO BANK NA 12/20/2019 15,005,977.89
96130AAF5 2.85% 04/26/2019 04/26/2019 25,000,000.00(5)WESTPAC BANKING CORP NY 04/26/2019 25,000,000.00
96130AAX6 2.78% 02/21/2019 05/21/2019 50,000,000.00(5)WESTPAC BANKING CORP NY 05/21/2019 50,000,000.00
96130ABB3 2.79% 02/04/2019 06/04/2019 20,000,000.00(5)WESTPAC BANKING CORP NY 06/04/2019 20,000,000.00
96130ABL1 2.93% 03/11/2019 09/10/2019 30,000,000.00(5)WESTPAC BANKING CORP NY 09/10/2019 30,000,000.00
2,089,657,000.00 2,089,713,953.16 Category of Investment Sub-Total
4,032,157,000.00 Portfolio Totals 4,030,273,921.55
Page 4

Schedule of Investments January 31, 2019For the Month Ending
SNAP® Fund Portfolio Virginia State Non-Arbitrage Program®
{VA SNAP POOL_2019-01-31}
The maturity date used to calculate weighted-average maturity (WAM) under GASB 79. This takes into account the maturity shortening provisions of GASB 79 regarding
demand features and interest rate adjustments.
Adjustable rate instrument. Rate shown is that which is in effect as of reporting date.(5)
The value in accordance with GASB 79. Unless otherwise noted, the fund utilizes the amortized cost method to value portfolio securities.(4)
The ultimate legal maturity date on which, in accordance with the terms of the security, and without reference to the maturity shortening provisions of GASB 79, the principal
amount must unconditionally be paid.
(3)
The maturity date used to calculate weighted-average life (WAL) under GASB 79. This takes into account the maturity shortening provisions of GASB 79 regarding demand
features without reference to interest rate adjustments.
(2)
(1)
The Fund's Weighted Average Maturity and Weighted Average Life Maturity as of the reporting date are 29 and 74 days, respectively.
This information is for institutional investor use only, not for further distribution to retail investors, and does not represent an offer to sell or a solicitation of an offer to buy or sell any fund or
other security. Investors should consider the investment objectives, risks, charges and expenses before investing in the Virginia State Non-Arbitrage Program (“SNAP®” or the “Program”).
This and other information about the Program is available in the SNAP® Information Statement, which should be read carefully before investing. A copy of the SNAP® Information
Statement may be obtained by calling 1-800-570-SNAP (7627) or is available on the Program’s website at www.vasnap.com . While the SNAP® Fund Portfolio seeks to maintain a stable net
asset value of $1.00 per share, it is possible to lose money investing in the Program. An investment in the Program is not insured or guaranteed by the Federal Deposit Insurance Corporation
or any other government agency. Shares of the SNAP® Fund Portfolio are distributed by PFM Fund Distributors, Inc., member Financial Industry Regulatory Authority (FINRA)
(www.finra.org) and Securities Investor Protection Corporation (SIPC) (www.sipc.org ). PFM Fund Distributors, Inc. is a wholly owned subsidiary of PFM Asset Management LLC.
Page 5

MONTHLY INVESTMENT REPORT
February 2019
Prepared for the Commonwealth Treasury Board
Treasury Yield Curve
3mo 6mo 1yr 2yr 3yr 5yr 7yr 10yr 30yr Slope 01/31/19 2.39 2.46 2.55 2.46 2.43 2.44 2.52 2.63 3.00 61 12/31/18 2.36 2.48 2.60 2.49 2.46 2.51 2.59 2.68 3.02 65 Change 0.03 -0.02 -0.05 -0.03 -0.03 -0.07 -0.07 -0.05 -0.02
Interest Rates and Economic Review Risk assets rallied and US Treasury yields declined following dovish FOMC statements during the January meeting. Resolution of the federal government shutdown, temporary as it may be, contributed to the positive tone. Although the shutdown limited the volume of economic data releases during the month, most market strategists suggest the economy remains strong and the risk of a recession in the near-term is low. January payrolls showed a better-than-expected increase of 300,000 jobs although the unemployment rate rose from 3 .9 percent to 4.0 percent. Despite the positive signals from the relief rally, however, there seems to be building caution around the outlook for the domestic and global economy. As expected, the FOMC did not announce any operational changes at the January meeting. They did however; signal a notable change in policy bias. While the FOMC continues to have a sanguine view of the domestic economy, the Committee noted ‘market-based measures for inflation compensation have moved lower in recent months,’ citing it as a factor for leaning to a less restrictive policy bias. FOMC participants also noted some concern about potential contagion from the global economic slowdown as contributing to an expected ‘pause’ in raising domestic policy rates. Indeed, the IMF’s recently released global growth report revised expectations for 2019 economic expansion lower, mostly driven by a slowdown in developed nations, citing the risks of a no-deal Brexit and slowing China growth, among other factors. Market participants have seized on officials’ change in tone and futures contracts are currently placing a higher probability of a domestic rate cut than a rate hike during 2019. In line with the more cautionary market environment, the Federal Reserve provided an updated Senior Loan Officer Survey for January showing banks are tightening credit standards. Standards for commercial real estate and credit card loans tightened most and respondents pointed to weakening demand for commercial loans, particularly construction and land development projects, and household loans. Loan officers also indicated they expect to tighten standards further for most classes of loans during 2019.

MONTHLY INVESTMENT REPORT Page 2 of 2 February 2019
Primary Liquidity Portfolio Monthly Review For the month of January, the liquidity portion of the General Account earned 2.56 percent, which was two basis points less than the one-year Treasury constant maturity return. Securities lending contributed $92,108 to income for the month. The average days to maturity at the end of the month was 163 days. Security purchases greater than 90 days-to-maturity included $502 million money market securities with a weighted average maturity of 157 days and a weighted average yield of 2.70 percent, $43.4 million US government agencies with an average weighted maturity of 2.4 years and a weighted average yield of 2.55 percent and, $25 million World Bank corporate bonds with a maturity of 252 days and a yield of 2.65 percent.
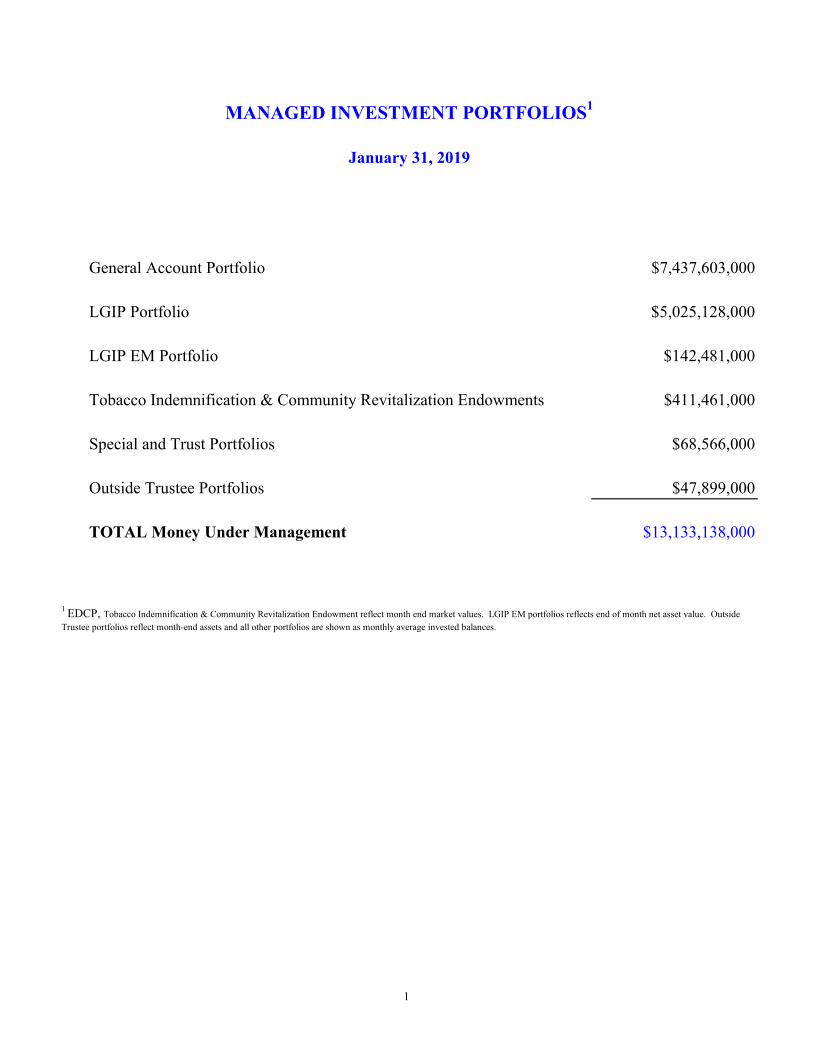
General Account Portfolio $7,437,603,000
LGIP Portfolio $5,025,128,000
LGIP EM Portfolio $142,481,000
Tobacco Indemnification & Community Revitalization Endowments $411,461,000
Special and Trust Portfolios $68,566,000
Outside Trustee Portfolios $47,899,000
TOTAL Money Under Management $13,133,138,000
MANAGED INVESTMENT PORTFOLIOS1
January 31, 2019
1 EDCP, Tobacco Indemnification & Community Revitalization Endowment reflect month end market values. LGIP EM portfolios reflects end of month net asset value. Outside Trustee portfolios reflect month-end assets and all other portfolios are shown as monthly average invested balances.
1

Government Securities Jan Dec Change
US Govt MMK Funds 0.5% 0.2% 0.3%
Repurchase Agreements 6.0% 6.2% -0.2%
U.S. Treasury 1.9% 0.8% 1.1%
Agency Securities 29.1% 22.4% 6.7%
AAA Sovereign 0.0% 0.0% 0.0%
Securities for Public Deposit CD's 0.2% 0.2% 0.0%
Sub-Total 37.7% 29.8% 7.9%
Credit SecuritiesCD's & Bank Notes 31.3% 38.7% -7.4%
Commercial Paper 30.6% 31.5% -0.9%
Corporate Notes 0.4% 0.0% 0.4%Sub-Total 62.3% 70.2% -7.9%
Total 100% 100%
Asset allocation calculations are based on end of month balance while portfolio compliance is measured at the time an asset is purchased.
Totals may not add due to rounding.
Asset Allocation and Risk ProfileGeneral Account - Primary Liquidity
January 31, 2019
2

1 Yr. Treasury FISCAL YEAR Constant
2019 Avg. Balance 1 YTM 2Duration (years) EOM Balance 3 YTM 4
Duration (years) Balance
Composite
YTM 5Duration (years) Maturity Yield 6
July 2018 $5,881.1 2.12% 0.51 $1,263.5 3.21% 4.10 $7,144.6 2.31% 1.15 2.39%
August 2018 $5,225.6 2.12% 0.48 $1,270.4 3.16% 4.06 $6,496.0 2.32% 1.18 2.45%
September 2018 $5,777.9 2.17% 0.51 $1,266.5 3.32% 4.11 $7,044.4 2.38% 1.16 2.56%
October 2018 $6,209.6 2.31% 0.53 $1,261.9 3.44% 4.13 $7,471.5 2.50% 1.14 2.65%
November 2018 $6,034.2 2.40% 0.57 $1,267.9 3.42% 4.07 $7,302.1 2.58% 1.18 2.70%
December 2018 $5,761.6 2.47% 0.53 $1,284.1 3.21% 4.02 $7,045.7 2.61% 1.17 2.66%
January 2019 $6,148.6 2.56% 0.45 $1,293.9 3.08% 4.04 $7,442.5 2.65% 1.07 2.58%1 Average daily balance for the Primary Liquidity Pool for the reporting period.
2 Total net earnings for the month ÷ number of days in month*365 ÷ average daily balance
3 Actual month end balance (market value + accrued income)
4 Actual YTM as of month end as reported by external managers.
5 Weighted YTM based on average Balance of Primary Liquidity and External Managers.
6 Federal Reserve Bank H.15 Release Monthly Averages
General Account Investment PortfolioPrimary Liquidity Portfolio Yield to Maturity (YTM)/Duration (years)
Externally Managed Extended Duration Portfolio Yield to Maturity (YTM)/Duration (years)
EXTERNAL MANAGEMENT
EXTENDED DURATION COMPOSITE
3

Report of General Account Investment Income
Fiscal Year 2019
Investment Balance,Income and This Year Last Year This Year Last Year
Month Earned Yield 2019 2018 2019 2018
JULY
2018 Average Balance Invested $7,145.2 $5,838.8 $7,145.2 $5,838.8
Collected Income 14.7 7.9 14.7 7.9
Earned Income 11.2 9.8 11.2 9.8
Transfers & Fees 0.0 0.0 0.0 0.0
Earned Yield % 1.84 % 1.97 % 1.84 % 1.97 %
AUGUST
2018 Average Balance Invested $6,492.6 $5,262.8 $6,818.9 $5,550.8
Collected Income 9.1 4.8 23.8 12.7
Earned Income 16.8 12.1 28.0 21.9
Transfers & Fees 0.0 0.0 0.0 0.0
Earned Yield % 3.05 % 2.71 % 2.42 % 2.32 %
SEPTEMBER
2018 Average Balance Invested $7,046.4 $5,565.4 $6,894.7 $5,555.7
Collected Income 9.4 6.8 33.3 19.5
Earned Income 5.8 (0.3) 33.8 21.6
Transfers & Fees 0.0 0.0 0.0 0.0
Earned Yield % 1.00 % (0.07)% 1.94 % 1.54 %
OCTOBER
2018 Average Balance Invested $7,473.8 $5,901.7 $7,039.5 $5,642.2
Collected Income 13.1 5.8 46.4 25.2
Earned Income 8.1 5.5 41.9 27.0
Transfers & Fees 25.0 13.8 25.0 13.8
Earned Yield % 1.28 % 1.09 % 1.77 % 1.42 %
NOVEMBER
2018 Average Balance Invested $7,299.1 $6,119.1 $7,091.4 $5,737.6
Collected Income 10.2 5.3 56.6 30.6
Earned Income 17.9 2.7 59.8 29.7
Transfers & Fees 0.0 0.0 25.0 13.8
Earned Yield % 2.98 % 0.54 % 2.01 % 1.24 %
DECEMBER
2018 Average Balance Invested $7,037.6 $6,071.2 $7,082.5 $5,793.2
Collected Income 10.1 8.8 66.7 39.4
Earned Income 29.0 8.7 88.8 38.4
Transfers & Fees 0.0 0.0 25.0 13.8
Earned Yield % 4.85 % 1.68 % 2.49 % 1.32 %
Department of the Treasury
Year-to-date(dollars in millions)
Month(dollars in millions)
4

Report of General Account Investment Income
Fiscal Year 2019
Investment Balance,Income and This Year Last Year This Year Last Year
Month Earned Yield 2019 2018 2019 2018
Department of the Treasury
Year-to-date(dollars in millions)
Month(dollars in millions)
JANUARY
2019 Average Balance Invested $7,437.6 $7,035.3 $7,133.2 $5,970.6
Collected Income 14.0 7.0 80.7 46.4
Earned Income 24.8 (3.5) 113.6 34.9
Transfers & Fees 26.4 16.6 51.4 30.4
Earned Yield % 3.93 % (0.58)% 2.70 % 0.99 %
FEBRUARY
2019 Average Balance Invested $7,002.4 $6,099.6
Collected Income 6.6 53.0
Earned Income 0.6 35.5
Transfers & Fees 0.0 30.4
Earned Yield % 0.12 % 0.88 %
MARCH
2019 Average Balance Invested $6,562.9 $6,151.1
Collected Income 6.4 59.5
Earned Income 12.2 47.7
Transfers & Fees 0.0 30.4
Earned Yield % 2.18 % 1.03 %
APRIL
2019 Average Balance Invested $6,725.8 $6,208.5
Collected Income 10.1 69.6
Earned Income 2.2 49.9
Transfers & Fees 16.3 46.7
Earned Yield % 0.40 % 0.97 %
MAY
2019 Average Balance Invested $7,075.5 $6,287.4
Collected Income 6.9 76.5
Earned Income 16.4 66.3
Transfers & Fees 0.0 46.7
Earned Yield % 2.73 % 1.15 %
JUNE
2019 Average Balance Invested $6,922.3 $6,340.3
Collected Income 12.3 88.8
Earned Income 8.6 74.9
Transfers & Fees 0.0 46.7
Earned Yield % 1.51 % 1.18 %
- Collected Income is collected interest income reported by ACTR 1673, Revenue Code 07101 & 07108 & 07133.
- Transfers represent interest accrued on various non-general funds and transferred to those funds from the general fund.- Earned Yield % is total Earned Income divided by Average Balances Invested.
5

EDCPPerformance (net of fees) vs. Benchmark*
Periods Ending January 31, 2019(1-Month and Rolling 12-Month Periods)
Manager – Solid/Benchmark - Striped
* Individual Manager Benchmarks are outlined in the Investment Policy Statement.
Source: JPM; Zephyr StyleAdvisor
0.5
0.9 1.0
1.3
0.6
0.9 0.4
0.9 0.9
1.3 1.3
0.8
2.3
2.6 2.6
1.4
2.2 2.3
2.3
2.7 2.7
1.8 1.8
2.4
0.00
0.50
1.00
1.50
2.00
2.50
3.00
Merganser IR+M Wellington Dodge & Cox Earnest EDCP Total
Past performance is not indicative of future results. 1

Portfolio StatisticsShort Duration Portfolio Market Value % of Plan Month 3 Month Fiscal YTD 1 Year 2 Year 3 Year 5 Year Inception(3) Benchmark Effective Duration Target Merganser Capital Mgmt. (3) 296,412,990.86$ 22.9% 0.48 1.43 1.97 0.48 2.35 1.56 1.39 1.24 4.09 3.95 1.71 1.91
Total Short Duration (6) 296,412,990.86$ 22.9% 0.48 1.43 1.97 0.48 2.35 1.56 1.39 1.24 4.08 3.85 1.71 1.91 Bloomberg Barclays Capital 1-3 Year Gov/Credit index 0.39 1.46 1.91 0.39 2.27 1.32 1.20 1.07 3.85
Intermediate Duration Portfolio Income Research and Mgmt. (3) 382,294,054.66$ 29.5% 0.92 2.71 2.73 0.92 2.61 1.85 1.53 2.05 4.59 4.67 3.85 3.83
Goldman Sachs (3) 1,586,194.75$ 0.1% 0.19 0.36 (3.20) 0.19 (3.31) (1.22) (0.51) 0.65 2.74 3.90 0.00 3.83
Wellington Mgmt Co.(3) 353,137,734.36$ 27.3% 0.98 2.72 2.71 0.98 2.62 1.90 1.72 1.90 5.02 5.29 3.73 3.83
Total Intermediate Duration(4) 737,017,983.77$ 56.9% 0.95 2.71 2.70 0.95 2.60 1.84 1.58 1.94 4.96 5.28 3.78 3.8385% Bloomberg Barclays Intermediate Govt/Credit 15% Bloomberg Barclays Fixed Rate MB 0.86 2.81 2.76 0.86 2.71 1.97 1.72 2.12 5.28
Long Duration Portfolio Dodge & Cox (3) 190,320,201.67$ 14.7% 1.25 3.69 2.71 1.25 1.39 2.30 2.16 2.85 5.35 5.57 6.56 6.53
Earnest Partners (3) 71,672,614.59$ 5.5% 0.65 3.77 2.44 0.65 2.23 2.40 1.88 3.17 4.57 4.81 6.95 6.53
Total Long Duration(5) 261,992,816.26$ 20.2% 1.09 3.72 2.64 1.09 1.62 2.33 2.08 2.94 5.70 6.15 6.67 6.5383% Bloomberg Barclays Agg, 17% Bloomberg Barclays Long Gov/Credit 1.26 4.06 2.71 1.26 1.79 2.61 2.52 3.13 6.15
Total Fund Return (3) (4) (5) (6) 1,295,423,790.89$ 100.0% 0.87 2.62 2.52 0.87 2.34 1.87 1.64 1.98 4.91 5.19 3.89 3.94Target Benchmark 0.85 2.79 2.59 0.85 2.44 1.99 1.80 2.14 5.19
(1) As of 1/2018 the Short Duration benchmark is the Bloomberg Barclays 1-3 Gov/Credit index, the intermediate Duration Benchmark is 85% Bloomberg Barclays Intermediate Govt/Credit 15% Bloomberg Barclays Fixed Rate MBS and the Long Duration benchmark is 83% Bloomberg Barclays Agg, 17% Bloomberg Barclays Long Gov/Credit. As of 11/2009 the Short Duration benchmark was the Bloomberg Barclays 1-3 Gov/Credit (+15bp): the incremental return over the benchmark for the intermediate duration was (+25bp) for the total long duration was (+30b). Prior to 11-2009…. (2) Effective 1/2018 The Target Benchmark consists of: 20% Short Duration benchmark, 60% Intermediate Duration benchmark and 20% Extended Duration benchmark. prior 11/2009 the incremental return over the benchmark is (+24bp) was included Prior to 11/2009 the incremental return over the benchmark was (+46bp). Prior to 4/2000 the incremental return over the benchmark was 32bp
(3) Inception dates: Total Fund, Merganser, Wellington and Western - January-1995 ** Loomis, Aberdeen, Merrill Lynch and Dodge & Cox - April-2000 ** Income Research - July-2000. ** Earnest Partners - Dec 2005. ** Dwight Asset - February 2007
(4) The Total Intermediate Duration and Total Fund Composite include the performance of the Western Asset Management account which was closed in May 2009 and the Loomis Sayles account which was closed in September 2002.
(5) The Total Long Duration and Total Fund Composite includes the performance of the Aberdeen Asset Management account which was closed in March 2010.
(6) The Total Short Duration and Total Fund Composite include the performance of the Merrill Lynch Asset Management account which was closed in September 2002.
Commonwealth of Virginia - Extended Duration and Credit PortfolioNet Investment Returns For the Period Ending January 31, 2019
Prior MonthReturns Annualized Returns

TICR Tax-Exempt & TICR TaxablePerformance (net of fees) vs. Benchmark*
Periods Ending January 31, 2019(1-Month and Rolling 12-Month Periods)
Manager – Solid/Benchmark - Striped
* Individual Manager Benchmarks are outlined in the Investment Policy Statement.
Source: JPM; Zephyr StyleAdvisor
0.4
1.0 0.9
0.4
0.7 0.7 0.6
0.4
1.1
0.9
0.3
0.7 0.7 0.6
1.8
3.4
3.0
2.3
2.9
2.4 2.4
2.0
3.7
3.1
2.3
3.0 3.0
2.8
0.00
0.50
1.00
1.50
2.00
2.50
3.00
3.50
4.00
BlackRock IR+M Tax-Ex Total IR+M SB&H D & C Taxable Total
Past performance is not indicative of future results. 2

Portfolio StatisticsMarket Value % of Plan Month 3 Month Fiscal YTD 1 Year 2 Year 3 Year 5 Year Inception
Money Market FundBlackRock MuniCash(5)(6) 20,054.18$ 0.0% 0.11 0.36 0.78 0.11 1.25 0.99 0.84 0.51 1.03
Total Tax-Exempt Short Term Fund(5) 20,054.18$ 0.0% 0.11 0.36 0.78 0.11 1.25 0.99 0.84 0.51 1.03BlackRock MuniCash Fund #015 20,054.18$ 0.0% 0.11 0.36 0.78 0.11 1.25 0.99 0.84 0.51 1.03
Short Duration Portfolio
Blackrock 40,624,916.25$ 21.6% 0.43 1.42 1.36 0.43 1.85 1.17 0.81 0.79 1.82
Total Short Duration 40,624,916.25$ 21.6% 0.43 1.42 1.36 0.43 1.85 1.17 0.81 0.79 1.82Bloomberg Barclays 1-3 Year Municipal Bond Index A Rated and Above +10bp 0.39 1.26 1.25 0.39 1.98 1.45 1.10 1.04 2.30
Intermediate Duration Portfolio
Income Research TICR Tax 147,229,159.73$ 78.4% 1.05 3.44 2.86 1.05 3.38 2.89 1.60 2.80 3.28
Total Intermediate Duration (3)(4) 147,229,159.73$ 78.4% 1.05 3.44 2.86 1.05 3.38 2.89 1.60 2.72 3.72Bloomberg Barclays 5-10 Year Municipal Bond Index A Rated and Above +10bp 1.12 3.52 3.09 1.12 3.74 3.17 1.81 2.96 4.24
Total Fund Return (2)(4) 187,874,130.16$ 100.0% 0.91 2.98 2.53 0.91 3.04 2.43 1.40 2.18 3.19Custom Benchmark +10bp (1)
0.88 2.78 2.50 0.88 3.15 2.64 1.64 2.38 3.60
(2) The Inception date for the TICR Tax Exempt Total Fund is October 2005.
(3) The Total Intermediate Duration and Total Fund Composite includes the performance of the SIT Asset Management account which was closed in November 2010. The inception date for Income Research is November 2010
(4) The Total Intermediate Duration and Total Fund Composite includes the performance of the Stable River account which was closed in September 2011 and the Deutsche Bank account which was closed in February 2015.
(5) The Federated Money Market Fund account return is calculated gross of fees.
(1) The Custom Benchmark is a blend of Bloomberg Barclays Capital 5 -10 Yr A Rated and Above Non-Blended Municipal Bond Index + 10bp, Bloomberg Barclays Capital 1 - 3 Yr A Rated and Above Municipal Bond Index 10bp and Federated Money Market Fund. Prior to July 1, 2011, the Custom Benchmark was a blend of Bloomberg Barclays Capital 5 -10 Yr Municipal Bond Index + 10bp, Bloomberg Barclays Capital 1 - 3 Yr Municipal Bond Index + 10bp, and Federated Money Market Fund
Commonwealth of Virginia - TICR Tax ExemptNet Investment Returns For the Period Ending January 31, 2019
Returns Annualized Returns

Portfolio StatisticsMarket Value % of Plan Month 3 Month Fiscal YTD 1 Year 2 Year 3 Year 5 Year Inception
Money Market FundInvesco Treasury Portfolio Institutional Shares Fund (5) 13,806.66$ 0.0% 0.18 0.54 1.18 0.18 1.82 1.32 0.96 0.62 0.42
Total Taxable Short Term Fund(5) 13,806.66$ 0.0% 0.18 0.54 1.18 0.18 1.82 1.32 0.96 0.62 0.42Invesco Treasury Portfolio Institutional Shares Fund #0 13,806.66$ 0.0% 0.18 0.54 1.18 0.18 1.82 1.32 0.96 0.62 0.42
Short Duration Portfolio
Income Research 66,878,525.74$ 30.1% 0.38 1.45 1.92 0.38 2.27 1.35 1.19 1.13 2.51
Total Short Duration 66,878,525.74$ 30.1% 0.38 1.45 1.92 0.38 2.27 1.35 1.19 1.13 2.51Bloomberg Barclays 1-3 Year Govt/Credit Index A Rated and Above + 10bp 0.35 1.49 1.94 0.35 2.34 1.33 1.13 1.08 1.86
Intermediate Duration Portfolio
Dodge & Cox 80,046,132.73$ 36.1% 0.68 2.37 2.38 0.68 2.38 1.65 1.35 2.00 3.69
Segall Bryant & Hamill (3) 74,894,876.22$ 33.8% 0.69 2.58 2.66 0.69 2.87 2.03 1.54 1.97 2.95
Total Intermediate Duration (4) 154,941,008.95$ 69.8% 0.68 2.45 2.47 0.68 2.53 1.75 1.36 1.90 3.1785% Bloomberg Barclays Intermediate Govt/Credit Index A Rated and Above, 15% Bloomberg 0.69 2.83 2.77 0.69 2.96 1.81 1.32 1.85 3.34
Total Portfolio Fund Return (2) (5) 221,833,341.35$ 100.0% 0.59 2.14 2.30 0.59 2.45 1.64 1.31 1.66 2.96Custom Benchmark (1)
0.60 2.49 2.56 0.60 2.80 1.69 1.27 1.66 2.93
(2) The Inception date for the TICR Taxable Total Fund is November 2007.
(3) The Inception date for Denver Liquid and Illiquid Assets is March 2009. The performance inception is April 2009. The account name was changed from Denver to Segall Bryant & Hamill on June 2018.
(4) The Total Intermediate Duration and Total Fund Composite includes the performance of the Western Asset Management and Denver Asset Management illiquid account which were closed in March 2009 and May 2009, respectively.
(5) The Total Portfolio Composite includes the performance of the LGIP Yield Restricted portfolio which was closed in November 2010. The current Money Market Fund was changed to Invesco Treasury Portfolio Instituional Shares Fun
from J.P. Morgan U.S. Government Money Market Fund effective 06-22-15.
(1) The Custom Benchmark is a blend of Bloomberg Barclays Capital 1- 3 Yr Gov't/Credit Index A Rated and Above + 10bp and 85% Bloomberg Barclays Capital Intermediate Govt/Credit Bond Index A Rated and Above/15% BloombergBarclays Fixed Rate MBS + 10bp. Prior to July 2011 the Custom Benchmark was a blend of Bloomberg Barclays Capital 1- 3 Year Treasury Index + 10bp and 85% Bloomberg Barclays Capital blend of Intermediate Govt/Credit Bond Index/ 15% Bloomberg Barclays Fixed Rate MBS + 10bp.
Commonwealth of Virginia - TICR TaxableNet Investment Returns For the Period Ending January 31, 2019
Returns Annualized Returns
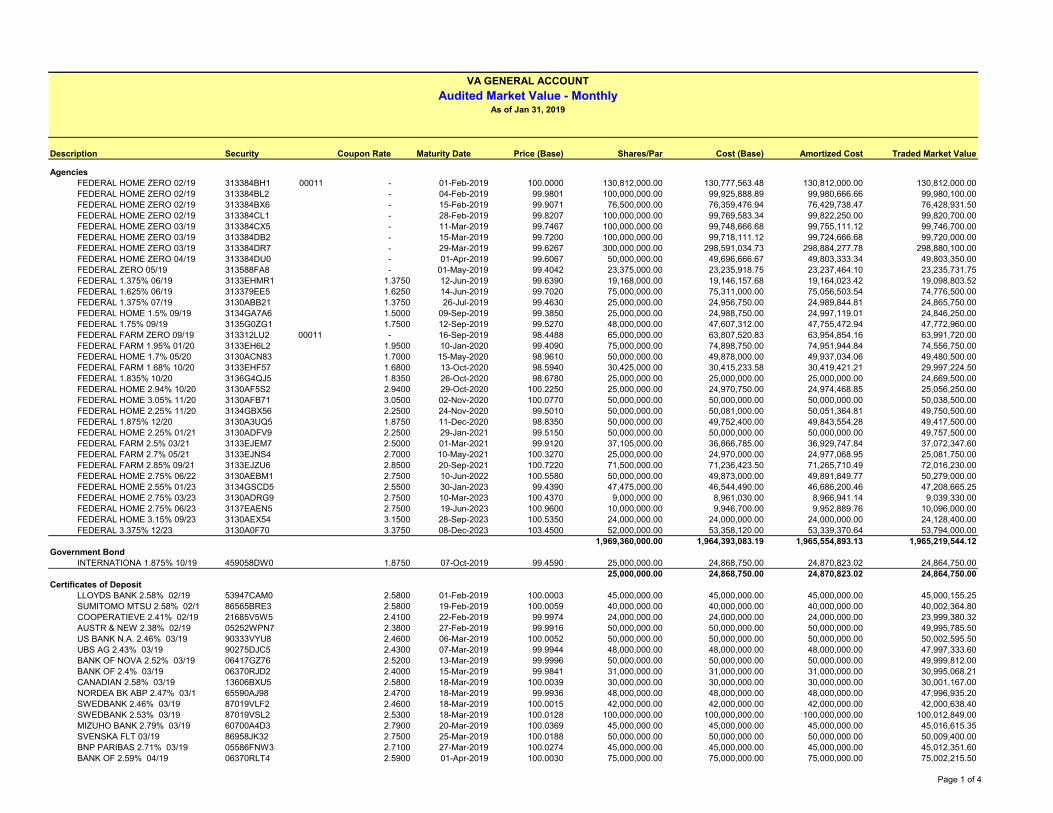
VA GENERAL ACCOUNT
Audited Market Value - MonthlyAs of Jan 31, 2019
Description Security Coupon Rate Maturity Date Price (Base) Shares/Par Cost (Base) Amortized Cost Traded Market Value
AgenciesFEDERAL HOME ZERO 02/19 313384BH1 00011 - 01-Feb-2019 100.0000 130,812,000.00 130,777,563.48 130,812,000.00 130,812,000.00FEDERAL HOME ZERO 02/19 313384BL2 - 04-Feb-2019 99.9801 100,000,000.00 99,925,888.89 99,980,666.66 99,980,100.00FEDERAL HOME ZERO 02/19 313384BX6 - 15-Feb-2019 99.9071 76,500,000.00 76,359,476.94 76,429,738.47 76,428,931.50FEDERAL HOME ZERO 02/19 313384CL1 - 28-Feb-2019 99.8207 100,000,000.00 99,769,583.34 99,822,250.00 99,820,700.00FEDERAL HOME ZERO 03/19 313384CX5 - 11-Mar-2019 99.7467 100,000,000.00 99,748,666.68 99,755,111.12 99,746,700.00FEDERAL HOME ZERO 03/19 313384DB2 - 15-Mar-2019 99.7200 100,000,000.00 99,718,111.12 99,724,666.68 99,720,000.00FEDERAL HOME ZERO 03/19 313384DR7 - 29-Mar-2019 99.6267 300,000,000.00 298,591,034.73 298,884,277.78 298,880,100.00FEDERAL HOME ZERO 04/19 313384DU0 - 01-Apr-2019 99.6067 50,000,000.00 49,696,666.67 49,803,333.34 49,803,350.00FEDERAL ZERO 05/19 313588FA8 - 01-May-2019 99.4042 23,375,000.00 23,235,918.75 23,237,464.10 23,235,731.75FEDERAL 1.375% 06/19 3133EHMR1 1.3750 12-Jun-2019 99.6390 19,168,000.00 19,146,157.68 19,164,023.42 19,098,803.52FEDERAL 1.625% 06/19 313379EE5 1.6250 14-Jun-2019 99.7020 75,000,000.00 75,311,000.00 75,056,503.54 74,776,500.00FEDERAL 1.375% 07/19 3130ABB21 1.3750 26-Jul-2019 99.4630 25,000,000.00 24,956,750.00 24,989,844.81 24,865,750.00FEDERAL HOME 1.5% 09/19 3134GA7A6 1.5000 09-Sep-2019 99.3850 25,000,000.00 24,988,750.00 24,997,119.01 24,846,250.00FEDERAL 1.75% 09/19 3135G0ZG1 1.7500 12-Sep-2019 99.5270 48,000,000.00 47,607,312.00 47,755,472.94 47,772,960.00FEDERAL FARM ZERO 09/19 313312LU2 00011 - 16-Sep-2019 98.4488 65,000,000.00 63,807,520.83 63,954,854.16 63,991,720.00FEDERAL FARM 1.95% 01/20 3133EH6L2 1.9500 10-Jan-2020 99.4090 75,000,000.00 74,898,750.00 74,951,944.84 74,556,750.00FEDERAL HOME 1.7% 05/20 3130ACN83 1.7000 15-May-2020 98.9610 50,000,000.00 49,878,000.00 49,937,034.06 49,480,500.00FEDERAL FARM 1.68% 10/20 3133EHF57 1.6800 13-Oct-2020 98.5940 30,425,000.00 30,415,233.58 30,419,421.21 29,997,224.50FEDERAL 1.835% 10/20 3136G4QJ5 1.8350 26-Oct-2020 98.6780 25,000,000.00 25,000,000.00 25,000,000.00 24,669,500.00FEDERAL HOME 2.94% 10/20 3130AF5S2 2.9400 29-Oct-2020 100.2250 25,000,000.00 24,970,750.00 24,974,468.85 25,056,250.00FEDERAL HOME 3.05% 11/20 3130AFB71 3.0500 02-Nov-2020 100.0770 50,000,000.00 50,000,000.00 50,000,000.00 50,038,500.00FEDERAL HOME 2.25% 11/20 3134GBX56 2.2500 24-Nov-2020 99.5010 50,000,000.00 50,081,000.00 50,051,364.81 49,750,500.00FEDERAL 1.875% 12/20 3130A3UQ5 1.8750 11-Dec-2020 98.8350 50,000,000.00 49,752,400.00 49,843,554.28 49,417,500.00FEDERAL HOME 2.25% 01/21 3130ADFV9 2.2500 29-Jan-2021 99.5150 50,000,000.00 50,000,000.00 50,000,000.00 49,757,500.00FEDERAL FARM 2.5% 03/21 3133EJEM7 2.5000 01-Mar-2021 99.9120 37,105,000.00 36,866,785.00 36,929,747.84 37,072,347.60FEDERAL FARM 2.7% 05/21 3133EJNS4 2.7000 10-May-2021 100.3270 25,000,000.00 24,970,000.00 24,977,068.95 25,081,750.00FEDERAL FARM 2.85% 09/21 3133EJZU6 2.8500 20-Sep-2021 100.7220 71,500,000.00 71,236,423.50 71,265,710.49 72,016,230.00FEDERAL HOME 2.75% 06/22 3130AEBM1 2.7500 10-Jun-2022 100.5580 50,000,000.00 49,873,000.00 49,891,849.77 50,279,000.00FEDERAL HOME 2.55% 01/23 3134GSCD5 2.5500 30-Jan-2023 99.4390 47,475,000.00 46,544,490.00 46,686,200.46 47,208,665.25FEDERAL HOME 2.75% 03/23 3130ADRG9 2.7500 10-Mar-2023 100.4370 9,000,000.00 8,961,030.00 8,966,941.14 9,039,330.00FEDERAL HOME 2.75% 06/23 3137EAEN5 2.7500 19-Jun-2023 100.9600 10,000,000.00 9,946,700.00 9,952,889.76 10,096,000.00FEDERAL HOME 3.15% 09/23 3130AEX54 3.1500 28-Sep-2023 100.5350 24,000,000.00 24,000,000.00 24,000,000.00 24,128,400.00FEDERAL 3.375% 12/23 3130A0F70 3.3750 08-Dec-2023 103.4500 52,000,000.00 53,358,120.00 53,339,370.64 53,794,000.00
1,969,360,000.00 1,964,393,083.19 1,965,554,893.13 1,965,219,544.12Government Bond
INTERNATIONA 1.875% 10/19 459058DW0 1.8750 07-Oct-2019 99.4590 25,000,000.00 24,868,750.00 24,870,823.02 24,864,750.0025,000,000.00 24,868,750.00 24,870,823.02 24,864,750.00
Certificates of DepositLLOYDS BANK 2.58% 02/19 53947CAM0 2.5800 01-Feb-2019 100.0003 45,000,000.00 45,000,000.00 45,000,000.00 45,000,155.25SUMITOMO MTSU 2.58% 02/1 86565BRE3 2.5800 19-Feb-2019 100.0059 40,000,000.00 40,000,000.00 40,000,000.00 40,002,364.80COOPERATIEVE 2.41% 02/19 21685V5W5 2.4100 22-Feb-2019 99.9974 24,000,000.00 24,000,000.00 24,000,000.00 23,999,380.32AUSTR & NEW 2.38% 02/19 05252WPN7 2.3800 27-Feb-2019 99.9916 50,000,000.00 50,000,000.00 50,000,000.00 49,995,785.50US BANK N.A. 2.46% 03/19 90333VYU8 2.4600 06-Mar-2019 100.0052 50,000,000.00 50,000,000.00 50,000,000.00 50,002,595.50UBS AG 2.43% 03/19 90275DJC5 2.4300 07-Mar-2019 99.9944 48,000,000.00 48,000,000.00 48,000,000.00 47,997,333.60BANK OF NOVA 2.52% 03/19 06417GZ76 2.5200 13-Mar-2019 99.9996 50,000,000.00 50,000,000.00 50,000,000.00 49,999,812.00BANK OF 2.4% 03/19 06370RJD2 2.4000 15-Mar-2019 99.9841 31,000,000.00 31,000,000.00 31,000,000.00 30,995,068.21CANADIAN 2.58% 03/19 13606BXU5 2.5800 18-Mar-2019 100.0039 30,000,000.00 30,000,000.00 30,000,000.00 30,001,167.00NORDEA BK ABP 2.47% 03/1 65590AJ98 2.4700 18-Mar-2019 99.9936 48,000,000.00 48,000,000.00 48,000,000.00 47,996,935.20SWEDBANK 2.46% 03/19 87019VLF2 2.4600 18-Mar-2019 100.0015 42,000,000.00 42,000,000.00 42,000,000.00 42,000,638.40SWEDBANK 2.53% 03/19 87019VSL2 2.5300 18-Mar-2019 100.0128 100,000,000.00 100,000,000.00 100,000,000.00 100,012,849.00MIZUHO BANK 2.79% 03/19 60700A4D3 2.7900 20-Mar-2019 100.0369 45,000,000.00 45,000,000.00 45,000,000.00 45,016,615.35SVENSKA FLT 03/19 86958JK32 2.7500 25-Mar-2019 100.0188 50,000,000.00 50,000,000.00 50,000,000.00 50,009,400.00BNP PARIBAS 2.71% 03/19 05586FNW3 2.7100 27-Mar-2019 100.0274 45,000,000.00 45,000,000.00 45,000,000.00 45,012,351.60BANK OF 2.59% 04/19 06370RLT4 2.5900 01-Apr-2019 100.0030 75,000,000.00 75,000,000.00 75,000,000.00 75,002,215.50
Page 1 of 4

VA GENERAL ACCOUNT
Audited Market Value - MonthlyAs of Jan 31, 2019
Description Security Coupon Rate Maturity Date Price (Base) Shares/Par Cost (Base) Amortized Cost Traded Market ValueWELLS FARGO 2.56% 04/19 94989RQ27 2.5600 01-Apr-2019 100.0528 25,000,000.00 25,000,000.00 25,000,000.00 25,013,200.00BANK OF 2.63% 04/19 06052TC99 2.6300 15-Apr-2019 100.0046 50,000,000.00 50,000,000.00 50,000,000.00 50,002,309.50SKANDINAVISKA 2.68% 04/19 83050F5G2 2.6800 15-Apr-2019 100.0338 25,000,000.00 25,000,000.00 25,000,000.00 25,008,439.50DNB BANK ASA, 2.58% 04/1 23341VMQ1 2.5800 16-Apr-2019 100.0084 33,000,000.00 33,000,000.00 33,000,000.00 33,002,769.36MUFG BANK LTD 2.72% 04/1 55379WWX0 2.7200 16-Apr-2019 100.0180 45,000,000.00 45,000,000.00 45,000,000.00 45,008,095.05SKANDIN ENS 2.67% 04/19 83050F3F6 2.6700 18-Apr-2019 100.0273 38,000,000.00 38,000,000.00 38,000,000.00 38,010,391.86WELLS FARGO FLT 04/19 94989RF60 2.9903 18-Apr-2019 100.0557 15,000,000.00 15,003,750.00 15,002,041.96 15,008,358.45BANK OF NOVA 2.75% 04/19 06417G2S6 2.7500 22-Apr-2019 100.0231 60,000,000.00 60,000,000.00 60,000,000.00 60,013,841.40NORDEA BK ABP 2.56% 05/1 65558TDQ5 2.5600 01-May-2019 99.9999 25,000,000.00 25,000,000.00 25,000,000.00 24,999,975.00BANK OF 2.82% 05/19 06052TD56 2.8200 02-May-2019 100.0405 35,000,000.00 35,000,000.00 35,000,000.00 35,014,186.20DNB BANK ASA, 2.75% 05/1 23341VNU1 2.7500 15-May-2019 100.0461 40,000,000.00 40,000,000.00 40,000,000.00 40,018,451.20DNB BANK ASA, 2.62% 05/1 23341VRQ6 2.6200 15-May-2019 100.0128 38,000,000.00 38,000,000.00 38,000,000.00 38,004,849.18AUSTR & NEW 2.6% 05/19 05252WPV9 2.6000 20-May-2019 99.9676 25,000,000.00 25,000,000.00 25,000,000.00 24,991,905.75AUSTR & NEW 2.6% 05/19 05252WPY3 2.6000 20-May-2019 99.9681 50,000,000.00 49,999,941.25 49,999,972.29 49,984,044.00UBS AG 2.84% 05/19 90275DJD3 2.8400 24-May-2019 100.0515 50,000,000.00 50,000,000.00 50,000,000.00 50,025,736.50US BANK N.A. 2.5% 05/19 90333VYL8 2.5000 28-May-2019 99.9435 50,000,000.00 50,000,000.00 50,000,000.00 49,971,726.00WELLS FARGO 2.52% 06/19 94989RV88 2.5200 03-Jun-2019 99.9259 45,000,000.00 45,000,000.00 45,000,000.00 44,966,653.65SUMITOMO FLT 06/19 86565BRQ6 2.7928 06-Jun-2019 100.0382 50,000,000.00 50,000,000.00 50,000,000.00 50,019,100.00CANADIAN 2.64% 06/19 13606BC95 2.6400 12-Jun-2019 99.9717 17,000,000.00 17,000,000.00 17,000,000.00 16,995,196.99NORDEA BK ABP 2.73% 06/1 65558TDD4 2.7300 17-Jun-2019 100.0456 50,000,000.00 50,000,000.00 50,000,000.00 50,022,804.00SKANDIN ENS 2.86% 06/19 83050F4L2 2.8600 18-Jun-2019 100.0868 31,000,000.00 31,000,000.00 31,000,000.00 31,026,922.57SVENSKA FLT 06/19 86958JU64 2.6800 25-Jun-2019 100.0077 35,000,000.00 35,000,000.00 35,000,000.00 35,002,695.00CANADIAN 2.69% 06/19 13606BF43 2.6900 26-Jun-2019 99.9804 25,000,000.00 25,000,000.00 25,000,000.00 24,995,111.50CANADIAN 2.69% 07/19 13606BF76 2.6900 01-Jul-2019 99.9766 45,000,000.00 45,000,000.00 45,000,000.00 44,989,471.80SKANDIN ENS 2.75% 07/19 83050F5M9 2.7500 15-Jul-2019 100.0484 19,605,000.00 19,608,545.07 19,608,380.18 19,614,479.61US BANK N.A. 2.72% 07/19 90333VZJ2 2.7200 16-Jul-2019 100.0012 45,000,000.00 45,000,000.00 45,000,000.00 45,000,535.50NATL 2.75% 07/19 63253TR34 2.7500 22-Jul-2019 100.0201 60,000,000.00 60,000,000.00 60,000,000.00 60,012,079.80TORONTO-DOMIN 2.67% 08/1 89114MTW7 2.6700 01-Aug-2019 99.9894 50,000,000.00 50,000,000.00 50,000,000.00 49,994,700.00TORONTO-DOMIN 2.73% 09/1 89114MEA1 2.7300 09-Sep-2019 99.9901 38,000,000.00 38,000,000.00 38,000,000.00 37,996,222.42WESTPAC BKING 2.92% 09/1 96130ABP2 2.9200 18-Sep-2019 100.0993 25,000,000.00 25,000,000.00 25,000,000.00 25,024,828.00TORONTO-DOMIN 2.78% 09/1 89114MFL6 2.7800 20-Sep-2019 100.0172 26,000,000.00 26,000,000.00 26,000,000.00 26,004,482.66CANADIAN 2.77% 10/19 13606BP26 2.7700 15-Oct-2019 100.0000 30,000,000.00 30,000,000.00 30,000,000.00 30,000,004.20TORONTO-DOMIN 2.93% 10/1 89114MJB4 2.9300 15-Oct-2019 100.1155 33,000,000.00 33,000,000.00 33,000,000.00 33,038,103.78SVENSKA FLT 10/19 86958J3Z0 2.7460 22-Oct-2019 100.0357 65,000,000.00 65,000,000.00 65,000,000.00 65,023,205.00TORONTO-DOMIN 3.03% 12/1 89114MRQ2 3.0300 27-Dec-2019 100.2262 50,000,000.00 50,000,000.00 50,000,000.00 50,113,122.00
2,116,605,000.00 2,116,612,236.32 2,116,610,394.43 2,116,962,664.66Commercial Paper
J.P. MORGAN ZERO 02/19 46640QP13 - 01-Feb-2019 99.9934 20,000,000.00 19,706,911.11 20,000,000.00 19,998,680.60ROCHE HOLDINGS, ZERO 02/1 77119MP19 - 01-Feb-2019 99.9935 46,350,000.00 46,281,736.75 46,350,000.00 46,346,983.54THUNDER BAY ZERO 02/19 88602UP12 - 01-Feb-2019 99.9933 28,000,000.00 27,998,156.67 28,000,000.00 27,998,112.24METLIFE SHORT ZERO 02/19 59157UP46 - 04-Feb-2019 99.9731 22,000,000.00 21,882,031.11 21,995,343.33 21,994,086.84OLD LINE ZERO 02/19 67983UP49 - 04-Feb-2019 99.9729 23,000,000.00 22,830,950.00 22,995,170.00 22,993,767.00WAL-MART INC ZERO 02/19 93114FP40 - 04-Feb-2019 99.9738 21,000,000.00 20,984,728.33 20,995,835.00 20,994,491.07EXPORT DEVELMT ZERO 02/19 30215HPB0 - 11-Feb-2019 99.9265 25,000,000.00 24,721,666.67 24,983,333.33 24,981,628.50EXXON MOBIL ZERO 02/19 30229BPB7 - 11-Feb-2019 99.9265 37,000,000.00 36,972,979.72 36,975,436.11 36,972,810.18METLIFE SHORT ZERO 02/19 59157UPB0 - 11-Feb-2019 99.9253 21,100,000.00 20,976,482.94 21,084,936.94 21,084,236.61EXXON MOBIL ZERO 02/11 30229BPE1 - 14-Feb-2019 99.9112 35,000,000.00 34,925,858.33 34,968,908.33 34,968,908.33CHEVRON CORP ZERO 02/19 16677KPF4 - 15-Feb-2019 99.8988 45,000,000.00 44,904,675.00 44,956,950.00 44,954,437.50EXXON MOBIL ZERO 02/19 30229BPF8 - 15-Feb-2019 99.8988 60,000,000.00 59,908,000.00 59,944,000.00 59,939,250.00METLIFE SHORT ZERO 02/19 59157UPF1 - 15-Feb-2019 99.8975 24,500,000.00 24,349,583.61 24,475,513.61 24,474,887.50NATIONAL SECS ZERO 02/19 63763QPF8 - 15-Feb-2019 99.8983 40,000,000.00 39,776,000.00 39,960,800.00 39,959,333.20PHILIP MORRIS ZERO 02/19 71838MPF1 - 15-Feb-2019 99.8983 45,000,000.00 44,906,225.00 44,957,650.00 44,954,249.85ROCHE HOLDINGS, ZERO 02/1 77119MPF8 - 15-Feb-2019 99.8988 30,000,000.00 29,954,191.67 29,972,116.67 29,969,625.00COCA-COLA ZERO 02/19 19121BPM5 - 21-Feb-2019 99.8562 25,000,000.00 24,706,666.67 24,966,666.67 24,964,037.50THUNDER BAY ZERO 03/19 88603H7K8 - 11-Mar-2019 99.7248 70,000,000.00 69,263,036.11 69,815,759.03 69,807,383.10
Page 2 of 4

VA GENERAL ACCOUNT
Audited Market Value - MonthlyAs of Jan 31, 2019
Description Security Coupon Rate Maturity Date Price (Base) Shares/Par Cost (Base) Amortized Cost Traded Market ValueAPPLE INC ZERO 03/19 03785EQF4 - 15-Mar-2019 99.7023 135,000,000.00 133,727,400.00 134,619,433.34 134,598,164.40CHEVRON CORP ZERO 03/19 16677KQF3 - 15-Mar-2019 99.7070 100,000,000.00 99,538,194.45 99,708,333.34 99,707,003.00J.P. MORGAN ZERO 03/19 46640QQF1 - 15-Mar-2019 99.6947 65,000,000.00 63,785,763.89 64,810,416.67 64,801,555.00METLIFE SHORT ZERO 03/19 59157UQF0 - 15-Mar-2019 99.7007 50,000,000.00 49,619,444.44 49,840,166.66 49,850,336.00THUNDER BAY ZERO 03/19 88602UQF0 - 15-Mar-2019 99.6951 25,000,000.00 24,835,902.78 24,918,916.67 24,923,764.50NATIONAL SECS ZERO 03/19 63763QQR1 - 25-Mar-2019 99.6281 50,000,000.00 49,392,361.11 49,819,444.44 49,814,058.50APPLE INC ZERO 03/19 03785EQV9 - 29-Mar-2019 99.6018 30,000,000.00 29,882,200.00 29,884,266.67 29,880,537.60CHEVRON CORP ZERO 03/19 16677KQV8 - 29-Mar-2019 99.6081 30,000,000.00 29,882,550.00 29,886,600.00 29,882,437.50EXPORT DEVELMT ZERO 03/19 30215HQV5 - 29-Mar-2019 99.5920 50,000,000.00 49,779,555.56 49,807,111.12 49,795,987.50EXXON MOBIL ZERO 04/19 30229BR82 - 08-Apr-2019 99.5375 50,000,000.00 49,716,416.67 49,771,750.00 49,768,757.00PFIZER INC ZERO 04/19 71708FR87 - 08-Apr-2019 99.5170 41,000,000.00 40,754,136.67 40,806,821.67 40,801,987.22WAL-MART INC ZERO 04/19 93114FR89 - 08-Apr-2019 99.5355 50,000,000.00 49,737,166.67 49,771,750.00 49,767,733.50EXPORT DEVELMT ZERO 04/19 30215HRF9 - 15-Apr-2019 99.4676 50,000,000.00 49,276,138.89 49,743,486.11 49,733,805.50ING (US) ZERO 04/19 4497W1RF5 - 15-Apr-2019 99.4711 30,000,000.00 29,599,166.67 29,841,833.33 29,841,331.80TOYOTA MOTOR ZERO 04/19 89233HRG1 - 16-Apr-2019 99.4667 65,000,000.00 64,616,536.11 64,653,947.22 64,653,333.55WAL-MART INC ZERO 04/19 93114FRG1 - 16-Apr-2019 99.4760 31,000,000.00 30,801,746.39 30,838,782.78 30,837,573.02EXPORT DEVELMT ZERO 04/19 30215HRH5 - 17-Apr-2019 99.4532 50,000,000.00 49,270,833.33 49,739,583.33 49,726,611.00NAT'L AUSTRALIA ZERO 04/1 63253KRJ8 - 18-Apr-2019 99.4467 50,000,000.00 49,351,416.67 49,727,666.67 49,723,334.50EXPORT DEVELMT ZERO 04/19 30215HRP7 - 23-Apr-2019 99.4101 50,000,000.00 49,259,791.67 49,713,125.00 49,705,028.00AMERICAN HONDA ZERO 04/19 02665KRR0 - 25-Apr-2019 99.3980 48,200,000.00 47,883,218.89 47,911,067.78 47,909,836.00J.P. MORGAN ZERO 05/19 46640QS10 - 01-May-2019 99.3200 25,000,000.00 24,639,875.00 24,840,541.67 24,830,000.00EXPORT DEVELMT ZERO 05/19 30215HS68 - 06-May-2019 99.3131 50,000,000.00 49,224,916.67 49,657,944.45 49,656,548.50EXPORT DEVELMT ZERO 05/19 30215HSF8 - 15-May-2019 99.2411 50,000,000.00 49,220,868.06 49,622,333.33 49,620,544.50ING US FUNDING ZERO 05/19 4497W1SF4 - 15-May-2019 99.2298 25,000,000.00 24,646,798.50 24,799,006.88 24,807,455.50EXPORT DEVELMT ZERO 05/19 30215HSG6 - 16-May-2019 99.2329 25,000,000.00 24,611,701.39 24,808,611.11 24,808,229.25ING (US) ZERO 05/19 4497W1SX5 - 31-May-2019 99.0900 50,000,000.00 49,266,333.33 49,530,611.11 49,545,000.00NATIONAL SECS ZERO 06/19 63763QT31 - 03-Jun-2019 99.0734 50,000,000.00 49,281,944.44 49,534,027.77 49,536,700.00THUNDER BAY VAR 06/19 88603YFC0 2.8127 03-Jun-2019 100.1030 25,000,000.00 25,000,000.00 25,000,000.00 25,025,750.00J.P. MORGAN ZERO 06/19 46640QTE1 - 14-Jun-2019 98.9578 25,000,000.00 24,527,500.00 24,767,250.00 24,739,444.50ING (US) ZERO 06/19 4497W1TH9 - 17-Jun-2019 98.9569 50,000,000.00 49,388,291.50 49,476,777.64 49,478,448.50OLD LINE ZERO 07/19 67983UUN1 - 22-Jul-2019 98.6579 25,000,000.00 24,654,340.28 24,682,216.06 24,664,480.50THUNDER BAY ZERO 08/19 88603HA81 - 01-Aug-2019 98.6676 70,000,000.00 69,067,347.22 69,082,553.52 69,067,347.30
2,138,150,000.00 2,119,289,736.94 2,129,014,795.36 2,128,860,032.20Money Market
INVESCO VAR 12/99 00499KPA5 2.3287 31-Dec-2099 100.0000 35,684,873.22 35,684,873.22 35,684,873.22 35,684,873.2235,684,873.22 35,684,873.22 35,684,873.22 35,684,873.22
T-NoteUNITED STATES 1% 03/19 912828P95 1.0000 15-Mar-2019 99.8370 80,000,000.00 79,865,995.20 79,872,077.97 79,869,600.00UNITED 1.25% 06/19 912828XV7 1.2500 30-Jun-2019 99.5080 25,000,000.00 24,935,546.88 24,986,590.08 24,877,000.00UNITED STATES 1% 11/19 912828U32 1.0000 15-Nov-2019 98.8050 25,000,000.00 24,884,765.63 24,969,478.96 24,701,250.00
130,000,000.00 129,686,307.71 129,828,147.01 129,447,850.00Repurchase Agreement
BANK OF NOVA 2.53% 02/19 AAU9962Z4 2.5300 01-Feb-2019 100.0000 150,000,000.00 150,000,000.00 150,000,000.00 150,000,000.00REPURCHASE 2.6% 2/19 99J310115 2.6000 01-Feb-2019 100.0000 34,320,000.00 34,320,000.00 34,320,000.00 34,320,000.00REPURCHASE 2.6% 2/19 99J310116 2.6000 01-Feb-2019 100.0000 49,180,000.00 49,180,000.00 49,180,000.00 49,180,000.00REPO BANK OF NEW YORK (DA 99J310117 1.3500 01-Feb-2019 100.0000 16,500,000.00 16,500,000.00 16,500,000.00 16,500,000.00REPO JP MORGAN SECS INC., 99J310118 1.4900 01-Feb-2019 100.0000 13,251,600.00 13,251,600.00 13,251,600.00 13,251,600.00REPURCHASE 2.57% 2/19 99J310119 2.5700 01-Feb-2019 100.0000 20,250,000.00 20,250,000.00 20,250,000.00 20,250,000.00DESC: REPO JPMCHASE (CU 99J310120 2.5700 01-Feb-2019 100.0000 20,250,000.00 20,250,000.00 20,250,000.00 20,250,000.00REPURCHASE 2.57% 2/19 99J310121 2.5700 01-Feb-2019 100.0000 20,250,000.00 20,250,000.00 20,250,000.00 20,250,000.00REPURCHASE 2.57% 2/19 99J310122 2.5700 01-Feb-2019 100.0000 20,250,000.00 20,250,000.00 20,250,000.00 20,250,000.00REPURCHASE 2.57% 2/19 99J310125 2.5700 01-Feb-2019 100.0000 20,250,000.00 20,250,000.00 20,250,000.00 20,250,000.00REPO JP MORGAN CHASE (CSN 99J310126 1.5000 01-Feb-2019 100.0000 20,250,000.00 20,250,000.00 20,250,000.00 20,250,000.00REPO JP MORGAN CHASE (CSN 99J310128 1.5000 01-Feb-2019 100.0000 20,250,000.00 20,250,000.00 20,250,000.00 20,250,000.00
405,001,600.00 405,001,600.00 405,001,600.00 405,001,600.00
Page 3 of 4

VA GENERAL ACCOUNT
Audited Market Value - MonthlyAs of Jan 31, 2019
Description Security Coupon Rate Maturity Date Price (Base) Shares/Par Cost (Base) Amortized Cost Traded Market Value
Totals 6,819,801,473.22 6,795,536,587.38 6,806,565,526.17 6,806,041,314.20
Page 4 of 4

Account: 3015464900 VA. GENERAL/MERGANSER CAP Created: 6-Feb-2019 02:10:18 AM [CST]
Audited Market Value - MonthlyAs of Jan 31, 2019
Description Security Coupon Rate Maturity Date Price (Base) Shares/Par Cost (Base) Amortized Cost Traded Market Value
Corporate BondAT&T INC 3% 06/22 00206RCM2 3.0000 6/30/2022 99.2140 1,796,000.00 1,750,710.59 1,754,944.77 1,781,883.44CHUBB INA 2.3% 11/20 00440EAT4 2.3000 11/3/2020 99.1560 2,500,000.00 2,513,375.00 2,504,945.32 2,478,900.00AMERICAN 2.375% 05/20 0258M0DT3 2.3750 5/26/2020 99.4310 1,390,000.00 1,373,014.20 1,379,286.12 1,382,090.90AMERICAN 2.5% 08/22 025816BM0 2.5000 8/1/2022 97.6581 925,000.00 888,212.75 894,906.63 903,337.52AMERICAN 1.2% 07/19 02665WBE0 1.2000 7/12/2019 99.3360 2,375,000.00 2,352,342.50 2,369,430.20 2,359,230.00AUTOZONE INC 2.5% 04/21 053332AS1 2.5000 4/15/2021 97.6520 1,000,000.00 992,500.00 995,919.70 976,520.00BB&T CORP 2.25% 02/19 05531FAQ6 2.2500 2/1/2019 100.0000 3,200,000.00 3,224,384.00 3,200,000.00 3,200,000.00BP CAPITAL 2.315% 02/20 05565QCX4 2.3150 2/13/2020 99.4680 2,525,000.00 2,497,805.75 2,510,205.59 2,511,567.00BANK OF 2.65% 04/19 06051GFD6 2.6500 4/1/2019 100.0000 3,000,000.00 3,032,460.00 3,003,419.93 3,000,000.00BANK OF NEW 2.05% 05/21 06406FAB9 2.0500 5/3/2021 98.3930 1,800,000.00 1,766,088.00 1,781,698.17 1,771,074.00BANK OF NEW 2.3% 09/19 06406HCW7 2.3000 9/11/2019 99.6730 700,000.00 699,867.00 699,983.35 697,711.00BANK OF NOVA 2.45% 03/21 064159HM1 2.4500 3/22/2021 99.1610 1,425,000.00 1,395,659.25 1,401,086.07 1,413,044.25BANK OF NOVA 2.7% 03/22 064159JG2 2.7000 3/7/2022 98.6500 1,200,000.00 1,198,800.00 1,199,111.26 1,183,800.00BLACKROCK INC 5% 12/19 09247XAE1 5.0000 12/10/2019 101.9470 2,485,000.00 2,772,738.15 2,539,773.16 2,533,382.95CATERPILLAR 1.931% 10/21 14912L7D7 1.9310 10/1/2021 97.3580 930,000.00 895,059.10 899,495.47 905,429.40CATERPILLAR 3.15% 09/21 14913Q2N8 3.1500 9/7/2021 100.5340 540,000.00 539,584.20 539,640.44 542,883.60CISCO SYSTEMS 2.2% 02/21 17275RBD3 2.2000 2/28/2021 99.0060 2,810,000.00 2,813,540.60 2,811,822.99 2,782,068.60CITIGROUP 2.75% 04/22 172967LG4 2.7500 4/25/2022 98.8738 2,990,000.00 2,898,236.90 2,913,270.38 2,956,326.02COLUMBIA 3.3% 06/20 198280AD1 3.3000 6/1/2020 99.9710 1,140,000.00 1,137,520.20 1,138,144.02 1,139,669.40COMCAST CORP 3.45% 10/21 20030NCQ2 3.4500 10/1/2021 101.1341 1,175,000.00 1,173,813.25 1,173,945.01 1,188,325.68COMMONWEALTH 3.4% 09/21 202795HZ6 3.4000 9/1/2021 100.8970 2,000,000.00 2,001,460.00 2,001,367.20 2,017,940.00COSTCO 1.75% 02/20 22160KAG0 1.7500 2/15/2020 98.9990 2,215,000.00 2,236,175.40 2,221,425.94 2,192,827.85COSTCO 2.15% 05/21 22160KAJ4 2.1500 5/18/2021 98.7380 2,575,000.00 2,570,493.75 2,572,434.59 2,542,503.50CREDIT SUISSE 2.3% 05/19 22546QAN7 2.3000 5/28/2019 99.8620 2,500,000.00 2,517,500.00 2,502,815.90 2,496,550.00JOHN DEERE 1.25% 10/19 24422ETJ8 1.2500 10/9/2019 99.0010 2,485,000.00 2,479,980.30 2,483,887.40 2,460,174.85FEDERAL HOME 2.25% 01/21 3130ADFV9 2.2500 1/29/2021 99.5150 3,000,000.00 2,995,680.00 2,997,142.60 2,985,450.00FEDERAL FARM 1.03% 04/19 3133EGJW6 1.0300 4/5/2019 99.7730 3,000,000.00 3,000,000.00 3,000,000.00 2,993,190.00GE CAPITAL 2.342% 11/20 36164QMS4 2.3420 11/15/2020 97.6380 2,850,000.00 2,876,220.00 2,864,837.28 2,782,683.00GENERAL 3% 05/21 369550BE7 3.0000 5/11/2021 100.6020 2,025,000.00 2,012,136.55 2,015,093.95 2,037,190.50GENERAL 4.15% 06/23 37045XCL8 4.1500 6/19/2023 98.3265 2,865,000.00 2,862,564.75 2,862,865.34 2,817,054.23GOLDMAN SACHS FLT 10/22 38148YAB4 3.5244 10/31/2022 99.0920 3,010,000.00 3,011,986.60 3,011,986.60 2,982,669.20HCP INC 2.625% 02/20 40414LAH2 2.6250 2/1/2020 99.5190 2,347,000.00 2,356,927.81 2,351,688.42 2,335,710.93HSBC USA INC 2.35% 03/20 40428HPR7 2.3500 3/5/2020 99.3780 2,890,000.00 2,892,283.10 2,891,100.47 2,872,024.20HEWLETT FLT 10/21 42824CBB4 3.5150 10/5/2021 99.3606 1,390,000.00 1,390,000.00 1,390,000.00 1,381,111.92HOME DEPOT 3.25% 03/22 437076BV3 3.2500 3/1/2022 101.5910 2,125,000.00 2,119,177.50 2,119,500.24 2,158,808.75HONEYWELL 1.4% 10/19 438516BJ4 1.4000 10/30/2019 99.0370 2,200,000.00 2,198,186.40 2,199,553.74 2,178,814.00INTERPUBLIC 4% 03/22 460690BH2 4.0000 3/15/2022 100.3710 1,105,000.00 1,104,988.95 1,104,989.94 1,109,099.55JPMORGAN 2.75% 06/20 46625HLW8 2.7500 6/23/2020 99.7157 2,800,000.00 2,847,404.00 2,820,759.42 2,792,039.60KEYBANK 2.35% 03/19 49327M2N3 2.3500 3/8/2019 99.9870 2,750,000.00 2,805,165.00 2,752,085.12 2,749,642.50MORGAN 2.65% 01/20 61747YDW2 2.6500 1/27/2020 99.6900 3,725,000.00 3,727,048.75 3,725,448.20 3,713,452.50NATIONAL 2.3% 09/22 63743HEQ1 2.3000 9/15/2022 97.2360 2,220,000.00 2,155,299.40 2,155,775.19 2,158,639.20NATIONAL 2.15% 02/19 637432MX0 2.1500 2/1/2019 100.0000 1,220,000.00 1,231,394.80 1,220,000.00 1,220,000.00PNC BANK NA 2.3% 06/20 69353REP9 2.3000 6/1/2020 99.2050 2,000,000.00 1,970,820.00 1,980,330.45 1,984,100.00
Page 1 of 4

Account: 3015464900 VA. GENERAL/MERGANSER CAP Created: 6-Feb-2019 02:10:18 AM [CST]
Audited Market Value - MonthlyAs of Jan 31, 2019
Description Security Coupon Rate Maturity Date Price (Base) Shares/Par Cost (Base) Amortized Cost Traded Market Value
PNC BANK NA 2.6% 07/20 69353RES3 2.6000 7/21/2020 99.5490 825,000.00 836,079.75 830,898.68 821,279.25PROGRESSIVE 3.75% 08/21 743315AN3 3.7500 8/23/2021 100.9210 2,135,000.00 2,164,527.05 2,158,877.71 2,154,663.35PUBLIC 5.15% 12/19 744533BK5 5.1500 12/1/2019 101.6710 2,230,000.00 2,416,896.30 2,286,014.10 2,267,263.30ROYAL BANK 2.125% 03/20 78012KC62 2.1250 3/2/2020 99.3240 1,635,000.00 1,633,822.80 1,634,575.37 1,623,947.40TENNESSEE 2.25% 03/20 880591EV0 2.2500 3/15/2020 99.7130 2,500,000.00 2,484,900.00 2,490,887.12 2,492,825.00TORONTO-DOMINI 2.5% 12/20 89114QBC1 2.5000 12/14/2020 99.4060 1,830,000.00 1,801,470.30 1,808,547.69 1,819,129.80TORONTO-DOMIN 2.55% 01/21 89114QBX5 2.5500 1/25/2021 99.3750 2,500,000.00 2,496,550.00 2,497,736.27 2,484,375.50TOYOTA 2.125% 07/19 89236TBP9 2.1250 7/18/2019 99.7740 2,000,000.00 2,014,780.00 2,003,031.89 1,995,480.00UBS 2.375% 08/19 90261XHE5 2.3750 8/14/2019 99.8330 2,850,000.00 2,875,833.50 2,854,499.83 2,845,240.50UDR INC 3.7% 10/20 90265EAH3 3.7000 10/1/2020 100.5330 1,500,000.00 1,555,725.00 1,530,414.88 1,507,995.00UNILEVER 1.8% 05/20 904764AV9 1.8000 5/5/2020 98.7760 1,970,000.00 1,963,715.70 1,967,376.50 1,945,887.20VISA INC 2.8% 12/22 92826CAC6 2.8000 12/14/2022 100.2660 2,500,000.00 2,462,725.00 2,467,268.28 2,506,650.00WELLS FARGO & FLT 02/22 949746SP7 3.5481 2/11/2022 100.5513 2,750,000.00 2,773,815.00 2,773,815.00 2,765,159.93
118,428,000.00 118,759,444.90 118,260,059.89 117,898,816.27 FHLMC
FHLMCGLD 4% 08/21 3128MDCN1 4.0000 8/1/2021 102.9780 324,648.96 345,827.23 330,487.67 334,317.01FHLMCGLD 3.5% 02/27 3128MDN74 3.5000 2/1/2027 101.8610 784,711.26 839,641.04 816,979.88 799,314.74FHLMCGLD 4% 05/27 3128MEB26 4.0000 5/1/2027 102.9780 846,561.41 885,185.79 880,387.99 871,772.01FHLMCGLD 4% 05/27 3128MECE9 4.0000 5/1/2027 102.9780 667,919.22 715,925.91 700,521.54 687,809.85FHLMCGLD 4.5% 09/26 3128MEMA6 4.5000 9/1/2026 102.8250 208,212.52 221,518.60 217,531.02 214,094.52FHLMCGLD 5% 06/25 3128MEMB4 5.0000 6/1/2025 101.6150 101,643.69 107,345.27 105,414.89 103,285.24FHLMCGLD 5.5% 12/24 3128MEMC2 5.5000 12/1/2024 102.0530 395,777.29 423,543.54 413,629.94 403,902.60
3,329,474.35 3,538,987.38 3,464,952.93 3,414,495.97 FNMA
FNMA MORTPASS 3% 03/27 3138EBRC1 3.0000 3/1/2027 100.5380 493,094.76 507,810.55 504,783.34 495,747.61FNMA MORTPASS 3.5% 10/29 3138EPFL3 3.5000 10/1/2029 102.0360 1,620,168.84 1,722,695.14 1,695,834.87 1,653,155.48FNMA MORTPASS 4.5% 05/21 3138EQPU0 4.5000 5/1/2021 101.6330 87,318.25 91,830.83 89,210.24 88,744.16FNMA MORTPASS 5% 09/25 3138EQPV8 5.0000 9/1/2025 101.8620 239,486.76 256,643.75 251,104.80 243,946.00FNMA MORTPASS 5.5% 09/25 3138EQPW6 5.5000 9/1/2025 103.0100 530,208.88 573,371.19 559,436.09 546,168.17FNMA MORTPASS 4% 03/29 3138ETHZ2 4.0000 3/1/2029 103.2040 1,305,237.18 1,372,946.36 1,365,006.44 1,347,056.98FNMA MORTPASS 5.5% 09/25 3138ETJ23 5.5000 9/1/2025 103.7110 1,464,366.25 1,601,879.40 1,563,118.55 1,518,708.88FNMA MORTPASS 3.5% 12/29 3138WDNE7 3.5000 12/1/2029 102.2220 2,434,058.39 2,457,638.33 2,456,222.04 2,488,143.17FNMA MORTPASS 3.5% 05/27 3138Y5DW3 3.5000 5/1/2027 101.9300 1,592,258.44 1,612,161.69 1,610,773.22 1,622,989.03FNMA MORTPASS 3% 06/31 3140J75E1 3.0000 6/1/2031 100.2640 2,561,578.65 2,556,975.81 2,556,979.89 2,568,341.22
12,327,776.40 12,753,953.05 12,652,469.48 12,573,000.70 GNMA1 (20 Day Lag)
GNMA II FLT 11/41 36225FJ26 4.1250 11/20/2041 102.9610 254,484.03 264,663.39 264,663.39 262,019.30254,484.03 264,663.39 264,663.39 262,019.30
Money MarketINVESCO VAR 12/99 00499KPA5 2.3287 12/31/2099 100.0000 4,841,029.65 4,841,029.65 4,841,029.65 4,841,029.65
4,841,029.65 4,841,029.65 4,841,029.65 4,841,029.65 Mortgage Related
ALLY MASTER 3.29% 05/23 02005AGU6 3.2900 5/15/2023 100.5970 2,550,000.00 2,549,976.29 2,549,978.84 2,565,222.48ALLY AUTO 1.44% 08/20 02007LAC6 1.4400 8/17/2020 99.7126 213,984.48 213,963.70 213,976.83 213,369.40
Page 2 of 4

Account: 3015464900 VA. GENERAL/MERGANSER CAP Created: 6-Feb-2019 02:10:18 AM [CST]
Audited Market Value - MonthlyAs of Jan 31, 2019
Description Security Coupon Rate Maturity Date Price (Base) Shares/Par Cost (Base) Amortized Cost Traded Market Value
AMERICAN 1.77% 11/22 02582JHE3 1.7700 11/15/2022 98.8199 3,245,000.00 3,244,398.70 3,244,592.01 3,206,706.73AMERICAN 2.04% 05/23 02582JHJ2 2.0400 5/15/2023 98.8421 2,500,000.00 2,499,623.25 2,499,710.66 2,471,052.00ATLANTIC CITY 5.55% 10/23 048312AD4 5.5500 10/20/2023 103.6742 1,181,755.21 1,225,701.75 1,222,706.87 1,225,175.26BARCLAYS 2.41% 07/22 06742LAE3 2.4100 7/15/2022 99.7667 2,150,000.00 2,177,882.81 2,169,367.83 2,144,983.19BENCHMARK 3.848% 04/51 08161BAV5 3.8480 4/10/2051 102.7888 1,740,000.00 1,792,170.59 1,790,809.79 1,788,525.82COMM 3.031% 09/47 12592KAZ7 3.0310 9/10/2047 99.9239 2,235,758.87 2,287,460.79 2,284,073.56 2,234,057.68COMM 2.976% 07/48 12593FBA1 2.9760 7/10/2048 99.7427 892,335.56 892,126.42 892,132.11 890,039.31CNH EQUIPMENT 3.22% 01/26 12596JAD5 3.2200 1/15/2026 99.9700 1,500,000.00 1,499,550.60 1,499,550.96 1,499,550.60COMM 3.147% 08/45 12624KAD8 3.1470 8/15/2045 99.9029 1,400,000.00 1,390,375.00 1,390,558.33 1,398,640.88CAPITAL ONE 2.05% 08/23 14041NFB2 2.0500 8/15/2023 98.8096 1,000,000.00 999,613.90 999,776.44 988,095.90CAPITAL ONE 1.34% 04/22 14041NFE6 1.3400 4/15/2022 99.4508 2,500,000.00 2,499,982.50 2,499,991.64 2,486,271.00CAPITAL ONE 1.82% 09/22 14041NFH9 1.8200 9/15/2022 99.2700 1,650,000.00 1,649,761.58 1,649,848.70 1,637,955.33CAPITAL ONE 1.99% 07/23 14041NFN6 1.9900 7/17/2023 98.8379 2,000,000.00 1,999,845.40 1,999,879.35 1,976,757.40CHASE 1.84% 04/22 161571GX6 1.8400 4/15/2022 98.7813 2,750,000.00 2,775,351.56 2,763,593.63 2,716,486.03CHASE 1.37% 06/21 161571HC1 1.3700 6/15/2021 99.4713 4,300,000.00 4,299,989.68 4,299,995.68 4,277,266.33CITIBANK 1.92% 04/22 17305EGB5 1.9200 4/7/2022 99.0109 2,900,000.00 2,899,164.51 2,899,471.74 2,871,316.68DISCOVER CARD 3.04% 07/24 254683CK9 3.0400 7/15/2024 100.2994 1,900,000.00 1,899,959.72 1,899,959.80 1,905,687.84FRESB 2017-SB27 VAR 01/22 302948AA2 2.4100 1/25/2022 98.8020 1,734,558.28 1,742,750.62 1,742,750.62 1,713,777.40FRESB VAR 07/23 30297PAE3 3.5300 7/25/2023 102.4522 1,297,440.58 1,303,618.99 1,303,618.99 1,329,256.16FANNIE MAE-ACES VAR 01/23 3136AEX69 2.3890 1/25/2023 98.3577 783,345.90 786,864.82 786,864.82 770,480.93FANNIE MAE-ACES VAR 10/21 3136ALHX2 2.6140 10/25/2021 99.4644 2,436,689.26 2,424,886.54 2,424,886.54 2,423,638.35FNMA REMICS 3% 04/42 3136ASJA5 3.0000 4/25/2042 99.7859 1,854,980.79 1,918,745.74 1,912,322.35 1,851,009.83FREDDIE MAC VAR 01/21 3137AA4W0 3.9740 1/25/2021 101.8689 1,000,000.00 1,064,921.88 1,064,921.88 1,018,689.30FHLMC REMICS 3.5% 07/41 3137ANTK1 3.5000 7/15/2041 101.0740 1,407,242.16 1,494,755.02 1,482,740.97 1,422,355.66FREDDIE MAC 2.183% 05/22 3137BQBY2 2.1830 5/25/2022 98.6695 774,720.63 775,689.04 775,427.90 764,413.20FREDDIE MAC 2.197% 11/23 3137BYMP2 2.1970 11/25/2023 97.8016 1,511,858.39 1,508,034.90 1,508,977.82 1,478,621.54FREDDIE MAC 3.498% 01/23 3137FEV49 3.4980 1/25/2023 102.0041 700,000.00 713,995.10 711,450.25 714,028.63FNMA REMICS 4.5% 09/23 31397MNG8 4.5000 9/25/2023 100.1816 100,702.05 101,350.95 101,080.35 100,884.93FORD CREDIT 2.16% 09/22 34528QFP4 2.1600 9/15/2022 98.6728 2,000,000.00 1,999,704.20 1,999,781.96 1,973,456.00FORD CREDIT 1.67% 06/21 34531EAD8 1.6700 6/15/2021 99.2473 2,465,970.31 2,465,961.19 2,465,966.36 2,447,408.21FORD CREDIT 2.16% 03/23 34532AAE3 2.1600 3/15/2023 98.2797 634,000.00 622,112.50 622,245.44 623,093.17SEASONED LOANS 3.5% 06/28 35564CAA5 3.5000 6/25/2028 100.5091 1,051,461.57 1,050,999.51 1,050,959.23 1,056,814.66GS MORTGAGE 2.011% 06/46 36197XAH7 2.0110 6/10/2046 99.9153 82,160.93 82,786.77 82,725.96 82,091.36GM FINANCIAL 3.02% 05/23 36255JAD6 3.0200 5/16/2023 100.4387 2,050,000.00 2,049,521.94 2,049,577.29 2,058,993.97GM FINANCIAL 2.81% 12/22 38013RAD7 2.8100 12/16/2022 99.8776 2,100,000.00 2,099,728.47 2,099,775.83 2,097,429.81GNMA 2010-117 KD 2% 06/39 38377J2S1 2.0000 6/20/2039 98.6331 142,628.34 143,831.77 143,537.52 140,678.70HARLEY-DAVIDS 1.34% 01/21 41284DAC6 1.3400 1/15/2021 99.6322 179,303.66 178,372.13 178,701.59 178,644.15HONDA AUTO 1.8% 01/20 43813FAB9 1.8000 1/21/2020 99.8338 796,991.40 796,942.23 796,968.83 795,666.40JP MORGAN 1.7966% 10/45 46638UAB2 1.7966 10/15/2045 100.0000 0.02 0.02 0.02 0.02JPMBB 3.3626% 07/45 46639NAP6 3.3626 7/15/2045 100.7819 1,003,350.07 1,016,283.88 1,015,830.72 1,011,195.06JP MORGAN 2.6942% 04/46 46639YAP2 2.6942 4/15/2046 100.0000 0.01 0.01 0.01 0.01JPMBB 2.7733% 10/48 46644FAB7 2.7733 10/15/2048 99.5825 1,725,305.69 1,719,105.38 1,719,265.42 1,718,102.19JPMCC 2.086% 03/50 46647TAN8 2.0860 3/15/2050 98.5976 790,052.06 790,051.24 790,051.24 778,972.61MORGAN 3.345% 12/50 61691NAB1 3.3450 12/15/2050 101.2430 1,710,000.00 1,761,270.59 1,759,502.59 1,731,255.13
Page 3 of 4

Account: 3015464900 VA. GENERAL/MERGANSER CAP Created: 6-Feb-2019 02:10:18 AM [CST]
Audited Market Value - MonthlyAs of Jan 31, 2019
Description Security Coupon Rate Maturity Date Price (Base) Shares/Par Cost (Base) Amortized Cost Traded Market Value
SYNCHRONY 3.38% 09/24 87166PAA9 3.3800 9/15/2024 101.1998 2,350,000.00 2,349,929.50 2,349,933.55 2,378,194.60TOYOTA AUTO 3.02% 12/22 89231AAD3 3.0200 12/15/2022 100.3474 2,535,000.00 2,534,549.02 2,534,597.29 2,543,805.83UBS-BARCLAY 2.7919% 12/45 90270RBD5 2.7919 12/10/2045 99.2174 1,800,000.00 1,761,257.81 1,761,776.51 1,785,913.56VERIZON OWNER 3.23% 04/23 92348XAA3 3.2300 4/20/2023 100.7815 1,340,000.00 1,339,979.10 1,339,980.32 1,350,471.70VOLKSWAGEN 3.02% 11/22 92868LAD3 3.0200 11/21/2022 100.3770 1,100,000.00 1,099,841.27 1,099,863.17 1,104,146.67VOLKSWAGEN 3.25% 04/23 92869BAD4 3.2500 4/20/2023 100.9040 2,000,000.00 1,999,916.00 1,999,919.90 2,018,079.40WFRBS 3.44% 04/45 92936QAG3 3.4400 4/15/2045 100.5563 1,275,000.00 1,273,181.64 1,273,196.68 1,282,092.44WELLS FARGO 1.639% 09/58 94989TAW4 1.6390 9/15/2058 100.0000 0.02 0.02 0.02 0.02WELLS FARGO 3.571% 09/58 94989TBA1 3.5710 9/15/2058 101.7162 2,200,000.00 2,246,406.25 2,245,354.57 2,237,755.52WFRBS 3.522% 03/47 96221TAF4 3.5220 3/15/2047 100.9386 1,300,000.00 1,371,093.75 1,367,118.27 1,312,201.28WORLD OMNI 1.95% 02/23 98161TAD7 1.9500 2/15/2023 98.4870 1,300,000.00 1,299,664.86 1,299,756.63 1,280,330.35WORLD OMNI 2.87% 07/23 98162QAC4 2.8700 7/17/2023 99.8795 2,800,000.00 2,799,729.80 2,799,772.22 2,796,625.16
88,941,596.24 89,484,733.20 89,431,176.40 88,867,733.77 T-Note
UNITED 1.125% 02/21 912828P87 1.1250 2/28/2021 97.2930 36,039,000.00 34,871,976.43 34,871,976.43 35,063,424.27UNITED 2.75% 09/21 9128285A4 2.7500 9/15/2021 100.7770 36,070,000.00 35,960,870.51 35,960,870.51 36,350,263.90
72,109,000.00 70,832,846.94 70,832,846.94 71,413,688.17 Totals $300,231,360.67 $300,475,658.51 $299,747,198.68 $299,270,783.83
Page 4 of 4

Account: 3015465000 VA GENERAL/WELLINGTON Created: 6-Feb-2019 02:10:27 AM [CST]
Audited Market Value - MonthlyAs of Jan 31, 2019
Description Security Coupon Rate Maturity Date Price (Base) Shares/Par Cost (Base) Amortized Cost Traded Market Value
Corporate BondAT&T INC 4.125% 02/26 00206RCT7 4.1250 2/17/2026 100.9150 195,000.00 196,398.36 195,995.70 196,784.25AT&T INC 4.25% 03/27 00206RDQ2 4.2500 3/1/2027 101.2090 215,000.00 216,860.24 216,610.66 217,599.35AETNA INC 2.8% 06/23 00817YAV0 2.8000 6/15/2023 96.8310 445,000.00 444,350.30 444,593.27 430,897.95ALABAMA 2.45% 03/22 010392FQ6 2.4500 3/30/2022 98.1190 645,000.00 638,973.30 639,967.16 632,867.55ALIBABA GROUP 3.4% 12/27 01609WAT9 3.4000 12/6/2027 95.6028 700,000.00 696,066.70 696,518.29 669,219.46ALTRIA GROUP 2.85% 08/22 02209SAN3 2.8500 8/9/2022 97.8200 650,000.00 660,081.45 655,750.38 635,830.00ALTRIA 2.625% 09/26 02209SAU7 2.6250 9/16/2026 88.5860 410,000.00 360,007.90 360,091.80 363,202.60AMAZON.COM 3.8% 12/24 023135AN6 3.8000 12/5/2024 104.3320 425,000.00 456,148.25 449,999.81 443,411.00AMEREN 3.25% 03/25 02361DAP5 3.2500 3/1/2025 99.1010 625,000.00 624,643.75 624,789.10 619,381.25AMERICAN 2.25% 08/19 0258M0DP1 2.2500 8/15/2019 99.7850 375,000.00 376,590.00 375,180.37 374,193.75AMERICAN 3.7% 11/21 025816BY4 3.7000 11/5/2021 101.6432 205,000.00 204,954.90 204,958.58 208,368.62AMERICAN 4.2% 11/25 025816CA5 4.2000 11/6/2025 103.4146 205,000.00 204,544.90 204,561.46 211,999.87ANHEUSER-BUSC 4.15% 01/25 03523TBX5 4.1500 1/23/2025 102.7070 1,045,000.00 1,043,955.00 1,043,965.34 1,073,288.15ANHEUSER-BUSCH 3.5% 01/24 035240AJ9 3.5000 1/12/2024 100.3500 740,000.00 736,351.80 736,898.76 742,590.00ANHEUSER-BUSCH 4% 04/28 035240AL4 4.0000 4/13/2028 99.1180 195,000.00 190,171.80 190,184.67 193,280.10ANHEUSER-BUSC 3.65% 02/26 035242AP1 3.6500 2/1/2026 98.2500 1,905,000.00 1,860,266.89 1,861,835.68 1,871,662.50ANTHEM INC 3.65% 12/27 036752AB9 3.6500 12/1/2027 98.3834 695,000.00 688,676.05 688,828.09 683,764.28APPALACHIAN 3.3% 06/27 037735CW5 3.3000 6/1/2027 96.0506 355,000.00 349,480.75 349,971.13 340,979.52APPLE INC 3.25% 02/26 037833BY5 3.2500 2/23/2026 100.0090 400,000.00 390,440.00 391,171.88 400,036.00BANCO 4.25% 04/27 05964HAB1 4.2500 4/11/2027 0.0000 0.00 0.00 0.00 0.00BANCO 3.8% 02/28 05964HAF2 3.8000 2/23/2028 93.1965 200,000.00 199,078.00 199,193.39 186,393.08BANCO FLT 04/23 05964HAH8 3.9169 4/12/2023 0.0000 0.00 0.00 0.00 0.00BANK OF VAR 01/23 06050TMJ8 3.3350 1/25/2023 100.6968 1,100,000.00 1,100,000.00 1,100,000.00 1,107,664.69BANK OF AMERICA 4% 01/25 06051GFM6 4.0000 1/22/2025 100.7860 265,000.00 263,402.05 264,048.54 267,082.90BANK OF 3.95% 04/25 06051GFP9 3.9500 4/21/2025 100.4070 125,000.00 124,631.25 124,769.85 125,508.75BANK OF VAR 04/28 06051GGL7 3.7050 4/24/2028 98.6280 890,000.00 872,530.00 873,572.18 877,789.11BANK OF VAR 07/21 06051GGP8 2.3690 7/21/2021 99.0170 660,000.00 660,000.00 660,000.00 653,512.07BANK OF VAR 01/22 06051GGY9 2.7380 1/23/2022 99.1395 455,000.00 455,000.00 455,000.00 451,084.54BANK OF VAR 12/28 06051GHD4 3.4190 12/20/2028 95.5257 345,000.00 319,728.75 320,463.15 329,563.77BANK OF VAR 07/24 06051GHL6 3.8640 7/23/2024 101.6560 965,000.00 965,000.00 965,000.00 980,980.40BANK OF 4.1% 07/23 06053FAA7 4.1000 7/24/2023 103.6370 595,000.00 628,005.35 612,199.00 616,640.15BANK OF NEW FLT 10/23 06406FAF0 3.8005 10/30/2023 100.8430 815,000.00 815,000.00 815,000.00 821,870.45BANK OF NEW 2.6% 08/20 06406HDD8 2.6000 8/17/2020 99.5970 490,000.00 489,769.70 489,929.62 488,025.30BOSTON 4% 03/28 101137AS6 4.0000 3/1/2028 100.6550 345,000.00 341,722.00 341,899.54 347,259.75BP CAPITAL 3.79% 02/24 10373QAD2 3.7900 2/6/2024 102.4983 615,000.00 615,000.00 615,000.00 630,364.55BP CAPITAL 3.224% 04/24 10373QAY6 3.2240 4/14/2024 99.7400 300,000.00 295,456.58 295,535.45 299,220.00BURLINGTON 3.4% 09/24 12189LAT8 3.4000 9/1/2024 101.5600 275,000.00 272,459.00 272,700.82 279,290.00BURLINGTON 3% 04/25 12189LAV3 3.0000 4/1/2025 98.9790 685,000.00 676,490.85 677,066.93 678,006.15BURLINGTON 4.7% 10/19 12189TBC7 4.7000 10/1/2019 101.2070 870,000.00 956,802.40 886,309.59 880,500.90CBS CORP 2.5% 02/23 124857AS2 2.5000 2/15/2023 95.2681 445,000.00 419,034.25 422,230.33 423,943.00CIGNA 3.05% 10/27 125509BV0 3.0500 10/15/2027 92.6340 3,075,000.00 2,831,755.45 2,840,884.42 2,848,495.50CSX CORP 3.25% 06/27 126408HH9 3.2500 6/1/2027 96.1810 340,000.00 339,585.20 339,657.77 327,015.33CVS HEALTH 3.875% 07/25 126650CL2 3.8750 7/20/2025 100.3390 1,001,000.00 969,898.93 972,484.05 1,004,393.39CVS HEALTH 2.875% 06/26 126650CU2 2.8750 6/1/2026 93.5130 740,000.00 696,751.30 700,938.36 691,996.20CVS HEALTH 4.1% 03/25 126650CW8 4.1000 3/25/2025 101.7990 1,435,000.00 1,420,951.35 1,422,760.75 1,460,815.65CVS HEALTH 4.3% 03/28 126650CX6 4.3000 3/25/2028 101.4400 155,000.00 152,643.63 152,784.87 157,232.00CANADIAN 2.95% 01/23 136385AW1 2.9500 1/15/2023 97.3929 700,000.00 678,930.00 679,060.50 681,750.51
Page 1 of 10

Account: 3015465000 VA GENERAL/WELLINGTON Created: 6-Feb-2019 02:10:27 AM [CST]
Audited Market Value - MonthlyAs of Jan 31, 2019
Description Security Coupon Rate Maturity Date Price (Base) Shares/Par Cost (Base) Amortized Cost Traded Market Value
CARDINAL 2.616% 06/22 14149YBF4 2.6160 6/15/2022 96.6358 565,000.00 565,000.00 565,000.00 545,992.33CATERPILLAR 1.85% 09/20 14913Q2A6 1.8500 9/4/2020 98.5323 425,000.00 424,643.00 424,811.18 418,762.23CENTERPOINT 2.5% 09/22 15189TAR8 2.5000 9/1/2022 96.2280 350,000.00 350,097.55 350,070.40 336,798.00CHEVRON 1.561% 05/19 166764BH2 1.5610 5/16/2019 99.7100 605,000.00 605,000.00 605,000.00 603,245.50CITIGROUP INC 5.5% 09/25 172967HB0 5.5000 9/13/2025 108.3310 250,000.00 272,986.56 265,122.22 270,827.50CITIGROUP INC 4.6% 03/26 172967KJ9 4.6000 3/9/2026 102.1640 170,000.00 169,663.40 169,759.34 173,678.80CITIGROUP INC VAR 01/28 172967LD1 3.8870 1/10/2028 99.6641 370,000.00 359,603.00 360,396.80 368,757.17CITIGROUP INC FLT 05/24 172967LL3 3.7400 5/17/2024 99.9190 175,000.00 175,000.00 175,000.00 174,858.25CITIGROUP INC VAR 07/23 172967LM1 2.8760 7/24/2023 98.2846 575,000.00 556,508.00 557,870.40 565,136.34CITIBANK NA 3.4% 07/21 17325FAQ1 3.4000 7/23/2021 101.0150 585,000.00 584,356.50 584,472.50 590,937.75COCA-COLA 1.375% 05/19 191216BV1 1.3750 5/30/2019 99.5980 830,000.00 829,419.00 829,938.05 826,663.40COCA-COLA 2.25% 09/26 191216BZ2 2.2500 9/1/2026 93.3060 375,000.00 357,530.15 361,124.07 349,897.61COMCAST 3.375% 08/25 20030NBN0 3.3750 8/15/2025 100.2070 355,000.00 341,328.57 342,447.30 355,734.85COMCAST CORP 3.45% 10/21 20030NCQ2 3.4500 10/1/2021 101.1341 280,000.00 279,717.20 279,748.92 283,175.48COMCAST CORP 3.95% 10/25 20030NCS8 3.9500 10/15/2025 103.1246 305,000.00 304,624.85 304,643.15 314,529.97COMCAST CORP 4.15% 10/28 20030NCT6 4.1500 10/15/2028 103.5345 415,000.00 414,792.50 414,799.82 429,668.38COMMONWEALTH 4% 08/20 202795HV5 4.0000 8/1/2020 101.3130 400,000.00 412,392.00 401,917.23 405,252.00COMMONWEALTH 2.55% 06/26 202795JH4 2.5500 6/15/2026 94.0930 290,000.00 290,000.00 290,000.00 272,869.70COMMONWEALTH 3.7% 08/28 202795JN1 3.7000 8/15/2028 101.2150 515,000.00 513,764.00 513,824.52 521,257.25CONSOLIDATED 4.45% 06/20 209111EZ2 4.4500 6/15/2020 102.1360 700,000.00 698,481.00 699,792.50 714,952.00CREDIT 3% 10/21 22546QAR8 3.0000 10/29/2021 99.7790 800,000.00 789,296.00 791,181.34 798,232.00JOHN DEERE 2.65% 01/22 24422ETL3 2.6500 1/6/2022 98.9271 575,000.00 574,839.00 574,907.31 568,830.88JOHN DEERE 2.15% 09/22 24422ETV1 2.1500 9/8/2022 96.8611 1,000,000.00 997,970.00 998,540.54 968,611.30DOMINION 3.9% 10/25 25746UCE7 3.9000 10/1/2025 100.5790 385,000.00 390,588.40 388,552.24 387,229.15DOMINION 4.25% 06/28 25746UCY3 4.2500 6/1/2028 101.9782 285,000.00 285,044.10 285,042.11 290,637.76DUKE ENERGY 3.35% 05/22 26442CAW4 3.3500 5/15/2022 101.8430 365,000.00 364,164.15 364,206.39 371,726.95DUKE ENERGY 3.25% 08/25 26442UAA2 3.2500 8/15/2025 99.5640 1,225,000.00 1,211,173.75 1,212,896.38 1,219,659.00ENTERPRISE 4.15% 10/28 29379VBT9 4.1500 10/16/2028 102.4600 435,000.00 429,693.00 429,849.60 445,701.00EXXON MOBIL 3.043% 03/26 30231GAT9 3.0430 3/1/2026 99.6657 215,000.00 215,000.00 215,000.00 214,281.21EXXON MOBIL 2.222% 03/21 30231GAV4 2.2220 3/1/2021 99.1970 765,000.00 765,000.00 765,000.00 758,857.05FEDERAL HOME 2.75% 03/26 3130AAUF3 2.7500 3/13/2026 99.0320 700,000.00 683,788.00 685,022.78 693,224.00FEDERAL 0.875% 08/19 3130A8Y72 0.8750 8/5/2019 99.1275 1,360,000.00 1,337,124.80 1,349,393.42 1,348,134.41FEDERAL 1.875% 09/26 3135G0Q22 1.8750 9/24/2026 93.7050 1,100,000.00 1,004,421.00 1,011,226.20 1,030,755.00FEDERAL 6.625% 11/30 31359MGK3 6.6250 11/15/2030 134.3400 1,100,000.00 1,475,452.00 1,457,672.88 1,477,740.00FIFTH THIRD 2.875% 10/21 31677QBC2 2.8750 10/1/2021 99.1480 925,000.00 920,236.25 923,204.81 917,119.00FISERV INC 3.8% 10/23 337738AQ1 3.8000 10/1/2023 100.2641 695,000.00 694,680.30 694,703.08 696,835.50FLUOR CORP 4.25% 09/28 343412AF9 4.2500 9/15/2028 95.9799 290,000.00 289,382.30 289,410.35 278,341.83FORD MOTOR 3.815% 11/27 345397YT4 3.8150 11/2/2027 84.1660 200,000.00 183,260.00 184,043.43 168,332.00FORD MOTOR 5.596% 01/22 345397ZM8 5.5960 1/7/2022 101.1534 290,000.00 290,000.00 290,000.00 293,344.80GENERAL 2.625% 11/27 369550AZ1 2.6250 11/15/2027 94.4080 550,000.00 538,070.50 539,701.18 519,244.00GENERAL 2.875% 05/20 369550BA5 2.8750 5/11/2020 100.1920 810,000.00 807,132.60 808,184.17 811,555.20GENERAL FLT 05/20 369550BB3 2.9081 5/11/2020 100.2163 200,000.00 200,493.20 200,337.13 200,432.64GENERAL 3.375% 05/23 369550BD9 3.3750 5/15/2023 101.7440 100,000.00 100,156.51 100,137.25 101,744.00GENERAL MOTORS 5% 10/28 37045VAS9 5.0000 10/1/2028 97.1547 620,000.00 619,783.00 619,791.94 602,359.26GENERAL 4.35% 01/27 37045XBT2 4.3500 1/17/2027 94.0512 800,000.00 801,593.00 800,881.71 752,409.60GEORGIA 2.85% 05/22 373334JX0 2.8500 5/15/2022 98.2850 145,000.00 141,862.20 142,337.28 142,513.25GEORGIA POWER 2.4% 04/21 373334KF7 2.4000 4/1/2021 98.3830 550,000.00 548,872.50 549,522.05 541,106.50GEORGIA POWER 2% 09/20 373334KJ9 2.0000 9/8/2020 98.2282 737,000.00 720,664.59 726,320.86 723,941.61
Page 2 of 10

Account: 3015465000 VA GENERAL/WELLINGTON Created: 6-Feb-2019 02:10:27 AM [CST]
Audited Market Value - MonthlyAs of Jan 31, 2019
Description Security Coupon Rate Maturity Date Price (Base) Shares/Par Cost (Base) Amortized Cost Traded Market Value
GLAXOSMITHKL 3.375% 05/23 377372AL1 3.3750 5/15/2023 101.4480 390,000.00 388,170.90 388,437.90 395,647.20GLAXOSMITHKLI 2.85% 05/22 377373AD7 2.8500 5/8/2022 99.4210 255,000.00 253,885.65 253,893.09 253,523.55GLAXOSMITHKL 3.125% 05/21 377373AE5 3.1250 5/14/2021 100.7431 390,000.00 388,950.90 389,204.55 392,898.05GOLDMAN SACHS FLT 11/23 38141EB81 4.3060 11/29/2023 101.6940 500,000.00 508,130.00 504,554.77 508,470.00GOLDMAN 5.75% 01/22 38141GGS7 5.7500 1/24/2022 107.3040 455,000.00 478,641.62 462,664.96 488,233.20GOLDMAN SACHS 4% 03/24 38141GVM3 4.0000 3/3/2024 102.0070 230,000.00 229,305.40 229,646.53 234,616.10GOLDMAN SACHS VAR 06/28 38141GWL4 3.6910 6/5/2028 96.9490 400,000.00 400,000.00 400,000.00 387,796.00GOLDMAN SACHS VAR 07/23 38141GWM2 2.9050 7/24/2023 97.6678 730,000.00 724,728.30 725,014.21 712,974.72GOLDMAN SACHS VAR 09/25 38141GWQ3 3.2720 9/29/2025 97.0558 260,000.00 248,625.00 248,666.94 252,345.00GOLDMAN SACHS VAR 05/29 38141GWZ3 4.2230 5/1/2029 100.4340 590,000.00 579,919.60 580,202.56 592,560.60GOLDMAN SACHS 3.5% 11/26 38145GAH3 3.5000 11/16/2026 96.3500 680,000.00 629,503.20 630,478.16 655,180.00GOLDMAN 3.75% 05/25 38148LAE6 3.7500 5/22/2025 99.6340 945,000.00 926,856.30 928,125.52 941,541.30GOLDMAN SACHS VAR 10/22 38148YAC2 2.8760 10/31/2022 98.5190 320,000.00 320,000.00 320,000.00 315,260.80HSBC 4.25% 03/24 404280AP4 4.2500 3/14/2024 101.5990 600,000.00 626,676.50 614,793.38 609,594.00HSBC HOLDINGS 4.3% 03/26 404280AW9 4.3000 3/8/2026 102.0630 255,000.00 261,775.02 259,815.29 260,260.65HSBC 2.95% 05/21 404280AY5 2.9500 5/25/2021 99.6230 640,000.00 635,190.05 636,299.06 637,587.20HOME DEPOT 2.7% 04/23 437076AZ5 2.7000 4/1/2023 100.1230 320,000.00 319,500.80 319,794.80 320,393.60HOME DEPOT 2.8% 09/27 437076BT8 2.8000 9/14/2027 96.7456 1,000,000.00 997,400.00 997,764.94 967,456.30HOME DEPOT 3.25% 03/22 437076BV3 3.2500 3/1/2022 101.5910 170,000.00 169,534.20 169,559.94 172,704.70HUMANA INC 3.85% 10/24 444859BD3 3.8500 10/1/2024 100.1190 350,000.00 349,363.00 349,422.92 350,416.50INTEL CORP 3.7% 07/25 458140AS9 3.7000 7/29/2025 103.2323 375,000.00 377,452.50 377,249.20 387,121.31INTEL CORP 1.7% 05/21 458140AW0 1.7000 5/19/2021 97.8164 625,000.00 623,900.00 624,496.40 611,352.19INTEL CORP 2.875% 05/24 458140BD1 2.8750 5/11/2024 99.5390 805,000.00 789,163.75 790,757.81 801,288.95JPMORGAN 2.295% 08/21 46623EKG3 2.2950 8/15/2021 98.2830 480,000.00 474,704.00 475,698.73 471,758.40JPMORGAN 4.35% 08/21 46625HJC5 4.3500 8/15/2021 103.0550 980,000.00 997,426.23 985,486.55 1,009,939.00JPMORGAN 3.875% 09/24 46625HJY7 3.8750 9/10/2024 101.4070 195,000.00 194,223.90 194,513.90 197,743.65JPMORGAN 1.85% 03/19 46625HQU7 1.8500 3/22/2019 99.8880 260,000.00 259,833.60 259,992.41 259,708.80JPMORGAN 3.3% 04/26 46625HQW3 3.3000 4/1/2026 98.0290 210,000.00 209,750.10 209,823.39 205,860.90JPMORGAN CHASE VAR 03/25 46647PAH9 3.2200 3/1/2025 98.2239 475,000.00 475,000.00 475,000.00 466,563.62JPMORGAN CHASE VAR 01/29 46647PAM8 3.5090 1/23/2029 96.8838 760,000.00 750,243.50 750,784.92 736,316.50JPMORGAN CHASE VAR 07/24 46647PAU0 3.7970 7/23/2024 101.6720 1,320,000.00 1,321,575.00 1,321,567.98 1,342,070.40JPMORGAN CHASE VAR 01/27 46647PBA3 3.9600 1/29/2027 101.5115 1,260,000.00 1,260,000.00 1,260,000.00 1,279,045.03JOHNSON & 2.45% 03/26 478160BY9 2.4500 3/1/2026 95.7900 130,000.00 129,816.70 129,870.60 124,527.00MARSH & 4.05% 10/23 571748AU6 4.0500 10/15/2023 102.0610 800,000.00 796,848.00 798,529.30 816,488.00MARSH & 3.5% 03/25 571748AX0 3.5000 3/10/2025 99.2040 120,000.00 119,621.49 119,781.26 119,044.80MARSH & 3.875% 03/24 571748BF8 3.8750 3/15/2024 102.0630 1,575,000.00 1,585,612.90 1,585,559.85 1,607,492.25MARSH & 4.375% 03/29 571748BG6 4.3750 3/15/2029 102.9448 200,000.00 200,335.05 200,333.14 205,889.58MERCK & CO 2.35% 02/22 58933YAQ8 2.3500 2/10/2022 99.0510 415,000.00 412,368.75 412,549.77 411,061.65METLIFE INC 4.368% 09/23 59156RBB3 4.3680 9/15/2023 105.4480 450,000.00 466,285.50 464,451.52 474,516.00METLIFE INC 3.048% 12/22 59156RBF4 3.0480 12/15/2022 100.0240 225,000.00 229,146.75 227,766.91 225,054.00MICROSOFT 2.375% 02/22 594918BA1 2.3750 2/12/2022 99.3880 205,000.00 204,645.35 204,848.68 203,745.40MICROSOFT 2.65% 11/22 594918BH6 2.6500 11/3/2022 100.0900 795,000.00 812,855.11 804,946.61 795,715.50MICROSOFT 2.4% 08/26 594918BR4 2.4000 8/8/2026 95.3630 240,000.00 223,996.80 227,304.37 228,871.20MICROSOFT 2.875% 02/24 594918BX1 2.8750 2/6/2024 100.5225 15,000.00 14,890.80 14,920.08 15,078.37MIDAMERICAN 3.5% 10/24 595620AM7 3.5000 10/15/2024 101.9160 595,000.00 608,525.80 603,757.00 606,400.20MIDAMERICAN 3.65% 04/29 595620AT2 3.6500 4/15/2029 101.9690 550,000.00 549,960.50 549,962.19 560,829.50MORGAN 4.35% 09/26 6174467Y9 4.3500 9/8/2026 101.1830 980,000.00 970,975.05 971,763.08 991,593.40MORGAN STANLEY VAR 01/30 6174468G7 4.4310 1/23/2030 103.8970 510,000.00 510,000.00 510,000.00 529,874.70
Page 3 of 10

Account: 3015465000 VA GENERAL/WELLINGTON Created: 6-Feb-2019 02:10:27 AM [CST]
Audited Market Value - MonthlyAs of Jan 31, 2019
Description Security Coupon Rate Maturity Date Price (Base) Shares/Par Cost (Base) Amortized Cost Traded Market Value
MORGAN 2.45% 02/19 61746BDX1 2.4500 2/1/2019 100.0000 510,000.00 509,658.30 510,000.00 510,000.00MORGAN 3.625% 01/27 61746BEF9 3.6250 1/20/2027 98.3179 545,000.00 538,429.05 539,747.45 535,832.56MORGAN 7.3% 05/19 61747YCG8 7.3000 5/13/2019 101.2332 725,000.00 854,882.22 730,485.81 733,940.99MORGAN 4.875% 11/22 6174824M3 4.8750 11/1/2022 104.7330 30,000.00 30,258.59 30,102.67 31,419.90MORGAN 2.8% 06/20 61761JB32 2.8000 6/16/2020 99.8500 915,000.00 919,250.54 916,266.60 913,627.50MORGAN 3.7% 10/24 61761JVL0 3.7000 10/23/2024 100.7410 375,000.00 389,895.00 383,750.40 377,778.75MORGAN 3.95% 04/27 61761JZN2 3.9500 4/23/2027 97.5770 125,000.00 124,550.00 124,688.78 121,971.25MORGAN 3.125% 07/26 61761J3R8 3.1250 7/27/2026 95.9130 225,000.00 223,470.00 223,857.11 215,804.25NATIONAL 3.05% 02/22 637432MQ5 3.0500 2/15/2022 99.6010 430,000.00 428,113.29 428,828.95 428,284.30NATIONAL RURAL 2% 01/20 637432NC5 2.0000 1/27/2020 99.2030 420,000.00 419,126.40 419,829.00 416,652.60NATIONAL 3.7% 03/29 637432NS0 3.7000 3/15/2029 100.0383 350,000.00 349,219.50 349,220.34 350,134.09NBCUNIVERSAL 5.15% 04/20 63946BAD2 5.1500 4/30/2020 102.7385 540,000.00 608,882.40 560,300.61 554,788.01PNC BANK NA 3.8% 07/23 69349LAM0 3.8000 7/25/2023 101.4530 600,000.00 602,934.00 602,593.74 608,718.00PFIZER INC 3.2% 09/23 717081EN9 3.2000 9/15/2023 100.7390 130,000.00 129,736.10 129,757.10 130,960.66PFIZER INC 3.6% 09/28 717081EP4 3.6000 9/15/2028 101.7517 130,000.00 129,793.30 129,802.30 132,277.26PHILIP 3.25% 11/24 718172BM0 3.2500 11/10/2024 98.3170 125,000.00 123,151.25 123,280.81 122,896.25PHILIP 2.125% 05/23 718172BU2 2.1250 5/10/2023 95.2220 980,000.00 929,239.00 937,301.60 933,175.60PHILIP 2.375% 08/22 718172CA5 2.3750 8/17/2022 97.3763 520,000.00 518,121.40 518,670.17 506,356.50PROVIDENCE 4.379% 10/23 743755AJ9 4.3790 10/1/2023 104.9310 485,000.00 485,000.00 485,000.00 508,915.35REYNOLDS 4.45% 06/25 761713BG0 4.4500 6/12/2025 100.0849 2,150,000.00 2,199,434.55 2,190,919.31 2,151,825.78RIO TINTO 3.75% 06/25 767201AS5 3.7500 6/15/2025 102.7620 520,000.00 523,166.80 522,899.30 534,362.40ROYAL BANK 2.15% 10/20 78013GKN4 2.1500 10/26/2020 98.7910 640,000.00 639,628.80 639,787.95 632,262.40ROYAL BANK OF 3.2% 04/21 78013XKG2 3.2000 4/30/2021 100.5454 250,000.00 249,664.93 249,733.82 251,363.60SALESFORCE.CO 3.25% 04/23 79466LAE4 3.2500 4/11/2023 101.5770 215,000.00 214,871.00 214,892.14 218,390.55SALESFORCE.COM 3.7% 04/28 79466LAF1 3.7000 4/11/2028 102.2530 265,000.00 264,112.95 264,167.33 270,970.45SANTANDER 4.5% 07/25 80282KAE6 4.5000 7/17/2025 101.8240 615,000.00 637,976.40 634,737.65 626,217.60SANTANDER 3.7% 03/22 80282KAT3 3.7000 3/28/2022 100.0433 180,000.00 177,402.60 177,809.20 180,077.85SANTANDER UK 2.35% 09/19 80283LAH6 2.3500 9/10/2019 99.6510 254,000.00 253,329.32 253,875.32 253,113.54SEMPRA ENERGY 3.4% 02/28 816851BG3 3.4000 2/1/2028 92.9211 240,000.00 225,322.10 226,214.67 223,010.64SHELL 2.125% 05/20 822582BG6 2.1250 5/11/2020 99.4380 550,000.00 543,405.50 545,483.44 546,909.00SHERWIN-WILLI 3.45% 08/25 824348AR7 3.4500 8/1/2025 96.9110 275,000.00 264,517.00 265,383.70 266,505.25SHERWIN-WILLI 2.75% 06/22 824348AU0 2.7500 6/1/2022 97.7106 225,000.00 223,341.50 223,611.02 219,848.85SHERWIN-WILLI 3.45% 06/27 824348AW6 3.4500 6/1/2027 95.6388 320,000.00 303,345.00 304,043.27 306,044.10SOUTHERN 2.6% 06/26 842434CQ3 2.6000 6/15/2026 93.4840 265,000.00 264,485.90 264,622.54 247,732.60SOUTHERN 2.95% 07/23 842587CU9 2.9500 7/1/2023 97.9334 25,000.00 24,978.75 24,988.58 24,483.36SOUTHERN 3.25% 07/26 842587CV7 3.2500 7/1/2026 95.4974 355,000.00 333,911.90 335,240.03 339,015.73STARBUCKS 3.8% 08/25 855244AQ2 3.8000 8/15/2025 100.8200 720,000.00 713,054.30 713,359.85 725,904.00STATE STREET VAR 12/24 857477BC6 3.7760 12/3/2024 102.8915 230,000.00 230,000.00 230,000.00 236,650.40SUNCOR ENERGY 3.6% 12/24 867224AA5 3.6000 12/1/2024 100.6320 340,000.00 336,605.00 336,173.92 342,148.80TELEFONICA 4.103% 03/27 87938WAT0 4.1030 3/8/2027 99.4380 805,000.00 779,811.20 780,682.52 800,475.90THERMO 2.95% 09/26 883556BR2 2.9500 9/19/2026 94.7060 380,000.00 375,390.60 376,486.80 359,882.80WARNER MEDIA 3.6% 07/25 887317AW5 3.6000 7/15/2025 98.5420 410,000.00 397,872.20 400,700.40 404,022.20WARNER 3.875% 01/26 887317AZ8 3.8750 1/15/2026 98.6050 145,000.00 147,593.82 147,169.22 142,977.25WARNER MEDIA 2.95% 07/26 887317BA2 2.9500 7/15/2026 92.3940 145,000.00 137,627.70 138,809.73 133,971.30TOTAL 3.883% 10/28 89152UAH5 3.8830 10/11/2028 104.2590 200,000.00 200,000.00 200,000.00 208,518.00TOTAL CAPITAL 3.7% 01/24 89153VAG4 3.7000 1/15/2024 102.9940 785,000.00 786,922.10 787,707.00 808,502.90TRANSCANADA 4.25% 05/28 89352HAW9 4.2500 5/15/2028 102.0370 950,000.00 955,447.75 955,390.51 969,351.50UNION 3.75% 07/25 907818ES3 3.7500 7/15/2025 101.9395 465,000.00 465,373.33 465,342.57 474,018.58
Page 4 of 10

Account: 3015465000 VA GENERAL/WELLINGTON Created: 6-Feb-2019 02:10:27 AM [CST]
Audited Market Value - MonthlyAs of Jan 31, 2019
Description Security Coupon Rate Maturity Date Price (Base) Shares/Par Cost (Base) Amortized Cost Traded Market Value
US BANCORP 3.375% 02/24 91159HHV5 3.3750 2/5/2024 100.8230 950,000.00 949,743.50 949,744.06 957,818.50UNITED 2.8% 05/24 913017CN7 2.8000 5/4/2024 96.8240 815,000.00 801,496.80 803,032.85 789,115.60UNITED 3.65% 08/23 913017DB2 3.6500 8/16/2023 101.4920 855,000.00 854,923.05 854,929.93 867,756.60UNITED 3.95% 08/25 913017DD8 3.9500 8/16/2025 102.3140 85,000.00 84,855.50 84,865.82 86,966.90UNITEDHEALTH 2.75% 02/23 91324PBZ4 2.7500 2/15/2023 98.6800 325,000.00 314,619.50 315,935.60 320,710.00UNITEDHEALTH 2.3% 12/19 91324PCG5 2.3000 12/15/2019 99.3246 770,000.00 787,710.00 773,165.25 764,799.57UNITEDHEALTH 2.875% 12/21 91324PCH3 2.8750 12/15/2021 99.7713 525,000.00 524,433.00 524,766.72 523,799.48UNITEDHEALTH 3.35% 07/22 91324PCN0 3.3500 7/15/2022 101.2690 294,000.00 302,595.69 298,562.11 297,730.86UNITEDHEALTH 1.7% 02/19 91324PCT7 1.7000 2/15/2019 99.9680 255,000.00 258,187.50 255,044.17 254,918.40UNITEDHEALTH 3.7% 12/25 91324PDN9 3.7000 12/15/2025 103.1374 170,000.00 169,658.30 169,664.80 175,333.61VALERO ENERGY 3.4% 09/26 91913YAU4 3.4000 9/15/2026 95.3120 430,000.00 423,804.21 424,990.15 409,841.60VERIZON 4.125% 03/27 92343VDY7 4.1250 3/16/2027 102.5810 255,000.00 261,974.25 261,196.77 261,581.55VISA INC 2.8% 12/22 92826CAC6 2.8000 12/14/2022 100.2660 45,000.00 44,937.45 44,964.70 45,119.70VISA INC 3.15% 12/25 92826CAD4 3.1500 12/14/2025 100.7030 230,000.00 229,747.00 229,804.28 231,616.90VODAFONE 3.75% 01/24 92857WBH2 3.7500 1/16/2024 99.9230 695,000.00 689,230.50 689,821.65 694,464.85WALMART INC 3.4% 06/23 931142EK5 3.4000 6/26/2023 102.4800 680,000.00 682,275.44 682,009.42 696,864.00ANTHEM INC 3.5% 08/24 94973VBJ5 3.5000 8/15/2024 99.7760 250,000.00 257,862.50 254,658.60 249,440.00WELLS FARGO & 4.3% 07/27 94974BGL8 4.3000 7/22/2027 102.0690 515,000.00 527,590.12 524,085.96 525,655.35WELLS FARGO & 2.5% 03/21 949746RS2 2.5000 3/4/2021 98.9630 610,000.00 612,529.79 611,070.61 603,674.30WELLS FARGO & 3% 04/26 949746RW3 3.0000 4/22/2026 95.8470 815,000.00 775,012.13 778,257.98 781,153.05WELLS FARGO 2.6% 01/21 94988J5N3 2.6000 1/15/2021 99.2241 275,000.00 274,851.50 274,903.61 272,866.14WELLS FARGO 3.625% 10/21 94988J5T0 3.6250 10/22/2021 101.4549 725,000.00 724,920.25 724,927.81 735,547.95WELLS FARGO & VAR 05/28 95000U2A0 3.5840 5/22/2028 99.0597 725,000.00 725,000.00 725,000.00 718,182.83WELLS FARGO 2.625% 07/22 95000U2B8 2.6250 7/22/2022 98.0805 630,000.00 630,623.20 630,446.86 617,907.15WELLS FARGO 3.75% 01/24 95000U2C6 3.7500 1/24/2024 101.7450 575,000.00 575,250.35 575,250.56 585,033.75WILLIS NORTH 3.6% 05/24 970648AF8 3.6000 5/15/2024 98.3571 175,000.00 175,256.70 175,193.60 172,124.91
112,856,000.00 112,629,941.95 112,333,230.34 112,578,172.22 FHLMC
TBA FGLMC SINGLE 4% 02R040623 4.0000 2/15/2049 102.4200 900,000.00 918,140.63 918,140.63 921,780.00TBA FGLMC SINGLE 4% 02R040631 4.0000 3/15/2049 102.3145 900,000.00 921,128.91 921,128.91 920,830.50TBA FGLMC SINGLE 4.5% 02R042629 4.5000 2/15/2048 103.9940 2,400,000.00 2,483,277.34 2,483,277.34 2,495,856.00FHLMCGLD 5% 01/36 3128K86S0 5.0000 1/1/2036 106.8080 166,668.05 160,457.08 163,099.77 178,014.81FHLMCGLD 5.5% 12/37 3128LCJD9 5.5000 12/1/2037 108.5100 143,926.82 155,816.61 155,469.31 156,174.99FHLMCGLD 3.5% 06/46 3128MJYH7 3.5000 6/1/2046 100.0000 0.01 0.01 0.01 0.01FHLMCGLD 3% 12/47 3128MJ2Z2 3.0000 12/1/2047 98.3371 176,558.27 169,413.19 169,570.34 173,622.35FHLMCGLD 3% 02/48 3128MJ3H1 3.0000 2/1/2048 98.3020 557,218.24 534,668.32 535,163.93 547,756.67FHLMCGLD 3.5% 03/48 3128MJ3N8 3.5000 3/1/2048 100.6111 358,633.32 355,145.06 355,221.24 360,825.04FHLMCGLD 3.5% 06/48 3128MJ4A5 3.5000 6/1/2048 100.5740 3,271,173.13 3,234,048.14 3,234,551.55 3,289,949.66FHLMCGLD 3% 07/48 3128MJ4G2 3.0000 7/1/2048 98.3190 1,603,871.77 1,538,965.08 1,540,370.95 1,576,910.69FHLMCGLD 3.5% 07/48 3128MJ4H0 3.5000 7/1/2048 100.5730 291,013.77 288,183.21 288,244.46 292,681.28FHLMCGLD 5.5% 09/19 3128MMAL7 5.5000 9/1/2019 100.2966 563.11 582.99 564.11 564.78FHLMCGLD 5% 01/21 3128MMC92 5.0000 1/1/2021 102.0700 9,315.78 9,190.60 9,298.64 9,508.62FHLMCGLD 5% 05/21 3128M1PU7 5.0000 5/1/2021 101.2300 31,125.40 30,665.81 31,049.70 31,508.24FHLMCGLD 5.5% 07/38 3128M6F29 5.5000 7/1/2038 107.4420 38,748.35 39,014.75 38,924.13 41,632.00FHLMCGLD 7% 02/39 3128M9U67 7.0000 2/1/2039 115.7540 66,985.74 75,316.76 75,087.45 77,538.67FHLMCGLD 5% 01/21 3128PCCE0 5.0000 1/1/2021 100.6000 9,014.74 8,893.61 8,998.11 9,068.83FHLMC MORTPASS 7.5% 11/19 31290KPL7 7.5000 11/1/2019 100.0000 0.81 0.81 0.81 0.81FHLMCGLD 5.5% 04/34 31292JAM2 5.5000 4/1/2034 108.6250 284,417.92 308,465.45 307,599.22 308,948.97
Page 5 of 10

Account: 3015465000 VA GENERAL/WELLINGTON Created: 6-Feb-2019 02:10:27 AM [CST]
Audited Market Value - MonthlyAs of Jan 31, 2019
Description Security Coupon Rate Maturity Date Price (Base) Shares/Par Cost (Base) Amortized Cost Traded Market Value
FHLMCGLD 5% 08/38 312927CU8 5.0000 8/1/2038 106.1860 64,615.96 63,808.26 64,081.65 68,613.10FHLMCGLD 8% 07/20 31295WFF0 8.0000 7/1/2020 100.0000 0.46 0.47 0.46 0.46FHLMCGLD 5.5% 08/19 312968WR7 5.5000 8/1/2019 100.1761 2,288.57 2,369.38 2,291.51 2,292.60FHLMCGLD 5% 01/20 312971UA0 5.0000 1/1/2020 100.4868 1,183.17 1,167.27 1,181.57 1,188.93FHLMCGLD 3% 01/48 3132L9J48 3.0000 1/1/2048 98.3180 380,747.91 365,339.53 365,679.31 374,343.73FHLMCGLD 3.5% 01/48 3132XWCU3 3.5000 1/1/2048 100.5690 294,434.12 291,041.22 291,085.26 296,109.45FHLMCGLD 3.5% 06/48 3132Y0KU3 3.5000 6/1/2048 100.5670 97,788.26 96,837.11 96,858.29 98,342.72
12,050,293.68 12,051,937.60 12,056,938.66 12,234,063.91 FNMA
TBA FNMA SINGLE 3.5% 01F032625 3.5000 2/25/2049 100.4940 14,015,000.00 14,014,452.54 14,014,452.54 14,084,234.10TBA FNMA SINGLE FAMILY 4% 01F040628 4.0000 2/25/2049 102.3590 4,685,000.00 4,773,426.67 4,773,426.67 4,795,519.15TBA FNMA SINGLE FAMILY 4% 01F040636 4.0000 3/25/2049 102.2580 2,200,000.00 2,236,867.19 2,236,867.19 2,249,676.00FNMA MORTPASS 8% 07/20 31365PQX9 8.0000 7/1/2020 100.0000 0.04 0.04 0.04 0.04FNMA MORTPASS 6% 05/19 31371HLW6 6.0000 5/1/2019 107.8619 190.92 178.15 190.61 205.93FNMA MORTPASS 7% 08/19 31374TW88 7.0000 8/1/2019 100.0136 220.17 215.08 219.73 220.20FNMA MORTPASS 4.5% 04/26 3138AFAG5 4.5000 4/1/2026 103.2140 181,928.12 188,040.91 187,593.13 187,775.29FNMA MORTPASS 4.5% 03/41 3138A87K6 4.5000 3/1/2041 104.9260 1,389,992.78 1,503,363.99 1,484,438.90 1,458,463.82FNMA MORTPASS 7% 03/39 3138ELYN7 7.0000 3/1/2039 113.5400 40,419.30 44,856.95 44,734.95 45,892.07FNMA MORTPASS 2.97% 06/27 3138LAA25 2.9700 6/1/2027 98.9980 481,206.79 488,424.88 486,262.25 476,385.10FNMA MORTPASS 3% 07/27 3138LJYG9 3.0000 7/1/2027 98.3180 660,000.00 674,179.69 672,275.69 648,898.80FNMA MORTPASS 3.16% 08/27 3138LJ5T3 3.1600 8/1/2027 99.3040 890,000.00 915,587.50 912,176.95 883,805.60FNMA MORTPASS 2.88% 11/27 3138LLFS9 2.8800 11/1/2027 97.3380 940,111.00 943,930.20 943,450.35 915,085.25FNMA MORTPASS 3.75% 06/30 3138LNPR6 3.7500 6/1/2030 103.0680 100,000.00 101,292.97 101,235.37 103,068.00FNMA MORTPASS 2.78% 03/27 3138L9BK7 2.7800 3/1/2027 97.6860 276,077.69 281,685.52 279,865.09 269,689.25FNMA MORTPASS 3% 04/43 3138MKQH2 3.0000 4/1/2043 98.8130 19,551.54 19,142.34 19,152.14 19,319.46FNMA MORTPASS 3% 01/43 3138MN5G1 3.0000 1/1/2043 98.8130 18,419.49 18,007.64 18,017.73 18,200.85FNMA MORTPASS 3% 12/42 3138MQTN3 3.0000 12/1/2042 98.8130 14,152.93 13,832.09 13,840.22 13,984.93FNMA MORTPASS 2.5% 01/43 3138MRK67 2.5000 1/1/2043 95.9180 550,231.48 512,231.13 519,169.50 527,771.03FNMA MORTPASS 3% 01/43 3138MRK75 3.0000 1/1/2043 98.8130 37,592.74 36,742.02 36,762.05 37,146.52FNMA MORTPASS 4% 03/44 3138WBG58 4.0000 3/1/2044 102.7390 1,618,656.27 1,702,791.00 1,689,821.73 1,662,991.27FNMA MORTPASS 2.5% 10/31 3138WJD88 2.5000 10/1/2031 98.4310 153,762.14 155,732.24 155,452.82 151,349.61FNMA MORTPASS 3% 04/43 3138WMWQ0 3.0000 4/1/2043 98.7830 39,434.59 38,554.80 38,575.00 38,954.67FNMA MORTPASS 3% 04/43 3138WN5M7 3.0000 4/1/2043 98.7660 36,228.75 35,404.55 35,423.26 35,781.69FNMA MORTPASS 2.5% 01/31 3140EVGE1 2.5000 1/1/2031 98.4310 48,225.09 48,842.97 48,751.09 47,468.44FNMA MORTPASS 2.5% 12/31 3140FDGH3 2.5000 12/1/2031 98.4310 384,629.10 389,557.16 388,865.72 378,594.27FNMA MORTPASS 3.5% 12/46 3140FLNT1 3.5000 12/1/2046 100.5080 127,680.48 126,598.19 126,622.89 128,329.10FNMA MORTPASS 4.5% 07/47 3140FPFS3 4.5000 7/1/2047 104.1118 899,467.87 937,906.09 937,154.29 936,452.28FNMA MORTPASS 3.5% 01/47 3140FQJ65 3.5000 1/1/2047 100.6180 691,420.50 685,559.62 685,693.28 695,693.48FNMA MORTPASS 3.5% 03/48 3140HAP95 3.5000 3/1/2048 100.5080 203,290.05 201,566.86 201,604.42 204,322.76FNMA MORTPASS 3.5% 05/48 3140HAS27 3.5000 5/1/2048 100.5080 647,997.52 642,504.73 642,623.90 651,289.35FNMA MORTPASS 3.5% 05/48 3140HJQC8 3.5000 5/1/2048 100.5080 169,940.00 168,499.48 168,531.40 170,803.30FNMA MORTPASS 3.5% 01/48 3140H1FV7 3.5000 1/1/2048 100.5540 159,842.30 158,487.38 158,517.71 160,727.83FNMA MORTPASS 3.5% 12/47 3140H5LJ8 3.5000 12/1/2047 100.5080 147,926.21 146,672.31 146,700.70 148,677.68FNMA MORTPASS 3.5% 04/48 3140H8QX6 3.5000 4/1/2048 100.5080 604,669.86 599,544.33 599,655.87 607,741.58FNMA MORTPASS 3.5% 11/47 3140Q8KD6 3.5000 11/1/2047 100.5080 575,176.04 570,322.99 570,430.50 578,097.93FNMA MORTPASS 5% 02/36 31403C6L0 5.0000 2/1/2036 107.1150 212,653.69 205,177.56 208,063.12 227,784.00FNMA MORTPASS 5% 04/19 31404NRV0 5.0000 4/1/2019 101.6317 555.24 560.75 555.44 564.30FNMA MORTPASS 6% 02/21 31406JS95 6.0000 2/1/2021 100.5600 6,971.08 7,058.22 6,984.07 7,010.12
Page 6 of 10

Account: 3015465000 VA GENERAL/WELLINGTON Created: 6-Feb-2019 02:10:27 AM [CST]
Audited Market Value - MonthlyAs of Jan 31, 2019
Description Security Coupon Rate Maturity Date Price (Base) Shares/Par Cost (Base) Amortized Cost Traded Market Value
FNMA MORTPASS 6% 03/21 31409AYA1 6.0000 3/1/2021 101.1760 10,412.69 10,542.85 10,432.65 10,535.14FNMA MORTPASS 6% 05/21 31409HC28 6.0000 5/1/2021 100.2189 4,034.18 4,084.62 4,043.36 4,043.01FNMA MORTPASS 6% 01/38 31410GWV1 6.0000 1/1/2038 109.6620 171,391.80 188,659.52 188,157.41 187,951.67FNMA MORTPASS 6% 01/38 31410GWW9 6.0000 1/1/2038 110.7810 98,698.94 110,572.43 110,226.89 109,339.67FNMA MORTPASS 6% 03/38 31410G4C4 6.0000 3/1/2038 110.7810 198,866.26 223,370.56 222,663.48 220,306.03FNMA MORTPASS 6% 10/36 31410QCW9 6.0000 10/1/2036 109.3370 78,591.28 79,033.36 78,857.90 85,929.35FNMA MORTPASS 6% 09/36 31410RVR7 6.0000 9/1/2036 108.5670 21,193.00 21,226.13 21,214.43 23,008.60FNMA MORTPASS 5.5% 05/37 31410WKW7 5.5000 5/1/2037 108.6499 5,718.90 5,478.53 5,568.69 6,213.58FNMA MORTPASS 6% 09/36 31410XBB1 6.0000 9/1/2036 107.8610 10,340.66 10,356.82 10,352.86 11,153.54FNMA MORTPASS 5.5% 04/37 31411RMG0 5.5000 4/1/2037 106.1180 30,527.88 29,244.80 29,729.38 32,395.58FNMA MORTPASS 5.5% 07/37 31412LQV5 5.5000 7/1/2037 108.6760 41,473.42 39,730.26 40,382.59 45,071.65FNMA MORTPASS 5.5% 05/37 31412YEC2 5.5000 5/1/2037 108.6630 16,523.30 15,828.82 16,090.63 17,954.71FNMA MORTPASS 6% 04/33 31415P4K1 6.0000 4/1/2033 109.5450 6,413.11 7,066.33 7,041.39 7,025.24FNMA MORTPASS 5.5% 09/39 31417MT45 5.5000 9/1/2039 108.9500 1,051,964.14 1,165,713.03 1,162,665.58 1,146,114.93FNMA MORTPASS 4% 03/46 31418BZY5 4.0000 3/1/2046 102.7230 314,068.48 336,200.49 334,176.64 322,620.56FNMA MORTPASS 4% 04/46 31418B3D6 4.0000 4/1/2046 102.7370 679,761.19 727,981.76 723,585.04 698,366.25FNMA MORTPASS 2.5% 11/31 31418CDH4 2.5000 11/1/2031 100.0000 0.01 0.01 0.01 0.01FNMA MORTPASS 3.5% 07/47 31418CMF8 3.5000 7/1/2047 100.6100 144,256.64 143,033.83 143,061.80 145,136.61FNMA MORTPASS 3.5% 03/48 31418CU77 3.5000 3/1/2048 100.5080 4,015,437.46 3,968,224.69 3,968,834.64 4,035,835.88FNMA MORTPASS 3.5% 05/48 31418CWS9 3.5000 5/1/2048 100.5080 483,786.10 479,685.25 479,774.76 486,243.73FNMA MORTPASS 5% 07/40 31418U4R2 5.0000 7/1/2040 107.8270 270,738.37 292,722.33 292,156.01 291,929.06
40,882,819.58 41,446,555.15 41,403,174.45 41,455,149.85 Government Bond
PETROLEOS 4.875% 01/22 71654QBB7 4.8750 1/24/2022 97.5000 375,000.00 384,843.75 379,118.08 365,625.00EQUINOR ASA 2.65% 01/24 85771PAK8 2.6500 1/15/2024 98.7470 880,000.00 841,731.30 852,576.82 868,973.60EQUINOR ASA 2.25% 11/19 85771PAW2 2.2500 11/8/2019 99.5980 225,000.00 224,905.50 224,984.60 224,095.50
1,480,000.00 1,451,480.55 1,456,679.50 1,458,694.10 GNMA1 (15 Day Lag)
GNMA I MORTPASS 3% 12/42 36178DRS2 3.0000 12/15/2042 100.0000 0.01 0.01 0.01 0.01GNMA I MORTPASS 3% 05/43 36178EDL0 3.0000 5/15/2043 117.6471 0.02 0.02 0.02 0.02GNMA I MORTPASS 4% 08/41 3620AY7J9 4.0000 8/15/2041 103.5000 993,832.21 1,073,299.96 1,055,238.48 1,028,616.34GNMA I MORTPASS 6% 08/34 36241KBZ0 6.0000 8/15/2034 110.1870 124,471.29 128,779.15 126,778.11 137,151.18GNMA I MORTPASS 7% 11/32 36241KJL3 7.0000 11/15/2032 115.9980 57,344.57 59,833.24 58,659.74 66,518.55GNMA I MORTPASS 7% 06/32 36241KJP4 7.0000 6/15/2032 110.1310 5,973.45 6,232.47 6,108.46 6,578.62GNMA I MORTPASS 7% 05/33 36241KJQ2 7.0000 5/15/2033 113.3820 4,774.86 4,982.27 4,886.77 5,413.83GNMA I MORTPASS 7% 01/33 36241KJT6 7.0000 1/15/2033 113.8740 11,809.74 12,325.96 12,094.51 13,448.22GNMA I MORTPASS 7% 11/33 36241KJ66 7.0000 11/15/2033 113.4750 16,537.73 17,121.05 16,857.63 18,766.19
1,214,743.88 1,302,574.13 1,280,623.73 1,276,492.96 GNMA1 (20 Day Lag)
TBA GNMA2 SINGLE 3.5% 21H032621 3.5000 2/15/2049 101.2680 2,500,000.00 2,512,500.00 2,512,500.00 2,531,700.00TBA GNMA2 SINGLE 4% 21H040624 4.0000 2/15/2048 102.8870 600,000.00 613,908.40 613,908.40 617,322.00TBA GNMA2 SINGLE 4% 21H040632 4.0000 3/15/2049 102.7770 200,000.00 204,625.00 204,625.00 205,554.00TBA GNMA2 SINGLE 4.5% 21H042620 4.5000 2/15/2049 103.8280 2,400,000.00 2,482,968.75 2,482,968.75 2,491,872.00GNMA II MORTPASS 4% 07/45 36179RJF7 4.0000 7/20/2045 103.3720 585,325.33 604,529.85 604,127.02 605,062.50GNMA II MORTPASS 4% 10/45 36179RQ36 4.0000 10/20/2045 103.2480 797,063.07 823,222.69 822,679.52 822,951.68GNMA II 3.5% 04/46 36179R7J2 3.5000 4/20/2046 100.0000 0.01 0.01 0.01 0.01GNMA II MORTPASS 3% 06/46 36179SEG8 3.0000 6/20/2046 100.0000 0.01 0.01 0.01 0.01GNMA II MORTPASS 4% 07/47 36179TCY9 4.0000 7/20/2047 102.9770 844,082.66 868,940.89 868,455.79 869,211.00
Page 7 of 10

Account: 3015465000 VA GENERAL/WELLINGTON Created: 6-Feb-2019 02:10:27 AM [CST]
Audited Market Value - MonthlyAs of Jan 31, 2019
Description Security Coupon Rate Maturity Date Price (Base) Shares/Par Cost (Base) Amortized Cost Traded Market Value
GNMA II MORTPASS 3% 01/48 36179TQN8 3.0000 1/20/2048 99.2850 95,578.91 92,297.12 92,369.46 94,895.52GNMA II MORTPASS 3% 02/48 36179TSF3 3.0000 2/20/2048 99.2850 2,882,365.25 2,783,396.54 2,785,567.16 2,861,756.34
10,904,415.24 10,986,389.26 10,987,201.12 11,100,325.06 Municipal Bond
CHICAGO ILL 4.864% 12/22 167486RW1 4.8640 12/1/2022 104.1170 210,000.00 219,901.50 216,917.74 218,645.70210,000.00 219,901.50 216,917.74 218,645.70
Money MarketINVESCO VAR 12/99 00499KPA5 2.3287 12/31/2099 100.0000 16,039,029.55 16,039,029.55 16,039,029.55 16,039,029.55
16,039,029.55 16,039,029.55 16,039,029.55 16,039,029.55 Mortgage Related
ALLY MASTER 2.04% 06/22 02005AGM4 2.0400 6/15/2022 98.8429 1,150,000.00 1,129,521.15 1,132,555.67 1,136,693.12ALLY MASTER 2.7% 01/23 02005AGP7 2.7000 1/17/2023 99.2228 600,000.00 594,089.22 594,851.06 595,336.92ALLY MASTER 3.3% 07/23 02005AHE1 3.3000 7/17/2023 100.5517 585,000.00 584,916.23 584,925.13 588,227.45ALLY AUTO 1.96% 07/22 02007FAD7 1.9600 7/15/2022 98.6708 660,000.00 659,937.96 659,955.90 651,227.15ALLY AUTO 3.12% 07/23 02007JAD9 3.1200 7/17/2023 100.5561 460,000.00 459,917.61 459,926.78 462,557.92AMERICREDIT 1.98% 12/21 03065GAD2 1.9800 12/20/2021 99.4792 510,000.00 511,553.91 511,030.59 507,343.67AMERICREDIT 3.38% 07/23 03066MAD8 3.3800 7/18/2023 100.9111 860,000.00 859,947.20 859,949.54 867,835.46BANK 4.272% 11/61 06036FAZ4 4.2720 11/15/2061 105.1512 900,000.00 926,970.21 926,837.77 946,360.35BARCLAYS 2.41% 07/22 06742LAE3 2.4100 7/15/2022 99.7667 800,000.00 795,821.44 796,427.90 798,133.28BARCLAYS 2.2% 12/22 06742LAH6 2.2000 12/15/2022 99.3567 914,000.00 919,748.20 918,095.20 908,120.24BARCLAYS FLT 05/23 06742LAP8 2.8089 5/15/2023 100.0000 560,000.00 560,000.00 560,000.00 560,000.00CFCRE 3.8343% 12/47 12527DAR1 3.8343 12/15/2047 101.2036 155,175.00 164,230.92 163,639.72 157,042.61COMMERCIAL 1.77% 02/49 12593YBA0 1.7700 2/10/2049 99.0281 344,775.32 344,770.47 344,770.47 341,424.55CSAIL 2.98551% 06/50 12595BAB7 2.9855 6/15/2050 99.6757 600,000.00 617,999.82 617,120.72 598,054.32CNH EQUIPMENT 3.37% 05/24 12596EAD6 3.3700 5/15/2024 101.3850 505,000.00 504,959.95 504,962.67 511,994.30CNH EQUIPMENT 3.01% 04/24 12596JAC7 3.0100 4/15/2024 100.2063 395,000.00 394,913.22 394,913.32 395,815.04COMM 3.288% 12/44 126192AD5 3.2880 12/10/2044 100.2088 451,291.77 450,392.72 450,405.75 452,234.07COMM 3.391% 05/45 12624BAC0 3.3910 5/15/2045 100.4083 703,068.70 734,761.72 732,508.96 705,939.12COMMERCIAL VAR 02/47 12630DAY0 4.2360 2/10/2047 104.6522 520,000.00 536,554.69 536,485.46 544,191.44COMM 3.528% 07/47 12632QAV5 3.5280 7/15/2047 99.9812 750,000.00 783,251.95 781,042.34 749,858.70CSAIL 3.2241% 06/57 12634NAU2 3.2241 6/15/2057 100.4127 730,000.00 726,749.22 726,783.03 733,012.78CSAIL 1.493% 01/49 12636MAA6 1.4930 1/15/2049 98.9116 279,714.10 279,713.84 279,713.84 276,669.72CNH EQUIPMENT 2.17% 04/23 12637BAE1 2.1700 4/17/2023 98.3984 205,000.00 204,983.83 204,989.46 201,716.70CSAIL 3.8184% 04/51 12652UAR0 3.8184 4/15/2051 102.4725 649,000.00 668,469.35 667,979.91 665,046.20CARMAX AUTO 3.13% 06/23 14313FAD1 3.1300 6/15/2023 100.5353 630,000.00 629,914.13 629,924.03 633,372.26CARMAX AUTO 1.6% 01/22 14314EAD3 1.6000 1/18/2022 98.1614 875,000.00 855,312.50 857,174.05 858,912.43CARMAX AUTO 2.22% 11/22 14314WAE1 2.2200 11/15/2022 98.4603 345,000.00 344,893.19 344,923.93 339,687.90CARMAX AUTO 3.36% 09/23 14315EAC4 3.3600 9/15/2023 101.0097 400,000.00 399,996.32 399,996.32 404,038.80CARMAX AUTO 3.05% 03/24 14315NAC4 3.0500 3/15/2024 100.2414 875,000.00 874,901.04 874,901.84 877,111.81CITIGROUP 1.506% 05/49 17290YAN8 1.5060 5/10/2049 98.4228 348,338.20 348,335.62 348,335.62 342,844.38DISCOVER CARD 1.9% 10/22 254683BP9 1.9000 10/17/2022 98.9622 450,000.00 442,040.99 443,128.11 445,329.99DISCOVER CARD 1.85% 10/23 254683BU8 1.8500 10/16/2023 98.0706 1,000,000.00 970,146.70 973,453.00 980,706.30DRIVE AUTO 3.34% 10/22 26208MAD8 3.3400 10/15/2022 100.4242 860,000.00 859,914.26 859,918.94 863,647.95DRIVE AUTO 3.18% 10/22 26208NAD6 3.1800 10/17/2022 100.0811 645,000.00 644,977.04 644,977.38 645,522.97DRIVE AUTO 3.04% 11/21 26209BAD1 3.0400 11/15/2021 99.9348 250,000.00 249,976.95 249,979.81 249,837.00FNMA REMICS 7% 07/42 3136ABDT7 7.0000 7/25/2042 114.6182 35,058.00 39,725.09 39,615.38 40,182.86FNMA REMICS 3% 01/46 3136ASMM5 3.0000 1/25/2046 99.4977 126,458.82 123,099.76 123,121.40 125,823.66FNMA REMICS 3.5% 07/44 3136AWCM7 3.5000 7/25/2044 101.4972 504,053.71 501,769.72 501,787.02 511,600.65
Page 8 of 10

Account: 3015465000 VA GENERAL/WELLINGTON Created: 6-Feb-2019 02:10:27 AM [CST]
Audited Market Value - MonthlyAs of Jan 31, 2019
Description Security Coupon Rate Maturity Date Price (Base) Shares/Par Cost (Base) Amortized Cost Traded Market Value
FNMA REMICS 3% 05/47 3136AWTK3 3.0000 5/25/2047 99.5198 270,830.08 258,811.76 258,936.02 269,529.55FNMA REMICS 3.5% 05/42 3136A6AN4 3.5000 5/25/2042 102.3688 145,006.81 146,881.70 146,821.81 148,441.66FNMA REMICS 2.5% 12/41 3136A6Y57 2.5000 12/25/2041 98.3107 416,634.29 404,200.35 404,632.65 409,596.09FANNIE 1.80057% 12/19 3136A7MK5 1.8006 12/25/2019 99.4305 89,981.71 89,395.92 89,621.84 89,469.27FNMA REMICS 7% 10/42 3136A9EA2 7.0000 10/25/2042 116.1204 12,965.78 14,815.10 14,772.02 15,055.92FNMA REMICS 3% 12/54 3136B0AP1 3.0000 12/25/2054 99.4425 492,890.35 483,263.58 483,396.77 490,142.44FNMA REMICS 3.5% 03/45 3136B1R48 3.5000 3/25/2045 101.5283 361,473.96 362,264.69 362,243.28 366,998.22FNMA REMICS 3.5% 07/54 3136B27F3 3.5000 7/25/2054 101.3173 647,204.35 634,524.69 634,625.75 655,729.78FNMA REMICS 3.5% 12/47 3136B3BA7 3.5000 12/25/2047 101.4623 520,650.41 515,382.89 515,446.44 528,263.62FNMA REMICS 3.5% 10/56 3136B3BD1 3.5000 10/25/2056 101.7777 483,956.66 481,990.59 482,007.61 492,559.72FNMA REMICS 3.5% 02/48 3136B3JN1 3.5000 2/25/2048 101.5052 224,201.75 223,220.87 223,233.09 227,576.43FREDDIE MAC 2.086% 03/19 3137AQVW5 2.0860 3/25/2019 99.7569 497,570.71 495,722.61 497,197.09 496,361.31FIRST NATIONAL FLT 10/24 32113CBS8 2.9689 10/15/2024 99.6630 510,000.00 510,000.00 510,000.00 508,281.15FORD CREDIT 2.07% 05/22 34528QFJ8 2.0700 5/15/2022 98.9405 790,000.00 789,864.36 789,910.07 781,629.79GS MORTGAGE 1.935% 11/48 36252AAA4 1.9350 11/10/2048 99.0579 371,231.89 370,476.08 370,544.30 367,734.51GS MORTGAGE 3.218% 03/50 36252HAB7 3.2180 3/10/2050 100.2658 756,000.00 778,654.22 777,345.74 758,009.22GS MORTGAGE 3.801% 01/47 36252RAJ8 3.8010 1/10/2047 102.2612 483,375.78 491,098.46 490,989.61 494,305.97GS MORTGAGE 1.478% 05/49 36252TAN5 1.4780 5/10/2049 98.3396 364,443.70 364,440.47 364,440.47 358,392.48GM FINANCIAL 3.46% 11/23 36256XAD4 3.4600 11/16/2023 100.3346 480,000.00 479,946.86 479,947.58 481,605.89GM FINANCIAL 2.18% 06/21 38013MAE6 2.1800 6/21/2021 99.2411 160,000.00 159,967.52 159,979.60 158,785.76GNMA 2005-74 7.5% 09/35 38374L5X5 7.5000 9/16/2035 107.2476 4,899.83 5,221.41 5,081.28 5,254.95GNMA 2013-37 LG 2% 01/42 38378JNS7 2.0000 1/20/2042 95.4627 507,581.63 473,637.12 474,131.34 484,551.23HONDA AUTO 3.16% 01/23 43815AAC6 3.1600 1/17/2023 100.5636 825,000.00 824,876.66 824,882.50 829,650.03HYUNDAI AUTO 3.2% 12/22 44933AAC1 3.2000 12/15/2022 100.6528 320,000.00 319,996.16 319,996.16 322,088.80JP MORGAN 1.949% 01/49 46590KAA2 1.9490 1/15/2049 99.0443 270,501.01 270,500.80 270,500.80 267,915.75JP MORGAN 4.1712% 08/46 46636VAC0 4.1712 8/15/2046 102.1179 64,272.69 68,701.47 68,407.50 65,633.93JPMCC 3.2397% 03/50 46647TAP3 3.2397 3/15/2050 100.2942 756,000.00 778,678.49 777,370.01 758,223.85MERCEDES-BENZ 3.21% 09/21 58769LAC6 3.2100 9/15/2021 100.4682 850,000.00 849,980.96 849,982.52 853,979.36MERCEDES-BENZ 3.1% 11/21 58772TAC4 3.1000 11/15/2021 100.1704 355,000.00 354,989.60 354,989.69 355,604.78MORGAN 3.089% 06/50 61691JAR5 3.0890 6/15/2050 100.6544 767,000.00 790,005.78 788,825.58 772,019.25MORGAN 1.531% 01/49 61766LBN8 1.5310 1/15/2049 98.7034 288,255.93 288,253.58 288,253.58 284,518.26NELNET STUDENT FLT 08/27 64031QCS8 2.7631 8/23/2027 99.8105 759,593.32 758,681.29 758,739.28 758,153.74NELNET STUDENT FLT 01/30 640315AE7 2.8706 1/25/2030 99.9522 199,563.68 199,387.69 199,396.74 199,468.29NISSAN AUTO 3.25% 09/21 65478BAD3 3.2500 9/15/2021 100.1951 360,000.00 359,968.54 359,971.78 360,702.18NISSAN AUTO 3.22% 06/23 65478NAD7 3.2200 6/15/2023 100.7456 790,000.00 789,848.64 789,853.95 795,890.56SANTANDER 3.03% 02/22 80285GAD4 3.0300 2/15/2022 100.0519 200,000.00 199,995.02 199,995.02 200,103.78SANTANDER 3.19% 03/22 80286AAD6 3.1900 3/15/2022 100.3167 380,000.00 379,950.75 379,955.07 381,203.35SOUTH CAROLINA FLT 05/30 83715RAE2 3.2699 5/1/2030 100.3078 375,662.64 377,357.75 377,274.71 376,819.04SYNCHRONY 1.93% 06/23 87165LBP5 1.9300 6/15/2023 98.7467 304,000.00 303,560.63 303,673.43 300,189.85TOYOTA AUTO 3.3% 02/24 89231PAE8 3.3000 2/15/2024 101.4589 325,000.00 324,933.83 324,936.65 329,741.43UBS COMMERCIAL 3.4% 05/45 90269GAC5 3.4000 5/10/2045 100.7718 175,072.58 183,060.27 182,493.67 176,423.76UBS-BARCLAY 3.1847% 03/46 90270YBF5 3.1847 3/10/2046 100.2506 1,000,000.00 992,617.19 992,724.50 1,002,506.40UBS 2.982% 06/50 90276EAB3 2.9820 6/15/2050 99.1353 760,000.00 782,768.99 781,616.09 753,428.28UBS 4.2569% 12/51 90278KAX9 4.2569 12/15/2051 104.4777 1,160,000.00 1,194,796.06 1,194,608.86 1,211,940.86UBS 4.2076% 10/51 90353KAV1 4.2076 10/15/2051 105.1063 615,000.00 633,447.29 633,243.80 646,403.75VOLKSWAGEN 3.15% 07/24 92868LAE1 3.1500 7/22/2024 100.8772 335,000.00 334,996.28 334,996.28 337,938.59VOLKSWAGEN 3.25% 04/23 92869BAD4 3.2500 4/20/2023 100.9040 670,000.00 669,971.86 669,973.42 676,056.60WFRBS 3.66% 03/47 92938VAN5 3.6600 3/15/2047 100.9634 750,000.00 786,093.75 783,669.83 757,225.43
Page 9 of 10
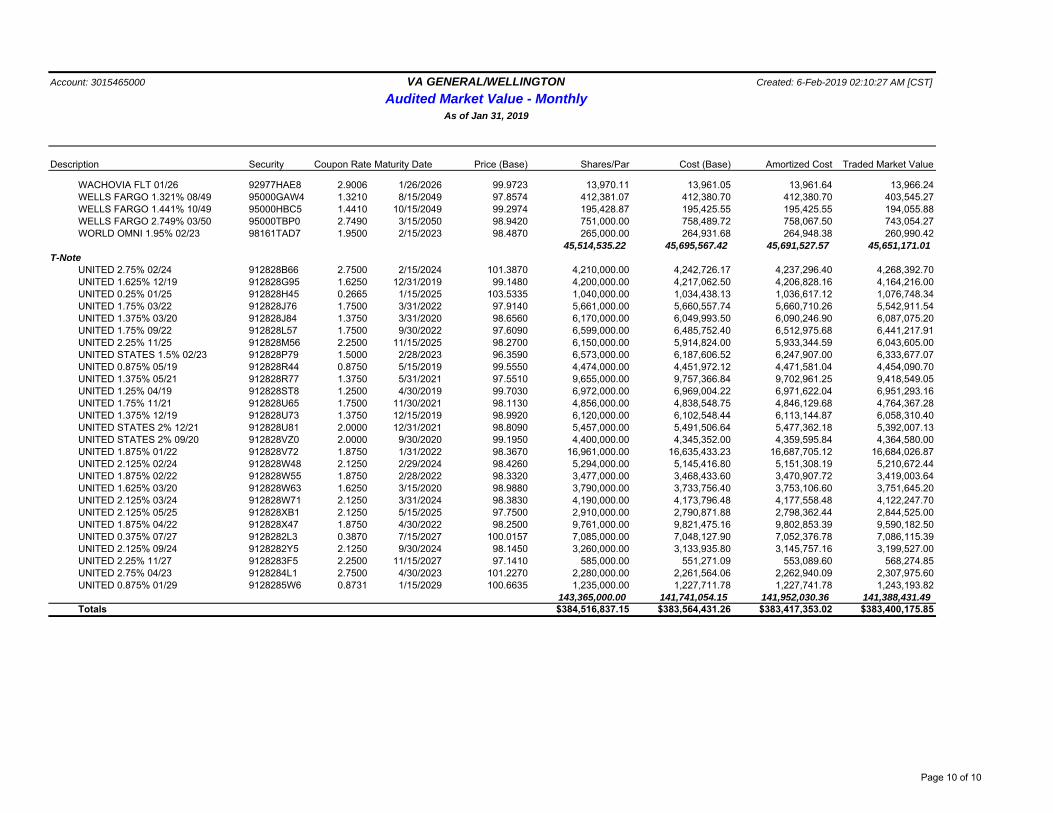
Account: 3015465000 VA GENERAL/WELLINGTON Created: 6-Feb-2019 02:10:27 AM [CST]
Audited Market Value - MonthlyAs of Jan 31, 2019
Description Security Coupon Rate Maturity Date Price (Base) Shares/Par Cost (Base) Amortized Cost Traded Market Value
WACHOVIA FLT 01/26 92977HAE8 2.9006 1/26/2026 99.9723 13,970.11 13,961.05 13,961.64 13,966.24WELLS FARGO 1.321% 08/49 95000GAW4 1.3210 8/15/2049 97.8574 412,381.07 412,380.70 412,380.70 403,545.27WELLS FARGO 1.441% 10/49 95000HBC5 1.4410 10/15/2049 99.2974 195,428.87 195,425.55 195,425.55 194,055.88WELLS FARGO 2.749% 03/50 95000TBP0 2.7490 3/15/2050 98.9420 751,000.00 758,489.72 758,067.50 743,054.27WORLD OMNI 1.95% 02/23 98161TAD7 1.9500 2/15/2023 98.4870 265,000.00 264,931.68 264,948.38 260,990.42
45,514,535.22 45,695,567.42 45,691,527.57 45,651,171.01 T-Note
UNITED 2.75% 02/24 912828B66 2.7500 2/15/2024 101.3870 4,210,000.00 4,242,726.17 4,237,296.40 4,268,392.70UNITED 1.625% 12/19 912828G95 1.6250 12/31/2019 99.1480 4,200,000.00 4,217,062.50 4,206,828.16 4,164,216.00UNITED 0.25% 01/25 912828H45 0.2665 1/15/2025 103.5335 1,040,000.00 1,034,438.13 1,036,617.12 1,076,748.34UNITED 1.75% 03/22 912828J76 1.7500 3/31/2022 97.9140 5,661,000.00 5,660,557.74 5,660,710.26 5,542,911.54UNITED 1.375% 03/20 912828J84 1.3750 3/31/2020 98.6560 6,170,000.00 6,049,993.50 6,090,246.90 6,087,075.20UNITED 1.75% 09/22 912828L57 1.7500 9/30/2022 97.6090 6,599,000.00 6,485,752.40 6,512,975.68 6,441,217.91UNITED 2.25% 11/25 912828M56 2.2500 11/15/2025 98.2700 6,150,000.00 5,914,824.00 5,933,344.59 6,043,605.00UNITED STATES 1.5% 02/23 912828P79 1.5000 2/28/2023 96.3590 6,573,000.00 6,187,606.52 6,247,907.00 6,333,677.07UNITED 0.875% 05/19 912828R44 0.8750 5/15/2019 99.5550 4,474,000.00 4,451,972.12 4,471,581.04 4,454,090.70UNITED 1.375% 05/21 912828R77 1.3750 5/31/2021 97.5510 9,655,000.00 9,757,366.84 9,702,961.25 9,418,549.05UNITED 1.25% 04/19 912828ST8 1.2500 4/30/2019 99.7030 6,972,000.00 6,969,004.22 6,971,622.04 6,951,293.16UNITED 1.75% 11/21 912828U65 1.7500 11/30/2021 98.1130 4,856,000.00 4,838,548.75 4,846,129.68 4,764,367.28UNITED 1.375% 12/19 912828U73 1.3750 12/15/2019 98.9920 6,120,000.00 6,102,548.44 6,113,144.87 6,058,310.40UNITED STATES 2% 12/21 912828U81 2.0000 12/31/2021 98.8090 5,457,000.00 5,491,506.64 5,477,362.18 5,392,007.13UNITED STATES 2% 09/20 912828VZ0 2.0000 9/30/2020 99.1950 4,400,000.00 4,345,352.00 4,359,595.84 4,364,580.00UNITED 1.875% 01/22 912828V72 1.8750 1/31/2022 98.3670 16,961,000.00 16,635,433.23 16,687,705.12 16,684,026.87UNITED 2.125% 02/24 912828W48 2.1250 2/29/2024 98.4260 5,294,000.00 5,145,416.80 5,151,308.19 5,210,672.44UNITED 1.875% 02/22 912828W55 1.8750 2/28/2022 98.3320 3,477,000.00 3,468,433.60 3,470,907.72 3,419,003.64UNITED 1.625% 03/20 912828W63 1.6250 3/15/2020 98.9880 3,790,000.00 3,733,756.40 3,753,106.60 3,751,645.20UNITED 2.125% 03/24 912828W71 2.1250 3/31/2024 98.3830 4,190,000.00 4,173,796.48 4,177,558.48 4,122,247.70UNITED 2.125% 05/25 912828XB1 2.1250 5/15/2025 97.7500 2,910,000.00 2,790,871.88 2,798,362.44 2,844,525.00UNITED 1.875% 04/22 912828X47 1.8750 4/30/2022 98.2500 9,761,000.00 9,821,475.16 9,802,853.39 9,590,182.50UNITED 0.375% 07/27 9128282L3 0.3870 7/15/2027 100.0157 7,085,000.00 7,048,127.90 7,052,376.78 7,086,115.39UNITED 2.125% 09/24 9128282Y5 2.1250 9/30/2024 98.1450 3,260,000.00 3,133,935.80 3,145,757.16 3,199,527.00UNITED 2.25% 11/27 9128283F5 2.2500 11/15/2027 97.1410 585,000.00 551,271.09 553,089.60 568,274.85UNITED 2.75% 04/23 9128284L1 2.7500 4/30/2023 101.2270 2,280,000.00 2,261,564.06 2,262,940.09 2,307,975.60UNITED 0.875% 01/29 9128285W6 0.8731 1/15/2029 100.6635 1,235,000.00 1,227,711.78 1,227,741.78 1,243,193.82
143,365,000.00 141,741,054.15 141,952,030.36 141,388,431.49 Totals $384,516,837.15 $383,564,431.26 $383,417,353.02 $383,400,175.85
Page 10 of 10

Account: 3015465200 VA GENERAL/INCOM RES& MGT Created: 6-Feb-2019 02:10:26 AM [CST]
Audited Market Value - MonthlyAs of Jan 31, 2019
Description Security Coupon Rate Maturity Date Price (Base) Shares/Par Cost (Base) Amortized Cost Traded Market Value
Corporate BondAT&T INC 3.4% 05/25 00206RCN0 3.4000 5/15/2025 97.8230 1,491,000.00 1,482,139.14 1,484,110.38 1,458,540.93AT&T INC 3.6% 02/23 00206RCS9 3.6000 2/17/2023 100.7730 76,000.00 74,875.96 75,017.80 76,587.48AT&T INC 4.125% 02/26 00206RCT7 4.1250 2/17/2026 100.9150 200,000.00 195,484.00 195,830.68 201,830.00AT&T INC NOTES FLT 07/21 00206RDV1 3.7373 7/15/2021 100.4925 400,000.00 403,808.00 403,808.00 401,970.00AT&T INC NOTES FLT 06/24 00206RGD8 3.9559 6/12/2024 99.0070 2,250,000.00 2,250,000.00 2,250,000.00 2,227,657.50COMCAST 9.455% 11/22 00209TAB1 9.4550 11/15/2022 122.5820 2,640,000.00 3,704,848.80 3,704,848.80 3,236,164.80CHUBB INA 2.3% 11/20 00440EAT4 2.3000 11/3/2020 99.1560 2,492,000.00 2,491,919.40 2,492,115.72 2,470,967.52AMAZON.COM 5.2% 12/25 023135BN5 5.2000 12/3/2025 112.6010 1,075,000.00 1,181,769.00 1,181,769.00 1,210,460.75AMERICAN 2.7% 03/22 0258M0EG0 2.7000 3/3/2022 99.6470 280,000.00 273,361.20 274,420.67 279,011.60AMERICAN 3.3% 05/27 0258M0EL9 3.3000 5/3/2027 99.7730 1,155,000.00 1,140,839.70 1,143,335.85 1,152,378.15AMERICAN 2.2% 10/20 025816BP3 2.2000 10/30/2020 98.8120 1,100,000.00 1,098,570.00 1,099,175.08 1,086,932.00AMERISOURCEBE 3.25% 03/25 03073EAM7 3.2500 3/1/2025 96.0050 300,000.00 284,559.00 285,915.76 288,015.00ANHEUSER-BUSC 2.65% 02/21 035242AJ5 2.6500 2/1/2021 99.2193 880,000.00 867,873.60 870,607.92 873,129.40ANHEUSER-BUSC 3.65% 02/26 035242AP1 3.6500 2/1/2026 98.2500 4,136,000.00 4,149,924.02 4,150,471.72 4,063,620.00APPLE INC 2.85% 05/24 037833CU2 2.8500 5/11/2024 99.5980 1,060,000.00 1,058,993.00 1,059,241.82 1,055,738.80ARCH 4.011% 12/26 03939CAA1 4.0110 12/15/2026 101.7860 400,000.00 395,196.00 395,529.84 407,144.00ARIZONA 2.95% 09/27 040555CW2 2.9500 9/15/2027 95.7069 450,000.00 423,376.11 425,070.99 430,680.92AUTOMATIC 3.375% 09/25 053015AE3 3.3750 9/15/2025 102.3572 100,000.00 98,965.00 99,048.46 102,357.20AVALONBAY 2.9% 10/26 05348EAY5 2.9000 10/15/2026 95.1700 1,110,000.00 1,106,547.90 1,107,354.42 1,056,387.00BB&T CORP 2.05% 05/21 05531FAV5 2.0500 5/10/2021 98.1000 1,897,000.00 1,895,027.12 1,896,108.83 1,860,957.00BANK OF VAR 01/23 06050TMJ8 3.3350 1/25/2023 100.6968 1,290,000.00 1,290,000.00 1,290,000.00 1,298,988.59BANK OF AMERICA 4% 04/24 06051GFF1 4.0000 4/1/2024 102.9043 800,000.00 807,008.00 807,008.00 823,234.16BANK OF 4.45% 03/26 06051GFU8 4.4500 3/3/2026 102.5500 1,155,000.00 1,155,464.00 1,155,464.00 1,184,452.50BANK OF 3.248% 10/27 06051GGA1 3.2480 10/21/2027 95.7278 325,000.00 302,890.25 304,283.39 311,115.22BANK OF NEW 3.55% 09/21 06406HBY4 3.5500 9/23/2021 101.8380 700,000.00 733,019.00 733,019.00 712,866.00BANK OF NEW 2.95% 01/23 06406RAE7 2.9500 1/29/2023 99.8760 1,275,000.00 1,273,062.00 1,273,459.50 1,273,419.00BRANCH 3.625% 09/25 07330MAB3 3.6250 9/16/2025 100.1680 250,000.00 245,967.50 246,294.92 250,420.00BERKSHIRE 2.75% 03/23 084670BR8 2.7500 3/15/2023 99.3330 2,018,000.00 2,032,152.16 2,032,152.16 2,004,539.94BOEING 3.25% 03/28 097023BX2 3.2500 3/1/2028 99.6760 250,000.00 244,223.90 244,574.86 249,189.98BOSTON 4.5% 12/28 10112RBA1 4.5000 12/1/2028 103.3360 1,600,000.00 1,594,256.00 1,594,380.80 1,653,376.00CAPITAL ONE 3.9% 01/24 14040HCA1 3.9000 1/29/2024 100.7874 1,500,000.00 1,496,760.00 1,496,774.16 1,511,811.15CAPITAL ONE 2.65% 08/22 14042RHC8 2.6500 8/8/2022 97.0948 430,000.00 413,004.55 415,433.02 417,507.81CHEVRON 2.355% 12/22 166764AB6 2.3550 12/5/2022 98.5410 575,000.00 549,717.25 549,717.25 566,610.75CISCO 4.95% 02/19 17275RAE2 4.9500 2/15/2019 100.0560 1,025,000.00 1,039,688.25 1,039,688.25 1,025,574.00CISCO 1.85% 09/21 17275RBJ0 1.8500 9/20/2021 97.8330 2,072,000.00 2,071,709.92 2,071,849.28 2,027,099.76CITIGROUP INC 3.4% 05/26 172967KN0 3.4000 5/1/2026 97.3230 1,469,000.00 1,466,049.42 1,466,868.33 1,429,674.87CITIGROUP 4.125% 07/28 172967KU4 4.1250 7/25/2028 99.1500 425,000.00 406,890.75 407,945.77 421,387.50CITIBANK NA 2% 03/19 17325FAA6 2.0000 3/20/2019 99.9100 742,000.00 741,391.56 741,961.22 741,332.20CITIBANK NA 3.05% 05/20 17325FAN8 3.0500 5/1/2020 100.1740 850,000.00 849,694.00 849,792.44 851,479.00CITIBANK NA 3.65% 01/24 17325FAS7 3.6500 1/23/2024 101.3545 1,089,000.00 1,087,518.96 1,087,532.73 1,103,750.83COLGATE-PALMO 1.95% 02/23 19416QEA4 1.9500 2/1/2023 96.3160 375,000.00 357,071.25 359,361.05 361,185.00CONNECTICUT 5.5% 02/19 207597EE1 5.5000 2/1/2019 100.0000 1,205,000.00 1,388,244.35 1,388,244.35 1,205,000.00DANAHER CORP 3.35% 09/25 235851AQ5 3.3500 9/15/2025 99.7530 175,000.00 171,913.00 172,163.38 174,567.75
Page 1 of 7

Account: 3015465200 VA GENERAL/INCOM RES& MGT Created: 6-Feb-2019 02:10:26 AM [CST]
Audited Market Value - MonthlyAs of Jan 31, 2019
Description Security Coupon Rate Maturity Date Price (Base) Shares/Par Cost (Base) Amortized Cost Traded Market Value
JOHN DEERE 2.375% 07/20 24422ESY6 2.3750 7/14/2020 99.5150 2,104,000.00 2,102,232.64 2,103,489.51 2,093,795.60DEVON ENERGY 4% 07/21 25179MAK9 4.0000 7/15/2021 100.8320 400,000.00 405,052.00 405,052.00 403,328.00DIAGEO 2.875% 05/22 25245BAB3 2.8750 5/11/2022 99.8350 700,000.00 689,591.00 691,172.46 698,845.00WALT DISNEY 2.55% 02/22 25468PCT1 2.5500 2/15/2022 99.0800 275,000.00 268,262.50 269,351.76 272,470.00DUKE ENERGY 3.9% 06/21 26442CAK0 3.9000 6/15/2021 102.2140 2,500,000.00 2,676,050.00 2,676,050.00 2,555,350.00ERP 4.625% 12/21 26884AAZ6 4.6250 12/15/2021 103.9130 224,000.00 232,187.20 232,187.20 232,765.12ECOLAB INC 2.7% 11/26 278865AV2 2.7000 11/1/2026 94.5362 175,000.00 161,731.50 162,664.54 165,438.40ENTERPRISE 2.85% 04/21 29379VBK8 2.8500 4/15/2021 99.7630 175,000.00 172,824.75 173,282.71 174,585.25FEDERAL 2.55% 01/21 313747AW7 2.5500 1/15/2021 98.6330 150,000.00 147,355.50 147,965.40 147,949.50FIFTH THIRD 2.2% 10/20 31677QBK4 2.2000 10/30/2020 98.5579 1,390,000.00 1,389,471.80 1,389,694.52 1,369,954.67WACHOVIA CORP STEP 08/26 337358BH7 7.5740 8/1/2026 120.2090 190,000.00 212,105.70 212,105.70 228,397.10GENERAL 2.875% 05/20 369550BA5 2.8750 5/11/2020 100.1920 275,000.00 274,670.00 274,774.47 275,528.00GILEAD 2.35% 02/20 375558AY9 2.3500 2/1/2020 99.5030 1,108,000.00 1,105,473.76 1,107,516.38 1,102,493.24GILEAD 3.65% 03/26 375558BF9 3.6500 3/1/2026 100.2413 400,000.00 394,916.00 395,305.48 400,965.16GOLDMAN 5.75% 01/22 38141GGS7 5.7500 1/24/2022 107.3040 1,217,000.00 1,418,816.75 1,418,816.75 1,305,889.68GOLDMAN SACHS 3% 04/22 38141GWC4 3.0000 4/26/2022 98.9143 1,552,000.00 1,547,514.72 1,549,209.30 1,535,149.16HCP INC 4.25% 11/23 40414LAJ8 4.2500 11/15/2023 101.4990 1,058,000.00 1,083,180.40 1,083,180.40 1,073,859.42HEALTHCARE 3.375% 07/21 42225UAC8 3.3750 7/15/2021 99.5850 125,000.00 124,585.00 124,664.37 124,481.25HUNTINGTON 3.25% 05/21 44644AAD9 3.2500 5/14/2021 100.3534 1,985,000.00 1,980,513.90 1,981,608.73 1,992,015.39HUNTINGTON 3.55% 10/23 44644AAE7 3.5500 10/6/2023 100.4808 1,495,000.00 1,491,711.00 1,492,006.75 1,502,188.11INTEL CORP 3.1% 07/22 458140AR1 3.1000 7/29/2022 101.3490 1,130,000.00 1,129,502.80 1,129,751.57 1,145,243.70INTERCONTINEN 2.35% 09/22 45866FAE4 2.3500 9/15/2022 97.5566 1,476,000.00 1,472,619.96 1,473,600.57 1,439,935.71JPMORGAN 4.4% 07/20 46625HHS2 4.4000 7/22/2020 102.0260 224,000.00 229,452.16 229,452.16 228,538.24JPMORGAN 4.5% 01/22 46625HJD3 4.5000 1/24/2022 104.1900 4,080,000.00 4,347,956.50 4,347,956.50 4,250,952.00JPMORGAN 3.625% 05/24 46625HJX9 3.6250 5/13/2024 101.3340 225,000.00 223,497.00 223,646.80 228,001.50JPMORGAN 3.625% 12/27 46625HRX0 3.6250 12/1/2027 95.9422 175,000.00 164,533.25 165,183.81 167,898.92JPMORGAN CHASE VAR 04/24 46647PAP1 3.5590 4/23/2024 100.5459 925,000.00 915,951.47 916,863.11 930,049.95JPMORGAN 2.972% 01/23 48128BAB7 2.9720 1/15/2023 99.2200 300,000.00 292,188.00 293,195.94 297,660.00KANSAS CITY 7.15% 04/19 485134BL3 7.1500 4/1/2019 100.6750 1,240,000.00 1,286,188.71 1,286,672.01 1,248,370.00KILROY 4.375% 10/25 49427RAL6 4.3750 10/1/2025 101.0300 250,000.00 250,347.50 250,347.50 252,575.00KIMCO REALTY 3.2% 05/21 49446RAL3 3.2000 5/1/2021 99.4860 400,000.00 397,584.00 398,084.76 397,944.00KROGER CO/THE 4% 02/24 501044CY5 4.0000 2/1/2024 101.3700 2,200,000.00 2,224,596.00 2,224,596.00 2,230,140.00MANUFACTURERS 2.05% 08/20 55279HAN0 2.0500 8/17/2020 98.5540 1,179,000.00 1,178,009.64 1,178,492.04 1,161,951.66MANUFACTURER 2.625% 01/21 55279HAR1 2.6250 1/25/2021 99.2730 935,000.00 933,737.75 934,169.00 928,202.55MAGELLAN 5% 03/26 559080AK2 5.0000 3/1/2026 106.1880 375,000.00 394,935.00 394,935.00 398,205.00MARSH & 3.875% 03/24 571748BF8 3.8750 3/15/2024 102.0630 1,416,000.00 1,415,221.20 1,415,231.04 1,445,212.08MCKESSON 2.85% 03/23 58155QAG8 2.8500 3/15/2023 96.9200 200,000.00 191,284.00 192,371.12 193,840.00METLIFE INC 3% 03/25 59156RBM9 3.0000 3/1/2025 98.0070 1,200,000.00 1,151,604.00 1,169,592.10 1,176,084.00MICROSOFT 3.3% 02/27 594918BY9 3.3000 2/6/2027 101.1559 2,074,000.00 2,058,104.05 2,059,818.68 2,097,973.16MORGAN STANLEY VAR 04/24 61744YAQ1 3.7370 4/24/2024 101.1370 225,000.00 223,650.00 223,786.96 227,558.25MORGAN STANLEY 4% 07/25 6174468C6 4.0000 7/23/2025 102.1582 25,000.00 24,924.00 24,930.42 25,539.55MORGAN 3.75% 02/23 61746BDJ2 3.7500 2/25/2023 101.6310 2,519,000.00 2,582,398.50 2,582,398.50 2,560,084.89MORGAN 3.875% 01/26 61746BDZ6 3.8750 1/27/2026 100.5300 975,000.00 1,007,210.07 1,007,210.07 980,167.50MORGAN STANLEY FLT 10/23 61746BEC6 4.1793 10/24/2023 101.2780 200,000.00 204,576.00 204,576.00 202,556.00
Page 2 of 7

Account: 3015465200 VA GENERAL/INCOM RES& MGT Created: 6-Feb-2019 02:10:26 AM [CST]
Audited Market Value - MonthlyAs of Jan 31, 2019
Description Security Coupon Rate Maturity Date Price (Base) Shares/Par Cost (Base) Amortized Cost Traded Market Value
MORGAN 3.625% 01/27 61746BEF9 3.6250 1/20/2027 98.3179 200,000.00 191,817.50 192,378.18 196,635.80MORGAN 5.5% 07/21 61747WAL3 5.5000 7/28/2021 105.7000 1,125,000.00 1,190,452.50 1,190,452.50 1,189,125.00MORGAN 2.65% 01/20 61747YDW2 2.6500 1/27/2020 99.6900 575,000.00 570,825.50 572,381.28 573,217.50MORGAN 3.7% 10/24 61761JVL0 3.7000 10/23/2024 100.7410 250,000.00 246,812.50 247,107.82 251,852.50NATIONAL 3.6% 12/26 637417AJ5 3.6000 12/15/2026 97.0210 175,000.00 165,662.00 166,308.28 169,786.75NIKE INC 2.25% 05/23 654106AC7 2.2500 5/1/2023 97.5630 650,000.00 621,842.00 625,257.44 634,159.50NISOURCE INC 3.49% 05/27 65473QBE2 3.4900 5/15/2027 96.6724 600,000.00 573,726.00 575,461.54 580,034.46NORTHROP 3.25% 01/28 666807BN1 3.2500 1/15/2028 96.8094 725,000.00 681,442.80 684,117.80 701,867.86ORACLE CORP 2.5% 05/22 68389XBB0 2.5000 5/15/2022 98.8180 275,000.00 267,773.00 268,867.11 271,749.50ORACLE CORP 3.25% 11/27 68389XBN4 3.2500 11/15/2027 98.5620 450,000.00 430,281.00 431,513.64 443,529.00PNC FINANCIAL 3.5% 01/24 693475AV7 3.5000 1/23/2024 101.0161 1,422,000.00 1,418,772.06 1,418,798.46 1,436,448.94PNC BANK NA 1.45% 07/19 69353REX2 1.4500 7/29/2019 99.3990 1,198,000.00 1,196,322.80 1,197,728.55 1,190,800.02PEPSICO INC 2.75% 03/23 713448CG1 2.7500 3/1/2023 99.8850 675,000.00 659,562.75 661,502.22 674,223.75PROCTER & 2.3% 02/22 742718DY2 2.3000 2/6/2022 99.0700 575,000.00 560,354.75 562,738.71 569,652.50PRUDENTIAL 3.5% 05/24 74432QBZ7 3.5000 5/15/2024 101.2600 400,000.00 396,580.00 396,921.65 405,040.00PRUDENTIAL 3.878% 03/28 74432QCC7 3.8780 3/27/2028 102.0089 600,000.00 591,171.48 591,702.20 612,053.40PUBLIC 5.125% 06/19 744448CC3 5.1250 6/1/2019 100.7550 1,845,000.00 2,105,587.80 2,105,587.80 1,858,929.75PUBLIC 3.75% 03/24 74456QBD7 3.7500 3/15/2024 100.9100 1,041,000.00 1,116,144.72 1,116,144.72 1,050,473.10PUBLIC 3.7% 05/28 74456QBU9 3.7000 5/1/2028 101.9106 125,000.00 125,366.25 125,366.25 127,388.20REALTY 3.65% 01/28 756109AU8 3.6500 1/15/2028 97.8630 1,412,000.00 1,421,008.56 1,421,008.56 1,381,825.56CHARLES 3.2% 03/27 808513AQ8 3.2000 3/2/2027 97.4265 300,000.00 286,392.00 287,312.20 292,279.35SEMPRA ENERGY 9.8% 02/19 816851AK5 9.8000 2/15/2019 100.2150 1,323,000.00 1,756,803.65 1,756,803.65 1,325,844.45SEMPRA ENERGY FLT 01/21 816851BD0 3.2873 1/15/2021 98.7017 300,000.00 300,918.78 300,918.78 296,105.19SIMON 4.125% 12/21 828807CG0 4.1250 12/1/2021 102.6870 580,000.00 592,951.40 592,951.40 595,584.60SIMON 2.75% 02/23 828807CN5 2.7500 2/1/2023 98.0050 3,132,000.00 3,085,427.16 3,101,417.68 3,069,516.60SOUTHERN 3.25% 07/26 842587CV7 3.2500 7/1/2026 95.4974 350,000.00 328,534.50 330,107.40 334,240.87STATE STREET VAR 05/23 857477AZ6 2.6530 5/15/2023 98.5344 1,678,000.00 1,678,000.00 1,678,000.00 1,653,407.90SUNTRUST 2.75% 05/23 86787EAN7 2.7500 5/1/2023 97.4130 400,000.00 386,344.00 388,000.36 389,652.00SUNTRUST VAR 10/21 86787EBA4 3.5250 10/26/2021 100.2216 1,211,000.00 1,211,000.00 1,211,000.00 1,213,683.70TD 3.625% 04/25 87236YAD0 3.6250 4/1/2025 100.9560 300,000.00 296,841.00 297,114.92 302,868.00TD AMERITRADE 3.3% 04/27 87236YAF5 3.3000 4/1/2027 98.6672 1,067,000.00 1,064,780.64 1,065,175.92 1,052,779.34TANGER 3.125% 09/26 875484AJ6 3.1250 9/1/2026 91.0220 50,000.00 45,117.50 45,468.46 45,511.00TOYOTA MOTOR 1.9% 04/21 89236TCZ6 1.9000 4/8/2021 98.1850 720,000.00 718,668.00 719,421.36 706,932.00TOYOTA MOTOR 2.2% 01/20 89236TEJ0 2.2000 1/10/2020 99.4942 1,420,000.00 1,418,736.20 1,419,408.33 1,412,817.5021ST CENTURY 6.9% 03/19 90131HAN5 6.9000 3/1/2019 100.3080 852,000.00 1,029,280.48 1,029,280.48 854,624.16US BANCORP 2.95% 07/22 91159JAA4 2.9500 7/15/2022 99.6290 150,000.00 146,566.50 147,065.12 149,443.50UNITEDHEALTH 3.5% 06/23 91324PDJ8 3.5000 6/15/2023 102.2370 895,000.00 894,552.50 894,609.22 915,021.15UNITEDHEALTH 3.5% 02/24 91324PDM1 3.5000 2/15/2024 102.1970 2,200,000.00 2,194,522.00 2,194,667.00 2,248,334.44VENTAS 3.25% 10/26 92277GAJ6 3.2500 10/15/2026 94.0370 1,571,000.00 1,557,646.81 1,559,586.00 1,477,321.27VERIZON 3.5% 11/24 92343VCR3 3.5000 11/1/2024 100.9220 275,000.00 265,988.25 266,820.71 277,535.50VERIZON 2.625% 08/26 92343VDD3 2.6250 8/15/2026 93.4070 1,573,000.00 1,423,785.22 1,433,846.66 1,469,292.11WELLS FARGO & 4.6% 04/21 94974BEV8 4.6000 4/1/2021 103.1350 625,000.00 645,343.75 645,343.75 644,593.75WELLS FARGO & 3.5% 03/22 94974BFC9 3.5000 3/8/2022 101.1270 425,000.00 423,614.50 423,834.92 429,789.75WELLS FARGO & 3% 04/26 949746RW3 3.0000 4/22/2026 95.8470 1,291,000.00 1,286,571.87 1,287,808.49 1,237,384.77
Page 3 of 7

Account: 3015465200 VA GENERAL/INCOM RES& MGT Created: 6-Feb-2019 02:10:26 AM [CST]
Audited Market Value - MonthlyAs of Jan 31, 2019
Description Security Coupon Rate Maturity Date Price (Base) Shares/Par Cost (Base) Amortized Cost Traded Market Value
WELLS FARGO & 3% 10/26 949746SH5 3.0000 10/23/2026 95.5877 250,000.00 230,835.00 232,185.38 238,969.28WELLS FARGO 1.75% 05/19 94988J5D5 1.7500 5/24/2019 99.7080 1,103,000.00 1,102,525.71 1,102,951.28 1,099,779.24XCEL ENERGY 2.6% 03/22 98389BAT7 2.6000 3/15/2022 98.1310 1,740,000.00 1,739,530.20 1,739,721.19 1,707,479.40
126,632,000.00 129,116,874.29 129,240,875.06 127,168,827.68 FHLMC
FHLMCGLD 5% 11/35 3128DFAR9 5.0000 11/1/2035 106.5480 2,397,403.39 2,537,127.06 2,537,127.06 2,554,385.36FHLMC MORTPASS FLT 04/35 3128JR6Z4 4.1760 4/1/2035 105.6460 937,830.72 988,239.11 988,239.11 990,780.64FHLMCGLD 4.5% 11/39 3128MJMW7 4.5000 11/1/2039 105.1680 313,460.13 335,059.49 335,059.49 329,659.75FHLMCGLD 4% 07/37 3128M9Z96 4.0000 7/1/2037 102.7930 1,222,825.04 1,292,182.15 1,292,182.15 1,256,978.54FHLMCGLD 4.5% 06/38 3128M93E0 4.5000 6/1/2038 104.4400 1,058,846.43 1,142,396.02 1,142,396.02 1,105,859.21FHLMCGLD 6% 03/35 3132FCD69 6.0000 3/1/2035 110.7090 1,436,814.94 1,604,742.67 1,604,742.67 1,590,683.45FHLMCGLD 4% 01/42 3132GL7D0 4.0000 1/1/2042 100.0000 0.01 0.01 0.01 0.01FHLMCGLD 4.5% 05/42 31335A3M8 4.5000 5/1/2042 104.4290 3,181,225.39 3,421,059.97 3,421,059.97 3,322,121.86FHLMCGLD 6.5% 12/35 31335BVT0 6.5000 12/1/2035 109.0620 950,125.26 1,055,529.78 1,055,529.78 1,036,225.61FHLMC MORTPASS FLT 03/45 31347A2T0 2.6750 3/1/2045 102.1890 2,312,550.24 2,357,355.89 2,357,355.89 2,363,171.96
13,811,081.55 14,733,692.15 14,733,692.15 14,549,866.39 FNMA
FNMA MORTPASS 5% 10/33 31371LDG1 5.0000 10/1/2033 107.1030 1,580,264.73 1,691,624.02 1,691,624.02 1,692,510.93FNMA MORTPASS 5% 05/41 3138AFFM7 5.0000 5/1/2041 106.5910 584,525.59 648,458.07 648,458.07 623,051.67FNMA MORTPASS FLT 08/37 3138EHJB9 4.3450 8/1/2037 100.0000 0.02 0.02 0.02 0.02FNMA MORTPASS 5% 11/38 3138EHQQ8 5.0000 11/1/2038 106.9090 1,754,741.91 1,858,655.53 1,858,655.53 1,875,977.03FNMA MORTPASS 4% 10/41 3138EKY74 4.0000 10/1/2041 100.0000 0.04 0.04 0.04 0.04FNMA MORTPASS FLT 04/44 3138EMV40 2.9220 4/1/2044 100.8700 488,443.41 504,470.47 504,470.47 492,692.87FNMA MORTPASS 5% 05/42 3138ENNE5 5.0000 5/1/2042 106.6620 335,757.77 372,323.92 372,323.92 358,125.95FNMA MORTPASS 5% 01/42 3138ENTM1 5.0000 1/1/2042 106.5640 436,616.07 484,984.95 484,984.95 465,275.55FNMA MORTPASS 4.5% 06/42 3138EPAB0 4.5000 6/1/2042 104.9200 1,049,521.41 1,143,076.44 1,143,076.44 1,101,157.86FNMA MORTPASS 6.5% 12/36 3138EPA20 6.5000 12/1/2036 111.1870 2,424,763.51 2,705,126.81 2,705,126.81 2,696,021.80FNMA MORTPASS 4% 03/39 3138EPMM3 4.0000 3/1/2039 102.8740 1,408,936.08 1,503,598.97 1,503,598.97 1,449,428.90FNMA MORTPASS FLT 08/44 3138EQCF7 2.2130 8/1/2044 98.9290 1,754,655.14 1,798,521.53 1,798,521.53 1,735,862.78FNMA MORTPASS 5% 06/39 3138EQLB6 5.0000 6/1/2039 107.3790 2,336,073.00 2,563,914.82 2,563,914.82 2,508,451.83FNMA MORTPASS 5% 07/44 3138ERCJ7 5.0000 7/1/2044 106.5840 1,139,857.66 1,253,131.01 1,253,131.01 1,214,905.89FNMA MORTPASS 4.5% 11/45 3138ERMP2 4.5000 11/1/2045 100.0000 0.03 0.03 0.03 0.03FNMA MORTPASS 4.5% 08/38 3138ERZB9 4.5000 8/1/2038 104.4600 791,691.64 850,326.32 850,326.32 827,001.09FNMA MORTPASS FLT 07/43 3138WTQA7 2.2240 7/1/2043 98.9320 2,447,433.28 2,403,264.78 2,404,152.47 2,421,294.69FNMA MORTPASS FLT 06/44 3138XQGY1 2.7680 6/1/2044 100.3970 584,800.20 606,638.82 606,638.82 587,121.86FNMA MORTPASS 5% 04/33 31385XAH0 5.0000 4/1/2033 107.1130 1,859,233.37 1,968,463.33 1,968,463.33 1,991,480.64FNMA MORTPASS 4% 07/46 3140EVK30 4.0000 7/1/2046 100.0000 0.01 0.01 0.01 0.01FNMA MORTPASS 5.5% 03/41 3140FXDD1 5.5000 3/1/2041 109.9165 6,828,401.97 7,449,359.77 7,449,359.77 7,505,538.40FNMA MORTPASS FLT 11/45 3140J5F20 2.7940 11/1/2045 100.4000 973,237.75 982,818.07 982,818.07 977,130.70FNMA MORTPASS 4.5% 08/42 3140J5GR4 4.5000 8/1/2042 104.7300 1,136,972.01 1,218,514.22 1,218,514.22 1,190,750.79FNMA MORTPASS FLT 04/45 3140J7PW9 4.0220 4/1/2045 102.0170 720,867.85 736,298.92 736,298.92 735,407.75FNMA MORTPASS FLT 11/44 3140J8NT6 3.9990 11/1/2044 101.9340 1,793,397.72 1,838,232.67 1,838,232.67 1,828,082.03FNMA MORTPASS FLT 05/47 3140J9B83 2.5890 5/1/2047 99.3980 3,008,965.03 2,984,399.65 2,984,454.39 2,990,851.06FNMA MORTPASS 5% 11/33 31402CPL0 5.0000 11/1/2033 107.4290 1,532,363.33 1,667,825.15 1,667,825.15 1,646,202.60
Page 4 of 7
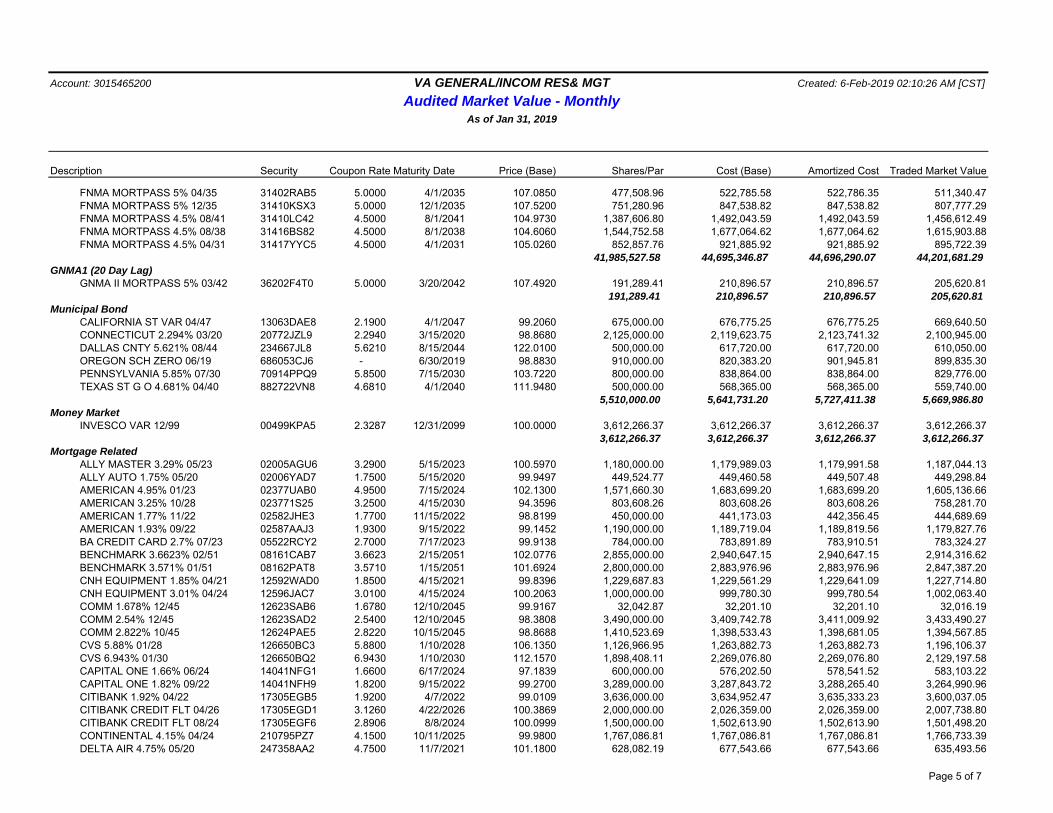
Account: 3015465200 VA GENERAL/INCOM RES& MGT Created: 6-Feb-2019 02:10:26 AM [CST]
Audited Market Value - MonthlyAs of Jan 31, 2019
Description Security Coupon Rate Maturity Date Price (Base) Shares/Par Cost (Base) Amortized Cost Traded Market Value
FNMA MORTPASS 5% 04/35 31402RAB5 5.0000 4/1/2035 107.0850 477,508.96 522,785.58 522,786.35 511,340.47FNMA MORTPASS 5% 12/35 31410KSX3 5.0000 12/1/2035 107.5200 751,280.96 847,538.82 847,538.82 807,777.29FNMA MORTPASS 4.5% 08/41 31410LC42 4.5000 8/1/2041 104.9730 1,387,606.80 1,492,043.59 1,492,043.59 1,456,612.49FNMA MORTPASS 4.5% 08/38 31416BS82 4.5000 8/1/2038 104.6060 1,544,752.58 1,677,064.62 1,677,064.62 1,615,903.88FNMA MORTPASS 4.5% 04/31 31417YYC5 4.5000 4/1/2031 105.0260 852,857.76 921,885.92 921,885.92 895,722.39
41,985,527.58 44,695,346.87 44,696,290.07 44,201,681.29 GNMA1 (20 Day Lag)
GNMA II MORTPASS 5% 03/42 36202F4T0 5.0000 3/20/2042 107.4920 191,289.41 210,896.57 210,896.57 205,620.81191,289.41 210,896.57 210,896.57 205,620.81
Municipal BondCALIFORNIA ST VAR 04/47 13063DAE8 2.1900 4/1/2047 99.2060 675,000.00 676,775.25 676,775.25 669,640.50CONNECTICUT 2.294% 03/20 20772JZL9 2.2940 3/15/2020 98.8680 2,125,000.00 2,119,623.75 2,123,741.32 2,100,945.00DALLAS CNTY 5.621% 08/44 234667JL8 5.6210 8/15/2044 122.0100 500,000.00 617,720.00 617,720.00 610,050.00OREGON SCH ZERO 06/19 686053CJ6 - 6/30/2019 98.8830 910,000.00 820,383.20 901,945.81 899,835.30PENNSYLVANIA 5.85% 07/30 70914PPQ9 5.8500 7/15/2030 103.7220 800,000.00 838,864.00 838,864.00 829,776.00TEXAS ST G O 4.681% 04/40 882722VN8 4.6810 4/1/2040 111.9480 500,000.00 568,365.00 568,365.00 559,740.00
5,510,000.00 5,641,731.20 5,727,411.38 5,669,986.80 Money Market
INVESCO VAR 12/99 00499KPA5 2.3287 12/31/2099 100.0000 3,612,266.37 3,612,266.37 3,612,266.37 3,612,266.373,612,266.37 3,612,266.37 3,612,266.37 3,612,266.37
Mortgage RelatedALLY MASTER 3.29% 05/23 02005AGU6 3.2900 5/15/2023 100.5970 1,180,000.00 1,179,989.03 1,179,991.58 1,187,044.13ALLY AUTO 1.75% 05/20 02006YAD7 1.7500 5/15/2020 99.9497 449,524.77 449,460.58 449,507.48 449,298.84AMERICAN 4.95% 01/23 02377UAB0 4.9500 7/15/2024 102.1300 1,571,660.30 1,683,699.20 1,683,699.20 1,605,136.66AMERICAN 3.25% 10/28 023771S25 3.2500 4/15/2030 94.3596 803,608.26 803,608.26 803,608.26 758,281.70AMERICAN 1.77% 11/22 02582JHE3 1.7700 11/15/2022 98.8199 450,000.00 441,173.03 442,356.45 444,689.69AMERICAN 1.93% 09/22 02587AAJ3 1.9300 9/15/2022 99.1452 1,190,000.00 1,189,719.04 1,189,819.56 1,179,827.76BA CREDIT CARD 2.7% 07/23 05522RCY2 2.7000 7/17/2023 99.9138 784,000.00 783,891.89 783,910.51 783,324.27BENCHMARK 3.6623% 02/51 08161CAB7 3.6623 2/15/2051 102.0776 2,855,000.00 2,940,647.15 2,940,647.15 2,914,316.62BENCHMARK 3.571% 01/51 08162PAT8 3.5710 1/15/2051 101.6924 2,800,000.00 2,883,976.96 2,883,976.96 2,847,387.20CNH EQUIPMENT 1.85% 04/21 12592WAD0 1.8500 4/15/2021 99.8396 1,229,687.83 1,229,561.29 1,229,641.09 1,227,714.80CNH EQUIPMENT 3.01% 04/24 12596JAC7 3.0100 4/15/2024 100.2063 1,000,000.00 999,780.30 999,780.54 1,002,063.40COMM 1.678% 12/45 12623SAB6 1.6780 12/10/2045 99.9167 32,042.87 32,201.10 32,201.10 32,016.19COMM 2.54% 12/45 12623SAD2 2.5400 12/10/2045 98.3808 3,490,000.00 3,409,742.78 3,411,009.92 3,433,490.27COMM 2.822% 10/45 12624PAE5 2.8220 10/15/2045 98.8688 1,410,523.69 1,398,533.43 1,398,681.05 1,394,567.85CVS 5.88% 01/28 126650BC3 5.8800 1/10/2028 106.1350 1,126,966.95 1,263,882.73 1,263,882.73 1,196,106.37CVS 6.943% 01/30 126650BQ2 6.9430 1/10/2030 112.1570 1,898,408.11 2,269,076.80 2,269,076.80 2,129,197.58CAPITAL ONE 1.66% 06/24 14041NFG1 1.6600 6/17/2024 97.1839 600,000.00 576,202.50 578,541.52 583,103.22CAPITAL ONE 1.82% 09/22 14041NFH9 1.8200 9/15/2022 99.2700 3,289,000.00 3,287,843.72 3,288,265.40 3,264,990.96CITIBANK 1.92% 04/22 17305EGB5 1.9200 4/7/2022 99.0109 3,636,000.00 3,634,952.47 3,635,333.23 3,600,037.05CITIBANK CREDIT FLT 04/26 17305EGD1 3.1260 4/22/2026 100.3869 2,000,000.00 2,026,359.00 2,026,359.00 2,007,738.80CITIBANK CREDIT FLT 08/24 17305EGF6 2.8906 8/8/2024 100.0999 1,500,000.00 1,502,613.90 1,502,613.90 1,501,498.20CONTINENTAL 4.15% 04/24 210795PZ7 4.1500 10/11/2025 99.9800 1,767,086.81 1,767,086.81 1,767,086.81 1,766,733.39DELTA AIR 4.75% 05/20 247358AA2 4.7500 11/7/2021 101.1800 628,082.19 677,543.66 677,543.66 635,493.56
Page 5 of 7
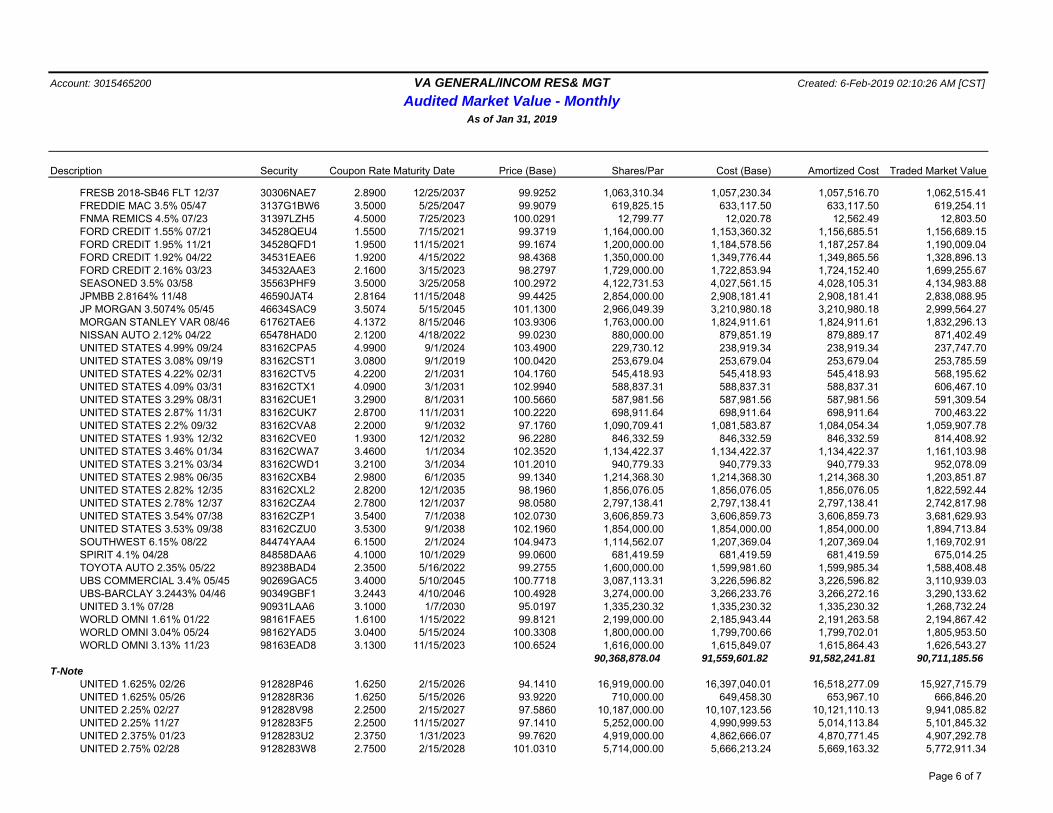
Account: 3015465200 VA GENERAL/INCOM RES& MGT Created: 6-Feb-2019 02:10:26 AM [CST]
Audited Market Value - MonthlyAs of Jan 31, 2019
Description Security Coupon Rate Maturity Date Price (Base) Shares/Par Cost (Base) Amortized Cost Traded Market Value
FRESB 2018-SB46 FLT 12/37 30306NAE7 2.8900 12/25/2037 99.9252 1,063,310.34 1,057,230.34 1,057,516.70 1,062,515.41FREDDIE MAC 3.5% 05/47 3137G1BW6 3.5000 5/25/2047 99.9079 619,825.15 633,117.50 633,117.50 619,254.11FNMA REMICS 4.5% 07/23 31397LZH5 4.5000 7/25/2023 100.0291 12,799.77 12,020.78 12,562.49 12,803.50FORD CREDIT 1.55% 07/21 34528QEU4 1.5500 7/15/2021 99.3719 1,164,000.00 1,153,360.32 1,156,685.51 1,156,689.15FORD CREDIT 1.95% 11/21 34528QFD1 1.9500 11/15/2021 99.1674 1,200,000.00 1,184,578.56 1,187,257.84 1,190,009.04FORD CREDIT 1.92% 04/22 34531EAE6 1.9200 4/15/2022 98.4368 1,350,000.00 1,349,776.44 1,349,865.56 1,328,896.13FORD CREDIT 2.16% 03/23 34532AAE3 2.1600 3/15/2023 98.2797 1,729,000.00 1,722,853.94 1,724,152.40 1,699,255.67SEASONED 3.5% 03/58 35563PHF9 3.5000 3/25/2058 100.2972 4,122,731.53 4,027,561.15 4,028,105.31 4,134,983.88JPMBB 2.8164% 11/48 46590JAT4 2.8164 11/15/2048 99.4425 2,854,000.00 2,908,181.41 2,908,181.41 2,838,088.95JP MORGAN 3.5074% 05/45 46634SAC9 3.5074 5/15/2045 101.1300 2,966,049.39 3,210,980.18 3,210,980.18 2,999,564.27MORGAN STANLEY VAR 08/46 61762TAE6 4.1372 8/15/2046 103.9306 1,763,000.00 1,824,911.61 1,824,911.61 1,832,296.13NISSAN AUTO 2.12% 04/22 65478HAD0 2.1200 4/18/2022 99.0230 880,000.00 879,851.19 879,889.17 871,402.49UNITED STATES 4.99% 09/24 83162CPA5 4.9900 9/1/2024 103.4900 229,730.12 238,919.34 238,919.34 237,747.70UNITED STATES 3.08% 09/19 83162CST1 3.0800 9/1/2019 100.0420 253,679.04 253,679.04 253,679.04 253,785.59UNITED STATES 4.22% 02/31 83162CTV5 4.2200 2/1/2031 104.1760 545,418.93 545,418.93 545,418.93 568,195.62UNITED STATES 4.09% 03/31 83162CTX1 4.0900 3/1/2031 102.9940 588,837.31 588,837.31 588,837.31 606,467.10UNITED STATES 3.29% 08/31 83162CUE1 3.2900 8/1/2031 100.5660 587,981.56 587,981.56 587,981.56 591,309.54UNITED STATES 2.87% 11/31 83162CUK7 2.8700 11/1/2031 100.2220 698,911.64 698,911.64 698,911.64 700,463.22UNITED STATES 2.2% 09/32 83162CVA8 2.2000 9/1/2032 97.1760 1,090,709.41 1,081,583.87 1,084,054.34 1,059,907.78UNITED STATES 1.93% 12/32 83162CVE0 1.9300 12/1/2032 96.2280 846,332.59 846,332.59 846,332.59 814,408.92UNITED STATES 3.46% 01/34 83162CWA7 3.4600 1/1/2034 102.3520 1,134,422.37 1,134,422.37 1,134,422.37 1,161,103.98UNITED STATES 3.21% 03/34 83162CWD1 3.2100 3/1/2034 101.2010 940,779.33 940,779.33 940,779.33 952,078.09UNITED STATES 2.98% 06/35 83162CXB4 2.9800 6/1/2035 99.1340 1,214,368.30 1,214,368.30 1,214,368.30 1,203,851.87UNITED STATES 2.82% 12/35 83162CXL2 2.8200 12/1/2035 98.1960 1,856,076.05 1,856,076.05 1,856,076.05 1,822,592.44UNITED STATES 2.78% 12/37 83162CZA4 2.7800 12/1/2037 98.0580 2,797,138.41 2,797,138.41 2,797,138.41 2,742,817.98UNITED STATES 3.54% 07/38 83162CZP1 3.5400 7/1/2038 102.0730 3,606,859.73 3,606,859.73 3,606,859.73 3,681,629.93UNITED STATES 3.53% 09/38 83162CZU0 3.5300 9/1/2038 102.1960 1,854,000.00 1,854,000.00 1,854,000.00 1,894,713.84SOUTHWEST 6.15% 08/22 84474YAA4 6.1500 2/1/2024 104.9473 1,114,562.07 1,207,369.04 1,207,369.04 1,169,702.91SPIRIT 4.1% 04/28 84858DAA6 4.1000 10/1/2029 99.0600 681,419.59 681,419.59 681,419.59 675,014.25TOYOTA AUTO 2.35% 05/22 89238BAD4 2.3500 5/16/2022 99.2755 1,600,000.00 1,599,981.60 1,599,985.34 1,588,408.48UBS COMMERCIAL 3.4% 05/45 90269GAC5 3.4000 5/10/2045 100.7718 3,087,113.31 3,226,596.82 3,226,596.82 3,110,939.03UBS-BARCLAY 3.2443% 04/46 90349GBF1 3.2443 4/10/2046 100.4928 3,274,000.00 3,266,233.76 3,266,272.16 3,290,133.62UNITED 3.1% 07/28 90931LAA6 3.1000 1/7/2030 95.0197 1,335,230.32 1,335,230.32 1,335,230.32 1,268,732.24WORLD OMNI 1.61% 01/22 98161FAE5 1.6100 1/15/2022 99.8121 2,199,000.00 2,185,943.44 2,191,263.58 2,194,867.42WORLD OMNI 3.04% 05/24 98162YAD5 3.0400 5/15/2024 100.3308 1,800,000.00 1,799,700.66 1,799,702.01 1,805,953.50WORLD OMNI 3.13% 11/23 98163EAD8 3.1300 11/15/2023 100.6524 1,616,000.00 1,615,849.07 1,615,864.43 1,626,543.27
90,368,878.04 91,559,601.82 91,582,241.81 90,711,185.56 T-Note
UNITED 1.625% 02/26 912828P46 1.6250 2/15/2026 94.1410 16,919,000.00 16,397,040.01 16,518,277.09 15,927,715.79UNITED 1.625% 05/26 912828R36 1.6250 5/15/2026 93.9220 710,000.00 649,458.30 653,967.10 666,846.20UNITED 2.25% 02/27 912828V98 2.2500 2/15/2027 97.5860 10,187,000.00 10,107,123.56 10,121,110.13 9,941,085.82UNITED 2.25% 11/27 9128283F5 2.2500 11/15/2027 97.1410 5,252,000.00 4,990,999.53 5,014,113.84 5,101,845.32UNITED 2.375% 01/23 9128283U2 2.3750 1/31/2023 99.7620 4,919,000.00 4,862,666.07 4,870,771.45 4,907,292.78UNITED 2.75% 02/28 9128283W8 2.7500 2/15/2028 101.0310 5,714,000.00 5,666,213.24 5,669,163.32 5,772,911.34
Page 6 of 7

Account: 3015465200 VA GENERAL/INCOM RES& MGT Created: 6-Feb-2019 02:10:26 AM [CST]
Audited Market Value - MonthlyAs of Jan 31, 2019
Description Security Coupon Rate Maturity Date Price (Base) Shares/Par Cost (Base) Amortized Cost Traded Market Value
UNITED 2.875% 04/25 9128284M9 2.8750 4/30/2025 102.1290 520,000.00 522,033.20 522,033.20 531,070.80UNITED 2.75% 05/23 9128284S6 2.7500 5/31/2023 101.2660 6,239,000.00 6,233,152.93 6,233,758.76 6,317,985.74UNITED 2.875% 08/28 9128284V9 2.8750 8/15/2028 102.0120 4,671,000.00 4,618,817.31 4,620,189.56 4,764,980.52UNITED 2.75% 09/21 9128285A4 2.7500 9/15/2021 100.7770 1,705,000.00 1,703,667.97 1,703,735.29 1,718,247.85UNITED 2.875% 09/23 9128285D8 2.8750 9/30/2023 101.8870 32,989,000.00 32,966,075.59 32,971,676.79 33,611,502.43UNITED 2.875% 11/21 9128285L0 2.8750 11/15/2021 101.1520 1,353,000.00 1,367,851.29 1,367,851.29 1,368,586.56
91,178,000.00 90,085,099.00 90,266,647.82 90,630,071.15 T-Bond
UNITED STATES 4.5% 02/36 912810FT0 4.5000 2/15/2036 123.7850 4,296,000.00 5,191,382.76 5,191,382.76 5,317,803.604,296,000.00 5,191,382.76 5,191,382.76 5,317,803.60
Totals $377,585,042.95 $384,846,891.03 $385,261,703.99 $382,067,309.65
Page 7 of 7

Account: 3015465500 VA GENERAL/DODGE & COX Created: 6-Feb-2019 02:10:19 AM [CST]
Audited Market Value - MonthlyAs of Jan 31, 2019
Description Security Coupon Rate Maturity Date Price (Base) Shares/Par Cost (Base) Amortized Cost Traded Market Value
Corporate BondAT&T INC 6.55% 02/39 00206RAS1 6.5500 2/15/2039 113.7978 775,000.00 762,188.50 766,458.53 881,932.64ANHEUSER-BUSC 4.95% 01/42 035240AG5 4.9500 1/15/2042 97.2300 1,250,000.00 1,365,125.00 1,357,028.82 1,215,375.00ANHEUSER-BUSCH 4% 04/28 035240AL4 4.0000 4/13/2028 99.1180 1,000,000.00 992,160.00 992,837.34 991,180.00BANK OF 5.875% 02/42 06051GEN5 5.8750 2/7/2042 121.5430 2,190,000.00 2,842,685.70 2,810,995.47 2,661,791.70BANK OF NEW 2.3% 09/19 06406HCW7 2.3000 9/11/2019 99.6730 1,800,000.00 1,799,658.00 1,799,958.93 1,794,114.00BURLINGTON 5.75% 05/40 12189LAA9 5.7500 5/1/2040 120.4990 1,400,000.00 1,772,946.00 1,748,009.40 1,686,986.00CSX CORP 6.22% 04/40 126408GS6 6.2200 4/30/2040 121.0840 750,000.00 982,417.50 966,877.30 908,130.00CSX 6.251% 01/23 126410LM9 6.2510 1/15/2023 107.7670 385,715.93 376,474.69 383,023.23 415,674.49CVS HEALTH 4.78% 03/38 126650CY4 4.7800 3/25/2038 100.0970 925,000.00 906,629.50 907,462.82 925,897.25CANADIAN 6.375% 11/37 136375BQ4 6.3750 11/15/2037 126.0500 1,337,000.00 1,868,274.40 1,802,826.87 1,685,288.50CANADIAN 5.75% 01/42 13645RAQ7 5.7500 1/15/2042 114.0991 300,000.00 347,829.00 342,601.68 342,297.24CHUBB CORP/THE 6% 05/37 171232AQ4 6.0000 5/11/2037 122.3220 1,350,000.00 1,518,829.18 1,484,959.09 1,651,347.00CITIGROUP 8.125% 07/39 172967EW7 8.1250 7/15/2039 145.8250 735,000.00 1,086,131.55 1,024,279.74 1,071,813.75COMCAST CORP 6.45% 03/37 20030NAM3 6.4500 3/15/2037 123.5710 1,800,000.00 2,242,385.47 2,177,762.32 2,224,278.00COMMONWEALTH 2.95% 08/27 202795JK7 2.9500 8/15/2027 95.9164 1,350,000.00 1,346,301.00 1,346,840.34 1,294,871.81CONOCOPHILLIPS 6.5% 02/39 20825CAQ7 6.5000 2/1/2039 131.2600 1,100,000.00 1,084,160.00 1,089,438.74 1,443,860.00DEERE & CO 4.375% 10/19 244199BC8 4.3750 10/16/2019 100.9640 700,000.00 696,192.00 699,731.44 706,748.00DOW CHEMICAL 9.4% 05/39 260543BY8 9.4000 5/15/2039 147.6220 1,600,000.00 2,729,472.00 2,672,432.62 2,361,952.00ERP 3.375% 06/25 26884ABD4 3.3750 6/1/2025 99.3220 1,750,000.00 1,751,572.50 1,752,643.98 1,738,135.00FORD MOTOR 4.389% 01/26 345397XU2 4.3890 1/8/2026 89.9970 850,000.00 865,232.00 862,182.46 764,974.50GRUPO 6.125% 01/46 40049JBC0 6.1250 1/31/2046 106.1090 1,300,000.00 1,303,165.00 1,302,827.90 1,379,417.00HSBC HOLDINGS 4.3% 03/26 404280AW9 4.3000 3/8/2026 102.0630 2,600,000.00 2,728,830.00 2,703,537.44 2,653,638.00JPMORGAN 5.5% 10/40 46625HHV5 5.5000 10/15/2040 115.2020 2,272,000.00 2,680,754.86 2,641,174.62 2,617,389.44KONINKLIJKE 6.875% 03/38 500472AC9 6.8750 3/11/2038 128.8100 1,500,000.00 1,919,040.00 1,809,387.18 1,932,150.00LAFARGE SA 7.125% 07/36 505861AC8 7.1250 7/15/2036 114.5980 538,000.00 627,781.44 613,822.74 616,537.24OVERSEAS 5.142% 12/23 690353NL7 5.1420 12/15/2023 106.0740 363,808.39 363,808.39 363,808.39 385,906.11PHILIP 4.375% 11/41 718172AM1 4.3750 11/15/2041 93.1810 975,000.00 951,204.00 951,908.71 908,514.75PHILIP 4.875% 11/43 718172BD0 4.8750 11/15/2043 100.4650 425,000.00 434,800.50 434,658.19 426,976.25PHILIP 2.75% 02/26 718172BT5 2.7500 2/25/2026 93.9090 475,000.00 439,213.50 442,177.26 446,067.75RAYTHEON CO 4.4% 02/20 755111BR1 4.4000 2/15/2020 101.6600 1,250,000.00 1,246,937.50 1,249,691.12 1,270,750.00TRAVELERS 6.75% 06/36 792860AK4 6.7500 6/20/2036 129.4550 300,000.00 375,075.32 356,629.74 388,365.00SHELL 6.375% 12/38 822582AD4 6.3750 12/15/2038 131.1400 1,075,000.00 1,345,943.00 1,308,193.36 1,409,755.00SMALL 8.03% 05/20 83162CKT9 8.0300 5/1/2020 101.6531 5,765.68 5,765.68 5,765.68 5,860.99TRAVELERS 6.375% 03/33 89420GAE9 6.3750 3/15/2033 125.5790 1,000,000.00 1,174,110.00 1,113,973.38 1,255,790.00TYCO 7.125% 10/37 902133AG2 7.1250 10/1/2037 129.2690 1,025,000.00 1,396,306.25 1,350,682.18 1,325,007.25UNITEDHEALTH 5.8% 03/36 91324PAR3 5.8000 3/15/2036 120.5770 1,425,000.00 1,481,895.00 1,470,268.10 1,718,222.25UNITEDHEALTH 2.95% 10/27 91324PDE9 2.9500 10/15/2027 96.6150 950,000.00 942,048.50 943,075.28 917,842.50VERIZON 4.272% 01/36 92343VCV4 4.2720 1/15/2036 97.3320 2,500,000.00 2,342,075.00 2,358,481.84 2,433,300.00VIRGINIA 8.875% 11/38 927804FG4 8.8750 11/15/2038 153.6590 1,100,000.00 1,579,336.00 1,579,336.00 1,690,249.00WELLS FARGO & 3% 04/26 949746RW3 3.0000 4/22/2026 95.8470 2,800,000.00 2,702,771.00 2,719,877.32 2,683,716.00
47,227,290.00 53,377,524.93 52,707,627.55 53,232,101.41 FHLMC
FHLMCGLD 4.5% 03/31 3128E5RW1 4.5000 3/1/2031 104.9710 473,614.88 510,542.03 499,590.17 497,158.28
Page 1 of 5

Account: 3015465500 VA GENERAL/DODGE & COX Created: 6-Feb-2019 02:10:19 AM [CST]
Audited Market Value - MonthlyAs of Jan 31, 2019
Description Security Coupon Rate Maturity Date Price (Base) Shares/Par Cost (Base) Amortized Cost Traded Market Value
FHLMCGLD 6% 02/22 3128MBJB4 6.0000 2/1/2022 102.6650 41,795.21 42,067.84 41,854.84 42,909.05FHLMCGLD 6% 03/23 3128MB5D5 6.0000 3/1/2023 102.6340 78,777.66 80,230.10 79,209.68 80,852.66FHLMCGLD 4% 05/27 3128MDKE2 4.0000 5/1/2027 102.9780 370,727.54 394,216.61 384,333.28 381,767.81FHLMCGLD 4.5% 01/44 3128MJT26 4.5000 1/1/2044 104.2650 298,115.01 318,563.83 315,249.05 310,829.62FHLMCGLD 4.5% 06/47 3128MJ2A7 4.5000 6/1/2047 104.1760 1,223,353.52 1,309,370.59 1,305,886.88 1,274,440.76FHLMCGLD 5.5% 10/20 3128M1PY9 5.5000 10/1/2020 101.1270 58,520.14 58,291.55 58,491.32 59,179.66FHLMCGLD 6.5% 01/38 3128M5QY9 6.5000 1/1/2038 113.4320 62,286.19 68,699.72 66,801.99 70,652.47FHLMCGLD 4.5% 05/41 3128M8P81 4.5000 5/1/2041 105.8470 402,830.57 433,420.51 428,100.72 426,384.07FHLMCGLD 4.5% 12/43 3128M9YH9 4.5000 12/1/2043 104.2660 170,209.78 183,720.17 181,707.40 177,470.93FHLMC MORTPASS FLT 08/36 3128S4EP8 4.1540 8/1/2036 103.3680 84,862.87 85,641.90 85,641.90 87,721.05FHLMCGLD 6.5% 10/37 3128UNDB5 6.5000 10/1/2037 108.8100 24,226.95 24,575.20 24,447.07 26,361.34FHLMCGLD 5.5% 03/34 31283HZ65 5.5000 3/1/2034 108.5970 116,373.05 123,200.88 120,714.06 126,377.64FHLMCGLD 5.5% 01/35 31283H5J0 5.5000 1/1/2035 108.6170 67,174.05 73,009.77 71,175.42 72,962.44FHLMCGLD 4.5% 09/40 312942NM3 4.5000 9/1/2040 105.1730 419,455.78 448,555.53 443,021.53 441,154.23FHLMC MORTPASS FLT 05/44 31300MNQ2 3.0990 5/1/2044 101.1020 725,544.62 751,165.42 751,165.42 733,540.12FHLMC MORTPASS FLT 11/44 31300MR39 2.9100 11/1/2044 100.5300 743,870.26 743,128.35 743,128.35 747,812.77FHLMC MORTPASS FLT 01/45 31300MVS9 3.0660 1/1/2045 100.6370 696,050.14 723,130.85 723,130.85 700,483.98FHLMCGLD 4.5% 04/47 3132L8QH3 4.5000 4/1/2047 104.1760 1,241,554.38 1,333,119.01 1,328,785.45 1,293,401.69FHLMCGLD 4.5% 05/47 3132L8RZ2 4.5000 5/1/2047 104.1760 3,363,138.20 3,616,161.78 3,603,895.75 3,503,582.85FHLMCGLD 4.5% 03/47 3132WLT71 4.5000 3/1/2047 104.1760 1,081,706.07 1,160,805.82 1,156,765.86 1,126,878.12FHLMCGLD 4.5% 05/47 3132WNEK4 4.5000 5/1/2047 104.1760 1,327,104.53 1,379,981.36 1,378,823.37 1,382,524.42FHLMC MORTPASS FLT 09/45 31326KCR6 2.9310 9/1/2045 100.1920 193,514.09 198,684.54 198,684.54 193,885.64FHLMCGLD 4.5% 07/42 31335BAP1 4.5000 7/1/2042 105.1580 4,699,626.66 5,071,190.90 5,045,601.22 4,942,033.40FHLMC MORTPASS FLT 10/34 31349UCV8 4.7390 10/1/2034 105.3260 212,998.62 207,507.24 207,507.24 224,342.93FHLMC MORTPASS FLT 03/35 31349UM54 3.9560 3/1/2035 105.2250 52,650.14 51,385.30 51,385.30 55,401.11
18,230,080.91 19,390,366.80 19,295,098.66 18,980,109.04 FNMA
FNMA MORTPASS 6.5% 11/32 31371KVH1 6.5000 11/1/2032 111.4830 31,467.10 32,730.70 32,111.91 35,080.47FNMA MORTPASS 7% 08/37 31371NH40 7.0000 8/1/2037 112.4050 29,021.36 30,411.22 29,921.48 32,621.46FNMA MORTPASS 7% 11/37 31371NNA9 7.0000 11/1/2037 113.3730 33,640.48 35,364.57 34,765.79 38,139.22FNMA MORTPASS 6.5% 02/38 31374CL53 6.5000 2/1/2038 111.4690 23,725.98 26,065.18 25,359.13 26,447.11FNMA MORTPASS 5% 09/25 3138EJWC8 5.0000 9/1/2025 102.1940 244,110.62 265,661.00 255,279.36 249,466.41FNMA MORTPASS 6% 07/39 3138EK7L3 6.0000 7/1/2039 109.5940 591,705.49 655,313.82 642,354.70 648,473.71FNMA MORTPASS 4.5% 01/32 3138EMBT7 4.5000 1/1/2032 105.0330 195,565.14 210,385.32 206,313.37 205,407.93FNMA MORTPASS FLT 02/44 3138EMRA1 2.9830 2/1/2044 101.0780 220,015.72 228,060.04 228,060.04 222,387.49FNMA MORTPASS 5% 09/39 3138EM5Y3 5.0000 9/1/2039 107.0780 1,022,243.87 1,126,384.97 1,107,682.98 1,094,598.29FNMA MORTPASS 4.5% 09/41 3138ENBK4 4.5000 9/1/2041 105.4300 284,430.19 309,362.27 305,215.01 299,874.75FNMA MORTPASS 3.5% 12/29 3138EQAF9 3.5000 12/1/2029 102.0460 312,076.64 328,850.75 324,905.57 318,461.73FNMA MORTPASS FLT 10/45 3138EQTS1 2.8340 10/1/2045 100.2370 1,175,004.69 1,200,111.23 1,200,111.23 1,177,789.45FNMA MORTPASS 4.5% 02/46 3138EREA4 4.5000 2/1/2046 105.1010 2,647,734.74 2,906,716.26 2,887,142.50 2,782,795.69FNMA MORTPASS FLT 07/46 3138ET4D5 2.5800 7/1/2046 99.5020 635,594.68 652,229.38 652,229.38 632,429.42FNMA MORTPASS 3.14% 12/31 3138LGAK2 3.1400 12/1/2031 95.8340 1,715,000.00 1,688,739.06 1,688,739.06 1,643,553.10FNMA MORTPASS 2.92% 11/36 3138LGDL7 2.9200 11/1/2036 91.7400 750,000.00 723,046.88 723,046.88 688,050.00FNMA MORTPASS 3.09% 12/36 3138LGEU6 3.0900 12/1/2036 92.6760 500,000.00 490,898.44 490,898.44 463,380.00
Page 2 of 5

Account: 3015465500 VA GENERAL/DODGE & COX Created: 6-Feb-2019 02:10:19 AM [CST]
Audited Market Value - MonthlyAs of Jan 31, 2019
Description Security Coupon Rate Maturity Date Price (Base) Shares/Par Cost (Base) Amortized Cost Traded Market Value
FNMA MORTPASS 3.28% 12/32 3138LLU52 3.2800 12/1/2032 97.6330 2,604,000.00 2,613,765.00 2,613,765.00 2,542,363.32FNMA MORTPASS 3.76% 07/33 3138LNYX3 3.7600 7/1/2033 102.9260 453,847.09 458,598.30 458,598.30 467,126.66FNMA MORTPASS 3.33% 10/29 3138L7WS1 3.3300 10/1/2029 100.7430 1,986,617.45 2,011,915.77 2,011,915.77 2,001,378.02FNMA MORTPASS 4% 12/34 3138WDK26 4.0000 12/1/2034 103.8440 757,100.13 810,215.44 800,725.24 786,203.06FNMA MORTPASS 4% 09/35 3138WFQY5 4.0000 9/1/2035 103.8440 2,697,045.04 2,909,858.74 2,881,246.21 2,800,719.45FNMA MORTPASS FLT 05/44 3138XUGF3 2.9570 5/1/2044 100.8700 268,168.97 275,913.88 275,913.88 270,502.04FNMA MORTPASS 6.5% 05/31 31384WLF5 6.5000 5/1/2031 111.6540 40,581.18 42,210.75 41,365.45 45,310.51FNMA MORTPASS 6.5% 06/32 31385JF86 6.5000 6/1/2032 112.4170 24,447.61 25,429.30 24,940.95 27,483.27FNMA MORTPASS 6.5% 07/32 31385JJF6 6.5000 7/1/2032 112.0040 13,045.96 13,569.83 13,309.61 14,612.00FNMA MORTPASS 6.5% 10/32 31385WV63 6.5000 10/1/2032 110.1160 36,683.28 38,156.32 37,432.10 40,394.16FNMA MORTPASS 6.5% 05/32 31391K5X1 6.5000 5/1/2032 111.6880 23,285.90 24,220.97 23,753.98 26,007.56FNMA MORTPASS 3.5% 06/46 3140F7P78 3.5000 6/1/2046 101.0010 2,063,207.81 2,131,551.58 2,127,448.75 2,083,860.52FNMA MORTPASS 4.5% 06/48 3140HBJG4 4.5000 6/1/2048 103.9700 1,210,452.69 1,260,714.85 1,259,789.27 1,258,507.66FNMA MORTPASS 4.5% 01/43 3140J5QK8 4.5000 1/1/2043 105.0970 1,240,543.34 1,344,341.93 1,337,843.22 1,303,773.83FNMA MORTPASS 4.5% 06/48 3140Q9DP5 4.5000 6/1/2048 103.9670 1,070,337.33 1,094,921.64 1,094,730.28 1,112,797.61FNMA MORTPASS 6.5% 10/32 31400FB48 6.5000 10/1/2032 107.7040 33,087.30 34,648.62 33,841.65 35,636.35FNMA MORTPASS 6% 01/33 31400FCF2 6.0000 1/1/2033 106.2920 99,546.48 102,455.11 100,968.04 105,809.94FNMA MORTPASS 6.5% 08/32 31402BVL5 6.5000 8/1/2032 100.2160 3,587.71 3,757.02 3,670.69 3,595.46FNMA MORTPASS FLT 10/33 31402DGA2 4.4530 10/1/2033 104.0950 131,632.24 126,202.40 126,202.40 137,022.58FNMA MORTPASS 6.5% 12/19 31402RC31 6.5000 12/1/2019 100.0000 22.45 23.43 22.62 22.45FNMA MORTPASS 6% 04/35 31402RDG1 6.0000 4/1/2035 109.5750 318,441.89 344,215.77 335,341.63 348,932.70FNMA MORTPASS 7% 11/33 31402RYC7 7.0000 11/1/2033 108.9090 44,461.00 47,309.24 45,897.56 48,422.03FNMA MORTPASS 6% 07/35 31403DA66 6.0000 7/1/2035 109.5530 167,164.21 168,888.09 168,145.52 183,133.41FNMA MORTPASS 7% 10/32 31405FD58 7.0000 10/1/2032 112.1740 25,427.53 26,798.26 26,106.17 28,523.08FNMA MORTPASS FLT 06/35 31406VYX8 3.9160 6/1/2035 103.2360 115,500.55 113,822.19 113,822.19 119,238.15FNMA MORTPASS FLT 07/35 31407JNR9 4.3980 7/1/2035 104.6710 224,992.78 223,024.08 223,024.08 235,502.19FNMA MORTPASS 6% 11/21 31410FSE6 6.0000 11/1/2021 102.4060 106,171.77 107,797.53 106,486.53 108,726.26FNMA MORTPASS 7% 03/37 31410F6C4 7.0000 3/1/2037 113.8500 100,687.65 111,653.15 108,216.27 114,632.89FNMA MORTPASS FLT 05/36 31410F7D1 4.3510 5/1/2036 104.7150 81,704.72 81,593.03 81,593.03 85,557.10FNMA MORTPASS 6% 04/35 31410GJS3 6.0000 4/1/2035 109.5470 83,195.30 82,961.31 83,055.86 91,137.96FNMA MORTPASS 6% 03/36 31410GTM5 6.0000 3/1/2036 109.4150 137,793.39 140,387.78 139,387.72 150,766.64FNMA MORTPASS 6.5% 02/38 31410KL77 6.5000 2/1/2038 112.9960 100,972.07 105,040.39 103,615.27 114,094.40FNMA MORTPASS 6.5% 07/38 31410KRB2 6.5000 7/1/2038 112.8340 13,358.57 13,773.94 13,632.03 15,073.01FNMA MORTPASS 6.5% 10/38 31410KXM1 6.5000 10/1/2038 113.4870 62,123.19 68,888.80 66,961.08 70,501.74FNMA MORTPASS 5.5% 11/29 31414UWN4 5.5000 11/1/2029 106.4570 312,039.94 341,683.74 331,413.34 332,188.36FNMA MORTPASS 6% 02/23 31414UZL5 6.0000 2/1/2023 103.1830 157,588.01 161,281.47 158,674.54 162,604.04FNMA MORTPASS 4% 11/30 31416W5Z1 4.0000 11/1/2030 103.0990 219,113.17 233,355.52 228,694.15 225,903.49FNMA MORTPASS 4.5% 01/31 31417YV46 4.5000 1/1/2031 105.0330 75,782.38 82,129.16 80,324.38 79,596.51FNMA MORTPASS 3.5% 03/37 31418CG99 3.5000 3/1/2037 101.1860 3,699,459.94 3,845,704.20 3,831,814.67 3,743,335.53FNMA MORTPASS 4.5% 05/48 31418CWU4 4.5000 5/1/2048 103.9580 1,052,538.12 1,085,923.31 1,085,752.32 1,094,197.58FNMA MORTPASS 4.5% 06/48 31418CXP4 4.5000 6/1/2048 103.9400 3,591,126.90 3,700,964.88 3,699,546.02 3,732,617.30FNMA MORTPASS 6.5% 08/39 31418MEC2 6.5000 8/1/2039 113.3310 69,747.85 75,942.24 74,195.26 79,045.94FNMA MORTPASS 5.5% 09/38 31418MGG1 5.5000 9/1/2038 108.9380 191,526.08 210,948.02 206,107.51 208,644.68FNMA MORTPASS 6% 08/37 31418MG30 6.0000 8/1/2037 109.5720 330,951.51 349,774.40 343,595.21 362,630.19
Page 3 of 5

Account: 3015465500 VA GENERAL/DODGE & COX Created: 6-Feb-2019 02:10:19 AM [CST]
Audited Market Value - MonthlyAs of Jan 31, 2019
Description Security Coupon Rate Maturity Date Price (Base) Shares/Par Cost (Base) Amortized Cost Traded Market Value
FNMA MORTPASS 5.5% 04/37 31418MH39 5.5000 4/1/2037 107.9630 122,699.85 131,633.92 128,824.18 132,470.44FNMA MORTPASS 7% 12/38 31418MKY7 7.0000 12/1/2038 113.2530 94,251.93 102,469.52 99,910.16 106,743.14FNMA MORTPASS 5.5% 02/38 31419AJ99 5.5000 2/1/2038 104.8290 98,704.35 105,567.39 103,504.46 103,470.78FNMA MORTPASS 6.5% 01/39 31419AP43 6.5000 1/1/2039 114.1850 125,849.40 140,223.78 136,233.96 143,701.14FNMA MORTPASS 5.5% 09/24 31419AQZ3 5.5000 9/1/2024 102.4240 60,884.28 65,697.94 62,872.82 62,360.11FNMA MORTPASS 5.5% 01/25 31419A6M4 5.5000 1/1/2025 103.5640 113,336.34 122,420.96 117,307.34 117,375.65
37,066,171.34 38,624,675.98 38,405,675.50 38,023,209.12 Government Bond
PETROLEOS 6.625% 06/35 706451BG5 6.6250 6/15/2035 90.5000 1,505,000.00 1,746,275.00 1,695,734.61 1,362,025.00PETROLEOS 6.75% 09/47 71654QCC4 6.7500 9/21/2047 87.1500 425,000.00 396,716.25 397,192.39 370,387.50PETROLEOS 6.5% 03/27 71654QCG5 6.5000 3/13/2027 95.9500 900,000.00 912,150.00 911,457.27 863,550.00
2,830,000.00 3,055,141.25 3,004,384.27 2,595,962.50 GNMA1 (15 Day Lag)
GNMA I 7.9% 10/21 36225BJR0 7.9000 10/15/2021 102.1670 14,079.33 14,114.54 14,084.12 14,384.4314,079.33 14,114.54 14,084.12 14,384.43
Municipal BondCALIFORNIA ST 7.5% 04/34 13063A5E0 7.5000 4/1/2034 140.2600 1,775,000.00 1,841,944.60 1,817,438.14 2,489,615.00CALIFORNIA 7.625% 03/40 13063BFR8 7.6250 3/1/2040 146.4070 200,000.00 293,384.00 286,288.07 292,814.00LOS ANGELES 5.75% 07/34 544646XZ0 5.7500 7/1/2034 120.5890 2,250,000.00 2,202,877.69 2,231,144.29 2,713,252.50
4,225,000.00 4,338,206.29 4,334,870.50 5,495,681.50 Money Market
INVESCO VAR 12/99 00499KPA5 2.3287 12/31/2099 100.0000 3,040,351.86 3,040,351.86 3,040,351.86 3,040,351.863,040,351.86 3,040,351.86 3,040,351.86 3,040,351.86
Mortgage RelatedBNSF 5.996% 04/24 05568YAA6 5.9960 4/1/2024 107.8520 392,502.49 392,502.49 392,502.49 423,321.79BURLINGTON 7.57% 01/21 12189PAF9 7.5700 1/2/2021 102.0765 64,887.05 74,265.50 66,546.01 66,234.40BURLINGTON 8.251% 01/21 12189PAG7 8.2510 1/15/2021 102.9560 82,119.93 91,141.53 83,617.37 84,547.40FNMA REMICS FLT 12/43 3136AHPA2 3.1100 12/25/2043 100.3232 2,260,754.23 2,265,346.36 2,265,346.36 2,268,059.86FANNIE MAE-ACES VAR 04/29 3136AWWF0 3.1782 4/25/2029 98.5432 700,000.00 705,299.98 705,299.98 689,802.19FHLMC REMICS VAR 03/44 3137B8LR6 4.5000 3/15/2044 106.6625 725,751.56 814,882.92 814,882.92 774,104.83FREDDIE MAC VAR 09/43 31392W7B0 6.5000 9/25/2043 113.6261 284,035.01 288,441.02 288,441.02 322,737.93FNMA TRUST 6.5% 09/42 31393BU94 6.5000 9/25/2042 111.2820 213,778.32 219,448.46 217,471.78 237,896.79FNMA TRUST 7% 08/44 31394BZ80 7.0000 8/25/2044 113.8390 121,042.02 128,332.91 125,856.89 137,792.98SEASONED 4.5% 06/57 35563PCS6 4.5000 6/25/2057 104.0626 1,232,137.34 1,349,333.67 1,346,234.71 1,282,194.27GNMA 2017-H20 FLT 10/67 38375UQ29 3.0700 10/20/2067 99.8222 967,252.72 967,252.72 967,252.72 965,532.94GNMA 2018-H05 FLT 02/68 38380LAC7 2.5600 2/20/2068 98.9553 1,113,016.38 1,111,116.10 1,111,116.10 1,101,388.14GNMA 2018-H08 FLT 06/68 38380LDF7 2.8300 6/20/2068 99.1683 1,592,271.18 1,586,016.29 1,586,016.29 1,579,028.58NEW VALLEY 4.929% 01/21 64908QAA9 4.9290 1/15/2021 102.5142 167,254.70 167,254.70 167,254.70 171,459.80UNITED STATES 4.72% 02/24 83162CNN9 4.7200 2/1/2024 102.6710 77,472.33 75,232.90 76,803.00 79,541.62UNITED STATES 4.88% 11/24 83162CPD9 4.8800 11/1/2024 103.4010 93,577.87 93,577.87 93,577.87 96,760.45UNION 4.698% 01/24 90783SAA0 4.6980 1/2/2024 103.3445 239,472.57 223,214.77 235,371.00 247,481.63UNION 5.082% 01/29 90783VAA3 5.0820 1/2/2029 107.4309 444,296.81 428,350.42 436,178.23 477,312.06UNION 6.176% 01/31 90783XAA9 6.1760 1/2/2031 111.0331 303,563.43 303,563.43 303,563.43 337,055.95
11,075,185.94 11,284,574.04 11,283,332.87 11,342,253.61
Page 4 of 5

Account: 3015465500 VA GENERAL/DODGE & COX Created: 6-Feb-2019 02:10:19 AM [CST]
Audited Market Value - MonthlyAs of Jan 31, 2019
Description Security Coupon Rate Maturity Date Price (Base) Shares/Par Cost (Base) Amortized Cost Traded Market Value
T-NoteUNITED 1.625% 02/26 912828P46 1.6250 2/15/2026 94.1410 3,000,000.00 2,879,605.83 2,879,605.83 2,824,230.00UNITED 1.375% 09/23 912828T26 1.3750 9/30/2023 95.3008 4,525,000.00 4,455,357.43 4,455,357.43 4,312,360.34UNITED STATES 2% 11/26 912828U24 2.0000 11/15/2026 95.9810 8,100,000.00 7,790,813.84 7,790,813.84 7,774,461.00UNITED 1.75% 05/23 912828VB3 1.7500 5/15/2023 97.1680 4,150,000.00 3,945,191.40 3,945,191.40 4,032,472.00UNITED 2.125% 05/25 912828XB1 2.1250 5/15/2025 97.7500 10,700,000.00 10,541,808.59 10,541,808.59 10,459,250.00UNITED STATES 1.5% 08/26 9128282A7 1.5000 8/15/2026 92.7810 8,935,000.00 8,735,472.56 8,735,472.56 8,289,982.35UNITED STATES 3% 10/25 9128285J5 3.0000 10/31/2025 102.9570 6,900,000.00 6,922,656.25 6,922,656.25 7,104,033.00UNITED 3.125% 11/28 9128285M8 3.1250 11/15/2028 104.2031 2,300,000.00 2,377,355.47 2,377,355.47 2,396,671.76
48,610,000.00 47,648,261.37 47,648,261.37 47,193,460.45 T-Bond
UNITED 2.75% 08/42 912810QX9 2.7500 8/15/2042 96.1760 3,560,000.00 3,362,277.48 3,362,277.48 3,423,865.60UNITED 3.625% 08/43 912810RC4 3.6250 8/15/2043 111.1090 2,600,000.00 2,561,467.34 2,561,467.34 2,888,834.00UNITED 2.75% 11/47 912810RZ3 2.7500 11/15/2047 94.9060 2,770,000.00 2,596,975.79 2,596,975.79 2,628,896.20
8,930,000.00 8,520,720.61 8,520,720.61 8,941,595.80 Totals $181,248,159.38 $189,293,937.67 $188,254,407.31 $188,859,109.72
Page 5 of 5

Account: 3016142600 VA GENERAL/EARNEST PARTNE Created: 6-Feb-2019 02:10:19 AM [CST]
Audited Market Value - MonthlyAs of Jan 31, 2019
Description Security Coupon Rate Maturity Date Price (Base) Shares/Par Cost (Base) Amortized Cost Traded Market Value
Corporate BondAFLAC INC 6.9% 12/39 001055AD4 6.9000 12/17/2039 128.0010 500,000.00 663,763.50 638,174.46 640,005.00AMERICAN 2.65% 12/22 025816BD0 2.6500 12/2/2022 98.0690 655,000.00 610,494.30 635,978.69 642,351.95AMERICAN 4.3% 12/42 03040WAJ4 4.3000 12/1/2042 100.5260 675,000.00 693,832.50 693,416.98 678,550.50BURLINGTON 3.75% 04/24 12189LAR2 3.7500 4/1/2024 102.3340 347,000.00 361,652.60 356,273.70 355,098.98CSX CORP 3.7% 11/23 126408GZ0 3.7000 11/1/2023 101.0270 141,000.00 146,593.60 144,296.64 142,448.07CSX 6.251% 01/23 126410LM9 6.2510 1/15/2023 107.7670 372,858.74 407,380.33 383,651.51 401,818.68CAL DIVE 4.93% 02/27 12802RAA3 4.9300 2/1/2027 106.3660 639,261.45 641,132.06 649,245.10 679,956.83CANADIAN 6.9% 07/28 136375BD3 6.9000 7/15/2028 126.5720 253,000.00 314,974.88 314,072.69 320,227.16DUKE ENERGY 6.3% 04/38 144141CY2 6.3000 4/1/2038 125.7220 550,000.00 559,481.00 556,130.79 691,471.00COMMONWEALTH 5.9% 03/36 202795HK9 5.9000 3/15/2036 118.3920 550,000.00 497,656.00 517,713.40 651,156.00VESSEL 3.432% 08/36 228027AA6 3.4320 8/15/2036 99.5700 658,000.00 662,318.52 661,988.35 655,170.60DOMINION 7% 06/38 25746UBD0 7.0000 6/15/2038 125.7900 500,000.00 624,855.00 606,653.44 628,950.00ENTERGY 4.44% 01/26 29364WAM0 4.4400 1/15/2026 102.8670 652,000.00 650,719.25 653,184.39 670,692.84FEDEX CORP 4% 01/24 31428XAY2 4.0000 1/15/2024 102.8950 363,000.00 385,225.20 376,992.61 373,508.85FLORIDA 5.96% 04/39 341081FB8 5.9600 4/1/2039 124.6620 431,000.00 553,943.73 543,372.90 537,293.22GATX CORP 3.25% 03/25 361448AW3 3.2500 3/30/2025 95.4270 717,000.00 685,220.45 696,808.55 684,211.59GEORGIA 4.75% 09/40 373334JS1 4.7500 9/1/2040 97.8480 656,000.00 713,555.79 705,225.24 641,882.88JOHN SEVIER 4.626% 01/42 478045AA5 4.6260 1/15/2042 108.0260 686,702.88 783,887.52 766,587.15 741,817.65KEYBANK 3.35% 06/21 49327M2W3 3.3500 6/15/2021 100.7023 525,000.00 524,806.32 524,831.73 528,686.92KROGER CO/THE 4.5% 01/29 501044DL2 4.5000 1/15/2029 100.5190 465,000.00 463,206.10 463,217.86 467,413.35MATSON 5.337% 09/28 576863BB9 5.3370 9/4/2028 108.4520 328,000.00 347,587.49 339,040.73 355,722.56NATIONAL 4.023% 11/32 637432MS1 4.0230 11/1/2032 102.8730 650,000.00 620,568.00 628,535.82 668,674.50NEVADA POWER 6.75% 07/37 641423BU1 6.7500 7/1/2037 129.0070 500,000.00 639,905.00 608,422.64 645,035.00NORFOLK 2.903% 02/23 655844BL1 2.9030 2/15/2023 98.8860 825,000.00 829,074.00 827,028.12 815,809.50OVERSEAS 3.19% 10/34 690353T64 3.1900 10/5/2034 99.7010 905,000.00 905,000.00 905,000.00 902,294.05OVERSEAS 3.37% 10/34 6903532V8 3.3700 10/5/2034 101.2046 695,000.00 695,000.00 695,000.00 703,371.97PNC BANK NA 2.5% 01/21 69353RFH6 2.5000 1/22/2021 98.9878 350,000.00 345,198.00 345,377.48 346,457.20REINAUER 5.875% 11/26 759330AA1 5.8750 11/30/2026 109.0460 527,000.00 569,071.43 554,224.10 574,672.42SMALL 6.12% 09/21 83162CLT8 6.1200 9/1/2021 101.7770 34,418.46 35,338.51 34,574.05 35,030.08UNITED 5.34% 11/21 83162CLW1 5.3400 11/1/2021 100.0000 0.11 0.11 0.11 0.11SOUTH 6.05% 01/38 837004CB4 6.0500 1/15/2038 120.4360 575,000.00 604,621.25 596,466.61 692,507.00TENNESSEE ZERO 01/27 88059ENL4 - 1/15/2027 77.8910 667,000.00 311,112.77 311,112.77 519,532.97TENNESSEE 4.65% 06/35 880591DX7 4.6500 6/15/2035 113.8900 700,000.00 636,727.00 659,843.17 797,230.00TORCHMARK 3.8% 09/22 891027AQ7 3.8000 9/15/2022 100.7060 380,000.00 381,908.60 380,694.05 382,682.80TOTE 3.45% 01/41 89156HAB3 3.4500 1/22/2041 98.5920 687,000.00 684,197.04 684,299.75 677,327.04US BANCORP 3.6% 09/24 91159HHK9 3.6000 9/11/2024 101.6430 658,000.00 702,681.30 689,024.95 668,810.94UNITED 3.46% 08/31 911759LV8 3.4600 8/1/2031 98.6690 570,000.00 569,775.00 569,785.90 562,413.30UNUM GROUP 3.875% 11/25 91529YAL0 3.8750 11/5/2025 97.6570 344,000.00 342,846.77 343,190.80 335,940.08VESSEL 5.125% 04/35 925387AE2 5.1250 4/16/2035 110.7330 365,000.00 365,000.00 365,000.00 404,175.45WASTE 3.9% 03/35 94106LBB4 3.9000 3/1/2035 98.1900 625,000.00 639,193.75 636,479.76 613,687.50
20,722,241.64 21,169,504.67 21,060,916.99 21,834,086.54 FHLMC
FHLMCGLD 7.645% 05/25 3128HJAH9 7.6450 5/1/2025 111.5330 457,023.10 529,851.73 493,514.55 509,731.57
Page 1 of 4

Account: 3016142600 VA GENERAL/EARNEST PARTNE Created: 6-Feb-2019 02:10:19 AM [CST]
Audited Market Value - MonthlyAs of Jan 31, 2019
Description Security Coupon Rate Maturity Date Price (Base) Shares/Par Cost (Base) Amortized Cost Traded Market Value
FHLMCGLD 2.64% 06/33 3132WXAB6 2.6400 6/1/2033 92.2260 889,512.82 875,336.21 877,241.97 820,362.091,346,535.92 1,405,187.94 1,370,756.52 1,330,093.66
FNMAFNMA MORTPASS 3% 03/42 3138EBPJ8 3.0000 3/1/2042 98.8120 483,345.01 469,448.84 471,800.43 477,602.87FNMA MORTPASS 3.54% 06/45 3138LACD9 3.5400 6/1/2045 101.4790 656,916.05 649,525.75 649,531.14 666,631.84FNMA MORTPASS 3.75% 12/37 3138LGJT4 3.7500 12/1/2037 102.4800 756,268.49 745,869.79 746,273.56 775,023.95FNMA MORTPASS 3.5% 06/42 3138LUSZ9 3.5000 6/1/2042 101.1560 171,634.22 179,008.33 177,910.38 173,618.31FNMA MORTPASS 3.5% 02/45 3138WD2R1 3.5000 2/1/2045 101.0640 537,096.19 570,832.55 567,927.68 542,810.89FNMA MORTPASS 3.5% 08/45 3138WFKJ4 3.5000 8/1/2045 100.9560 769,749.84 803,816.72 800,777.09 777,108.65FNMA MORTPASS 3.5% 04/43 3138WMW49 3.5000 4/1/2043 101.2030 415,903.31 419,867.43 419,205.04 420,906.63FNMA MORTPASS 3% 07/43 3138X0Y28 3.0000 7/1/2043 98.7500 1,163,737.98 1,185,865.81 1,183,268.22 1,149,191.26FNMA MORTPASS 4% 10/43 3138X6P66 4.0000 10/1/2043 103.0690 341,852.94 358,358.01 355,526.84 352,344.41FNMA MORTPASS 3.5% 02/45 3138Y9RV2 3.5000 2/1/2045 101.0640 594,472.12 612,965.63 610,696.71 600,797.30FNMA MORTPASS 5.06% 01/30 31381LQS9 5.0600 1/1/2030 112.5230 1,041,111.35 1,070,067.27 1,057,161.76 1,171,489.72FNMA MORTPASS 4.96% 06/30 31381MR56 4.9600 6/1/2030 111.3940 589,534.76 688,281.83 672,223.62 656,706.35FNMA MORTPASS 4.68% 08/28 31381NKY8 4.6800 8/1/2028 107.8660 525,838.37 534,218.92 530,457.74 567,200.82FNMA MORTPASS 5.62% 06/41 31381RFK5 5.6200 6/1/2041 109.3470 668,638.73 687,235.27 682,613.20 731,136.39FNMA MORTPASS 3.49% 07/30 31381VD36 3.4900 7/1/2030 101.9910 611,846.91 638,137.23 628,720.10 624,028.78FNMA MORTPASS 3.3% 07/32 31381VHP3 3.3000 7/1/2032 101.0520 1,190,727.77 1,230,170.65 1,217,523.99 1,203,254.23FNMA MORTPASS 4% 01/46 3140EUE39 4.0000 1/1/2046 102.7330 795,335.96 852,500.73 847,354.75 817,072.49FNMA MORTPASS 3.5% 11/47 3140GUMA2 3.5000 11/1/2047 100.5080 1,266,606.31 1,303,664.42 1,302,210.56 1,273,040.67FNMA MORTPASS 5.26% 01/25 31409LGT6 5.2600 1/1/2025 103.7240 567,039.36 591,004.72 577,353.48 588,155.91FNMA MORTPASS 6% 10/37 31410GNB5 6.0000 10/1/2037 100.0000 0.02 0.02 0.02 0.02FNMA MORTPASS 5.03% 05/24 31413XU27 5.0300 5/1/2024 110.1600 935,163.10 989,838.83 975,704.87 1,030,175.67FNMA MORTPASS 4% 01/41 31416XHV5 4.0000 1/1/2041 102.5990 175,696.35 173,143.28 173,807.39 180,262.70FNMA MORTPASS 3.5% 05/43 31417GGC4 3.5000 5/1/2043 101.1550 412,580.96 410,969.35 411,239.38 417,346.27FNMA 4.821% 07/19 31418MDF6 4.8210 7/1/2019 100.4880 207,897.06 221,146.06 208,581.81 208,911.60FNMA 4.785% 08/19 31418MFG2 4.7850 8/1/2019 100.7250 252,767.30 265,711.76 253,475.88 254,599.86FNMA 4.501% 01/20 31418M2U5 4.5010 1/1/2020 101.0440 305,721.55 314,773.80 306,628.22 308,913.28FNMA MORTPASS 4% 12/39 31419AGZ4 4.0000 12/1/2039 103.2130 406,946.37 418,932.19 416,539.37 420,021.56FNMA MORTPASS 4.5% 10/40 31419FU79 4.5000 10/1/2040 105.1120 165,958.75 176,167.13 173,920.41 174,442.56
16,010,387.13 16,561,522.32 16,418,433.64 16,562,794.99 Government Bond
STATE OF ZERO 02/24 465139RG0 - 2/15/2024 86.7800 1,500,000.00 793,230.00 793,230.00 1,301,700.001,500,000.00 793,230.00 793,230.00 1,301,700.00
GNMA1 (15 Day Lag)GNMA I MORTPASS 4% 01/29 3620ANRW2 4.0000 1/15/2029 101.2520 453,749.44 456,660.83 455,551.22 459,430.38GNMA I 3.85% 07/36 36230MFL6 3.8500 7/15/2036 101.2660 790,410.13 838,442.09 831,650.28 800,416.72
1,244,159.57 1,295,102.92 1,287,201.50 1,259,847.10 GNMA1 (20 Day Lag)
GNMA II VAR 11/62 36176HLE2 4.5680 11/20/2062 100.8809 348,182.91 388,570.87 383,733.86 351,250.09GNMA II 4.5% 04/35 36202EDD8 4.5000 4/20/2035 104.4630 38,382.15 36,606.97 37,382.44 40,095.15GNMA II 5.5% 05/35 36202EDQ9 5.5000 5/20/2035 109.1880 68,179.72 67,539.93 67,804.47 74,444.07GNMA II MORTPASS 5% 09/35 36202EE88 5.0000 9/20/2035 106.5260 41,754.35 40,872.68 41,247.01 44,479.24
Page 2 of 4

Account: 3016142600 VA GENERAL/EARNEST PARTNE Created: 6-Feb-2019 02:10:19 AM [CST]
Audited Market Value - MonthlyAs of Jan 31, 2019
Description Security Coupon Rate Maturity Date Price (Base) Shares/Par Cost (Base) Amortized Cost Traded Market Value
496,499.13 533,590.45 530,167.78 510,268.55 Municipal Bond
BRISTOL VA GO 4.14% 01/37 110331PN9 4.1400 1/1/2037 100.8720 680,000.00 686,222.00 685,957.19 685,929.60CALIFORNIA ST 7.3% 10/39 13063A7D0 7.3000 10/1/2039 139.9060 470,000.00 688,451.30 672,460.62 657,558.20LOS ANGELES 5.75% 07/34 544646XZ0 5.7500 7/1/2034 120.5890 580,000.00 710,104.30 700,398.50 699,416.20WASHINGTON 5.481% 08/39 93974CPM6 5.4810 8/1/2039 120.1410 515,000.00 628,804.70 613,593.35 618,726.15
2,245,000.00 2,713,582.30 2,672,409.66 2,661,630.15 Money Market
INVESCO VAR 12/99 00499KPA5 2.3287 12/31/2099 100.0000 1,784,368.65 1,784,368.65 1,784,368.65 1,784,368.651,784,368.65 1,784,368.65 1,784,368.65 1,784,368.65
Mortgage RelatedAMERICAN 5.25% 01/21 023767AA4 5.2500 7/31/2022 101.6800 326,971.37 355,977.70 340,837.60 332,464.49AMERICAN 3.7% 10/26 02377AAA6 3.7000 4/1/2028 97.7620 284,655.06 288,595.46 287,891.42 278,284.48BURLINGTON 5.14% 01/21 12189PAM4 5.1400 1/15/2021 100.1737 29,519.61 30,231.86 29,680.46 29,570.88CVS 6.943% 01/30 126650BQ2 6.9430 1/10/2030 112.1570 587,586.44 615,311.91 609,305.12 659,019.32DELTA AIR 4.95% 05/19 247361ZH4 4.9500 11/23/2020 100.4300 97,262.83 100,739.99 98,245.03 97,681.06GNMA 2009-108 WG 4% 09/38 38376ETD7 4.0000 9/20/2038 100.0000 0.14 0.14 0.14 0.14UNITED STATES 7.59% 01/20 83162CKM4 7.5900 1/1/2020 101.7280 28,088.67 31,327.01 28,526.72 28,574.04UNITED STATES 6.07% 03/22 83162CMC4 6.0700 3/1/2022 102.5220 42,438.50 45,587.92 43,424.53 43,508.80UNITED STATES 5.08% 11/22 83162CMQ3 5.0800 11/1/2022 102.1600 87,871.12 93,712.37 90,212.90 89,769.14UNITED STATES 4.34% 03/24 83162CNQ2 4.3400 3/1/2024 102.1030 43,239.88 40,064.21 42,319.68 44,149.21UNITED STATES 4.99% 09/24 83162CPA5 4.9900 9/1/2024 103.4900 113,218.24 121,063.23 117,161.15 117,169.56UNITED STATES 4.88% 11/24 83162CPD9 4.8800 11/1/2024 103.4010 66,284.33 69,370.69 67,489.79 68,538.66UNITED STATES 4.57% 06/25 83162CPP2 4.5700 6/1/2025 102.7970 96,223.79 92,314.70 94,863.38 98,915.17UNITED STATES 5.09% 10/25 83162CPV9 5.0900 10/1/2025 103.4130 89,589.15 94,919.62 92,140.61 92,646.83UNITED STATES 5.7% 08/26 83162CQL0 5.7000 8/1/2026 104.8000 113,843.15 113,843.15 113,843.15 119,307.62UNITED STATES 5.36% 11/26 83162CQR7 5.3600 11/1/2026 104.3770 95,108.12 95,539.08 95,281.53 99,271.00UNITED STATES 5.71% 06/27 83162CRB1 5.7100 6/1/2027 105.3030 140,146.52 142,175.41 141,317.69 147,578.49UNITED STATES 5.29% 12/27 83162CRL9 5.2900 12/1/2027 104.0570 108,856.87 113,627.47 111,604.03 113,273.19UNITED STATES 5.49% 03/28 83162CRR6 5.4900 3/1/2028 106.8140 176,565.71 188,576.29 183,886.54 188,596.90UNITED STATES 5.68% 06/28 83162CRV7 5.6800 6/1/2028 107.3280 79,670.44 79,670.44 79,670.44 85,508.69UNITED STATES 5.63% 10/28 83162CSB0 5.6300 10/1/2028 107.2890 224,285.94 238,521.06 234,040.00 240,634.14UNITED STATES 6.77% 11/28 83162CSD6 6.7700 11/1/2028 109.0240 142,360.96 153,120.52 149,813.01 155,207.61UNITED STATES 6.22% 12/28 83162CSE4 6.2200 12/1/2028 108.9470 220,511.79 253,673.10 242,595.43 240,240.98UNITED STATES 4.66% 03/29 83162CSK0 4.6600 3/1/2029 105.7050 241,527.98 250,572.90 247,025.14 255,307.15UNITED STATES 4.95% 06/29 83162CSP9 4.9500 6/1/2029 106.8620 241,471.16 264,126.50 254,876.63 258,040.91UNITED STATES 3.92% 10/29 83162CSV6 3.9200 10/1/2029 103.8280 251,087.21 277,608.29 268,187.08 260,698.83UNITED STATES 2.76% 10/31 83162CUH4 2.7600 10/1/2031 98.6900 535,678.51 538,691.71 538,017.94 528,661.12UNITED STATES 2.13% 01/33 83162CVG5 2.1300 1/1/2033 96.0740 757,059.91 731,486.41 737,499.20 727,337.74UNITED STATES 3.15% 07/33 83162CVR1 3.1500 7/1/2033 100.4070 812,955.35 827,866.31 824,300.12 816,264.08UNITED STATES 3.16% 08/33 83162CVS9 3.1600 8/1/2033 100.4100 1,061,795.53 1,076,067.12 1,073,936.61 1,066,148.89UNITED STATES 3.11% 04/34 83162CWE9 3.1100 4/1/2034 100.5220 756,888.00 787,400.04 782,554.05 760,838.96UNITED STATES 2.87% 07/34 83162CWK5 2.8700 7/1/2034 99.6680 646,038.58 649,462.29 648,722.51 643,893.73UNITED STATES 2.88% 08/34 83162CWL3 2.8800 8/1/2034 99.7960 593,087.59 599,925.06 599,209.67 591,877.69
Page 3 of 4

Account: 3016142600 VA GENERAL/EARNEST PARTNE Created: 6-Feb-2019 02:10:19 AM [CST]
Audited Market Value - MonthlyAs of Jan 31, 2019
Description Security Coupon Rate Maturity Date Price (Base) Shares/Par Cost (Base) Amortized Cost Traded Market Value
UNITED STATES 2.46% 02/35 83162CWV1 2.4600 2/1/2035 96.3670 530,385.42 546,545.61 544,416.56 511,116.52UNITED STATES 2.82% 08/35 83162CXE8 2.8200 8/1/2035 98.3440 840,658.38 838,578.64 838,434.42 826,737.08UNITED STATES 2.78% 01/36 83162CXN8 2.7800 1/1/2036 97.9160 1,088,590.22 1,105,075.24 1,103,027.51 1,065,904.00UNITED STATES 2.82% 02/37 83162CYH0 2.8200 2/1/2037 98.2960 631,607.68 631,607.68 631,607.68 620,845.09UNITED STATES 2.75% 08/37 83162CYU1 2.7500 8/1/2037 97.9740 613,552.38 613,552.38 613,552.38 601,121.81UNITED STATES 2.59% 09/37 83162CYW7 2.5900 9/1/2037 96.3190 681,164.90 681,164.90 681,164.90 656,091.22UNITED STATES 3.22% 02/38 83162CZF3 3.2200 2/1/2038 100.2640 1,352,921.29 1,352,921.29 1,352,921.29 1,356,493.00UNITED STATES 3.2% 03/38 83162CZH9 3.2000 3/1/2038 100.2290 651,385.17 651,385.17 651,385.17 652,876.84UNITED STATES 3.68% 07/43 83162CZQ9 3.6800 7/1/2043 102.2000 831,742.87 831,742.87 831,742.87 850,041.21SBA SMALL 2.845% 03/27 831641FH3 2.8450 3/10/2027 100.3470 680,087.90 680,087.90 680,087.90 682,447.81SBA SMALL 3.548% 09/28 831641FL4 3.5480 9/11/2028 103.1940 700,000.00 700,000.00 700,000.00 722,358.00SOUTHWEST 6.15% 08/22 84474YAA4 6.1500 2/1/2024 104.9473 459,087.35 520,490.27 487,896.70 481,799.82UNION 2.695% 05/27 90782JAA1 2.6950 5/12/2027 96.5193 443,115.17 443,115.17 443,115.17 427,691.53UNION 4.698% 01/24 90783SAA0 4.6980 1/2/2024 103.3445 181,999.11 196,709.56 188,399.23 188,086.00UNITED 3.75% 09/26 90932QAA4 3.7500 3/3/2028 97.9500 704,939.63 731,494.75 723,431.30 690,488.37
19,483,125.92 19,885,641.39 19,739,662.38 19,613,077.80 T-Bond
UNITED STATES ZERO 05/40 912803DM2 - 5/15/2040 53.5600 1,875,000.00 765,112.50 1,008,626.57 1,004,250.00UNITED STATES ZERO 05/43 912803EC3 - 5/15/2043 47.9000 1,535,000.00 657,621.25 728,660.39 735,265.00UNITED STATES ZERO 05/45 912803EN9 - 5/15/2045 45.1040 3,145,000.00 1,407,324.60 1,447,465.01 1,418,520.80UNITED STATES ZERO 05/48 912803FD0 - 5/15/2048 40.8760 2,815,000.00 1,135,880.65 1,170,625.89 1,150,659.40
9,370,000.00 3,965,939.00 4,355,377.86 4,308,695.20 Totals $74,202,317.97 $70,107,669.64 $70,012,524.98 $71,166,562.64
Page 4 of 4

SECURITIES LENDING
Investment Holdings Report
Run time 01-Feb-2019 08:06 EST
Date Asof 31-JAN-2019
Investment Account Not Specified
Master Client COV
Security ID Trade Date/Settle Date
PurchasePrice
Par BookValue
AmountInvested
MarketValue
MoneyMarketYield
Security Description Maturity Date/ExpectedMaturity
S&P MDY Variance%
Commonwealth of Virginia Dept of the TreasuryOutstanding Positions
USD
Open Triparty Set 3
ALDBB0004115-Aug-201815-Aug-2018 100.00 75,000,000 75,000,00075,000,000 75,000,0002.590000Deutsche Bank Securities Inc
OBFR+20A-1 P-1 0.00OPEN
BARLO0000008-Jan-201914-Aug-2018 100.00 25,000,000 25,000,00025,000,000 25,000,0002.490000Barclays Bank PLC London
OBFR+10A-1+ P-1 0.00OPEN
PERSH0000107-Jan-201915-Aug-2018 100.00 75,000,000 75,000,00075,000,000 75,000,0002.640000Pershing LLC
OBFR+25A-1 P-1 0.00OPEN
SUBTOTAL 175,000,000 2.597143 175,000,000 175,000,000 0.00
Triparty Set 1
CANTO000FE31-Jan-201931-Jan-2019 100.00 2,023,443 2,023,4432,023,443 2,023,4432.570000CANTOR FITZGERALD & CO.
FIXEDNR NR 0.0001-Feb-2019
HSBCS0009631-Jan-201931-Jan-2019 100.00 12,500,000 12,500,00012,500,000 12,500,0002.540000HSBC SECURITIES USA INC
FIXEDA-1+ NR 0.0001-Feb-2019
JEFFC001B231-Jan-201931-Jan-2019 100.00 25,000,000 25,000,00025,000,000 25,000,0002.590000Jefferies & Company Inc
FIXEDNR NR 0.0001-Feb-2019
JEFFC001B331-Jan-201931-Jan-2019 100.00 25,000,000 25,000,00025,000,000 25,000,0002.550000Jefferies & Company Inc
FIXEDNR NR 0.0001-Feb-2019
JEFFC001B631-Jan-201931-Jan-2019 100.00 25,000,000 25,000,00025,000,000 25,000,0002.570000Jefferies & Company Inc
FIXEDNR NR 0.0001-Feb-2019
SUBTOTAL 89,523,443 2.565811 89,523,443 89,523,443 0.00
Page 1 of 3

Security ID Trade Date/Settle Date
PurchasePrice
Par BookValue
AmountInvested
MarketValue
MoneyMarketYield
Security Description Maturity Date/ExpectedMaturity
S&P MDY Variance%
Triparty Set 2
BRCCA0052731-Jan-201931-Jan-2019 100.00 75,000,000 75,000,00075,000,000 75,000,0002.680000Barclays Capital Inc
OBFR+29A-1 P-1 0.0001-May-2019
CITGM0023131-Jan-201931-Jan-2019 100.00 90,000,000 90,000,00090,000,000 90,000,0002.690000Citigroup Global Markets Inc.
OBFR+30A-1 P-2 0.0022-Mar-2019
SUBTOTAL 165,000,000 2.685455 165,000,000 165,000,000 0.00
Triparty Set 3
BNPPR0010704-Jan-201904-Jan-2019 100.00 50,000,000 50,000,00050,000,000 50,000,0002.660000BNP Paribas Paris
OBFR+27A-1 P-1 0.0005-Mar-2019
BNPPR0013A31-Jan-201931-Jan-2019 100.00 15,000,000 15,000,00015,000,000 15,000,0002.680000BNP Paribas Paris
OBFR+29A-1 P-1 0.0001-May-2019
GOLDM0025731-Jan-201931-Jan-2019 100.00 60,000,000 60,000,00060,000,000 60,000,0002.700000Goldman Sachs & Co.
OBFR+31A-1 NR 0.0001-May-2019
JEFFC001A825-Jan-201925-Jan-2019 100.00 75,000,000 75,000,00075,000,000 75,000,0002.940000Jefferies & Company Inc
OBFR+55NR NR 0.0026-Mar-2019
MERPF0004422-Jan-201922-Jan-2019 100.00 60,000,000 60,000,00060,000,000 60,000,0002.590000MERRILL LYNCH PIERCE FENNER
OBFR+20A-1 NR 0.0008-Mar-2019
MORGC0033830-Jan-201930-Jan-2019 100.00 75,000,000 75,000,00075,000,000 75,000,0002.740000Morgan Stanley & Co. Inc.
OBFR+35A-2 P-2 0.0004-Mar-2019
NOMIN001C131-Jan-201931-Jan-2019 100.00 82,500,000 82,500,00082,500,000 82,500,0002.860000NOMURA SECURITIES INTL
OBFR+47NR NR 0.0003-May-2019
SOCGP000F431-Jan-201931-Jan-2019 100.00 85,000,000 85,000,00085,000,000 85,000,0002.620000Societe Generale Paris
OBFR+23A-1 P-1 0.0005-Mar-2019
SUBTOTAL 502,500,000 2.736816 502,500,000 502,500,000 0.00
TOTAL 932,023,443 932,023,443 932,023,443 0.00
PORTFOLIO YIELD
UNREALIZED GAIN/LOSS
2.685072
0
Page 2 of 3

Security ID Trade Date/Settle Date
PurchasePrice
Par BookValue
AmountInvested
MarketValue
MoneyMarketYield
Security Description Maturity Date/ExpectedMaturity
S&P MDY Variance%
This document is intended for discussion purposes only and does not create any legally binding obligations on the part of Deutsche Bank AG and/or its affiliates ("DB"). Without limitation, this document does not constitute a DB's view, an offer, aninvitation to offer or a recommendation to enter into any transaction. DB is not acting as your financial advisor or in any other fiduciary capacity with respect to this document. The transaction(s) or product(s) mentioned herein may not be appropriate forall users and before entering into any transaction you should take steps to ensure that you fully understand the transaction and have made an independent assessment of the appropriateness of the transaction in the light of your own objectives andcircumstances, including the possible risks and benefits of entering into such transaction. You should also consider seeking advice from your own advisers in making this assessment. If you decide to enter into a transaction with DB, you do so in relianceon your own judgment. The information contained in this document is based on material we believe to be reliable; however, we do not represent that it is accurate, current, complete, or error free. Any opinions expressed herein may differ from theopinions expressed by other DB departments. DB may engage in transactions in a manner inconsistent with the views discussed herein. DB trades or may trade as principal in the instruments (or related derivatives) discussed herein. The distribution ofthis document and availability of these products and services in certain jurisdictions may be restricted by law. You may not distribute this document, in whole or in part, without our express written permission. DB SPECIFICALLY DISCLAIMS ALLLIABILITY FOR ANY DIRECT INDIRECT, CONSEQUENTIAL OR OTHER LOSSES OR DAMAGES INCLUDING LOSS OF PROFITS INCURRED BY YOU OR ANY THIRD PARTY THAT MAY ARISE FROM ANY RELIANCE ON THIS DOCUMENTFOR THE RELIABILTY, ACCURACY, COMPLETENESS OR TIMELINESS THEREFORE. Deutsche Bank AG, including its subsidiaries and affiliates, does not provide legal, tax or accounting advice. The recipient of this communication should seekadvice from an independent tax advisor regarding any tax matters addressed herein based on its particular circumstances. DB is authorized under German Banking Law (competent authority: BaFin - Federal Financial Supervising Authority) andregulated by the Financial Services Authority for the conduct of UK business. Copyright @ 2017 Deutsche Bank AG. All rights reserved.
Page 3 of 3

LGIP Compliance Investment staff affirms the portfolio complies with the following standards at
time of purchase for the month of January 2019. Maturity Requirements
o LGIP portfolio weighted average maturity ≤ 60-days (WAM). o LGIP portfolio weighted average final maturity ≤120-days (WAL).
Liquidity Requirements
o Daily Liquid Assets ≥10% of Total Assets. o Weekly Liquid Assets (WLA) ≥ 30% of Total Assets. o ≤ 5% of Total Assets in Illiquid Securities.
Portfolio Quality o All security purchases were Eligible Securities. o All holdings were Eligible Securities.
Stress Test (Weekly) subject to:
o Interest rate movements. o Credit spread widening. o Current market NAV of portfolio. o Shareholder redemptions.
Comments: The Stress Test indicates that the LGIP can maintain a stable net asset value per share based upon the hypothetical event assumptions developed by management using worst case scenarios.
Shadow Price NAV
o Determined weekly using JPMorgan’s third party pricing services.
Comments: Board will be advised if Shadow Price NAV deviation from the amortized cost price per share exceeds ½ of 1 percent.
Definitions:
o Daily Liquid Assets: Securities that will mature or are subject to a Demand Feature that is exercisable and payable within one Business Day and direct obligations of the U.S. Government.
o Weekly Liquid Assets: Securities that will mature or are subject to a Demand Feature that is exercisable and payable within five Business Days, Direct obligations of the U.S. Government, and Government Securities issued at a discount having a remaining maturity date of 60 days or less (e.g. government agency discount notes).
o Liquid Securities: Securities which can be sold or disposed of within 7 calendar days at approximately the values ascribed to it by the Fund.
o Eligible Securities: Securities that meet the LGIP’s credit quality, issuer limits, and maturity requirements.

Government Securities Jan Dec Change
US Govt MMK Funds 1.9% 1.2% 0.7%
Repurchase Agreements 16.0% 15.6% 0.4%
U.S. Treasury 0.0% 0.0% 0.0%
Agency Securities 16.9% 19.2% -2.3%
AAA Sovereign 0.0% 0.0% 0.0%Sub-Total 34.8% 36.0% -1.2%
Credit Securities
CD's, Bank Notes & Bankers Acceptance 34.0% 33.2% 0.8%
Commercial Paper 30.9% 30.2% 0.7%
Corporate Notes 0.3% 0.6% -0.3%Sub-Total 65.2% 64.0% 1.2%
Total 100% 100%
Asset allocation calculations are based on end of month balance while portfolio compliance is measured at the time an asset is purchased.
Totals may not add due to rounding.
Asset Allocation and Risk ProfileLocal Government Investment Pool
January 31, 2019
2

FISCAL YEAR Average Average Treasury 3-Month iMoneyNet2019 Average Bal. Maturity Maturity Gross Constant Money Fund Monitor TM
$ (millions) (WAM)r (WAM)f Yield % Maturity1 Institutional Index
July 2018 $4,994.0 44 84 2.15% 1.99% 1.66%
August 2018 $4,614.7 45 84 2.17% 2.07% 1.69%
September 2018 $4,229.5 50 91 2.21% 2.17% 1.74%
October 2018 $4,024.1 50 89 2.33% 2.29% 1.89%
November 2018 $4,253.2 53 82 2.39% 2.37% 1.96%
December 2018 $4,990.5 55 93 2.49% 2.41% 2.06%
January 2019 $5,025.1 45 85 2.60% 2.42% 2.16%
February 2019
March 2019
April 2019
May 2019
June 2019
Year-to-Date Average2$4,590.2 49 87 2.34% 2.25% 1.88%
1 Federal Reserve Bank H.15 Release.
2 YTD average is weighted for the LGIP.
LGIP YIELD COMPARISONS
LGIP
3 2/12/2019 1:43 PM

Account: 3015463600 - LGIP INVESTMENT A/C Created: 07 Feb 2019 18:53
Security No. Security Description Holding Cost (Local) Price (Local)
O
f
f
Market Value
(Local)Cost (Base) Market Value (Base)
Accrued Income
(Base)
Unrealised
Gain/Loss (Base)
Market Value + Accrued
Income (Base)% of Fund
Account: 3015463600 Base: USD NAV Value: 4,958,299,488.05
Currency: USD Rate: 1.000017325FAA6 CITIBANK NA CALLABLE NOTES FIXED 2% 20/MAR/2019 USD 100014,250,000.00 14,235,750.00 99.9175 14,238,250.00 14,235,750.00 14,238,250.00 104,638.89 2,500.00 14,342,888.89 0.29%
3133EHJD6 FEDERAL FARM CREDIT BANKS BOND VARIABLE 11/MAR/2019 USD 100043,000,000.00 42,996,130.00 99.9995 42,999,776.00 42,996,130.00 42,999,776.00 147,621.36 3,646.00 43,147,397.36 0.87%
3133EJGC7 FEDERAL FARM CREDIT BANKS BOND VARIABLE 13/MAR/2020 USD 100025,000,000.00 24,995,011.00 99.9889 24,997,229.09 24,995,011.00 24,997,229.09 86,979.21 2,218.09 25,084,208.30 0.51%
3133EH2Z5 FEDERAL FARM CREDIT BANKS BOND VARIABLE 18/DEC/2019 USD 100050,000,000.00 49,995,000.00 99.9956 49,997,805.21 49,995,000.00 49,997,805.21 151,180.56 2,805.21 50,148,985.77 1.01%
3133EHU92 FEDERAL FARM CREDIT BANKS BOND VARIABLE 20/SEP/2019 USD 100056,975,000.00 56,955,628.50 99.9873 56,967,747.46 56,955,628.50 56,967,747.46 161,991.00 12,118.96 57,129,738.46 1.15%
3133EJTC3 FEDERAL FARM CREDIT BANKS BOND VARIABLE 29/JUN/2020 USD 100050,000,000.00 49,990,050.00 99.9860 49,993,003.69 49,990,050.00 49,993,003.69 116,818.02 2,953.69 50,109,821.71 1.01%
3133EJTD1 FEDERAL FARM CREDIT BANKS BOND VARIABLE 29/JUN/2020 USD 100025,000,000.00 25,000,000.00 100.0000 25,000,000.00 25,000,000.00 25,000,000.00 59,972.26 0.00 25,059,972.26 0.51%
3130AFK30 FEDERAL HOME LOAN BANKS BOND VARIABLE 10/JUN/2020 USD 500025,000,000.00 25,000,000.00 100.0000 25,000,000.00 25,000,000.00 25,000,000.00 92,888.88 0.00 25,092,888.88 0.51%
3130ADJZ6 FEDERAL HOME LOAN BANKS BOND VARIABLE 28/JAN/2020 USD 500050,000,000.00 50,005,658.50 100.0058 50,002,897.47 50,005,658.50 50,002,897.47 13,538.88 (2,761.03) 50,016,436.35 1.01%
FIXED INCOME Subtotal 339,173,228.00 339,196,708.92 339,173,228.00 339,196,708.92 935,629.06 23,480.92 340,132,337.98 6.86%
AAU9934Z9 BANK OF NOVA SCOTIA/THE REPURCHASE AGREEMENT FIXED 2.53% DTD 31/JAN/2019 DUE 01/FEB/2019550,000,000.00 550,000,000.00 100.0000 550,000,000.00 550,000,000.00 550,000,000.00 38,652.78 0.00 550,038,652.78 11.09%
AAU9955Z3 BANK OF NOVA SCOTIA/THE REPURCHASE AGREEMENT FIXED 2.60% DTD 31/JAN/2019 DUE 01/FEB/2019200,000,000.00 200,000,000.00 100.0000 200,000,000.00 200,000,000.00 200,000,000.00 14,444.44 0.00 200,014,444.44 4.03%
09248U700 BLACKROCK LIQUIDITY FUNDS INSTITUTIONAL SHSFEDFUND PORTFOLIO50,487,397.39 50,487,397.39 100.0000 50,487,397.39 50,487,397.39 50,487,397.39 98,422.77 0.00 50,585,820.16 1.02%
00499KPA5 INVESCO TREASURY PORTFOLIO INST.SHARES FUND 193142,042,329.12 42,042,329.12 100.0000 42,042,329.12 42,042,329.12 42,042,329.12 2,619.66 0.00 42,044,948.78 0.85%
AAU9956Z2 METROPOLITAN LIFE INSURANCE CO REPURCHASE AGREEMENT FIXED 2.57% DTD 31/JAN/2019 DUE45,001,625.00 45,001,625.00 100.0000 45,001,625.00 45,001,625.00 45,001,625.00 3,212.62 0.00 45,004,837.62 0.91%
USD NET PAYABLES 0.00 0.0000 (1,106.41) 0.00 (1,106.41) (11,170,261.98) 0.00 (11,171,368.39) -0.23%
USD NET RECEIVABLES 0.00 0.0000 0.00 0.00 0.00 257,057.07 0.00 257,057.07 0.01%
CASH EQUIVALENTS Subtotal 887,531,351.51 887,530,245.10 887,531,351.51 887,530,245.10 (10,755,852.64) 0.00 876,774,392.46 17.68%
02665KQ67 AMERICAN HONDA FINAN CORPORATE COMMERCIAL PAPER DISCOUNT DTD 06/DEC/2018 DUE 06/MAR/2019 2.69%20,000,000.00 19,869,466.67 99.7580 19,951,600.00 19,869,466.67 19,951,600.00 0.00 82,133.33 19,951,600.00 0.40%
02665KP76 AMERICAN HONDA FINAN CORPORATE COMMERCIAL PAPER DISCOUNT DTD 06/NOV/2018 DUE 07/FEB/2019 2.55%50,000,000.00 49,707,194.44 99.9577 49,978,833.33 49,707,194.44 49,978,833.33 0.00 271,638.89 49,978,833.33 1.01%
02665KRA7 AMERICAN HONDA FINAN CORPORATE COMMERCIAL PAPER DISCOUNT DTD 22/JAN/2019 DUE 10/APR/2019 2.66%15,000,000.00 14,925,625.00 99.5183 14,927,750.00 14,925,625.00 14,927,750.00 0.00 2,125.00 14,927,750.00 0.30%
03785EQ15 APPLE INC CORPORATE COMMERCIAL PAPER DISCOUNT DTD 03/OCT/2018 DUE 01/MAR/2019 2.37%70,000,000.00 69,650,000.00 99.8056 69,863,888.89 69,650,000.00 69,863,888.89 0.00 213,888.89 69,863,888.89 1.41%
03785EPK4 APPLE INC CORPORATE COMMERCIAL PAPER DISCOUNT DTD 22/OCT/2018 DUE 19/FEB/2019 2.39%25,000,000.00 24,896,250.00 99.8755 24,968,875.00 24,896,250.00 24,968,875.00 0.00 72,625.00 24,968,875.00 0.50%
03785EPM0 APPLE INC CORPORATE COMMERCIAL PAPER DISCOUNT DTD 25/OCT/2018 DUE 21/FEB/2019 2.39%50,000,000.00 49,854,750.00 99.8617 49,930,833.33 49,854,750.00 49,930,833.33 0.00 76,083.33 49,930,833.33 1.01%
05252WPR8 AUSTR & NEW ZEALND B CERTIFICATE OF DEPOSIT FIXED DTD 16/AUG/2018 DUE 13/MAY/2019 2.52%40,000,000.00 40,000,000.00 100.0000 40,000,000.00 40,000,000.00 40,000,000.00 473,200.00 0.00 40,473,200.00 0.82%
05252WQJ5 AUSTR & NEW ZEALND B CERTIFICATE OF DEPOSIT FIXED DTD 19/NOV/2018 DUE 28/MAY/2019 2.82%45,000,000.00 45,000,000.00 100.0000 45,000,000.00 45,000,000.00 45,000,000.00 260,850.00 0.00 45,260,850.00 0.91%
06052TD56 BANK OF AMERICA CORP CERTIFICATE OF DEPOSIT FIXED 2.8200% DTD 07/NOV/2018 DUE 02/MAY/201917,000,000.00 17,000,000.00 100.0000 17,000,000.00 17,000,000.00 17,000,000.00 114,523.33 0.00 17,114,523.33 0.35%
06050FDL3 BANK OF AMERICA NA CERTIFICATE OF DEPOSIT VARIABLE DTD 10/JAN/2019 DUE 08/JUL/201970,000,000.00 70,000,000.00 100.0000 70,000,000.00 70,000,000.00 70,000,000.00 118,729.69 0.00 70,118,729.69 1.41%
06370RNB1 BANK OF MONTREAL- CERTIFICATE OF DEPOSIT FIXED DTD 02/NOV/2018 DUE 01/FEB/2019 2.55%30,000,000.00 30,000,000.00 100.0000 30,000,000.00 30,000,000.00 30,000,000.00 193,375.00 0.00 30,193,375.00 0.61%
06370RRG6 BANK OF MONTREAL- CERTIFICATE OF DEPOSIT FIXED DTD 12/DEC/2018 DUE 12/JUN/2019 2.87%23,000,000.00 23,000,000.00 100.0000 23,000,000.00 23,000,000.00 23,000,000.00 93,514.17 0.00 23,093,514.17 0.47%
06370RJD2 BANK OF MONTREAL- CERTIFICATE OF DEPOSIT FIXED DTD 12/SEP/2018 DUE 15/MAR/2019 2.4%14,000,000.00 14,000,000.00 100.0000 14,000,000.00 14,000,000.00 14,000,000.00 132,533.33 0.00 14,132,533.33 0.29%
06370RRY7 BANK OF MONTREAL- CERTIFICATE OF DEPOSIT FIXED DTD 19/DEC/2018 DUE 19/APR/2019 2.8%23,000,000.00 23,000,000.00 100.0000 23,000,000.00 23,000,000.00 23,000,000.00 78,711.11 0.00 23,078,711.11 0.47%
06417GZ76 BANK OF NOVA SCOTIA CERTIFICATE OF DEPOSIT FIXED DTD 14/SEP/2018 DUE 13/MAR/2019 2.52%73,500,000.00 73,500,000.00 100.0000 73,500,000.00 73,500,000.00 73,500,000.00 720,300.00 0.00 74,220,300.00 1.50%
05586FGW1 BNP PARIBAS NEW YORK 29,000,000.00 29,000,000.00 100.0000 29,000,000.00 29,000,000.00 29,000,000.00 174,580.00 0.00 29,174,580.00 0.59%
13606BM37 CANADIAN IMPERIAL BANK OF COMMERCE/NEW YORK NY CERTIFICATE OF DEPOSIT VARIABLE 24/SEP/2019 USD50,000,000.00 50,000,000.00 100.0000 50,000,000.00 50,000,000.00 50,000,000.00 31,655.56 0.00 50,031,655.56 1.01%
13606BE69 CANADIAN IMPERIAL BK CERTIFICATE OF DEPOSIT FIXED DTD 21/SEP/2018 DUE 21/JUN/2019 2.68%29,000,000.00 29,000,000.00 100.0000 29,000,000.00 29,000,000.00 29,000,000.00 287,132.22 0.00 29,287,132.22 0.59%
13606BM60 CANADIAN IMPERIAL BK CERTIFICATE OF DEPOSIT FIXED DTD 28/DEC/2018 DUE 01/JUL/2019 2.83%39,000,000.00 39,000,000.00 100.0000 39,000,000.00 39,000,000.00 39,000,000.00 107,304.17 0.00 39,107,304.17 0.79%
13606BK62 CANADIAN IMPERIAL BK CERTIFICATE OF DEPOSIT FIXED DTD 30/NOV/2018 DUE 29/AUG/2019 2.96%13,500,000.00 13,500,000.00 100.0000 13,500,000.00 13,500,000.00 13,500,000.00 69,930.00 0.00 13,569,930.00 0.27%
16677KP15 CHEVRON CORP CORPORATE COMMERCIAL PAPER DISCOUNT DTD 29/NOV/2018 DUE 01/FEB/2019 2.41%16,000,000.00 15,932,800.00 100.0000 16,000,000.00 15,932,800.00 16,000,000.00 0.00 67,200.00 16,000,000.00 0.32%
16677KP64 CHEVRON CORP CORPORATE COMMERCIAL PAPER DISCOUNT DTD 31/DEC/2018 DUE 06/FEB/2019 2.49%50,000,000.00 49,953,333.33 99.9667 49,983,333.33 49,953,333.33 49,983,333.33 0.00 30,000.00 49,983,333.33 1.01%
17305TZH8 CITIBANK N.A. NEW YORK CERTIFICATE OF DEPOSIT FIXED DTD 14/SEP/2018 DUE 14/MAR/2019 2.51%25,000,000.00 25,000,000.00 100.0000 25,000,000.00 25,000,000.00 25,000,000.00 244,027.78 0.00 25,244,027.78 0.51%
19121BSF7 COCA-COLA COMPANY 25,000,000.00 24,658,750.00 99.2275 24,806,875.00 24,658,750.00 24,806,875.00 0.00 148,125.00 24,806,875.00 0.50%
22549LEX9 CREDIT SUISSE AG/NEW YORK NY CERTIFICATE OF DEPOSIT FIXED 1.75% 12/MAR/2019 USD 100018,117,000.00 18,097,814.10 99.9102 18,100,733.69 18,097,814.10 18,100,733.69 445,627.87 2,919.59 18,546,361.56 0.37%
23341VRE3 DNB BANK ASA, NY BRANC CERTIFICATE OF DEPOSIT FIXED DTD 17/JAN/2019 DUE 17/APR/2019 2.65%43,000,000.00 43,000,000.00 100.0000 43,000,000.00 43,000,000.00 43,000,000.00 47,479.17 0.00 43,047,479.17 0.87%
23341VQH7 DNB BANK ASA, NY BRANC CERTIFICATE OF DEPOSIT FIXED DTD 19/DEC/2018 DUE 20/MAR/2019 2.73%25,000,000.00 25,000,000.00 100.0000 25,000,000.00 25,000,000.00 25,000,000.00 83,416.67 0.00 25,083,416.67 0.51%
23341VRT0 DNB BANK ASA, NY BRANC CERTIFICATE OF DEPOSIT FIXED DTD 25/JAN/2019 DUE 01/FEB/2019 2.38%30,000,000.00 30,000,000.00 100.0000 30,000,000.00 30,000,000.00 30,000,000.00 13,883.33 0.00 30,013,883.33 0.61%
30215HS68 EXPORT DEVELMT CORP CORPORATE COMMERCIAL PAPER DISCOUNT DTD 05/OCT/2018 DUE 06/MAY/2019 2.62%25,000,000.00 24,612,458.33 99.3159 24,828,972.22 24,612,458.33 24,828,972.22 0.00 216,513.89 24,828,972.22 0.50%
30215HSF8 EXPORT DEVELMT CORP CORPORATE COMMERCIAL PAPER DISCOUNT DTD 12/OCT/2018 DUE 15/MAY/2019 2.63%48,000,000.00 47,250,441.67 99.2445 47,637,382.78 47,250,441.67 47,637,382.78 0.00 386,941.11 47,637,382.78 0.96%
30215HSG6 EXPORT DEVELMT CORP CORPORATE COMMERCIAL PAPER DISCOUNT DTD 17/OCT/2018 DUE 16/MAY/2019 2.65%40,000,000.00 39,474,222.22 99.1911 39,676,444.44 39,474,222.22 39,676,444.44 0.00 202,222.22 39,676,444.44 0.80%
30215HRH5 EXPORT DEVELMT CORP CORPORATE COMMERCIAL PAPER DISCOUNT DTD 19/SEP/2018 DUE 17/APR/2019 2.5%25,000,000.00 24,635,416.67 99.4792 24,869,791.67 24,635,416.67 24,869,791.67 0.00 234,375.00 24,869,791.67 0.50%
30215HPB0 EXPORT DEVELMT CORP CORPORATE COMMERCIAL PAPER DISCOUNT DTD 28/AUG/2018 DUE 11/FEB/2019 2.4%25,000,000.00 24,721,666.67 99.9333 24,983,333.33 24,721,666.67 24,983,333.33 0.00 261,666.66 24,983,333.33 0.50%
30215HSM3 EXPORT DEVELMT CORP CORPORATE COMMERCIAL PAPER DISCOUNT DTD 30/NOV/2018 DUE 21/MAY/2019 2.61%50,000,000.00 49,358,333.33 99.1522 49,576,111.11 49,358,333.33 49,576,111.11 0.00 217,777.78 49,576,111.11 1.00%
30229BQ42 EXXON MOBIL CORP CORPORATE COMMERCIAL PAPER DISCOUNT DTD 06/DEC/2018 DUE 04/MAR/2019 2.38%50,000,000.00 49,768,291.67 99.7856 49,892,791.67 49,768,291.67 49,892,791.67 0.00 124,500.00 49,892,791.67 1.01%
30229BPF8 EXXON MOBIL CORP CORPORATE COMMERCIAL PAPER DISCOUNT DTD 19/OCT/2018 DUE 15/FEB/2019 2.31%50,000,000.00 49,929,708.33 99.9063 49,953,138.89 49,929,708.33 49,953,138.89 0.00 23,430.56 49,953,138.89 1.01%
313312BW9 FEDERAL FARM CREDIT DISCOUNT NOTES DISCOUNT NOTES ZERO CPN 14/FEB/2019 USD 100040,000,000.00 39,831,466.67 99.9144 39,965,766.67 39,831,466.67 39,965,766.67 0.00 134,300.00 39,965,766.67 0.81%
313384DU0 FEDERAL HOME LOAN BANKS DISCOUNT NOTES ZERO CPN 01/APR/2019 USD 100050,000,000.00 49,696,666.67 99.6067 49,803,333.34 49,696,666.67 49,803,333.34 0.00 106,666.67 49,803,333.34 1.00%
313384BH1 00011 FEDERAL HOME LOAN BANKS DISCOUNT NOTES ZERO CPN 01/FEB/2019 USD 1000100,000,000.00 99,639,458.33 100.0000 100,000,000.00 99,639,458.33 100,000,000.00 0.00 360,541.67 100,000,000.00 2.02%
313384CM9 FEDERAL HOME LOAN BANKS DISCOUNT NOTES ZERO CPN 01/MAR/2019 USD 100050,000,000.00 49,801,250.00 99.8145 49,907,250.00 49,801,250.00 49,907,250.00 0.00 106,000.00 49,907,250.00 1.01%
313384BV0 FEDERAL HOME LOAN BANKS DISCOUNT NOTES ZERO CPN 13/FEB/2019 USD 100025,000,000.00 24,897,187.50 99.9217 24,980,416.67 24,897,187.50 24,980,416.67 0.00 83,229.17 24,980,416.67 0.50%
313384CC1 FEDERAL HOME LOAN BANKS DISCOUNT NOTES ZERO CPN 20/FEB/2019 USD 100050,000,000.00 49,767,638.89 99.8739 49,936,930.56 49,767,638.89 49,936,930.56 0.00 169,291.67 49,936,930.56 1.01%
313384CE7 FEDERAL HOME LOAN BANKS DISCOUNT NOTES ZERO CPN 22/FEB/2019 USD 100050,000,000.00 49,791,750.00 99.8612 49,930,583.33 49,791,750.00 49,930,583.33 0.00 138,833.33 49,930,583.33 1.01%
313384CL1 FEDERAL HOME LOAN BANKS DISCOUNT NOTES ZERO CPN 28/FEB/2019 USD 1000100,000,000.00 99,768,611.11 99.8215 99,821,500.00 99,768,611.11 99,821,500.00 0.00 52,888.89 99,821,500.00 2.01%
313396DV2 00011 FEDERAL HOME LOAN MORTGAGE CORP DISCOUNT NOTES ZERO CPN 02/APR/2019 USD 100050,000,000.00 49,772,500.00 99.6100 49,805,000.00 49,772,500.00 49,805,000.00 0.00 32,500.00 49,805,000.00 1.00%
4497W1S31 ING (US) FUNDING LLC CORPORATE COMMERCIAL PAPER DISCOUNT DTD 06/AUG/2018 DUE 03/MAY/2019 2.61%32,000,000.00 31,709,111.04 99.3049 31,777,555.50 31,709,111.04 31,777,555.50 0.00 68,444.46 31,777,555.50 0.64%
4497W1SD9 ING (US) FUNDING LLC CORPORATE COMMERCIAL PAPER DISCOUNT DTD 13/NOV/2018 DUE 13/MAY/2019 2.81%10,000,000.00 9,859,222.22 99.2144 9,921,444.44 9,859,222.22 9,921,444.44 0.00 62,222.22 9,921,444.44 0.20%
4497W1SX5 ING (US) FUNDING LLC CORPORATE COMMERCIAL PAPER DISCOUNT DTD 26/NOV/2018 DUE 31/MAY/2019 2.85%12,000,000.00 11,823,920.00 99.0612 11,887,346.67 11,823,920.00 11,887,346.67 0.00 63,426.67 11,887,346.67 0.24%
4497W1SF4 ING US FUNDING LLC COMMERCIAL PAPER DISCOUNT DTD 15/NOV/2018 DUE 15/MAY/2019 0%32,000,000.00 31,547,902.08 99.1960 31,742,728.81 31,547,902.08 31,742,728.81 0.00 194,826.73 31,742,728.81 0.64%
46640QPB1 J.P. MORGAN SECURITIES CORPORATE COMMERCIAL PAPER DISCOUNT DTD 17/MAY/2018 DUE 11/FEB/2019 2.57%40,000,000.00 39,341,222.22 99.9319 39,972,777.78 39,341,222.22 39,972,777.78 0.00 631,555.56 39,972,777.78 0.81%
46640QQF1 J.P. MORGAN SECURITIES CORPORATE COMMERCIAL PAPER DISCOUNT DTD 18/JUN/2018 DUE 15/MAR/2019 2.61%15,000,000.00 14,719,791.67 99.7083 14,956,250.00 14,719,791.67 14,956,250.00 0.00 236,458.33 14,956,250.00 0.30%
46640QQ87 JP MORGAN SECURITIES LLC COMMERCIAL PAPER ZERO CPN DTD 11/JUN/2018 DUE 08/MAR/201925,000,000.00 24,536,722.22 99.7589 24,939,722.22 24,536,722.22 24,939,722.22 0.00 403,000.00 24,939,722.22 0.50%
59157UR10 METLIFE SHORT TERM FDG CORPORATE COMMERCIAL PAPER DISCOUNT DTD 01/OCT/2018 DUE 01/APR/2019 2.5%17,000,000.00 16,868,986.67 99.5542 16,924,217.78 16,868,986.67 16,924,217.78 0.00 55,231.11 16,924,217.78 0.34%
59157UP12 METLIFE SHORT TERM FDG CORPORATE COMMERCIAL PAPER DISCOUNT DTD 02/NOV/2018 DUE 01/FEB/2019 2.64%37,000,000.00 36,776,458.33 100.0000 37,000,000.00 36,776,458.33 37,000,000.00 0.00 223,541.67 37,000,000.00 0.75%
59157UT34 METLIFE SHORT TERM FDG CORPORATE COMMERCIAL PAPER DISCOUNT DTD 30/NOV/2018 DUE 03/JUN/2019 2.73%25,000,000.00 24,773,645.83 99.1019 24,775,486.11 24,773,645.83 24,775,486.11 0.00 1,840.28 24,775,486.11 0.50%
Detailed NAVAs at: 31 Jan 2019
GROUP BY CURRENCY IDENTIFIER = S CONSOLIDATED = NO
Version 2.3 Page 1 of 2
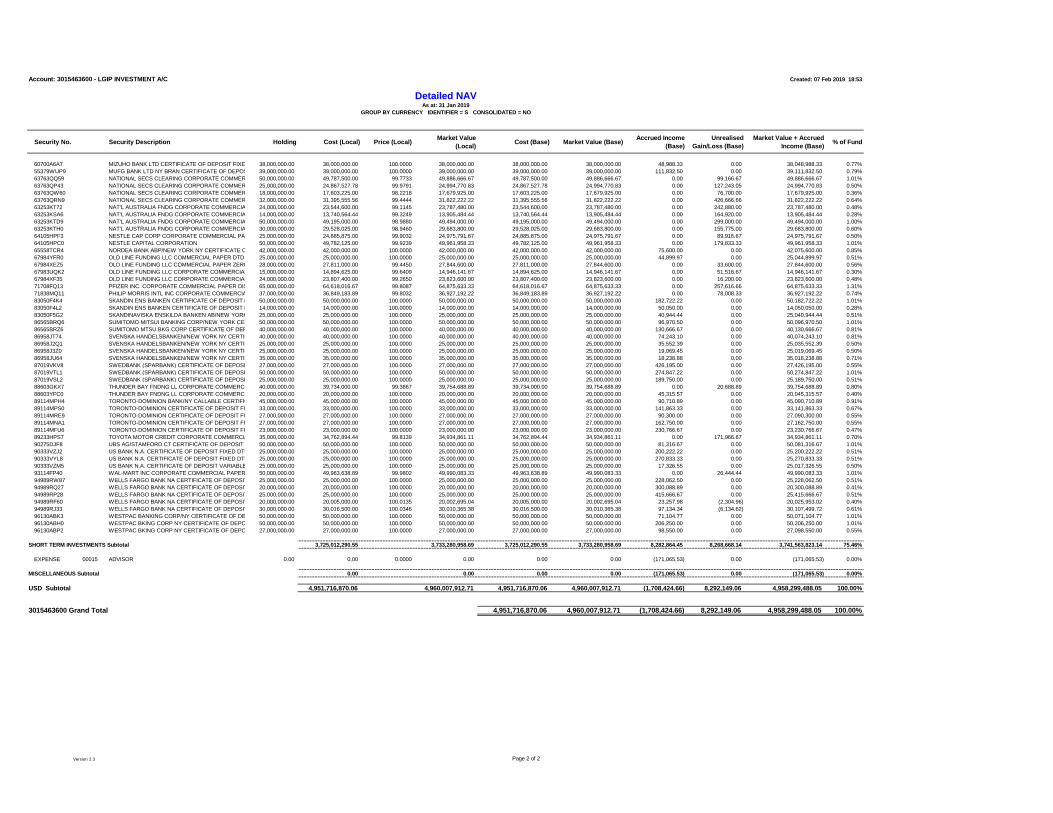
Account: 3015463600 - LGIP INVESTMENT A/C Created: 07 Feb 2019 18:53
Security No. Security Description Holding Cost (Local) Price (Local)
O
f
f
Market Value
(Local)Cost (Base) Market Value (Base)
Accrued Income
(Base)
Unrealised
Gain/Loss (Base)
Market Value + Accrued
Income (Base)% of Fund
Detailed NAVAs at: 31 Jan 2019
GROUP BY CURRENCY IDENTIFIER = S CONSOLIDATED = NO
60700A6A7 MIZUHO BANK LTD CERTIFICATE OF DEPOSIT FIXED DTD 15/JAN/2019 DUE 15/APR/2019 2.73%38,000,000.00 38,000,000.00 100.0000 38,000,000.00 38,000,000.00 38,000,000.00 48,988.33 0.00 38,048,988.33 0.77%
55379WUP9 MUFG BANK LTD NY BRAN CERTIFICATE OF DEPOSIT FIXED DTD 26/DEC/2018 DUE 26/MAR/2019 2.79%39,000,000.00 39,000,000.00 100.0000 39,000,000.00 39,000,000.00 39,000,000.00 111,832.50 0.00 39,111,832.50 0.79%
63763QQ59 NATIONAL SECS CLEARING CORPORATE COMMERCIAL PAPER DISCOUNT DTD 05/SEP/2018 DUE 05/MAR/2019 2.42%50,000,000.00 49,787,500.00 99.7733 49,886,666.67 49,787,500.00 49,886,666.67 0.00 99,166.67 49,886,666.67 1.01%
63763QP43 NATIONAL SECS CLEARING CORPORATE COMMERCIAL PAPER DISCOUNT DTD 08/AUG/2018 DUE 04/FEB/2019 2.4%25,000,000.00 24,867,527.78 99.9791 24,994,770.83 24,867,527.78 24,994,770.83 0.00 127,243.05 24,994,770.83 0.50%
63763QW60 NATIONAL SECS CLEARING CORPORATE COMMERCIAL PAPER DISCOUNT DTD 11/DEC/2018 DUE 06/SEP/2019 3%18,000,000.00 17,603,225.00 98.2218 17,679,925.00 17,603,225.00 17,679,925.00 0.00 76,700.00 17,679,925.00 0.36%
63763QRN9 NATIONAL SECS CLEARING CORPORATE COMMERCIAL PAPER DISCOUNT DTD 24/JUL/2018 DUE 22/APR/2019 2.55%32,000,000.00 31,395,555.56 99.4444 31,822,222.22 31,395,555.56 31,822,222.22 0.00 426,666.66 31,822,222.22 0.64%
63253KT72 NAT'L AUSTRALIA FNDG CORPORATE COMMERCIAL PAPER DISCOUNT DTD 10/SEP/2018 DUE 07/JUN/2019 2.53%24,000,000.00 23,544,600.00 99.1145 23,787,480.00 23,544,600.00 23,787,480.00 0.00 242,880.00 23,787,480.00 0.48%
63253KSA6 NAT'L AUSTRALIA FNDG CORPORATE COMMERCIAL PAPER DISCOUNT DTD 14/AUG/2018 DUE 10/MAY/2019 2.48%14,000,000.00 13,740,564.44 99.3249 13,905,484.44 13,740,564.44 13,905,484.44 0.00 164,920.00 13,905,484.44 0.28%
63253KTD9 NAT'L AUSTRALIA FNDG CORPORATE COMMERCIAL PAPER DISCOUNT DTD 15/NOV/2018 DUE 13/JUN/2019 2.76%50,000,000.00 49,195,000.00 98.9880 49,494,000.00 49,195,000.00 49,494,000.00 0.00 299,000.00 49,494,000.00 1.00%
63253KTH0 NAT'L AUSTRALIA FNDG CORPORATE COMMERCIAL PAPER DISCOUNT DTD 26/NOV/2018 DUE 17/JUN/2019 2.79%30,000,000.00 29,528,025.00 98.9460 29,683,800.00 29,528,025.00 29,683,800.00 0.00 155,775.00 29,683,800.00 0.60%
64105HPF3 NESTLE CAP CORP CORPORATE COMMERCIAL PAPER DISCOUNT DTD 11/DEC/2018 DUE 15/FEB/2019 2.5%25,000,000.00 24,885,875.00 99.9032 24,975,791.67 24,885,875.00 24,975,791.67 0.00 89,916.67 24,975,791.67 0.50%
64105HPC0 NESTLE CAPITAL CORPORATION 50,000,000.00 49,782,125.00 99.9239 49,961,958.33 49,782,125.00 49,961,958.33 0.00 179,833.33 49,961,958.33 1.01%
65558TCR4 NORDEA BANK ABP/NEW YORK NY CERTIFICATE OF DEPOSIT FIXED 2.70% DTD 08/JAN/2019 DUE 08/APR/201942,000,000.00 42,000,000.00 100.0000 42,000,000.00 42,000,000.00 42,000,000.00 75,600.00 0.00 42,075,600.00 0.85%
67984YFR0 OLD LINE FUNDING LLC COMMERCIAL PAPER DTD 09/JAN/2019 DUE 11/JUL/2019 2.81113%25,000,000.00 25,000,000.00 100.0000 25,000,000.00 25,000,000.00 25,000,000.00 44,899.97 0.00 25,044,899.97 0.51%
67984XEZ5 OLD LINE FUNDING LLC COMMERCIAL PAPER ZERO CPN DTD 16/JAN/2019 DUE 16/APR/201928,000,000.00 27,811,000.00 99.4450 27,844,600.00 27,811,000.00 27,844,600.00 0.00 33,600.00 27,844,600.00 0.56%
67983UQK2 OLD LINE FUNDING LLC CORPORATE COMMERCIAL PAPER DISCOUNT DTD 10/DEC/2018 DUE 19/MAR/2019 2.88%15,000,000.00 14,894,625.00 99.6409 14,946,141.67 14,894,625.00 14,946,141.67 0.00 51,516.67 14,946,141.67 0.30%
67984XF35 OLD LINE FUNDING LLC CORPORATE COMMERCIAL PAPER DISCOUNT DTD 23/JAN/2019 DUE 10/MAY/2019 2.7%24,000,000.00 23,807,400.00 99.2650 23,823,600.00 23,807,400.00 23,823,600.00 0.00 16,200.00 23,823,600.00 0.48%
71708FQ13 PFIZER INC. CORPORATE COMMERCIAL PAPER DISCOUNT DTD 03/DEC/2018 DUE 01/MAR/2019 2.5%65,000,000.00 64,618,016.67 99.8087 64,875,633.33 64,618,016.67 64,875,633.33 0.00 257,616.66 64,875,633.33 1.31%
71838MQ11 PHILIP MORRIS INTL INC CORPORATE COMMERCIAL PAPER DISCOUNT DTD 02/JAN/2019 DUE 01/MAR/2019 2.56%37,000,000.00 36,849,183.89 99.8032 36,927,192.22 36,849,183.89 36,927,192.22 0.00 78,008.33 36,927,192.22 0.74%
83050F4K4 SKANDIN ENS BANKEN CERTIFICATE OF DEPOSIT FIXED DTD 17/DEC/2018 DUE 17/JUN/2019 2.86%50,000,000.00 50,000,000.00 100.0000 50,000,000.00 50,000,000.00 50,000,000.00 182,722.22 0.00 50,182,722.22 1.01%
83050F4L2 SKANDIN ENS BANKEN CERTIFICATE OF DEPOSIT FIXED DTD 18/DEC/2018 DUE 18/JUN/2019 2.86%14,000,000.00 14,000,000.00 100.0000 14,000,000.00 14,000,000.00 14,000,000.00 50,050.00 0.00 14,050,050.00 0.28%
83050F5G2 SKANDINAVISKA ENSKILDA BANKEN AB/NEW YORK NY CERTIFICATE OF DEPOSIT FIXED 2.68% DTD 10/JAN/201925,000,000.00 25,000,000.00 100.0000 25,000,000.00 25,000,000.00 25,000,000.00 40,944.44 0.00 25,040,944.44 0.51%
86565BRQ6 SUMITOMO MITSUI BANKING CORP/NEW YORK CERTIFICATE OF DEPOSIT VARIABLE 06/JUN/2019 USD 100050,000,000.00 50,000,000.00 100.0000 50,000,000.00 50,000,000.00 50,000,000.00 96,970.50 0.00 50,096,970.50 1.01%
86565BRZ6 SUMITOMO MTSU BKG CORP CERTIFICATE OF DEPOSIT FIXED DTD 21/DEC/2018 DUE 23/APR/2019 2.8%40,000,000.00 40,000,000.00 100.0000 40,000,000.00 40,000,000.00 40,000,000.00 130,666.67 0.00 40,130,666.67 0.81%
86958JT74 SVENSKA HANDELSBANKEN/NEW YORK NY CERTIFICATE OF DEPOSIT VARIABLE 06/JUN/2019 USD 100040,000,000.00 40,000,000.00 100.0000 40,000,000.00 40,000,000.00 40,000,000.00 74,243.10 0.00 40,074,243.10 0.81%
86958J2Q1 SVENSKA HANDELSBANKEN/NEW YORK NY CERTIFICATE OF DEPOSIT VARIABLE 12/SEP/2019 USD 100025,000,000.00 25,000,000.00 100.0000 25,000,000.00 25,000,000.00 25,000,000.00 35,552.39 0.00 25,035,552.39 0.50%
86958J3Z0 SVENSKA HANDELSBANKEN/NEW YORK NY CERTIFICATE OF DEPOSIT VARIABLE 22/OCT/2019 USD 100025,000,000.00 25,000,000.00 100.0000 25,000,000.00 25,000,000.00 25,000,000.00 19,069.45 0.00 25,019,069.45 0.50%
86958JU64 SVENSKA HANDELSBANKEN/NEW YORK NY CERTIFICATE OF DEPOSIT VARIABLE 25/JUN/2019 USD 100035,000,000.00 35,000,000.00 100.0000 35,000,000.00 35,000,000.00 35,000,000.00 18,238.88 0.00 35,018,238.88 0.71%
87019VKV8 SWEDBANK (SPARBANK) CERTIFICATE OF DEPOSIT FIXED DTD 15/JUN/2018 DUE 13/MAR/2019 2.46%27,000,000.00 27,000,000.00 100.0000 27,000,000.00 27,000,000.00 27,000,000.00 426,195.00 0.00 27,426,195.00 0.55%
87019VTL1 SWEDBANK (SPARBANK) CERTIFICATE OF DEPOSIT FIXED DTD 16/NOV/2018 DUE 18/MAR/2019 2.57%50,000,000.00 50,000,000.00 100.0000 50,000,000.00 50,000,000.00 50,000,000.00 274,847.22 0.00 50,274,847.22 1.01%
87019VSL2 SWEDBANK (SPARBANK) CERTIFICATE OF DEPOSIT FIXED DTD 16/OCT/2018 DUE 18/MAR/2019 2.53%25,000,000.00 25,000,000.00 100.0000 25,000,000.00 25,000,000.00 25,000,000.00 189,750.00 0.00 25,189,750.00 0.51%
88603GKX7 THUNDER BAY FNDNG LL CORPORATE COMMERCIAL PAPER DISCOUNT DTD 25/JAN/2019 DUE 25/APR/2019 2.66%40,000,000.00 39,734,000.00 99.3867 39,754,688.89 39,734,000.00 39,754,688.89 0.00 20,688.89 39,754,688.89 0.80%
88603YFC0 THUNDER BAY FNDNG LL CORPORATE COMMERCIAL PAPER VARIABLE DTD 03/DEC/2018 DUE 03/JUN/201920,000,000.00 20,000,000.00 100.0000 20,000,000.00 20,000,000.00 20,000,000.00 45,315.57 0.00 20,045,315.57 0.40%
89114MPH4 TORONTO-DOMINION BANK/NY CALLABLE CERTIFICATE OF DEPOSIT VARIABLE 06/DEC/2019 USD 100045,000,000.00 45,000,000.00 100.0000 45,000,000.00 45,000,000.00 45,000,000.00 90,710.89 0.00 45,090,710.89 0.91%
89114MPS0 TORONTO-DOMINION CERTIFICATE OF DEPOSIT FIXED DTD 10/DEC/2018 DUE 01/AUG/2019 2.92%33,000,000.00 33,000,000.00 100.0000 33,000,000.00 33,000,000.00 33,000,000.00 141,863.33 0.00 33,141,863.33 0.67%
89114MRE9 TORONTO-DOMINION CERTIFICATE OF DEPOSIT FIXED DTD 20/DEC/2018 DUE 21/MAR/2019 2.8%27,000,000.00 27,000,000.00 100.0000 27,000,000.00 27,000,000.00 27,000,000.00 90,300.00 0.00 27,090,300.00 0.55%
89114MNA1 TORONTO-DOMINION CERTIFICATE OF DEPOSIT FIXED DTD 23/NOV/2018 DUE 25/NOV/2019 3.1%27,000,000.00 27,000,000.00 100.0000 27,000,000.00 27,000,000.00 27,000,000.00 162,750.00 0.00 27,162,750.00 0.55%
89114MFU6 TORONTO-DOMINION CERTIFICATE OF DEPOSIT FIXED DTD 25/SEP/2018 DUE 25/SEP/2019 2.8%23,000,000.00 23,000,000.00 100.0000 23,000,000.00 23,000,000.00 23,000,000.00 230,766.67 0.00 23,230,766.67 0.47%
89233HPS7 TOYOTA MOTOR CREDIT CORPORATE COMMERCIAL PAPER DISCOUNT DTD 18/JUL/2018 DUE 26/FEB/2019 2.46%35,000,000.00 34,762,894.44 99.8139 34,934,861.11 34,762,894.44 34,934,861.11 0.00 171,966.67 34,934,861.11 0.70%
90275DJF8 UBS AG/STAMFORD CT CERTIFICATE OF DEPOSIT FIXED 2.788% DTD 11/JAN/2019 DUE 11/JUL/201950,000,000.00 50,000,000.00 100.0000 50,000,000.00 50,000,000.00 50,000,000.00 81,316.67 0.00 50,081,316.67 1.01%
90333VZJ2 US BANK N.A. CERTIFICATE OF DEPOSIT FIXED DTD 18/OCT/2018 DUE 16/JUL/2019 2.72%25,000,000.00 25,000,000.00 100.0000 25,000,000.00 25,000,000.00 25,000,000.00 200,222.22 0.00 25,200,222.22 0.51%
90333VYL8 US BANK N.A. CERTIFICATE OF DEPOSIT FIXED DTD 29/AUG/2018 DUE 28/MAY/2019 2.5%25,000,000.00 25,000,000.00 100.0000 25,000,000.00 25,000,000.00 25,000,000.00 270,833.33 0.00 25,270,833.33 0.51%
90333VZM5 US BANK N.A. CERTIFICATE OF DEPOSIT VARIABLE DTD 23/OCT/2018 DUE 23/JUL/201925,000,000.00 25,000,000.00 100.0000 25,000,000.00 25,000,000.00 25,000,000.00 17,326.55 0.00 25,017,326.55 0.50%
93114FP40 WAL-MART INC CORPORATE COMMERCIAL PAPER DISCOUNT DTD 24/JAN/2019 DUE 04/FEB/2019 2.41%50,000,000.00 49,963,638.89 99.9802 49,990,083.33 49,963,638.89 49,990,083.33 0.00 26,444.44 49,990,083.33 1.01%
94989RW87 WELLS FARGO BANK NA CERTIFICATE OF DEPOSIT FIXED DTD 01/OCT/2018 DUE 01/JUL/2019 2.67%25,000,000.00 25,000,000.00 100.0000 25,000,000.00 25,000,000.00 25,000,000.00 228,062.50 0.00 25,228,062.50 0.51%
94989RQ27 WELLS FARGO BANK NA CERTIFICATE OF DEPOSIT FIXED DTD 05/JUL/2018 DUE 01/APR/2019 2.56%20,000,000.00 20,000,000.00 100.0000 20,000,000.00 20,000,000.00 20,000,000.00 300,088.89 0.00 20,300,088.89 0.41%
94989RP28 WELLS FARGO BANK NA CERTIFICATE OF DEPOSIT FIXED DTD 14/JUN/2018 DUE 11/MAR/2019 2.58%25,000,000.00 25,000,000.00 100.0000 25,000,000.00 25,000,000.00 25,000,000.00 415,666.67 0.00 25,415,666.67 0.51%
94989RF60 WELLS FARGO BANK NA CERTIFICATE OF DEPOSIT VARIABLE 18/APR/2019 USD 100020,000,000.00 20,005,000.00 100.0135 20,002,695.04 20,005,000.00 20,002,695.04 23,257.98 (2,304.96) 20,025,953.02 0.40%
94989RJ33 WELLS FARGO BANK NA CERTIFICATE OF DEPOSIT VARIABLE 22/MAR/2019 USD 100030,000,000.00 30,016,500.00 100.0346 30,010,365.38 30,016,500.00 30,010,365.38 97,134.34 (6,134.62) 30,107,499.72 0.61%
96130ABK3 WESTPAC BANKING CORP/NY CERTIFICATE OF DEPOSIT VARIABLE 16/SEP/2019 USD 100050,000,000.00 50,000,000.00 100.0000 50,000,000.00 50,000,000.00 50,000,000.00 71,104.77 0.00 50,071,104.77 1.01%
96130ABH0 WESTPAC BKING CORP NY CERTIFICATE OF DEPOSIT FIXED DTD 13/DEC/2018 DUE 13/SEP/2019 2.97%50,000,000.00 50,000,000.00 100.0000 50,000,000.00 50,000,000.00 50,000,000.00 206,250.00 0.00 50,206,250.00 1.01%
96130ABP2 WESTPAC BKING CORP NY CERTIFICATE OF DEPOSIT FIXED DTD 18/DEC/2018 DUE 18/SEP/2019 2.92%27,000,000.00 27,000,000.00 100.0000 27,000,000.00 27,000,000.00 27,000,000.00 98,550.00 0.00 27,098,550.00 0.55%
SHORT TERM INVESTMENTS Subtotal 3,725,012,290.55 3,733,280,958.69 3,725,012,290.55 3,733,280,958.69 8,282,864.45 8,268,668.14 3,741,563,823.14 75.46%
EXPENSE 00015 ADVISOR 0.00 0.00 0.0000 0.00 0.00 0.00 (171,065.53) 0.00 (171,065.53) 0.00%
MISCELLANEOUS Subtotal 0.00 0.00 0.00 0.00 (171,065.53) 0.00 (171,065.53) 0.00%
USD Subtotal 4,951,716,870.06 4,960,007,912.71 4,951,716,870.06 4,960,007,912.71 (1,708,424.66) 8,292,149.06 4,958,299,488.05 100.00%
3015463600 Grand Total 4,951,716,870.06 4,960,007,912.71 (1,708,424.66) 8,292,149.06 4,958,299,488.05 100.00%
Version 2.3 Page 2 of 2

1
LGIP Extended Maturity (EM) Compliance Investment staff affirms the portfolio complies with the following standards at
time of purchase for the month of January 2019 Maturity/Duration Requirements
o The weighted average maturity (WAM) is one year +/-3 months. o The maximum final maturity is five years.
Portfolio Quality
o All holdings and securities purchased were Eligible Securities in compliance with Treasury Board approved guidelines.
Asset Allocation
o The portfolio is currently in compliance with asset allocation guidelines. S&P Global Ratings
o The portfolio is in compliance with S&P requirements for a ‘AAAf’/S1 rating.

Jan Dec Change
US MMK FundsLGIP 2.2% 0.8% 1.4%
Sub-Total 2.2% 0.8% 1.4%
Government SecuritiesUS Gov MMK Funds 0.0% 0.0% 0.0%
Repurchase Agreements 0.0% 0.0% 0.0%
U.S. Treasury 0.0% 0.0% 0.0%
Agency Securities 41.8% 43.9% -2.1%
AAA Sovereign 0.0% 0.0% 0.0%Sub-Total 41.8% 43.9% -2.1%
Credit Securities
CD's, Bank Notes & Bankers Acceptance 22.5% 22.9% -0.4%
Commercial Paper 17.1% 17.1% 0.0%
Corporate Notes 16.4% 15.3% 1.1%Sub-Total 56.0% 55.3% 0.7%
Total 100% 100%Asset allocation calculations are based on end of month balance while portfolio compliance is measured at the time an asset is purchased.
Totals may not add due to rounding.
Asset Allocation and Risk ProfileLocal Government Investment Pool EM
January 31, 2019

FISCAL YEAR2019 Net Asset Value NAV Duration NAV Gross Bank of America Merrill Lynch Duration
$ (millions) (Per Share) (Years) YTM U.S. 1-Year Treasury Bill Index1 (Years)
July 2018 $138.5 $9.95 0.78 2.10% 2.38% 0.87
August 2018 $139.2 $9.95 0.79 2.13% 2.38% 0.87
September 2018 $139.3 $9.94 0.82 2.19% 2.59% 0.86
October 2018 $141.6 $9.94 0.77 2.24% 2.60% 0.85
November 2018 $141.4 $9.95 0.76 2.28% 2.62% 0.85
December 2018 $141.9 $9.96 0.77 2.35% 2.60% 0.84
January 2019 $142.5 $9.97 0.79 2.37% 2.51% 0.83
February 2019
March 2019
April 2019
May 2019
June 2019
Year-to-Date Average2$140.6 $9.95 0.78 2.24% 2.53% 0.85
1 As reported on Bloomberg.2 YTD Average is weighted for the LGIP EM.
LGIP EM & BENCHMARK YIELD AND DURATION COMPARISONS
LGIP EM Benchmark
3 2/12/2019 2:06 PM

LGIP EM HOLDINGSS&P SURVEILLANCE REPORTAs of January 31, 2019
SECURITY TYPES: S&P RATING: MATURITIES:Treasuries 0.0% AAA < 31d 2.3% 0.0
Treasury Notes 0.0% AAA > 365d 0.0% 0.0 0 to 1 Years 74.2%Treasury Bills 0.0% AA+ > 365d 25.8% 6.4 1 to 2 Years 17.0%
Agencies 41.8% AA > 365d 0.0% 0.0 2 to 3 Years 4.2%Discount Notes 0.0% AA- > 365d 0.0% 0.0 3 to 5 Years 4.6%Agency Fixed Rate 41.8% A-1+ < 31d 7.9% 0.1Agency Floating Rate 0.0% A-1+ < 92d 9.2% 0.2
AAA Sovereigns 0.0% A-1+ < 365d 34.8% 2.4Credit 56.0% A-1 < 31d 0.7% 0.1
CP Fixed Rate 14.2% A-1 < 92d 10.9% 2.2ABCP 2.8% A-1 < 365d 8.5% 3.4YCD Fixed Rate 21.2% 100.0% 14.811YCD Floating Rate 1.4% S&P rating AAAfCorporate Fixed Rate 13.3%Corporate Floating Rate 3.0%
Cash 2.3%100.0%
TOP TEN HOLDINGS:CUSIP Issuer Percent of Fund Market Value Maturity DTM
1. 3137EAEL9 FEDERAL HOME LOAN MORTGAGE CORP NOTES FIXED 2.375% 3.5% 4,988,110$ 2/16/2021 7472. 3137EAEH8 FEDERAL HOME LOAN MORTGAGE CORP NOTES FIXED 1.375% 3.5% 4,970,550$ 8/15/2019 1963. 3133EH6L2 FEDERAL FARM CREDIT BANKS BOND FIXED 1.95% 3.5% 4,970,455$ 1/10/2020 3444. 3130ACN83 FEDERAL HOME LOAN BANKS CALLABLE BOND FIXED 1.7% 3.5% 4,948,055$ 5/15/2020 4705. 3130A0JR2 FEDERAL HOME LOAN BANKS BOND FIXED 2.375% 2.8% 3,993,116$ 12/13/2019 3166. AAM9943P9 VIRGINIA TREASURY LGIP STIF 2.2% 3,160,084$ 12/31/2049 17. 05252WPR8 AUSTR & NEW ZEALND B CERTIFICATE OF DEPOSIT FIXED 2.1% 2,998,401$ 5/13/2019 1028. 30215HPB0 EXPORT DEVELMT CORP CORPORATE COMMERCIAL PAPER 2.1% 2,997,795$ 2/11/2019 119. 3130ADFV9 FEDERAL HOME LOAN BANKS CALLABLE BOND FIXED 2.25% 2.1% 2,985,438$ 1/29/2021 729
10. 3134GBX56 FEDERAL HOME LOAN MORTGAGE CORP CALLABLE NOTES 2.1% 2,985,030$ 11/24/2020 663
Asset allocation calculations are based on market value at end of month while portfolio compliance is measured at the time an asset is purchased.
4

Account: 3014143700 - LGIP EM Created: 07 Feb 2019 18:50
Security No. Security Description Holding Cost (Local) Price (Local)Market Value
(Local)Cost (Base)
Market Value
(Base)
Accrued
Income (Base)
Unrealised
Gain/Loss (Base)
Market Value +
Accrued Income
(Base)
% of Fund
Account: 3014143700 Base: UNKNOWN NAV Value: 142,481,458.53
Currency: USD Rate: 1.0000037833CE8 APPLE INC CALLABLE NOTES FIXED 1.55% 08/FEB/2019 USD 1000 1,500,000.00 1,493,055.00 99.9838 1,499,756.27 1,493,055.00 1,499,756.27 11,182.74 6,701.27 1,510,939.01 1.06%
037833CA6 APPLE INC NOTES VARIABLE 02/AUG/2019 USD 1000 1,000,000.00 1,000,160.00 100.0347 1,000,346.81 1,000,160.00 1,000,346.81 6,728.15 186.81 1,007,074.96 0.71%
05253JAN1 AUSTRALIA & NEW ZEALAND BANKING GROUP LTD/NEW YORK NY MEDIUM TERM NOTE FIXED 1.6% 15/JUL/2019 USD500,000.00 497,285.00 99.4746 497,372.82 497,285.00 497,372.82 377.51 87.82 497,750.33 0.35%
084670BL1 BERKSHIRE HATHAWAY INC CALLABLE NOTES FIXED 2.1% 14/AUG/2019 USD 10001,724,000.00 1,714,707.64 99.6011 1,717,122.15 1,714,707.64 1,717,122.15 16,823.36 2,414.51 1,733,945.51 1.22%
07330NAM7 BRANCH BANKING & TRUST CO CALLABLE MEDIUM TERM NOTE VARIABLE 01/MAY/2019 USD 1000730,000.00 730,403.60 100.0735 730,536.61 730,403.60 730,536.61 5,729.12 133.01 736,265.73 0.52%
07330NAL9 BRANCH BANKING & TRUST CO CALLABLE NOTES FIXED 1.45% 10/MAY/2019 USD 10001,150,000.00 1,142,410.00 99.6738 1,146,248.44 1,142,410.00 1,146,248.44 3,824.59 3,838.44 1,150,073.03 0.81%
110122AV0 BRISTOL-MYERS SQUIBB CO CALLABLE NOTES FIXED 1.75% 01/MAR/2019 USD 1000450,000.00 449,599.50 99.9460 449,757.00 449,599.50 449,757.00 3,303.88 157.50 453,060.88 0.32%
17325FAA6 CITIBANK NA CALLABLE NOTES FIXED 2% 20/MAR/2019 USD 1000 350,000.00 348,978.00 99.9099 349,684.80 348,978.00 349,684.80 2,586.11 706.80 352,270.91 0.25%
20271RAH3 COMMONWEALTH BANK OF AUSTRALIA/NEW YORK NY BOND FIXED 2.3% 06/SEP/2019 USD 1000720,000.00 715,622.40 99.7268 718,032.62 715,622.40 718,032.62 6,762.00 2,410.22 724,794.62 0.51%
20271RAN0 COMMONWEALTH BANK OF AUSTRALIA/NEW YORK NY NOTES FIXED 2.05% 15/MAR/2019 USD 10002,830,000.00 2,818,049.00 99.9130 2,827,537.90 2,818,049.00 2,827,537.90 22,276.48 9,488.90 2,849,814.38 2.00%
30231GAP7 EXXON MOBIL CORP CALLABLE NOTES FIXED 1.708% 01/MAR/2019 USD 10001,000,000.00 994,540.00 99.9535 999,535.33 994,540.00 999,535.33 7,259.00 4,995.33 1,006,794.33 0.71%
3133EHP23 FEDERAL FARM CREDIT BANKS BOND FIXED 1.5% 06/FEB/2019 USD 1000 2,105,000.00 2,097,527.25 99.9892 2,104,772.66 2,097,527.25 2,104,772.66 15,358.49 7,245.41 2,120,131.15 1.49%
3133EHF57 FEDERAL FARM CREDIT BANKS BOND FIXED 1.68% 13/OCT/2020 USD 1000 3,000,000.00 2,999,037.00 98.5940 2,957,820.00 2,999,037.00 2,957,820.00 15,369.23 (41,217.00) 2,973,189.23 2.09%
3133EH6L2 FEDERAL FARM CREDIT BANKS BOND FIXED 1.95% 10/JAN/2020 USD 1000 5,000,000.00 4,993,250.00 99.4091 4,970,455.00 4,993,250.00 4,970,455.00 5,925.41 (22,795.00) 4,976,380.41 3.49%
3130A66T9 FEDERAL HOME LOAN BANKS BOND FIXED 1.625% 11/SEP/2020 USD 5000 3,000,000.00 3,005,640.00 98.5923 2,957,769.00 3,005,640.00 2,957,769.00 19,257.60 (47,871.00) 2,977,026.60 2.09%
313378J77 FEDERAL HOME LOAN BANKS BOND FIXED 1.875% 13/MAR/2020 USD 5000 1,435,000.00 1,421,152.25 99.2008 1,423,531.48 1,421,152.25 1,423,531.48 10,480.06 2,379.23 1,434,011.54 1.01%
3130A0FH8 FEDERAL HOME LOAN BANKS BOND FIXED 2.1% 20/NOV/2019 USD 5000 500,000.00 505,530.00 99.6418 498,209.00 505,530.00 498,209.00 2,117.40 (7,321.00) 500,326.40 0.35%
3130A0JR2 FEDERAL HOME LOAN BANKS BOND FIXED 2.375% 13/DEC/2019 USD 5000 4,000,000.00 4,034,280.00 99.8279 3,993,116.00 4,034,280.00 3,993,116.00 13,049.45 (41,164.00) 4,006,165.45 2.81%
3130A0F70 FEDERAL HOME LOAN BANKS BOND FIXED 3.375% 08/DEC/2023 USD 5000 1,000,000.00 1,032,350.00 103.4498 1,034,498.00 1,032,350.00 1,034,498.00 5,050.87 2,148.00 1,039,548.87 0.73%
3130ACN83 FEDERAL HOME LOAN BANKS CALLABLE BOND FIXED 1.7% 15/MAY/2020 USD 50005,000,000.00 4,974,000.00 98.9611 4,948,055.00 4,974,000.00 4,948,055.00 18,314.92 (25,945.00) 4,966,369.92 3.49%
3130ADFV9 FEDERAL HOME LOAN BANKS CALLABLE BOND FIXED 2.25% 29/JAN/2021 USD 50003,000,000.00 2,967,000.00 99.5146 2,985,438.00 2,967,000.00 2,985,438.00 559.39 18,438.00 2,985,997.39 2.10%
3130AEX54 FEDERAL HOME LOAN BANKS CALLABLE BOND FIXED 3.15% 28/SEP/2023 USD 50001,000,000.00 1,000,000.00 100.5353 1,005,353.00 1,000,000.00 1,005,353.00 10,964.09 5,353.00 1,016,317.09 0.71%
3134GBW81 FEDERAL HOME LOAN MORTGAGE CORP CALLABLE MEDIUM TERM NOTE FIXED 2.35% 22/NOV/2022 USD 1000600,000.00 582,804.00 98.8138 592,882.80 582,804.00 592,882.80 2,766.15 10,078.80 595,648.95 0.42%
3134GSJ48 FEDERAL HOME LOAN MORTGAGE CORP CALLABLE MEDIUM TERM NOTE FIXED 3.1% 27/JUN/2022 USD 10001,000,000.00 1,002,000.00 100.2987 1,002,987.00 1,002,000.00 1,002,987.00 3,066.70 987.00 1,006,053.70 0.71%
3134GSR31 FEDERAL HOME LOAN MORTGAGE CORP CALLABLE MEDIUM TERM NOTE FIXED 3.1% 29/JAN/2024 USD 10001,000,000.00 1,000,000.00 100.0772 1,000,772.00 1,000,000.00 1,000,772.00 257.37 772.00 1,001,029.37 0.70%
3134GSM93 FEDERAL HOME LOAN MORTGAGE CORP CALLABLE MEDIUM TERM NOTE FIXED 3.32% 27/DEC/2023 USD 10001,870,000.00 1,873,976.00 100.4363 1,878,158.81 1,873,976.00 1,878,158.81 6,058.70 4,182.81 1,884,217.51 1.32%
3134GBX56 FEDERAL HOME LOAN MORTGAGE CORP CALLABLE NOTES FIXED 2.25% 24/NOV/2020 USD 10003,000,000.00 3,000,000.00 99.5010 2,985,030.00 3,000,000.00 2,985,030.00 12,866.02 (14,970.00) 2,997,896.02 2.10%
3137EAEH8 FEDERAL HOME LOAN MORTGAGE CORP NOTES FIXED 1.375% 15/AUG/2019 USD 10005,000,000.00 4,994,500.00 99.4110 4,970,550.00 4,994,500.00 4,970,550.00 31,759.51 (23,950.00) 5,002,309.51 3.51%
3137EAEL9 FEDERAL HOME LOAN MORTGAGE CORP NOTES FIXED 2.375% 16/FEB/2021 USD 10005,000,000.00 4,988,700.00 99.7622 4,988,110.00 4,988,700.00 4,988,110.00 54,534.65 (590.00) 5,042,644.65 3.54%
313586RC5 FEDERAL NATIONAL MORTGAGE ASSOCIATION BOND ZERO CPN 09/OCT/2019 USD 50002,210,000.00 2,149,202.90 98.2157 2,170,566.06 2,149,202.90 2,170,566.06 0.00 21,363.16 2,170,566.06 1.52%
3136G17C7 FEDERAL NATIONAL MORTGAGE ASSOCIATION CALLABLE NOTES FIXED 1.25% 27/JUN/2019 USD 10002,000,000.00 1,982,020.00 99.4943 1,989,886.00 1,982,020.00 1,989,886.00 2,472.53 7,866.00 1,992,358.53 1.40%
3135G0UU5 FEDERAL NATIONAL MORTGAGE ASSOCIATION CALLABLE NOTES FIXED 1.75% 06/MAR/2020 USD 10003,000,000.00 3,012,960.00 99.1569 2,974,707.00 3,012,960.00 2,974,707.00 21,464.09 (38,253.00) 2,996,171.09 2.10%
3136G4SW4 FEDERAL NATIONAL MORTGAGE ASSOCIATION CALLABLE NOTES FIXED 2.9% 28/JUN/2021 USD 1000920,000.00 914,682.40 100.0561 920,516.12 914,682.40 920,516.12 2,565.38 5,833.72 923,081.50 0.65%
3135G0T60 FEDERAL NATIONAL MORTGAGE ASSOCIATION NOTES FIXED 1.5% 30/JUL/2020 USD 10003,000,000.00 2,992,530.00 98.5498 2,956,494.00 2,992,530.00 2,956,494.00 248.62 (36,036.00) 2,956,742.62 2.08%
3135G0ZG1 FEDERAL NATIONAL MORTGAGE ASSOCIATION NOTES FIXED 1.75% 12/SEP/2019 USD 10002,000,000.00 1,983,638.00 99.5274 1,990,548.00 1,983,638.00 1,990,548.00 13,730.12 6,910.00 2,004,278.12 1.41%
478160BR4 JOHNSON & JOHNSON CALLABLE NOTES FIXED 1.125% 01/MAR/2019 USD 10002,000,000.00 1,979,460.00 99.9038 1,998,075.72 1,979,460.00 1,998,075.72 9,562.50 18,615.72 2,007,638.22 1.41%
69353REV6 PNC BANK NA CALLABLE NOTES FIXED 1.95% 04/MAR/2019 USD 1000 785,000.00 782,951.15 99.9377 784,511.06 782,951.15 784,511.06 6,335.61 1,559.91 790,846.67 0.56%
91159HHH6 US BANCORP CALLABLE MEDIUM TERM NOTE FIXED 2.2% 25/APR/2019 USD 1000780,000.00 777,870.60 99.8958 779,186.96 777,870.60 779,186.96 4,652.13 1,316.36 783,839.09 0.55%
90331HNE9 US BANK NA/CINCINNATI OH CALLABLE NOTES VARIABLE 24/MAY/2019 USD 1000769,000.00 768,454.01 100.0240 769,184.94 768,454.01 769,184.94 4,063.52 730.93 773,248.46 0.54%
931142CP6 WAL-MART STORES INC NOTES FIXED 4.125% 01/FEB/2019 USD 1000 1,144,000.00 1,167,268.96 100.0000 1,144,000.00 1,167,268.96 1,144,000.00 23,595.00 (23,268.96) 1,167,595.00 0.82%
94988J5D5 WELLS FARGO BANK NA NOTES FIXED 1.75% 24/MAY/2019 USD 1000 2,000,000.00 1,987,560.00 99.7078 1,994,155.84 1,987,560.00 1,994,155.84 6,671.27 6,595.84 2,000,827.11 1.40%
94988J5E3 WELLS FARGO BANK NA NOTES VARIABLE 24/MAY/2019 USD 1000 450,000.00 450,436.50 100.1513 450,680.68 450,436.50 450,680.68 2,754.75 244.18 453,435.43 0.32%
961214CY7 WESTPAC BANKING CORP NOTES FIXED 1.6% 19/AUG/2019 USD 1000 400,000.00 396,052.00 99.3861 397,544.58 396,052.00 397,544.58 2,887.91 1,492.58 400,432.49 0.28%
961214CT8 WESTPAC BANKING CORP NOTES FIXED 1.65% 13/MAY/2019 USD 1000 1,660,000.00 1,649,258.60 99.6870 1,654,804.20 1,649,258.60 1,654,804.20 6,120.58 5,545.60 1,660,924.78 1.17%
961214CU5 WESTPAC BANKING CORP NOTES VARIABLE 13/MAY/2019 USD 1000 1,330,000.00 1,333,378.20 100.1476 1,331,963.40 1,333,378.20 1,331,963.40 9,836.48 (1,414.80) 1,341,799.88 0.94%
FIXED INCOME Subtotal 82,704,279.96 82,540,263.06 82,704,279.96 82,540,263.06 431,569.44 (164,016.90) 82,971,832.50 58.23%
CASH . 222.10 222.10 100.0000 222.10 222.10 222.10 0.00 0.00 222.10 0.00%
00499KPA5 INVESCO TREASURY PORTFOLIO INST.SHARES FUND 1931 46,734.68 46,734.68 100.0000 46,734.68 46,734.68 46,734.68 56.72 0.00 46,791.40 0.03%
AAM9943P9 VIRGINIA TREASURY LGIP STIF 3,160,083.62 3,160,083.62 100.0000 3,160,083.62 3,160,083.62 3,160,083.62 1,288.15 0.00 3,161,371.77 2.22%
USD NET PAYABLES 0.00 0.0000 0.00 0.00 0.00 (276,827.35) 0.00 (276,827.35) -0.19%
CASH EQUIVALENTS Subtotal 3,207,040.40 3,207,040.40 3,207,040.40 3,207,040.40 (275,482.48) 0.00 2,931,557.92 2.06%
05252WPR8 AUSTR & NEW ZEALND B CERTIFICATE OF DEPOSIT FIXED DTD 16/AUG/2018 DUE 13/MAY/2019 2.52%3,000,000.00 3,000,000.00 99.9467 2,998,401.45 3,000,000.00 2,998,401.45 35,490.00 (1,598.55) 3,033,891.45 2.13%
06052TC99 BANK OF AMERICA N/A CERTIFICATE OF DEPOSIT FIXED DTD 15/OCT/2018 DUE 15/APR/2019 2.63%1,400,000.00 1,400,000.00 100.0046 1,400,064.67 1,400,000.00 1,400,064.67 11,148.28 64.67 1,411,212.95 0.99%
06370RLT4 BANK OF MONTREAL- CERTIFICATE OF DEPOSIT FIXED DTD 02/OCT/2018 DUE 01/APR/2019 2.59%2,000,000.00 2,000,000.00 100.0030 2,000,059.08 2,000,000.00 2,000,059.08 17,554.44 59.08 2,017,613.52 1.42%
06417GZ76 BANK OF NOVA SCOTIA CERTIFICATE OF DEPOSIT FIXED DTD 14/SEP/2018 DUE 13/MAR/2019 2.52%1,500,000.00 1,500,000.00 99.9996 1,499,994.36 1,500,000.00 1,499,994.36 14,700.00 (5.64) 1,514,694.36 1.06%
06417GUE6 BANK OF NOVA SCOTIA/HOUSTON CERTIFICATE OF DEPOSIT FIXED 1.91% 05/APR/2019 USD 1000950,000.00 946,972.32 99.8729 948,792.55 946,972.32 948,792.55 5,997.93 1,820.23 954,790.48 0.67%
13606BC95 CANADIAN IMPERIAL BK CERTIFICATE OF DEPOSIT FIXED DTD 12/SEP/2018 DUE 12/JUN/2019 2.64%1,000,000.00 1,000,000.00 99.9717 999,717.47 1,000,000.00 999,717.47 10,413.33 (282.53) 1,010,130.80 0.71%
13606BE69 CANADIAN IMPERIAL BK CERTIFICATE OF DEPOSIT FIXED DTD 21/SEP/2018 DUE 21/JUN/2019 2.68%1,000,000.00 1,000,000.00 99.9800 999,800.09 1,000,000.00 999,800.09 9,901.11 (199.91) 1,009,701.20 0.71%
13606BK62 CANADIAN IMPERIAL BK CERTIFICATE OF DEPOSIT FIXED DTD 30/NOV/2018 DUE 29/AUG/2019 2.96%1,500,000.00 1,500,000.00 100.1085 1,501,627.11 1,500,000.00 1,501,627.11 7,770.00 1,627.11 1,509,397.11 1.06%
17305TZH8 CITIBANK N.A. NEW YORK CERTIFICATE OF DEPOSIT FIXED DTD 14/SEP/2018 DUE 14/MAR/2019 2.51%2,000,000.00 2,000,000.00 99.9962 1,999,924.62 2,000,000.00 1,999,924.62 19,522.22 (75.38) 2,019,446.84 1.42%
21685V5W5 COOPERATIEVE CENTRAL CERTIFICATE OF DEPOSIT FIXED DTD 22/AUG/2018 DUE 22/FEB/2019 2.41%1,000,000.00 1,000,000.00 99.9974 999,974.18 1,000,000.00 999,974.18 10,911.94 (25.82) 1,010,886.12 0.71%
23341VMQ1 DNB BANK ASA, NY BRANC CERTIFICATE OF DEPOSIT FIXED DTD 15/OCT/2018 DUE 16/APR/2019 2.58%2,000,000.00 2,000,000.00 100.0084 2,000,167.84 2,000,000.00 2,000,167.84 15,623.33 167.84 2,015,791.17 1.41%
30215HSF8 EXPORT DEVELMT CORP CORPORATE COMMERCIAL PAPER DISCOUNT DTD 12/OCT/2018 DUE 15/MAY/2019 2.63%2,000,000.00 1,968,586.11 99.2411 1,984,821.78 1,968,586.11 1,984,821.78 0.00 16,235.67 1,984,821.78 1.39%
30215HRH5 EXPORT DEVELMT CORP CORPORATE COMMERCIAL PAPER DISCOUNT DTD 19/SEP/2018 DUE 17/APR/2019 2.5%2,000,000.00 1,970,833.33 99.4532 1,989,064.44 1,970,833.33 1,989,064.44 0.00 18,231.11 1,989,064.44 1.40%
30215HPB0 EXPORT DEVELMT CORP CORPORATE COMMERCIAL PAPER DISCOUNT DTD 28/AUG/2018 DUE 11/FEB/2019 2.4%3,000,000.00 2,966,600.00 99.9265 2,997,795.42 2,966,600.00 2,997,795.42 0.00 31,195.42 2,997,795.42 2.10%
4497W1SD9 ING (US) FUNDING LLC CORPORATE COMMERCIAL PAPER DISCOUNT DTD 13/NOV/2018 DUE 13/MAY/2019 2.81%2,000,000.00 1,971,844.44 99.2469 1,984,938.00 1,971,844.44 1,984,938.00 0.00 13,093.56 1,984,938.00 1.39%
46640QTE1 J.P. MORGAN SECURITIES CORPORATE COMMERCIAL PAPER DISCOUNT DTD 17/SEP/2018 DUE 14/JUN/2019 2.67%2,000,000.00 1,962,200.00 98.9578 1,979,155.56 1,962,200.00 1,979,155.56 0.00 16,955.56 1,979,155.56 1.39%
46640QQ87 JP MORGAN SECURITIES LLC COMMERCIAL PAPER ZERO CPN DTD 11/JUN/2018 DUE 08/MAR/20191,500,000.00 1,472,203.33 99.7458 1,496,187.00 1,472,203.33 1,496,187.00 0.00 23,983.67 1,496,187.00 1.05%
63763QRG4 NATIONAL SECS CLEARING CORPORATE COMMERCIAL PAPER DISCOUNT DTD 20/JUL/2018 DUE 16/APR/2019 2.55%2,800,000.00 2,747,500.00 99.4635 2,784,979.18 2,747,500.00 2,784,979.18 0.00 37,479.18 2,784,979.18 1.95%
63763QT31 NATIONAL SECS CLEARING CORPORATE COMMERCIAL PAPER DISCOUNT DTD 27/NOV/2018 DUE 03/JUN/2019 2.8%2,000,000.00 1,971,277.78 99.0734 1,981,468.00 1,971,277.78 1,981,468.00 0.00 10,190.22 1,981,468.00 1.39%
63253KSA6 NAT'L AUSTRALIA FNDG CORPORATE COMMERCIAL PAPER DISCOUNT DTD 14/AUG/2018 DUE 10/MAY/2019 2.48%3,000,000.00 2,944,406.67 99.2809 2,978,426.25 2,944,406.67 2,978,426.25 0.00 34,019.58 2,978,426.25 2.09%
65590AJ98 NORDEA BK ABP NY CERTIFICATE OF DEPOSIT FIXED DTD 18/SEP/2018 DUE 18/MAR/2019 2.47%2,000,000.00 2,000,000.00 99.9936 1,999,872.30 2,000,000.00 1,999,872.30 18,662.22 (127.70) 2,018,534.52 1.42%
67983UUN1 OLD LINE FUNDING LLC CORPORATE COMMERCIAL PAPER DISCOUNT DTD 22/JAN/2019 DUE 22/JUL/2019 2.8%2,500,000.00 2,465,434.03 98.6579 2,466,448.05 2,465,434.03 2,466,448.05 0.00 1,014.02 2,466,448.05 1.73%
Detailed NAVAs at: 31 Jan 2019
GROUP BY CURRENCY IDENTIFIER = S CONSOLIDATED = NO
Version 2.3 Page 1 of 2

Account: 3014143700 - LGIP EM Created: 07 Feb 2019 18:50
Security No. Security Description Holding Cost (Local) Price (Local)Market Value
(Local)Cost (Base)
Market Value
(Base)
Accrued
Income (Base)
Unrealised
Gain/Loss (Base)
Market Value +
Accrued Income
(Base)
% of Fund
Detailed NAVAs at: 31 Jan 2019
GROUP BY CURRENCY IDENTIFIER = S CONSOLIDATED = NO
86958JT74 SVENSKA HANDELSBANKEN/NEW YORK NY CERTIFICATE OF DEPOSIT VARIABLE 06/JUN/2019 USD 10002,000,000.00 2,000,000.00 100.0034 2,000,068.00 2,000,000.00 2,000,068.00 3,712.16 68.00 2,003,780.16 1.41%
87019VKV8 SWEDBANK (SPARBANK) CERTIFICATE OF DEPOSIT FIXED DTD 15/JUN/2018 DUE 13/MAR/2019 2.46%1,500,000.00 1,500,000.00 100.0020 1,500,029.31 1,500,000.00 1,500,029.31 23,677.50 29.31 1,523,706.81 1.07%
88603H7K8 THUNDER BAY FNDNG LL CORPORATE COMMERCIAL PAPER DISCOUNT DTD 11/OCT/2018 DUE 11/MAR/2019 2.51%1,500,000.00 1,484,207.92 99.7248 1,495,872.50 1,484,207.92 1,495,872.50 0.00 11,664.58 1,495,872.50 1.05%
89114MKD8 TORONTO-DOMINION BANK/NY CERTIFICATE OF DEPOSIT FIXED 3.05% DTD 25/OCT/2018 DUE 25/OCT/20191,850,000.00 1,851,758.45 100.2029 1,853,754.13 1,851,758.45 1,853,754.13 15,516.88 1,995.68 1,869,271.01 1.31%
89113XP32 TORONTO-DOMINION CERTIFICATE OF DEPOSIT FIXED DTD 14/MAY/2018 DUE 09/AUG/2019 2.77%2,420,000.00 2,419,615.59 99.9400 2,418,548.00 2,419,615.59 2,418,548.00 48,972.06 (1,067.59) 2,467,520.06 1.73%
90275DJC5 UBS AG STAMFORD BRAN CERTIFICATE OF DEPOSIT FIXED DTD 07/SEP/2018 DUE 07/MAR/2019 2.43%2,000,000.00 2,000,000.00 99.9944 1,999,888.90 2,000,000.00 1,999,888.90 19,845.00 (111.10) 2,019,733.90 1.42%
90333VZJ2 US BANK N.A. CERTIFICATE OF DEPOSIT FIXED DTD 18/OCT/2018 DUE 16/JUL/2019 2.72%1,000,000.00 1,000,000.00 100.0012 1,000,011.90 1,000,000.00 1,000,011.90 8,008.89 11.90 1,008,020.79 0.71%
90333VYL8 US BANK N.A. CERTIFICATE OF DEPOSIT FIXED DTD 29/AUG/2018 DUE 28/MAY/2019 2.5%1,000,000.00 1,000,000.00 99.9435 999,434.52 1,000,000.00 999,434.52 10,833.33 (565.48) 1,010,267.85 0.71%
94989RJ58 WELLS FARGO BANK NA CERTIFICATE OF DEPOSIT FIXED DTD 08/MAY/2018 DUE 07/MAY/2019 2.72%1,000,000.00 1,000,808.00 99.9860 999,859.59 1,000,808.00 999,859.59 20,324.44 (948.41) 1,020,184.03 0.72%
SHORT TERM INVESTMENTS Subtotal 56,044,247.97 56,259,146.25 56,044,247.97 56,259,146.25 328,585.06 214,898.28 56,587,731.31 39.72%
EXPENSE 00015 ADVISOR 0.00 0.00 0.0000 0.00 0.00 0.00 (9,663.20) 0.00 (9,663.20) -0.01%
MISCELLANEOUS Subtotal 0.00 0.00 0.00 0.00 (9,663.20) 0.00 (9,663.20) -0.01%
USD Subtotal 141,955,568.33 142,006,449.71 141,955,568.33 142,006,449.71 475,008.82 50,881.38 142,481,458.53 100.00%
3014143700 Grand Total 141,955,568.33 142,006,449.71 475,008.82 50,881.38 142,481,458.53 100.00%
Version 2.3 Page 2 of 2