Embed Size (px)
Citation preview

Agenda
• Background
• Model for purchase probability (often
reffered to as conversion rate)
• Model for renewwal probability
• What is the link between price change,
product mix and churn??

Bakgrunn
• Assume you have developed a new tariff model, using chapter 8,9 and 10 from the book
• Should you implement it «as is»?
• Compare new tariff with the gross tariff that exists today (gross tairff is the tariff used today adjusted for discounts and moderations) and analyze differences
• Evaluate consequences of the tariff used today and reconcile with the differences above:
– How is the conversion rate today?
– How is the renewal rate today?

Logistic regression – the probability that
something is occuring Those with property,
For example insurance
Those without property,
i.e., insurance Client
age
Product
mix
Geo-
graphy
Client
age
Product-
mix
Ge-
ography
• Those having insurance are compared with those that do not have insurance
• If an explanatory variable is statistically significant it will be included in the model that
predicts the probability that a client has an insurance product
• Name this probability p
• Then the modelled link between p and the explanatory variables is:
• This model can be used to score all customers since every customer is assigned a
modelled p
• The idea is to prioritize those with high modelled p that do not possess the insurance
product
nnxxp
p
...
1log 11
Variable 1 can for example be client age Estimated effect of variable 1

Purchase probability (conversion
rate) villa insurance • Model: Purchase probaility for villa insurance using logistic regression
• Database 1 (insurance data) : – Bank clients without insurance products
– Insurance information is used
• Database 2 (bank data): – Bank clients without insurance products
– Bank information is used
• Period: (1.5.2012-30.4.2014)
• Approximately 70 000 bank clients were offered villa insurance
• Approximately 31% accepted
• Model 1 is typically used for consequence analysis in connection with tariff development/assessment
• Model 2 is typically used by the sales department
• It is conceivable that a model 3 using both information sources could be developed. This was attempted but it did not outperform model 2.
• Model 1 and model 2 do both have 6 explanatory variables

Different events require separate
treatment
Sales to new customers • Which factors drive the sales?
• What objects are easily sold?
• Which bank customers
purchase villa insurance?
Event
Renewal • What factors drive the renewal
rate?
• How important is price change
for the renewal rate?
• Is the churn wanted or not?
Cross sales to existing
customers • What factors drive cross sales?
Logistic regression • Offer data
• Bank data and insurance data
• Respons: has purchased villa
insurance (yes/no)
Method and data
Logistic regression • Insurance data
• Respons: has renewed the
policy (yes/no)
Same as sales to new
customers
• Is the company attractive for
strategically important
customers?
• Should the price be adjusted
for specific groups?
Follow up questions
• How does renewal vary with
customer scoring?
• How does price sensitivity vary
with customer scoring?
• Does the cross sales increase
expected customer lifetime?

Purchase probability (conversion
rate) villa insurance
• About the data
• Validation of model
• Explanatory variables in model
• Ranking of explanatory variables
• Interpretation of odds ratio for explanatory
variables
Purchase probability villa insurance
• Model: purchase probability for villa insurance using logistic regression
• Database 1 (insurance data) : – Bank customers without property insurance products
– Insurance data is used
• Database 2 (bankdata): – Bank customers without property insurance products
– Bankdata is used
• Period: (1.5.2012-30.4.2014)
• Approximately 70 000 such customers were offered villa insurance
• Approximately 31% accepted
• Model 1 is typically used for consequence analysis in tariff development
• Model 2 is typically used for sales purposes
• A model 3 combining data from model 1 and 2 is conceivable. This was attempted but it did not outperform model 2 and was therefore discarded.
• Model 1 and model 2 do both have 6 explanatory variables
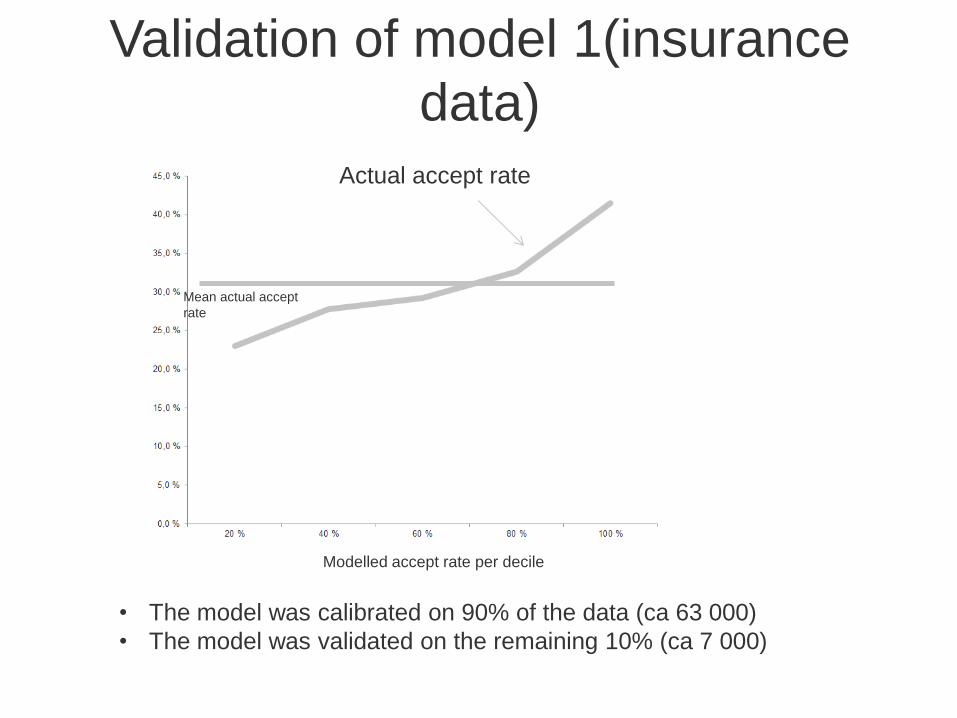
Validation of model 1(insurance
data)
• The model was calibrated on 90% of the data (ca 63 000)
• The model was validated on the remaining 10% (ca 7 000)
Modelled accept rate per decile
Actual accept rate
Mean actual accept
rate

Explanatory variables model
1(insurancedata)
• Customer age
• Building age
• Building standard
• Use of the building
• Building size in square meters (proxy for
insurable sum)
• Building type

Results model 1 insurancedata
• Wald is defined as (Estimate/sd(estimate))^2
• Wald can be used to rank the importance of the
explanatory variables
• Assume for example, as above, that all explanatory
variables are statistically significant
• The variables customer age and building size have the
highest Wald score
• In other words, The Wald criterion is ranking customer
age and building size as the most important explanatory
variables
Explanatory
variable Wald Significance
Customer age 610 <0.0001
Building size 160 <0.0001
Normal standard 121 <0.0001
Building age 79 <0.0001
Villa (yes/no) 54 <0.0001
Inhabitated by
owner (yes/no) 6 0.0137
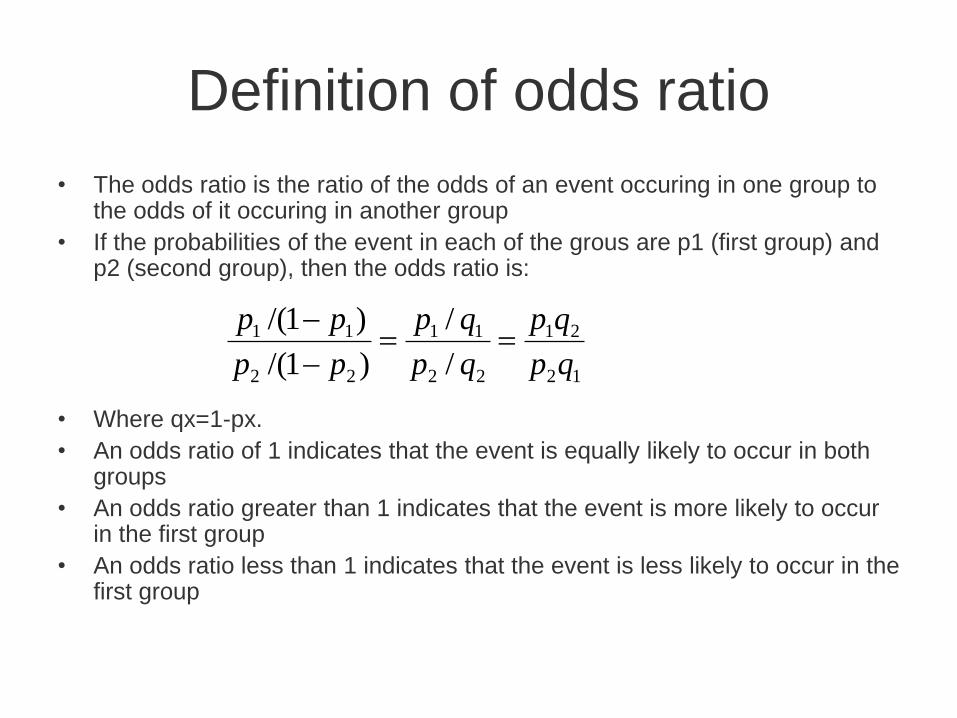
Definition of odds ratio
• The odds ratio is the ratio of the odds of an event occuring in one group to the odds of it occuring in another group
• If the probabilities of the event in each of the grous are p1 (first group) and p2 (second group), then the odds ratio is:
• Where qx=1-px.
• An odds ratio of 1 indicates that the event is equally likely to occur in both groups
• An odds ratio greater than 1 indicates that the event is more likely to occur in the first group
• An odds ratio less than 1 indicates that the event is less likely to occur in the first group
12
21
22
11
22
11
/
/
)1/(
)1/(
qp
qp
qp
qp
pp
pp

Results model 1 insurance data
The accept rate for
young customers is
higher than the
accept rate for old
customers
The accept rate for semi-
old is lower than the
accept rate for old
old >= 70 young <30 % change
accept rate 20 % 32 % 60 %
25 % 39 % 56 %
31 % 45 % 45 %
35 % 51 % 44 %
odds ratio 1.9

Purchase probability villa insurance
model 2
• Validation of model
• Explanatory variables model
• Ranking of explanatory variables
• Interpretation of odds ratio for explanatory
variables

Validation of model 2 (bankdata)
• The model was calibrated on 90% of the data (ca 56 000)
• The model was validated on the remaining 10% (ca 6 000)
Modellert tilslag per decil
Actual accept rate
Average actual
accept rate

Explanatory variables model 2
(bankdata)
• Number of products
• Has / has not house loan
• Has / has not a savings account and if yes
what kind
• Has / has not active savings insurance
• Has / has not stake in mutual fund
• Occupational affinity(Academic, Nurse etc)
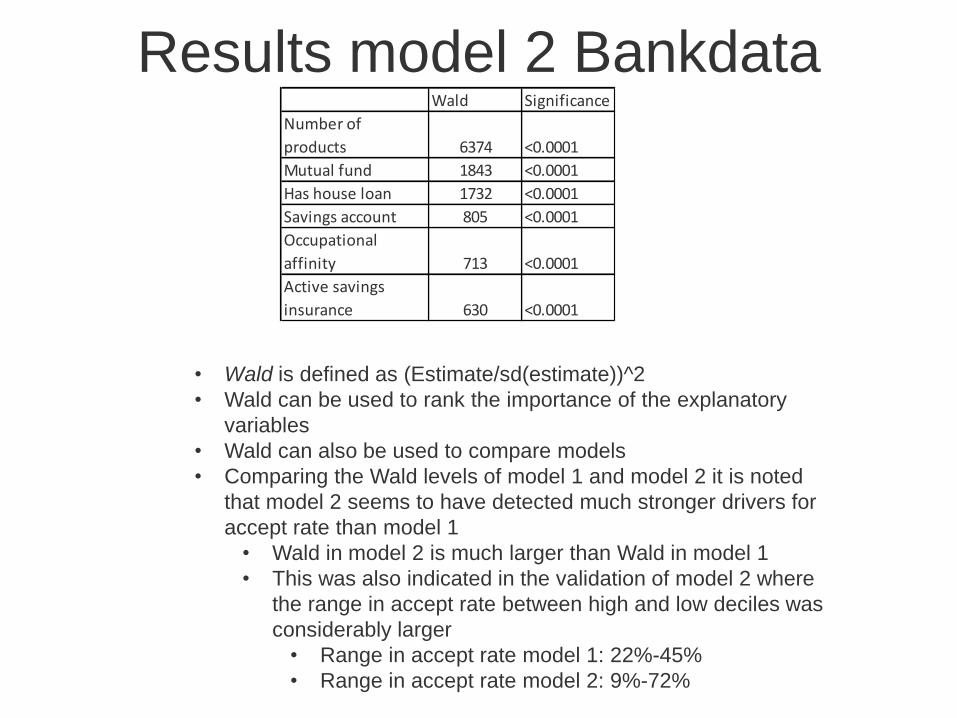
Results model 2 Bankdata
• Wald is defined as (Estimate/sd(estimate))^2
• Wald can be used to rank the importance of the explanatory
variables
• Wald can also be used to compare models
• Comparing the Wald levels of model 1 and model 2 it is noted
that model 2 seems to have detected much stronger drivers for
accept rate than model 1
• Wald in model 2 is much larger than Wald in model 1
• This was also indicated in the validation of model 2 where
the range in accept rate between high and low deciles was
considerably larger
• Range in accept rate model 1: 22%-45%
• Range in accept rate model 2: 9%-72%
Wald Significance
Number of
products 6374 <0.0001
Mutual fund 1843 <0.0001
Has house loan 1732 <0.0001
Savings account 805 <0.0001
Occupational
affinity 713 <0.0001
Active savings
insurance 630 <0.0001

Resultats model 1 Bankdata

Renewal rate villa insurance
• About the methodology
• About the data
• About the development of the portfolio
• Validation of model
• About the selection of time window
• Price sensitivity villa insurance
• Explanatory variables model
• Ranking of explanatory variables
• Interpretation of odds ratio for explanatory variables

Metodikk
Renewal date
Last active version
before renewal
version, named 1: Renewal version,
named 2:
Active version some
time after renewal,
named 3:
Comparison of 1 and 2:
• The effect of tariff changes is measured
• The effect of index, change in discounts is measured
Comparison of 3 and 2:
• The effect of exposure changes is measured (most relevant for motor insurance)
• Changes in deductible, change in coverage is measured
Comparison of 3 and 1:
• The total effect of tariff change and exposure change is measured
• Due to 1,2 and 3 the total effect of the renewal may be decomposed into the effect of tariff
changes and the effect of exposure changes
Timeline

Renewal probability
– Selection of time window for renewal: • If the policy is active up to 60 days after the
renewal date the policy is counted as renewed
– 4 years of data (all policies with tariff date from June 1, 2010)
– Validation of model
– Price sensitivity
– Explanatory variables renewal model
– Ranking of explanatory variables
– Odds ratios explanatory variables

Fornyelsessannlighet villaforsikring
• Modell: Renewal probability for villa
insurance using logistic regression
• Data:
– Villas in the portfolio, active or historic, with
tariff date > May 31, 2010
– Villas with good history (ca 71 000)

Validering av fornyelsesmodell
• Model calibrated on 90% of the data (appr 64 000)
• Model validated on the remaining 10% (ca 7 000)
Persentile in renewal model
Actual renewal rate Average actual
renewal rate
Renewal rate

Selection of time window
• The graph shows the total share not renewed in time after the renewal date for the 4 years period
• The graph shows that the share not renewed is highest in the renewal month and the month after
• The total share not renewed is 32% accumulated for the entire 4 years period
Tid i måneder etter fornyelse
Total share not renewed per month after
renewal
Not renewed
Accumulated not renewed

Price sensitivity villa
• The graph shows renewal rate for different price changes for active and historic villa policies for the
entire 4 years period
• The renewal rate is hardly changed when the price change is between -4% and 2% - reducing the
premium does not reduce the churn in this case
• When the price change is between 2% and 14% the renewal rate is reduced with 0.5% per percent price
increase
• When the price change is above 14% the renewal rate is reduced with 1% per percent price increase
Persentil i fordeling av prisendring i fornyelsen
Average renewal based on 4 years of data using 60 days
window
Estimated renewal rate based on the 4 year period
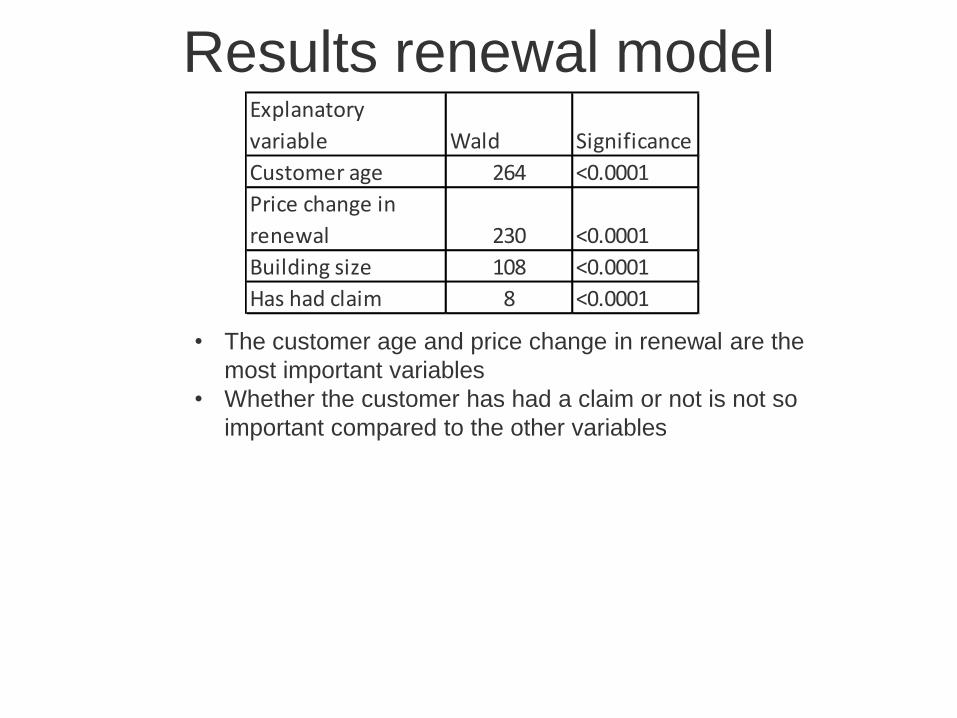
Results renewal model
• The customer age and price change in renewal are the
most important variables
• Whether the customer has had a claim or not is not so
important compared to the other variables
Explanatory
variable Wald Significance
Customer age 264 <0.0001
Price change in
renewal 230 <0.0001
Building size 108 <0.0001
Has had claim 8 <0.0001

Results model 1
• The renewal is increasing with increasing age
• The renewal is increasing with increasing building size
• The renewal is lowest for those with at least 5% price reduction (who are these?)
• The renewal is highest for those with price increase between 2% and 12%
• The renewal is higher for those that did not have claims (improvement potential in claims
settlement department?)

Do main products like car and villa increase
expected customer lifetime?
How price sensitive is the customer?
tid 1/5-2010 1/5-2011 1/5-2012 1/5-2013 1/5-2014
villa car
Only villa Only car Both villa and car
How many are in
the portfolio here
?
How many are
remaining? And
here?
And
here?
And
here?
Price increase villa
Price increase car Large Very large
Significant Moderate
Significant
Moderate
Negativ
Moderate

The churn is declining with time
and depending on product mix
• The churn is highest for those with villa and not car
• The churn is lowest for customers with villa and car
• The churn is highest the first year after the starting point and declining afterwards
• Are these results robust?
Villa not car
Car not villa
Both villa and car
Yearly churn for different product mix C
hu
rn

Hypothesis: the churn is highest
the first year
• Observe those who are in the portfolio one year later, i.e., 1/5-2011. How many are still in
the portfolio after 1,2 og 3 years?
• The churn is highest for those with villa and no car
• The churn is lowest for customers with villa and car
• The churn is highest the first year and declining aftwerwards
Villa not car
Car not villa
Both villa and car
Yearly churn for different product mix
Chu
rn

Resultats from 3 starting points
avgang villa ikke bil bil ikke villa kunder med villa og bil
1/5-10 - 1/5-11 30,0 % 26,0 % 15,7 %
1/5-11 - 1/5-12 17,0 % 15,0 % 14,2 %
1/5-12 - 1/5-13 11,1 % 10,6 % 10,7 %
1/5-13 - 1/5-14 7,7 % 7,9 % 7,4 %
avgang villa ikke bil bil ikke villa kunder med villa og bil
1/5-11 - 1/5-12 30,7 % 24,3 % 19,8 %
1/5-12 - 1/5-13 16,4 % 15,5 % 14,3 %
1/5-13 - 1/5-14 11,4 % 11,4 % 9,9 %
avgang villa ikke bil bil ikke villa kunder med villa og bil
1/5-12 - 1/5-13 23,1 % 18,7 % 17,0 %
1/5-13 - 1/5-14 17,7 % 17,2 % 13,6 %
Starting point: 1/5 2010
Starting point: 1/5 2011
Starting point: 1/5 2012
Churn villa not car car not villa both villa and car
Churn villa not car car not villa both villa and car
Churn villa not car car not villa both villa and car

Summary churn, product mix and
price change • In periods with severe price increases the churn is higher
• This result is reconcilable with the results from the renewal rate model. This indicates a quite strong link between churn and price change.
• Those with villa and no car have the highest churn, those with car and no villa have medium churn and those with villa and car have the lowest churn.
• Independent of product mix the churn measured in time after starting point seems to be declining. (the churn 1 year after the starting point is highest, 2 years after a little lower etc)
• The difference in churn between the product mix groups is falling as a function of time after the starting point
• The results indicate that customers with both villa and car are less price sensitive than customers with only one main product