Embed Size (px)
Citation preview

`
Agenda
Investment Advisory Council (IAC)
Monday, June 11, 2018 1:00 P.M.*
Hermitage Centre Hermitage Conference Room, First Floor
1801 Hermitage Blvd., Tallahassee, FL 32308
1:00 – 1:05 P.M. 1. Welcome/Call to Order/Approval of Minutes/Election of
Officers Peter Collins, Chair
(Action Required)
1:05 – 1:15 P.M. 2. Opening Remarks/Reports
Ash Williams, Executive Director & CIO
1:15 – 2:00 P.M. 3. Florida PRIME Review
A. Florida PRIME Legal Compliance Review – Chapter 218, Pt. IV, Florida Statutes
Anne Longman, Lewis, Longman and Walker, P.A.
B. Florida PRIME Best Practices Review Kristen Doyle, Aon Hewitt Katie Comstock, Aon Hewitt
C. Florida PRIME Portfolio Review Amy Michaliszyn, Federated Investors Paige Wilhelm, Federated Investors
D. Review of Florida PRIME Investment Policy Statement Ash Williams, Executive Director & CIO, SBA
(Action Required)

IAC Meeting – Agenda June 11, 2018 Page 2 2:00 – 2:45 P.M. 4. Private Equity Asset Class Review
John Bradley, SIO, Strategic Investments & Private Equity Wes Bradle, Senior Portfolio Manager Sheila Ryan, Cambridge Associates
2:45 – 3:30 P.M. 5. Defined Contribution Program Review Daniel Beard, Chief – Defined Contribution Programs Walter Kelleher, Director of Educational Services Kristen Doyle, Aon Hewitt Katie Comstock, Aon Hewitt
3:30 – 4:20 P.M. 6. SIO Asset Class Updates
Alison Romano, SIO, Global Equity Tim Taylor, SIO, Global Equity Katy Wojciechowski, SIO, Fixed Income Steve Spook, SIO, Real Estate Trent Webster, SIO, Strategic Investments & Private Equity
4:20 – 4:30 P.M. 7. Review Changes to Florida Retirement System Pension Plan Investment Policy Statement
Ash Williams, Executive Director & CIO (Action Required)
4:30 – 4:40 P.M. 8. Major Mandate Review
Kristen Doyle, Aon Hewitt Katie Comstock, Aon Hewitt
4:40 – 4:50 P.M. 9. Audience Comments/2018 Scheduled Meetings/
Closing Remarks/Adjourn TBD, Chair *All agenda item times are subject to change.


STATE BOARD OF ADMINISTRATION OF FLORIDA
INVESTMENT ADVISORY COUNCIL MEETING
MONDAY, DECEMBER 4, 2017 1:00 P.M. - 3:30 P.M.
1801 HERMITAGE BOULEVARD HERMITAGE ROOM, FIRST FLOOR
TALLAHASSEE, FLORIDA
REPORTED BY: JO LANGSTON Registered Professional Reporter
ACCURATE STENOTYPE REPORTERS, INC.
2894-A REMINGTON GREEN LANE TALLAHASSEE, FLORIDA 32308
(850)878-2221
2
ACCURATE STENOTYPE REPORTERS, INC.
APPEARANCES
IAC MEMBERS:
PETER COLLINS GARY WENDT CHUCK COBB BOBBY JONES VINNY OLMSTEAD SEAN McGOULD LES DANIELS MICHAEL PRICE
SBA EMPLOYEES:
ASH WILLIAMS, EXECUTIVE DIRECTOR KENT PEREZ JOHN BENTON JOHN BRADLEY TRENT WEBSTER STEVE SPOOK KATY WOJCIECHOWSKI CHERIE JEFFRIES ALISON ROMANO TIM TAYLOR DANIEL BEARD
CONSULTANTS: ANDRÉ MEHTA - (Cambridge Associates) TOD TRABOCCO - (Cambridge Associates) SAMIT CHHABRA - (Cambridge Associates) JIM MNOOKIN - (Cambridge Associates) (Telephonically) RICHARD BROWN - (The Townsend Group) SETH MARCUS - (The Townsend Group) STEVE CUMMINGS - (Aon Hewitt) KATIE COMSTOCK - (Aon Hewitt)

3
ACCURATE STENOTYPE REPORTERS, INC.
INVESTMENT ADVISORY COUNCIL MEETING
* * *
MR. COLLINS: Do we have anybody on the phone
today? Anybody called in?
MR. MNOOKIN: Yes. Jim Mnookin from Cambridge
Associates is on.
MR. COLLINS: Hey, Jim. Thank you for
attending. Anyone else? So welcome, everybody.
And we need to look at the minutes and approve the
minutes from the last meeting.
MR. PRICE: Move it.
MR. COLLINS: Bobby?
MR. JONES: Second.
MR. COLLINS: Does anyone have any comments or
objections to the minutes from last meeting? Seeing
none, they're approved. Opening remarks. Ash.
He's going to tell us whether we're actually up or
down this year.
MR. WILLIAMS: Michael Price seemed to be of
the general view that we -- no, it was Les
Daniels -- that we might be up on the year.
Fortunately we are. As of the close on December 1,
the FRS Trust Fund is up 15.61 percent. These are
initial numbers, of course, on the year. That's 42
basis points ahead of target, $16 billion net of
1
2
3
4
5
6
7
8
9
10
11
12
13
14
15
16
17
18
19
20
21
22
23
24
25
4
ACCURATE STENOTYPE REPORTERS, INC.
distributions that average 600 million-ish a month,
on the calendar year, leaving us with a balance of
160.4 billion, which is an all-time record high. So
that's good.
And does the levitation continue? Well, I
think we all probably have doubts about that. But
when the wind is blowing, get the sail out and move
the boat. So that's what we've done. And we
continue to be well-diversified. And as you will
hear as we go through the asset classes today, I
would ask the SIOs to give a sense of the character
of the flows they're seeing within their individual
asset classes and how you see the relative valuation
environment and how your asset class will fit into
the overall portfolio construction of the Board.
It's particularly appropriate that we have the
focus today on strategic investments because that's
where we've got most of the stuff that's sort of
negatively correlated to broad equity beta. So good
on the performance side.
I think of equal strength is what's going on on
the defined contribution side. We have been growing
the DC side of the Florida Retirement System. The
numbers are a little bit different there. We don't
have real-time numbers on a daily basis there. So
1
2
3
4
5
6
7
8
9
10
11
12
13
14
15
16
17
18
19
20
21
22
23
24
25

5
ACCURATE STENOTYPE REPORTERS, INC.
the numbers I'll share now are as of month-end
October.
But if we look at calendar year to date there,
up 11.79 percent. That's 85 basis points of value
add, which reflects two things, manager selection --
well, three things really. Manager selection,
manager oversight, and the manager performance
relative to the underlying benchmarks they're
looking at, and I think also the fee structures we
have, because in many cases the fees that we have on
the DC platform are firms that we're also doing
business with on the DB side, meaning we can
leverage our scale with them and get substantially
more advantageous fee structures for the
beneficiaries than they would see if they bought the
exact same funds in an over-the-counter transaction
with a retail financial services firm.
The other thing that's of interest is that the
aggregate assets in the Florida investment plan,
which is the proper name of the defined contribution
scheme, is $10.5 billion, which up 1.2 billion from
where we started the year. So all is well on all
fronts.
A couple of other things I wanted to touch on.
We were very pleased to see the hurricane season
1
2
3
4
5
6
7
8
9
10
11
12
13
14
15
16
17
18
19
20
21
22
23
24
25
6
ACCURATE STENOTYPE REPORTERS, INC.
end. This year, like we did last year, we had close
brushes with Mother Nature that fortunately did not
do anywhere near the damage they could have done.
And with Hurricane Irma, we've had an awful lot of
questions about, gee, what are your losses from
Irma.
The short answer is it's too big to say. I
think what we paid out to date is about $26 million,
which is nothing on a $17 billion fund. There are
two reasons for that. Number one, loss development
takes time. The CAT Fund is a reimbursement scheme
for primary insurers. It is not a primary insurer.
So before we get claims from primary insurance
companies, they have to first complete their own
claims adjusting process and reach closure on what
they're paying out, and we then reimburse them for a
component of that, with a co-pay, so that the
alignment remains appropriate. You can have loss
development after a storm for literally years. So
to be weeks or months after a storm, it's not
realistic to expect we really know.
That said, we've looked at the actuarial work
on the storm and modeled it against our zip code
base of exposures. And our thinking is, at the
outside, this is probably a 5 billion kind of an
1
2
3
4
5
6
7
8
9
10
11
12
13
14
15
16
17
18
19
20
21
22
23
24
25

7
ACCURATE STENOTYPE REPORTERS, INC.
exposure for us. I think that's probably 2x
reality, if not more.
Long way of saying the CAT Fund is and remains
in excellent financial condition coming into the
next hurricane season. And we'll accept the grace
of God for that, but also understand that prudent
policy on the part of the trustees and the
legislature has been helpful.
I would say also, on the team, I want to thank
the IAC again for all your support on things that we
have done, been able to do, that you've empowered us
to do on the recruitment and retention side. In the
calendar year we did not lose -- I don't think we
lost a single investment staff person, did we, for
any kind of competitive reasons?
And we did fill at least one vacancy. Where is
Shoaib? Is he in here? There he is. We brought in
Mr. Shoaib Khan from New York, who was on the
private sector and is in strategic investments on
the credit side, doing a terrific job. And there's
no way that could have happened five years ago.
That's a direct result -- because he's not cheap. I
mean, you know how these people are.
MR. KHAN: I'm not that expensive either.
MR. WILLIAMS: The only thing worse is football
1
2
3
4
5
6
7
8
9
10
11
12
13
14
15
16
17
18
19
20
21
22
23
24
25
8
ACCURATE STENOTYPE REPORTERS, INC.
coaches, but that's a different story. Don't get me
started. So all good there.
The other key thing I wanted to bring up on the
team side is that we did have our chief investment
technology officer leave during the past six months.
We have completed a search there, found an
outstanding woman for that role who is a Boston
College person, for the benefit of some of our IAC
members, and extremely sharp and has been on the
private side doing development work that I think is
directly relevant to what we're doing here. So
she'll be starting very soon and may even be here
today. No.
UNIDENTIFIED SPEAKER: She has started. She's
not with us, but she's here.
MR. WILLIAMS: So she's being very selective
about who she'll talk to. You have to respect that.
MR. COLLINS: Probably good to skip this group.
MR. WILLIAMS: Yeah, I don't blame her. And
the next hire we'll be making in the IT area is a
head of cyber security. And we think that's worth a
separate position. In the past week I met the
deputy U.S. attorney general who handles all of the
cyber crime prosecutions for the U.S. Department of
Justice, had an extensive conversation with that
1
2
3
4
5
6
7
8
9
10
11
12
13
14
15
16
17
18
19
20
21
22
23
24
25

9
ACCURATE STENOTYPE REPORTERS, INC.
individual about what's going on in that space, also
reacquainted myself with the person who was head of
cyber security for the Homeland Security
Administration.
And, interestingly, they have a major cyber
security facility, Homeland Security does, in
Pensacola, so just a couple hundred miles west of
here. I met this fellow a year ago. And he is now
the head of cyber security for Goldman Sachs. He's
gone private and made a pretty good trade out of it.
But he has again offered to open the door for us to
meet the folks over in Pensacola and get the best
insights they have on doing a little look at what
we're doing and how we might sharpen our cyber
security environment.
I also met last week a woman who heads up one
of the leading crisis management firms in the world.
And we were talking about this whole idea of cyber
security, and she made a very interesting point,
that with social media the way it is, if you have
any kind of a problem, whether it is of a cyber
penetration origin or some other thing, it will
literally go global in 17 seconds courtesy of social
media. The average major corporation takes between
18 and 36 hours to even recognize and define a
1
2
3
4
5
6
7
8
9
10
11
12
13
14
15
16
17
18
19
20
21
22
23
24
25
10
ACCURATE STENOTYPE REPORTERS, INC.
problem and come up with a statement.
By that time the sound bites are already there.
The headlines are already there. The blogs have
already picked it up. And the whole issue has been
calibrated for you. And trying to reconstruct that
on a backward-looking basis, or change it, very,
very difficult.
All of which is why we are really, really
tightening up on this cyber security business.
Everything I hear about that is bad. The number of
bad actors that are out there spending their waking
hours doing those sorts of things is incredible.
At an event I was at last week in New York, one
of the MFA events, we had a very senior person from
the Treasury there who had recently left the
Treasury and gone elsewhere. And he said, By the
way, if any of you receive a letter on perfect -- a
digital letter on perfect United States Treasury
letterhead, with very credible language, saying your
institution has an account or a hung instrument
somewhere, blah, blah, blah, all you have to do to
claim it is e-mail me at the below address, and it
has my signature on it. He said, The only problem
is it's not my signature. It's something that's a
scam out of Eastern Europe or Africa or something
1
2
3
4
5
6
7
8
9
10
11
12
13
14
15
16
17
18
19
20
21
22
23
24
25

11
ACCURATE STENOTYPE REPORTERS, INC.
like that.
But he said it looks so good, he said, If I saw
it and I didn't know my own signature, I would think
it was real. So I think there are so many
unexploded bombs buried out there for financial
institutions in cyber world, we can't pay too much
attention to it.
Two other things I'll touch on. Legislatively,
the governor's budget is out. He has again taken an
appropriate leadership role and is recommending full
funding of the Florida Retirement System, normal
cost and an appropriate actuarially indicated
contribution to unfunded liability. So we thank him
for that.
A lot of stuff in the news lately about
cryptocurrencies, Bitcoin, et cetera, et cetera. We
get asked all the time, Do you have Bitcoin
investments? The answer is no. Are you thinking
about them? Not really. Although I did see what
would be a temptation perhaps to someone, not us,
but I see Venezuela has now launched its own
cryptocurrency, the Petro. I think we'll take a
pass on that, for a number of reasons.
The last thing I want to share is, at the
trustees meeting on November 7, they reaffirmed for
1
2
3
4
5
6
7
8
9
10
11
12
13
14
15
16
17
18
19
20
21
22
23
24
25
12
ACCURATE STENOTYPE REPORTERS, INC.
another year the executive director and CIO of the
SBA. So thank you for your work on that. And they
also accepted without change all of the IAC's
recommendations with regard to my relationship with
the Board. So thank you again for your leadership
broadly and for your help on that specifically.
With that, Mr. Chair, unless there are any
questions, I'm done.
MR. COLLINS: Does anybody have any questions
on that? I would just say that relative to the
Compensation Committee work that was done, this is
the first year where the Compensation Committee got
together, did its work, went pretty smoothly, put it
before the Cabinet and the Cabinet didn't even have
any questions, so if that gives you a sense of the
kind of job that they think we're doing on the
compensation side.
So does anybody have any comments or questions
before we move on to Trent? Trent, we gave you long
enough to get in your seat. Go ahead and let's
start the review.
MR. WEBSTER: Well, I'm glad to say that I
removed that old presentation on cryptocurrencies as
the next asset in strategic investments.
MR. COLLINS: I was going to say he stole your
1
2
3
4
5
6
7
8
9
10
11
12
13
14
15
16
17
18
19
20
21
22
23
24
25

13
ACCURATE STENOTYPE REPORTERS, INC.
thunder. I thought you were cornering the market on
Bitcoin.
MR. WEBSTER: We're leaving that to private
equity. So for those that may be new in the
audience, we're strategic investments. We are the
alternative asset class. If an investment doesn't
fit nice and neatly into the four other asset
classes, it comes to us.
And we're charged in policy with four policy
objectives. For people who have seen this before,
you'll notice a slight change in that we're now
charged with generating a four and a half percent
real return. And that is in line with the change at
the total fund level. We're also here to diversify
the rest of the fund, to provide a hedge against
inflation and to invest opportunistically.
And in fact not only has the first one changed
a little bit, but we're going to be changing these a
little bit, too, based on some of the discussions
we've had in this forum. So you'll see that in the
next quarter or two.
So as Ash had mentioned, we hired Mr. Shoaib
Khan during this calendar year. We also have an
opening for an analyst. So if anyone knows an eager
beaver young professional who always dreamt of
1
2
3
4
5
6
7
8
9
10
11
12
13
14
15
16
17
18
19
20
21
22
23
24
25
14
ACCURATE STENOTYPE REPORTERS, INC.
working at the State Board, we have a position for
him or her.
I thought we'd spend the bulk of our time today
on how we approach the portfolio philosophically and
how all the components fit together and how we fit
into the total fund. So I thought we'd move through
process fairly quickly, though I'm happy to spend as
much time on anything that anyone wishes.
So when we're looking at individual funds,
these are the three broad screens that we look for
for managers. So they must be of high ethical
standards, and they must be of institutional
quality, and they must be able to demonstrate
attractive, process-driven, repeatable risk-adjusted
performance, in that order. If a manager has a very
good track record but we hear dodgy things about
him, we're just not interested.
This next slide, I apologize for this
eye-straining slide. One day I'll get around to
improving this. But this shows the multiple steps
in our fund selection process. And typically, when
we're doing our due diligence, we spend a lot of
time on a manager. Typically, during the due
diligence process, we're spending between 20 and 40
hours on an individual manager. And in fact it can
1
2
3
4
5
6
7
8
9
10
11
12
13
14
15
16
17
18
19
20
21
22
23
24
25

15
ACCURATE STENOTYPE REPORTERS, INC.
take significantly longer than that, because prior
to entering our pipeline, we've often had multiple
meetings already with the manager, often meeting
them here or in the office or over the phone and
reading up about them. And sometimes it can take us
years to develop a relationship with a manager.
In private market structures, we prefer to meet
a manager when they're in between fund-raising.
That way we're not rushed or we don't feel urgency
like we have to invest in a fund.
Of course, thorough due diligence is part of
our risk management. Also up front I had mentioned
earlier, at the beginning, that one of our
objectives is to invest opportunistically. And we
tend to take a contrarian approach to investment,
where we want to be investing in things where a lot
of capital has left. So typically that means
they're cheaper. Sometimes it looks a little scary,
but generally capital has come out of the market,
and we're trying to put money into those areas and
avoid areas which are frothy.
Ongoing manager monitoring is also part of our
risk management process. And typically we're
speaking to the managers at least quarterly,
sometimes monthly. And oftentimes we will follow up
1
2
3
4
5
6
7
8
9
10
11
12
13
14
15
16
17
18
19
20
21
22
23
24
25
16
ACCURATE STENOTYPE REPORTERS, INC.
if there are any issues outstanding that we feel
necessary.
The other issue that is highlighted on here is
that where possible, if a manager has a limited
partner advisory committee, we request seats on
those boards. And we are on most of the LPACs with
our funds. That gives us a heightened level of
manager monitoring for our managers.
MR. COLLINS: Trent, a question on that. How
many funds are you in today? I know you're going to
get to that, but I'm going back to the topic you
just brought up about being on the boards.
MR. WEBSTER: 86.
MR. COLLINS: 86.
MR. WEBSTER: Sorry. 136 funds, but those
include SMAs, those include LP structures, and those
include hedge funds.
MR. COLLINS: And when you reduce that 86 for,
say, multiple funds with one firm, what does it come
down to?
MR. WEBSTER: Well, we have 86 relationships.
We have -- I think it's 136 funds. I have that on a
slide.
MR. COLLINS: Okay. So how many of those
meetings do you go to?
1
2
3
4
5
6
7
8
9
10
11
12
13
14
15
16
17
18
19
20
21
22
23
24
25

17
ACCURATE STENOTYPE REPORTERS, INC.
MR. WEBSTER: How many meetings? We try to
attend every annual meeting for our funds which put
them on. Occasionally we may not because we may
have a conflict. But we're generally covering
99 percent of the meetings that our managers put on.
MR. COLLINS: Okay.
MR. WEBSTER: So even though we are an
opportunistic asset class, we do have an asset
allocation process once a year. We sit down as a
group and make a determination over the next three
to five years on where we want to allocate capital
relative to where the portfolio is currently. And
you'll see that in few minutes when we go through
some of the strategies.
We create a target allocation for the next
three to five years. And that is a guide. It is
not a hard-set target, but rather acts as a roadmap
for us to allocate capital, because we don't ever
want to be in a situation where we wake up one day
and, say, have half our portfolio in distressed or
30 percent in insurance or some other overweight
that is unintended.
Currently we're at 8.2 percent of the total
fund. We have a policy target allocation of
12 percent. We've been working really hard to get
1
2
3
4
5
6
7
8
9
10
11
12
13
14
15
16
17
18
19
20
21
22
23
24
25
18
ACCURATE STENOTYPE REPORTERS, INC.
there. But Tim and Alison have made it very
difficult for us because they just sprint away like
jackrabbits in global equities.
So we've been around eight and a quarter
percent for the last two years. And we have not
changed our investment process at all. We're going
to allocate something like two and a half billion
dollars this year, this calendar year, which is a
little above what we normally do.
But we're having a problem getting up simply
because the global equity markets have been so
strong and the other phenomena of our managers in
the private market structures who are distributing
capital back faster to us than we're contributing to
them. So we're at about eight and a quarter.
Our net asset value is 12.9 billion. If you
include the unfunded commitments, our total exposure
at the end of the third quarter was 17.7 billion.
As of the third quarter, we had 86 relationships,
managing 136 funds. And currently it's roughly
split half and half between illiquid strategies and
liquid strategies.
In the most recent quarter we had cash outflows
of $57 million for the calendar year. The first
three quarters of the calendar year, we've had just
1
2
3
4
5
6
7
8
9
10
11
12
13
14
15
16
17
18
19
20
21
22
23
24
25

19
ACCURATE STENOTYPE REPORTERS, INC.
under $100 million go out the door. We've had five
new funds, totaling $800 million, closed in the
third quarter. And we actually now, in this quarter
it's now up to three new funds at I think it's
$450 million. And for the calendar year we've
closed 16 funds at $2.3 billion.
And we're trying to get a few more across the
line before the end of the calendar year. Our
pipeline, though, is probably the thinnest it's been
since I've been involved in the asset class. We're
actually now at five funds at roughly $450 million.
So before we go into performance, are there any
questions? Okay. So this is our performance. We
don't get too excited over near-term performance for
the quarterly or one year. We're looking -- in our
mind-set, we're looking at three to five years or
longer. The blue bars is the performance of the
asset class. The red bar is the benchmark, and the
yellow bar is the real return target.
We have actually -- I'll explain why we've
lagged our real return target in a few minutes since
inception. But in terms of the benchmarks, our
benchmarks that we officially are measured against
is the weighted sum of all the individual fund
benchmarks rolled up to an aggregate. And those are
1
2
3
4
5
6
7
8
9
10
11
12
13
14
15
16
17
18
19
20
21
22
23
24
25
20
ACCURATE STENOTYPE REPORTERS, INC.
comprised of either market based, peer based or the
real return benchmark for individual funds.
We're charged with generating a real return of
four and a half percent over time. We create a
portfolio that we think will attain that or beat it
over time. What that means is that we will put some
strategies which should do significantly better in
that portfolio than the real return target as we
expect. But we will also put some things in the
portfolio which we think are diversifying and helps
improve the risk patrol of the asset class and the
total fund but may have a lower return than the CPI
plus 5 percent.
So I mentioned earlier that global equity has
been a hard act to follow this calendar year. You
can see here we like to compare ourselves to the
rest of the FRS, just to see how we're doing. The
FRS is primarily an equity-based risk fund. We're
primarily credit and some other things with a bit of
equity. So we wouldn't necessarily expect to keep
up to the performance of the total fund, but we like
to pay attention to it nonetheless.
So I had mentioned earlier that we had
underperformed the real return target since
inception. The reason for that, it can be explained
1
2
3
4
5
6
7
8
9
10
11
12
13
14
15
16
17
18
19
20
21
22
23
24
25

21
ACCURATE STENOTYPE REPORTERS, INC.
in this graph. So this is our strategy allocations
over time. And so we've gone -- this big red part
is global equities. And we no longer have a global
equities allocation.
When strategic investments began in 2007, we
were allocated a $6 billion global equity portfolio,
which was to fund the alternative strategies over
time. So the idea would be that we would cash out
of those and then fund what would traditionally be
thought of as alternative strategies.
But then the global financial crisis happened,
and we plunged pretty significantly. So because we
were primarily a global equity portfolio, we acted
like a global equity portfolio and fell a lot.
In 2010 the global equity portfolio was
transferred over to the newly created global equity
asset class, which was a merger between domestic and
foreign equities. And that now resides with Tim and
Alison. But we never got the bounce that came with
the global equity markets in that allocation.
You can see the light blue part of the graph
there. That is a high yield portfolio. High yield
was transferred to strategic investments in 2010,
and it was sold out and used to fund other
strategies.
1
2
3
4
5
6
7
8
9
10
11
12
13
14
15
16
17
18
19
20
21
22
23
24
25
22
ACCURATE STENOTYPE REPORTERS, INC.
So this is where I was going to make my
cryptocurrency joke. But you can see here we've got
19 different strategies, sub-strategies in
strategic. We're hoping to have a small little
purple slice in there called insurance within the
next couple of quarters, if we can get one of the
funds or two of the funds closed before year-end,
but we'll see.
Another way of looking at the portfolio is to
divide it up between the illiquid markets and the
liquid markets. So we currently have $2.6 billion
invested in illiquid income-generating assets or
strategies or funds. And these are strategies where
the return is primarily driven by the coupon. So we
have $2.6 billion allocated there.
In the red part of the pie graph, that's
$4.5 billion invested in what we call illiquid
markets-growth. And these are strategies where the
returns are not dependent upon income in the
illiquid markets.
On the right-hand side of the graph the yellow
part, liquid markets-growth, we have $3.5 billion.
These are the more traditional hedge funds, as well
as activists and a few other things. And then that
purple part is the diversifying strategies, which
1
2
3
4
5
6
7
8
9
10
11
12
13
14
15
16
17
18
19
20
21
22
23
24
25

23
ACCURATE STENOTYPE REPORTERS, INC.
are mostly the diversifying strategies I mentioned
earlier, and that's $2.4 billion.
So if you think about it, the top part of the
graph is the buffer of the portfolio. The bottom
half of the graph is really the growth engines of
the portfolio. So we would expect the illiquid
income portfolio to decline during a -- or the net
asset value to decline during a bear market, but the
income should provide a buffer for it, whereas the
diversifying strategies, those are generally
uncorrelated to markets and have historically done
fairly well in bear markets. So if you think about
it, we've got about two-thirds of the portfolio in
growth engines and about one-third of it in more
defensive allocations.
Twelve months ago we decided to start looking
at what our exposures were at an asset class level.
As of the end of the third quarter, we currently
have a gross -- or had a gross exposure of just
under 250 percent where we were long -- actually
about 245 percent where we were long, about
165 percent short, about 80, 81 percent, giving us a
net exposure of 82 percent. And so currently we're
generating returns with about an 80 percent exposure
to assets.
1
2
3
4
5
6
7
8
9
10
11
12
13
14
15
16
17
18
19
20
21
22
23
24
25
24
ACCURATE STENOTYPE REPORTERS, INC.
Now, that also includes a lot of our
diversifying strategies, which we're long things
that should do well during a bear market. So I
think that our --
MR. PRICE: So, Trent, what you're saying is a
lot of your funds have big short books.
MR. WEBSTER: Some do, yes.
MR. PRICE: And how many of your funds are
levered, like margin account levered?
MR. WEBSTER: I would say most of the hedge
funds are.
MR. PRICE: So do you have any charts on how
much real exposure you're running with the leverage,
or this incorporates that?
MR. WEBSTER: That incorporates that, yeah.
And these are our largest allocations by manager.
So currently we have 86 different relationships.
Ten of them account for just over a third of the
book. And Blackrock is our largest allocation.
Any questions before we move on?
MR. PRICE: So your returns are net of your
fees, and your fees are less than 2 and 20 but
approaching 2 and 20, versus your fees in global
equities of 15, 20 basis points. So there's a large
3 or 4 percent differential right there. Fair
1
2
3
4
5
6
7
8
9
10
11
12
13
14
15
16
17
18
19
20
21
22
23
24
25

25
ACCURATE STENOTYPE REPORTERS, INC.
enough? Is that fair?
MR. WEBSTER: We actually -- I think we have
two -- well, three or four funds where we pay a 2
and 20. Everything is below that.
MR. COLLINS: But it's not 15 or 20 basis
points.
MR. WEBSTER: Not yet.
MR. COLLINS: That's okay. Nobody is --
MR. PRICE: And you couple that with no
liquidity, right? So you've got less liquid, worse
performance and higher fees, Cambridge, right? And
you're paying Cambridge to advise you on this. Is
that a fair statement?
MR. WEBSTER: Well, I think -- I think that the
performance of the portfolio has obviously lagged
the global equity portfolio.
MR. PRICE: Of course. It's a bull market.
But is that a fair statement? High fees -- if you
adjust for the fees, you come much closer to their
returns.
MR. WEBSTER: That's an interesting point
because -- and this is one of the themes that I was
actually going to touch on as we started with the
debt portfolio, because we have four different
strategies, distressed, mezzanine, opportunistic
1
2
3
4
5
6
7
8
9
10
11
12
13
14
15
16
17
18
19
20
21
22
23
24
25
26
ACCURATE STENOTYPE REPORTERS, INC.
debt and senior loans.
And so in opportunistic debt, those are our
credit hedge funds. And then we've got a book of
everything else. What we're finding in our book is
that they often run similar strategies. Oftentimes
they have similar credit exposure. And sometimes
they will actually have the exact same security in
the portfolio.
And what we have found is that in our private
market structures, where we're -- we're generating
300 to 400 basis points above what we're generating
in the hedge funds. Part of that is the fee
structure, because in a hedge fund we're paying
carry on the first dollar of profits earned, whereas
the private market structure, you're not paying any
carry until you hit a hurdle of 8 percent. So we're
finding that that accounts for about half of the
underperformance, when you look at it apples to
apples on similar strategies. The other half is
what we think is in a liquidity premium.
So currently I think we're paying -- I think
for this year it's going to come to about one and a
quarter, is our management fee, somewhere around
there, 1.3 percent is what we're paying.
MR. PRICE: Plus performance.
1
2
3
4
5
6
7
8
9
10
11
12
13
14
15
16
17
18
19
20
21
22
23
24
25

27
ACCURATE STENOTYPE REPORTERS, INC.
MR. WEBSTER: Yeah, and then plus performance.
We've got a weighted average performance, which we
track, which is something along the lines of -- I
think it's an 18 percent carry, with a five and a
half percent hurdle across all of our funds. So if
you think of our fee structure on a weighted average
basis, that's what we're paying.
So thanks for that. That's a good segue. And
one of the themes that we're finding is that in --
where we can get credit in equity exposure, we've
been moving it more to the private market funds and
then hedging it with our diversifying strategies,
which we talked about earlier.
The other point that I could make on this page
is that parts of the credit market are very
overheated, especially in the sponsored lending.
Some of our managers have been doing this for
decades, have seen it through multiple market
cycles, and they're saying they've never seen things
like this in some areas before.
One of the anecdotes that we had heard was that
one of the managers had forced upon its creditors to
accept $500 million in synergies that were not
identified five years from now. And our manager is
saying that's just crazy. So that's what you're
1
2
3
4
5
6
7
8
9
10
11
12
13
14
15
16
17
18
19
20
21
22
23
24
25
28
ACCURATE STENOTYPE REPORTERS, INC.
seeing. So we've become cautious on certain parts
of the credit market.
This is our performance. And this is a pattern
that you will see. So you can see -- I use three
years here because this is where we've got the most
data points for a time series. But distressed, mezz
and senior loans are all private market.
Opportunistic debt is the hedge funds.
And by the way, that opportunistic debt portion
outperformed its benchmark. And the benchmarks are
peer-based benchmarks. So they're running up
against their comps. You can see the disparity in
performance amongst the private markets and the
hedge funds. I don't know if that will necessarily
last forever, but it certainly has been over the
last few years.
MR. COLLINS: You know, with that many names,
and you were alluding to it earlier where there's
some bleed-over with one manager or a distressed
manager and an opportunistic manager owning the same
name, right? So how do you-all monitor that when
you're bringing this firm or this new investment in,
or how do you get at that?
MR. WEBSTER: Well, I think first of all, we
haven't actually done anything new in credit hedge
1
2
3
4
5
6
7
8
9
10
11
12
13
14
15
16
17
18
19
20
21
22
23
24
25

29
ACCURATE STENOTYPE REPORTERS, INC.
funds for several years. So those funds were
originally funds we had invested in several years
ago.
MR. COLLINS: When was the last one made? How
old is that portfolio?
MR. WEBSTER: On the hedge funds?
MR. COLLINS: Yeah.
MR. WEBSTER: I think that we hired Canyon, was
it four years ago, five years ago?
MR. COLLINS: So you haven't done anything in
the debt portfolio in four or five years?
MR. WEBSTER: In the hedge funds, in the
opportunistic debt. Now, having said that, if we
thought that the opportunistic debt portfolio was
going to do better, we'd allocate more money there.
But it hasn't been the case.
For equity, we have some equity investments.
So typically we focus on strategies which are not in
global equities or in private equity, but we have
some private-equity-like stuff. But the bar is very
high for us to put an equity investment in strategic
investments simply because the FRS is composed of
90 percent equity risk.
Now, we want to have some equity for two
reasons. One because there are opportunities in the
1
2
3
4
5
6
7
8
9
10
11
12
13
14
15
16
17
18
19
20
21
22
23
24
25
30
ACCURATE STENOTYPE REPORTERS, INC.
equity markets that perhaps don't fit well in global
equities or private equity. And part of it is we
probably need some equity to generate our real
return over time. And we do intend to get more
aggressive allocating to global equity or to
equities during the next bear market, which
apparently will never ever happen again.
And you can see here, so you look here, so this
is our activist equity, which is really a beta-plus
strategy. The GP investments, which are investments
in a couple of firms. And then long/short equity.
So that's three year performance. But that
long/short equity performance lagged its benchmark
by about one and a third percent. So it's not like
it lagged by five or six percent. You can just see
the underperformance. But, again, if we ever have a
bear market again, then we would get more aggressive
in equity.
In real assets, we really like mining right
now, especially on the lending side, because it's a
classic -- a classic thing that we like is that it
had a pretty brutal bear market. The commodities
have gone sideways. A lot of capital had been
destroyed. A lot of capital had left. And so we
have been allocating to some mining funds. The
1
2
3
4
5
6
7
8
9
10
11
12
13
14
15
16
17
18
19
20
21
22
23
24
25

31
ACCURATE STENOTYPE REPORTERS, INC.
problem for us is it's hard to access. It's hard to
find institutional quality managers where we can do
that on a structured credit or equity side.
We like energy because of what's happened in
energy. There's a lot of money that's been raised
in energy, but we think the opportunity is quite
large. So on a risk-return basis, we think it's
pretty good.
On infrastructure, infrastructure has actually
done pretty well for us. But we think that there is
an imbalance of demand over supply for attractive
risk-adjusted returns. So we really haven't been
doing a whole lot in infrastructure over the last
few years. We have a slight underweight in a
portfolio context. Though we do like some of the
things that are going on in emerging markets
infrastructure, where we think you're probably
compensated for it on a risk-adjusted basis. You
can see here, this is the performance. This is a
little bit more even on the real assets portfolio.
So this is an area where we've been spending a
lot of time. This is the portfolio that we use to
hedge the credit and equity portions in the private
structure markets. We hope to put some money in the
ground in insurance soon, but we'll just wait to see
1
2
3
4
5
6
7
8
9
10
11
12
13
14
15
16
17
18
19
20
21
22
23
24
25
32
ACCURATE STENOTYPE REPORTERS, INC.
how pricing is before we get really aggressive on
that.
And this is the performance. We don't have
three year performance for relative value and
royalties. Global macro, which has been a bit of
a -- has had a bit of a difficult time, has actually
been, I think, our best performing hedge fund
strategy over the past three years.
Flexible mandates are composed of event-driven,
multi-strategy. These are primarily hedge fund
strategy. And then we also have this allocation
called open mandate, where we give -- these thus far
have been private structures, but we give the
manager a wide mandate to invest across a variety of
different things.
And often they are investing in things which
fall between the cracks within their organizations,
which maybe they're too aggressive for credit but
they don't meet the return hurdles for private
equity but are still attractive on a risk-adjusted
basis.
We don't have a three year track record yet for
open mandate. But you can see event. Event,
actually that was down 1 percent. It lagged its
benchmark, but the benchmark was down 0.5 percent.
1
2
3
4
5
6
7
8
9
10
11
12
13
14
15
16
17
18
19
20
21
22
23
24
25

33
ACCURATE STENOTYPE REPORTERS, INC.
MR. COBB: Mr. Chairman, I have a question on
Luxor Capital. I'm on another endowment fund that's
had very poor experience with Luxor. What's your
experience and are -- is that a hold or a warning?
MR. WEBSTER: So as you know, they had a pretty
big decline, and then they came rallying back. So I
don't want to comment about individual funds
specifically, but we do have a risk profile that
we're looking for, and we're assessing whether or
not a fund that goes down 30 or 40 percent fits in
our portfolio.
There are other mitigating circumstances that
we will assess. It's possible that with funds that
go down a lot, that bounce a lot, maybe give a small
allocation to them and then ramp up when they fall.
We don't know. We're assessing all those things.
But it's a live situation for us currently.
And the special situations is the miscellaneous
bucket of the portfolio. This is primarily
comprised of transportation, private-equity-like
strategies in the Florida Growth Fund. We're
actually going to be restructuring the asset class a
little bit. And most of this or all of it will be
reallocated elsewhere, either to newer strategies or
to new strategies, newly created strategies or
1
2
3
4
5
6
7
8
9
10
11
12
13
14
15
16
17
18
19
20
21
22
23
24
25
34
ACCURATE STENOTYPE REPORTERS, INC.
allocated within the asset class currently. But
it's done fairly well over the last three years.
So any questions? So I want to spend a little
time on hedge funds and the role that they play in
our portfolio, because we sat here and we've talked
about how they've pretty dramatically underperformed
private market structures. So we'll get to that in
a little bit.
But if you look at -- I've blacked out the
non-hedge fund strategies. And if you look at this
allocation, there are currently 38 -- we have
currently 38 percent of the asset class and
3 percent of the total fund are currently in hedge
funds. And it splits about 50-50 between the
diversifying strategies and the more beta-oriented
strategies in the portfolio.
The allocation does not include activists.
Some strategies include activists. We consider
activists not to be a hedge fund strategy. We don't
include them as such. And the important point --
MR. COLLINS: What do you consider them to be?
MR. WEBSTER: Beta plus. They're long-only
beta plus. And the one point that I would just make
here is that we don't have a hedge fund program. We
have a program that includes hedge funds. We think
1
2
3
4
5
6
7
8
9
10
11
12
13
14
15
16
17
18
19
20
21
22
23
24
25

35
ACCURATE STENOTYPE REPORTERS, INC.
that talking about a hedge fund program is a bit of
a misnomer, in the same way that somebody would be
talking about a liquid custodial fund program.
I can't recall anyone ever having a discussion
about a liquid custodial program, but I just
described fixed income and equity. Those are liquid
custodial funds, but they're two very different
asset classes.
Within hedge funds we see them as a wide
variety of different hedge funds and strategies.
And so we think of them as such and allocate capital
as such, as opposed to saying we want to have
5 percent in hedge funds or whatever.
So even though it's -- I think hedge funds have
lagged a little bit recently, I think it's important
to put into context why we went into them
originally. So if you were the CIO, not just of the
FRS but of any public fund, and it's 2010 and you're
looking back at the world and you're saying, gosh,
we've gone through two giant bear markets, should we
be looking at hedge funds. You look at these
numbers and you say, well, yes, because not only
have they done a pretty good job of protecting
capital relative to equity, they've actually
significantly outperformed a typical pension plan in
1
2
3
4
5
6
7
8
9
10
11
12
13
14
15
16
17
18
19
20
21
22
23
24
25
36
ACCURATE STENOTYPE REPORTERS, INC.
the Sharpe ratio during that time period it's been
significantly higher.
So it's perfectly rational in the post-global
financial crisis to make this assessment, because it
would move the portfolio of the total fund out onto
the efficient frontier.
As we know, it hasn't worked out that way. The
credit -- this is the broad market. The Credit
Suisse Hedge Fund Index has actually been about half
that of the total fund, and the Sharpe ratio has
been slightly less than the rest of the plan. And
to add injury to insult, what we found was that the
correlation of hedge funds to the FRS, you know, has
risen during that post-global financial crisis time
period.
So I wanted to just give a bit of a background
on how we think about them. When we originally went
into hedge funds in 2011, we focused on big
institutional brand name funds. A lot of pension
plans originally went through a fund of funds route.
We opted to go direct, but we opted to go to funds
which were well known, which had first class back
offices and operations.
And so our first -- what we did is that we
hired the good people at Cambridge, and then we told
1
2
3
4
5
6
7
8
9
10
11
12
13
14
15
16
17
18
19
20
21
22
23
24
25

37
ACCURATE STENOTYPE REPORTERS, INC.
them what we were looking for. They gave us ten
names. And we did our very best, because we're
curmudgeons, to shoot down all their ideas. And if
we couldn't shoot them all down sufficiently enough,
then we hired those managers. So hired five
managers from that. And then we went and asked
them, okay, send us some more. And I think they
sent six, seven other managers. And from that we
hired two or three.
That was our first wave. And we focused not
just on the large managers but the managers that had
done well protecting capital during the global
financial crisis, because we looked at the world and
we said, well, you know, the FRS went down 20-some
percent. Global equities went down 40 percent.
We've got enough of that. So let's find things that
aren't that.
And I think the first 15 or 20 funds that we
hired, I think the average decline during 2008 was
eight and a half percent, whereas stock markets went
down 40 percent during that year, or thereabouts.
So that was the original thinking. And that
was in our first wave, was getting suggestions from
Cambridge. Then we went back to Cambridge and we
said, in our second wave we said, let's take a look
1
2
3
4
5
6
7
8
9
10
11
12
13
14
15
16
17
18
19
20
21
22
23
24
25
38
ACCURATE STENOTYPE REPORTERS, INC.
at all the comps of the firms that you've supplied
to us. And they gave us about 80 or 100 names. And
then from that, we went through every single one and
culled it down to about 40. And then we went and
met all of them and made a decision to hire
something like five or six of them.
And then in the third wave, where we got to
know hedge funds, we got to know the assets in the
hedge funds, got to know who the players were, we
spread our wings and we started to fly away from the
nest, and it became more of a partnership with hedge
funds, where we're sourcing ideas and bouncing it
off them and they're sourcing ideas and bouncing it
off us. We're working more like an integrated team.
The other change was that it evolved to focus
less on how you did in the financial crisis to more
focusing on strategies which were uncorrelated to
equity returns, because the first few waves of
strategies were in funds which were primarily credit
and equity.
So what we currently do is we're currently
looking for strategies which are not correlated to
equities and less focused on credit but with a big
caveat that we'll always find a place in the
portfolio for a high quality manager no matter what
1
2
3
4
5
6
7
8
9
10
11
12
13
14
15
16
17
18
19
20
21
22
23
24
25

39
ACCURATE STENOTYPE REPORTERS, INC.
they do, if they're equity, credit or whomever. So
we'll always look at those types of managers, so
we'll always have, we would imagine, exposures to
those strategies.
But really the way we see it is a large portion
of this book is to hedge the illiquid strategies in
the private market structure, where we can access
those exposures cheaper through a private market
structure than we can through a more liquid hedge
fund.
And so this is our performance since
April 2011. And so from a total return standpoint,
it's been probably less than what we had expected,
but it has beaten its benchmark. It has beaten the
industry. It has beaten the fund of funds. It's
lagged the FRS, and it's lagged our real return
benchmark. But if you look at it on a risk-adjusted
basis, on a Sharpe ratio, it's ahead of all of
those.
So there's a bit of a conundrum that we would
be looking much better on an absolute return basis
if our managers took more risk. But they've been
running at about a three and a half percent vol
since inception, and so they're not generating a
great deal of return, but they are generating
1
2
3
4
5
6
7
8
9
10
11
12
13
14
15
16
17
18
19
20
21
22
23
24
25
40
ACCURATE STENOTYPE REPORTERS, INC.
attractive risk-adjusted return.
And not only that, but what we've seen over
time is that we've seen the correlation of our hedge
fund portfolios decline relative to the FRS. So the
light blue line, that represents the total industry
or the Credit Suisse Hedge Fund Index. The dark
blue line, that's us.
One thing I forgot to mention on here on the
performance is we don't include activists in it, but
our activist book has been so strong because equity
markets have been so strong and it's beaten the
benchmark, that had we included activists, that
return, hedge funds plus activists, would be
8.8 percent since inception. So it just depends on
what you're comparing.
And, finally, these are the returns, the three
year returns where we have the most data for all our
hedge fund strategies. The relative value is
actually quite negative because we've had one fund
that hasn't done well. But they're all lower than
what we had expected. But this book has beaten its
benchmark over three years by about 90 basis points.
So that's all I had.
MR. PRICE: How long a leash do you give them?
MR. WEBSTER: That's a good question. We
1
2
3
4
5
6
7
8
9
10
11
12
13
14
15
16
17
18
19
20
21
22
23
24
25

41
ACCURATE STENOTYPE REPORTERS, INC.
typically go into any fund with the mind-set of
three to five years. Now, if there's something
that's going wrong fast, then we'll get out. And
that has happened for us.
But ideally you'd like to give them a market
cycle. But what's a market cycle these days? Ten,
12 years is probably too long. So we typically
think at about three to five years and then adjust
accordingly. I think the average duration of our
hedge funds are somewhere around three and a half,
four years thus far.
MR. McGOULD: And, Trent, when you look at just
the allocation of U.S. versus European or Asian
hedge funds, are you actively looking for hedge
funds outside of the U.S., or is it mainly U.S.
focused?
MR. WEBSTER: Most of it's been U.S. focused.
We do have a few things outside of North America.
And broadly what we've been discussing as a group
recently is, not just in the hedge funds but in the
total fund, putting more money outside the U.S. And
I would imagine over time we will. But I would
guess that most of our assets will be in America.
The problem that we have with Asia is that we
require full position level transparency from our
1
2
3
4
5
6
7
8
9
10
11
12
13
14
15
16
17
18
19
20
21
22
23
24
25
42
ACCURATE STENOTYPE REPORTERS, INC.
funds. And that's pretty difficult to get in Asia.
So that's -- that stops us from doing business
there. But ideally we'd like to put more money
outside of the United States.
MR. COLLINS: Any questions?
MR. COBB: Yes, sir. I have a question.
Trent, in your presentation particularly on hedge
funds, you continue to emphasis risk -- minimizing
risk. And clearly the hedge funds do that. On your
very first slide -- and I commented on this I think
twice during the last couple of years. No. Back to
the very first slide of the whole presentation,
where you talk about your objectives.
MR. WEBSTER: I'm sure there's a better way to
do this.
MR. COBB: So there's absolutely no mention of
risk or minimizing risk. And it seems to me that
you're doing most of those things through other than
hedge funds, but you also do have hedge funds. And
although you're reducing it, which I would support,
it's still 38 percent of your portfolio. And the
reason I think you have those hedge funds is to
minimize risk.
And so it seems to me one of your key policy
objectives, and that's the main reason you're in the
1
2
3
4
5
6
7
8
9
10
11
12
13
14
15
16
17
18
19
20
21
22
23
24
25

43
ACCURATE STENOTYPE REPORTERS, INC.
hedge funds, is to minimize risk, which is
completely different than diversification, by the
way. So I know I brought this up before, but I
think you disagreed with me then, and I'm still
finding out whether you're still disagreeing with
me.
MR. WEBSTER: Actually, you know something?
There are two points here and why we're changing the
policy. We're going to change it slightly. What
you'll see here in the next couple of quarters is,
because of the conversations that we've had,
Ambassador, because you made a great point about
downside protection, where I've always been a little
bit worried about getting nailed on that is that
there are some times where you want to be really
aggressive in the markets. And so there could be
times when stocks are at seven times earnings or
whatever.
MR. COBB: But why isn't it one of five key
policy objectives?
MR. WEBSTER: Let me explain. So I'm going to
tell you what we're going to change. What we're
going to change is, because I don't actually want to
put downside protection in there, but what we're
going to change it to, I think the exact wording is
1
2
3
4
5
6
7
8
9
10
11
12
13
14
15
16
17
18
19
20
21
22
23
24
25
44
ACCURATE STENOTYPE REPORTERS, INC.
outperform during a significant market decline. So
if you get a big decline, this portfolio should do
better, significantly better by the way we're
constructing it.
And we acknowledge that that should be one of
our objectives. So we're going to change it and add
language which says that we should be doing better
than the FRS during a market decline, and that
should push us into strategies which will help
mitigate the down side.
Part of our thing is that we actually -- if you
have like a 40 percent decline, we don't expect to
go up. We expect to go down. But we would go down
10 percent, 15 percent, somewhere along those lines.
But we will have strategies in there which will help
mitigate it.
MR. COBB: The Cambridge slide two or three
from now shows that -- it says the status, that we
captured only 17 percent of the last downturn, if I
understand this chart correctly. So, yes, we did
accomplish that minimizing risk, but it seemed to me
it should be the focus. That's all.
MR. WEBSTER: And that's fair. And it has been
a focus for the last three years, which was why we
haven't done any credit hedge funds. We've done one
1
2
3
4
5
6
7
8
9
10
11
12
13
14
15
16
17
18
19
20
21
22
23
24
25

45
ACCURATE STENOTYPE REPORTERS, INC.
equity hedge fund in the last four years.
MR. WILLIAMS: Mr. Chairman, can I help out
here?
MR. COLLINS: Sure.
MR. WILLIAMS: Trent has just given us the long
answer of yes. That's the answer.
MR. WEBSTER: I'm windy.
MR. WILLIAMS: The policy objective is to help
reduce risk, yes. Thank you.
MR. COLLINS: And I think what the ambassador
is saying is why don't we put something in there.
If that is the case, why doesn't it appear anywhere?
MR. WEBSTER: That's coming.
MR. COLLINS: Is that a ditto, Ash? Okay.
MR. WEBSTER: And the other change we've had is
again from conversations around here. I remember
making this presentation, it might have been a year
or two ago, and I said one of our objectives is to
diversify the Florida Retirement System. And Mr.
Price wisely said, Well, isn't that why you're all
here?
So we're changing that actually, and the
wording will be something along the lines of "dampen
the volatility of the fund." We're actually going
to strike that "provide a hedge against inflation"
1
2
3
4
5
6
7
8
9
10
11
12
13
14
15
16
17
18
19
20
21
22
23
24
25
46
ACCURATE STENOTYPE REPORTERS, INC.
because it's already implied in generating a real
return. So you'll see a little bit of a change.
MR. COLLINS: All I'm going to say is it better
be in there before the next meeting.
MR. WILLIAMS: Thank you. May we have another.
MR. COLLINS: Because I think he's going to say
something again, and rightfully so.
MR. WEBSTER: We're with you in spirit.
MR. COLLINS: Continue.
MR. MEHTA: Thank you. We have a number of
pages here. In the interest of time, we'll just go
through a few, sort of building on the conversation
that we've had already.
MR. COLLINS: Andre, for those that might not
know up here, why don't you give a little bit of
background on what you do specifically for the State
Board at Cambridge.
MR. MEHTA: Sure. So at Cambridge we serve a
number of different roles, both on the strategics
side and then we also work with John Bradley,
another team, on the private side. I think, as
Trent described it, that really is a fair
assessment. So we work hand in hand as real
partners here, with a lot of debate going back and
forth, being almost like another part of their
1
2
3
4
5
6
7
8
9
10
11
12
13
14
15
16
17
18
19
20
21
22
23
24
25

47
ACCURATE STENOTYPE REPORTERS, INC.
investment office, having weekly calls where we
discuss what interesting managers we've met with,
talk about interesting things we've heard out there
in the markets, talk about strategies, about how to
access difficult-to-access managers, how to convince
them that providing transparency is the right thing
to do, and also importantly to negotiate fees down,
because fees are certainly a big cost of this.
So it's a wide ranging -- we talk about
anything and everything. We'll interject thoughts
on capital markets and how that might impact the
program. So it's a very dynamic discussion. Is
that helpful?
MR. COLLINS: Yes.
MR. MEHTA: So let me just flip to the right
slide here. I'll start with this slide here called
How Are Hedge Funds Different From Traditional
Investments. And one of the ongoing discussions are
the question of whether or not every incremental
fund that we add really does serve to achieve those
goals that Trent outlined earlier.
So what this honeycomb chart really is is
looking at what are those investment strategies that
you can achieve through traditional fixed income in
blue through traditional equity in orange and hedge
1
2
3
4
5
6
7
8
9
10
11
12
13
14
15
16
17
18
19
20
21
22
23
24
25
48
ACCURATE STENOTYPE REPORTERS, INC.
funds in green, which is in addition to everything
else that you see in the blue and the orange slides.
So the big picture point is that what we're
trying to do is to find investments that generate a
reasonable return, that do so in a very different
way than what else is in the portfolio.
When thinking about which managers might fall
into this portfolio of hedge funds as opposed to a
hedge fund portfolio, every investor has their own
unique goals and unique circumstances. And we've
outlined here three broad goals of hedge fund
portfolios. One is true diversification. Another
on the other extreme end might be a very
return-seeking goal, and in the middle certainly a
blend of the two strategies.
And in this case we have focused on the
diversification goal, so really again emphasizing
that we're trying to find things that are different
than what we might get elsewhere in the total FRS
plan.
In terms of measuring, you brought up the
question of have we protected in down markets. So
let me just describe what this matrix is briefly.
When we think about evaluating the performance of a
portfolio of hedge funds, we're really thinking
1
2
3
4
5
6
7
8
9
10
11
12
13
14
15
16
17
18
19
20
21
22
23
24
25

49
ACCURATE STENOTYPE REPORTERS, INC.
about it from a return perspective, clearly, but
also a risk perspective and a diversification
perspective.
And so we'll talk about these various metrics
on an ongoing basis, not only to evaluate
performance but thinking about what might be missing
and what might we be seeking in order to try and
better the overall profile of the portfolio.
You did point out in the very bottom of that
green block and the very top of that orange block,
we are trying to capture a meaningful portion of
market returns. And over the course of the past 78
months since 2011, we've been able to achieve
roughly a 60 percent market capture when markets are
rising. And similarly, when market are falling,
that has been roughly 17 percent.
So what we're looking for is that asymmetry,
try and capture as much of the returns when markets
are rising but try and really capture as little of
the negative returns when markets are falling.
MR. CHHABRA: We're going to flip one more
page. If you flip forward to --
MR. COLLINS: Can I just ask a question real
quick?
MR. CHHABRA: Please.
1
2
3
4
5
6
7
8
9
10
11
12
13
14
15
16
17
18
19
20
21
22
23
24
25
50
ACCURATE STENOTYPE REPORTERS, INC.
MR. COLLINS: So on the 60 and the 17, so I
guess a couple of pages or the next page, actually,
it says we captured 55.9 and 24 percent of the -- of
the up and 24 percent of the down. If our goal is
60 and I think you said 17, is that right?
MR. MEHTA: That is historical. The goal is
somewhat qualitative. We like to ideally capture
100 percent when markets are rising and zero percent
or negative -- make money when markets are falling.
MR. COLLINS: So I guess that answers sort of
my whole issue with the hedge fund portfolio in
general today, modern hedge fund portfolios. I
think, along with some of the other people up here,
I sit on other endowment boards or pension boards as
well. The returns -- it's not so much the returns.
It's the, hey, I thought I bought this and I got
this. Right? And it was about two years of
performance before we realized that we didn't get
what we bought for, but we paid a lot, so that was
good.
And so in the diversification, it seems to me
that whenever somebody goes out to build a hedge
fund portfolio or when they were starting to build
hedge fund portfolios, oh, well, we need some of
this and we need some of this and we need three or
1
2
3
4
5
6
7
8
9
10
11
12
13
14
15
16
17
18
19
20
21
22
23
24
25

51
ACCURATE STENOTYPE REPORTERS, INC.
four names here.
And before you know it, you've got 20 names.
Right? And three different strategies, all of them
Google. Right? And how can that be? Right? Well,
one guy is buying puts, and somebody else is just
going long, and then some idiot is going short.
Right?
So at the end of the day, I wonder if the three
of you and Trent, no offense, if we really have any
idea how it's going to perform at certain levels of
market performance. I just find it just baffling
because I don't -- it's like grabbing onto sand.
MR. WEBSTER: Can I make a comment on that?
Like on the diversifying strategies, what we have
found is that during pull-backs, it's performed as
we've expected. It's either been up or it's been
down a little bit. And that's what we're looking
for.
Now, when the market is up 20 percent or
whatever, it's going to be up two or whatever. So
you look at it and you go, gee, why aren't you in,
you know, the market? And our argument is, well,
that's not the market. This is something different,
has a different role.
So parts of what we already -- what we have in
1
2
3
4
5
6
7
8
9
10
11
12
13
14
15
16
17
18
19
20
21
22
23
24
25
52
ACCURATE STENOTYPE REPORTERS, INC.
the portfolio is acting as it should. And then the
other parts, which are more the growth engines and
the growth drivers, they've done better than the
market or, I'm sorry, better than the industry, but
it lagged the market.
MR. COLLINS: So in the graph on this next page
that I'm talking about, you've got MSCI Investable
Market Index, 7.9, and you're saying we're at 4.4.
Is that the right benchmark to judge whether we're
getting 60 percent against or not?
MR. MEHTA: So it's the question of what really
are the overall goals, right?
MR. COLLINS: Yeah. What is the market, right,
that we're trying to grab 60 percent of.
MR. MEHTA: We're using the equity markets just
as a proxy for that asset class which generates a
substantial long-term return and that will drive
performance of the overall plan most greatly. It
may not be the right -- it may not be the right
index. It may not be the right market, but there's
a question with alternatives, which is what are you
really trying to achieve overall. And defining the
goals and defining a benchmark is something we could
spend all day on.
MR. COLLINS: Like I say --
1
2
3
4
5
6
7
8
9
10
11
12
13
14
15
16
17
18
19
20
21
22
23
24
25

53
ACCURATE STENOTYPE REPORTERS, INC.
MR. MEHTA: I agree.
MR. COLLINS: -- it's like grabbing sand.
MR. MEHTA: One more comment.
MR. COLLINS: Expensive sand.
MR. MEHTA: It is expensive. We agree
completely. And it is a big sand box, and there's a
lot of people, a lot of grains of sand in there that
really aren't worth it. And so we spend a lot of
time trying to weave through those to find those
which really are.
And at the same time, instead of trying to fill
buckets -- and I think Trent's direction to us has
been very clear on this. We're looking at it from a
bottom-up perspective. So each individual manager
needs to stand on its own. And what we really need
to understand is, when you put a dollar in, you're
going to expect a dollar plus out, and what is that
mechanism in between that achieves that goal.
MR. WEBSTER: And you have an excellent point,
because this is our realization, Peter, is that, you
know, we can get the credit and equity exposure
through the private market structure where the fees
are lower, just do that. But we've got to hedge it,
so we're hedging it with the stuff that will go up
when the market goes down. That's how we think of
1
2
3
4
5
6
7
8
9
10
11
12
13
14
15
16
17
18
19
20
21
22
23
24
25
54
ACCURATE STENOTYPE REPORTERS, INC.
it holistically from a portfolio standpoint.
MR. DANIELS: Mr. Chairman?
MR. COLLINS: Yes.
MR. DANIELS: But aren't you really saying,
when you look at the numbers, that you're paying a
price to have this cushion, if you will, in a down
market? Because if you didn't have the asset class
at all and you went back and looked at since
inception, which means you can stomach the down
market, you'd do better without the asset class. So
you're saying that you're willing to pay that
overall return difference to have that damper in a
down market.
MR. WEBSTER: Well, I do think that there's --
and I'll defer to Ash on this. But from the total
fund basis, I think there is a benefit to reducing
volatility to the total fund. It depends on how
much you want to --
MR. WILLIAMS: But directly to your question,
Les, that is the proposition. And since we set this
up -- keep in mind I got back in Q4 of '08. We
hired Cambridge in '09, I guess, and did our first
manager visits and fundings in '10. We haven't had
a real downturn since then, and it's been an
uncommonly long bull market.
1
2
3
4
5
6
7
8
9
10
11
12
13
14
15
16
17
18
19
20
21
22
23
24
25

55
ACCURATE STENOTYPE REPORTERS, INC.
UNIDENTIFIED SPEAKER: (Inaudible).
MR. WILLIAMS: True, that's true. But it
wasn't like '08, '09 either or some of the other big
downturns.
MR. PRICE: I think the Board, Ash, needs to
turn from Trent and you and say, do you think, as
the head of this place, 4.4 percent with the fees is
sufficient.
MR. WILLIAMS: I think where we have the fees
and the way we model out what the benefit will be,
yes, it makes sense from a portfolio construction
standpoint now. And as Trent just said, what we've
continued to do is sharpen our pencils in terms of
looking at these strategies and saying, wait a
minute, this is really like -- effectively like
something we can do in the public markets for almost
no cost or something we can do in a long-only
private market format at substantially less cost.
We do that on a daily basis.
And I think the other trend that's in place in
the hedge fund industry unambiguously is fees and
terms are becoming more and more aligned between LPs
and GPs.
MR. DANIELS: I'm not so concerned about -- the
fees aren't a problem. What I'm getting at is you
1
2
3
4
5
6
7
8
9
10
11
12
13
14
15
16
17
18
19
20
21
22
23
24
25
56
ACCURATE STENOTYPE REPORTERS, INC.
are making a conscious decision that having that
damper in down markets is worth paying a premium for
over not having it.
MR. COLLINS: And not only that, but I think we
have an asset allocation really, an overall asset
allocation that is supposed to be helping us with
that, and then you're taking part of that asset
allocation that's supposed to be helping, and then
you're doing it -- you know, you're doing it again
on a sub-level that's really expensive.
And I'm not sure at the end of the day, if we
have another '08 or '09, how much of that is going
to be the real reason why we don't go down dollar
for dollar and how much other portions of the asset
allocation are going to really contribute.
MR. DANIELS: Putting it another way, it helps
you sleep, but it doesn't necessarily help you eat
over the long run.
MR. WILLIAMS: That's the best summary I've
heard. That's really good. That may be right. And
then the question is, you know, how much hunger is
the sleep worth, I guess.
MR. DANIELS: That's the question.
MR. WILLIAMS: I get it. That's the balance.
And, again, I would come back to it and say I guess
1
2
3
4
5
6
7
8
9
10
11
12
13
14
15
16
17
18
19
20
21
22
23
24
25

57
ACCURATE STENOTYPE REPORTERS, INC.
on a relative basis, if you think about -- this
seems to be a cost-benefit analysis. And if you
look at the cost, it's a relatively small cost. I
mean, all in, you're talking about, what did we say,
175 basis points, 160 across the book, something
like that?
MR. WEBSTER: Less than that.
MR. WILLIAMS: Right. So think about that and
then think about the capital preservation value. If
you have a material drawdown against that same
capital base, you could cover a fair number of years
in those fees in one good drawdown that you've
mitigated significantly through the holding of those
assets.
I think the other thing is, again, I can't
leave this point of the way we're continuing to
evolve the book. The last really big change we made
in this hedge fund portfolio was to add the CTA
exposure, which is probably the most powerful
capital protector in down environments, risk
mitigator, risk reducer, negatively correlated thing
you could have. It's also one of the very cheapest
exposures we've got.
MR. WEBSTER: Just as a point, when we did
this, we've done analysis of whether we could have
1
2
3
4
5
6
7
8
9
10
11
12
13
14
15
16
17
18
19
20
21
22
23
24
25
58
ACCURATE STENOTYPE REPORTERS, INC.
managed futures in the portfolio, and I think we ran
it through -- I think it was the FRS, or it was
stocks. I can't remember. It did reduce the
returns, but I think it reduced it by like 50 basis
points, 100 basis points. It reduced the volatility
by 40 percent. We look at that and that causes your
Sharpe ratio to spike, you know.
And it's a balance, because you can go
100 percent equity and make the same argument for
this whole fund. Just give all the money to Alison
and Tim and there you go. So it's a balance between
what sort of risk-return trade-off do you want to
have.
And as a point, we've seen in managed futures
fees absolutely collapse, below -- it's double digit
basis points, no carry. That's what we're seeing.
So for us it's worth it.
MR. WILLIAMS: And that fulfills exactly the
need we're trying to fulfill and does it very
cheaply.
MR. COBB: Mr. Chairman, I have a question for
Cambridge. And my question relates to the macro
world of both hedge funds and private equity, with
today, what, four, five trillion dollars, all
looking for inefficiencies in the market, when ten
1
2
3
4
5
6
7
8
9
10
11
12
13
14
15
16
17
18
19
20
21
22
23
24
25

59
ACCURATE STENOTYPE REPORTERS, INC.
years ago there was 5 percent of that or 10 percent
of that amount of money looking for the same
inefficiencies in the market.
So it seems to me it was pretty easy to justify
fees because there were so many inefficiencies and
so little capital. And your returns show that up
until 2009 or '10. But since that time, just the
supply of capital seems to me a factor. But it
hasn't been mentioned at all in this presentation.
MR. MEHTA: What was subtly mentioned in
Trent's presentation was a shift towards smaller
managers that do have the ability to invest in
things that the big, mega players cannot. So we are
cognizant of the amount of capital, the vast amount
of capital that exists in the alternative markets.
We are trying to find managers that that is not
a hinderance. And one of the things that we measure
very clearly is at what point does a manager's asset
base exceed, or rather at what point do they start
to diminish the returns by accepting additional
capital.
MR. COLLINS: Bobby.
MR. JONES: The only point I wanted to make was
I think all of us have some questions about the fees
associated with hedge funds, how expensive that
1
2
3
4
5
6
7
8
9
10
11
12
13
14
15
16
17
18
19
20
21
22
23
24
25
60
ACCURATE STENOTYPE REPORTERS, INC.
insurance is. And, again, we haven't seen a payoff
in quite a long time. So I think it's something we
ought to keep looking at.
I think the other indication, though, is our
performance against the other top endowments and
pension funds has been in the top quartile, if not
number one or better. So it's something that seems
like we don't make a decision in one day but
continue watching ourselves as well as our peers and
make sure our returns stay better than the rest of
the ocean.
MR. COLLINS: Yeah, I think I would agree with
that. The only thing I would say about fees coming
down, you know, a brand-new boat captain charges
more than a boat captain with a really broken boat
when you go to charter. And you can get really,
really, really, really cheap boats. Not sure you
want to go on it at the end of the day. Right?
So I love paying for alpha. Right? But I
don't want to overpay for beta. And they can keep
reducing the fee because they're not creating alpha
and everybody is screaming. Right? But we're still
overpaying for beta.
MR. WILLIAMS: If we're buying beta in that
format, and I think I would argue we're not.
1
2
3
4
5
6
7
8
9
10
11
12
13
14
15
16
17
18
19
20
21
22
23
24
25

61
ACCURATE STENOTYPE REPORTERS, INC.
MR. COLLINS: And I would tell you that I think
in all the diversification, I don't think that we're
getting as much hedge as we think we are. None of
us disagree with the hedging. I think, as I said,
asset allocation is our greatest hedge. But I think
when you get that many funds and that many different
strategies, you never really know until you look in
the rearview mirror.
But it just seems to me that if you deep dive
into these various funds and you start looking at
the names that are owned and what the strategy is on
that name, you could have really good performance in
one fund and really bad performance in another and
you overpaid for one of them.
MR. WEBSTER: And we're cognizant of that. So
one of the things that we have been studying for
years and that we continue to look at is these risk
premia, style premia, alternative beta, whatever you
have. We have one of those funds from AQR. And we
have met with a lot of the providers of that.
That's a very -- that may be one of the solutions.
MR. COLLINS: I don't want to belabor it. So
let's keep moving on, unless anybody else has any
other questions.
MR. CHHABRA: Just one last point. I flipped
1
2
3
4
5
6
7
8
9
10
11
12
13
14
15
16
17
18
19
20
21
22
23
24
25
62
ACCURATE STENOTYPE REPORTERS, INC.
forward two pages. It's hard to see on the screen,
two pages forward. But I think this is powerful to
the point of morphing this part of the portfolio to
be more focused on diversification.
Trent mentioned the addition of global macro,
specifically CTAs over the last few years. That's
done wonders, and along with that adding some other
diversified strategies, to bring down the total
correlation relative to what we're getting in the
broader part of the portfolio.
So that's actually decreased the correlation of
the strategic part of the portfolio to the rest of
the portfolio by something like 40 percent. It's
been -- going forward, should you have any worries
about market valuation levels and the ability sort
of to morph this to be more diversification in
periods of stress, I think this is proof in the
pudding that we should be well situated.
MR. COLLINS: Does anybody have any comment on
that? Okay. All right. So do we have global
equity next? Alison and Tim, or is it Katy? No.
Alison and Tim. That's what I have in my book.
MR. WILLIAMS: I think we have another
component.
MR. COLLINS: Oh, sorry.
1
2
3
4
5
6
7
8
9
10
11
12
13
14
15
16
17
18
19
20
21
22
23
24
25

63
ACCURATE STENOTYPE REPORTERS, INC.
MR. MARCUS: So we'll keep this brief. We know
you've gone on quite a bit here with the strategic
portfolio. So we'll jump ahead. Townsend has a
couple of slides in here, and I'll give a quick
explanation of what Townsend does.
MR. COLLINS: Just explain to everybody
Townsend and your role and what you're doing in the
portfolio.
MR. MARCUS: Absolutely. So there's a Townsend
update later in the presentation. Townsend has
about 34 years of experience working in the real
estate and real assets asset classes. We've been
working with the SBA since 2004, and we focus on
real assets exclusively. So we work with both Trent
on the strategic group, with a focus on real estate
debt and also timber, and then with Steve Spook and
his team on the real estate equity side of the
portfolio.
So we are headquartered in Cleveland, Ohio,
offices in London, Hong Kong and also in San
Francisco. Trent and his team have recently
utilized our international offices on some due
diligence trips to Europe. And another recent
update of Townsend is, announced on September 1st of
this year, Aon, who you know well, announced the
1
2
3
4
5
6
7
8
9
10
11
12
13
14
15
16
17
18
19
20
21
22
23
24
25
64
ACCURATE STENOTYPE REPORTERS, INC.
acquisition of Townsend later this year. So we feel
this is a great fit for Townsend's clients,
yourself, as well as Townsend employees.
So Townsend will become a wholly-owned
subsidiary of Aon, Aon's global retirement
investment business, which as you know, really
provides objective advice and investment management
solutions to a wide range of global clients, and as
a strong fiduciary, much like Townsend, has strong
values, corporate culture, very like-minded
organizations, putting the client first.
And the acquisition really provides stability
here at the Townsend level, a large balance sheet,
really a path of growth for Townsend as an
organization, and all to support you-all and also
our employees. Essentially it's being really
structured as a reverse merger. So Townsend will
retain its name, maintain its headquarters in
Cleveland, the investment process, the investment
committee. And to that point, Terry Ahern, someone
you have met over the years, will remain the CEO of
Townsend going forward in all the existing illiquid
asset classes that AON covers.
MR. COLLINS: Anybody have any concerns there?
I know that they're making him go through that slide
1
2
3
4
5
6
7
8
9
10
11
12
13
14
15
16
17
18
19
20
21
22
23
24
25

65
ACCURATE STENOTYPE REPORTERS, INC.
at every presentation.
MR. DANIELS: Have you thought about moving to
Florida?
MR. WILLIAMS: The chief executive of Aon is
right here, Steve Cummings, if you'd like to pose
that question to Steve.
MR. DANIELS: Sure. Steve, you can answer that
question.
MR. CUMMINGS: Am I moving to Florida?
MR. DANIELS: Move the company to Florida.
MR. CUMMINGS: Not in the immediate future,
sir.
MR. MARCUS: Any other question on that? I'll
jump just quickly to two slides of our presentation,
talk about performance of the real estate debt and
timber portfolio. So here on the slide in front of
you we look at the real estate credit and timber
portfolio performance.
This is a sub-allocation within the strategic
investments of about 1.6 billion of market value
today. It's 16 active positions. That's across --
16 active positions in the debt side and two in the
timber. And that's across ten different managers.
There's been approximately 3 billion of capital
commitments, with 1.7 billion returned to you-all,
1
2
3
4
5
6
7
8
9
10
11
12
13
14
15
16
17
18
19
20
21
22
23
24
25
66
ACCURATE STENOTYPE REPORTERS, INC.
with about 750 million of unfunded capital. Since
the portfolio's inception, so the first investment
was made in 2008, the portfolio has generated, as
you'll see here, an 8.7 percent net IRR.
Flipping to the next slide, we focus on just
the debt performance of the portfolio. And here is
really the majority of the investments that we all
cover at Townsend. Approximately 70 percent of
those 3 billion in commitments were made to real
estate debt investments. And we show again a very
strong performance over these time periods.
We also show on the right-hand side the cash
flows and market value of these investments dating
back to that '07, late '07, '08 inception. And it's
somewhat hard to see, but on the far right-hand side
of this chart, you'll see the past six quarters of
distributions have actually exceeded capital
contributions. You'll see a slight decline in the
net asset value.
And this is, to another point that Trent
mentioned earlier, capital is being returned quicker
than it's being invested. That's the nature of the
market we're in today, the market environment, but
also the life cycle of these funds. So they're
reaching sort of their full term.
1
2
3
4
5
6
7
8
9
10
11
12
13
14
15
16
17
18
19
20
21
22
23
24
25

67
ACCURATE STENOTYPE REPORTERS, INC.
The last slide I'll touch on and then pass it
back to you-all is really on the timber performance.
So here on this slide we show both the performance
of the two timber separate accounts as well as their
diversification. However, you'll notice some
underperformance in your timber portfolio versus the
industry indices, not necessarily the benchmark
within the SBA but the industry indices of the
NCREIF timber index and the separate account index.
MR. COLLINS: Is that because of regionality of
our holdings, or what would cause that
underperformance relative to the index?
MR. MARCUS: The primary reason is inception.
So your portfolio began in 2012. Both of these
indices have long-standing cash flow and assets
dating back to the eighties. So as your portfolio
is still being created, value creation is still
being implemented, a lot of your assets are being
held at cost in the first year. So it's more of a
timing issue than it is the diversification or
allocation.
MR. COLLINS: Ash, we weren't in timber before
2012?
MR. WILLIAMS: No.
MR. COLLINS: Really? In any way?
1
2
3
4
5
6
7
8
9
10
11
12
13
14
15
16
17
18
19
20
21
22
23
24
25
68
ACCURATE STENOTYPE REPORTERS, INC.
MR. WILLIAMS: Look, I've thought of about a
half a dozen timber jokes here, and I'm going to
steer away from all of them. But no.
MR. COLLINS: For sure we were involved with
some Timcos or something way back when. Okay.
MR. MARCUS: So it's really the early onset of
this portfolio. It will continue to grow. And if
you just look at the long-term performance over the
three year period, there's a slight
underperformance, but it is tracking towards that
benchmark.
So there's a number of other slides here, but
in the interest of time and keeping it brief, I'll
stop there and open it up to any questions.
MR. COLLINS: Any questions to them? We're
just talking about timber. Any questions for
Townsend? Okay. Thanks, everybody. Thanks, Seth.
Thanks, Dick.
MR. MARCUS: Thank you.
MR. COLLINS: Alison, Tim, now you're up,
unless Katy wants to go first.
MS. WOJCIECHOWSKI: No.
MR. COLLINS: Okay.
MS. ROMANO: Good afternoon. It's been alluded
to many times in this discussion and I know you-all
1
2
3
4
5
6
7
8
9
10
11
12
13
14
15
16
17
18
19
20
21
22
23
24
25

69
ACCURATE STENOTYPE REPORTERS, INC.
know the markets well. Equity markets are way up.
But I want to provide a few data points to provide
some context around what I know you do want to talk
about, which is performance. So I'm going to give
some updated statistics to even what's on this page.
But just to give you a sense of how much the
markets are up this year, through last Friday,
domestic markets up 19.7 percent, non-U.S. developed
markets, almost 22 percent, and year to date
emerging markets up 31.5 percent this year.
One really interesting point, if you break down
emerging markets, now close to 20 percent of the
emerging market index is five companies. So how
Tencent does, Samsung, Alibaba, Taiwan Semi and
Naspers, which essentially owns Tencent, so you
could say it's four companies, how they do has
driven a lot of this quick rise in emerging markets.
MR. COLLINS: So what's the acronym for that?
Like FANG, what's the acronym for that? Y'all
haven't made one? Okay.
MS. ROMANO: So tech has had an incredible run,
and particularly in emerging markets. And you can
see in the bottom left graph there that it's not
only been tech, but it's been a lot of the cyclical
areas that have come back, materials, industrials,
1
2
3
4
5
6
7
8
9
10
11
12
13
14
15
16
17
18
19
20
21
22
23
24
25
70
ACCURATE STENOTYPE REPORTERS, INC.
financials. So if you want to call that a risk-on
environment, we could.
I think what's also telling on the bottom, or
sorry, the top right graph is how much growth has
been in favor. So it looks like over the quarter
it's only 71 BPs but, again, year to date through
last Friday, growth has beaten value 10.6 percent
across the world.
And I mention this because I think, as we
started, we said everything looks expensive. But
there is divergence within the equity market. So
there could very well be opportunity for the right
managers. For instance, is this now the time for
value, because for so long growth has outperformed.
And there's a lot of evidence to say, over very long
periods of time, value should outperform.
So in periods where the market keeps going up
and up -- and to give you another set, 13 months in
a row of up performance for the MSCI World Index.
It can be tough for active managers. Everything is
rising in tandem.
But you'll see our performance on the next
slide. We have outperformed. So 21 BPs
outperformance in the third quarter, 98 BPs for the
year and 79 BPs over the five years. We continue to
1
2
3
4
5
6
7
8
9
10
11
12
13
14
15
16
17
18
19
20
21
22
23
24
25

71
ACCURATE STENOTYPE REPORTERS, INC.
do this well within our risk budget, and actually
well below the monitoring standard, to deliver
ongoing strong risk-adjusted returns. And I'll turn
it over to Tim to talk about the detail behind that
performance.
MR. TAYLOR: Thank you, Alison. Good
afternoon, everybody. Looking at the next page,
under active performance summary, I'm not going to
cover each line here, but I thought I'd focus on the
top two and the bottom two. If you look at the
emerging market active aggregate, it lagged its
benchmark. Very strong market. It was up seven and
a half percent in the quarter. Cash holdings
detracted, as well as an underweight to the Chinese
Internet names.
As Alison discussed, the EM benchmark has
changed notably in the past couple of years, as the
top five names account for such a large percentage
of the benchmark. Three of the names that Alison
mentioned, Tencent, Alibaba, Baidu, are all grouped
into the category of Chinese Internet stocks. Just
I think it was a week or two ago Tencent became the
first Asian company to ever exceed a market
capitalization of $750 billion.
The struggle of U.S. small cap, those managers,
1
2
3
4
5
6
7
8
9
10
11
12
13
14
15
16
17
18
19
20
21
22
23
24
25
72
ACCURATE STENOTYPE REPORTERS, INC.
continued in the quarter. Headwinds have included
the outperformance of, quote, unquote, non-earners.
This would include biotechnology stocks. We
recently completed a manager search in this space,
and we funded two new managers. I'll talk very
briefly about that in just a moment.
On the positive side, in the foreign developed
large cap space we did well. Historically this has
been a very good, consistent source of alpha. Here,
one of the contributors was off-benchmark exposures.
These managers actually held some of these names,
Tencent and Alibaba, that our emerging market
managers typically underweight, as well as some
momentum tailwinds.
Finally on this page I'll note the positive
developments in the U.S. large cap active aggregate.
It was up 131 basis points in Q3. From our
discussions previously, you know this has been a
challenging space, and we've made some changes. It
was our best performing aggregate in Q3. And now
for the one year period it is above its benchmark.
And the last page we'll discuss with you today
is an update on initiatives. We have been active
with respect to structural enhancements. I
mentioned the two new U.S. small cap managers. They
1
2
3
4
5
6
7
8
9
10
11
12
13
14
15
16
17
18
19
20
21
22
23
24
25

73
ACCURATE STENOTYPE REPORTERS, INC.
began their official performance on November 1st.
We're also deep into the process for a search for a
foreign developed value strategy to complement that
successful aggregate.
And we are continuing to research potential
strategies for internal management. Currently we're
internally managing four passive strategies but also
two active strategies, all in-house, all by SBA
employees.
The bullet point here, we are identifying and
targeting certain strategies for fee negotiations,
with the goal of obtaining more attractive
structures, more attractive schedules. We've been
successful on many occasions already. And we know
many of our managers read these transcripts. If
you'd like to call us about a potential fee
concession before we call you, that would be much
appreciated.
MR. COLLINS: Where is Trent?
MR. TAYLOR: We recently established access to
the Hong Kong Connect program with our global
custodian BNY Mellon. This is really good. This is
in advance of MSCI adding China A Share securities
to our target, which will happen in only a few
months. So we have access there in advance that we
1
2
3
4
5
6
7
8
9
10
11
12
13
14
15
16
17
18
19
20
21
22
23
24
25
74
ACCURATE STENOTYPE REPORTERS, INC.
can offer up to our managers. It wasn't
particularly easy. There's still a lot of
questions, but we do have access there.
On the staffing side in global equity, we're
excited to have recently filled two open positions
with talented individuals that bring impressive
skills and also solid experience to our team. In
some cases this helps us to further our custom
analytic capability and also bolsters our internal
management resources.
And the last bullet point here, provide
liquidity. We've provided over $5 billion year to
date through Q3 for benefit payments and for other
reasons, and we remain ready and able to raise funds
efficiently when called upon. We're always at the
ready for that.
Those were the last of our prepared comments.
Mr. Chairman, I think you -- Ash had asked maybe to
comment briefly on valuations perhaps in the asset
class. I think there is an acknowledgment that
valuations in equity across the board are very
expensive. But I think it's in three tiers. It's
the U.S., then the non-U.S., and in particularly
emerging markets some would argue that there are
values there.
1
2
3
4
5
6
7
8
9
10
11
12
13
14
15
16
17
18
19
20
21
22
23
24
25

75
ACCURATE STENOTYPE REPORTERS, INC.
There are discussions about are we in a bubble,
particularly for U.S. equities. My personal belief,
I don't think so. I don't think so. Valuations are
rich. If you think of some of the companies that
have really driven the performance, called the
disrupters, if you think of Google, if you think of
Facebook, these are tremendous businesses with
tremendous growth potential still as we sit here
today. So they are rich on some metrics, but they
are real businesses. They are very well managed.
So I think one of the risks that investment managers
have is underestimating the power of these
disrupters.
Also, with respect to equities, if you don't
have your money in equities, where are you going to
put your money? Relative to fixed income, fixed
income is very expensive. Equities arguably are
attractive. You don't want your money to be in
cash. Where are you going to get your return? And
then finally I'll mention that over the last few
years, in many cases non-U.S. investors, we haven't
seen flows from them into the U.S. market to
purchase U.S. stocks. We're starting to see signs
now that actually non-U.S. investors' money is
flowing to U.S. equity markets, for whatever reasons
1
2
3
4
5
6
7
8
9
10
11
12
13
14
15
16
17
18
19
20
21
22
23
24
25
76
ACCURATE STENOTYPE REPORTERS, INC.
there. That's another positive as well.
So while valuations are very rich, there's
still -- volatility levels remain very low and
somewhat scary that they're so low. We don't think
we're in a bubble, but we're particularly -- it's
certainly not inexpensive to invest in equities
right now. Thank you.
MR. PRICE: Mr. Chairman.
MR. COLLINS: Yes.
MR. PRICE: This is, what, 50 billion or so?
MR. TAYLOR: It's about 90 billion.
MR. PRICE: Ninety billion, of which half is
active, half is passive?
MR. TAYLOR: Roughly, yes, sir.
MR. PRICE: In the active section and the
passive combined, how many dollars do you have in
the five more or less FANG stocks, Facebook, Apple,
Google, Netflix, maybe Alibaba, how many dollars?
MR. TAYLOR: I do not know that metric off the
top of my head. We certainly can get it to you.
MR. PRICE: I'd just be curious whether it was
5 billion or 10 billion or even more than
10 billion.
MS. ROMANO: I don't know the exact weight. I
will tell you, given on the U.S. side our large cap
1
2
3
4
5
6
7
8
9
10
11
12
13
14
15
16
17
18
19
20
21
22
23
24
25

77
ACCURATE STENOTYPE REPORTERS, INC.
managers are a little more value focused, we're most
likely underweight some of the U.S. names.
Externally, on the emerging market managers, they
tend to be more quality and valuation sensitive.
They're going to be underweight. Our developed
market managers are growth focused, and they are the
ones that are overweight. So when you bring it all
together, they're not our top over or underweight.
MR. COLLINS: Could you do us a favor and get
that number to Ash, that dollar number to Ash, and
he can get it out to us?
MR. TAYLOR: Absolutely.
MR. COLLINS: How many names are you doing the
search for on the international value right now, the
new search?
MR. TAYLOR: How many names?
MR. COLLINS: Foreign, yeah, the foreign.
MR. TAYLOR: We did our interviews a few weeks
ago.
MR. COLLINS: I mean, will you add one? Will
you add two?
MR. TAYLOR: One certainly, two perhaps. It's
being debated right now.
MR. COLLINS: And what do you think the total
allocation to that will be?
1
2
3
4
5
6
7
8
9
10
11
12
13
14
15
16
17
18
19
20
21
22
23
24
25
78
ACCURATE STENOTYPE REPORTERS, INC.
MR. TAYLOR: It will be a significant mandate.
The account values in that space that are going to
be added are all very large, on the order of like
1 to $2 billion accounts. This account will
probably be at least a billion dollars, perhaps up
to 1.5. So these are big accounts in that space.
MR. COLLINS: And what do you think the fee
would be on that, that you're going to pay?
MR. TAYLOR: Well, right now the proposals we
have are in the, let's say, 25 to 30 basis point
range. We will probably go back at them again if we
get real serious about putting forth the -- when we
get the recommendation together.
MR. COLLINS: Any other questions? Mr. Wendt?
MR. WENDT: Earlier today there was a comment
made about the need for transparency, there must be
absolute transparency. Now you're talking about
China stocks. Do you have a concern there that you
can't meet that test?
MS. ROMANO: I think part of the reason for
hiring active managers is because they are highly
focused on quality and transparency and corporate
governance. There are a lot of companies that our
managers won't invest in. There's state-owned
entities a lot of them will avoid outright and will
1
2
3
4
5
6
7
8
9
10
11
12
13
14
15
16
17
18
19
20
21
22
23
24
25

79
ACCURATE STENOTYPE REPORTERS, INC.
not invest heavily.
So, yes, we have concerns, but that's where we
hire active managers to assist us. We did have a
China A fund at some point. And while the market
may be this, the investable market to address those
questions does shrink quickly.
MR. WENDT: Thank you.
MR. COLLINS: Any other questions? Great.
Thanks. Now -- sorry. Did somebody have a
question? Okay. Katy.
MS. WOJCIECHOWSKI: I'll be pretty brief as
well. Boring returns is all I can say. The yields
on -- very low volatility in fixed income markets as
well. We finally got I think the yield on the
Intermediate Ag to about 2.50. So that's up from
where I put my notes here, which was about 2.40.
And the duration is still about 4.4, 4.2 years. So
not very exciting.
Long corporates did incredibly well over the
past 12 months. That's our off-index bet, so we
have some long corporates but not a lot.
Intermediate corporates also did well, and we have
an overweight to that persistently. So the tide is
coming in. Don't fight the Fed, those kind of
things.
1
2
3
4
5
6
7
8
9
10
11
12
13
14
15
16
17
18
19
20
21
22
23
24
25
80
ACCURATE STENOTYPE REPORTERS, INC.
Just a couple of notes. Tim mentioned the wall
of money coming into the United States. There's
definitely still demand, central banks still buying.
We are the high yielders if you look (inaudible),
sad to say, but we are the high yielders throughout
the world.
So we continue to see the wall of money
possibly easing off, definitely in the United States
over the next year, possibly hints from Europe, but
that's about it. So we continue to see that
persisting, which will keep a lid on rates. But we
have recently assigned a little bit more of a
non-zero probability that rates may rise.
So to Ash's question about what do we see for
outlook, we see that corporations are still in good
shape, so we don't see spreads widening
continuously. And there is a lot of demand for
buying. So we continue to see that as a positive,
but also headwinds because valuations are, to Tim's
point, very tight right now.
Rates, obviously on the short end we believe
rates will continue to rise over the next 12 months,
and possibly in the long run a little bit more. We
saw it today a little bit with possible budget and
tax reform. So we'll see.
1
2
3
4
5
6
7
8
9
10
11
12
13
14
15
16
17
18
19
20
21
22
23
24
25

81
ACCURATE STENOTYPE REPORTERS, INC.
Risk we continue to keep pretty low. We did
over the last year -- I'm just going to flip to this
because we did increase our allocation to core plus,
not because we're trying to reach for yield or
spreads or anything like that but because our core
plus manager has a little bit more allocation to
some different, like different arrows in their
quiver. So it will give them opportunities, without
taking more risk, to possibly get more
non-correlated returns. And we'll continue to do
that. We're looking at it seriously right now.
We're seriously considering a couple of
different strategies for fixed income, different
because there's not a lot of ways to spell
intermediate ag, investment grade fixed income, but
we continue to look at that.
And then we're just going to -- periodically we
like to discuss just briefly our sec lending
program. I think it doesn't get mentioned often,
but we do have a significant securities lending
program. It's historically been weighted towards
equities, sometimes a very significant add, and in
the past year it's been actually on fixed income a
little bit, right?
MS. JEFFRIES: Yes. So over the past year
1
2
3
4
5
6
7
8
9
10
11
12
13
14
15
16
17
18
19
20
21
22
23
24
25
82
ACCURATE STENOTYPE REPORTERS, INC.
there's been no changes to the program. The program
is performing well. The lendable assets actually
grew this year. Thank you, equity. Utilization is
still maintaining around 11 percent. And the net
earnings actually rose for calendar year 2016 to
49 million.
MS. WOJCIECHOWSKI: I just want to stress, we
are extremely risk controlled. There are other
people throughout the globe who are less -- who
invest more aggressively. We do not reinvest the
proceeds aggressively. And I think that's it.
MR. COLLINS: Any questions for Katy? Okay.
Thanks. Mr. Spook.
MR. SPOOK: Good afternoon. I'd like to start
with some very good news. At least it's very good
news for me. There are no hedge funds in my
portfolio.
MR. COLLINS: Trent, you're going to make him
pay for that later, aren't you?
MR. WEBSTER: Yes, I am.
MR. COLLINS: That he knows of anyway, Trent.
MR. COBB: And no Bitcoins either?
MR. SPOOK: No Bitcoins either. So real estate
performance continues to be very strong. Over the
one year period, 120 basis point outperformance.
1
2
3
4
5
6
7
8
9
10
11
12
13
14
15
16
17
18
19
20
21
22
23
24
25

83
ACCURATE STENOTYPE REPORTERS, INC.
Three year, 80 basis points. Five years, 190 basis
points. And that outperformance is pretty evenly
distributed across the portfolio.
Here you see the principal investments, which
is our direct investment portfolio, with similar
type of outperformance, 130 basis points one year,
90 three year, 200 on the five year. And then
outperformance in all periods for the externally
managed portfolio as well, which is, as you know,
our pooled funds and public REIT portfolios.
Here's the sector allocation. Our target is
public 10 percent and private 90 percent. And
that's exactly where we are. We target 20 percent
for non-core, we're almost at that, 19 percent, and
core, 81 percent. And that chart shows 8.9 percent.
That's a little dated information. We're probably
at closer to 8.6 percent of the total portfolio.
That's partly Tim and Alison's fault, on the
denominator effect. And we've continued to be net
sellers.
Here's property type diversification. We're
slightly below benchmark exposures in most property
types except office, due to an overexposure in the
alternative property types. We feel pretty good
about this situation at this point in the cycle.
1
2
3
4
5
6
7
8
9
10
11
12
13
14
15
16
17
18
19
20
21
22
23
24
25
84
ACCURATE STENOTYPE REPORTERS, INC.
Office is by far the most volatile of the property
types, and we've positioned ourselves in the "other"
category in more defensive, less volatile property
types.
Geographic, we're pretty close to the benchmark
positions also, with the exception of the Midwest.
We just don't see a lot of great opportunities in
the Midwest.
And recent activity, three acquisitions.
They're all fairly small acquisitions, but they're
all hold-ons to existing portfolios that we have.
So you may recall last year we purchased a
66-property self storage portfolio. Ourselves and
our JV partner continue to look to add on to that
portfolio and buy these one-offs from mom and mops.
You can add serious efficiencies. And so we think
these small acquisitions are very prudent.
Same with medical office. We have an existing
portfolio in the medical office space. Building up
a portfolio creates value through aggregation. The
large medical office REITs, you know, such as a
Ventas or HCP, don't really have the time go out and
find a $6.3 million building in Akron, but we -- we
aggregate those and are creating value that way.
And retail, I think I've talked about that program
1
2
3
4
5
6
7
8
9
10
11
12
13
14
15
16
17
18
19
20
21
22
23
24
25

85
ACCURATE STENOTYPE REPORTERS, INC.
before, too, where we're buying High Street retail
and creating a portfolio.
Dispositions, sold one senior housing deal in
Seattle. Industrial, that's a JV where we're
developing leasing, stabilizing and selling with our
JV partners, so that's creating value there.
Student housing, that was -- we've got a portfolio
there. We keep adding to the portfolio. This was
one particular property that was a value add
opportunity as opposed to a core opportunity.
Business plan was accomplished and sold it and made
money. And multifamily, we sold a fairly large
multifamily deal in San Diego.
Commingled funds, one domestic value add fund
commitment, 75 million, and a European value add
fund with 50 million commitment.
MR. DANIELS: Excuse me, Steve. Just a rough
number if you have it, on a weighted average basis,
what kind of cap rate are you acquiring at and what
kind of cap rate were you disposing at?
MR. SPOOK: It depends on the property type
obviously. That multifamily deal is probably a 4.3,
4.4 cap rate, conventional property type in a larger
market. Senior housing, you're going to get a
higher cap right there. It's a higher risk type of
1
2
3
4
5
6
7
8
9
10
11
12
13
14
15
16
17
18
19
20
21
22
23
24
25
86
ACCURATE STENOTYPE REPORTERS, INC.
asset.
Student housing, we went into it with the idea
that with cap rates so low on multifamily, that we
could get a premium on student housing. That
premium still exists, but it's come in. It's
compressed quite a bit. We still like the sector
because we believe it will behave differently than
traditional multifamily in a downturn. People will
still go to school. In the GFC enrollment actually
went up.
Again, student housing depends if you're in a
primary market for student housing, like
Tallahassee, or if you're going to a smaller school.
But on average you're going to see student housing
probably between five and a half, 6 percent.
Medical office buildings, again, you would
expect to see some premium to conventional office.
Same ways in student housing now. We think it will
act different than regular office in down times. So
medical office buildings, again, depends on the
market because what we consider a primary market or
conventional office like New York, Washington, San
Francisco, medical office can be in Davenport, Iowa,
as long as it's associated with a leading health
care provider.
1
2
3
4
5
6
7
8
9
10
11
12
13
14
15
16
17
18
19
20
21
22
23
24
25

87
ACCURATE STENOTYPE REPORTERS, INC.
MR. COLLINS: Mr. Wendt?
MR. WENDT: You obviously mathematically sold a
lot more since the last report than you bought or
invested in. There have been a lot of comments
today about equity markets being highly valued. Do
you think that has also happened in the real estate
industry in general? Do you think the properties
you're buying are overvalued?
MR. SPOOK: I think it depends on what measure
you're looking at. If you're talking about price
per pound, so price per square foot, versus
historical valuations, yes, the market looks
expensive. If you're looking at the spread between
corporates or the risk-free rates, spread between
cap rates and those other rates, it looks fairly
valued today.
MR. WENDT: Do you think real estate is
tracking at higher values than all other assets?
MR. SPOOK: I'm sorry?
MR. WENDT: Do you think the real estate
values -- sorry. I didn't understand the answer to
my question. But I think it was, yes, real estate
values are going up, but so is everything else.
MR. SPOOK: So is everything else. So the
spread between a cap rate you can buy a property at
1
2
3
4
5
6
7
8
9
10
11
12
13
14
15
16
17
18
19
20
21
22
23
24
25
88
ACCURATE STENOTYPE REPORTERS, INC.
and your alternatives such as corporate bonds or
Treasuries, that spread is not out of line with
historical averages. And so on that basis --
MR. WENDT: So you don't think real estate is
overvalued today?
MR. SPOOK: It's expensive.
MR. COLLINS: He's a real estate guy, so he's
going to give you five different answers for that.
Right? He's going to say price per square foot,
he's going to say, you know, a multiple on NOI.
MR. SPOOK: And Townsend is in the room. They
may have an opinion on pricing also.
MR. WENDT: I didn't ask Townsend, though.
MR. COLLINS: Wow. Dick, did you hear that?
MR. BROWN: It was softly.
MR. COLLINS: Softly, okay. So I have a couple
of questions for you. First, my favorite question,
what is our leverage position today? Because as I
look at --
MR. SPOOK: I knew that was coming.
MR. COLLINS: -- interest rates and we've had
another quarter of pretty low interest rates -- and
I'm going to pick on Townsend here for a second.
Dick wasn't here when I brought this up last time,
in all fairness.
1
2
3
4
5
6
7
8
9
10
11
12
13
14
15
16
17
18
19
20
21
22
23
24
25

89
ACCURATE STENOTYPE REPORTERS, INC.
MR. SPOOK: I'm sure he heard about it.
MR. COLLINS: So I asked one time in a meeting
to -- you know, can we study this. Everybody is
concerned about risk and everybody is concerned
about taking on too much debt and over-risking the
portfolio. And my premise is that we've got core
assets in core markets and we have extremely low
leverage on them.
And if you're -- but yet we're investing in
opportunistic funds, right, that have higher risk
with third parties and there's more leverage in
those assets. So to boil my position down, I don't
think there's any difference materially in going
from, say, 25 percent leverage to 35 percent
leverage in a core asset in a core market.
So I asked them to put together some
information. And what you may remember we got from
Townsend was a line chart. It wasn't even one of
these unreadable, you know, that look like a sunset
of the Grand Canyon charts. It was just a line, and
it said, hey, as you up your leverage, your risk
increases. And it was almost linear. Well, that
can't be. Right? I mean, there's got to be some
movement in that. You can't tell me it's a direct
percentage-to-dollar ratio between 26 percent
1
2
3
4
5
6
7
8
9
10
11
12
13
14
15
16
17
18
19
20
21
22
23
24
25
90
ACCURATE STENOTYPE REPORTERS, INC.
leverage and 27 percent leverage. There's got to be
a little bit of a flatness there, but this chart was
a perfect slope. So what's our leverage? How are
we doing today and what are your thoughts on that?
MR. SPOOK: So with deals that we have in
process, so adjusted, we're somewhere between 28 and
28 and a half percent. We've also identified a
number of assets that would be suitable for putting
leverage on, so fairly low-risk assets. And we're
currently talking to brokers right now about getting
quotes in the range of about 400, $450 million. So
it will go up a little bit. But then we are going
to be bumping up against the new 30 percent cap.
But it has fairly --
MR. COLLINS: I think when we first started
looking at this, we were like 21, 22 percent.
MR. SPOOK: We were at about 21 percent.
MR. WILLIAMS: Mr. Chairman?
MR. COLLINS: Yes.
MR. WILLIAMS: I think another element of this
is that as we've added the leverage in the real
estate book, we've been pleasantly surprised at the
structures and the cost of the leverage, which is to
say both are better than we would have expected.
The technique we used, as Steve just referred to, is
1
2
3
4
5
6
7
8
9
10
11
12
13
14
15
16
17
18
19
20
21
22
23
24
25

91
ACCURATE STENOTYPE REPORTERS, INC.
we use third parties to go out and canvass the
market for us and get the best terms we can get.
And then we get a fiduciary letter. We evaluate it.
We pick whoever the winner is and move on.
We have been getting fixed-rate stuff,
unbelievable terms, ridiculously low cost. It's
sort of the sort of thing that you hear people say,
well, the banks aren't replaying the mistakes they
made in prior cycles. I'm not so sure. But if
people are willing to give us money under these
terms, we're happy to take it.
MR. SPOOK: To add to that, like I said, we
pick our safest assets with the right kind of
leasing in place versus the long-term. And
typically we're between 40 and 50 percent loan to
value. So that's why we're getting such good terms.
We've got lenders fighting to get that business.
MR. COLLINS: Right.
MR. SPOOK: It would have to be worse than the
GFC really for them to lose money on that.
MR. PRICE: Mr. Chairman.
MR. COLLINS: Yes.
MR. PRICE: Do we have a place in our
portfolio, either with Steve or anywhere else, where
there's someone trading real estate investment
1
2
3
4
5
6
7
8
9
10
11
12
13
14
15
16
17
18
19
20
21
22
23
24
25
92
ACCURATE STENOTYPE REPORTERS, INC.
trusts at large discounts from net asset values
versus cap rates he's willing to pay? For instance,
you're out buying retail. I don't know. You said
it was High Street, not malls. But, for instance,
in the last couple of quarters, the mall stocks got
destroyed. Taubman, Macerich and General Growth all
came down 40 percent. Since then there have been
two tender offers and one proxy fight. So is
anybody taking advantage of that, with your real
estate knowledge, in the public markets?
MR. SPOOK: I'm sure they are, but we aren't
personally, no. We do have global REIT separate
accounts. They're more conventional accounts.
MR. PRICE: Under which pocket? Is it under
Trent?
MR. SPOOK: Under real estate.
MR. PRICE: Under you.
MR. SPOOK: Yes. Ten percent of the total real
estate book is public securities.
MR. COLLINS: But you're long.
MR. SPOOK: Yes.
MR. WILLIAMS: I hear what you're saying.
That's an interesting angle for I'm thinking maybe
somebody in a PE format. But I don't know that
we've really got anything that's hitting it.
1
2
3
4
5
6
7
8
9
10
11
12
13
14
15
16
17
18
19
20
21
22
23
24
25

93
ACCURATE STENOTYPE REPORTERS, INC.
MR. COLLINS: What you have is market knowledge
every day. Right? You're the third largest public
pension fund in the country. You're buying. You're
selling. You know every player in the market. And
you see these REITs out there and what they're
trading at in terms of net asset value.
I think what Michael is saying is that you're
just not doing anything with that knowledge, other
than buying and selling traditional -- or buying and
selling properties directly but not going --
MR. PRICE: Cap rates -- I know where there are
public securities with liquidity trading much
cheaper than he's paying, happily and financing
well. That's all I'm saying. There's a place to
put a few billion.
MR. COLLINS: So my second question would be
California. Any update on California, the fires and
everything there relative to our holdings in the
state?
MR. SPOOK: No damage to our properties.
Rainfall has been above average for the last couple
of years now. Great snow pack. So from an ag point
of view, we're looking pretty good. But, no, the
fires didn't affect us at all.
MR. COLLINS: Any other questions of Steve?
1
2
3
4
5
6
7
8
9
10
11
12
13
14
15
16
17
18
19
20
21
22
23
24
25
94
ACCURATE STENOTYPE REPORTERS, INC.
Vinny?
MR. OLMSTEAD: One quick question. Obviously,
we are disposing much more than we're acquiring.
How does the pipeline look when you guys are looking
at what's available out there and how close you are
on buying some more stuff?
MR. SPOOK: We've got a pretty good pipeline.
There are several deals that are in closing or due
diligence right now.
MR. COLLINS: You're looking for more, Vinny?
MR. OLMSTEAD: Just curious, because the last
time we were here also, it seems like we're
obviously disposing more than we're acquiring. So
overall the percentage is going down. If you
believe there's a good market, it sounds like there
is a pipeline there, it's logical just to -- if you
think it's a good value.
MR. WILLIAMS: It might be helpful, if I may,
Mr. Chair.
MR. COLLINS: Please.
MR. WILLIAMS: The degree of specificity that
would really be responsive to that question might be
better delivered off line, because sometimes when
you have transactions that are in process, we don't
want to broadcast, We've got our eye on this, if you
1
2
3
4
5
6
7
8
9
10
11
12
13
14
15
16
17
18
19
20
21
22
23
24
25

95
ACCURATE STENOTYPE REPORTERS, INC.
follow my drift.
MR. SPOOK: I can show you our pipeline after
the meeting.
MR. COBB: Mr. Chairman.
MR. COLLINS: Yes.
MR. COBB: I would like to repeat what I think
Steve has said, Vinny, because I heard it different
than you. I heard that values are high per square
foot, some of the highest they've ever been.
They're high by other measurements. And the only
measurement that they are not low but reasonable is
vis-a-vis fixed income.
And so my conclusion of that is that I'm
delighted we're selling more than we're buying,
particularly that we've sold -- in San Francisco it
was 3 percent cap rates, and some other places we've
been selling 3 percent cap rates. So I want to
applaud management, from my point of view. I think
real estate is pretty fully valued.
MR. COLLINS: The other thing that I would say
that in my opinion that they've done well is in this
market it's tough to buy core. Right? Tough to buy
core multifamily or core anything in a core market
and pay better than a four cap.
MR. SPOOK: We've been manufacturing a lot of
1
2
3
4
5
6
7
8
9
10
11
12
13
14
15
16
17
18
19
20
21
22
23
24
25
96
ACCURATE STENOTYPE REPORTERS, INC.
that.
MR. COLLINS: Right. So what they've done is
they've gone out and said, okay, well, if we can't
buy it, we're going to build it and sell it to other
people, and so they've been doing quite a bit of
that.
MR. SPOOK: Or keep it.
MR. COLLINS: Or keep it. Right? Which you
get a better basis if you're in there in the
beginning. If you're developing something at a
seven and a half percent --
MR. SPOOK: It's come down from that.
MR. COLLINS: Let's say seven, maybe a little
bit lower, and selling at four and a half or five,
that's a decent business. There's churn, but it's a
decent business.
MR. WILLIAMS: I just wanted to make a
clarifying point, following up on something Mr.
Wendt said a moment ago that's very, very important.
When I made the comment about information off line,
I want to be very clear. What I meant was any
member of the IAC who wants to contact me or any
member of staff directly with any questions, fine.
I did not mean any off line discussion among members
of this body, which would be violative of Florida
1
2
3
4
5
6
7
8
9
10
11
12
13
14
15
16
17
18
19
20
21
22
23
24
25

97
ACCURATE STENOTYPE REPORTERS, INC.
law, to be very clear.
MR. COLLINS: Thank you for that, Ash. What is
next? John Bradley.
MR. BRADLEY: Thank you and good afternoon.
I'll start with a market update. U.S. buyout
activity picked up in the third quarter at almost
50 billion of activity, which was an increase from
what we saw in quarter two, yet 2017 still trails
2016. Not surprisingly, pricing continues to rise
in aggregate. Pricing today is almost a full turn
higher, at 10.6 times versus 9.7 times observed at
the peak of the last cycle in 2007.
I would say this 10.6 headline number is being
driven by the large end of the market, particularly
large tech deals. The small to middle market has
seen pricing trend down a bit over the last few
quarters.
Asset sales and distributions remain strong
across the entire industry. If this current pace
continues, 2017 could set a new record for the PE
industry in terms of distributions. And this will
likely be the case within our portfolio. Our net
cash flow through October stood at $687 million.
And there's a strong chance this will increase by
the end of the year. And to put that 687 in
1
2
3
4
5
6
7
8
9
10
11
12
13
14
15
16
17
18
19
20
21
22
23
24
25
98
ACCURATE STENOTYPE REPORTERS, INC.
perspective, our past high for net cash flow was
650 million in 2015.
And then the final bullet, over the past 12
months, our distressed portfolio at 21.8 percent and
our non-U.S. buyout portfolio at 21.1 percent, were
our best performing strategies. Both of those
strategies, performance was driven by some strong
realizations seen throughout the year.
MR. PRICE: John, can I ask, you say technology
is 40 percent of your portfolio. Is that because
some venture deals matured largely?
MR. BRADLEY: Correct. That's a big part of
it. What we'll also see here -- and what we've seen
is if you put aside our venture and our tech-focused
buyout guys, we've seen a lot of our generalists
cycle into the tech space. And I would say, as long
as these deals continue to be successful, which they
have been to date, that trend will likely continue.
Our sector exposure. Geographically we remain
focused on building out our non-U.S. portfolio.
That portfolio today sits at 25 percent, which is a
slight increase in what we observed last year. We
were at 22 percent, and the year before that at 18.
So the growth internationally continues, albeit at a
slow pace.
1
2
3
4
5
6
7
8
9
10
11
12
13
14
15
16
17
18
19
20
21
22
23
24
25

99
ACCURATE STENOTYPE REPORTERS, INC.
We move to performance of the asset class. We
can see our one year performance trails the
benchmark by around 350 basis points. As everyone
has mentioned today, public markets have been a
pretty tough bogey to keep pace with over the past
year. But you will see all other time periods
showing outperformance versus the benchmark, with
our three year return being particularly strong.
MR. COLLINS: I always really like the colors
on that slide, John. Very nice.
MR. BRADLEY: Thank you, Peter. I like them,
too.
MR. OLMSTEAD: John, real quick. When you look
at the geographic exposure and you say you're
looking outside the U.S., are you looking anywhere
specifically or just sort of generically outside the
U.S.?
MR. BRADLEY: I think our focus would be, maybe
over the last four to five years we've kind of honed
in our Europe portfolio and built that out, so
anything in Europe would be on the margin, probably
not adding a lot there. The focus has really been
in Asia, and that's mainly been in China.
What I would tell you, though, is we've been
focused there for probably three or four years and
1
2
3
4
5
6
7
8
9
10
11
12
13
14
15
16
17
18
19
20
21
22
23
24
25
100
ACCURATE STENOTYPE REPORTERS, INC.
have moved extremely slowly and have had
difficulties finding groups that we're comfortable
with. But the quality of the GP, the performance,
the ability to diligence, that is getting much, much
better.
Here we're at the slide with performance of the
asset class sub-strategies. I guess what I would
say is all strategies continue to perform well. And
since inception only our non-U.S. growth strategy
has underperformed it's peer benchmark.
And then finally I'll end with our commitment
activity. This is through the first nine months of
the year. So as of September 30 we've committed
1.6 billion to 16 funds, that's 1.1 billion to 11
buyout funds. I'd note over half of that went to
funds focused on the small end of the market. We've
committed 150 million to three venture funds and
300 million to two distressed or turnaround funds.
MR. OLMSTEAD: Any other thoughts on sort of
construct? I go to a number of these conferences,
and they're sort of saying underweight the venture
capital. Any changes in thoughts on buyout versus
venture versus some of the sub-strategy performance?
Is that how you're looking at it?
MR. BRADLEY: I don't think so. I think we've
1
2
3
4
5
6
7
8
9
10
11
12
13
14
15
16
17
18
19
20
21
22
23
24
25

101
ACCURATE STENOTYPE REPORTERS, INC.
been if nothing but consistent with kind of our
targets, our overall targets. So when you look at
what we're doing in venture, we're committing what
we think we should be to maintain a 10 percent
allocation to venture.
I think we believe in cycles of these markets.
We hear our peers and we hear people concerned with
venture, but we invest in these funds over ten year
horizons and --
MR. OLMSTEAD: As a venture capitalist, I like
to hear that.
MR. BRADLEY: That's it. Any other questions?
MR. COLLINS: Any more questions of Mr. Bradley
on the private equity portfolio?
MR. WENDT: Do you think prices are getting
high?
MR. BRADLEY: I think they are. I think they
are historically. I think our GPs also think they
have. Dry powder has been building in the industry.
Our funds have been less active on the buy side. So
I think their actions would also indicate that they
think things are expensive today.
MR. COLLINS: You're probably the only person
at the Board whose relationships cost more than
Trent's. Have you thought about that?
1
2
3
4
5
6
7
8
9
10
11
12
13
14
15
16
17
18
19
20
21
22
23
24
25
102
ACCURATE STENOTYPE REPORTERS, INC.
MR. BRADLEY: Maybe.
MR. COLLINS: Dan. Where's Joan?
MR. WILLIAMS: We've got Dan on deck.
MR. COLLINS: Dan. Sorry. I was just asking
where Joan was. I don't see her smiling face, but I
like yours just as well.
MR. BEARD: Thank you. Good afternoon. Before
I get into the slides, I want to do an update on a
couple of legislative changes from this past session
that impacted the FRS major. The first one was
renewed membership was reopened. Effective July 1,
2010, renewed membership was closed for any rehired
retiree. They did open that back up effective
July 1, 2017. But it was just for retirees from one
of the optional plans, which the investment plan is.
So effective July 1, 2017, it opened back up.
Since that point in time, we've had
approximately 6,000 new members who have come back
into the investment plan. They're mandatory in the
investment plan. They don't have to make a choice.
It's mandatory, as long as they retired from the
investment plan. So that was one piece of the
legislation.
The second piece is a change in the default.
So the default is currently the pension plan. So
1
2
3
4
5
6
7
8
9
10
11
12
13
14
15
16
17
18
19
20
21
22
23
24
25

103
ACCURATE STENOTYPE REPORTERS, INC.
any member who, once they go through the choice
period, if they don't make a choice, they default
into the pension plan.
Well, effective January 1, 2018, that default
is going to be changing to the investment plan. And
that's for all new hires except those who are
special risk. And special risk are your
firefighters, correctional officers, your police,
your troopers. They're all considered special risk.
They will still default, if they don't make a
choice, into the pension plan.
So the first time that we will see someone who
actually defaults into the investment plan will be
October 1, 2018, because the second part of that was
they lengthened the choice period. Currently it's
five months from the month of hire. Well, effective
January 1, 2018, it goes to eight months from the
month of hire in order to make a choice.
So those are two pieces of major legislation
that impacted the Florida Retirement System. One
has already gone into law, and the other one will be
effective January 1, 2018.
So assets, as of September 30th, we were at
10.3 billion. As of November 30th, we're at
10.5 billion. For our returns, through
1
2
3
4
5
6
7
8
9
10
11
12
13
14
15
16
17
18
19
20
21
22
23
24
25
104
ACCURATE STENOTYPE REPORTERS, INC.
November 30th, calendar year to date return, is
actually 15.23, and then fiscal year to date 7.10.
We have 183,000 members. Again, that includes the
5,000 mandatory investment plan members who are
rehired retirees.
Average account balance has increased about
3.5 percent over the year, and then we saw a
10 percent increase in the number of retirees. And,
again, the retirees are members who actually take a
benefit from the plan, whether it be a partial
benefit or the full benefit.
The next slide you see is how the assets are
broken out. Again, the majority, as expected, is in
the retirement date funds. The retirement date
funds is the fund that they will default into, so
that's a majority of the funds.
The next one is our performance both quarter
year to date, fiscal year to date, one year, three
years and five years. And as you can see, with the
increase in the market, it also has been a benefit
to our members.
Membership growth, this year 3.6 percent.
Again, a lot of that is driven by that additional
5,000 members who have come in due to the renewed
membership. And then for the financial guidance
1
2
3
4
5
6
7
8
9
10
11
12
13
14
15
16
17
18
19
20
21
22
23
24
25

105
ACCURATE STENOTYPE REPORTERS, INC.
program, again, we do see a lot of hits to our
website, as well as those members who are using
chat, that continues to increase as we get a lot of
people who want to communicate via chat.
Does anyone have any questions on what I've
covered? Thank you.
MR. COLLINS: Any questions? Steve and Katie.
MR. CUMMINGS: Thank you, Mr. Chairman, members
of the council. It's good to be here again. Once
upon a time I was on the official SBA consulting
team from Aon, but I think as you know, Kristen
Doyle and Katie Comstock represent that team. I'm
here today covering for Kristen. As I think you all
are aware, she is due to deliver twins here in a few
weeks, so she sends her best.
Logistically, we thought it was good for me to
support Katie on this visit in case you had any
questions for me or my colleagues, my soon-to-be
colleagues from Townsend about our business
transaction.
Kristen does expect to be back with you for
your March meeting. In the event she's not able, I
will be taking that meeting, along with Phil
Kivarkis, because Katie will be out on maternity
leave for your March meeting. So we are growing our
1
2
3
4
5
6
7
8
9
10
11
12
13
14
15
16
17
18
19
20
21
22
23
24
25
106
ACCURATE STENOTYPE REPORTERS, INC.
ranks.
MR. COLLINS: Did you guys schedule that,
Katie, you and Kristen?
MS. COMSTOCK: We planned it out last year,
absolutely.
MR. JONES: Kind of makes it hard to recruit
women now.
MR. CUMMINGS: Actually, we were talking about
that at lunch. We're enjoying great success in no
small part because of -- our ranks are deep enough
that we can accommodate these work-life balance
issues that are so critically important to
attracting and retaining. We just planned to roll
out a new paternity leave policy as well in the new
year. So we're excited.
Katie is going to cover the major market
mandate review. As I think all of you know, over
the years, we've done a variety of different tasks
as your general consultant. And one of them is
fairly routine but is also important as a
check-the-box part of our services, to opine on the
performance of the major markets at a very high
level compared to appropriate benchmarks and peers.
So as usual, Katie will step through that. But
before I hand it over to her, are there any other
1
2
3
4
5
6
7
8
9
10
11
12
13
14
15
16
17
18
19
20
21
22
23
24
25

107
ACCURATE STENOTYPE REPORTERS, INC.
questions as relates to -- I know Seth mentioned the
pending acquisition of Townsend by Aon. We are
waiting for regulatory approval, which we expect to
come in the next few weeks, but you can't rush
regulators. They have their own schedules.
But if you have any questions about what's
going on at Aon or the consulting or the pending
acquisition at Townsend, I'd be pleased to answer
those questions. Otherwise I will quickly let Katie
take over the rest of the presentation.
MR. COLLINS: Does anybody have any questions?
Okay.
MS. COMSTOCK: Thanks, Steve. Good afternoon,
everyone. We'll move right along. I will reiterate
Ash's comments from earlier in this meeting that all
is well across all fronts of the five major mandates
that we report on, and we'll go into a little bit
more detail. But the performance continues to be
exceptional on an absolute and relative basis.
So moving ahead, starting with the pension plan
performance, Ash gave updated numbers. All of our
numbers in this report will be through the third
quarter of 2017, so ending September 30th. The
pension plan ended the quarter with $157.6 billion,
growth over the quarter of about 4 billion. As Ash
1
2
3
4
5
6
7
8
9
10
11
12
13
14
15
16
17
18
19
20
21
22
23
24
25
108
ACCURATE STENOTYPE REPORTERS, INC.
mentioned, that has risen to over 160 billion
through December 1st, I believe. So all-time highs.
Growth being due to significant investment
earnings. You can see over the quarter that was
about $5.9 billion in growth over a one year period.
That represents investment earnings of 19.5, growth
of $12.9 billion.
Before we dive into the associated returns, I
did want to stop on this page quickly. You heard
from each of the asset class heads in silos, but
just to aggregate that and to give one snapshot of
how the overall portfolio is allocated across the
different asset classes.
The green bar represents where the FRS is
allocated at the end of the third quarter, the
orange bar being the interim targets. I'll note
that what's not on here is the longer-term targets,
where each of these asset classes are at their
long-term targets, with the exception of two, real
estate and strategic investments.
The long-term target for real estate is
10 percent, and strategic investments is 12 percent.
And as you heard from your asset class heads, the
challenges of growing that when you have an overall
portfolio that continues to grow very quickly and
1
2
3
4
5
6
7
8
9
10
11
12
13
14
15
16
17
18
19
20
21
22
23
24
25

109
ACCURATE STENOTYPE REPORTERS, INC.
the asset classes continue to distribute capital,
not a bad problem to have but will make reaching
those longer-term targets a bit more challenging.
I also remind the committee, this came up at
the last meeting, that in the March meeting we will
be doing our refresher of the asset-liability and
asset allocation study, where we will not get into
strategy-specific discussions but at a higher level
we will talk about the trade-offs of and ideally the
goal of both eating well and sleeping well.
We'll talk about the roles of the asset classes
and the implications not only on expected return but
on volatility, on contribution rates, on funded
status. So that's to come in the next meeting.
Now I want to talk about returns. You-all
continue to make our lives fairly easy coming here
in front of you-all. The FRS net investment returns
through the end of the third quarter are represented
by the beige bar. As you can see across the board,
strong absolute returns, primarily driven by global
equities, but also alternative investments, both
private equity and real estate, have generated
double digit returns across most of these time
periods here.
We compare to two benchmarks on this page. The
1
2
3
4
5
6
7
8
9
10
11
12
13
14
15
16
17
18
19
20
21
22
23
24
25
110
ACCURATE STENOTYPE REPORTERS, INC.
first being the performance benchmark represented in
blue. On a relative basis, strong outperformance,
ranging from 20 basis points outperformance for the
quarter, all the way up to 100 basis points for the
one year period.
The longer term periods, the margin of
outperformance has been very strong, and it's been
diversified across the asset classes as well, which
is also rare, when you see each asset class adding
value across the board across these different time
periods.
The next benchmark is the absolute nominal
target rate of return, which was represented -- it
was CPI plus 5 percent. As Trent touched on, it's
now CPI plus four and a half percent. This is more
appropriately evaluated over a longer time period,
so we do include this metric. And the next slide,
over the past 20, 25 and 30 years, you can see over
the 20 year, the portfolio was in line with the
longer-term target and ahead of the benchmark fairly
significantly over the 25 and 30 year period.
The next few slides look at the FRS's
performance relative to a peer group. This is the
TUCS Top 10, so the top 10 largest pension plans in
the United States. And we show here the asset
1
2
3
4
5
6
7
8
9
10
11
12
13
14
15
16
17
18
19
20
21
22
23
24
25

111
ACCURATE STENOTYPE REPORTERS, INC.
allocation of the FRS as of 9/30 relative to the
median plan in this universe of other ten plans.
And consistent with previous quarters, the greatest
difference between these asset allocations and what
drives the difference in returns that we'll look at
on the next page is primarily the greater allocation
FRS has to global equity.
You can see roughly 10 percentage points
greater than the median plan in this universe. And
if you look at the detail, the composition of the
global equity, nearly all of that is coming from the
FRS having greater weight to foreign securities. So
recently that has been a tailwind that's been
beneficial for relative performance.
If you look longer term, the U.S. has done
exceptionally well. And so the FRS being an early
mover to a global mandate, that had provided in the
past some headwinds when you look at relative
performance, but recently this has been beneficial.
The offset to that is the alternatives, where
peers have about 22 percent and the FRS has about
15 percent to what we would aggregate as
alternative, being private equity and strategic
investments.
Any questions on asset allocation? So I'm
1
2
3
4
5
6
7
8
9
10
11
12
13
14
15
16
17
18
19
20
21
22
23
24
25
112
ACCURATE STENOTYPE REPORTERS, INC.
looking at returns. This shows FRS returns over
these same time periods. These are gross returns so
we can have an apples to apples comparison with the
TUCS universe, because they report on gross returns.
But you can see, with the exception of the third
quarter, the FRS has outperformed the median plan
across all these time periods, and not only
outperformed the median but has ranked in the top
quartile.
The ranking for the FRS are those bottom
numbers there. So over the one year period it
ranked in the first percentile of that universe, so
that top, that hot spot you want to be at over the
one year period, and then in the top quartile in
three and five year and the top 5 percent of plans
over the ten year. So great performance relative to
your peer groups.
Also we don't show this. We have this in the
detail books, but we also look at your performance
relative to another peer group, which is a little
bit broader. It's roughly 100 other public pension
plans with assets over a billion dollars. And the
FRS ranks in the top quartile across all of these
time periods as well.
So those are slides on the FRS performance.
1
2
3
4
5
6
7
8
9
10
11
12
13
14
15
16
17
18
19
20
21
22
23
24
25

113
ACCURATE STENOTYPE REPORTERS, INC.
Any questions? The next major mandate we cover is
the investment plan. Any questions?
MR. COLLINS: I was just -- I had two questions
of Ash. I said, How many times have we been number
one? And he said, I don't think we've ever been. I
said, Well, how many times have I been chairman?
MR. CUMMINGS: We could run a correlation on
that for you, if you'd like.
MS. COMSTOCK: I think you were number one last
quarter, so you're two for two at least. The
investment plan, as you heard from Dan and Ash
earlier as well, the performance continues to be
very strong. The numbers to focus at on the top of
the third line there, that shows the relative
performance of the aggregated investment plan versus
the aggregated benchmark. And what this is
representing are the active managers and how they're
performing relative to their benchmarks, as well as
what Ash mentioned earlier, the lower fees that also
come into play when selecting the investment options
for the members.
So strong outperformance across the board.
And, again, this is coming from -- diversified
across all the asset classes. I think each fund has
outperformed its benchmark across all of these time
1
2
3
4
5
6
7
8
9
10
11
12
13
14
15
16
17
18
19
20
21
22
23
24
25
114
ACCURATE STENOTYPE REPORTERS, INC.
periods, with one exception, the real assets fund,
which we've spoken about in previous quarters. Over
I believe the three and five year, more
benchmark-like performance, given an allocation to
commodities. But that has come back over the one
year period. So great relative performance across
the board for the investment plan options.
MR. COLLINS: Can I go back one slide for a
second? On the asset allocation -- maybe a couple
of slides -- on the alternatives. Do you happen to
know the breakdown between how the universe looks at
alternatives between, say, private equity and other
versus how we are broken up in private equity,
strategics?
MS. COMSTOCK: Yeah, that's a great question.
Unfortunately, that's a tough -- that's an issue
that most of these survey providers run across, is
how specific can you break out alternatives.
Unfortunately TUCS just has a broad alternatives
allocation. They don't give the breakout between
private equity or other, or sometimes commodities
can be in there, managed futures.
MR. COLLINS: Hedge funds?
MS. COMSTOCK: Hedge funds absolutely are
included in the alternatives. There are other
1
2
3
4
5
6
7
8
9
10
11
12
13
14
15
16
17
18
19
20
21
22
23
24
25

115
ACCURATE STENOTYPE REPORTERS, INC.
providers that will break out private equity and
that will have then an "other" category, or some
will do private equity and hedge funds. So we can
provide some of that information. Unfortunately,
this universe does not give us any detail on that.
MR. COLLINS: Okay.
MS. COMSTOCK: Jumping back to the investment
plan, we did get updated universe data. So that's
the table at the bottom. Numbers are a little bit
hard to see, but this is the CEM benchmarking
report. That is a survey that's done on an annual
basis. The information here is through
December 2016, as it takes time for them to collect
and aggregate and then distribute the report.
So we look at three metrics from this peer
survey. One is a five year average return. And we
look at the investment plan relative to a peer group
and how the FRS investment plan did. And you see
that bottom line. The investment plan
underperformed by one percentage point. This is
going to be largely due to asset allocation and how
the participants are allocating their assets, which
you-all don't have control over.
So the difference there is that the peers had a
greater allocation to equities than the investment
1
2
3
4
5
6
7
8
9
10
11
12
13
14
15
16
17
18
19
20
21
22
23
24
25
116
ACCURATE STENOTYPE REPORTERS, INC.
plan participants. And as equities have done well,
when you aggregate overall performance, the
performance is going to be better.
Before that reason, we also look at the net
value added that the SBA's investment plan has added
relative to its benchmark compared to peers. And so
that's a positive number. Again, though, this will
be impacted by how the participants are invested.
If there's more assets in passively managed funds,
then you won't see as great a level of
outperformance relative to the benchmark. The
number is positive. It's not as great as some of
the peer -- as the median peer group here. But this
is consistent with past surveys.
And then the last metric that we look at is the
expense ratio. The overall annualized expense ratio
is 33 basis points for the FRS investment plan.
This has come down since the last survey about three
basis points. And this includes the administrative
costs as well as the investment manager fees.
And when you look, break this number down and
compare it to peers on those two components, the
investment management -- the investment management
offerings have a lower fee relative to peers, which
is what the participants are paying.
1
2
3
4
5
6
7
8
9
10
11
12
13
14
15
16
17
18
19
20
21
22
23
24
25

117
ACCURATE STENOTYPE REPORTERS, INC.
When you look at the aggregated fee relative to
the peer group, it looks -- the FRS is paying about
seven basis points greater than the peer group. And
that's all due to the investment advice program that
the SBA offers the participants that -- it is
unclear if other peers are offering that to their
programs and what that entails. So it's a little
bit of an apples to oranges comparison, but that's
where the extra fee is coming from.
The universe data here, this is pretty
consistent with what we've seen in past years as
well. So nothing really new to know but just new
numbers.
We'll move on to the hurricane catastrophe
fund. We can move pretty quickly through. The
performance on a relative basis continues to
outperform the benchmark. As a reminder, the goal
of these funds are to be stable, ongoing and provide
liquidity when it's needed. And as Ash mentioned,
the fund continues to be in excellent shape, with
about $17 billion in assets at the end of the third
quarter.
Lawton Chiles Endowment Fund is the next major
mandate that we cover. Just a quick reminder that
it's about 70 percent invested in global equities,
1
2
3
4
5
6
7
8
9
10
11
12
13
14
15
16
17
18
19
20
21
22
23
24
25
118
ACCURATE STENOTYPE REPORTERS, INC.
which will drive performance. That global equity
allocation is managed by one active manager. That
active manager has done very well for the fund
across all these time periods and has driven the
outperformance of the total endowment relative to
the performance benchmark.
And the last major mandate that we cover is
Florida PRIME. Low absolute returns but, again,
relative to the benchmark, which is a peer group of
other local government investment pools, strong
outperformance here. With the increase in the
federal fund rate and expectations, we have seen an
uptick. Though it doesn't look that great, yields
have risen. We're expecting them to as well, which
will help absolute performance.
Here again, the goal is to provide stability,
preserve the capital that the participants are
investing and to provide liquidity. So that's the
reason for the low absolute returns, but the
relative returns continue to be very strong relative
to the peer group.
I ran through that pretty quickly, but are
there any questions on any of the five major
mandates that we cover?
MR. COLLINS: Any questions? Great. Thanks,
1
2
3
4
5
6
7
8
9
10
11
12
13
14
15
16
17
18
19
20
21
22
23
24
25

119
ACCURATE STENOTYPE REPORTERS, INC.
Katie.
MS. COMSTOCK: Thank you.
MR. COLLINS: Appreciate it. Thanks, Steve.
Is that it, Ash?
MR. WILLIAMS: I think that's it.
MR. COLLINS: I think that's it. Yeah. So we
need --
MR. WILLIAMS: Audience remarks.
MR. COLLINS: Audience remarks. Anybody on the
phone or anybody in the audience have anything that
they would like to discuss with the Board or take
up? Okay. And then dates for next year, so at Tab
6 in your book, the meeting dates are there, the
four meeting dates, March, June, September and
December. These are the proposed meeting dates,
so --
MR. WILLIAMS: Be aware of those.
MR. COLLINS: Yeah, be aware of those. If
nothing else, we'll be adjourned. Thanks.
(Whereupon, the meeting was concluded at 3:30
p.m.)
1
2
3
4
5
6
7
8
9
10
11
12
13
14
15
16
17
18
19
20
21
22
23
24
25
120
ACCURATE STENOTYPE REPORTERS, INC.
CERTIFICATE OF REPORTER
STATE OF FLORIDA )
COUNTY OF LEON )
I, Jo Langston, Registered Professional
Reporter, do hereby certify that the foregoing pages 3
through 119, both inclusive, comprise a true and correct
transcript of the proceeding; that said proceeding was
taken by me stenographically and transcribed by me as it
now appears; that I am not a relative or employee or
attorney or counsel of the parties, or a relative or
employee of such attorney or counsel, nor am I interested
in this proceeding or its outcome.
IN WITNESS WHEREOF, I have hereunto set my hand
this 2nd day of January 2018.
_______________________________
JO LANGSTON Registered Professional Reporter
1
2
3
4
5
6
7
8
9
10
11
12
13
14
15
16
17
18
19
20
21
22
23
24
25


STATE BOARD OF ADMINISTRATION OF FLORIDA
INVESTMENT ADVISORY COUNCIL MEETING
MONDAY, MARCH 19, 2018 1:05 P.M. - 4:30 P.M.
1801 HERMITAGE BOULEVARD HERMITAGE ROOM, FIRST FLOOR
TALLAHASSEE, FLORIDA
REPORTED BY: JO LANGSTON Registered Professional Reporter
ACCURATE STENOTYPE REPORTERS, INC.
2894-A REMINGTON GREEN LANE TALLAHASSEE, FLORIDA 32308
(850)878-2221
2
ACCURATE STENOTYPE REPORTERS, INC.
APPEARANCES
IAC MEMBERS:
PETER COLLINS (Telephonically) CHUCK COBB VINNY OLMSTEAD LES DANIELS
SBA EMPLOYEES:
ASH WILLIAMS, EXECUTIVE DIRECTOR KENT PEREZ JOHN BENTON STEVE SPOOK LYNNE GRAY MICHAEL FOGLIANO ALISON ROMANO TIM TAYLOR KATY WOJCIECHOWSKI JOHN BRADLEY TRENT WEBSTER JOAN HASEMAN MICHAEL MCCAULEY
CONSULTANTS: PHIL KIVARKIS - (Aon Hewitt) (Telephonically) KRISTEN DOYLE - (Aon Hewitt) JACK KOCH - (The Townsend Group) RICHARD BROWN - (The Townsend Group) SETH MARCUS - (The Townsend Group)

3
ACCURATE STENOTYPE REPORTERS, INC.
INVESTMENT ADVISORY COUNCIL MEETING
* * *
MR. WILLIAMS: Good afternoon. This is Ash
Williams. We have an unusual format today in that
we have several of our members calling in by phone,
including our chair, Peter Collins, who I understand
is on the line. Is that right, Peter?
MR. COLLINS: I'm here.
MR. WILLIAMS: Okay. Great. And I believe
we're going to have Bobby Jones dialing in as well.
Bobby, are you with us? All right. We'll stand by
for Bobby's arrival. So why don't we do this. For
purposes of identifying who is speaking, for the
court reporter's benefit, at this point Peter Jones
(sic) is the only one on the phone, but let's just
be mindful of that, and when we get other people on,
we'll remind them to please identify themselves. So
with that, Peter, do you have anything you want to
open with?
MR. COLLINS: Other than sorry I could not be
there today, but I'll do my best on the phone. Do
we need to wait until Bobby comes on for our -- not
for our call to order but our elections?
MR. WILLIAMS: Yes. And let me just back up
and tell everybody where we are, because not
1
2
3
4
5
6
7
8
9
10
11
12
13
14
15
16
17
18
19
20
21
22
23
24
25
4
ACCURATE STENOTYPE REPORTERS, INC.
everybody in the room understands the dynamics. We
have several folks out today. Peter had a
transportation issue, couldn't make the trip due to
a broken airplane. Bobby had a different kind of
transportation issue, couldn't make it because of a
broken foot, just different levels of
transportation, I suppose.
And then in addition, Gary Wendt is ill, and
Michael Price is on spring break, as is Sean
McGould, our remaining IAC member. So they're both
on family travel and not available for those
reasons. But if Bobby comes on, we will have a
quorum.
And the first order of business in the March
meeting is usually to elect successor chair and
vice-chair leadership. That's always a simple
process because it's a simple seniority thing. So
Gary Wendt is set to move up as chair, and Peter
Collins has expressed a willingness to step into the
vice-chair role. So the awkwardness we've got is
that we don't have either of them present. So if
the members choose to move forward, we can do that.
MR. COLLINS: Ash, I think you meant to say
that Bobby Jones has expressed the willingness to
step into the vice-chair role.
1
2
3
4
5
6
7
8
9
10
11
12
13
14
15
16
17
18
19
20
21
22
23
24
25

5
ACCURATE STENOTYPE REPORTERS, INC.
MR. WILLIAMS: Yes. What did I say?
MR. COLLINS: Peter Collins.
MR. WILLIAMS: Sorry. Do you want to
reconsider, Peter?
MR. COLLINS: I just wanted it to be clear and
on the record.
MR. WILLIAMS: Not being here, you're at risk
for all kinds of stuff. Yeah. My mistake.
MR. COLLINS: Well, why don't we just go ahead
and call the meeting to order. We don't have a
quorum to approve the minutes, so why don't we go
right to your opening remarks and legislative
update, Ash.
MR. WILLIAMS: We can do that. And Les just
suggested it might make sense to just put off the
election to the next meeting anyway, and that way we
have everybody here. I'm not sure if that's
acceptable to the group.
MR. COLLINS: That's fine.
MR. WILLIAMS: So in terms of legislative
activity and general update for me, first, as
always, we'll open with performance. And through
Friday's close, if we look at the fiscal year to
date, the Florida Retirement System Trust Fund --
and these are unaudited gross numbers at this
1
2
3
4
5
6
7
8
9
10
11
12
13
14
15
16
17
18
19
20
21
22
23
24
25
6
ACCURATE STENOTYPE REPORTERS, INC.
point -- up 9.44 percent. That's three basis points
ahead of target and leaves us with a current balance
of $163.5 billion. That's $10 billion ahead of
where we started the fiscal year, net of
distributions that average about $600 million per
month. So performance has been good.
Our value add over benchmark at three basis
points you may perceive as conspicuously small
compared to what you normally hear, and I think
that's correct. But it's a high class problem in
this market environment because when you have very,
very robust bull markets, our value add is less
apparent. If you have more challenging
environments, we will tend to show substantially
better numbers. Either way, the good news is we're
up $10 billion, so no complaints there.
Legislatively, probably the most fundamentally
important thing that the legislature did in the
session that ended, what, Sunday a week ago, I
suppose, was to approve full actuarial funding for
the pension system and the full actuarially
indicated contribution to unfunded liability.
In addition to those things, legislation that
we previously discussed relating to Venezuela, which
simply reenacts in statute the same provision that
1
2
3
4
5
6
7
8
9
10
11
12
13
14
15
16
17
18
19
20
21
22
23
24
25

7
ACCURATE STENOTYPE REPORTERS, INC.
the trustees had previously adopted by resolution,
and we in turn have reflected in our investment
policy statement, that is now in statute. In
addition, we had two reviser's bills. Reviser's
bills are technical legislative lingo for bills that
don't have a substantive policy impact, they just
clean things up.
So the two revisions were, one, a cleanup of
all the SBA statutes to eliminate redundant or
outdated references. And the other was elimination
of Fund B and the Participant Local Advisory
Council. So you'll recall that we've had joint
meetings every June of the IAC and the PLGAC.
With the resolution of Fund B and the tail end
of the problems in what's now known as Florida
PRIME, back in the old days the Local Government
Surplus Funds Trust Fund, since that whole matter
was resolved, the PLGAC had little reason to exist
and voted itself to dissolve. But the legislature
has to take that action. So that bill, I believe,
has now gone to the governor.
And there were a number of things rattling
around that we were not particularly fans of. And
the good news is none of those went anywhere. So I
think, on the whole, it was a good legislative
1
2
3
4
5
6
7
8
9
10
11
12
13
14
15
16
17
18
19
20
21
22
23
24
25
8
ACCURATE STENOTYPE REPORTERS, INC.
session for the SBA, and we're happy with its
outcome. So -- oh, one other thing that came up, it
was a very, very high visibility issue, obviously
was the tragedy at Parkland school. And that led to
a lot of discussion about what the right legislative
response should be to that situation.
One of the things that came up was, not
surprisingly, a divestiture initiative. And that
was not a course taken. There were a number of
public safety policy solutions embraced by the
legislature and put forward by the governor that in
our view are the appropriate way to respond to
something like this. This was not an investment
policy issue. It was a public safety issue. And,
therefore, the realm of policy that's appropriate to
its resolution is public safety policy, not
investment policy.
That said, what we are probably going to be
doing over time is looking at responsible and
prudent ways that we can engage with companies in
which we own shares that may be firearms or
ammunition producers. And we have a long history of
constructive engagement. We're thoughtful in how we
go about it. I've already had some contact with
some of our peers and some of the large private
1
2
3
4
5
6
7
8
9
10
11
12
13
14
15
16
17
18
19
20
21
22
23
24
25

9
ACCURATE STENOTYPE REPORTERS, INC.
sector asset managers, and I think there's a lot of
interest around this area.
Mike McCauley, who runs the State Board's
corporate governance program, is the chairman of the
International Corporate Governance Network, and I
was elected chairman of the Council of Institutional
Investors last week. So between the two of us and
our long history in this area of corporate
governance, I think we're well positioned to be
heard on this and I think can keep the discussion in
a constructive and productive vein instead of doing
things just to do them, which sometimes can be an
offshoot of emotional issues.
So unless there are any questions, happy to
move on with the asset-liability review, as you
prefer, Mr. Chair.
MR. COLLINS: That's great. The only thing I
would say is congrats to both you and Mike for those
two respective roles. It's a pretty high honor to
get elected to those two positions, and so congrats
to both of you. And I think it speaks to your work
and dedication on behalf of all of the pension funds
in the country, so we're fortunate.
Let's go ahead and start. I'm assuming Phil
and Kristen are both there.
1
2
3
4
5
6
7
8
9
10
11
12
13
14
15
16
17
18
19
20
21
22
23
24
25
10
ACCURATE STENOTYPE REPORTERS, INC.
MR. WILLIAMS: Peter, can I jump back for one
minute?
MR. COLLINS: Yeah.
MR. WILLIAMS: I apologize. I neglected to do
two things I should have done. I need to mention
the reports that are in the book, which are all of
the substantive reports from IG, the audit
committee, general counsel, compliance. And the key
thing I wanted to draw a little bit of attention to
there is that we had a periodic review done of our
compliance and risk environment.
So this is something that best practice says
you do every three to five years. We've
historically done it every three years. I think
we're probably going to move it to five because it
makes more sense and will save us some money. But
at any rate, we brought in an outfit called Funston
Advisers, which is a top drawer firm in this area.
They did an extensive review of our governance
risk and compliance, GRC, activities and practices
and concluded that -- basically they divide
practices into leading, prevailing and lagging. And
as they looked over dozens of different areas of our
activity, they concluded that the vast majority of
what we do is either leading or prevailing and very
1
2
3
4
5
6
7
8
9
10
11
12
13
14
15
16
17
18
19
20
21
22
23
24
25

11
ACCURATE STENOTYPE REPORTERS, INC.
little in the way of lagging.
That said, there are always things we can do
better. This was a true partnership engagement,
where the Funston people, our compliance people and
our chief audit executive and her team worked
together all the way across management, all asset
classes, et cetera, and had a very, I think, open
and productive discussion as to areas where we can
improve and be more cutting edge in what we're doing
in that space.
So we're taking that forward. We've already
taken the report up to the audit committee. The
Funston people came in and spent a lengthy audit
committee meeting reviewing the details of their
findings and management's reactions, et cetera. I
think the audit committee is happy, and this is
primarily within their beat. But it's an important
thing, so I wanted to mention it to you.
One other thing I wanted to mention to the
advisory council that I mentioned to the trustees
last week is we did have a compliance exception.
And it's rare that we have these. But when we have
one, we're going to report it promptly and be clear
about it.
We were transitioning among three different
1
2
3
4
5
6
7
8
9
10
11
12
13
14
15
16
17
18
19
20
21
22
23
24
25
12
ACCURATE STENOTYPE REPORTERS, INC.
equity managers, outside equity managers. And in
the process of that transition, two equity issues
were errantly bought that were violative of the
Iran/Sudan prohibitions. The global equity team
caught that just about immediately. The trades were
reversed, and there's no economic impact plus or
minus to the State Board.
And we're sorting through how exactly that slip
occurred and to fix it so it won't happen in the
future. But since that's a statutory exception, we
take it seriously, and I reported it last week, or
the week before, to the trustees. So we should be
squared on that.
MR. COLLINS: I'm glad you brought up the
Funston report, Ash, because I just want to thank
everybody that participated. I know they did an
exhaustive interview process. If everybody would
look up their report on page two or page three, you
can see -- it's under Tab 2 -- the list of
interviewees and the list of survey participants.
Thirty-four groups and 98 individuals were
invited to participate in the survey, and 94
responded, so 95 percent. I know I talked to them
at length, and I'm sure some of the other Investment
Advisory Council members did as well. So good
1
2
3
4
5
6
7
8
9
10
11
12
13
14
15
16
17
18
19
20
21
22
23
24
25

13
ACCURATE STENOTYPE REPORTERS, INC.
process. And I thought the questions were great and
glad to see the results.
MR. WILLIAMS: Thank you. That's it for me. I
apologize for having to go back and retread.
MR. COLLINS: Great. All right. So we'll turn
it over to Aon Hewitt.
MS. DOYLE: Great. Thank you, Chairman. So,
actually, Phil Kivarkis is on the phone today. He
also had travel troubles. I think it was a broken
engine. So unfortunately he's not present with us
today either.
But for those of you that have been through
this before, I think all of the IAC members have
actually been through this at least once before, you
will recall that we refresh the asset-liability
study every March. So we're going to do that again
today.
And what we do and what we focus on with the
asset-liability study is looking at the relationship
between plan assets and liabilities and revisiting
the risk position that we have, so that overall
allocation to what we call return-seeking or risky
assets and safety or risk-reducing assets. So that
is the high level decision that we want to make sure
that we discuss today.
1
2
3
4
5
6
7
8
9
10
11
12
13
14
15
16
17
18
19
20
21
22
23
24
25
14
ACCURATE STENOTYPE REPORTERS, INC.
So I am actually going to turn it over to Phil.
I'm going to help advance slides. And if you have
questions and Phil is not pausing or something, just
let me know and I will interrupt him and we can make
sure that you-all are able to get all of your
questions answered. So with that, Phil, I will turn
it over to you.
MR. KIVARKIS: Fantastic. Can you hear me
okay?
MS. DOYLE: Yes.
MR. KIVARKIS: All right. This Phil Kivarkis.
I'm the U.S. director of investment policy services
with Aon Hewitt Investment Consulting. I'm going to
walk us through our latest and greatest pension
asset-liability study. You'll note the title is,
Pension Asset-Liability Study: Initial Results.
That should be the document you're looking at and
will see for the next several minutes.
MR. COBB: I think he needs to get closer to
the microphone.
MR. COLLINS: If he's on speaker, take it off
speaker.
MR. KIVARKIS: Is this better?
MR. COLLINS: Much.
MS. DOYLE: Keep going and we'll let you know.
1
2
3
4
5
6
7
8
9
10
11
12
13
14
15
16
17
18
19
20
21
22
23
24
25

15
ACCURATE STENOTYPE REPORTERS, INC.
MR. KIVARKIS: All right. Fantastic. Please
do. So the table of contents on page one, you can
see that we'll start with the executive summary,
effectively, the overarching message. We'll
summarize with the bottom line, and thereafter we'll
go over the overview of the analysis and then the
results of our analysis, and I'll wrap with summary
and conclusions. We'll have Q and A at the end, but
by all means, if you have questions that arise
throughout the discussion, feel free to ask away.
The first section, executive summary, I'm on
page three, and the scope of the project is this
annual asset-liability management review. So part
of this will be the 30 year asset-liability
projection analysis, and we'll review what those
results look like. We'll review the risk and reward
trade-offs for a variety of portfolios as part of
this analysis, and then we'll compare and contrast
what the implications of various portfolio
strategies would have been in our study.
So that's it at a very high level. Now, page
four is the bottom line on the executive summary.
And we really split this into two key components,
the investment analysis and then the asset-liability
projection analysis.
1
2
3
4
5
6
7
8
9
10
11
12
13
14
15
16
17
18
19
20
21
22
23
24
25
16
ACCURATE STENOTYPE REPORTERS, INC.
Now, we looked at the investment analysis. By
and large we like the current construct of the fund.
The current portfolio, we believe, is
well-constructed. It's 81 percent allocated to what
we call return-seeking assets. And we'll provide
more detail as to what that looks like in just a few
moments.
Importantly, the equity risk premium, which
you'll recall is actually an average of four
different investment advisers' assumptions. The
equity risk premium is 3.62 percent for this 2018
study. It was 3.72 percent for last year's study.
And we've noticed a consistent decline in that
assumption over the course of the last several
years. And so that's important. That will have
implications as we walk through the analysis, which
I'll highlight.
The asset returns at 6.44 percent based on this
analysis is obviously lower than the actuarial rate
of return, which is 7.5 percent. And that also has
implications, as we'll see. The expected real
return, 4.06 percent, falls short of the investment
policy target of 4.5 percent.
When we look at the asset-liability projection
analysis, the most noteworthy item is that the
1
2
3
4
5
6
7
8
9
10
11
12
13
14
15
16
17
18
19
20
21
22
23
24
25

17
ACCURATE STENOTYPE REPORTERS, INC.
funded ratio is projected to move sideways over the
course of the projection period. So if we're to
look at the 30 year projection analysis, you would
note that the funded ratio starts in the
mid-eighties, and over the course of the 30 year
projection period stays in the mid-eighties by and
large. And so you'll see what that looks like over
the course of the next 30 years.
Of course, higher return-seeking strategies
would have a higher trajectory of funded ratio
growth over time, and lower return-seeking portfolio
strategies would have a lower trajectory. But of
course the resultant knock-on effects in terms of
risk, higher return-seeking strategies are more
risky by their nature as well.
And then, finally, longer time horizons work to
the benefit of public pension funds. By and large,
because public pension funds are primarily focused
in the long run, they tend to tilt their portfolios
towards return-seeking assets, as those are expected
to reward over the long run, and thus economically,
from a risk-reward perspective, look advantageous.
And we'll examine that as well.
All right. That's it in a nutshell. Now I'm
going to spend a few minutes going over how we
1
2
3
4
5
6
7
8
9
10
11
12
13
14
15
16
17
18
19
20
21
22
23
24
25
18
ACCURATE STENOTYPE REPORTERS, INC.
conducted the study and then the detailed results of
that study. Again, this should look fairly familiar
to you, but by and large, if you have questions,
feel free to interrupt.
So the next section, the overview, I'm on page
six. So what is an asset-liability study? It's
intended to provide the group with an understanding
of the nature of the relationship between assets and
liabilities within the pension plan. Now, we'll use
this study to examine the impacts of various asset
allocation strategies in terms of the economic risk
versus the economic reward.
We'll be able to identify trend lines of the
main financials in the pension plan, things like
funded ratio and contributions, for example, so that
you can examine the implications of different
strategies on the pension's projected financials,
and then finally to help determine the appropriate
level of risk in the context of the plan.
So it's right there at the bottom the page.
The asset-liability study provides you with the
tools to align the plan's risk taking with the
nature of the liabilities in question.
And you can see the schematic on page seven,
which shows effectively that everything that we're
1
2
3
4
5
6
7
8
9
10
11
12
13
14
15
16
17
18
19
20
21
22
23
24
25

19
ACCURATE STENOTYPE REPORTERS, INC.
talking about here is a balance of assets and
liabilities. And interestingly, if you're working
with a plan that is less than 100 percent funded or
less than fully funded, the way to grow the funded
ratio from less than fully funded back to
100 percent is to have the assets grow faster than
the liabilities.
Now, you can see what components would grow the
liabilities and what components would grow the
assets. Generally speaking, the liabilities will
grow every year because of new benefit accruals.
That's because your people earn one more year of
service. Their benefits grow as a result. And the
liability return is effectively the actuarial
interest rate.
And then growing the assets is a combination of
cash contributions and asset returns. Well, if the
assets are to grow faster than the liabilities, you
would need cash contributions and/or asset returns
which fuels growth of the assets such that that
exceeded the liabilities. So one of the first
things we'll study is, what is the growth rate of
the liabilities, what is the expected growth rate of
the assets, and how do they compare over time.
All right. Page eight shows a schematic of how
1
2
3
4
5
6
7
8
9
10
11
12
13
14
15
16
17
18
19
20
21
22
23
24
25
20
ACCURATE STENOTYPE REPORTERS, INC.
we conducted our asset-liability study. Now, I
won't get into too many of the weeds, but I will say
that we conducted a 30 year projection analysis of
assets and liabilities on a single platform.
We study not just one trial. We study 5,000
economic trials over the course of the next 30
years, from the best of times to the worst of times
and everything in between. And for each one of
those 5,000 trials, we'll have a progression of
actuarial results, a progression of pension plan
financials, if you will. And some of those will be
very optimistic. Some of those will be very
pessimistic, and we'll have -- some of those will be
middle of the road, and we'll have a distribution of
potential outcomes.
So effectively we're doing this 5,000 times.
We're ensuring that the economic scenarios -- each
of those 5,000 economic scenarios is robustly
treated over the course of the next 30 years on both
the assets and the liabilities and ultimately the
contributions and funded ratios, et cetera. So all
of that is baked into the model that we use.
Page nine talks about the long-term economic
cost of the plan. So this is one of our key
metrics, and we'll show you what the economic cost
1
2
3
4
5
6
7
8
9
10
11
12
13
14
15
16
17
18
19
20
21
22
23
24
25

21
ACCURATE STENOTYPE REPORTERS, INC.
looks like. When we look at economic cost, we're
effectively talking about the cost of contributions
plus any shortfall at the end of the projection
period.
So for example, let's say you were to fund over
the course of time -- if you were to fund over the
course of time $50 billion into the plan, and over
the course of that projection period, you never
quite get to a fully funded state. You're still 10
billion short. We call that economic cost about
$60 billion, because it costs 50 billion in cash,
plus there was a shortfall at the end of the day.
And so the expected economic cost is one key
metric. Of course, that's the expected case.
However, the actual scenarios that play out over the
next 30 years could be quite pessimistic. And so
we, as a matter of economic risk, also study what
might happen if things don't play out as expected
but rather if we have a pessimistic case.
And so we're going to compare economic cost in
the expected case versus economic cost in the --
what some might deem to be the worst case and
compare that -- and present that for your
consideration. Effectively, we call that economic
cost versus economic risk evaluation.
1
2
3
4
5
6
7
8
9
10
11
12
13
14
15
16
17
18
19
20
21
22
23
24
25
22
ACCURATE STENOTYPE REPORTERS, INC.
But those are the key metrics. In fact,
economic cost by and large is going to be the
present value of contributions into the plan over
the course of the projection period.
And then finally in this section I wanted to
highlight on page ten the risk-reward trade-offs.
The risk-reward trade-offs when we compare the
asset-only or traditional sense versus the
asset-liability sense.
Your traditional asset-only sense, reward is
measured in terms of investment return. So think
about your standard, you know, your portfolio will
earn 7 percent. Risk is the volatility of those
returns. And that's the traditional sense for risk
versus reward. We're going to consider that as part
of this analysis. We're also going to consider,
however, the asset-liability context.
What is return in terms of a reward in terms of
the asset-liability context? It's the potential
cost reduction associated with different investment
strategies or potential funded status improvement.
And risk is what happens to those metrics in the
worst of times. So in other words, in the worst
case economic outcome, what does the pension plan
financial state look like. So we're going to
1
2
3
4
5
6
7
8
9
10
11
12
13
14
15
16
17
18
19
20
21
22
23
24
25

23
ACCURATE STENOTYPE REPORTERS, INC.
examine risk versus reward, not just in terms of
asset-only traditional sense but also
asset-liability within the context of your pension
plan.
All right. The next slide covers some key
factors affecting the risk-reward trade-off. Just
to highlight this in very broad strokes, the time
horizon, the longer the time horizon the more that
supports risk taking. The characteristics of the
plan. For example, a mature plan might have a lower
tolerance for risk than a less mature plan.
Funded status can come into play as well. The
plan with less funding that needs more upside might
desire a higher risk profile, if you will. And then
finally the nature of plan benefits. So for
example, if there was a sensitivity to inflation
because of wage growth, then that might implicate
the investment strategy as well. So those are a few
of the key features that might affect the
risk-reward trade-off.
When we talk about the risk-reward trade-off,
by and large we're talking about the allocations to
what we call return-seeking assets versus
risk-reducing assets. Return-seeking, things like
equities. Risk-reducing, things like investment
1
2
3
4
5
6
7
8
9
10
11
12
13
14
15
16
17
18
19
20
21
22
23
24
25
24
ACCURATE STENOTYPE REPORTERS, INC.
grade bonds.
In the interest of time, there's a glossary of
terms on the next page. I will mention that it's
there, but I don't intend to cover that. And with
that, let's move forward to the asset-liability
profile. So the next slide has the historical
information on the assets and liabilities for the
FRS.
And here you can see that the green line is the
value of assets over the last 15 or so years. The
blue line is the value of the liabilities. It's
interesting and noteworthy that at the start of this
graph, the assets actually exceeded the liabilities.
And you can see that that was true until about 2008.
You'll recall in 2008 is when markets were
quite challenged performance-wise. And so that's
when you saw a crossover point. The assets moved
south of the liabilities. You'll notice the
liabilities have had a fairly smooth and steady
progression north over the course of the last
(inaudible) years.
Assets have also been a fairly smooth
progression. That's because these assets are the
actuarial value of assets. There are smoothing
mechanisms (inaudible). However, you will notice
1
2
3
4
5
6
7
8
9
10
11
12
13
14
15
16
17
18
19
20
21
22
23
24
25

25
ACCURATE STENOTYPE REPORTERS, INC.
there's a precipitous drop in that 2008, 2009 time
period. But by and large they've been roughly
tracking together over the course of the -- over the
historical period, minus that 2008, 2009 time
period.
And onto today, the asset-liability profile as
of July 1, 2017, on the next slide. And here you'll
see effectively four quadrants to this page. The
upper left-hand corner shows the asset-liability
snapshot as of July 1, 2017. Market value of
assets, $154 billion, 86 percent funded on that
basis. You'll notice the actuarial liability is
178.6 billion. Actuarial value of assets, pretty
close to the market value, 150.6, 84 percent funded
on that basis.
I'm going to focus on the market value of
assets basis just because it's more of the economic
reality. The plan as of July 1 of 2017 sat at about
86 percent funded. And that will be the starting
point for the projection analysis that's
forthcoming.
The upper right-hand corner shows the expected
benefit payments. I'll note that the plan is
projected to grow the benefit payments over the
course of the next 30 years at a smooth and steady,
1
2
3
4
5
6
7
8
9
10
11
12
13
14
15
16
17
18
19
20
21
22
23
24
25
26
ACCURATE STENOTYPE REPORTERS, INC.
predictable pattern. Now, this information was
information that we, Aon, collected from the plan
actuary. And so this information -- we partnered
with the actuary to collect this information and
ultimately to see, begin the starting point for our
asset-liability projection analysis.
MR. COBB: Excuse me, Mr. Chairman. I have a
question at this point.
MR. COLLINS: Go ahead, Ambassador.
MR. COBB: So with the 86.3 percent funded, is
that assuming that we will earn an average rate of
return of 7.6 percent? So is that the discount that
you have used to get to the 86 percent?
MR. KIVARKIS: It's actually 7.5 percent.
MR. COBB: Except the legislature has given us
7.6, I thought. Isn't that right?
MR. WILLIAMS: I believe we moved back to 7.5.
What's happened is they've taken it down slightly
for each of the past couple of years.
MR. COBB: So we're at 7.5 now. Okay.
MR. WILLIAMS: Yes, sir.
MR. COBB: So if we earn less than 7.5 over
time or if we assume we're going to earn less than,
which I think our investment advisers are
suggesting, then we're really not at 86 percent.
1
2
3
4
5
6
7
8
9
10
11
12
13
14
15
16
17
18
19
20
21
22
23
24
25

27
ACCURATE STENOTYPE REPORTERS, INC.
MR. WILLIAMS: Mr. Chairman, if I may.
MR. COLLINS: Go ahead, Ash.
MR. WILLIAMS: Ambassador, you've just
identified the central tension that all public
pension plans have, which is since the convention in
public plan actuarial science is to use the
investment return assumption as the discount factor,
there is a hard-wiring between conservative or lower
investment return assumptions and funding
requirements.
MR. COBB: But I assume, on the other hand, if
in fact interest rates go up, our assumption of
asset values presumably would go up, too, which
would help our percentage.
MR. WILLIAMS: Depending on the mix, yes,
should be the case.
MS. DOYLE: Yes. And what you'll see, when we
get into the projections that Phil has been
mentioning, is that we do assume the 6.4 percent
expected return on assets based on our capital
markets assumptions, actually the blended capital
markets assumptions from the four consultants. And
so you'll see that the projected funded status does
not stay at 86 percent. It definitely sort of
levels off around 78 or 80 percent, which I think is
1
2
3
4
5
6
7
8
9
10
11
12
13
14
15
16
17
18
19
20
21
22
23
24
25
28
ACCURATE STENOTYPE REPORTERS, INC.
what you were alluding to.
MR. COBB: Thank you.
MS. DOYLE: Okay, Phil.
MR. KIVARKIS: So I agree with all those
points, by the way. And, yes, there's more
information forthcoming along those lines exactly.
In fact, just to say it, the lower left-hand corner
covers the snapshot, the point in time as of July 1
of 2017, the asset-liability growth metric.
I mentioned earlier, when we looked at that
page showing the scale of assets versus liabilities,
here we can see the liabilities are growing every
year due to what we call an interest cost. That's
the 7.5 percent actuarial assumption. Another 1.1
percent due to normal cost, cost of new benefits
that accrue to your people every year for one more
year of service, et cetera. $15.3 billion per year,
about 8.6 percent of the liabilities. In other
words, your liabilities are growing at about
8.6 percent per year. By the way, that's simply
15.3 billion divided by 178.6. 8.6 percent per
year.
However, if you were to do the math, as a
percentage of the assets, it's more like 9.9
percent. If I take 15.3 billion, divide it by 154.1
1
2
3
4
5
6
7
8
9
10
11
12
13
14
15
16
17
18
19
20
21
22
23
24
25

29
ACCURATE STENOTYPE REPORTERS, INC.
billion, I get 9.9 percent. So that's important
because that tells us how much the assets have to
grow just to keep pace with the liabilities.
Now, what are we projecting for the assets?
We're projecting the assets will grow by two
different components. Expected return on assets,
which is effectively your investment performance.
And here you can see 6.4 percent is what we're
projecting. And another 2.4 percent per year due to
contributions, funding going into the plan.
So as of the snapshot at July 1 of 2017, we see
expected asset growth of something on the order of
8.8 percent. That's less than the 9.9 percent that
I just mentioned. For that reason, because the
assets are growing 8.8 when we need them to grow
9.9, you're going to see the initial funded ratios,
if anything, trend slightly lower in the early
years.
Now, the good news is this. We're actually
projecting the contribution rate will increase over
time. We're also projecting that the investment
performance will increase over time as interest
rates revert back to more normal levels, just as you
described.
So the sum total of those things will actually
1
2
3
4
5
6
7
8
9
10
11
12
13
14
15
16
17
18
19
20
21
22
23
24
25
30
ACCURATE STENOTYPE REPORTERS, INC.
pull the asset growth rate in excess of the
liability growth rate, but not right away. Right
away you can see that there's going to be a little
bit of a shortfall, which means the trajectory of
the funded ratio will point lower before it starts
going higher.
So with that, why don't we continue on. I'm
looking at the investment analysis, the equity risk
premium methodology. This is the SBA approach.
It's the average of four different investment
advisers' assumptions. So the whole point of this
exercise is to remove biases from one single
adviser. The four advisers in play were Mercer,
Wilshire, Callan and Aon Hewitt. You can see the
overarching average equity risk premium from that
group, 3.62 percent.
It's always interesting to see how individual
advisers shake out relative to one another. But you
can see that there's a range here between
2.9 percent to 4.1 percent. And so by and large the
average equity risk premium -- by the way, equity
risk premium being the equity return expectation
less the bond return expectation. And when we say
equity, we mean global equity.
So the average global equity return
1
2
3
4
5
6
7
8
9
10
11
12
13
14
15
16
17
18
19
20
21
22
23
24
25

31
ACCURATE STENOTYPE REPORTERS, INC.
expectation, 6.78 percent. The average bond return
expectation, 3.16 percent. And the difference
between those two is the 3.62 percent equity risk
premium.
Now, you'll notice that last year it was
3.72 percent. And so on average that assumption has
dropped 10 basis points. If you look at what we've
seen over the past several years, you'll notice we
have quite a bit of history here. Going all the way
back to 2012, 4.3 percent, 4.7 percent, 3.5 percent,
3.9 percent. So we're certainly on the low end of
that scale. And that's important because that will
implicate -- the assumptions going in, of course,
implicate the results coming out of the analysis.
The next page covers the investment analysis
using that set of assumptions that I just described
on the previous page. And here we're looking at the
current frontier. We're looking at risk and reward
within the context of the traditional approach, the
asset-only approach for starters. The vertical axis
on the graph shows the expected return on assets.
The horizontal axis shows the volatility of the
returns.
And you can see a spectrum of potential
solutions ranging from what we call zero percent
1
2
3
4
5
6
7
8
9
10
11
12
13
14
15
16
17
18
19
20
21
22
23
24
25
32
ACCURATE STENOTYPE REPORTERS, INC.
return-seeking assets to 100 percent return-seeking
assets, and at several points in between. Of
course, the 100 percent return-seeking asset
portfolio is going to be the highest reward and
highest risk. And conversely, the zero percent
return-seeking portfolio, low reward, low risk.
You can see that your current policy is what we
call 81 percent return-seeking. It lies toward the
upper end of the risk spectrum. It's pretty common
with public pension funds, given their long-term
time horizon.
I'm looking at the table down below, and you
can see some more detail as to what those summary
statistics look like. 6.44 percent expected nominal
return, 12.52 percent expected volatility, Sharpe
ratio of .323. And you can see what that allocation
looks like. Off to the right you can see the
allocation to return-seeking assets and also the
safety or risk-reducing assets.
By and large, the return-seeking assets,
they're centered in global equity. There is some
allocation to real estate, the strategic funds and
private equity as well. And then in terms of the
safety assets, it's primarily investment grade
bonds. So that's the current frontier.
1
2
3
4
5
6
7
8
9
10
11
12
13
14
15
16
17
18
19
20
21
22
23
24
25

33
ACCURATE STENOTYPE REPORTERS, INC.
Now, if we look at the implications of the
current portfolio in terms of the range of potential
returns over various periods, if you flip to the
next page, you can see what the range of those
nominal returns looks like over 5, 10, 15, and 30
year periods.
And you can see that the 50th percentile
return, 6.44 percent, lies under the actuarial
assumed rate of return, 7.5. In the range of
outcomes, however, you'll notice -- and this is
cumulative annual returns. You can see that the
range of those outcomes narrows over time as you're
progressing from 5 years to 10 to 15 to 30, such
that over the course of the 30 year period, we have
investment returns which could range from
2.78 percent to 10.23 percent cumulative annual
returns over the course of the 30 year projection
period, the 10 year being 6.44 percent.
Now, of course, the shorter the time horizon,
the less certainty around that cumulative annual
result. You'll see that the range of outcomes is
considerably wider.
And we've done the same analysis on page 19 on
page 20, except for that here we're showing the
range of real returns on the next page. You can see
1
2
3
4
5
6
7
8
9
10
11
12
13
14
15
16
17
18
19
20
21
22
23
24
25
34
ACCURATE STENOTYPE REPORTERS, INC.
a similar picture. I'm not going to belabor the
point.
All right. So that takes us to the next
section of our analysis, which is now the
asset-liability projection analysis. So I'm on
the -- the first page in this section is the
projection of employer contributions over the course
of the 30 year projected period for the defined
benefit plan.
Now, just to orient you to the page, we have
three graphs on the page. The three graphs
represent three different investment policies. The
second investment policy is the current policy, the
81 percent return-seeking portfolio. And you'll
notice we bracketed that result with a 70 percent
return-seeking portfolio and a 90 percent
return-seeking portfolio. Effectively, we've
bracketed the current policy with a lower risk and
a higher risk investment solution. And so we can
examine the implications to the contribution rate of
each of these types of strategies.
Now, the vertical axis, that's the contribution
percentage, that's as it relates to the total
payroll. And the X axis shows the calendar years.
So you can see the -- I'm sorry. These are fiscal
1
2
3
4
5
6
7
8
9
10
11
12
13
14
15
16
17
18
19
20
21
22
23
24
25

35
ACCURATE STENOTYPE REPORTERS, INC.
years. So you can see the years across the bottom
of the page, ranging from 2017 to 2047, thus
representing the 30 year projection period.
I'm going to focus on the current policy for
starters. And it is important to note that the
current policy has a starting point of 10 percent of
payroll as your contribution rate. If you examine
the dotted line, consider the dotted line your
central expectation. It's the 50th percentile above
the 5,000 trials, stochastic trials. But consider
that dotted line to be the central expectation.
You can see that the central expectation for
contributions in is expected to grow from 10 percent
to about 16 percent over the next 20 years. And
then it takes -- it moves south. After various 20
year amortizations are complete, it moves south,
once those amortizations expire, down to a level,
something on the order of 12 or 13 percent of
payroll. So that is the contribution requirement in
the expected case with the current policy.
Now, that's the central expectation. Of
course, things could be better. They could be
worse. In the best of times, you can see that that
contribution starts trending toward zero. I'm
looking at the dark blue line, the 5th percentile
1
2
3
4
5
6
7
8
9
10
11
12
13
14
15
16
17
18
19
20
21
22
23
24
25
36
ACCURATE STENOTYPE REPORTERS, INC.
result effectively. And you can see that in the
best of times you have funded ratios of
substantially north of 100 percent, and the
contribution therefore would start to move toward
zero. In the worst of times, that's the dark green
line, you can see contributions moving even north of
30 percent 20 years out.
So there is quite a range of potential
outcomes. But I'm going to focus on that central
tendency. The central tendency says the expected
contribution going from 10 percent to 16 percent
over the next 20 years.
Now, if you compare that to the 70 percent
return-seeking portfolio, that's a lower risk, lower
reward portfolio, you can see a higher trajectory of
cost. You'll notice that the cost is expected to
grow from 10 percent to about 19 percent over the
next 20 years before trending lower.
And, conversely, the 90 percent return-seeking
portfolio, which is effectively higher risk and
higher reward, that has a lower cost. It's expected
to grow from 10 percent to just shy of 15 percent
over the next 20 years. So there's a lower cost
associated with a higher risk portfolio, and vice
versa.
1
2
3
4
5
6
7
8
9
10
11
12
13
14
15
16
17
18
19
20
21
22
23
24
25

37
ACCURATE STENOTYPE REPORTERS, INC.
So that's the contributions. Now, the
contributions were used for purposes of determining
the funded ratios, which are shown on the next
slide. And, again, just to orient you to the page,
here we're looking at funded ratios. That is the
market value of assets divided by liabilities. The
second graph is your current policy. I'm going to
focus on the starting point and the trajectory of
those future values.
You can see that the projection starts life at
about 86 percent funded, and you'll notice it moved
south ever so slightly before it starts to move
sideways. And so it moves south because that active
growth rate being less than the liability growth
rate initially, but after those contributions start
to ramp up, we then move to a state where the assets
are basically treading water versus the liabilities.
So you can see it kind of settles in at the
80 percent level over the course of the next 30
years.
Now, you can see what happens. If you were to
move to a 70 percent return-seeking portfolio, you'd
see that trajectory continue to move south. And
with a 90 percent return-seeing portfolio, you see
the trajectory start to move slightly north.
1
2
3
4
5
6
7
8
9
10
11
12
13
14
15
16
17
18
19
20
21
22
23
24
25
38
ACCURATE STENOTYPE REPORTERS, INC.
So that's the implication of the various
strategies. But by and large, with the current
strategy, we're expecting to move largely sideways,
ending at about 80 percent funded.
If you were to compare this result to what we
saw last year, you'd see a very similar outcome. In
fact, these pictures are effectively similar, albeit
slightly south of what the pictures looked like last
year. And the reason that they're slightly south is
because the return expectations are slightly south.
So because those return expectations are slightly
south, so too are the trajectories of your funded
ratios over time.
All right. And then on page 24, I'm sorry, the
next slide you can see the net outflow analysis.
Net outflow is defined as the benefit payments less
contributions as a percentage of the market value of
assets. The reason we look at the net outflow
analysis is because this is a good indication as to
whether there will be significant drawdown in the
value of the assets over the course of the
projection period.
Once we start getting into the 10 percent
range, that's where we start to really take notice
of the fact that you have a fairly substantial
1
2
3
4
5
6
7
8
9
10
11
12
13
14
15
16
17
18
19
20
21
22
23
24
25

39
ACCURATE STENOTYPE REPORTERS, INC.
drawdown. And if that's the case, that might
implicate the nature of the liquidity of the fund.
So we want to make sure that we're staying well
south of that.
Now, I'm going to focus again on the current
policy, the middle picture. You can see that the
net outflows for starters are around 4 percent.
That tells me that the benefit payments, less
contributions, divided by the asset value, 4 percent
net outflow for starters.
You can see that it, by and large, over the
course of the 30 year period, trends sideways in the
expected case. I'm looking at the dotted line.
It's right around 4 or 5, 6 percent over the course
of the next 30 years. All manageable in the
expected case. In the best of times, you can see
that net outflows move to almost zero. And in the
worst of times, you can see that start to trend
higher.
You'll notice that 30 years out in the worst
case -- I'm looking at the 95th percentile, you do
cross the 10 percent threshold. But it's a very low
probability, 5 percent probability of crossing that
10 percent threshold, and that's 30 years away. We
wouldn't view that as a substantial problem.
1
2
3
4
5
6
7
8
9
10
11
12
13
14
15
16
17
18
19
20
21
22
23
24
25
40
ACCURATE STENOTYPE REPORTERS, INC.
Although, if the time came, you'd want to make sure
you kept your eyes on it.
All right. And then just to close on the
economic cost over the various periods, I'm looking
at the economic cost over 1, 5, 10, 15 and 30 year
horizons on the next slide. It is interesting
because here we're looking at your risk versus
reward, but now we're talking about economic risk
versus reward. Recall we're defining economic cost
as the present value of contributions, plus any
shortfall at the end of the projection period.
And in looking at these curves, it is
interesting. The one year curve is the orange
curve. It's fairly flat. What is that telling us?
It's telling us that -- oh, and by the way, the left
end of this curve is a zero percent return-seeking
portfolio. The right end of the curve is a 100
percent return-seeking portfolio.
And you can see that if you were to move from a
zero percent return-seeking portfolio to a
100 percent return-seeking portfolio, there wouldn't
be that much cost reduction over the next five
years, but there would be considerable risk added.
So that's -- the implication of a flat curve
tells me that there's not a lot of reward but there
1
2
3
4
5
6
7
8
9
10
11
12
13
14
15
16
17
18
19
20
21
22
23
24
25

41
ACCURATE STENOTYPE REPORTERS, INC.
is extra risk with the heavier allocation to
return-seeking assets. But it is interesting to
note what happens. As you increase the time horizon
from one year to five years, you'll notice the curve
gets a little bit more vertical, to 10 years and it
gets more vertical. Fifteen it gets more vertical
still. And by the time you're at 30 years, you're
almost looking at a straight line up and down.
What is that telling us? It's telling us that
while you might not be incentivized to take risk
over a one year period, you certainly do appear to
be incentivized to take risk over a 30 year period.
The heavier return-seeking allocations over a 30
year period offer considerable reward without a
whole lot of extra economic risk. Now, that's not
the case if you're looking at shorter time horizons.
Ultimately, it's a question of, are you looking
at a long-term or a short-term. And the real answer
is that it's going to be a blend of both short-term
and long-term concerns, primarily long-term.
However, just note that the short-term can be
particularly painful in the worst of times, as we
saw in that 2008, 2009 time period.
Finally, on page 26 we've stress tested what
the equity risk premium might look like and how it
1
2
3
4
5
6
7
8
9
10
11
12
13
14
15
16
17
18
19
20
21
22
23
24
25
42
ACCURATE STENOTYPE REPORTERS, INC.
might implicate the economic results. And so here
we've effectively taken a plus or minus 1 percent on
that equity risk premium. And so where you'll note
the 3.62 percent was the expectation from the four
investment advisers, you'll note that if the equity
risk premium was 4.62 percent, you'd have a more
vertical display, which tells me that the more
vertical, again, the more incentivized you are to
take risk. And if the equity risk premium was 2.62
percent, or minus 1, that would be a more horizontal
and therefore less incentive to take risk.
So here's a graphical representation of, as
that equity risk premium changes over time, as that
equity risk premium assumption were to change, it
will demonstrate quantitatively more or less
incentive to take risk in the portfolio.
And on the next slide, some shortfall analysis
to balance kind of the long-term view with some of
the shorter-term concerns. Here we're looking at
probabilities of falling below some key funded ratio
thresholds over the next five years.
And just to say it, I'm going to focus on the
current policy. If you look at the graph,
81 percent current policy, it has a 29.6 percent
probability of falling below 70 percent funded over
1
2
3
4
5
6
7
8
9
10
11
12
13
14
15
16
17
18
19
20
21
22
23
24
25

43
ACCURATE STENOTYPE REPORTERS, INC.
the next five years, 15.8 percent probability of
falling below 60, and a 6 percent probability of
falling below 50 percent funded.
Here you can see that the higher return-seeking
assets will implicate the probability of falling
below 50 percent over the next five years. So for
example, if you were to move to a 100 percent
return-seeking portfolio, you'll notice that the
probability grows from 6 percent to 9 percent of
falling below 50 percent funded. So there is a risk
associated with a heavier return-seeking allocation.
All right. The next section --
MS. DOYLE: Do you mind --
MR. KIVARKIS: Please.
MS. DOYLE: Do you mind if I make one quick
comment? So the reason that we've shown you a
couple different types of analysis, so we showed you
the economic cost analysis over a number of
different time periods -- and, again, if you look at
the 30 year, it indicates that you should take more
risk, that you're getting reward for very little
incremental risk, so why wouldn't you do that.
And part of the reason, part of where we get
into the science of the -- or the art of this is
with the shortfall analysis, that sort of indicates,
1
2
3
4
5
6
7
8
9
10
11
12
13
14
15
16
17
18
19
20
21
22
23
24
25
44
ACCURATE STENOTYPE REPORTERS, INC.
okay, but we also have to remember that there are
2008s and there are 2001s, and so we need to
understand what the implications are of taking more
risk.
So that's why we showed you a number of
different analyses, and we sort of have to blend
them all together because they all tell a slightly
different story.
And we also want to consider the current market
environment. The equity risk premium that we're
showing you is 3.6 percent. Interest rates have
gone up quite considerably over the last couple of
months, and so that's not necessarily baked into
this analysis. If we did that, our equity risk
premium may be slightly lower. And so then that
indicates that maybe there isn't a reason to take
additional risk.
So I just want to make sure that we kind of
tied this all together, because I know there's a lot
of numbers and a lot of charts. But that's the
reason for the number of different analyses. Are
there any questions before we move on? I know there
was a lot of data there and a lot of analysis.
Okay, great.
MR. KIVARKIS: Fantastic. So the next section
1
2
3
4
5
6
7
8
9
10
11
12
13
14
15
16
17
18
19
20
21
22
23
24
25

45
ACCURATE STENOTYPE REPORTERS, INC.
is benchmarking versus peers. I'm just going to
cover the highlights here. The first slide in this
section, comparing the asset allocation versus other
public peers. There are just a couple of noteworthy
items on the first page.
A 59 percent what we call equity allocation for
FRS, compare that to some of the peers. You appear
slightly higher than other peers in the large public
pension space, also slightly higher than Aon
Hewitt's public peer average, but frankly pretty
darn close. We're talking about 59 percent versus a
range of 55 to 57 percent. Pretty close.
Slightly lower in terms of fixed income
exposure. About the same in terms of real asset
exposure. And then other diversifiers, you're a bit
higher than the average, largely due to that
strategic fund. But pretty close in terms of the
asset allocation, when comparing your asset
allocation to peers.
If you look at the next slide, at the expected
returns, you can see that there was an effort to --
the red line is your assumption for the expected
return on assets. And you can see -- this is the
actuarial assumption, by the way. You can see how
that's dropped from 8.0 percent down to 7.75, down
1
2
3
4
5
6
7
8
9
10
11
12
13
14
15
16
17
18
19
20
21
22
23
24
25
46
ACCURATE STENOTYPE REPORTERS, INC.
to what's now 7.5. Fiscal 2016 was still 7.6, I
believe. But you're now at 7.5.
And you can see how that compares to the
universe of public pension funds. You can see that
public pension funds also dropped from 8, albeit a
little bit later than you did, but the trend has
continued, all the way down to 7.5. You should be
right on top of the median, which is nice to know.
In terms of demographics, the demographics of
the U.S. population has aged. That's true in
pension funds. It's true in the Florida plan as
well. So you can see that the percentage of actives
to non-actives has decreased. And that's true as
populations generally age. You have effectively
more retirees and as a percentage of your total. So
here you can see the trend is fairly similar. If
anything, the Florida plan has aged slightly more
quickly than the field, but very close.
When we look at the next slide, the funded
ratio, this is a great story, I think, in terms of
the strength of your system versus others. Your
system shows a north of 100 percent funded ratio
prior to 2009 and then south of 100 post-2009,
albeit still well above average. You can see that
you're in the top quartile of funded ratios among
1
2
3
4
5
6
7
8
9
10
11
12
13
14
15
16
17
18
19
20
21
22
23
24
25

47
ACCURATE STENOTYPE REPORTERS, INC.
public pension funds. So great story there.
And then in terms of contributions made versus
peers, you can see that by and large Florida has
made around 100 percent of the funding, the
actuarial funding requirements over the course of
the last 15 years. There was a period there, 2011,
2012, 2013, where it was south of 100, but that was
short and moved right back to the 100 percent range
in 14, '15, '16. All right. So, again, some good
news.
And this is important, right, because it's --
it's important because your assets grow with those
two key components. And what we found was the plans
that are the most healthy are the ones that have
good performance and good funding into their
programs. The ones that are less healthy are the
ones that have not as strong performance and/or not
funding in the actuarial calculated contribution.
And so it's important to have both. And if you have
both, that's a recipe for success.
All right. So on to the summary and
conclusions. The next page, the summary of results
shows a big table of costs, contributions and
funding ratios over the course of the next 30 years,
with relationships that you'd probably expect. That
1
2
3
4
5
6
7
8
9
10
11
12
13
14
15
16
17
18
19
20
21
22
23
24
25
48
ACCURATE STENOTYPE REPORTERS, INC.
is, contributions will go down as return-seeking
assets or the riskiness of the portfolio goes up.
But of course the risk goes up as well. The
downside can be more severe as well.
If we're looking at the expected contributions
going into the plan over the next 30 years, present
value, $66 billion expected. But in the worst of
times, that could be as much as 115.9 billion.
Funding ratio, if we're looking at the expected
case, that's 80 percent expected funded ratio 30
years out with the current policy. In the worst of
times, that is a 5th percentile outcome. It could
be as low as 23 percent. And so in the worst of
times, that's a 1 in 20 type of event over the next
30 years, you could have substantially lower funded
ratios than you have today. We don't think that's
likely. It's a very low probability of occurring
but a probability nonetheless.
And if we look at the next page, just to kind
of bring it all home and restate, the bottom line on
top, which is now the bottom line on bottom, again,
breaking it into the two key components that I
highlighted at the beginning in terms of the
investment analysis and the asset-liability
projection analysis. In terms of the investments,
1
2
3
4
5
6
7
8
9
10
11
12
13
14
15
16
17
18
19
20
21
22
23
24
25

49
ACCURATE STENOTYPE REPORTERS, INC.
we think that the portfolio is well constructed,
81 percent return-seeking assets. It's well
diversified and well constructed.
The equity risk premium has continued to drop,
and 3.62 percent is less than it was last year, 3.72
percent last year. And as a result, the asset
returns have dropped, and so the asset returns,
6.44 percent, not expected to keep pace with the
liability, with the actuarial assumed interest rate
of 7.5. And that has implications particularly at
the front end of the projections, as that funded
ratio started to trend lower before leveling off.
And so that's really the first point in terms
of the asset-liability projection analysis, is the
funded ratio is effectively projected to go
sideways, that there is actually an initial step
lower before trending sideways over the course of
the projection period.
You'll note, if you compared to your last year,
you'd note that that trajectory is slightly south,
again, because the assets -- the projected asset
returns are slightly south of where they were last
year. It all boils back down to the assumptions.
And of course, if you think about the
risk-reward trade-off, the longer time horizons
1
2
3
4
5
6
7
8
9
10
11
12
13
14
15
16
17
18
19
20
21
22
23
24
25
50
ACCURATE STENOTYPE REPORTERS, INC.
incentivize more risk taking. Of course, you as a
group should consider the long-term needs with the
short-term risks. And most public pension funds
have decided that they want to be focused on the
long run and for that reason tilted towards the
higher end of the spectrum, albeit not all the way
because there are short-term needs that they need to
consider as well.
With that, I will pause and see if there are
additional questions.
MR. COLLINS: Does anybody have any questions?
I have a couple of questions, if you don't mind,
Ash.
MR. WILLIAMS: Fire away.
MR. COLLINS: So if you were to hand us -- I
think going back to page 17, where you show the
asset-liability profile as of July 1st, and I guess
the liability hurdle rate, I guess that's the total
amount of our deficit. And if it's not, let me
know. But if somebody handed us a check today for
$15.3 billion, tomorrow we would be underfunded via
our return -- our real returns versus what our
liabilities are. Would that be a correct statement?
MR. KIVARKIS: So the 15.3 is how much the
liability is growing every year. So in other
1
2
3
4
5
6
7
8
9
10
11
12
13
14
15
16
17
18
19
20
21
22
23
24
25

51
ACCURATE STENOTYPE REPORTERS, INC.
words --
MR. COLLINS: Okay. I get it. So instead of
that then, so go back to my premise without the
dollar amount. So if the premise is, let's say that
the deficit today is $30 billion. If somebody
handed us a check for $30 billion today, tomorrow we
would be less than 100 percent, or in a week or in a
month or something, just by virtue of what our
return long-term horizon is versus what the
liability percentage is. Is that right?
MR. KIVARKIS: That's right. The current
deficit as of July 1 of '17 was 24 billion. If
somebody were to give you a check for 24 billion
such that you had 178 billion of assets and 178
billion of liabilities, in theory the assets would
still be growing 1 percent less than the
liabilities. And for that reason, you would expect
that, a year out, you'd have a funded ratio not of
100 but of 99.
MR. COLLINS: So how much of that is compounded
by the ratio that you gave us of active versus
beneficiaries falling?
MR. KIVARKIS: That's all baked into the
amortization. So that shouldn't -- the demographic
makeup shouldn't have a major implication on the
1
2
3
4
5
6
7
8
9
10
11
12
13
14
15
16
17
18
19
20
21
22
23
24
25
52
ACCURATE STENOTYPE REPORTERS, INC.
progression of the funded ratio over time. If
anything, there's less stress on the liability
growth rate because you have fewer actives relative
to the field that are earning like new benefits,
which means the liability growth rate, if anything,
would be lower.
MR. COLLINS: Right. So the only way to
overcome this is to have more of our assets
investment seeking, but based on the scenarios that
you run in your analysis, that brings a much higher
likelihood of having shortfalls. So there's
really -- as I look at the data, there's really not
much we can do about it. It really has to be
adjusted on the spend side. Is that a correct
assumption?
MR. KIVARKIS: Well, I think what you're -- the
picture you're painting, I think, is certainly
valid. Ultimately it's a question of, look, my
liability is growing at 15.3 billion per year. I
want my assets to grow at 15.3 billion per year to
keep pace. How am I going to accomplish that is one
of two ways. Right? It's either investment
performance or it's funding or it's some combination
thereof.
And so if you're locked in on your investments,
1
2
3
4
5
6
7
8
9
10
11
12
13
14
15
16
17
18
19
20
21
22
23
24
25

53
ACCURATE STENOTYPE REPORTERS, INC.
then effectively the makeup or the fudge factor, if
you will, will be funding. And we actually see that
come into play in the projections. We're seeing
that the funding has to ramp up from 10 percent to
16 percent to keep pace over time. So we do see
that happening. It's just not an immediate thing.
It happens over time.
MR. COLLINS: Right. So, Ash, my last comment.
So going back to the ambassador's original question
and your answer to it, the only way that this can be
combated is really in the conference that you do
with -- I think you do it annually, or is it
biannually -- with the revenue estimating
conference.
MR. WILLIAMS: That's correct. I mean, that's
where this comes from. I think it's also helpful to
look at the history. And to your point, it is a
funding solution. And I think there is some
relationship between the current amount of
underfunding and what happened when some years ago
the funding level peaked at 118 percent, and there
was a conscious decision taken by the legislature to
deliberately reduce funding and provide partial
contribution holidays to member employers over a
period of about a decade that resulted in an
1
2
3
4
5
6
7
8
9
10
11
12
13
14
15
16
17
18
19
20
21
22
23
24
25
54
ACCURATE STENOTYPE REPORTERS, INC.
aggregate -- and, John, I think the number is about
12 billion. Is that right? About $12 billion less
in contributions was made over that period than
otherwise would have been made. Then you came to
2008, and you suddenly had underfunding on a mark to
market basis.
If you look at aggregate pension contributions
where they are today for member employers of the FRS
relative to where they've been in years past, I want
to say you'd have to go back to a period of about
2010 to see them lower than where they are today.
So the idea that contributions could increase a
bit to get this situation straightened out over time
or to maintain it on a sound basis is not crazy at
all, and it should not be burdensome.
And if you look at, as Moody's, the credit
rating agency, has done, if you look at all the
pension plans, state plans across the country,
normalize their data for funded status, et cetera,
et cetera, fiscal years, Florida's funding level and
more importantly the net metric that Moody's creates
for looking at the cost of public pension funds is
what they call net pension fund liability, and they
look at that on a total economy basis for each state
and on a per capita basis.
1
2
3
4
5
6
7
8
9
10
11
12
13
14
15
16
17
18
19
20
21
22
23
24
25

55
ACCURATE STENOTYPE REPORTERS, INC.
Florida's is one of the lowest in the country.
I want to say it's the third lowest in the country,
something like that. And when you add to that the
fact that our economy is a growth economy and our
population is growing, as opposed to a lot of other
states that have mature pension plans, we're in far,
far better shape to deal with this than most states.
MR. COBB: Ash, in your introductory comments,
you talked about the legislature made the
recommended. What was that number?
MR. WILLIAMS: I don't know exactly what the
number is. Frankly, to me, it's more important that
they hit the actuarial target than exactly what the
number is. That's the way we think about it,
because what the exact number is will move around
year to year, but the fact that it's the right
number per the actuaries is what matters to us.
MR. COLLINS: But in that regard, I don't know
that it's the right number. Right? So if the right
number is based on a 7.5 percent assumed return,
then the number that that spits out, if we're
actually performing less than -- well less than
that, the number isn't, quote, right. It's just a
number.
MR. WILLIAMS: Well, with all of this, what you
1
2
3
4
5
6
7
8
9
10
11
12
13
14
15
16
17
18
19
20
21
22
23
24
25
56
ACCURATE STENOTYPE REPORTERS, INC.
have to consider is you're talking about long-term
information. So data points of a single year are
just that. They're data points for a single year,
and you shouldn't fixate on them.
I think the other thing that we should keep in
mind in our consideration and discussion of this
subject matter is that we're looking at it in terms
of the expected return and related risk of any mix
of risk assets and non-risk assets, and we're
looking at it in terms of benefit cost and growth of
benefit cost.
There's a third variable here that is in fact
the most critical variable to public pension funds
that get in real trouble, and this is proven through
decades of observation, and that is funding. So the
fact that I opened this conversation by saying the
Florida Legislature fully funded both the normal
cost and the actuarially indicated contribution to
unfunded liability, that in and of itself, believe
it or not, is exceptional if you look across other
states.
The vast majority of states, think of
Pennsylvania, Connecticut, New Jersey, et cetera,
those that have real chronic and acute underfunding
problems didn't get there because they missed their
1
2
3
4
5
6
7
8
9
10
11
12
13
14
15
16
17
18
19
20
21
22
23
24
25

57
ACCURATE STENOTYPE REPORTERS, INC.
asset mix, and for the most part, amazingly, they
didn't even get there because they had gold-plated
benefits. They got there because they just never
contributed to the plan. And we don't have that
problem.
MR. COLLINS: Look, I agree with that. The
issue is, if you go -- I'm trying to find the chart
on the right page. Even with that, as our
80 percent or 81 percent return-seeking portfolio,
it moved a little south this year. Even with that
full funding last year, we still moved a little
south this year, and we're going to move a little
south next year.
MR. WILLIAMS: Part of what you're seeing there
is the way several years of variant behavior can
affect you on a longer-term basis. Here's the
variant behavior I'm talking about. Going back over
the 40-plus years of history of the Florida
Retirement System, to my knowledge, there are
exactly three years out of that entire period where
the legislature did not fully fund normal cost, and
to the extent there was an unfunded liability -- and
there's not always been one. There was a very big
one at the onset of the FRS, and then it was
eliminated in the late nineties and we started
1
2
3
4
5
6
7
8
9
10
11
12
13
14
15
16
17
18
19
20
21
22
23
24
25
58
ACCURATE STENOTYPE REPORTERS, INC.
becoming more and more overfunded.
But the only three years they didn't fully fund
those two contribution levels, normal and unfunded
actuarial contribution, were the three years
immediately following the great financial crisis.
And even then, they fully funded the normal cost,
and they made a partial contribution to the unfunded
liability.
And in fairness to the legislature, the State
was broke, and they were scratching around looking
for nickels in the sofa to balance the budget. So
the fact that they didn't step up fully for those
three years, but they stepped up an awful lot, and
compared to most of their peers, even in those three
years, they did better than most of their peers.
So I think part of what we're seeing on our
funding levels is the consequence of that. Aon can
opine on that more capably than I, but I think
that's true.
MS. DOYLE: Yeah. I mean, everything you've
said is true, in terms of how you compare to other
states. And, Mr. Chairman, to your comment about
the discount rate, 7.5 percent, certainly that
impacts the contribution rate. Encouragingly, yes,
it's come down very small increments over the last
1
2
3
4
5
6
7
8
9
10
11
12
13
14
15
16
17
18
19
20
21
22
23
24
25

59
ACCURATE STENOTYPE REPORTERS, INC.
couple of years, but the fact that it's coming down
is a benefit in terms of trying to maintain or keep
up with the liability growth rate.
MR. COLLINS: Yeah. We can never get around
the third bullet in the summary and conclusions, as
far as I'm concerned, where it says, Asset returns,
6.44 percent, are not expected to keep pace with the
actuarial assumed rate of return of 7.5 percent. I
mean, it's like having a 106 basis point load on a
mutual fund you're buying every year.
MS. DOYLE: Right. And then this is also --
what Ash had mentioned earlier is the tension
between the expected return on assets and the
liability discount rate for public pension plans,
because the liability discount rate is a static
number. It doesn't change very often. You don't
want it to. That would make contributions way too
volatile. And it also tends to be a much
longer-term projection period for -- or outlook,
whereas the 6.4 percent expected return is a 10 year
expected return. So you have a little bit of a
mismatch in terms of timing as well.
MR. COLLINS: My point is, we can only do so
much. The FRS or the SBA can only do so much. If
you have a portfolio that we believe is well
1
2
3
4
5
6
7
8
9
10
11
12
13
14
15
16
17
18
19
20
21
22
23
24
25
60
ACCURATE STENOTYPE REPORTERS, INC.
constructed with 81 percent return-seeking assets
and your asset returns are not expected to keep pace
with what the legislature is using as the actuarial
rate of return and our expected real return falls
short of the investment policy target, whatever
amount of money the legislature gives us is going to
continue to take that line down a little bit every
year in funded.
Now, are we doing better than our peers?
Absolutely. Is the legislature doing better than
other legislatures? Absolutely. But it doesn't
change the fact that we're on a -- you know, I think
Phil is being nice when he says it's going sideways.
That's my last point, Ash.
MR. WILLIAMS: Well taken.
MR. COLLINS: Anybody else have any questions
on this, or comments?
MR. COBB: Yeah. My question would be, how
many in the legislature have heard this presentation
and have sat through our presentation?
MR. WILLIAMS: I think roughly the same number
that are with us today.
MR. COLLINS: There's going to -- it's setting
up a reckoning, and it could be a long time from now
or it could be a short time, but there will be a
1
2
3
4
5
6
7
8
9
10
11
12
13
14
15
16
17
18
19
20
21
22
23
24
25

61
ACCURATE STENOTYPE REPORTERS, INC.
reckoning. All right. Let's do our benchmark
review. Kristen, go ahead.
MS. DOYLE: Okay. Thanks. Let me just get
there on the slides. So every couple of years, one
of the things we do is review all of the benchmarks
that are used for the total fund asset classes. So
that's what we've done this year. I think the last
time we did this was in 2014. We only have one
recommendation, so I'm not going to spend a ton of
time on this review. There's a couple of slides
that I'll walk through, but also know that there is
the longer report that we wrote in your packet of
information.
So if we look at just the executive summary
here, so the report starts out by defining what
characteristics make a benchmark good. And you can
see those listed here. They're fairly intuitive.
The public market benchmarks that we'll talk about
are going to fulfill all of these requirements. But
once we start to get into the private markets, they
will fulfill some but not all of these requirements.
And so that's just really the nature of the
private markets. We're challenged with liquidity
and valuation frequency and other factors, when we
look at private markets, that make those markets
1
2
3
4
5
6
7
8
9
10
11
12
13
14
15
16
17
18
19
20
21
22
23
24
25
62
ACCURATE STENOTYPE REPORTERS, INC.
more difficult to benchmark. We just want to
acknowledge that those are challenges and then we do
our best to ensure that we have the appropriate
measures for performance for those particular parts
of the asset allocation.
So on this slide here you can see an overview
of each of the major asset classes for the total
fund and their respective benchmarks. And, again,
as I mentioned, there's only one recommendation for
change, which is to the cash benchmark, which I will
go through in just a few minutes. So let me just
walk through each of the major asset classes really
quickly.
So here you can see the global equity and fixed
income benchmarks. So the global equity benchmark
today is the MSCI All Country World Investable
Market Index. This is the benchmark for the -- this
is the deepest benchmark that exists for the global
equity markets. It covers 99 percent of the
opportunity set, and it's the most widely used
benchmark by investors to benchmark active global
equity mandates as well as to manage passive global
equity mandates. So no recommendation for a change
here for this particular benchmark.
For the fixed income benchmark, it's now the
1
2
3
4
5
6
7
8
9
10
11
12
13
14
15
16
17
18
19
20
21
22
23
24
25

63
ACCURATE STENOTYPE REPORTERS, INC.
Bloomberg Barclays suite of indices. And so this is
also the most widely used benchmark provider for
fixed income assets. The suite of aggregate
benchmarks provides the most coverage and has a very
sound construction methodology, which is important
for both equities and fixed income, but in
particular it's very important for the fixed income
markets, to make sure that you have a sound
philosophy for how you construct the benchmark.
So, again here, we're not recommending any
change. Recall that we're using the intermediate
aggregate bond index as opposed to the aggregate
bond index. And that was a conscious decision that
was made a number of years ago, I think in 2010, to
shift the duration of the fixed income portfolio
slightly lower than the aggregate.
MR. COBB: So a question on that. Today, what
is our average maturity actual and what is our --
what is the benchmark maturity?
MS. WOJCIECHOWSKI: The intermediate ag is four
and a half years, and that's roughly a year and a
half short of the ag. So we cut out the 10 to 30
maturities.
MS. DOYLE: And I think the actual portfolio
matches the -- typically matches the duration of the
1
2
3
4
5
6
7
8
9
10
11
12
13
14
15
16
17
18
19
20
21
22
23
24
25
64
ACCURATE STENOTYPE REPORTERS, INC.
index pretty closely.
For the real estate asset class, so this is a
blended benchmark, so let me just go through this
quickly and explain the different components. So
for the core part of the portfolio, we're using
what's called the NCREIF ODCE index, which
represents a universe of core real estate equity
managers and has rules for inclusion in that
particular benchmark that ensures appropriate
representation of the actual core equity real estate
market, things like you have to be 95 percent
invested in the U.S., 80 percent in real estate
equity, and you can't have more than 40 percent
leverage. So it's a very well-controlled benchmark.
It's a peer universe benchmark. So we use that for
the core part of the portfolio.
For the non-core part of the portfolio, we're
adding a premium onto the ODCE index to indicate
that because we're taking more risk and we're in
value added and opportunistic investments, we would
expect that we would outperform a core benchmark,
higher levels of leverage and things like that. So
we've got that plus 150 basis points over the NCREIF
ODCE.
And then there is a REIT component to the real
1
2
3
4
5
6
7
8
9
10
11
12
13
14
15
16
17
18
19
20
21
22
23
24
25

65
ACCURATE STENOTYPE REPORTERS, INC.
estate portfolio. And you'll hear a lot more about
that today. And so we're benchmarking that to the
broadest measure of the global REIT index, which is
the FTSE NAREIT developed index.
We changed this benchmark a couple of years
ago, took a deep dive into the portfolio to make
sure that we had the right mix, and so there's no
additional recommendations for the real estate
benchmark either.
Here is the private real asset benchmark peer
data. So this isn't a reason to necessarily have a
benchmark based on what your peers are doing, but it
is interesting to see how you stack up relative to
peers. And for real estate it's really kind of a
mix of what different funds, different public
pension plans are doing in terms of benchmarking
their real estate.
And it tends to be very dependent on the
composition of the real estate program, how much
core versus non-core is in the portfolio, how
aggressive the non-core program is, the maturity of
the program and other things. So you can just see
here that there really isn't a common practice.
What we would say is best practice is taking a look
at your portfolio and customizing a benchmark to
1
2
3
4
5
6
7
8
9
10
11
12
13
14
15
16
17
18
19
20
21
22
23
24
25
66
ACCURATE STENOTYPE REPORTERS, INC.
make sure you're reflecting the appropriate measure.
And then on private equity, so again, as I
mentioned, it can be very difficult to benchmark
these private components to the portfolio, private
equity being one. So we have two benchmarks for
private equity currently. We have the primary
benchmark, which is an opportunity cost benchmark of
the global equity index, which again is that MSCI
All Country World Investable Market Index, plus a
premium of 300 basis points.
So that premium, if you recall, has come down
over the years. It used to be at 600 basis points.
We've incrementally lowered that, as there has been
less of an ability to earn that type of a premium
over a global equity -- a public global equity
benchmark. We're not recommending a change today.
We took a long, hard look at whether we should
lower this number from 300 to something else, say
maybe 250 or something like that. But ultimately we
felt that the 300 BPs premium was appropriate for
some of the reasons that we've listed here, which is
that the history of the program is that it continues
to outperform the global equity index. There's a
significant fee advantage that the SBA gets from
being a large investor with an established private
1
2
3
4
5
6
7
8
9
10
11
12
13
14
15
16
17
18
19
20
21
22
23
24
25

67
ACCURATE STENOTYPE REPORTERS, INC.
equity program.
There's also, looking at peers to see whether
we're in line with peers -- again, we don't want to
make a decision solely based on what peers are
doing, but if you look at the next slide, you can
see that really the average is pretty close to that
300 basis points. It's come down slightly from when
we did this in 2014, but nothing notable. So we
felt that the 300 basis points continued to remain
appropriate. So no recommendation for a change
there either.
Then we also use a secondary benchmark for
private equity, which is a peer-based benchmark, so
this actually giving you a more apples-to-apples
comparison to other private equity funds that are
out there. It's a broad universe of private equity
funds across a number of different strategies.
You've got venture cap and buyout in that universe.
And so we like to look at that as a secondary
benchmark to gauge how the program is doing relative
to the opportunity set that's out there in the
marketplace.
And then second to last is strategic
investments. You heard a lot about strategic
investments at the December meeting. So the primary
1
2
3
4
5
6
7
8
9
10
11
12
13
14
15
16
17
18
19
20
21
22
23
24
25
68
ACCURATE STENOTYPE REPORTERS, INC.
benchmark here is the aggregation of those
individual fund level benchmarks. So there's a very
comprehensive process by which staff and consultants
select benchmarks for each of the different fund
investments that are made, because strategic
investments has such a wide range of strategies and
funds that it invests in. It invests in private
market structures and open-end structures.
So we think the best benchmark for that is the
aggregation of those individual benchmarks. But
then we also have a secondary benchmark, given that
the goal and one of the main objectives of that
particular part of the portfolio is to outperform
that long-term nominal target rate of return that
we've set of inflation plus 4.5 percent. So we want
to make sure that over long periods of time, we are
measuring to that benchmark as well. So that's why
we show that benchmark as a secondary. So, again,
no change there.
And then last is where we do have a
recommendation. So for the cash part of the
portfolio, the current benchmark is the iMoneyNet
money market fund index. So this is a peer
benchmark that's made up of a very wide range of
money market funds. Part of the reason to recommend
1
2
3
4
5
6
7
8
9
10
11
12
13
14
15
16
17
18
19
20
21
22
23
24
25

69
ACCURATE STENOTYPE REPORTERS, INC.
the change, a couple of things. One is that this
iMoneyNet money market fund index is not necessarily
investable, so you can't really go out and invest in
the entire benchmark itself.
We often have a disconnect between what the SBA
is actually doing in the cash portfolio and what the
characteristics of the iMoneyNet money market fund
index have. So a couple of things. One is that the
duration tends to be lower than what the typical
money market fund is managing to. And there are
asset-backed securities that are in the iMoneyNet
index that the SBA does not invest in in the cash
portfolio. So it causes a little bit of a
disconnect, and it makes it less appropriate, given
how the cash portfolio is being managed.
The other component to this is that for the
SBA, the cash portfolio really is for capital
preservation. That's the number one objective of
that part of the portfolio. So using a Treasury
index, which is the recommendation for the primary
benchmark, would be the three month U.S. Treasury
index, is a very comparable index, we think, given
that the objective of the portfolio is really to
maintain capital preservation and to not take risk.
But we still think that having a peer-based
1
2
3
4
5
6
7
8
9
10
11
12
13
14
15
16
17
18
19
20
21
22
23
24
25
70
ACCURATE STENOTYPE REPORTERS, INC.
benchmark would be beneficial to gauge how the cash
portfolio is doing relative to other cash funds.
And so we would recommend that we keep the iMoneyNet
as a secondary benchmark for cash. Any questions on
that recommendation?
MR. COLLINS: Does anybody have any questions?
MR. COBB: Yes. I have a comment and a
question.
MR. COLLINS: Go ahead, Ambassador.
MR. COBB: One of the good things about these
benchmark recommendations is they are simple and
they're easy to understand by all of our audiences,
the trustees, us as a committee and everybody. And
the only one that doesn't meet that, Steve, in my
perspective, is the real estate, which is really --
I mean, I have -- Les and I flew up together, and I
tried to remember our real estate benchmark, which
is impossible to memorize because it's so
complicated. So my question -- that's my comment.
My question is, why have we been so easy to
understand on all the other benchmarks and we have
come up with this impossible to understand and to
remember benchmark for real estate?
MR. SPOOK: Is that a question for me or for
Aon?
1
2
3
4
5
6
7
8
9
10
11
12
13
14
15
16
17
18
19
20
21
22
23
24
25

71
ACCURATE STENOTYPE REPORTERS, INC.
MR. COBB: Either one, anybody that can answer
that question.
MR. SPOOK: I know there's a lot of acronyms in
there and everything.
MR. COLLINS: Why is it that you're doing the
impossible?
MR. SPOOK: There's a lot of acronyms, but it
really comes down to two components. It's the
private market, which is based on the ODCE, and the
public market, which is, granted, a lot of letters,
FTSE EPRA NAREIT, but that is the most used global
diversified REIT index, and the ODCE is -- really
all we're doing for the non-core portion is adding
150 basis points premium to that because they have
higher expected returns. So it's really a two part,
with an adjustment to the non-core.
MR. COBB: I understand the rationale, because
I've asked the question before. My question today
was why don't we make it simpler. And as we look at
all of our other peers, they are so simple. Maybe
ours is more difficult. In fact, you've almost
convinced me that it's more difficult, particularly
with the 150 basis point increase. Why don't we try
to make it simple, as we've done all the rest of
them?
1
2
3
4
5
6
7
8
9
10
11
12
13
14
15
16
17
18
19
20
21
22
23
24
25
72
ACCURATE STENOTYPE REPORTERS, INC.
MR. WILLIAMS: Mr. Chair, can I help out here?
MR. COBB: Yeah.
MR. COLLINS: Please.
MR. WILLIAMS: So I think the short answer is,
you just said exactly the right thing, Ambassador.
If you look at all our peers, most of them are very
simple. That's because they are very simple. If
you look at their real estate portfolios, they don't
manage a principal book in-house like we do. So
what we've tried to do, particularly since we have
gone into the realm of alignment of professional
staff and other stakeholders in comp, we want to
keep everybody honest for what they're accountable
for and what their performance expectations are.
And part of what we do is if we did something
as a simple as what our peers do, it wouldn't fully
reflect what we do, and it would arguably give Steve
and his team more of a tailwind than they deserve,
because we have major advantages over our peers
because we do have a principal book that has a much
lower cost of operation and therefore a higher
profitability, for lack of a better term, than the
real estate books most of our peers have that are
all commingled funds, where they're paying fees,
carry, suffering the artificial time table,
1
2
3
4
5
6
7
8
9
10
11
12
13
14
15
16
17
18
19
20
21
22
23
24
25

73
ACCURATE STENOTYPE REPORTERS, INC.
suffering the burden of -- well, I won't say
excessive leverage, but that will be problematic in
and of itself.
But, anyway, we've tried to accurately reflect
every component of what we do in this benchmark.
And I admit it is more complicated than higher math.
But look at it this way. Nobody will ever hack it.
MR. SPOOK: I'm looking at the list of peers,
and I would take most of their benchmarks any day
because they're, frankly, easier to beat because
they don't have a risk premium in there for
non-core.
MR. KOCH: Mr. Ambassador, that's exactly what
I was going to say as well. The fact is is that a
lot of these portfolios, the underlying portfolios
of these peers don't match what these benchmarks
are, where your benchmark is in fact measuring, as
Steve just said, each one of the underlying
components of the composition of your portfolio. So
yours does to a much closer degree track the actual
risk that's inherent in the portfolio.
There is certainly a way that we could simplify
it. But I think today this really does track and
makes it much harder to beat and therefore a much
more realistic representation of what the
1
2
3
4
5
6
7
8
9
10
11
12
13
14
15
16
17
18
19
20
21
22
23
24
25
74
ACCURATE STENOTYPE REPORTERS, INC.
performance of those underlying components are.
MR. COBB: Okay. So let me challenge a little
bit more. Why don't we take global equity and break
it down into its component pieces of large cap,
domestic, mid cap, small cap, international,
developed, emerging markets, frontier, and give them
six different benchmarks and then an average of all
six?
I mean, I could take the argument that you have
for real estate and do it for each of these
portfolio managers. I've probably spent more time
on this than it's worth.
MS. DOYLE: No. I think it's a good point.
Part of the difference with global equity versus
real estate is that the global equity benchmark
we're using includes all of those components. There
isn't really a non-core real estate benchmark that
we can use today. So that's also part of the
problem, is that because real estate, especially
non-core real estate, is sort of a, quote, unquote,
newer asset class and something that institutional
investors haven't always invested in, we don't have
as great a benchmarks yet like we have in private
equity, like we have in fixed income and global
equity. So we're trying to work with what we've got
1
2
3
4
5
6
7
8
9
10
11
12
13
14
15
16
17
18
19
20
21
22
23
24
25

75
ACCURATE STENOTYPE REPORTERS, INC.
to make sure that we give the best measure possible
for what the SBA is doing in that portfolio.
MR. COBB: I give up.
MR. COLLINS: I don't see the white flag.
MS. DOYLE: The only other thing I just wanted
to make sure I close the loop on is the total fund
benchmark, which is, as you all know, all those
underlying component benchmarks we just talked about
at the policy weights that we've established for
each of the asset classes. And that is best
practice in terms of how to track and measure the
performance of the total fund.
MR. COBB: Do we need a motion to approve?
MR. COLLINS: I think we do.
MR. WILLIAMS: That would be appropriate.
MR. COLLINS: Are you making the motion?
MR. BENTON: Ash, Peter, what we plan on doing
is bringing the investment policy statement to the
June meeting for approval for the changes to the
cash benchmark.
MR. COLLINS: Okay. Everybody okay with that?
Okay. Anything else on that, Kristen?
MS. DOYLE: No. Thank you.
MR. COLLINS: All right. Steve, you know, I so
wanted to be there in person for this today.
1
2
3
4
5
6
7
8
9
10
11
12
13
14
15
16
17
18
19
20
21
22
23
24
25
76
ACCURATE STENOTYPE REPORTERS, INC.
MR. WILLIAMS: I think I know who diddled your
strut on your plane.
MR. COLLINS: Exactly. Go ahead, Steve. Real
estate review.
MR. SPOOK: Don't worry, Peter. There's a
slide on leverage. Good afternoon. I'm Steve
Spook. I'm the senior investment officer for real
estate. And with me today are Lynne Gray, senior
portfolio manager for principal investments.
MR. COLLINS: Could you speak up just a little
bit, Steve?
MR. SPOOK: Yeah. I'll put the mike closer.
And Michael Fogliano, senior portfolio manager for
externally managed portfolio. So I'm going to start
off today with a broad overview of the total real
estate portfolio, and then Lynne and Michael will
each do a deeper dive into their respective
portfolios.
So on the next page you see the org chart,
where I report directly to Ash Williams as executive
director and CIO. You see that real estate is
really divided into two kind of separate sections,
each reporting up to me, with Lynne Gray overseeing
principal investments, which is our direct-owned
portfolio, and Michael oversees externally managed,
1
2
3
4
5
6
7
8
9
10
11
12
13
14
15
16
17
18
19
20
21
22
23
24
25

77
ACCURATE STENOTYPE REPORTERS, INC.
which is our pooled funds and our REITs. Lynne has
four portfolio managers and an analyst reporting to
her, and Michael has two portfolio managers and an
analyst reporting up to him.
In this slide you can see that Ash, as
executive director and CIO, approves all major
decisions, which includes new managers, direct-owned
acquisitions, dispositions, financings, new funds,
IMAs, and joint ventures. And Kent Perez, as deputy
executive director, is consulted on all of these
major decisions, and his concurrence is required
prior to approval by Ash.
The Townsend Group is our real estate
consultant. And joining us today are Jack Koch,
Seth Marcus and Dick Brown. They are retained by
the executive director/CIO and provide the services
shown here. So they prepare all our performance
reports, investment provider monitoring and annual
reviews, all fund due diligence, research, and
projects as assigned.
I think we talked about this slide, so I'll
just keep going. So the reason we exist is, real
estate, we're designed to provide attractive
risk-adjusted returns, diversification for total
fund with low correlation to equities. We do have
1
2
3
4
5
6
7
8
9
10
11
12
13
14
15
16
17
18
19
20
21
22
23
24
25
78
ACCURATE STENOTYPE REPORTERS, INC.
an income focus, and theoretically we provide an
inflation hedge.
Within the private real estate portfolio, we
have two broad strategies, core and non-core. Core
has a quality, as you see there, primarily income
focused, institutional quality, and stabilized.
Non-core is, you know, more getting hands dirty,
lease-up, development, repositioning.
We consider core strategic because those tend
to be long-term holds or the base of the portfolio.
Non-core is more tactical. It's more of a buy it,
fix it and sell it, and therefore by definition more
of a short-term hold. Higher risk, but higher
expected returns.
So we've got a target of 85 percent per policy
for core and 15 percent for non-core. Within core
we can operate between 70 percent and 100 percent,
and currently we're at 83 percent and 17 percent for
non-core.
Target allocation for real estate is
10 percent. As of Q3 2017, we're 8.7 percent, and
we're roughly the same today. I described earlier
what principal investments and externally managed
were, and this is the breakdown between the two
within the portfolio, 63/37. And then within
1
2
3
4
5
6
7
8
9
10
11
12
13
14
15
16
17
18
19
20
21
22
23
24
25

79
ACCURATE STENOTYPE REPORTERS, INC.
externally managed, REITs is 10 percent of the total
portfolio, which is exactly what our target
allocation to REITs is. And we can operate within 5
to 15 percent for REITs.
Property type diversification, we're slightly
below the benchmark exposures. And the main reason
for that is our allocation to other, which includes
ag, student housing, senior housing, self-storage.
And our biggest underexposure in the main property
types is office. I'm perfectly comfortable with
that underexposure, given where we are late in the
real estate cycle.
Geographically, we're pretty close to benchmark
exposures, with the biggest underweight being in the
Midwest. We're perfectly fine with that as well,
seeing as the Midwest tends to be, one, a much
smaller market but a relative underperformer. And
the other category is our international.
And here we've got the leverage page, Peter.
So the one area of leverage that we have the most
control over is that third bar, principal
investments. And as you know, we recently increased
our permissible leverage in that portfolio from
25 percent LTV to 30 percent. These numbers here
that you see, where we're 21.7 in principal
1
2
3
4
5
6
7
8
9
10
11
12
13
14
15
16
17
18
19
20
21
22
23
24
25
80
ACCURATE STENOTYPE REPORTERS, INC.
investments, is as of Q3 '17. If you adjust for
transactions that have occurred since then, so
dispositions, acquisitions and actively putting
financing, very conservative financing on existing
assets, today we are at 28.3 percent. And note that
the leverage is 21.3 percent.
MR. COLLINS: You're still breaking up a little
bit, Steve, on me, when you go back and forth like
that. So I don't know if you're still a little far
from the mike, but you're going in and out.
MR. SPOOK: I just pulled it closer. Is that
better?
MR. COLLINS: Thanks. Yes.
MR. SPOOK: And real estate returns, we
continue to beat our benchmark over all time periods
by pretty good margins. Next is returns versus our
peers. And what this graph shows is 61
institutional real estate investors, SBA being in
the 83rd percentile. As the note on the slide says,
it's important to note all these plans have
different strategies, different leverage levels and
different risk appetites.
But I do think the next slide is more relevant
than the one I just showed because it shows all the
plans with real estate assets in excess of
1
2
3
4
5
6
7
8
9
10
11
12
13
14
15
16
17
18
19
20
21
22
23
24
25

81
ACCURATE STENOTYPE REPORTERS, INC.
$2 billion. And in that graph we rank, over the
five year period, number two. And that's 22
institutional investors.
So fiscal year 2017 through today, which the
fiscal year started July 1st, 2017, in principal
investments, we made acquisitions of $662 million.
I've got the breakdown on the slide. And
dispositions were 334, for a net increase of
332 million. And then you see the financing, which
has been pretty substantial. Some of it is still in
closing. And that's part of the adjusted leverage I
gave you on the previous -- couple of slides
previous.
And in pooled funds during that same time
period, we committed to five new pooled funds across
various strategies, for a total of 385 million. And
we rebalanced our core open-end portfolio and had
redemptions of 150 million. So unless there's any
further questions, I will turn it over to Lynne Gray
to do principal investments.
MR. COLLINS: I'm going to just hold any
questions I have until the end, but if anybody else
has any questions that they'd like to ask now before
Lynne starts, go ahead. Okay. Lynne.
MS. GRAY: Thank you. As Steve mentioned,
1
2
3
4
5
6
7
8
9
10
11
12
13
14
15
16
17
18
19
20
21
22
23
24
25
82
ACCURATE STENOTYPE REPORTERS, INC.
principal investments is the board's portfolio of
direct-owned real estate investments. It's actively
managed by real estate staff. As of September 30th
we had a gross market value of just over
$11 billion, with a corresponding net asset value of
$8.7 billion. Our primary objective within
principal investments is to meet or exceed our
benchmark, which is NCREIF ODCE.
And if you flip to the next slide, you'll see
how we've compared to our benchmark. Over the one,
three and five year period, we've outperformed the
benchmark. And while it's not shown on this slide,
we've even outperformed over the ten year.
Performance for the one, three and five year is
driven by our industrial portfolio, which has had
strong returns of in excess of 14 percent over the
one, three and five year periods of time.
The SBA has established investment portfolio
guidelines for managing and monitoring risk within
the portfolio, both at the portfolio level and the
asset level. Over the next series of slides, we'll
touch on each aspect of these guidelines, which
include strategy, property type, location, exposure
to single investment and investment managers.
As we've mentioned, principal investments has a
1
2
3
4
5
6
7
8
9
10
11
12
13
14
15
16
17
18
19
20
21
22
23
24
25

83
ACCURATE STENOTYPE REPORTERS, INC.
core strategy, with a primary focus of investing in
high quality, well-leased assets, well-located
assets, with credit quality tenants, stable
occupancy and income stream. We look for assets
that have the majority of the return based on income
rather than appreciation.
Our guidelines do allow up to 15 percent in
non-core, and currently we're at 9.3 percent
non-core. That's up just under 2 percent from a
year ago when we presented this presentation. Our
non-core portfolio consists primarily of development
today, which includes apartment, industrial and
office development.
On the next slide we'll show how the portfolio
is allocated among the different property types,
primarily four main property types, office, retail,
industrial and apartment. Our specialty sector
includes agriculture, self storage, senior housing
and student housing.
And as Steve mentioned earlier, our principal
investments leverage position is 21.7 percent. With
everything baked into the pipeline, we'll bring that
percentage up to 28 percent. In addition to what
Steve has noted, I will add that today our current
weighted average cost of debt is approximately
1
2
3
4
5
6
7
8
9
10
11
12
13
14
15
16
17
18
19
20
21
22
23
24
25
84
ACCURATE STENOTYPE REPORTERS, INC.
3.6 percent.
On the next slide you see the map with the dots
representing the locations for our commercial
properties. That includes industrial, office,
retail, multifamily and then even the specialty
sectors. We have a large concentration of the
portfolio on the West Coast, with 45 percent of the
net asset value on the West Coast, 30 percent East
Coast, and then approximately 20 percent in the
South, with the remainder in the Midwest.
One of the major changes that you may note from
last year with this slide is that we have a lot more
dots in Florida. And so subsequent to the
presentation last year, we closed on a self storage
portfolio, so most of those dots are represented by
self storage facilities within the state of Florida.
This map represents the markets we're in for
agriculture. Again, the West Coast, the majority of
the exposure is to permanent plantings, nuts,
apples, citrus. And then in the South and the
Midwest, those investments are primarily row crops.
The next slide shows how principal investments
compares to our benchmark by property type and by
location. And as you'll note, we're within policy
guidelines for exposures. And on the next slide it
1
2
3
4
5
6
7
8
9
10
11
12
13
14
15
16
17
18
19
20
21
22
23
24
25

85
ACCURATE STENOTYPE REPORTERS, INC.
shows manager concentration. We have a policy limit
of less than 30 percent exposure to our investment
managers. Currently we work with eight separate
account managers. Three of those managers manage
our specialty property types. And the remaining
five invest for us in all property types.
This slide shows our metro and investment
exposure. Our top ten metros are shown on the left
side. This represents just under 60 percent of the
net asset value for our portfolio in the top ten
metros. On the right side you see our top five
largest assets in the portfolio based on net asset
value.
And this slide brings it all together. It
shows all property types, the number of properties
per property type along with the net asset value and
other metrics associated with each property type.
We invest -- we have just over 70 investments in the
portfolio and 250 properties within those
investments. Again, a market value of $11 billion,
with a net asset value of 8.7 billion.
This slide shows operational metrics for the
stable properties in the portfolio. On the upper
left side you'll see our average occupancy. On the
lower left you'll see the commercial lease
1
2
3
4
5
6
7
8
9
10
11
12
13
14
15
16
17
18
19
20
21
22
23
24
25
86
ACCURATE STENOTYPE REPORTERS, INC.
expirations. This includes office, industrial and
retail property types. And then on the right you'll
see net operating income. And this is for
properties that are stable properties that have been
held for the 12 months ending December 31st, '17.
As I mentioned earlier, our portfolio is
actively managed by staff. And in the upper left
side you'll see what's involved with a portion of
that active management. We determine investment
strategy. We decide on acquisitions and
dispositions. We manage the assets once we close on
them, and we also make decisions on financing
activities.
On the lower left side you'll see that we work
with third-party service providers. Our investment
managers are an extension of staff. Property
management and leasing companies are the groups that
are on the ground managing day-to-day operations of
the business or property. And then we also work
with investment brokers for acquisitions,
dispositions and even financings.
On the right side you'll see the various groups
within the board that are also involved with
management of the entities. For each title-holding
entity, there's a board of directors. That is made
1
2
3
4
5
6
7
8
9
10
11
12
13
14
15
16
17
18
19
20
21
22
23
24
25

87
ACCURATE STENOTYPE REPORTERS, INC.
up of the COO, the general counsel and the SIO of
real estate here within the board. They oversee the
audit and tax program. Our SBA general counsel is
involved with all aspects of the portfolio, not just
legal matters but acquisitions, dispositions,
financings and other matters that may come up in the
portfolio.
And then, finally, our accounting group
oversees and manages the valuation program. SBA
accounting works with a third-party service provider
for managing both the external appraisal and
internal valuation process. Each property within
the portfolio is valued throughout the year and has
either an internal or an external on a quarterly
basis.
As part of our active management internally,
each investment has an annual hold/sell analysis.
And if acquired, we ask for a hold/sell analysis on
an interim basis. We take into consideration the
individual investment performance, market
conditions, whether it be space fundamentals or
capital markets, and then we layer that with overall
portfolio considerations to determine if the
particular investment is a disposition candidate or
if we should continue to hold the property in the
1
2
3
4
5
6
7
8
9
10
11
12
13
14
15
16
17
18
19
20
21
22
23
24
25
88
ACCURATE STENOTYPE REPORTERS, INC.
portfolio. And occasionally we go through this
exercise, and then we have someone who comes along
and makes an insane offer on a property that we
can't pass up, and so we take their money.
The next series of slides, really, are just
photos that represent the various properties that we
have in the portfolio. And so I'll just make a few
comments on those, and please stop me if you have
any questions. The apartment portfolio, we have
garden, mid-rise and high-rise properties within the
portfolio, over 6,000 units, and this represents
20 percent of the principal investments portfolio.
Average rents range from just under $2 a square foot
to well over $6 a square foot.
Industrial, we have nine investments, 54
properties in total, market value of $1.7 billion,
and roughly 14 percent of principal investments.
And as I mentioned earlier, the industrial portfolio
has been one of the top performers over the one,
three and five year period, with strong returns of
14, 16 and 15 percent respectively for those periods
of time.
Our office portfolio, 16 commercial office
buildings, eight medical office buildings, which are
included in the office portfolio. And this
1
2
3
4
5
6
7
8
9
10
11
12
13
14
15
16
17
18
19
20
21
22
23
24
25

89
ACCURATE STENOTYPE REPORTERS, INC.
represents just under 30 percent of principal
investments.
Our retail portfolio, 13 investments, just
under 20 percent of principal investments. Student
housing, we have 11 properties in our student
housing portfolio within ten universities throughout
the United States. We have just over 2600 units
with 7,000 beds.
Senior housing, one thing to emphasize on
senior housing is that we do not take operating risk
at the senior housing facilities. They're triple
net leased to operators. And so we are not managing
the properties on a day-to-day basis.
Agriculture, we have both permanent and row
crops within the portfolio. One of the recent
additions to our portfolio has been a pecan grove in
South Georgia.
And then, finally, self storage, which I had
mentioned that this was a newer acquisition for us,
a joint venture, and not our first venture with self
storage. Our first investment in self storage, I
think, was back in 1998. So this is our third round
in self storage. And with that, I'll turn it over
to Michael for an overview of externally managed.
MR. FOGLIANO: Thanks, Lynne. In the
1
2
3
4
5
6
7
8
9
10
11
12
13
14
15
16
17
18
19
20
21
22
23
24
25
90
ACCURATE STENOTYPE REPORTERS, INC.
externally managed portfolio, we invest with fund
managers and REIT separate account managers. The
objectives of investing with these managers is to
provide the overall real estate portfolio with
property and geographic diversification and access
to non-core investments via managers with unique
strategies and expertise.
The externally managed portfolio is 5.2 billion
in size. The portfolio consists of large open-ended
funds, a mid-sized closed-end fund portfolio
consisting of value add and opportunistic
strategies, and a mid-size global REIT portfolio.
You can see the pros and cons of open-end and
closed-end funds on the slide. Most open-ended
funds are lower risk funds with low debt levels and
provide good cash flow to investors. The debt level
of our core fund portfolio is 20.5 percent. For the
closed-end funds, risk profiles tend to be value add
or opportunistic.
Leverage is higher in these funds and can be
65 percent or higher. In this cycle, however, we
are witnessing more prudent levels of leverage. For
instance, our value add investments are 43 percent
levered, and our opportunistic investments are 57
percent levered. The overall debt level of our
1
2
3
4
5
6
7
8
9
10
11
12
13
14
15
16
17
18
19
20
21
22
23
24
25

91
ACCURATE STENOTYPE REPORTERS, INC.
closed-end portfolio is 55 percent, and the overall
debt in the externally managed portfolio is
40 percent.
There are many closed-end fund options in the
market today. We invest in REITs through four
separate account managers. A REIT is a real estate
company that trades on the stock exchange. Our REIT
managers provide us with global real estate exposure
on an actively managed basis, and they typically
have 75 or more REIT positions. These managers can
trade in and out of their positions on a daily
basis.
The pros with such a portfolio is that we get
global exposure. There's low fees, and it's not a
perfect correlation with private real estate. The
cons is it could be volatile and we're exposed to
currency fluctuations.
Of the three investment types within EMP,
open-ended funds is the largest, with 2.5 billion
spread over ten investments and eight managers. Our
closed-end funds have an NAV of 1.2 billion, spread
over 30 investments and 15 managers. Our uncalled
capital of just over 1.1 billion is mostly
associated with these closed-end funds. The REIT
portfolio is managed by four managers, with a total
1
2
3
4
5
6
7
8
9
10
11
12
13
14
15
16
17
18
19
20
21
22
23
24
25
92
ACCURATE STENOTYPE REPORTERS, INC.
NAV of approximately 1.4 billion.
The externally managed portfolio exceeds its
benchmark for all time periods. The externally
managed pooled funds exceeds its benchmark for all
time periods. The core portfolio is beating its
benchmark.
More than a year ago the EMP group initiated an
exercise to enhance returns of the core portfolio.
So far we ended up redeeming out of two funds for a
total of 340 million and committing to two funds for
a total of 150 million. The goal was to reduce our
exposure to funds that were providing low income
returns and low appreciation returns due to being
overexposed to weaker segments of the market and
underexposed to stronger growth segments of the
market.
We believe these moves will benefit the
portfolio in the midterm at least, in the next three
to five years. As you can see, the non-core
portfolio, which is comprised of value add and
opportunistic pooled funds, has beaten its benchmark
by a wide margin.
Our apartment and industrial properties have a
similar property type weighting compared to the ODCE
index, and our office and retail properties are
1
2
3
4
5
6
7
8
9
10
11
12
13
14
15
16
17
18
19
20
21
22
23
24
25

93
ACCURATE STENOTYPE REPORTERS, INC.
moderately lower than the index. Our portfolio has
15 percent exposure to international, which is up
from 13 percent one year earlier.
Our top five international markets in order is
the UK, India, Australia, Germany and Denmark. Our
international diversification will increase as our
recent commitments to global, European and Asian
strategies made over the last few years are invested
by our managers.
Over the last year we have conducted due
diligence on many markets, including São Paulo,
Brazil, four markets in Asia and a handful of
European markets. This has enabled us to understand
the markets and where our dollars are being placed.
Overperformance relative to the benchmark was
achieved in all time periods with our REIT
portfolio. The overall REIT market has been
volatile over the last 12 months. With inflation on
the horizon, the REIT market has been hurt, despite
strong real estate fundamentals. Our four separate
global REIT accounts have an average of 105 REIT
positions. Our four managers complement each other
to create an appropriately diversified portfolio.
Our approach to investing and managing a
portfolio of real estate funds is discussed further
1
2
3
4
5
6
7
8
9
10
11
12
13
14
15
16
17
18
19
20
21
22
23
24
25
94
ACCURATE STENOTYPE REPORTERS, INC.
on the next six slides. If anyone has a question
related to the process, feel free to ask, but this
concludes my commentary.
MR. COLLINS: Does anybody have any questions?
MR. COBB: Yes. I have a question regarding
our REIT commitments.
MR. COLLINS: Go ahead.
MR. COBB: It's my impression in today's market
that investors are seeking yield and are -- and over
the last few years, there's been sort of an
adjustment on that the last year, but that the REIT
prices have gotten way high based on their intrinsic
real estate values, because they've been selling on
a competitive yield basis.
So are you as concerned as I am about REIT
investments compared to your other options in real
estate?
MR. FOGLIANO: Well, it really depends on the
market. So there are some markets that we're
invested in that they're trading at a discount to
the NAV, and there's other markets where there's a
slight premium, like J-REITs, for example. REITs in
Japan are trading at premiums, and some of our
managers are backing off that. But there's other
markets where I would say on average, across our
1
2
3
4
5
6
7
8
9
10
11
12
13
14
15
16
17
18
19
20
21
22
23
24
25

95
ACCURATE STENOTYPE REPORTERS, INC.
entire REIT portfolio, they're trading
approximately at -- at or slightly under NAV.
MR. SPOOK: But U.S. REITs are probably on
average about 15 percent, trading at a discount to
NAV of about 15 percent. And that's -- U.S. REITs
have way underperformed the broader equity markets
over the last 12 months.
MR. FOGLIANO: And that's particularly true
with the retail and the hotel REITs. They're
trading at substantial discounts, whereas industrial
is trading at a premium, and office is probably
close to par. So just having a large diversified
portfolio helps. We have some situations where we
have premium to NAV and others where we have severe
discounts, but overall it's around par.
MR. COBB: I guess I'm a little skeptical of
those appraisals that give you those NAVs that say
that there's a discount. I personally haven't found
too many, but I'm glad you have.
MR. FOGLIANO: You know, if you bet against
retail, maybe the mall REIT portfolio might be one
to go after. They're trading at substantial
discounts.
MR. COLLINS: Any other questions? So I have
one. And I'm going to pick on Lynne.
1
2
3
4
5
6
7
8
9
10
11
12
13
14
15
16
17
18
19
20
21
22
23
24
25
96
ACCURATE STENOTYPE REPORTERS, INC.
MS. GRAY: Thank you.
MR. COLLINS: Nothing personal. It's just an
easier way to make my point. So I have been
struggling for three years now to get us to increase
the leverage in the real estate portfolio. And I
almost thought I couldn't get it done even when I
was chair, but I got an additional meeting because
the new chair couldn't be there, so I'm going to
give it one last try.
So if you look at slide 25 of the principal
investments -- and principal investments is --
because we control this. We own it. (Inaudible)
And our portfolio is limited -- we're not going to
call it a target, but we're going to say it's
limited at 30 percent of LTV.
And I think that -- what I've been trying to do
is to get somebody to give me an analysis of the
risk, much like we do -- that Aon did for the
pension asset-liability study, where they do the
current (inaudible) risk-reward spectrum.
And the one time I got this, I asked for it, I
got it, and what I got was, hey, if you add -- it
was essentially a straight-line line graph. If you
add 1 percent risk, or if you add one more
percentage of leverage, you add 1 more percent of
1
2
3
4
5
6
7
8
9
10
11
12
13
14
15
16
17
18
19
20
21
22
23
24
25

97
ACCURATE STENOTYPE REPORTERS, INC.
risk. And that's just -- that's not real. That's
not true. I keep asking for additional analysis,
but we aren't -- I haven't seen any.
So to put it in numbers, if you -- so right now
we're at 21.7 percent leverage, where our limit is
30. So we're at 72 percent of our potential
leverage, on a portfolio that's earning -- that
earned 7 percent last year, has earned 10.3 percent
over the three years and 12.5 percent over the five
years.
So the principal investment total portfolio is
about $11.1 billion. At 30 percent, that's about
3.334 billion of debt. Today we have 2.4 billion of
actual debt. So there's almost a billion more
dollars that we could have had available to earn the
7 percent, the 10.3 percent or the 12.5 percent. So
on the one year, that would have been $70 million of
additional income.
Now, I'm not for, quote, risking up the
portfolio, but I don't think that there's -- I'd
love to see the study that tells -- that says, hey,
if you go from 21.7 to 30, boy, that's a real --
that's just too much risk. Even if you go from
30 percent to 40 percent, boy, that's just too much
risk. But nobody is producing that efficient
1
2
3
4
5
6
7
8
9
10
11
12
13
14
15
16
17
18
19
20
21
22
23
24
25
98
ACCURATE STENOTYPE REPORTERS, INC.
frontier for us. And I think we are leaving a lot
of money on the table based on the notion that this
real estate portfolio should have really low risk.
I love that we're outproducing the ODCE with
approximately the same percent leverage, but I would
tell you that 21 percent in a core portfolio that we
control 100 percent is low. It's too low relative
to what our requirements are for returns. And I
don't think that going from 21 percent to, say,
35 percent is going to create a meaningful risk in
an asset class like the principal investment
portfolio.
So I've been asking for three years for
somebody to show me otherwise, and I can't get it,
and so I feel like I'm beating my head against the
wall, but we're leaving a lot of money on the table.
And I'll leave that -- I'll leave it with you, Ash,
at that.
MS. GRAY: So, Peter, this is Lynne. I wanted
to just point out one thing that Steve and I both
mentioned and I'll reiterate, that with the change
in policy increasing from 25 to 30 percent, we
actually have gone out, and right now we have --
first of all, the 21.7 percent is as of
September 30, 2017. Post-September 30, 2017, we
1
2
3
4
5
6
7
8
9
10
11
12
13
14
15
16
17
18
19
20
21
22
23
24
25

99
ACCURATE STENOTYPE REPORTERS, INC.
actually have baked with seven assets up to
500 million in leverage. And so that amount alone
brings us up to 26.3 percent.
In addition to that, we have what I'll call
pipeline activity, where there are investments that
we have identified and we're working toward either
in document -- the negotiation stage of the deal.
But if we close on everything in the pipeline, we'll
be at 28 percent.
So based on the conversations that we've had
over the past three years, I think that the one good
outcome has been that we've been able to go out,
we've identified assets, existing assets in the
portfolio that are long-term hold, stable assets in
the portfolio, and we've been able to get some
really advantageous leverage for that portfolio.
And an example of that would be with our -- one
of our larger multifamily deals that we have that we
see holding for a much longer period of time, we
were able to secure 15 year debt at 3. -- I believe
it was 3.5, interest only, that is actually open to
prepay without penalty in year 12.
So I think that we've had a good -- we've made
progress. And while I can't give you the answer
today for the most efficient or that tipping point
1
2
3
4
5
6
7
8
9
10
11
12
13
14
15
16
17
18
19
20
21
22
23
24
25
100
ACCURATE STENOTYPE REPORTERS, INC.
for leverage, what I can tell you is that we
actually have proactively gone out and we are
increasing the leverage in the portfolio, and we've
gotten some really good terms on the leverage that
we've applied.
MR. COLLINS: Well, so I appreciate that. But
I've -- and not to be combative, but I've had this
same conversation, like I said, three years. And
every time I bring it up, somebody says, Oh, we're
doing better. We are increasing the leverage. We
are doing this. We are doing that.
But it seems to me like we're -- if that's the
case, then we still wouldn't be at 26 percent, so --
and I guess my bigger question is, we've got a lot
of consultants, and I think Aon does a great job and
Townsend does a good job. But the last time --
well, not the last time, but the time before last I
was there, and we asked Townsend -- we tasked
Townsend with doing an analysis. And I've yet to
see it.
And so I think that while we're getting closer
to 30 percent, I don't know that that's the right
number. And I think that we're stuck in this
conventional wisdom that, oh, real estate is the
anchor to windward. Right? And it's going to -- we
1
2
3
4
5
6
7
8
9
10
11
12
13
14
15
16
17
18
19
20
21
22
23
24
25

101
ACCURATE STENOTYPE REPORTERS, INC.
can't put too much risk in that. While I agree with
that concept generally, somebody has yet to show me
what that level is.
And I don't want risk for the sake of risk, and
I certainly don't want risk that risks corpus. But
I'd like us to do an analysis and just get out of
the conventional wisdom that risk above X in the
real estate portfolio is not good.
MR. WILLIAMS: Peter, it's Ash. Let me offer a
couple of thoughts, if I may. First of all, there
are two components to leverage. One is the amount
of debt. The other is the value of the asset. Over
the time we've been having this conversation, which
is two-plus years, we've added about a billion
dollars in debt to our real estate book, or a very
significant amount of money. Even if you break that
down to a daily basis, it averages to a fair amount
of money every day, not that we do it that way.
At the same time, we've had the happy problem
of the value of our assets going up very
dramatically. So while we add leverage, to the
extent the asset value outstrips that leverage, it
masks the amount of additional leverage we've put in
place and its impact on the portfolio, which is
terrific.
1
2
3
4
5
6
7
8
9
10
11
12
13
14
15
16
17
18
19
20
21
22
23
24
25
102
ACCURATE STENOTYPE REPORTERS, INC.
MR. COLLINS: I agree.
MR. WILLIAMS: It doesn't always go that way.
And it can go the reverse. And the initial analysis
that we did illustrated the historical impact that
leverage can have on a real estate portfolio. And
what we saw was, when the tide goes out in a period
of economic adversity, as we saw in U.S. real estate
in '91 or more recently in the great financial
crisis, the effects of really high leverage are
awful.
I understand that's not what we're talking
about. And so what we're really -- the conversation
we're having is how much is enough. And that's a
hard thing to peg.
MR. COLLINS: How much is too much, right,
relative to the overall goal and the asset
allocation structure of the portfolio.
MR. WILLIAMS: Correct. And I'm not sure
there's a hard number for that. We've talked with
Aon. We've talked with Townsend at some length, and
I don't think there's a bright line anywhere. And
there's another couple of variables here. One is
we're not looking at simply maximizing the return of
real estate in and of itself. We're looking at the
contribution real estate makes to the aggregate
1
2
3
4
5
6
7
8
9
10
11
12
13
14
15
16
17
18
19
20
21
22
23
24
25

103
ACCURATE STENOTYPE REPORTERS, INC.
returns of the fund and the aggregate risk of the
fund.
And from a portfolio construction standpoint,
one of the things we're looking to real estate to do
is be a diversifier to global equity beta, which is
our single biggest risk exposure. And if you think
about what we have in private equity, that's global
equity beta on steroids with less liquidity.
So having some things like the fixed income
portfolio, the strategic investments portfolio, the
real estate portfolio all mitigate that
concentration of risk and return-seeking assets of
the equity ilk. And the real estate risk we look at
as appropriately a blend of equity and credit risk.
So I guess what I'd say is, given where we are
in the cycle -- and the ambassador has brought up on
a couple of occasions how certain major markets in
the U.S. are at valuations that are just
stratospheric and hard to imagine that they're
sustainable. Our sense is, and as Lynne touched on,
we have quite literally had a number of unsolicited
bids where I would not refer to them as crazy, I
would just say that they had a thorough recognition
of the high quality and desirability of our
portfolio, perhaps more anticipatory than our own.
1
2
3
4
5
6
7
8
9
10
11
12
13
14
15
16
17
18
19
20
21
22
23
24
25
104
ACCURATE STENOTYPE REPORTERS, INC.
And, therefore, we were quick to take their cash and
let them have that asset at these valuations.
So I think our sense is, valuation-wise, we've
come a long, long way. And I guess, on the balance
of all those things, our sense is we've done a lot.
We've gotten excellent structures, fixed rates,
pretty good longevity on these loans. And if you
also think about the sorts of things we've been
doing lately, where we've repurposed the cash that's
come out of some of these asset sales into develop
to core strategies, by definition those have an
element of leverage in them that is more pronounced
than our other exposures in the principal portfolio.
So I think we've come a long way in the
direction you want us to come. And the question is,
two things, from my perspective, how much is enough
and, from your perspective, yeah, but how much more
can we do before we get a hangover. And the science
on that last one is hard to define.
MR. COLLINS: Well, it's amazing to me that Aon
can run a 5,000-scenario simulation on our entire
portfolio, asset and liability and our portfolio
construction, but we can't run it on leverage in the
real estate portfolio. We can't get anybody to run
a meaningful analysis in the real estate portfolio
1
2
3
4
5
6
7
8
9
10
11
12
13
14
15
16
17
18
19
20
21
22
23
24
25

105
ACCURATE STENOTYPE REPORTERS, INC.
on debt.
MR. KOCH: Peter, this is Jack Koch with The
Townsend Group. And I apologize if what we provided
in the past wasn't what you were seeking. However,
I do also believe that Aon ran a very similar
analysis in the course of the past six months that
also showed the same outcomes.
So we'll be happy to have further conversations
with you and give you more information maybe in a
different vein. However, we were under the
impression that we did provide you what you were
looking for, and I believe that Aon was as well on
the real estate side.
It is -- as Ash said, it's not a crystal clear
answer. We work to the objective within the real
estate portfolio of roughly a 7.5 return. And
that's based upon the asset-liability study,
et cetera, and filling that on a risk-adjusted basis
at that 7.5 percent. So we've created a portfolio
and provided that advice to both staff and your
peers on the board that ultimately have followed
that strategy and it's performed very well.
So we would agree that if there was analysis
and that information was available, we would
certainly like to put our hands on it, and we'll
1
2
3
4
5
6
7
8
9
10
11
12
13
14
15
16
17
18
19
20
21
22
23
24
25
106
ACCURATE STENOTYPE REPORTERS, INC.
continue to look to try to give you the information
that you're looking for. So happy to follow up at a
later date.
MR. COLLINS: So if there was something that
you guys did in the last six months that I didn't
see, I'd love to see it, but I haven't seen anything
that anyone has done in the last six months on this.
MR. FOGLIANO: Jack, I just wanted to point
out, so the ODCE, open-ended diversified core
portfolio, that's around 21 percent levered. We're,
in the principal, going to be 28 percent levered.
And core-plus funds out there are somewhere either
maxed at 40 percent or 50 percent debt. So I think
40 percent is way too high, because you're into a
totally new risk profile. And I think the upper end
of the core, open-end diversified core portfolio
range is in the mid to upper twenties. So at 28, we
would be at the top of the open-end diversified core
universe.
So what do we want this portfolio to be? Do we
want it to be core-plus or core? So, anyway, that's
just my observation.
MR. WILLIAMS: Good context. Anything else on
this? We will circle back with you, Peter, on what
if any analysis we have not shared. I think we have
1
2
3
4
5
6
7
8
9
10
11
12
13
14
15
16
17
18
19
20
21
22
23
24
25

107
ACCURATE STENOTYPE REPORTERS, INC.
shared everything we've got. And if we were off on
our memory of the timing, shame on us.
MR. OLMSTEAD: Can I just ask a quick
clarifying question? So we're at, in theory,
26.3 percent. Is 30 percent the max that we can go
on the leverage? And of the pipeline, we're at 28.
So part of Peter's conversation is whether that
30 percent is the right number --
MR. WILLIAMS: Correct.
MR. OLMSTEAD: -- or whether that should be
higher. And that's why we're trying to look at some
analysis.
MR. COLLINS: Yeah. My point is, if we're
going to refer to ODCE as the benchmark from a
leverage standpoint -- I feel like I'm beating my
head against the wall, but I feel like the guy in
the room that's saying, no, the world is round, and
everybody is like, no, no, no, it's flat.
So the argument against what I'm saying is,
well, the ODCE benchmark. Well, okay. But if you
look at our asset allocation versus the world out
there, we look a lot different. And why do we look
a lot different? Because we studied it. We spent a
lot of time on it. And we were number one last
time. I don't know what we are now, but we were
1
2
3
4
5
6
7
8
9
10
11
12
13
14
15
16
17
18
19
20
21
22
23
24
25
108
ACCURATE STENOTYPE REPORTERS, INC.
number one in the TUCS top 10.
Are we materially riskier than the rest of the
world out there relative to those returns we're
generating? We've all looked at that and said,
well, we're comfortable with that risk. So I don't
want the reason why we don't go to a certain risk
level, whatever that risk level is, I don't want it
to be, well, because the ODCE index is X.
MR. WILLIAMS: I don't think that's the core
reason. I think that was a contextual observation.
MR. COLLINS: And all I'm trying to do is get
somebody to do some analysis. I mean, we pay people
good money to do a lot of analysis for us, and let's
pay somebody some good money and let's get smarter
on it. Let's get as much information on it as we
can. If we truly did leave a billion dollars out
there of leverage between 21.7 and 30 percent, these
are real dollars we're talking about. It's not like
I'm trying to pick up crumbs on the way to the --
you know, to see the retirees. It's real money.
Rant over.
MR. WILLIAMS: Rant received.
MR. COLLINS: All right. Anybody else have any
comments on that? Asset class, investment officer
updates. So we have Alison and Tim first?
1
2
3
4
5
6
7
8
9
10
11
12
13
14
15
16
17
18
19
20
21
22
23
24
25

109
ACCURATE STENOTYPE REPORTERS, INC.
MR. WILLIAMS: I think we have The Townsend
leverage report next.
MR. COLLINS: Townsend is going to make a
presentation.
MR. MARCUS: Peter, this is Seth Marcus at
Townsend. We'll keep this brief.
MR. COLLINS: Okay, perfect.
MR. MARCUS: So I'm fast-forwarding through the
slides in the room. Just to reiterate, so Townsend
has worked with the IAC, with SBA on the real estate
portfolio since 2004, so over the past 14 years. We
appreciate the opportunity to again present an
update to you.
As you may know, Townsend works with the staff,
as Steve explained earlier, to facilitate new
investments, as well as investment performance
monitoring, and as well as some other projects we
do.
The individuals next to me in the room here,
Jack Koch on my left and Richard Brown on my right,
make up the Florida team that is dedicated to
service you-all. We're also backed by the broader
Townsend organization, 100-plus employees across
offices in Cleveland, San Francisco, Hong Kong and
London. And as we discussed at the last meeting,
1
2
3
4
5
6
7
8
9
10
11
12
13
14
15
16
17
18
19
20
21
22
23
24
25
110
ACCURATE STENOTYPE REPORTERS, INC.
we're also now further augmented by the Aon
platform, where Townsend is a wholly-owned
subsidiary of Aon.
As I mentioned, I'll keep this brief. I won't
repeat too much that has already been said or any
that has already been said. So the portfolio is at
and near its target allocation of 90 percent to the
private, 10 percent to public real estate, with
about 8.8 percent of total plan assets, 8.7 percent
of total plan assets as of the third quarter.
That's about 13.9 billion.
This is under the 10 percent allocation. And
this is both due to a strong growth at the total
plan level, also a denominator effect, as well as
the real estate portfolio taking advantage of an
attractive selling environment, both on the direct
side, but we're also seeing that on the fund side as
well.
So investment periods are being elongated.
Managers are taking a longer time to put the capital
work, and they're also taking more chips off the
table, given the opportunity and the capital flows
in the market today.
Over $800 million has been committed over the
last 12 months across the direct and externally
1
2
3
4
5
6
7
8
9
10
11
12
13
14
15
16
17
18
19
20
21
22
23
24
25

111
ACCURATE STENOTYPE REPORTERS, INC.
managed portfolio. And the portfolio has
consistently outperformed the benchmark over the
rolling five year period.
So I'm on slide 147 in the room, and this shows
the rolling five year performance quarter over
quarter. So the portfolio has consistently
outperformed its benchmark. And the benchmark has
been adjusted over a time period, so the benchmark
is adjusted on this page. But since 2002, 16 years
of consistent outperformance over the rolling five
year period. Further, the portfolio outperforms
over both the shorter and longer time periods, the
one year, the three year, as well as the 10 year and
the 15.
The driver of this outperformance has been
broad-based, but a large portion of your portfolio
is obviously in the core assets. And that
allocation has driven outperformance, given the
consistent strong performance there. However, we do
believe that core returns -- and we are seeing it in
your portfolio -- are moderating. So we expect the
long-term average to come back to core at around 6
to 8 percent, with the majority of that coming from
income, 70 percent of that roughly from income.
Therefore, the outperformance to really drive
1
2
3
4
5
6
7
8
9
10
11
12
13
14
15
16
17
18
19
20
21
22
23
24
25
112
ACCURATE STENOTYPE REPORTERS, INC.
the higher performance for your portfolio will come
from the smaller allocation but to that non-core
portfolio. And we've seen that over the last
handful of years, really, as Michael highlighted,
returns in the mid to high teens from your non-core
portfolio. On a relative basis, we also are already
seeing that we rank strongly amongst peers as well
as the larger funds.
The last thing I'll mention, in the interest of
keeping it short, is that this portfolio has
consistently delivered strong returns, while doing
so and remaining within policy guidelines and
compliance. That's on slide 158 in the room.
And because of the SBA's size, in many cases,
we've also qualified for fee reductions because of
the size of our commitments to individual fund
managers. Additionally, we've pooled Townsend
clients with the Florida SBA commitments to further
augment further reduction in management fees. So
that is something that we continue to focus on.
We've talked about that in the past, but just one
more point of how we're looking to drive a little
bit of alpha in a very difficult environment.
So there's a lot of other slides in here, but I
said I'd keep it brief, so I'll stop here and open
1
2
3
4
5
6
7
8
9
10
11
12
13
14
15
16
17
18
19
20
21
22
23
24
25

113
ACCURATE STENOTYPE REPORTERS, INC.
it up to any further questions.
MR. COLLINS: Anybody have any questions? Keep
going.
MR. MARCUS: That wraps up Townsend's prepared
remarks.
MR. COLLINS: Okay. All right. Alison and
Tim.
MR. TAYLOR: Thank you, Mr. Chairman. This is
Tim Taylor. I'll start us off with the global
equity review, and Alison will close it out. 2017
was an impressive year for global equity markets.
The U.S. was up over 21 percent. However, this
trailed the 25 percent rise in non-U.S. developed
markets and also the surge of almost 37 percent in
emerging markets. It should be noted that for U.S.
dollar-based investors, the weak U.S. dollar
accounted for a notable percentage of non-U.S.
equity returns.
2017 was a year of strong corporate earnings
growth and positive economic data almost everywhere
in the world. All major central banks were moving
away from quantitative easing and towards policies
of normalization. The information technology sector
was incredibly strong, with an annual return of 40
percent. Trailing the pack was the energy sector,
1
2
3
4
5
6
7
8
9
10
11
12
13
14
15
16
17
18
19
20
21
22
23
24
25
114
ACCURATE STENOTYPE REPORTERS, INC.
with a return that, while positive, was far off that
of the IT sector.
I mentioned the 37 percent return in emerging
markets. It was its highest return in that space
since 2009, so almost a decade. Growth and momentum
were in favor and risk was on. Volatility levels
were extraordinarily low.
The next page shows our performance. The
global equity asset class's return was 25 percent in
2017. This exceeded our benchmark return by more
than 1 percent, or 100 basis points. Excess returns
continue to be positive over the three year, five
year and from inception periods, all ending
December 2017.
I'd like to note a couple of things here. The
sheer strength of the bull market is seen by an
annualized benchmark return of 11.5 percent from the
inception of the asset class in July 2010. Also,
our tracking error in the asset class has hovered
around 50 basis points. This is leading to a strong
risk-adjusted return as measured by the information
ratio.
I wanted to talk a little bit about the year to
date. 2018 has already been -- I chose the word
"interesting." There's probably a lot of other
1
2
3
4
5
6
7
8
9
10
11
12
13
14
15
16
17
18
19
20
21
22
23
24
25

115
ACCURATE STENOTYPE REPORTERS, INC.
words I could have chosen. I went with
"interesting." I don't know why. But it was
interesting. It has been interesting. This page is
a visual depiction of global equity's excess asset
class return, coincident with the return of our
benchmark. We believe that we should outperform
when investors show at least some preference for
positive fundamentals or characteristics.
Particularly, we expect our absolute
performance to suffer when the general market
declines. However, we would expect our portfolio to
fall less because we're typically positioned in
securities perceived as higher quality because they
have stronger balance sheets, they have predictable,
defendable cash flows, they have positive growth
characteristics.
This graph indicates that as the market roared
to an almost 8 percent return in January, global
equity, our asset class, underperformed, the lighter
green line there. However, as the market lost all
of its early gains and more and went negative, our
excess returns quickly turned positive. So this
capital preservation characteristic has served us
well historically, and our belief is that it will
continue to do so going forward.
1
2
3
4
5
6
7
8
9
10
11
12
13
14
15
16
17
18
19
20
21
22
23
24
25
116
ACCURATE STENOTYPE REPORTERS, INC.
This is a small, I think, example of what Ash
alluded to earlier in the meeting, that we expect to
do well in challenging times. Again, this is a
small sample of that. Alison is going to take over
on the next page.
MS. ROMANO: So moving to the performance of
our active managers by aggregate, what we have on
this slide is performance over various periods and
commentary that relates to the full year 2017.
First I'll make a couple of points on the last
quarter, or fourth quarter. In emerging markets,
that was an area that we struggled. It's a theme
that we've talked about in previous quarters.
Companies like Tencent and other Chinese Internet
names continued to roar up, and those managers tend
to be underweight.
Our global aggregate underperformed. Again, a
theme we've talked about. We tend to have some
defensive managers there, and the market was up
strongly, but also our growth managers had some
stock-specific issues. It was, however, a very good
quarter for our U.S. large cap aggregate, which has
seen a positive trend, having factor tailwinds in
areas like momentum and exposure to mid caps.
Looking more broadly at 2017, we'll take a
1
2
3
4
5
6
7
8
9
10
11
12
13
14
15
16
17
18
19
20
21
22
23
24
25

117
ACCURATE STENOTYPE REPORTERS, INC.
little trip around the globe in terms of
performance. Our developed market large cap had a
fabulous year, outperforming the benchmark by over
five percent. Eight of the nine managers
outperformed. Four managers had greater than
5 percent excess returns. Now, remember, that
benchmark was up 24 percent. So they beat a very
strong benchmark and beat it in a big way.
How did they do that? Factor tailwinds,
growth, momentum, making off-benchmark bets in the
U.S., in the emerging markets, in some of these
technology names, and just good stock picking.
Emerging markets, the theme that I talked about
for the fourth quarter applied for the full year.
These managers tend to be quality and valuation
oriented and are not going to be big investors in
names like Tencent. Just to give you the picture
for the year, Tencent was up 114 percent versus our
benchmark, which was up 24 percent. And the top ten
names in the EM benchmark delivered 38 percent of
that benchmark's return. So holding those specific
names really sort of made or broke managers. So
given our focus on quality and on value, we're
comfortable with where those managers ended the
year.
1
2
3
4
5
6
7
8
9
10
11
12
13
14
15
16
17
18
19
20
21
22
23
24
25
118
ACCURATE STENOTYPE REPORTERS, INC.
On the positive side, U.S. large cap again
continued the positive trend, driven by beta
significantly. And then the currency managers did
have a difficult year. A very simple explanation,
long the U.S. dollar and short the Euro. And that
was not a bet that paid off for the year. Again,
overall, very positive 2017 for our active managers.
Turning to the next slide, our initiatives and
what we're looking at going forward. In the past
quarter we hired two foreign developed value
managers, and we have just funded them recently at
about $1.4 billion. The reason there was to round
out our value exposure, and the average manager in
that aggregate was close to 2 billion, and we
thought it made sense to spread the wealth around
some more managers and decrease the manager
concentration risk.
We also completed funding for our two U.S.
small cap managers, gaining one growth and one value
manager. And we increased the funding to our
internal factor strategy. It's now about
918 million. We continue to look for ways to bring
money in-house and are researching that, as well as
continuing to go after fees and make sure that we
are negotiating fees where we are not getting unique
1
2
3
4
5
6
7
8
9
10
11
12
13
14
15
16
17
18
19
20
21
22
23
24
25

119
ACCURATE STENOTYPE REPORTERS, INC.
returns.
The final point I'd like to make, looking at
2017 in totality, we raised $7.1 billion. So we had
an excess return in our asset class over 1 percent,
and that is absorbing the costs of raising that
$7.1 billion to meet both beneficiary payments and
liquidity needs. With that, I'll turn it over and
ask if you have any questions.
MR. COLLINS: Are there any questions for Tim
or Alison. Okay. Katy?
MS. WOJCIECHOWSKI: Okay. I'll be brief. So
while the equity markets were off to the races last
year, we have barely held our own over the past 12
months. At the end of February we were up only half
a percent, so barely keeping track with our cash
portfolio. And 12 months through today we're up 70
basis points, so a little bit better, some
improvement.
Annual returns were slightly positive. As you
can see, credit and credit spread sectors did the
best overall as rates rose. And the 10 year, if
you'll notice, rose during the period from 2.40 to
2.80, and we're roughly at 2.85 right now, or when I
came in here at least.
Fiscal year to date and the one, three and five
1
2
3
4
5
6
7
8
9
10
11
12
13
14
15
16
17
18
19
20
21
22
23
24
25
120
ACCURATE STENOTYPE REPORTERS, INC.
year, we're outperforming on all periods, both
internally and externally. And that's really with
some very, very low risk levels, by the way, so
great information ratios for those periods as well.
Still very close to the vest, very low risk levels.
We're taking about 16 basis points of tracking
error, just for point of reference, and our -- we
have the ability to take a lot more than that but
just didn't see the opportunities. We're beginning
to see opportunities, and I'll get to those in just
a moment.
Just if you take a look on the left-hand side
of the next slide, you'll see that finally
option-adjusted spreads have moved out a bit, and we
are seeing some opportunities for that. Still see
the wall of money from foreign central banks, but we
do see some issuance in the short end, where we see
some opportunities. It is a -- I'm going to say a
hundred percent baked in chance of a Fed hike in a
couple of -- this month. Four are pretty much baked
in, three and a half definitely.
And unless we see inflation really pick up, you
can make the argument -- and that is not our central
theme, by the way -- that you could make the
argument that the curve will continue to flatten.
1
2
3
4
5
6
7
8
9
10
11
12
13
14
15
16
17
18
19
20
21
22
23
24
25

121
ACCURATE STENOTYPE REPORTERS, INC.
We see some opportunities in short corporates,
and we're working on that right now. And that's
kind of where we are focusing, so taking some of
those opportunities.
And just by way of note, you can see how low
our active risk levels are right now, so just
incredibly low. But we have made money, even with
those levels, just through security selection. So
as Alison mentioned stock picking, it's bond picking
instead.
And that's just kind of an update on the final
page, just kind of where we're looking. We are
looking at some possible short corporate, like a
dedicated portfolio maybe in shorter duration, but
that's to follow in the future. I think that's it.
Any questions?
MR. COLLINS: Any questions for Katy? Thank
you. John.
MR. BRADLEY: Thank you, Peter. I'll start
with a quick update, first on the market. 2017 was
a strong year for private equity fundraising. The
U.S., Asia and Europe all saw gains year over year
in funds raised. Purchase price multiples do
continue to rise. Reported large buyout
transactions averaged 10.9 times during 2017, while
1
2
3
4
5
6
7
8
9
10
11
12
13
14
15
16
17
18
19
20
21
22
23
24
25
122
ACCURATE STENOTYPE REPORTERS, INC.
multiples for middle market companies averaged 8.3
times. Funding for these higher purchase prices
came in part from increased leverage. Leverage was
up half a turn, from five and a half times to six
times. But what might be surprising is equity
contributions also continue to rise. Average equity
contributions for middle market companies hit their
highest level since 2009, at 47 percent, which was
up 7 percent from 2016.
Within the portfolio, our net cash flow for the
full year of 2017 came in at $706 million, which was
our highest year since our inception. We saw strong
performance from our buyout, distressed and
secondary strategies. And our venture and growth
strategies did lag a bit on an absolute basis but
still had solid performance relative to their peer
benchmarks.
There's been no changes in our sector exposure.
We continue to look similar to our private equity
peer benchmark, and technology remains our largest
exposure. Geographically, we remain heavily focused
on the U.S. Exposure outside the U.S. continues to
grow and now makes up more than 26 percent of the
portfolio.
Moving on to the asset class returns, these are
1
2
3
4
5
6
7
8
9
10
11
12
13
14
15
16
17
18
19
20
21
22
23
24
25

123
ACCURATE STENOTYPE REPORTERS, INC.
shown as of September 30, 2017. Our one year return
trails what has been a very tough benchmark over the
short-term, which would be the public markets plus a
300 basis point premium. So you can see here our
one year performance trails by 120 basis points.
Longer term performance continues to remain strong,
however, and exceeds its benchmark over all
subsequent time periods.
Here we have performance broken out by strategy
and sub-strategies. Over the past year, as I
mentioned, our buyout, which would include both our
U.S. and non-U.S. portfolios, performed best. Over
the longer term and since inception all strategies,
with the exception of our non-U.S. growth equity
portfolio, have outperformed their peer benchmarks.
And then finally we made three commitments in
the first two months of the year, totaling
$265 million. All three commitments were made to
buyout funds, one each, focused on small, mid and
large buyouts. And then geographically two of those
funds were focused in the U.S. and one focused on
Europe. I think that's all I have.
MR. COBB: I have a question relating to
international focused.
MR. COLLINS: Great. Go ahead.
1
2
3
4
5
6
7
8
9
10
11
12
13
14
15
16
17
18
19
20
21
22
23
24
25
124
ACCURATE STENOTYPE REPORTERS, INC.
MR. COBB: So we're at 74 percent U.S., much
higher than Cambridge or the benchmark index. I
suspect that cap rates in Europe and Japan,
Australia are less than the U.S., just talk in terms
of 10 percent, up to 10 times EBITDA, where in
Europe is much lower. Why not more focus on Europe,
Asia and Australia for private equity?
MR. BRADLEY: That's a great point. I would
agree. What I would say is if we turn the clock
back a year, year and a half, our exposure within
the U.S. was 84, 86 percent. So we have begun to
build that out and make those commitments. But
given the nature of private equity and the three to
five year investment periods, that might take some
time.
But I think it's our goal and our strategy, and
we'll discuss it some at the June meeting when go
through private equity more in depth, but that piece
of the portfolio will continue to grow relative to
the U.S.
MR. OLMSTEAD: Do you have a target on that?
MR. BRADLEY: We don't have a target. I think
we tend to look at the Cambridge peer benchmark as
sort of a guidepost. And then we really still weigh
every decision based on funds we see, both in the
1
2
3
4
5
6
7
8
9
10
11
12
13
14
15
16
17
18
19
20
21
22
23
24
25

125
ACCURATE STENOTYPE REPORTERS, INC.
U.S. and outside the U.S. So the bar remains the
same regardless of geography.
MR. OLMSTEAD: When you look at the capital
raising that's going on, how would you allocate
that? Is it Asia? U.S. obviously. But with an
increase, a significant increase in capital raising
for these funds, where are you seeing those? Where
are you seeing that geographically?
MR. BRADLEY: I think over the past year Europe
has been by far the leader in fundraising. So a lot
of LPs have flocked to Europe. Asia, I think, came
in second in terms of increased fundraising. And
then the U.S., which had been the leader the last
two to three years, is a little behind. But we
still see a lot of our peers and a lot of investors
moving their portfolios overseas.
MR. OLMSTEAD: Is your approach to that more
proactive versus reactive? So when you look at
Europe, how is your sort of penetration, or how do
they -- do they know a lot about your investing
there? How are we getting the Asia and Europe --
MR. BRADLEY: Yes. It's definitely proactive.
So we are, with Cambridge, with our consultant,
identifying the top funds around the globe,
constantly debating portfolio allocation, where we
1
2
3
4
5
6
7
8
9
10
11
12
13
14
15
16
17
18
19
20
21
22
23
24
25
126
ACCURATE STENOTYPE REPORTERS, INC.
put our money, and then we are traveling quite
frequently to those geographies, meeting managers,
explaining our program, our portfolio. And then
hopefully from those, developing those relationships
and getting allocations and access to those funds
when they come back to market.
MR. COBB: What are the cap rates in Europe,
Australia and Japan compared to U.S.?
MR. BRADLEY: I think Europe is about a turn
less. So if you said the U.S. is about 10 times
market per purchase price, Europe is probably at 9.
Some of that's leverage. So Europe, leverage tends
to be about a turn less.
Japan is not a very active private equity
market, and so I think the multiples there are much
less. But I think in Japan, the last we looked,
there was only 30 to 40 transactions a year,
compared to the thousands that get done in the U.S.
MR. COBB: Thank you.
MR. COLLINS: Anybody have any additional
questions? I always like the color of your slides,
John.
MR. BRADLEY: Thank you.
MR. COLLINS: Trent.
MR. WEBSTER: Thank you, Mr. Chairman. So in
1
2
3
4
5
6
7
8
9
10
11
12
13
14
15
16
17
18
19
20
21
22
23
24
25

127
ACCURATE STENOTYPE REPORTERS, INC.
the last meeting, when we last met here in December,
I'd mentioned that we were making some changes to
our policy objectives. Most of them are consistent
with what the total FRS is currently using for the
real return benchmark. A couple of them are for
clarification. But the most significant one is the
third bullet point on the screen.
What we've done is that we have taken out -- it
used to say there, to provide a hedge against
inflation. But that's implied in the first
objective, which is to generate a 4.5 percent real
return over the long-term.
And we instead replaced this as a nod to the
ambassador, who has pointed out that since one of
our -- what we're actually doing is providing
downside protection, is to put it into our policy
objective. So we changed that to outperform the FRS
during periods of significant market declines. And
we're thinking more in bear markets.
And we do think that when we run our scenario
analysis, that we probably -- would probably provide
a beta of about a third to the rest of -- to the
equity markets. So that's something we're actively
doing, been spending a lot of time on that, so we
put that into our policy objectives.
1
2
3
4
5
6
7
8
9
10
11
12
13
14
15
16
17
18
19
20
21
22
23
24
25
128
ACCURATE STENOTYPE REPORTERS, INC.
The other change on the next slide is that we
have reclassified a few of our sub-strategies and
added a few others. You'll notice on here that we
used to have in this colorful graph a yellow piece
of the pie called special situations. We've
actually reallocated all those funds, mostly to a
few newer strategies but a couple elsewhere as well.
And so you'll see at the bottom, in the pink,
there's something there that says SI private equity.
We are not actively sourcing private equity funds.
John has a very good group, has done a very good
job. But one of the reasons for the existence of
this asset class, strategic investments, is to
provide a repository for funds and strategies which
may not fit nice and neatly in other asset classes.
So we do have some funds which have gone across
equity and credit, have gone across equity and debt.
But what we have found is that for some of these
funds, they have morphed more into private equity,
to be more like private equity. And so if they
become too much like private equity, then we would
defer over to John's group, to private equity, and
hand that fund over to them, if they wanted to re-up
into it. And in SI private equity we also have
equity investments of the Florida Growth Fund.
1
2
3
4
5
6
7
8
9
10
11
12
13
14
15
16
17
18
19
20
21
22
23
24
25

129
ACCURATE STENOTYPE REPORTERS, INC.
In the green part of the graph, we've created a
new sub-strategy called transportation. We've been
actively investing in aircraft leases and tear-downs
for nearly ten years now. We actually have a fund
which we're hoping to close at the end of the
quarter which invests in rail cars. So we created
this new transportation slice.
And finally we started to make investments in
insurance. We were able to close but not fund in
the fourth quarter. We've actually closed on two
funds since then. So you'll start seeing insurance
come in in our diversifying strategies, which is the
purple part of the pie.
Now I direct everyone's attention to the screen
as opposed to if you're flipping through the book.
So my apologies. This is a relatively new graph
that we're producing, and we found a data error in
it. Unfortunately it was after we distributed the
books to everyone. These are our exposures, gross
and net, across the entire asset class. Our net
exposure hasn't changed very much over the last five
quarters. It's roughly 80 percent. Our gross has
come down a little bit as some of our hedge funds
took risk off during the quarter.
This is our performance. We slightly
1
2
3
4
5
6
7
8
9
10
11
12
13
14
15
16
17
18
19
20
21
22
23
24
25
130
ACCURATE STENOTYPE REPORTERS, INC.
underperformed our benchmark in the first quarter.
We've outperformed over most other time periods. We
don't get too excited about performance over the
near term. And we would expect that, in a bear
market, for some of that alpha to come down.
And finally, the other piece of news is that
we're actually formally separating from private
equity on July the 1st. Strategic investments was
an outgrowth from the private equity asset class.
And though we've operated as two asset classes for
more than ten years, we've actually been one
department within the SBA. We've shared a back
office. We have a common budget. If you look at
our org chart, it's all together. Starting on
July 1st we will formally separate and become two
separate departments.
For the calendar year, the only other point I
would mention, for the calendar year we made
actually 21 allocations at just under $2.6 billion,
which is actually probably more than what I would
have expected because we haven't been all that
constructive on some of the opportunities out there,
but we have been finding nichey things to do and
some interesting things to do, and we've been doing
some re-ups with our funds.
1
2
3
4
5
6
7
8
9
10
11
12
13
14
15
16
17
18
19
20
21
22
23
24
25

131
ACCURATE STENOTYPE REPORTERS, INC.
Currently our pipeline is still pretty thin,
with four funds at $500 million, but these
opportunities seemed to pop up. We would expect
this calendar year to be lighter than last calendar
year, but we're opportunistic and we'll just see
what shakes out. Any questions?
MR. COLLINS: Any questions? Okay. Does that
take us to Joan?
MS. HASEMAN: It does. I'm here.
MR. COLLINS: Go ahead.
MS. HASEMAN: These slides are very typical of
the ones you've been seeing over the course of the
last four years. As of December 31st, our assets
sat at about 10-point almost 7 billion. As of
market close on Friday, we were at 10.8 billion.
Our membership growth is showing at 185-,
almost 186,000. Of that, we have 127,000 active and
58,000 inactive. As of Friday, I believe it was, we
were close to 188,264, and our active membership is
up just a tick by about 2,000.
Our average account balance is sitting at about
57,386. That's a 6 percent increase over a year ago
this time. And our average age is 47. Our
membership is broken out by males and females,
obviously, and 49 percent are males and 46 percent
1
2
3
4
5
6
7
8
9
10
11
12
13
14
15
16
17
18
19
20
21
22
23
24
25
132
ACCURATE STENOTYPE REPORTERS, INC.
are females, but you'll note our members, our
females make up 63 percent of our membership.
Average years of service is still well under
the eight years required to vest in the pension plan
at five years. And our retirees almost equal our
active members.
We did have $11.4 billion in distributions from
the plan. The good news is 61 percent of that are
rollovers, which we like seeing. We don't like
seeing money leave the plan, but we do like seeing
it being rolled, which tells us that members are
continuing to save for retirement.
This is our assets under management by class.
I don't think there are any surprises here. Our
brokerage account is still sitting at about
5 percent of our assets under management, but the
membership is around 2.5 percent, which is what is
expected when you introduce a self-directed
brokerage window.
Our performance this year has been, I think,
stellar, is a word I've heard used in the past a
little bit. Our performance this year for one year
has been stellar. It's probably the highest I've
seen since I've been with the plan, 16.36 percent.
And I'll let Aon comment further on that.
1
2
3
4
5
6
7
8
9
10
11
12
13
14
15
16
17
18
19
20
21
22
23
24
25

133
ACCURATE STENOTYPE REPORTERS, INC.
We did have a little downtick this past
quarter. It looks like it's down a little bit, but
I think we've held very well for the last 12 months,
and I hope to see it continue into the rest of this
fiscal year. This is our growth numbers in
membership. No surprises.
And for our financial guidance program, which
we consider to be one of the most important parts of
the program that we offer all of our FRS members,
we're still seeing a good usage of it, not as much
as we'd like. The downtick I think you see is a
result of our teachers going into the holiday time.
We don't expect to see a lot of activity in
December. They're closing out the midyear terms,
and colleges are out. Students are going out on
break, as are the teachers. And that covers my
presentation.
MR. COLLINS: Any questions of Joan?
MR. WILLIAMS: I have an observation,
Mr. Chairman, if I may.
MR. COLLINS: Please.
MR. WILLIAMS: Members of the IAC and guests,
you should know this will be Joan's last IAC
meeting. She's about to cross the great beyond and
become an active retiree/beneficiary and will
1
2
3
4
5
6
7
8
9
10
11
12
13
14
15
16
17
18
19
20
21
22
23
24
25
134
ACCURATE STENOTYPE REPORTERS, INC.
therefore haunt us to ensure that we're doing the
right things in our day-to-day management of her
assets. So I just want to recognize and thank her
for the terrific job she and her team have done.
MS. HASEMAN: Thank you.
(Applause)
MR. COLLINS: Well said. Joan, we'll miss you.
It feels like yesterday, but it was 25 years ago.
MS. HASEMAN: Thank you. That was kind.
MR. COLLINS: All right. Mike.
MR. McCAULEY: All right. I was just waiting
for you. Thanks, Peter. We've included some voting
statistics through the calendar year. These are
more or less in line with prior periods. We vote
against management about one out of every five
ballot items. And we also have a significant amount
of information on our website in terms of the
individual votes, our archive votes, that sort of
thing. We believe in transparency. So I won't
spend a whole lot of time on that.
One of the probably most notable things that we
did over the last few months -- we started it in
late 2017 and published it in January of 2018 -- was
a study on over-boarding, which we looked at U.S.
board members, companies within the Russell 3000
1
2
3
4
5
6
7
8
9
10
11
12
13
14
15
16
17
18
19
20
21
22
23
24
25

135
ACCURATE STENOTYPE REPORTERS, INC.
index, and looked at their service on multiple
boards, so any -- we looked at all directors but
really focused in on those directors that serve on
two or more. Our own voting guideline is more than
three, and that's something that's been a driver
historically of our voting practices.
So we wanted to essentially go in and
quantitatively examine that policy position. Very
similar to what we did in 2015, where we looked at
our voting with proxy contest scenarios, the value
of the vote study.
So we looked at, again, only U.S. companies,
although it broadly applies, from a voting guideline
context, broadly applies to other markets. And what
we found is, where you had companies that had a
higher than average level of directorships, both at
the individual board member perspective as well as
in the aggregate, when you added them all up and you
summed all the directorships up, there was an
inverse relationship between the level of
directorships and the company performance.
So I've got the stat for the five year
stockholder return, but it also was evident in the
one and three year time frames. And we looked at it
across a couple of different segments. Kind of
1
2
3
4
5
6
7
8
9
10
11
12
13
14
15
16
17
18
19
20
21
22
23
24
25
136
ACCURATE STENOTYPE REPORTERS, INC.
above average, we looked at the top decile, top
quartile names and companies. And then we also
looked at just the segment that failed to meet the
SBA policy. And the same relationship held across
all time periods and all segments.
So, again, not unlike the value of the vote
study, I think we were pleased to see that it
validates our policy approach. And we also examined
the extent that that drove some of our individual
director voting, which it was about a third of all
of our against or withheld support levels for U.S.
directors.
And then in addition to that, we're proposing
for the 2018 proxy season and beyond a set of rather
minor tweaks and edits, but a couple of notable ones
in here. Some of these are essentially wordsmithing
or just polishing up existing guidelines. But we do
have a new expanded version of the high-risk markets
guideline that deals with Venezuela, as Ash noted in
the opening remarks.
And then we also have an expansion of an
existing guideline dealing with board committees,
where we -- in the second half of 2017, we came
across quite a few Chinese and Hong Kong domiciled
companies, state-owned enterprises,
1
2
3
4
5
6
7
8
9
10
11
12
13
14
15
16
17
18
19
20
21
22
23
24
25

137
ACCURATE STENOTYPE REPORTERS, INC.
government-owned, where they were installing new
committee structures that in some instances could
override the board of directors, and we started to
shift our voting. So we felt it would be a good
idea to kind of beef up our existing policy.
The remaining ones are pretty straightforward.
I'm happy to answer any questions you have on any of
them, but they're relatively minor. So pretty much
status quo for the current season.
MR. COLLINS: Anybody have any questions for
Mike? Okay. Major mandate review, back to Kristen.
MS. DOYLE: Thank you. I will bring us home
here. So what you'll see from the major mandate
review that I'll go through quickly here is that
performance continues to be very strong across all
the major mandates. For the diversified mandates,
so that's the pension, the Lawton Chiles, et cetera,
absolute returns are phenomenal for the one year
period, and you'll see that when I get to the
different slides.
And that's really due to the continued strong
performance from the equity markets. But even the
more conservative mandates continue to steadily
outperform their benchmarks, albeit with lower
absolute returns, given the low interest rate
1
2
3
4
5
6
7
8
9
10
11
12
13
14
15
16
17
18
19
20
21
22
23
24
25
138
ACCURATE STENOTYPE REPORTERS, INC.
environment that we've been in. So overall the news
is very good.
If you look here, I'm on -- for those on the
phone, I'm on the slide FRS pension plan change in
market value ending December 31, 2017. You'll see
that for the fiscal year to date period, which is
July through December, the pension, net of benefit
payments, grew by $8.5 billion. If we extended this
chart out to the one year calendar year period,
you'd see from January to December that the pension
grew somewhere around $16 billion net of benefit
payments.
And I think what's most notable -- and I'll
move to that slide now, so now I'm on the FRS
pension plan investment results, two slides
forward -- is that the pension achieved 70 basis
points of alpha in a very strong market over the
past year. And you can see that with the one year,
the beige bar versus the blue bar.
And one of the things we talk a lot about here
but is really evident now that we've been through a
number of different market environments in the past
10, 15 years, is that the SBA does continue to
outperform across many different market
environments. And especially in strong market
1
2
3
4
5
6
7
8
9
10
11
12
13
14
15
16
17
18
19
20
21
22
23
24
25

139
ACCURATE STENOTYPE REPORTERS, INC.
environments, being able to achieve alpha is quite
impressive. So I wanted to make sure I pointed that
out.
We also look out over longer periods, as you
know, relative to the absolute nominal target rate
of return. And here we have outperformance over all
periods. It's a little bit less for the 20 year
period, but over the 25 and the 30 year period,
continued strong performance relative to that metric
as well.
And as you know, we compare on a quarterly
basis to the TUCS top 10 defined benefit plans in
the United States. As you've seen in the past, the
asset allocation differs a bit from the universe.
So the SBA tends to be overweight global equity,
slightly underweight fixed income, and then just
slightly underweight to the private market asset
classes, although that gap has been shrinking over
the past couple of years.
Performance continues to be strong relative to
the median defined benefit plan fund in this
universe. And drum roll, please. Over the one year
period, the FRS continues to remain the first. I
think that the rank was number one through September
as well over the one year period. And then over the
1
2
3
4
5
6
7
8
9
10
11
12
13
14
15
16
17
18
19
20
21
22
23
24
25
140
ACCURATE STENOTYPE REPORTERS, INC.
three, five and ten, up in the top quartile. So,
again, continued strong performance relative to
peers as well. Most of that is driven by that
overweight to global equity, as we continue to see
strong returns from that part of the market.
Please let me know if you have questions,
otherwise I'm just going to continue on.
MR. COLLINS: The incredible insight of
(inaudible).
MS. DOYLE: We lost you there.
MR. COLLINS: You don't think any of that is
due to the incredible insight of the Investment
Advisory Council?
MS. DOYLE: You're right. I was remiss in
mentioning that. You're right. And the chairman,
of course, right?
MR. COLLINS: Keep going.
MS. DOYLE: So the investment plan results
continue to be strong as well. Joan just mentioned
the strong absolute return for the one year period.
But, again, I think what's even more notable here is
the continued outperformance. So this is indicating
that the active managers in the program continue to
outperform, and the beneficiaries and active members
continue to benefit from the strong performance of
1
2
3
4
5
6
7
8
9
10
11
12
13
14
15
16
17
18
19
20
21
22
23
24
25

141
ACCURATE STENOTYPE REPORTERS, INC.
the active managers in the program.
The chart on the bottom here is one that
doesn't change. It only changes once a year, and I
believe my colleague Katy went over this at the last
meeting, so I will move on.
Again, as I mentioned, for the more
conservative mandates, like the CAT Fund, which is
invested solely in fixed income, continued strong
outperformance relative to its benchmarks, but again
sort of muted absolute returns, just given the low
interest rate environment that we continue to be in.
And then we'll look at Lawton Chiles. Similar
to the FRS, to the pension, strong absolute and
relative performance, up 18.5 percent for the one
year period and was able to again achieve an
outperformance, some alpha, even in a very, very
strong environment.
And last but not least we have the Florida
PRIME, which if you remember we benchmarked to a
peer universe of other local government investment
pools. And the Florida PRIME continues to
outperform that benchmark over all periods. And
with that, I'm happy to answer any questions.
Otherwise that concludes my comments.
MR. COLLINS: Does anybody have any questions
1
2
3
4
5
6
7
8
9
10
11
12
13
14
15
16
17
18
19
20
21
22
23
24
25
142
ACCURATE STENOTYPE REPORTERS, INC.
for Kristen or Aon about the review? Okay. Ash, I
understand we have a couple of guests today. If you
wouldn't mind introducing them and giving them a few
minutes to talk to the board.
MR. WILLIAMS: We do. We have Jim Baker, with
the Private Equity Stakeholder Project, and William
Ortiz of Organize Florida. So if you guys would
like to speak, we need to get you on the record, so
you have a mike here. Please use that.
MR. BAKER: I have materials I'll hand out
while William starts.
MR. ORTIZ: Good afternoon, everyone. My name
is William Ortiz. I am Puerto Rican, and I'm also a
student at Florida State University, studying
international affairs. I'm here to talk about the
foreclosure crisis in Puerto Rico and ask the State
Board of Administration to halt its investments in
companies that are driving the crisis in Puerto
Rico.
Puerto Rico has been facing difficult
situations ever since the U.S. first invaded in
1898. This is just a more recent crisis in a long
history of them. Tomorrow is the six-month
anniversary of Hurricane Maria making landfall in
Puerto Rico. The hurricane devastated the island
1
2
3
4
5
6
7
8
9
10
11
12
13
14
15
16
17
18
19
20
21
22
23
24
25

143
ACCURATE STENOTYPE REPORTERS, INC.
after it already faced an 11-year recession. And
six months later, hundreds of thousands of people in
Puerto Rico are still without power, and many others
face regular power outages. And thousands of small
businesses remain closed, and more are still
closing.
Right before the hurricane hit, a family member
of mine suffered a stroke and was hospitalized. It
was extremely stressful for my family, as power
lines and phone lines were shut down. We could not
contact our family for two weeks to see if he was
fine. It's families like mine in Puerto Rico that
investing in firms like Blackstone would be
suffering from, families like mine.
Beginning in 2016 Puerto Rico fell into a debt
crisis. Since Puerto Rico is still a colony under
the status of an unincorporated territory, it cannot
declare bankruptcy on their debts of over
$70 billion like a state or city like Detroit would
be able to. And since they lack national
sovereignty, Puerto Rico does not have access to
international credit and are forced to borrow loans
from the vulture capitalist firms that seek to
maximize profits at the expense of people on the
island.
1
2
3
4
5
6
7
8
9
10
11
12
13
14
15
16
17
18
19
20
21
22
23
24
25
144
ACCURATE STENOTYPE REPORTERS, INC.
These neocolonial economic conditions have
created an unsustainable living condition in Puerto
Rico, which has forced people to flee their
homeland. Since the year 2000, Puerto Rico has lost
an estimated half a million people. Hurricane Maria
has exacerbated both the economic and population
crisis.
The hurricane was a natural disaster, but now
the island is facing another economic crisis, a
foreclosure crisis. Even before the hurricane,
foreclosures in Puerto Rico have reached record
levels. Many families cannot afford to make
mortgage payments because they don't have a job as a
result of the hurricane and economic crisis on the
island.
Companies like Blackstone and TPG have
foreclosed on many home owners in Puerto Rico. And
it's not right that our state has invested hundreds
of millions of dollars with Blackstone and TPG. Our
state has to take a stand. We should not be
investing in companies that are exploiting the
situation that Puerto Ricans now face.
I'm asking the State of Florida to halt
investments with Blackstone and TPG until they
provide a path for Puerto Rican families to stay in
1
2
3
4
5
6
7
8
9
10
11
12
13
14
15
16
17
18
19
20
21
22
23
24
25

145
ACCURATE STENOTYPE REPORTERS, INC.
their homes.
The federal government is ignoring the plight
of Puerto Ricans by failing to provide adequate aid
after the hurricane and creating the PROMESA Fiscal
Control Board that aims to strangle the Puerto Rican
economy of every last dime. I hope the State of
Florida won't do the same. We should be valuing the
people of Puerto Rico over profits. Thank you.
MR. BAKER: Good afternoon, Mr. Chair, members
of the board.
MR. COLLINS: Thank you.
MR. BAKER: Good afternoon, Mr. Chair, members
of the board. My name is Jim Baker with the Private
Equity Stakeholder Project. As you know, Florida is
a major investor with both The Blackstone Group and
TPG Capital, two large private equity managers.
Recent media accounts have highlighted the roles
that TPG and Blackstone are playing in driving
the -- or have played in driving the foreclosure
crisis in Puerto Rico. Those are included in the
packet that I handed out to folks in the room but
can also share electronically for folks who are not
here in person.
From the New York Times on December 16th,
Blackstone owns a company, Finance of America
1
2
3
4
5
6
7
8
9
10
11
12
13
14
15
16
17
18
19
20
21
22
23
24
25
146
ACCURATE STENOTYPE REPORTERS, INC.
Reverse, that specializes in a type of home loan
called a reverse mortgage, which is guaranteed by
the federal government. There are 10,000 reverse
mortgages in Puerto Rico, and Finance of America
controls about 40 percent of the market. Court
records show that the Blackstone-controlled company
is aggressive in its pursuit of and foreclosures on
borrowers.
Then from The Intercept on December 22nd,
Roosevelt Cayman Asset Company has 289 active
foreclosure cases in federal court and another 56 in
local Puerto Rican courts. Federal courts,
typically not a venue for foreclosure cases, are
seen as faster than local courts. So offshore
companies like Roosevelt lean heavily on them.
Roosevelt is an affiliate of Rushmore Loan
Management Services, which in turn services loans
owned by private equity giant TPG Capital.
Even prior to our recent hurricanes, Puerto
Rico has faced an unprecedented foreclosure crisis
that has destabilized families and communities. In
June 2017 an average of 18 families lost homes every
day to foreclosure in Puerto Rico, more than double
the rate a decade ago during the global financial
crisis. A record 5,424 homes were foreclosed last
1
2
3
4
5
6
7
8
9
10
11
12
13
14
15
16
17
18
19
20
21
22
23
24
25

147
ACCURATE STENOTYPE REPORTERS, INC.
year, up 130 percent from nearly a decade ago when
the government first began tracking the numbers.
Three months ago the New York Times reported
that nearly one-third of the island's 425,000 home
owners are behind on their mortgage payments to
banks and Wall Street firms that previously bought
up distressed mortgages. As of January 2018, a data
firm Black Knight found 57,000 loans remain in
delinquency in Puerto Rico, and 49,000 of them
seriously so.
Recently, community groups and Puerto Rican
diaspora groups sent letters to TPG Capital and
Blackstone Group to discuss the firm's foreclosures.
We spoke to Blackstone and Finance of America more
than a month ago and provided the company a set of
proposals to enable families to stay in their homes.
Unfortunately, Blackstone has not responded to
those proposals thus far. In addition, Blackstone's
Finance of America is continuing to advance on
foreclosure suits in Puerto Rico, despite there
being an FHA foreclosure moratorium in place. For
example, see the motion for service by publication
that I included in your packet.
TPG Capital did respond and has put a temporary
halt through late May on many but not all of its
1
2
3
4
5
6
7
8
9
10
11
12
13
14
15
16
17
18
19
20
21
22
23
24
25
148
ACCURATE STENOTYPE REPORTERS, INC.
foreclosure cases in Puerto Rico. We had a positive
meeting with representatives of TPG and its servicer
Rushmore the week before last. TPG indicated that
its moratorium on foreclosures would be extended and
it was reviewing proposals community groups and
Puerto Rican diaspora groups have made to enable
families to stay in their homes. We await more
detail on TPG's specific response.
The Florida State Board of Administration
invested $200 million in Blackstone Tactical
Opportunities Funds 2, which owns Finance of
America, the Blackstone affiliate that's foreclosing
on people in Puerto Rico. Overall, the Florida SBA
has invested at least a billion dollars with
Blackstone since 2012.
The SBA has invested $200 million in TPG's TSSP
Adjacent Opportunities fund. TSSP is the arm of TPG
that has invested in Puerto Rican mortgages and
foreclosed on home owners and small business owners
in Puerto Rico. Overall, the SBA has invested at
least $400 million with TPG since 2012.
Given the devastation that Puerto Rico faces,
we ask that the Florida State Board of
Administration halt further investments with TPG and
Blackstone until they provide a path for families to
1
2
3
4
5
6
7
8
9
10
11
12
13
14
15
16
17
18
19
20
21
22
23
24
25

149
ACCURATE STENOTYPE REPORTERS, INC.
stay in their homes. Thank you.
MR. COLLINS: Thank you to Mr. Baker and
Mr. Ortiz for your comments. I think that several
members of the committee have gotten -- have
received correspondence, and I know that Ash has
received some correspondence. Ash, any comment from
you on this?
MR. WILLIAMS: No, I don't believe so. I met
with Mr. Baker last week, and we're in regular
contact on this and other issues. We have a good
rapport with them.
MR. COLLINS: Okay. Well, thank you,
gentlemen, for coming and presenting your views on
the Puerto Rican situation. I know that it's
something that's on all of our minds. We all have
friends who have been impacted, so appreciate what
you-all are doing on behalf of the people in Puerto
Rico.
Okay. Any other -- anybody else in the
audience, Ash, that would wish to say something?
MR. WILLIAMS: Anyone else want to be heard?
Dennis MacKee is back there grinning, but we're not
calling on him.
MR. COLLINS: I just wanted to one more time
just say thank you again to Joan for her service to
1
2
3
4
5
6
7
8
9
10
11
12
13
14
15
16
17
18
19
20
21
22
23
24
25
150
ACCURATE STENOTYPE REPORTERS, INC.
the State Board, really appreciate all that you've
given to the board over the years, and you will
surely be missed.
MS. HASEMAN: Thank you.
MR. COLLINS: With that, I will take a motion
to adjourn.
MR. DANIELS: So moved.
MR. OLMSTEAD: Second.
(Ayes)
MR. COLLINS: Nobody wants to adjourn? Do we
want to talk about leverage?
MS. DOYLE: He couldn't hear because the mike
wasn't on.
MR. WILLIAMS: Sorry. There was a motion, a
second and a unanimous vote, except for the
chairman. So do you want to stay in session?
MR. COLLINS: I thought somebody was going to
take up leverage again. I was getting ready for
round two.
MR. WILLIAMS: Steve looks tired.
MR. COLLINS: All right. We are adjourned.
Thank you, everybody.
(Whereupon, the meeting was concluded at 4:30
p.m.)
1
2
3
4
5
6
7
8
9
10
11
12
13
14
15
16
17
18
19
20
21
22
23
24
25

151
ACCURATE STENOTYPE REPORTERS, INC.
CERTIFICATE OF REPORTER
STATE OF FLORIDA )
COUNTY OF LEON )
I, Jo Langston, Registered Professional
Reporter, do hereby certify that the foregoing pages 3
through 150, both inclusive, comprise a true and correct
transcript of the proceeding; that said proceeding was
taken by me stenographically and transcribed by me as it
now appears; that I am not a relative or employee or
attorney or counsel of the parties, or a relative or
employee of such attorney or counsel, nor am I interested
in this proceeding or its outcome.
IN WITNESS WHEREOF, I have hereunto set my hand
this 10th day of April 2018.
_______________________________
JO LANGSTON Registered Professional Reporter
1
2
3
4
5
6
7
8
9
10
11
12
13
14
15
16
17
18
19
20
21
22
23
24
25

STATE BOARD OF ADMINISTRATION Audit Committee Open Meeting
Agenda April 30, 2018
9:30 A.M. – Noon
1. Call to Order 2. Approval of the minutes of Open and Closed meetings held on January 29, 2018
3. SBA Executive Director & CIO status report
SBA Update: investment performance, risks, opportunities and challenges
4. Presentation of Crowe Horwath’s audit plan for the financial statement audits of FRS Pension Plan and FRS Investment Plan for the year ending June 30, 2018
5. Presentation of OIA’s Compliance Advisory Engagement
6. Update on Management’s Response to GRC Report
7. Proposed FY 2018-2019 Internal Audit Budget 8. OIA Annual Audit Plan for FY 2018-2019
9. Office of Internal Audit Quarterly Report
10. Chief Risk & Compliance Officer Quarterly Report
11. Other items of interest 12. Closing remarks of the Audit Committee Chair and Members 13. Adjournment
April 30, 2018
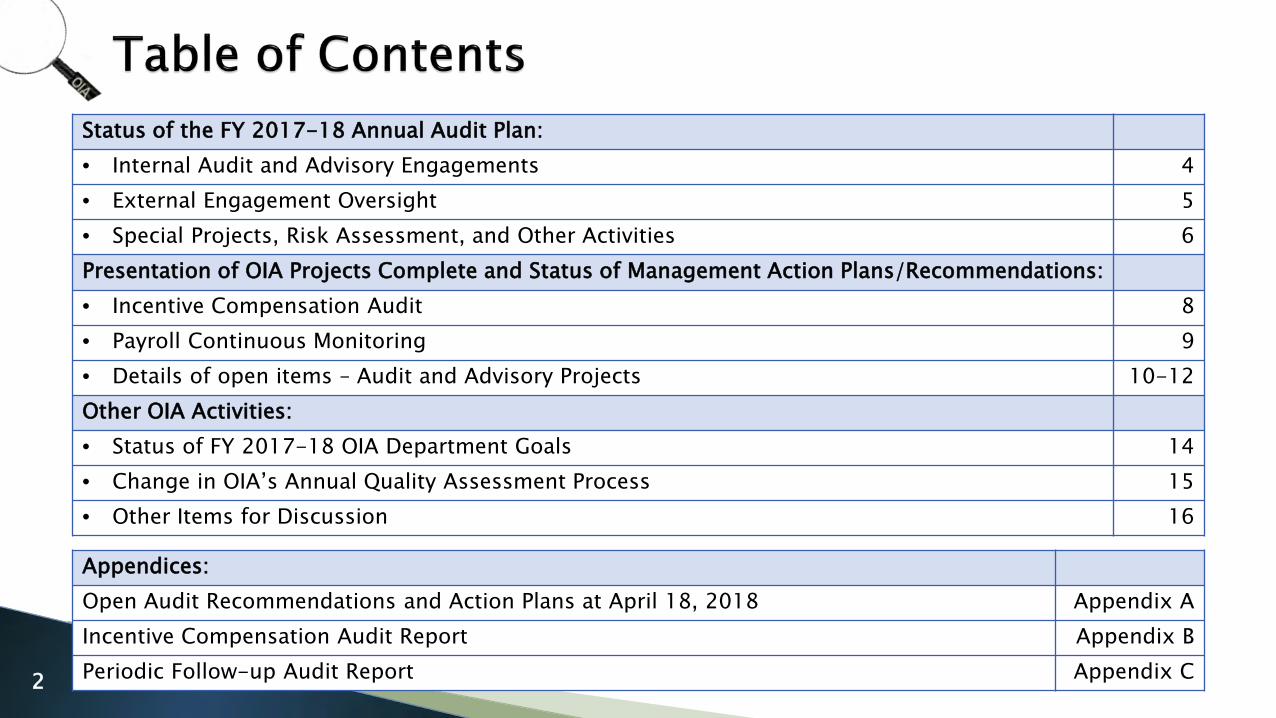
2
Status of the FY 2017-18 Annual Audit Plan:• Internal Audit and Advisory Engagements 4• External Engagement Oversight 5• Special Projects, Risk Assessment, and Other Activities 6Presentation of OIA Projects Complete and Status of Management Action Plans/Recommendations:• Incentive Compensation Audit 8• Payroll Continuous Monitoring 9• Details of open items – Audit and Advisory Projects 10-12Other OIA Activities:• Status of FY 2017-18 OIA Department Goals 14• Change in OIA’s Annual Quality Assessment Process 15• Other Items for Discussion 16
Appendices:Open Audit Recommendations and Action Plans at April 18, 2018 Appendix AIncentive Compensation Audit Report Appendix BPeriodic Follow-up Audit Report Appendix C

33

4
Completed73%
In Progress9%
Not Yet Started
18%
Internal Audit and Advisory Engagements
Highlighted: Completed since prior quarterly report.
Projects Status Type Planned Timing
CompletedInternal Controls over Financial Reporting - DC OIA Advisory Q1Real Estate, commingled OIA Operational Audit Q1Continuous Monitoring - GE (Cost by Dealer report only) OIA Advisory Q1Internal Controls Assessment - RE Cash Transfers OIA Advisory Q2Quarterly Follow-up Audits/Action Plan Monitoring OIA Operational Audit/Project Management OngoingContinuous Monitoring - Payroll OIA Advisory Q2Compliance Advisory, automation, efficiencies and gaps OIA Advisory Q2/Q3Incentive Compensation Audit OIA Operational Audit Q3/Q4In ProgressExternally Managed Derivatives Audit OIA Operational Audit Q3/Q4Not StartedContinuous Monitoring - Accounts Payable OIA Advisory Q3/Q4Continuous Monitoring - Pcards OIA Advisory Q3/Q4
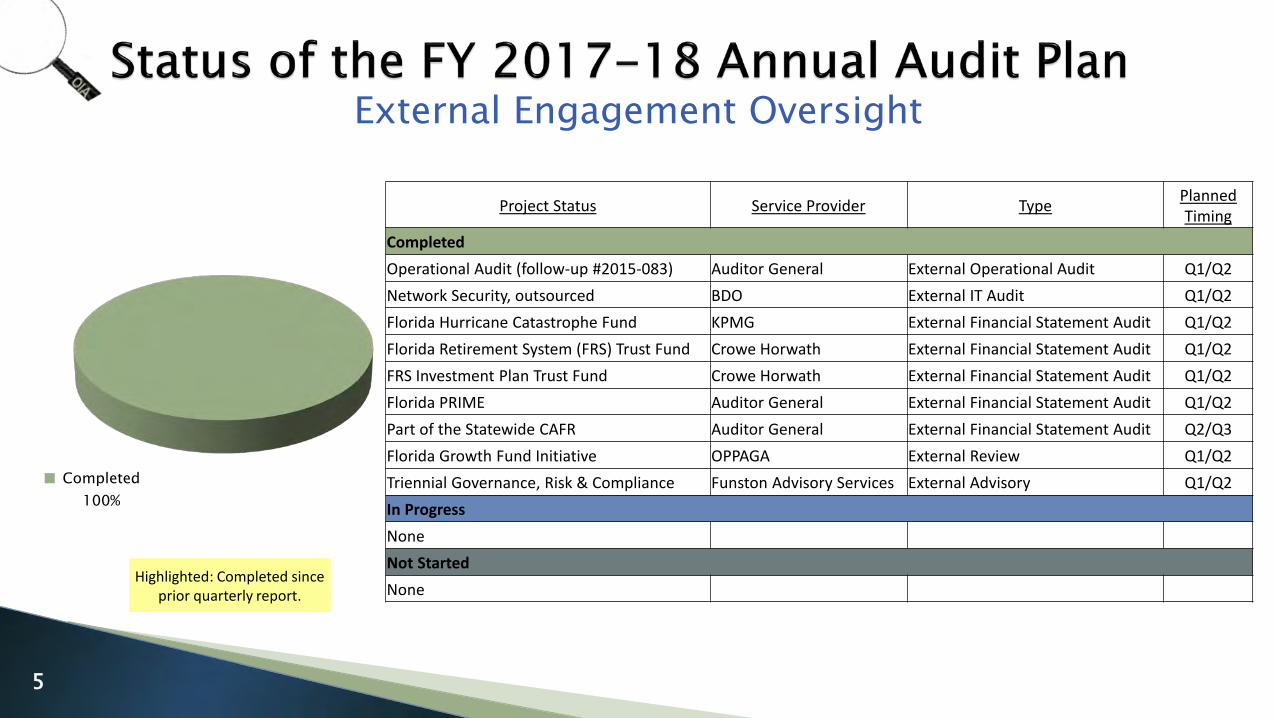
5
External Engagement Oversight
Completed100%
Highlighted: Completed since prior quarterly report.
Project Status Service Provider Type Planned Timing
CompletedOperational Audit (follow-up #2015-083) Auditor General External Operational Audit Q1/Q2Network Security, outsourced BDO External IT Audit Q1/Q2Florida Hurricane Catastrophe Fund KPMG External Financial Statement Audit Q1/Q2Florida Retirement System (FRS) Trust Fund Crowe Horwath External Financial Statement Audit Q1/Q2FRS Investment Plan Trust Fund Crowe Horwath External Financial Statement Audit Q1/Q2Florida PRIME Auditor General External Financial Statement Audit Q1/Q2Part of the Statewide CAFR Auditor General External Financial Statement Audit Q2/Q3Florida Growth Fund Initiative OPPAGA External Review Q1/Q2Triennial Governance, Risk & Compliance Funston Advisory Services External Advisory Q1/Q2In ProgressNoneNot StartedNone

6
Completed17%
Not Yet Started
8%
Ongoing / In
Progress75%
Special Projects, Risk Assessments, and Other Activities
Project Status Type Planned Timing
CompletedAnnual Risk Assessment OIA Risk Assessment Q1/Q2Risk Assessment Updates OIA Risk Assessment Q3/Q4Annual Audit Plan OIA Risk Assessment Q3/Q4Ongoing/In ProgressSpecial requests from SBA management and/or Audit Committee OIA Special Projects OngoingWorkSmart Portal Enhancements OIA Special Projects OngoingIntegrated Risk Management Solution Cost Benefit Analysis OIA Special Projects Q2/Q3Data Analytics Tools Enhancements OIA Special Projects OngoingISO 22301 Implementation Analysis (new request from management) OIA Special Projects Q4ACH Advisory Project for FHCF OIA Special Projects Q4OIA process improvement initiatives, including QAR identified initiatives OIA Quality Assurance OngoingAudit Committee Related Activities OIA Audit Committee OngoingNot Yet StartedAnnual Quality Assessment Review OIA Quality Assurance Q3/Q4
Highlighted: Completed since prior quarterly report.

77

8
Our risk-based audit assessed the existence, adequacy and effectiveness of internal controls, and compliance to relevant policies and procedures for three separate, but similar incentive compensation plans for FY 2015-16 and FY 2016-17. We evaluated the accuracy of participant information in the SBA systems and when possible, we performed data analytics and recalculations on select data for the same period. For flowcharts of these processes, see the appendix included in the report.
Plans In-Scope1. The Incentive Compensation Plan for the ED&CIO2. The Incentive Compensation Plan for Certain SBA Employees Other than the ED&CIO (Pension Plan)3. The Incentive Compensation Plan for Certain SBA Employees –FRS Investment Plan
Legend for Control Effectiveness Rating
# of Key Controls
Effective 11
Improvement Needed 1
Not Effective 3
Total Key Controls 15
Observations in the Report: Status of Action Plan:0 High NA3 Medium Target completion date for
one observation is May 31, 2018 and for the other two observations is June 30, 2018
2 Low Target completion date forone observation is June30, 2018 and the second observation, not related to key controls is June 30, 2019
5 Total Observations

9
Payroll Continuous Monitoring – This engagement was created to provide management with a means to review potential anomalies in the payroll data at a glance and provide assurance that due diligence was exercised in regard to payroll processing. The two objectives of this engagement:
1. Recreate the tests and scripts of two separate payroll tests in a single consistent, repeatable set of tests in Tableau:
a. Tests from the 2014 Payroll Data Analytics, depending on the available data;
b. Tests from the pre-packaged IDEA scripts purchased in 2016, depending on the available data;
c. Tableau dashboard resulted in 14 tests, with 3 “alternate” looks at 3 of the 14.
2. Identify anomalies (if any exist) in Payroll data

10
# of Recs SourceNew recommendations
2 OIA Report 2018-03 Real Estate Cash Transfers Advisory6 OIA Report 2018-06 Incentive Compensation Program Operational Audit (Appendix B)
85 Governance, Risk Management, and Compliance Assessment (Funston) (Note 1)93 Total recommendations added to the database
Closed action plans and recommendations: (Note 2)(1) OIA Report 2017-03 Global Equity Internal Trading Operational Audit
Reported in the OIA Report 2018-07,Periodic Follow-up Audit (Appendix C)
(4) OIA Report 2017-05 Internally Managed Derivatives Operational Audit
(1) OIA Report 2017-08 Real Estate Externally Managed Portfolios Operational Audit
(1) Fiscal Year 2016-17 FRS Audit (Crowe Horwath)(7) Total action plans/recommendations closed in the database86 Total Change for both Audit and Advisory Action Plans/Recommendations
Audit and Advisory Engagements
Note 1: Funston’s report originally included a total of 110 recommendations. The SBA has reviewed and combined some of these recommendations for a total of 85, and will continue to combine as it makes sense to do so.
Note 2: Advisory recommendations closed as part of our annual risk assessment will be reflected on the next quarterly report to the Audit Committee.

11
Legend:NYI - Not Yet ImplementedPIRP - Partially Implemented and the Remainder is in ProgressOTV - OIA to Verify
Management Action Plans relating to findings from audits performed by internal or external auditors. The OIA monitors and performs follow-up procedures on the management action plans in accordance with the IIA Standard 2500. A1. In certain cases, follow-up procedures are performed by external auditors.
0
5
10
15
20
25
NYI PI OTV
Low
Med
High
Risk Rating Status
Report Title Report Date High Med Low Total NYI PIRP OTV TotalTravel Services Operational Audit (OIA) 02/13/2015 1 1 1 1Accounts Payable Continuous Audit (OIA) 08/07/2015 2 2 2 2Fixed Income Trading Activities Operational Audit (OIA) 01/29/2016 1 1 2 2 2Trust Services Operational Audit (OIA) 07/25/2016 1 1 1 1Global Equity Internal Trading Activities Operational Audit (OIA) 01/18/2017 1 1 2 2 2
Internally Managed Derivatives Operational Audit (OIA) 03/31/2017 5 1 2 8 6 2 8Auditor General IT Operational Audit 2017 04/05/2017 9 9 2 7 9Auditor General Operational Audit 2017 11/13/2017 1 1 2 1 1 2Fiscal Year 2016-17 FRS Audit (Crowe Horwath) 11/06/2017 1 1 1 1Incentive Compensation Program Operational Audit (OIA) 04/10/2018 4 2 6 6 6
7 19 8 34 21 3 10 34
21% 56% 24% 62% 9% 29%
For details, see Appendix A.
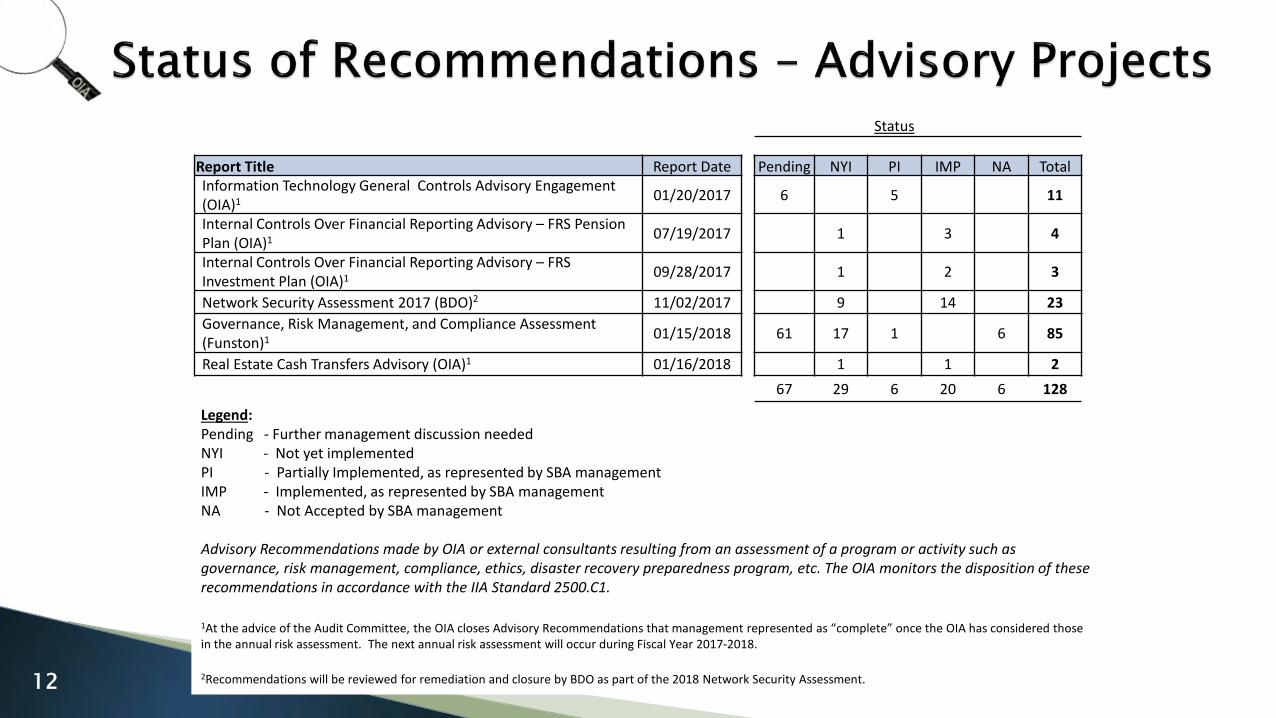
12
Legend:Pending - Further management discussion neededNYI - Not yet implementedPI - Partially Implemented, as represented by SBA managementIMP - Implemented, as represented by SBA managementNA - Not Accepted by SBA management
Advisory Recommendations made by OIA or external consultants resulting from an assessment of a program or activity such as governance, risk management, compliance, ethics, disaster recovery preparedness program, etc. The OIA monitors the disposition of these recommendations in accordance with the IIA Standard 2500.C1.
1At the advice of the Audit Committee, the OIA closes Advisory Recommendations that management represented as “complete” once the OIA has considered those in the annual risk assessment. The next annual risk assessment will occur during Fiscal Year 2017-2018.
2Recommendations will be reviewed for remediation and closure by BDO as part of the 2018 Network Security Assessment.
Status
Report Title Report Date Pending NYI PI IMP NA TotalInformation Technology General Controls Advisory Engagement (OIA)1 01/20/2017 6 5 11
Internal Controls Over Financial Reporting Advisory – FRS Pension Plan (OIA)1 07/19/2017 1 3 4
Internal Controls Over Financial Reporting Advisory – FRS Investment Plan (OIA)1 09/28/2017 1 2 3
Network Security Assessment 2017 (BDO)2 11/02/2017 9 14 23Governance, Risk Management, and Compliance Assessment (Funston)1 01/15/2018 61 17 1 6 85
Real Estate Cash Transfers Advisory (OIA)1 01/16/2018 1 1 267 29 6 20 6 128

1313

14
Completed52%
In Progress / Ongoing
33%
Not Started15% Completed In Progress /
OngoingNot Yet Started
Annual Audit Plan 3 2 1Successfully deliver the fiscal year 2016-17 Audit Plan and budget. Enhance communication of the COSO internal control framework.
Internal Audit Process 4 2 2Focus on enhancing OIA processes, programs and procedures, resulting in more efficient operation of the department administration and the effective development and utilization of department resources.
Use of Technology 2 3 0Implement audit technology solutions to enhance department effectiveness and efficiency.
People 5 2 1Evaluate staffing and development needs.

15
OIA is recommending a rolling quality assessment process, as follows:
◦ 2014: Self-Assessment with external validation◦ 2015: Self-Assessment◦ 2016: Self-Assessment◦ 2017: Self-Assessment◦ 2018: GRC Assessment◦ 2019: Self-Assessment with external validation◦ 2020: Self-Assessment◦ 2021: Self-Assessment◦ 2022: Self-Assessment◦ 2023: GRC Assessment (Recommending changing the Audit Committee Charter to perform the
GRC Assessment every five years instead of every three years)

16
Externally Managed Derivatives Audit Update
Integrated Risk Management Solution Update
Introduce Intern
Next Audit Committee Meeting Dates◦ Monday, August 6, 2018◦ Monday, November 26, 2018


STATE BOARD OF ADMINISTRATION OF FLORIDA
1801 HERMITAGE BOULEVARD, SUITE 100
TALLAHASSEE, FLORIDA 32308 (850) 488-4406
POST OFFICE BOX 13300
32317-3300
RICK SCOTT GOVERNOR
CHAIR
JIMMY PATRONIS CHIEF FINANCIAL OFFICER
PAM BONDI
ATTORNEY GENERAL
ASH WILLIAMS EXECUTIVE DIRECTOR & CIO
MEMORANDUM To: Ash Williams From: Michael McCauley Date: May 21, 2018 Subject: Quarterly Standing Report - Investment Programs & Governance
GLOBAL EQUITY PROXY VOTING & OPERATIONS During the first quarter of 2018, SBA staff cast votes at 1,458 companies worldwide, voting on ballot items including director elections, audit firm ratification, executive compensation plans, merger & acquisitions, and a variety of other management and shareowner proposals. These votes involved 11,041 distinct voting items—voting 76.5 percent “For’’, 20.9 percent “Against”, and 2.5 percent as “Abstained.” Of all votes cast, 21.6 percent were “Against” the management-recommended-vote. SBA proxy voting was conducted across 55 countries, with the top five countries comprised of the South Korea (433 votes), United States (215), Japan (146), India (82), and China (52). The table below provides major statistics on the SBA’s proxy voting activities during the most recent quarter ending on March 31, 2018:
Votes in Favor 76.5%
Votes aligned to Management’s Recommendation
78.4%
Most Voted Market (# of Votes)
South Korea (433)
Total Voting Items
(All Markets) 11,041
CORPORATE GOVERNANCE & PROXY VOTING OVERSIGHT GROUP The most recent meeting of the Corporate Governance & Proxy Voting Oversight Group (Proxy Committee) occurred on March 27, 2018, and the Committee will meet next on June 20, 2018. The Proxy Committee continues to review ongoing governance issues including the volume and trends for recent SBA proxy votes, company-specific voting scenarios, corporate governance policies, governance-related investment factors, major regulatory developments and individual company research related to the Protecting Florida’s Investments Act (PFIA) and recent statutory investment requirements implemented for Israel and Venezuela. LEADERSHIP & SPEAKING EVENTS Staff periodically participates in and often is an invited presenter at investor and other governance conferences. Typically, these events include significant involvement by corporate directors, senior members of management,
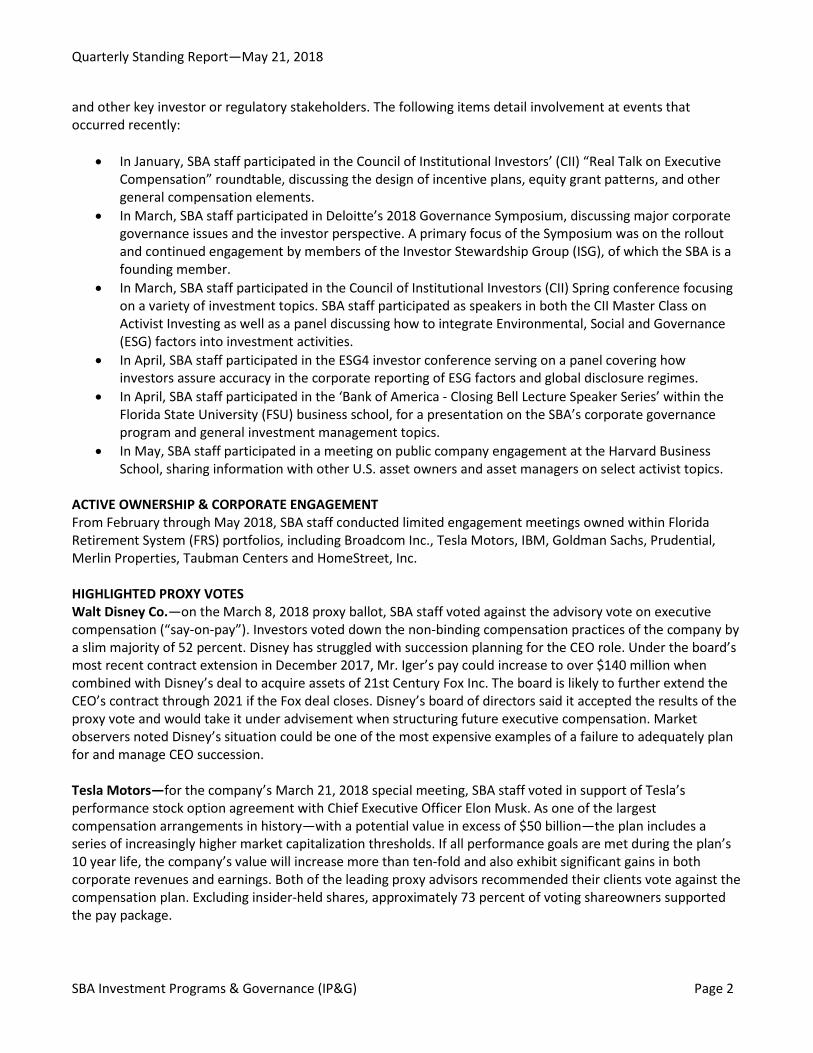
Quarterly Standing Report—May 21, 2018
SBA Investment Programs & Governance (IP&G) Page 2
and other key investor or regulatory stakeholders. The following items detail involvement at events that occurred recently:
• In January, SBA staff participated in the Council of Institutional Investors’ (CII) “Real Talk on Executive Compensation” roundtable, discussing the design of incentive plans, equity grant patterns, and other general compensation elements.
• In March, SBA staff participated in Deloitte’s 2018 Governance Symposium, discussing major corporate governance issues and the investor perspective. A primary focus of the Symposium was on the rollout and continued engagement by members of the Investor Stewardship Group (ISG), of which the SBA is a founding member.
• In March, SBA staff participated in the Council of Institutional Investors (CII) Spring conference focusing on a variety of investment topics. SBA staff participated as speakers in both the CII Master Class on Activist Investing as well as a panel discussing how to integrate Environmental, Social and Governance (ESG) factors into investment activities.
• In April, SBA staff participated in the ESG4 investor conference serving on a panel covering how investors assure accuracy in the corporate reporting of ESG factors and global disclosure regimes.
• In April, SBA staff participated in the ‘Bank of America - Closing Bell Lecture Speaker Series’ within the Florida State University (FSU) business school, for a presentation on the SBA’s corporate governance program and general investment management topics.
• In May, SBA staff participated in a meeting on public company engagement at the Harvard Business School, sharing information with other U.S. asset owners and asset managers on select activist topics.
ACTIVE OWNERSHIP & CORPORATE ENGAGEMENT From February through May 2018, SBA staff conducted limited engagement meetings owned within Florida Retirement System (FRS) portfolios, including Broadcom Inc., Tesla Motors, IBM, Goldman Sachs, Prudential, Merlin Properties, Taubman Centers and HomeStreet, Inc. HIGHLIGHTED PROXY VOTES Walt Disney Co.—on the March 8, 2018 proxy ballot, SBA staff voted against the advisory vote on executive compensation (“say-on-pay”). Investors voted down the non-binding compensation practices of the company by a slim majority of 52 percent. Disney has struggled with succession planning for the CEO role. Under the board’s most recent contract extension in December 2017, Mr. Iger’s pay could increase to over $140 million when combined with Disney’s deal to acquire assets of 21st Century Fox Inc. The board is likely to further extend the CEO’s contract through 2021 if the Fox deal closes. Disney’s board of directors said it accepted the results of the proxy vote and would take it under advisement when structuring future executive compensation. Market observers noted Disney’s situation could be one of the most expensive examples of a failure to adequately plan for and manage CEO succession. Tesla Motors—for the company’s March 21, 2018 special meeting, SBA staff voted in support of Tesla’s performance stock option agreement with Chief Executive Officer Elon Musk. As one of the largest compensation arrangements in history—with a potential value in excess of $50 billion—the plan includes a series of increasingly higher market capitalization thresholds. If all performance goals are met during the plan’s 10 year life, the company’s value will increase more than ten-fold and also exhibit significant gains in both corporate revenues and earnings. Both of the leading proxy advisors recommended their clients vote against the compensation plan. Excluding insider-held shares, approximately 73 percent of voting shareowners supported the pay package.
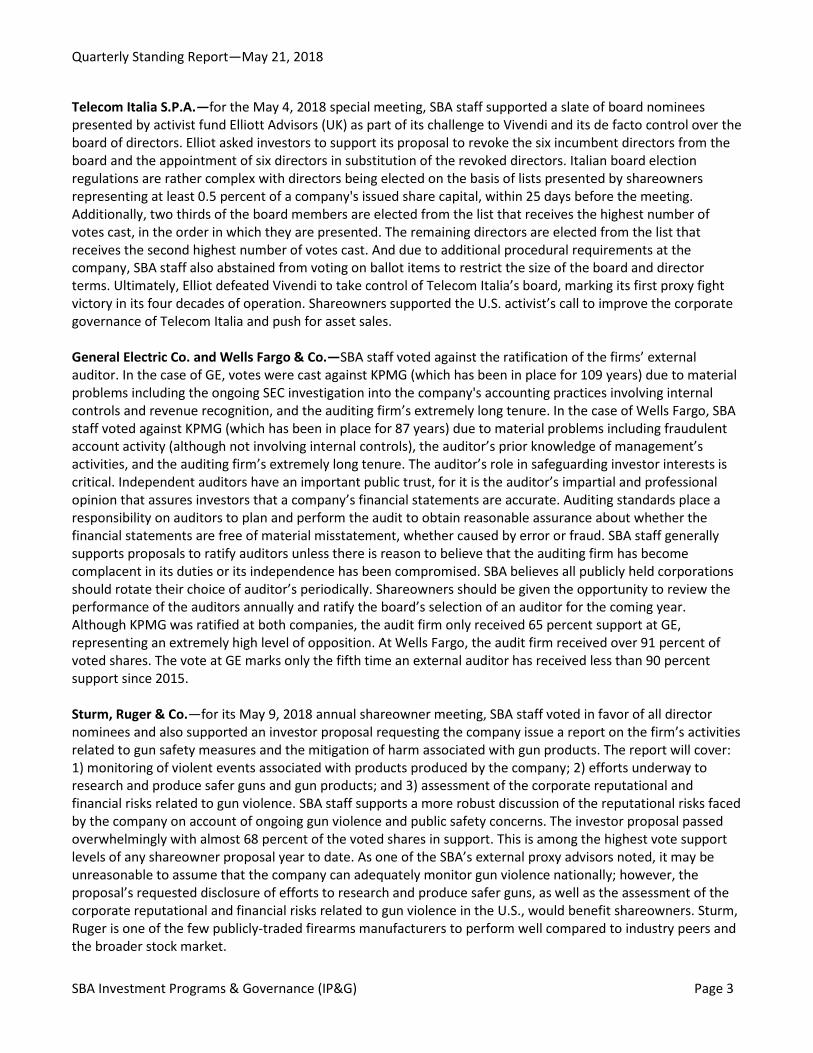
Quarterly Standing Report—May 21, 2018
SBA Investment Programs & Governance (IP&G) Page 3
Telecom Italia S.P.A.—for the May 4, 2018 special meeting, SBA staff supported a slate of board nominees presented by activist fund Elliott Advisors (UK) as part of its challenge to Vivendi and its de facto control over the board of directors. Elliot asked investors to support its proposal to revoke the six incumbent directors from the board and the appointment of six directors in substitution of the revoked directors. Italian board election regulations are rather complex with directors being elected on the basis of lists presented by shareowners representing at least 0.5 percent of a company's issued share capital, within 25 days before the meeting. Additionally, two thirds of the board members are elected from the list that receives the highest number of votes cast, in the order in which they are presented. The remaining directors are elected from the list that receives the second highest number of votes cast. And due to additional procedural requirements at the company, SBA staff also abstained from voting on ballot items to restrict the size of the board and director terms. Ultimately, Elliot defeated Vivendi to take control of Telecom Italia’s board, marking its first proxy fight victory in its four decades of operation. Shareowners supported the U.S. activist’s call to improve the corporate governance of Telecom Italia and push for asset sales. General Electric Co. and Wells Fargo & Co.—SBA staff voted against the ratification of the firms’ external auditor. In the case of GE, votes were cast against KPMG (which has been in place for 109 years) due to material problems including the ongoing SEC investigation into the company's accounting practices involving internal controls and revenue recognition, and the auditing firm’s extremely long tenure. In the case of Wells Fargo, SBA staff voted against KPMG (which has been in place for 87 years) due to material problems including fraudulent account activity (although not involving internal controls), the auditor’s prior knowledge of management’s activities, and the auditing firm’s extremely long tenure. The auditor’s role in safeguarding investor interests is critical. Independent auditors have an important public trust, for it is the auditor’s impartial and professional opinion that assures investors that a company’s financial statements are accurate. Auditing standards place a responsibility on auditors to plan and perform the audit to obtain reasonable assurance about whether the financial statements are free of material misstatement, whether caused by error or fraud. SBA staff generally supports proposals to ratify auditors unless there is reason to believe that the auditing firm has become complacent in its duties or its independence has been compromised. SBA believes all publicly held corporations should rotate their choice of auditor’s periodically. Shareowners should be given the opportunity to review the performance of the auditors annually and ratify the board’s selection of an auditor for the coming year. Although KPMG was ratified at both companies, the audit firm only received 65 percent support at GE, representing an extremely high level of opposition. At Wells Fargo, the audit firm received over 91 percent of voted shares. The vote at GE marks only the fifth time an external auditor has received less than 90 percent support since 2015. Sturm, Ruger & Co.—for its May 9, 2018 annual shareowner meeting, SBA staff voted in favor of all director nominees and also supported an investor proposal requesting the company issue a report on the firm’s activities related to gun safety measures and the mitigation of harm associated with gun products. The report will cover: 1) monitoring of violent events associated with products produced by the company; 2) efforts underway to research and produce safer guns and gun products; and 3) assessment of the corporate reputational and financial risks related to gun violence. SBA staff supports a more robust discussion of the reputational risks faced by the company on account of ongoing gun violence and public safety concerns. The investor proposal passed overwhelmingly with almost 68 percent of the voted shares in support. This is among the highest vote support levels of any shareowner proposal year to date. As one of the SBA’s external proxy advisors noted, it may be unreasonable to assume that the company can adequately monitor gun violence nationally; however, the proposal’s requested disclosure of efforts to research and produce safer guns, as well as the assessment of the corporate reputational and financial risks related to gun violence in the U.S., would benefit shareowners. Sturm, Ruger is one of the few publicly-traded firearms manufacturers to perform well compared to industry peers and the broader stock market.

Quarterly Standing Report—May 21, 2018
SBA Investment Programs & Governance (IP&G) Page 4
USG Corp.—for its May 9, 2018 annual shareowner meeting, SBA staff voted against four management director nominees due to the board’s refusal to enter into takeover negotiations with Gebr. Knauf Verwaltungsgesellschaft KG (“Knauf”), which publicly announced an offer to acquire USG for $5.6 billion, or $42.00 per share in cash, representing a premium of approximately 25.3 percent to USG's unaffected closing share price on the day of the offer. The USG board’s inaction is protected by the company’s extensive structural defense policies, including a poison pill, a classified board, inability for shareowners to call a special meeting and restrictions on actions by written consent. On April 12, 2018, Berkshire Hathaway publicly announced its intention to vote its entire 31 percent share ownership of USG equity against the four USG director candidates. Berkshire’s action represented the first time the investment holding company had ever cast votes against members of the incumbent management at a company it owned. Warren Bufffet stated, “We did not think the [USG's] directors were essentially doing their job." After receiving significant negative votes from over 76 percent of the company’s investors, the board announced on May 1, 2018 that it authorized management to enter into negotiations with Knauf regarding a potential sale of the company. On May 4, 2018, USG and Knauf entered into a confidentiality agreement, pursuant to which USG agreed to provide certain non-public information to Knauf. In addition, Knauf stated that the agreement had a term of two years and contained certain standstill provisions lasting through August 31, 2018. Since the date of the Berkshire Hathaway announcement, the price of the company’s stock has risen over 30 percent. NOTABLE RESEARCH & GOVERNANCE TRENDS Department of Labor (DOL) Guidance on ESG—on April 23, 2018, the Labor Department’s Employee Benefits Security Administration (EBSA) issued Field Assistance Bulletin 2018-01 (FAB 2018-1) clarifying Issues regarding proxy voting, shareholder engagement, and economically targeted investments. The DOL refers to investments that are chosen for reasons other than the economic return to a plan as “economically targeted investments” (ETIs). The newest FAB clarifies earlier interpretations set forth in Interpretive Bulletins (IB) 2015-01 and 2016-01. In IB 2015-01, the Department held that fiduciaries may not sacrifice returns or assume greater risks to promote collateral environmental, social, or corporate governance (ESG) policy goals when making investment decisions. The DOL found that ESG factors may in fact be part of the economic analysis of investments, and so it may be appropriate to apply ESG factors as more than mere “tiebreakers.” In IB 2016-01, the Department addressed issues surrounding written statements of investment policy, proxy voting, and other exercises of shareholder rights by fiduciaries when managing plan assets that are corporate stock. The DOL found that plan fiduciaries may adopt investment policies requiring ESG factors (including governance issues like board composition, transparency or executive compensation) to be taken into account by investment managers in voting proxies to enhance the long-term economic value of investments. For decades, the DOL has consistently interpreted the fiduciary standards of ERISA to require investment decisions to be based primarily on economic factors, such as risk and return. ERISA requires fiduciaries to act with the “exclusive purpose” of providing benefits to participants and beneficiaries and paying reasonable expenses of plan administration. DOL’s guidance on how fiduciaries should take into account environmental, social or governance (ESG) factors has evolved over time. Guidance issued in 2008 generally permitted ESG factors to be used only as a “tiebreaker” among investments that were otherwise determined to be economically equivalent based on a quantitative and qualitative analysis of the investments. Similarly, 2008 guidance found that fiduciaries may violate their duties if they “attempt to further legislative, regulatory or public policy issues through the proxy process.” FAB 2018-01 advises fiduciaries of ERISA-covered plans to “avoid too readily treating ESG issues as being economically relevant to any particular investment choice.” It further advises that ERISA does not necessarily require plans to adopt investment policy statements with express guidelines on ESG factors. FAB 2018-01 recognizes that proxy voting of plan investments is typically performed by institutional investment managers with resources available to assess the economic benefits and costs of

Quarterly Standing Report—May 21, 2018
SBA Investment Programs & Governance (IP&G) Page 5
proxy voting. Any proxy voting or shareholder engagement policies approved by plan fiduciaries should be intended to enhance the economic return of investments, and fiduciaries should be able to demonstrate that they have analyzed the economic benefit in view of the costs to the plan and that they are not using plan assets to promote public policy preferences. The FAB also clarifies that plan fiduciaries (including investment managers) may not routinely incur significant plan expenses to pay for the costs of shareholder resolutions or special shareholder meetings or to initiate or actively sponsor proxy fights on environmental or social issues. Separately, the U.S. Government Accountability Office (GAO) will issue a report later in 2018 covering how retirement plans should handle ESG investments.


STATE BOARD OF ADMINISTRATION OF FLORIDA
1801 HERMITAGE BOULEVARD TALLAHASSEE, FLORIDA 32308
(850) 488-4406
POST OFFICE BOX 13300 32317-3300
RICK SCOTT GOVERNOR
AS CHAIR
JIMMY PATRONIS CHIEF FINANCIAL OFFICER
PAM BONDI
ATTORNEY GENERAL
ASH WILLIAMS EXECUTIVE DIRECTOR & CIO
DATE: May 21, 2018 TO: Ash Williams, Executive Director & CIO FROM: Karen Chandler, Chief Risk & Compliance Officer SUBJECT: Trustee Update – June 2018 _____________________________________________________________________________________ The role of the Risk Management and Compliance (RMC) unit is to assist the Executive Director & CIO in maintaining an appropriate and effective risk management and compliance program to identify, monitor and mitigate key investment and operational risks. RMC plays a critical role in developing and enhancing the enterprise-wide system of internal controls. RMC proactively works with the Executive Director & CIO and designees to ensure issues are promptly and thoroughly addressed by management. SBA senior management has created a culture of risk management and compliance through the governance structure, allocation of budgetary resources, policies and associated training and awareness. Management is committed to ethical practices and to serving the best interests of the SBA’s clients. Included below is a brief status report of RMC activities and initiatives completed or in progress during the period March 3, 2018 to May 21, 2018. Compliance Exceptions No material compliance exceptions were reported during the period. Risk Assessments and Management Plans There were no changes in the residual risk levels of the 13 top-level risks in the Enterprise Risk Management Framework. The Risk and Compliance Committee (RCC) held their quarterly meeting on April 3, 2018 and affirmed Management Plans. The RCC reviewed the proposed SBA Business Model, and have been providing feedback. Once finalized, risks to the model will be documented and key risk indicators formalized. Triennial Governance, Risk, and Compliance (GRC) Assessment Recommendations contained in the Triennial external assessment of the SBA’s Governance, Risk, and Compliance Program include but are not limited to the following three broad categories:
• Tying a risk framework to an SBA business model with related Key Risk and Key Performance Indicators.
• Clarifying roles and responsibilities regarding operational due diligence. • Prioritizing and automating compliance activities.
These will be primary focus areas for RMC over the next year. Business Model Development Business model development involves first designing a diagram that represents investment management and the functions thereof, rather than basing it on current business unit structure or the current risk framework. Additional diagrams would reflect the non-investment business of the SBA and unique business items, such
A. Williams Page 2
Page 2 of 3
as the Florida Hurricane Catastrophe Fund. From this the SBA plans to revise the current risk framework and design and track Key Risk Indicators. Operational Due Diligence (ODD) RMC plays a significant role in ODD processes within the SBA and is participating in a cross-functional evaluation of ODD processes conducted on all SBA investments. A new framework is under development and will inform the roles and responsibilities included in policy. Trading and Compliance Systems The upgrade of the Charles River Investment Management Solution and move to the new Software as a Service (SAAS) operating model was implemented April 2018. The trading and compliance modules have been enhanced, and workflows have been tested. Going forward, the SAAS model will provide an annual upgrade service to capture the latest technology offered by Charles River. RMC is preparing to implement the Aladdin system for holdings-based compliance, and is currently evaluating additional functionality in existing compliance systems to ensure automated processes are in place to the extent practical. Compliance Advisory The OIA Compliance Advisory project was completed April 2018. As part of the engagement, an aggregate compliance rule library was developed containing all compliance rules. This library will be maintained by RMC going forward. The Advisory has provided useful recommendations to advance the program and gain additional efficiencies through automation. Counterparty Renewal and Monitoring RMC continues to enhance counterparty evaluation and monitoring processes to ensure current broker/dealer financial information and real-time market signals are considered in trading decisions. Counterparty exposure and market trend information is reported daily. Additional reporting has and continues to be developed. The annual counterparty renewal process led by RMC is planned to begin in June, with the new Authorized Trading Counterparty List being effective October 2018. Performance and Risk Analytics RMC recently launched an interactive performance, risk and attribution dashboard as a complement to the on-demand reports. The dashboard allows all SBA staff to quickly view performance, attribution, and asset allocation information for individual portfolios, groups of portfolios, or asset classes. Dashboard enhancements will continue. As part of this development process, Kelly Marsey, Director of Performance & Risk Analytics, earned the Specialization in Data Science Certificate, following a rigorous 10-course program through Johns Hopkins University. The specialization provides a solid foundation in programming and data visualization that allows RMC to broaden capabilities in managing large data sets, providing enhanced insights into investment performance and risk. Additionally, Carolina Ramirez, Manager of Quantitative Investment Analysis, earned the Certificate in Performance Measurement (CIPM) designation in May 2018. This designation, awarded by the CFA Institute, reflects mastery in concepts relating to investment portfolio performance evaluation and risk analysis. Florida Asset Manager Evaluation (FLAME) System A new system has been internally developed to automate information collection from over 200 external investment managers as part of the annual contractual and statutory compliance certification process. This

A. Williams Page 3
Page 3 of 3
collaboration between RMC and Information Technology has produced significant benefits including greater efficiency in analysis, process streamlining, and enhanced security in data transmission. Testing has been conducted and RMC is beginning the process of registering asset managers in preparation for July 2018 implementation. Based on positive feedback from investment managers and SBA senior management, planning is in progress for a second phase of implementation to collect a broader range of investment data to support asset class oversight of investment managers.


Aon Hewitt
Risk. Reinsurance. Human Resources.
Florida PRIME™ Best Practices Review Florida State Board of Administration (SBA)
June 2018

Aon Hewitt
Florida PRIME™ Best Practices Review June 2018 2
(This page left blank intentionally)

Aon Hewitt
Florida PRIME™ Best Practices Review June 2018 3
Table of Contents
Executive Summary 1 Compliance Review Follow-up 2 Investment Policy Statement Review 3 Participant Local Government Advisory Council 4

Aon Hewitt
Florida PRIME™ Best Practices Review June 2018 4
(This page left blank intentionally)

Aon Hewitt
Florida PRIME™ Best Practices Review June 2018 5
Executive Summary Aon Hewitt Investment Consulting (AHIC) conducts a Best Practices Review of Florida PRIME on an annual basis. In this report, we provide a summary of the most recent Governance, Risk Management, and Compliance Assessment and report on the discontinuation of the Participant Local Government Advisory Council. Typically our report provides an overview of the results from the annual participant survey; however, this year the survey will be conducted later in the year and we will include our evaluation of the survey results in our 2019 Best Practices Review. We also reviewed the Investment Policy Statement and did not have any recommendations for changes. Based on our review, we continue to believe that Florida PRIME is being managed in a manner consistent with best practices and in consideration of participants’ best interests. 2018 Recommendations
We do not have any recommendations at this time.
Aon Hewitt
Florida PRIME™ Best Practices Review June 2018 6
Compliance Review The compliance policies that govern the Florida PRIME investment pool and corresponding compliance procedures represent a robust, multilayered approach to ensuring the portfolio remains in compliance with the criteria contained in the Investment Policy Statement. The effectiveness of the compliance procedures is crucial to the success of Florida PRIME in preserving and protecting participants’ assets. The Florida PRIME procedures have been continually updated and improved over time, as the portfolio and industry continue to evolve. We believe it is important to periodically take a step back and review the entire compliance process to ensure that the procedures remain effective, relevant, and efficient. In the 2017 Best Practices Review, AHIC conducted a comprehensive review of the compliance procedures and policies that govern the management of the Florida PRIME Investment Pool. The review included an evaluation of the compliance practices followed by Federated, S&P, and the SBA. The observations from our review were threefold. First, that Federated has established thorough and effective compliance procedures, which together with their past performance, has provided us with full confidence in their ability to manage the portfolio successfully and in compliance with the applicable guidelines. Second, that the SBA has developed a very comprehensive compliance program that both ensures the policies in place for Florida PRIME are in line with best practices and provides independent verification that the portfolio is constantly managed in compliance with the governing polices. Lastly, after reviewing the compliance process as a whole, our review identified a few potential areas where efficiencies could be gained through streamlining processes and refocusing redundant efforts towards more effective activities. Subsequent to our review, the SBA underwent its Triennial Governance, Risk Management and Compliance Assessment conducted by a third party consultant. This Assessment covered all major mandates managed by the SBA, including Florida PRIME. To no surprise, the Assessment identified the SBA as a high performing organization with strong governance and compliance practices and did not find any material issues. The assessment also provided some suggestions for the SBA to consider surrounding its compliance structure and practices. At the time our 2018 Best Practices Review was being written, the SBA was still digesting and responding to the results of the Triennial Assessment which covers the entire organization, of which Florida PRIME is only one aspect. Therefore, AHIC will postpone making any parallel recommendations until any potential changes resulting from the Assessment have been implemented. Importantly, we reiterate that the compliance policies that govern the Florida PRIME investment pool and corresponding compliance procedures represent a robust, multilayered approach to ensuring the portfolio remains in compliance with the criteria contained in the Investment Policy Statement. AHIC maintains ongoing communication with the SBA Staff in order to stay apprised of any potential changes to the compliance procedures governing Florida PRIME.

Aon Hewitt
Florida PRIME™ Best Practices Review June 2018 7
Investment Policy Review On a periodic basis, AHIC conducts a review of the Florida PRIME Investment Policy Statement (IPS). The objective of the IPS is to set forth the objectives, strategy, guidelines, and overall responsibilities for the oversight and prudent investment of Florida PRIME assets. The purpose of the periodic review is to ensure the document reflects the evolving investment portfolio, current legal and regulatory developments, and best practices. A well-written and unambiguous document is critical to the success of an investment program Included in AHIC’s 2016 best practices review was a comprehensive review of the Florida PRIME IPS and recommendations for modifications to align the IPS with the recently released GASB 79 guidelines. The modifications were all generally modest as Florida PRIME has stayed current with the guidelines issued by GASB over time. As part of the 2018 review, AHIC reviewed the IPS and continues to find that the topics covered continue to be relevant and cover the components that are critical to the success of the management of Florida PRIME assets. The investment objective of the pool and the roles and responsibilities are clearly defined. The IPS provides the necessary specifics and supplemental guidelines for a clear understanding of the investment strategy, making direct and clear reference to the appropriate GASB guidelines for appropriate fiduciaries to follow and understand. We believe the IPS thoroughly defines the risks that are associated with investing in Florida PRIME and find the detailed control procedures provide the comfort of prudent safe-keeping and oversight of assets. During the 2018 review, two modest reference edits, noted below, were identified and will be updated.
1. Within Section I. Purpose and Scope: Reference to Fund B will be removed as Section 218.421 was repealed earlier this year and the Fund B Trust Fund has been terminated.
2. Within Section II. Overview of Florida PRIME: A citation to Section 215.47(9) needs to be corrected to Section 215.47(10) to reflect the correct reference to the applicable fiduciary standards.
While it is not expected that the IPS will change frequently, it is a living, breathing document that should be reviewed periodically to ensure it remains appropriate and relevant. Overall, we continue to believe the Florida PRIME IPS is robust and in line with the goals and objectives of investment pool, and continue to find the Policy to be an effective guiding document for the management of Florida PRIME.

Aon Hewitt
Florida PRIME™ Best Practices Review June 2018 8
Participant Local Government Advisory Council The Participant Local Government Advisory Council (PLGAC) was formed in 2009 to provide additional oversight to the Florida SBA on Florida PRIME and was statutorily repealed on March 30, 2018. The PLGAC consisted of members from local governments appointed by the Board of Trustees and advised the SBA on matters related to Florida PRIME including participant communication, investment policy statement, investment approach, compliance policies and procedures, and other matters that need their attention. As we entered the ninth year since the formation of the PLGAC, the recommendation by the existing members of the PLGAC was to repeal the Council. The recommendation was also to continue to instead rely on the oversight and advice provided by the Investment Advisory Council (IAC). The IAC will continue to review Florida PRIME performance and risk on a quarterly basis and the Best Practices Review on an annual basis, as they do in the current structure. Aon Hewitt agrees with this approach. Since we began our Best Practices Review, the Florida PRIME has implemented many changes and enhancements to ensure that participants are receiving the best a local government investment pool can offer in terms of investment strategy, investment risk, oversight and compliance, education, communication, and technology. We have made very few recommendations in the past couple years as a result of our review, which is an indication that Florida PRIME has reached a target state wherein it is functioning at the very highest level, performing well, and delivering to participants what they need. For all these reasons, we are supportive of the repeal of the PLGAC and the suggested continued reliance on the IAC for continued oversight and council to the SBA on Florida PRIME.

Quarterly Update
IAC Meeting 1

Relationship Overview
3
Florida PRIME Assets: $11.6 billion (as of 3/31/18)
737 Participants
1,394 Accounts
Investment Manager Paige WilhelmSenior Vice President Senior Portfolio Manager Federated Investment Counseling
• Weekly Market Commentary• Monthly Newsletter• Quarterly Review• Marketing Support
1st Quarter 2018 Event
Jan. 30- Feb. 20 Florida Council of Business Affairs (COBA) (St. Augustine)
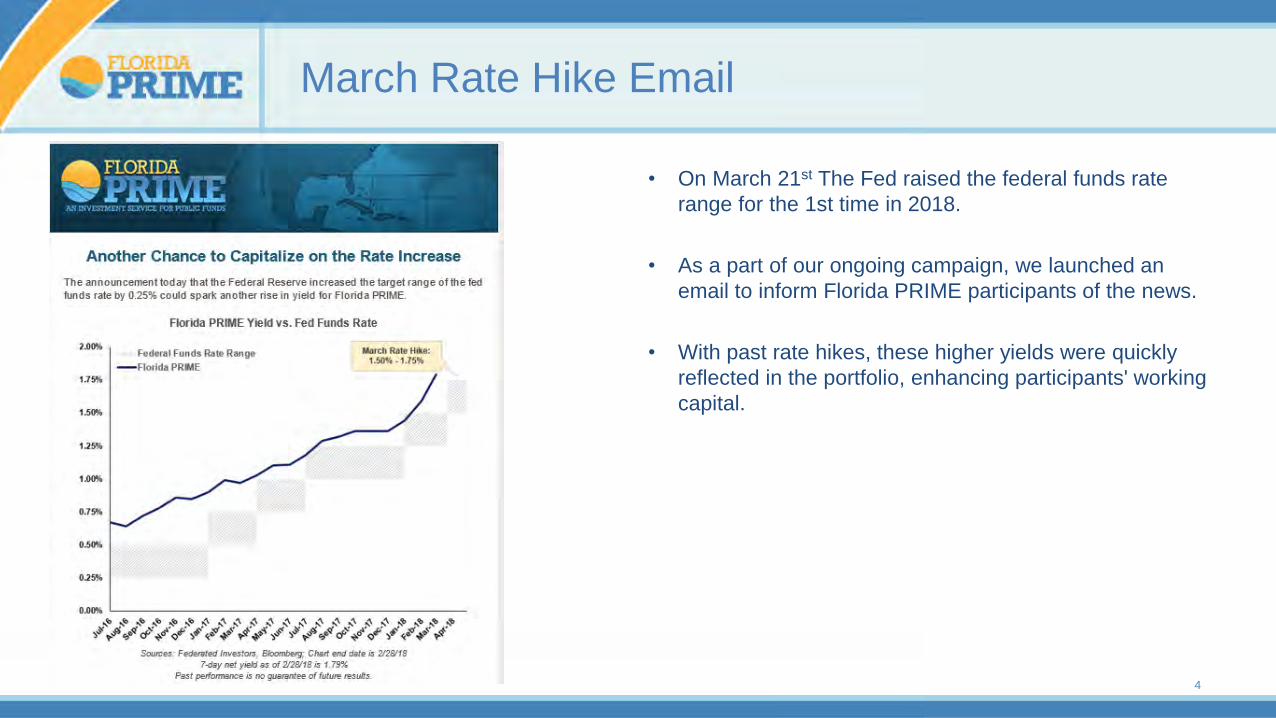
March Rate Hike Email
4
• On March 21st The Fed raised the federal funds rate range for the 1st time in 2018.
• As a part of our ongoing campaign, we launched an email to inform Florida PRIME participants of the news.
• With past rate hikes, these higher yields were quickly reflected in the portfolio, enhancing participants' working capital.

Direct Mail and Digital Marketing
Outreach to Florida School Officials Every year, Federated advertises in FASBO (Florida Association of School Business Officials) Magazine, the organization’s biggest issue of the year delivered to all superintendents and school districts in the State of Florida. Federated uses this opportunity to stress the key message of Florida PRIME: “The Premier Cash Management Solution for Florida Public Entities.”
• Over 2,000 Florida PRIME fact sheets were shipped via U.S. Postal Service on April 27, 2018.
• Fact sheet was emailed along with the 2018 Spring/Summer digital issue of FASBO Magazine.
• Additional distribution will take place at the 2018 Annual Conference from October 2-5, 2018 in Cape Coral.
IAC Meeting 5
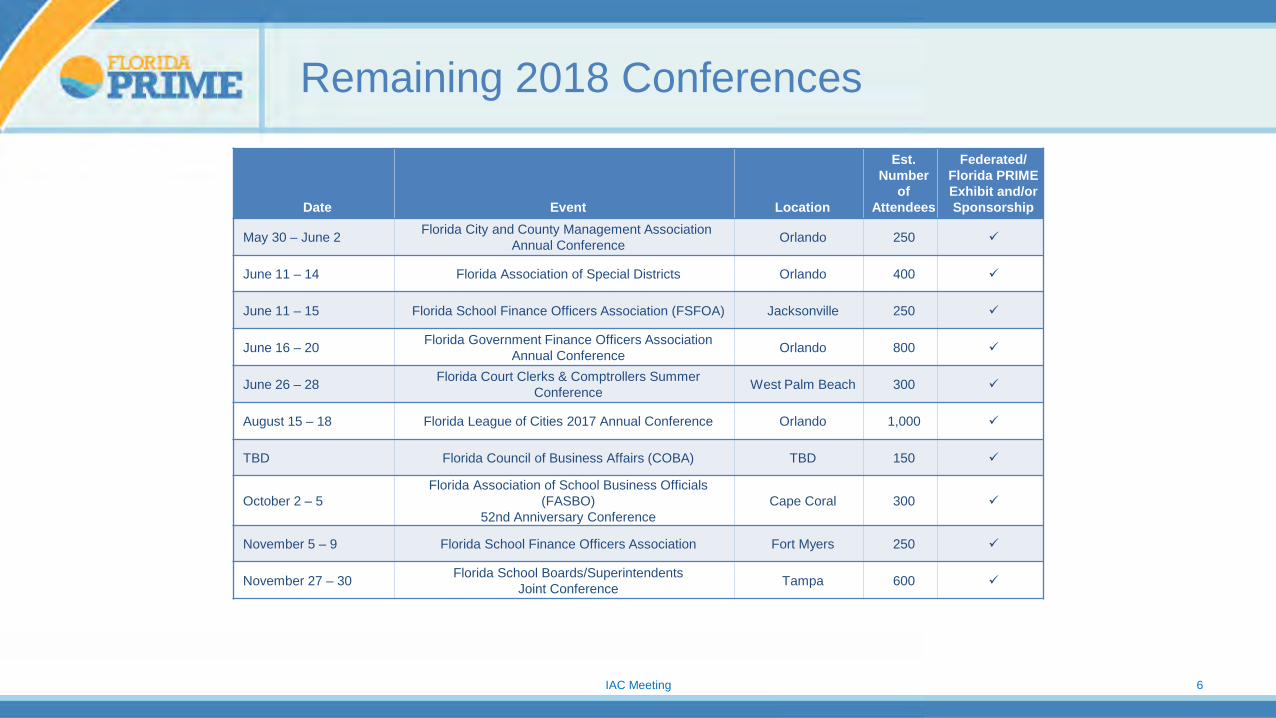
Remaining 2018 Conferences
Date Event Location
Est.Number
of Attendees
Federated/Florida PRIMEExhibit and/or Sponsorship
May 30 – June 2 Florida City and County Management AssociationAnnual Conference Orlando 250
June 11 – 14 Florida Association of Special Districts Orlando 400
June 11 – 15 Florida School Finance Officers Association (FSFOA) Jacksonville 250
June 16 – 20 Florida Government Finance Officers Association Annual Conference Orlando 800
June 26 – 28 Florida Court Clerks & Comptrollers Summer Conference West Palm Beach 300
August 15 – 18 Florida League of Cities 2017 Annual Conference Orlando 1,000
TBD Florida Council of Business Affairs (COBA) TBD 150
October 2 – 5Florida Association of School Business Officials
(FASBO) 52nd Anniversary Conference
Cape Coral 300
November 5 – 9 Florida School Finance Officers Association Fort Myers 250
November 27 – 30 Florida School Boards/Superintendents Joint Conference Tampa 600
IAC Meeting 6

Fund FlowsQuarter Ending 3/31/18
7
*Period July 2017 – March 2018
IAC Meeting
$10.06$9.67
$9.33 $9.24$8.85
$8.04$7.67
$9.51
$11.43$12.16 $12.00
$11.59
-$2
$0
$2
$4
$6
$8
$10
$12
$14
Apr-17 May-17 Jun-17 Jul-17 Aug-17 Sep-17 Oct-17 Nov-17 Dec-17 Jan-18 Feb-18 Mar-18
Billio
ns
Net Change Deposits Withdrawals Net Asset Value
Cash Flows as of 3/31/2018 First Quarter Fiscal YTD*Opening Balance $11,428,954,534 $9,329,349,587Participant Deposits $4,862,785,763 $18,036,255,287Gross Earnings $51,350,083 $113,250,674Participant Withdrawals ($4,756,284,139) ($15,890,581,594)Fees ($983,520) ($2,451,234)Closing Balance (3/31/2018) $11,585,822,722 $11,585,822,722
Change $156,868,188 $2,256,473,135
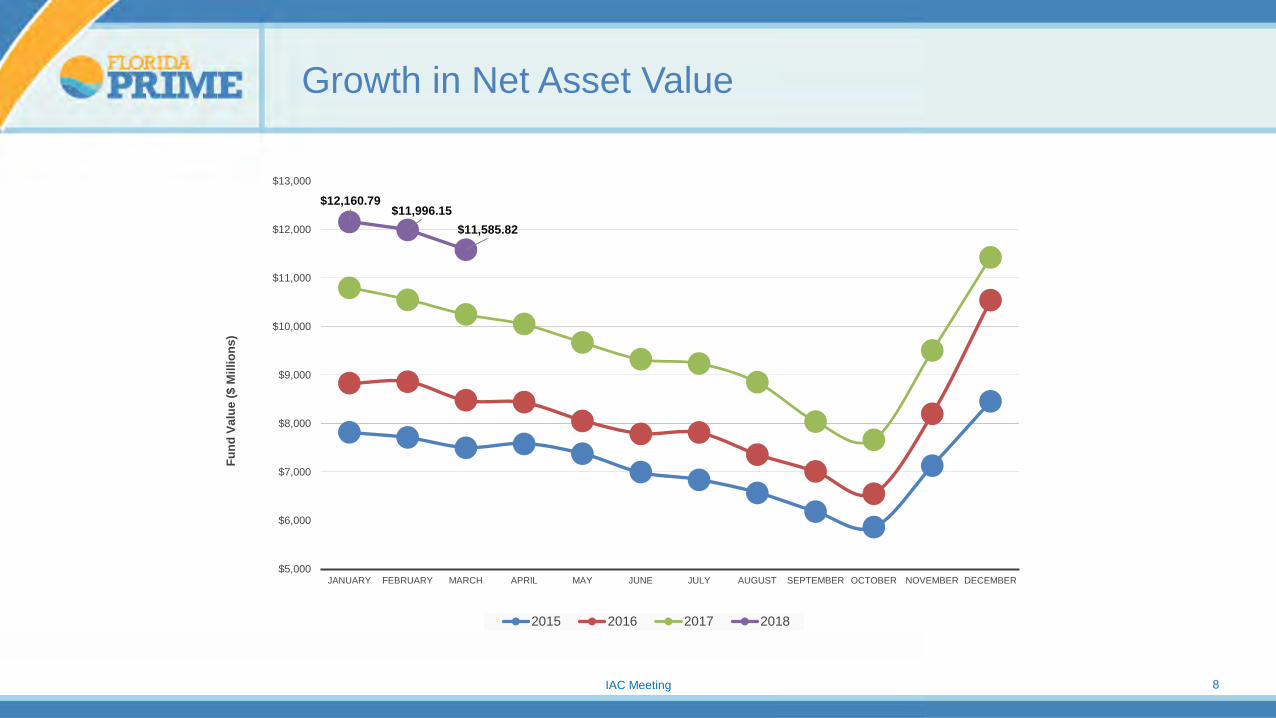
8IAC Meeting
Growth in Net Asset Value
$12,160.79$11,996.15
$11,585.82
$5,000
$6,000
$7,000
$8,000
$9,000
$10,000
$11,000
$12,000
$13,000
JANUARY FEBRUARY MARCH APRIL MAY JUNE JULY AUGUST SEPTEMBER OCTOBER NOVEMBER DECEMBER
Fund
Val
ue ($
Mill
ions
)
2015 2016 2017 2018

Florida PRIME Portfolio Review
9
In a quarter in which equity markets seemed to be lookingfor reasons to be jittery, money markets took a more calmand collected approach. A bump in wage growth inJanuary caused sharp volatility in stocks, but cashinvestors paid more attention to the Federal Reserve’scommunication that other measures of inflation were stillmodest and that it likely would continue on a deliberateand slow tightening path. Its emphasis on continuity anddata dependence took on extra significance in the quarteras the Fed came under new leadership with JeromePowell succeeding Janet Yellen. In March, Chair Powelloversaw his first Federal Open Market Committee meetingand his first hike, as policymakers raised the target rangeof the federal funds rate from 1.25-50% to 1.50-75%. Inannouncing its decision, the Fed cited strong labor marketconditions and robust business and consumer confidence,but noted consumer spending had moderated and inflationstill remained below its target. Projections for steadygrowth in gross domestic product (GDP), inflation andemployment contributed to expectations for a modestnumber of rate increases in 2018 and 2019, likely three ineach. A brewing potential global trade war did not have atangible effect on the money markets; however, they weresignificantly affected by a spike in Treasury issuance asgovernment borrowing needs jumped due to tax reform,increased spending and a widening federal deficit.
1st Quarter 2018 Market Review
10
Issuance also was affected by the U.S. Treasury’s need toreplenish its cash balance and pay back the Fed as thecentral bank ramped up the magnitude of monthlyreductions in its balance sheet. Treasury officials indicatedthat a quarter to a third of the tapering repayments couldbe reissued as Treasury bills, adding to the supply at thefront end of the yield curve. All of this pushed T-bill yieldsto strong levels, with the 1-month breaching 1.50% in lateFebruary. Throughout the reporting period, municipalissuers, state and local governments, and investorscontinued to examine the details and ramifications of thenew tax code set into law in December as to what impactit may have on tax-free securities.
During the three months ended March 31, 2018, the 1-month London interbank offered rate (Libor) rose from1.56% to 1.88% and 3-month Libor rose from 1.69% to2.31%. The short end of the Treasury yield curve alsoincreased over the quarter, with 1-month and 3-monthTreasury yields rising from 1.25% to 1.71% and 1.45% to1.76%, respectively.

Credit Quality
A-1+ 56.8%
A-1 43.2%
Top 10 Holdings (ex Repos)
United States Treasury 12.1%
Societe Generale, Paris 5.1%
Mitsubishi UFJ Financial Group, Inc. 5.0%
Royal Bank of Canada 5.0%
Mizuho Financial Group, Inc. 4.7%
JPMorgan Chase & Co. 4.6%
Sumitomo Mitsui Financial Group, Inc. 4.4%
Wells Fargo & Co. 4.4%
Federated Institutional Prime Value Obligations Fund 3.9%
Old Line Funding, LLC 3.7%
Total % of Portfolio 52.9%
Portfolio Characteristics Period Ending 3/29/18
Maturity Schedule Weighted Average Maturity (WAM)
Weighted Average Life (WAL)
1-7 days 8-30 days 31-90 days 91-180 days 181+ days42.4 days 90.2 days
33.7% 25.4% 27.1% 13.0% 0.8%11
Portfolio Composition
12.1
11.2
25.1
10.7
8
16.4
5.7
40.9 6 Government
Bank Instrument - Fixed
Asset Backed CP- Fixed
Corporate CP - Fixed
Asset Backed CP- Floating
Bank Instrument - Floating
Corporate CP - Floating
Money Market Mutual Funds
Corporate Notes - Floating
Repo
Top Country Exposure Japan 16.6%
Canada 14.6%
France 6.5%
Australia 3.9%
Luxembourg 3.1%
Belgium 2.6%
Netherlands 1.8%
Germany 1.5%
United Kingdom 0.6%
Sweden 0.3%
Total % of Portfolio 51.6%

Performance vs. IndexPeriod Ending 3/31/18
Notes: Annualized 1-month and 3-month performance figures; S&P AAA & AA GIP All 30-Day Net Yield Index for all time periods shown.
Net Returns (%) as of 3/31/18
1-month 3-month 1-year 3-years 5-years 10-yearsSince
Jan. 1996
Florida PRIME 30-Day Average Net Yield 1.80% 1.73% 1.40% 0.84% 0.57% 0.59% 2.59%
S&P AAA/AA Rated GIPAll 30-Day Net Index 1.50% 1.39% 1.09% 0.57% 0.36% 0.43% 2.38%
Above (Below) Benchmark 0.30% 0.35% 0.31% 0.27% 0.21% 0.17% 0.22%
12

Stress Test Resultsas of 3/29/18
13IAC Meeting

Stress Test Footnotesas of 3/29/18
IAC Meeting 14

STATE BOARD OF ADMINISTRATION OF FLORIDA
1801 HERMITAGE BOULEVARD, SUITE 100
TALLAHASSEE, FLORIDA 32308 (850) 488-4406
POST OFFICE BOX 13300
32317-3300
RICK SCOTT GOVERNOR
CHAIR
JIMMY PATRONIS CHIEF FINANCIAL OFFICER
PAM BONDI
ATTORNEY GENERAL
ASH WILLIAMS EXECUTIVE DIRECTOR & CIO
To: Ash Williams
From: Michael McCauley
cc: Senior Leadership Group
Date: May 22, 2018
Subject: Annual Review and Approval of Florida PRIME Investment Policy Statement (IPS)
With respect to Florida PRIME, Section 218.409 Florida Statutes requires:
The trustees shall ensure that the board or a professional money management firm administers the trust fund on behalf of the participants. The board or a professional money management firm shall have the power to invest such funds in accordance with a written investment policy. The investment policy shall be updated annually to conform to best investment practices. [s. 218.409(2)(a), Florida Statutes] The investment policy shall be reviewed and approved annually by the trustees or when market changes dictate, and in each event the investment policy shall be reviewed by the Investment Advisory Council.[s. 218.409(2)(d), Florida Statutes]
Although there are no investment policy changes recommended at this time for the Florida PRIME Investment Policy Statement (IPS) (attached), a couple of statutory citations need updating:
1) Section 215.47(9) needs to reflect the correct reference to the applicable fiduciary standards contained in 215.47(10). The current IPS’ Overview section references paragraph (9) instead of paragraph (10) of the statute, which are included below for reference:
(9) Investments in any securities authorized by this section may be under repurchase agreements or reverse repurchase agreements. (10) Investments made by the State Board of Administration shall be designed to maximize the financial return to the fund consistent with the risks incumbent in each investment and shall be designed to preserve an appropriate diversification of the portfolio. The board shall discharge its duties with respect to a plan solely in the interest of its participants and beneficiaries. The board in performing the above investment duties shall comply with the fiduciary standards set forth in the Employee Retirement Income Security Act of 1974 at 29 U.S.C. s. 1104(a)(1)(A) through (C). In case of conflict with other provisions of law authorizing investments, the investment and fiduciary standards set forth in this subsection shall prevail.
2) Section 218.421 was repealed earlier this year and the Fund B Trust Fund has been terminated. The referenced language needs to be stricken from the Florida PRIME IPS.
Let me know if you have any questions. Attachments
Blacklined for IAC Review on June 11, 2018 Effective on Approvedal by SBA Trustees on June 1314, 20187
1
Investment Policy Statement
Local Government Surplus Funds Trust Fund (Non-Qualified) Effective June 1314, 20187
I. Purpose and Scope The purpose of this Investment Policy Statement (“Policy”) is to set forth the investment objective, investment strategies, and authorized portfolio securities for the Local Government Surplus Funds Trust Fund (“Florida PRIME”). The Policy also describes the risks associated with an investment in Florida PRIME. This Policy does not relate to Fund B as defined in Section 218.421, Florida Statutes. II. Overview of Florida PRIME The Local Government Surplus Funds Trust Fund was created by an Act of the Florida Legislature effective October 1, 1977 (Chapter 218, Part IV, Florida Statutes). The State Board of Administration (“SBA”) is charged with the powers and duties to administer and invest Florida PRIME, in accordance with the statutory fiduciary standards of care as contained in Section 215.47(109), Florida Statutes. The SBA has contracted with Federated Investment Counseling (the “Investment Manager”) to provide investment advisory services for Florida PRIME. Florida PRIME is governed by Chapters 215 and 218, Florida Statutes, and Chapter 19-7 of the Florida Administrative Code (collectively, “Applicable Florida Law”). III. Roles and Responsibilities The Board of Trustees of the SBA (“Trustees”) consists of the Governor, as Chairman, the Chief Financial Officer, as Treasurer, and the Attorney General, as Secretary. The Trustees will annually certify that Florida PRIME is in compliance with the requirements of Chapter 218, Florida Statutes, and that the management of Florida PRIME is in accord with best investment practices. The Trustees delegate the administrative and investment authority to manage Florida PRIME to the Executive Director of the SBA, subject to Applicable Florida Law. The Trustees appoint an Investment Advisory Council and a Participant Local Government Advisory Council. Both Councils will, at least annually, review this Policy and any proposed changes prior to its presentation to the Trustees and will undertake other duties set forth in Applicable Florida Law. IV. Amortized Cost Accounting In March 1997, the Governmental Accounting Standards Board (“GASB”) issued Statement 31, titled “Accounting and Financial Reporting for Certain Investments and for External Investment Pools.” GASB 31 applies to Florida PRIME. GASB 31 outlines the two options for accounting and reporting for money market investment pools as either “2a-7 like” or fluctuating net asset value (“NAV”). GASB 31 describes a “2a-7 like” pool as an “external investment pool that is not registered with the Securities and Exchange Commission (“SEC”) as an investment company, but nevertheless has a policy that it will, and does, operate in a manner consistent with Rule 2a-7 under the Investment Company Act of 1940 (the “1940 Act”).” Rule 2a-7 is the rule that permits money market funds to use amortized cost to maintain a constant NAV of $1.00 per share, provided that such funds meet certain conditions. In December 2015, GASB issued Statement 79, “Certain External Investment Pools and Pool Participants,” which delinks the accounting treatment of external investment pools from Rule 2a-7, and
Blacklined for IAC Review on June 11, 2018 Effective on Approvedal by SBA Trustees on June 1314, 20187
2
establishes criteria for the use of amortized cost to value portfolio assets of an external pool. GASB 79 also made clear that rounding unit value up or down to the nearest penny to maintain a stable NAV of $1.00 per share for issuances and redemptions of units is an operational decision for an external investment pool, rather than an accounting matter. GASB 79 also specifies, however, that seeking to maintain a stable price of $1.00 per share is one of the criteria that an external investment pool must meet as a condition to valuing all portfolio assets at amortized cost for financial reporting purposes. Florida PRIME will seek to operate in a manner consistent with the criteria and requirements in GASB 79, including diversification, credit quality and maturity conditions. Accordingly, it is thereby permitted to value portfolio assets at amortized cost method. V. Investment Objective The primary investment objectives for Florida PRIME, in priority order, are safety, liquidity, and competitive returns with minimization of risks. Investment performance of Florida PRIME will be evaluated on a monthly basis against the Standard & Poor’s U.S. AAA & AA Rated GIP All 30 Day Net Yield Index. While there is no assurance that Florida PRIME will achieve its investment objectives, it endeavors to do so by following the investment strategies described in this Policy. VI. Investment Strategies & Specific Limitations The Investment Manager will invest Florida PRIME’s assets in short-term, high-quality fixed income securities. All Florida PRIME assets (100 percent) will be U.S. dollar-denominated. To be considered high-quality, a security must be rated in the highest short-term rating category by one or more nationally recognized statistical rating organizations (“NRSROs”), or be deemed to be of comparable quality thereto by the Investment Manager, subject to Section 215.47(1)(j), Florida Statutes. The Investment Manager also may enter into special transactions for Florida PRIME, like repurchase agreements. Each repurchase agreement counterparty must have an explicit issuer or counterparty credit rating in the highest short-term rating category from Standard & Poor's. Certain of the fixed -income securities in which Florida PRIME invests pay interest at a rate that is periodically adjusted (“Adjustable Rate Securities”). The Investment Manager will manage credit risk by purchasing only high quality securities. The Investment Manager will perform a credit analysis to develop a database of issuers and securities that meet the Investment Manager’s standard for minimal credit risk. The Investment Manager monitors the credit risks of all Florida PRIME’s portfolio securities on an ongoing basis by reviewing periodic financial data, issuer news and developments, and ratings of certain NRSROs. The Investment Manager will utilize a “new products” or similar committee to review and approve new security structures prior to an investment of Florida PRIME’s assets in such securities. The Investment Manager will periodically consider and follow best practices in connection with minimal credit risk determinations (e.g., such as those described in Appendix I of the Investment Company Institute's 2009, Report of the Money Market Working Group). The Investment Manager will manage interest rate risk by purchasing only short-term fixed income securities. The Investment Manager will target a dollar-weighted average maturity range for Florida PRIME based on its interest rate outlook. The Investment Manager will formulate its interest rate outlook by analyzing a variety of factors, such as current and expected U.S. economic growth; current and expected interest rates and inflation; and the Federal Reserve Board’s monetary policy. The Investment Manager will generally shorten Florida PRIME’s dollar-weighted average maturity when it expects interest rates to rise and extend Florida PRIME’s dollar-weighted average maturity when it expects interest rates to fall. In order to meet the investment grade ratings criteria of Standard & Poor’s for a pool, the remaining maturity of securities purchased by the Investment Manager shall not exceed 762 days for government floating rate notes/variable rate notes and will not exceed 397 days for all other securities; provided, however, that if not required by the ratings criteria of the applicable NRSRO that is providing

Blacklined for IAC Review on June 11, 2018 Effective on Approvedal by SBA Trustees on June 1314, 20187
3
an investment grade rating to the pool and to the extent consistent with the portfolio criteria of GASB 79, longer term floating rate/variable rate notes that are U.S. government securities may be owned by Florida PRIME. The Investment Manager will exercise reasonable care to maintain (i) a dollar weighted average maturity (“DWAM”) of 60 days or less; and (ii) a maximum weighted average life (WAL) within the range of 90-120 days, depending on the levels of exposure and ratings of certain Adjustable Rate Securities. The maximum WAL will depend upon the percentage exposures to government and non-government Adjustable Rate Securities, with sovereign (government) Adjustable Rate Securities rated AA- and higher allowed a 120-day limit, and non-sovereign (corporate) Adjustable Rate Securities (and sovereign Adjustable Rate Securities rated below AA-) restricted to a 90-day limit. The portfolio’s maximum WAL will be based on a weighted average of the percentage exposures to each type of floating-rate instrument. For purposes of calculating DWAM, the maturity of an Adjustable Rate Security generally will be the period remaining until its next interest rate adjustment. For purposes of calculating WAL, the maturity of an Adjustable Rate Security will be its stated final maturity, without regard to interest rate adjustments; accordingly, the WAL limitation could serve to restrict Florida PRIME’s ability to invest in Adjustable Rate Securities. The Investment Manager will exercise reasonable care to limit exposure to not more than 25% of Florida PRIME’s assets in a single industry sector, with the exception that the Investment Manager may invest more than 25% in the financial services industry sector, which includes banks, broker-dealers, and finance companies. This higher limit is in recognition of the large outstanding value of money fund instruments issued by financial services firms. Government securities are not considered to be an industry. The Investment Manager will exercise reasonable care to not acquire a security, other than (i) a Daily Liquid Asset, if immediately after the acquisition Florida PRIME would have invested less than 10% of its total assets in Daily Liquid Assets; (ii) a Weekly Liquid Asset, if immediately after the acquisition Florida PRIME would have invested less than 30% of its total assets in Weekly Liquid Assets. Daily Liquid Assets include cash, direct obligations of the U.S. government and securities that convert to cash in one business day. Weekly Liquid Assets include cash, direct obligations of the U.S. government, certain government securities with remaining maturities of 60 business days or less and securities that convert to cash in five business days. Florida PRIME shall seek to hold liquid assets sufficient to meet reasonably foreseeable redemptions, based upon knowledge of the expected cash needs of participants. The Investment Manager will exercise reasonable care to not acquire securities that cannot be sold or disposed of in the ordinary course of business within five business days at approximately the value ascribed to them by Florida PRIME if, immediately after the acquisition, Florida PRIME would have invested more than 5% of its total assets in such securities. In buying and selling portfolio securities for Florida PRIME, the Investment Manager will comply with (i) the diversification, maturity and credit quality criteria in GASB 79, (ii) the requirements imposed by any NRSRO that rates Florida PRIME to ensure that it maintains a AAAm rating (or the equivalent) and (iii) the investment limitations imposed by Section 215.47, Florida Statutes except to the extent, as permitted by Section 215.44(3), the trust instrument of Florida PRIME and this investment policy statement specifically authorize investments in addition to those authorized by Section 215.47. The Investment Manager generally will comply with the following diversification limitations that are additional to those set forth in GASB 79. First, at least 50% of Florida PRIME assets will be invested in securities rated “A-1+” or those deemed to be of comparable credit quality thereto by the Investment Manager (i.e., so long as such deeming is consistent with the requirements of the NRSRO’s AAAm (or

Blacklined for IAC Review on June 11, 2018 Effective on Approvedal by SBA Trustees on June 1314, 20187
4
equivalent) rating criteria), subject to Section 215.47(1)(j), Florida Statutes. The Investment Manager will document each instance in which a security is deemed to be of comparable credit quality and its basis for such a determination. Second, exposure to any single non-governmental issuer (other than a money market mutual fund) will not exceed 5% and exposure to any single money market mutual fund will not exceed 10% of Florida PRIME assets. VII. Portfolio Securities and Special Transactions The Investment Manager will purchase only fixed income securities for Florida PRIME, and may engage in special transactions, for any purpose that is consistent with Florida PRIME’s investment objective. Fixed income securities are securities that pay interest, dividends or distributions at a specified rate. The rate may be a fixed percentage of the principal or adjusted periodically. In addition, the issuer of a short-term fixed income security must repay the principal amount of the security, normally within a specified time. The fixed income securities in which Florida PRIME may invest include corporate debt securities, bank instruments, asset backed securities, U.S. Treasury securities, U.S. government agency securities, insurance contracts, municipal securities, foreign securities, mortgage backed securities, and shares of money market mutual funds. However, Florida PRIME is not permitted to buy such fixed income securities to the extent that they require Florida PRIME to be a qualified institutional buyer. Special transactions are transactions into which Florida PRIME may enter, including, but not limited to, repurchase agreements and delayed delivery transactions. For a more detailed description of Florida PRIME’s portfolio securities and special transactions, please see “Additional Information Regarding Florida PRIME’s Principal Securities” at Appendix A. VIII. Risks Associated with Florida PRIME An investment in Florida PRIME is subject to certain risks. Any investor in Florida PRIME should specifically consider, among other things, the following principal risks before making a decision to purchase shares of Florida PRIME. Risk that Florida PRIME will not Maintain a Stable Net Asset Value Although the Investment Manager attempts to manage Florida PRIME such that it maintains a stable NAV of $1.00 per share, there is no guarantee that it will be able to do so. Florida PRIME is not registered under the 1940 Act or regulated by the SEC. Interest Rate Risks The prices of the fixed income securities in which Florida PRIME will invest rise and fall in response to changes in the interest rates paid by similar securities. Generally, when interest rates rise, prices of fixed income securities fall. However, market factors, such as demand for particular fixed income securities, may cause the price of certain fixed income securities to fall while the price of other securities rise or remain unchanged. Interest rate changes have a greater effect on the price of fixed income securities with longer maturities. Credit Risks Credit risk is the possibility that an issuer of a fixed income security held by Florida PRIME will default on the security by failing to pay interest or principal when due. If an issuer defaults, Florida PRIME will lose money.

Blacklined for IAC Review on June 11, 2018 Effective on Approvedal by SBA Trustees on June 1314, 20187
5
Liquidity Risks Trading opportunities are more limited for fixed income securities that are not widely held. These features make it more difficult to sell or buy securities at a favorable price or time. Consequently, Florida PRIME may have to accept a lower price to sell a security, sell other securities to raise cash or give up an investment opportunity, any of which could have a negative effect on Florida PRIME’s performance. Concentration Risks A substantial part of Florida PRIME may be comprised of securities issued by companies in the financial services industry, companies with similar characteristics, or securities credit enhanced by banks or companies with similar characteristics. As a result, Florida PRIME may be more susceptible to any economic, business, or political risks or other developments that generally affect finance companies. Developments affecting companies in the financial services industry or companies with similar characteristics might include changes in interest rates, changes in the economic cycle affecting credit losses and regulatory changes. Risks of Foreign Investing Foreign securities pose additional risks because foreign economic or political conditions may be less favorable than those of the United States. Securities in foreign markets also may be subject to taxation policies that reduce returns for U.S. investors. Call Risks If a fixed income security is called, Florida PRIME may have to reinvest the proceeds in other fixed income securities with lower interest rates, higher credit risks or other less favorable characteristics. Prepayment Risks Unlike traditional fixed income securities, which pay a fixed rate of interest until maturity (when the entire principal amount is due), payments on asset-backed securities include both interest and a partial payment of principal. Partial payment of principal may be comprised of scheduled principal payments as well as unscheduled payments from voluntary prepayment, refinancing, or foreclosure of the underlying loans. If Florida PRIME receives unscheduled prepayments, it may have to reinvest the proceeds in other fixed income securities with lower interest rates, higher credit risks or other less favorable characteristics. Risks Associated with Amortized Cost Method of Valuation Florida PRIME will use the amortized cost method to determine the value of its portfolio securities. Under this method, portfolio securities are valued at the acquisition cost as adjusted for amortization of premium or accumulation of discount rather than at current market value. Accordingly, neither the amount of daily income nor the NAV is affected by any unrealized appreciation or depreciation of the portfolio. In periods of declining interest rates, the indicated daily yield on shares computed by dividing the annualized daily income on Florida PRIME’s portfolio by the NAV, as computed above, may tend to be higher than a similar computation made by using a method of valuation based on market prices and estimates. In periods of rising interest rates, the opposite may be true. Changing Distribution Level Risk There is no guarantee that Florida PRIME will provide a certain level of income or that any such income will exceed the rate of inflation. Further, Florida PRIME's yield will vary. A low interest rate environment may prevent Florida PRIME from providing a positive yield or paying expenses out of current income.
Blacklined for IAC Review on June 11, 2018 Effective on Approvedal by SBA Trustees on June 1314, 20187
6
Throughout this section, it shall be understood that actions described as being taken by Florida PRIME refer to actions taken by the Investment Manager on behalf of Florida PRIME. For additional information regarding Florida PRIME’s principal securities and associated risks, please see Appendix A. IX. Controls and Escalation Procedures Section 218.409(2), Florida Statutes requires this Policy to document a system of internal controls designed to prevent the loss of public funds arising from fraud, employee error, misrepresentation by third parties, unanticipated changes in financial markets, or imprudent actions by employees and officers of the board or a professional money management firm. The controls include formal escalation reporting guidelines for all employees to address material impacts on Florida PRIME that require reporting and action. The SBA has engaged BNY Mellon (“Custodian”) to provide asset safekeeping, custody, fund accounting and performance measurement services to Florida PRIME. The Custodian will mark to market the portfolio holdings of Florida PRIME on a daily basis and will daily communicate both amortized cost price and mark to market price, so that the SBA and the Investment Manager can monitor the deviations between the amortized cost price and market price. By contractual agreement, the Investment Manager will reconcile accounting and performance measurement reports with the Custodian on at least a monthly basis, under the supervision of the SBA. The NRSRO that rates Florida PRIME will perform regular independent surveillance of Florida PRIME. The SBA and an independent investment consultant will regularly monitor the Investment Manager with respect to performance and organizational factors according to SBA manager monitoring policies. The SBA and third parties used to materially implement Florida PRIME will maintain internal control, fraud and ethics policies and procedures designed to prevent the loss of public funds. The Executive Director will develop policies and procedures to:
• Identify, monitor and control/mitigate key investment and operational risks. • Maintain an appropriate and effective risk management and compliance program that identifies,
evaluates and manages risks within business units and at the enterprise level. • Maintain an appropriate and effective control environment for SBA investment and operational
responsibilities. • Approve risk allocations and limits, including total fund and asset class risk budgets.
The Executive Director will appoint a Chief Risk and Compliance Officer, whose selection, compensation and termination will be affirmed by the Board, to assist in the execution of the responsibilities enumerated in the preceding list. For day-to-day executive and administrative purposes, the Chief Risk and Compliance Officer will proactively work with the Executive Director and designees to ensure that issues are promptly and thoroughly addressed by management. On at least a quarterly basis, the Chief Risk and Compliance Officer will provide reports to the Investment Advisory Council, Audit Committee and Board, and is authorized to directly access these bodies at any time as appropriate to ensure the integrity and effectiveness of risk management and compliance functions.

Blacklined for IAC Review on June 11, 2018 Effective on Approvedal by SBA Trustees on June 1314, 20187
7
Pursuant to written SBA policy, the Executive Director will organize an Investment Oversight Group to regularly review, document and formally escalate compliance exceptions and events that may have a material impact on Florida PRIME. Minutes of the Investment Oversight Group’s meetings and a listing of meeting participants shall be timely posted on the Florida PRIME website. The Investment Oversight Group will meet and report monthly to the Executive Director, except upon the occurrence of a material event. The SBA and the Investment Manager have an affirmative duty to immediately disclose any material impact on Florida PRIME to the participants, including, but not limited to:
1. When the deviation between the market value and amortized cost of Florida PRIME exceeds 0.25%, according to pricing information provided by the Custodian, the Investment Manager will establish a formal action plan. The Investment Oversight Group will review the formal action plan and prepare a recommendation for the Executive Director’s consideration. 2. When the deviation between the market value and amortized cost of Florida PRIME exceeds 0.50%, according to pricing information provided by the Custodian, the Executive Director will promptly consider what action, if any, will be initiated. Where the Executive Director believes the extent of any deviation from Florida PRIME's amortized cost price per share may result in material dilution or other unfair results to investors or existing shareholders, he will cause Florida PRIME to take such action as he deems appropriate to eliminate or reduce to the extent reasonably practicable such dilution or unfair results. 3. The Investment Manager will perform daily compliance monitoring to ensure that investment practices comply with the requirements of this Policy, according to documented compliance procedures. The Investment Manager will provide regular compliance reports and will communicate compliance exceptions within 24 hours of identification to the Investment Oversight Group. Additionally, the Investment Oversight Group will periodically conduct independent compliance reviews. 4. In the event that a security receives a credit rating downgrade and ceases to be in the highest rating category, or the Investment Manager determines that the security is no longer of comparable quality to the highest short-term rating category (in either case, a “Downgrade”), the Investment Manager will reassess whether the security continues to present minimal credit risk and will cause Florida PRIME to take any actions determined by the Investment Manager to be in the best interest of Florida PRIME; provided however, that the Investment Manager will not be required to make such reassessments if Florida PRIME disposes of the security (or the security matures) within five business days of the Downgrade. 5. In the event that a security no longer meets the criteria for purchase due to default, event of insolvency, a determination that the security no longer presents minimal credit risks, or other material event (“Affected Security”), the Investment Manager must dispose of the security as soon as practical, consistent with achieving an orderly disposition of the security, by sale, exercise of a demand feature or otherwise, and the requirements of GASB 79. An Affected Security may be held only if the Executive Director has determined, based upon a recommendation from the Investment Manager and the Investment Oversight Group, that it would not be in the best interest of Florida PRIME to dispose of the security taking into account market conditions that may affect an orderly disposition. 6. The Investment Manager will monthly stress test Florida PRIME and at least quarterly report the results of the stress tests to the Investment Oversight Group. Stress tests must be conducted for at least the following events, or combinations of events (i) a change in short-term interest rates; (ii) an increase in net shareholder redemptions; (iii) downgrades or defaults; and (iv)

Blacklined for IAC Review on June 11, 2018 Effective on Approvedal by SBA Trustees on June 1314, 20187
8
changes between a benchmark overnight interest rate and the interest rates on securities held by Florida PRIME.
The Investment Manager will at least annually provide the Investment Oversight Group with: (i) their documented compliance procedures; (ii) an assessment of Florida PRIME's ability to withstand events reasonably likely to occur in the coming year and (iii) their list of NRSROs utilized as a component of the credit risk monitoring process. The Executive Director’s delegated authority as described in this section is intended to provide him with sufficient authority and operating flexibility to make professional investment decisions in response to changing market and economic conditions. Nonetheless, the Trustees will at least monthly review and approve management summaries of material impacts on Florida PRIME, any actions or escalations taken thereon, and carry out such duties and make such determinations as are otherwise necessary under applicable law, regulation or rule. Pursuant to Florida law, the Auditor General will conduct an annual financial audit of Florida PRIME, which will include testing for compliance with this Policy. X. Deposits and Withdrawals Investors should refer to the separate Florida PRIME Operating Procedures for detailed descriptions regarding how to make deposits in and withdrawals from Florida PRIME, including (1) any fees and limitations that may be imposed with respect thereto; and (2) reports provided to participants. XI. Management Reporting The Executive Director will be responsible for providing the formal periodic reports to the Trustees, legislative committees and other entities:
1. An annual report on the SBA and its investment portfolios, including that of Florida PRIME. 2. A monthly report on performance and investment actions taken. 3. Special reports pursuant to Chapter 218, Florida Statutes.
Blacklined for IAC Review on June 11, 2018 Effective on Approvedal by SBA Trustees on June 1314, 20187
9
Appendix A Additional Information Regarding Florida PRIME’s Principal Securities
Throughout this appendix it shall be understood that actions described as being taken by Florida PRIME refer to actions taken by the Investment Manager on behalf of Florida PRIME.
FIXED INCOME SECURITIES
Corporate Debt Securities
Corporate debt securities are fixed income securities issued by businesses. Notes, bonds, debentures and commercial paper are the most prevalent types of corporate debt securities. Florida PRIME also may purchase interests in bank loans to companies.
COMMERCIAL PAPER
Commercial paper is an issuer’s obligation with a maturity of generally less than 270 days. Companies typically issue commercial paper to pay for current expenditures. Most issuers constantly reissue their commercial paper and use the proceeds (or bank loans) to repay maturing paper. If the issuer cannot continue to obtain liquidity in this fashion, its commercial paper may default.
DEMAND INSTRUMENTS
Demand instruments are corporate debt securities that the issuer must repay upon demand. Other demand instruments require a third party, such as a dealer or bank, to repurchase the security for its face value upon demand. Florida PRIME treats demand instruments as short-term securities, even though their stated maturity may extend beyond one year.
Bank Instruments
Bank instruments are unsecured interest bearing deposits with banks. Bank instruments include, but are not limited to, bank accounts, time deposits, certificates of deposit and banker’s acceptances. Yankee instruments are denominated in U.S. dollars and issued by U.S. branches of foreign banks. Eurodollar instruments are denominated in U.S. dollars and issued by non-U.S. branches of U.S. or foreign banks.
Florida PRIME will not invest in instruments of domestic and foreign banks and savings and loans unless they have capital, surplus, and undivided profits of over $100,000,000, or if the principal amount of the instrument is insured by the Bank Insurance Fund or the Savings Association Insurance Fund which are administered by the Federal Deposit Insurance Corporation. These instruments may include Eurodollar Certificates of Deposit, Yankee Certificates of Deposit, and Euro-dollar Time Deposits.
Florida PRIME shall further limit its investments in bank instruments consistent with the requirements of GASB 79. Asset Backed Securities Asset backed securities are payable from pools of obligations, most of which involve consumer or commercial debts. However, almost any type of fixed income assets (including other fixed income securities) may be used to create an asset backed security. Asset backed securities may take the form of commercial paper, notes or pass-through certificates.

Blacklined for IAC Review on June 11, 2018 Effective on Approvedal by SBA Trustees on June 1314, 20187
10
Government Securities
Government security means any security issued or guaranteed as to principal or interest by the United States, or by a person controlled or supervised by and acting as an instrumentality of the Government of the United States pursuant to authority granted by the Congress of the United States; or any certificate of deposit for any of the foregoing.
U.S. Treasury Securities
U.S. Treasury securities are direct obligations of the federal government of the United States. U.S. Treasury securities are generally regarded as having the lowest credit risks.
Agency Securities
Agency securities are issued or guaranteed by a federal agency or other government sponsored entity (GSE) acting under federal authority. Some GSE securities are supported by the full faith and credit of the United States. These include securities issued by the Government National Mortgage Association, Small Business Administration, Farm Credit System Financial Assistance Corporation, Farmer's Home Administration, Federal Financing Bank, General Services Administration, Department of Housing and Urban Development, Export-Import Bank, Overseas Private Investment Corporation, and Washington Metropolitan Area Transit Authority.
Other GSE securities receive support through federal subsidies, loans or other benefits. For example, the U.S. Treasury is authorized to purchase specified amounts of securities issued by (or otherwise make funds available to) the Federal Home Loan Bank System, Federal Home Loan Mortgage Corporation, Federal National Mortgage Association, Student Loan Marketing Association, and Tennessee Valley Authority in support of such obligations.
A few GSE securities have no explicit financial support, but are regarded as having implied support because the federal government sponsors their activities. These include securities issued by the Farm Credit System, Financing Corporation, and Resolution Funding Corporation.
Investors regard agency securities as having low credit risks, but not as low as Treasury securities. Florida PRIME treats mortgage-backed securities guaranteed by a GSE as if issued or guaranteed by a federal agency. Although such a guarantee protects against credit risks, it does not reduce market risks.
Insurance Contracts
Insurance contracts include guaranteed investment contracts, funding agreements and annuities. Florida PRIME treats these contracts as fixed income securities.
Municipal Securities
Municipal securities are issued by states, counties, cities and other political subdivisions and authorities.
Foreign Securities
Foreign securities are U.S. dollar-denominated securities of issuers based outside the United States. Florida PRIME considers an issuer to be based outside the United States if:
• it is organized under the laws of, or has a principal office located in, another country; • the principal trading market for its securities is in another country; or
Blacklined for IAC Review on June 11, 2018 Effective on Approvedal by SBA Trustees on June 1314, 20187
11
• it (or its subsidiaries) derived in its most current fiscal year at least 50% of its total assets, capitalization, gross revenue or profit from goods produced, services performed or sales made in another country.
Mortgage Backed Securities Mortgage backed securities represent interests in pools of mortgages. The mortgages that comprise a pool normally have similar interest rates, maturities and other terms. Mortgages may have fixed or adjustable interest rates. Interests in pools of adjustable rate mortgages are known as ARMs. Zero Coupon Securities Certain of the fixed income securities in which Florida PRIME invests are zero coupon securities. Zero coupon securities do not pay interest or principal until final maturity, unlike debt securities that provide periodic payments of interest (referred to as a “coupon payment”). Investors buy zero coupon securities at a price below the amount payable at maturity. The difference between the purchase price and the amount paid at maturity represents interest on the zero coupon security. Investors must wait until maturity to receive interest and principal, which increases the interest rate and credit risks of a zero coupon security. Callable Securities Certain of the fixed income securities in which Florida PRIME invests are callable at the option of the issuer. Callable securities are subject to reinvestment risks. 144A Securities The SBA has determined that Florida PRIME constitutes (i) an “accredited investor” as defined in Rule 501(a)(7) promulgated under the Securities Act of 1933, as amended (the “Securities Act”), as long as Florida PRIME has total assets in excess of $5,000,000 and (ii) a “qualified purchaser” as defined in Section 2(a)(51)(A)(iv) of the 1940 Act, as long as Florida PRIME in the aggregate owns and invests on a discretionary basis not less than $25,000,000 in investments, but does not constitute a “qualified institutional buyer” as defined in Rule 144A(a)(1) promulgated under the Securities Act. Florida PRIME is restricted from purchasing or acquiring securities or investments that would require Florida PRIME to represent in connection with such purchase or acquisition that it is a “qualified institutional buyer” as defined in Rule 144A(a)(1) promulgated under the Securities Act. Money Market Mutual Funds Florida PRIME may invest in shares of registered investment companies that are money market mutual funds, including those that are affiliated with the Investment Manager, as an efficient means of implementing its investment strategies and/or managing its uninvested cash. These other money market mutual funds are managed independently of Florida PRIME and incur additional fees and/or expenses that would, therefore, be borne indirectly by Florida PRIME in connection with such investment. However, the Investment Manager believes that the benefits and efficiencies of this approach should outweigh the potential additional fees and/or expenses. The Investment Manager must obtain prior written consent of the SBA to invest Florida PRIME in money market mutual funds that are “affiliated persons” of the Investment Manager. SPECIAL TRANSACTIONS The Investment Manager on behalf of Florida PRIME may engage in the following special transactions.
Blacklined for IAC Review on June 11, 2018 Effective on Approvedal by SBA Trustees on June 1314, 20187
12
Repurchase Agreements
A repurchase agreement is a transaction in which Florida PRIME buys a security from a dealer or bank and agrees to sell the security back at a mutually agreed-upon time and price. The repurchase price exceeds the sale price, reflecting Florida PRIME’s return on the transaction. This return is unrelated to the interest rate on the underlying security. Florida PRIME will enter into repurchase agreements only with banks and other recognized financial institutions, such as securities dealers, deemed creditworthy by the Investment Manager. The securities that are subject to the repurchase transactions are limited to securities in which Florida PRIME would be permitted to invest, except that such securities may have a maturity longer than would otherwise be permitted for Florida PRIME to own.
Florida PRIME’s custodian or subcustodian will take possession of the securities subject to repurchase agreements. The Investment Manager or subcustodian will monitor the value of the underlying security each day to ensure that the value of the security always equals or exceeds the repurchase price.
Repurchase agreements are subject to credit risks.
Delayed Delivery Transactions
Delayed delivery transactions, including when-issued transactions, are arrangements in which Florida PRIME buys securities for a set price, with payment and delivery of the securities scheduled for a future time. During the period between purchase and settlement, no payment is made by Florida PRIME to the issuer and no interest accrues to Florida PRIME. Florida PRIME records the transaction when it agrees to buy the securities and reflects their value in determining the price of its units. Settlement dates may not be more than seven business days after entering into these transactions; nonetheless, the market values of the securities bought may vary from the purchase prices. Therefore, delayed delivery transactions create interest rate risks for Florida PRIME. Delayed delivery transactions also involve credit risks in the event of a counterparty default.
Asset Coverage
In order to secure its obligations in connection with special transactions, Florida PRIME will either own the underlying assets, enter into an offsetting transaction or set aside readily marketable securities with a value that equals or exceeds Florida PRIME’s obligations. Unless Florida PRIME has other readily marketable assets to set aside, it cannot trade assets used to secure such obligations without terminating a special transaction. This may cause Florida PRIME to miss favorable trading opportunities or to realize losses on special transactions.

State Board of Administration
Private Equity Asset Class ReviewJohn Bradley, SIO Strategic Investments & Private Equity
Investment Advisory CouncilJune 11, 2018

Agenda• PE Policy, Benchmarking and Structure
– Goals/Objectives– Benchmarks– Staffing
• Asset Class Investment Process– Annual Investment Plan– Sourcing– Monitoring– Fees
• Asset Class Portfolio– Investment Types– Portfolio Composition– Performance
• Asset Class Sub-Strategies– Buyouts/Growth Equity– Venture Capital– Distressed/Turnaround– Secondary
3
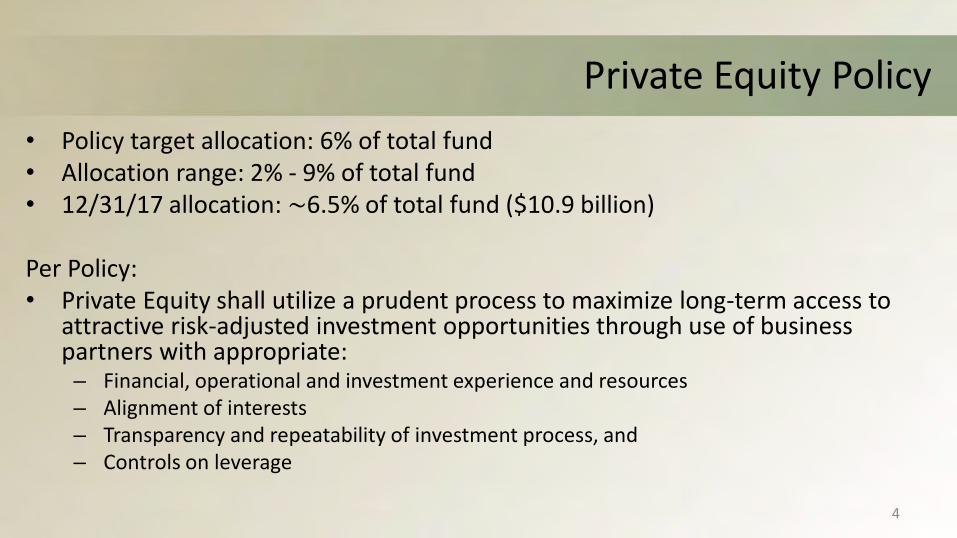
Private Equity Policy• Policy target allocation: 6% of total fund• Allocation range: 2% - 9% of total fund• 12/31/17 allocation: ∼6.5% of total fund ($10.9 billion)
Per Policy:• Private Equity shall utilize a prudent process to maximize long-term access to
attractive risk-adjusted investment opportunities through use of business partners with appropriate:– Financial, operational and investment experience and resources– Alignment of interests– Transparency and repeatability of investment process, and– Controls on leverage
4
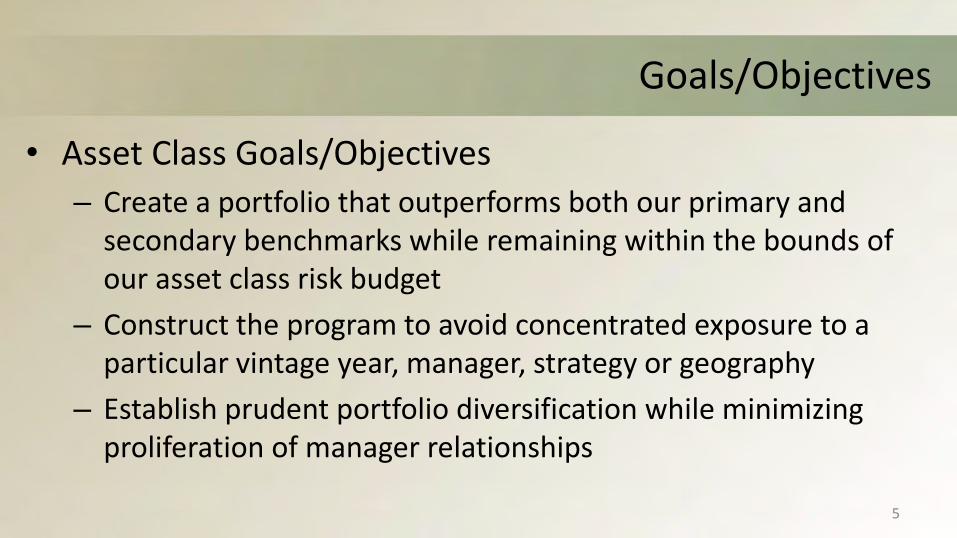
Goals/Objectives
• Asset Class Goals/Objectives– Create a portfolio that outperforms both our primary and
secondary benchmarks while remaining within the bounds of our asset class risk budget
– Construct the program to avoid concentrated exposure to a particular vintage year, manager, strategy or geography
– Establish prudent portfolio diversification while minimizing proliferation of manager relationships
5
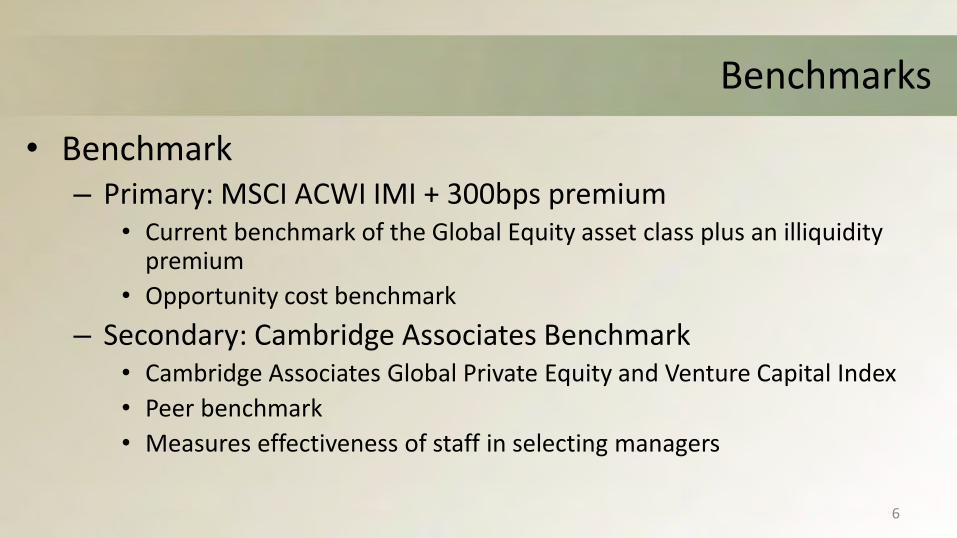
Benchmarks
• Benchmark– Primary: MSCI ACWI IMI + 300bps premium
• Current benchmark of the Global Equity asset class plus an illiquidity premium
• Opportunity cost benchmark– Secondary: Cambridge Associates Benchmark
• Cambridge Associates Global Private Equity and Venture Capital Index• Peer benchmark• Measures effectiveness of staff in selecting managers
6

Staffing• Staff of six investment professionals
– Senior Investment Officer– Three Senior Portfolio Managers– One Portfolio Manager– One Senior Analyst– Administrative Assistant
• Cambridge Associates– Market research– Fund due diligence– Quarterly performance review– Semi-Annual strategy review
7

Private Equity Investment Process
•Initial screening•Full diligence•Legal negotiation•Closing
•Annual meetings•Advisory Boards•Cambridge review•SBA compliance
•Proactive•Reactive
•Pacing model•Portfolio priorities•GP focus list•Forward calendar
Annual Investment
PlanSourcing
Due DiligenceMonitoring
8
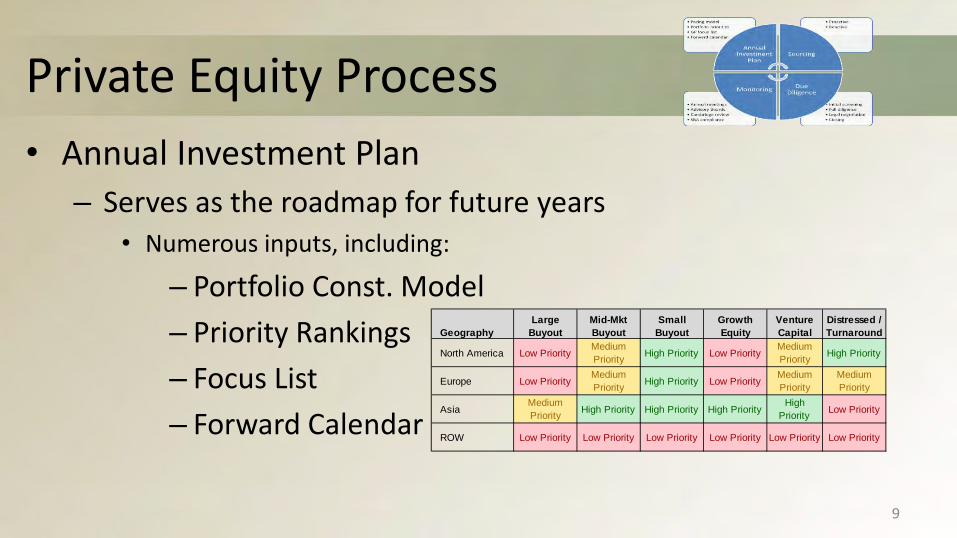
Private Equity Process • Annual Investment Plan
– Serves as the roadmap for future years• Numerous inputs, including:
– Portfolio Const. Model– Priority Rankings– Focus List– Forward Calendar
9
GeographyLarge
BuyoutMid-Mkt Buyout
Small Buyout
Growth Equity
Venture Capital
Distressed / Turnaround
North America Low PriorityMedium Priority High Priority Low Priority
Medium Priority High Priority
Europe Low PriorityMedium Priority High Priority Low Priority
Medium Priority
Medium Priority
AsiaMedium Priority High Priority High Priority High Priority
High Priority Low Priority
ROW Low Priority Low Priority Low Priority Low Priority Low Priority Low Priority
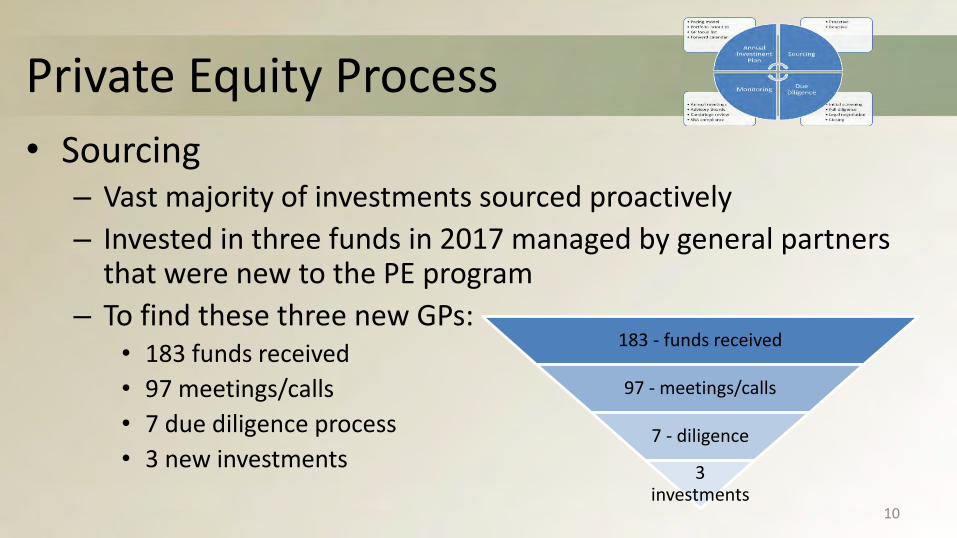
Private Equity Process • Sourcing
– Vast majority of investments sourced proactively– Invested in three funds in 2017 managed by general partners
that were new to the PE program– To find these three new GPs:
• 183 funds received• 97 meetings/calls• 7 due diligence process• 3 new investments
183 - funds received
97 - meetings/calls
7 - diligence
3 investments
10
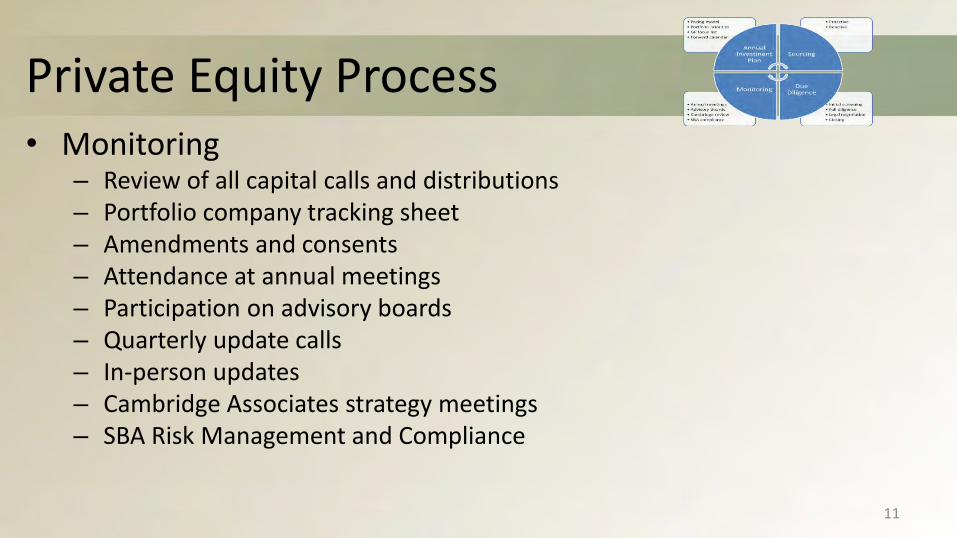
Private Equity Process • Monitoring
– Review of all capital calls and distributions– Portfolio company tracking sheet– Amendments and consents – Attendance at annual meetings– Participation on advisory boards– Quarterly update calls– In-person updates– Cambridge Associates strategy meetings– SBA Risk Management and Compliance
11

Private Equity Fees
• Focus on alignment and appropriateness– Manager fees– Partnership expenses– Other fees (transaction, monitoring, board of directors, etc.)
• Fees– Chart below shows general market fee schedule– SBA private equity fees at the bottom end of the range
Direct GPs Mgmt Fee Preferred Return Carried Interest Fund-of-Funds Mgmt Fee Preferred Return Carried Interest
Buyout 1.5% - 2.0% 8% 20% Buyout 0.5% - 1.0% 8% 5% - 10%
Venture 2.0% - 2.5% -- 20% - 30% Venture 0.5% - 1.0% 0% - 8% 5% - 10%
Distressed 1.5% - 2.0% 8% 20% - 30%
Secondary 1.0% - 2.0% 8% - 10% 10% - 15%
12

Investment Strategies• Four sub-strategies within the portfolio
– Buyouts/Growth Equity• Focused on more established businesses• Typically control investments• Often utilize leverage
– Venture Capital• Early stage investments in start-up companies• Non-control• No leverage
– Distressed/Turnarounds• Control investing in underperforming companies• Heavy focus on operations• Leverage not typical at time of purchase; will often recap prior to sale
– Secondary Funds• Purchase of stakes in private equity funds from limited partners• Secondary buyer assumes all future cash flow obligations from seller
13

Portfolio Composition and Performance
14
Geographic Focus• 10 - Global • 29 - U.S. • 8 - Europe• 3 - Asia
PE Portfolio• $10.9b NAV (12/31/17)
• $6.7b Unfunded• 184 funds• 68 GPs (48 core)
Sector Focus• 28 - Generalist • 12 - Technology • 4 - Energy• 1 – Financials
• 2 – Consumer/Retail• 1 – Health Care
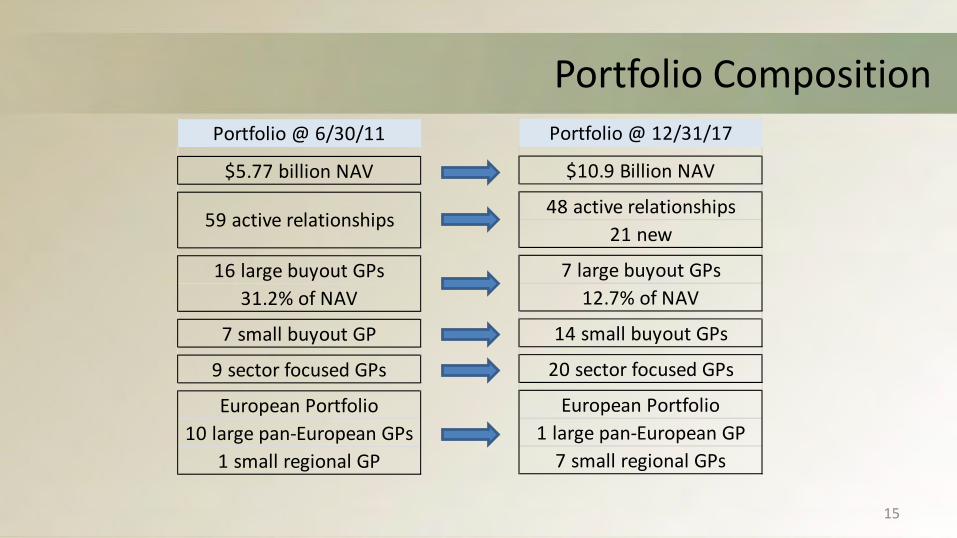
Portfolio Composition
15
Portfolio @ 6/30/11
$5.77 billion NAV
16 large buyout GPs31.2% of NAV
7 small buyout GP
9 sector focused GPs
European Portfolio10 large pan-European GPs
1 small regional GP
59 active relationships
Portfolio @ 12/31/17
$10.9 Billion NAV
48 active relationships21 new
7 large buyout GPs12.7% of NAV
14 small buyout GPs
20 sector focused GPs
European Portfolio1 large pan-European GP
7 small regional GPs
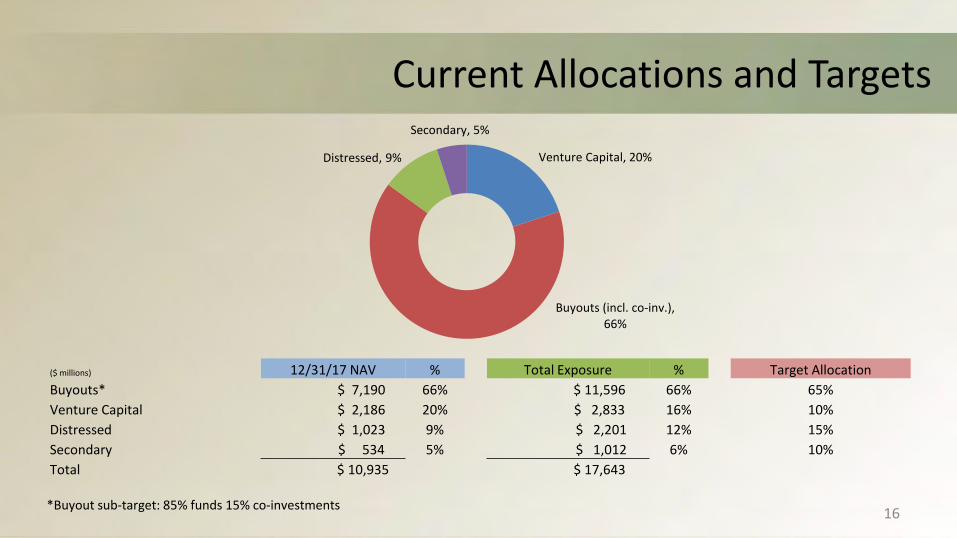
Current Allocations and Targets
16
($ millions) 12/31/17 NAV % Total Exposure % Target AllocationBuyouts* $ 7,190 66% $ 11,596 66% 65%Venture Capital $ 2,186 20% $ 2,833 16% 10%Distressed $ 1,023 9% $ 2,201 12% 15%Secondary $ 534 5% $ 1,012 6% 10%Total $ 10,935 $ 17,643
*Buyout sub-target: 85% funds 15% co-investments
Venture Capital, 20%
Buyouts (incl. co-inv.), 66%
Distressed, 9%
Secondary, 5%

Commitment Pacing
17
• Estimated pacing over the next three fiscal years in-line with asset class target allocations
• Actual timing of fundraises will vary depending on market conditions
($ in millions) FY 18/19 FY 19/20 FY 20/21 Total 3 year avg.
Buyout $ 1,235 $ 1,055 $ 1,320 $ 3,610 $ 1,203 69%
Funds $ 1,035 $ 855 $ 1,095 $ 2,985 $ 995
Co-investments $ 200 $ 200 $ 225 $ 625 $ 208
Venture Capital $ 95 $ 175 $ 105 $ 375 $ 125 7%
Distressed $ 350 $ 260 $ 350 $ 960 $ 320 18%
Secondary $ 200 $ 50 $ 50 $ 300 $ 100 6%
Total $ 1,880 $ 1,540 $ 1,825 $ 5,245 $ 1,761

Total Sector Exposure
• Portfolio sector exposure is similar to that of the Cambridge PE/VC benchmark• Relative to the asset class primary benchmark, PE managers have a large overweight to
technology (+20%) and a large underweight to the financials sector (-10%).Source: Cambridge Associates and MSCI
As of December 31, 2017
18
40% 37%
20%
16%13%
21%
14%13%
21%
11%14%
11%
10% 16%
6%
8% 6%
18%
0%
10%
20%
30%
40%
50%
60%
70%
80%
90%
100%
PE NAV Cambridge PE/VC Bmrk MSCI ACWI IMI
Other
Financials
Energy/Nat. Resources
Healthcare
Mfg/Industrials
Consumer/Retail
IT/Media

Total Geographic Exposure
• The portfolio remains tilted to North America. We expect exposures in Europe and Asia to grow over time.
Source: Cambridge Associates and MSCI
As of December 31, 2017
19
75% 72%
55%
16% 18%
21%
7% 9%21%
0%
10%
20%
30%
40%
50%
60%
70%
80%
90%
100%
PE NAV Cambridge PE/VC Bmrk MSCI ACWI IMI
Africa
Middle East
Latin America
Other Geo
Asia
Europe
North America

GP Concentration
• Total portfolio is diversified by GP• The largest 15 exposures
represent 57% of portfolio NAV• Lexington Partners is the largest
GP relationship in the portfolio (10%)– 76% co-investments– 24% secondary
20
General Partner 12/31/17 NAV % of PE PortfolioLexington Partners 1,124,825,651 10%Grove Street Advisors 791,303,298 7%SVB Capital 569,637,686 5%Thoma Bravo 508,405,948 5%TrueBridge Ventures 433,265,886 4%Fairview Capital 415,941,080 4%Hellman & Freidman 366,974,109 3%Warburg Pincus 331,230,587 3%Ares Management 303,243,825 3%Ardian 277,992,039 3%Carlyle Group 237,656,231 2%Insight 231,146,101 2%Blackstone Group 229,791,900 2%RCP Advisors 224,203,733 2%Advent Intl. 217,114,141 2%
Total 6,262,732,215$ 57%

Private Equity Program Performance
21
• Since inception the asset class has committed over $24b to 236 funds
• $17.6b called to date• $16.3b distributed; 0.9x
DPI• $10.9b in remaining
value; 1.5x TVPI• Value creation to date
of $9.6b
As of December 31, 2017
$24,358
$10,935
$16,306
$17,634
$0
$5,000
$10,000
$15,000
$20,000
$25,000
$30,000
Total PE Asset Class Portfolio ($M)
1.5x
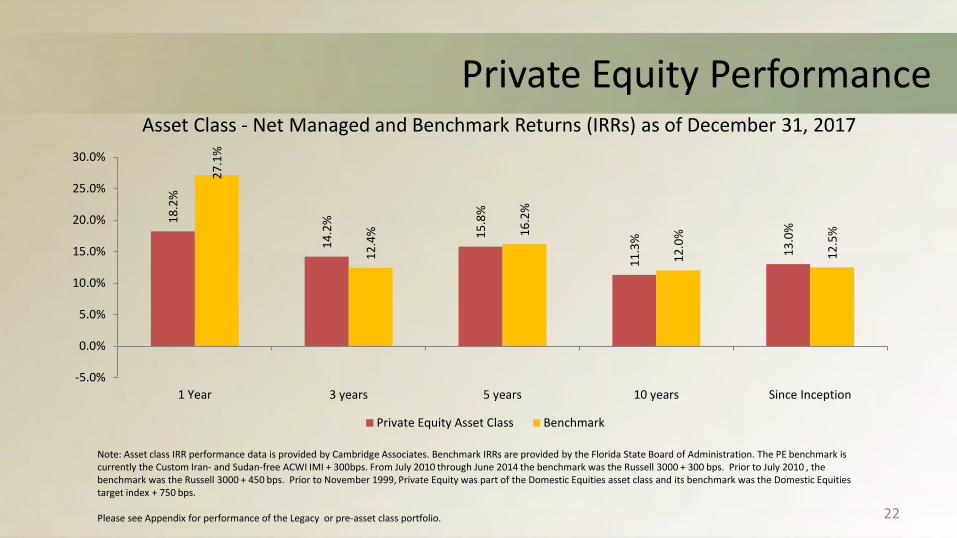
Private Equity PerformanceAsset Class - Net Managed and Benchmark Returns (IRRs) as of December 31, 2017
Note: Asset class IRR performance data is provided by Cambridge Associates. Benchmark IRRs are provided by the Florida State Board of Administration. The PE benchmark is currently the Custom Iran- and Sudan-free ACWI IMI + 300bps. From July 2010 through June 2014 the benchmark was the Russell 3000 + 300 bps. Prior to July 2010 , the benchmark was the Russell 3000 + 450 bps. Prior to November 1999, Private Equity was part of the Domestic Equities asset class and its benchmark was the Domestic Equities target index + 750 bps.
Please see Appendix for performance of the Legacy or pre-asset class portfolio. 22
18.2
%
14.2
%
15.8
%
11.3
%
13.0
%
27.1
%
12.4
% 16.2
%
12.0
%
12.5
%
-5.0%
0.0%
5.0%
10.0%
15.0%
20.0%
25.0%
30.0%
1 Year 3 years 5 years 10 years Since Inception
Private Equity Asset Class Benchmark

Vintage Year Performance
23
• Since inception of the asset class, the SBA has outperformed vintage year benchmarks in 13 out of 18 years (72%)
As of December 31, 201722.8
18.0
9.213.0
19.3
10.4
7.38.6
13.912.2
17.5
14.5
19.6
15.714.1
15.8
13.0
9.8
(5.0)
-
5.0
10.0
15.0
20.0
25.0
1999 2000 2001 2002 2003 2004 2005 2006 2007 2008 2009 2010 2011 2012 2013 2014 2015 2016
Net
IRR
Fund IRR CA Median

Cash Flow History
24
-965.7-727.1
-378.0 -342.4-729.6
-529.9-687.7
-976.7 -1,086.1 -1,063.9
-520.4
-1,036.0 -1,186.4-1,489.4
-1,243.1
-2,177.6-1,919.0 -1,951.8 -2,020.5
346.0 309.4 454.7 589.6391.3
904.7 916.01,139.1
931.0 826.0
395.5613.4
979.01,343.1
1,734.7
2,408.62,598.4
1,911.7
2,727.9
-2,500
-2,000
-1,500
-1,000
-500
0
500
1,000
1,500
2,000
2,500
3,000
1999 2000 2001 2002 2003 2004 2005 2006 2007 2008 2009 2010 2011 2012 2013 2014 2015 2016 2017
Cas
h Fl
ow ($
M)
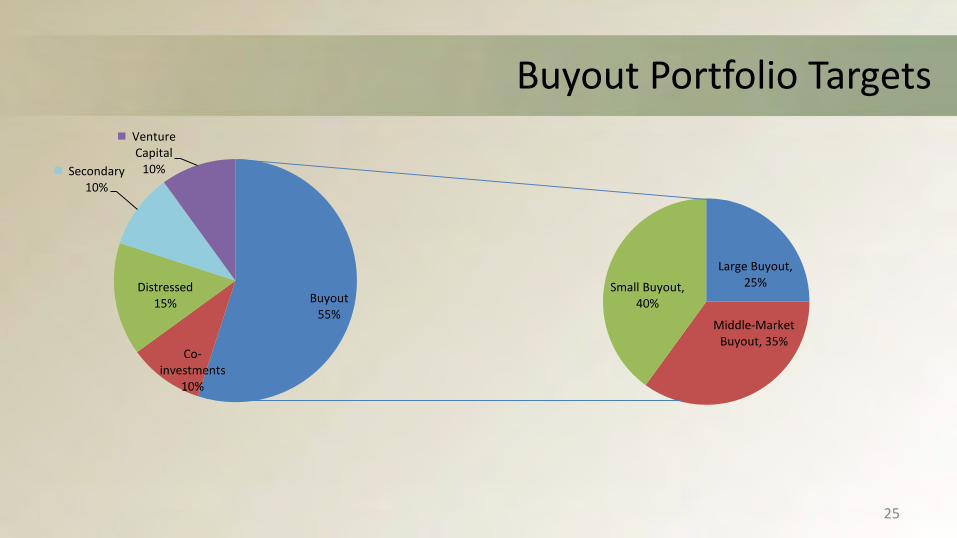
Buyout Portfolio Targets
25
Buyout55%
Co-investments
10%
Distressed15%
Secondary10%
Venture Capital
10%
Large Buyout, 25%
Middle-Market Buyout, 35%
Small Buyout, 40%

Buyout Portfolio
• 12 GPs – Target of 12• Fund sizes range from $750m-$7b• Avg. EV between $250m-$750m• $50m - $200 target commitment
26
• 7 GPs – Target of 6• Fund sizes range from $8.5b - $18b• Avg. EV greater than $750m• $200m target commitment
• 14 GPs – Target of 18• Fund sizes range from $200m - $12b• Avg. EV less than $250m• $25m - $100m target commitment
Large Middle-Market Small
Firm Geographic Focus Sector Focus Firm Geographic Focus Sector Focus Firm Geographic Focus Sector FocusAdvent International Europe Generalist ABRY Partners U.S. TMT Accel KKR U.S. TechnologyBlackstone Group Global Generalist Ardian Europe Generalist Asia Alternatives Asia GeneralistThe Carlyle Group U.S. Generalist Berkshire Partners U.S. Generalist Carnelian U.S. EnergyCVC Europe Generalist Charlesbank U.S. Generalist Cortec U.S. GeneralistHellman & Friedman U.S. Generalist Denham U.S. Energy Cressey & Co. U.S. Health CareKKR Asia Asia Generalist EnCap U.S. Energy Deutsche Beteiligungs Europe GeneralistSilver Lake U.S. Technology FS Equity U.S. Consumer Equistone Europe Generalist
InvestIndustrial Europe Generalist Francisco Partners U.S. TechnologyMontagu Europe Generalist Post Oak U.S. EnergySiris U.S. Technology Rubicon U.S. TechnologyStone Point U.S. Financials Thoma Bravo U.S. TechnologyThoma Bravo U.S. Technology TPG Global Generalist
Waterland Europe GeneralistWarburg Pincus Global Generalist

Buyout Portfolio Exposure by Sector
Portfolio Commentary• The information technology, consumer and energy
sectors make up the largest exposures in the portfolio• Portfolio balanced by size, which is unique for a plan of
our size• Portfolio weighted heavily towards North America, but
we continue to proactively source opportunities in Europe and Asia.
27
Exposure by Geography
Exposure by Size
*Exposure weightings by NAV as of 12/31/17
U.S. and Canada, 76.7%
Europe, 15.3%
Asia, 7.0%Other, 1.1%
Large Buyout, 30%
Middle-Market
Buyout, 35%
Small Buyout, 36%
Health Care, 9.8%
Information Technology,
32.1%
Consumer Discretionary,
15.8%Financials, 9.0%
Telecommunication Services,
1.2%
Utilities, 1.2%
Industrials, 10.1%
Energy, 14.5%
Materials, 3.1%
Consumer Staples, 3.2%

Buyout Portfolio Performance
28
4.8%
0.0%1.0%2.0%3.0%4.0%5.0%6.0%
Alpha over MSCI ACWI IMI(IRR%)
(net IRRs) 1yr 3yr 5yr 10yrSince
InceptionU.S. Buyouts 20.0% 15.9% 16.3% 11.1% 12.3%Non-U.S. Buyouts 27.3% 17.8% 16.8% 11.4% 11.3%U.S. Growth Equity 15.3% 14.9% 17.0% 13.0% 13.0%Non-U.S. Growth Equity 15.3% 10.6% 11.1% -- 6.9%
Total Buyouts 20.8% 15.6% 16.0% 11.2% 12.4%CA Benchmark 20.1% 12.0% 12.9% 8.8% 12.1%
Public Market Equivalent (PME) Comparison (Since Inception)
As of December 31, 2017
• Overall outperformance vs. the benchmark• Non-U.S. Buyouts have outperformed U.S.
peers (helped by € appreciation)• Alpha over public markets (PME) of 480 bps• DPI of 0.9x and TVPI of 1.5x
0.7x0.4x
1.0x0.7x
0.9x
1.5x1.2x
1.6x1.4x 1.5x
0.0
0.5
1.0
1.5
2.0
U.S. GrowthEqutiy
Non-U.S.Growth Equity
U.S. Buyouts Non-U.S.Buyouts
Total Buyouts
Distributed/Paid-In Total Value/Paid-In
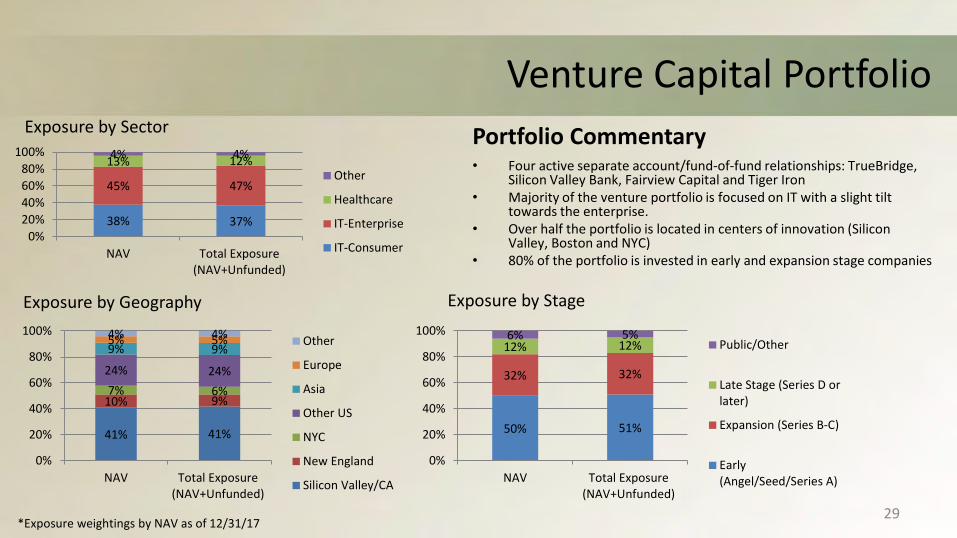
Venture Capital PortfolioPortfolio Commentary• Four active separate account/fund-of-fund relationships: TrueBridge,
Silicon Valley Bank, Fairview Capital and Tiger Iron• Majority of the venture portfolio is focused on IT with a slight tilt
towards the enterprise.• Over half the portfolio is located in centers of innovation (Silicon
Valley, Boston and NYC)• 80% of the portfolio is invested in early and expansion stage companies
29
Exposure by Sector
Exposure by Geography Exposure by Stage
*Exposure weightings by NAV as of 12/31/17
38% 37%
45% 47%
13% 12%4% 4%
0%20%40%60%80%
100%
NAV Total Exposure(NAV+Unfunded)
Other
Healthcare
IT-Enterprise
IT-Consumer
41% 41%
10% 9%7% 6%
24% 24%
9% 9%5% 5%4% 4%
0%
20%
40%
60%
80%
100%
NAV Total Exposure(NAV+Unfunded)
Other
Europe
Asia
Other US
NYC
New England
Silicon Valley/CA
50% 51%
32% 32%
12% 12%6% 5%
0%
20%
40%
60%
80%
100%
NAV Total Exposure(NAV+Unfunded)
Public/Other
Late Stage (Series D orlater)
Expansion (Series B-C)
Early(Angel/Seed/Series A)
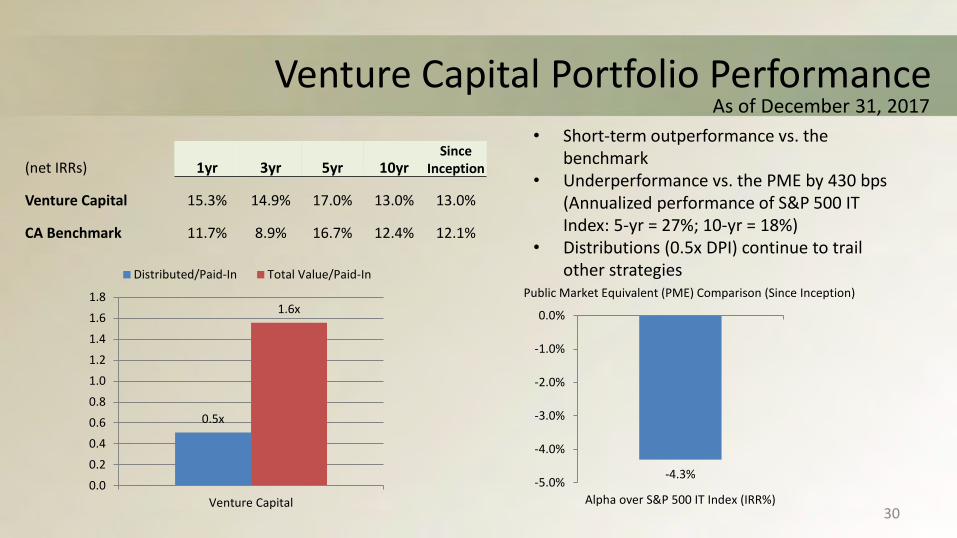
Venture Capital Portfolio Performance
30
-4.3%-5.0%
-4.0%
-3.0%
-2.0%
-1.0%
0.0%
Alpha over S&P 500 IT Index (IRR%)
(net IRRs) 1yr 3yr 5yr 10yrSince
Inception
Venture Capital 15.3% 14.9% 17.0% 13.0% 13.0%
CA Benchmark 11.7% 8.9% 16.7% 12.4% 12.1%
Public Market Equivalent (PME) Comparison (Since Inception)
• Short-term outperformance vs. the benchmark
• Underperformance vs. the PME by 430 bps (Annualized performance of S&P 500 IT Index: 5-yr = 27%; 10-yr = 18%)
• Distributions (0.5x DPI) continue to trail other strategies
As of December 31, 2017
0.5x
1.6x
0.0
0.2
0.4
0.6
0.8
1.0
1.2
1.4
1.6
1.8
Venture Capital
Distributed/Paid-In Total Value/Paid-In
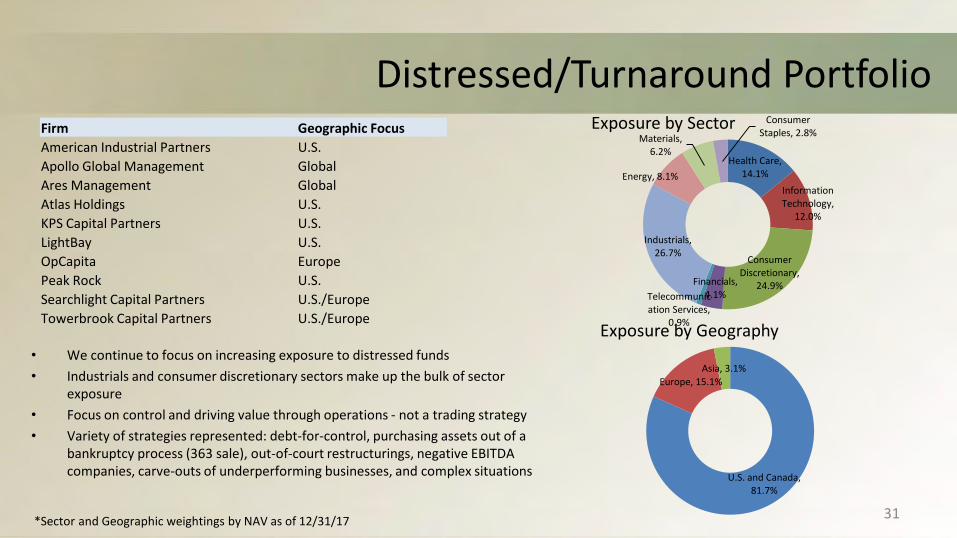
Distressed/Turnaround Portfolio
31
• We continue to focus on increasing exposure to distressed funds • Industrials and consumer discretionary sectors make up the bulk of sector
exposure• Focus on control and driving value through operations - not a trading strategy• Variety of strategies represented: debt-for-control, purchasing assets out of a
bankruptcy process (363 sale), out-of-court restructurings, negative EBITDA companies, carve-outs of underperforming businesses, and complex situations
Firm Geographic FocusAmerican Industrial Partners U.S.Apollo Global Management GlobalAres Management GlobalAtlas Holdings U.S.KPS Capital Partners U.S.LightBay U.S.OpCapita EuropePeak Rock U.S.Searchlight Capital Partners U.S./EuropeTowerbrook Capital Partners U.S./Europe
*Sector and Geographic weightings by NAV as of 12/31/17
Exposure by Sector
Exposure by Geography
Health Care, 14.1%
Information Technology,
12.0%
Consumer Discretionary,
24.9%Financials, 4.1%Telecommunic
ation Services, 0.9%
Industrials, 26.7%
Energy, 8.1%
Materials, 6.2%
Consumer Staples, 2.8%
U.S. and Canada, 81.7%
Europe, 15.1%Asia, 3.1%

Distressed/Turnaround Portfolio Performance
32*Exposure weightings by NAV as of 12/31/17
12.5%
0.0%2.0%4.0%6.0%8.0%
10.0%12.0%14.0%
Alpha over MSCI ACWI IMI (IRR%)
(net IRRs) 1yr 3yr 5yr 10yrSince
Inception
Distressed/Turnaround 21.5% 15.3% 16.2% 12.3% 20.6%
CA Benchmark 13.2% 8.5% 10.2% 9.4% 10.8%
Public Market Equivalent (PME) Comparison (Since Inception)
• Overall outperformance vs. the benchmarks• Alpha over the public markets (PME) of 1,250
bps• Distributions received greater than
contributed capital (DPI 1.2x)• 1.7x TVPI leads overall PE portfolio
As of December 31, 2017
1.2x
1.7x
0.0
0.5
1.0
1.5
2.0
Distressed/Turnaround
Distributed/Paid-In Total Value/Paid-In

Secondary Portfolio
33
• Highly diversified portfolio with more than 1,000 underlying private equity funds
• Very competitive market• Secondary market pricing has
increased over the last few years• Leveraging secondary
relationships to operate more tactically
Firm Strategy/Market Geographic FocusArdian Large GlobalLexington Partners Large Global
% of Secondary Portfolio (by NAV)
Ardian, 38%
Lexington Partners, 62%
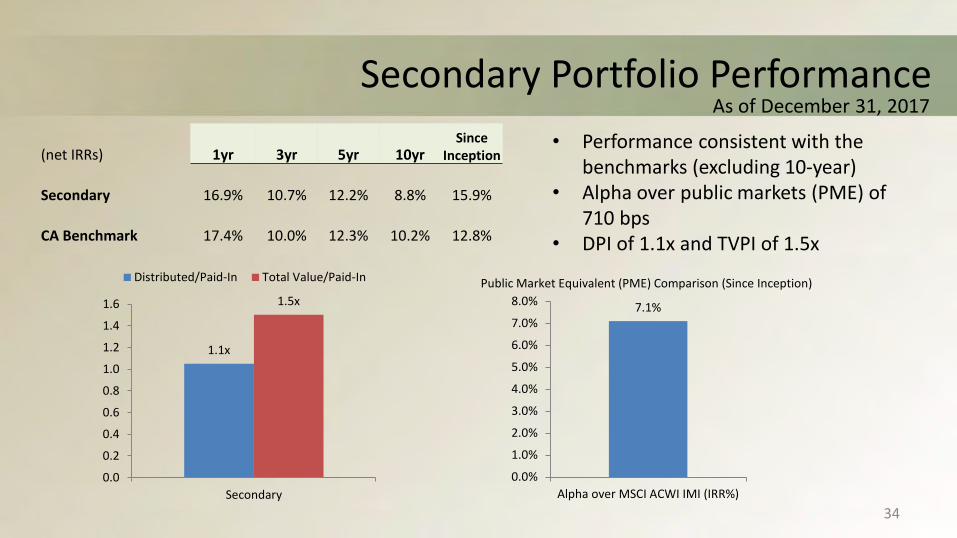
Secondary Portfolio Performance
34
7.1%
0.0%
1.0%
2.0%
3.0%
4.0%
5.0%
6.0%
7.0%
8.0%
Alpha over MSCI ACWI IMI (IRR%)
(net IRRs) 1yr 3yr 5yr 10yrSince
Inception
Secondary 16.9% 10.7% 12.2% 8.8% 15.9%
CA Benchmark 17.4% 10.0% 12.3% 10.2% 12.8%
Public Market Equivalent (PME) Comparison (Since Inception)
• Performance consistent with the benchmarks (excluding 10-year)
• Alpha over public markets (PME) of 710 bps
• DPI of 1.1x and TVPI of 1.5x
As of December 31, 2017
1.1x
1.5x
0.0
0.2
0.4
0.6
0.8
1.0
1.2
1.4
1.6
Secondary
Distributed/Paid-In Total Value/Paid-In

Appendix
35

Private Equity AggregatesDollar-Weighted Performance (IRRs) as of December 31, 2017
Note: Asset class IRR performance data is provided by Cambridge Associates. Benchmark IRRs are provided by the Florida State Board of Administration. The PE benchmark is currently the Custom Iran- and Sudan-free ACWI IMI + 300bps. From July 2010 through June 2014 the benchmark was the Russell 3000 + 300 bps. Prior to July 2010 , the benchmark was the Russell 3000 + 450 bps. Prior to November 1999, Private Equity was part of the Domestic Equity asset class and its benchmark was the Domestic Equity target index + 750 bps.
Inception DateMarket Value (in
Millions) 1yr 3yr 5yr 10yrSince
Inception
Total Private Equity 1/27/1989 $10,944 18.2% 14.2% 15.4% 10.0% 9.5%
Custom Iran- and Sudan-free ACWI IMI +300bps 27.1% 12.4% 15.6% 11.3% 11.1%
Private Equity Legacy Portfolio 1/27/1989 $9 -10.8% -15.4% -17.9% -8.6% 3.7%
Custom Iran- and Sudan-free ACWI IMI +300bps 27.0% 12.5% 19.6% 6.7% 10.0%
Private Equity Asset Class Portfolio 8/31/2000 $10,935 18.2% 14.2% 15.8% 11.3% 13.0%
Custom Iran- and Sudan-free ACWI IMI +300bps 27.1% 12.4% 16.2% 12.0% 12.5%
36

Private Equity Partnership PerformanceAs of December 31, 2017
Note: Manager IRR performance data is provided by Cambridge Associates.
37
Private Investments Partnerships Commitment ($) Current NAV ($) TVPI Net IRR3i Europartners Vb, L.P. 77,440,017 0 0.97 -0.6%3i Growth Capital Fund, L.P. 54,440,286 0 0.93 -2.0%ABRY Partners VII, L.P. 75,000,000 29,610,662 1.81 15.6%ABRY Partners VIII, L.P. 75,000,000 67,234,522 1.17 8.9%Accel-KKR Capital Partners V 50,000,000 9,217,013 0.98 NAAccel-KKR Structured Capital Partners II, LP 25,000,000 10,009,662 1.12 7.9%Advent International Global Private Equity VIII-D 150,000,000 72,688,421 1.07 12.7%Advent International GPE VI-D, L.P. 58,000,000 27,488,976 2.10 17.4%Advent International GPE VII-D, L.P. 102,335,815 116,936,744 1.70 18.7%American Industrial Partners Capital Fund VI, L.P. 50,000,000 28,117,687 0.99 -2.0%Apax VIII-B, L.P. 157,584,000 177,683,287 1.39 13.5%Apollo Investment Fund IX, L.P. 200,000,000 0 NA NAApollo Investment Fund V, L.P. 150,000,000 0 2.66 38.8%Apollo Investment Fund VI L.P. 200,000,000 0 1.70 9.5%Apollo Investment Fund VII, L.P. 200,000,000 0 2.02 23.8%Apollo Investment Fund VIII, L.P. 200,000,000 176,784,104 1.35 19.8%Ardian LBO Fund VI, L.P 98,905,446 39,673,199 1.00 -0.8%Ardian Secondary Fund VI, L.P. 150,000,000 100,581,389 1.36 14.6%Ares Corporate Opportunities Fund III, L.P. 100,000,000 103,348,759 2.65 23.8%Ares Corporate Opportunities Fund IV, L.P. 200,000,000 173,280,762 1.49 15.7%Ares Corporate Opportunities Fund V 200,000,000 26,614,304 0.96 NAASF VII, L.P. 150,000,000 39,459,111 1.22 21.0%Asia Alternatives FL Investor II, LP 200,000,000 2,617,404 0.88 NA

Private Equity Partnership PerformanceAs of December 31, 2017
Note: Manager IRR performance data is provided by Cambridge Associates. 38
Private Investments Partnerships Commitment ($) Current NAV ($) TVPI Net IRRAsia Alternatives FL Investor, LP 200,000,000 123,069,430 1.24 15.0%Atlas Capital Resources II 20,000,000 12,557,644 1.31 18.0%AXA LBO Fund V, L.P. 76,858,858 76,680,070 1.45 12.9%AXA Secondary Fund V, L.P. 100,000,000 21,598,269 1.63 17.7%BC European Capital IX, L.P. 101,118,077 0 1.09 5.8%Berkshire Fund IX, L.P. 110,000,000 26,433,446 0.96 NABerkshire Fund VIII, L.P. 60,000,000 49,999,347 1.43 12.3%Blackstone Capital Partners V, L.P. 150,000,000 0 1.60 7.1%Blackstone Capital Partners VI, L.P. 200,000,000 190,567,763 1.49 13.1%Blackstone Capital Partners VII, L.P. 180,000,000 39,224,137 1.05 9.0%Carlyle Asia Growth Partners IV, L.P. 75,000,000 37,917,664 1.31 6.6%Carlyle Europe Partners III, L.P. 66,000,377 0 1.61 12.9%Carlyle Partners III, L.P. 200,000,000 0 2.30 22.8%Carlyle Partners IV, L.P. 75,000,000 1,454,014 2.02 13.1%Carlyle Partners V, L.P. 200,000,000 0 1.81 13.5%Carlyle Partners VI, L.P. 200,000,000 198,284,553 1.25 13.0%Carnelian Energy Capital II 40,000,000 3,208,739 1.03 NACharlesbank Equity Fund IX, L.P. 105,000,000 0 NA NACharlesbank Equity Fund VII, L.P. 75,000,000 43,172,238 2.07 23.3%Charlesbank Equity Fund VIII, L.P. 85,000,000 74,217,188 1.15 9.8%Charlesbank Fund IX Overage Allocation Program 10,000,000 0 NA NACharterhouse Capital Partners IX, L.P. 90,366,890 0 1.35 13.7%Cortec Group Fund V, L.P. 50,000,000 168,287,385 3.85 40.1%
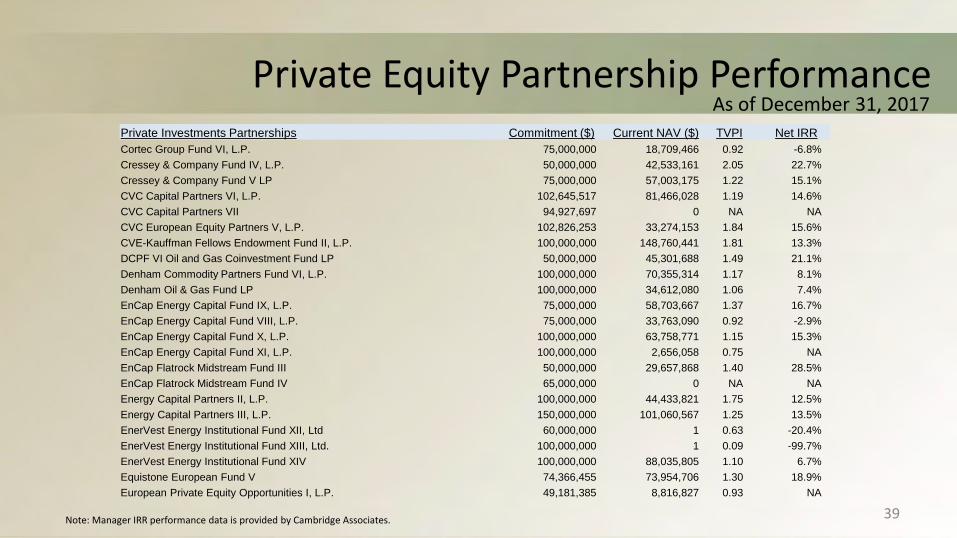
Private Equity Partnership PerformanceAs of December 31, 2017
Note: Manager IRR performance data is provided by Cambridge Associates. 39
Private Investments Partnerships Commitment ($) Current NAV ($) TVPI Net IRRCortec Group Fund VI, L.P. 75,000,000 18,709,466 0.92 -6.8%Cressey & Company Fund IV, L.P. 50,000,000 42,533,161 2.05 22.7%Cressey & Company Fund V LP 75,000,000 57,003,175 1.22 15.1%CVC Capital Partners VI, L.P. 102,645,517 81,466,028 1.19 14.6%CVC Capital Partners VII 94,927,697 0 NA NACVC European Equity Partners V, L.P. 102,826,253 33,274,153 1.84 15.6%CVE-Kauffman Fellows Endowment Fund II, L.P. 100,000,000 148,760,441 1.81 13.3%DCPF VI Oil and Gas Coinvestment Fund LP 50,000,000 45,301,688 1.49 21.1%Denham Commodity Partners Fund VI, L.P. 100,000,000 70,355,314 1.17 8.1%Denham Oil & Gas Fund LP 100,000,000 34,612,080 1.06 7.4%EnCap Energy Capital Fund IX, L.P. 75,000,000 58,703,667 1.37 16.7%EnCap Energy Capital Fund VIII, L.P. 75,000,000 33,763,090 0.92 -2.9%EnCap Energy Capital Fund X, L.P. 100,000,000 63,758,771 1.15 15.3%EnCap Energy Capital Fund XI, L.P. 100,000,000 2,656,058 0.75 NAEnCap Flatrock Midstream Fund III 50,000,000 29,657,868 1.40 28.5%EnCap Flatrock Midstream Fund IV 65,000,000 0 NA NAEnergy Capital Partners II, L.P. 100,000,000 44,433,821 1.75 12.5%Energy Capital Partners III, L.P. 150,000,000 101,060,567 1.25 13.5%EnerVest Energy Institutional Fund XII, Ltd 60,000,000 1 0.63 -20.4%EnerVest Energy Institutional Fund XIII, Ltd. 100,000,000 1 0.09 -99.7%EnerVest Energy Institutional Fund XIV 100,000,000 88,035,805 1.10 6.7%Equistone European Fund V 74,366,455 73,954,706 1.30 18.9%European Private Equity Opportunities I, L.P. 49,181,385 8,816,827 0.93 NA
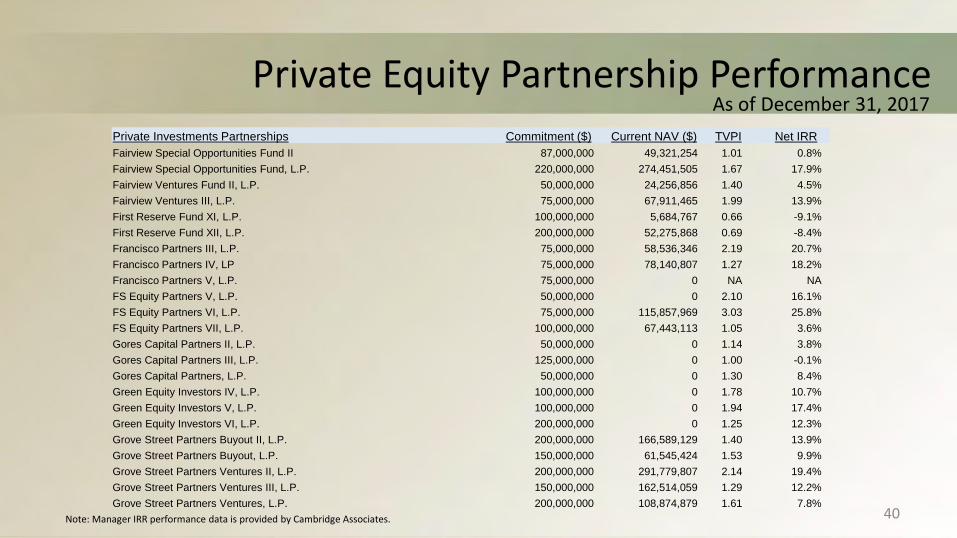
Private Equity Partnership PerformanceAs of December 31, 2017
Note: Manager IRR performance data is provided by Cambridge Associates. 40
Private Investments Partnerships Commitment ($) Current NAV ($) TVPI Net IRRFairview Special Opportunities Fund II 87,000,000 49,321,254 1.01 0.8%Fairview Special Opportunities Fund, L.P. 220,000,000 274,451,505 1.67 17.9%Fairview Ventures Fund II, L.P. 50,000,000 24,256,856 1.40 4.5%Fairview Ventures III, L.P. 75,000,000 67,911,465 1.99 13.9%First Reserve Fund XI, L.P. 100,000,000 5,684,767 0.66 -9.1%First Reserve Fund XII, L.P. 200,000,000 52,275,868 0.69 -8.4%Francisco Partners III, L.P. 75,000,000 58,536,346 2.19 20.7%Francisco Partners IV, LP 75,000,000 78,140,807 1.27 18.2%Francisco Partners V, L.P. 75,000,000 0 NA NAFS Equity Partners V, L.P. 50,000,000 0 2.10 16.1%FS Equity Partners VI, L.P. 75,000,000 115,857,969 3.03 25.8%FS Equity Partners VII, L.P. 100,000,000 67,443,113 1.05 3.6%Gores Capital Partners II, L.P. 50,000,000 0 1.14 3.8%Gores Capital Partners III, L.P. 125,000,000 0 1.00 -0.1%Gores Capital Partners, L.P. 50,000,000 0 1.30 8.4%Green Equity Investors IV, L.P. 100,000,000 0 1.78 10.7%Green Equity Investors V, L.P. 100,000,000 0 1.94 17.4%Green Equity Investors VI, L.P. 200,000,000 0 1.25 12.3%Grove Street Partners Buyout II, L.P. 200,000,000 166,589,129 1.40 13.9%Grove Street Partners Buyout, L.P. 150,000,000 61,545,424 1.53 9.9%Grove Street Partners Ventures II, L.P. 200,000,000 291,779,807 2.14 19.4%Grove Street Partners Ventures III, L.P. 150,000,000 162,514,059 1.29 12.2%Grove Street Partners Ventures, L.P. 200,000,000 108,874,879 1.61 7.8%
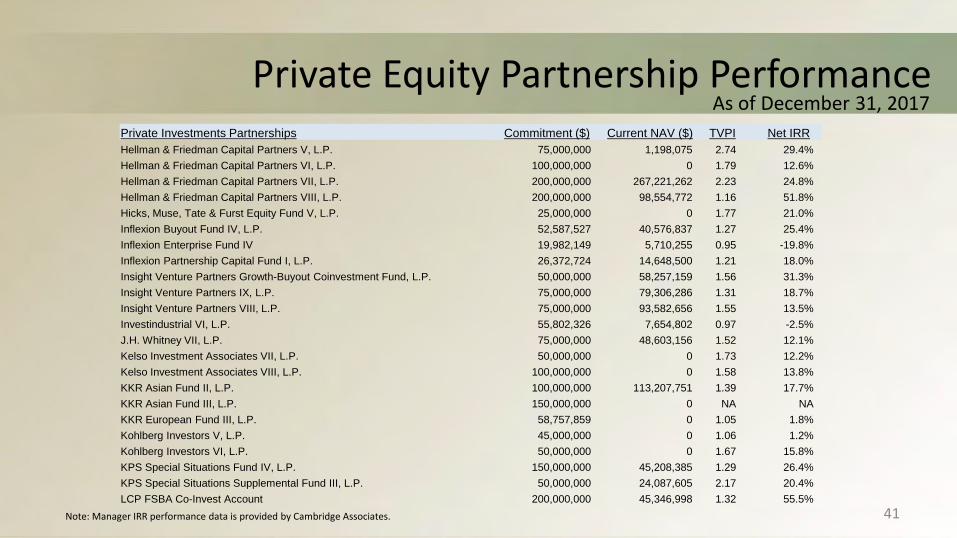
Private Equity Partnership PerformanceAs of December 31, 2017
Note: Manager IRR performance data is provided by Cambridge Associates. 41
Private Investments Partnerships Commitment ($) Current NAV ($) TVPI Net IRRHellman & Friedman Capital Partners V, L.P. 75,000,000 1,198,075 2.74 29.4%Hellman & Friedman Capital Partners VI, L.P. 100,000,000 0 1.79 12.6%Hellman & Friedman Capital Partners VII, L.P. 200,000,000 267,221,262 2.23 24.8%Hellman & Friedman Capital Partners VIII, L.P. 200,000,000 98,554,772 1.16 51.8%Hicks, Muse, Tate & Furst Equity Fund V, L.P. 25,000,000 0 1.77 21.0%Inflexion Buyout Fund IV, L.P. 52,587,527 40,576,837 1.27 25.4%Inflexion Enterprise Fund IV 19,982,149 5,710,255 0.95 -19.8%Inflexion Partnership Capital Fund I, L.P. 26,372,724 14,648,500 1.21 18.0%Insight Venture Partners Growth-Buyout Coinvestment Fund, L.P. 50,000,000 58,257,159 1.56 31.3%Insight Venture Partners IX, L.P. 75,000,000 79,306,286 1.31 18.7%Insight Venture Partners VIII, L.P. 75,000,000 93,582,656 1.55 13.5%Investindustrial VI, L.P. 55,802,326 7,654,802 0.97 -2.5%J.H. Whitney VII, L.P. 75,000,000 48,603,156 1.52 12.1%Kelso Investment Associates VII, L.P. 50,000,000 0 1.73 12.2%Kelso Investment Associates VIII, L.P. 100,000,000 0 1.58 13.8%KKR Asian Fund II, L.P. 100,000,000 113,207,751 1.39 17.7%KKR Asian Fund III, L.P. 150,000,000 0 NA NAKKR European Fund III, L.P. 58,757,859 0 1.05 1.8%Kohlberg Investors V, L.P. 45,000,000 0 1.06 1.2%Kohlberg Investors VI, L.P. 50,000,000 0 1.67 15.8%KPS Special Situations Fund IV, L.P. 150,000,000 45,208,385 1.29 26.4%KPS Special Situations Supplemental Fund III, L.P. 50,000,000 24,087,605 2.17 20.4%LCP FSBA Co-Invest Account 200,000,000 45,346,998 1.32 55.5%

Private Equity Partnership PerformanceAs of December 31, 2017
Note: Manager IRR performance data is provided by Cambridge Associates. 42
Private Investments Partnerships Commitment ($) Current NAV ($) TVPI Net IRRLexington Capital Partners IV, L.P. 200,000,000 0 1.78 20.2%Lexington Capital Partners V, L.P. 100,000,000 4,997,783 1.69 19.0%Lexington Capital Partners VI, L.P. 100,000,000 16,007,565 1.35 6.4%Lexington Capital Partners VII, L.P. 200,000,000 74,003,196 1.55 14.6%Lexington Capital Partners VIII, L.P. 250,000,000 123,537,092 1.32 27.9%Lexington Co-Investment Partners (Pools I & II), L.P. 500,000,000 0 1.35 6.3%Lexington Co-Investment Partners 2005 (Pool III), L.P. 500,000,000 528,829,601 1.74 20.9%Lexington Co-Investment Partners 2005 (Pools I & II), L.P. 500,000,000 111,650,365 1.32 4.4%Lexington Co-Investment Partners 2005 Pool IV 500,000,000 135,257,151 1.13 NALexington Co-Investment Partners II (Pools III & IV), L.P. 500,000,000 38,550,691 2.23 23.6%Lexington Middle Market Investors III, L.P. 100,000,000 46,645,209 1.37 17.7%Lightbay Investment Partners LP 50,000,000 0 NA NALindsay, Goldberg & Bessemer II, L.P. 100,000,000 0 1.48 8.0%Lindsay, Goldberg & Bessemer III, L.P. 100,000,000 0 1.18 6.8%Montagu Private Equity IV, L.P. 56,819,796 35,125,889 1.51 14.1%Montagu V 111,109,877 31,060,759 1.11 19.6%New Mountain Partners II, L.P. 50,000,000 1,836,882 2.07 13.7%New Mountain Partners III, L.P. 100,000,000 68,990,057 2.02 13.6%New Mountain Partners IV, L.P. 100,000,000 105,197,494 1.34 20.5%OpCapita Consumer Opportunities Fund II 38,251,366 10,697,490 0.91 -20.4%OpenView Venture Partners IV, L.P. 25,000,000 18,263,262 1.08 4.9%OpenView Venture Partners V, L.P. 25,000,000 3,498,249 0.91 NAPAI Europe V, L.P. 42,563,071 0 1.30 7.0%

Private Equity Partnership PerformanceAs of December 31, 2017
Note: Manager IRR performance data is provided by Cambridge Associates. 43
Private Investments Partnerships Commitment ($) Current NAV ($) TVPI Net IRRPantheon Global Secondary Fund IV, L.P. 100,000,000 27,284,742 1.57 14.5%Pantheon Venture Partners II, L.P. 100,000,000 48,200,706 1.58 7.5%Paul Capital Top Tier Investments II, L.P. 120,000,000 14,858,338 1.36 4.5%Paul Capital Top Tier Investments III, L.P. 75,000,000 25,374,588 1.34 5.1%Paul Capital Top Tier Investments IV, L.P. 100,000,000 95,177,556 2.04 15.2%Paul Capital Top Tier Special Opportunities Fund, L.P. 12,450,000 2,383,816 0.62 -7.7%Peak Rock Capital Credit Fund II 20,000,000 153,177 0.98 NAPeak Rock Capital Fund II, L.P. 80,000,000 3,570,594 0.93 NAPermira European Fund IV, L.P. 1 64,037,705 0 1.56 8.3%Permira V, LP 136,860,690 110,600,007 1.37 13.2%Platinum Equity Capital Partners II, L.P. 75,000,000 12,155,257 1.64 12.8%Platinum Equity Capital Partners III, L.P. 200,000,000 159,998,619 1.91 36.1%Platinum Equity Capital Partners, L.P. 50,000,000 0 2.91 60.2%Pomona Capital VI (Combined), L.P. 50,000,000 9,884,531 1.35 5.2%Pomona Capital VII (Combined), L.P. 50,000,000 2,726,386 1.30 7.8%Post Oak Energy Partners II, LP 25,000,000 34,169,407 1.80 51.2%Post Oak Energy Partners III, LP 60,000,000 31,507,784 1.23 38.9%Post Oak Energy Partners IV, LP 60,000,000 0 NA NAProvidence Equity Partners VI, L.P. 50,000,000 0 1.46 7.3%Providence Equity Partners VII, L.P. 200,000,000 171,543,355 1.56 21.2%RCP Advisors Fund IV, L.P. 50,000,000 16,731,218 1.81 13.0%RCP Advisors Fund IX, L.P. 50,000,000 29,795,660 1.10 7.5%RCP Advisors Fund V, L.P. 50,000,000 30,599,320 1.79 15.3%

Private Equity Partnership PerformanceAs of December 31, 2017
Note: Manager IRR performance data is provided by Cambridge Associates. 44
Private Investments Partnerships Commitment ($) Current NAV ($) TVPI Net IRRRCP Advisors Fund VI, L.P. 50,000,000 40,720,270 1.61 13.1%RCP Advisors Fund VII, L.P. 50,000,000 51,429,145 1.64 16.6%RCP Advisors Fund VIII, L.P. 50,000,000 41,007,598 1.29 12.3%RCP Advisors Fund X 50,000,000 13,920,522 0.84 -20.3%Ripplewood Partners II, L.P. 100,000,000 0 1.19 6.2%Riverside Capital Appreciation Fund 2008, L.P. 75,000,000 0 1.32 8.2%Riverside Capital Appreciation Fund VI, L.P. 75,000,000 70,309,402 1.48 18.9%Riverside Europe Fund IV, L.P. 49,699,937 0 1.04 1.5%Rubicon Technology Partners II 76,000,000 8,970,258 0.88 NARubicon Technology Partners L.P. 50,000,000 47,777,536 1.12 6.2%Searchlight Partners II, L.P. 100,000,000 50,483,104 1.44 34.9%Silicon Valley Bank Capital Partners III, L.P. 22,500,000 18,873,523 1.05 2.6%Silicon Valley Bank Capital Partners IV 25,000,000 801,078 0.89 NASilicon Valley Bank Overage Fund 100,500,000 86,280,459 1.31 10.7%Silicon Valley Bank SIF V, L.P. 125,000,000 158,653,651 1.67 14.5%Silicon Valley Bank SIF V-A Opportunity, L.P. 50,000,000 71,764,629 2.09 20.3%Silicon Valley Bank SIF VI-A 125,000,000 141,010,173 1.31 11.8%Silicon Valley Bank SIF VII, L.P. 125,000,000 78,936,760 1.02 1.6%Silicon Valley Bank SIF VIII 100,000,000 13,317,413 0.92 -12.6%Silver Lake Partners IV, L.P. 100,000,000 109,720,998 1.48 26.4%Silver Lake Partners V, L.P. 140,000,000 0 NA NASiris Partners III 75,000,000 51,005,285 1.09 9.5%Snow Phipps II, L.P. 50,000,000 0 1.37 14.6%
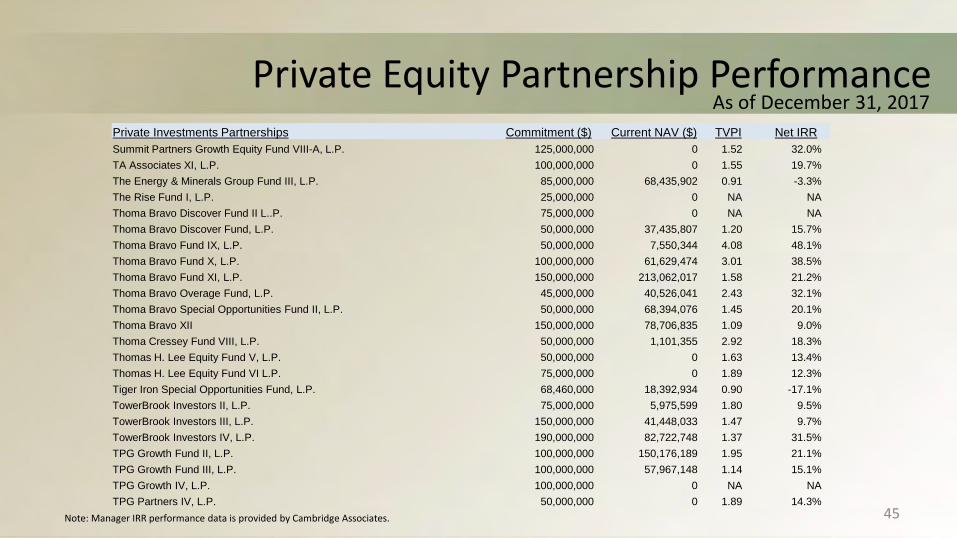
Private Equity Partnership PerformanceAs of December 31, 2017
Note: Manager IRR performance data is provided by Cambridge Associates. 45
Private Investments Partnerships Commitment ($) Current NAV ($) TVPI Net IRRSummit Partners Growth Equity Fund VIII-A, L.P. 125,000,000 0 1.52 32.0%TA Associates XI, L.P. 100,000,000 0 1.55 19.7%The Energy & Minerals Group Fund III, L.P. 85,000,000 68,435,902 0.91 -3.3%The Rise Fund I, L.P. 25,000,000 0 NA NAThoma Bravo Discover Fund II L..P. 75,000,000 0 NA NAThoma Bravo Discover Fund, L.P. 50,000,000 37,435,807 1.20 15.7%Thoma Bravo Fund IX, L.P. 50,000,000 7,550,344 4.08 48.1%Thoma Bravo Fund X, L.P. 100,000,000 61,629,474 3.01 38.5%Thoma Bravo Fund XI, L.P. 150,000,000 213,062,017 1.58 21.2%Thoma Bravo Overage Fund, L.P. 45,000,000 40,526,041 2.43 32.1%Thoma Bravo Special Opportunities Fund II, L.P. 50,000,000 68,394,076 1.45 20.1%Thoma Bravo XII 150,000,000 78,706,835 1.09 9.0%Thoma Cressey Fund VIII, L.P. 50,000,000 1,101,355 2.92 18.3%Thomas H. Lee Equity Fund V, L.P. 50,000,000 0 1.63 13.4%Thomas H. Lee Equity Fund VI L.P. 75,000,000 0 1.89 12.3%Tiger Iron Special Opportunities Fund, L.P. 68,460,000 18,392,934 0.90 -17.1%TowerBrook Investors II, L.P. 75,000,000 5,975,599 1.80 9.5%TowerBrook Investors III, L.P. 150,000,000 41,448,033 1.47 9.7%TowerBrook Investors IV, L.P. 190,000,000 82,722,748 1.37 31.5%TPG Growth Fund II, L.P. 100,000,000 150,176,189 1.95 21.1%TPG Growth Fund III, L.P. 100,000,000 57,967,148 1.14 15.1%TPG Growth IV, L.P. 100,000,000 0 NA NATPG Partners IV, L.P. 50,000,000 0 1.89 14.3%

Private Equity Partnership PerformanceAs of December 31, 2017
Note: Manager IRR performance data is provided by Cambridge Associates. 46
Private Investments Partnerships Commitment ($) Current NAV ($) TVPI Net IRRTPG Partners V, L.P. 100,000,000 0 1.18 2.6%TPG Partners VI, L.P. 200,000,000 0 1.42 11.3%Trident V, L.P. 75,000,000 74,139,482 1.58 11.3%Trident VI Fund, L.P. 75,000,000 72,955,750 1.29 16.8%Trident VII, L.P. 75,000,000 7,319,579 0.89 NATrueBridge Capital FSA, LLC 35,000,000 17,238,638 1.31 29.5%TrueBridge Capital Partners Fund V, L.P. 100,000,000 0 NA NATrueBridge FLSBA Special Purpose, LLC 47,972,078 75,255,779 2.08 19.9%TrueBridge Special Purpose II (F) 22,500,000 22,960,324 1.51 19.7%Truebridge-Kauffman Fellows Endowment Fund IV 125,000,000 42,805,534 0.95 -5.8%TrueBridge-Kauffman Fellows Fund III, L.P. 125,000,000 126,245,170 1.16 6.1%W Capital Partners III, L.P. 75,000,000 67,874,780 1.37 15.6%Warburg Pincus China 68,000,000 22,700,517 1.06 13.7%Warburg Pincus Private Equity Fund XI, L.P. 200,000,000 184,067,191 1.46 13.5%Warburg Pincus Private Equity Fund XII, L.P. 87,000,000 45,070,543 1.05 6.0%Warburg Pincus Private Equity IX, L.P. 75,000,000 8,132,659 1.76 10.0%Warburg Pincus Private Equity X, L.P. 150,000,000 71,259,677 1.54 8.2%Waterland Private Equity Fund VII C.V. 105,475,219 0 NA NAWaterland Private Equity VI Overflow Feeder Fund L.P. 28,974,931 5,731 0.13 -79.1%Waterland Private Equity VI, L.P. 61,110,432 27,719,206 1.17 15.9%Wellspring Capital Partners III, L.P. 50,000,000 0 2.19 27.1%Wellspring Capital Partners IV, L.P. 75,000,000 0 1.40 6.6%Wellspring Capital Partners V, L.P. 150,000,000 66,609,560 1.58 17.8%Willis Stein & Partners III, L.P. 100,000,000 0 1.01 0.1%

Private Equity Partnership PerformanceAs of December 31, 2017
Note: Manager IRR performance data is provided by Cambridge Associates. 47
Private Investments Partnerships (Legacy Portfolio) Commitment ($) Current NAV ($) TVPI Net IRRCorporate Partners, L.P. 149,192,410 0 2.13 12.4%Liberty Partners Pool I 205,686,600 0 2.35 20.7%Liberty Partners Pool II 359,789,821 0 1.61 10.7%Carlyle Partners II, L.P. 200,000,000 0 2.30 20.1%Centre Capital Investors II, L.P. 200,000,000 0 0.81 -4.1%Hicks, Muse, Tate & Furst Equity Fund III, L.P. 200,000,000 0 0.89 -1.8%Liberty Partners Pool III 506,208,481 0 1.02 0.4%Ripplewood Partners, L.P. 100,000,000 0 1.74 13.6%Cypress Equity Group Trust 15,000,000 0 2.15 16.1%Thomas H. Lee Equity Fund IV, L.P. 100,000,000 0 0.87 -2.6%Apollo Investment Fund IV, L.P. 250,000,000 0 1.52 6.8%Hicks, Muse, Tate & Furst Equity Fund IV, L.P. 400,000,000 0 0.63 -8.8%Willis Stein & Partners II, L.P. 40,000,000 0 0.58 -9.7%TSG Capital Fund III, L.P. 100,000,000 0 0.54 -13.7%Green Equity Investors III, L.P. 60,000,000 0 2.31 21.9%Chartwell Capital Investors II, L.P. 50,000,000 0 1.34 4.7%Liberty Partners Pool IV 195,075,745 0 0.67 -19.2%Liberty Partners Pool V 329,664,359 0 1.14 2.7%Liberty Partners Pool VI 595,484,687 275,000 0.86 -6.6%Liberty Partners Pool VII 290,808,542 8,999,264 0.85 -7.4%Liberty Partners Group II, L.P. 9,766,830 0 0.00 -100.0%
STATE BOARD OF ADMINISTRATION OF FLORIDAPRIVATE EQUITY UPDATE
JUNE 2018

STATE BOARD OF ADMINISTRATION OF FLORIDAPRIVATE EQUITY UPDATE
JUNE 2018

PORTFOLIO PERFORMANCE
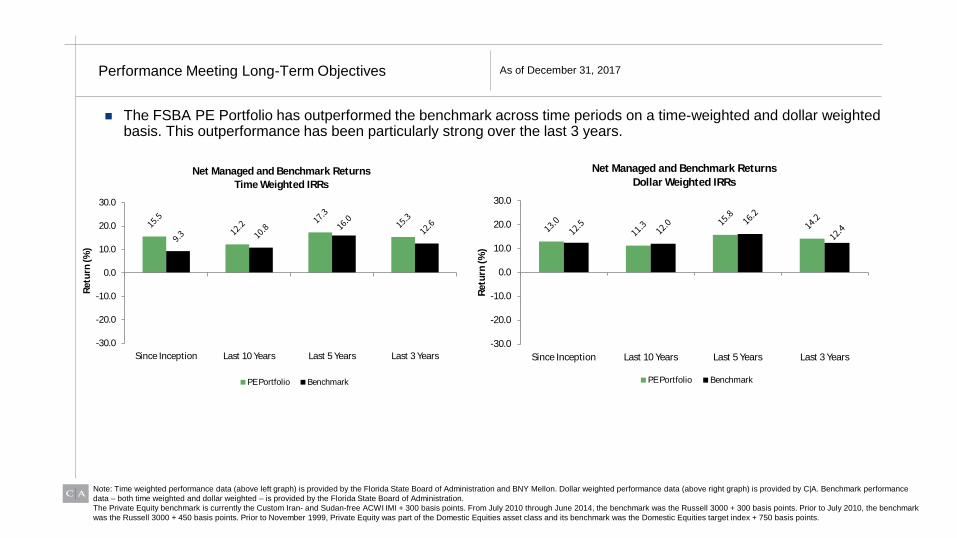
Performance Meeting Long-Term Objectives
The FSBA PE Portfolio has outperformed the benchmark across time periods on a time-weighted and dollar weighted basis. This outperformance has been particularly strong over the last 3 years.
Note: Time weighted performance data (above left graph) is provided by the Florida State Board of Administration and BNY Mellon. Dollar weighted performance data (above right graph) is provided by C|A. Benchmark performance data – both time weighted and dollar weighted – is provided by the Florida State Board of Administration.The Private Equity benchmark is currently the Custom Iran- and Sudan-free ACWI IMI + 300 basis points. From July 2010 through June 2014, the benchmark was the Russell 3000 + 300 basis points. Prior to July 2010, the benchmark was the Russell 3000 + 450 basis points. Prior to November 1999, Private Equity was part of the Domestic Equities asset class and its benchmark was the Domestic Equities target index + 750 basis points.
As of December 31, 2017
-30.0
-20.0
-10.0
0.0
10.0
20.0
30.0
Since Inception Last 10 Years Last 5 Years Last 3 Years
Retu
rn (%
)
Net Managed and Benchmark ReturnsTime Weighted IRRs
PE Portfolio Benchmark
-30.0
-20.0
-10.0
0.0
10.0
20.0
30.0
Since Inception Last 10 Years Last 5 Years Last 3 Years
Retu
rn (%
)
Net Managed and Benchmark ReturnsDollar Weighted IRRs
PE Portfolio Benchmark
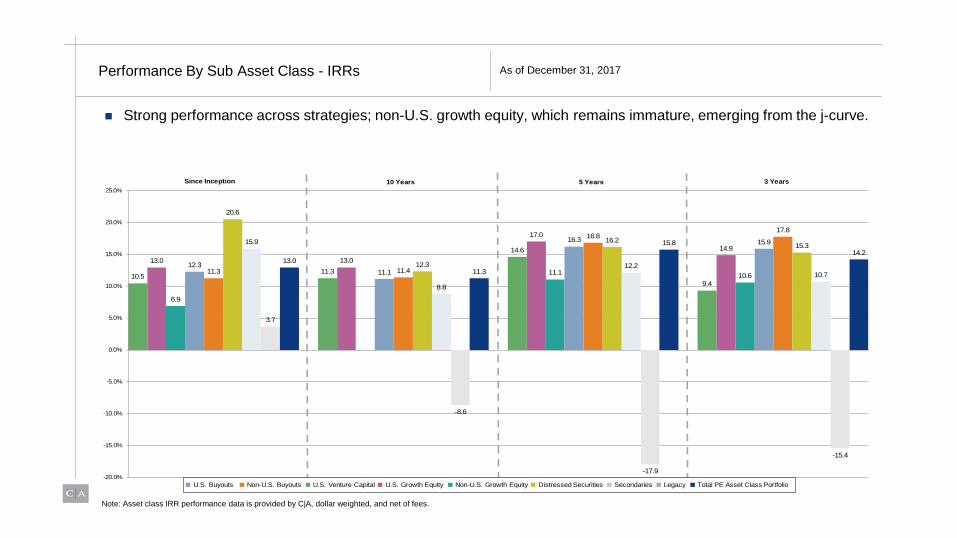
10.5
13.0
6.9
12.311.3
20.6
15.9
3.7
13.011.3
13.0
11.1 11.412.3
8.8
-8.6
11.3
14.6
17.0
11.1
16.3 16.8 16.2
12.2
-17.9
15.8
9.4
14.9
10.6
15.9
17.8
15.3
10.7
-15.4
14.2
-20.0%
-15.0%
-10.0%
-5.0%
0.0%
5.0%
10.0%
15.0%
20.0%
25.0%Since Inception 10 Years 5 Years 3 Years
■ U.S. Buyouts ■ Non-U.S. Buyouts ■ U.S. Venture Capital ■ U.S. Growth Equity ■ Non-U.S. Growth Equity ■ Distressed Securities ■ Secondaries ■ Legacy ■ Total PE Asset Class Portfolio
Strong performance across strategies; non-U.S. growth equity, which remains immature, emerging from the j-curve.
Performance By Sub Asset Class - IRRs
Note: Asset class IRR performance data is provided by C|A, dollar weighted, and net of fees.
As of December 31, 2017
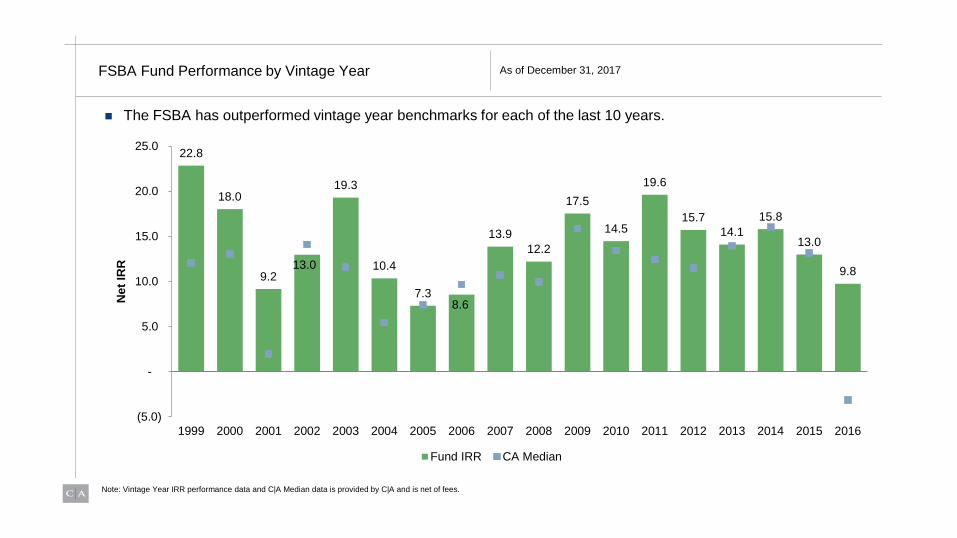
The FSBA has outperformed vintage year benchmarks for each of the last 10 years.
FSBA Fund Performance by Vintage Year
Note: Vintage Year IRR performance data and C|A Median data is provided by C|A and is net of fees.
As of December 31, 2017
22.8
18.0
9.213.0
19.3
10.4
7.38.6
13.912.2
17.5
14.5
19.6
15.714.1
15.8
13.0
9.8
(5.0)
-
5.0
10.0
15.0
20.0
25.0
1999 2000 2001 2002 2003 2004 2005 2006 2007 2008 2009 2010 2011 2012 2013 2014 2015 2016
Net
IRR
Fund IRR CA Median
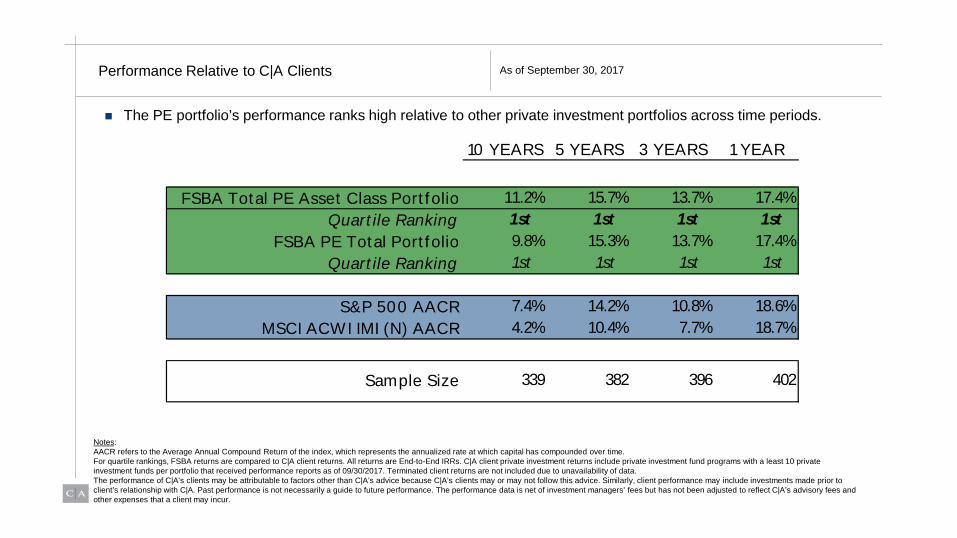
The PE portfolio’s performance ranks high relative to other private investment portfolios across time periods.
Performance Relative to C|A Clients
Notes: AACR refers to the Average Annual Compound Return of the index, which represents the annualized rate at which capital has compounded over time. For quartile rankings, FSBA returns are compared to C|A client returns. All returns are End-to-End IRRs. C|A client private investment returns include private investment fund programs with a least 10 private investment funds per portfolio that received performance reports as of 09/30/2017. Terminated client returns are not included due to unavailability of data.The performance of C|A’s clients may be attributable to factors other than C|A’s advice because C|A’s clients may or may not follow this advice. Similarly, client performance may include investments made prior to client’s relationship with C|A. Past performance is not necessarily a guide to future performance. The performance data is net of investment managers’ fees but has not been adjusted to reflect C|A’s advisory fees and other expenses that a client may incur.
10 YEARS 5 YEARS 3 YEARS 1 YEAR
FSBA Total PE Asset Class Port folio 11.2% 15.7% 13.7% 17.4%Quart ile Ranking 1st 1st 1st 1st
FSBA PE Total Port folio 9.8% 15.3% 13.7% 17.4%Quart ile Ranking 1st 1st 1st 1st
S&P 500 AACR 7.4% 14.2% 10.8% 18.6%MSCI ACWI IMI (N) AACR 4.2% 10.4% 7.7% 18.7%
339Sample Size 382 396 402
As of September 30, 2017

EXPOSURES AND PACING

The PE Portfolio’s NAV exposure stood at ~6.7% of FRS total assets, roughly in line with the 6% target allocation.
PE Portfolio Currently At Target
Source: FRS annual market values were provided by FSBA as of December 31, 2017.Note: This data is based on aggregating cash flows for paid-in capital and distributions as tracked by C|A. Unfunded capital amounts may not match C|A performance reports due to fees, recallable distributions, and secondary sale transactions. Based on preliminary December 31, 2017 data, adjusted for recent secondary sale. Includes subsequent commitments through March 31, 2018.
As of December 31, 2017
0%
2%
4%
6%
8%
10%
12%NAV
Target
NAV + Unfunded
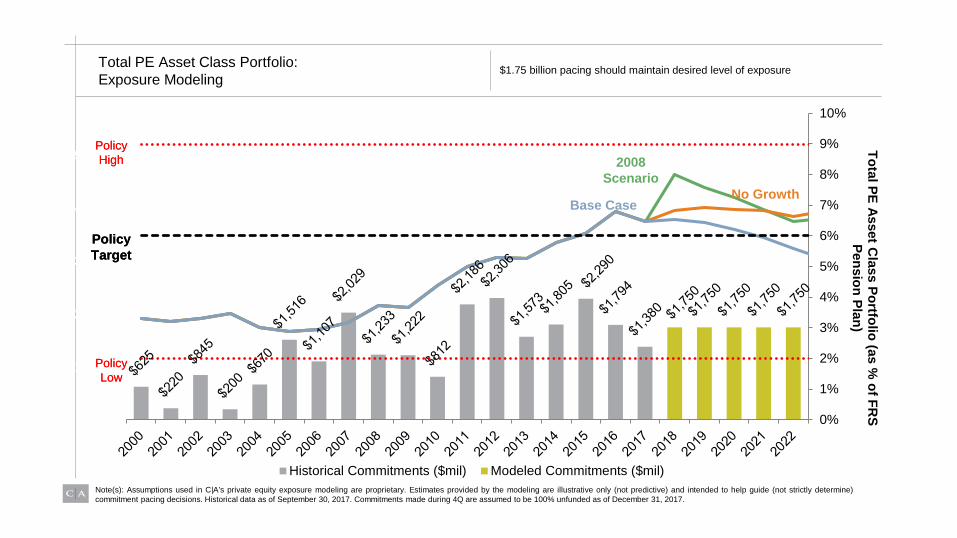
Total PE Asset Class Portfolio: Exposure Modeling
Note(s): Assumptions used in C|A’s private equity exposure modeling are proprietary. Estimates provided by the modeling are illustrative only (not predictive) and intended to help guide (not strictly determine)commitment pacing decisions. Historical data as of September 30, 2017. Commitments made during 4Q are assumed to be 100% unfunded as of December 31, 2017.
0%
1%
2%
3%
4%
5%
6%
7%
8%
9%
10%
$0.0
$1000.0
$2000.0
$3000.0
$4000.0
$5000.0
Total PE Asset Class Portfolio (as %
of FRS
Pension Plan)
Historical Commitments ($mil) Modeled Commitments ($mil)
Policy High
Policy Target
Policy Low
2008 Scenario
No GrowthBase Case
Policy High
Policy Target
Policy Low
$1.75 billion pacing should maintain desired level of exposure
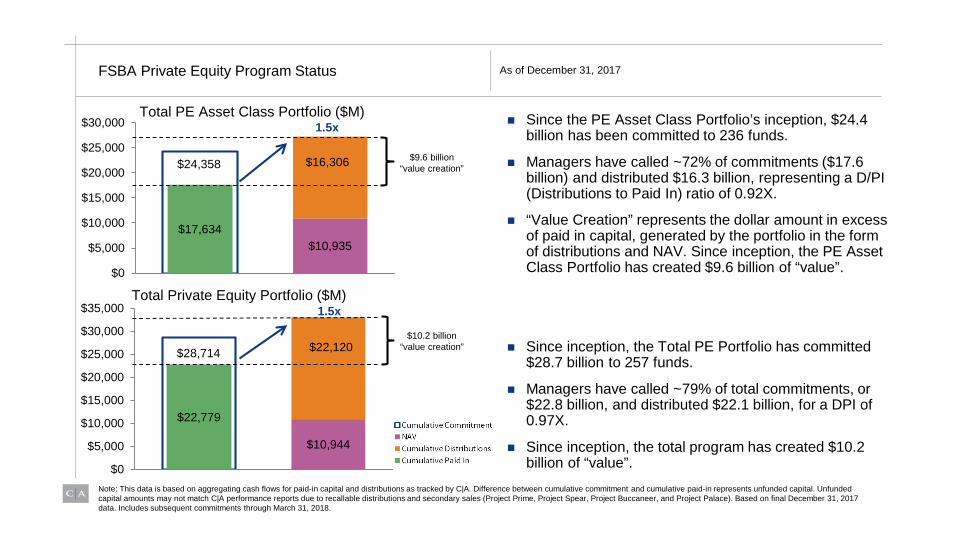
$28,714
$10,944
$22,120
$22,779
$0
$5,000
$10,000
$15,000
$20,000
$25,000
$30,000
$35,000Total Private Equity Portfolio ($M)
1.5x
FSBA Private Equity Program Status
Note: This data is based on aggregating cash flows for paid-in capital and distributions as tracked by C|A. Difference between cumulative commitment and cumulative paid-in represents unfunded capital. Unfunded capital amounts may not match C|A performance reports due to recallable distributions and secondary sales (Project Prime, Project Spear, Project Buccaneer, and Project Palace). Based on final December 31, 2017 data. Includes subsequent commitments through March 31, 2018.
$10.2 billion “value creation”
$9.6 billion “value creation”
As of December 31, 2017
$24,358
$10,935
$16,306
$17,634
$0
$5,000
$10,000
$15,000
$20,000
$25,000
$30,000Total PE Asset Class Portfolio ($M)
1.5x Since the PE Asset Class Portfolio’s inception, $24.4 billion has been committed to 236 funds.
Managers have called ~72% of commitments ($17.6billion) and distributed $16.3 billion, representing a D/PI (Distributions to Paid In) ratio of 0.92X.
“Value Creation” represents the dollar amount in excess of paid in capital, generated by the portfolio in the form of distributions and NAV. Since inception, the PE Asset Class Portfolio has created $9.6 billion of “value”.
Since inception, the Total PE Portfolio has committed $28.7 billion to 257 funds.
Managers have called ~79% of total commitments, or $22.8 billion, and distributed $22.1 billion, for a DPI of 0.97X.
Since inception, the total program has created $10.2 billion of “value”.
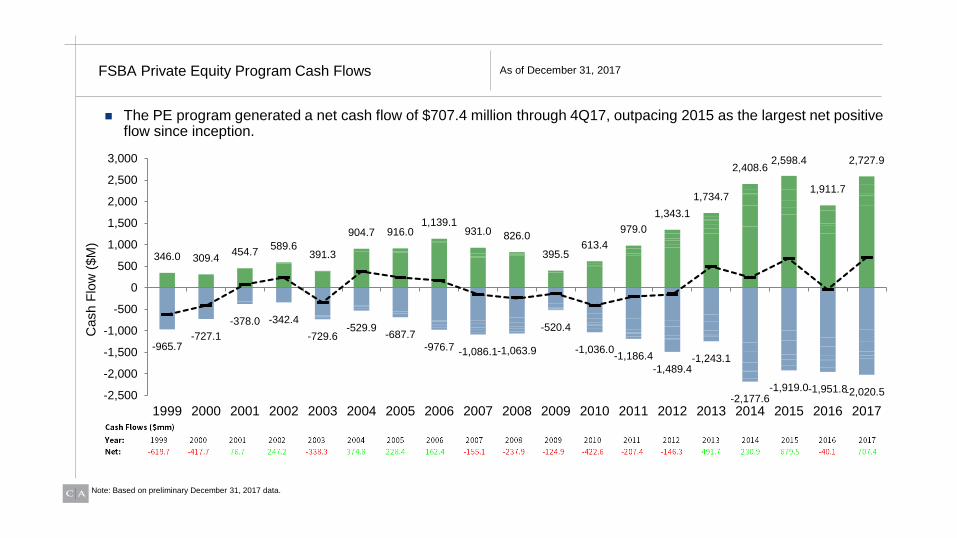
The PE program generated a net cash flow of $707.4 million through 4Q17, outpacing 2015 as the largest net positive flow since inception.
FSBA Private Equity Program Cash Flows
Note: Based on preliminary December 31, 2017 data.
As of December 31, 2017
-965.7-727.1
-378.0 -342.4-729.6
-529.9 -687.7-976.7 -1,086.1-1,063.9
-520.4
-1,036.0-1,186.4-1,489.4
-1,243.1
-2,177.6-1,919.0-1,951.8-2,020.5
346.0 309.4 454.7 589.6391.3
904.7 916.01,139.1
931.0 826.0
395.5613.4
979.01,343.1
1,734.7
2,408.6 2,598.4
1,911.7
2,727.9
-2,500
-2,000
-1,500
-1,000
-500
0
500
1,000
1,500
2,000
2,500
3,000
1999 2000 2001 2002 2003 2004 2005 2006 2007 2008 2009 2010 2011 2012 2013 2014 2015 2016 2017
Cas
h Fl
ow ($
M)
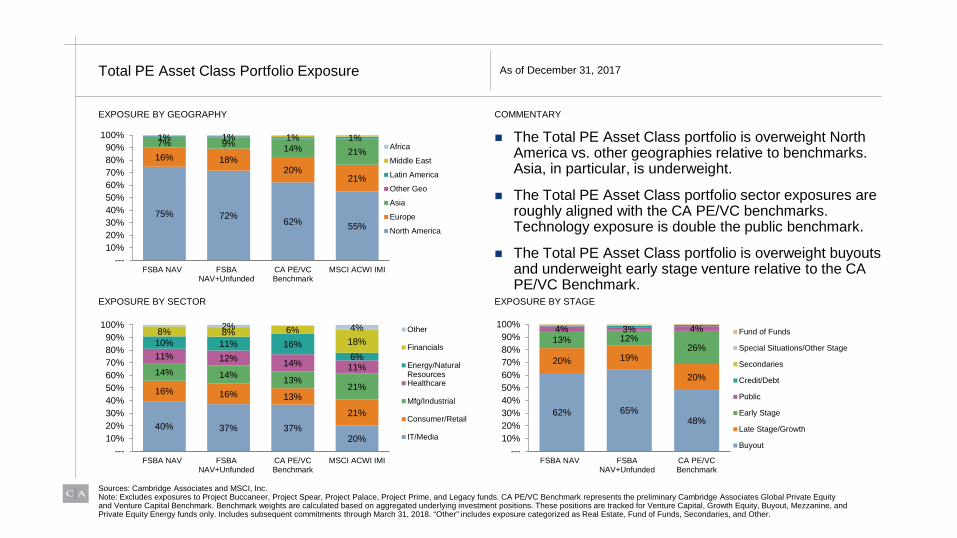
Total PE Asset Class Portfolio Exposure
EXPOSURE BY GEOGRAPHY
EXPOSURE BY SECTOR
COMMENTARY
EXPOSURE BY STAGE
Sources: Cambridge Associates and MSCI, Inc.Note: Excludes exposures to Project Buccaneer, Project Spear, Project Palace, Project Prime, and Legacy funds. CA PE/VC Benchmark represents the preliminary Cambridge Associates Global Private Equity and Venture Capital Benchmark. Benchmark weights are calculated based on aggregated underlying investment positions. These positions are tracked for Venture Capital, Growth Equity, Buyout, Mezzanine, and Private Equity Energy funds only. Includes subsequent commitments through March 31, 2018. “Other” includes exposure categorized as Real Estate, Fund of Funds, Secondaries, and Other.
As of December 31, 2017
75% 72% 62% 55%
16% 18%20%
21%
7% 9% 14% 21%1% 1% 1% 1%
---10%20%30%40%50%60%70%80%90%
100%
FSBA NAV FSBANAV+Unfunded
CA PE/VCBenchmark
MSCI ACWI IMI
Africa
Middle East
Latin America
Other Geo
Asia
Europe
North America
40% 37% 37%20%
16% 16% 13%
21%
14% 14% 13%21%
11% 12% 14% 11%
10% 11% 16%6%
8% 8% 6%18%
2% 4%
---10%20%30%40%50%60%70%80%90%
100%
FSBA NAV FSBANAV+Unfunded
CA PE/VCBenchmark
MSCI ACWI IMI
Other
Financials
Energy/NaturalResourcesHealthcare
Mfg/Industrial
Consumer/Retail
IT/Media
62% 65%48%
20% 19%
20%
13% 12%26%
4% 3% 4%
---10%20%30%40%50%60%70%80%90%
100%
FSBA NAV FSBANAV+Unfunded
CA PE/VCBenchmark
Fund of Funds
Special Situations/Other Stage
Secondaries
Credit/Debt
Public
Early Stage
Late Stage/Growth
Buyout
The Total PE Asset Class portfolio is overweight North America vs. other geographies relative to benchmarks. Asia, in particular, is underweight.
The Total PE Asset Class portfolio sector exposures are roughly aligned with the CA PE/VC benchmarks. Technology exposure is double the public benchmark.
The Total PE Asset Class portfolio is overweight buyouts and underweight early stage venture relative to the CA PE/VC Benchmark.
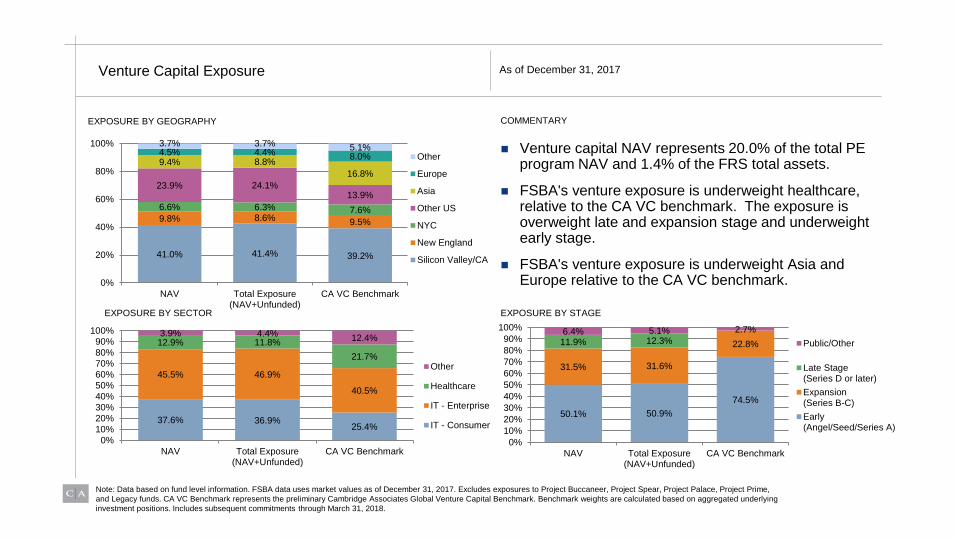
EXPOSURE BY GEOGRAPHY COMMENTARY
EXPOSURE BY SECTOR EXPOSURE BY STAGE
Venture capital NAV represents 20.0% of the total PE program NAV and 1.4% of the FRS total assets.
FSBA's venture exposure is underweight healthcare, relative to the CA VC benchmark. The exposure is overweight late and expansion stage and underweight early stage.
FSBA's venture exposure is underweight Asia and Europe relative to the CA VC benchmark.
Venture Capital Exposure
Note: Data based on fund level information. FSBA data uses market values as of December 31, 2017. Excludes exposures to Project Buccaneer, Project Spear, Project Palace, Project Prime, and Legacy funds. CA VC Benchmark represents the preliminary Cambridge Associates Global Venture Capital Benchmark. Benchmark weights are calculated based on aggregated underlying investment positions. Includes subsequent commitments through March 31, 2018.
As of December 31, 2017
41.0% 41.4% 39.2%
9.8% 8.6% 9.5%6.6% 6.3% 7.6%
23.9% 24.1%13.9%
9.4% 8.8%16.8%
4.5% 4.4% 8.0%3.7% 3.7% 5.1%
0%
20%
40%
60%
80%
100%
NAV Total Exposure(NAV+Unfunded)
CA VC Benchmark
Other
Europe
Asia
Other US
NYC
New England
Silicon Valley/CA
37.6% 36.9%25.4%
45.5% 46.9%
40.5%
12.9% 11.8%21.7%
3.9% 4.4% 12.4%
0%10%20%30%40%50%60%70%80%90%
100%
NAV Total Exposure(NAV+Unfunded)
CA VC Benchmark
Other
Healthcare
IT - Enterprise
IT - Consumer50.1% 50.9%
74.5%
31.5% 31.6%
22.8%11.9% 12.3%6.4% 5.1% 2.7%
0%10%20%30%40%50%60%70%80%90%
100%
NAV Total Exposure(NAV+Unfunded)
CA VC Benchmark
Public/Other
Late Stage(Series D or later)Expansion(Series B-C)Early(Angel/Seed/Series A)

Increasingly Diversified Across Sub-Asset Classes
FSBA’s PI Asset Allocation by NAV Over TimeAs at December 31, 2017. Calculated in USD.
Note: Excludes exposures to Project Buccaneer, Project Spear, Project Palace, Project Prime and Legacy funds. Includes subsequent commitments through March 31, 2018.
As NAV has grown over the past five years, portfolio has become increasingly diversified by geography and asset class
$.0
$2.0
$4.0
$6.0
$8.0
$10.0
$12.0
0%
10%
20%
30%
40%
50%
60%
70%
80%
90%
100%
1999 2000 2001 2002 2003 2004 2005 2006 2007 2008 2009 2010 2011 2012 2013 2014 2015 2016 2017
NAV
($B
)
NAV
(%)
Distressed U.S. Growth Equity Secondaries U.S. Venture CapitalNon-U.S. Buyouts Non-U.S. Growth Equity U.S. Buyouts Total NAV
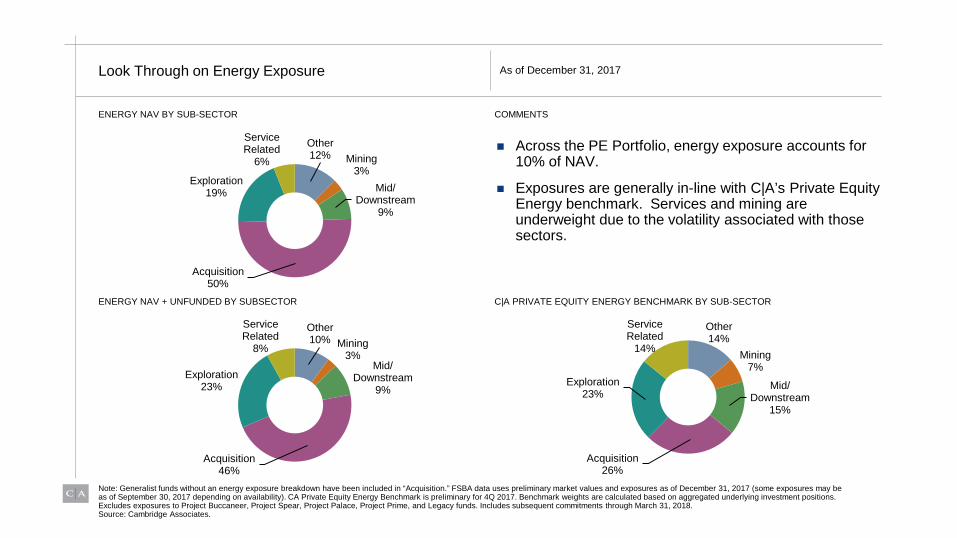
Look Through on Energy Exposure
ENERGY NAV BY SUB-SECTOR
ENERGY NAV + UNFUNDED BY SUBSECTOR
Across the PE Portfolio, energy exposure accounts for 10% of NAV.
Exposures are generally in-line with C|A’s Private Equity Energy benchmark. Services and mining are underweight due to the volatility associated with those sectors.
COMMENTS
C|A PRIVATE EQUITY ENERGY BENCHMARK BY SUB-SECTOR
As of December 31, 2017
Note: Generalist funds without an energy exposure breakdown have been included in “Acquisition.” FSBA data uses preliminary market values and exposures as of December 31, 2017 (some exposures may be as of September 30, 2017 depending on availability). CA Private Equity Energy Benchmark is preliminary for 4Q 2017. Benchmark weights are calculated based on aggregated underlying investment positions.Excludes exposures to Project Buccaneer, Project Spear, Project Palace, Project Prime, and Legacy funds. Includes subsequent commitments through March 31, 2018.Source: Cambridge Associates.
Other12% Mining
3%Mid/
Downstream9%
Acquisition50%
Exploration19%
Service Related
6%
Other10% Mining
3%Mid/
Downstream9%
Acquisition46%
Exploration23%
Service Related
8%
Other14%
Mining7%
Mid/ Downstream
15%
Acquisition26%
Exploration23%
Service Related
14%

CURRENT MARKET ENVIRONMENT

U.S. Private Equity: Periodic Rates of Return
Sources: Cambridge Associates LLC, Frank Russell Company, Standard & Poor's and Thomson Reuters Datastream.Notes: Pooled private investment periodic returns are net of fees, expenses and carried interest. Multi-Year Annualized Returns are generated for time periods ending September 30, 2017.Copyright © 2018 by Cambridge Associates LLC. All rights reserved.
Long term performance of private equity continues to be strong versus the public markets
21.6
14.2
19.9
17.1
13.6
9.7
13.6
10.210.0
7.4
14.2
10.811.4
7.8
13.812.2
0.0
5.0
10.0
15.0
20.0
25.0
15-Year 10-Year 5-Year 3-Year
Perio
dic
Rat
es o
f Ret
urn
(%)
CA U.S. Private Equity (Top Two Quartiles) CA U.S. Private Equity Index ® S&P 500 Russell 2000 ®
U.S. Private Equity: Periodic Rates of ReturnAs of September 30, 2017

U.S. Venture Capital: Periodic Rates of Return
Sources: Cambridge Associates LLC Private Investments Database, Frank Russell Company, Standard & Poor’s and Thomson Reuters Datastream.Notes: Pooled private investment periodic returns are net of fees, expenses, and carried interest. Multi-year annualized returns are generated for time periods ending September 30, 2017.Copyright © 2018 by Cambridge Associates LLC. All rights reserved.
Above median funds meaningfully ahead of public markets over all time periods
14.8 14.7
22.6
16.7
8.8 9.1
14.8
10.810.0
7.4
14.2
10.811.4
7.8
13.812.2
0.0
5.0
10.0
15.0
20.0
25.0
15-Year 10-Year 5-Year 3-Year
Perio
dic
Rat
es o
f Ret
urn
(%)
CA U.S. Venture Capital (Top Two Quartiles) CA U.S. Venture Capital Index® S&P 500 Russell 2000®
U.S. Venture Capital: Periodic Rates of ReturnAs of September 30, 2017
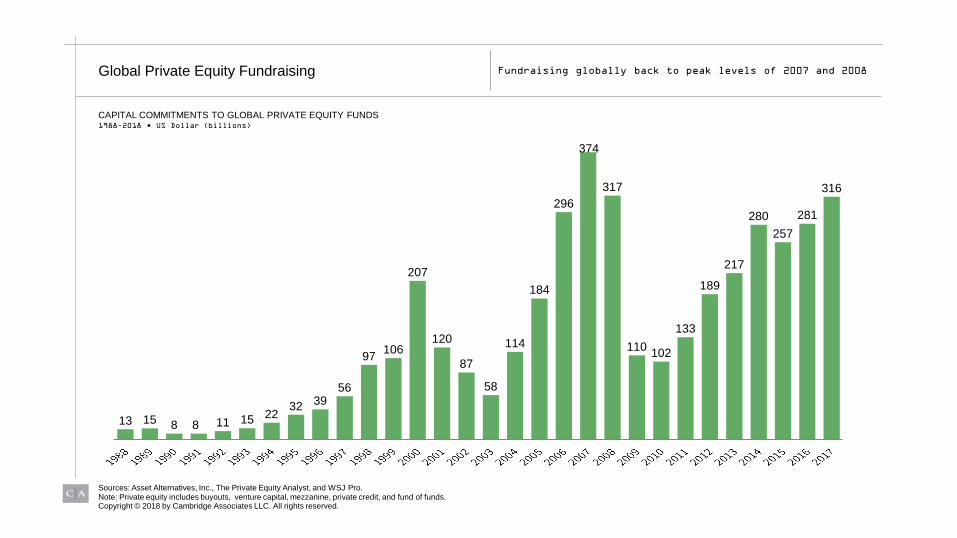
Global Private Equity Fundraising Fundraising globally back to peak levels of 2007 and 2008
Sources: Asset Alternatives, Inc., The Private Equity Analyst, and WSJ Pro.Note: Private equity includes buyouts, venture capital, mezzanine, private credit, and fund of funds.
13 15 8 8 11 15 22 32 3956
97 106
207
120
87
58
114
184
296
CAPITAL COMMITMENTS TO GLOBAL PRIVATE EQUITY FUNDS1988–2018 • US Dollar (billions)
374
317
110 102
133
189
217
280257
281
316
Copyright © 2018 by Cambridge Associates LLC. All rights reserved.
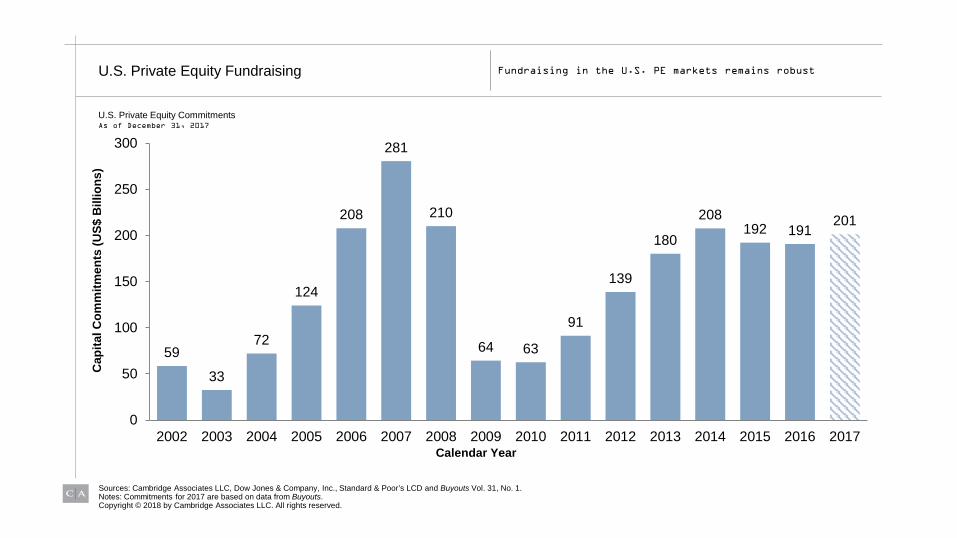
U.S. Private Equity Fundraising Fundraising in the U.S. PE markets remains robust
Sources: Cambridge Associates LLC, Dow Jones & Company, Inc., Standard & Poor’s LCD and Buyouts Vol. 31, No. 1.Notes: Commitments for 2017 are based on data from Buyouts.Copyright © 2018 by Cambridge Associates LLC. All rights reserved.
59
33
72
124
208
281
210
64 63
91
139
180
208192 191
201
0
50
100
150
200
250
300
2002 2003 2004 2005 2006 2007 2008 2009 2010 2011 2012 2013 2014 2015 2016 2017
Cap
ital C
omm
itmen
ts (U
S$ B
illio
ns)
Calendar Year
U.S. Private Equity CommitmentsAs of December 31, 2017

$201 $201
$150 $150
$60$100
2017 C|A Co-Inv 2017 McKinsey0
50
100
150
200
250
Fund
rais
ing
(US$
Bill
ions
)
U.S. PE Commitments U.S. PE Fund Called Capital* Co-Investment Activity
Co-Investments Easily One-Quarter of All PI Activity, Not Going Away
AS OF DECEMBER 31, 2017
Sources: Cambridge Associates LLC, Dow Jones & Company, Inc., and Buyouts Vol. 31, No. 1.Notes: USPE Commitments for 2017 are based on data from Buyouts and co-investment activity is based on Cambridge Associates co-investment team deal flow.* Called capital for 2017 is annualized and based on the $83 billion that has been called as of September 30, 2017.Copyright © 2018 by Cambridge Associates LLC. All rights reserved.
40% of total investment
activity
U.S. PRIVATE EQUITY & CO-INVESTMENT VOLUMES
29% of total investment
activity
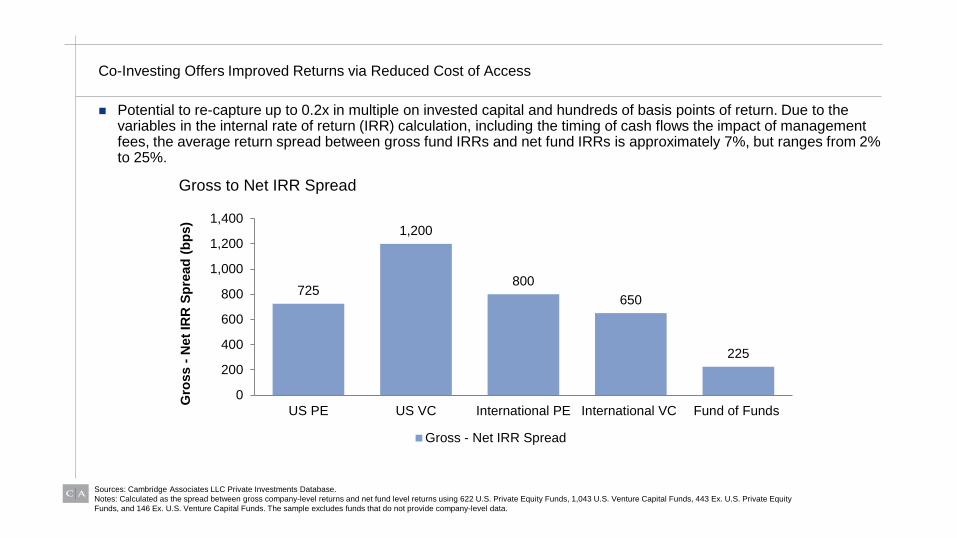
Co-Investing Offers Improved Returns via Reduced Cost of Access
Potential to re-capture up to 0.2x in multiple on invested capital and hundreds of basis points of return. Due to the variables in the internal rate of return (IRR) calculation, including the timing of cash flows the impact of management fees, the average return spread between gross fund IRRs and net fund IRRs is approximately 7%, but ranges from 2% to 25%.
725
1,200
800650
225
0
200
400
600
800
1,000
1,200
1,400
US PE US VC International PE International VC Fund of Funds
Gro
ss -
Net
IRR
Spr
ead
(bps
) Gross to Net IRR Spread
Gross - Net IRR Spread
Sources: Cambridge Associates LLC Private Investments Database. Notes: Calculated as the spread between gross company-level returns and net fund level returns using 622 U.S. Private Equity Funds, 1,043 U.S. Venture Capital Funds, 443 Ex. U.S. Private Equity Funds, and 146 Ex. U.S. Venture Capital Funds. The sample excludes funds that do not provide company-level data.

Private Equity “On the 7s” — The Fading Dominance of the Consumer and the Rise of Tech
Source: Cambridge Associates LLCAs of September 30, 2017Capital invested by US Buyouts and Growth Equity funds in each year; 2017 represents only the first nine months. The totals do not add to 100% because “other” sector investments have been excluded from the analysis. “Other “includes energy, limited partnership interests, portfolio, real estate, and utilities.
84%
41%29% 24%
2%
5%
7%5%
14%
16%21%
6%
16%20%
16%
6%
20%17% 28%
0%
25%
50%
75%
100%
1987 1997 2007 2017
U.S. Private Equity% of Invested Capital by Sector, 1987, 1997, 2007, 2017
Consumer Financials Health care Industrials IT and Telecom
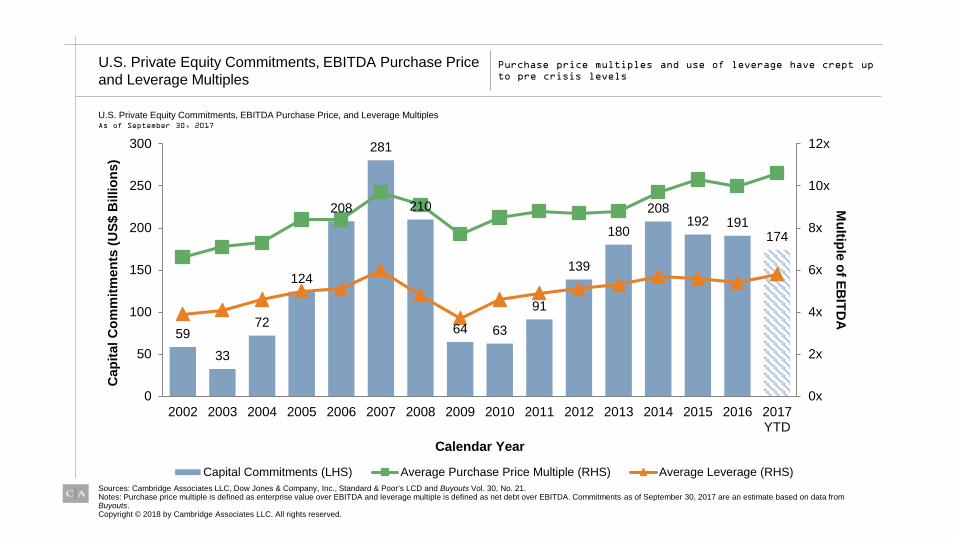
U.S. Private Equity Commitments, EBITDA Purchase Price and Leverage Multiples
Sources: Cambridge Associates LLC, Dow Jones & Company, Inc., Standard & Poor’s LCD and Buyouts Vol. 30, No. 21.Notes: Purchase price multiple is defined as enterprise value over EBITDA and leverage multiple is defined as net debt over EBITDA. Commitments as of September 30, 2017 are an estimate based on data from Buyouts.Copyright © 2018 by Cambridge Associates LLC. All rights reserved.
Purchase price multiples and use of leverage have crept up to pre crisis levels
5933
72
124
208
281
210
64 63
91
139
180
208192 191
174
0x
2x
4x
6x
8x
10x
12x
0
50
100
150
200
250
300
2002 2003 2004 2005 2006 2007 2008 2009 2010 2011 2012 2013 2014 2015 2016 2017YTD
Multiple of EB
ITDA
Cap
ital C
omm
itmen
ts (U
S$ B
illio
ns)
Calendar Year
Capital Commitments (LHS) Average Purchase Price Multiple (RHS) Average Leverage (RHS)
U.S. Private Equity Commitments, EBITDA Purchase Price, and Leverage MultiplesAs of September 30, 2017

Pooled IRRs Net to Limited Partners of Various Private Investment Categories
Source: Cambridge Associates LLC Private Investments DatabaseNote: Data as of September 30, 2017. Internal rates of return are since inception returns net of fees, expenses, and carried interest. Energy includes global private equity energy and energy upstream and royalties. Private equity includes buyouts, growth equity, private equity energy, and subordinated capital funds. Years refer to asset class vintage years and vintage year funds formed since 2014 are too young to have produced meaningful returns.Copyright © 2018 by Cambridge Associates LLC. All rights reserved.
Portfolio diversification has helped investors over the long term
1999 2000 2001 2002 2003 2004 2005 2006 2007 2008 2009 2010 2011 2012 2013 2014
Energy32.3%
Europe PE&VC23.6%
Energy39.5%
Energy36.3%
Asia PE&VC24.2%
<250m US Buyout18.0%
Asia PE&VC12.1%
<250m US Buyout18.7%
<250m US Buyout16.6%
US Buyout15.5%
Real Estate23.1%
<250m US Buyout32.9%
US Venture Capital19.9%
<250m US Buyout29.7%
<250m US Buyout24.5%
Secondaries26.7%
>750m US Buyout17.6%
Energy23.0%
Real Estate28.0%
Secondaries28.1%
Energy22.3%
Energy14.0%
<250m US Buyout
9.1%Asia PE&VC
10.5%US Venture
Capital15.7%
>750m US Buyout15.3%
>750m US Buyout21.5%
US Venture Capital28.1%
Asia PE&VC19.0%
>750m US Buyout19.3%
Asia PE&VC21.3%
Europe PE&VC20.7%
US Buyout16.0%
Real Estate18.3%
Europe PE&VC26.9%
Asia PE&VC25.3%
Europe PE&VC19.7%
Europe PE&VC13.0%
US Private Equity8.8%
US Buyout9.3%
>750m US Buyout13.1%
Secondaries14.4%
US Buyout21.3%
US Buyout21.5%
Secondaries18.1%
US Buyout19.0%
US Venture Capital18.9%
Asia PE&VC17.6%
US Private Equity15.2%
US Buyout17.0%
>750m US Buyout24.9%
Europe PE&VC21.6%
Secondaries17.5%
Secondaries10.9%
US Buyout8.1%
>750m US Buyout
9.2%US Buyout
13.0%Asia PE&VC
13.6%US Private
Equity19.4%
>750m US Buyout20.0%
>750m US Buyout17.2%
US Venture Capital17.5%
Secondaries18.6%
<250m US Buyout17.2%
Europe PE&VC15.0%
>750m US Buyout16.5%
Distressed23.9%
Distressed20.7%
US Private Equity15.6%
>750m US Buyout10.7%
>750m US Buyout
7.7%
US Venture Capital9.0%
US Private Equity11.9%
Distressed13.1%
Secondaries15.8%
Asia PE&VC18.3%
US Buyout17.0%
US Private Equity15.6%
Real Estate14.2%
Energy16.7%
<250m US Buyout11.8%
Asia PE&VC15.6%
US Buyout22.9%
<250m US Buyout20.2%
>750m US Buyout14.8%
US Buyout10.7%
Fund of Funds7.4%
Distressed8.8%
Distressed11.5%
US Venture Capital12.4%
US Venture Capital15.2%
Secondaries16.5%
Real Estate16.0%
Secondaries14.6%
Europe PE&VC13.7%
US Private Equity15.7%
Real Estate11.7%
Distressed15.3%
US Private Equity22.1%
>750m US Buyout19.5%
US Buyout14.7%
US Private Equity10.4%
US Venture Capital7.2%
US Private Equity8.4%
Fund of Funds11.2%
US Private Equity11.2%
Europe PE&VC15.0%
US Private Equity14.1%
US Private Equity15.4%
Real Estate14.4%
US Buyout12.3%
US Buyout13.8%
Secondaries11.4%
US Private Equity15.2%
<250m US Buyout20.1%
US Private Equity18.9%
Fund of Funds10.5%
US Venture Capital8.1%
Distressed6.4%
Fund of Funds8.4%
Asia PE&VC10.5%
Fund of Funds10.6%
Fund of Funds12.7%
Europe PE&VC12.5%
Europe PE&VC15.3%
Asia PE&VC13.9%
>750m US Buyout11.3%
>750m US Buyout13.7%
Distressed8.8%
Secondaries14.9%
Asia PE&VC18.8%
US Buyout17.7%
US Venture Capital9.2%
Asia PE&VC7.0%
Secondaries6.2%
Secondaries7.2%
Secondaries9.7%
Real Estate10.1%
Asia PE&VC11.5%
Real Estate12.5%
<250m US Buyout12.9%
Europe PE&VC12.5%
Distressed10.0%
Real Estate13.2%
Fund of Funds6.1%
<250m US Buyout13.0%
Secondaries16.2%
Real Estate11.1%
Real Estate8.9%
Fund of Funds6.4%
Energy5.3%
Europe PE&VC7.2%
Europe PE&VC9.7%
Europe PE&VC9.7%
Distressed10.8%
Fund of Funds12.4%
Fund of Funds12.3%
Fund of Funds12.0%
US Private Equity9.7%
US Venture Capital13.0%
Asia PE&VC5.4%
Fund of Funds6.6%
Fund of Funds10.2%
Fund of Funds9.5%
Distressed8.6%
Distressed5.0%
Europe PE&VC3.8%
Energy2.6%
Real Estate7.0%
<250m US Buyout
9.5%
<250m US Buyout
9.1%Distressed
7.9%Distressed
10.9%Distressed
12.0%Fund of Funds
8.6%Distressed
11.2%
US Venture Capital-0.9%
US Venture Capital0.7%
US Venture Capital2.7%
US Venture Capital-0.4%
<250m US Buyout
7.2%Real Estate
1.0%Real Estate
-0.3%Real Estate
-2.4%Energy
6.9%Energy
2.8%Energy
1.9%Energy-4.0%
Energy5.8%
Energy5.0%
Energy5.0%
Fund of Funds10.1%
Spread Between Highest and Lowest Values Within a Given Time Period33.2% 22.9% 36.8% 36.7% 17.0% 17.0% 12.4% 21.1% 9.7% 12.7% 21.2% 36.9% 14.1% 24.7% 19.5% 16.6%

FRS INVESTMENT PLANand
MyFRS FINANCIAL GUIDANCE PROGRAM

FRS INVESTMENT PLAN REVIEW
Office of Defined Contribution Programs
Daniel Beard, Chief of Defined Contribution ProgramsWalter Kelleher, Director of Educational Services
Investment Advisory Council MeetingJune 2018

FLORIDA RETIREMENT SYSTEM (FRS)PENSION PLAN AND INVESTMENT PLAN
• The State of Florida offers its public employees the option of participating in one of two retirement plans.
Traditional Defined Benefit Plan• Funded by mandatory employer and
employee contributions• Has been in existence since the early 1970’s• Assets: $160.3 B (as of 3/31/18)
401(a) Defined Contribution Plan • Funded by mandatory employer and
employee contributions• Has been in existence since July 2002 • Assets: $10.7 B (as of 3/31/18)

PENSION PLAN AND INVESTMENT PLAN
• New employees, at the time of hire, make an initial choice to enroll in one of the two Plans – the Pension Plan or Investment Plan.
• The Division of Retirement within the Department of Management Services is responsible for the day-to-day administration of the Pension Plan.
• The State Board of Administration (SBA) is responsible for the day-to-day administration of the Investment Plan.– All major components – recordkeeping, custodian services, benefit
payments are outsourced as mandated by Florida Statutes.

GOVERNANCE
• Section 121.4501 – Florida Legislature passed legislation in 2000 mandating the establishment of a defined contribution plan under the FRS. It also included provisions for an educational component for ALL FRS employees. – Directed that the State Board of Administration Trustees (Trustees) would be the
responsible governing entity.
• Executive Director & CIO (ED & CIO) – Delegated authority by Trustees to oversee the implementation and ongoing oversight
of the Investment Plan.
• Deputy Executive Director (DED) – Provides guidance and input on Investment Plan activities.

GOVERNANCE
• Chief of Defined Contribution Programs – Delegated authority by ED & CIO to oversee the administrative duties and
responsibilities for the contract management of all services providers for the Investment Plan and the Financial Guidance Program.
• Investment Advisory Council (IAC)– Sections 121.4501(12) and (14) – states role of the IAC to the Investment Plan:
• Assist the SBA with administering the Investment Plan.• May provide comments on recommendations on providers and investment
products. • Will review any proposed changes to the Investment Policy Statement and present
the result of the review to the Trustees.
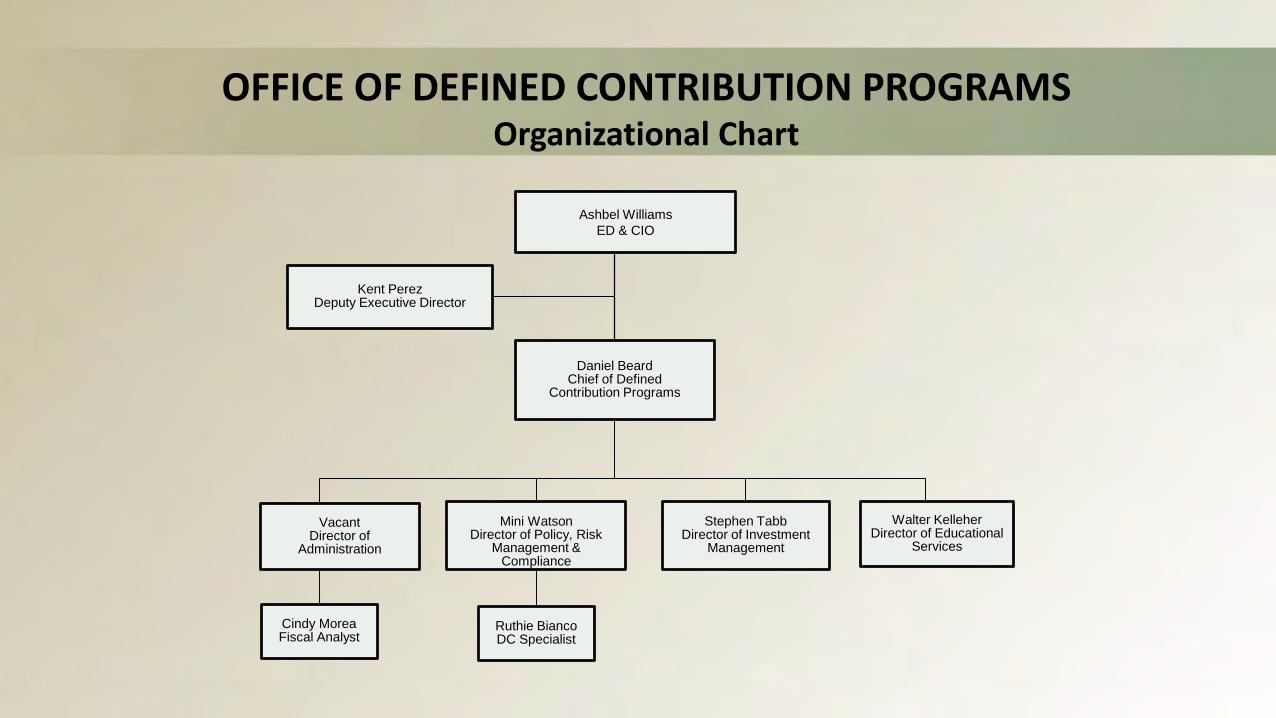
OFFICE OF DEFINED CONTRIBUTION PROGRAMSOrganizational Chart
Ashbel WilliamsED & CIO
Daniel BeardChief of Defined
Contribution Programs
Kent PerezDeputy Executive Director
VacantDirector of
Administration
Stephen TabbDirector of Investment
Management
Walter KelleherDirector of Educational
Services
Mini WatsonDirector of Policy, Risk
Management & Compliance
Cindy MoreaFiscal Analyst
Ruthie BiancoDC Specialist

FLORIDA RETIREMENT SYSTEM(as of March 31, 2018)
Plan Members RetireesInvestment Plan – 1 year vesting(Defined Contribution)
189,208 124,549
Pension Plan – 8 year vesting(Defined Benefit) 515,310 432,060
Participating Employers• State - 57• County Agencies – 396• School Boards – 67• Community Colleges – 28• Cities – 173• Independent Hospitals – 2• Special Districts – 264• Other - 12
999
OVERVIEW OF THE INVESTMENT PLAN ADMINISTRATION
Daniel Beard Chief of Defined Contributions Programs
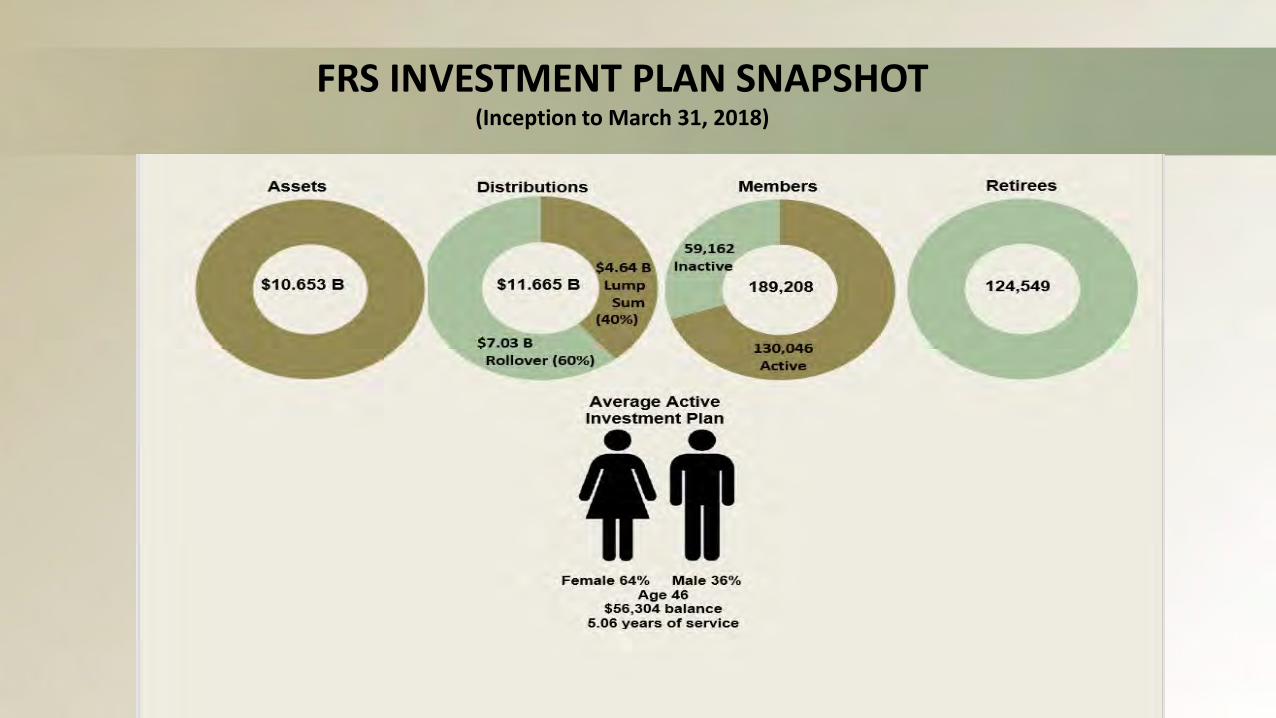
FRS INVESTMENT PLAN SNAPSHOT (Inception to March 31, 2018)
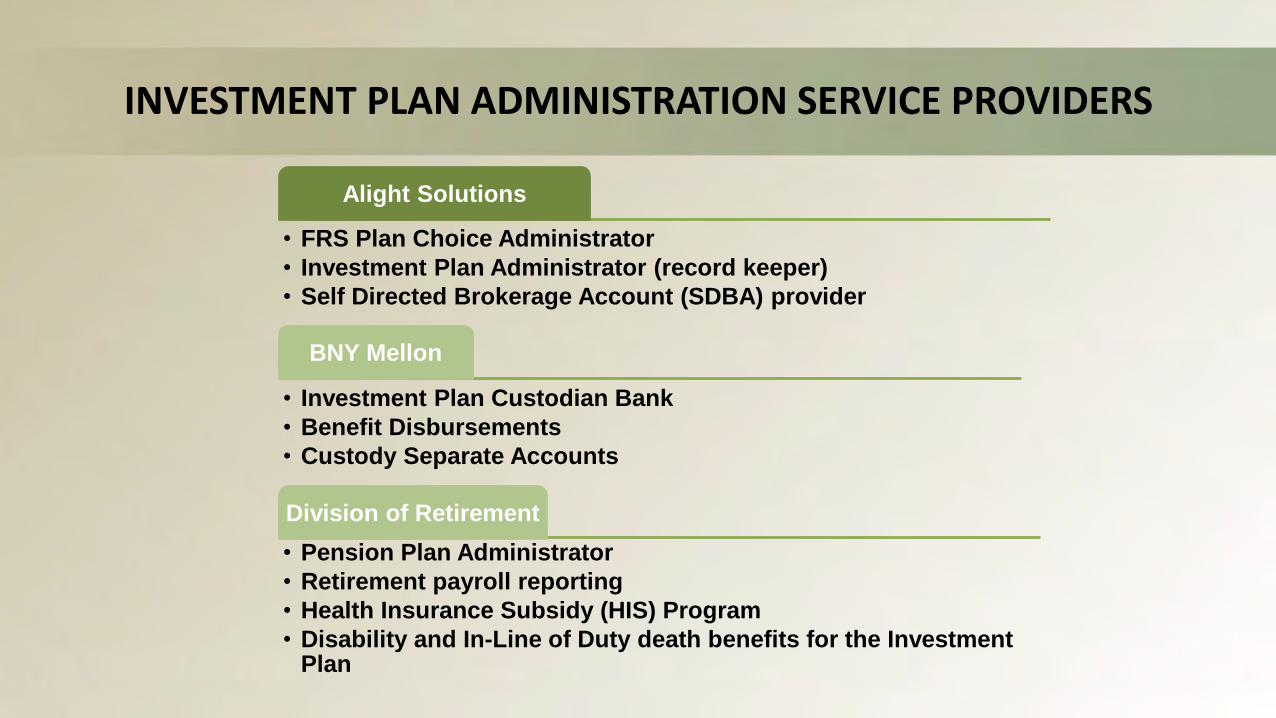
INVESTMENT PLAN ADMINISTRATION SERVICE PROVIDERS
Alight Solutions
• FRS Plan Choice Administrator• Investment Plan Administrator (record keeper)• Self Directed Brokerage Account (SDBA) provider
BNY Mellon
• Investment Plan Custodian Bank• Benefit Disbursements• Custody Separate Accounts
Division of Retirement• Pension Plan Administrator• Retirement payroll reporting• Health Insurance Subsidy (HIS) Program• Disability and In-Line of Duty death benefits for the Investment
Plan
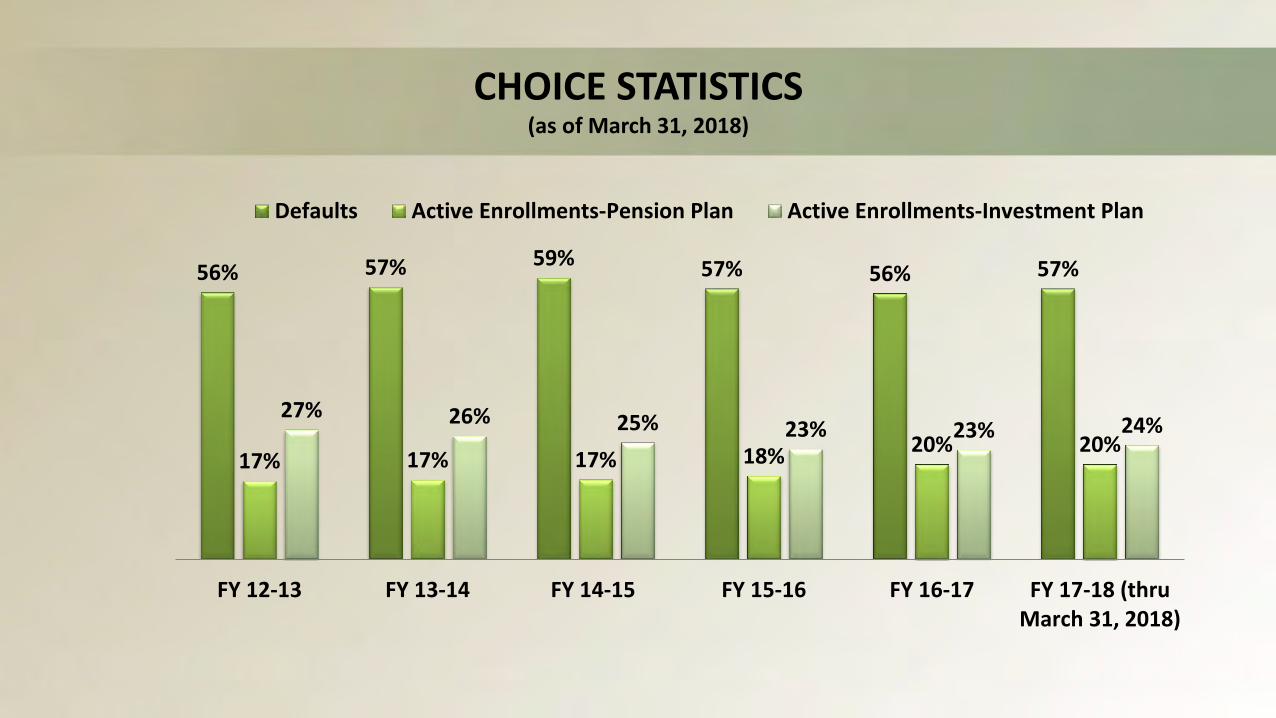
CHOICE STATISTICS(as of March 31, 2018)
56% 57% 59% 57% 56% 57%
17% 17% 17% 18% 20% 20%27% 26% 25% 23% 23% 24%
FY 12-13 FY 13-14 FY 14-15 FY 15-16 FY 16-17 FY 17-18 (thruMarch 31, 2018)
Defaults Active Enrollments-Pension Plan Active Enrollments-Investment Plan
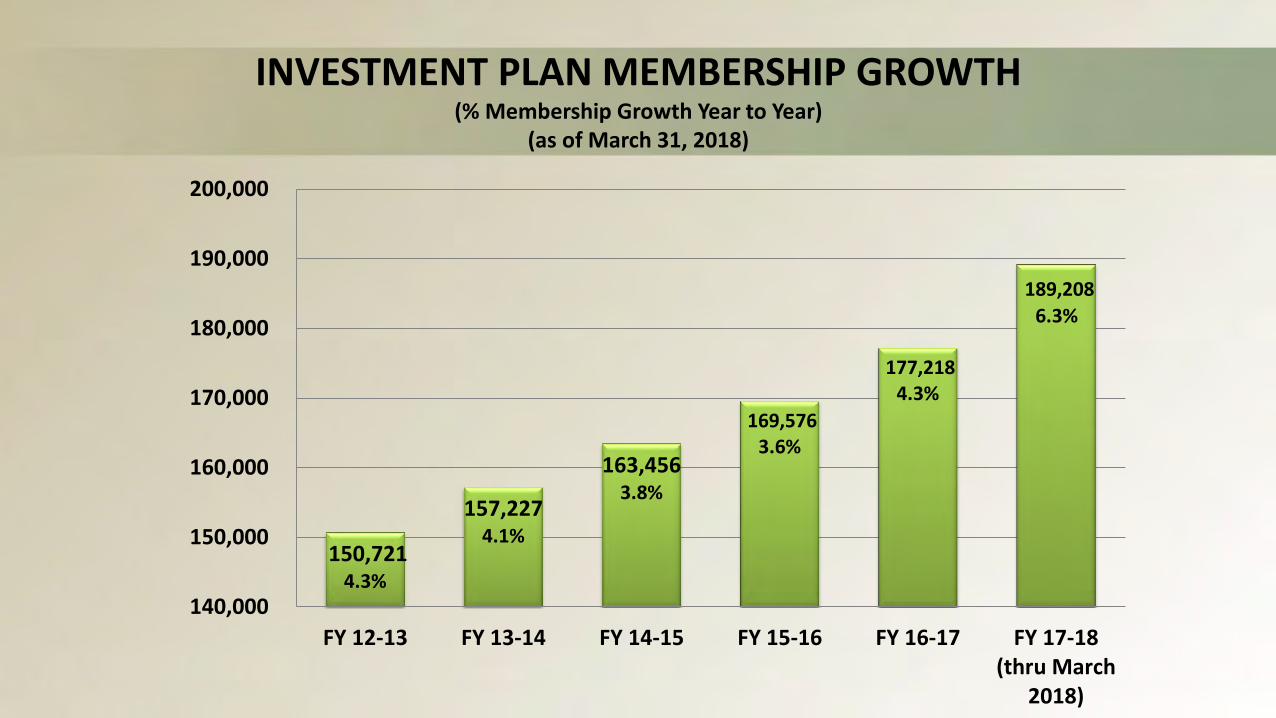
INVESTMENT PLAN MEMBERSHIP GROWTH(% Membership Growth Year to Year)
(as of March 31, 2018)
150,7214.3%
157,2274.1%
163,4563.8%
169,5763.6%
177,2184.3%
189,2086.3%
140,000
150,000
160,000
170,000
180,000
190,000
200,000
FY 12-13 FY 13-14 FY 14-15 FY 15-16 FY 16-17 FY 17-18(thru March
2018)

ADMINISTRATION STATISTICS (July 2017 through March 2018)
• Processed 1,117,907 member contributions postings totaling $318 M
• Mailed/e-mailed average of 183,572 quarterly statements
• Mailed 1,132,185 personalized communications• Received 71,770 telephone calls
Alight Solutions
• Mailed 10,341 distribution checks• Directed deposited 33,168 distribution
payments• Assets under custody- $10.050 B
BNY Mellon

Requests for Intervention
• Total Complaints Fiscal Year to March 31, 2018: 316
• Total Complaints Inception to Date: 4,224
• Top 6 Reasons for Filing Complaint:– Election Rescinds– Distributions– Criminal Forfeitures– Terminated Employment Prior to Election Receipt– Election Not Received– Requesting 3rd Election

OVERVIEW OF THE FINANCIAL GUIDANCE PROGRAM
Walter KelleherDirector of Educational Services
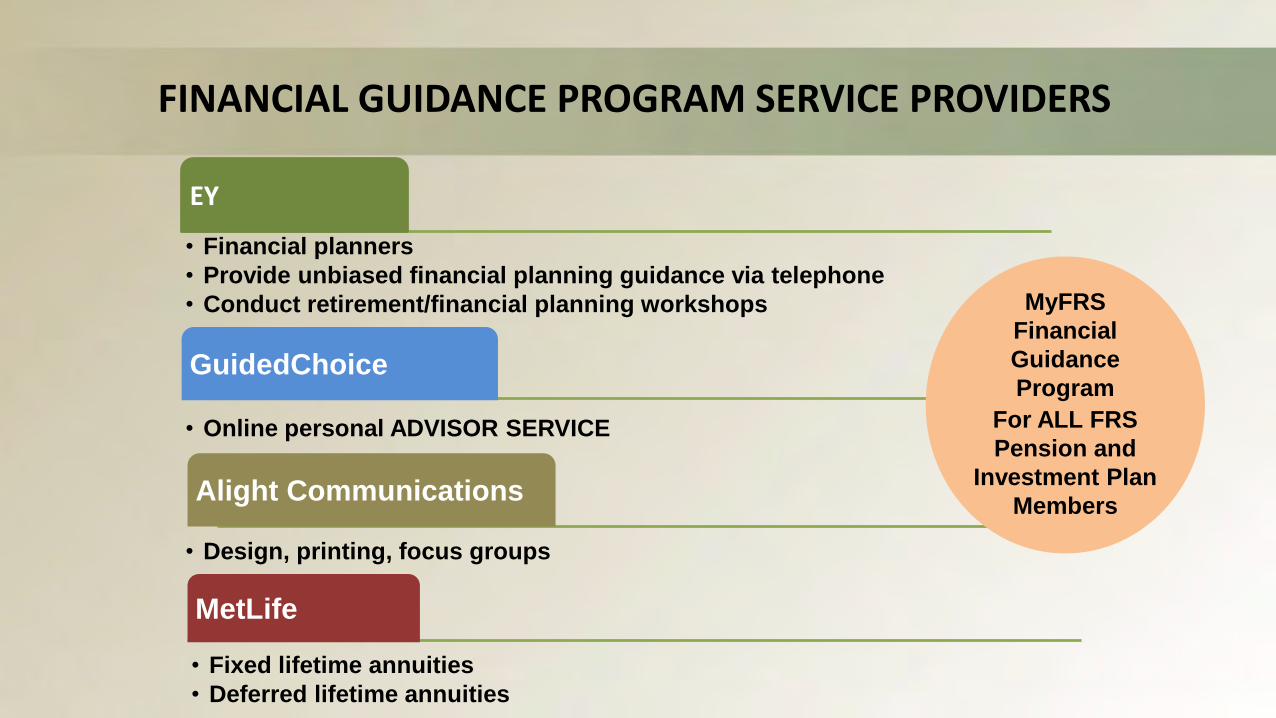
FINANCIAL GUIDANCE PROGRAM SERVICE PROVIDERS
EY
• Financial planners • Provide unbiased financial planning guidance via telephone• Conduct retirement/financial planning workshops
GuidedChoice
• Online personal ADVISOR SERVICE
Alight Communications
• Design, printing, focus groups
MetLife
• Fixed lifetime annuities• Deferred lifetime annuities
MyFRS Financial Guidance Program
For ALL FRS Pension and
Investment Plan Members

MyFRS FINANCIAL GUIDANCE PROGRAM
• Telephone
• MyFRS.com
• Videos
• Workshops/Webcasts

MyFRS FINANCIAL GUIDANCE PROGRAM(April 1, 2017-March 31, 2018)
INVESTMENT EDUCATION
EY FINANCIAL PLANNER
CALLS 281,704
# FINANCIAL PLANNING
WORKSHOPS 527
ATTENDANCE FINANCIAL
WORKSHOPS 16,524
-11%
-2% -12%
WEBSITE HITS
2,534,552
+11%
WEBSITE CHATS 38,312
+20%
11 Annuities purchased last 12 months - $1.5 million104 Total Annuities purchased inception to date - $13.4 million
(% change from previous 12 months)

Education Highlights
• GuidedChoice new online Advisor Service provider
• Alight Solutions new online Choice Service provider
• MyFRS.com infrastructure moved to Amazon Web Services Cloud
OVERVIEW OF THE INVESTMENT PLAN INVESTMENT FUND OPTIONS
Daniel BeardChief of Defined Contribution Programs
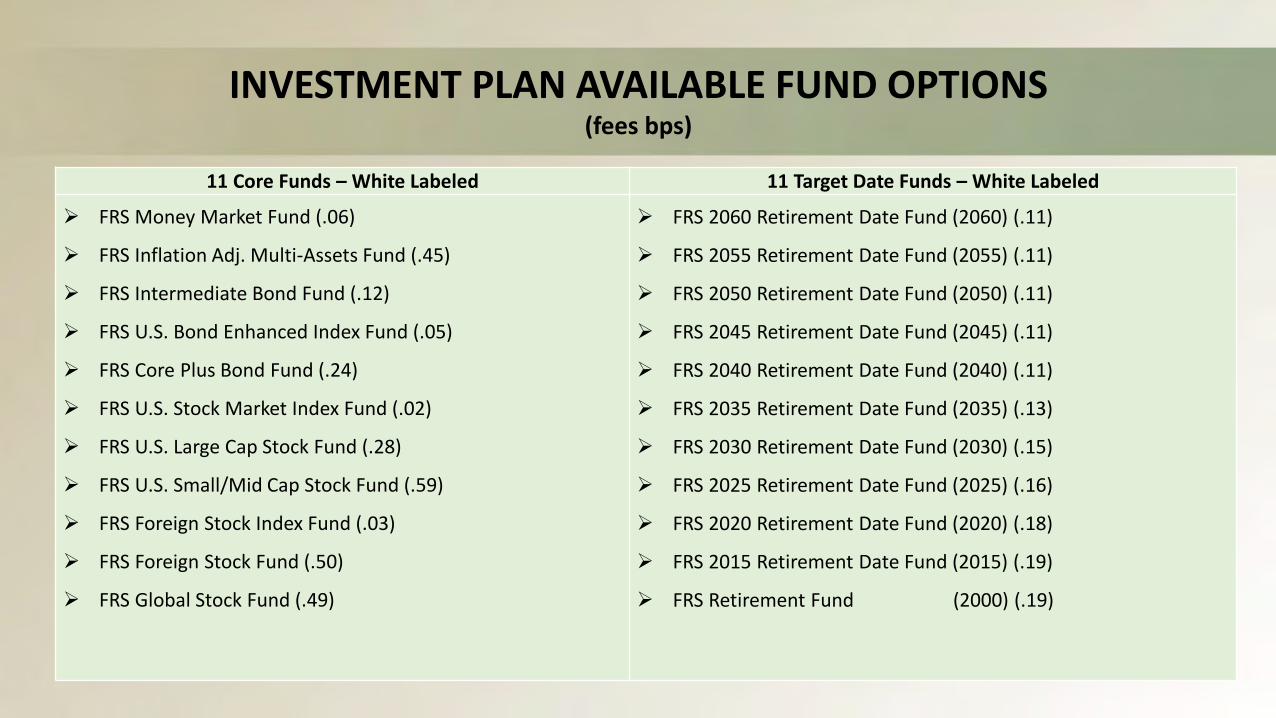
INVESTMENT PLAN AVAILABLE FUND OPTIONS(fees bps)
11 Core Funds – White Labeled 11 Target Date Funds – White Labeled
FRS Money Market Fund (.06)
FRS Inflation Adj. Multi-Assets Fund (.45)
FRS Intermediate Bond Fund (.12)
FRS U.S. Bond Enhanced Index Fund (.05)
FRS Core Plus Bond Fund (.24)
FRS U.S. Stock Market Index Fund (.02)
FRS U.S. Large Cap Stock Fund (.28)
FRS U.S. Small/Mid Cap Stock Fund (.59)
FRS Foreign Stock Index Fund (.03)
FRS Foreign Stock Fund (.50)
FRS Global Stock Fund (.49)
FRS 2060 Retirement Date Fund (2060) (.11)
FRS 2055 Retirement Date Fund (2055) (.11)
FRS 2050 Retirement Date Fund (2050) (.11)
FRS 2045 Retirement Date Fund (2045) (.11)
FRS 2040 Retirement Date Fund (2040) (.11)
FRS 2035 Retirement Date Fund (2035) (.13)
FRS 2030 Retirement Date Fund (2030) (.15)
FRS 2025 Retirement Date Fund (2025) (.16)
FRS 2020 Retirement Date Fund (2020) (.18)
FRS 2015 Retirement Date Fund (2015) (.19)
FRS Retirement Fund (2000) (.19)
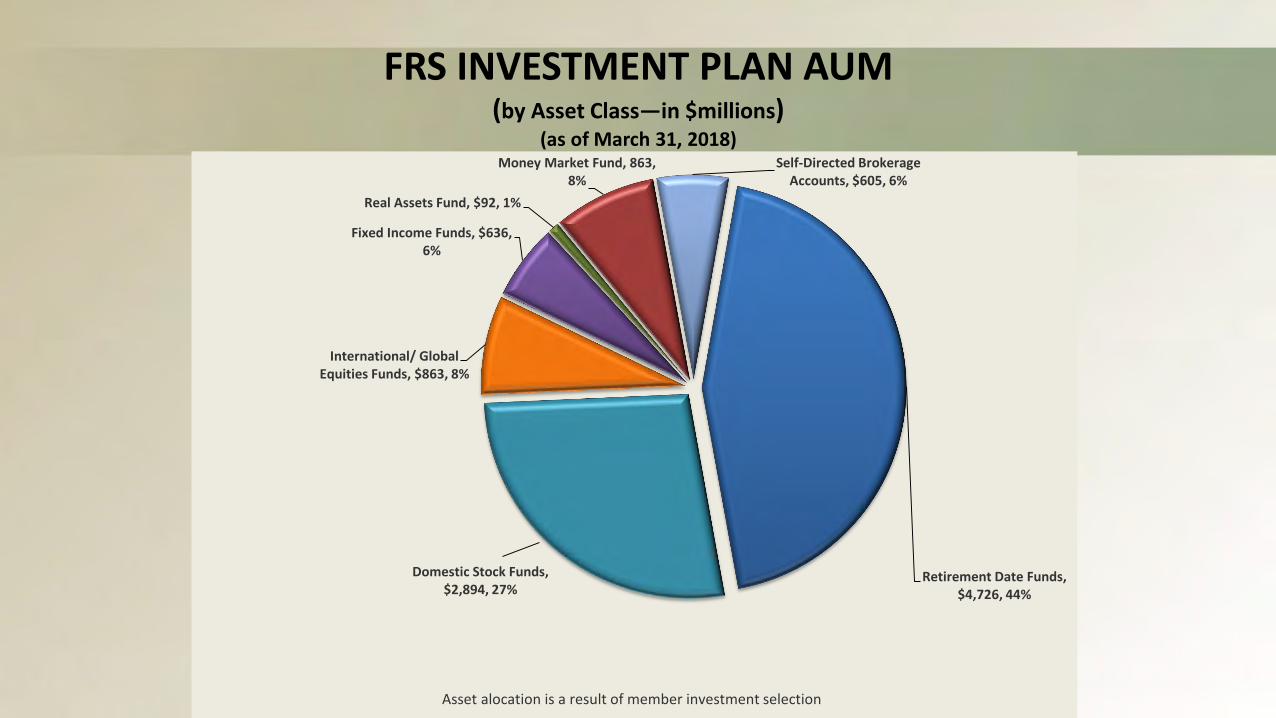
FRS INVESTMENT PLAN AUM(by Asset Class—in $millions)
(as of March 31, 2018)
Retirement Date Funds, $4,726, 44%
Domestic Stock Funds, $2,894, 27%
International/ Global Equities Funds, $863, 8%
Fixed Income Funds, $636, 6%
Real Assets Fund, $92, 1%
Money Market Fund, 863, 8%
Self-Directed Brokerage Accounts, $605, 6%
Asset alocation is a result of member investment selection
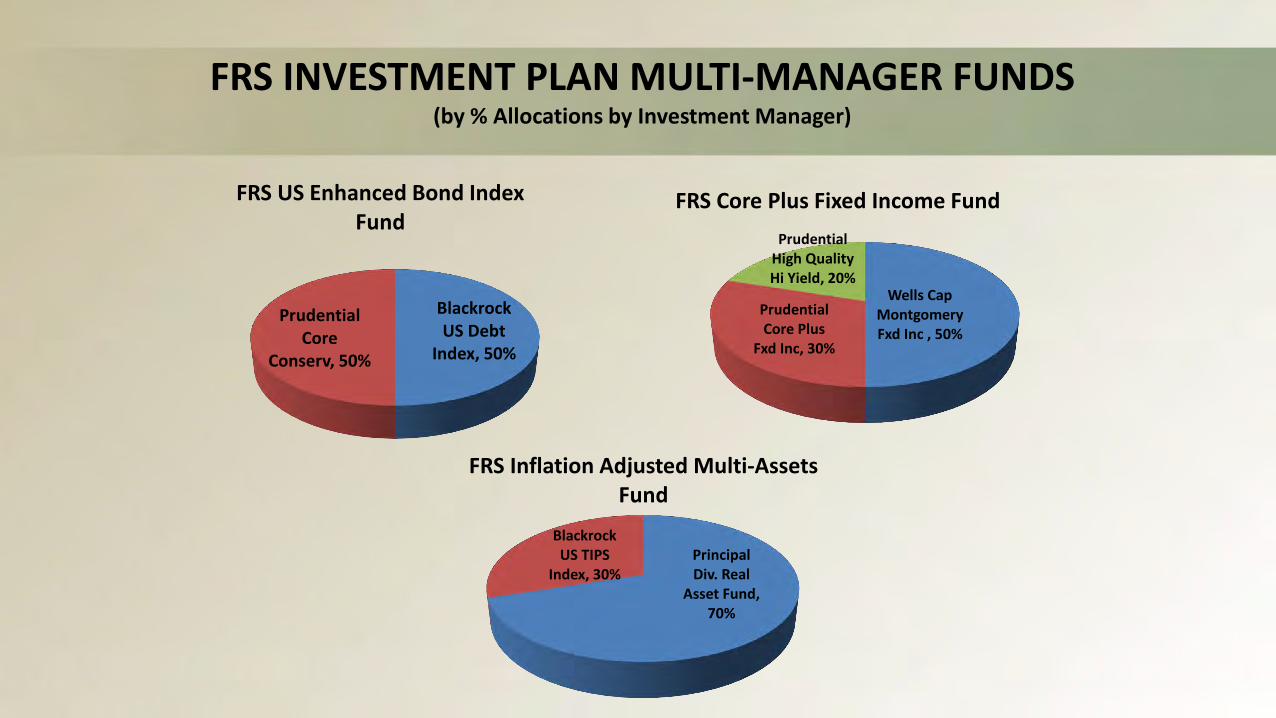
FRS INVESTMENT PLAN MULTI-MANAGER FUNDS(by % Allocations by Investment Manager)
Blackrock US Debt
Index, 50%
Prudential Core
Conserv, 50%
FRS US Enhanced Bond Index Fund
Wells Cap Montgomery Fxd Inc , 50%
Prudential Core Plus
Fxd Inc, 30%
Prudential High Quality Hi Yield, 20%
FRS Core Plus Fixed Income Fund
Principal Div. Real
Asset Fund, 70%
Blackrock US TIPS
Index, 30%
FRS Inflation Adjusted Multi-Assets Fund

FRS INVESTMENT PLAN MULTI-MANAGER FUNDS(by % Allocations by Investment Manager)
BlkRck 1000
Index F, 8%
AJO, 25%
Jennison Growth Equity,
19%
Fidelity Growth
Company, 19%
QMA Value
Equity, 14%
The London
Company, 15%
FRS Large Cap Stock FundT Rowe
Price Small Cap Stock,
30%
American Beacon SC Value, 25%
QMA MidCap Quantitative,
25%
Stephens Mid Cap Growth,
20%
FRS Small-Mid Cap Stock Fund
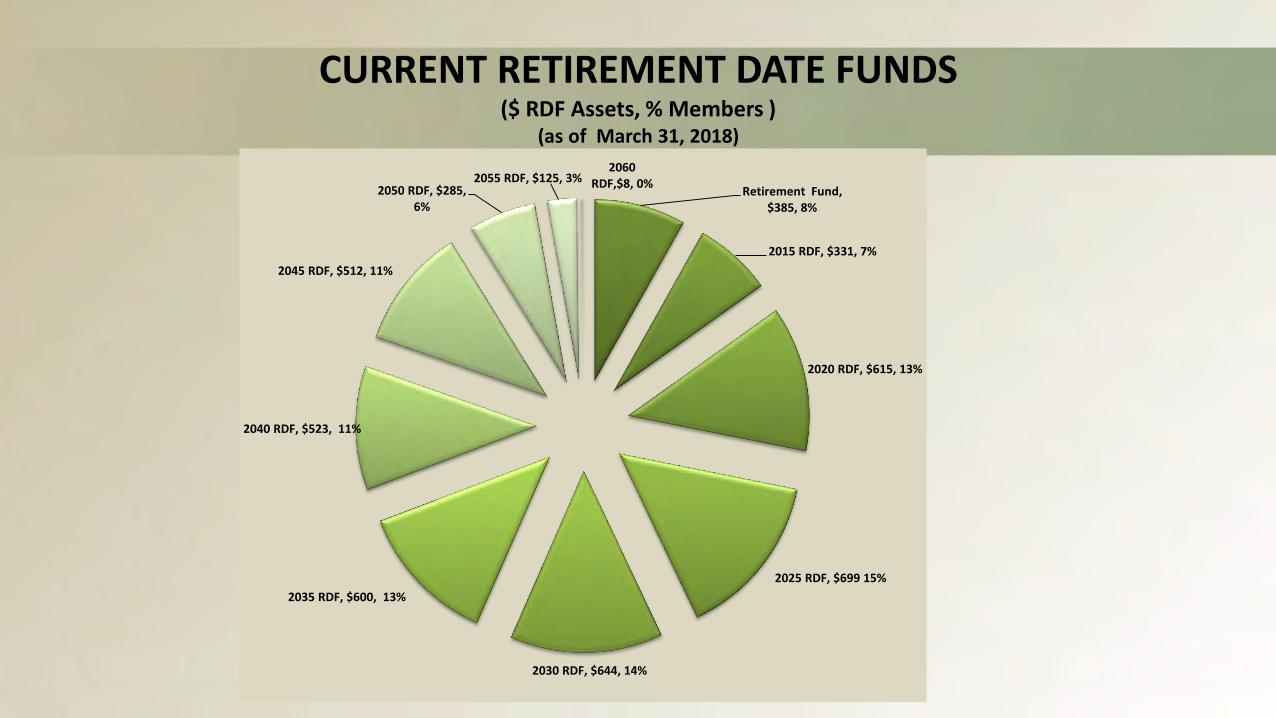
CURRENT RETIREMENT DATE FUNDS($ RDF Assets, % Members )
(as of March 31, 2018)
Retirement Fund, $385, 8%
2015 RDF, $331, 7%
2020 RDF, $615, 13%
2025 RDF, $699 15%
2030 RDF, $644, 14%
2035 RDF, $600, 13%
2040 RDF, $523, 11%
2045 RDF, $512, 11%
2050 RDF, $285, 6%
2055 RDF, $125, 3%2060
RDF,$8, 0%

TOTAL FUND ASSET ALLOCATION BY AGE(as of March 31, 2018)
75%
69%
55%
41%
31%
15%
21%
24%
27%
30%
3%
3%
5%
9%
15%
2%
3%
6%
13%
17%
4%
3%
3%
3%
3%
1%
3%
8%
7%
4%
0% 10% 20% 30% 40% 50% 60% 70% 80% 90% 100%
Under 35
35-45
45-55
55-65
Over 65
Stocks Fixed Income Real Assets Money Market Real Estate (RDF only) SDBA

ASSET ALLOCATION BY GENDER(as of March 31, 2018)
0%
10%
20%
30%
40%
50%
60%
Retirement DateFunds
Money Market Real Assets Fixed Income Domestic Equities InternationalEquities
SDBA
Female Male
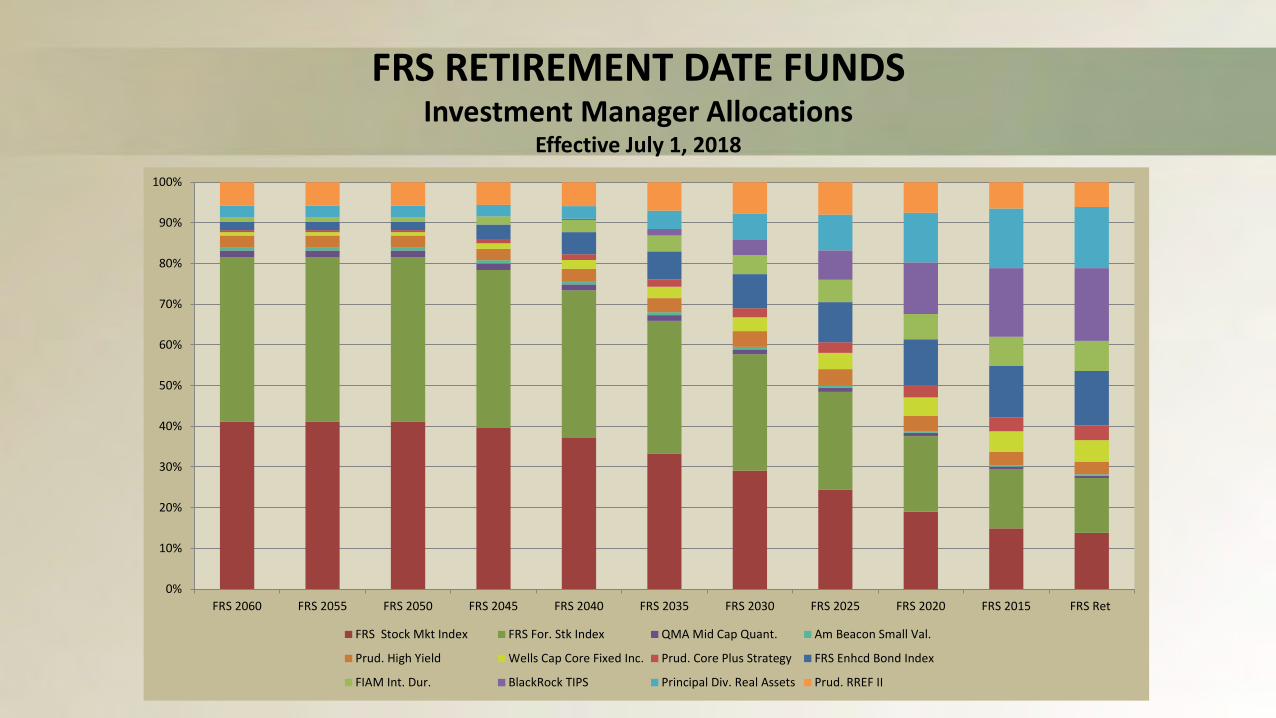
FRS RETIREMENT DATE FUNDS Investment Manager Allocations
Effective July 1, 2018
0%
10%
20%
30%
40%
50%
60%
70%
80%
90%
100%
FRS 2060 FRS 2055 FRS 2050 FRS 2045 FRS 2040 FRS 2035 FRS 2030 FRS 2025 FRS 2020 FRS 2015 FRS Ret
FRS Stock Mkt Index FRS For. Stk Index QMA Mid Cap Quant. Am Beacon Small Val.
Prud. High Yield Wells Cap Core Fixed Inc. Prud. Core Plus Strategy FRS Enhcd Bond Index
FIAM Int. Dur. BlackRock TIPS Principal Div. Real Assets Prud. RREF II
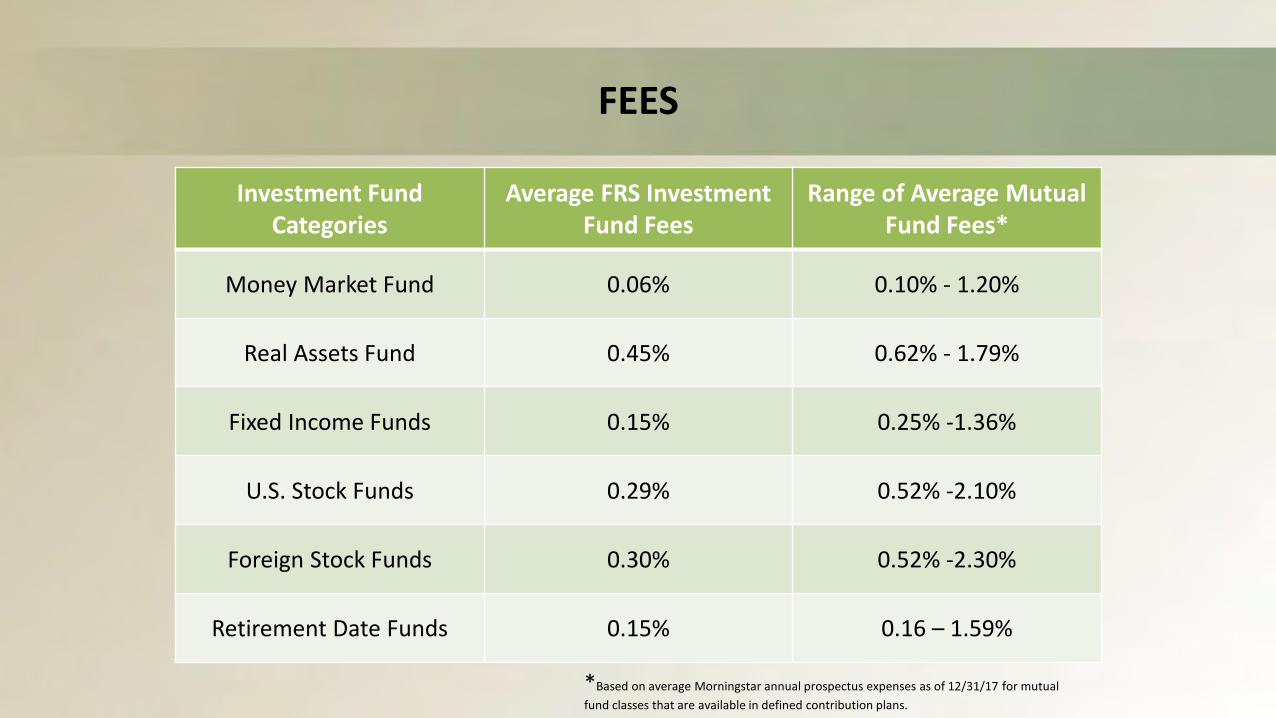
FEES
Investment Fund Categories
Average FRS Investment Fund Fees
Range of Average Mutual Fund Fees*
Money Market Fund 0.06% 0.10% - 1.20%
Real Assets Fund 0.45% 0.62% - 1.79%
Fixed Income Funds 0.15% 0.25% -1.36%
U.S. Stock Funds 0.29% 0.52% -2.10%
Foreign Stock Funds 0.30% 0.52% -2.30%
Retirement Date Funds 0.15% 0.16 – 1.59%
*Based on average Morningstar annual prospectus expenses as of 12/31/17 for mutual fund classes that are available in defined contribution plans.

Asset Class Performance(as of March 31, 2018)
QTD FYTD 1 Year 3 Years 5 Years Inception
Total Fund -0.23% 7.91% 11.10% 6.62% 7.50% 7.07%
Money Market 0.43% 1.12% 1.41% 0.81% 0.56% 1.52%
Real Assets & TIPS -1.03% 3.11% 4.15% 1.01% -0.45% 0.79% (7/1/14)
Fixed Income -1.26% 0.12% 2.06% 2.25% 4.24% 4.71%
Domestic Equities -0.04% 10.79% 14.58% 10.41% 13.35% 10.25%
Global & Intl Equities -0.07% 11.57% 18.52% 7.79% 8.12% 8.69%
Retirement Date Funds -0.65% 7.50% 11.10% 6.62% N.A. 5.42% (7/1/14)
TF x RDFs 0.14% 7.91% 11.23% 6.75% N.A. 6.47% (7/1/14)

2018-19 INITIATIVES
Investment Option Updates
Rolldown in RDF Glidepath allocations effective July 2, 2018
Finalize recommended benchmark changes
Plan Administration Initiatives
Conduct Focus Groups on New Hire Materials
Continue Enhanced Website Security Development
Continue Website Updates and Mobile Compatibility
Issue ITN for Plan Choice and Investment Plan Administrator
Issue ITN for Education Provider

QUESTIONS

FRS Investment Plan Self-Directed Brokerage Account
(as of March 31, 2018)
MUTUAL FUNDS62%
EQUITY21%
CASH AND EQUIVALENTS
8%
ETF8% FIXED INCOME
1% ($3.9 M)
($376.9 M)
($128.1 M)
($48.3 M)
($47.7 M)
Total Assets = $605.1 M
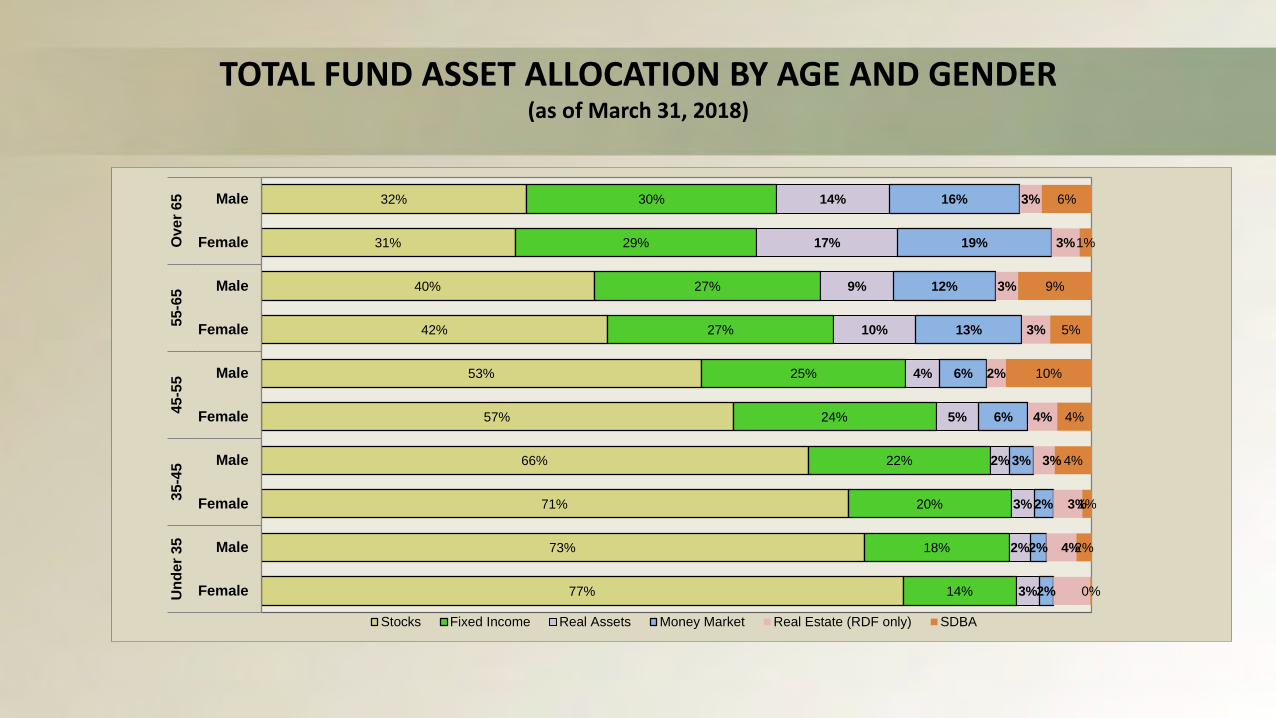
TOTAL FUND ASSET ALLOCATION BY AGE AND GENDER(as of March 31, 2018)
77%
73%
71%
66%
57%
53%
42%
40%
31%
32%
14%
18%
20%
22%
24%
25%
27%
27%
29%
30%
3%
2%
3%
2%
5%
4%
10%
9%
17%
14%
2%
2%
2%
3%
6%
6%
13%
12%
19%
16%
4%
3%
3%
4%
2%
3%
3%
3%
3%
0%
2%
1%
4%
4%
10%
5%
9%
1%
6%
Female
Male
Female
Male
Female
Male
Female
Male
Female
MaleU
nder
35
35-4
545
-55
55-6
5O
ver 6
5
Stocks Fixed Income Real Assets Money Market Real Estate (RDF only) SDBA

MEMBER INVESTMENT OPTIONS ALLOCATION BY AGE AND GENDER
(as of March 31, 2018)
77%
62%
60%
43%
48%
31%
44%
36%
52%
41%
2%
2%
2%
3%
6%
6%
13%
12%
19%
16%
0%
0%
1%
1%
1%
1%
1%
1%
1%
1%
8%
12%
12%
16%
14%
18%
15%
17%
13%
17%
14%
17%
23%
19%
24%
15%
16%
10%
13%
4%
7%
7%
11%
8%
11%
6%
8%
4%
6%
0%
2%
1%
5%
4%
10%
5%
9%
1%
6%
0% 10% 20% 30% 40% 50% 60% 70% 80% 90% 100%
Female
Male
Female
Male
Female
Male
Female
Male
Female
Male
Und
er 3
535
-45
45-5
555
-65
Ove
r 65
Retirement Date Funds Money Market Real Assets Fixed Income Domestic Equities International Equities SDBA

IMPACT OF MARKET CONDITIONS
Asset Class 2Q17 3Q17 4Q17 1Q18
Total Fund 2.96% 3.90% 4.09% -0.23%
Money Market
Real Assets
Fixed Income
Domestic EquitiesGlobal International Equities
Total Fund Benchmark Return 2.72% 3.71% 4.07% -0.80%Total Fund Active Return 0.24 0.19 0.02 0.57
Market Detractors from Performance .
Negative markets for natural resources and
energy sectors
Active Global and International Equity
funds underperform..
Equity market declineperformance. Fed
tightens.
Asset class allocation weights are derived by member selection, not any risk budget process.Benchmark returns reflect asset class weight based on AUM not specific target.
AonInvestment advice and consulting services provided by Aon Hewitt Investment Consulting, Inc., an Aon Company. 1
State Board of Administration of Florida
FRS Investment Plan ReviewMay 2018

AonInvestment advice and consulting services provided by Aon Hewitt Investment Consulting, Inc., an Aon Company. 2
(This slide left blank intentionally)
AonInvestment advice and consulting services provided by Aon Hewitt Investment Consulting, Inc., an Aon Company. 3
FRS Investment Plan Review
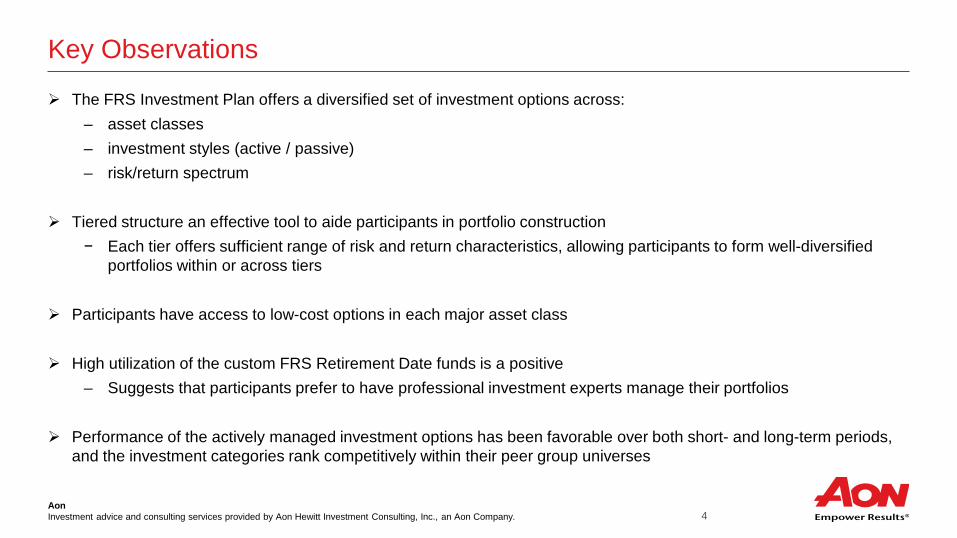
AonInvestment advice and consulting services provided by Aon Hewitt Investment Consulting, Inc., an Aon Company. 4
Key Observations
The FRS Investment Plan offers a diversified set of investment options across:– asset classes– investment styles (active / passive)– risk/return spectrum
Tiered structure an effective tool to aide participants in portfolio construction− Each tier offers sufficient range of risk and return characteristics, allowing participants to form well-diversified
portfolios within or across tiers
Participants have access to low-cost options in each major asset class
High utilization of the custom FRS Retirement Date funds is a positive– Suggests that participants prefer to have professional investment experts manage their portfolios
Performance of the actively managed investment options has been favorable over both short- and long-term periods, and the investment categories rank competitively within their peer group universes

AonInvestment advice and consulting services provided by Aon Hewitt Investment Consulting, Inc., an Aon Company. 5
Investment Structure
The investment structure of a participant-directed defined contribution plan refers to the number and types of options offered to participants
It is one of the most important components of the investment program as it will:─ Shape how participants invest their assets─ Impact the employees’ perceived value of the Plan─ Influence participants’ readiness for retirement
We recommend a structure that:─ Offers sufficient range of choice – low to high risk─ Allows participants to form well-diversified portfolios─ Does not burden or confuse the average participant─ Meets broad participant demand to the extent that it is prudent─ Uses compelling, low cost funds
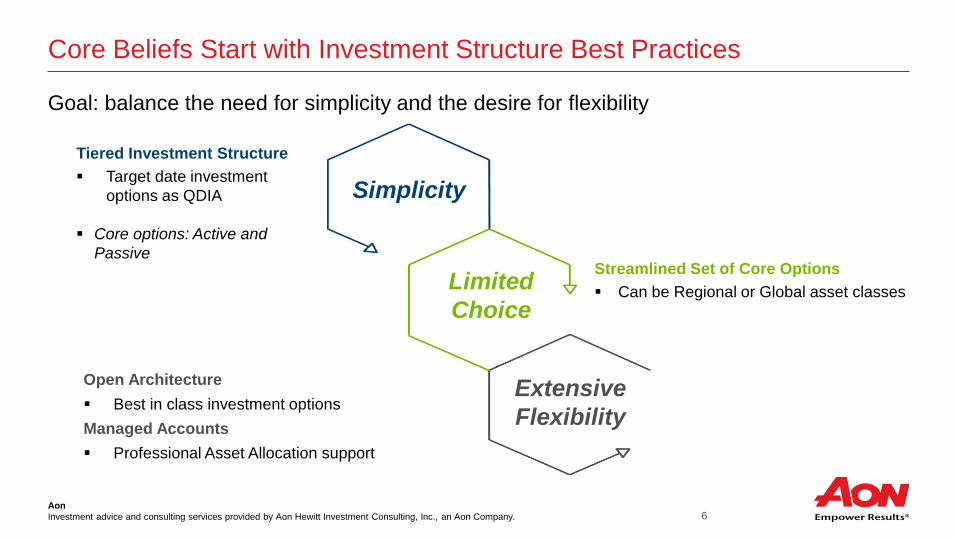
AonInvestment advice and consulting services provided by Aon Hewitt Investment Consulting, Inc., an Aon Company. 6
Open Architecture Best in class investment optionsManaged Accounts Professional Asset Allocation support
Streamlined Set of Core Options Can be Regional or Global asset classes
Tiered Investment Structure Target date investment
options as QDIA
Core options: Active and Passive
Simplicity
ExtensiveFlexibility
LimitedChoice
Core Beliefs Start with Investment Structure Best Practices
Goal: balance the need for simplicity and the desire for flexibility

AonInvestment advice and consulting services provided by Aon Hewitt Investment Consulting, Inc., an Aon Company. 7
Investment Structure: Traditional Tiered Structure
Tier 1
Tier 2
Tier 3
Tier 4
Novice or Disinterested Target Retirement Funds
Knowledgeable and Cost Sensitive
Active Investor
Investment Savvy
Passive Funds
Active Funds
Self-Directed Brokerage
Tiered investment structures categorizes and communicates investment options in a manner that guides participants through investment option choices
Observation: The FRS Investment Plan offers an appropriate range of options for all investor types of participants
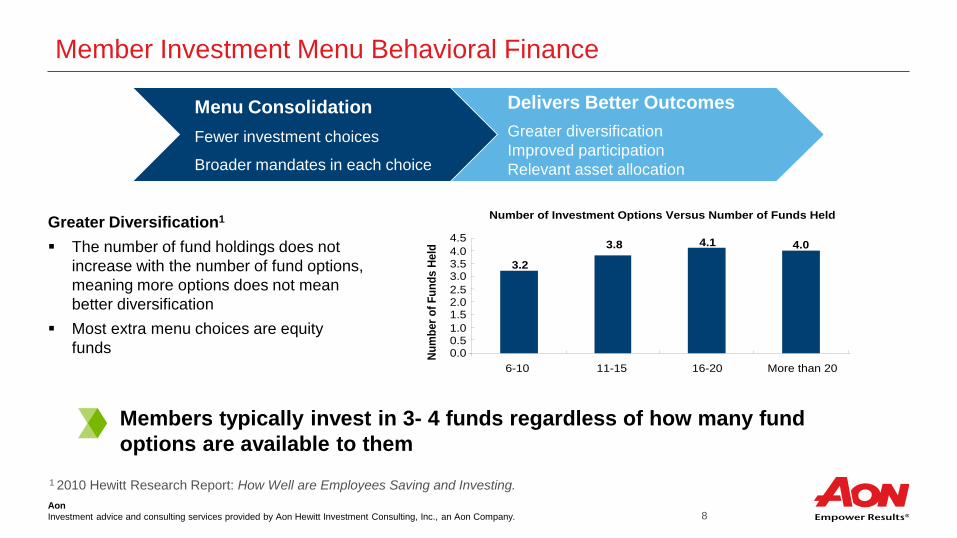
AonInvestment advice and consulting services provided by Aon Hewitt Investment Consulting, Inc., an Aon Company. 8
Member Investment Menu Behavioral Finance
Greater Diversification1
The number of fund holdings does not increase with the number of fund options, meaning more options does not mean better diversification
Most extra menu choices are equity funds
1 2010 Hewitt Research Report: How Well are Employees Saving and Investing.
Number of Investment Options Versus Number of Funds Held
3.2
3.8 4.1 4.0
0.0 0.5 1.0 1.5 2.0 2.5 3.0 3.5 4.0 4.5
6-10 11-15 16-20 More than 20
Num
ber o
f Fun
ds H
eld
Menu ConsolidationFewer investment choices
Broader mandates in each choice
Delivers Better OutcomesGreater diversificationImproved participationRelevant asset allocation
Members typically invest in 3- 4 funds regardless of how many fund options are available to them
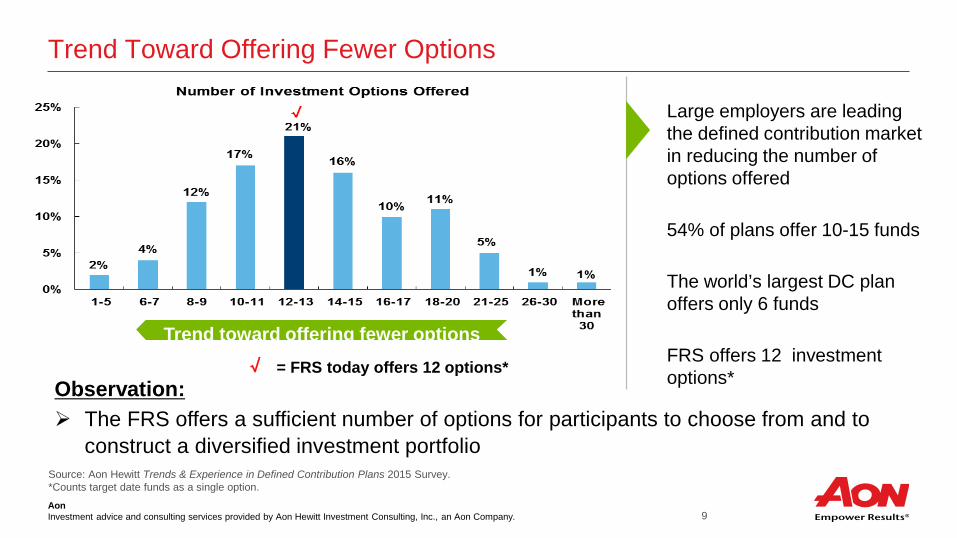
AonInvestment advice and consulting services provided by Aon Hewitt Investment Consulting, Inc., an Aon Company. 9
Source: Aon Hewitt Trends & Experience in Defined Contribution Plans 2015 Survey.*Counts target date funds as a single option.
Large employers are leading the defined contribution market in reducing the number of options offered
54% of plans offer 10-15 funds
The world’s largest DC plan offers only 6 funds
FRS offers 12 investment options*= FRS today offers 12 options*√
Trend toward offering fewer options
Trend Toward Offering Fewer Options
Observation: The FRS offers a sufficient number of options for participants to choose from and to
construct a diversified investment portfolio

10AonInvestment advice and consulting services provided by Aon Hewitt Investment Consulting, Inc., an Aon Company.
43%35%
19%33%
5%36%36%
78%79%
93%83%
59%85%
12%60%
76%
0% 10% 20% 30% 40% 50% 60% 70% 80% 90% 100%
Balanced FundEmerging MarketsReal Estate Fund
TIPSAlternative Asset Class
Self-Directed WindowMoney Market Fund
Stable ValueTarget Date Funds
U.S. Equity PassiveU.S. Equity Active
Non-U.S./Global Equity PassiveNon-U.S./Global Equity Active
Non-U.S. Fixed IncomeU.S. Fixed Income Passive
U.S. Fixed Income ActiveDC Plans 5000+ Participants
What are the right Type of Options?
Source: Profit Sharing 401(k) Council of America (PSCA) 2016; 102 DC Plans with 5,000+ Participants*FRS offers a Real Assets Fund that currently offers exposure to TIPS, commodities, real estate, infrastructure and natural resources
DC Asset Class Prevalence (Percentage of Plans)
√
√
√√
√
√
√
= FRS Today√√*
√
√
Observation: FRS’s investment options are diversified and cover the most prevalent asset classes
√*
√*
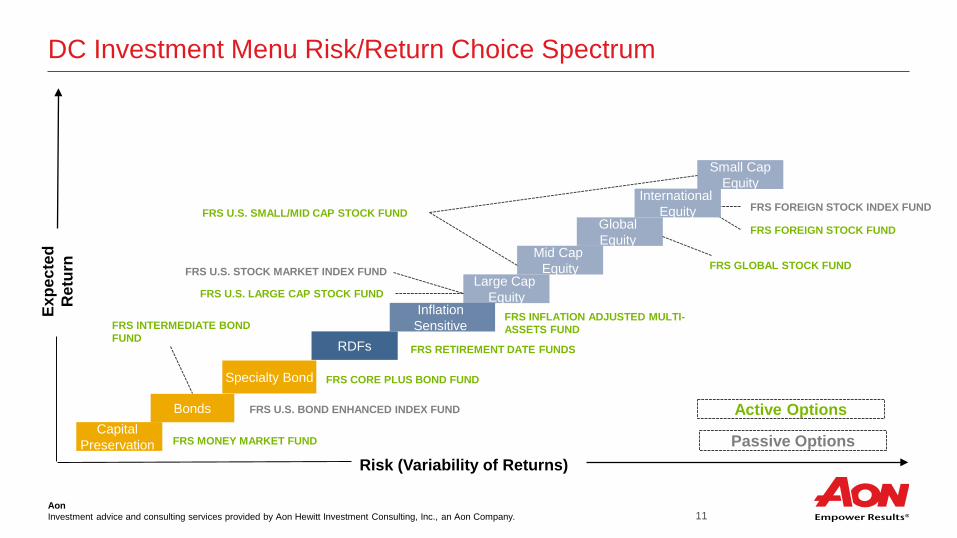
11AonInvestment advice and consulting services provided by Aon Hewitt Investment Consulting, Inc., an Aon Company.
Risk (Variability of Returns)
Capital Preservation
Bonds
Expe
cted
R
etur
n
Large Cap Equity
Mid Cap Equity
Small CapEquity
Specialty Bond
RDFs
FRS U.S. LARGE CAP STOCK FUND
FRS U.S. SMALL/MID CAP STOCK FUND
FRS RETIREMENT DATE FUNDS
FRS INTERMEDIATE BOND FUND
FRS FOREIGN STOCK INDEX FUND
FRS U.S. STOCK MARKET INDEX FUND
FRS MONEY MARKET FUND
FRS CORE PLUS BOND FUND
FRS INFLATION ADJUSTED MULTI-ASSETS FUND
FRS GLOBAL STOCK FUND
Global Equity
Inflation Sensitive
FRS FOREIGN STOCK FUND
Active Options
Passive Options
International Equity
FRS U.S. BOND ENHANCED INDEX FUND
DC Investment Menu Risk/Return Choice Spectrum
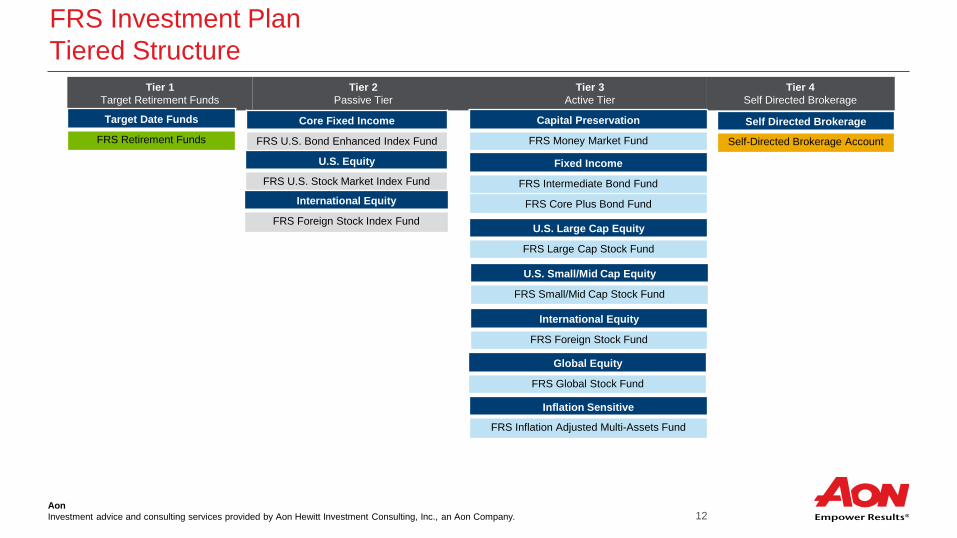
12AonInvestment advice and consulting services provided by Aon Hewitt Investment Consulting, Inc., an Aon Company.
Tier 1Target Retirement Funds
Tier 2 Passive Tier
Tier 3Active Tier
Tier 4 Self Directed Brokerage
FRS Investment PlanTiered Structure
Target Date Funds
FRS Retirement Funds
Core Fixed Income
FRS U.S. Bond Enhanced Index Fund
U.S. Equity
FRS U.S. Stock Market Index Fund
Capital Preservation
FRS Money Market Fund
Fixed Income
FRS Intermediate Bond Fund
FRS Core Plus Bond Fund
U.S. Large Cap Equity
FRS Large Cap Stock Fund
U.S. Small/Mid Cap Equity
FRS Small/Mid Cap Stock Fund
Global Equity
FRS Global Stock Fund
International Equity
FRS Foreign Stock Fund
International Equity
FRS Foreign Stock Index Fund
Self Directed Brokerage
Self-Directed Brokerage Account
Inflation Sensitive
FRS Inflation Adjusted Multi-Assets Fund
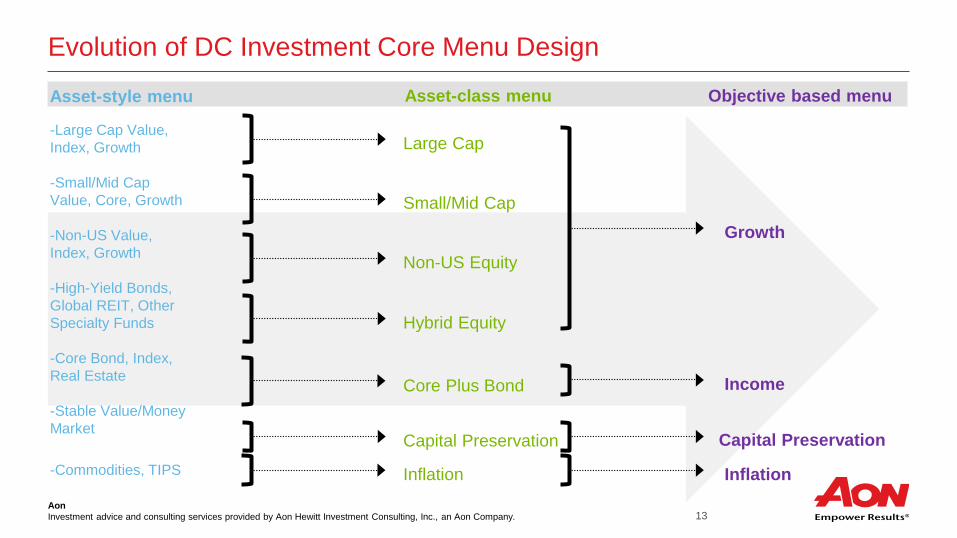
13AonInvestment advice and consulting services provided by Aon Hewitt Investment Consulting, Inc., an Aon Company.
-Large Cap Value, Index, Growth
-Small/Mid Cap Value, Core, Growth
-Non-US Value, Index, Growth
-High-Yield Bonds, Global REIT, Other Specialty Funds
-Core Bond, Index, Real Estate
-Stable Value/Money Market
-Commodities, TIPS
Evolution of DC Investment Core Menu Design
Capital Preservation
Asset-style menu Asset-class menu Objective based menu
Large Cap
Small/Mid Cap
Non-US Equity
Hybrid Equity
Core Plus Bond
Capital Preservation
Inflation
Growth
Income
Inflation

AonInvestment advice and consulting services provided by Aon Hewitt Investment Consulting, Inc., an Aon Company. 14
FRS Investment Plan Option Costs
*Average fee of multiple products in category as of 3/31/2018.**Source: AHIC’s annual mutual fund expense analysis as of 12/31/2017.***No single appropriate universe exists. Average fee based on weighted average of underlying investment category fees in the FRS Inflation Adjusted Multi-Assets Fund.
FRS Investment Plan Option Investment Category Investment Plan Fee* Average Mutual Fund
Fee**RDFs Target Date 0.15% 0.52%FRS Money Market Fund Money Market 0.06% 0.31%FRS Inflation Adjusted Multi-Assets Fund Multiple*** 0.45% 0.70%***FRS U.S. Bond EnhancedIndex
Passive U.S. Broad Market CoreFixed Income 0.05% 0.17%
FIAM Int. Duration Pool U.S. Broad Market Core FixedIncome 0.12% 0.52%
FRS Core Plus Fixed Income U.S. Broad Market Core PlusFixed Income 0.24% 0.56%
FRS U.S. Large Cap Equity U.S. Large Cap Equity 0.28% 0.80%FRS U.S. Stock Market Index Passive U.S. Large Equity Core 0.02% 0.35%FRS Small/Mid Cap Equity U.S. SMID Cap Equity 0.59% 0.99%FRS Foreign Stock Index Passive International Equity All 0.03% 0.29%AF EuroPacific Growth Fund International Equity All 0.50% 0.97%AF New Perspective Fund Global Equity All 0.49% 1.05%
Observations Management fees are lower than the median as represented by
Morningstar’s mutual fund universe for every investment category.
Key: FRS Discount to Average Fee
> 50%
20 – 50%
< 20%

AonInvestment advice and consulting services provided by Aon Hewitt Investment Consulting, Inc., an Aon Company. 15
FRS Asset Allocation as of 3/31/2018
Market Value ($M) Percent of Total Participant Count
FRS Retirement Income Fund $385 3.6% 8,178
FRS 2015 Retirement Date Fund 331 3.1 7,569
FRS 2020 Retirement Date Fund 615 5.8 12,925
FRS 2025 Retirement Date Fund 699 6.6 15,923
FRS 2030 Retirement Date Fund 644 6.0 16,728
FRS 2035 Retirement Date Fund 600 5.6 18,257
FRS 2040 Retirement Date Fund 523 4.9 18,227
FRS 2045 Retirement Date Fund 512 4.8 21,028
FRS 2050 Retirement Date Fund 285 2.7 18,913
FRS 2055 Retirement Date Fund 125 1.2 18,078
FRS 2060 Retirement Date Fund 8 0.1 1,897
Tier I: Target Date Funds $4,726 44.4% --
Observation: High utilization of the custom FRS Retirement Date funds is a positive

AonInvestment advice and consulting services provided by Aon Hewitt Investment Consulting, Inc., an Aon Company. 16
FRS Asset Allocation as of 3/31/2018 (cont’d)
Market Value ($M) Percent of Total Participant Count
FRS U.S. Bond Enhanced Index Fund $242 2.3% 14,020
FRS U.S. Stock Market Index Fund 997 9.4 36,513
FRS Foreign Stock Index Fund 344 3.2 22,566
Tier II: Index Funds $1,583 14.9% --
FRS Money Market Fund $863 8.1% 16,101
FRS Inflation Adjusted Multi-Assets Fund 92 0.9 7,891
FIAM Intermediate Duration Pool Fund 98 0.9 5,493
FRS Core Plus Fixed Income Fund 296 2.8 14,643
FRS U.S. Large Cap Stock Fund 1,011 9.5 32,050
FRS U.S. Small/Mid Cap Stock Fund 885 8.3 30,507
American Funds New Perspective Fund 297 2.8 16,829
American Funds Euro-Pacific Growth Fund 197 1.9 14,037
Tier III: Actively Managed Options $3,739 35.2% --
Tier IV: Self-Directed Brokerage Account $605 5.7% 3,143
Total Plan $10,653 100% --

AonInvestment advice and consulting services provided by Aon Hewitt Investment Consulting, Inc., an Aon Company. 17
11.1%
6.6%7.5%
5.9%
10.0%
6.3%7.1%
5.4%
1.1%0.4% 0.4% 0.4%
0.0%
2.0%
4.0%
6.0%
8.0%
10.0%
12.0%
1 Year 3 Years 5 Years 10 Years
Total Fund Total Plan Aggregate Benchmark Relative Performance
Total Investment Plan Returns
*Returns shown are net of fees.
Periods Ending 3/31/2018*
Observations The FRS Investment Plan outperformed the Total Plan Aggregate Benchmark over all trailing periods shown
above, suggesting strong relative performance of the underlying fund options in which participants are investing Aggregate benchmark returns are an average of the individual portfolio benchmark returns at their actual weights

AonInvestment advice and consulting services provided by Aon Hewitt Investment Consulting, Inc., an Aon Company. 18
Investment Category Returns and Ranks
Periods Ending 3/31/2018* 1-Year 3-Years 5-Years 10-Years
CashiMoneyNet 1st Tier Inst’l Net Index
1.41.0
(1)(17)
0.80.5
(1)(18)
0.60.3
(1)(18)
0.5 0.5
(2)(13)
Real Assets**FRS Custom Real Assets Index
4.14.0 -- 1.0
2.1 -- -0.5-0.1 -- -- --
Fixed IncomeTotal Bond Index
1.81.5
(11)(15)
2.11.7
(6)(13)
2.22.1
(4)(7)
4.23.8
(8)(17)
Domestic EquityTotal U.S. Equities Index
14.613.1
(41)(52)
10.49.8
(21)(33)
13.312.6
(24)(38)
10.49.7
(16)(29)
International/Global EquityTotal Int’l / Global Equities Index
18.516.8
(49)(63)
7.86.9
(43)(52)
8.17.1
(28)(42)
4.53.4
(29)(46)
*Returns shown are net of fees**The returns for the Real Assets composite uses prehire data for all months prior to 7/1/2014, actual live data is used thereafter.Note: Composite returns for the Retirement Date Funds and the SDBA are unavailable.
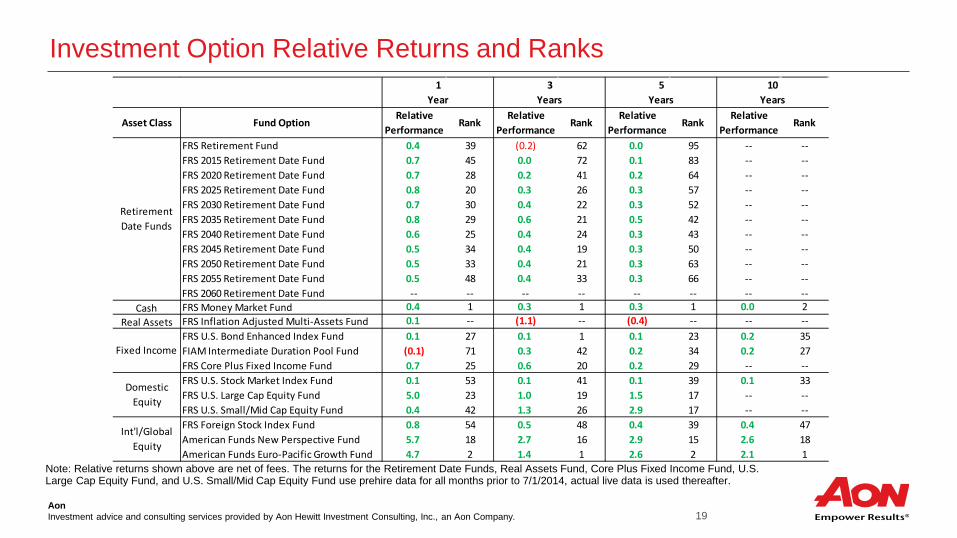
AonInvestment advice and consulting services provided by Aon Hewitt Investment Consulting, Inc., an Aon Company. 19
Investment Option Relative Returns and Ranks
Note: Relative returns shown above are net of fees. The returns for the Retirement Date Funds, Real Assets Fund, Core Plus Fixed Income Fund, U.S. Large Cap Equity Fund, and U.S. Small/Mid Cap Equity Fund use prehire data for all months prior to 7/1/2014, actual live data is used thereafter.
Asset Class Fund OptionRelative
PerformanceRank
Relative Performance
RankRelative
PerformanceRank
Relative Performance
Rank
FRS Retirement Fund 0.4 39 (0.2) 62 0.0 95 -- --FRS 2015 Retirement Date Fund 0.7 45 0.0 72 0.1 83 -- --FRS 2020 Retirement Date Fund 0.7 28 0.2 41 0.2 64 -- --FRS 2025 Retirement Date Fund 0.8 20 0.3 26 0.3 57 -- --FRS 2030 Retirement Date Fund 0.7 30 0.4 22 0.3 52 -- --FRS 2035 Retirement Date Fund 0.8 29 0.6 21 0.5 42 -- --FRS 2040 Retirement Date Fund 0.6 25 0.4 24 0.3 43 -- --FRS 2045 Retirement Date Fund 0.5 34 0.4 19 0.3 50 -- --FRS 2050 Retirement Date Fund 0.5 33 0.4 21 0.3 63 -- --FRS 2055 Retirement Date Fund 0.5 48 0.4 33 0.3 66 -- --FRS 2060 Retirement Date Fund -- -- -- -- -- -- -- --
Cash FRS Money Market Fund 0.4 1 0.3 1 0.3 1 0.0 2Real Assets FRS Inflation Adjusted Multi-Assets Fund 0.1 -- (1.1) -- (0.4) -- -- --
FRS U.S. Bond Enhanced Index Fund 0.1 27 0.1 1 0.1 23 0.2 35FIAM Intermediate Duration Pool Fund (0.1) 71 0.3 42 0.2 34 0.2 27FRS Core Plus Fixed Income Fund 0.7 25 0.6 20 0.2 29 -- --FRS U.S. Stock Market Index Fund 0.1 53 0.1 41 0.1 39 0.1 33FRS U.S. Large Cap Equity Fund 5.0 23 1.0 19 1.5 17 -- --FRS U.S. Small/Mid Cap Equity Fund 0.4 42 1.3 26 2.9 17 -- --FRS Foreign Stock Index Fund 0.8 54 0.5 48 0.4 39 0.4 47American Funds New Perspective Fund 5.7 18 2.7 16 2.9 15 2.6 18American Funds Euro-Pacific Growth Fund 4.7 2 1.4 1 2.6 2 2.1 1
10 Years
Retirement Date Funds
Fixed Income
Domestic Equity
Int'l/Global Equity
1 Year
3 Years
5 Years

AonInvestment advice and consulting services provided by Aon Hewitt Investment Consulting, Inc., an Aon Company. 20
Investment Category and Fund Option Performance Observations
Observations The FRS Investment Plan options have all exhibited strong relative performance over both short- and
long-term time periods
− Exception includes the Real Assets investment option
• Real Assets investment option trailed over the 3- and 5-year periods, primarily due to commodity exposure which struggled in 2015
Each actively managed investment option, excluding the RDFs, ranked in the top 50th percentile amongst their respective peer universes over both the trailing 3- and 5-year periods
The FRS index funds have performed in line with their respective benchmarks, as expected

AonInvestment advice and consulting services provided by Aon Hewitt Investment Consulting, Inc., an Aon Company. 21
Appendix
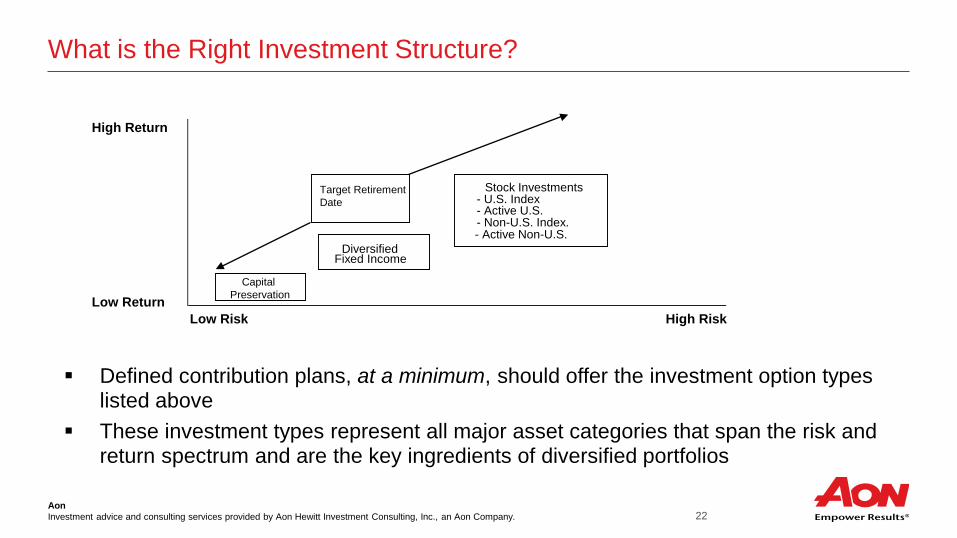
AonInvestment advice and consulting services provided by Aon Hewitt Investment Consulting, Inc., an Aon Company. 22
Defined contribution plans, at a minimum, should offer the investment option types listed above
These investment types represent all major asset categories that span the risk and return spectrum and are the key ingredients of diversified portfolios
High Return
DiversifiedFixed Income
Capital PreservationLow Return
Low Risk High Risk
Stock Investments- U.S. Index- Active U.S.- Non-U.S. Index.- Active Non-U.S.
Target Retirement Date
What is the Right Investment Structure?
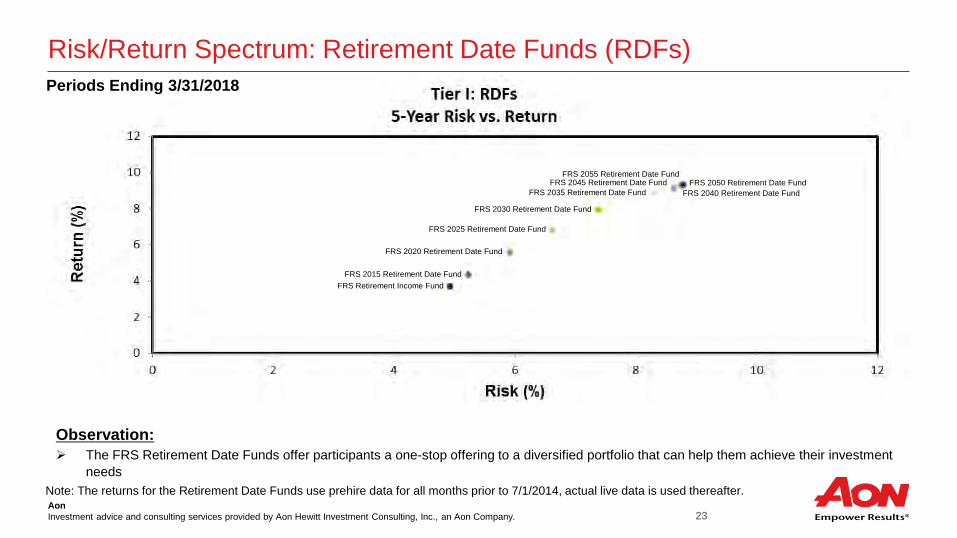
AonInvestment advice and consulting services provided by Aon Hewitt Investment Consulting, Inc., an Aon Company. 23
Risk/Return Spectrum: Retirement Date Funds (RDFs)
Observation: The FRS Retirement Date Funds offer participants a one-stop offering to a diversified portfolio that can help them achieve their investment
needsNote: The returns for the Retirement Date Funds use prehire data for all months prior to 7/1/2014, actual live data is used thereafter.
FRS Retirement Income FundFRS 2015 Retirement Date Fund
FRS 2035 Retirement Date FundFRS 2045 Retirement Date Fund
FRS 2040 Retirement Date Fund
FRS 2025 Retirement Date Fund
FRS 2020 Retirement Date Fund
FRS 2030 Retirement Date Fund
FRS 2050 Retirement Date FundFRS 2055 Retirement Date Fund
Periods Ending 3/31/2018

AonInvestment advice and consulting services provided by Aon Hewitt Investment Consulting, Inc., an Aon Company. 24
Risk/Return Spectrum: Tier II
Observation: The FRS offers a sufficient range of passively managed options across the risk and return
spectrum for those participants who are focused on minimizing costs
FRS U.S. Bond Enhanced Index Fund
FRS U.S. Stock Market Index Fund
FRS Foreign Stock Index Fund
Periods Ending 3/31/2018
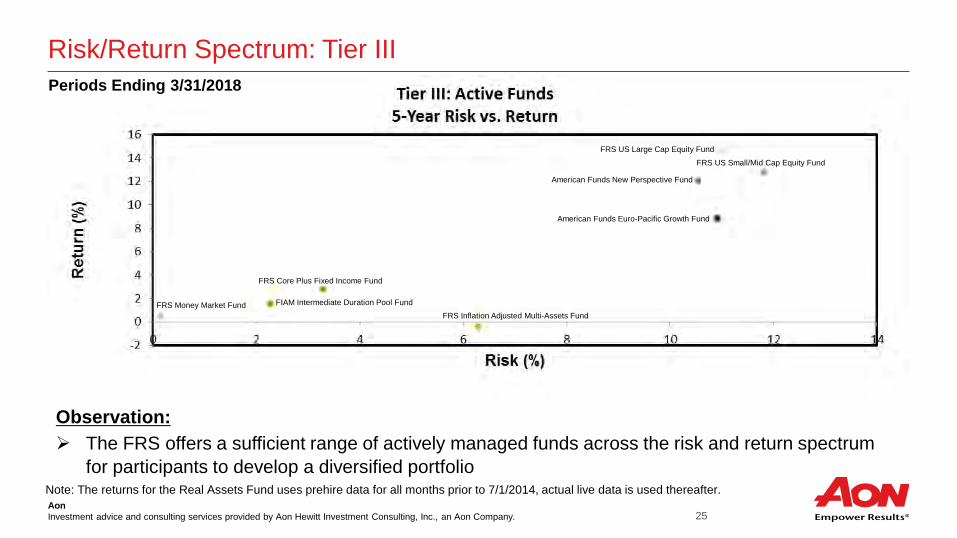
AonInvestment advice and consulting services provided by Aon Hewitt Investment Consulting, Inc., an Aon Company. 25
Observation: The FRS offers a sufficient range of actively managed funds across the risk and return spectrum
for participants to develop a diversified portfolio
Risk/Return Spectrum: Tier III
Note: The returns for the Real Assets Fund uses prehire data for all months prior to 7/1/2014, actual live data is used thereafter.
American Funds Euro-Pacific Growth Fund
FRS Core Plus Fixed Income Fund
FRS Money Market FundFRS Inflation Adjusted Multi-Assets Fund
FRS US Large Cap Equity FundFRS US Small/Mid Cap Equity Fund
FIAM Intermediate Duration Pool Fund
American Funds New Perspective Fund
Periods Ending 3/31/2018
Global Equity UpdateAlison Romano, Senior Investment Officer
Tim Taylor, Senior Investment Officer
Investment Advisory CouncilJune 11, 2018
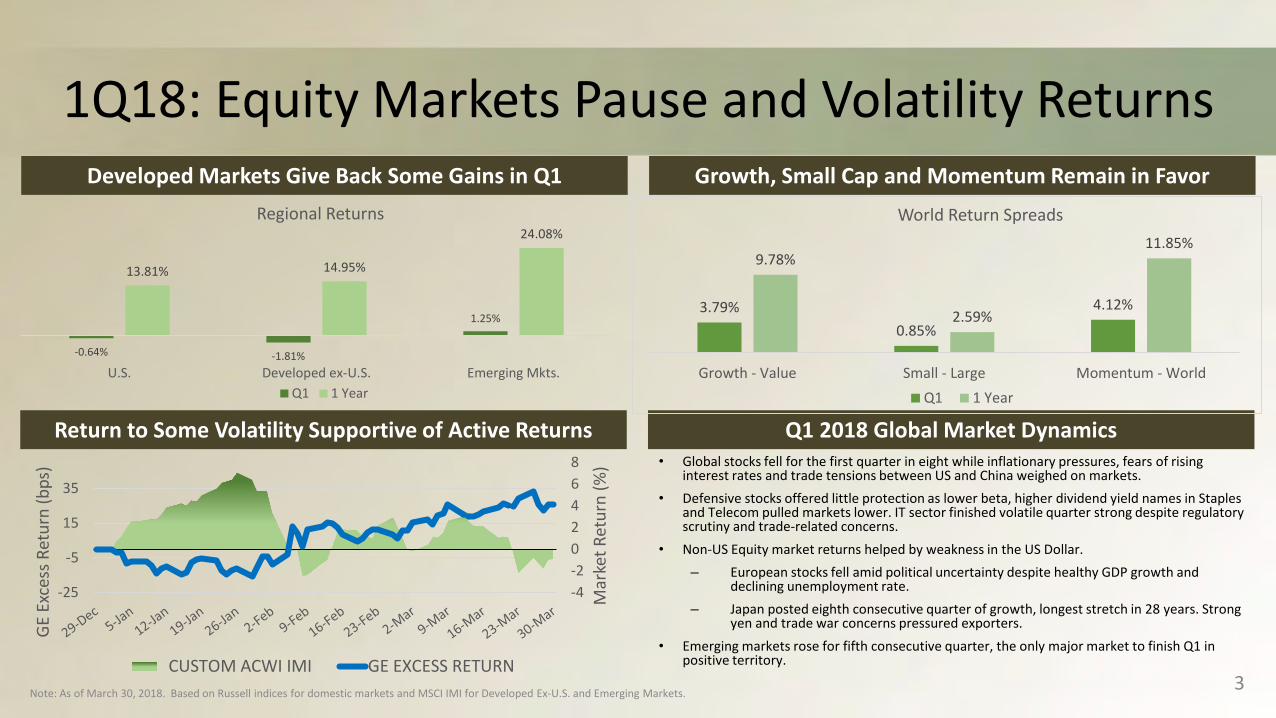
1Q18: Equity Markets Pause and Volatility Returns
• Global stocks fell for the first quarter in eight while inflationary pressures, fears of rising interest rates and trade tensions between US and China weighed on markets.
• Defensive stocks offered little protection as lower beta, higher dividend yield names in Staples and Telecom pulled markets lower. IT sector finished volatile quarter strong despite regulatory scrutiny and trade-related concerns.
• Non-US Equity market returns helped by weakness in the US Dollar. – European stocks fell amid political uncertainty despite healthy GDP growth and
declining unemployment rate. – Japan posted eighth consecutive quarter of growth, longest stretch in 28 years. Strong
yen and trade war concerns pressured exporters.• Emerging markets rose for fifth consecutive quarter, the only major market to finish Q1 in
positive territory.
3
Developed Markets Give Back Some Gains in Q1 Growth, Small Cap and Momentum Remain in Favor
Return to Some Volatility Supportive of Active Returns Q1 2018 Global Market Dynamics
Note: As of March 30, 2018. Based on Russell indices for domestic markets and MSCI IMI for Developed Ex-U.S. and Emerging Markets.
-4-202468
-25
-5
15
35
Mar
ket R
etur
n (%
)
GE
Exce
ss R
etur
n (b
ps)
CUSTOM ACWI IMI GE EXCESS RETURN
-0.64% -1.81%
1.25%
13.81% 14.95%
24.08%
U.S. Developed ex-U.S. Emerging Mkts.
Regional Returns
Q1 1 Year
3.79%0.85%
4.12%
9.78%
2.59%
11.85%
Growth - Value Small - Large Momentum - World
World Return Spreads
Q1 1 Year

Aggregate Performance Summary
4Note: All returns through 03/30/2018. Inception 7/1/10. Benchmark is Custom Iran Sudan Free ACWI IMI Index.
1Q17 FYTD CYTD 1 Yr 3 Yr 5 Yr Incept.Total Asset Class Return -0.64 10.81 -0.64 16.04 8.92 10.09 11.87
Benchmark -0.91 10.32 -0.91 15.04 8.29 9.38 10.94Excess Return 0.27 0.49 0.27 1.00 0.63 0.70 0.93Tracking Error 0.52 0.50 0.51
Return / Risk (IR) 1.09 1.26 1.61
0.00
0.20
0.40
0.60
0.80
1.00
1.20
QTD FYTD CYTD 1 Yr 3 Yr 5 Yr Incept.
ASSET CLASS EXCESS RETURN (%)
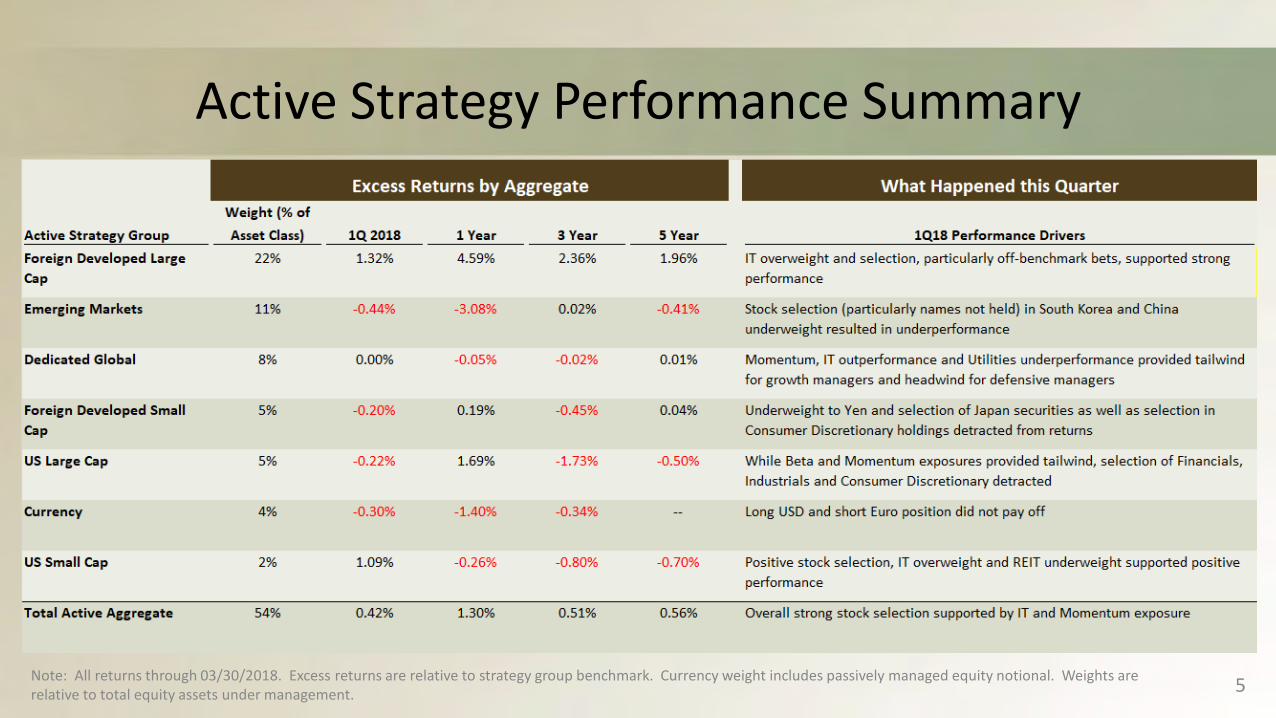
Active Strategy Performance Summary
5Note: All returns through 03/30/2018. Excess returns are relative to strategy group benchmark. Currency weight includes passively managed equity notional. Weights are relative to total equity assets under management.
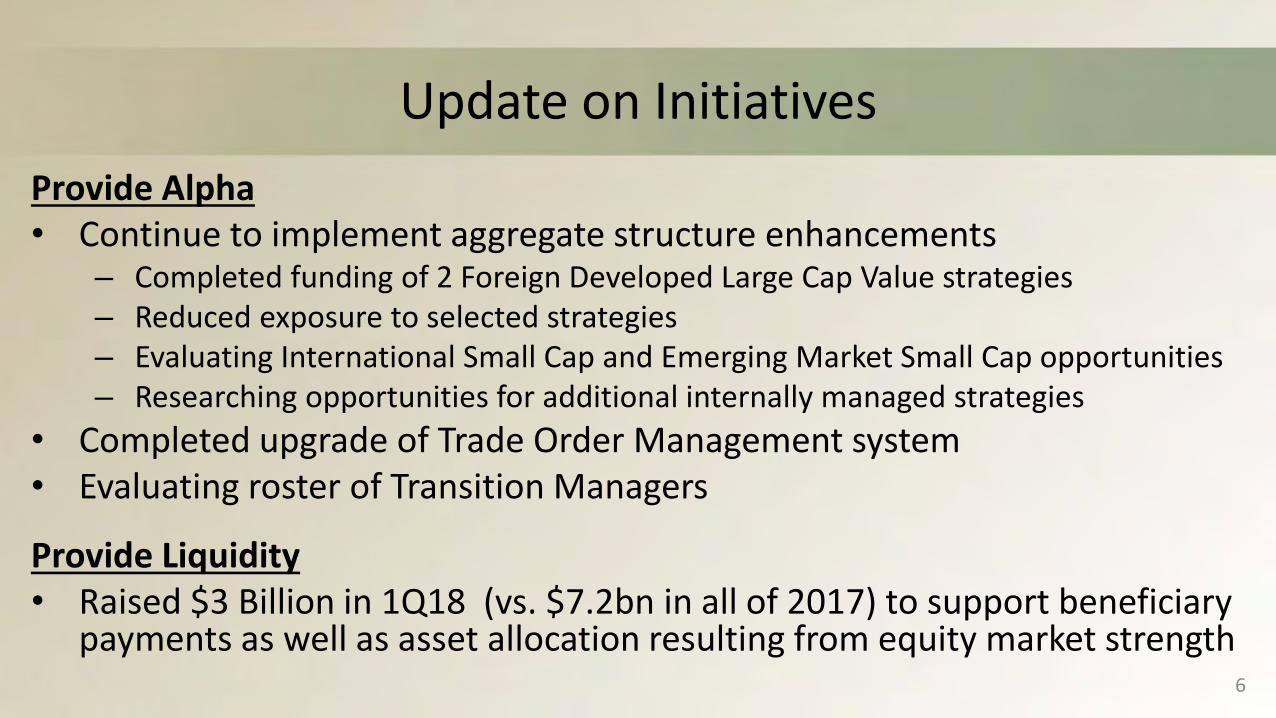
Update on InitiativesProvide Alpha• Continue to implement aggregate structure enhancements
– Completed funding of 2 Foreign Developed Large Cap Value strategies– Reduced exposure to selected strategies– Evaluating International Small Cap and Emerging Market Small Cap opportunities– Researching opportunities for additional internally managed strategies
• Completed upgrade of Trade Order Management system• Evaluating roster of Transition Managers
Provide Liquidity• Raised $3 Billion in 1Q18 (vs. $7.2bn in all of 2017) to support beneficiary
payments as well as asset allocation resulting from equity market strength6

State Board of Administration
Fixed Income Update Katy Wojciechowski
Senior Investment Officer Fixed Income
Investment Advisory CouncilJune 11, 2018
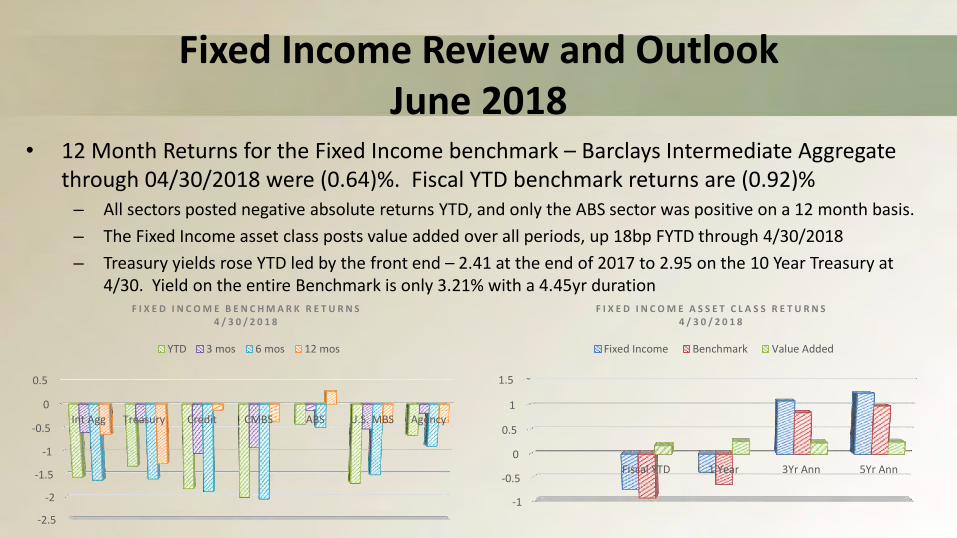
Fixed Income Review and OutlookJune 2018
• 12 Month Returns for the Fixed Income benchmark – Barclays Intermediate Aggregate through 04/30/2018 were (0.64)%. Fiscal YTD benchmark returns are (0.92)%
– All sectors posted negative absolute returns YTD, and only the ABS sector was positive on a 12 month basis.– The Fixed Income asset class posts value added over all periods, up 18bp FYTD through 4/30/2018– Treasury yields rose YTD led by the front end – 2.41 at the end of 2017 to 2.95 on the 10 Year Treasury at
4/30. Yield on the entire Benchmark is only 3.21% with a 4.45yr duration
-2.5
-2
-1.5
-1
-0.5
0
0.5
Int Agg Treasury Credit CMBS ABS U.S. MBS Agency
F I X E D I N C O M E B E N C H M A R K R E T U R N S4 / 3 0 / 2 0 1 8
YTD 3 mos 6 mos 12 mos
-1
-0.5
0
0.5
1
1.5
Fiscal YTD 1 Year 3Yr Ann 5Yr Ann
F I X E D I N C O M E A S S E T C L A S S R E T U R N S4 / 3 0 / 2 0 1 8
Fixed Income Benchmark Value Added
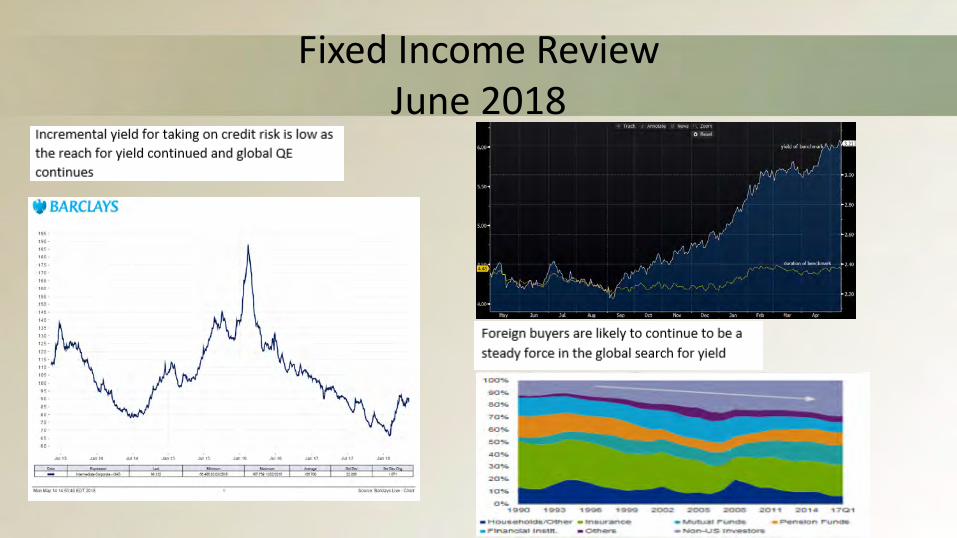
Fixed Income Review June 2018

Fixed Income Review and OutlookJune 2018

Looking Forward: Update on Recommendations from Mercer Structure Review
• Consider moving more assets in house • Moved additional funds into Internal Active portfolio
– SBA already possesses the needed infrastructure and internal staff to manage assets internally; taking the opportunity to use current resources while driving down costs
• Consider increasing active allocation• Moderately increased allocation to Internal Active portfolio• Increased allocation to Core Plus strategy – move from Passive• Enhancing some portfolio guidelines to allow for more risk to support increased risk
allocation• Consider adding dedicated exposure to out of benchmark structured products in a dedicated strategy
• Coordinated research with current managers continues – Consider opportunity to reduce risk to a rising rate environment within overall allocation
• Continue to take thoughtful, incremental approach to opportunistic investments• Researching several new portfolio strategies
6
Mercer’s Recommendations Support Fixed Income Structure and Workplan

State Board of Administration
Real Estate Update
Steve SpookSIO Real Estate
Investment Advisory Council MeetingJune 11, 2018

Total Real Estate Portfolio PerformanceData Through December 31, 2017
8.3%
10.1%11.6%
7.2%
9.2%10.3%
0%
2%
4%
6%
8%
10%
12%
14%
One Year Return Three Year Return Five Year Return
SBA RE Total Net Return SBA RE Primary Benchmark
Market Value $14,066 M
Source: The Townsend Group
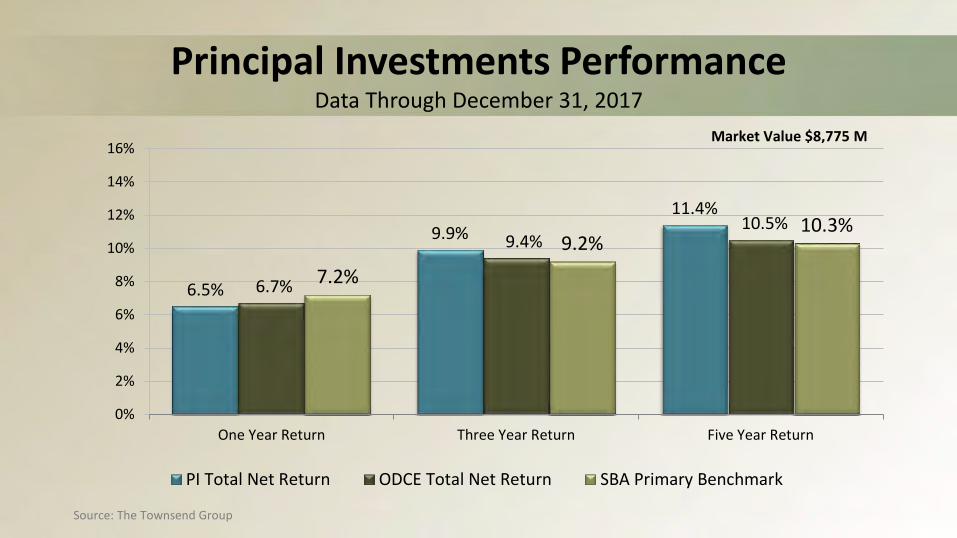
Principal Investments PerformanceData Through December 31, 2017
6.5%
9.9%11.4%
6.7%
9.4%10.5%
7.2%9.2%
10.3%
0%
2%
4%
6%
8%
10%
12%
14%
16%
One Year Return Three Year Return Five Year Return
PI Total Net Return ODCE Total Net Return SBA Primary Benchmark
Market Value $8,775 M
Source: The Townsend Group

Externally Managed Portfolio PerformanceData Through December 31, 2017
11.4%10.3%
11.9%
8.1% 8.7%9.9%
7.2%
9.2%10.3%
0%
2%
4%
6%
8%
10%
12%
14%
One Year Return Three Year Return Five Year Return
EMP Total Net Return External Custom Benchmark Net Return SBAF Primary Benchmark
Market Value $5,291 M
Source: The Townsend Group

Real Estate PortfolioSector Allocation
Private90%
Public10%
Total RE Portfolio
Core80%
Non-Core20%
Private Market
Cash1.4%
Private Equity6.5%
Strategic Inv.8.2%
Real Estate8.6%
Fixed Income17.6%
Global Equities57.7%
Florida Retirement SystemDefined Benefit Fund
Source: IBP 12/31/17 Report
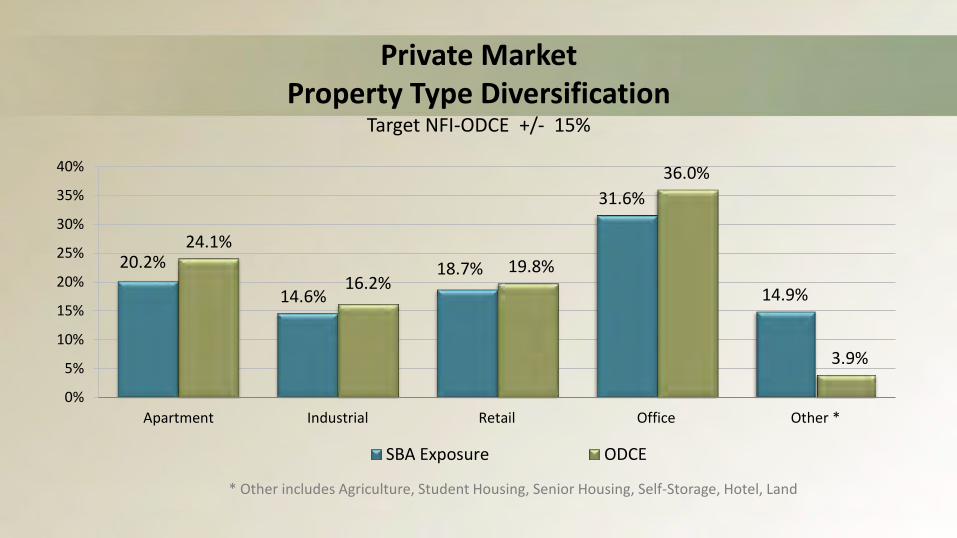
Private MarketProperty Type Diversification
Target NFI-ODCE +/- 15%
20.2%
14.6%18.7%
31.6%
14.9%
24.1%
16.2%19.8%
36.0%
3.9%
0%
5%
10%
15%
20%
25%
30%
35%
40%
Apartment Industrial Retail Office Other *
* Other includes Agriculture, Student Housing, Senior Housing, Self-Storage, Hotel, Land
SBA Exposure ODCE

Private MarketGeographic Diversification
Target NFI-ODCE +/- 15%
29.8%
5.8%
18.8%
41.2%
4.4%
31.1%
9.4%
18.4%
41.2%
0%0%
10%
20%
30%
40%
50%
East Midwest South West Other *
* Other includes International Investments
SBA Exposure ODCE
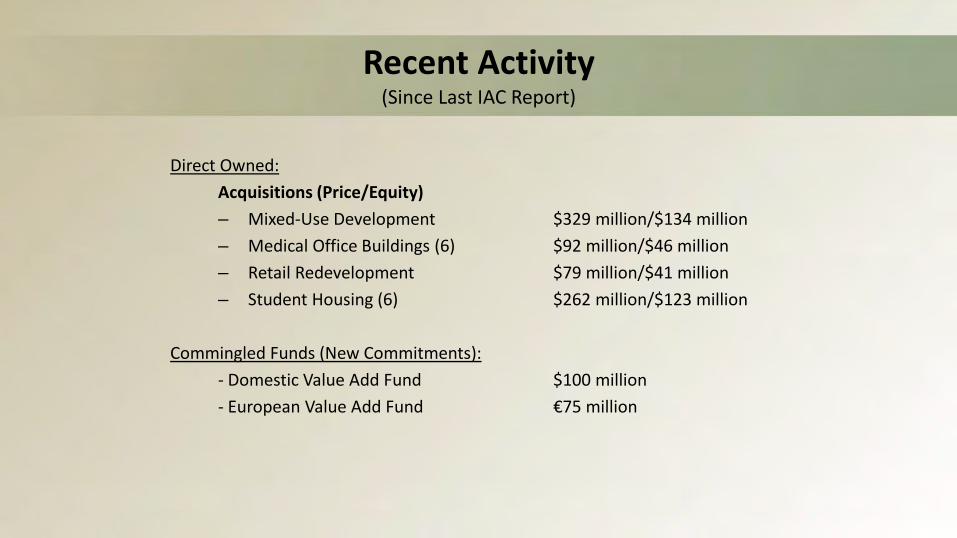
Recent Activity(Since Last IAC Report)
Direct Owned:Acquisitions (Price/Equity)– Mixed-Use Development $329 million/$134 million– Medical Office Buildings (6) $92 million/$46 million– Retail Redevelopment $79 million/$41 million– Student Housing (6) $262 million/$123 million
Commingled Funds (New Commitments):- Domestic Value Add Fund $100 million- European Value Add Fund €75 million

State Board of Administration
Strategic Investments Asset Class Review
Trent Webster Senior Investment Officer, Strategic Investments & Private Equity
Investment Advisory Council Meeting
June 11, 2018
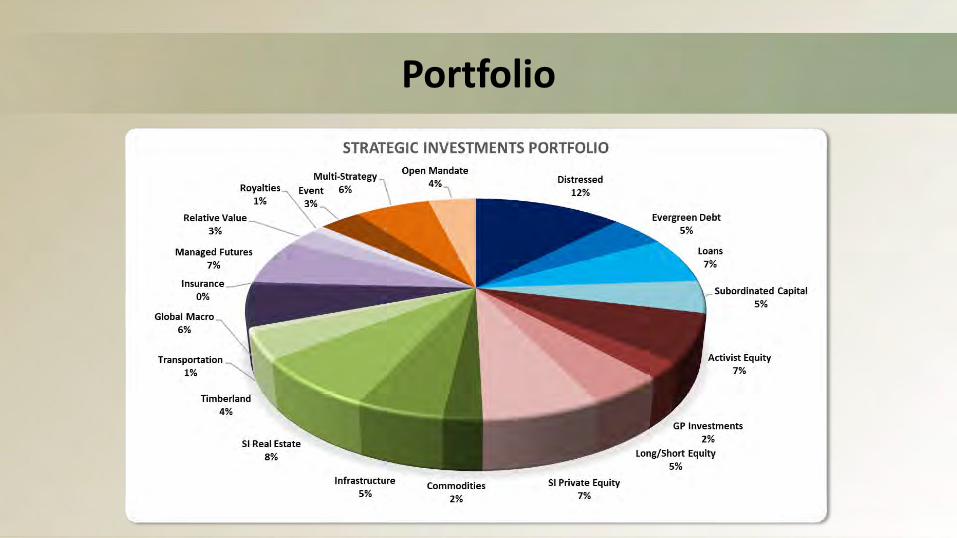
Portfolio

Portfolio

Gross and Net Exposures

Performance
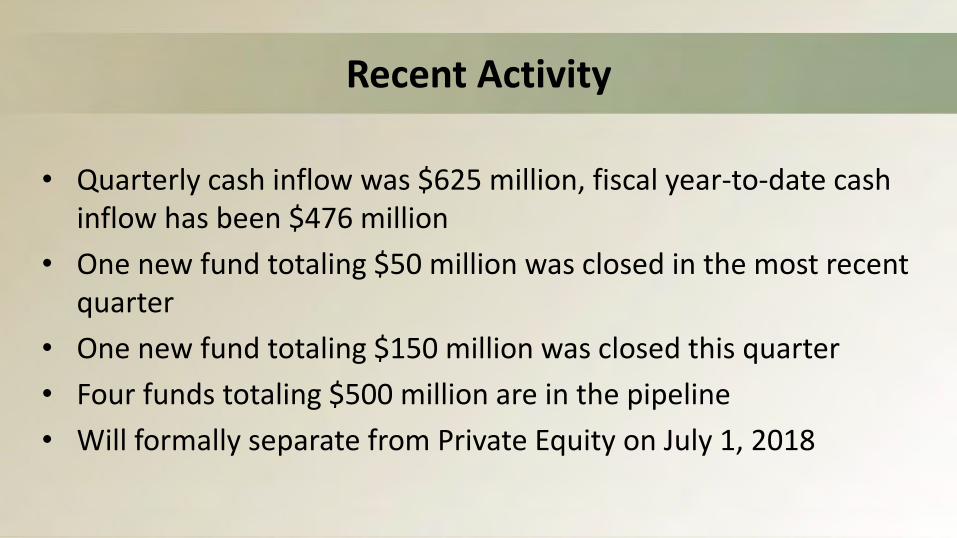
Recent Activity
• Quarterly cash inflow was $625 million, fiscal year-to-date cash inflow has been $476 million
• One new fund totaling $50 million was closed in the most recent quarter
• One new fund totaling $150 million was closed this quarter• Four funds totaling $500 million are in the pipeline• Will formally separate from Private Equity on July 1, 2018
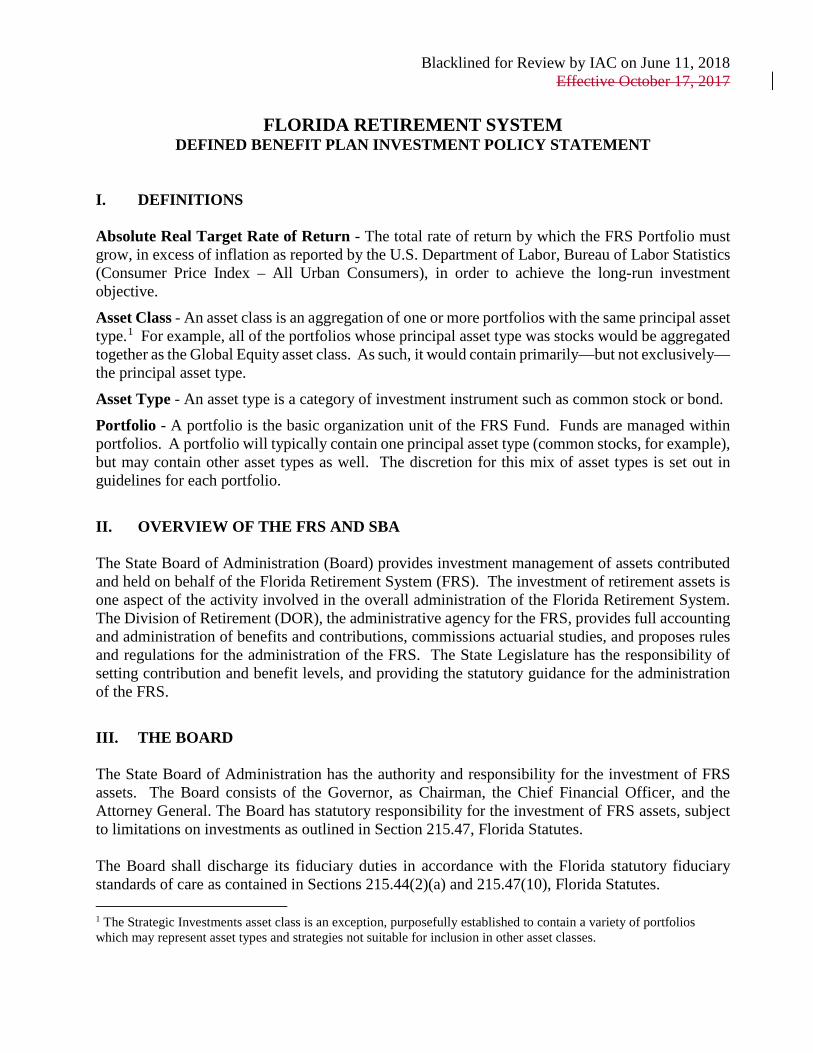
Blacklined for Review by IAC on June 11, 2018 Effective October 17, 2017
FLORIDA RETIREMENT SYSTEM DEFINED BENEFIT PLAN INVESTMENT POLICY STATEMENT
I. DEFINITIONS Absolute Real Target Rate of Return - The total rate of return by which the FRS Portfolio must grow, in excess of inflation as reported by the U.S. Department of Labor, Bureau of Labor Statistics (Consumer Price Index – All Urban Consumers), in order to achieve the long-run investment objective. Asset Class - An asset class is an aggregation of one or more portfolios with the same principal asset type.1 For example, all of the portfolios whose principal asset type was stocks would be aggregated together as the Global Equity asset class. As such, it would contain primarily—but not exclusively—the principal asset type. Asset Type - An asset type is a category of investment instrument such as common stock or bond. Portfolio - A portfolio is the basic organization unit of the FRS Fund. Funds are managed within portfolios. A portfolio will typically contain one principal asset type (common stocks, for example), but may contain other asset types as well. The discretion for this mix of asset types is set out in guidelines for each portfolio.
II. OVERVIEW OF THE FRS AND SBA The State Board of Administration (Board) provides investment management of assets contributed and held on behalf of the Florida Retirement System (FRS). The investment of retirement assets is one aspect of the activity involved in the overall administration of the Florida Retirement System. The Division of Retirement (DOR), the administrative agency for the FRS, provides full accounting and administration of benefits and contributions, commissions actuarial studies, and proposes rules and regulations for the administration of the FRS. The State Legislature has the responsibility of setting contribution and benefit levels, and providing the statutory guidance for the administration of the FRS.
III. THE BOARD The State Board of Administration has the authority and responsibility for the investment of FRS assets. The Board consists of the Governor, as Chairman, the Chief Financial Officer, and the Attorney General. The Board has statutory responsibility for the investment of FRS assets, subject to limitations on investments as outlined in Section 215.47, Florida Statutes. The Board shall discharge its fiduciary duties in accordance with the Florida statutory fiduciary standards of care as contained in Sections 215.44(2)(a) and 215.47(10), Florida Statutes. 1 The Strategic Investments asset class is an exception, purposefully established to contain a variety of portfolios which may represent asset types and strategies not suitable for inclusion in other asset classes.
Blacklined for Review by IAC on June 11, 2018 Effective October 17, 2017
2
The Board delegates to the Executive Director the administrative and investment authority, within the statutory limitations and rules, to manage the investment of FRS assets. An Investment Advisory Council (IAC) is appointed by the Board. The IAC meets quarterly, and is charged with the review and study of general portfolio objectives, policies and strategies, including a review of investment performance. The mission of the State Board of Administration is to provide superior investment management and trust services by proactively and comprehensively managing risk and adhering to the highest ethical, fiduciary and professional standards.
IV. THE EXECUTIVE DIRECTOR The Executive Director is charged with the responsibility for managing and directing administrative, personnel, budgeting, and investment functions, including the strategic and tactical allocation of investment assets. The Executive Director is charged with developing specific individual investment portfolio objectives and policy guidelines, and providing the Board with monthly and quarterly reports of investment activities. The Executive Director has investment responsibility for maintaining diversified portfolios, and maximizing returns with respect to the broad diversified market standards of individual asset classes, consistent with appropriate risk constraints. The Executive Director will develop policies and procedures to:
• Identify, monitor and control/mitigate key investment and operational risks.
• Maintain an appropriate and effective risk management and compliance program that identifies, evaluates and manages risks within business units and at the enterprise level.
• Maintain an appropriate and effective control environment for SBA investment and operational responsibilities.
• Approve risk allocations and limits, including total fund and asset class risk budgets. The Executive Director will appoint a Chief Risk and Compliance Officer, whose selection, compensation and termination will be affirmed by the Board, to assist in the execution of the responsibilities enumerated in the preceding list. For day-to-day executive and administrative purposes, the Chief Risk and Compliance Officer will proactively work with the Executive Director and designees to ensure that issues are promptly and thoroughly addressed by management. On at least a quarterly basis, the Chief Risk and Compliance Officer will provide reports to the Investment Advisory Council, Audit Committee and Board and is authorized to directly access these bodies at

Blacklined for Review by IAC on June 11, 2018 Effective October 17, 2017
3
any time as appropriate to ensure the integrity and effectiveness of risk management and compliance functions. Pursuant to written SBA policy, the Executive Director will organize an Investment Oversight Group(s) to regularly review, document and formally escalate guideline compliance exceptions and events that may have a material impact on the Trust Fund. The Executive Director is delegated the authority and responsibility to prudently address any such compliance exceptions, with input from the Investment Advisory Council and Audit Committee as necessary and appropriate, unless otherwise required in this Investment Policy Statement. The Executive Director is responsible for evaluating the appropriateness of the goals and objectives in this Plan in light of actuarial studies and recommending changes to the Board when appropriate.
V. INVESTMENT OBJECTIVES The investment objective of the Board is to provide investment returns sufficient for the plan to be maintained in a manner that ensures the timely payment of promised benefits to current and future participants and keeps the plan cost at a reasonable level. To achieve this, a long-term real return approximating 4.05% per annum (compounded and net of investment expenses) should be attained. As additional considerations, the Board seeks to avoid excessive risk in long-term cost trends. To manage these risks, the volatility of annual returns should be reasonably controlled. The Board's principal means for achieving this goal is through investment directives to the Executive Director. The main object of these investment directives is the asset class. The Board directs the Executive Director to manage the asset classes in ways that, in the Board's opinion, will maximize the likelihood of achieving the Board's investment objective within an appropriate risk management framework. The Board establishes asset classes, sets target allocations and reasonable ranges around them for each and establishes performance benchmarks for them. In addition, it establishes a performance benchmark for the total portfolio.
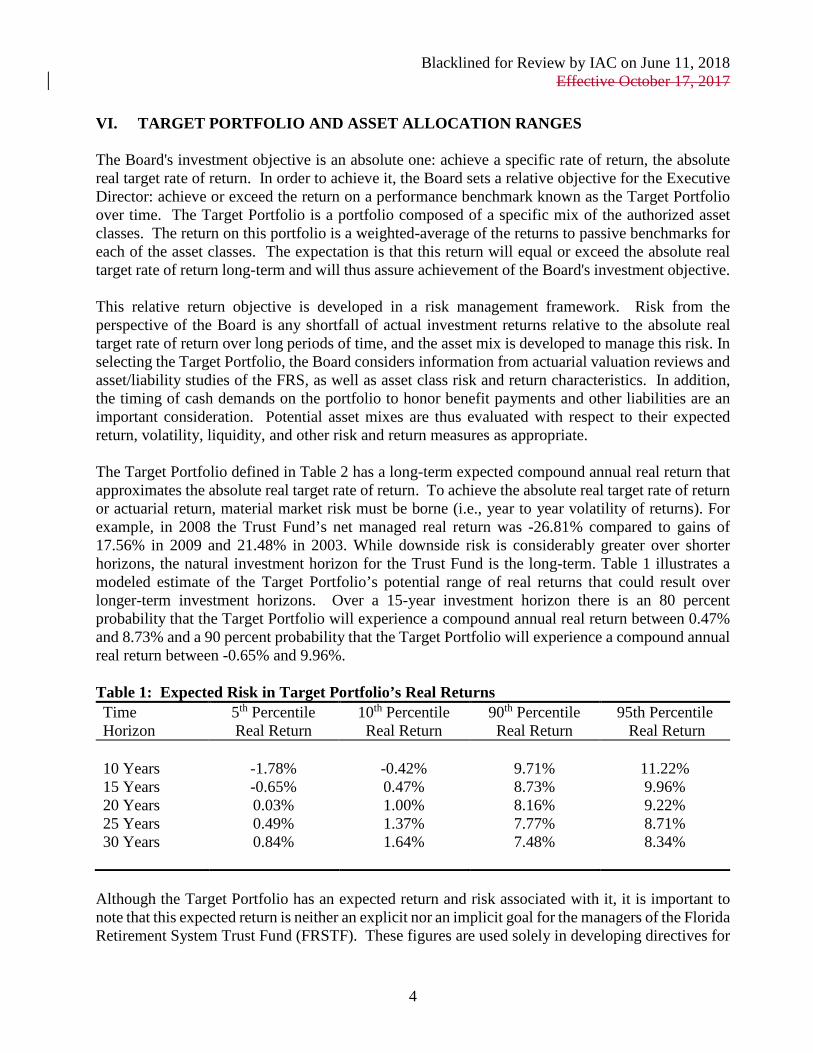
Blacklined for Review by IAC on June 11, 2018 Effective October 17, 2017
4
VI. TARGET PORTFOLIO AND ASSET ALLOCATION RANGES The Board's investment objective is an absolute one: achieve a specific rate of return, the absolute real target rate of return. In order to achieve it, the Board sets a relative objective for the Executive Director: achieve or exceed the return on a performance benchmark known as the Target Portfolio over time. The Target Portfolio is a portfolio composed of a specific mix of the authorized asset classes. The return on this portfolio is a weighted-average of the returns to passive benchmarks for each of the asset classes. The expectation is that this return will equal or exceed the absolute real target rate of return long-term and will thus assure achievement of the Board's investment objective. This relative return objective is developed in a risk management framework. Risk from the perspective of the Board is any shortfall of actual investment returns relative to the absolute real target rate of return over long periods of time, and the asset mix is developed to manage this risk. In selecting the Target Portfolio, the Board considers information from actuarial valuation reviews and asset/liability studies of the FRS, as well as asset class risk and return characteristics. In addition, the timing of cash demands on the portfolio to honor benefit payments and other liabilities are an important consideration. Potential asset mixes are thus evaluated with respect to their expected return, volatility, liquidity, and other risk and return measures as appropriate. The Target Portfolio defined in Table 2 has a long-term expected compound annual real return that approximates the absolute real target rate of return. To achieve the absolute real target rate of return or actuarial return, material market risk must be borne (i.e., year to year volatility of returns). For example, in 2008 the Trust Fund’s net managed real return was -26.81% compared to gains of 17.56% in 2009 and 21.48% in 2003. While downside risk is considerably greater over shorter horizons, the natural investment horizon for the Trust Fund is the long-term. Table 1 illustrates a modeled estimate of the Target Portfolio’s potential range of real returns that could result over longer-term investment horizons. Over a 15-year investment horizon there is an 80 percent probability that the Target Portfolio will experience a compound annual real return between 0.47% and 8.73% and a 90 percent probability that the Target Portfolio will experience a compound annual real return between -0.65% and 9.96%. Table 1: Expected Risk in Target Portfolio’s Real Returns Time Horizon
5th Percentile Real Return
10th Percentile Real Return
90th Percentile Real Return
95th Percentile Real Return
10 Years -1.78% -0.42% 9.71% 11.22% 15 Years -0.65% 0.47% 8.73% 9.96% 20 Years 0.03% 1.00% 8.16% 9.22% 25 Years 0.49% 1.37% 7.77% 8.71% 30 Years 0.84% 1.64% 7.48% 8.34%
Although the Target Portfolio has an expected return and risk associated with it, it is important to note that this expected return is neither an explicit nor an implicit goal for the managers of the Florida Retirement System Trust Fund (FRSTF). These figures are used solely in developing directives for

Blacklined for Review by IAC on June 11, 2018 Effective October 17, 2017
5
fund management that will raise the probability of success in achieving the absolute real target rate of return. The Executive Director is held responsible not for specifically achieving the absolute real target rate of return in each period, but rather for doing at least as well as the market using the Target Portfolio's mix of assets. In pursuit of incremental investment returns, the Executive Director may vary the asset mix from the target allocation based on market conditions and the investment environment for the individual asset classes. The Executive Director shall adopt an asset allocation policy guideline which specifies the process for making these tactical decisions. The guideline shall concentrate on the analysis of economic conditions, the absolute values of asset class investments and the relative values between asset classes. The Board establishes ranges for tactical allocations, as shown in Table 2.
Table 2: Authorized Asset Classes, Target Allocations and Policy Ranges
Asset Class Target Allocation Policy Range Low Policy Range
High Global Equity 53% 45% 70% Fixed Income 18% 10% 26% Real Estate 10% 4% 16% Private Equity 6% 2% 9% Strategic Investments 12% 0% 16% Cash Equivalents 1% 0.25% 5% Total Fund 100% -- --
For purposes of determining compliance with these policy ranges, an asset class is considered to be an aggregation of one or more portfolios with substantially the same principal asset type.2 An asset type is a category of investment instrument such as common stock or bond. For example, all of the portfolios whose principal asset type is bonds would be aggregated together as the Fixed Income asset class. As such, it would contain primarily—but not exclusively—the principal asset type. As a standard management practice, portfolio managers are expected to meet their goals for all assets allocated to their portfolio. It is expected that the FRS Portfolio will be managed in such a way that the actual allocation mix will remain within these ranges. Investment strategies or market conditions which result in an allocation position for any asset class outside of the enumerated ranges for a period exceeding thirty
2 The Strategic Investments asset class is an exception, purposefully established to potentially contain a variety of portfolios which may represent asset types and strategies not suitable for inclusion in other asset classes.

Blacklined for Review by IAC on June 11, 2018 Effective October 17, 2017
6
(30) consecutive business days shall be reported to the Board, together with a review of conditions causing the persistent deviation and a recommendation for subsequent investment action. The asset allocation is established in concert with the investment objective, capital market expectations, projected actuarial liabilities, and resulting cash flows. Table 3 indicates estimated net cash flows (benefit payments less employer and employee contributions) and associated probabilities that are implicit in this policy statement, assuming the Legislature adheres to system funding provisions in current law. Additionally, the annualized income yield of the fund is projected to approximate 2% to 3%. Table 3: Estimated Net Cash Outflow ($ millions/ % Fund)
In 5 Years
In 10 Years
10th Percentile $ 4,851 3.67% $ 3,497 3.14% 25th Percentile $ 6,776 4.15% $ 6,329 4.03% Median $ 7,466 4.54% $ 8,523 4.60% 75th Percentile $ 8,079 5.04% $ 11,561 5.22% 90th Percentile $ 10,690 5.96% $ 12,895 6.27%
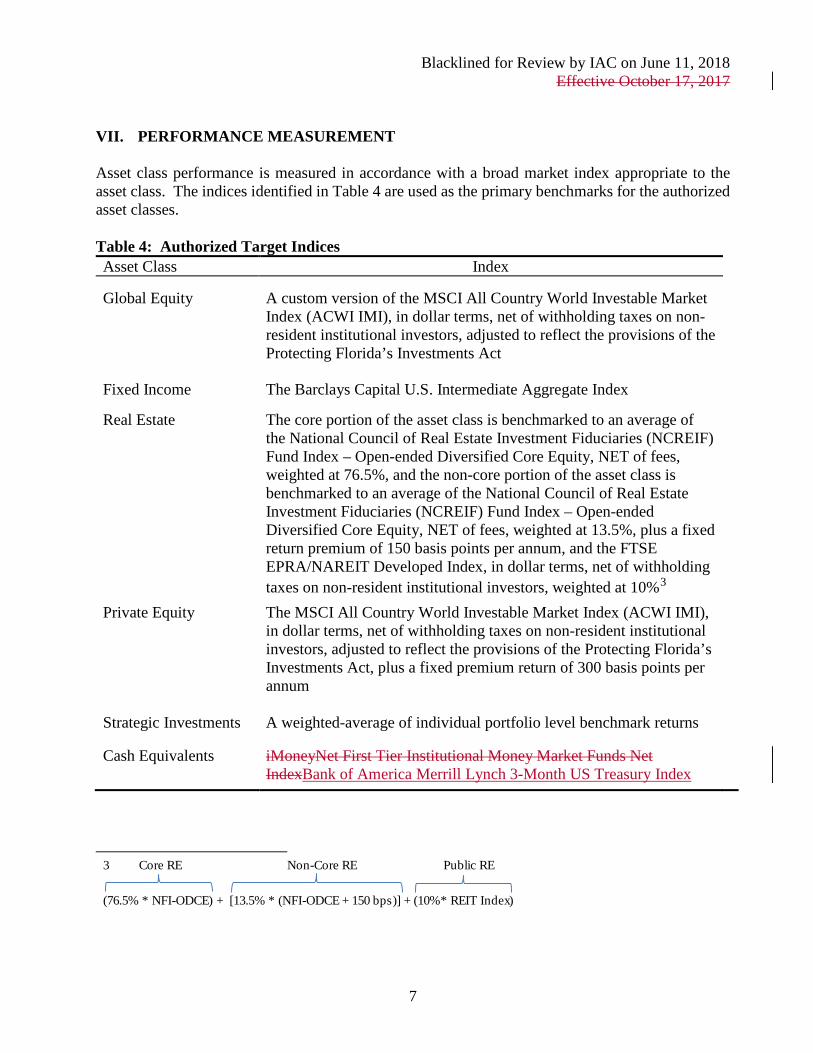
Blacklined for Review by IAC on June 11, 2018 Effective October 17, 2017
7
VII. PERFORMANCE MEASUREMENT
Asset class performance is measured in accordance with a broad market index appropriate to the asset class. The indices identified in Table 4 are used as the primary benchmarks for the authorized asset classes. Table 4: Authorized Target Indices Asset Class Index Global Equity A custom version of the MSCI All Country World Investable Market
Index (ACWI IMI), in dollar terms, net of withholding taxes on non-resident institutional investors, adjusted to reflect the provisions of the Protecting Florida’s Investments Act
Fixed Income The Barclays Capital U.S. Intermediate Aggregate Index
Real Estate The core portion of the asset class is benchmarked to an average of the National Council of Real Estate Investment Fiduciaries (NCREIF) Fund Index – Open-ended Diversified Core Equity, NET of fees, weighted at 76.5%, and the non-core portion of the asset class is benchmarked to an average of the National Council of Real Estate Investment Fiduciaries (NCREIF) Fund Index – Open-ended Diversified Core Equity, NET of fees, weighted at 13.5%, plus a fixed return premium of 150 basis points per annum, and the FTSE EPRA/NAREIT Developed Index, in dollar terms, net of withholding taxes on non-resident institutional investors, weighted at 10%3
Private Equity The MSCI All Country World Investable Market Index (ACWI IMI), in dollar terms, net of withholding taxes on non-resident institutional investors, adjusted to reflect the provisions of the Protecting Florida’s Investments Act, plus a fixed premium return of 300 basis points per annum
Strategic Investments A weighted-average of individual portfolio level benchmark returns
Cash Equivalents iMoneyNet First Tier Institutional Money Market Funds Net IndexBank of America Merrill Lynch 3-Month US Treasury Index
3
3 Core RE Public RE
(76.5% * NFI-ODCE) + [13.5% * (NFI-ODCE + 150 bps)] + (10%* REIT Index)
Non-Core RE
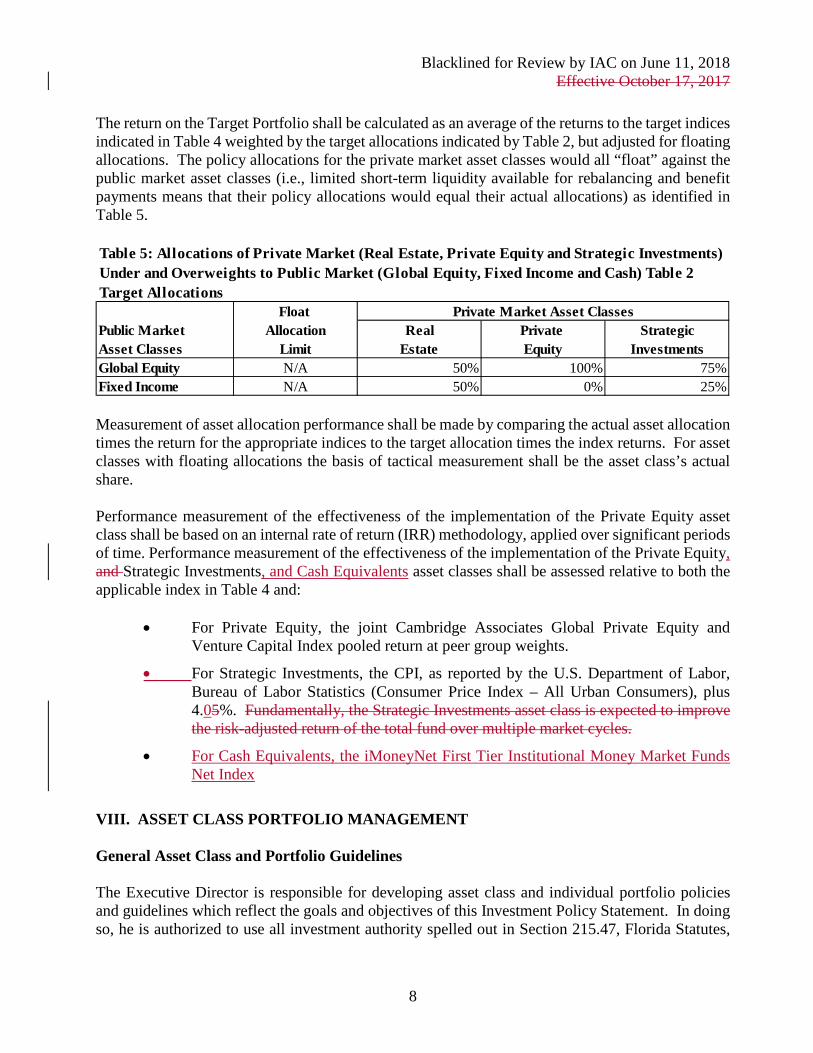
Blacklined for Review by IAC on June 11, 2018 Effective October 17, 2017
8
The return on the Target Portfolio shall be calculated as an average of the returns to the target indices indicated in Table 4 weighted by the target allocations indicated by Table 2, but adjusted for floating allocations. The policy allocations for the private market asset classes would all “float” against the public market asset classes (i.e., limited short-term liquidity available for rebalancing and benefit payments means that their policy allocations would equal their actual allocations) as identified in Table 5.
Measurement of asset allocation performance shall be made by comparing the actual asset allocation times the return for the appropriate indices to the target allocation times the index returns. For asset classes with floating allocations the basis of tactical measurement shall be the asset class’s actual share. Performance measurement of the effectiveness of the implementation of the Private Equity asset class shall be based on an internal rate of return (IRR) methodology, applied over significant periods of time. Performance measurement of the effectiveness of the implementation of the Private Equity, and Strategic Investments, and Cash Equivalents asset classes shall be assessed relative to both the applicable index in Table 4 and:
• For Private Equity, the joint Cambridge Associates Global Private Equity and Venture Capital Index pooled return at peer group weights.
• For Strategic Investments, the CPI, as reported by the U.S. Department of Labor, Bureau of Labor Statistics (Consumer Price Index – All Urban Consumers), plus 4.05%. Fundamentally, the Strategic Investments asset class is expected to improve the risk-adjusted return of the total fund over multiple market cycles.
• For Cash Equivalents, the iMoneyNet First Tier Institutional Money Market Funds Net Index
VIII. ASSET CLASS PORTFOLIO MANAGEMENT General Asset Class and Portfolio Guidelines The Executive Director is responsible for developing asset class and individual portfolio policies and guidelines which reflect the goals and objectives of this Investment Policy Statement. In doing so, he is authorized to use all investment authority spelled out in Section 215.47, Florida Statutes,
Table 5: Allocations of Private Market (Real Estate, Private Equity and Strategic Investments) Under and Overweights to Public Market (Global Equity, Fixed Income and Cash) Table 2 Target Allocations
Float Public Market Allocation Real Private StrategicAsset Classes Limit Estate Equity InvestmentsGlobal Equity N/A 50% 100% 75%Fixed Income N/A 50% 0% 25%
Private Market Asset Classes

Blacklined for Review by IAC on June 11, 2018 Effective October 17, 2017
9
except as limited by this Plan or SBA Rules. The Executive Director shall develop guidelines for the selection and retention of portfolios, and shall manage all external contractual relationships in accordance with the fiduciary responsibilities of the Board. All asset classes shall be invested to achieve or exceed the return on their respective benchmarks over a long period of time. To obtain appropriate compensation for associated performance risks:
• Public market asset classes shall be well diversified with respect to their benchmarks and have a reliance on low cost passive strategies scaled according to the degree of efficiency in underlying securities markets, capacity in effective active strategies, and ongoing total fund liquidity requirements.
• Private Equity, Real Estate and Strategic Investments asset classes shall utilize a prudent process to maximize long-term access to attractive risk-adjusted investment opportunities through use of business partners with appropriate: o Financial, operational and investment expertise and resources; o Alignment of interests; o Transparency and repeatability of investment process; and o Controls on leverage.
Strategic Investments Guidelines The objective of the asset class is to proactively identify and utilize non-traditional and multi-asset class investments, on an opportunistic and strategic basis, in order to accomplish one or more of the following:
• Generate long-term incremental returns in excess of a 4.05% annualized real rate of return, commensurate with risk.
• Diversify Reduce the volatility of FRS Pension Plan assets and improve the FRS Pension Plan’s risk-adjusted return over multiple market cycles.
• Provide a potential hedge against inflation.Outperform the FRS Pension Plan during periods of significant market declines.
• Increase investment flexibility, across market environments, in order to access evolving or opportunistic investments outside of traditional asset classes and effective risk-adjusted portfolio management strategies.
Strategic Investments may include, but not be limited to, direct investments authorized by s. 215.47, Florida Statutes or investments in capital commitment partnerships, hedge funds or other vehicles that make or involve non-traditional, opportunistic and/or long or short investments in marketable
Blacklined for Review by IAC on June 11, 2018 Effective October 17, 2017
10
and nonmarketable debt, equity, and/or real assets (e.g., real estate, infrastructure, or commodities). Leverage may be utilized subject to appropriate controls. Other Guidelines The Executive Director shall develop and implement policies as appropriate for the orderly and effective implementation of the provisions of Chapter 2007-88, Laws of Florida, the “Protecting Florida’s Investments Act.” Actions taken and determinations made pursuant to said policies are hereby incorporated by reference into this Investment Policy Statement, as required by subsection 215.473(6), Florida Statutes. The Executive Director shall develop and implement policies as appropriate for the orderly and effective implementation of the provisions of Chapter 2016-36, Laws of Florida, an act relating to companies that boycott Israel. Actions taken and determinations made pursuant to said policies are hereby incorporated by reference into this Investment Policy Statement, as required by subsection 215.4725(5), Florida Statutes. The Executive Director shall develop and implement policies as appropriate for the orderly and effective implementation of the provisions of Chapter 2018-125, Laws of Florida, an act relating to state investments in or with the government of Venezuela. Actions taken and determinations made pursuant to said policies are hereby incorporated by reference into this Investment Policy Statement, as required by subsection 215.475(3)(a), Florida Statutes. Subsection 215.475(3)(a) Florida Statutes is consistent with the Resolution adopted by the Trustees of the Board on August 16, 2017. At that meeting, the Board also included in the Resolution the specific direction that the SBA include in this Investment Policy Statement upon review of the IAC in accordance with Section 215.475(2) Florida Statutes, the following: “The SBA will not vote in favor of any proxy resolution advocating the support of the Maduro Regime in Venezuela.” On August 16, 2017, the Trustees of the Board adopted a Resolution directing the following (the “Venezuela Resolution”) be included in this Investment Policy Statement upon review of the IAC in accordance with Section 215.475(2), Florida Statutes: 1. Prohibited Investments. Until such as time as the SBA determines it is otherwise prudent to do so, the SBA is prohibited from investing in: (a) any financial institution or company domiciled in the United States, or foreign subsidiary of a company domiciled in the United States, which directly or through a United States or foreign subsidiary and in violation of federal law, makes any loan, extends credit of any kind or character, advances funds in any manner, or purchases or trades any goods or services in or with the government of Venezuela; and (b) any securities issued by the government of Venezuela or any company that is majority-owned by the government of Venezuela. 2. Proxy Voting. The SBA will not vote in favor of any proxy resolution advocating the support of the Maduro Regime in Venezuela. The Executive Director shall develop and implement policies as appropriate for the orderly and effective implementing of the Venezuela Resolution. Actions taken and determinations made
Blacklined for Review by IAC on June 11, 2018 Effective October 17, 2017
11
pursuant to said policies are hereby incorporated by reference into this Investment Policy Statement.
IX. REPORTING The Board directs the Executive Director to coordinate the preparation of quarterly reports of the investment performance of the FRS by the Board's independent performance evaluation consultant. The following formal periodic reports to the Board shall be the responsibility of the Executive Director:
• An annual report on the SBA and its investment portfolios, including that of the FRS.
• A monthly report on performance and investment actions taken.
• Special investment reports pursuant to Section 215.44-215.53, Florida Statutes.
X. IMPLEMENTATION SCHEDULE This policy statement shall be effective upon approval by the Board July 1, 2018.

Final for Adoption by IAC on June 11, 2018
FLORIDA RETIREMENT SYSTEM DEFINED BENEFIT PLAN INVESTMENT POLICY STATEMENT
I. DEFINITIONS Absolute Real Target Rate of Return - The total rate of return by which the FRS Portfolio must grow, in excess of inflation as reported by the U.S. Department of Labor, Bureau of Labor Statistics (Consumer Price Index – All Urban Consumers), in order to achieve the long-run investment objective. Asset Class - An asset class is an aggregation of one or more portfolios with the same principal asset type.1 For example, all of the portfolios whose principal asset type was stocks would be aggregated together as the Global Equity asset class. As such, it would contain primarily—but not exclusively—the principal asset type. Asset Type - An asset type is a category of investment instrument such as common stock or bond. Portfolio - A portfolio is the basic organization unit of the FRS Fund. Funds are managed within portfolios. A portfolio will typically contain one principal asset type (common stocks, for example), but may contain other asset types as well. The discretion for this mix of asset types is set out in guidelines for each portfolio.
II. OVERVIEW OF THE FRS AND SBA The State Board of Administration (Board) provides investment management of assets contributed and held on behalf of the Florida Retirement System (FRS). The investment of retirement assets is one aspect of the activity involved in the overall administration of the Florida Retirement System. The Division of Retirement (DOR), the administrative agency for the FRS, provides full accounting and administration of benefits and contributions, commissions actuarial studies, and proposes rules and regulations for the administration of the FRS. The State Legislature has the responsibility of setting contribution and benefit levels, and providing the statutory guidance for the administration of the FRS.
III. THE BOARD The State Board of Administration has the authority and responsibility for the investment of FRS assets. The Board consists of the Governor, as Chairman, the Chief Financial Officer, and the Attorney General. The Board has statutory responsibility for the investment of FRS assets, subject to limitations on investments as outlined in Section 215.47, Florida Statutes. The Board shall discharge its fiduciary duties in accordance with the Florida statutory fiduciary standards of care as contained in Sections 215.44(2)(a) and 215.47(10), Florida Statutes. 1 The Strategic Investments asset class is an exception, purposefully established to contain a variety of portfolios which may represent asset types and strategies not suitable for inclusion in other asset classes.

Final for Adoption by IAC on June 11, 2018
2
The Board delegates to the Executive Director the administrative and investment authority, within the statutory limitations and rules, to manage the investment of FRS assets. An Investment Advisory Council (IAC) is appointed by the Board. The IAC meets quarterly, and is charged with the review and study of general portfolio objectives, policies and strategies, including a review of investment performance. The mission of the State Board of Administration is to provide superior investment management and trust services by proactively and comprehensively managing risk and adhering to the highest ethical, fiduciary and professional standards.
IV. THE EXECUTIVE DIRECTOR The Executive Director is charged with the responsibility for managing and directing administrative, personnel, budgeting, and investment functions, including the strategic and tactical allocation of investment assets. The Executive Director is charged with developing specific individual investment portfolio objectives and policy guidelines, and providing the Board with monthly and quarterly reports of investment activities. The Executive Director has investment responsibility for maintaining diversified portfolios, and maximizing returns with respect to the broad diversified market standards of individual asset classes, consistent with appropriate risk constraints. The Executive Director will develop policies and procedures to:
• Identify, monitor and control/mitigate key investment and operational risks.
• Maintain an appropriate and effective risk management and compliance program that identifies, evaluates and manages risks within business units and at the enterprise level.
• Maintain an appropriate and effective control environment for SBA investment and operational responsibilities.
• Approve risk allocations and limits, including total fund and asset class risk budgets. The Executive Director will appoint a Chief Risk and Compliance Officer, whose selection, compensation and termination will be affirmed by the Board, to assist in the execution of the responsibilities enumerated in the preceding list. For day-to-day executive and administrative purposes, the Chief Risk and Compliance Officer will proactively work with the Executive Director and designees to ensure that issues are promptly and thoroughly addressed by management. On at least a quarterly basis, the Chief Risk and Compliance Officer will provide reports to the Investment Advisory Council, Audit Committee and Board and is authorized to directly access these bodies at

Final for Adoption by IAC on June 11, 2018
3
any time as appropriate to ensure the integrity and effectiveness of risk management and compliance functions. Pursuant to written SBA policy, the Executive Director will organize an Investment Oversight Group(s) to regularly review, document and formally escalate guideline compliance exceptions and events that may have a material impact on the Trust Fund. The Executive Director is delegated the authority and responsibility to prudently address any such compliance exceptions, with input from the Investment Advisory Council and Audit Committee as necessary and appropriate, unless otherwise required in this Investment Policy Statement. The Executive Director is responsible for evaluating the appropriateness of the goals and objectives in this Plan in light of actuarial studies and recommending changes to the Board when appropriate.
V. INVESTMENT OBJECTIVES The investment objective of the Board is to provide investment returns sufficient for the plan to be maintained in a manner that ensures the timely payment of promised benefits to current and future participants and keeps the plan cost at a reasonable level. To achieve this, a long-term real return approximating 4.0% per annum (compounded and net of investment expenses) should be attained. As additional considerations, the Board seeks to avoid excessive risk in long-term cost trends. To manage these risks, the volatility of annual returns should be reasonably controlled. The Board's principal means for achieving this goal is through investment directives to the Executive Director. The main object of these investment directives is the asset class. The Board directs the Executive Director to manage the asset classes in ways that, in the Board's opinion, will maximize the likelihood of achieving the Board's investment objective within an appropriate risk management framework. The Board establishes asset classes, sets target allocations and reasonable ranges around them for each and establishes performance benchmarks for them. In addition, it establishes a performance benchmark for the total portfolio.
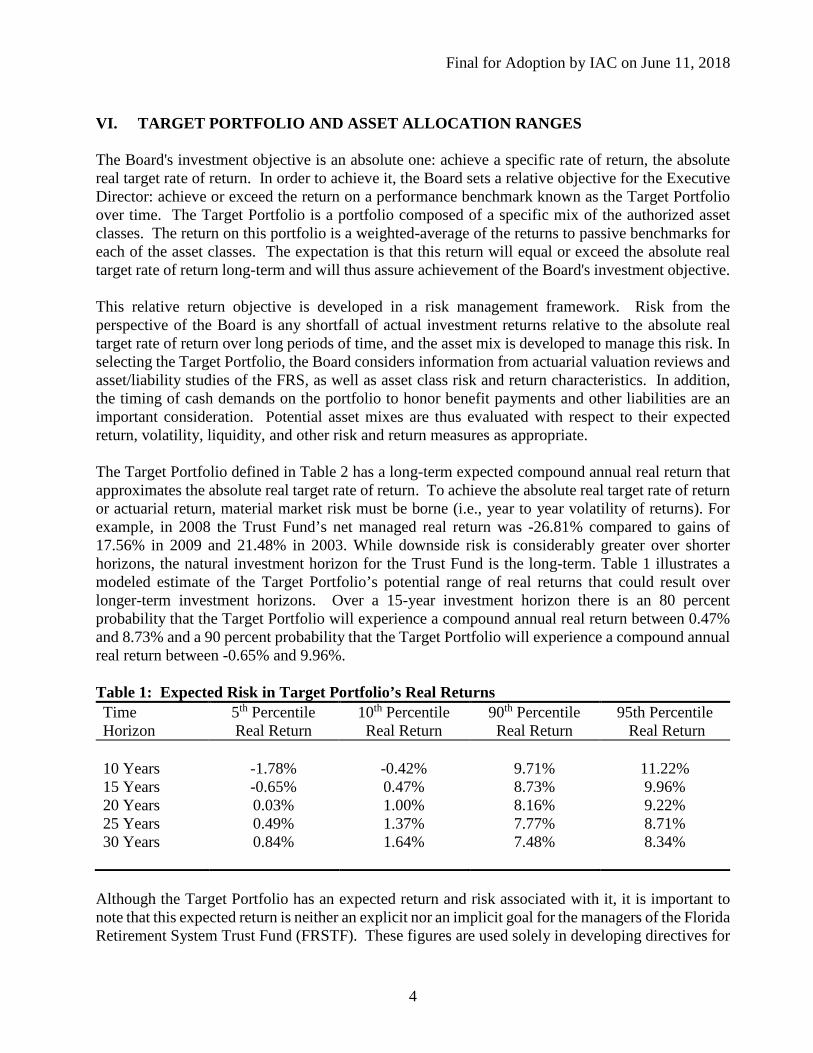
Final for Adoption by IAC on June 11, 2018
4
VI. TARGET PORTFOLIO AND ASSET ALLOCATION RANGES The Board's investment objective is an absolute one: achieve a specific rate of return, the absolute real target rate of return. In order to achieve it, the Board sets a relative objective for the Executive Director: achieve or exceed the return on a performance benchmark known as the Target Portfolio over time. The Target Portfolio is a portfolio composed of a specific mix of the authorized asset classes. The return on this portfolio is a weighted-average of the returns to passive benchmarks for each of the asset classes. The expectation is that this return will equal or exceed the absolute real target rate of return long-term and will thus assure achievement of the Board's investment objective. This relative return objective is developed in a risk management framework. Risk from the perspective of the Board is any shortfall of actual investment returns relative to the absolute real target rate of return over long periods of time, and the asset mix is developed to manage this risk. In selecting the Target Portfolio, the Board considers information from actuarial valuation reviews and asset/liability studies of the FRS, as well as asset class risk and return characteristics. In addition, the timing of cash demands on the portfolio to honor benefit payments and other liabilities are an important consideration. Potential asset mixes are thus evaluated with respect to their expected return, volatility, liquidity, and other risk and return measures as appropriate. The Target Portfolio defined in Table 2 has a long-term expected compound annual real return that approximates the absolute real target rate of return. To achieve the absolute real target rate of return or actuarial return, material market risk must be borne (i.e., year to year volatility of returns). For example, in 2008 the Trust Fund’s net managed real return was -26.81% compared to gains of 17.56% in 2009 and 21.48% in 2003. While downside risk is considerably greater over shorter horizons, the natural investment horizon for the Trust Fund is the long-term. Table 1 illustrates a modeled estimate of the Target Portfolio’s potential range of real returns that could result over longer-term investment horizons. Over a 15-year investment horizon there is an 80 percent probability that the Target Portfolio will experience a compound annual real return between 0.47% and 8.73% and a 90 percent probability that the Target Portfolio will experience a compound annual real return between -0.65% and 9.96%. Table 1: Expected Risk in Target Portfolio’s Real Returns Time Horizon
5th Percentile Real Return
10th Percentile Real Return
90th Percentile Real Return
95th Percentile Real Return
10 Years -1.78% -0.42% 9.71% 11.22% 15 Years -0.65% 0.47% 8.73% 9.96% 20 Years 0.03% 1.00% 8.16% 9.22% 25 Years 0.49% 1.37% 7.77% 8.71% 30 Years 0.84% 1.64% 7.48% 8.34%
Although the Target Portfolio has an expected return and risk associated with it, it is important to note that this expected return is neither an explicit nor an implicit goal for the managers of the Florida Retirement System Trust Fund (FRSTF). These figures are used solely in developing directives for
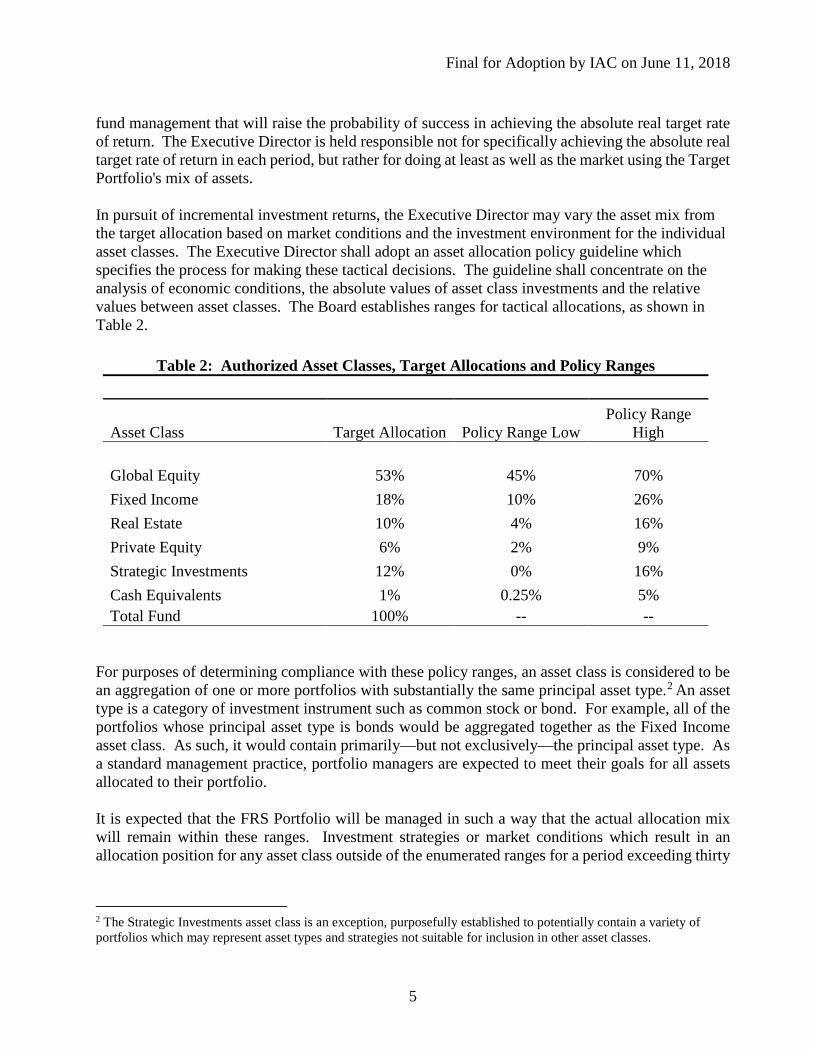
Final for Adoption by IAC on June 11, 2018
5
fund management that will raise the probability of success in achieving the absolute real target rate of return. The Executive Director is held responsible not for specifically achieving the absolute real target rate of return in each period, but rather for doing at least as well as the market using the Target Portfolio's mix of assets. In pursuit of incremental investment returns, the Executive Director may vary the asset mix from the target allocation based on market conditions and the investment environment for the individual asset classes. The Executive Director shall adopt an asset allocation policy guideline which specifies the process for making these tactical decisions. The guideline shall concentrate on the analysis of economic conditions, the absolute values of asset class investments and the relative values between asset classes. The Board establishes ranges for tactical allocations, as shown in Table 2.
Table 2: Authorized Asset Classes, Target Allocations and Policy Ranges
Asset Class Target Allocation Policy Range Low Policy Range
High Global Equity 53% 45% 70% Fixed Income 18% 10% 26% Real Estate 10% 4% 16% Private Equity 6% 2% 9% Strategic Investments 12% 0% 16% Cash Equivalents 1% 0.25% 5% Total Fund 100% -- --
For purposes of determining compliance with these policy ranges, an asset class is considered to be an aggregation of one or more portfolios with substantially the same principal asset type.2 An asset type is a category of investment instrument such as common stock or bond. For example, all of the portfolios whose principal asset type is bonds would be aggregated together as the Fixed Income asset class. As such, it would contain primarily—but not exclusively—the principal asset type. As a standard management practice, portfolio managers are expected to meet their goals for all assets allocated to their portfolio. It is expected that the FRS Portfolio will be managed in such a way that the actual allocation mix will remain within these ranges. Investment strategies or market conditions which result in an allocation position for any asset class outside of the enumerated ranges for a period exceeding thirty
2 The Strategic Investments asset class is an exception, purposefully established to potentially contain a variety of portfolios which may represent asset types and strategies not suitable for inclusion in other asset classes.

Final for Adoption by IAC on June 11, 2018
6
(30) consecutive business days shall be reported to the Board, together with a review of conditions causing the persistent deviation and a recommendation for subsequent investment action. The asset allocation is established in concert with the investment objective, capital market expectations, projected actuarial liabilities, and resulting cash flows. Table 3 indicates estimated net cash flows (benefit payments less employer and employee contributions) and associated probabilities that are implicit in this policy statement, assuming the Legislature adheres to system funding provisions in current law. Additionally, the annualized income yield of the fund is projected to approximate 2% to 3%. Table 3: Estimated Net Cash Outflow ($ millions/ % Fund)
In 5 Years
In 10 Years
10th Percentile $ 4,851 3.67% $ 3,497 3.14% 25th Percentile $ 6,776 4.15% $ 6,329 4.03% Median $ 7,466 4.54% $ 8,523 4.60% 75th Percentile $ 8,079 5.04% $ 11,561 5.22% 90th Percentile $ 10,690 5.96% $ 12,895 6.27%

Final for Adoption by IAC on June 11, 2018
7
VII. PERFORMANCE MEASUREMENT
Asset class performance is measured in accordance with a broad market index appropriate to the asset class. The indices identified in Table 4 are used as the primary benchmarks for the authorized asset classes. Table 4: Authorized Target Indices Asset Class Index Global Equity A custom version of the MSCI All Country World Investable Market
Index (ACWI IMI), in dollar terms, net of withholding taxes on non-resident institutional investors, adjusted to reflect the provisions of the Protecting Florida’s Investments Act
Fixed Income The Barclays Capital U.S. Intermediate Aggregate Index
Real Estate The core portion of the asset class is benchmarked to an average of the National Council of Real Estate Investment Fiduciaries (NCREIF) Fund Index – Open-ended Diversified Core Equity, NET of fees, weighted at 76.5%, and the non-core portion of the asset class is benchmarked to an average of the National Council of Real Estate Investment Fiduciaries (NCREIF) Fund Index – Open-ended Diversified Core Equity, NET of fees, weighted at 13.5%, plus a fixed return premium of 150 basis points per annum, and the FTSE EPRA/NAREIT Developed Index, in dollar terms, net of withholding taxes on non-resident institutional investors, weighted at 10%3
Private Equity The MSCI All Country World Investable Market Index (ACWI IMI), in dollar terms, net of withholding taxes on non-resident institutional investors, adjusted to reflect the provisions of the Protecting Florida’s Investments Act, plus a fixed premium return of 300 basis points per annum
Strategic Investments A weighted-average of individual portfolio level benchmark returns
Cash Equivalents Bank of America Merrill Lynch 3-Month US Treasury Index
The return on the Target Portfolio shall be calculated as an average of the returns to the target indices indicated in Table 4 weighted by the target allocations indicated by Table 2, but adjusted for floating allocations. The policy allocations for the private market asset classes would all “float” against the
3
3 Core RE Public RE
(76.5% * NFI-ODCE) + [13.5% * (NFI-ODCE + 150 bps)] + (10%* REIT Index)
Non-Core RE

Final for Adoption by IAC on June 11, 2018
8
public market asset classes (i.e., limited short-term liquidity available for rebalancing and benefit payments means that their policy allocations would equal their actual allocations) as identified in Table 5.
Measurement of asset allocation performance shall be made by comparing the actual asset allocation times the return for the appropriate indices to the target allocation times the index returns. For asset classes with floating allocations the basis of tactical measurement shall be the asset class’s actual share. Performance measurement of the effectiveness of the implementation of the Private Equity asset class shall be based on an internal rate of return (IRR) methodology, applied over significant periods of time. Performance measurement of the effectiveness of the implementation of the Private Equity, Strategic Investments, and Cash Equivalents asset classes shall be assessed relative to both the applicable index in Table 4 and:
• For Private Equity, the joint Cambridge Associates Global Private Equity and Venture Capital Index pooled return at peer group weights.
• For Strategic Investments, the CPI, as reported by the U.S. Department of Labor, Bureau of Labor Statistics (Consumer Price Index – All Urban Consumers), plus 4.0%.
• For Cash Equivalents, the iMoneyNet First Tier Institutional Money Market Funds Net Index
VIII. ASSET CLASS PORTFOLIO MANAGEMENT General Asset Class and Portfolio Guidelines The Executive Director is responsible for developing asset class and individual portfolio policies and guidelines which reflect the goals and objectives of this Investment Policy Statement. In doing so, he is authorized to use all investment authority spelled out in Section 215.47, Florida Statutes, except as limited by this Plan or SBA Rules. The Executive Director shall develop guidelines for the selection and retention of portfolios, and shall manage all external contractual relationships in accordance with the fiduciary responsibilities of the Board.
Table 5: Allocations of Private Market (Real Estate, Private Equity and Strategic Investments) Under and Overweights to Public Market (Global Equity, Fixed Income and Cash) Table 2 Target Allocations
Float Public Market Allocation Real Private StrategicAsset Classes Limit Estate Equity InvestmentsGlobal Equity N/A 50% 100% 75%Fixed Income N/A 50% 0% 25%
Private Market Asset Classes
Final for Adoption by IAC on June 11, 2018
9
All asset classes shall be invested to achieve or exceed the return on their respective benchmarks over a long period of time. To obtain appropriate compensation for associated performance risks:
• Public market asset classes shall be well diversified with respect to their benchmarks and have a reliance on low cost passive strategies scaled according to the degree of efficiency in underlying securities markets, capacity in effective active strategies, and ongoing total fund liquidity requirements.
• Private Equity, Real Estate and Strategic Investments asset classes shall utilize a prudent process to maximize long-term access to attractive risk-adjusted investment opportunities through use of business partners with appropriate: o Financial, operational and investment expertise and resources; o Alignment of interests; o Transparency and repeatability of investment process; and o Controls on leverage.
Strategic Investments Guidelines The objective of the asset class is to proactively identify and utilize non-traditional and multi-asset class investments, on an opportunistic and strategic basis, in order to accomplish one or more of the following:
• Generate long-term incremental returns in excess of a 4.0% annualized real rate of return, commensurate with risk.
• Reduce the volatility of FRS Pension Plan assets and improve the FRS Pension Plan’s risk-adjusted return over multiple market cycles.
• Outperform the FRS Pension Plan during periods of significant market declines.
• Increase investment flexibility across market environments in order to access evolving or opportunistic investments outside of traditional asset classes and effective risk-adjusted portfolio management strategies.
Strategic Investments may include, but not be limited to, direct investments authorized by s. 215.47, Florida Statutes or investments in capital commitment partnerships, hedge funds or other vehicles that make or involve non-traditional, opportunistic and/or long or short investments in marketable and nonmarketable debt, equity, and/or real assets (e.g., real estate, infrastructure, or commodities). Leverage may be utilized subject to appropriate controls. Other Guidelines The Executive Director shall develop and implement policies as appropriate for the orderly and effective implementation of the provisions of Chapter 2007-88, Laws of Florida, the “Protecting

Final for Adoption by IAC on June 11, 2018
10
Florida’s Investments Act.” Actions taken and determinations made pursuant to said policies are hereby incorporated by reference into this Investment Policy Statement, as required by subsection 215.473(6), Florida Statutes. The Executive Director shall develop and implement policies as appropriate for the orderly and effective implementation of the provisions of Chapter 2016-36, Laws of Florida, an act relating to companies that boycott Israel. Actions taken and determinations made pursuant to said policies are hereby incorporated by reference into this Investment Policy Statement, as required by subsection 215.4725(5), Florida Statutes. The Executive Director shall develop and implement policies as appropriate for the orderly and effective implementation of the provisions of Chapter 2018-125, Laws of Florida, an act relating to state investments in or with the government of Venezuela. Actions taken and determinations made pursuant to said policies are hereby incorporated by reference into this Investment Policy Statement, as required by subsection 215.475(3)(a), Florida Statutes. Subsection 215.475(3)(a) Florida Statutes is consistent with the Resolution adopted by the Trustees of the Board on August 16, 2017. At that meeting, the Board also included in the Resolution the specific direction that the SBA include in this Investment Policy Statement upon review of the IAC in accordance with Section 215.475(2) Florida Statutes, the following: “The SBA will not vote in favor of any proxy resolution advocating the support of the Maduro Regime in Venezuela.”
IX. REPORTING The Board directs the Executive Director to coordinate the preparation of quarterly reports of the investment performance of the FRS by the Board's independent performance evaluation consultant. The following formal periodic reports to the Board shall be the responsibility of the Executive Director:
• An annual report on the SBA and its investment portfolios, including that of the FRS.
• A monthly report on performance and investment actions taken.
• Special investment reports pursuant to Section 215.44-215.53, Florida Statutes.
X. IMPLEMENTATION SCHEDULE This policy statement shall be effective July 1, 2018.

Pension Asset-Liability Study: Initial ResultsFlorida State Board of AdministrationFebruary 2018
Investment advice and consulting services provided by Aon Hewitt Investment Consulting, Inc., an Aon Company.
Investment advice and consulting services provided by Aon Hewitt Investment Consulting, Inc., an Aon Company. 2
Table of Contents
Executive Summary Overview
‒ Asset-Liability Management Background‒ Asset-Liability Profile
Analysis‒ Investment Analysis‒ Asset-Liability Projection Analysis‒ Public Pension Peer Comparison
Summary & Conclusions Appendix

Investment advice and consulting services provided by Aon Hewitt Investment Consulting, Inc., an Aon Company. 4
Executive Summary
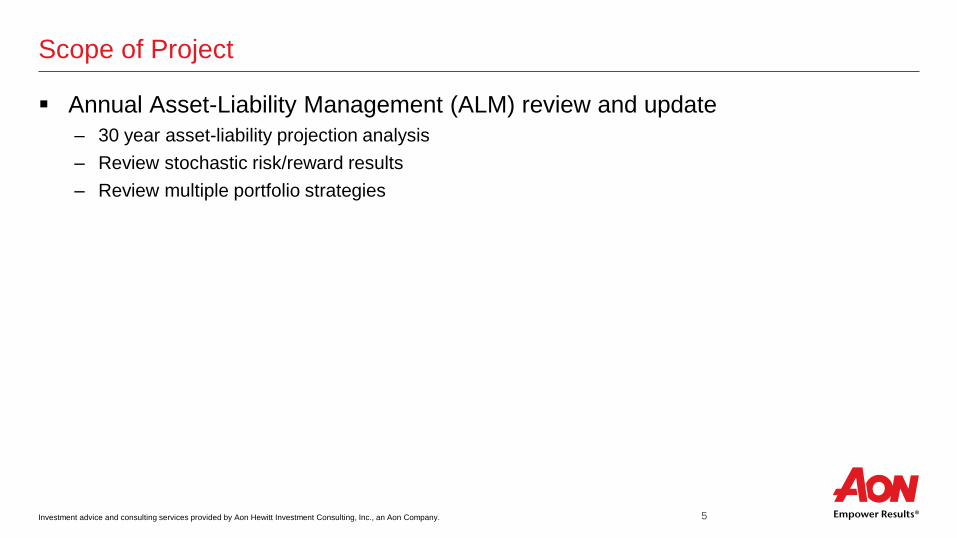
Investment advice and consulting services provided by Aon Hewitt Investment Consulting, Inc., an Aon Company. 5
Scope of Project
Annual Asset-Liability Management (ALM) review and update‒ 30 year asset-liability projection analysis‒ Review stochastic risk/reward results‒ Review multiple portfolio strategies

Investment advice and consulting services provided by Aon Hewitt Investment Consulting, Inc., an Aon Company. 6
Executive Summary
We believe the current portfolio is well-constructed with 81% return-seeking assets The equity risk premium is 3.62% in this 2018 A-L study, compared to 3.72% from
2017 Asset returns (6.44%) are not expected to keep pace with the actuarial assumed
rate of return (7.50%) Expected real return of 4.06% falls short of the investment policy target of 4.50%
The funded ratio is expected to remain relatively flat over the course of the projection period
Higher return-seeking strategies result in a higher trajectory of projected funded ratio, with greater risk than the current portfolio; lower return-seeking portfolios do the opposite
Longer time horizons are expected to reward higher levels of risk Adverse market experience could significantly impact the funded status
of the Plan over the projection period, albeit with low likelihood
InvestmentAnalysis
Asset-LiabilityProjectionAnalysis

Investment advice and consulting services provided by Aon Hewitt Investment Consulting, Inc., an Aon Company. 7
Overview Asset-Liability Management Background
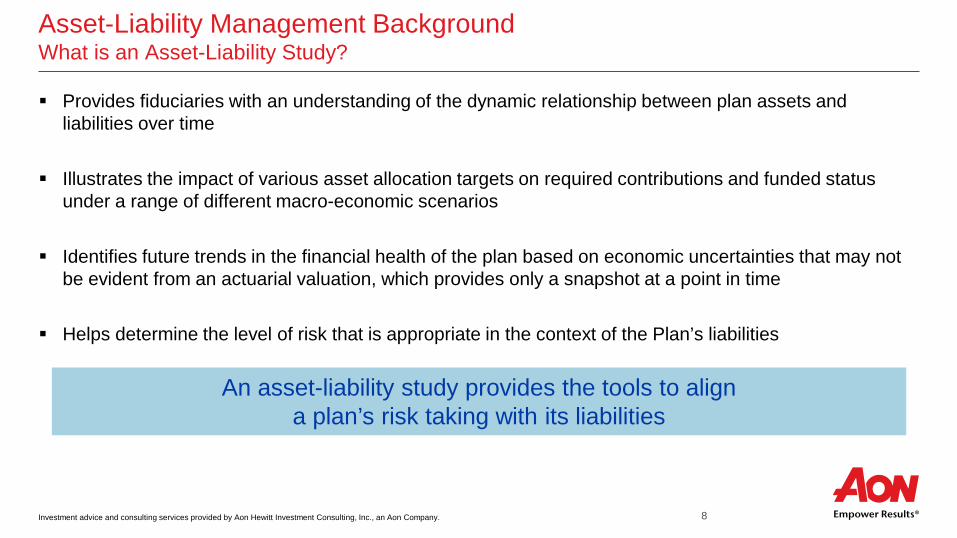
Investment advice and consulting services provided by Aon Hewitt Investment Consulting, Inc., an Aon Company. 8
Asset-Liability Management BackgroundWhat is an Asset-Liability Study?
Provides fiduciaries with an understanding of the dynamic relationship between plan assets and liabilities over time
Illustrates the impact of various asset allocation targets on required contributions and funded status under a range of different macro-economic scenarios
Identifies future trends in the financial health of the plan based on economic uncertainties that may not be evident from an actuarial valuation, which provides only a snapshot at a point in time
Helps determine the level of risk that is appropriate in the context of the Plan’s liabilities
An asset-liability study provides the tools to aligna plan’s risk taking with its liabilities

Investment advice and consulting services provided by Aon Hewitt Investment Consulting, Inc., an Aon Company. 9
Asset-Liability Management BackgroundBalance of Liabilities and Assets
Assets$ Liabilities
$
PENSION PLAN+ New Benefit
Accrual
+ Cash Contributions
+ AssetReturn+ Liability
Return
- Benefit Payments
- Benefit Payments

Investment advice and consulting services provided by Aon Hewitt Investment Consulting, Inc., an Aon Company. 10
Asset-Liability Management Background Mechanics of Asset-Liability Modeling Process
ContributionsFunded Ratio
Correlation Duration Discount Rate
Salary Increase
Asset MixDemographicsPlan Design
Actuarial Assumptions
PortfolioReturn Liabilities
Inflation InterestRate
Asset and liability modeling integrated in single platform Integrates impact of key
economic variables
Flexibility in modeling parameters and output to client preferences
Stochastic and deterministic modeling performed

Investment advice and consulting services provided by Aon Hewitt Investment Consulting, Inc., an Aon Company. 11
Asset-Liability Management BackgroundLong-Term Economic Cost of Plan
Main component of long-term economic cost
Does not reflect the plan’s funded status at the end of the forecast period
Reflects the plan’s funded status at the end of the forecast period
Surplus assets are valuable as they lower future contributions
Unfunded liabilities are costs that will be recognized in future years
TerminalFunding Surplus Shortfall
Utility RationaleDeclining value, or
utility, from very highfunded ratios
Increasing “pain” asunfunded amounts grow
to high levels
Threshold PVB / AL (5 Yrs. of BenefitPayments) / AL
Utility Factorabove/belowthreshold
50% 200%
Long-Term Economic Cost =
Present Value of Plan Contributions +
Present Value of Terminal Funding, adjusted by a utility factor
Present Value of Plan
Contributions
Present Value of Terminal
Funding
Utility Factor Applied to Terminal Funding
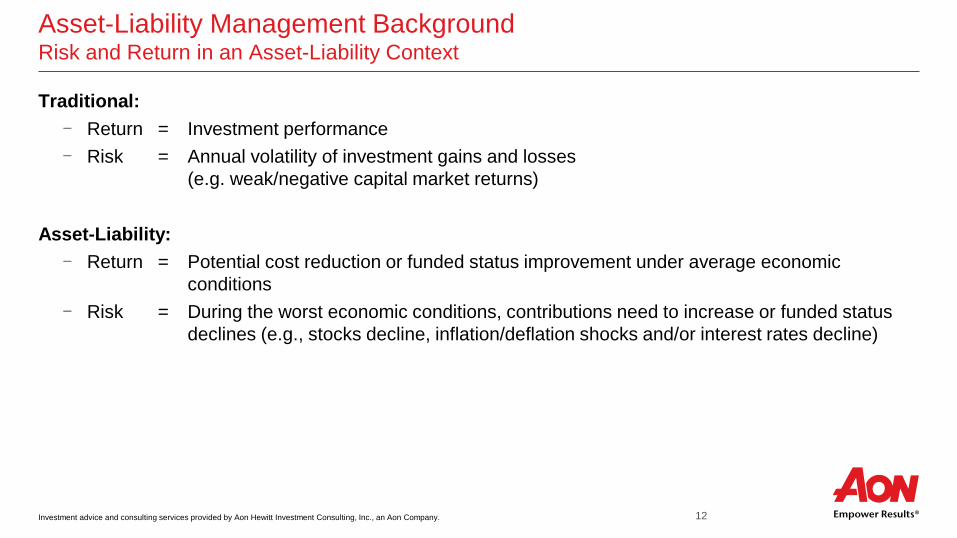
Investment advice and consulting services provided by Aon Hewitt Investment Consulting, Inc., an Aon Company. 12
Asset-Liability Management Background Risk and Return in an Asset-Liability Context
Traditional:- Return = Investment performance- Risk = Annual volatility of investment gains and losses
(e.g. weak/negative capital market returns)
Asset-Liability:- Return = Potential cost reduction or funded status improvement under average economic
conditions- Risk = During the worst economic conditions, contributions need to increase or funded status
declines (e.g., stocks decline, inflation/deflation shocks and/or interest rates decline)

Investment advice and consulting services provided by Aon Hewitt Investment Consulting, Inc., an Aon Company. 13
Asset-Liability Management Background Key Factors Affecting the Risk/Reward Trade-off
The key take-away from the A/L study is the allocation between equity (“return-seeking”) vs. fixed income (“risk-reducing”)
Major factors affecting the ultimate mix are: Time horizon (or amortization period of unfunded liability) to fund the liability: a longer time horizon
supports more risk taking Characteristics of plan participants: a growing population of active participants supports more risk
taking; a mature population with significant retirees might need a more conservative policy Funded status: a less funded plan can utilize additional returns from equity investments Nature of plan benefits: a pension with sensitivity to wage inflation growth can benefit from equities in
the long-term; an increased need in liquidity due to significant benefit payments in the near future can have a more conservative policy

Investment advice and consulting services provided by Aon Hewitt Investment Consulting, Inc., an Aon Company. 14
Asset-Liability Management Background Glossary of Terms
AVA = Actuarial Value of Assets (i.e., incorporates smoothing of gains and losses) Asset Growth Rate or “Hurdle Rate” – The required rate of growth of the assets (through both
contributions and investment returns) to keep pace with the growth of the liability Current Frontier – uses SBA’s mix of asset classes within the Return-Seeking allocation, then dials the
Return-Seeking allocation up and down from 0% to 100% to illustrate forecasted returns at various Return-Seeking / Safety Asset mixes
Economic Cost – Present Value of forecasted future contributions + Funding Shortfall / (Surplus) Liability Growth Rate – the projected growth of the liability over the coming year as measurement by
the sum of the Normal Cost (new benefit accruals) and Interest Cost (one year of discounting) MVA = Market Value of Assets (i.e., un-smoothed / economic reality) Return-Seeking Assets (“R-S”) – All non “Safety” assets Safety Assets – Assets where the primary function is risk control / downside mitigation. Target Mix – the allocation of assets between Return-Seeking Assets and Safety Assets

Investment advice and consulting services provided by Aon Hewitt Investment Consulting, Inc., an Aon Company. 15
Overview Asset-Liability Profile

Investment advice and consulting services provided by Aon Hewitt Investment Consulting, Inc., an Aon Company. 16
Florida Retirement System (FRS)Historical Information
Key Takeaways:
Blue line represents the actuarial liabilities over time– Adding to the increase in
liability has been the decrease in the assumed investment return (light gray bar)
Green line represents the actuarial value of plan assets over time– Assets reflect smoothing
parameters to the actual return on assets (dark gray bar)
Sources: Public Plans Data (publicplansdata.org) as of July 2017

Investment advice and consulting services provided by Aon Hewitt Investment Consulting, Inc., an Aon Company. 17
Asset-Liability Profile as of July 1, 2017Asset-Liability Snapshot as of 7/1/2017
Metric ($, Billions) Value Fund %Market Value of Assets $154.1 86.3%Actuarial Value of Assets $150.6 84.3%Liability MetricsActuarial Liability (AL) - Funding $178.61
Asset-Liability Growth MetricsMetric ($, Billions) Value % Liability % AssetsAL Interest Cost $13.4 7.5% 8.7%AL Normal Cost $1.9 1.1% 1.2%Total Liability Hurdle Rate $15.3 8.6% 9.9%Expected Return on Assets2 $9.9 5.6% 6.4%ER + EE Contributions $3.7 2.1% 2.4%Total Exp. Asset Growth $13.6 7.7% 8.8%Hurdle Rate Shortfall $1.7 0.9% 1.1%Est. Benefit Payments $9.8 5.5% 6.3%
Target Asset Allocation as of 7/1/2017Metric ($, Billions) Value Alloc %Return-Seeking
- Global Equity $81.6 53%- Private Equity $9.2 6%- Strategic $18.5 12%- Real Estate $15.4 10%- Total $124.8 81%
Risk-Reducing- Cash & Short Duration Fixed Income $1.5 1%- Intermediate Duration Fixed Income $27.7 18%- Total $29.3 19%
Total $154.1 100%
1 Based on plan's valuation interest rate of 7.50% from the 2017 actuarial valuation report (Funding) 2 Based on aggregated capital market assumptions as shown in appendix

Investment advice and consulting services provided by Aon Hewitt Investment Consulting, Inc., an Aon Company. 18
Analysis Investment Analysis
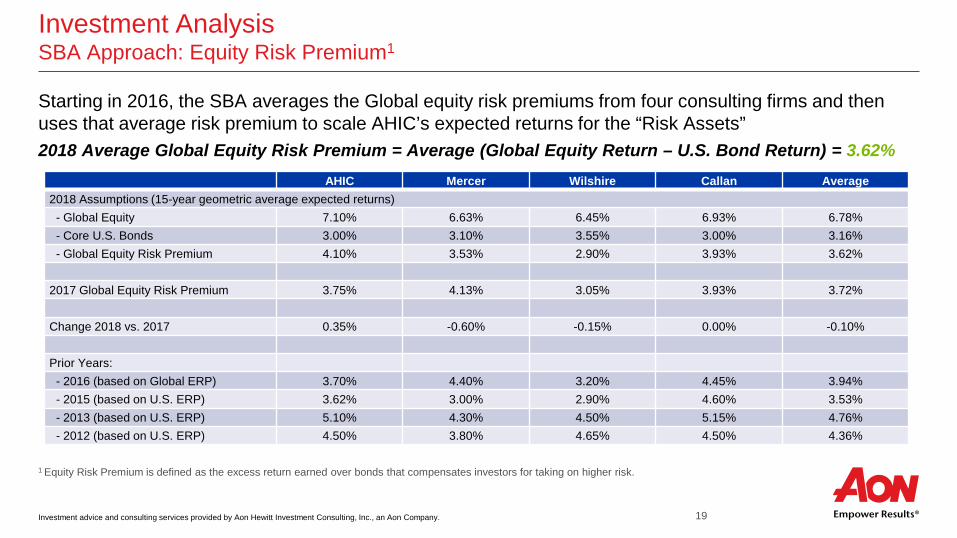
Investment advice and consulting services provided by Aon Hewitt Investment Consulting, Inc., an Aon Company. 19
Investment Analysis SBA Approach: Equity Risk Premium1
Starting in 2016, the SBA averages the Global equity risk premiums from four consulting firms and then uses that average risk premium to scale AHIC’s expected returns for the “Risk Assets”2018 Average Global Equity Risk Premium = Average (Global Equity Return – U.S. Bond Return) = 3.62%
All returns are 15-year geometric average (compounded) expected returns.
1 Equity Risk Premium is defined as the excess return earned over bonds that compensates investors for taking on higher risk.
AHIC Mercer Wilshire Callan Average2018 Assumptions (15-year geometric average expected returns)
- Global Equity 7.10% 6.63% 6.45% 6.93% 6.78%- Core U.S. Bonds 3.00% 3.10% 3.55% 3.00% 3.16%- Global Equity Risk Premium 4.10% 3.53% 2.90% 3.93% 3.62%
2017 Global Equity Risk Premium 3.75% 4.13% 3.05% 3.93% 3.72%
Change 2018 vs. 2017 0.35% -0.60% -0.15% 0.00% -0.10%
Prior Years:- 2016 (based on Global ERP) 3.70% 4.40% 3.20% 4.45% 3.94%- 2015 (based on U.S. ERP) 3.62% 3.00% 2.90% 4.60% 3.53%- 2013 (based on U.S. ERP) 5.10% 4.30% 4.50% 5.15% 4.76%- 2012 (based on U.S. ERP) 4.50% 3.80% 4.65% 4.50% 4.36%

Investment advice and consulting services provided by Aon Hewitt Investment Consulting, Inc., an Aon Company. 20
Investment AnalysisCurrent Frontier
Key Takeaways: The current portfolio is well-diversified
– Return-seeking assets are broadly diversified
– Safety asset allocation should withstand stressed markets
Return-Seeking SafetyExpected Nominal Return
Expected Nominal Volatility
Sharpe Ratio
Global Equity Real Estate Strategic
Private Equity
Cash & ShortDuration Bonds
Interm. Duration
Gov't Bonds
Interm. Duration
CreditCurrent Policy (81% R-S) 6.44% 12.52% 0.323 53% 10% 12% 6% 1% 9% 9%Current Frontier0% Return-Seeking 3.06% 4.02% 0.165 0% 0% 0% 0% 0% 50% 50%10% Return-Seeking 3.56% 3.98% 0.292 7% 1% 1% 1% 0% 45% 45%20% Return-Seeking 4.04% 4.53% 0.362 13% 2% 3% 1% 0% 40% 40%30% Return-Seeking 4.49% 5.49% 0.381 20% 4% 4% 2% 0% 35% 35%40% Return-Seeking 4.92% 6.69% 0.377 26% 5% 6% 3% 0% 30% 30%50% Return-Seeking 5.33% 8.02% 0.365 33% 6% 7% 4% 0% 25% 25%60% Return-Seeking 5.71% 9.43% 0.351 39% 7% 9% 4% 0% 20% 20%70% Return-Seeking 6.07% 10.89% 0.337 46% 9% 10% 5% 0% 15% 15%80% Return-Seeking 6.42% 12.37% 0.325 52% 10% 12% 6% 0% 10% 10%90% Return-Seeking 6.74% 13.88% 0.312 59% 11% 13% 7% 0% 5% 5%100% Return-Seeking 7.04% 15.40% 0.301 65% 12% 15% 7% 0% 0% 0%

Investment advice and consulting services provided by Aon Hewitt Investment Consulting, Inc., an Aon Company. 21
Investment AnalysisRange of Nominal Returns
Actuarial assumed rate of return (7.50%)
Note: Returns based on AHIC’s 30 Year Capital Market Assumptions as of December 31, 2017
50th
95th
75th
25th
5th
Percentile
50th
95th
75th
25th
5th
Percentile
50th
95th
75th
25th
5th
Percentile
50th
95th
75th
25th
5th
Percentile
Percentile Current Policy –5 Year
Current Policy –10 Year
Current Policy –15 Year
Current Policy –30 Year
5th -2.30% 0.19% 1.31% 2.78%
25th 2.77% 3.83% 4.30% 4.93%
50th 6.44% 6.44% 6.44% 6.44%
75th 10.25% 9.12% 8.62% 7.98%
95th 15.96% 13.09% 11.84% 10.23%

Investment advice and consulting services provided by Aon Hewitt Investment Consulting, Inc., an Aon Company. 22
Investment AnalysisRange of Real Returns
Note: Returns based on AHIC’s 30 Year Capital Market Assumptions as of December 31, 2017
Percentile Current Policy –5 Year
Current Policy –10 Year
Current Policy –15 Year
Current Policy –30 Year
5th -4.63% -2.16% -1.05% 0.42%
25th 0.41% 1.47% 1.94% 2.56%
50th 4.06% 4.06% 4.06% 4.06%
75th 7.85% 6.73% 6.23% 5.59%
95th 13.55% 10.68% 9.44% 7.84%
50th
95th
75th
25th
5th
Percentile
50th
95th
75th
25th
5th
Percentile
50th
95th
75th
25th
5th
Percentile
50th
95th
75th
25th
5th
Percentile

Investment advice and consulting services provided by Aon Hewitt Investment Consulting, Inc., an Aon Company. 23
Analysis Asset-Liability Projection Analysis
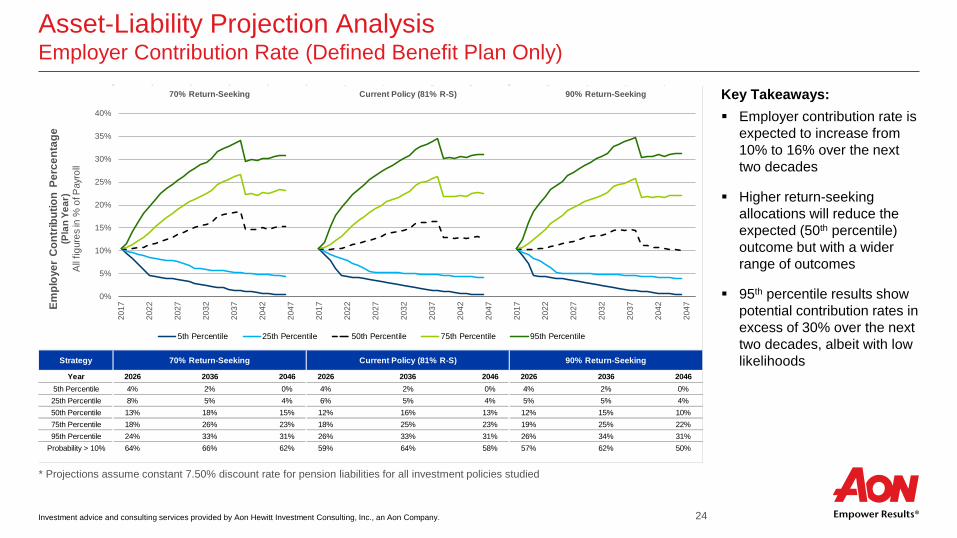
Investment advice and consulting services provided by Aon Hewitt Investment Consulting, Inc., an Aon Company. 24
Asset-Liability Projection AnalysisEmployer Contribution Rate (Defined Benefit Plan Only)
Key Takeaways: Employer contribution rate is
expected to increase from 10% to 16% over the next two decades
Higher return-seeking allocations will reduce the expected (50th percentile) outcome but with a wider range of outcomes
95th percentile results show potential contribution rates in excess of 30% over the next two decades, albeit with low likelihoods
* Projections assume constant 7.50% discount rate for pension liabilities for all investment policies studied
Strategy
Year 2026 2036 2046 2026 2036 2046 2026 2036 20465th Percentile 4% 2% 0% 4% 2% 0% 4% 2% 0%25th Percentile 8% 5% 4% 6% 5% 4% 5% 5% 4%50th Percentile 13% 18% 15% 12% 16% 13% 12% 15% 10%75th Percentile 18% 26% 23% 18% 25% 23% 19% 25% 22%95th Percentile 24% 33% 31% 26% 33% 31% 26% 34% 31%
Probability > 10% 64% 66% 62% 59% 64% 58% 57% 62% 50%
70% Return-Seeking Current Policy (81% R-S) 90% Return-Seeking
70% Return-Seeking Current Policy (81% R-S) 90% Return-Seeking
0%
5%
10%
15%
20%
25%
30%
35%
40%20
17
2022
2027
2032
2037
2042
2047
2017
2022
2027
2032
2037
2042
2047
2017
2022
2027
2032
2037
2042
2047Em
ploy
er C
ontri
butio
n Pe
rcen
tage
(Pla
n Ye
ar)
All
figur
es in
% o
f Pay
roll
5th Percentile 25th Percentile 50th Percentile 75th Percentile 95th Percentile
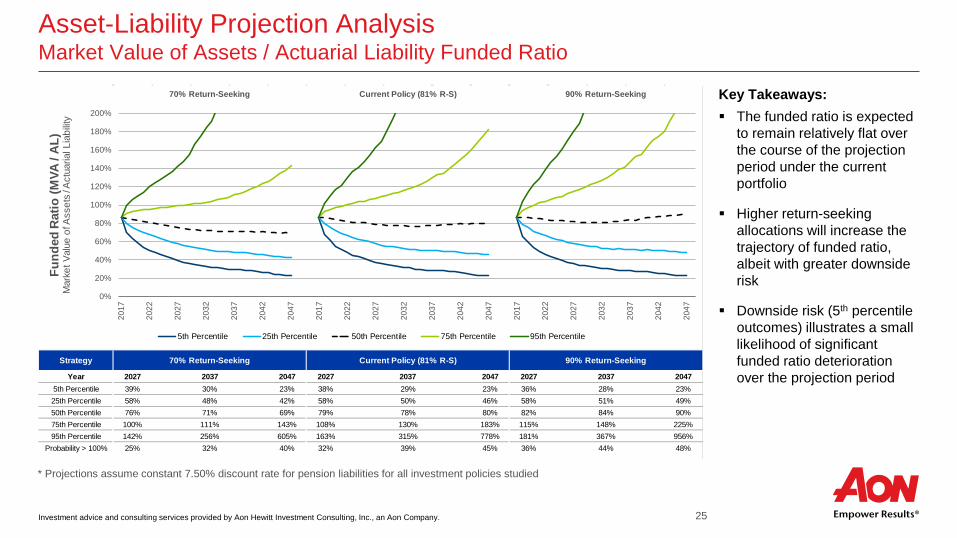
Investment advice and consulting services provided by Aon Hewitt Investment Consulting, Inc., an Aon Company. 25
Asset-Liability Projection AnalysisMarket Value of Assets / Actuarial Liability Funded Ratio
Key Takeaways: The funded ratio is expected
to remain relatively flat over the course of the projection period under the current portfolio
Higher return-seeking allocations will increase the trajectory of funded ratio, albeit with greater downside risk
Downside risk (5th percentile outcomes) illustrates a small likelihood of significant funded ratio deterioration over the projection period
* Projections assume constant 7.50% discount rate for pension liabilities for all investment policies studied
Strategy
Year 2027 2037 2047 2027 2037 2047 2027 2037 20475th Percentile 39% 30% 23% 38% 29% 23% 36% 28% 23%25th Percentile 58% 48% 42% 58% 50% 46% 58% 51% 49%50th Percentile 76% 71% 69% 79% 78% 80% 82% 84% 90%75th Percentile 100% 111% 143% 108% 130% 183% 115% 148% 225%95th Percentile 142% 256% 605% 163% 315% 778% 181% 367% 956%
Probability > 100% 25% 32% 40% 32% 39% 45% 36% 44% 48%
70% Return-Seeking Current Policy (81% R-S) 90% Return-Seeking
70% Return-Seeking Current Policy (81% R-S) 90% Return-Seeking
0%
20%
40%
60%
80%
100%
120%
140%
160%
180%
200%20
17
2022
2027
2032
2037
2042
2047
2017
2022
2027
2032
2037
2042
2047
2017
2022
2027
2032
2037
2042
2047
Fund
ed R
atio
(MVA
/ AL
)M
arke
t Val
ue o
f Ass
ets
/ Act
uaria
l Lia
bilit
y
5th Percentile 25th Percentile 50th Percentile 75th Percentile 95th Percentile
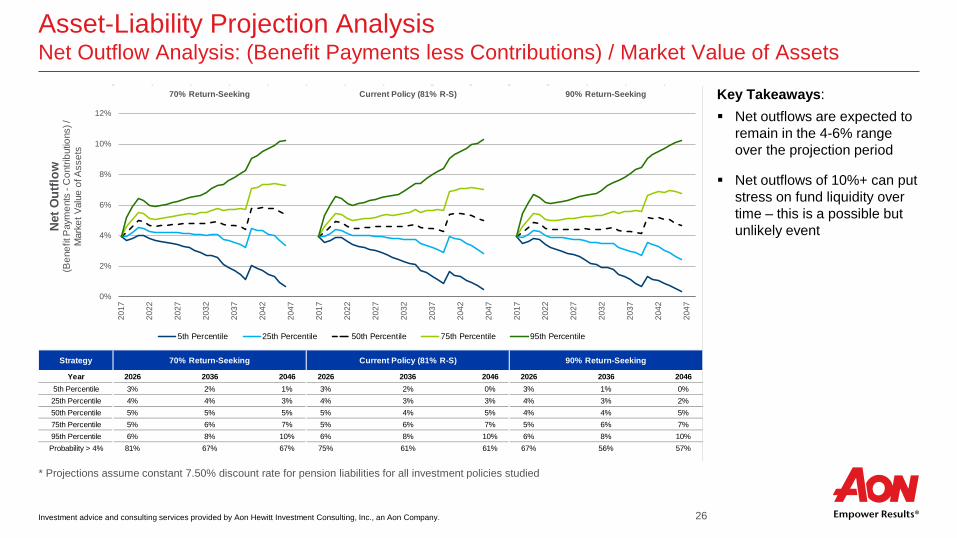
Investment advice and consulting services provided by Aon Hewitt Investment Consulting, Inc., an Aon Company. 26
Asset-Liability Projection AnalysisNet Outflow Analysis: (Benefit Payments less Contributions) / Market Value of Assets
Key Takeaways: Net outflows are expected to
remain in the 4-6% range over the projection period
Net outflows of 10%+ can put stress on fund liquidity over time – this is a possible but unlikely event
* Projections assume constant 7.50% discount rate for pension liabilities for all investment policies studied
Strategy
Year 2026 2036 2046 2026 2036 2046 2026 2036 20465th Percentile 3% 2% 1% 3% 2% 0% 3% 1% 0%25th Percentile 4% 4% 3% 4% 3% 3% 4% 3% 2%50th Percentile 5% 5% 5% 5% 4% 5% 4% 4% 5%75th Percentile 5% 6% 7% 5% 6% 7% 5% 6% 7%95th Percentile 6% 8% 10% 6% 8% 10% 6% 8% 10%Probability > 4% 81% 67% 67% 75% 61% 61% 67% 56% 57%
70% Return-Seeking Current Policy (81% R-S) 90% Return-Seeking
70% Return-Seeking Current Policy (81% R-S) 90% Return-Seeking
0%
2%
4%
6%
8%
10%
12%20
17
2022
2027
2032
2037
2042
2047
2017
2022
2027
2032
2037
2042
2047
2017
2022
2027
2032
2037
2042
2047
Net O
utflo
w(B
enef
it P
aym
ents
-C
ontri
butio
ns) /
Mar
ket V
alue
of A
sset
s
5th Percentile 25th Percentile 50th Percentile 75th Percentile 95th Percentile
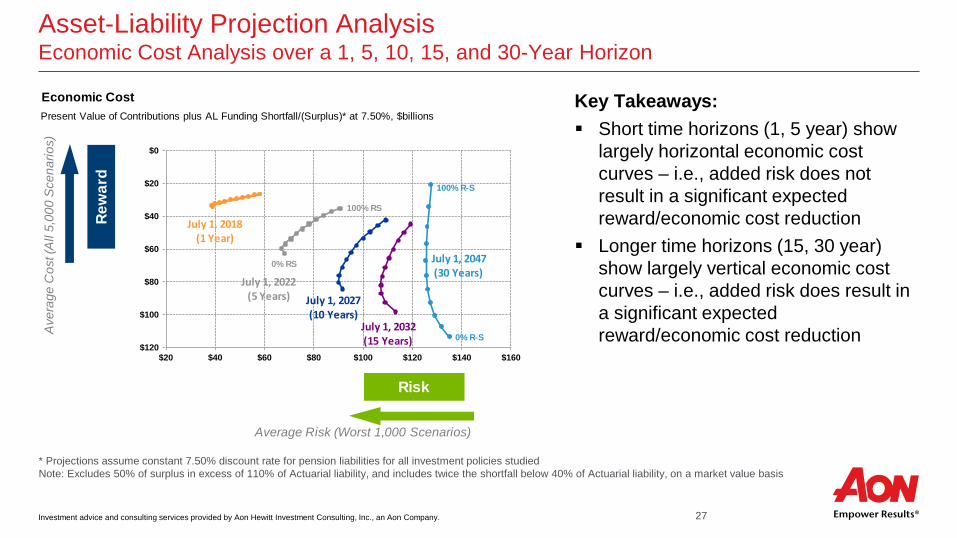
Investment advice and consulting services provided by Aon Hewitt Investment Consulting, Inc., an Aon Company. 27
Asset-Liability Projection AnalysisEconomic Cost Analysis over a 1, 5, 10, 15, and 30-Year Horizon
Key Takeaways: Short time horizons (1, 5 year) show
largely horizontal economic cost curves – i.e., added risk does not result in a significant expected reward/economic cost reduction
Longer time horizons (15, 30 year) show largely vertical economic cost curves – i.e., added risk does result in a significant expected reward/economic cost reduction
* Projections assume constant 7.50% discount rate for pension liabilities for all investment policies studiedNote: Excludes 50% of surplus in excess of 110% of Actuarial liability, and includes twice the shortfall below 40% of Actuarial liability, on a market value basis
Economic CostPresent Value of Contributions plus AL Funding Shortfall/(Surplus)* at 7.50%, $billions
Ave
rage
Cos
t (A
ll 5,
000
Sce
nario
s)
0% RS
100% RS
0% R-S
100% R-S
$0
$20
$40
$60
$80
$100
$120$20 $40 $60 $80 $100 $120 $140 $160
Rew
ard
July 1, 2022 (5 Years) July 1, 2027
(10 Years)
July 1, 2047 (30 Years)
July 1, 2032 (15 Years)
July 1, 2018 (1 Year)
Risk
Average Risk (Worst 1,000 Scenarios)

Investment advice and consulting services provided by Aon Hewitt Investment Consulting, Inc., an Aon Company. 28
Risk-Reward AnalysisSensitivity to Equity Risk Premium Assumption
Observation: The dashed lines illustrate how
the Economic Cost curve shifts under alternative equity risk premium assumptions over a 5 and 15-year time horizon.
* Projections assume constant 7.50% discount rate for pension liabilities for all investment policies studied.Note: Excludes 50% of surplus in excess of 110% of Actuarial liability, and includes twice the shortfall below 40% of Actuarial liability, on a market value basis
Economic CostPresent Value of Contributions plus AL Funding Shortfall/(Surplus)* at 7.50%, $billions
Ave
rage
Cos
t (A
ll 5,
000
Sce
nario
s)
0% RS
100% RS
0% R-S
100% R-S
$0
$20
$40
$60
$80
$100
$120$20 $40 $60 $80 $100 $120 $140 $160
ERP = 4.62%
ERP = 3.62%
ERP = 2.62%
Rew
ard
July 1, 2022 (5 Years)
July 1, 2032 (15 Years)
Risk
Average Risk (Worst 1,000 Scenarios)

Investment advice and consulting services provided by Aon Hewitt Investment Consulting, Inc., an Aon Company. 29
Short-Term Funded Ratio Shortfall Analysis(Based on Market Value of Assets)
FRS’ funded ratio based on the current allocation projects to the following outcomes after 5 years: 29.6% probability of being below 70% funded 15.8% probability of being below 60% funded 6.0% probability of being below 50% funded
50% Funded Status Dialing up the risk to 90% return-seeking assets will increase this
probability of falling below 50% funded to 7.3% Dialing down risk to 70% return-seeking assets will decrease the
probability to 4.4%
70% Funded Status Asset allocations with a return-seeking allocation of 70% or
greater have a similar likelihood of falling below 70% funded

Investment advice and consulting services provided by Aon Hewitt Investment Consulting, Inc., an Aon Company. 30
Analysis Public Pension Peer Comparison

Investment advice and consulting services provided by Aon Hewitt Investment Consulting, Inc., an Aon Company. 31
Public Pension Peer ComparisonFRS’ Asset Allocation versus Public Peers
* Source: "2016 U.S. Institutional Market Trends", Greenwich Associates
** Source: "2016 Report on State Retirement Systems: Funding Levels and Asset Allocation", Wilshire Consulting
*** Source: AHIC Public Peer Average is based on a universe of AHIC's 11 largest public pension plans with total assets ranging from $14B-$142B
Asset Allocation FRSLarge Public
Pension Plans (>$5B)*
Total Public Pension
Universe*
Wilshire Report on State
Retirement Systems **
AHIC PublicPeer Average ***
Equity ExposureGlobal Equity 53.0% 8.2% 7.9% 45.5%
Total U.S. Equity 0.0% 21.7% 22.1% 27.3%Total Int'l Equity 0.0% 16.1% 16.2% 20.1%Private Markets 6.0% 9.4% 9.0% 10.0% 12.1%
Total Equity 59.0% 55.4% 55.2% 57.4% 57.6%
Fixed Income ExposureU.S. Fixed Income 18.0% 21.4% 21.4% 21.1%
High Yield Bonds / Bank Loans 0.0%Non-US Developed Bonds 0.0% 3.5% 3.5% 2.3%
Emerging Market Debt 0.0% 1.3% 1.2%Inflation Protected 0.0%
Total Fixed Income 18.0% 26.2% 26.1% 23.4% 21.3%
Real Asset ExposureUS Infrastructure (Public + Private) 0.0% 0.4% 0.4%
Commodities / Gold 0.0% 0.9% 1.0%Real Estate 10.0% 9.0% 9.0% 8.1%
Total Real Assets 10.0% 10.3% 10.4% 8.1% 12.9%
Hedge Funds / Opportunistic 12.0% 4.1% 4.2% 5.8%Multi-Asset / Risk Parity 0.0% 0.7% 1.0% 2.3%Money Market / Cash 1.0% 1.1% 1.1% 0.4%Leverage 0.0%Other 0.0% 2.0% 2.1% 11.1%
Net Other 13.0% 7.9% 8.4% 11.1% 8.5%Total 100% 100% 100% 100% 100%

Investment advice and consulting services provided by Aon Hewitt Investment Consulting, Inc., an Aon Company. 32
Florida Retirement System (FRS)Expected Return Assumption versus Peers1
Key Takeaways: Median actuarial assumption for
investment return has declined from 8.00% in 2001-2010 to 7.50% based on the latest survey data
FRS’ assumption for FYE 2016 (7.60%) lied above the median relative to its peers
If FRS fails to achieve the actuarial return assumption, higher funding will be needed in future years
Sources: Public Plans Data (publicplansdata.org) as of July 2017; Expected Returns are the assumptions made by the plans included in the data set. 1 Peers defined as public funds published within publicplansdata.org as of July 2017; Number of plans per year are shown in parentheses
50th
95th
75th
25th
5th
Percentile
50th
95th
75th
25th
5th
Percentile
50th
95th
75th
25th
5th
Percentile
50th
95th
75th
25th
5th
Percentile
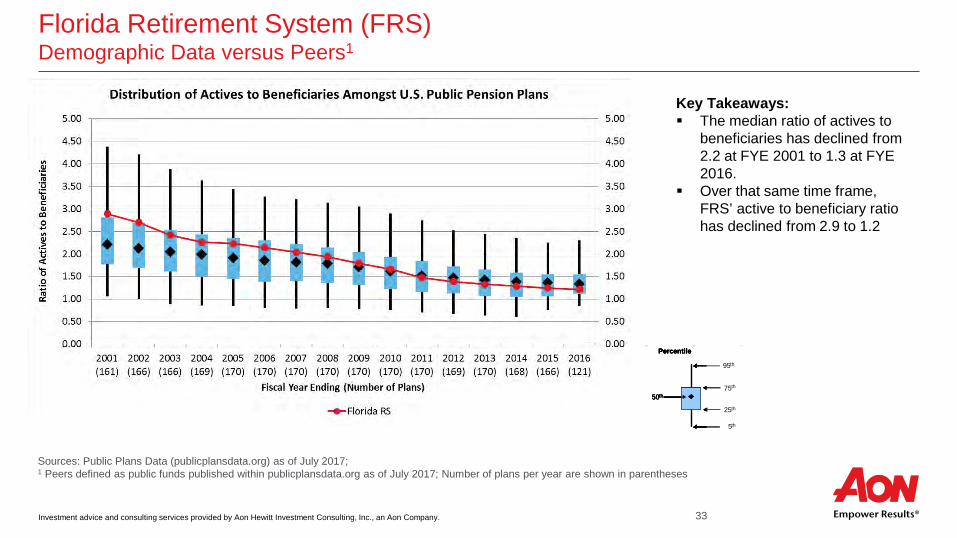
Investment advice and consulting services provided by Aon Hewitt Investment Consulting, Inc., an Aon Company. 33
Florida Retirement System (FRS) Demographic Data versus Peers1
Key Takeaways: The median ratio of actives to
beneficiaries has declined from 2.2 at FYE 2001 to 1.3 at FYE 2016.
Over that same time frame, FRS’ active to beneficiary ratio has declined from 2.9 to 1.2
Sources: Public Plans Data (publicplansdata.org) as of July 2017; 1 Peers defined as public funds published within publicplansdata.org as of July 2017; Number of plans per year are shown in parentheses
50th
95th
75th
25th
5th
Percentile
50th
95th
75th
25th
5th
Percentile
50th
95th
75th
25th
5th
Percentile
50th
95th
75th
25th
5th
Percentile

Investment advice and consulting services provided by Aon Hewitt Investment Consulting, Inc., an Aon Company. 34
Florida Retirement System (FRS)Funded Ratio (Based on Actuarial Value of Assets) versus Peers1
Key Takeaways: The median funded ratio as of
FYE 2016 was 74% based on the latest survey data
FRS’ FYE 2016 funded ratio (85%) lied above the 75th
percentile relative to its peers
Sources: Public Plans Data (publicplansdata.org) as of July 2017; 1 Peers defined as public funds published within publicplansdata.org as of July 2017; Number of plans per year are shown in parentheses
50th
95th
75th
25th
5th
Percentile
50th
95th
75th
25th
5th
Percentile
50th
95th
75th
25th
5th
Percentile
50th
95th
75th
25th
5th
Percentile

Investment advice and consulting services provided by Aon Hewitt Investment Consulting, Inc., an Aon Company. 35
Florida Retirement System (FRS)Percentage of Actuarial Contribution Made versus Peers1
Key Takeaway: Median contributions of plans
within the data, as a percentage of the actuarial amount, have been approximately 100% since FYE 2001
Sources: Public Plans Data (publicplansdata.org) as of July 20171 Peers defined as public funds published within publicplansdata.org as of July 2017; Number of plans per year are shown in parentheses
50th
95th
75th
25th
5th
Percentile
50th
95th
75th
25th
5th
Percentile
50th
95th
75th
25th
5th
Percentile
50th
95th
75th
25th
5th
Percentile
Investment advice and consulting services provided by Aon Hewitt Investment Consulting, Inc., an Aon Company. 36
Summary & Conclusions
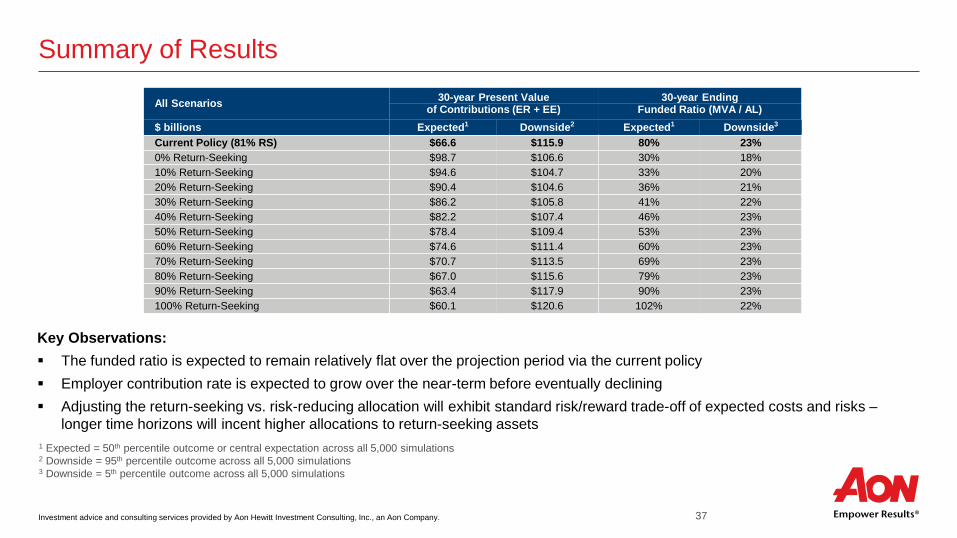
Investment advice and consulting services provided by Aon Hewitt Investment Consulting, Inc., an Aon Company. 37
Summary of Results
Key Observations: The funded ratio is expected to remain relatively flat over the projection period via the current policy Employer contribution rate is expected to grow over the near-term before eventually declining Adjusting the return-seeking vs. risk-reducing allocation will exhibit standard risk/reward trade-off of expected costs and risks –
longer time horizons will incent higher allocations to return-seeking assets
All Scenarios 30-year Present Value 30-year Endingof Contributions (ER + EE) Funded Ratio (MVA / AL)
$ billions Expected1 Downside2 Expected1 Downside3
Current Policy (81% RS) $66.6 $115.9 80% 23%0% Return-Seeking $98.7 $106.6 30% 18%10% Return-Seeking $94.6 $104.7 33% 20%20% Return-Seeking $90.4 $104.6 36% 21%30% Return-Seeking $86.2 $105.8 41% 22%40% Return-Seeking $82.2 $107.4 46% 23%50% Return-Seeking $78.4 $109.4 53% 23%60% Return-Seeking $74.6 $111.4 60% 23%70% Return-Seeking $70.7 $113.5 69% 23%80% Return-Seeking $67.0 $115.6 79% 23%90% Return-Seeking $63.4 $117.9 90% 23%100% Return-Seeking $60.1 $120.6 102% 22%
1 Expected = 50th percentile outcome or central expectation across all 5,000 simulations2 Downside = 95th percentile outcome across all 5,000 simulations3 Downside = 5th percentile outcome across all 5,000 simulations
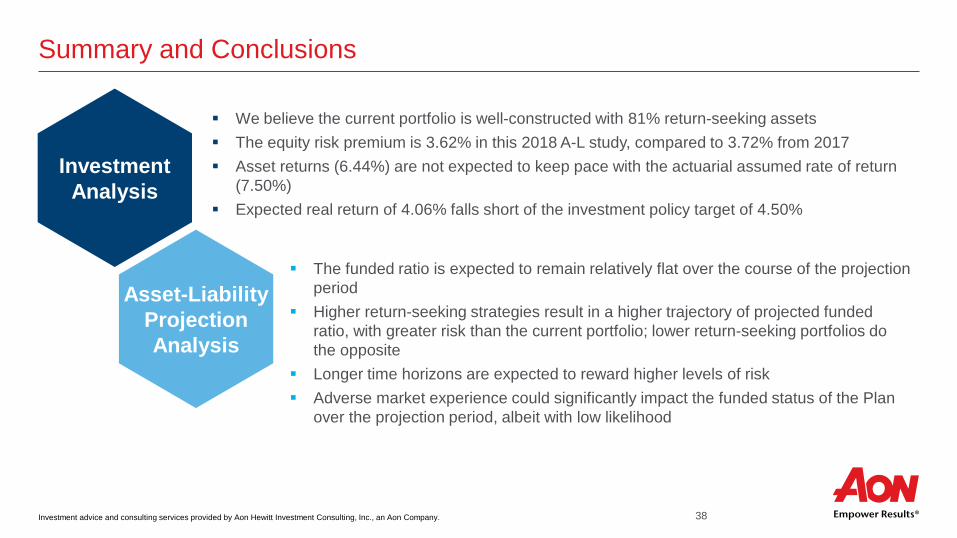
Investment advice and consulting services provided by Aon Hewitt Investment Consulting, Inc., an Aon Company. 38
Summary and Conclusions
We believe the current portfolio is well-constructed with 81% return-seeking assets The equity risk premium is 3.62% in this 2018 A-L study, compared to 3.72% from 2017 Asset returns (6.44%) are not expected to keep pace with the actuarial assumed rate of return
(7.50%) Expected real return of 4.06% falls short of the investment policy target of 4.50%
The funded ratio is expected to remain relatively flat over the course of the projection period
Higher return-seeking strategies result in a higher trajectory of projected funded ratio, with greater risk than the current portfolio; lower return-seeking portfolios do the opposite
Longer time horizons are expected to reward higher levels of risk Adverse market experience could significantly impact the funded status of the Plan
over the projection period, albeit with low likelihood
InvestmentAnalysis
Asset-LiabilityProjectionAnalysis

Investment advice and consulting services provided by Aon Hewitt Investment Consulting, Inc., an Aon Company. 39
Appendix Additional Detail

Investment advice and consulting services provided by Aon Hewitt Investment Consulting, Inc., an Aon Company. 40
Types of Risk Time Horizon Risk Management Tools and Controls
Return Shortfall Assets do not grow with liabilities Investment return & contribution less than liability
growth
Long-Term(10+ years)
Funding policy Plan design Investment policy Assumptions & methods
Liquidity Cannot liquidate assets efficiently to meet needs Lose control of asset allocation
Short- to Medium-Term(<5 years)
Funding policy Benefit accruals Use of Illiquid investments Scenario analysis Monitoring
Investment Asset allocation (policy) Investment structure Manager selection Rebalancing Scenario (or path risk) Factor
Short-to Medium-Term(<5 years)
Investment policy statement– Static/dynamic– Asset allocation– Rebalancing– Manager guidelines– Monitoring/roles & responsibilities
Risk budgeting Monitoring / dashboards Medium term views Regression and scenario analysis
Asset-Liability Management Background Key Risks for Public Pension Plans

Investment advice and consulting services provided by Aon Hewitt Investment Consulting, Inc., an Aon Company. 41
Asset-Liability Management BackgroundOverview of the Asset-Liability Study Process
+ ++Planning Objectives of the
Study Modeling and
Liability Assumptions
Risk Tolerance Risk Preference Demographics Funded Status Business/Financial Industry Practices
Liability Analysis Cost Projections Funded Status Sensitivity Analysis
Asset Modeling Capital Market
Analysis Efficient Frontier
Analysis Portfolios for Study
Desired Outcomes: Understand the pension risk Identify optimal investment strategy
Planning Discussions Asset-Liability Projections
Implementation
Monitoring & Execution

Investment advice and consulting services provided by Aon Hewitt Investment Consulting, Inc., an Aon Company. 42
Asset-Liability Management Background Modeling Process
Goals of an asset-liability study: Understand the pension plan’s asset-liability risk, and Identify the optimal investment strategies
Stochastic, Monte Carlo simulation analysis used 5,000 independent economic trials Building block approach
‒ Starts with inflation and interest rates‒ Using a multi-factor regression analysis, other
asset classes are then modeled Assets and liabilities are modeled over the projection
period‒ Projections include contribution requirements and
funded ratios
Asset-liability studies are best-suited to determine the optimal mix of return-seeking (e.g., equity) and fixed income assets for the pension fund Asset mix is the single most important investment
decision for the plan sponsor‒ Is it worthwhile to have a more aggressive
allocation in order to reduce long term cost in exchange for risk of higher costs in a bad outcome?
‒ Is it worthwhile to have a more conservative allocation in order to have a more predictable cost in exchange for potentially higher average costs?

Investment advice and consulting services provided by Aon Hewitt Investment Consulting, Inc., an Aon Company. 43
Asset-Liability Management Background Utility Factor For Terminal Funded Status
Modest deviations from 100% funding are normal, and no special adjustment is needed for these scenarios – the amount of surplus or unfunded liability can be reflected at its dollar value
As surplus amounts grow to very high levels, there is a declining value, or utility, to the surplus: Contributions cannot go below zero Long contribution holidays may create a false sense of how much the plan really costs, and lead to
confusion when cost levels revert to “normal” Large surplus amounts can become a potential target for non-pension applications
As unfunded amounts grow to very high levels, there is an increasing amount of “pain” as contributions rise to unacceptable levels: May be viewed as “breaking trust” with future taxpayers Freezing of the pension plan becomes a possibility
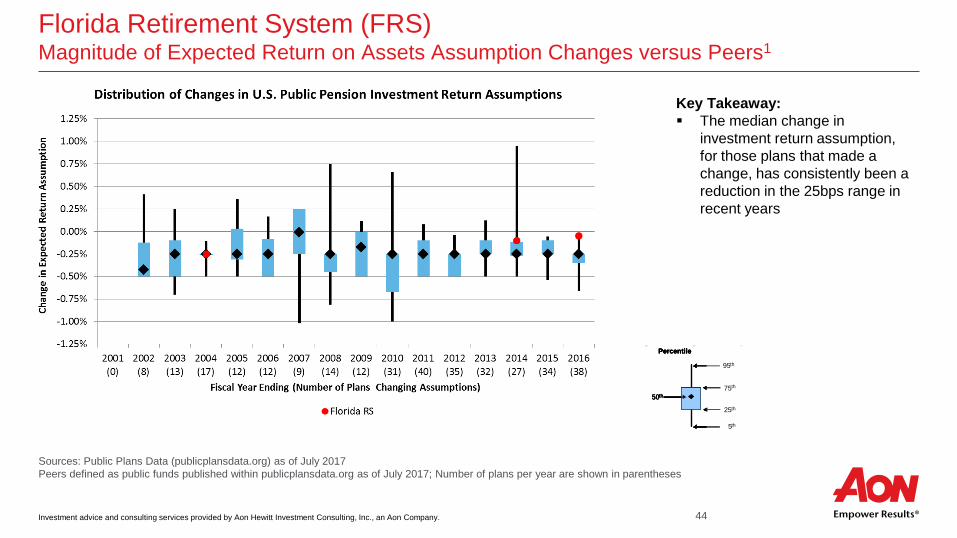
Investment advice and consulting services provided by Aon Hewitt Investment Consulting, Inc., an Aon Company. 44
Florida Retirement System (FRS) Magnitude of Expected Return on Assets Assumption Changes versus Peers1
Sources: Public Plans Data (publicplansdata.org) as of July 2017Peers defined as public funds published within publicplansdata.org as of July 2017; Number of plans per year are shown in parentheses
Key Takeaway: The median change in
investment return assumption, for those plans that made a change, has consistently been a reduction in the 25bps range in recent years
50th
95th
75th
25th
5th
Percentile
50th
95th
75th
25th
5th
Percentile
50th
95th
75th
25th
5th
Percentile
50th
95th
75th
25th
5th
Percentile

Investment advice and consulting services provided by Aon Hewitt Investment Consulting, Inc., an Aon Company. 45
Appendix Assumptions & Methods
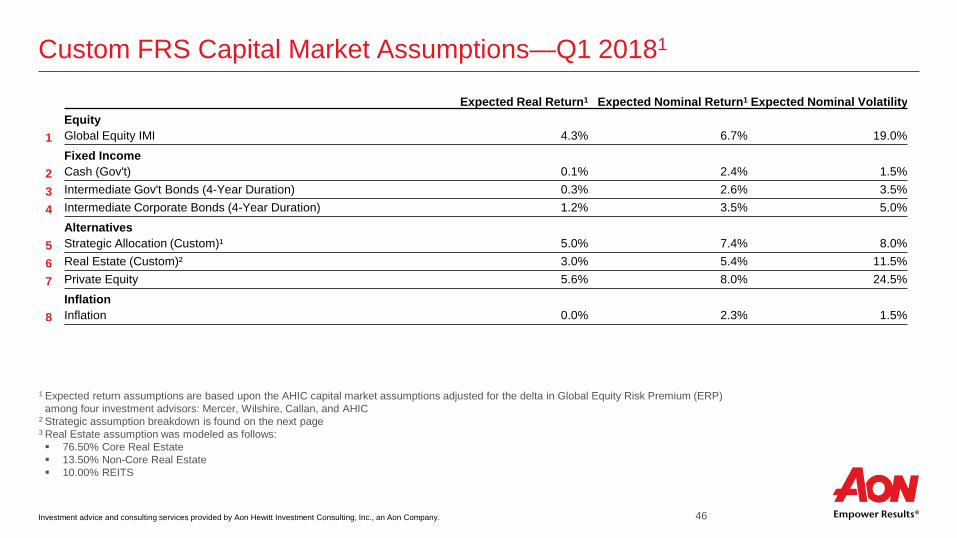
Investment advice and consulting services provided by Aon Hewitt Investment Consulting, Inc., an Aon Company. 46
Custom FRS Capital Market Assumptions—Q1 20181
Expected Real Return1 Expected Nominal Return1 Expected Nominal VolatilityEquity
1 Global Equity IMI 4.3% 6.7% 19.0%Fixed Income
2 Cash (Gov't) 0.1% 2.4% 1.5%3 Intermediate Gov't Bonds (4-Year Duration) 0.3% 2.6% 3.5%4 Intermediate Corporate Bonds (4-Year Duration) 1.2% 3.5% 5.0%
Alternatives5 Strategic Allocation (Custom)¹ 5.0% 7.4% 8.0%6 Real Estate (Custom)² 3.0% 5.4% 11.5%7 Private Equity 5.6% 8.0% 24.5%
Inflation8 Inflation 0.0% 2.3% 1.5%
1 Expected return assumptions are based upon the AHIC capital market assumptions adjusted for the delta in Global Equity Risk Premium (ERP) among four investment advisors: Mercer, Wilshire, Callan, and AHIC
2 Strategic assumption breakdown is found on the next page3 Real Estate assumption was modeled as follows: 76.50% Core Real Estate 13.50% Non-Core Real Estate 10.00% REITS

Investment advice and consulting services provided by Aon Hewitt Investment Consulting, Inc., an Aon Company. 47
FRS Capital Market Assumptions—Q1 2018Strategic Investment Allocation
The Strategic Investment allocation was modeled as follows:
Capital Market Assumption % of Total Asset Allocation
% of StrategicInvestment
Commodities 0.4% 3.3%Global Public Equities 0.8% 6.7%Hedge Funds - CTAs (Buy List) 1.1% 9.2%Hedge Funds - Direct Buy List (Diversified Portfolio of Direct HFs) 2.6% 21.7%Hedge Funds - Distressed Debt (Buy List) 0.5% 4.2%Hedge Funds - Equity Long/Short (Buy List) 0.5% 4.2%Hedge Funds - Event Driven (Buy List) 0.4% 3.3%Hedge Funds - Global Macro (Buy List) 0.8% 6.7%Infrastructure 0.6% 5.0%Insurance-Linked Securities (Catastrophe Bonds) 0.2% 1.7%Non-Core Real Estate 0.5% 4.2%Private Debt - Commercial Mortgages 0.5% 4.2%Private Debt - Direct Lending 0.6% 5.0%Private Equity - Distressed Debt 1.4% 11.7%Private Equity - Mezzanine 0.6% 5.0%Timberland 0.5% 4.2%Total 12.0% 100.0%
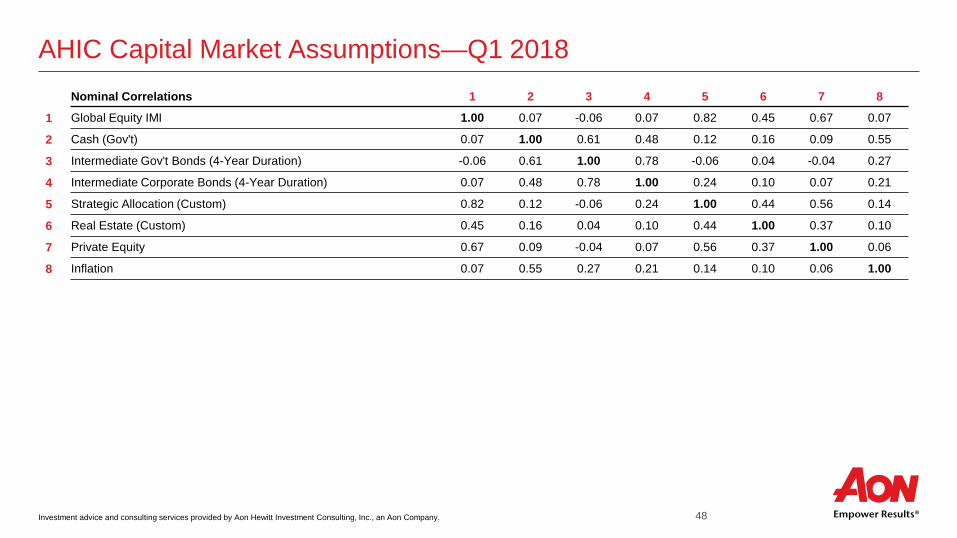
Investment advice and consulting services provided by Aon Hewitt Investment Consulting, Inc., an Aon Company. 48
AHIC Capital Market Assumptions—Q1 2018Nominal Correlations 1 2 3 4 5 6 7 8
1 Global Equity IMI 1.00 0.07 -0.06 0.07 0.82 0.45 0.67 0.07
2 Cash (Gov't) 0.07 1.00 0.61 0.48 0.12 0.16 0.09 0.55
3 Intermediate Gov't Bonds (4-Year Duration) -0.06 0.61 1.00 0.78 -0.06 0.04 -0.04 0.27
4 Intermediate Corporate Bonds (4-Year Duration) 0.07 0.48 0.78 1.00 0.24 0.10 0.07 0.21
5 Strategic Allocation (Custom) 0.82 0.12 -0.06 0.24 1.00 0.44 0.56 0.14
6 Real Estate (Custom) 0.45 0.16 0.04 0.10 0.44 1.00 0.37 0.10
7 Private Equity 0.67 0.09 -0.04 0.07 0.56 0.37 1.00 0.06
8 Inflation 0.07 0.55 0.27 0.21 0.14 0.10 0.06 1.00

Investment advice and consulting services provided by Aon Hewitt Investment Consulting, Inc., an Aon Company. 49
AHIC Capital Market Assumptions Explanation of Capital Market Assumptions—Q1 2018 (30 Years)
The following capital market assumptions were developed by Aon's Global Asset Allocation Team and represent the long-term capital market outlook (i.e., 30 years) based on data at the end of the fourth quarter of 2017. The assumptions were developed using a building block approach, reflecting observable inflation and interest rate information available in the fixed income markets as well as Consensus Economics forecasts. Our long-term assumptions for other asset classes are based on historical results, current market characteristics, and our professional judgment.
Inflation – Expected Level (2.3%)Based on Consensus Economics long-term estimates and our near-term economic outlook, we expect U.S. consumer price inflation to be approximately 2.3% during the next 30 years.
Real Returns for Asset Classes Fixed Income Cash (0.1%) – Over the long run, we expect the real yield on cash and money market instruments to produce a real return of 0.1% in a
moderate- to low-inflationary environment. TIPS (0.9%) – We expect intermediate duration Treasury Inflation-Protected Securities to produce a real return of about 0.9%. Core Fixed Income (i.e., Market Duration) (0.9%) – We expect intermediate duration Treasuries to produce a real return of about 0.3%.
We estimate the fair value credit spread (credit risk premium - expected losses from defaults and downgrades) to be 0.6%, resulting in a long-term real return of 0.9%.
Long Duration Bonds – Government and Credit (1.1%) – We expect Treasuries with a duration comparable to the Long Government Credit Index to produce a real return of 0.6%. We estimate the fair value credit spread (credit risk premium - expected losses from defaults and downgrades) to be 0.5%, resulting in an expected real return of 1.1%.
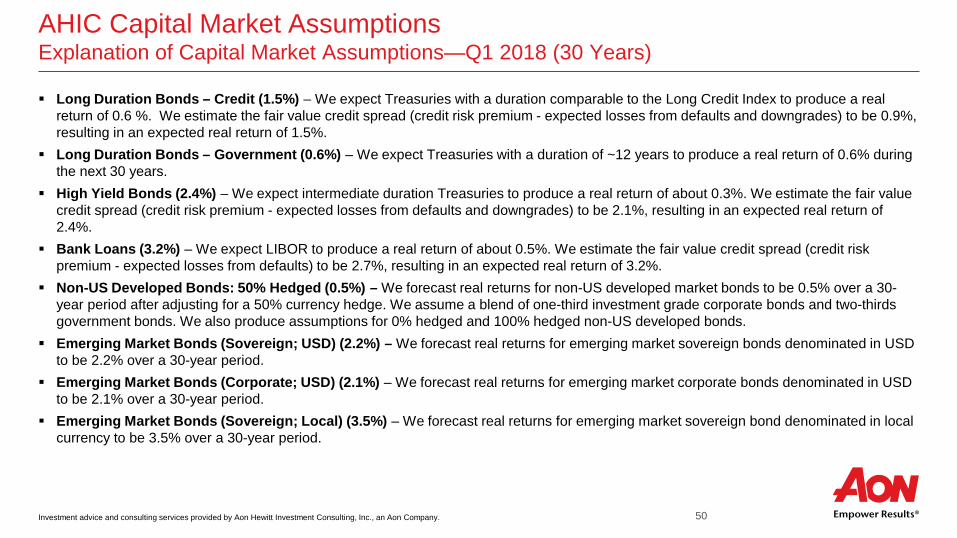
Investment advice and consulting services provided by Aon Hewitt Investment Consulting, Inc., an Aon Company. 50
AHIC Capital Market Assumptions Explanation of Capital Market Assumptions—Q1 2018 (30 Years)
Long Duration Bonds – Credit (1.5%) – We expect Treasuries with a duration comparable to the Long Credit Index to produce a real return of 0.6 %. We estimate the fair value credit spread (credit risk premium - expected losses from defaults and downgrades) to be 0.9%, resulting in an expected real return of 1.5%.
Long Duration Bonds – Government (0.6%) – We expect Treasuries with a duration of ~12 years to produce a real return of 0.6% during the next 30 years.
High Yield Bonds (2.4%) – We expect intermediate duration Treasuries to produce a real return of about 0.3%. We estimate the fair value credit spread (credit risk premium - expected losses from defaults and downgrades) to be 2.1%, resulting in an expected real return of 2.4%.
Bank Loans (3.2%) – We expect LIBOR to produce a real return of about 0.5%. We estimate the fair value credit spread (credit risk premium - expected losses from defaults) to be 2.7%, resulting in an expected real return of 3.2%.
Non-US Developed Bonds: 50% Hedged (0.5%) – We forecast real returns for non-US developed market bonds to be 0.5% over a 30-year period after adjusting for a 50% currency hedge. We assume a blend of one-third investment grade corporate bonds and two-thirds government bonds. We also produce assumptions for 0% hedged and 100% hedged non-US developed bonds.
Emerging Market Bonds (Sovereign; USD) (2.2%) – We forecast real returns for emerging market sovereign bonds denominated in USD to be 2.2% over a 30-year period.
Emerging Market Bonds (Corporate; USD) (2.1%) – We forecast real returns for emerging market corporate bonds denominated in USD to be 2.1% over a 30-year period.
Emerging Market Bonds (Sovereign; Local) (3.5%) – We forecast real returns for emerging market sovereign bond denominated in local currency to be 3.5% over a 30-year period.
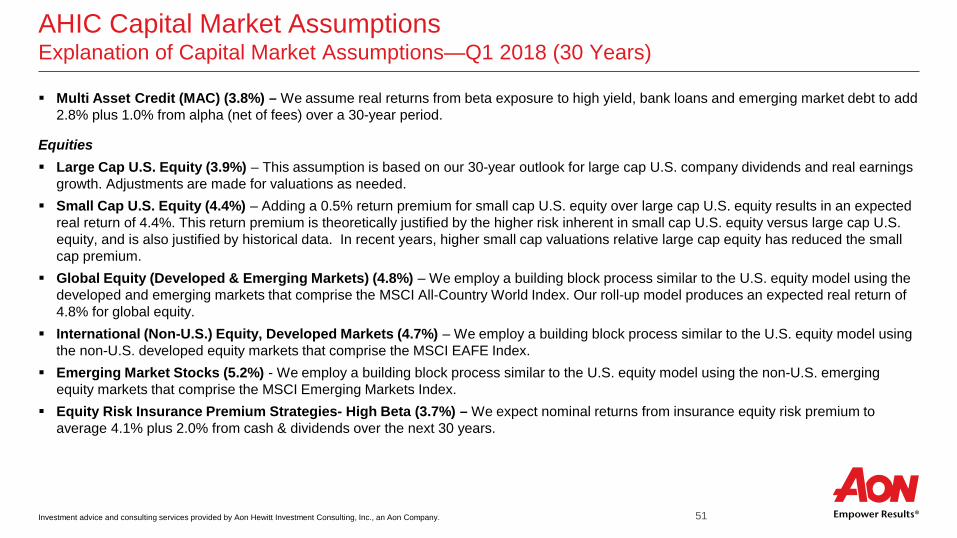
Investment advice and consulting services provided by Aon Hewitt Investment Consulting, Inc., an Aon Company. 51
AHIC Capital Market Assumptions Explanation of Capital Market Assumptions—Q1 2018 (30 Years)
Multi Asset Credit (MAC) (3.8%) – We assume real returns from beta exposure to high yield, bank loans and emerging market debt to add 2.8% plus 1.0% from alpha (net of fees) over a 30-year period.
Equities Large Cap U.S. Equity (3.9%) – This assumption is based on our 30-year outlook for large cap U.S. company dividends and real earnings
growth. Adjustments are made for valuations as needed. Small Cap U.S. Equity (4.4%) – Adding a 0.5% return premium for small cap U.S. equity over large cap U.S. equity results in an expected
real return of 4.4%. This return premium is theoretically justified by the higher risk inherent in small cap U.S. equity versus large cap U.S. equity, and is also justified by historical data. In recent years, higher small cap valuations relative large cap equity has reduced the small cap premium.
Global Equity (Developed & Emerging Markets) (4.8%) – We employ a building block process similar to the U.S. equity model using the developed and emerging markets that comprise the MSCI All-Country World Index. Our roll-up model produces an expected real return of 4.8% for global equity.
International (Non-U.S.) Equity, Developed Markets (4.7%) – We employ a building block process similar to the U.S. equity model using the non-U.S. developed equity markets that comprise the MSCI EAFE Index.
Emerging Market Stocks (5.2%) - We employ a building block process similar to the U.S. equity model using the non-U.S. emerging equity markets that comprise the MSCI Emerging Markets Index.
Equity Risk Insurance Premium Strategies- High Beta (3.7%) – We expect nominal returns from insurance equity risk premium to average 4.1% plus 2.0% from cash & dividends over the next 30 years.

Investment advice and consulting services provided by Aon Hewitt Investment Consulting, Inc., an Aon Company. 52
AHIC Capital Market Assumptions Explanation of Capital Market Assumptions—Q1 2018 (30 Years)
Alternative Asset Classes Hedge Fund-of-Funds Universe (1.7%) – The generic category “hedge funds” encompasses a wide range of strategies accessed through
“fund-of-funds” vehicles. We also assume the median manager is selected and also allow for the additional costs associated with Fund-of-Funds management. A top-tier portfolio of funds (hedge fund-of-funds buy-list) could add an additional 1.1% in return at similar volatility based on alpha, lower fees and better risk management.
Hedge Fund-of-Funds Buy List (2.9%) – The generic category of top-tier “hedge funds” encompasses a wide range of strategies accessed through “fund-of-funds” vehicles. We assume additional costs associated with Funds-of-Funds management. To use this category the funds must be buy rated or we advise on manager selection.
Broad Hedge Funds (3.1%) – Represents a diversified portfolio of direct hedge fund investments. This investment will tend to be less diversified than a typical “fund-of-funds” strategy as there will be fewer underlying managers and will not include the extra layer of fees found in a Fund-of-Funds structure.
Broad Hedge Funds Buy List (4.4%) – Represents a diversified portfolio of top-tier direct hedge fund investments. This investment will tend to be less diversified than a typical “fund-of-funds” strategy as there will be fewer underlying managers and will not include the extra layer of fees found in a Fund-of-Funds structure. To use this category the funds must be buy rated or we advise on manager selection.
Core Real Estate (3.1%) – Our real return assumption for core real estate is based on a gross income of about 4.4%, management fees of roughly 1%, and future capital appreciation near the rate of inflation during the next 30 years. We assume a portfolio of equity real estate holdings that is diversified by property type and geographic region.
U.S. REITs (4.0%) – Our real return assumption for U.S. REITs is based on income of 3.9% and future capital appreciation near the rate of inflation over the next 30 years. REITs are a sub-set of the U.S. small/mid cap equities.
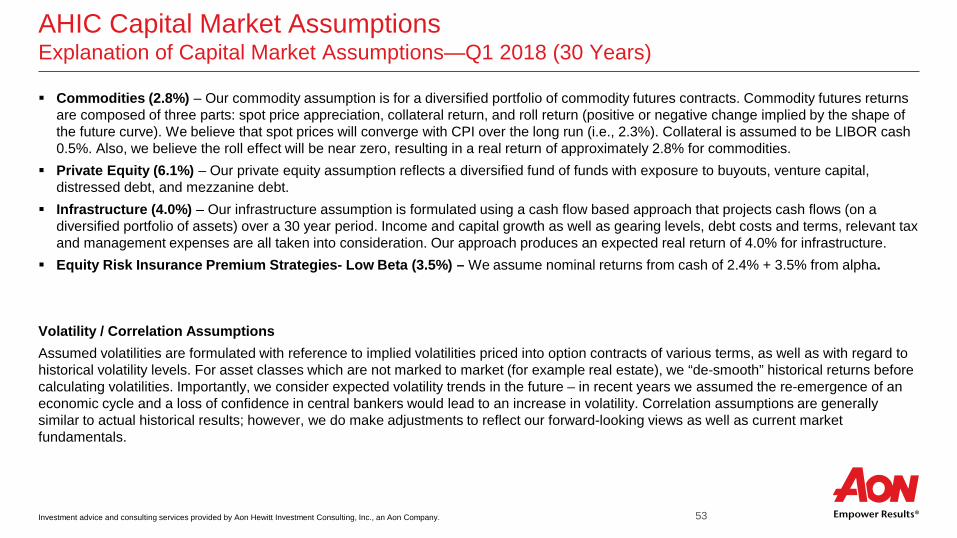
Investment advice and consulting services provided by Aon Hewitt Investment Consulting, Inc., an Aon Company. 53
AHIC Capital Market Assumptions Explanation of Capital Market Assumptions—Q1 2018 (30 Years)
Commodities (2.8%) – Our commodity assumption is for a diversified portfolio of commodity futures contracts. Commodity futures returns are composed of three parts: spot price appreciation, collateral return, and roll return (positive or negative change implied by the shape of the future curve). We believe that spot prices will converge with CPI over the long run (i.e., 2.3%). Collateral is assumed to be LIBOR cash 0.5%. Also, we believe the roll effect will be near zero, resulting in a real return of approximately 2.8% for commodities.
Private Equity (6.1%) – Our private equity assumption reflects a diversified fund of funds with exposure to buyouts, venture capital, distressed debt, and mezzanine debt.
Infrastructure (4.0%) – Our infrastructure assumption is formulated using a cash flow based approach that projects cash flows (on a diversified portfolio of assets) over a 30 year period. Income and capital growth as well as gearing levels, debt costs and terms, relevant tax and management expenses are all taken into consideration. Our approach produces an expected real return of 4.0% for infrastructure.
Equity Risk Insurance Premium Strategies- Low Beta (3.5%) – We assume nominal returns from cash of 2.4% + 3.5% from alpha.
Volatility / Correlation AssumptionsAssumed volatilities are formulated with reference to implied volatilities priced into option contracts of various terms, as well as with regard to historical volatility levels. For asset classes which are not marked to market (for example real estate), we “de-smooth” historical returns before calculating volatilities. Importantly, we consider expected volatility trends in the future – in recent years we assumed the re-emergence of an economic cycle and a loss of confidence in central bankers would lead to an increase in volatility. Correlation assumptions are generally similar to actual historical results; however, we do make adjustments to reflect our forward-looking views as well as current market fundamentals.

Investment advice and consulting services provided by Aon Hewitt Investment Consulting, Inc., an Aon Company. 54
Appendix Horizon Survey of Capital Market Assumptions
Investment advice and consulting services provided by Aon Hewitt Investment Consulting, Inc., an Aon Company. 55
2017 Horizon Survey ResultsAHIC vs. Other Advisors
Since 2010, Horizon Actuarial Services, LLC has conducted a capital market assumption survey of investment firms to aid in determining reasonable assumptions for a pension plan’s expected return on assets While we do not seek to change our approach based on how we stack up to peers, it is a helpful double-check to make sure we are not
too far off from others in the industry
Compared to 2016, the 2017 survey results under the 10-year forecast indicate a slight decrease in return assumptions for both risky assets (equity-like) and fixed income asset classes Equity return assumptions are lower by an average of 0.2% Fixed income return assumptions are lower by an average of 0.3% Alternative asset class return assumptions are lower by an average of 0.1%
2017 AHIC 10-year forecast assumptions tend to be lower than the survey average AHIC equity assumptions are driven by market valuations, earnings growth expectations and assumed payouts to investors. Recent
experience suggests strong equity market performance has been driven more by increasing valuations than increasing profits. As markets have become more expensive, our equity return assumptions have consequently fallen
AHIC fixed income assumptions reflect falling yields and flattening of yield curves during the first quarter of 2017 AHIC alternative asset class assumptions are generally lower due to methodological and inflation forecast differences compared to survey
participant forecasts
In conclusion, AHIC assumptions appear somewhat more conservative than peers included in the 2017 Horizon Survey of capital market assumptions

Investment advice and consulting services provided by Aon Hewitt Investment Consulting, Inc., an Aon Company. 56
2017 Horizon Survey ResultsCapital Market Assumptions from 35 Investment Advisors
Source: Horizon Actuarial survey of 2017 capital market assumptions from 35 independent investment advisorsExpected returns of the survey are annualized over 10-years (geometric). AHIC expected returns are annualized over 10-years as of 2Q 2017
0%2%4%6%8%
10%12%14%
Expected Geometric Returns by Asset Class(10 Year Forecast)
AHIC 10-Yr

Investment advice and consulting services provided by Aon Hewitt Investment Consulting, Inc., an Aon Company. 57
AHIC Versus Peers (2017 Horizon Survey)—10-Year Forecast
Asset Class Expected Return Expected Risk Expected Return Expected Risk DifferenceUS Equity - Large Cap 6.5% 16.6% 6.5% 17.0% 0.0%US Equity - Small/Mid Cap 6.9% 20.2% 6.7% 23.0% -0.2%Non-US Equity - Developed 7.0% 18.9% 7.1% 20.0% 0.1%Non-US Equity - Emerging 8.0% 25.4% 7.5% 30.0% -0.5%US Fixed Income - Core 3.2% 5.5% 2.9% 4.0% -0.3%US Fixed Income - Long Duration Corp 3.6% 10.4% 4.0% 11.0% 0.4%US Fixed Income - High Yield 5.1% 10.6% 3.9% 12.0% -1.2%Non-US Fixed Income - Developed 2.2% 7.4% 2.2% 5.5% 0.0%Non-US Fixed Income - Emerging 5.3% 11.8% 4.1% 13.0% -1.2%Treasuries (Cash Equivalents) 2.3% 3.0% 2.1% 1.0% -0.2%TIPS (Inflation-Protected) 2.9% 6.3% 2.8% 4.5% -0.1%Real Estate 6.2% 14.5% 5.2% 11.5% -1.0%Hedge Funds 4.9% 8.0% 5.0% 9.0% 0.1%Commodities 4.1% 17.9% 4.8% 17.0% 0.8%Infrastructure 6.7% 14.6% 6.2% 14.5% -0.5%Private Equity 9.0% 22.0% 8.6% 24.0% -0.4%Inflation 2.2% 1.7% 2.2% 1.0% 0.0%
Notes (Horizon Survey):Source: Horizon Actuarial survey of 2017 capital market assumptions from 35 independent investment advisorsExpected returns are annualized (geometric).
Notes (AHIC Forecasts):AHIC Forecasts are for Q2 2017US Equity - Small/Mid Cap forecasts represents AHIC forecasts for US Small Cap US Fixed Income - Long Duration forecasts represents AHIC forecasts for Long Duration CreditNon-US Fixed Income - Developed forecasts represents AHIC forecasts for Non-US Fixed Income - Developed (50% Hedged)Non-US Fixed Income- Emerging forecasts represents AHIC forecasts for Non-US Fixed Income- Emerging Sovereign USDReal Estate forecasts represents AHIC forecasts for Core Private Real EstateHedge Funds forecasts represents AHIC forecasts for Hedge Fund-of-Funds (Buy List)
10 Year Forecasts Horizon Survey AHIC10 Year Horizon

Investment advice and consulting services provided by Aon Hewitt Investment Consulting, Inc., an Aon Company. 58
Leading Methodologies
Building Block Global Capital Asset Pricing Model (Global
CAPM) Surveys Historical data (as a guide to future) Black-Litterman (combination of building block
and CAPM)
Reasons for Differences
Methodology Time Horizon Arithmetic vs. Geometric forecasts* Alpha (active management)* Inflation Investment Fees Asset class definition
Leading Methodologies & Reasons for Differences
* While some firms in Horizon survey responded with Arithmetic forecasts, the results have been converted to Geometric forecasts for comparison purposes. Additionally, the return expectations included in the Horizon survey are based on indexed returns (no “alpha”). However, AHIC return assumptions for certain asset classes include “alpha” or active management premium (e.g., Hedge Funds)
Investment advice and consulting services provided by Aon Hewitt Investment Consulting, Inc., an Aon Company. 59
Appendix Investment Guidance for Public Employee Retirement System Trustees
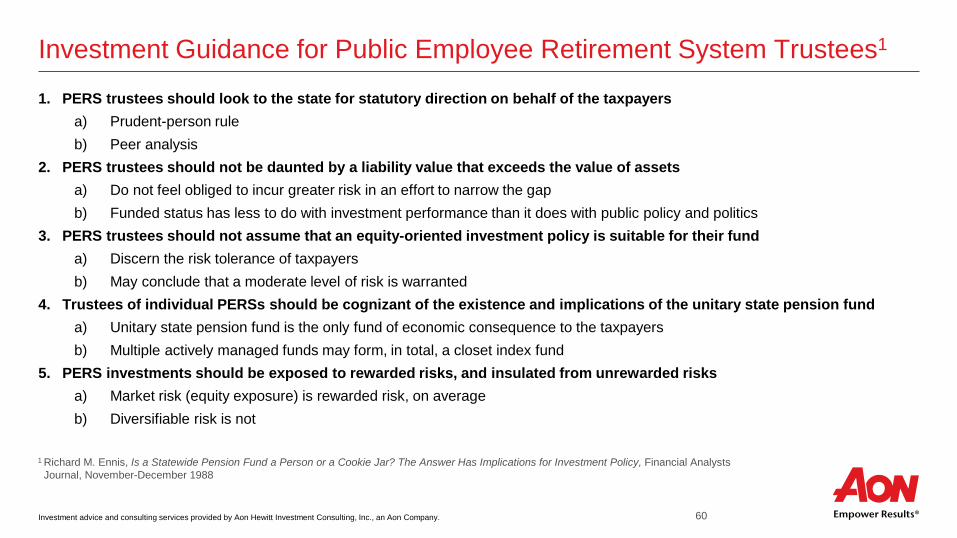
Investment advice and consulting services provided by Aon Hewitt Investment Consulting, Inc., an Aon Company. 60
Investment Guidance for Public Employee Retirement System Trustees1
1. PERS trustees should look to the state for statutory direction on behalf of the taxpayersa) Prudent-person ruleb) Peer analysis
2. PERS trustees should not be daunted by a liability value that exceeds the value of assetsa) Do not feel obliged to incur greater risk in an effort to narrow the gapb) Funded status has less to do with investment performance than it does with public policy and politics
3. PERS trustees should not assume that an equity-oriented investment policy is suitable for their funda) Discern the risk tolerance of taxpayersb) May conclude that a moderate level of risk is warranted
4. Trustees of individual PERSs should be cognizant of the existence and implications of the unitary state pension funda) Unitary state pension fund is the only fund of economic consequence to the taxpayersb) Multiple actively managed funds may form, in total, a closet index fund
5. PERS investments should be exposed to rewarded risks, and insulated from unrewarded risksa) Market risk (equity exposure) is rewarded risk, on averageb) Diversifiable risk is not
1 Richard M. Ennis, Is a Statewide Pension Fund a Person or a Cookie Jar? The Answer Has Implications for Investment Policy, Financial Analysts Journal, November-December 1988
Investment advice and consulting services provided by Aon Hewitt Investment Consulting, Inc., an Aon Company. 61
Appendix About This Material
Investment advice and consulting services provided by Aon Hewitt Investment Consulting, Inc., an Aon Company. 62
About This Material This material includes a summary of calculations and consulting related to the finances of Florida State Board of Administration (SBA). The following variables have been addressed: Contributions, Economic Cost, Funded Ratio, Net Outflow
This analysis is intended to assist the Investment Committee with a review of the associated issues and options, and its use may not be appropriate for other purposes. This analysis has been prepared solely for the benefit of the Investment Committee. Any further dissemination of this report is not allowed without the written consent of Aon Hewitt Investment Consulting, Inc.Our calculations were generally based on the methodologies identified in the actuary’s valuation report for SBA. We believe the methodology used in these calculations conforms to the applicable standards identified in the report. Experience different than anticipated could have a material impact on the ultimate costs of the benefits. In addition, changes in plan provisions or applicable laws could have a significant impact on cost. Actual experience may differ from our modeling assumptions.Our calculations were based on data provided by the plan actuary. The actuarial assumptions and methods and plan provisions reflected in these projections are the same as those used for the 2017 fiscal year actuarial valuation for SBA as noted in the actuarial report, except where noted in this report. Unless specifically noted, our calculations do not reflect any other changes or events after July 1, 2017.In conducting these projections, we have relied on plan design, demographic and financial information provided by other parties, including the plan’s actuary and plan sponsor. While we cannot verify the accuracy of all of the information, the supplied information was reviewed for consistency and reasonableness. As a result of this review, we have no reason to doubt the substantial accuracy or completeness of the information and believe that it has produced appropriate results. These projections have been conducted in accordance with generally accepted actuarial principles and practices, including applicable Actuarial Standards of Practice as issued by the Actuarial Standards Board. The undersigned actuary is familiar with the near-term and long-term aspects of pension valuations and meet the Qualification Standards of the American Academy of Actuaries necessary to render the actuarial opinions contained herein. All sections of this report are considered an integral part of the actuarial opinions. To our knowledge, no associate of Aon Hewitt Investment Consulting, Inc. providing services to SBA has any direct financial interest or indirect material interest in SBA. Thus, we believe there is no relationship existing that might affect our capacity to prepare and certify this report for SBA. Aon Hewitt Investment Consulting, Inc.Phil Kivarkis FSA, CFA

Investment advice and consulting services provided by Aon Hewitt Investment Consulting, Inc., an Aon Company. 63
Legal Disclosures and DisclaimersInvestment advice and consulting services provided by Aon Hewitt Investment Consulting, Inc. (“AHIC”). The information contained herein is given as of the date hereof and does not purport to give information as of any other date. The delivery at any time shall not, under any circumstances, create any implication that there has been a change in the information set forth herein since the date hereof or any obligation to update or provide amendments hereto. This document is not intended to provide, and shall not be relied upon for, accounting, legal or tax advice or investment recommendations. Any accounting, legal, or taxation position described in this presentation is a general statement and shall only be used as a guide. It does not constitute accounting, legal, and tax advice and is based on AHIC’s understanding of current laws and interpretation. This document is intended for general information purposes only and should not be construed as advice or opinions on any specific facts or circumstances. The comments in this summary are based upon AHIC’s preliminary analysis of publicly available information. The content of this document is made available on an “as is” basis, without warranty of any kind. AHIC disclaims any legal liability to any person or organization for loss or damage caused by or resulting from any reliance placed on that content. AHIC. reserves all rights to the content of this document. No part of this document may be reproduced, stored, or transmitted by any means without the express written consent of AHIC. Aon Hewitt Investment Consulting, Inc. is a federally registered investment advisor with the U.S. Securities and Exchange Commission. AHIC is also registered with the Commodity Futures Trading Commission as a commodity pool operator and a commodity trading advisor, and is a member of the National Futures Association. The AHIC ADV Form Part 2A disclosure statement is available upon written request to:
Aon Hewitt Investment Consulting, Inc.200 E. Randolph StreetSuite 1500Chicago, IL 60601ATTN: AHIC Compliance Officer
© Aon plc 2018. All rights reserved.

Comprehensive Benchmarking ReviewFlorida State Board of AdministrationFebruary 2018
Investment advice and consulting services provided by Aon Hewitt Investment Consulting, Inc., an Aon Company.
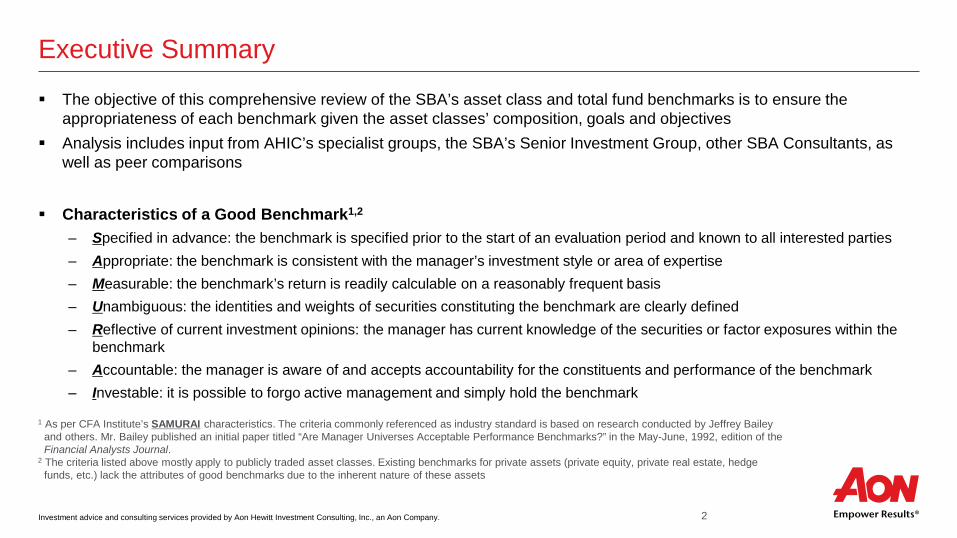
Investment advice and consulting services provided by Aon Hewitt Investment Consulting, Inc., an Aon Company. 2
Executive Summary
The objective of this comprehensive review of the SBA’s asset class and total fund benchmarks is to ensure the appropriateness of each benchmark given the asset classes’ composition, goals and objectives
Analysis includes input from AHIC’s specialist groups, the SBA’s Senior Investment Group, other SBA Consultants, as well as peer comparisons
Characteristics of a Good Benchmark1,2
‒ Specified in advance: the benchmark is specified prior to the start of an evaluation period and known to all interested parties‒ Appropriate: the benchmark is consistent with the manager’s investment style or area of expertise‒ Measurable: the benchmark’s return is readily calculable on a reasonably frequent basis‒ Unambiguous: the identities and weights of securities constituting the benchmark are clearly defined‒ Reflective of current investment opinions: the manager has current knowledge of the securities or factor exposures within the
benchmark‒ Accountable: the manager is aware of and accepts accountability for the constituents and performance of the benchmark‒ Investable: it is possible to forgo active management and simply hold the benchmark
1 As per CFA Institute’s SAMURAI characteristics. The criteria commonly referenced as industry standard is based on research conducted by Jeffrey Bailey and others. Mr. Bailey published an initial paper titled “Are Manager Universes Acceptable Performance Benchmarks?” in the May-June, 1992, edition of the Financial Analysts Journal.
2 The criteria listed above mostly apply to publicly traded asset classes. Existing benchmarks for private assets (private equity, private real estate, hedge funds, etc.) lack the attributes of good benchmarks due to the inherent nature of these assets
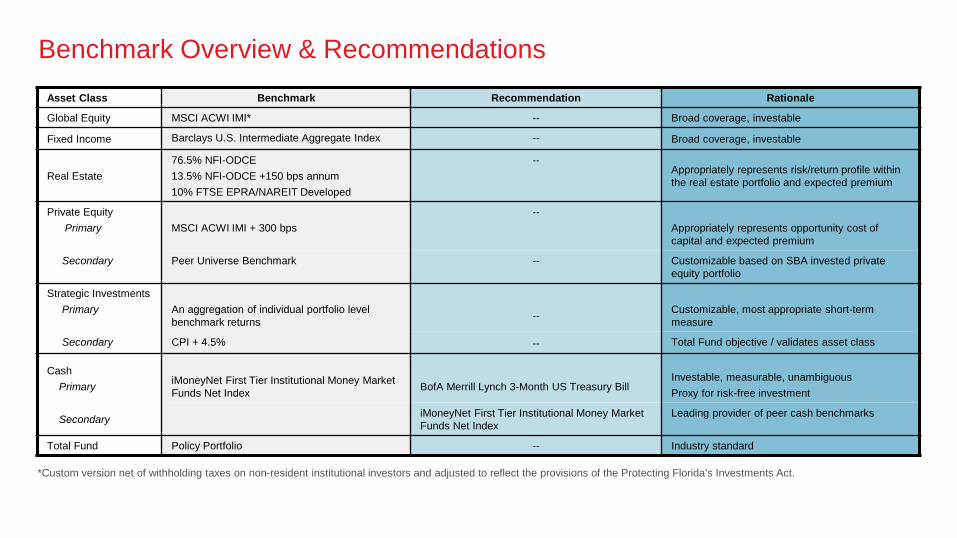
Benchmark Overview & RecommendationsAsset Class Benchmark Recommendation Rationale
Global Equity MSCI ACWI IMI* -- Broad coverage, investable
Fixed Income Barclays U.S. Intermediate Aggregate Index -- Broad coverage, investable
Real Estate 76.5% NFI-ODCE 13.5% NFI-ODCE +150 bps annum10% FTSE EPRA/NAREIT Developed
--Appropriately represents risk/return profile within the real estate portfolio and expected premium
Private EquityPrimary MSCI ACWI IMI + 300 bps
--Appropriately represents opportunity cost of capital and expected premium
Secondary Peer Universe Benchmark -- Customizable based on SBA invested private equity portfolio
Strategic InvestmentsPrimary An aggregation of individual portfolio level
benchmark returns -- Customizable, most appropriate short-term measure
Secondary CPI + 4.5% -- Total Fund objective / validates asset class
CashPrimary iMoneyNet First Tier Institutional Money Market
Funds Net Index BofA Merrill Lynch 3-Month US Treasury Bill Investable, measurable, unambiguousProxy for risk-free investment
Secondary iMoneyNet First Tier Institutional Money Market Funds Net Index
Leading provider of peer cash benchmarks
Total Fund Policy Portfolio -- Industry standard
*Custom version net of withholding taxes on non-resident institutional investors and adjusted to reflect the provisions of the Protecting Florida’s Investments Act.
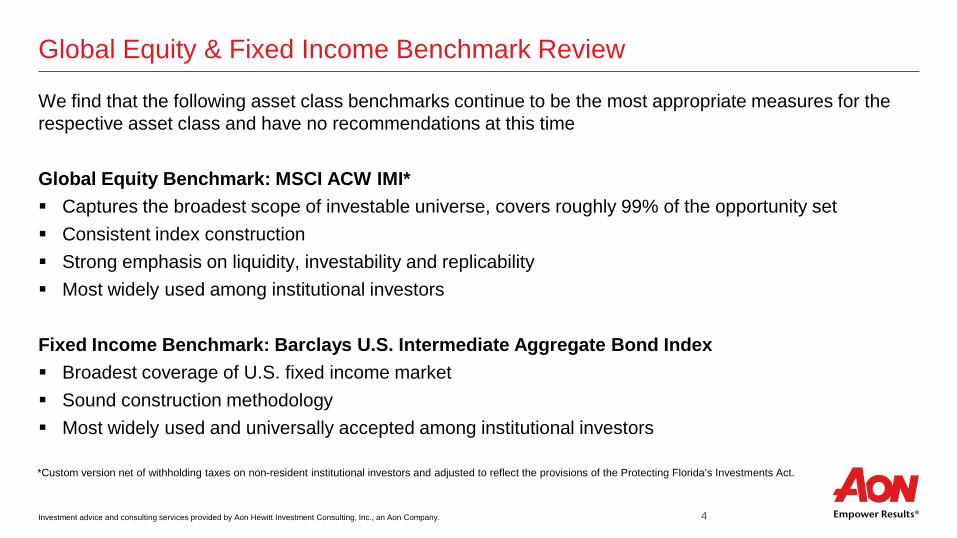
Investment advice and consulting services provided by Aon Hewitt Investment Consulting, Inc., an Aon Company. 4
Global Equity & Fixed Income Benchmark Review
We find that the following asset class benchmarks continue to be the most appropriate measures for the respective asset class and have no recommendations at this time
Global Equity Benchmark: MSCI ACW IMI* Captures the broadest scope of investable universe, covers roughly 99% of the opportunity set Consistent index construction Strong emphasis on liquidity, investability and replicability Most widely used among institutional investors
Fixed Income Benchmark: Barclays U.S. Intermediate Aggregate Bond Index Broadest coverage of U.S. fixed income market Sound construction methodology Most widely used and universally accepted among institutional investors
*Custom version net of withholding taxes on non-resident institutional investors and adjusted to reflect the provisions of the Protecting Florida’s Investments Act.
Investment advice and consulting services provided by Aon Hewitt Investment Consulting, Inc., an Aon Company. 5
Real Estate Benchmark Review
Real Estate Benchmark: 76.5% NFI-ODCE / 13.5% NFI-ODCE +150 bps annum/ 10% FTSE EPRA/NAREIT Developed
FTSE EPRA/NAREIT: broadest coverage of global REIT opportunity set NFI-ODCE: most appropriate core, open-end fund peer benchmark SBA’s Private Real Estate Policy Target: 85% Core and 15% Non-Core A premium better represents the higher expected return from non-core investments 150 bps derived considering the following factors:
‒ Target premium of non-core investments, as stated in SBA’s Real Estate IPS‒ Use of leverage‒ Strong, above benchmark historical performance‒ Forward looking expected returns
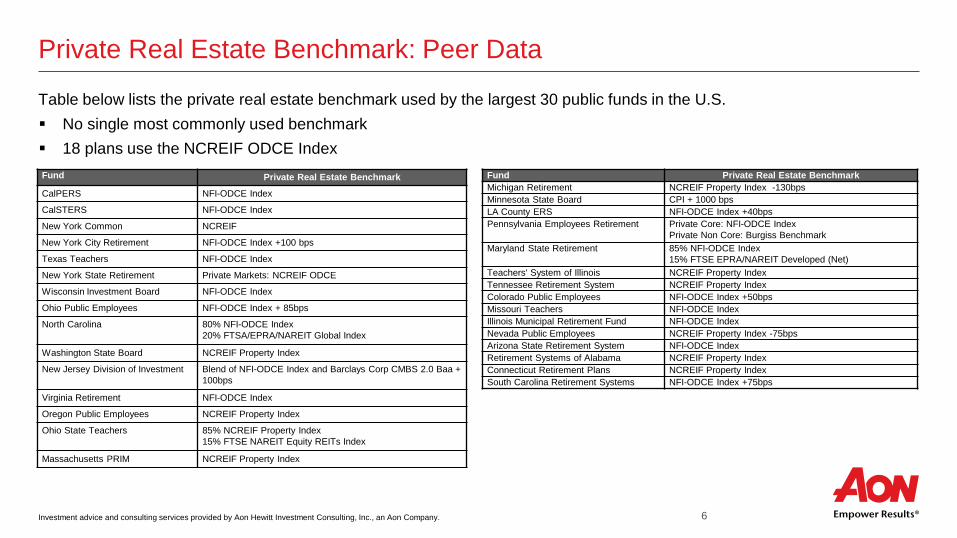
Investment advice and consulting services provided by Aon Hewitt Investment Consulting, Inc., an Aon Company. 6
Private Real Estate Benchmark: Peer Data
Table below lists the private real estate benchmark used by the largest 30 public funds in the U.S. No single most commonly used benchmark 18 plans use the NCREIF ODCE IndexFund Private Real Estate BenchmarkCalPERS NFI-ODCE Index
CalSTERS NFI-ODCE Index
New York Common NCREIF
New York City Retirement NFI-ODCE Index +100 bps
Texas Teachers NFI-ODCE Index
New York State Retirement Private Markets: NCREIF ODCE
Wisconsin Investment Board NFI-ODCE Index
Ohio Public Employees NFI-ODCE Index + 85bps
North Carolina 80% NFI-ODCE Index20% FTSA/EPRA/NAREIT Global Index
Washington State Board NCREIF Property Index
New Jersey Division of Investment Blend of NFI-ODCE Index and Barclays Corp CMBS 2.0 Baa + 100bps
Virginia Retirement NFI-ODCE Index
Oregon Public Employees NCREIF Property Index
Ohio State Teachers 85% NCREIF Property Index15% FTSE NAREIT Equity REITs Index
Massachusetts PRIM NCREIF Property Index
Fund Private Real Estate BenchmarkMichigan Retirement NCREIF Property Index -130bpsMinnesota State Board CPI + 1000 bpsLA County ERS NFI-ODCE Index +40bpsPennsylvania Employees Retirement Private Core: NFI-ODCE Index
Private Non Core: Burgiss BenchmarkMaryland State Retirement 85% NFI-ODCE Index
15% FTSE EPRA/NAREIT Developed (Net)Teachers' System of Illinois NCREIF Property IndexTennessee Retirement System NCREIF Property IndexColorado Public Employees NFI-ODCE Index +50bpsMissouri Teachers NFI-ODCE IndexIllinois Municipal Retirement Fund NFI-ODCE IndexNevada Public Employees NCREIF Property Index -75bpsArizona State Retirement System NFI-ODCE IndexRetirement Systems of Alabama NCREIF Property IndexConnecticut Retirement Plans NCREIF Property IndexSouth Carolina Retirement Systems NFI-ODCE Index +75bps

Investment advice and consulting services provided by Aon Hewitt Investment Consulting, Inc., an Aon Company. 7
Private Equity Review
Private Equity Primary Benchmark – MSCI ACWI IMI Index plus 300 bps annually
Benchmark intended to reflect the opportunity cost of capital Opportunity cost for the SBA is Global Equity
We find the 300 bps premium to be an appropriate level ‒ Private equity continues to demonstrate strong outperformance relative to public equities‒ Fee advantage relative to the median private equity fund‒ SBA’s actual, absolute private equity performance has been strong over long time periods as well as
relative performance‒ Premium level is inline with peers
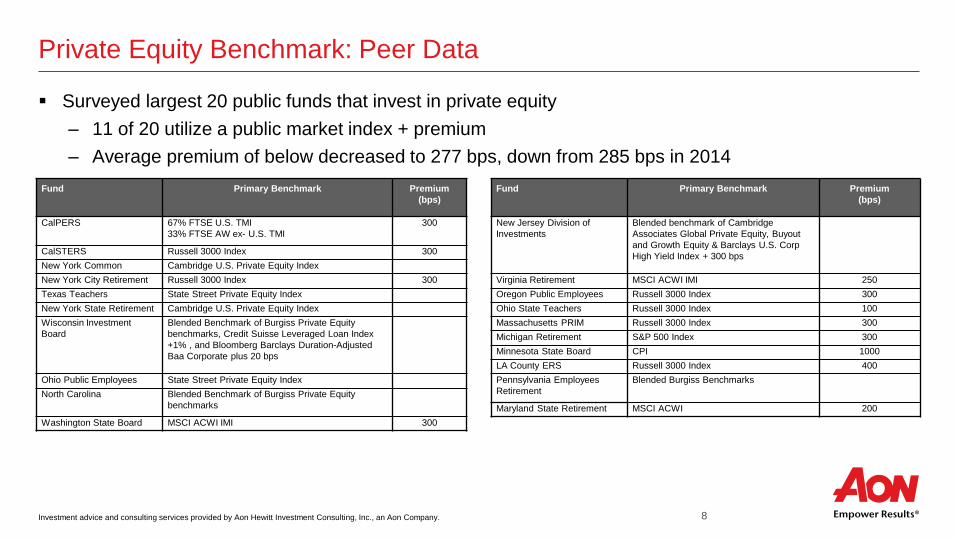
Investment advice and consulting services provided by Aon Hewitt Investment Consulting, Inc., an Aon Company. 8
Private Equity Benchmark: Peer Data
Surveyed largest 20 public funds that invest in private equity ‒ 11 of 20 utilize a public market index + premium‒ Average premium of below decreased to 277 bps, down from 285 bps in 2014
Fund Primary Benchmark Premium (bps)
CalPERS 67% FTSE U.S. TMI33% FTSE AW ex- U.S. TMI
300
CalSTERS Russell 3000 Index 300New York Common Cambridge U.S. Private Equity IndexNew York City Retirement Russell 3000 Index 300Texas Teachers State Street Private Equity IndexNew York State Retirement Cambridge U.S. Private Equity IndexWisconsin Investment Board
Blended Benchmark of Burgiss Private Equity benchmarks, Credit Suisse Leveraged Loan Index +1% , and Bloomberg Barclays Duration-Adjusted Baa Corporate plus 20 bps
Ohio Public Employees State Street Private Equity IndexNorth Carolina Blended Benchmark of Burgiss Private Equity
benchmarks
Washington State Board MSCI ACWI IMI 300
Fund Primary Benchmark Premium (bps)
New Jersey Division of Investments
Blended benchmark of Cambridge Associates Global Private Equity, Buyout and Growth Equity & Barclays U.S. Corp High Yield Index + 300 bps
Virginia Retirement MSCI ACWI IMI 250Oregon Public Employees Russell 3000 Index 300Ohio State Teachers Russell 3000 Index 100Massachusetts PRIM Russell 3000 Index 300Michigan Retirement S&P 500 Index 300Minnesota State Board CPI 1000LA County ERS Russell 3000 Index 400Pennsylvania Employees Retirement
Blended Burgiss Benchmarks
Maryland State Retirement MSCI ACWI 200

Investment advice and consulting services provided by Aon Hewitt Investment Consulting, Inc., an Aon Company. 9
Private Equity Secondary Benchmark Review
Private Equity Secondary Benchmark: Cambridge Associates
The SBA utilizes the joint Cambridge Associates Global Private Equity and Venture Capital Index pooled return at peer group weights as a secondary benchmark
Best reflects a like-invested portfolio to compare performance on an apples-to-apples basis
Compares IRR and multiple on cost with private equity portfolios with similar composition of style and vintage years
We find Cambridge to be a capable and appropriate peer benchmark provider
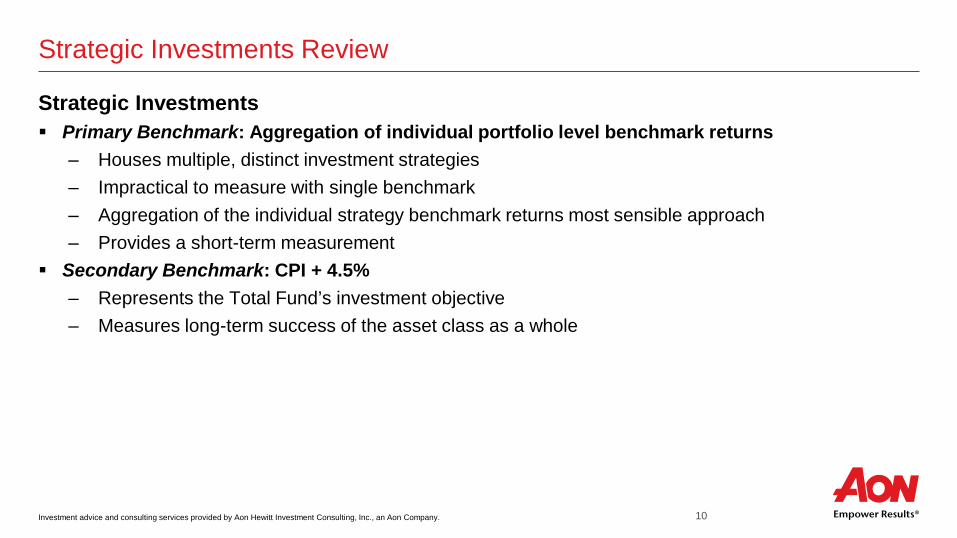
Investment advice and consulting services provided by Aon Hewitt Investment Consulting, Inc., an Aon Company. 10
Strategic Investments Review
Strategic Investments Primary Benchmark: Aggregation of individual portfolio level benchmark returns
‒ Houses multiple, distinct investment strategies ‒ Impractical to measure with single benchmark‒ Aggregation of the individual strategy benchmark returns most sensible approach‒ Provides a short-term measurement
Secondary Benchmark: CPI + 4.5%‒ Represents the Total Fund’s investment objective ‒ Measures long-term success of the asset class as a whole
Investment advice and consulting services provided by Aon Hewitt Investment Consulting, Inc., an Aon Company. 11
Cash Benchmark Recommendation
Primary Benchmark: BofA Merrill Lynch 3-Month US Treasury Index Maturity of 90 days or less is more in line with SBA’s portfolio Proxy for risk-free investment Investable Commonly used benchmark among cash investmentsSecondary Benchmark: iMoneyNet First Tier Institutional Money Market Funds Net Leading provider of peer cash benchmarks Not investable Tends to have longer maturity and contain more ABS than SBA’s portfolio Fee waivers of recent years have increased net of fee returns making comparisons to prior years less
consistent
Investment advice and consulting services provided by Aon Hewitt Investment Consulting, Inc., an Aon Company. 12
Total Fund Benchmark
Total Fund Benchmark: Policy Portfolio Utilization of a blend of the individual asset class benchmarks conforms to standard practice among
institutional investors Passive representation of a fund’s specific asset allocation strategy
‒ An unbiased measure of portfolio success Best characterization of a fund’s requirements to meet its long term objectives – providing funding for
future benefit payments The SBA uses a policy portfolio that floats the Real Estate, Private Equity, and Strategic Investments
asset classes against Global Equity and Fixed Income

Investment advice and consulting services provided by Aon Hewitt Investment Consulting, Inc., an Aon Company. 13
Legal Disclosures and DisclaimersInvestment advice and consulting services provided by Aon Hewitt Investment Consulting, Inc. (“AHIC”). The information contained herein is given as of the date hereof and does not purport to give information as of any other date. The delivery at any time shall not, under any circumstances, create any implication that there has been a change in the information set forth herein since the date hereof or any obligation to update or provide amendments hereto. This document is not intended to provide, and shall not be relied upon for, accounting, legal or tax advice or investment recommendations. Any accounting, legal, or taxation position described in this presentation is a general statement and shall only be used as a guide. It does not constitute accounting, legal, and tax advice and is based on AHIC’s understanding of current laws and interpretation. This document is intended for general information purposes only and should not be construed as advice or opinions on any specific facts or circumstances. The comments in this summary are based upon AHIC’s preliminary analysis of publicly available information. The content of this document is made available on an “as is” basis, without warranty of any kind. AHIC disclaims any legal liability to any person or organization for loss or damage caused by or resulting from any reliance placed on that content. AHIC. reserves all rights to the content of this document. No part of this document may be reproduced, stored, or transmitted by any means without the express written consent of AHIC. Aon Hewitt Investment Consulting, Inc. is a federally registered investment advisor with the U.S. Securities and Exchange Commission. AHIC is also registered with the Commodity Futures Trading Commission as a commodity pool operator and a commodity trading advisor, and is a member of the National Futures Association. The AHIC ADV Form Part 2A disclosure statement is available upon written request to:
Aon Hewitt Investment Consulting, Inc.200 E. Randolph StreetSuite 1500Chicago, IL 60601ATTN: AHIC Compliance Officer
© Aon plc 2018. All rights reserved.

Florida State Board of Administration
Comprehensive Benchmark Review February 2018

Comprehensive Benchmark Review 2
Background and Recommendations Aon Hewitt Investment Consulting (AHIC) conducted a comprehensive benchmark review of the Florida Retirement System Pension Plan’s (the Plan) Asset Class and Total Fund benchmarks. The goal of this review is to ensure the appropriateness of each benchmark given the asset classes’ composition, goals and objectives. Our analysis includes input from AHIC’s specialist groups, including the Private Equity, Real Estate and Liquid Alternatives teams, the Florida State Board of Administration’s (SBA’s) Senior Investment Group, as well as peer comparisons where appropriate. Setting appropriate benchmarks assists the SBA in monitoring and reviewing the performance of the Total Fund and the achievement of the SBA’s investment objectives. Below we list each asset class, the current benchmarks and our recommendations for the SBA based on this review. Global Equity: A custom version of the Morgan Stanley Capital International All Country World Investable Market Index (MSCI ACW IMI), in dollar terms, net of withholding taxes on non-resident institutional investors, adjusted to reflect the provisions of the Protecting Florida’s Investments Act Fixed Income: The Barclays U.S. Intermediate Aggregate Bond Index Real Estate: 76.5% the National Council of Real Estate Investment Fiduciaries (NCREIF) Fund Index – Open-Ended Diversified Core Equity (ODCE), net of fees, 13.5% NCREIF-ODCE, net of fees + 150 basis points, and 10% the FTSE EPRA/ NAREIT Developed Index Private Equity: Primary Benchmark – MSCI ACW IMI plus a 300 basis point premium; Secondary Benchmark – Peer Universe Benchmark Strategic Investments: Primary Benchmark – An aggregation of individual portfolio level benchmark returns; Secondary Benchmark – CPI + 4.5% Cash: iMoneyNet First Tier Institutional Money Market Funds Net Index Recommendation: Use BofA Merrill Lynch 3-Month US Treasury Bill Index as the primary benchmark and iMoneyNet First Tier Institutional Money Market Funds Net Index as the secondary benchmark
Total Fund: A Policy Portfolio – a passive representation of the FRS policy asset allocation strategy, including floating weights for Real Estate, Private Equity, and Strategic Investments against Global Equity and Fixed Income In the following sections, we review the current benchmarks and provide support for the recommendation made above.
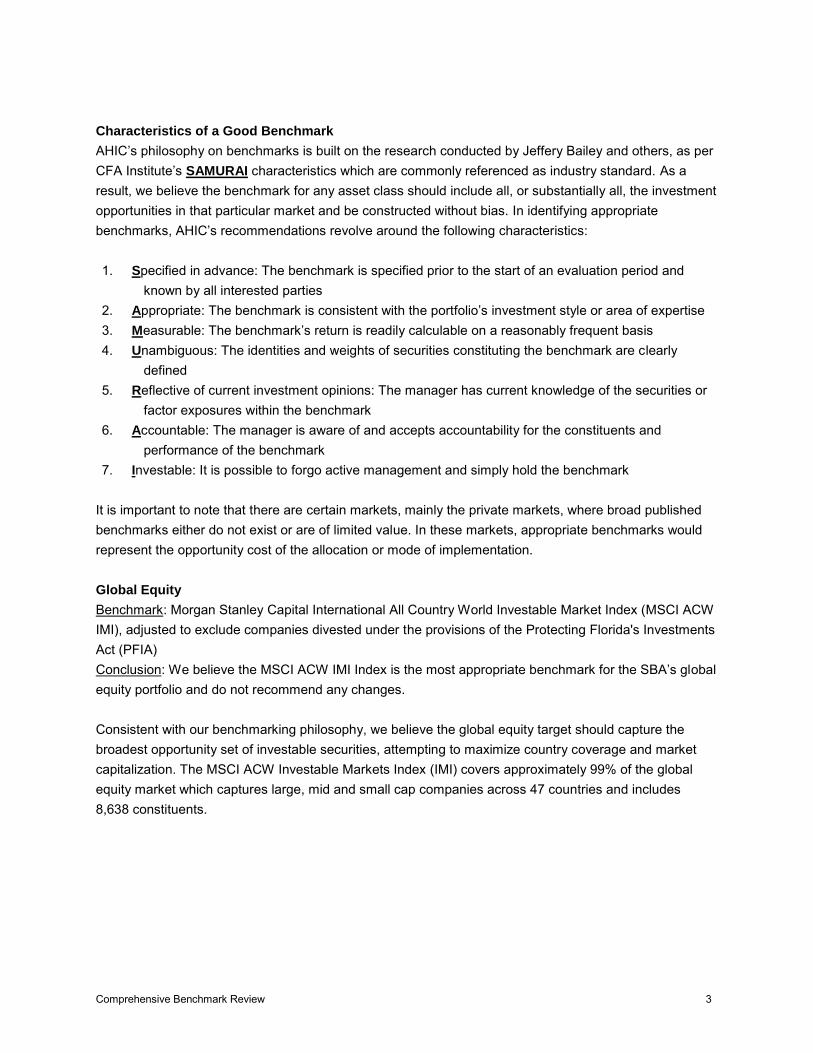
Comprehensive Benchmark Review 3
Characteristics of a Good Benchmark
AHIC’s philosophy on benchmarks is built on the research conducted by Jeffery Bailey and others, as per CFA Institute’s SAMURAI characteristics which are commonly referenced as industry standard. As a result, we believe the benchmark for any asset class should include all, or substantially all, the investment opportunities in that particular market and be constructed without bias. In identifying appropriate benchmarks, AHIC’s recommendations revolve around the following characteristics: 1. Specified in advance: The benchmark is specified prior to the start of an evaluation period and
known by all interested parties 2. Appropriate: The benchmark is consistent with the portfolio’s investment style or area of expertise 3. Measurable: The benchmark’s return is readily calculable on a reasonably frequent basis 4. Unambiguous: The identities and weights of securities constituting the benchmark are clearly
defined 5. Reflective of current investment opinions: The manager has current knowledge of the securities or
factor exposures within the benchmark 6. Accountable: The manager is aware of and accepts accountability for the constituents and
performance of the benchmark 7. Investable: It is possible to forgo active management and simply hold the benchmark
It is important to note that there are certain markets, mainly the private markets, where broad published benchmarks either do not exist or are of limited value. In these markets, appropriate benchmarks would represent the opportunity cost of the allocation or mode of implementation. Global Equity
Benchmark: Morgan Stanley Capital International All Country World Investable Market Index (MSCI ACW IMI), adjusted to exclude companies divested under the provisions of the Protecting Florida's Investments Act (PFIA) Conclusion: We believe the MSCI ACW IMI Index is the most appropriate benchmark for the SBA’s global equity portfolio and do not recommend any changes. Consistent with our benchmarking philosophy, we believe the global equity target should capture the broadest opportunity set of investable securities, attempting to maximize country coverage and market capitalization. The MSCI ACW Investable Markets Index (IMI) covers approximately 99% of the global equity market which captures large, mid and small cap companies across 47 countries and includes 8,638 constituents.

Comprehensive Benchmark Review 4
AHIC considers FTSE and S&P, two other major global equity index providers, as potential alternatives to MSCI. Each provider has a slightly different construction methodology, though all offer global indices that are market-cap weighted, adjusted for free float and have long-track records. While recent historical performance has shown that there is little difference with respect to returns and correlations, we continue to find the MSCI ACW IMI to be the most appropriate for the following reasons: – Implements consistent index construction across size, region and style, providing meaningful
aggregation to the broad index along with broad exposure – Represents 99% of global market capitalization and includes small cap securities – Exhibits low turnover and has a strong emphasis on liquidity, investability and replicability – Represents the most widely used global benchmark provider for institutional investors Other factors that lead us to continue to recommend the MSCI ACW IMI are SBA’s significant passive exposure to the benchmark (47% - 57%), low tracking error (<1%), limited out-of-benchmark exposure (<1%) and regional exposures that are generally in-line with the index.
Fixed Income
Benchmark: The Bloomberg Barclays U.S. Intermediate Aggregate Bond Index Conclusion: We continue to believe the Bloomberg Barclays U.S. Intermediate Aggregate Bond Index is the most appropriate index for the fixed income asset class and do not recommend any changes. The Barclays suite of indices is the most widely-followed and universally accepted performance benchmark among institutional investors. Barclays employs a sound construction methodology and covers a significant portion of the U.S. fixed income market. The Barclays U.S. Intermediate Aggregate Bond Index is designed to track the performance of bonds issued in the U.S. investment-grade bond market. The index includes investment grade issues with a maturity between one and ten years that are dollar denominated and non-convertible. The index includes Treasuries, Agencies, residential and commercial mortgage-backed securities, asset-backed securities, and corporate debt, and is reconstituted on a monthly basis. JP Morgan and Citigroup also provide suites of fixed income benchmarks and have sound construction methodologies. While we find them to be of institutional quality and believe they have leading indices in certain sector specific bond markets, Bloomberg Barclays continues to be the industry leading index provider and we continue to view them favorably given the following: – Market share leader with over $10 trillion benchmarked to Barclays indexes – Deep coverage (70,000 index eligible securities world-wide and more than $50 trillion in assets) – Rules based methodology – Monthly rebalancing – Market value weighted – Emphasis on liquidity

Comprehensive Benchmark Review 5
The SBA is considering adding exposure to sectors outside of the benchmark through “core plus” mandates. We do not see any issues with this since the SBA has considerable room to move higher within their active risk budget. The SBA fixed income portfolio has significant passive exposure to the Bloomberg Barclays Intermediate Aggregate which will act as an anchor limiting excessive tracking error. The SBA is also considering moving to a more barbell strategy, but the overall duration will still be targeted near the current benchmark. Provided that the role of the SBA’s fixed income asset class is primarily to provide downside protection against weak equity markets, dampen volatility, provide stable returns and act as a key source of liquidity, we believe the Barclays U.S. Intermediate Aggregate Bond Index is the most appropriate benchmark. Additionally, SBA’s desire to maintain a moderate duration level with significant passive exposure to the index and plans to stay within current active risk budget affirm the use of the Barclays U.S. Intermediate Aggregate Bond Index as the most appropriate benchmark for the SBA fixed income asset class.
Real Estate
Primary Benchmark: Blend of 76.5% NFI-ODCE Index, net of fees, 13.5% NFI-ODCE, net of fees, + 150 bps, and 10% FTSE EPRA/NAREIT Developed Index. This represents 76.5% Private Core Real Estate, 13.5% Private Non-Core Real Estate, and 10% to Public Market Real Estate investments. Conclusion: We continue to believe the real estate target noted above is an appropriate benchmark given the SBA’s goals and objectives for the asset class.
The Real Estate asset class benchmark continues to be appropriate considering the SBA’s current Real Estate Allocation Policy and macro policy execution. The benchmark split between the core private real estate, non-core private real estate and public market real estate is in line with the SBA’s Real Estate Allocation Policy which states: Public / Private mix: 90% to private real estate investments and 10% to publicly traded real estate
investments (REITs) Private Markets Core / Non-Core mix: 85% core and 15% non-core, which translates to 76.5% and
13.5%, respectively, of the total real estate benchmark. The public market benchmark of the FTSE EPRA/NAREIT Developed Index captures the broad global REIT opportunity set which we believe is the most appropriate index for the public real estate allocation given its objective of investing in a globally diversified public real estate portfolio. The private market benchmark of the NCREIF Fund Index Open-end Diversified Core Equity (NFI-ODCE) Index is a peer benchmark that currently includes investment returns of 24 open-end commingled funds pursuing a core investment strategy. The underlying funds must market themselves as diversified core investment strategies, primarily investing in private equity real estate with at least 80% of net assets invested in office, industrial, apartment, or retail properties. The funds are leveraged, with a max allowable level of 40%. The index offers both gross and net returns. The NFI-ODCE has been widely
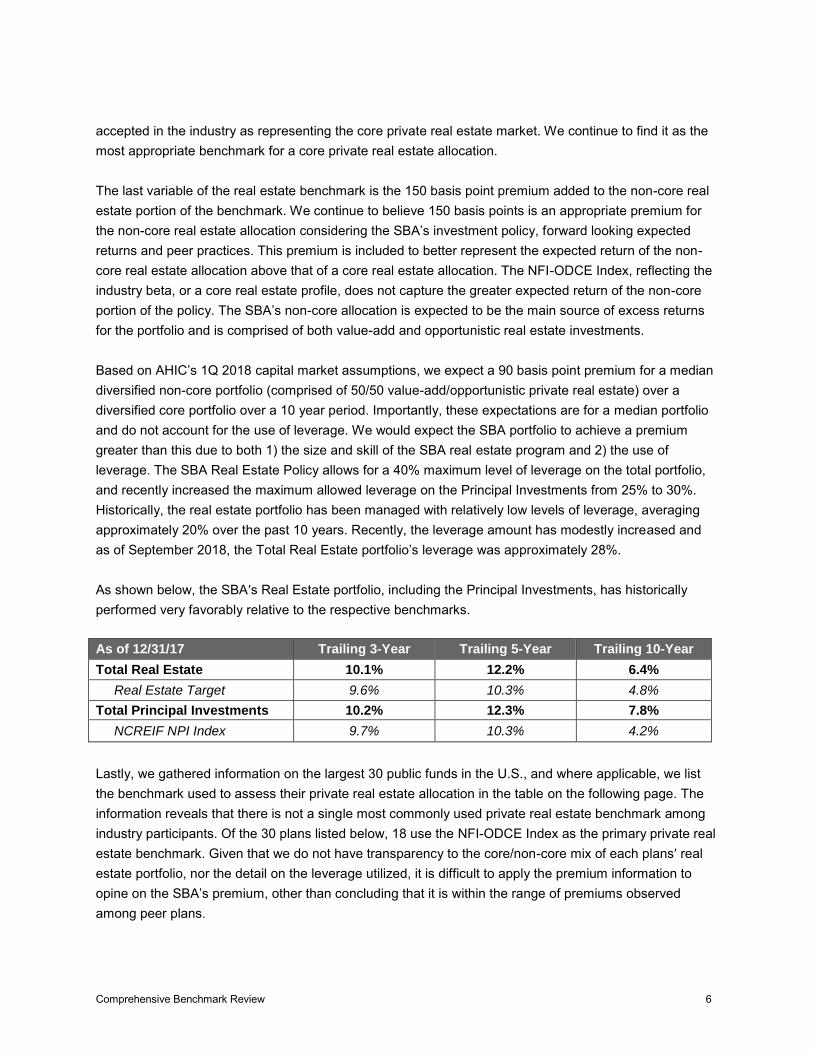
Comprehensive Benchmark Review 6
accepted in the industry as representing the core private real estate market. We continue to find it as the most appropriate benchmark for a core private real estate allocation. The last variable of the real estate benchmark is the 150 basis point premium added to the non-core real estate portion of the benchmark. We continue to believe 150 basis points is an appropriate premium for the non-core real estate allocation considering the SBA’s investment policy, forward looking expected returns and peer practices. This premium is included to better represent the expected return of the non-core real estate allocation above that of a core real estate allocation. The NFI-ODCE Index, reflecting the industry beta, or a core real estate profile, does not capture the greater expected return of the non-core portion of the policy. The SBA’s non-core allocation is expected to be the main source of excess returns for the portfolio and is comprised of both value-add and opportunistic real estate investments. Based on AHIC’s 1Q 2018 capital market assumptions, we expect a 90 basis point premium for a median diversified non-core portfolio (comprised of 50/50 value-add/opportunistic private real estate) over a diversified core portfolio over a 10 year period. Importantly, these expectations are for a median portfolio and do not account for the use of leverage. We would expect the SBA portfolio to achieve a premium greater than this due to both 1) the size and skill of the SBA real estate program and 2) the use of leverage. The SBA Real Estate Policy allows for a 40% maximum level of leverage on the total portfolio, and recently increased the maximum allowed leverage on the Principal Investments from 25% to 30%. Historically, the real estate portfolio has been managed with relatively low levels of leverage, averaging approximately 20% over the past 10 years. Recently, the leverage amount has modestly increased and as of September 2018, the Total Real Estate portfolio’s leverage was approximately 28%. As shown below, the SBA’s Real Estate portfolio, including the Principal Investments, has historically performed very favorably relative to the respective benchmarks. As of 12/31/17 Trailing 3-Year Trailing 5-Year Trailing 10-Year
Total Real Estate 10.1% 12.2% 6.4%
Real Estate Target 9.6% 10.3% 4.8%
Total Principal Investments 10.2% 12.3% 7.8%
NCREIF NPI Index 9.7% 10.3% 4.2%
Lastly, we gathered information on the largest 30 public funds in the U.S., and where applicable, we list the benchmark used to assess their private real estate allocation in the table on the following page. The information reveals that there is not a single most commonly used private real estate benchmark among industry participants. Of the 30 plans listed below, 18 use the NFI-ODCE Index as the primary private real estate benchmark. Given that we do not have transparency to the core/non-core mix of each plans’ real estate portfolio, nor the detail on the leverage utilized, it is difficult to apply the premium information to opine on the SBA’s premium, other than concluding that it is within the range of premiums observed among peer plans.

Comprehensive Benchmark Review 7
Fund Private Real Estate Benchmark Premium
CalPERS NFI-ODCE Index
CalSTERS NFI-ODCE Index
New York Common NCREIF
New York City Retirement NFI-ODCE Index 100
Texas Teachers NFI-ODCE Index New York State Retirement Private Markets: NFI-ODCE Index Wisconsin Investment Board NFI-ODCE Index
Ohio Public Employees NFI-ODCE Index 85
North Carolina 80% NFI-ODCE Index 20% FTSA/EPRA/NAREIT Global Index
Washington State Board NCREIF Property Index
New Jersey Division of Investment Blend of NFI-ODCE Index and Barclays Corp CMBS 2.0 Baa + 100
Virginia Retirement NFI-ODCE Index
Oregon Public Employees NCREIF Property Index
Ohio State Teachers 85% NCREIF Property Index 15% FTSE NAREIT Equity REITs Index
Massachusetts PRIM NCREIF Property Index Michigan Retirement NCREIF Property Index -130
Minnesota State Board CPI + 1000 bps
LA County ERS NFI-ODCE Index 40
Pennsylvania Employees Retirement Private Core: NFI-ODCE Index Private Non-Core: Burgiss Benchmark
Maryland State Retirement
85% NFI-ODCE Index 15% FTSE EPRA/NAREIT Developed (Net)
Teachers' System of Illinois NCREIF Property Index Tennessee Retirement System NCREIF Property Index Colorado Public Employees NFI-ODCE Index 50 Missouri Teachers NFI-ODCE Index Illinois Municipal Retirement Fund NFI-ODCE Index Nevada Public Employees NCREIF Property Index -75 Arizona State Retirement System NFI-ODCE Index Retirement Systems of Alabama NCREIF Property Index Connecticut Retirement Plans NCREIF Property Index South Carolina Retirement Systems NFI-ODCE Index 75
We continue to believe 150 basis points is an appropriate premium for the non-core real estate allocation considering the SBA’s investment policy, forward looking expected returns and peer practices. Provided
Comprehensive Benchmark Review 8
that the SBA has a long term policy allocation to non-core investments that is expected to be the source of excess returns, we continue to believe that the addition of a premium for that portion of the benchmark is appropriate and will better reflect the targeted risk/return profile of the allocation. Private Equity
Primary Benchmark: MSCI ACWI IMI Index + 3% annually
Secondary Benchmark: Cambridge Associates Private Equity Index
Conclusion: The SBA currently uses a public markets index (MSCI ACWI IMI) plus 300 bps for its Private Equity asset class policy benchmark. AHIC is comfortable with the choice of the public market index and views the 300bps premium as being in line with peers and suitable given the expected outperformance of the private equity asset class over public equities.
Unlike traditional market security asset classes, there are no perfect or universally accepted benchmarks for private equity investments given the illiquid and unique characteristics of the asset class. However, the two approaches used by the SBA are the two most common benchmarks we see used by institutional investors. We provide a brief explanation of each below.
Public market index plus a premium: This method measures the opportunity cost of the decision to invest in private equity. Under this approach, institutional investors seek a premium over the return that they would expect to earn from public equities. A premium is added because private equity investments are expected to be more risky than public equity investments, on account of the illiquid nature and early stage of many private equity portfolio companies. Investors expect to earn a higher rate of return to be compensated for the higher risk. It should be noted that an index with a return premium is not investable, violating one of our key benchmarking tenants. Further, public equity markets are priced on a continuous basis and fluctuate more rapidly than illiquid private equity investments. For this reason, there can be significant tracking error and short-term performance comparisons are less meaningful.
Peer Benchmark: Peer benchmarks are the second most commonly used benchmark typically seen for institutional private equity portfolios. Entities such as Cambridge Associates and Burgiss have provided peer benchmarks by collecting cash flow data from institutional private equity investors. Returns are net of fees and carried interest for individual investment funds. These institutions have the ability to compile the returns into different vintage year and geographical benchmarks to provide performance comparisons for like-invested funds. This is important because performance of private equity funds with different vintage years or geographical representation can vary significantly. Private equity returns tend to be cyclical in nature, primarily as a result of the operational costs of a private equity fund which tends to be higher during the earlier years of a fund’s life compared to the payback period (also known as the J-curve effect). In addition to vintage year and geographical groups, peer benchmarks can also be compiled by strategy, such as buyout, venture capital, and distressed debt, as well as by size or sub-category (e.g. early stage, growth stage, large, mega).
For evaluating the performance of an entire portfolio of private equity investments, peer benchmarks can provide returns of composite portfolios that mirror the investor’s own portfolio as well as possible. The composite portfolios are comprised of funds formed in a number of years rather than in one vintage year and the holding period composite returns are pooled rates of return for each investment horizon. One of the downfalls of using peer benchmarks is that the data is only available on a 4-5 month lagged basis.

Comprehensive Benchmark Review 9
We continue to find the SBA’s current approach of using a public market index plus a premium as the primary benchmark and a peer benchmark as the secondary benchmark to be an appropriate and effective means to benchmarking the private equity portfolio. We next evaluated the implementation of these two approaches.
Primary Benchmark: MSCI ACWI IMI Index + 3% annually
The public market index utilized under this method should reflect the opportunity cost of the decision to invest in private equity. The MSCI ACWI IMI is consistent with the SBA’s opportunity cost of capital based on its current Investment Policy. The composition of the MSCI ACWI IMI Index is also broadly aligned with the geographic weightings of the private markets around the world.
The second component of the primary benchmark is the annual premium that is added to the public equity index to compensate for the added risk of investing in private equity. The premium is largely a function of the historical premium that private equity markets have yielded over their public equity counterparts. In addition, we also take into account the expected private equity returns based on our most recent capital market assumptions, as well as identifying industry standards. Historically, we have seen premiums within the range of 200-400 basis points among institutional investors. The SBA’s premium of 300 basis points falls in the middle of this range.
In recent years we have seen the expected premium trending modestly downward. Based on our most recent Capital Market Assumptions (forward looking return expectations for the major asset classes available for investment), we expect private equity to earn a premium over public equities of 150 basis points.
The table below illustrates our latest private equity return expectations:
Based on 1Q 2018 CMAs Model Portfolio
Weights Expected
Return Premium
Venture Capital 24% 10.3% 3.3% Buyouts (LBOs) 54% 7.7% 0.7% Distressed Debt 16% 8.6% 1.6% Mezzanine 6% 7.9% 0.9% Model Private Equity Portfolio 100% 8.5% 1.5%
*Premium reflects the expected return over global equity’s expected return of 7.0%
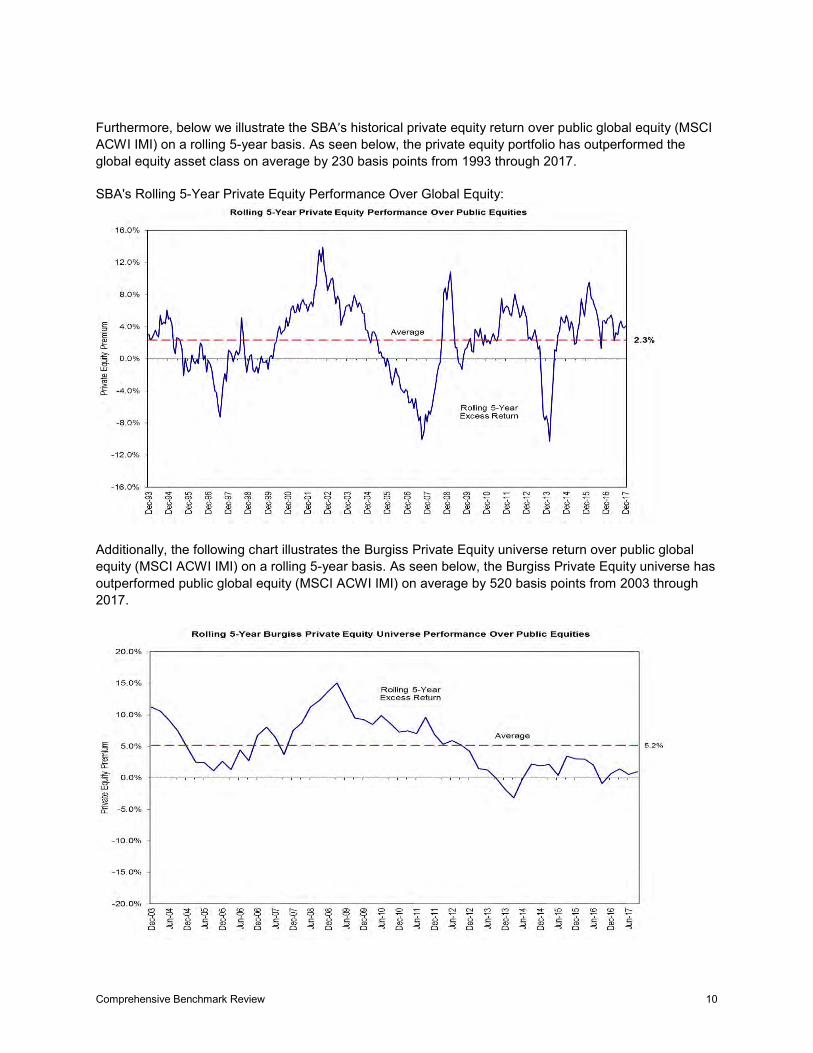
Comprehensive Benchmark Review 10
Furthermore, below we illustrate the SBA’s historical private equity return over public global equity (MSCI ACWI IMI) on a rolling 5-year basis. As seen below, the private equity portfolio has outperformed the global equity asset class on average by 230 basis points from 1993 through 2017.
SBA's Rolling 5-Year Private Equity Performance Over Global Equity:
Additionally, the following chart illustrates the Burgiss Private Equity universe return over public global equity (MSCI ACWI IMI) on a rolling 5-year basis. As seen below, the Burgiss Private Equity universe has outperformed public global equity (MSCI ACWI IMI) on average by 520 basis points from 2003 through 2017.
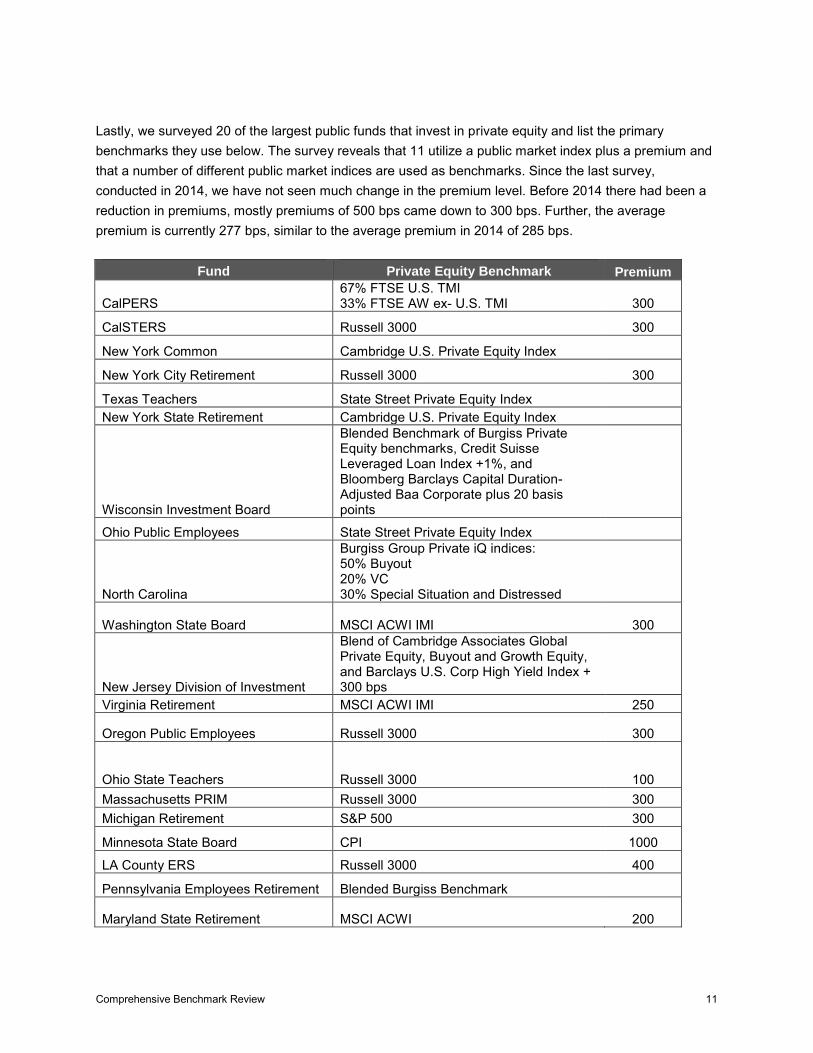
Comprehensive Benchmark Review 11
Lastly, we surveyed 20 of the largest public funds that invest in private equity and list the primary benchmarks they use below. The survey reveals that 11 utilize a public market index plus a premium and that a number of different public market indices are used as benchmarks. Since the last survey, conducted in 2014, we have not seen much change in the premium level. Before 2014 there had been a reduction in premiums, mostly premiums of 500 bps came down to 300 bps. Further, the average premium is currently 277 bps, similar to the average premium in 2014 of 285 bps.
Fund Private Equity Benchmark Premium
CalPERS 67% FTSE U.S. TMI 33% FTSE AW ex- U.S. TMI 300
CalSTERS Russell 3000 300
New York Common Cambridge U.S. Private Equity Index
New York City Retirement Russell 3000 300
Texas Teachers State Street Private Equity Index New York State Retirement Cambridge U.S. Private Equity Index
Wisconsin Investment Board
Blended Benchmark of Burgiss Private Equity benchmarks, Credit Suisse Leveraged Loan Index +1%, and Bloomberg Barclays Capital Duration-Adjusted Baa Corporate plus 20 basis points
Ohio Public Employees State Street Private Equity Index
North Carolina
Burgiss Group Private iQ indices: 50% Buyout 20% VC 30% Special Situation and Distressed
Washington State Board MSCI ACWI IMI 300
New Jersey Division of Investment
Blend of Cambridge Associates Global Private Equity, Buyout and Growth Equity, and Barclays U.S. Corp High Yield Index + 300 bps
Virginia Retirement MSCI ACWI IMI 250
Oregon Public Employees Russell 3000 300
Ohio State Teachers Russell 3000 100 Massachusetts PRIM Russell 3000 300 Michigan Retirement S&P 500 300
Minnesota State Board CPI 1000
LA County ERS Russell 3000 400
Pennsylvania Employees Retirement Blended Burgiss Benchmark
Maryland State Retirement MSCI ACWI 200
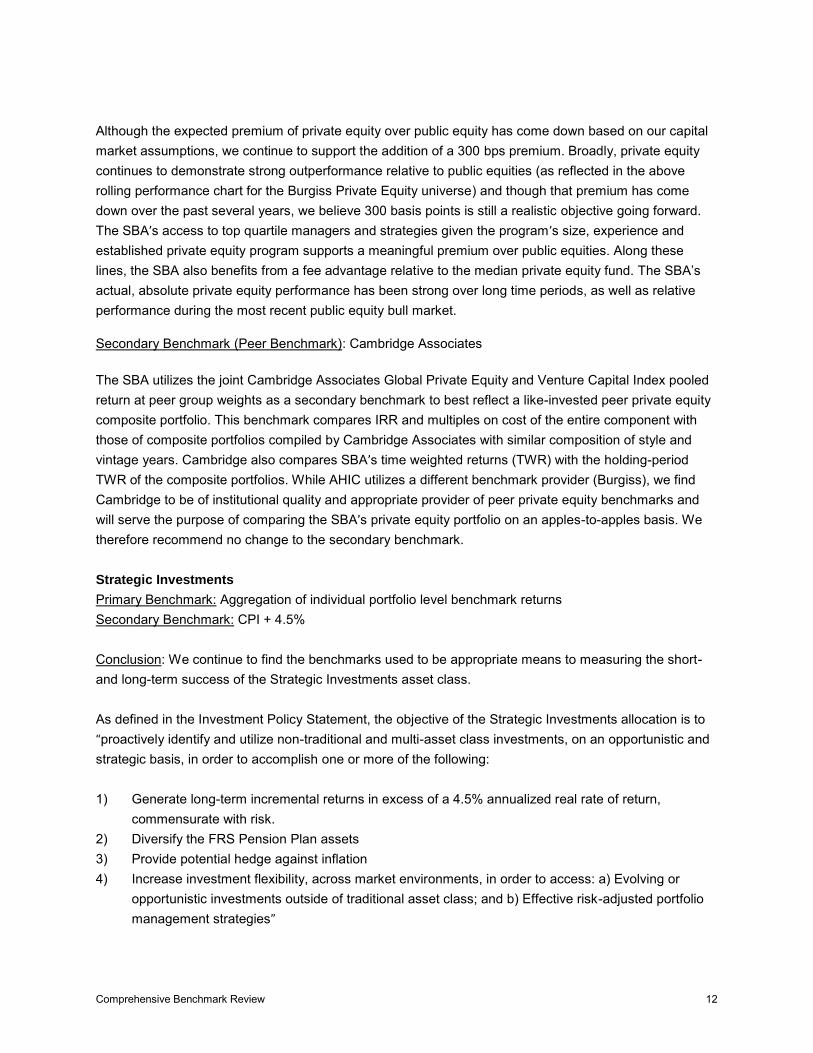
Comprehensive Benchmark Review 12
Although the expected premium of private equity over public equity has come down based on our capital market assumptions, we continue to support the addition of a 300 bps premium. Broadly, private equity continues to demonstrate strong outperformance relative to public equities (as reflected in the above rolling performance chart for the Burgiss Private Equity universe) and though that premium has come down over the past several years, we believe 300 basis points is still a realistic objective going forward. The SBA’s access to top quartile managers and strategies given the program’s size, experience and established private equity program supports a meaningful premium over public equities. Along these lines, the SBA also benefits from a fee advantage relative to the median private equity fund. The SBA’s actual, absolute private equity performance has been strong over long time periods, as well as relative performance during the most recent public equity bull market. Secondary Benchmark (Peer Benchmark): Cambridge Associates
The SBA utilizes the joint Cambridge Associates Global Private Equity and Venture Capital Index pooled return at peer group weights as a secondary benchmark to best reflect a like-invested peer private equity composite portfolio. This benchmark compares IRR and multiples on cost of the entire component with those of composite portfolios compiled by Cambridge Associates with similar composition of style and vintage years. Cambridge also compares SBA’s time weighted returns (TWR) with the holding-period TWR of the composite portfolios. While AHIC utilizes a different benchmark provider (Burgiss), we find Cambridge to be of institutional quality and appropriate provider of peer private equity benchmarks and will serve the purpose of comparing the SBA’s private equity portfolio on an apples-to-apples basis. We therefore recommend no change to the secondary benchmark.
Strategic Investments Primary Benchmark: Aggregation of individual portfolio level benchmark returns Secondary Benchmark: CPI + 4.5% Conclusion: We continue to find the benchmarks used to be appropriate means to measuring the short- and long-term success of the Strategic Investments asset class. As defined in the Investment Policy Statement, the objective of the Strategic Investments allocation is to “proactively identify and utilize non-traditional and multi-asset class investments, on an opportunistic and strategic basis, in order to accomplish one or more of the following: 1) Generate long-term incremental returns in excess of a 4.5% annualized real rate of return,
commensurate with risk. 2) Diversify the FRS Pension Plan assets 3) Provide potential hedge against inflation 4) Increase investment flexibility, across market environments, in order to access: a) Evolving or
opportunistic investments outside of traditional asset class; and b) Effective risk-adjusted portfolio management strategies”

Comprehensive Benchmark Review 13
For portfolios that are more opportunistic, that tend to have more short/intermediate term holding periods in which to take advantage of market dislocations, we believe a good benchmark alternative would be to identify the opportunity cost of allocating to these assets. The opportunity cost may consist of the total plan benchmark or the asset class from where the opportunistic investment was funded. However, in the case of the Strategic Investments allocation, the mandate is much broader with potentially longer holding periods. Therefore, we believe using an aggregation of the individual strategy benchmark returns is the most sensible approach to benchmarking the asset class over the short-term. Since there are no individual strategy allocation targets within the Strategic Investments, the weights should be allowed to float. Over the long-term, it important to be able to measure the portfolio’s stated goals in the IPS which is to provide real returns in excess of 4.5%. As a result, we continue to view CPI + 4.5% as a reasonable approach for a secondary benchmark for Strategic Investments. We support the reduction of the real return target from 5.0% to 4.5%, as reflected in the previous asset liability study and based on lower capital market assumptions. Cash
Benchmark: iMoneyNet First Tier Institutional Money Market Funds Net Index Recommendation: We recommend changing to the iMoneyNet First Tier Institutional Money Market Funds Net Index to the BofA Merrill Lynch 3-Month US Treasury Bill Index. We believe the iMoneyNet First Tier Institutional Money Market Funds Net Index would be a good secondary benchmark. iMoneyNet continues to be a leading provider of peer cash benchmarks, providing the broadest peer index of money market funds available and is widely used in the industry. However, there are certain characteristics of the iMoneyNet benchmark that make it a less desirable index for the SBA’s cash portfolio. iMoneyNet is not investable and is net of fees. Fee waivers have made comparisons more problematic, having altered the return over the past few years. Had money market managers not waived fees, portfolios would have had a yield below zero. Managers chose to artificially manage the portfolio by varying the fee so that the net monthly return was 0 or 1 bps. Additionally, relative to the SBA cash portfolio, the iMoneyNet tends to have a longer maturity and contains exposure to additional sectors that SBA does not tend to invest in (e.g. asset backed securities). That said we believe there is still value in comparisons to peer groups and believe the iMoneyNet will serve as a useful secondary benchmark. There is no perfect benchmark for cash as it would not be feasible to create a custom benchmark from all underlying non-prime money market securities. Since cash has a very low risk profile and its primary purpose is capital preservation, we view risk-free Treasuries of similar maturity as an appropriate passive alternative and recommend the SBA use the BofA Merrill Lynch 3-Month U.S. Treasury Bill index as the primary benchmark. To the extent that the portfolio takes on credit risk or extends maturity, we should view this as active risk. Although the SBA’s investment guidelines allow for maturities greater than 90 days, the BofA Merrill Lynch 3-Month US Treasury Bill’s maturity characteristics tends to be more aligned
Comprehensive Benchmark Review 14
with the SBA cash portfolio than iMoneyNet and is one of the most widely used benchmarks for cash investments. We examined a few other alternatives such as the Bloomberg Barclays 1-3 Month Govt/Corp Index as it offers credit exposure, however corporate bonds would not be an adequate proxy for a commercial paper heavy portfolio. This benchmark is also not commonly used among peers. Total Fund
Benchmark: Policy Portfolio; A blend of asset class benchmarks at Policy weights Conclusion: The total fund benchmark, as a blend of the individual asset class benchmarks, conforms to standard practice among institutional investors. Most investors use a Policy Portfolio to assess the success of their investment programs. A policy portfolio is an unbiased measure of portfolio success. The policy portfolio’s return is the best characterization of a fund’s requirements to meet its long term objectives. Using floating weights, is common practice for plans with allocations to private assets that are in the process of funding or winding down. These weights are often reviewed on an annual basis.

Aon Hewitt | Retirement and Investment Investment advice and consulting services provided by Aon Hewitt Investment Consulting, Inc., an Aon Company. 1
State Board of Administration of Florida Major Mandate Review First Quarter 2018
Aon Hewitt | Retirement and Investment Investment advice and consulting services provided by Aon Hewitt Investment Consulting, Inc., an Aon Company. 2
Table of Contents
1. Executive Summary 2. Pension Plan Review 3. Investment Plan Review 4. CAT Fund Review 5. Lawton Chiles Endowment Fund Review 6. Florida PRIME Review 7. Appendix

Aon Hewitt | Retirement and Investment Investment advice and consulting services provided by Aon Hewitt Investment Consulting, Inc., an Aon Company. 3
Executive Summary
The major mandates each produced generally strong returns relative to their respective benchmarks over both short- and long-term time periods ending March 31, 2018.
The Pension Plan outperformed its Performance Benchmark during the quarter and over the trailing one-, three-, five-, ten-, and fifteen-year periods.
– Over the long-term, Global Equity is the leading source of value added, followed by Strategic Investments, Real Estate and Fixed Income.
– Over the trailing one-, three-. five-, and ten-year periods, the Pension Plan’s return ranked in the top quartile of the TUCS Top Ten Defined Benefit Plan universe.
The FRS Investment Plan has outperformed the Total Plan Aggregate Benchmark during the quarter and over the trailing one-, three-, five-, and ten-year periods.
The Lawton Chiles Endowment Fund outperformed its benchmark during the quarter and over the trailing one-, three-, five-, and ten-year periods.
The CAT Funds’ performance is strong over both short-term and long-term periods, outperforming the benchmark over the trailing one-, three-, five-, and ten-year periods.
Florida PRIME has continued to outperform its benchmark over both short- and long-term time periods.
Aon Hewitt | Retirement and Investment Investment advice and consulting services provided by Aon Hewitt Investment Consulting, Inc., an Aon Company. 4
(This page is left blank intentionally)
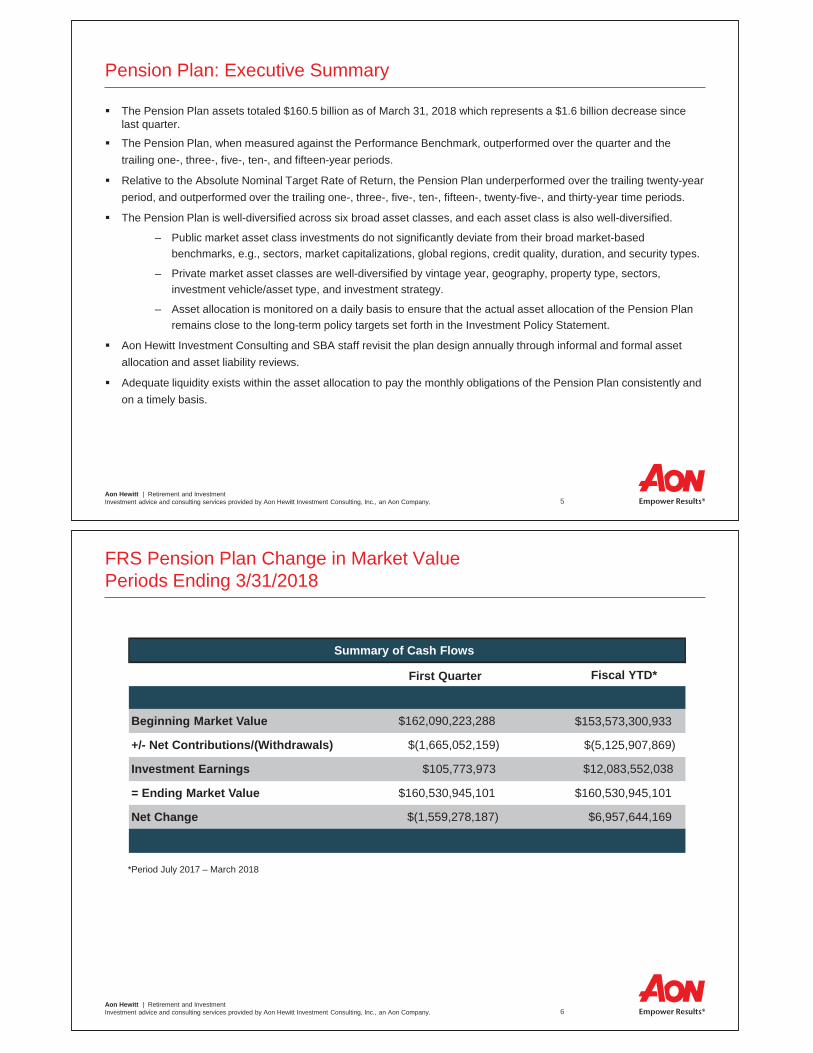
Aon Hewitt | Retirement and Investment Investment advice and consulting services provided by Aon Hewitt Investment Consulting, Inc., an Aon Company. 5
Pension Plan: Executive Summary
The Pension Plan assets totaled $160.5 billion as of March 31, 2018 which represents a $1.6 billion decrease since last quarter. The Pension Plan, when measured against the Performance Benchmark, outperformed over the quarter and the trailing one-, three-, five-, ten-, and fifteen-year periods.
Relative to the Absolute Nominal Target Rate of Return, the Pension Plan underperformed over the trailing twenty-year period, and outperformed over the trailing one-, three-, five-, ten-, fifteen-, twenty-five-, and thirty-year time periods.
The Pension Plan is well-diversified across six broad asset classes, and each asset class is also well-diversified.
– Public market asset class investments do not significantly deviate from their broad market-based benchmarks, e.g., sectors, market capitalizations, global regions, credit quality, duration, and security types.
– Private market asset classes are well-diversified by vintage year, geography, property type, sectors, investment vehicle/asset type, and investment strategy.
– Asset allocation is monitored on a daily basis to ensure that the actual asset allocation of the Pension Plan remains close to the long-term policy targets set forth in the Investment Policy Statement.
Aon Hewitt Investment Consulting and SBA staff revisit the plan design annually through informal and formal asset allocation and asset liability reviews.
Adequate liquidity exists within the asset allocation to pay the monthly obligations of the Pension Plan consistently and on a timely basis.
Aon Hewitt | Retirement and Investment Investment advice and consulting services provided by Aon Hewitt Investment Consulting, Inc., an Aon Company. 6
FRS Pension Plan Change in Market Value Periods Ending 3/31/2018
First Quarter Fiscal YTD*
Beginning Market Value $162,090,223,288
+/- Net Contributions/(Withdrawals) $(1,665,052,159)
Investment Earnings $105,773,973
= Ending Market Value $160,530,945,101
Net Change $(1,559,278,187)
Summary of Cash Flows
*Period July 2017 – March 2018
$153,573,300,933
$(5,125,907,869)
$160,530,945,101
$12,083,552,038
$6,957,644,169

Aon Hewitt | Retirement and Investment Investment advice and consulting services provided by Aon Hewitt Investment Consulting, Inc., an Aon Company. 7
Asset Allocation as of 3/31/2018 Total Fund Assets = $160.5 Billion
* Global Equity became an asset class in July 2010. The historical return series prior to July 2010 was derived from the underlying Domestic Equities, Foreign Equities, and Global Equities components.
Aon Hewitt | Retirement and Investment Investment advice and consulting services provided by Aon Hewitt Investment Consulting, Inc., an Aon Company. 8
0.1
11.9
7.6 8.5
6.7
8.6
-0.5
10.6
6.7 7.6
5.9
8.0
2.3
7.1 6.8 6.4 6.6 6.8
-5.0
0.0
5.0
10.0
15.0
20.0
Quarter 1-Year 3-Year 5-Year 10-Year 15-Year
FRS Pension Plan Investment Results Periods Ending 3/31/2018
Total FRS Pension Plan Performance Benchmark Absolute Nominal Target Rate of Return

Aon Hewitt | Retirement and Investment Investment advice and consulting services provided by Aon Hewitt Investment Consulting, Inc., an Aon Company. 9
6.4
8.2
9.0
6.7 6.9 7.2
0.0
2.0
4.0
6.0
8.0
10.0
12.0
Last 20 Years Last 25 Years Last 30 Years
Annu
aliz
ed R
etur
n (%
)
FRS Pension Plan Investment Results Periods Ending 3/31/2018
vs. SBA's Long-Term Investment Objective Long-Term FRS Pension Plan Performance Results
Total FRS Pension Plan Absolute Nominal Target Rate of Return
Aon Hewitt | Retirement and Investment Investment advice and consulting services provided by Aon Hewitt Investment Consulting, Inc., an Aon Company. 10
Global Equity** 46.7%
Fixed Income 20.4%
Real Estate 7.2%
Alternatives 23.5%
Other 0.0%
Cash 2.3%
Global Equity* 56.6% Fixed Income
18.7%
Real Estate 8.8%
Private Equity 6.8%
Strategic Investments
8.0% Cash 1.1%
Comparison of Asset Allocation (TUCS Top Ten) As of 3/31/2018
FRS Pension Plan vs. Top Ten Defined Benefit Plans
**Global Equity Allocation: 28.3% Domestic Equities; 18.4% Foreign Equities.
FRS TOTAL FUND TUCS TOP TEN
*Global Equity Allocation: 25.6% Domestic Equities; 24.5% Foreign Equities; 5.5% Global Equities; 0.9% Global Equity Liquidity Account. Percentages are of the Total FRS Fund.
Note: The TUCS Top Ten Universe includes $1,516.8 billion in total assets. The median fund size was $151.4 billion and the average fund size was $151.7 billion. Note: Due to rounding, percentage totals displayed may not sum perfectly.
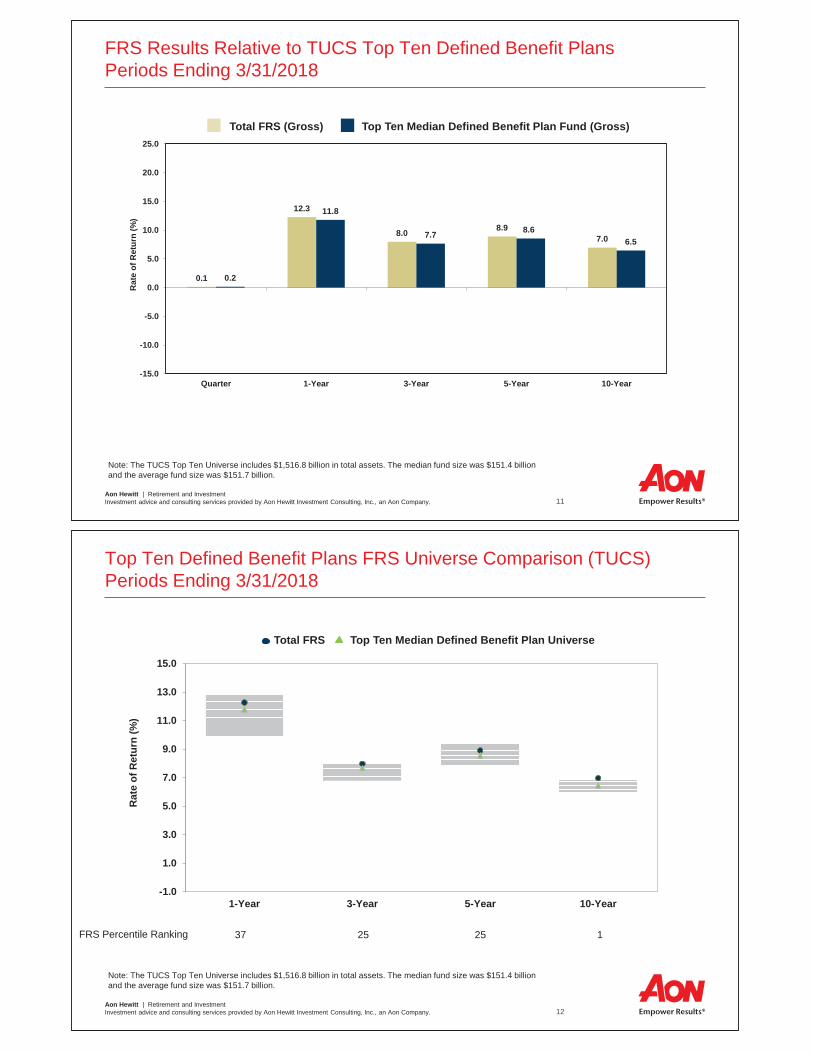
Aon Hewitt | Retirement and Investment Investment advice and consulting services provided by Aon Hewitt Investment Consulting, Inc., an Aon Company. 11
0.1
12.3
8.0 8.9 7.0
0.2
11.8
7.7 8.6 6.5
-15.0
-10.0
-5.0
0.0
5.0
10.0
15.0
20.0
25.0
Quarter 1-Year 3-Year 5-Year 10-Year
Rat
e of
Ret
urn
(%)
FRS Results Relative to TUCS Top Ten Defined Benefit Plans Periods Ending 3/31/2018
Total FRS (Gross) Top Ten Median Defined Benefit Plan Fund (Gross)
Note: The TUCS Top Ten Universe includes $1,516.8 billion in total assets. The median fund size was $151.4 billion and the average fund size was $151.7 billion.
Aon Hewitt | Retirement and Investment Investment advice and consulting services provided by Aon Hewitt Investment Consulting, Inc., an Aon Company. 12
-1.0
1.0
3.0
5.0
7.0
9.0
11.0
13.0
15.0
1-Year 3-Year 5-Year 10-Year
Rat
e of
Ret
urn
(%)
Top Ten Defined Benefit Plans FRS Universe Comparison (TUCS) Periods Ending 3/31/2018
Total FRS Top Ten Median Defined Benefit Plan Universe
FRS Percentile Ranking 37 25 25 1
Note: The TUCS Top Ten Universe includes $1,516.8 billion in total assets. The median fund size was $151.4 billion and the average fund size was $151.7 billion.

Aon Hewitt | Retirement and Investment Investment advice and consulting services provided by Aon Hewitt Investment Consulting, Inc., an Aon Company. 13
Investment Plan: Executive Summary
The FRS Investment Plan outperformed the Total Plan Aggregate Benchmark over the trailing one-, three-, five-, and ten-year periods. This suggests strong relative performance of the underlying fund options in which participants are investing. The FRS Investment Plan’s total expense ratio is slightly higher, on average, when compared to a defined contribution peer group and is lower than the average corporate and public defined benefit plan, based on year-end 2016 data. The total FRS Investment Plan expense ratio includes investment management fees, as well as administration, communication and education costs. Communication and education costs are not charged to FRS Investment Plan members; however, these and similar costs may be charged to members of plans within the peer group. Management fees are lower than the median as represented by Morningstar’s mutual fund universe for every investment category. The FRS Investment Plan offers an appropriate number of fund options that span the risk and return spectrum. The Investment Policy Statement is revisited periodically to ensure that the structure and guidelines of the FRS Investment Plan are appropriate, taking into consideration the FRS Investment Plan’s goals and objectives.
Aon Hewitt | Retirement and Investment Investment advice and consulting services provided by Aon Hewitt Investment Consulting, Inc., an Aon Company. 14
Total Investment Plan Returns & Cost
*Returns shown are net of fees. **Aggregate benchmark returns are an average of the individual portfolio benchmark returns at their actual weights. ***Source: 2016 CEM Benchmarking Report. Peer group for the Five-Year Average Return and Value Added represents the U.S. Median plan return based on
the CEM 2016 Survey that included 145 U.S. defined contribution plans with assets ranging from $72 million to $49.6 billion. Peer group for the Expense Ratio represents a custom peer group for FSBA of 17 DC plans including corporate and public plans with assets between $2.3 - $15.5 billion.
****Returns shown are gross of fees. *****The total FRS Investment Plan expense ratio includes investment management fees, as well as administration, communication and education costs. These
latter costs are not charged to FRS Investment Plan members; however, these and similar costs may be charged to members of plans within the peer group utilized above.
Periods Ending 3/31/2018*
One-Year Three-Year Five-Year Ten-Year
FRS Investment Plan 11.1% 6.6% 7.5% 5.9%
Total Plan Aggregate Benchmark** 10.0% 6.3% 7.1% 5.4%
FRS Investment Plan vs. Total Plan Aggregate Benchmark 1.1 0.3 0.4 0.5
Five-Year Average Return****
Five-Year Net Value Added
Expense Ratio
FRS Investment Plan 7.2% 0.1% 0.33%*****
Peer Group 8.2 0.2 0.26
FRS Investment Plan vs. Peer Group -1.0 -0.1 0.07
Periods Ending 12/31/2016***

Aon Hewitt | Retirement and Investment Investment advice and consulting services provided by Aon Hewitt Investment Consulting, Inc., an Aon Company. 15
CAT Fund: Executive Summary
Returns on an absolute basis continue to be modest given the current low interest rate environment.
Over long-term periods, the relative performance of the CAT Funds has been favorable as they have outperformed the Performance Benchmark over the trialing one-, three-, five-, and ten-year time periods. During the quarter, the CAT Funds either matched or modestly trailed the Performance Benchmark.
The CAT Funds are adequately diversified across issuers within the short-term bond market.
The Investment Portfolio Guidelines appropriately constrain the CAT Funds to invest in short-term and high quality bonds to minimize both interest rate and credit risk.
Adequate liquidity exists to address the cash flow obligations of the CAT Funds.
The Investment Portfolio Guidelines are revisited periodically to ensure that the structure and guidelines of the CAT Funds are appropriate, taking into consideration the CAT Funds’ goals and objectives.
Aon Hewitt | Retirement and Investment Investment advice and consulting services provided by Aon Hewitt Investment Consulting, Inc., an Aon Company. 16
0.33
0.87
0.610.39 0.39
0.29
0.830.60
0.39 0.47
0.000.200.400.600.801.001.201.40
Quarter 1 Year 3 Years 5 Years 10 Years
0.28
1.05
0.29
0.83
0.000.200.400.600.801.001.201.40
Quarter 1 Year
0.29
1.05
0.73
0.29
0.83
0.60
0.000.200.400.600.801.001.201.40
Quarter 1 Year 3 Years
CAT Funds Investment Results Periods Ending 3/31/2018
*CAT Operating Fund: Beginning March 2008, the returns for the CAT Fund reflect marked-to-market returns. Prior to that time, cost-based returns are used. **Performance Benchmark: The CAT Fund was benchmarked to the IBC First Tier through February 2008. From March 2008 to December 2009, it was the Merrill Lynch 1-Month LIBOR. From January 2010 to June 2010, it was a blend of the average of the 3-Month Treasury Bill rate and the iMoneyNet First Tier Institutional Money Market Funds Gross Index. From July 2010 to September 2014, it was a blend of the average of the 3-Month Treasury Bill rate and the iMoneyNet First Tier Institutional Money Market Funds Net Index. Effective October 2014, it is a blend of the average of the Merrill Lynch 1-Yr US Treasury Bill Index and the iMoneyNet First Tier Institutional Money Market Funds Net Index. Beginning February 2018, the CAT Fund was split into two different funds, the CAT Fund Operating Liquidity Fund and the CAT Fund Operating Claims Paying Fund. Beginning February 2018, the CAT Fund Operating Liquidity Fund was benchmarked to the B of A Merrill Lynch 3-6 Month US Treasury Bill Index, and the CAT Fund Operating Claims Paying Fund was benchmarked to itself. Beginning February 2018, the CAT 2013 A and 2016 A Operating Funds were benchmarked to themselves.
Rat
e of
Ret
urn
(%)
CAT 2013 A Operating Fund
Performance Benchmark**
Rat
e of
Ret
urn
(%)
CAT Operating Fund* Performance Benchmark**
CAT 2016 A Operating Fund
Performance Benchmark**
Rat
e of
Ret
urn
(%)

Aon Hewitt | Retirement and Investment Investment advice and consulting services provided by Aon Hewitt Investment Consulting, Inc., an Aon Company. 17
Lawton Chiles Endowment Fund: Executive Summary
Established in July 1999, the Lawton Chiles Endowment Fund (LCEF) was created to provide a source of funding for child health and welfare programs, elder programs and research related to tobacco use.
– The investment objective is to preserve the real value of the net contributed principal and provide annual cash flows for appropriation.
– The Endowment’s investments are diversified across various asset classes including global equity, fixed income, inflation-indexed bonds (TIPS) and cash.
The Endowment assets totaled $762.7 million as of March 31, 2018.
The Endowment’s return outperformed its Target over the quarter and the trailing one-, three-, five-, and ten-year time periods.
Aon Hewitt | Retirement and Investment Investment advice and consulting services provided by Aon Hewitt Investment Consulting, Inc., an Aon Company. 18
Asset Allocation as of 3/31/2018 Total LCEF Assets = $762.7 Million

Aon Hewitt | Retirement and Investment Investment advice and consulting services provided by Aon Hewitt Investment Consulting, Inc., an Aon Company. 19
LCEF Investment Results Periods Ending 3/31/2018
Total LCEF Performance Benchmark
-0.4
12.8
7.4 8.2 6.3
-0.8
11.1
6.3 7.1 5.3
-15.0
-10.0
-5.0
0.0
5.0
10.0
15.0
20.0
25.0
Quarter 1-Year 3-Year 5-Year 10-Year
Annu
aliz
ed R
etur
n (%
)
Aon Hewitt | Retirement and Investment Investment advice and consulting services provided by Aon Hewitt Investment Consulting, Inc., an Aon Company. 20
(This page is left blank intentionally)

Aon Hewitt | Retirement and Investment Investment advice and consulting services provided by Aon Hewitt Investment Consulting, Inc., an Aon Company. 21
Florida Hurricane Catastrophe Fund Background
The purpose of the Florida Hurricane Catastrophe Fund (FHCF) is to provide a stable, ongoing and timely source of reimbursement to insurers for a portion of their hurricane losses. The CAT Fund (Operating Funds), along with CAT 2016 A Fund and CAT 2013 A Fund are internally managed portfolios. As of March 31, 2018, the total value of:
The CAT Fund (Operating Funds) was $14.8 billion The CAT 2016 A Fund was $1.2 billion The CAT 2013 A Fund was $1.0 billion
Aon Hewitt | Retirement and Investment Investment advice and consulting services provided by Aon Hewitt Investment Consulting, Inc., an Aon Company. 22
Florida PRIME: Executive Summary
The purpose of Florida PRIME is safety, liquidity, and competitive returns with minimal risk for participants.
The Investment Policy Statement appropriately constrains Florida PRIME to invest in short-term and high quality bonds to minimize both interest rate and credit risk.
Florida PRIME is adequately diversified across issuers within the short-term bond market, and adequate liquidity exists to address the cash flow obligations of Florida PRIME.
Performance of Florida PRIME has been strong over short- and long-term time periods, outperforming its performance benchmark during the quarter and over the trailing one-, three-, five-, and ten-year time periods.
As of March 31, 2018, the total market value of Florida PRIME was $11.6 billion.
Aon Hewitt Investment Consulting, in conjunction with SBA staff, compiles an annual best practices report that includes a full review of the Investment Policy Statement, operational items, and investment structure for Florida PRIME.
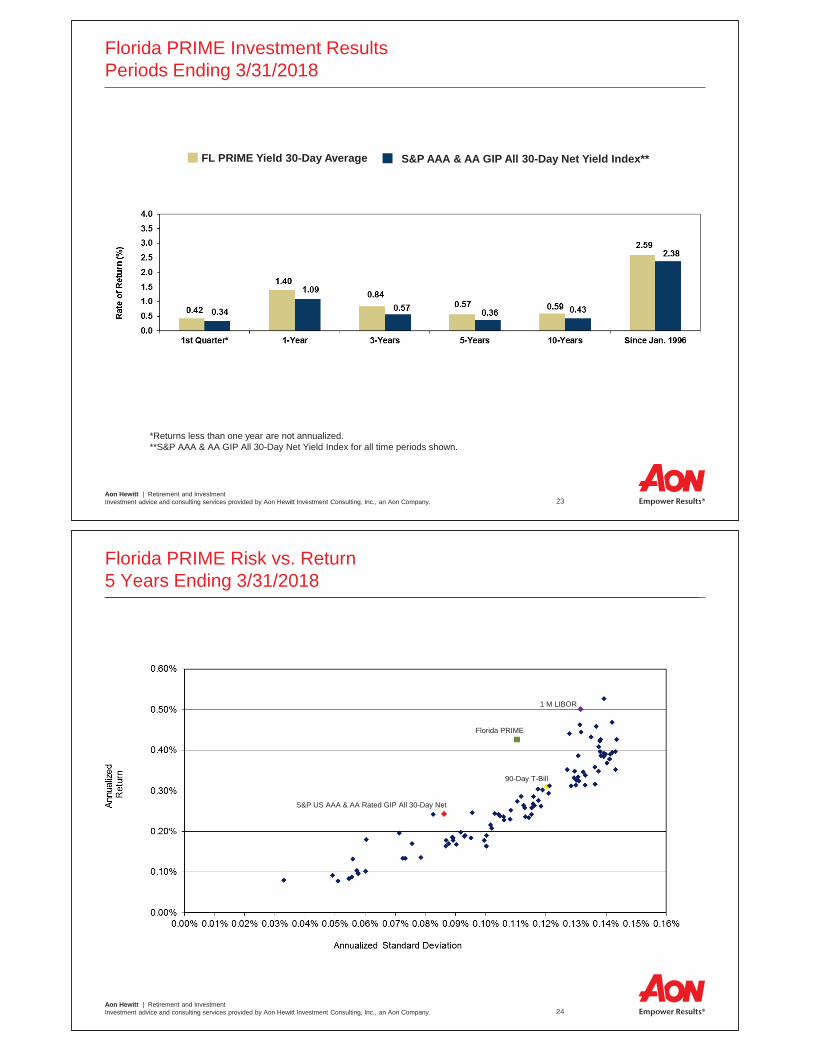
Aon Hewitt | Retirement and Investment Investment advice and consulting services provided by Aon Hewitt Investment Consulting, Inc., an Aon Company. 23
Florida PRIME Investment Results Periods Ending 3/31/2018
*Returns less than one year are not annualized. **S&P AAA & AA GIP All 30-Day Net Yield Index for all time periods shown.
FL PRIME Yield 30-Day Average S&P AAA & AA GIP All 30-Day Net Yield Index**
Aon Hewitt | Retirement and Investment Investment advice and consulting services provided by Aon Hewitt Investment Consulting, Inc., an Aon Company. 24
Florida PRIME
Florida PRIME Risk vs. Return 5 Years Ending 3/31/2018
1 M LIBOR
S&P US AAA & AA Rated GIP All 30-Day Net
90-Day T-Bill

Aon Hewitt | Retirement and Investment Investment advice and consulting services provided by Aon Hewitt Investment Consulting, Inc., an Aon Company. 25
Return Distribution Periods Ending 3/31/2018
Aon Hewitt | Retirement and Investment Investment advice and consulting services provided by Aon Hewitt Investment Consulting, Inc., an Aon Company. 26
Standard Deviation Distribution Periods Ending 3/31/2018

Aon Hewitt | Retirement and Investment Investment advice and consulting services provided by Aon Hewitt Investment Consulting, Inc., an Aon Company. 27
(This page is left blank intentionally)
Aon Hewitt | Retirement and Investment Investment advice and consulting services provided by Aon Hewitt Investment Consulting, Inc., an Aon Company. 28
Appendix

Aon Hewitt | Retirement and Investment Investment advice and consulting services provided by Aon Hewitt Investment Consulting, Inc., an Aon Company. 29
FRS Investment Plan Costs
*Average fee of multiple products in category as of 3/31/2018.
**Source: AHIC’s annual mutual fund expense analysis as of 12/31/2017.
Investment Category Investment Plan Fee* Average Mutual Fund Fee**
Large Cap Equity 0.15% 0.81%
Small-Mid Cap Equity 0.59% 0.95%
International Equity 0.30% 0.97%
Diversified Bonds 0.15% 0.52%
Target Date 0.15% 0.56%
Money Market 0.06% 0.31%
Aon Hewitt | Retirement and Investment Investment advice and consulting services provided by Aon Hewitt Investment Consulting, Inc., an Aon Company. 30
$333 $706
$1,426
$2,306
$3,688
$4,365 $4,075
$5,048
$6,733 $7,136
$7,879
$9,035 $9,129 $8,918
$9,967
$10,653
$0
$2,000
$4,000
$6,000
$8,000
$10,000
$12,000
FY 02-03 FY 03-04 FY 04-05 FY 05-06 FY 06-07 FY 07-08 FY 08-09 FY 09-10 FY 10-11 FY 11-12 FY 12-13 FY 13-14 FY 14-15 FY 15-16 FY 16-17 FY 17-18*
*Period Ending 3/31/2018
Investment Plan Fiscal Year End Assets Under Management
Source: Investment Plan Administrator
By Fiscal Year ($ millions)
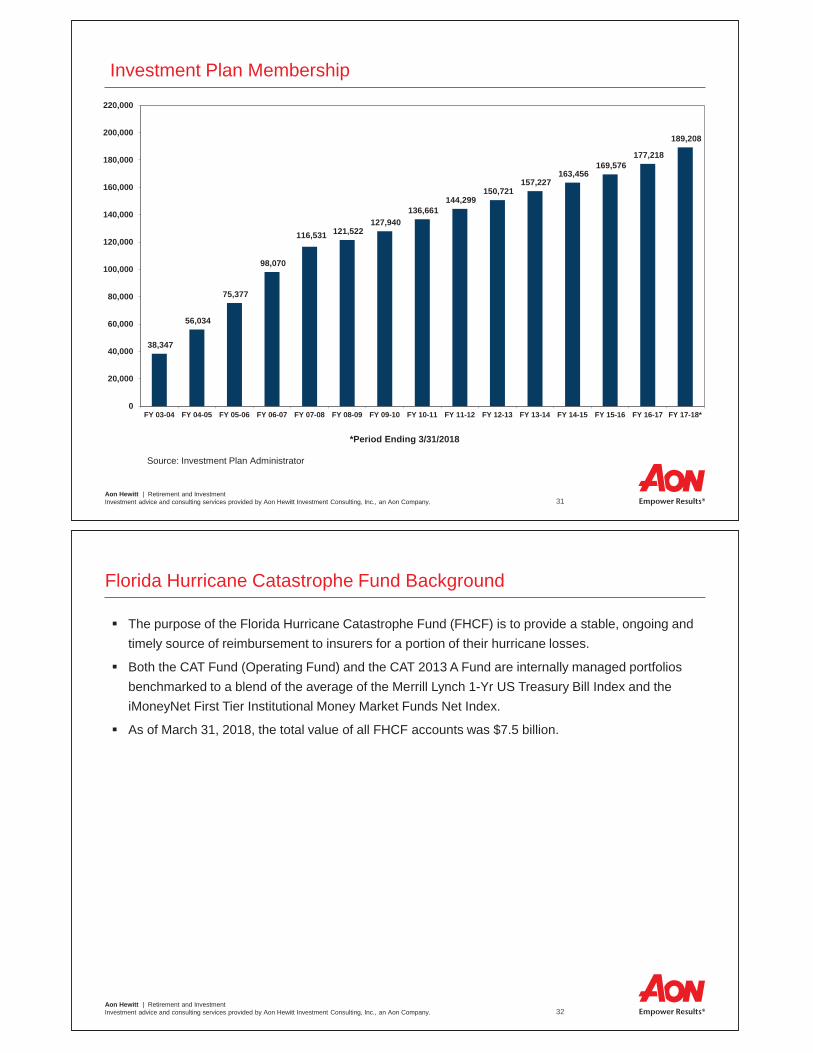
Aon Hewitt | Retirement and Investment Investment advice and consulting services provided by Aon Hewitt Investment Consulting, Inc., an Aon Company. 31
38,347
56,034
75,377
98,070
116,531 121,522 127,940
136,661 144,299
150,721 157,227
163,456 169,576
177,218
189,208
0
20,000
40,000
60,000
80,000
100,000
120,000
140,000
160,000
180,000
200,000
220,000
FY 03-04 FY 04-05 FY 05-06 FY 06-07 FY 07-08 FY 08-09 FY 09-10 FY 10-11 FY 11-12 FY 12-13 FY 13-14 FY 14-15 FY 15-16 FY 16-17 FY 17-18*
Investment Plan Membership
Source: Investment Plan Administrator
*Period Ending 3/31/2018
Aon Hewitt | Retirement and Investment Investment advice and consulting services provided by Aon Hewitt Investment Consulting, Inc., an Aon Company. 32
Florida Hurricane Catastrophe Fund Background
The purpose of the Florida Hurricane Catastrophe Fund (FHCF) is to provide a stable, ongoing and timely source of reimbursement to insurers for a portion of their hurricane losses.
Both the CAT Fund (Operating Fund) and the CAT 2013 A Fund are internally managed portfolios benchmarked to a blend of the average of the Merrill Lynch 1-Yr US Treasury Bill Index and the iMoneyNet First Tier Institutional Money Market Funds Net Index.
As of March 31, 2018, the total value of all FHCF accounts was $7.5 billion.

Aon Hewitt | Retirement and Investment Investment advice and consulting services provided by Aon Hewitt Investment Consulting, Inc., an Aon Company. 33
CAT Operating Fund Characteristics Period Ending 3/31/2018
Maturity Analysis1 to 30 Days 21.31%31 to 60 Days 9.6961 to 90 Days 5.1591 to 120 Days 4.87121 to 150 Days 6.70151 to 180 Days 11.66181 to 270 Days 10.13271 to 365 Days 13.82366 to 455 Days 1.54 >= 456 Days 15.13Total % of Portfolio: 100.00%
Bond Rating AnalysisAAA 57.27%AA 8.43A 34.30Baa 0.00Other 0.00Total % of Portfolio 100.00%
Aon Hewitt | Retirement and Investment Investment advice and consulting services provided by Aon Hewitt Investment Consulting, Inc., an Aon Company. 34
CAT 2013 A Fund Characteristics Period Ending 3/31/2018
Maturity Analysis1 to 30 Days 7.86%31 to 60 Days 1.5561 to 90 Days 2.5991 to 120 Days 4.75121 to 150 Days 5.68151 to 180 Days 2.57181 to 270 Days 9.53271 to 365 Days 6.25366 to 455 Days 10.81 >= 456 Days 48.41Total % of Portfolio: 100.00%
Bond Rating AnalysisAAA 80.08%AA 11.69A 8.23Baa 0.00Other 0.00Total % of Portfolio 100.00%

Aon Hewitt | Retirement and Investment Investment advice and consulting services provided by Aon Hewitt Investment Consulting, Inc., an Aon Company. 35
CAT 2016 A Fund Characteristics Period Ending 3/31/2018
Maturity Analysis1 to 30 Days 8.97%31 to 60 Days 0.4161 to 90 Days 5.4791 to 120 Days 2.39121 to 150 Days 4.24151 to 180 Days 7.70181 to 270 Days 7.95271 to 365 Days 6.78366 to 455 Days 7.53 >= 456 Days 48.56Total % of Portfolio: 100.00%
Bond Rating AnalysisAAA 71.47%AA 15.68A 12.85Baa 0.00Other 0.00Total % of Portfolio 100.00%
Aon Hewitt | Retirement and Investment Investment advice and consulting services provided by Aon Hewitt Investment Consulting, Inc., an Aon Company. 36
Florida PRIME Characteristics Quarter Ending 3/31/2018
*Period July 2017 – March 2018
Cash Flows as of 3/31/2018 First Quarter Fiscal YTD*Opening Balance $11,428,954,534 $9,329,349,587Participant Deposits $4,862,785,763 $18,036,255,287Gross Earnings $51,350,083 $113,250,674Participant Withdrawals ($4,756,284,139) ($15,890,581,594)Fees ($983,520) ($2,451,234)Closing Balance (3/31/2018) $11,585,822,722 $11,585,822,722
Change $156,868,188 $2,256,473,135

Aon Hewitt | Retirement and Investment Investment advice and consulting services provided by Aon Hewitt Investment Consulting, Inc., an Aon Company. 37
Florida PRIME Characteristics Quarter Ending 3/31/2018
Portfolio Composition
Aon Hewitt | Retirement and Investment Investment advice and consulting services provided by Aon Hewitt Investment Consulting, Inc., an Aon Company. 38
Florida PRIME Characteristics Period Ending 3/31/2018
Effective Maturity Schedule1-7 Days 33.7%8 - 30 Days 25.4%31 - 90 Days 27.1%91 - 180 Days 13.0%181+ Days 0.8%Total % of Portfolio: 100.0%
S & P Credit Quality CompositionA-1+ 56.8%A-1 43.2%Total % of Portfolio: 100.0%

Visit the Aon Retirement and Investment Blog (http://retirementandinvestmentblog.aon.com); sharing our best thinking.
FRS Pension Plan | First Quarter 2018
Quarterly Investment Review
(This page is left blank intentionally)

1 Market Environment 12 Total Fund 153 Global Equity 254 Domestic Equities 275 Foreign Equities 316 Global Equities 357 Fixed Income 378 Private Equity 419 Real Estate 4510 Strategic Investments 4911 Cash 5112 Appendix 53
Table of Contents
(This page is left blank intentionally)

Market Environment
1
Investment advice and consulting services provided by Aon Hewitt Investment Consulting, Inc., an Aon Company.
Global Equity Markets
Following a positive initial start to 2018, bouts of volatility later in the quarter saw global equities slip from their heady heights and even move into “correction” territory. Expectations of a pick up in inflation and later extended by growing fears over a possible trade war between the U.S. and China were key drivers of underperformance last quarter. These events led global equities lower over the quarter with a return of -0.9% in Q1 2018 in U.S. dollar terms. The weakening of the U.S. dollar (1.3% in trade-weighted terms) dragged down the returns further to -1.7% in local currency terms.
With the exception of Emerging Markets and Japan, all regions shown above generated negative returns over the quarter. Emerging Markets was the strongest performer, returning 1.3% in the first quarter of 2018. A very strong start to the year (6.8% over January in local currency terms) provided a sufficient enough cushion to offset later market falls. Canadian equities were one of the worst performers over the quarter, returning -7.5% as economic momentum waned while an unscheduled shutdown in oilsands production detracted from energy sector performance.
-0.9% -1.1% -0.7%-3.5%
1.1%
-7.5%-3.7%
-1.1%-3.5%
1.3%
15.0%17.1%
13.2% 13.5%
20.7%
4.1%
-1.9%
16.7%
9.3%
24.1%
-10%
0%
10%
20%
30%
ACWI IMI 48.3%ACWI ex-U.S. IMI
51.7%USA IMI
5.8%UK IMI
8.5%Japan IMI
3.0%Canada IMI
0.2%Israel IMI
14.9%Europe ex-UK IMI
3.9%Pacific ex-Japan
IMI
12.1%Emerging
Markets IMI
GLOBAL MSCI IMI INDEX RETURNSAS OF 03/31/2018
First Quarter 2018 One-Year
Source: MSCI
2

Investment advice and consulting services provided by Aon Hewitt Investment Consulting, Inc., an Aon Company.
Global Equity Markets
The two exhibits on this slide illustrate the percentage that each country/region represents of the global and international equity markets as measured by the MSCI All Country World IMI Index and the MSCI All Country World ex-U.S. IMI Index, respectively.
3
Investment advice and consulting services provided by Aon Hewitt Investment Consulting, Inc., an Aon Company.
U.S. Equity Markets
The Russell 3000 Index returned -0.6% during the first quarter and 13.8% over the one-year period.
All sectors generated negative returns over the quarter with the exception of Technology (3.6%) and Consumer Discretionary (1.7%) sectors; the former was supported by a strong earnings season. Focusing on the sectors that detracted from returns, Consumer Staples and Energy were the weakest performers with returns of -7.4% and -6.0%, respectively, in Q1 2018.
In general, smaller cap and growth-oriented U.S. equities outperformed over the quarter. With the majority of their revenue generated domestically, small cap stocks were less affected by fears of rising protectionism while U.S. tax reform provided additional impetus. Over the last twelve months, value stocks continue to lag their growth stock equivalents significantly (double-digit underperformance across the market capitalization spectrum).
-0.6%-3.0%
1.2%
-2.5%
2.2%
-2.6%
2.3%
13.8%
7.2%
21.8%
6.5%
19.7%
5.1%
18.6%
-5.0%
0.0%
5.0%
10.0%
15.0%
20.0%
25.0%
Russell3000
30.3%LargeValue
36.0%Large
Growth
14.3%MediumValue
11.7%MediumGrowth
3.6%SmallValue
4.1%Small
Growth
RUSSELL STYLE RETURNSAS OF 03/31/2018
First Quarter 2018One-Year
Source: Russell Indexes
-0.6%
3.6%
-0.3%
1.7%
-7.4% -6.0%-5.3%
-1.5% -0.5%
-4.8%
13.8%
26.1%
12.7%16.7%
-4.1%-0.9%
9.6%
15.7% 15.9%
-0.6%
-15.0%-10.0%
-5.0%0.0%5.0%
10.0%15.0%20.0%25.0%30.0%
Russell3000
20.3%Technology
13.2% HealthCare
14.1%Cons.Disc.
5.9%Cons.
Staples
5.5%Energy
3.8% Materials
&Processing
11.0%ProducerDurables
21.5%FinancialServices
4.6%Utilities
RUSSELL GICS SECTOR RETURNSAS OF 03/31/2018
First Quarter 2018One-Year
Source: Russell Indexes
4
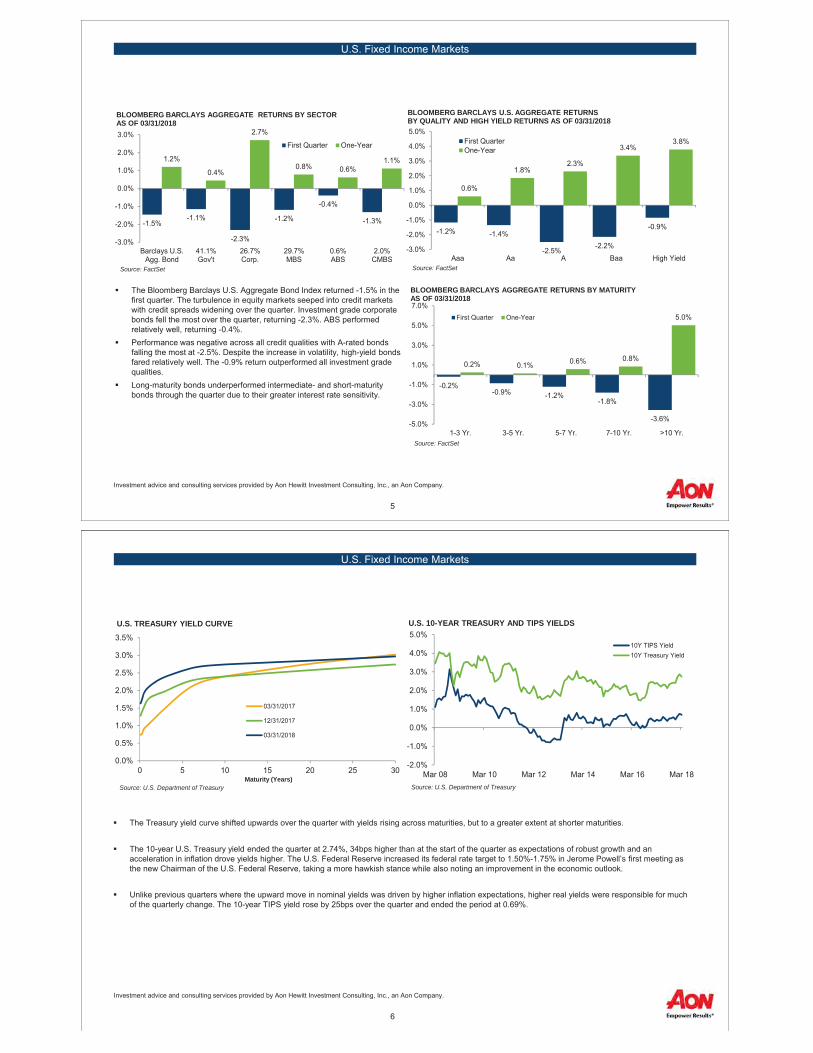
Investment advice and consulting services provided by Aon Hewitt Investment Consulting, Inc., an Aon Company.
U.S. Fixed Income Markets
The Bloomberg Barclays U.S. Aggregate Bond Index returned -1.5% in the first quarter. The turbulence in equity markets seeped into credit markets with credit spreads widening over the quarter. Investment grade corporate bonds fell the most over the quarter, returning -2.3%. ABS performed relatively well, returning -0.4%. Performance was negative across all credit qualities with A-rated bonds falling the most at -2.5%. Despite the increase in volatility, high-yield bonds fared relatively well. The -0.9% return outperformed all investment grade qualities. Long-maturity bonds underperformed intermediate- and short-maturity bonds through the quarter due to their greater interest rate sensitivity.
-0.2%-0.9% -1.2%
-1.8%
-3.6%
0.2% 0.1% 0.6% 0.8%
5.0%
-5.0%
-3.0%
-1.0%
1.0%
3.0%
5.0%
7.0%
1-3 Yr. 3-5 Yr. 5-7 Yr. 7-10 Yr. >10 Yr.
BLOOMBERG BARCLAYS AGGREGATE RETURNS BY MATURITYAS OF 03/31/2018
First Quarter One-Year
Source: FactSet
-1.2% -1.4%
-2.5% -2.2%
-0.9%
0.6%
1.8%2.3%
3.4%3.8%
-3.0%
-2.0%
-1.0%
0.0%
1.0%
2.0%
3.0%
4.0%
5.0%
Aaa Aa A Baa High Yield
BLOOMBERG BARCLAYS U.S. AGGREGATE RETURNSBY QUALITY AND HIGH YIELD RETURNS AS OF 03/31/2018
First QuarterOne-Year
Source: FactSet
-1.5%-1.1%
-2.3%
-1.2%
-0.4%
-1.3%
1.2%
0.4%
2.7%
0.8% 0.6%1.1%
-3.0%
-2.0%
-1.0%
0.0%
1.0%
2.0%
3.0%
Barclays U.S.Agg. Bond
41.1%Gov't
26.7%Corp.
29.7%MBS
0.6%ABS
2.0%CMBS
BLOOMBERG BARCLAYS AGGREGATE RETURNS BY SECTORAS OF 03/31/2018
First Quarter One-Year
Source: FactSet
5
Investment advice and consulting services provided by Aon Hewitt Investment Consulting, Inc., an Aon Company.
U.S. Fixed Income Markets
The Treasury yield curve shifted upwards over the quarter with yields rising across maturities, but to a greater extent at shorter maturities.
The 10-year U.S. Treasury yield ended the quarter at 2.74%, 34bps higher than at the start of the quarter as expectations of robust growth and an acceleration in inflation drove yields higher. The U.S. Federal Reserve increased its federal rate target to 1.50%-1.75% in Jerome Powell’s first meeting as the new Chairman of the U.S. Federal Reserve, taking a more hawkish stance while also noting an improvement in the economic outlook.
Unlike previous quarters where the upward move in nominal yields was driven by higher inflation expectations, higher real yields were responsible for much of the quarterly change. The 10-year TIPS yield rose by 25bps over the quarter and ended the period at 0.69%.
-2.0%
-1.0%
0.0%
1.0%
2.0%
3.0%
4.0%
5.0%
Mar 08 Mar 10 Mar 12 Mar 14 Mar 16 Mar 18
U.S. 10-YEAR TREASURY AND TIPS YIELDS
10Y TIPS Yield10Y Treasury Yield
Source: U.S. Department of Treasury
0.0%
0.5%
1.0%
1.5%
2.0%
2.5%
3.0%
3.5%
0 5 10 15 20 25 30Maturity (Years)
U.S. TREASURY YIELD CURVE
03/31/2017
12/31/2017
03/31/2018
Source: U.S. Department of Treasury
6

Investment advice and consulting services provided by Aon Hewitt Investment Consulting, Inc., an Aon Company.
European Fixed Income Markets
In the eurozone, bond spreads over 10-year German bunds were mixed across the region. Spanish government bond yields fell by 38bps to 1.16% over the quarter which saw Fitch (a ratings agency) upgrade Spain’s sovereign credit rating, citing broad-based economic recovery and limited economic impact caused by Catalonia’s declaration of independence.Italian bond yields fell by 20bps to 1.79%, despite the greater uncertainty surrounding Italian politics following March’s general election. Portuguese government bond yields fell by 32bps to 1.59%.Greek government bond yields rose by 22bps to 4.29%, despite a credit rating upgrade by S&P, Fitch, and Moody’s. Nonetheless, Greece’s credit rating remains several notches below investment grade quality. The spread between Greek bonds and German bunds moved 15bps higher in the first three months of 2018.
0%4%8%
12%16%20%24%28%32%36%
Mar 12 Mar 13 Mar 14 Mar 15 Mar 16 Mar 17 Mar 18
EUROZONE PERIPHERAL BOND SPREADS(10-YEAR SPREADS OVER GERMAN BUNDS)
Spain ItalyPortugal GreeceIreland
Source: FactSet
7
Investment advice and consulting services provided by Aon Hewitt Investment Consulting, Inc., an Aon Company.
Credit Spreads
During the fourth quarter, spreads over U.S. Treasuries increased across all the areas of the bond market except for long-maturity U.S. government bonds, which fell by 1bp.
The increase in spreads was particularly felt within the U.S. investment grade corporate bond market where spreads widened by 16bps. Global Emerging Market and ABS credit spreads were not too far behind, by 15bps and 12bps, respectively.
Spread (bps) 03/31/2018 12/31/2017 03/31/2017 Quarterly Change (bps) 1-Year Change (bps)
U.S. Aggregate 41 36 44 5 -3Long Gov't 1 2 3 -1 -2Long Credit 148 139 168 9 -20Long Gov't/Credit 88 83 101 5 -13MBS 29 25 27 4 2CMBS 67 62 77 5 -10ABS 48 36 54 12 -6Corporate 109 93 118 16 -9High Yield 354 343 383 11 -29Global Emerging Markets 230 215 257 15 -27Source: FactSet
8
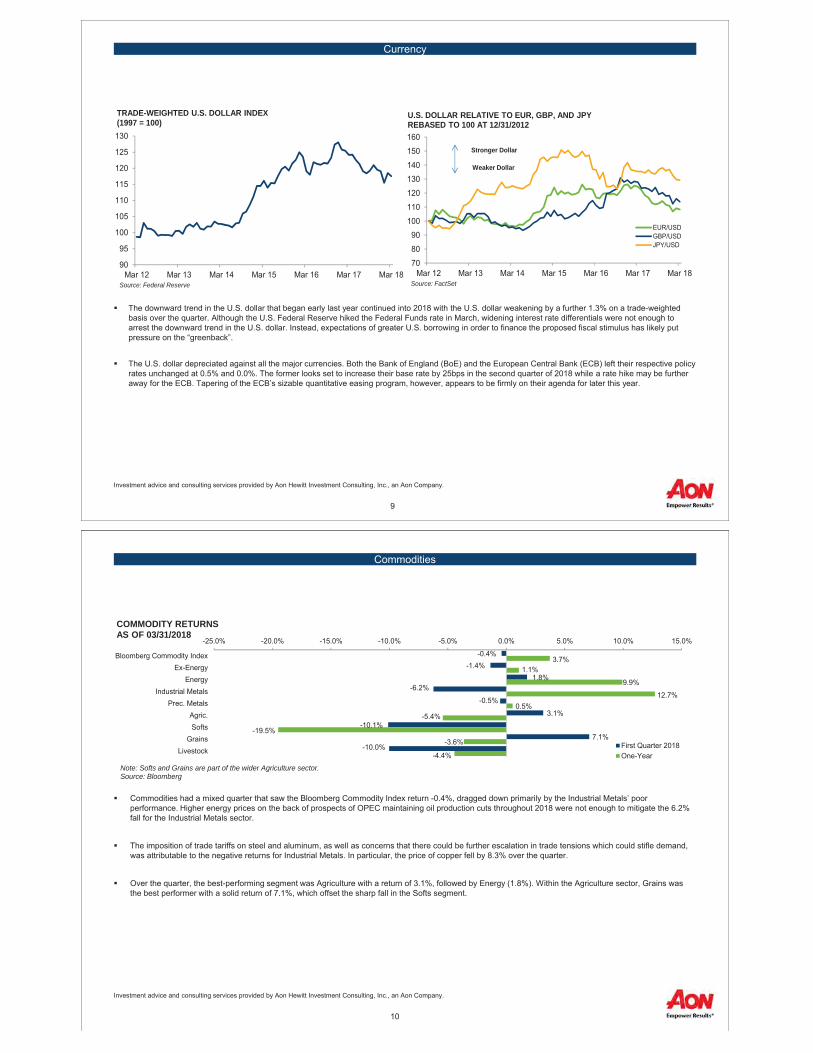
Investment advice and consulting services provided by Aon Hewitt Investment Consulting, Inc., an Aon Company.
Currency
The downward trend in the U.S. dollar that began early last year continued into 2018 with the U.S. dollar weakening by a further 1.3% on a trade-weighted basis over the quarter. Although the U.S. Federal Reserve hiked the Federal Funds rate in March, widening interest rate differentials were not enough to arrest the downward trend in the U.S. dollar. Instead, expectations of greater U.S. borrowing in order to finance the proposed fiscal stimulus has likely put pressure on the “greenback”.
The U.S. dollar depreciated against all the major currencies. Both the Bank of England (BoE) and the European Central Bank (ECB) left their respective policy rates unchanged at 0.5% and 0.0%. The former looks set to increase their base rate by 25bps in the second quarter of 2018 while a rate hike may be further away for the ECB. Tapering of the ECB’s sizable quantitative easing program, however, appears to be firmly on their agenda for later this year.
90
95
100
105
110
115
120
125
130
Mar 12 Mar 13 Mar 14 Mar 15 Mar 16 Mar 17 Mar 18
TRADE-WEIGHTED U.S. DOLLAR INDEX(1997 = 100)
Source: Federal Reserve
708090
100110120130140150160
Mar 12 Mar 13 Mar 14 Mar 15 Mar 16 Mar 17 Mar 18
U.S. DOLLAR RELATIVE TO EUR, GBP, AND JPYREBASED TO 100 AT 12/31/2012
EUR/USDGBP/USDJPY/USD
Source: FactSet
Stronger Dollar
Weaker Dollar
9
Investment advice and consulting services provided by Aon Hewitt Investment Consulting, Inc., an Aon Company.
Commodities
Commodities had a mixed quarter that saw the Bloomberg Commodity Index return -0.4%, dragged down primarily by the Industrial Metals’ poor performance. Higher energy prices on the back of prospects of OPEC maintaining oil production cuts throughout 2018 were not enough to mitigate the 6.2% fall for the Industrial Metals sector.
The imposition of trade tariffs on steel and aluminum, as well as concerns that there could be further escalation in trade tensions which could stifle demand, was attributable to the negative returns for Industrial Metals. In particular, the price of copper fell by 8.3% over the quarter.
Over the quarter, the best-performing segment was Agriculture with a return of 3.1%, followed by Energy (1.8%). Within the Agriculture sector, Grains was the best performer with a solid return of 7.1%, which offset the sharp fall in the Softs segment.
-0.4%-1.4%
1.8%-6.2%
-0.5%
3.1%-10.1%
7.1%-10.0%
3.7%1.1%
9.9%12.7%
0.5%-5.4%
-19.5%-3.6%
-4.4%
-25.0% -20.0% -15.0% -10.0% -5.0% 0.0% 5.0% 10.0% 15.0%
Bloomberg Commodity IndexEx-Energy
EnergyIndustrial Metals
Prec. MetalsAgric.Softs
GrainsLivestock
COMMODITY RETURNS AS OF 03/31/2018
First Quarter 2018One-Year
Note: Softs and Grains are part of the wider Agriculture sector.Source: Bloomberg
10

Investment advice and consulting services provided by Aon Hewitt Investment Consulting, Inc., an Aon Company.
Hedge Fund Markets Overview
Against a backdrop of higher equity market volatility, hedge fund performance was generally positive over the first quarter, except for Global Macro strategies. The latter ended the first quarter down 1.0%.
In the first three months to March 2018, the HFRI Fund-Weighted Composite Index and the HFRI Fund of Funds Composite Index produced returns of 0.3% and 0.9%, respectively.
Emerging Market hedge funds continued to be the best performer, particularly over the last year, with a return of 13.3%. The level of outperformance relative to other strategies was less marked over the three-month horizon; a return of 1.1% was marginally ahead of the 1.0% recorded by Fixed Income/Convertible Arbitrage strategies.
1.0%
-1.0%
0.7%
1.1%
0.2%
0.5%
0.8%
0.3%
0.9%
4.8%
1.0%
9.7%
13.3%
5.2%
4.2%
3.2%
6.1%
5.9%
-2.0% 0.0% 2.0% 4.0% 6.0% 8.0% 10.0% 12.0% 14.0%
Fixed Income/Convertible Arb.
Global Macro
Equity Hedge
Emerging Markets
Event-Driven
Distressed-Restructuring
Relative Value
Fund-Weighted Composite Index
Fund of Funds Composite Index
HEDGE FUND PERFORMANCE AS OF 03/31/2018
First Quarter 2018
One-Year
Note: Latest five months of HFR data are estimated by HFR and may change in the future.Source: HFR
11
Investment advice and consulting services provided by Aon Hewitt Investment Consulting, Inc., an Aon Company.
9.1 x
7.7 x8.5 x 8.8 x 8.7x 8.8x
9.8x 10.3x 10.0x10.6x
0.0 x
2.0 x
4.0 x
6.0 x
8.0 x
10.0 x
12.0 x
Senior Debt/EBITDA Sub Debt/EBITDA Equity/EBITDA Others
Private Equity Market Overview–Fourth Quarter 2017
Source: Preqin Source: Standard & Poor’s
LTM Global Private Equity-Backed Buyout Deal Volume Purchase Price Multiples–All U.S. Transaction Sizes
Sources: 1 Preqin 2 Standard & Poor’s 3 PWC/CB Insights MoneyTree Report 4 PitchBook/NVCA Venture Monitor 5 Fitch Ratings 6 Thomson Reuters 7 UBSNotes: FY: Fiscal year ended 12/31; YTD: Year to date; LTM: Last twelve months (aka trailing twelve months); PPM: Purchase Price Multiples: Total Purchase Price ÷EBITDA.
Fundraising: In 2017, $630.6 billion was raised by 1,364 funds, which despite being down 20.9% on a deal basis, was up 3.5% on a capital basis year-over-year. Dry powder stood at nearly $1.4 trillion at the end of the year, an increase of 7.6% and 34.9% compared to 2016 and the five-year average, respectively.1
Buyout: Global private equity-backed buyout deals totaled $364.7 billion in 2017, which was an increase of 7.6% and 5.4% from 2016 and the five-year average, respectively.1 At the end of 2017, the average purchase price multiple for all U.S. LBOs was 10.6x EBITDA, up from both 2016 (10.0x) and the five-year average (9.5x). Middle-market purchase price multiples stood at 11.6x, up compared to 10.2x in 2016. The weighted average purchase price multiple across all European transaction sizes averaged 10.7x EBITDA on a full-year 2017 basis, up from 9.3x in 2016. Purchase prices for transactions of €1.0 billion or more increased slightly from 11.4x to 11.6x year-over-year. Transactions between €250.0 million and €500.0 million were up 0.5x from 2016, and stood at 9.7x.2 Globally, exit value totaled $294.7 billion on 1,796 deals in 2017 compared to $361.5 billion on 1,950 deals in the prior year.1
Venture: During the year, 5,268 venture-backed transactions totaling $74.2 billion were completed, which was an increase on a capital basis over the prior year’s total of $61.7 billion across 5,343 deals. This was 39.0% higher than the five-year average of $53.5 billion.3 Total U.S. venture-backed exit activity totaled approximately $51.0 billion across 769 completed transactions in 2017, down from $52.9 billion across 857 exits in 2016.4
Mezzanine: 35 funds closed on $11.6 billion during the year. This was a decrease from the prior year’s total of $31.5 billion raised by 46 funds and represented a decline of 40.3% from the five-year average of $19.4 billion. Estimated dry powder was $50.5 billion at the end of 2017, which was down 4.7% from year-end 2016.1
Distressed Debt: The LTM U.S. high-yield default rate was 1.8% as of year-end 2017, which was up from September 2017’s LTM rate of 1.6%.5 Distressed debt and bankruptcy restructuring activity totaled $282.2 billion during 2017, representing a decline of 18.0% from 2016. U.S. activity accounted for $114.4 billion in 2017 and was down 38.0% from 2016.6
Secondaries: 42 funds raised $42.4 billion during the year, up from $29.3 billion by 39 funds in 2016.1 The average discount rate for all private equity sectors finished the year at 7.9%, down from 8.5% at the end of 2016.7
Infrastructure: $67.4 billion of capital was raised by 79 funds in 2017 compared to $65.8 billion of capital raised by 81 partnerships in 2016. At the end of the year, dry powder stood at $158.0 billion, up from the third quarter’s record total of $154.0 billion. Infrastructure managers completed 2,378 deals with an estimated aggregate deal value of $916.0 billion in 2017 compared to 2,299 deals totaling $809.7 billion in 2016.1
Natural Resources: During 2017, 31 funds closed on $19.4 billion compared to 52 funds totaling $24.9 billion in 2016. Energy and utilities industry managers completed approximately 130 deals totaling $36.9 billion in 2017, compared to $22.0 billion across 215 deals in 2016.1
0
500
1,000
1,500
2,000
2,500
3,000
3,500
4,000
4,500
5,000
$0
$100
$200
$300
$400
$500
$600
Q309 Q210 Q111 Q411 Q312 Q213 Q114 Q414 Q315 Q216 Q117 Q417
Nu
mb
er o
f DealsV
alu
e (
$ B
illi
on
s)
Deal Value ($ Billions)
Number of Deals
12

Investment advice and consulting services provided by Aon Hewitt Investment Consulting, Inc., an Aon Company.
U.S. Commercial Real Estate Markets
Core real estate returns generated 2.19%* in the first quarter, which is 12bps higher than Q4 2017 and a decrease of 29bps year-over-year (YOY). Asset appreciationaccelerated during the quarter at a fairly robust 1.15%, surprising and outpacing the income return (1.04%). Investment returns are expected to continue to moderate overthe medium term.Global property stocks (FTSE EPRA/NAREIT Developed Index) fell 4.3% during the first quarter, posting losses in each of the major regions in conjunction with risingbond yields and weakness in broader equity markets, with the most significant weakness in the U.S. The U.S. REIT market (FTSE NAREIT Equity REITs Index) declined7.8% in Q1 after gaining 3.9% in the full year 2017. The sector experienced significant weakness through mid-February leading to share price declines in excess of 10%followed by a modest recovery in March. Share price weakness appeared to be largely related to concerns with regard to the impact on REIT share prices in a higherinterest rate environment. With asset values for high-quality assets, on average, approximately 15%-20% above 2007 valuations, the sector ended the quarter trading at a6% discount to NAVs.U.S. transaction volume continued to demonstrate a declining trend in early Q1, with February data marking a 10% drop in transaction volume YOY. Property sales remainsubdued due to fewer entity and portfolio deals over the past year, as well as concern over a rising interest rate environment and a widening gap between buyers’ andsellers’ future return expectations.Despite the declining trend in sales, pricing is holding fairly firm or still growing, up 8% nationally YOY in February, with Apartment and Industrial leading these results.Cap rates have remained low and sticky, sitting today at similar levels to Q1 2017.Dry powder for non core real estate investments currently stands at another all-time peak for all regions. While this should help support current sector pricing for a bitlonger, moderating trends in underlying fundamentals (e.g., rent growth, supply-demand balance), interest rates, and economic tailwinds raise investment risk levels at thismature point in the cycle. To-date, the U.S. continues to benefit as a global safe haven.The U.S. real estate cycle is mature and thus more susceptible to bumps along the road. While still solid income returns are forecast to continue to support attractiverelative returns versus many other asset classes, portfolio construction consideration is critical. At this point in the cycle, appropriate risk mitigation measures should be astaple in all investment portfolios as new investments will likely be required to ride out a cyclical downturn–though none is clearly on the horizon yet.
Sources: NCREIF, RCA, CBRE-EA, Aon Hewitt, *Indicates preliminary NFI-ODCE data (gross of fees)
Source: RCA
2.2%
8.1%10.0%
11.4%
5.1%
-8.2%
-4.5%
1.1%
5.9% 6.4%
-10.0%
-5.0%
0.0%
5.0%
10.0%
15.0%
First Quarter2018
1-Year 3-Years 5-Years 10-Years
PRIVATE VS. PUBLIC REAL ESTATE RETURNSAS OF 03/31/2018
Private (NFI-ODCE Gross)*Public (NAREIT Gross)
*First quarter returns are preliminary.Sources: NCREIF, NAREIT
13
(This page is left blank intentionally)
14

Total Fund
15
Executive SummaryPerformance of the Pension Plan, when measured against the Performance Benchmark, has been strong over short- and long-term time periods.Performance relative to peers is also competitive over short- and long-term time periods.The Pension Plan is well-diversified across six broad asset classes, and each asset class is also well-diversified.Public market asset class investments do not significantly deviate from their broad market based benchmarks, e.g., sectors, market capitalizations, globalregions, credit quality, duration, and security types.Private market asset classes are well-diversified by vintage year, geography, property type, sectors, investment vehicle/asset type, or investmentstrategy.Asset allocation is monitored on a daily basis to ensure the actual asset allocation of the plan remains close to the long-term policy targets set forth in theInvestment Policy Statement.Aon Hewitt Investment Consulting and SBA staff revisit the plan design annually through informal and formal asset allocation and asset liability reviews.Adequate liquidity exists within the asset allocation to pay the monthly obligations of the Pension Plan consistently and on a timely basis.
Performance HighlightsDuring the quarter, the Total Fund outperformed the Performance Benchmark. The Total Fund outperformed the Performance Benchmark during the
trailing one-, three-, five-, and ten-year periods.
Asset AllocationThe Fund assets total $160.5 billion as of March 31, 2018, which represents a $1.6 billion decrease since last quarter.Actual allocations for all asset classes were within their respective policy ranges at quarter-end.The Fund was modestly overweight to global equity, with a corresponding underweight to fixed income.
HighlightsAs of March 31, 2018
16
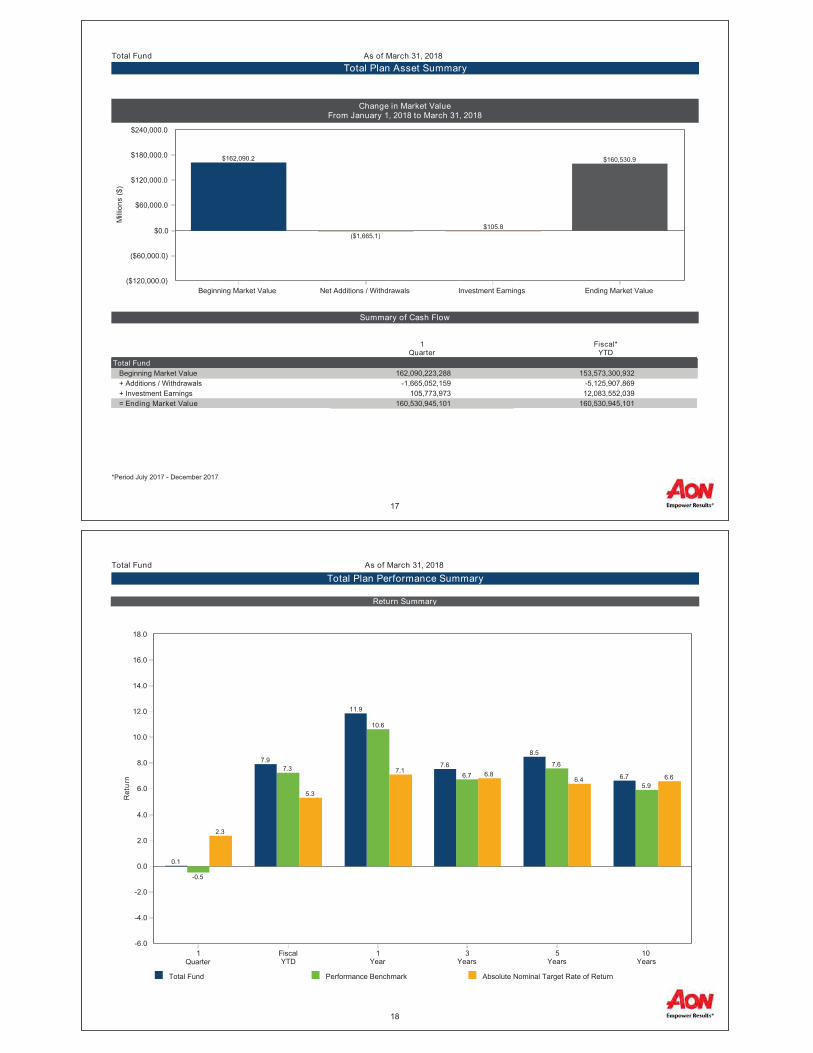
Change in Market ValueFrom January 1, 2018 to March 31, 2018
Summary of Cash Flow
$0.0
$60,000.0
$120,000.0
$180,000.0
$240,000.0
($60,000.0)
($120,000.0)
Mill
ions
($)
Beginning Market Value Net Additions / Withdrawals Investment Earnings Ending Market Value
$162,090.2
($1,665.1)$105.8
$160,530.9
1Quarter
Fiscal*YTD
Total Fund Beginning Market Value 162,090,223,288 153,573,300,932 + Additions / Withdrawals -1,665,052,159 -5,125,907,869 + Investment Earnings 105,773,973 12,083,552,039 = Ending Market Value 160,530,945,101 160,530,945,101
Total FundTotal Plan Asset Summary
As of March 31, 2018
*Period July 2017 - December 2017
17
Total Fund Performance Benchmark Absolute Nominal Target Rate of Return
0.0
2.0
4.0
6.0
8.0
10.0
12.0
14.0
16.0
18.0
-2.0
-4.0
-6.0
Ret
urn
1Quarter
FiscalYTD
1Year
3Years
5Years
10Years
2.3
5.3
7.1 6.86.4 6.6
-0.5
7.3
10.6
6.77.6
5.9
0.1
7.9
11.9
7.6
8.5
6.7
Total Fund
Total Plan Performance SummaryAs of March 31, 2018
Return Summary
18
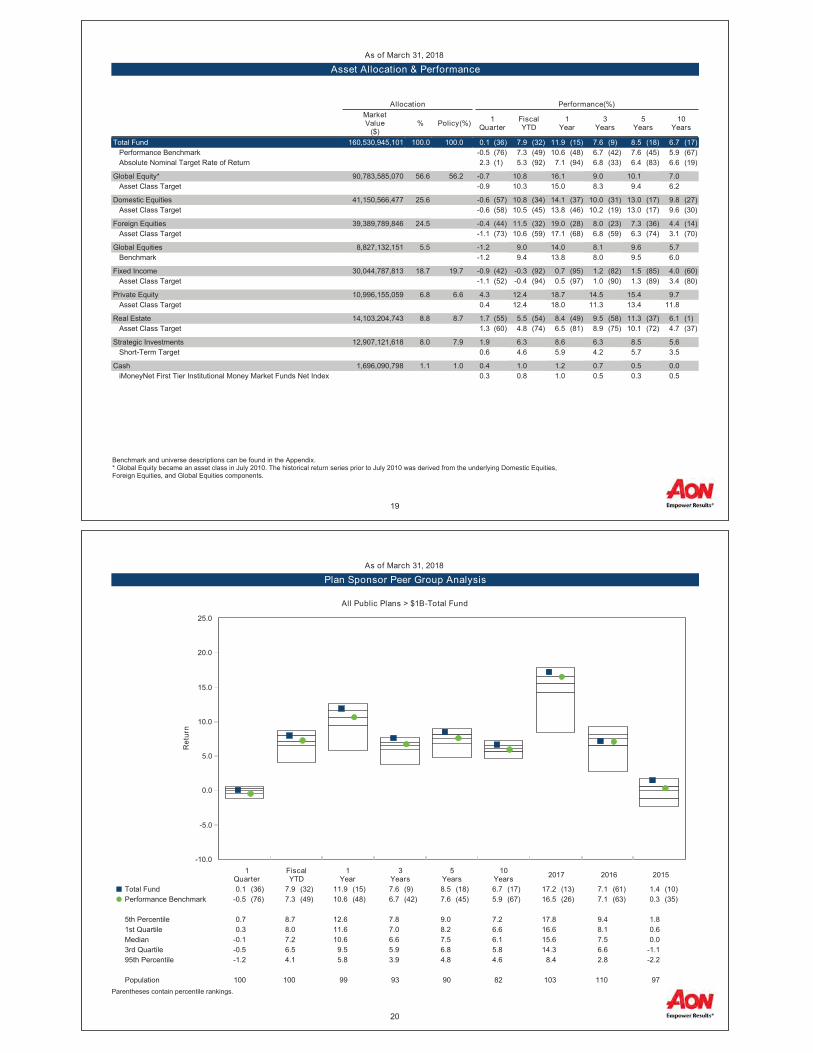
AllocationMarketValue
($)% Policy(%)
Performance(%)
1Quarter
FiscalYTD
1Year
3Years
5Years
10Years
Total Fund 160,530,945,101 100.0 100.0 0.1 (36) 7.9 (32) 11.9 (15) 7.6 (9) 8.5 (18) 6.7 (17) Performance Benchmark -0.5 (76) 7.3 (49) 10.6 (48) 6.7 (42) 7.6 (45) 5.9 (67) Absolute Nominal Target Rate of Return 2.3 (1) 5.3 (92) 7.1 (94) 6.8 (33) 6.4 (83) 6.6 (19)All Public Plans > $1B-Total Fund Median -0.1 7.2 10.6 6.6 7.5 6.1
Global Equity* 90,783,585,070 56.6 56.2 -0.7 10.8 16.1 9.0 10.1 7.0 Asset Class Target -0.9 10.3 15.0 8.3 9.4 6.2
Domestic Equities 41,150,566,477 25.6 -0.6 (57) 10.8 (34) 14.1 (37) 10.0 (31) 13.0 (17) 9.8 (27) Asset Class Target -0.6 (58) 10.5 (45) 13.8 (46) 10.2 (19) 13.0 (17) 9.6 (30)All Public Plans > $1B-US Equity Segment Median -0.5 10.2 13.6 9.6 12.4 9.1
Foreign Equities 39,389,789,846 24.5 -0.4 (44) 11.5 (32) 19.0 (28) 8.0 (23) 7.3 (36) 4.4 (14) Asset Class Target -1.1 (73) 10.6 (59) 17.1 (68) 6.8 (59) 6.3 (74) 3.1 (70)All Public Plans > $1B-Intl. Equity Segment Median -0.6 10.8 18.1 7.1 6.8 3.4
Global Equities 8,827,132,151 5.5 -1.2 9.0 14.0 8.1 9.6 5.7 Benchmark -1.2 9.4 13.8 8.0 9.5 6.0
Fixed Income 30,044,787,813 18.7 19.7 -0.9 (42) -0.3 (92) 0.7 (95) 1.2 (82) 1.5 (85) 4.0 (60) Asset Class Target -1.1 (52) -0.4 (94) 0.5 (97) 1.0 (90) 1.3 (89) 3.4 (80)All Public Plans > $1B-US Fixed Income Segment Median -1.0 0.6 1.9 2.0 2.1 4.2
Private Equity 10,996,155,059 6.8 6.6 4.3 12.4 18.7 14.5 15.4 9.7 Asset Class Target 0.4 12.4 18.0 11.3 13.4 11.8
Real Estate 14,103,204,743 8.8 8.7 1.7 (55) 5.5 (54) 8.4 (49) 9.5 (58) 11.3 (37) 6.1 (1) Asset Class Target 1.3 (60) 4.8 (74) 6.5 (81) 8.9 (75) 10.1 (72) 4.7 (37)All Public Plans > $1B-Real Estate Segment Median 1.8 5.6 8.2 9.8 10.9 4.5
Strategic Investments 12,907,121,618 8.0 7.9 1.9 6.3 8.6 6.3 8.5 5.6 Short-Term Target 0.6 4.6 5.9 4.2 5.7 3.5
Cash 1,696,090,798 1.1 1.0 0.4 1.0 1.2 0.7 0.5 0.0 iMoneyNet First Tier Institutional Money Market Funds Net Index 0.3 0.8 1.0 0.5 0.3 0.5
Asset Allocation & PerformanceAs of March 31, 2018
Benchmark and universe descriptions can be found in the Appendix.* Global Equity became an asset class in July 2010. The historical return series prior to July 2010 was derived from the underlying Domestic Equities,Foreign Equities, and Global Equities components.
19
-10.0
-5.0
0.0
5.0
10.0
15.0
20.0
25.0
Ret
urn
1Quarter
FiscalYTD
1Year
3Years
5Years
10Years 2017 2016 2015
Total Fund 0.1 (36) 7.9 (32) 11.9 (15) 7.6 (9) 8.5 (18) 6.7 (17) 17.2 (13) 7.1 (61) 1.4 (10)
Performance Benchmark -0.5 (76) 7.3 (49) 10.6 (48) 6.7 (42) 7.6 (45) 5.9 (67) 16.5 (26) 7.1 (63) 0.3 (35)
5th Percentile 0.7 8.7 12.6 7.8 9.0 7.2 17.8 9.4 1.81st Quartile 0.3 8.0 11.6 7.0 8.2 6.6 16.6 8.1 0.6Median -0.1 7.2 10.6 6.6 7.5 6.1 15.6 7.5 0.03rd Quartile -0.5 6.5 9.5 5.9 6.8 5.8 14.3 6.6 -1.195th Percentile -1.2 4.1 5.8 3.9 4.8 4.6 8.4 2.8 -2.2
Population 100 100 99 93 90 82 103 110 97
Plan Sponsor Peer Group AnalysisAs of March 31, 2018
All Public Plans > $1B-Total Fund
Parentheses contain percentile rankings.
20

Global Equity** 50.7%
Fixed Income 24.7%
Real Estate 6.1%
Alternatives 16.9%
Cash 1.6%
Global Equity*56.6%
Fixed Income18.7%
Real Estate8.8%
Private Equity6.8%
Strategic Investments
8.0%Cash1.1%
Universe Asset Allocation Comparison
Total Fund As of March 31, 2018
Total Fund BNY Mellon Public Funds > $1B Net Universe
*Global Equity Allocation: 25.6% Domestic Equities; 24.5% Foreign Equities; 5.5% Global Equities; 0.9% Global Equity Liquidity Account. Percentages are of the Total FRS Fund.
**Global Equity Allocation: 29.8% Domestic Equities; 20.9% Foreign Equities.
21
42
5
9
10
18
-3
10
0
91
-50 0 50 100 150
57
4
16
6
21
-3
24
0
125
-50 0 50 100 150
Attribution
Total Fund As of March 31, 2018
*Cash AA includes Cash and Central Custody, Securities Lending Account income from 12/2009 to 3/2013 and unrealized gains and losses on securities lending collateral beginning June 2013, TF STIPFRS NAV Adjustment Account, and the Cash Expense Account.**Other includes legacy accounts and unexplained differences due to methodology.
Basis Points
1-Year Ending 3/31/2018
Global Equity
Fixed Income
Real Estate
Strategic Investments
Cash AA*
TAA
Other**
Total Fund
Private Equity
Global Equity
Fixed Income
Real Estate
Private Equity
Strategic Investments
Cash AA*
TAA
Other**
Basis Points
5-Year Ending 3/31/2018
Total Fund
22
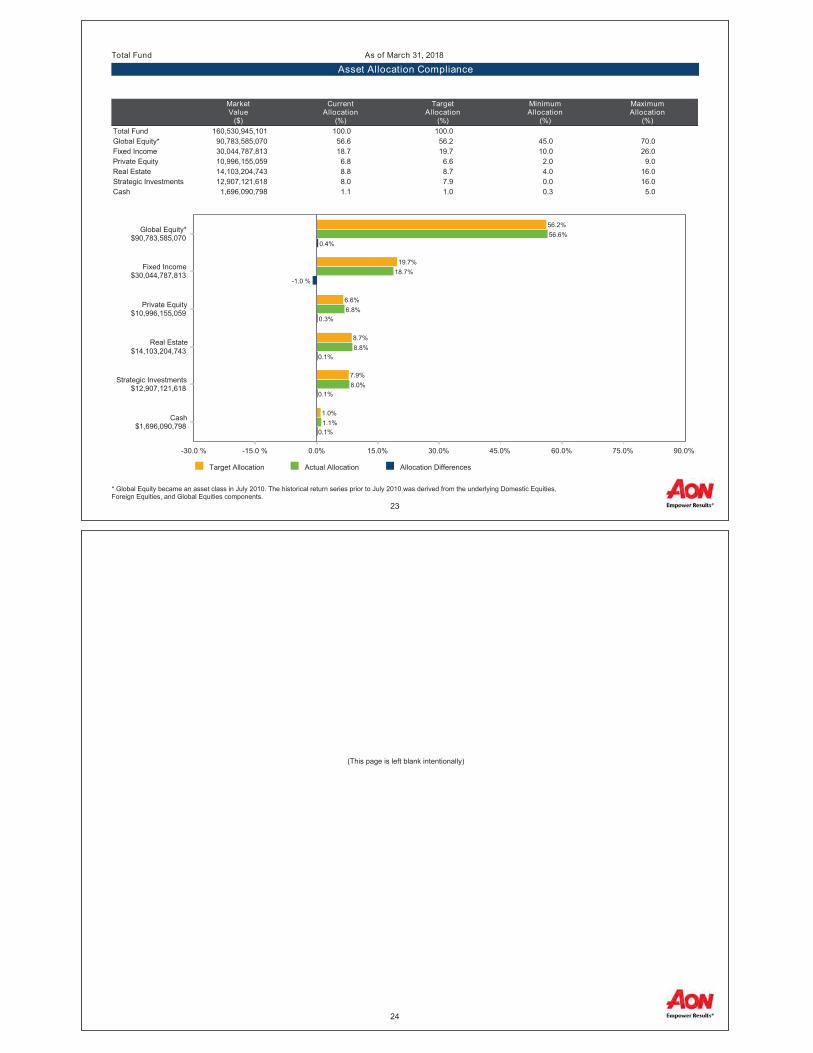
MarketValue
($)
CurrentAllocation
(%)
TargetAllocation
(%)
MinimumAllocation
(%)
MaximumAllocation
(%)Total Fund 160,530,945,101 100.0 100.0Global Equity* 90,783,585,070 56.6 56.2 45.0 70.0Fixed Income 30,044,787,813 18.7 19.7 10.0 26.0Private Equity 10,996,155,059 6.8 6.6 2.0 9.0Real Estate 14,103,204,743 8.8 8.7 4.0 16.0Strategic Investments 12,907,121,618 8.0 7.9 0.0 16.0Cash 1,696,090,798 1.1 1.0 0.3 5.0
Target Allocation Actual Allocation Allocation Differences
0.0% 15.0% 30.0% 45.0% 60.0% 75.0% 90.0%-15.0 %-30.0 %
Cash$1,696,090,798
Strategic Investments$12,907,121,618
Real Estate$14,103,204,743
Private Equity$10,996,155,059
Fixed Income$30,044,787,813
Global Equity*$90,783,585,070
1.0%
7.9%
8.7%
6.6%
19.7%
56.2%
1.1%
8.0%
8.8%
6.8%
18.7%
56.6%
0.1%
0.1%
0.1%
0.3%
-1.0 %
0.4%
Total Fund
Asset Allocation ComplianceAs of March 31, 2018
* Global Equity became an asset class in July 2010. The historical return series prior to July 2010 was derived from the underlying Domestic Equities,Foreign Equities, and Global Equities components.
23
(This page is left blank intentionally)
24
Global Equity
25
Current Allocation
Return Summary
March 31, 2018 : $90,784M
Domestic Equities 45.3%
GE Liquidity 1.5%Currency Managed Account 0.0%
Global Equity Currency Program 0.0%Global Equities 9.7%
Foreign Equities 43.4%
Global Equity* Asset Class Target
0.0
8.0
16.0
24.0
-8.0
Ret
urn
1Quarter
FiscalYTD
1Year
3Years
5Years
10Years
-0.9
10.3
15.0
8.3 9.4
6.2
-0.7
10.8
16.1
9.0 10.1
7.0
Global Equity*
Global Equity* Portfolio OverviewAs of March 31, 2018
* Global Equity became an asset class in July 2010. The historical return series prior to July 2010 was derived from the underlying Domestic Equities,Foreign Equities, and Global Equities components.
26
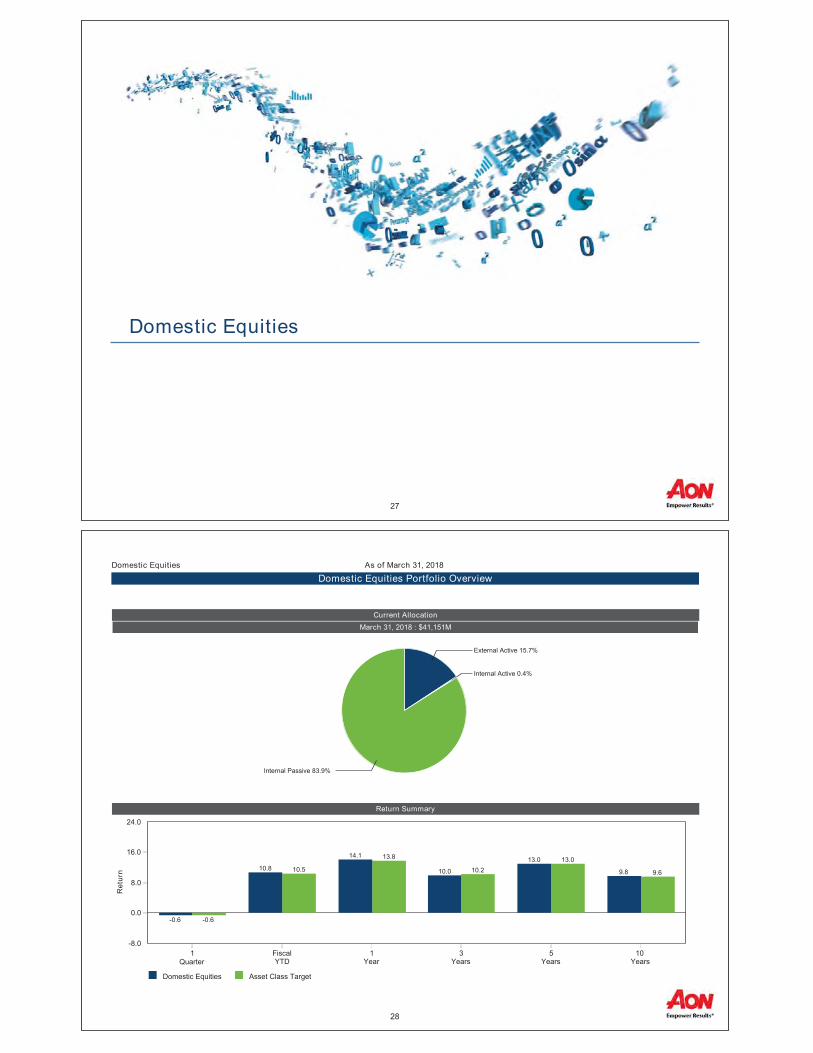
Domestic Equities
27
Current Allocation
Return Summary
March 31, 2018 : $41,151M
External Active 15.7%
Internal Active 0.4%
Internal Passive 83.9%
Domestic Equities Asset Class Target
0.0
8.0
16.0
24.0
-8.0
Ret
urn
1Quarter
FiscalYTD
1Year
3Years
5Years
10Years
-0.6
10.5
13.8
10.213.0
9.6
-0.6
10.8
14.1
10.0
13.0
9.8
Domestic Equities
Domestic Equities Portfolio OverviewAs of March 31, 2018
28
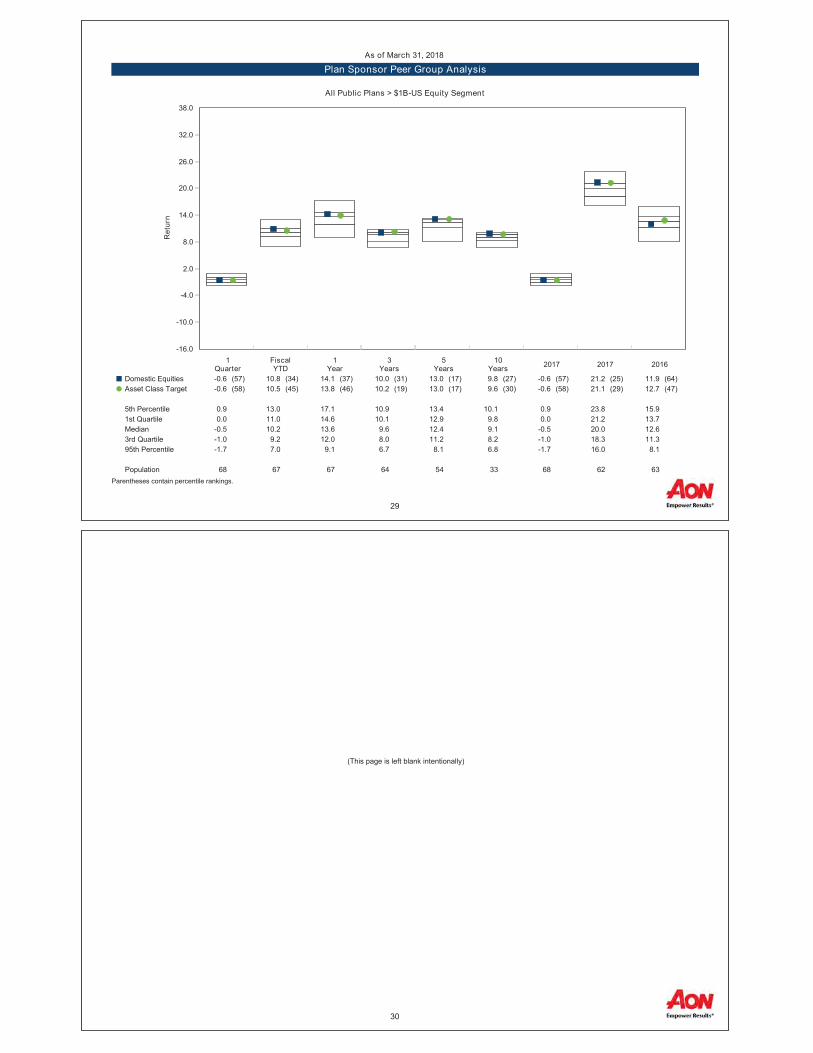
-16.0
-10.0
-4.0
2.0
8.0
14.0
20.0
26.0
32.0
38.0
Ret
urn
1Quarter
FiscalYTD
1Year
3Years
5Years
10Years 2017 2017 2016
Domestic Equities -0.6 (57) 10.8 (34) 14.1 (37) 10.0 (31) 13.0 (17) 9.8 (27) -0.6 (57) 21.2 (25) 11.9 (64)
Asset Class Target -0.6 (58) 10.5 (45) 13.8 (46) 10.2 (19) 13.0 (17) 9.6 (30) -0.6 (58) 21.1 (29) 12.7 (47)
5th Percentile 0.9 13.0 17.1 10.9 13.4 10.1 0.9 23.8 15.91st Quartile 0.0 11.0 14.6 10.1 12.9 9.8 0.0 21.2 13.7Median -0.5 10.2 13.6 9.6 12.4 9.1 -0.5 20.0 12.63rd Quartile -1.0 9.2 12.0 8.0 11.2 8.2 -1.0 18.3 11.395th Percentile -1.7 7.0 9.1 6.7 8.1 6.8 -1.7 16.0 8.1
Population 68 67 67 64 54 33 68 62 63
Plan Sponsor Peer Group AnalysisAs of March 31, 2018
All Public Plans > $1B-US Equity Segment
Parentheses contain percentile rankings.
29
(This page is left blank intentionally)
30
Foreign Equities
31
Current Allocation
Return Summary
March 31, 2018 : $39,390M
Frontier Active 1.1%
Emerging Active 25.4%
Developed Passive 10.9% Developed Active 62.6%
Foreign Equities Asset Class Target
0.0
10.0
20.0
30.0
-10.0
Ret
urn
1Quarter
FiscalYTD
1Year
3Years
5Years
10Years
-1.1
10.6
17.1
6.8 6.33.1
-0.4
11.5
19.0
8.0 7.34.4
Foreign Equities
Foreign Equities Portfolio OverviewAs of March 31, 2018
32

-20.0
-12.0
-4.0
4.0
12.0
20.0
28.0
36.0
44.0
52.0
Ret
urn
1Quarter
FiscalYTD
1Year
3Years
5Years
10Years
YearTo
Date2017 2016
Foreign Equities -0.4 (44) 11.5 (32) 19.0 (28) 8.0 (23) 7.3 (36) 4.4 (14) -0.4 (44) 30.2 (19) 4.1 (37)
Asset Class Target -1.1 (73) 10.6 (59) 17.1 (68) 6.8 (59) 6.3 (74) 3.1 (70) -1.1 (73) 27.9 (58) 4.3 (33)
5th Percentile 0.8 13.6 21.5 9.1 8.5 5.7 0.8 32.8 7.91st Quartile 0.0 11.9 19.1 7.9 7.6 3.9 0.0 29.8 4.7Median -0.6 10.8 18.1 7.1 6.8 3.4 -0.6 28.5 3.43rd Quartile -1.2 9.5 16.6 6.3 6.2 2.9 -1.2 26.8 2.395th Percentile -1.8 6.4 11.2 5.2 5.5 1.9 -1.8 20.3 -0.9
Population 70 70 69 65 53 33 70 65 64
Plan Sponsor Peer Group AnalysisAs of March 31, 2018
All Public Plans > $1B-Intl. Equity Segment
Parentheses contain percentile rankings.
33
(This page is left blank intentionally)
34

Global Equities
35
Global Equities Benchmark
0.0
3.0
6.0
9.0
12.0
15.0
18.0
21.0
-3.0
-6.0
-9.0
Ret
urn
1Quarter
FiscalYTD
1Year
3Years
5Years
10Years
-1.2
9.4
13.8
8.0
9.5
6.0
-1.2
9.0
14.0
8.1
9.6
5.7
Global Equities
Global Equities Performance SummaryAs of March 31, 2018
Return Summary
36
Fixed Income
37
Current Allocation
Return Summary
March 31, 2018 : $30,045M
Active External 33.3%
Fixed Income Liquidity 4.2%
Passive Internal 41.8%
Other 0.0% Active Internal 20.7%
Fixed Income Asset Class Target
0.0
3.0
6.0
-3.0
Ret
urn
1Quarter
FiscalYTD
1Year
3Years
5Years
10Years
-1.1-0.4
0.51.0 1.3
3.4
-0.9-0.3
0.71.2
1.5
4.0
Fixed Income
Fixed Income Portfolio OverviewAs of March 31, 2018
38
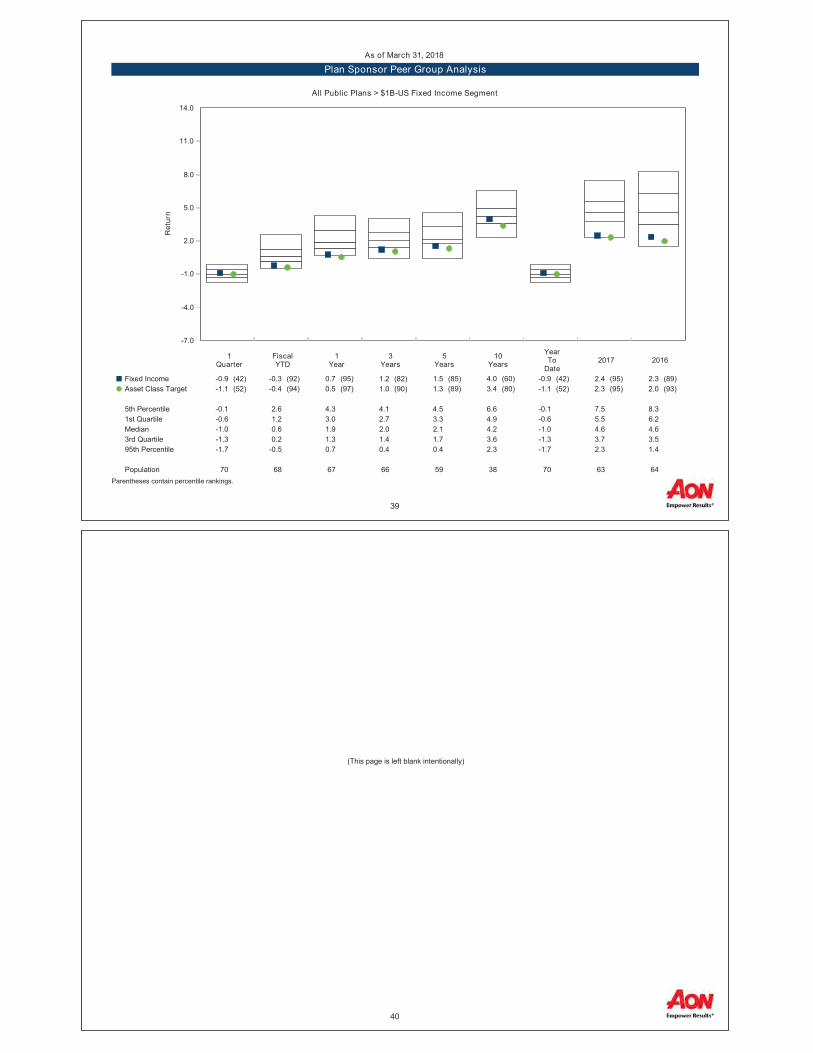
-7.0
-4.0
-1.0
2.0
5.0
8.0
11.0
14.0
Ret
urn
1Quarter
FiscalYTD
1Year
3Years
5Years
10Years
YearTo
Date2017 2016
Fixed Income -0.9 (42) -0.3 (92) 0.7 (95) 1.2 (82) 1.5 (85) 4.0 (60) -0.9 (42) 2.4 (95) 2.3 (89)
Asset Class Target -1.1 (52) -0.4 (94) 0.5 (97) 1.0 (90) 1.3 (89) 3.4 (80) -1.1 (52) 2.3 (95) 2.0 (93)
5th Percentile -0.1 2.6 4.3 4.1 4.5 6.6 -0.1 7.5 8.31st Quartile -0.6 1.2 3.0 2.7 3.3 4.9 -0.6 5.5 6.2Median -1.0 0.6 1.9 2.0 2.1 4.2 -1.0 4.6 4.63rd Quartile -1.3 0.2 1.3 1.4 1.7 3.6 -1.3 3.7 3.595th Percentile -1.7 -0.5 0.7 0.4 0.4 2.3 -1.7 2.3 1.4
Population 70 68 67 66 59 38 70 63 64
Plan Sponsor Peer Group AnalysisAs of March 31, 2018
All Public Plans > $1B-US Fixed Income Segment
Parentheses contain percentile rankings.
39
(This page is left blank intentionally)
40

Private Equity
41
LBO70.4%
Venture Capital19.4%
Other10.2%
FRS Private Equity by Market Value*
LBO46.8%
Venture Capital15.5%
Other****37.7%
Overview
Private Equity As of March 31, 2018
Preqin Private Equity Strategies by Market
Value**
*Allocation data is as of March 31, 2018.**Allocation data is as of June 30, 2015, from the Preqin database.***Other for the FRS Private Equity consists of Growth Capital, Secondary, PE Cash, and PE Transition.****Other for the Preqin data consists of Distressed PE, Growth, Mezzanine, and other Private Equity/Special Situations.Preqin universe is comprised of 10,000 private equity funds representing $3.8 trillion.
42

Private Equity Return Summary as of March 31, 2018
Private Equity Legacy Return Summary as of March 31, 2018
Private Equity Post Asset Class Return Summary as of March 31, 2018
Private Equity Asset Class Target
0.0
8.0
16.0
24.0
32.0R
etur
n
1Year
3Years
5Years
10Years
18.0
11.3 13.4 11.8
18.714.5 15.4
9.7
Private Equity Legacy Asset Class Target
0.015.030.045.0
-15.0-30.0
Ret
urn
1Year
3Years
5Years
10Years
18.011.3 13.4 11.8
-13.3 -15.1-8.1 -9.5
Private Equity Post Asset Class Asset Class Target
0.0
8.0
16.0
24.0
32.0
Ret
urn
1Year
3Years
5Years
10Years
18.0
11.3 13.4 11.8
18.914.7 15.9
10.7
Private Equity
Time-Weighted Investment Results
43
9.24.4
13.411.0 10.0
12.2
-5.00.05.0
10.015.020.025.0
Private Equity Legacy Portfolio* Post-AC Portfolio**Rate
of
Retu
rn (
%)
Since Inception
Private Equity Target
9.14.4
13.313.2 13.4 12.4
-5.00.05.0
10.015.020.025.0
Private Equity Legacy Portfolio* Post-AC Portfolio**Rate
of
Retu
rn (
%)
Since Inception
Private Equity Secondary Target***
Dollar-Weighted Investment Results
Private Equity
*The Inception Date for the Legacy Portfolio is January 1989.**The Inception Date for the Post-AC Portfolio is September 2000.***The Secondary Target is a blend of the Cambridge Associates Private Equity Index and the Cambridge Associates Venture Capital Index based on actual ABAL weights. Secondary Target data is on a quarterly lag.
As of December 31, 2017
As of March 31, 2018
44

Real Estate
45
Apartment 20.2%
Industrial 14.6%
Retail 18.7%
Office 31.6%
Other14.9%
Apartment 24.1%
Industrial 16.2%
Retail 19.8%
Office 36.0%
Other 3.9%
Overview
Real Estate As of December 31, 2017
*Property Allocation data is as of December 31, 2017. The FRS chart includes only the FRS private real estate assets. Property type information for the REIT portfolios is not included.**Other for the FRS consists of Hotel, Land, Preferred Equity, Agriculture, Self-Storage and Senior Housing.***Other for the NFI-ODCE Index consists of Hotel, Senior Living, Health Care, Mixed Use, Single Family Residential, Parking, Timber/Agriculture, Land and Infrastructure.
FRS*NFI-ODCE
Index*
46

Current Allocation
Return Summary
March 31, 2018 : $14,103M
Externally Managed Joint Ventures 0.0%REITs 9.9%Cash 1.0%
Pooled Funds 27.5%
Principal Investments 61.6%
Real Estate Asset Class Target
0.0
5.0
10.0
15.0
20.0
Ret
urn
1Quarter
FiscalYTD
1Year
3Years
5Years
10Years
1.3
4.86.5
8.910.1
4.7
1.7
5.5
8.49.5
11.3
6.1
Real Estate
Real Estate Portfolio OverviewAs of March 31, 2018
47
Principal Investments Return Summary as of March 31, 2018
Pooled Funds Return Summary as of March 31, 2018
REITs Return Summary as of March 31, 2018
Principal Investments NCREIF NPI Index
0.0
5.0
10.0
15.0
20.0
Ret
urn
1Year
3Years
5Years
10Years
6.79.3 10.1
4.17.6
10.3 11.4
7.3
Pooled Funds NFI-ODCE Index Net of Fees
0.0
5.0
10.0
15.0
20.0
Ret
urn
1Year
3Years
5Years
10Years
7.19.0 10.4
4.2
11.3 10.913.3
3.2
REITs FTSE EPRA/NAREIT Developed Index
0.0
3.0
6.0
9.0
Ret
urn
1Year
3Years
5Years
10Years
3.21.5
4.1 4.75.9
2.9
5.4 5.4
Real Estate
48

Strategic Investments
49
Current Allocation
Return Summary
March 31, 2018 : $12,907M
SI Cash AA 0.6%
SI Equity 20.3%
SI Real Assets 19.2%
SI Diversifying Strategies 18.6%
SI Flexible Mandates 13.4%
SI Debt 27.9%
Strategic Investments Short-Term Target
0.0
4.0
8.0
12.0
16.0
Ret
urn
1Quarter
FiscalYTD
1Year
3Years
5Years
10Years
0.6
4.65.9
4.25.7
3.5
1.9
6.3
8.6
6.3
8.5
5.6
Strategic Investments
Strategic Investments Portfolio OverviewAs of March 31, 2018
50

Cash
51
Return Summary
Cash iMoneyNet First Tier Institutional Money Market Funds Net Index
0.0
0.2
0.4
0.6
0.8
1.0
1.2
1.4
1.6
1.8
-0.2
-0.4
-0.6
Ret
urn
1Quarter
FisalYTD
1Year
3Years
5Years
10Years
0.3
0.8
1.0
0.5
0.3
0.5
0.4
1.0
1.2
0.7
0.5
0.0
Cash
Cash Performance SummaryAs of March 31, 2018
52

Appendix
53
Total FRS AssetsPerformance Benchmark - A combination of the Global Equity Target, the Barclays Capital U.S. Intermediate Aggregate Index, the Private Equity Target Index,the Real Estate Investments Target Index, the Strategic Investments Target Benchmark, and the iMoneyNet First Tier Institutional Money Market Funds NetIndex. The short-term target policy allocations to the Strategic Investments, Real Estate and Private Equity asset classes are floating and based on the actualaverage monthly balance of the Global Equity asset class. Please refer to section VII. Performance Measurement in the FRS Defined Benefit Plan InvestmentPolicy Statement for more details on the calculation of the Performance Benchmark. Prior to October 1, 2013, the Performance benchmark was a combination ofthe Global Equity Target, the Barclays Aggregate Bond Index, the Private Equity Target Index, the Real Estate Investments Target Index, the StrategicInvestments Target Benchmark, and the iMoneyNet First Tier Institutional Money Market Funds Net Index. The short-term target policy allocations to the StrategicInvestments, Real Estate and Private Equity asset classes are floating and based on the actual average monthly balance of the Global Equity asset class. Prior toJuly 2010, the Performance Benchmark was a combination of the Russell 3000 Index, the Foreign Equity Target Index, the Strategic Investments TargetBenchmark, the Barclays Aggregate Bond Index, the Real Estate Investments Target Index, the Private Equity Target Index, the Barclays U.S. High Yield Ba/B2% Issuer Capped Index, and the iMoneyNet First Tier Institutional Money Market Funds Gross Index. During this time, the short-term target policy allocations toStrategic Investments, Real Estate and Private Equity asset classes were floating and based on the actual average monthly balance of the Strategic Investments,Real Estate and Private Equity asset classes. The target weights shown for Real Estate and Private Equity were the allocations that the asset classes werecentered around. The actual target weight floated around this target month to month based on changes in asset values.
Total Global EquityPerformance Benchmark - A custom version of the MSCI All Country World Investable Market Index, adjusted to exclude companies divested under theprovisions of the Protecting Florida's Investments Act (PFIA). Prior to July 2010, the asset class benchmark is a weighted average of the underlyingDomestic Equities, Foreign Equities and Global Equities historical benchmarks.
Total Domestic EquitiesPerformance Benchmark - The Russell 3000 Index. Prior to July 1, 2002, the benchmark was the Wilshire 2500 Stock Index. Prior to January 1, 2001, thebenchmark was the Wilshire 2500 Stock Index ex-Tobacco. Prior to May 1, 1997, the benchmark was the Wilshire 2500 Stock Index. Prior to September 1, 1994,the benchmark was the S&P 500 Stock Index.
Total Foreign EquitiesPerformance Benchmark - A custom version of the MSCI ACWI ex-U.S. Investable Market Index adjusted to exclude companies divested under the PFIA. Prior toApril 1, 2008, it was the MSCI All Country World Index ex-U.S. Investable Market Index. Prior to September 24, 2007, the target was the MSCI All Country Worldex-U.S. Free Index. Prior to November 1, 1999, the benchmark was 85% MSCI Europe, Australasia and Far East (EAFE) Foreign Stock Index and 15% IFCIEmerging Markets Index with a half weight in Malaysia. Prior to March 31, 1995, the benchmark was the EAFE Index.
Total Global EquitiesPerformance Benchmark - Aggregated based on each underlying manager's individual benchmark. The calculation accounts for the actual weight and thebenchmark return. The benchmarks used for the underlying managers include both the MSCI FSB All Country World ex-Sudan ex-Iran Net Index and MSCI FSBAll Country World ex-Sudan ex-Iran Net Investable Market Index (IMI).
AppendixAs of March 31, 2018
54
AppendixAs of March 31, 2018
Total Fixed IncomePerformance Benchmark - The Barclays Capital U.S. Intermediate Aggregate Index. Prior to October 1, 2013, it was the Barclays U.S. Aggregate Bond Index.Prior to June 1, 2007, it was the Fixed Income Management Aggregate (FIMA). Prior to July 1, 1999, the benchmark was the Florida High Yield ExtendedDuration Index. Prior to July 31, 1997, the benchmark was the Florida Extended Duration Index. Prior to July 1, 1989, the Salomon Brothers Broad Investment-Grade Bond Index was the benchmark. For calendar year 1985, the performance benchmark was 70% Shearson Lehman Extended Duration and 30% SalomonBrothers Mortgage Index.
Total Private EquityPerformance Benchmark - The MSCI All Country World Investable Market Index (ACWI IMI), adjusted to reflect the provisions of the Protecting Florida'sInvestments Act, plus a fixed premium return of 300 basis points per annum. Prior to July 1, 2014, the benchmark was the domestic equities target index return(Russell 3000 Index) plus a fixed premium return of 300 basis points per annum. Prior to July 1, 2010, it was the domestic equities target index return plus a fixedpremium return of 450 basis points per annum. Prior to November 1, 1999, Private Equities was part of the Domestic Equities asset class and its benchmark wasthe domestic equities target index return plus 750 basis points.
Total Real EstatePerformance Benchmark - The core portion of the asset class is benchmarked to an average of the National Council of Real Estate Investment Fiduciaries(NCREIF) Fund Index- Open-ended Diversified Core Equity, net of fees, weighted at 76.5%, and the non-core portion of the asset class is benchmarked to anaverage of the National Council of Real Estate Investment Fiduciaries (NCREIF) Fund Index- Open-ended Diversified Core Equity, net of fees, weighted at13.5%, plus a fixed return premium of 150 basis points per annum, and the FTSE EPRA/NAREIT Developed Index, in dollar terms, net of withholding taxes onnon-resident institutional investors, weighted at 10%. Prior to July 1, 2014, the benchmark was a combination of 90% NCREIF ODCE Index, net of fees, and 10%FTSE EPRA/NAREIT Developed Index, net of fees. Prior to July 1, 2010, it was a combination of 90% NCREIF ODCE Index, gross of fees, and 10% Dow JonesU.S. Select RESI. Prior to June 1, 2007, it was the Consumer Price Index plus 450 basis points annually. Prior to July 1, 2003, the benchmark was the DowJones U.S. Select Real Estate Securities Index Un-Levered. Prior to November 1, 1999, the benchmark was the Russell-NCREIF Property Index.
Total Strategic InvestmentsPerformance Benchmark - Long-term, 4.5% plus the contemporaneous rate of inflation or CPI. Short-term, a weighted aggregation of individual portfolio levelbenchmarks.
Total CashPerformance Benchmark - The iMoneyNet First Tier Institutional Money Market Funds Net Index. Prior to July 1, 2010, it was the iMoneyNet First Tier InstitutionalMoney Market Funds Gross Index. Prior to June 1, 2007, it was the return of the Merrill Lynch 90-Day (Auction Average) Treasury Bill Yield Index.
55
Description of Benchmarks
Barclays Capital U.S. Intermediate Aggregate Bond Index - A market value-weighted index consisting of U.S. Treasury securities, corporate bonds andmortgage-related and asset-backed securities with one to ten years to maturity and an outstanding par value of $250 million or greater.
Consumer Price Index (CPI) - The CPI, an index consisting of a fixed basket of goods bought by the typical consumer and used to measure consumer inflation.
FTSE EPRA/NAREIT Developed Index - An index designed to represent general trends in eligible real estate equities worldwide. Relevant real estate activitiesare defined as the ownership, disposure and development of income-producing real estate. This index covers the four primary core asset classes (Industrial,Retail, Office, and Apartment).
iMoneyNet First Tier Institutional Money Market Funds Net Index - An average of non-governmental institutional funds that do not hold any second tiersecurities. It includes money market mutual funds, net of fees, that invest in commercial paper, bank obligations and short-term investments in the highest ratingscategory and is open to corporations and fiduciaries only.
MSCI All Country World Investable Market Index - A free float-adjusted market capitalization-weighted index that is designed to measure the equity marketperformance of developed and emerging markets. This investable market index contains constituents from the large, mid, and small cap size segments andtargets a coverage range around 99% of free-float adjusted market capitalization.
NCREIF ODCE Property Index - The NCREIF ODCE is a capitalization-weighted, gross of fee, time-weighted return index. The index is a summation of open-end funds, which NCREIF defines as infinite-life vehicles consisting of multiple investors who have the ability to enter or exit the fund on a periodic basis, subjectto contribution and/or redemption requests.
Russell 3000 Index - A capitalization-weighted stock index consisting of the 3,000 largest publicly traded U.S. stocks by capitalization. This represents mostpublicly traded, liquid U.S. stocks.
AppendixAs of March 31, 2018
56
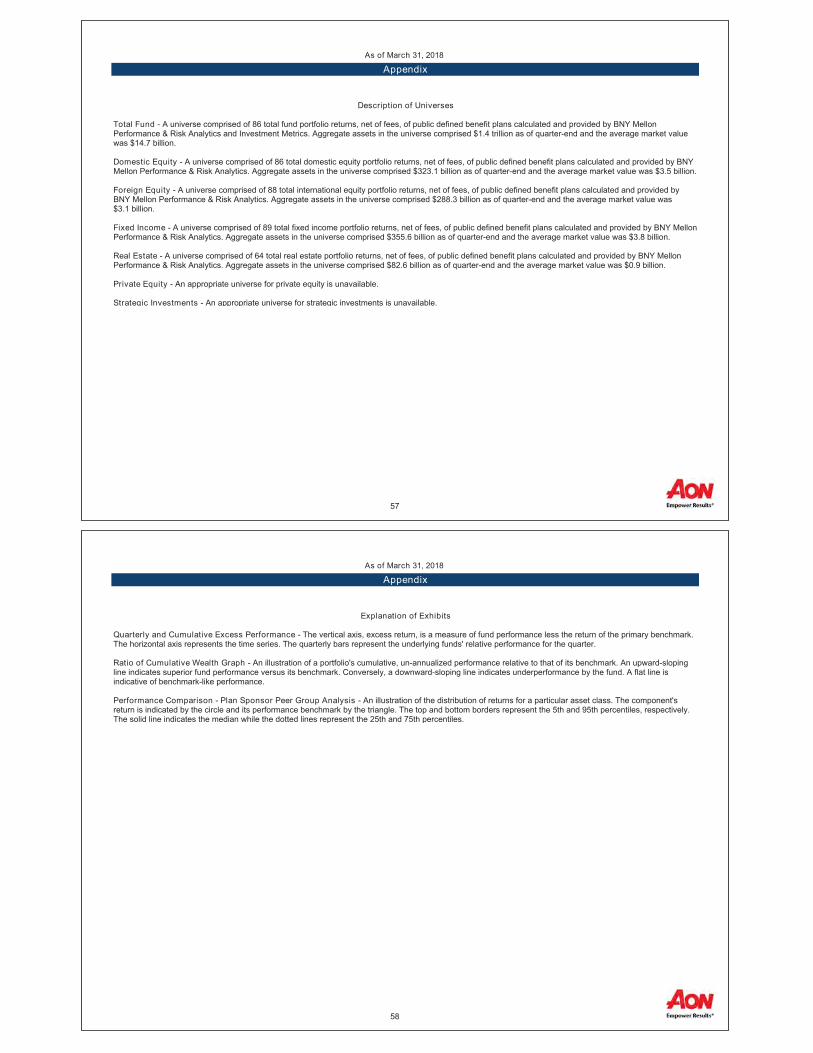
Description of Universes
Total Fund - A universe comprised of 86 total fund portfolio returns, net of fees, of public defined benefit plans calculated and provided by BNY MellonPerformance & Risk Analytics and Investment Metrics. Aggregate assets in the universe comprised $1.4 trillion as of quarter-end and the average market valuewas $14.7 billion.
Domestic Equity - A universe comprised of 86 total domestic equity portfolio returns, net of fees, of public defined benefit plans calculated and provided by BNYMellon Performance & Risk Analytics. Aggregate assets in the universe comprised $323.1 billion as of quarter-end and the average market value was $3.5 billion.
Foreign Equity - A universe comprised of 88 total international equity portfolio returns, net of fees, of public defined benefit plans calculated and provided byBNY Mellon Performance & Risk Analytics. Aggregate assets in the universe comprised $288.3 billion as of quarter-end and the average market value was$3.1 billion.
Fixed Income - A universe comprised of 89 total fixed income portfolio returns, net of fees, of public defined benefit plans calculated and provided by BNY MellonPerformance & Risk Analytics. Aggregate assets in the universe comprised $355.6 billion as of quarter-end and the average market value was $3.8 billion.
Real Estate - A universe comprised of 64 total real estate portfolio returns, net of fees, of public defined benefit plans calculated and provided by BNY MellonPerformance & Risk Analytics. Aggregate assets in the universe comprised $82.6 billion as of quarter-end and the average market value was $0.9 billion.
Private Equity - An appropriate universe for private equity is unavailable.
Strategic Investments - An appropriate universe for strategic investments is unavailable.
AppendixAs of March 31, 2018
57
Explanation of Exhibits
Quarterly and Cumulative Excess Performance - The vertical axis, excess return, is a measure of fund performance less the return of the primary benchmark.The horizontal axis represents the time series. The quarterly bars represent the underlying funds' relative performance for the quarter.
Ratio of Cumulative Wealth Graph - An illustration of a portfolio's cumulative, un-annualized performance relative to that of its benchmark. An upward-slopingline indicates superior fund performance versus its benchmark. Conversely, a downward-sloping line indicates underperformance by the fund. A flat line isindicative of benchmark-like performance.
Performance Comparison - Plan Sponsor Peer Group Analysis - An illustration of the distribution of returns for a particular asset class. The component'sreturn is indicated by the circle and its performance benchmark by the triangle. The top and bottom borders represent the 5th and 95th percentiles, respectively.The solid line indicates the median while the dotted lines represent the 25th and 75th percentiles.
AppendixAs of March 31, 2018
58

The rates of return contained in this report are shown on an after-fees basis unless otherwise noted. They are geometric and time-weighted. Returns for periods longer than one year are annualized.
Universe percentiles are based upon an ordering system in which 1 is the best ranking and 100 is the worst ranking.
Due to rounding throughout the report, percentage totals displayed may not sum to 100%. Additionally, individual fund totals in dollar terms may not sum to the plan total.
<ReportMemberName>
NotesAs of March 31, 2018
59
The information contained herein is proprietary and provided for informational purposes only. It is not complete and does not contain certain material information about making investments in securities including important disclosures and risk factors. All securities transactions involve substantial risk of loss. Under no circumstances does the information in this report represent a recommendation to buy or sell stocks, limited partnership interests, or other investment instruments.
The data contained in these reports is compiled from statements provided by the custodian(s), record-keeper(s), and/or other third-party data provider(s). Thisdocument is not intended to provide, and shall not be relied upon for, accounting and legal or tax advice. AHIC has not conducted additional audits and cannotwarrant its accuracy or completeness.
We urge you to compare this statement with that of your qualified custodian and/or record-keeper and notify AHIC with any issues or questions you may havewith respect to investment performance or any other matter set forth herein.
The mutual fund information found in this report is provided by Thomson Reuters Lipper and AHIC cannot warrant its accuracy or timeliness. Thomson ReutersLipper Global Data Feed provides comprehensive coverage of mutual fund information directly to Investment Metrics, AHIC’s performance reporting vendor, viathe PARis performance reporting platform. Thomson Reuters Lipper is the data provider chosen by Investment Metrics, and as such, AHIC has no directrelationship with Thomson Reuters Lipper.
Refer to Hedge Fund Research, Inc. www.hedgefundresearch.com for information on HFR indices.
FTSE International Limited (“FTSE”) © FTSE 2017. “FTSE®” and “FTSE4Good®” are trademarks of the London Stock Exchange Group companies and are usedby FTSE International Limited under license. The FTSE indices are calculated by FTSE International Limited in conjunction with Indonesia Stock Exchange,Bursa Malaysia Berhad, The Philippine Stock Exchange, Inc., Singapore Exchange Securities Trading Limited and the Stock Exchange of Thailand (the"Exchanges"). All intellectual property rights in the FTSE/ASEAN Index vest in FTSE and the Exchanges. Neither FTSE nor its licensors accept any liability forany errors or omissions in the FTSE indices and / or FTSE ratings or underlying data. No further distribution of FTSE Data is permitted without FTSE’s expresswritten consent.
Past performance is not necessarily indicative of future results.
Aon Hewitt Investment Consulting, Inc. (“AHIC”) is a federally registered investment advisor with the U.S. Securities and Exchange Commission (“SEC”). AHIC isalso registered with the Commodity Futures Trade Commission as a commodity pool operator and a commodity trading advisor, and is a member of the NationalFutures Association. The AHIC ADV Form Part 2A disclosure statement is available upon written request to:
Aon Hewitt Investment Consulting, Inc.200 East Randolph StreetSuite 1500Chicago, IL 60601ATTN: AHIC Compliance Officer
Disclaimers
60

Visit the Aon Retirement and Investment Blog (http://retirementandinvestmentblog.aon.com); sharing our best thinking.
FRS Investment Plan | First Quarter 2018
Quarterly Investment Review
(This page is left blank intentionally)

1 FRS Investment Plan 12 Appendix 11
Table Of Contents
(This page is left blank intentionally)

FRS Investment Plan
1
AllocationMarketValue
($)%
Performance(%)
1Quarter
1Year
3Years
5Years
10Years
FRS Investment Plan 10,653,242,093 100.0 -0.2 11.1 6.6 7.5 5.9 Total Plan Aggregate Benchmark -0.8 10.0 6.3 7.1 5.4Blank
Retirement Date 4,725,830,818 44.4Blank
FRS Retirement Fund 385,061,486 3.6 -0.8 (76) 6.5 (39) 3.7 (62) 3.7 (95) - Retirement Custom Index -1.1 (79) 6.1 (54) 3.9 (60) 3.7 (95) -IM Retirement Income (MF) Median -0.5 6.3 4.3 6.2 5.7
FRS 2015 Retirement Date Fund 330,530,665 3.1 -0.8 (56) 7.3 (45) 4.2 (72) 4.3 (83) - 2015 Retirement Custom Index -1.1 (97) 6.6 (68) 4.2 (72) 4.2 (85) -IM Mixed-Asset Target 2015 (MF) Median -0.7 7.0 4.7 5.9 5.3
FRS 2020 Retirement Date Fund 614,518,085 5.8 -0.7 (42) 8.7 (28) 5.2 (41) 5.6 (64) - 2020 Retirement Custom Index -1.0 (81) 8.0 (45) 5.0 (50) 5.4 (65) -IM Mixed-Asset Target 2020 (MF) Median -0.8 8.0 5.0 6.2 5.5
FRS 2025 Retirement Date Fund 699,298,033 6.6 -0.6 (51) 10.3 (20) 6.2 (26) 6.8 (57) - 2025 Retirement Custom Index -0.9 (75) 9.5 (50) 5.9 (46) 6.5 (65) -IM Mixed-Asset Target 2025 (MF) Median -0.6 9.5 5.8 7.0 5.9
FRS 2030 Retirement Date Fund 643,516,004 6.0 -0.6 (46) 11.5 (30) 6.9 (22) 7.9 (52) - 2030 Retirement Custom Index -0.9 (75) 10.8 (52) 6.5 (45) 7.6 (57) -IM Mixed-Asset Target 2030 (MF) Median -0.7 10.8 6.4 8.0 6.2
FRS 2035 Retirement Date Fund 600,028,601 5.6 -0.6 (57) 12.7 (29) 7.6 (21) 8.9 (42) - 2035 Retirement Custom Index -0.9 (80) 11.9 (64) 7.0 (55) 8.4 (58) -IM Mixed-Asset Target 2035 (MF) Median -0.5 12.1 7.1 8.5 6.5
FRS 2040 Retirement Date Fund 523,086,378 4.9 -0.6 (50) 13.4 (25) 7.9 (24) 9.1 (43) - 2040 Retirement Custom Index -0.9 (73) 12.8 (54) 7.5 (49) 8.8 (63) -IM Mixed-Asset Target 2040 (MF) Median -0.6 12.9 7.4 9.0 6.7
FRS 2045 Retirement Date Fund 511,849,311 4.8 -0.6 (58) 13.9 (34) 8.2 (19) 9.3 (50) - 2045 Retirement Custom Index -0.9 (81) 13.4 (51) 7.8 (52) 9.0 (69) -IM Mixed-Asset Target 2045 (MF) Median -0.4 13.4 7.8 9.3 6.7
FRS 2050 Retirement Date Fund 285,409,439 2.7 -0.6 (48) 14.0 (33) 8.2 (21) 9.3 (63) - 2050 Retirement Custom Index -0.8 (74) 13.5 (54) 7.8 (50) 9.0 (71) -IM Mixed-Asset Target 2050 (MF) Median -0.6 13.6 7.8 9.4 6.8
FRS 2055 Retirement Date Fund 124,807,459 1.2 -0.5 (58) 14.0 (48) 8.2 (33) 9.3 (66) - 2055 Retirement Custom Index -0.8 (80) 13.5 (68) 7.8 (63) 9.0 (83) -IM Mixed-Asset Target 2055+ (MF) Median -0.4 13.9 8.0 9.5 -
FRS 2060 Retirement Date Fund 7,725,357 0.1 -0.5 (57) - - - - 2060 Retirement Custom Index -0.8 (80) - - - -IM Mixed-Asset Target 2055+ (MF) Median -0.4 13.9 8.0 9.5 -
Asset Allocation & PerformanceAs of March 31, 2018
2
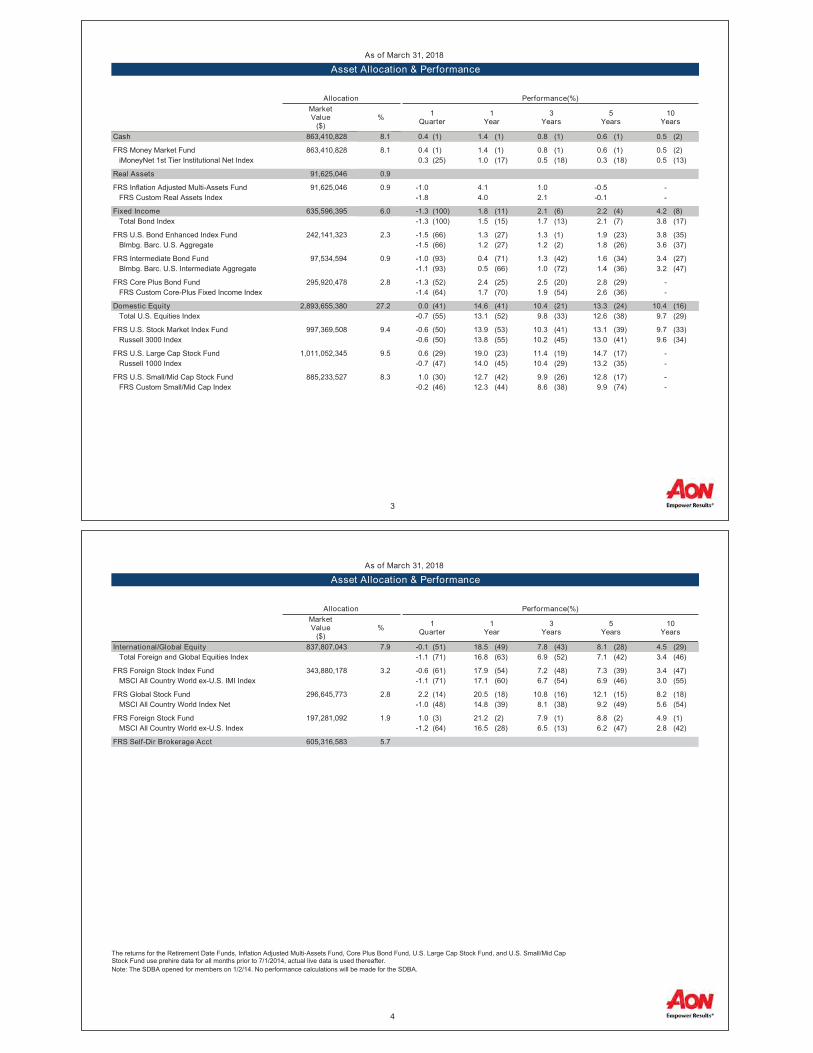
Asset Allocation & PerformanceAs of March 31, 2018
AllocationMarketValue
($)%
Performance(%)
1Quarter
1Year
3Years
5Years
10Years
Cash 863,410,828 8.1 0.4 (1) 1.4 (1) 0.8 (1) 0.6 (1) 0.5 (2)IM U.S. Taxable Money Market (MF) Median 0.3 0.9 0.4 0.2 0.3
FRS Money Market Fund 863,410,828 8.1 0.4 (1) 1.4 (1) 0.8 (1) 0.6 (1) 0.5 (2) iMoneyNet 1st Tier Institutional Net Index 0.3 (25) 1.0 (17) 0.5 (18) 0.3 (18) 0.5 (13)IM U.S. Taxable Money Market (MF) Median 0.3 0.9 0.4 0.2 0.3
Real Assets 91,625,046 0.9
FRS Inflation Adjusted Multi-Assets Fund 91,625,046 0.9 -1.0 4.1 1.0 -0.5 - FRS Custom Real Assets Index -1.8 4.0 2.1 -0.1 -
Fixed Income 635,596,395 6.0 -1.3 (100) 1.8 (11) 2.1 (6) 2.2 (4) 4.2 (8) Total Bond Index -1.3 (100) 1.5 (15) 1.7 (13) 2.1 (7) 3.8 (17)IM U.S. Intermediate Investment Grade (MF) Median -0.6 0.6 1.1 1.2 3.1
FRS U.S. Bond Enhanced Index Fund 242,141,323 2.3 -1.5 (66) 1.3 (27) 1.3 (1) 1.9 (23) 3.8 (35) Blmbg. Barc. U.S. Aggregate -1.5 (66) 1.2 (27) 1.2 (2) 1.8 (26) 3.6 (37)IM U.S. Long Term Treasury/Govt Bond (MF) Median -1.2 0.3 0.3 1.0 3.1
FRS Intermediate Bond Fund 97,534,594 0.9 -1.0 (93) 0.4 (71) 1.3 (42) 1.6 (34) 3.4 (27) Blmbg. Barc. U.S. Intermediate Aggregate -1.1 (93) 0.5 (66) 1.0 (72) 1.4 (36) 3.2 (47)IM U.S. Intermediate Investment Grade (MF) Median -0.6 0.6 1.1 1.2 3.1
FRS Core Plus Bond Fund 295,920,478 2.8 -1.3 (52) 2.4 (25) 2.5 (20) 2.8 (29) - FRS Custom Core-Plus Fixed Income Index -1.4 (64) 1.7 (70) 1.9 (54) 2.6 (36) -IM U.S. Broad Market Core+ Fixed Income (SA+CF) Median -1.3 2.0 1.9 2.4 4.8
Domestic Equity 2,893,655,380 27.2 0.0 (41) 14.6 (41) 10.4 (21) 13.3 (24) 10.4 (16) Total U.S. Equities Index -0.7 (55) 13.1 (52) 9.8 (33) 12.6 (38) 9.7 (29)IM U.S. Multi-Cap Equity (MF) Median -0.5 13.3 8.6 11.9 8.8
FRS U.S. Stock Market Index Fund 997,369,508 9.4 -0.6 (50) 13.9 (53) 10.3 (41) 13.1 (39) 9.7 (33) Russell 3000 Index -0.6 (50) 13.8 (55) 10.2 (45) 13.0 (41) 9.6 (34)IM U.S. Large Cap Equity (MF) Median -0.7 14.2 9.8 12.5 9.0
FRS U.S. Large Cap Stock Fund 1,011,052,345 9.5 0.6 (29) 19.0 (23) 11.4 (19) 14.7 (17) - Russell 1000 Index -0.7 (47) 14.0 (45) 10.4 (29) 13.2 (35) -IM U.S. Large Cap Equity (SA+CF) Median -0.8 13.3 9.4 12.5 9.1
FRS U.S. Small/Mid Cap Stock Fund 885,233,527 8.3 1.0 (30) 12.7 (42) 9.9 (26) 12.8 (17) - FRS Custom Small/Mid Cap Index -0.2 (46) 12.3 (44) 8.6 (38) 9.9 (74) -IM U.S. SMID Cap Equity (SA+CF) Median -0.4 11.5 7.5 11.1 10.0
3
Asset Allocation & PerformanceAs of March 31, 2018
AllocationMarketValue
($)%
Performance(%)
1Quarter
1Year
3Years
5Years
10Years
International/Global Equity 837,807,043 7.9 -0.1 (51) 18.5 (49) 7.8 (43) 8.1 (28) 4.5 (29) Total Foreign and Global Equities Index -1.1 (71) 16.8 (63) 6.9 (52) 7.1 (42) 3.4 (46)IM International Equity (MF) Median -0.1 18.4 7.0 6.7 3.2
FRS Foreign Stock Index Fund 343,880,178 3.2 -0.6 (61) 17.9 (54) 7.2 (48) 7.3 (39) 3.4 (47) MSCI All Country World ex-U.S. IMI Index -1.1 (71) 17.1 (60) 6.7 (54) 6.9 (46) 3.0 (55)IM International Equity (MF) Median -0.1 18.4 7.0 6.7 3.2
FRS Global Stock Fund 296,645,773 2.8 2.2 (14) 20.5 (18) 10.8 (16) 12.1 (15) 8.2 (18) MSCI All Country World Index Net -1.0 (48) 14.8 (39) 8.1 (38) 9.2 (49) 5.6 (54)IM Global Equity (MF) Median -1.1 13.1 7.1 9.1 5.8
FRS Foreign Stock Fund 197,281,092 1.9 1.0 (3) 21.2 (2) 7.9 (1) 8.8 (2) 4.9 (1) MSCI All Country World ex-U.S. Index -1.2 (64) 16.5 (28) 6.5 (13) 6.2 (47) 2.8 (42)IM International Large Cap Core Equity (MF) Median -1.0 14.0 5.3 6.0 2.5
FRS Self-Dir Brokerage Acct 605,316,583 5.7
The returns for the Retirement Date Funds, Inflation Adjusted Multi-Assets Fund, Core Plus Bond Fund, U.S. Large Cap Stock Fund, and U.S. Small/Mid CapStock Fund use prehire data for all months prior to 7/1/2014, actual live data is used thereafter.Note: The SDBA opened for members on 1/2/14. No performance calculations will be made for the SDBA.
4

Performance(%)2017 2016 2015 2014 2013 2012 2011 2010
FRS Investment Plan 16.4 8.0 -0.9 4.9 15.2 10.5 0.7 10.6 Total Plan Aggregate Benchmark 15.5 8.5 -1.3 4.9 14.6 9.7 0.9 10.2Blank
Retirement DateBlank
FRS Retirement Fund 10.8 (52) 6.2 (50) -2.6 (100) 4.4 (82) 3.5 (96) 10.7 (59) 3.4 (10) 11.5 (55) Retirement Custom Index 10.4 (58) 6.2 (50) -1.8 (95) 3.6 (89) 3.4 (96) 8.5 (78) 5.0 (1) 9.9 (84)IM Retirement Income (MF) Median 10.8 6.2 -0.2 5.7 12.8 11.0 -0.5 11.8
FRS 2015 Retirement Date Fund 12.0 (39) 6.7 (43) -2.5 (98) 4.4 (78) 5.5 (89) 11.3 (43) 2.1 (20) 11.5 (62) 2015 Retirement Custom Index 11.2 (60) 6.5 (50) -1.8 (92) 3.7 (92) 5.7 (88) 9.6 (88) 3.2 (1) 10.4 (85)IM Mixed-Asset Target 2015 (MF) Median 11.5 6.5 -0.8 4.9 11.5 11.0 0.9 11.7
FRS 2020 Retirement Date Fund 14.0 (23) 7.4 (19) -2.1 (92) 4.4 (79) 9.6 (75) 12.4 (38) 0.6 (38) 12.2 (64) 2020 Retirement Custom Index 13.3 (46) 7.1 (31) -1.6 (82) 3.9 (88) 9.7 (75) 11.0 (74) 1.5 (21) 11.2 (86)IM Mixed-Asset Target 2020 (MF) Median 13.0 6.6 -0.8 5.1 13.0 11.8 0.2 12.8
FRS 2025 Retirement Date Fund 16.1 (26) 8.0 (14) -1.7 (80) 4.5 (86) 13.7 (74) 13.5 (43) -0.7 (35) 12.5 (88) 2025 Retirement Custom Index 15.5 (39) 7.6 (19) -1.5 (75) 4.2 (91) 13.8 (74) 12.4 (73) -0.3 (26) 11.8 (93)IM Mixed-Asset Target 2025 (MF) Median 15.2 7.2 -1.1 5.5 16.1 13.3 -1.0 13.7
FRS 2030 Retirement Date Fund 18.0 (30) 8.5 (17) -1.3 (60) 4.5 (83) 18.1 (54) 14.6 (34) -2.1 (50) 13.0 (86) 2030 Retirement Custom Index 17.3 (48) 8.0 (36) -1.5 (63) 4.4 (83) 18.2 (52) 13.8 (53) -2.0 (49) 12.5 (91)IM Mixed-Asset Target 2030 (MF) Median 17.2 7.5 -1.0 5.7 18.2 14.0 -2.2 13.9
FRS 2035 Retirement Date Fund 19.8 (27) 9.1 (18) -1.4 (46) 4.4 (84) 22.0 (38) 15.8 (23) -3.0 (46) 13.7 (80) 2035 Retirement Custom Index 18.9 (54) 8.3 (46) -1.7 (63) 4.3 (85) 22.0 (38) 15.2 (46) -3.1 (47) 13.3 (89)IM Mixed-Asset Target 2035 (MF) Median 18.9 8.3 -1.5 5.7 20.8 15.1 -3.1 14.6
FRS 2040 Retirement Date Fund 20.9 (28) 9.2 (19) -1.4 (52) 4.4 (83) 22.3 (48) 15.8 (36) -3.0 (38) 13.7 (79) 2040 Retirement Custom Index 20.4 (45) 8.6 (45) -1.7 (66) 4.3 (84) 22.4 (48) 15.2 (50) -3.1 (38) 13.3 (85)IM Mixed-Asset Target 2040 (MF) Median 20.3 8.4 -1.2 5.9 21.7 15.2 -3.7 14.7
FRS 2045 Retirement Date Fund 21.5 (26) 9.4 (20) -1.5 (48) 4.4 (82) 22.3 (60) 15.8 (38) -3.0 (26) 13.7 (86) 2045 Retirement Custom Index 21.2 (39) 8.9 (37) -1.7 (59) 4.3 (83) 22.4 (60) 15.2 (68) -3.1 (26) 13.3 (89)IM Mixed-Asset Target 2045 (MF) Median 21.0 8.5 -1.6 5.8 23.1 15.7 -3.9 15.0
FRS 2050 Retirement Date Fund 21.6 (32) 9.5 (21) -1.5 (55) 4.4 (82) 22.3 (53) 15.8 (36) -3.0 (20) 13.7 (84) 2050 Retirement Custom Index 21.3 (52) 8.9 (37) -1.7 (62) 4.3 (82) 22.4 (53) 15.2 (58) -3.1 (20) 13.3 (87)IM Mixed-Asset Target 2050 (MF) Median 21.3 8.4 -1.3 6.0 23.3 15.6 -4.0 14.9
FRS 2055 Retirement Date Fund 21.5 (52) 9.3 (27) -1.4 (54) 4.4 (80) 22.3 (73) 15.8 (45) - - 2055 Retirement Custom Index 21.3 (61) 8.9 (33) -1.7 (68) 4.3 (80) 22.4 (72) 15.2 (75) - -IM Mixed-Asset Target 2055+ (MF) Median 21.6 8.7 -1.2 5.7 23.2 15.7 -4.3 -
FRS 2060 Retirement Date Fund - - - - - - - - 2060 Retirement Custom Index - - - - - - - -IM Mixed-Asset Target 2055+ (MF) Median 21.6 8.7 -1.2 5.7 23.2 15.7 -4.3 -
Asset Allocation & PerformanceAs of March 31, 2018
5
Asset Allocation & PerformanceAs of March 31, 2018
Performance(%)2017 2016 2015 2014 2013 2012 2011 2010
Cash 1.2 (1) 0.6 (1) 0.2 (4) 0.1 (1) 0.2 (1) 0.3 (1) 0.2 (1) 0.3 (2)IM U.S. Taxable Money Market (MF) Median 0.7 0.2 0.0 0.0 0.0 0.0 0.0 0.0
FRS Money Market Fund 1.2 (1) 0.6 (1) 0.2 (4) 0.1 (1) 0.2 (1) 0.3 (1) 0.2 (1) 0.3 (2) iMoneyNet 1st Tier Institutional Net Index 0.9 (16) 0.3 (24) 0.0 (26) 0.0 (23) 0.0 (23) 0.1 (23) 0.1 (23) 0.2 (7)IM U.S. Taxable Money Market (MF) Median 0.7 0.2 0.0 0.0 0.0 0.0 0.0 0.0
Real Assets
FRS Inflation Adjusted Multi-Assets Fund 8.1 6.0 -7.9 3.2 -9.1 9.1 7.4 11.7 FRS Custom Real Assets Index 8.1 6.2 -5.0 1.8 -8.9 6.6 4.6 13.0
Fixed Income 4.4 (1) 4.7 (9) 0.3 (78) 4.7 (3) -1.1 (85) 6.0 (36) 6.7 (1) 7.6 (30) Total Bond Index 3.9 (3) 4.3 (11) 0.1 (84) 4.9 (2) -1.2 (88) 4.8 (62) 7.4 (1) 7.0 (35)IM U.S. Intermediate Investment Grade (MF) Median 2.1 2.4 0.7 2.0 0.1 5.5 3.9 6.1
FRS U.S. Bond Enhanced Index Fund 3.6 (29) 2.7 (3) 0.7 (33) 6.2 (35) -2.0 (16) 4.4 (14) 7.9 (67) 6.7 (48) Blmbg. Barc. U.S. Aggregate 3.5 (29) 2.6 (3) 0.5 (43) 6.0 (36) -2.0 (17) 4.2 (15) 7.8 (67) 6.5 (49)IM U.S. Long Term Treasury/Govt Bond (MF) Median 2.2 1.0 0.4 5.1 -3.4 2.9 9.7 6.5
FRS Intermediate Bond Fund 2.4 (20) 3.1 (31) 0.9 (30) 3.4 (20) -0.5 (63) 4.9 (59) 5.9 (12) 7.0 (35) Blmbg. Barc. U.S. Intermediate Aggregate 2.3 (32) 2.0 (69) 1.2 (16) 4.1 (6) -1.0 (83) 3.6 (79) 6.0 (11) 6.1 (48)IM U.S. Intermediate Investment Grade (MF) Median 2.1 2.4 0.7 2.0 0.1 5.5 3.9 6.1
FRS Core Plus Bond Fund 5.3 (26) 5.7 (28) 0.1 (46) 4.6 (88) 0.8 (21) 11.1 (16) 4.6 (89) 10.1 (28) FRS Custom Core-Plus Fixed Income Index 4.2 (63) 4.9 (41) 0.2 (41) 5.1 (79) 0.8 (20) 7.8 (51) 7.6 (31) 9.1 (42)IM U.S. Broad Market Core+ Fixed Income (SA+CF) Median 4.6 4.4 0.0 5.9 -0.8 7.8 7.1 8.7
Domestic Equity 20.8 (48) 13.7 (27) 0.7 (32) 11.5 (42) 35.2 (45) 16.9 (33) 0.3 (38) 20.4 (23) Total U.S. Equities Index 19.6 (55) 14.9 (22) -0.5 (43) 11.1 (46) 34.0 (56) 16.5 (37) -0.1 (41) 19.3 (28)IM U.S. Multi-Cap Equity (MF) Median 20.5 10.1 -1.3 10.7 34.4 15.7 -1.1 16.1
FRS U.S. Stock Market Index Fund 21.2 (55) 12.9 (25) 0.6 (52) 12.6 (34) 33.6 (39) 16.5 (40) 1.0 (38) 17.1 (20) Russell 3000 Index 21.1 (55) 12.7 (26) 0.5 (52) 12.6 (34) 33.6 (40) 16.4 (40) 1.0 (38) 16.9 (21)IM U.S. Large Cap Equity (MF) Median 21.7 9.2 0.8 11.4 32.7 15.8 -0.2 14.1
FRS U.S. Large Cap Stock Fund 25.5 (24) 9.3 (58) 2.7 (30) 12.8 (42) 36.4 (22) 17.2 (24) 1.2 (45) 17.8 (19) Russell 1000 Index 21.7 (43) 12.1 (33) 0.9 (43) 13.2 (33) 33.1 (47) 16.4 (31) 1.5 (41) 16.1 (31)IM U.S. Large Cap Equity (SA+CF) Median 21.0 10.3 0.4 12.3 32.8 15.1 0.6 14.4
FRS U.S. Small/Mid Cap Stock Fund 16.3 (54) 19.9 (25) -1.1 (36) 8.6 (28) 37.1 (46) 18.7 (26) -0.9 (37) 29.6 (25) FRS Custom Small/Mid Cap Index 16.8 (49) 19.6 (26) -4.2 (71) 7.7 (34) 22.0 (98) 15.3 (53) 1.1 (22) 21.3 (85)IM U.S. SMID Cap Equity (SA+CF) Median 16.7 15.4 -2.3 6.1 36.4 15.7 -2.6 25.9
6

Asset Allocation & PerformanceAs of March 31, 2018
Performance(%)2017 2016 2015 2014 2013 2012 2011 2010
International/Global Equity 28.6 (50) 4.5 (42) -2.6 (47) -3.2 (42) 21.6 (33) 18.6 (53) -11.3 (23) 10.1 (73) Total Foreign and Global Equities Index 27.3 (59) 4.9 (39) -4.4 (54) -3.0 (41) 20.6 (39) 16.6 (72) -11.3 (23) 10.1 (73)IM International Equity (MF) Median 28.5 2.8 -3.3 -4.2 16.9 18.8 -14.8 14.3
FRS Foreign Stock Index Fund 28.3 (53) 5.3 (37) -4.4 (54) -4.5 (54) 20.5 (39) 17.6 (63) -11.8 (27) 9.2 (77) MSCI All Country World ex-U.S. IMI Index 27.8 (56) 4.4 (42) -4.6 (55) -4.2 (51) 21.0 (36) 16.4 (72) -12.2 (30) 8.9 (78)IM International Equity (MF) Median 28.5 2.8 -3.3 -4.2 16.9 18.8 -14.8 14.3
FRS Global Stock Fund 29.3 (17) 2.2 (80) 5.6 (13) 3.7 (43) 27.1 (41) 21.0 (15) -7.4 (46) 13.0 (55) MSCI All Country World Index Net 24.0 (39) 7.9 (46) -2.4 (56) 4.2 (39) 22.8 (61) 16.3 (38) -5.5 (35) 11.8 (60)IM Global Equity (MF) Median 22.0 7.4 -1.9 2.7 25.3 14.7 -7.8 13.8
FRS Foreign Stock Fund 31.2 (4) 1.0 (62) -0.5 (23) -2.3 (14) 20.6 (57) 19.6 (41) -13.3 (60) 9.8 (24) MSCI All Country World ex-U.S. Index 27.2 (20) 5.0 (8) -5.3 (80) -3.4 (16) 15.8 (79) 17.4 (72) -13.3 (61) 11.6 (13)IM International Large Cap Core Equity (MF) Median 23.9 1.8 -2.3 -5.6 20.7 19.0 -13.0 7.2
FRS Self-Dir Brokerage Acct
The returns for the Retirement Date Funds, Inflation Adjusted Multi-Assets Fund, Core Plus Bond Fund, U.S. Large Cap Stock Fund, and U.S. Small/Mid CapStock Fund use prehire data for all months prior to 7/1/2014, actual live data is used thereafter.Note: The SDBA opened for members on 1/2/14. No performance calculations will be made for the SDBA.
7
Asset Allocation
FRS Investment Plan As of March 31, 2018
The returns for the Retirement Date Funds, Inflation Adjusted Multi-Assets Fund, Core Plus Bond Fund, U.S. Large Cap Stock Fund, and U.S. Small/Mid Cap Stock Fund use prehire data for all months prior to 7/1/2014, actual live data is used thereafter. Note: The SDBA opened for members on 1/2/14. No performance calculations will be made for the SDBA.
Asset Allocation as of 3/31/2018
U.S. Equity Non-U.S. Equity U.S. Fixed Income Real Assets Cash Brokerage Total % of Total
FRS Retirement Fund 60,454,653 55,833,915 139,392,258 129,380,659 385,061,486 3.6%
FRS 2015 Retirement Date Fund 57,842,866 53,215,437 114,363,610 105,108,752 330,530,665 3.1%
FRS 2020 Retirement Date Fund 140,110,123 129,663,316 200,332,896 144,411,750 614,518,085 5.8%
FRS 2025 Retirement Date Fund 202,097,131 186,712,575 206,992,218 103,496,109 699,298,033 6.6%
FRS 2030 Retirement Date Fund 218,151,925 201,420,509 166,027,129 57,916,440 643,516,004 6.0%
FRS 2035 Retirement Date Fund 229,210,926 211,810,096 128,406,121 30,601,459 600,028,601 5.6%
FRS 2040 Retirement Date Fund 219,696,279 202,957,514 86,832,339 13,600,246 523,086,378 4.9%
FRS 2045 Retirement Date Fund 227,772,943 209,858,218 62,445,616 11,772,534 511,849,311 4.8%
FRS 2050 Retirement Date Fund 127,292,610 117,303,279 34,249,133 6,564,417 285,409,439 2.7%
FRS 2055 Retirement Date Fund 55,664,127 51,295,866 14,976,895 2,870,572 124,807,459 1.2%
FRS 2060 Retirement Date Fund 3,445,509 3,175,122 927,043 177,683 7,725,357 0.1%
Total Retirement Date Funds 1,538,293,584$ 1,420,070,726$ 1,154,018,213$ 605,722,937$ -$ -$ 4,725,830,818$ 44.4%
FRS Money Market Fund 863,410,828 863,410,828 8.1%
Total Cash -$ -$ -$ -$ 863,410,828$ -$ 863,410,828$ 8.1%
FRS Inflation Adjusted Multi-Assets Fund 91,625,046 - 91,625,046 0.9%
Total Real Assets -$ -$ -$ 91,625,046$ -$ -$ 91,625,046$ 0.9%
FRS U.S. Bond Enhanced Index Fund 242,141,323 242,141,323 2.3%
FRS Intermediate Bond Fund 97,534,594 97,534,594 0.9%
FRS Core Plus Bond Fund 295,920,478 295,920,478 2.8%
Total Fixed Income -$ -$ 635,596,395$ -$ -$ -$ 635,596,395$ 6.0%
FRS U.S. Stock Market Index Fund 997,369,508 997,369,508 9.4%
FRS U.S. Large Cap Stock Fund 1,011,052,345 1,011,052,345 9.5%
FRS U.S. Small/Mid Cap Stock Fund 885,233,527 885,233,527 8.3%
Total Domestic Equity 2,893,655,380$ -$ -$ -$ -$ -$ 2,893,655,380$ 27.2%
FRS Foreign Stock Index Fund 343,880,178 343,880,178 3.2%
FRS Global Stock Fund 296,645,773 296,645,773 2.8%
FRS Foreign Stock Fund 197,281,092 197,281,092 1.9%
Total International/Global Equity -$ 837,807,043$ -$ -$ -$ -$ 837,807,043$ 7.9%
FRS Self-Dir Brokerage Acct 605,316,583 605,316,583 5.7%
Total Self-Dir Brokerage Acct 605,316,583$ 605,316,583$ 5.7%
Total Portfolio 4,431,948,964$ 2,257,877,769$ 1,789,614,609$ 697,347,983$ 863,410,828$ 605,316,583$ 10,653,242,093$ 100.0%
Percent of Total 41.60% 21.19% 16.80% 6.55% 8.10% 5.68% 99.9%
8
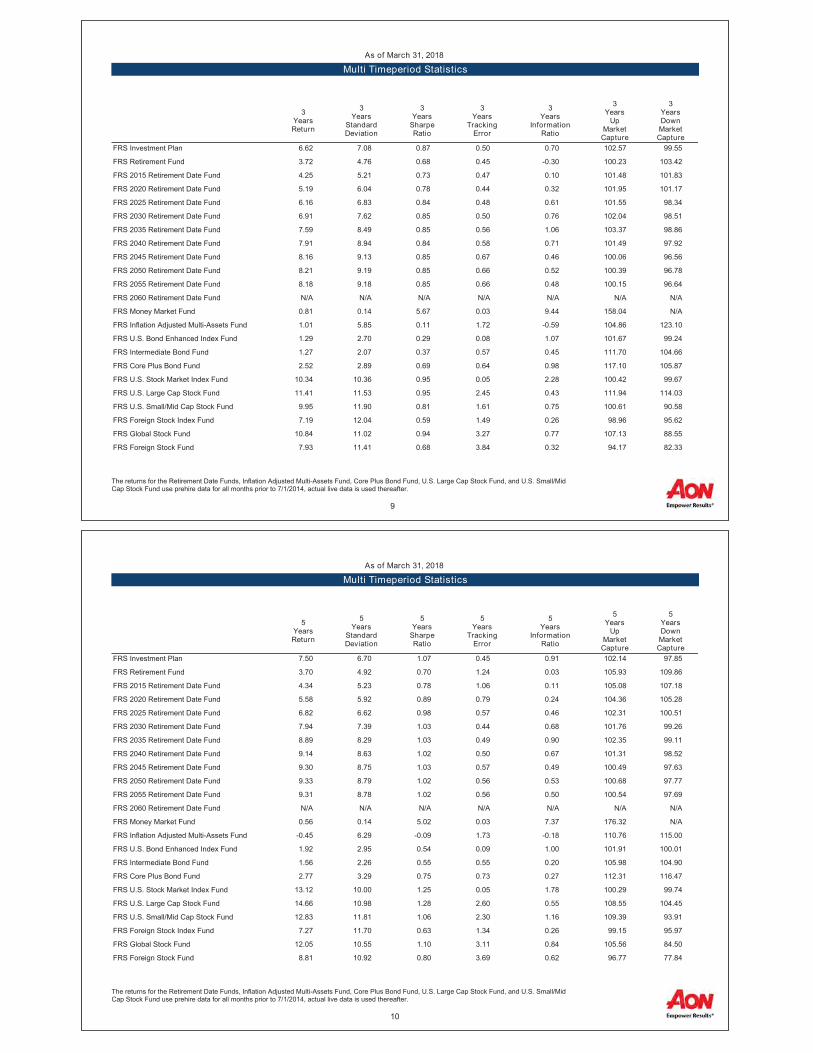
3YearsReturn
3Years
StandardDeviation
3Years
SharpeRatio
3Years
TrackingError
3Years
InformationRatio
3Years
UpMarketCapture
3YearsDownMarketCapture
FRS Investment Plan 6.62 7.08 0.87 0.50 0.70 102.57 99.55Total Plan Aggregate Benchmark 6.26 6.94 0.84 0.00 N/A 100.00 100.00
FRS Retirement Fund 3.72 4.76 0.68 0.45 -0.30 100.23 103.42Retirement Custom Index 3.86 4.62 0.73 0.00 N/A 100.00 100.00
FRS 2015 Retirement Date Fund 4.25 5.21 0.73 0.47 0.10 101.48 101.832015 Retirement Custom Index 4.21 5.05 0.74 0.00 N/A 100.00 100.00
FRS 2020 Retirement Date Fund 5.19 6.04 0.78 0.44 0.32 101.95 101.172020 Retirement Custom Index 5.04 5.96 0.77 0.00 N/A 100.00 100.00
FRS 2025 Retirement Date Fund 6.16 6.83 0.84 0.48 0.61 101.55 98.342025 Retirement Custom Index 5.85 6.85 0.79 0.00 N/A 100.00 100.00
FRS 2030 Retirement Date Fund 6.91 7.62 0.85 0.50 0.76 102.04 98.512030 Retirement Custom Index 6.51 7.67 0.79 0.00 N/A 100.00 100.00
FRS 2035 Retirement Date Fund 7.59 8.49 0.85 0.56 1.06 103.37 98.862035 Retirement Custom Index 6.96 8.48 0.78 0.00 N/A 100.00 100.00
FRS 2040 Retirement Date Fund 7.91 8.94 0.84 0.58 0.71 101.49 97.922040 Retirement Custom Index 7.46 9.02 0.79 0.00 N/A 100.00 100.00
FRS 2045 Retirement Date Fund 8.16 9.13 0.85 0.67 0.46 100.06 96.562045 Retirement Custom Index 7.81 9.35 0.80 0.00 N/A 100.00 100.00
FRS 2050 Retirement Date Fund 8.21 9.19 0.85 0.66 0.52 100.39 96.782050 Retirement Custom Index 7.82 9.39 0.80 0.00 N/A 100.00 100.00
FRS 2055 Retirement Date Fund 8.18 9.18 0.85 0.66 0.48 100.15 96.642055 Retirement Custom Index 7.82 9.39 0.80 0.00 N/A 100.00 100.00
FRS 2060 Retirement Date Fund N/A N/A N/A N/A N/A N/A N/A2060 Retirement Custom Index N/A N/A N/A N/A N/A N/A N/A
FRS Money Market Fund 0.81 0.14 5.67 0.03 9.44 158.04 N/AiMoneyNet 1st Tier Institutional Net Index 0.51 0.12 -0.32 0.00 N/A 100.00 N/A
FRS Inflation Adjusted Multi-Assets Fund 1.01 5.85 0.11 1.72 -0.59 104.86 123.10FRS Custom Real Assets Index 2.08 4.97 0.33 0.00 N/A 100.00 100.00
FRS U.S. Bond Enhanced Index Fund 1.29 2.70 0.29 0.08 1.07 101.67 99.24Blmbg. Barc. U.S. Aggregate 1.20 2.69 0.26 0.00 N/A 100.00 100.00
FRS Intermediate Bond Fund 1.27 2.07 0.37 0.57 0.45 111.70 104.66Blmbg. Barc. U.S. Intermediate Aggregate 1.02 1.95 0.26 0.00 N/A 100.00 100.00
FRS Core Plus Bond Fund 2.52 2.89 0.69 0.64 0.98 117.10 105.87FRS Custom Core-Plus Fixed Income Index 1.89 2.59 0.53 0.00 N/A 100.00 100.00
FRS U.S. Stock Market Index Fund 10.34 10.36 0.95 0.05 2.28 100.42 99.67Russell 3000 Index 10.22 10.36 0.94 0.00 N/A 100.00 100.00
FRS U.S. Large Cap Stock Fund 11.41 11.53 0.95 2.45 0.43 111.94 114.03Russell 1000 Index 10.39 10.28 0.96 0.00 N/A 100.00 100.00
FRS U.S. Small/Mid Cap Stock Fund 9.95 11.90 0.81 1.61 0.75 100.61 90.58FRS Custom Small/Mid Cap Index 8.63 11.94 0.71 0.00 N/A 100.00 100.00
FRS Foreign Stock Index Fund 7.19 12.04 0.59 1.49 0.26 98.96 95.62MSCI World ex USA 6.75 12.34 0.55 0.00 N/A 100.00 100.00
FRS Global Stock Fund 10.84 11.02 0.94 3.27 0.77 107.13 88.55MSCI All Country World Index Net 8.12 10.88 0.73 0.00 N/A 100.00 100.00
FRS Foreign Stock Fund 7.93 11.41 0.68 3.84 0.32 94.17 82.33MSCI All Country World ex-U.S. Index 6.48 12.47 0.52 0.00 N/A 100.00 100.00
Multi Timeperiod StatisticsAs of March 31, 2018
The returns for the Retirement Date Funds, Inflation Adjusted Multi-Assets Fund, Core Plus Bond Fund, U.S. Large Cap Stock Fund, and U.S. Small/MidCap Stock Fund use prehire data for all months prior to 7/1/2014, actual live data is used thereafter.
9
5YearsReturn
5Years
StandardDeviation
5Years
SharpeRatio
5Years
TrackingError
5Years
InformationRatio
5Years
UpMarketCapture
5YearsDownMarketCapture
FRS Investment Plan 7.50 6.70 1.07 0.45 0.91 102.14 97.85Total Plan Aggregate Benchmark 7.07 6.59 1.02 0.00 N/A 100.00 100.00
FRS Retirement Fund 3.70 4.92 0.70 1.24 0.03 105.93 109.86Retirement Custom Index 3.68 4.46 0.76 0.00 N/A 100.00 100.00
FRS 2015 Retirement Date Fund 4.34 5.23 0.78 1.06 0.11 105.08 107.182015 Retirement Custom Index 4.24 4.84 0.82 0.00 N/A 100.00 100.00
FRS 2020 Retirement Date Fund 5.58 5.92 0.89 0.79 0.24 104.36 105.282020 Retirement Custom Index 5.40 5.67 0.90 0.00 N/A 100.00 100.00
FRS 2025 Retirement Date Fund 6.82 6.62 0.98 0.57 0.46 102.31 100.512025 Retirement Custom Index 6.55 6.53 0.96 0.00 N/A 100.00 100.00
FRS 2030 Retirement Date Fund 7.94 7.39 1.03 0.44 0.68 101.76 99.262030 Retirement Custom Index 7.62 7.40 0.99 0.00 N/A 100.00 100.00
FRS 2035 Retirement Date Fund 8.89 8.29 1.03 0.49 0.90 102.35 99.112035 Retirement Custom Index 8.41 8.29 0.98 0.00 N/A 100.00 100.00
FRS 2040 Retirement Date Fund 9.14 8.63 1.02 0.50 0.67 101.31 98.522040 Retirement Custom Index 8.77 8.69 0.98 0.00 N/A 100.00 100.00
FRS 2045 Retirement Date Fund 9.30 8.75 1.03 0.57 0.49 100.49 97.632045 Retirement Custom Index 8.98 8.88 0.98 0.00 N/A 100.00 100.00
FRS 2050 Retirement Date Fund 9.33 8.79 1.02 0.56 0.53 100.68 97.772050 Retirement Custom Index 8.99 8.91 0.98 0.00 N/A 100.00 100.00
FRS 2055 Retirement Date Fund 9.31 8.78 1.02 0.56 0.50 100.54 97.692055 Retirement Custom Index 8.99 8.91 0.98 0.00 N/A 100.00 100.00
FRS 2060 Retirement Date Fund N/A N/A N/A N/A N/A N/A N/A2060 Retirement Custom Index N/A N/A N/A N/A N/A N/A N/A
FRS Money Market Fund 0.56 0.14 5.02 0.03 7.37 176.32 N/AiMoneyNet 1st Tier Institutional Net Index 0.32 0.12 -0.47 0.00 N/A 100.00 N/A
FRS Inflation Adjusted Multi-Assets Fund -0.45 6.29 -0.09 1.73 -0.18 110.76 115.00FRS Custom Real Assets Index -0.10 5.54 -0.05 0.00 N/A 100.00 100.00
FRS U.S. Bond Enhanced Index Fund 1.92 2.95 0.54 0.09 1.00 101.91 100.01Blmbg. Barc. U.S. Aggregate 1.82 2.93 0.52 0.00 N/A 100.00 100.00
FRS Intermediate Bond Fund 1.56 2.26 0.55 0.55 0.20 105.98 104.90Blmbg. Barc. U.S. Intermediate Aggregate 1.45 2.15 0.52 0.00 N/A 100.00 100.00
FRS Core Plus Bond Fund 2.77 3.29 0.75 0.73 0.27 112.31 116.47FRS Custom Core-Plus Fixed Income Index 2.58 2.89 0.78 0.00 N/A 100.00 100.00
FRS U.S. Stock Market Index Fund 13.12 10.00 1.25 0.05 1.78 100.29 99.74Russell 3000 Index 13.03 10.00 1.25 0.00 N/A 100.00 100.00
FRS U.S. Large Cap Stock Fund 14.66 10.98 1.28 2.60 0.55 108.55 104.45Russell 1000 Index 13.17 9.89 1.27 0.00 N/A 100.00 100.00
FRS U.S. Small/Mid Cap Stock Fund 12.83 11.81 1.06 2.30 1.16 109.39 93.91FRS Custom Small/Mid Cap Index 9.92 11.47 0.86 0.00 N/A 100.00 100.00
FRS Foreign Stock Index Fund 7.27 11.70 0.63 1.34 0.26 99.15 95.97MSCI World ex USA 6.88 11.86 0.59 0.00 N/A 100.00 100.00
FRS Global Stock Fund 12.05 10.55 1.10 3.11 0.84 105.56 84.50MSCI All Country World Index Net 9.20 10.35 0.87 0.00 N/A 100.00 100.00
FRS Foreign Stock Fund 8.81 10.92 0.80 3.69 0.62 96.77 77.84MSCI All Country World ex-U.S. Index 6.25 11.88 0.54 0.00 N/A 100.00 100.00
Multi Timeperiod StatisticsAs of March 31, 2018
The returns for the Retirement Date Funds, Inflation Adjusted Multi-Assets Fund, Core Plus Bond Fund, U.S. Large Cap Stock Fund, and U.S. Small/MidCap Stock Fund use prehire data for all months prior to 7/1/2014, actual live data is used thereafter.
10

Appendix
11
Retirement Date Benchmarks - A weighted average composite of the underlying components' benchmarks for each fund.
iMoneyNet 1st Tier Institutional Net Index - An index made up of the entire universe of money market mutual funds. The index currently represents over 1,300 funds, orapproximately 99 percent of all money fund assets.
FRS Custom Real Assets Index - A monthly weighted composite of underlying indices for each TIPS and Real Assets fund. These indices include Barclays U.S. TIPS Index,MSCI AC World Index and the Bloomberg Commodity Total Return Index, NAREIT Developed Index, S&P Global Infrastructure Index, S&P Global Natural Resources Index.
Total Bond Index - A weighted average composite of the underlying benchmarks for each bond fund.
Barclays Aggregate Bond Index - A market value-weighted index consisting of government bonds, SEC-registered corporate bonds and mortgage-related and asset-backedsecurities with at least one year to maturity and an outstanding par value of $250 million or greater. This index is a broad measure of the performance of the investment grade U.S.fixed income market.
Barclays Intermediate Aggregate Bond Index - A market value-weighted index consisting of U.S. Treasury securities, corporate bonds and mortgage-related and asset-backedsecurities with one to ten years to maturity and an outstanding par value of $250 million or greater.
FRS Custom Core-Plus Fixed Income Index - A monthly rebalanced blend of 80% Barclays U.S. Aggregate Bond Index and 20% Barclays U.S. High Yield Ba/B 1% IssuerConstrained Index.
Total U.S. Equities Index - A weighted average composite of the underlying benchmarks for each domestic equity fund.
Russell 3000 Index - A capitalization-weighted index consisting of the 3,000 largest publicly traded U.S. stocks by capitalization. This index is a broad measure of the performanceof the aggregate domestic equity market.
Russell 1000 Index - An index that measures the performance of the largest 1,000 stocks contained in the Russell 3000 Index.
FRS Custom Small/Mid Cap Index - A monthly rebalanced blend of 25% S&P 400 Index, 30% Russell 2000 Index, 25% Russell 2000 Value Index, and 20% Russell Mid CapGrowth Index.
Total Foreign and Global Equities Index - A weighted average composite of the underlying benchmarks for each foreign and global equity fund.
MSCI All Country World ex-U.S. IMI Index - A capitalization-weighted index of stocks representing 22 developed country stock markets and 23 emerging countries, excluding theU.S. market.
MSCI All Country World Index - A capitalization-weighted index of stocks representing approximately 46 developed and emerging countries, including the U.S. and Canadianmarkets.
MSCI All Country World ex-U.S. Index - A capitalization-weighted index consisting of 23 developed and 21 emerging countries, but excluding the U.S.
Benchmark DescriptionsAs of March 31, 2018
12

Retirement Date Funds - Target date universes calculated and provided by Lipper.
FRS Money Market Fund - A money market universe calculated and provided by Lipper.
FRS U.S. Bond Enhanced Index Fund - A long-term bond fixed income universe calculated and provided by Lipper.
FRS Intermediate Bond Fund - A broad intermediate-term fixed income universe calculated and provided by Lipper.
FRS Core Plus Bond Fund - A core plus bond fixed income universe calculated and provided by Lipper.
FRS U.S. Stock Market Index Fund - A large cap blend universe calculated and provided by Lipper.
FRS U.S. Large Cap Stock Fund - A large cap universe calculated and provided by Lipper.
FRS U.S. Small/Mid Cap Stock Fund - A small/mid cap universe calculated and provided by Lipper.
FRS Foreign Stock Index Fund - A foreign blend universe calculated and provided by Lipper.
FRS Global Stock Fund - A global stock universe calculated and provided by Lipper.
FRS Foreign Stock Fund - A foreign large blend universe calculated and provided by Lipper.
Descriptions of UniversesAs of March 31, 2018
13
The rates of return contained in this report are shown on an after-fees basis unless otherwise noted. They are geometric and time-weighted. Returns for periods longer than one year are annualized.
Universe percentiles are based upon an ordering system in which 1 is the best ranking and 100 is the worst ranking.
Due to rounding throughout the report, percentage totals displayed may not sum to 100%. Additionally, individual fund totals in dollar terms may not sum to the plan total.
<ReportMemberName>
NotesAs of March 31, 2018
14

The information contained herein is proprietary and provided for informational purposes only. It is not complete and does not contain certain material information about making investments in securities including important disclosures and risk factors. All securities transactions involve substantial risk of loss. Under no circumstances does the information in this report represent a recommendation to buy or sell stocks, limited partnership interests, or other investment instruments.
The data contained in these reports is compiled from statements provided by the custodian(s), record-keeper(s), and/or other third-party data provider(s). Thisdocument is not intended to provide, and shall not be relied upon for, accounting and legal or tax advice. AHIC has not conducted additional audits and cannotwarrant its accuracy or completeness.
We urge you to compare this statement with that of your qualified custodian and/or record-keeper and notify AHIC with any issues or questions you may havewith respect to investment performance or any other matter set forth herein.
The mutual fund information found in this report is provided by Thomson Reuters Lipper and AHIC cannot warrant its accuracy or timeliness. Thomson ReutersLipper Global Data Feed provides comprehensive coverage of mutual fund information directly to Investment Metrics, AHIC’s performance reporting vendor, viathe PARis performance reporting platform. Thomson Reuters Lipper is the data provider chosen by Investment Metrics, and as such, AHIC has no directrelationship with Thomson Reuters Lipper.
Refer to Hedge Fund Research, Inc. www.hedgefundresearch.com for information on HFR indices.
FTSE International Limited (“FTSE”) © FTSE 2017. “FTSE®” and “FTSE4Good®” are trademarks of the London Stock Exchange Group companies and are usedby FTSE International Limited under license. The FTSE indices are calculated by FTSE International Limited in conjunction with Indonesia Stock Exchange,Bursa Malaysia Berhad, The Philippine Stock Exchange, Inc., Singapore Exchange Securities Trading Limited and the Stock Exchange of Thailand (the"Exchanges"). All intellectual property rights in the FTSE/ASEAN Index vest in FTSE and the Exchanges. Neither FTSE nor its licensors accept any liability forany errors or omissions in the FTSE indices and / or FTSE ratings or underlying data. No further distribution of FTSE Data is permitted without FTSE’s expresswritten consent.
Past performance is not necessarily indicative of future results.
Aon Hewitt Investment Consulting, Inc. (“AHIC”) is a federally registered investment advisor with the U.S. Securities and Exchange Commission (“SEC”). AHIC isalso registered with the Commodity Futures Trade Commission as a commodity pool operator and a commodity trading advisor, and is a member of the NationalFutures Association. The AHIC ADV Form Part 2A disclosure statement is available upon written request to:
Aon Hewitt Investment Consulting, Inc.200 East Randolph StreetSuite 1500Chicago, IL 60601ATTN: AHIC Compliance Officer
Disclaimers
15
Visit the Aon Retirement and Investment Blog (http://retirementandinvestmentblog.aon.com); sharing our best thinking.
Lawton Chiles Endowment Fund | First Quarter 2018
Quarterly Investment Review

(This page is left blank intentionally)
1 LCEF Total Fund 12 Appendix 9
Table of Contents
(This page is left blank intentionally)
LCEF Total Fund
1
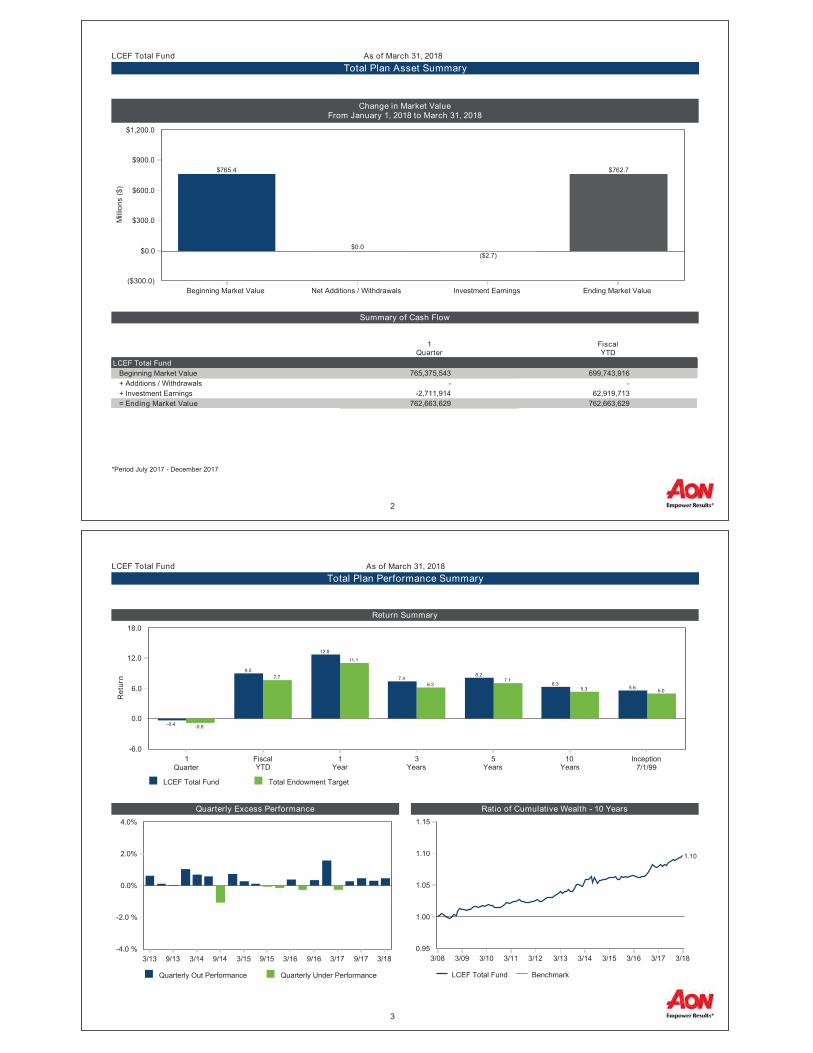
Change in Market ValueFrom January 1, 2018 to March 31, 2018
Summary of Cash Flow
$0.0
$300.0
$600.0
$900.0
$1,200.0
($300.0)
Mill
ions
($)
Beginning Market Value Net Additions / Withdrawals Investment Earnings Ending Market Value
$765.4
$0.0($2.7)
$762.7
1Quarter
FiscalYTD
LCEF Total Fund Beginning Market Value 765,375,543 699,743,916 + Additions / Withdrawals - - + Investment Earnings -2,711,914 62,919,713 = Ending Market Value 762,663,629 762,663,629
LCEF Total FundTotal Plan Asset Summary
As of March 31, 2018
*Period July 2017 - December 2017
2
Return Summary
Quarterly Excess Performance Ratio of Cumulative Wealth - 10 Years
LCEF Total Fund Total Endowment Target
0.0
6.0
12.0
18.0
-6.0
Ret
urn
1Quarter
FiscalYTD
1Year
3Years
5Years
10Years
Inception7/1/99
-0.8
7.7
11.1
6.37.1
5.3 5.0
-0.4
9.0
12.8
7.48.2
6.35.6
LCEF Total Fund Benchmark
0.95
1.00
1.05
1.10
1.15
3/08 3/09 3/10 3/11 3/12 3/13 3/14 3/15 3/16 3/17 3/18
1.10
Quarterly Out Performance Quarterly Under Performance
0.0%
2.0%
4.0%
-2.0 %
-4.0 %3/13 9/13 3/14 9/14 3/15 9/15 3/16 9/16 3/17 9/17 3/18
Total Plan Performance SummaryAs of March 31, 2018LCEF Total Fund
3
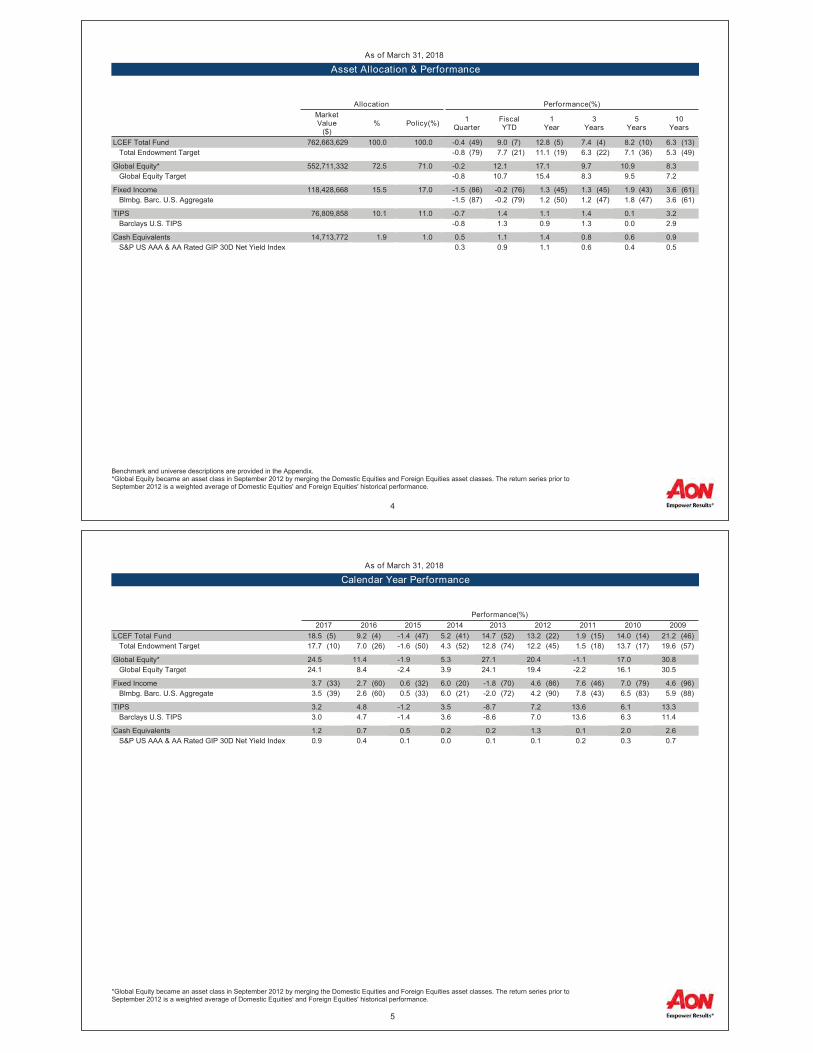
AllocationMarketValue
($)% Policy(%)
Performance(%)
1Quarter
FiscalYTD
1Year
3Years
5Years
10Years
LCEF Total Fund 762,663,629 100.0 100.0 -0.4 (49) 9.0 (7) 12.8 (5) 7.4 (4) 8.2 (10) 6.3 (13) Total Endowment Target -0.8 (79) 7.7 (21) 11.1 (19) 6.3 (22) 7.1 (36) 5.3 (49)All Endowments-Total Fund Median -0.4 6.6 9.7 5.4 6.7 5.3
Global Equity* 552,711,332 72.5 71.0 -0.2 12.1 17.1 9.7 10.9 8.3 Global Equity Target -0.8 10.7 15.4 8.3 9.5 7.2Blank
Fixed Income 118,428,668 15.5 17.0 -1.5 (86) -0.2 (76) 1.3 (45) 1.3 (45) 1.9 (43) 3.6 (61) Blmbg. Barc. U.S. Aggregate -1.5 (87) -0.2 (79) 1.2 (50) 1.2 (47) 1.8 (47) 3.6 (61)All Endowments-US Fixed Income Segment Median -0.8 0.2 1.2 1.2 1.7 3.9
TIPS 76,809,858 10.1 11.0 -0.7 1.4 1.1 1.4 0.1 3.2 Barclays U.S. TIPS -0.8 1.3 0.9 1.3 0.0 2.9Blank
Cash Equivalents 14,713,772 1.9 1.0 0.5 1.1 1.4 0.8 0.6 0.9 S&P US AAA & AA Rated GIP 30D Net Yield Index 0.3 0.9 1.1 0.6 0.4 0.5
Asset Allocation & PerformanceAs of March 31, 2018
Benchmark and universe descriptions are provided in the Appendix.*Global Equity became an asset class in September 2012 by merging the Domestic Equities and Foreign Equities asset classes. The return series prior toSeptember 2012 is a weighted average of Domestic Equities' and Foreign Equities' historical performance.
4
Performance(%)2017 2016 2015 2014 2013 2012 2011 2010 2009
LCEF Total Fund 18.5 (5) 9.2 (4) -1.4 (47) 5.2 (41) 14.7 (52) 13.2 (22) 1.9 (15) 14.0 (14) 21.2 (46) Total Endowment Target 17.7 (10) 7.0 (26) -1.6 (50) 4.3 (52) 12.8 (74) 12.2 (45) 1.5 (18) 13.7 (17) 19.6 (57)All Endowments-Total Fund Median 14.9 6.2 -1.6 4.4 14.9 12.0 -1.3 12.0 20.6
Global Equity* 24.5 11.4 -1.9 5.3 27.1 20.4 -1.1 17.0 30.8 Global Equity Target 24.1 8.4 -2.4 3.9 24.1 19.4 -2.2 16.1 30.5Blank
Fixed Income 3.7 (33) 2.7 (60) 0.6 (32) 6.0 (20) -1.8 (70) 4.6 (86) 7.6 (46) 7.0 (79) 4.6 (96) Blmbg. Barc. U.S. Aggregate 3.5 (39) 2.6 (60) 0.5 (33) 6.0 (21) -2.0 (72) 4.2 (90) 7.8 (43) 6.5 (83) 5.9 (88)All Endowments-US Fixed Income Segment Median 3.2 2.8 0.0 4.4 -1.1 8.5 6.9 7.9 13.2
TIPS 3.2 4.8 -1.2 3.5 -8.7 7.2 13.6 6.1 13.3 Barclays U.S. TIPS 3.0 4.7 -1.4 3.6 -8.6 7.0 13.6 6.3 11.4Blank
Cash Equivalents 1.2 0.7 0.5 0.2 0.2 1.3 0.1 2.0 2.6 S&P US AAA & AA Rated GIP 30D Net Yield Index 0.9 0.4 0.1 0.0 0.1 0.1 0.2 0.3 0.7
Calendar Year PerformanceAs of March 31, 2018
*Global Equity became an asset class in September 2012 by merging the Domestic Equities and Foreign Equities asset classes. The return series prior toSeptember 2012 is a weighted average of Domestic Equities' and Foreign Equities' historical performance.
5
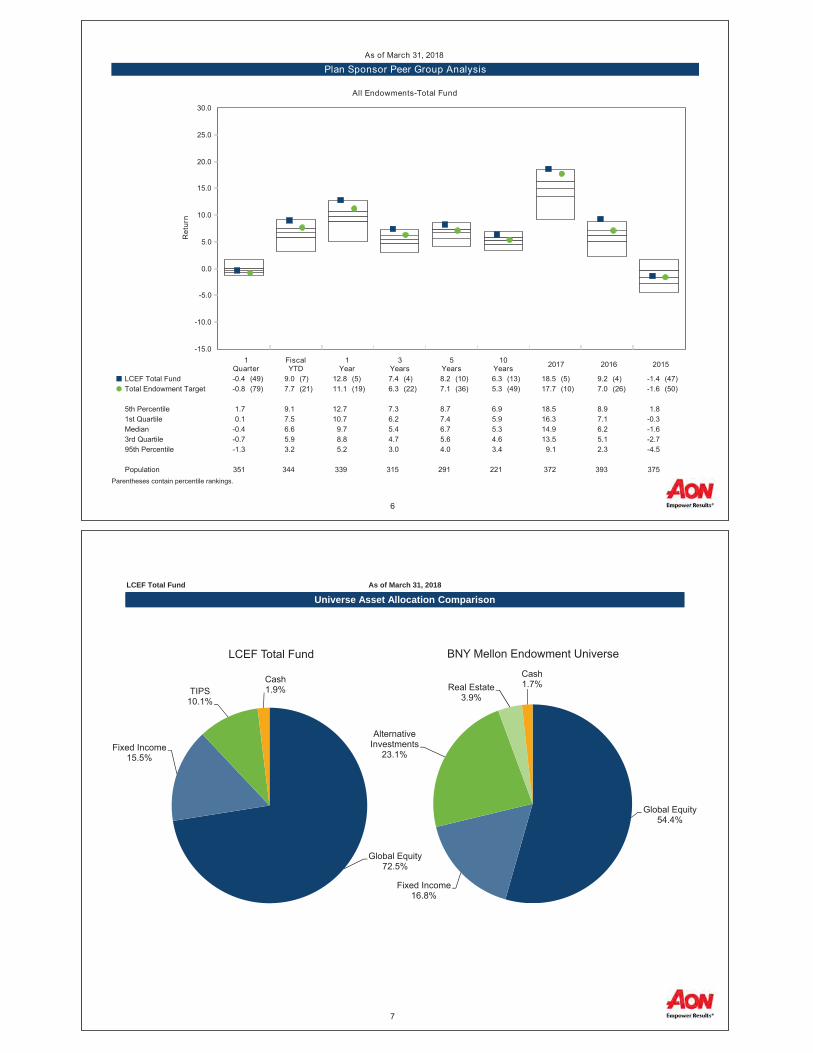
-15.0
-10.0
-5.0
0.0
5.0
10.0
15.0
20.0
25.0
30.0
Ret
urn
1Quarter
FiscalYTD
1Year
3Years
5Years
10Years 2017 2016 2015
LCEF Total Fund -0.4 (49) 9.0 (7) 12.8 (5) 7.4 (4) 8.2 (10) 6.3 (13) 18.5 (5) 9.2 (4) -1.4 (47)
Total Endowment Target -0.8 (79) 7.7 (21) 11.1 (19) 6.3 (22) 7.1 (36) 5.3 (49) 17.7 (10) 7.0 (26) -1.6 (50)
5th Percentile 1.7 9.1 12.7 7.3 8.7 6.9 18.5 8.9 1.81st Quartile 0.1 7.5 10.7 6.2 7.4 5.9 16.3 7.1 -0.3Median -0.4 6.6 9.7 5.4 6.7 5.3 14.9 6.2 -1.63rd Quartile -0.7 5.9 8.8 4.7 5.6 4.6 13.5 5.1 -2.795th Percentile -1.3 3.2 5.2 3.0 4.0 3.4 9.1 2.3 -4.5
Population 351 344 339 315 291 221 372 393 375
Plan Sponsor Peer Group AnalysisAs of March 31, 2018
All Endowments-Total Fund
Parentheses contain percentile rankings.
6
Global Equity 72.5%
Fixed Income15.5%
TIPS10.1%
Cash1.9%
Global Equity 54.4%
Fixed Income16.8%
Alternative Investments
23.1%
Real Estate3.9%
Cash1.7%
As of March 31, 2018
Universe Asset Allocation Comparison
LCEF Total Fund
LCEF Total Fund BNY Mellon Endowment Universe
7

105
1
2
1
7
-2
114
-200 -150 -100 -50 0 50 100 150 200
129
1
2
1
34
-3
164
-250 -200 -150 -100 -50 0 50 100 150 200 250
Attribution
LCEF Total Fund As of March 31, 2018
*Other includes differences between official performance value added due to methodology and extraordinary payouts.
Basis Points
1-Year Ending 3/31/2018
Basis Points
5-Year Ending 3/31/2018
Total Fund
Global Equity
Fixed Income
TIPS
Cash
TAA
Other*
Fixed Income
Total Fund
Global Equity
TIPS
Cash
TAA
Other*
8
Appendix
9
LCEF Total FundTotal Endowment Target - A weighted blend of the individual asset class target benchmarks.
Total Global EquityMSCI ACWI IMI ex-Tobacco - From 7/1/2014 forward, a custom version of the MSCI ACWI IMI excluding tobacco-related companies. From 10/1/2013 to 6/30/2014, a customversion of the MSCI ACWI IMI adjusted to reflect a 55% fixed weight in the MSCI USA IMI and a 45% fixed weight in the MSCI ACWI ex-USA IMI, and excluding certain equities oftobacco-related companies. From 9/1/2012 to 9/30/2013, a custom version of the MSCI ACWI IMI excluding tobacco-related companies. Prior to 9/1/2012, the benchmark is aweighted average of both the Domestic Equities and Foreign Equities historical benchmarks.
Total Domestic EquitiesRussell 3000 Index ex-Tobacco - Prior to 9/1/2012, an index that measures the performance of the 3,000 stocks that make up the Russell 1000 and Russell 2000 Indices, whileexcluding tobacco companies.
Total Foreign EquitiesMSCI ACWI ex-US IMI ex-Tobacco - Prior to 9/1/2012, a capitalization-weighted index representing 44 countries, but excluding the United States. The index includes 23 developedand 21 emerging market countries, and excludes tobacco companies.
Total Fixed IncomeBarclays Aggregate Bond Index - A market value-weighted index consisting of the Barclays Credit, Government, and Mortgage-Backed Securities Indices. The index also includescredit card, auto, and home equity loan-backed securities. This index is the broadest available measure of the aggregate investment grade U.S. fixed income market.
Total TIPSBarclays U.S. TIPS - A market value-weighted index consisting of U.S. Treasury Inflation-Protected Securities with one or more years remaining until maturity with total outstandingissue size of $500 million or more.
Total Cash EquivalentsS&P U.S. AAA & AA Rated GIP 30-Day Net Yield Index - An unmanaged, net-of-fees, market index representative of the Local Government Investment Pool. On 10/1/2011, theS&P U.S. AAA & AA Rated GIP 30-Day Net Yield Index replaced the S&P U.S. AAA & AA Rated GIP 30-Day Gross Yield Index, which was previously used from 4/30/08 - 9/30/11.Prior to 4/30/08, it was the average 3-month T-bill rate.
Benchmark DescriptionsAs of March 31, 2018
10
LCEF Total FundA universe comprised of 357 total endowment portfolio returns, net of fees, calculated and provided by BNY Mellon Performance & Risk Analytics and Investment Metrics.Aggregate assets in the universe comprised $360.6 billion as of quarter-end and the average market value was $1.0 billion.
Total Fixed IncomeA universe comprised of 313 total fixed income portfolio returns, net of fees, of endowment plans calculated and provided by BNY Mellon Performance & Risk Analytics andInvestment Metrics. Aggregate assets in the universe comprised $34.4 billion as of quarter-end and the average market value was $98.5 million.
Universe DescriptionsAs of March 31, 2018
11

Quarterly and Cumulative Excess Performance - The vertical axis, excess return, is a measure of fund performance less the return of the primary benchmark. The horizontalaxis represents the time series. The quarterly bars represent the underlying funds' relative performance for the quarter.
Ratio of Cumulative Wealth Graph - An illustration of a portfolio's cumulative, un-annualized performance relative to that of its benchmark. An upward-sloping line indicatessuperior fund performance versus its benchmark. Conversely, a downward-sloping line indicates underperformance by the fund. A flat line is indicative of benchmark-likeperformance.
Performance Comparison - Plan Sponsor Peer Group Analysis - An illustration of the distribution of returns for a particular asset class. The component's return is indicated bythe circle and its performance benchmark by the triangle. The top and bottom borders represent the 5th and 95th percentiles, respectively. The solid line indicates the median whilethe dotted lines represent the 25th and 75th percentiles.
Explanation of ExhibitsAs of March 31, 2018
12
The rates of return contained in this report are shown on an after-fees basis unless otherwise noted. They are geometric and time-weighted. Returns for periods longer than one year are annualized.
Universe percentiles are based upon an ordering system in which 1 is the best ranking and 100 is the worst ranking.
Due to rounding throughout the report, percentage totals displayed may not sum to 100%. Additionally, individual fund totals in dollar terms may not sum to the plan total.
<ReportMemberName>
NotesAs of March 31, 2018
13

The information contained herein is proprietary and provided for informational purposes only. It is not complete and does not contain certain material information about making investments in securities including important disclosures and risk factors. All securities transactions involve substantial risk of loss. Under no circumstances does the information in this report represent a recommendation to buy or sell stocks, limited partnership interests, or other investment instruments.
The data contained in these reports is compiled from statements provided by the custodian(s), record-keeper(s), and/or other third-party data provider(s). Thisdocument is not intended to provide, and shall not be relied upon for, accounting and legal or tax advice. AHIC has not conducted additional audits and cannotwarrant its accuracy or completeness.
We urge you to compare this statement with that of your qualified custodian and/or record-keeper and notify AHIC with any issues or questions you may havewith respect to investment performance or any other matter set forth herein.
The mutual fund information found in this report is provided by Thomson Reuters Lipper and AHIC cannot warrant its accuracy or timeliness. Thomson ReutersLipper Global Data Feed provides comprehensive coverage of mutual fund information directly to Investment Metrics, AHIC’s performance reporting vendor, viathe PARis performance reporting platform. Thomson Reuters Lipper is the data provider chosen by Investment Metrics, and as such, AHIC has no directrelationship with Thomson Reuters Lipper.
Refer to Hedge Fund Research, Inc. www.hedgefundresearch.com for information on HFR indices.
FTSE International Limited (“FTSE”) © FTSE 2017. “FTSE®” and “FTSE4Good®” are trademarks of the London Stock Exchange Group companies and are usedby FTSE International Limited under license. The FTSE indices are calculated by FTSE International Limited in conjunction with Indonesia Stock Exchange,Bursa Malaysia Berhad, The Philippine Stock Exchange, Inc., Singapore Exchange Securities Trading Limited and the Stock Exchange of Thailand (the"Exchanges"). All intellectual property rights in the FTSE/ASEAN Index vest in FTSE and the Exchanges. Neither FTSE nor its licensors accept any liability forany errors or omissions in the FTSE indices and / or FTSE ratings or underlying data. No further distribution of FTSE Data is permitted without FTSE’s expresswritten consent.
Past performance is not necessarily indicative of future results.
Aon Hewitt Investment Consulting, Inc. (“AHIC”) is a federally registered investment advisor with the U.S. Securities and Exchange Commission (“SEC”). AHIC isalso registered with the Commodity Futures Trade Commission as a commodity pool operator and a commodity trading advisor, and is a member of the NationalFutures Association. The AHIC ADV Form Part 2A disclosure statement is available upon written request to:
Aon Hewitt Investment Consulting, Inc.200 East Randolph StreetSuite 1500Chicago, IL 60601ATTN: AHIC Compliance Officer
Disclaimers
14

S M T W T F S S M T W T F S S M T W T F S S M T W T F S1 2 3 4 5 6 1 2 3 4 5 6 7 1 2 3 4 5 6 7 1 2 3 4 5 6
7 8 9 10 11 12 13 8 9 10 11 12 13 14 8 9 10 11 12 13 14 7 8 9 10 11 12 1314 15 16 17 18 19 20 15 16 17 18 19 20 21 15 16 17 18 19 20 21 14 15 16 17 18 19 2021 22 23 24 25 26 27 22 23 24 25 26 27 28 22 23 24 25 26 27 28 21 22 23 24 25 26 2728 29 30 31 29 30 29 30 31 28 29 30 31
S M T W T F S S M T W T F S S M T W T F S S M T W T F S1 2 3 1 2 3 4 5 1 2 3 4 1 2 3
4 5 6 7 8 9 10 6 7 8 9 10 11 12 5 6 7 8 9 10 11 4 5 6 7 8 9 1011 12 13 14 15 16 17 13 14 15 16 17 18 19 12 13 14 15 16 17 18 11 12 13 14 15 16 1718 19 20 21 22 23 24 20 21 22 23 24 25 26 19 20 21 22 23 24 25 18 19 20 21 22 23 2425 26 27 28 27 28 29 30 31 26 27 28 29 30 31 25 26 27 28 29 30
S M T W T F S S M T W T F S S M T W T F S S M T W T F S1 2 3 1 2 1 1
4 5 6 7 8 9 10 3 4 5 6 7 8 9 2 3 4 5 6 7 8 2 3 4 5 6 7 811 12 13 14 15 16 17 10 11 12 13 14 15 16 9 10 11 12 13 14 15 9 10 11 12 13 14 1518 19 20 21 22 23 24 17 18 19 20 21 22 23 16 17 18 19 20 21 22 16 17 18 19 20 21 2225 26 27 28 29 30 31 24 25 26 27 28 29 30 23 24 25 26 27 28 29 23 24 25 26 27 28 29
30 30 31
Yellow is Proposed IAC MeetingOrange is Proposed Cabinet Meeting
2018
March June September December
January April July October
February May August November