Embed Size (px)
Citation preview

1 |

2 |
Agenda
1H18 financial performance Dominic Stevens – CEO
Strategy Dominic Stevens
Business performance Peter Hiom – Deputy CEO
Summary and outlook Dominic Stevens
Q&A – analysts followed by media Dominic Stevens, Peter Hiom and Stephen Hammon – Deputy CFO

3 |
213.1
219.4
230.5
213.1 214.7
FY16 FY17 FY18
NPAT ($million)
1H 2H
Highlights – financial results 1H18
Earnings per share • Earnings per share of 119.1 cents, up 5.0%
• $230.5 million, up 5.1%• Continued solid growth
Expenses • $96.2 million, up 6.7% (3.1% normalised for step changes)• Full-year guidance unchanged at approx. 8% growth
Revenue• $409.0 million, up 5.8%• Strong overall performance despite subdued equities trading
• Full-year guidance circa $50 million
Strong business performance and returns to shareholders
Revenue and expenses as per the Group segment reportingVariance relative to the prior comparative period (1H17 pcp) expressed favourable / (unfavourable)
Net profit after tax
($6.1m)
+$11.1m
+$22.4m
+5.7cps
$13.4mCapital expenditure
Dividends per share +5.2cps• Interim dividend of 107.2 cents per share, up 5.1%• 90% payout ratio, fully franked
EBITDA • $312.8 million, up 5.5%• Up 6.6% normalised for step changes
+$16.3m

4 |
417.1 454.3 529.5 539.0 510.1
413.9 512.2
529.6 540.5
FY14 FY15 FY16 FY17 FY18
Cash market tradingASX value on-market ($billion)
2H
1H36.7 38.6
54.6 36.8 44.8
29.3
50.3 24.0
19.1
FY14 FY15 FY16 FY17 FY18
Total capital raised ($billion)
2H
1H
58.9 60.3 63.4 69.0 74.5
59.2 66.0 73.4 73.4
FY14 FY15 FY16 FY17 FY18
Futures - contracts (million)
2H
1H
Highlights – activity levelsMore capital raised, increased futures trading, lower equities trading, growth in ALC connectivity
Up 22%
vs 1H17
Up 8%
vs 1H17
Down 5%
vs 1H17
133179
219270 298
142 188
231 285
622 679
819871
934
-
100
200
300
400
500
600
700
800
900
1,000
0
50
100
150
200
250
300
350
FY14 FY15 FY16 FY17 FY18
ALC cabinets and connections
1H cabinets 2H cabinets ALC service connections

5 |
0.0%
0.1%
0.2%
0.3%
0.4%
0.5%
0
5
10
15
20
25
Dec-10 Dec-11 Dec-12 Dec-13 Dec-14 Dec-15 Dec-16 Dec-17
S&P/ASX 200 volatility index vs market turnover
1 year rolling avg S&P/ASX200 volatility
ASX daily turnover as % of total market capitalisation (RHS)
Highlights – 1H18 revenue
Revenue as per the Group segment reportingVariance relative to the prior comparative period (1H17 pcp) expressed favourable / (unfavourable)
Revenue $409.0 million, up 5.8%
Listings and Issuer Services● Revenue $113.5 million, up 9.8%● Higher secondary capital raisings● Higher annual listings revenue● Fewer IPOs but comparable initial capital
raised
Trading Services ● Revenue $104.5 million, up 8.8%● Cash market trading down reflecting low
volatility● New data products including BBSW ● ALC community and ecosystem continue
to expand
Derivatives and OTC Markets● Revenue $138.1 million, up 3.8%● Higher futures volumes● Continued growth in OTC clearing and
ASX Collateral services● Equity options marginally lower
Equity Post-Trade Services● Revenue $52.2 million, down 1.3%● Decrease in overall market value traded
and cleared● Settlement revenue up marginally
Solid business performance during period of low market volatility
10.25.1
8.5
(0.7) (0.7)
386.6
409.0
1H17 Listings andIssuer
Services
Derivativesand OTCMarkets
TradingServices
Equity Post-Trade
Services
Other 1H18
Revenue movement ($million)
Revenue up 5.8%$22.4m

6 |
2.8 1.9 0.6 0.8
90.1 92.9 96.2
1H17 Underlyinggrowth
ASICsupervision
levy
Postage Rentand
electricity
1H18
Expense movement ($million)
Operating expensesExpense growth influenced by step changes
Operating expenses increased $6.1 million, up 6.7%
Underlying growth up 3.1%
• Staff costs up 2.3%‒ Average headcount in line with 1H17‒ Reflects annual remuneration increases
Step changes
• ASIC supervision levy increased $1.9 million, up 133%‒ Increase due to new industry funding model
• Postage costs increased $0.6 million, up 18%‒ Increased postage fee and higher CHESS statements
• Rent and electricity costs increased $0.8 million, up 11%‒ New 10-year lease increased rent $0.2 million, up 5%‒ Electricity increased $0.6 million, up 82%
FY18 guidance• Full-year guidance unchanged at approximately 8% increase
Operating expenses as per the Group segment reportingVariance relative to the prior comparative period (1H17 pcp) expressed favourable / (unfavourable)
up 3.1%up 6.7%

Dominic Stevens - CEO
Continuing strategy

8 |
Diversified business with multiple growth driversStrong and attractive business model
Diversification supports revenues across different market cycles
• Product and service diversification
– Primary market facilitation via listings – Cash market trading, clearing and settlement– Exchange-traded futures and options– OTC clearing– Depository, registry and collateral services– Information and technical services
• Asset class diversification
– Equities– Fixed income– Energy– Commodities

9 |
Strong core value propositionUnderlying macro drivers plus ASX initiatives supporting growth
Core customer value proposition
Listings Trade execution Post-trade
Initial and ongoing access to capitalLower cost of capital
Listings integrityBranding
Deep and diverse liquidityHedging and risk transfer
Market integrityEfficient and timely accessTechnical and data services
Capital efficiencyRisk reduction/nettingOperational efficiencySettlement certainty
Macro growth drivers
Demand for financial assets Large and growing savings system
Growing capital needsProduct diversification
Globalisation of marketsAutomation of OTC markets
24 hour trading
Regulatory developments Operational efficiency needs
Capital efficiency needs
ASX initiatives
Expansion of listings franchise (technology and foreign)
ETF/ETP listingsmFund expansion
Offshore customer acquisitionASX Benchmarks (BBSW)Centre Point innovationALC/ASX Net solutions
CHESS replacement/DLTOTC Clearing, Client Clearing Futures/OTC cross margining
ASX Collateral
MAP upgrade ASX Net communications Secondary data centre ISIN enhancements Digital refreshTrading gateway replacements Database upgrades CHESS replacement Customer service improvements
Business development
Licence to operate

10 |
Growing importance as a technology listings venue
1. Includes IPOs and backdoor listings
Growth in ASX technology companies market capitalisation (Dec-14 to Dec-17)
• $26 billion (1.7% of market) to $63 billion (3.3% of market)
• 140% increase in market capitalisation
• 80 new domestic and 39 new foreign companies
• Seen significant recent listings - Domain, WiseTech, Netwealth and Link
• Israel – total listings 17 and growing
• Credible Labs $300 million largest US fintech listing
• Xero – consolidated listing on ASX
• “… access to deeper capital markets, increased trading liquidity and a broader base of potential investors is critical …” (Xero CEO)
Third largest sector by number of listings
0
20
40
60
80
Dec-14 Dec-17
ASX technology companies1
market capitalisation ($billion)
Up 140%
0
50
100
150
200
250
Dec-14 Dec-17
Number of ASX technology companies1
Domestic tech listings Foreign tech listings
Up 118%

11 |
Attracting domestic and offshore trading customersTechnology and marketing strategies paying dividends
0
5
10
15
20
25
30
35
40
1H13 1H17 1H18
Domestic and offshore proprietary trader volumes (million)
Further growth enhanced by benefits from new trading system
Growth driven by ALC, ASX Net and overseas marketing
Volumes up 135%
Increase in offshore traders underpinned by ASX technology and international marketing presence
• New futures trading platform live in March 2017
• Proprietary trading volumes have increased from 14 to 32 million contracts since 1H13
• Positive customer feedback on new platform
• Improved customer functionality contributing to increased trading activity despite low volatility
• 7 new proprietary trader customers post-launch
• Led to increased ITCH data revenues

12 |
0
5
10
15
20
25
30
35
40
1H08 1H17 1H18
Technical services revenue ($million)
Expansion of technical services ecosystemExtending core liquidity access services
ALC
Continued growth in customer numbers, up 9.9%
• Online reporting to assist customers and operations
• Customer portal to promote self-service
• Expanding ecosystem – 4 new service providers available in ALC
ASX Net
Increase in ASX Net service feeds, up 14.1%
• Continued investment in ecosystem evolution
• Comprehensive portfolio of ASX Net service feeds
• ‘Any-to-any’ customer connectivity solutions
Long-term growth in connections and customers
Further growth from increased connectivity and hosting
Revenue up 175%

Dominic Stevens - CEO
Developing strategy

14 |
Growing importance of ASX multi-dimensional technology ecosystemMaking business easier for our customers
• Computing power/speed
• Costs of storage and processing
• Rise of ‘big data’ and cloud
• Artificial intelligence (AI) and machine learning
• Distributed ledger technology (DLT)
Global technology drivers of change
• Ultimate source of truth
• Real-time
• Rich data set, easily searched and filtered
• Readily accessible – delivered seamlessly
• Produced at scale with cost efficiency
• Able to easily add analytic layer
Leads to demand for information that is
Goal: making business easier for our customers
How is ASX addressing this?

15 |
ASX’s multi-dimensional technology ecosystem
Hardware and communicationsALC and ASX Net – the heart of Australia’s financial markets
• ALC brought financial community together• Efficiency delivers lower total cost of ownership for
technology services• Open ecosystem, with scale economics and proximity
benefits• Allowed a level playing field for all ecosystem
members• Improved resilience with continued investmentsCurrent development opportunities• Upgrade secondary data centre to complement ALC• Upgrade ASX Net communications network• Cloud strategy Hardware and communications

16 |
ASX’s multi-dimensional technology ecosystem
Software and applicationsDriving customer efficiencies with contemporary technology
• New futures trading platform allows for• Low latency, better customer risk management• Better and faster response to customer problems
• ASX Collateral: real-time collateral management• Margin optimiser: futures and swaps margin efficiencies
Current development opportunities• DLT project for CHESS replacement
• Expected to reduce administration and reconciliation costs
• Long-term benefits from standardisation (ISO 20022)• Consider use-case for Austraclear Hardware and communications
Software and applications

17 |
ASX’s multi-dimensional technology ecosystem
DataImproved scope and delivery of data
• Provision of new high quality data services• Futures and equity orders and trades• Low latency and standard delivery• Provision to data on-sellers• New BBSW benchmarks business
Current development opportunities
• Building a ‘big data’ analytical environment• Broader range of available ASX data sets• DLT model provides provable source of truth in
real-time Hardware and communications
Software and applications
Data

18 |
ASX’s multi-dimensional technology ecosystem
Hardware and communications
Software and applications
Data
Analytics and insightsEarly stages of an exciting opportunity
• Investigating to determine whether AI can provide efficiencies to internal ASX processes
• Analytics to sit on top of ‘big data’ platform
• Seek to provide further data, services and value to customers
Current development opportunities
• Market Announcements Platform efficiencies
• Analytics to give greater insight to Austraclear data
• Other use-cases being considered
Analytics and insights
19 |
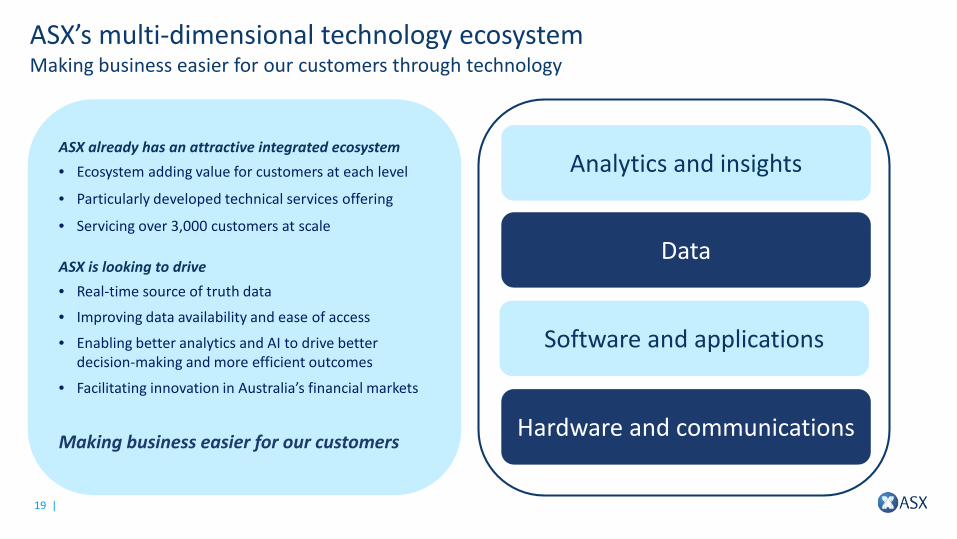
ASX’s multi-dimensional technology ecosystemMaking business easier for our customers through technology
ASX already has an attractive integrated ecosystem• Ecosystem adding value for customers at each level
• Particularly developed technical services offering
• Servicing over 3,000 customers at scale
ASX is looking to drive• Real-time source of truth data
• Improving data availability and ease of access
• Enabling better analytics and AI to drive better decision-making and more efficient outcomes
• Facilitating innovation in Australia’s financial markets
Making business easier for our customers Hardware and communications
Software and applications
Data
Analytics and insights

20 |
15.520.5
15.4 18.613.0
18.7 20.313.4
34.718.6
23.524.6
31.4
31.5 30.0
FY11 FY12 FY13 FY14 FY15 FY16 FY17 FY18
Capital expenditure ($million)
1H 2H
Capital expenditure Continued investment in core technology and evaluating new opportunities
Circa $50 million guidance maintained for FY18
Core technology• Continued investment to strengthen resilience of
platforms
CHESS replacement• Consultation on final scope and timing will determine
capex cost and timing profileSecondary data centre upgrade• Once in 15-20 years• 2-3 year project, $20-25 million• Incremental to regular capexOutlook• FY18 full-year guidance circa $50 million• Update outlook for FY19 in August when scope and
speed of DLT, and other new projects are progressedALC data
centre

Peter Hiom – Deputy CEO
Business performance

22 |
28%
0
50
100
0
20
40
60
1H14 2H14 1H15 2H15 1H16 2H16 1H17 2H17 1H18
Total capital raised ($billion) and number of IPOs
Secondary capital ($billion) IPO capital ($billion)Scrip-for-scrip ($billion) Number of IPOs (RHS)
Listing and Issuer ServicesPositive outlook, strong secondary capital raisings
Revenue $113.5 million, up 9.8%• Annual listing $42.6 million, up 8.4%
‒ Increases in number of companies, market cap and fee changes• Initial listing $9.4 million, down 3.9%
‒ Decrease in number of new listings, capital remained relatively flat• Secondary capital $32.6 million, up 22.2%
‒ Capital raised, up 31.4% • Issuer services $24.9 million, up 10.1%
‒ Holding statements, up 2.6%‒ Fee changes related to the maintenance of the sub-registry
Revenue as per the Group segment reportingVariance relative to the prior comparative period (1H17 pcp) expressed favourable / (unfavourable)
1H18 1H17 Var $ Var %Revenue ($million) 113.5 103.3 10.2 9.8%Listings 88.6 80.7 7.9 9.8%Issuer Services 24.9 22.6 2.3 10.1%
Key driversNumber of new listings 77 86 (9) (10.5%)IPO capital ($billion) 11.0 11.1 (0.1) (1.0%)Secondary capital ($billion) 33.9 25.8 8.1 31.4%CHESS holding statements (million) 7.5 7.3 0.2 2.6%
3.3
5.9 2.3
0.3 1.0
103.3113.5
1H17 Annual Secondary Initial Issuerservices
Other 1H18
Listings revenue movement ($million)

23 |
Listings and Issuer ServicesTechnology and foreign listings, expanding the investment product offering
Key highlights• Momentum in technology sector
• 11 listings¹ in 1H18
• 220 entities now listed
• Continue to attract foreign listings • 18 listings¹ in 1H18• 279 entities now listed compared to 123 in FY13
• Exchange-traded products (ETPs) – 17 listings in 1H18, 227 ETPs listed, total market value $36 billion, up 39.6% on pcp
• Unlisted managed funds through mFund service –59 fund managers (up 5%), offering 190 funds (up 12%) via 17 brokers
1. Includes IPOs and backdoor listings
0
50
100
150
200
0
200
400
600
1H16 2H16 1H17 2H17 1H18
mFund FUM ($million) and number of funds
FUM Number of funds (RHS)
0
50
100
150
200
250
0
10
20
30
40
1H16 2H16 1H17 2H17 1H18
ETP market value ($billion) and number of funds
Market value Number of funds (RHS)

24 |
34%
Derivatives and OTC MarketsStrong futures activity, continued momentum in key investments
Revenue $138.1 million, up 3.8%• Futures and OTC $101.6 million, up 4.5%
‒ Futures contracts traded up 7.9%‒ Continued growth in proprietary traders leading to increased rebates‒ Strong momentum in OTC and collateral services
• Equity options $10.9 million, down 0.7%‒ Contracts traded down 6.1%
• Austraclear $25.6 million, up 2.9% ‒ Transaction volumes up 2.6%‒ Average holdings balance down 2.2%
Revenue as per the Group segment reportingVariance relative to the prior comparative period (1H17 pcp) expressed favourable / (unfavourable)
1H18 1H17 Var $ Var %Revenue ($million) 138.1 133.0 5.1 3.8%Futures and OTC 101.6 97.2 4.4 4.5%Equity options 10.9 11.0 (0.1) (0.7%)Austraclear 25.6 24.8 0.8 2.9%
Key drivers Futures volumes (million) 74.5 69.0 5.5 7.9%OTC cleared value ($billion) 3,137.6 2,159.7 977.9 45.3%Equity options volumes (million) 47.7 50.8 (3.1) (6.1%)Collateral balance ($billion) 20.6 11.7 8.9 75.7%
6
7
8
9
10
11
12
13
1H14 1H17 1H18
Index options and SPI futures contracts (million)
40
50
60
70
80
1H14 1H17 1H18
Total futures contracts (million)
Up 26%
Up 39%

25 |
Derivatives and OTC MarketsSuccess in global distribution, OTC sales activity and client on-boarding
Key highlightsFutures• Growth in offshore futures trading linked to sales effortOTC clearing• Extended clearing hours, client clearing API• ASX commenced clearing NZ$ OTC interest rate swaps• Continued growth with $3.1 trillion value cleared, up
45.3% ($2.2 trillion pcp), open interest $3.5 trillion, up 81% ($1.9 trillion pcp)
ASX Collateral Management • Peak collateral balance at $23.9 billion achieved during
1H18, averaging 32% of RBA open market operations • Usage of service expanding to include bank treasuries
National electronic conveyancing and property settlement • Exploring opportunity to partner with InfoTrack to
leverage core competencies, distribution and platforms
0
2,000
4,000
6,000
FY14 FY15 FY16 FY17 FY18
OTC notional value cleared ($billion)
1H 2H
0%
10%
20%
30%
40%
0
5
10
15
20
25
1H14 2H14 1H15 2H15 1H16 2H16 1H17 2H17 1H18
Collateral balance movement ($billion)
Balance ASX % of RBA open market operations

26 |
25%
Trading Services Further expansion and successes in information and technical services
Revenue $104.5 million, up 8.8%• Cash market trading $22.6 million, down 3.0%
‒ On-market value traded down 5.3%; lower levels of market volatility‒ Growth in the use of auctions, up 7.8%
• Information services $44.7 million, up 12.0%‒ BBSW interest rate benchmark revenue from January 2017‒ Futures data product expansion
• Technical services $37.2 million, up 13.3%‒ Increased service connections and automated data feeds‒ Number of customers hosted in the ALC increased from 111 to 122
Revenue as per the Group segment reportingVariance relative to the prior comparative period (1H17 pcp) expressed favourable / (unfavourable)
1H18 1H17 Var $ Var %Revenue ($million) 104.5 96.0 8.5 8.8%Cash market trading 22.6 23.3 (0.7) (3.0%)Information services 44.7 39.9 4.8 12.0%Technical services 37.2 32.8 4.4 13.3%
Key drivers On-market value ($billion) 510.1 539.0 (28.9) (5.3%)Auctions value ($billion) 122.5 113.7 8.8 7.8%Centre Point value ($billion) 53.4 54.0 (0.6) (1.1%)Number of ALC customers 122 111 11 9.9%
0
40
80
120
1H08 1H17 1H18
Trading Services revenue ($million)
Cash market trading Information services Technical services
CAGR 4.6%
0.00
0.10
0.20
0
500
1,000
1,500
FY13 FY14 FY15 FY16 FY17 1H18
ASX on-market value traded ($billion) and average trading fee per side per $ value (bps)
Continuous trading AuctionsCentre Point Avg trading fee per side (RHS)

27 |
Trading ServicesFocus on distribution, community growth and expanding ASX data
Key highlightsEquity trading• Centre Point value 10.5% of ASX on-market value
traded (10.0% pcp)• Auctions value 24.0% of ASX on-market value traded
(21.1% pcp) as customers seek deep liquidity• On-market trading market share 85.9% (87.9% pcp)
Technical services• Growth in hosting as customers utilise ALC as primary
data centre• Continued expansion of ALC ecosystem• Upgrade and expansion of ASX Net underwayInformation services• Focus on data analytics with target 1H19 live date• BBSW has brought approx. 500 new customers, new
methodology targeted for April 2018• Futures data product transition pricing now complete
0%
10%
20%
30%
40%
FY11 FY12 FY13 FY14 FY15 FY16 FY17 1H18
Auctions and Centre Point % of ASX value traded
Auctions % of on-market value Centre Point % of on-market value
0
200
400
600
800
1000
50
70
90
110
130
1H14 2H14 1H15 2H15 1H16 2H16 1H17 2H17 1H18
Australian Liquidity Centre
ALC customers ALC service connections (RHS)

28 |
Equity Post-Trade ServicesDecline in clearing revenue consistent with decreased cash market activity
Revenue $52.2 million, down 1.3%• Clearing $25.9 million, down 3.4%
‒ Value cleared down 3.3%‒ Reflects subdued market activity
• Settlement $26.3 million, up 0.9%‒ Settlement messages1 down 6.3%‒ Transfers and conversions up 4.3%‒ Revenue sharing rebate nil, $1.1 million pcp
1. Reflects dominant settlement messagesRevenue as per the Group segment reportingVariance relative to the prior comparative period (1H17 pcp) expressed favourable / (unfavourable)
1H18 1H17 Var $ Var %Revenue ($million) 52.2 52.9 (0.7) (1.3%)Cash market clearing 25.9 26.8 (0.9) (3.4%)Cash market settlement 26.3 26.1 0.2 0.9%
Key driversOn-market value cleared ($billion) 555.9 574.7 (18.8) (3.3%)Settlement messages1 (million) 8.8 9.4 (0.6) (6.3%)Average trades per day (million) 1.1 1.0 0.1 11.5%
13%
500
1,000
1,500
2,000
Dec-11 Dec-12 Dec-13 Dec-14 Dec-15 Dec-16 Dec-17
CHESS holdings - period end ($billion)
0
200
400
600
800
1,000
1,200
1,400
FY13 FY14 FY15 FY16 FY17 1H18
Total billable value cleared ($billion)

29 |
CHESS replacement
• Enterprise grade base level software developed by our technology partner Digital Asset
• Assessment confirms our confidence in the functional, capacity, security and resilience capabilities
• Will be operated by ASX on a secure private network where participants are known
• Significant consultation on requirements over last year• Includes the ISO 20022 message protocol to replace
proprietary CHESS messaging• Additional functionality expected to deliver greater
efficiency and reduced need for reconciliation• Day 1 functional scope definition on track for end Mar-18
with consultation on transition completed by Jun-18• Implementation period will allow stakeholders to fully test
and prepare
Completion of two-year evaluation led to selection of DLT to replace CHESS

30 |
Interest and dividend incomeHigher collateral balances supporting net increase in interest
$million 1H18 1H17 Var $ Var %
ASX Group net interest income 8.7 9.4 (0.7) (7.6%)Net interest on collateral balances 24.4 23.2 1.2 5.2%Total net interest income 33.1 32.6 0.5 1.5%Dividend income 5.1 4.9 0.2 4.6%Interest and dividend income 38.2 37.5 0.7 2.0%
Variance relative to the prior comparative period (1H17 pcp) expressed favourable / (unfavourable)Net interest income per segment reporting
Highlights
• ASX Group net interest income down 7.6% due to lower average interest rates
• Net interest earned on collateral balances up 5.2%‒ Average collateral balances up 26.5% to $7.0 billion‒ Investment spread 29 bps (41 bps pcp)
• Portfolio transitioned to new regulatory standards; majority of portfolio investments backed by Commonwealth and State Government securities
0
10
20
30
40
50
1H15 2H15 1H16 2H16 1H17 2H17 1H18
Interest and dividend income ($million)
Dividend income
ASX Group net interest income
Net interest earned on collateral balances

Dominic Stevens – CEO
Summary and outlook

32 |
Summary and outlookContinued growth in earnings and core offering, developing new opportunities
Summary
• Strong performance despite subdued equity trading
• Revenue up 5.8% led by listings, technical and information services, and futures
• EPS and DPS growth consistent with profit, 90% payout ratio, fully franked
• Strong balance sheet, AA- long-term S&P credit rating re-affirmed
Outlook
• Activity for last 6 weeks: capital raised up 230% (January), cash market trading average daily on-market value up 7%, futures average daily contracts up 42%
• Early signs of turning interest rate cycle leading to greater volatility, as evidenced globally in the early part of February
• Continued strategy to develop core offerings and strengthen resilience
• Expansion of ASX multi-dimensional technology ecosystem
• Making business easier for our customers
• Developing new opportunities - ‘big data’, DLT and analyticsVariance relative to the prior comparative period (6 weeks to 10th February 2017) expressed favourable / (unfavourable)

Q&A(Slide to be updated)

34 |
1. Income statement
2. Balance sheet
3. Key financial ratios
4. Transaction and activity levels
5. Free cash flow summary
6. Capital attribution
Appendices

35 |
1. Income statement
1H16$million
2H16$million
1H17$million
2H17$million
1H18$million
Annual listing fees 36.7 38.5 39.3 40.0 42.6 Initial listing fees 11.7 6.9 9.7 6.3 9.4 Subsequent listing fees 29.0 16.1 26.7 19.8 32.6 Other listing fees 5.0 5.5 5.0 3.5 4.0
Listings 82.4 67.0 80.7 69.6 88.6 Issuer Services 23.2 20.1 22.6 19.8 24.9 Listings and Issuer Services 105.6 87.1 103.3 89.4 113.5
Equity options 11.3 11.8 11.0 10.7 10.9 Futures and OTC clearing 91.6 102.7 97.2 100.2 101.6 Austraclear 23.9 24.5 24.8 25.2 25.6
Derivatives and OTC Markets 126.8 139.0 133.0 136.1 138.1 Cash market trading 20.3 20.4 23.3 23.0 22.6Information services 40.6 39.5 39.9 42.6 44.7Technical services 30.5 31.5 32.8 34.4 37.2
Trading Services 91.4 91.4 96.0 100.0 104.5
Cash market clearing 27.2 26.9 26.8 26.5 25.9
Cash market settlement 23.8 24.1 26.1 25.0 26.3
Equity Post-Trade Services 51.0 51.0 52.9 51.5 52.2
Other revenue 1.4 1.6 1.4 0.5 0.7
Operating revenue 376.2 370.1 386.6 377.5 409.0
Operating revenues and operating expenses as per the Group segment reporting

36 |
1. Income statement
1H16$million
2H16$million
1H17$million
2H17$million
1H18$million
Staff 50.7 50.4 55.2 55.4 56.5
Occupancy 6.8 7.3 7.3 7.3 8.1
Equipment 13.1 13.9 14.6 13.3 13.8
Administration 9.9 9.4 8.1 10.1 10.4
Variable 3.1 3.1 3.4 3.3 4.0
ASIC supervision levy 1.5 1.4 1.5 1.4 3.4
Operating expenses 85.1 85.5 90.1 90.8 96.2
EBITDA 291.1 284.6 296.5 286.7 312.8
Depreciation and amortisation 20.8 21.9 22.1 23.9 22.4
EBIT 270.3 262.7 274.4 262.8 290.4
Net interest income 11.3 11.0 9.4 8.4 8.7
Net interest on participants’ balances 17.5 20.2 23.2 24.3 24.4
Dividend revenue 4.9 8.2 4.9 9.0 5.1
Interest and dividend income 33.7 39.4 37.5 41.7 38.2
Underlying profit before tax 304.0 302.1 311.9 304.5 328.6
Income tax expense (90.9) (89.0) (92.5) (89.8) (98.1)
Underlying profit after tax 213.1 213.1 219.4 214.7 230.5
Significant items (net of tax) - - - - -
Statutory profit after tax 213.1 213.1 219.4 214.7 230.5 Operating revenues and operating expenses as per the Group segment reporting

37 |
2. Balance sheet
31 Dec 15$million
30 Jun 16$million
31 Dec 16$million
30 Jun 17$ Million
31 Dec 17$million
Assets
Cash and available-for-sale financial assets 5,356.3 7,072.8 7,002.2 9,085.6 8,636.2
Intangibles (excluding software) 2,317.6 2,317.6 2,317.6 2,326.6 2,326.5
Investments 373.6 424.8 473.2 497.8 471.2
Other assets 527.9 636.4 462.8 1,301.7 494.7
Total assets 8,575.4 10,451.6 10,255.8 13,211.7 11,928.6
Liabilities
Amounts owing to participants (including funded commitments) 4,308.5 6,088.2 5,987.7 8,084.7 7,251.7
Other liabilities 479.7 539.3 394.0 1,218.9 751.7
Total liabilities 4,788.2 6,627.5 6,381.7 9,303.6 8,003.4
Equity
Capital 3,027.2 3,027.2 3,027.2 3,027.2 3,027.2
Retained earnings 555.5 576.9 604.8 622.2 659.6
Reserves 204.5 220.0 242.1 258.7 238.4
Total equity 3,787.2 3,824.1 3,874.1 3,908.1 3,925.2

38 |
Operating revenues and operating expenses as per the Group segment reporting ¹ Weighted average number of ordinary shares used to calculate EPS
3. Key financial ratios1H16 2H16 1H17 2H17 1H18
Basic EPS (including significant items) 110.2c 110.2c 113.4c 111.0c 119.1cDiluted EPS (including significant items) 110.2c 110.2c 113.4c 111.0c 119.1cUnderlying EPS (excluding significant items) 110.2c 110.2c 113.4c 111.0c 119.1cDividend per share – interim 99.1c - 102.0c - 107.2cDividend per share – final - 99.0c - 99.8c -Statutory return on equity (including significant items) 11.4% 11.3% 11.5% 11.2% 12.0%Underlying return on equity 11.4% 11.3% 11.5% 11.2% 12.0%EBITDA / Operating revenue 77.4% 76.9% 76.7% 76.0% 76.5%EBIT / Operating revenue 71.9% 71.0% 71.0% 69.6% 71.0%Total expenses (including depreciation and amortisation) / Operating revenue 28.1% 29.0% 29.0% 30.4% 29.0%Capital expenditure ($m) $18.7 $31.5 $20.3 $30.0 $13.4Net tangible asset backing per share $7.12 $7.25 $7.45 $7.59 $7.70Net asset backing per share $19.56 $19.75 $20.01 $20.19 $20.28Shareholders’ equity as a % of total assets (excluding participants’ balances) 88.8% 87.6% 90.8% 76.2% 83.9%Shareholders’ equity as a % of total assets (including participants’ balances) 44.2% 36.6% 37.8% 29.6% 32.9%Share price at end of period $42.46 $45.76 $49.74 $53.61 $54.86Ordinary shares on issue at end of period 193,595,162 193,595,162 193,595,162 193,595,162 193,595,162Weighted average number of ordinary shares (excluding treasury shares)¹ 193,413,893 193,413,893 193,416,713 193,414,125 193,482,099Market value of ordinary shares on issue ($m) $8,220 $8,859 $9,629 $10,379 $10,621Market to book ratio 2.17 2.32 2.49 2.66 2.71Full-time equivalent permanent staff – number at period end 534 546 547 554 552Full-time equivalent permanent staff – average during the period 523 544 556 556 555

39 |
4.1 Listings and Issuer Services
1H16 2H16 1H17 2H17 1H18
Total domestic market capitalisation ($bn) – period end $1,629 $1,620 $1,760 $1,777 $1,932Total number of listed entities (includes all stapled entities) – period end 2,238 2,204 2,215 2,239 2,275 Number of new listings 77 47 86 66 77 Average annual listing fee $16,381 $17,467 $17,752 $17,857 $18,734 Average initial listing fee $152,508 $146,415 $113,020 $96,115 $121,309 Average fee per $m of initial capital $871 $681 $877 $1,776 $851Average fee per $m of secondary capital $707 $1,156 $1,037 $1,269 $964 Initial capital raised ($m) $13,477 $10,110 $11,080 $3,572 $10,973 Secondary capital raised ($m) $35,597 $9,702 $23,619 $13,541 $23,850 Other secondary capital raised including scrip-for-scrip ($m) $5,501 $4,203 $2,137 $2,019 $10,004 Total capital raised (including other) ($m) $54,575 $24,015 $36,836 $19,132 $44,827 Number of new warrant series quoted 1,290 1,669 915 913 728 Total warrant series quoted 2,925 2,886 2,804 2,827 2,822 Number of CHESS holding statements issued (m) 7.4 6.6 7.3 6.3 7.5
36.729.3
38.6
50.354.6
24.0
36.8
19.1
44.8
1H14 2H14 1H15 2H15 1H16 2H16 1H17 2H17 1H18
Total capital raised (including other) ($bn)

40 |
4.2 Equity Options
1H16 2H16 1H17 2H17 1H18
Trading days 130 124 129 124 128
Single stock equity options (‘000) 44,050 44,651 45,241 48,054 41,768
Index options (‘000) 6,201 6,567 5,580 4,808 5,932
Total contracts traded (‘000) 50,251 51,218 50,821 52,862 47,700
Average daily options contracts 386,549 413,049 393,960 426,309 372,659
Average fee per options contract $0.23 $0.23 $0.22 $0.20 $0.23
485,055 500,287 493,843 454,070
386,549 413,049 393,960 426,309 372,659
1H14 2H14 1H15 2H15 1H16 2H16 1H17 2H17 1H18
Options average daily contracts

41 |
4.2 Futures and OTC Markets1H16 2H16 1H17 2H17 1H18
Trading days 130 127 129 127 128
Total contracts traded – futures ('000)
ASX SPI 200 5,919 6,186 6,040 6,215 6,253
90 day bank bills 13,728 15,839 14,061 14,870 15,456
3 year bonds 23,708 26,397 25,431 27,802 28,127
10 year bonds 15,996 20,083 20,038 21,659 21,920
20 year bonds¹ 192 231 336 209 195
30 day interbank cash rate 1,817 2,295 1,467 988 992
Agricultural 75 57 58 33 48
Electricity 105 152 158 186 181
Other ² 83 54 52 50 57
NZD 90 day bank bills 898 1,017 690 732 746
Total futures 62,521 72,311 68,331 72,744 73,975
¹ Introduced 21 September 2015² Other includes VIX and sector futures

42 |
4.2 Futures and OTC Markets (continued)1H16 2H16 1H17 2H17 1H18
Total contracts traded – options on futures ('000)
ASX SPI 200 189 174 120 82 77
3 year bonds 137 219 119 33 51
Overnight 3 year bonds 249 330 194 284 158
Intra-day 3 year bonds 329 331 250 210 207
10 year bonds 1 3 10 9 9
Electricity 14 9 12 15 15
Other ¹ 1 5 3 2 0
Total options on futures 920 1,071 708 635 517
Total futures and options on futures contract volume ('000) 63,441 73,382 69,039 73,379 74,492
Daily average contracts – futures and options 488,009 577,819 535,185 577,790 581,971
Average fee per contract – futures and options $1.44 $1.40 $1.41 $1.37 $1.36
OTC Markets
Total notional cleared value ($bn) 2 $817.445 $1,924.557 $2,159.682 $3,006.267 $3,137.550
453,007 469,548 464,196 523,776 488,009 577,819 535,185 577,790 581,971
1H14 2H14 1H15 2H15 1H16 2H16 1H17 2H17 1H18
Futures average daily contracts
¹ Other includes options over 90 day bank bills, overnight and intraday 10 year bonds and agricultural² Cleared notional value is double-sided

43 |
4.2 Austraclear
1H16 2H16 1H17 2H17 1H18
Settlement days 130 124 129 124 128
Transactions ('000)
Cash transfers 300 290 292 290 296
Fixed interest securities 363 354 367 374 383
Discount securities 75 75 74 72 72
Foreign exchange 6 5 4 5 5
Other 2 0 1 0 2
Total transactions 746 724 738 741 758
Average daily settlement volume 5,736 5,838 5,724 5,970 5,919
Securities holdings (monthly average $bn) $1,828.2 $1,887.1 $1,930.5 $1,900.3 $1,887.4
Securities holdings (period end $bn) $1,849.0 $1,895.6 $1,947.3 $1,860.3 $1,902.5
Average settlement and depository fee (including portfolio holdings)per transaction (excludes registry services revenue) $15.62 $16.39 $16.19 $16.49 $16.37
6,287 6,310 5,956 6,366 5,736 5,838 5,724 5,970 5,919
1H14 2H14 1H15 2H15 1H16 2H16 1H17 2H17 1H18
Austraclear average daily settlement volume

44 |
4.3 Trading Services – Cash Market Trading
1H16 2H16 1H17 2H17 1H18
Trading days 130 124 129 124 128Total cash market trades ('000) 110,091 125,832 130,984 135,449 144,880 Average daily cash market trades 846,853 1,014,772 1,015,381 1,092,332 1,131,875
Continuous trading ($bn) $390.115 $380.690 $371.262 $364.185 $334.219 Auctions ($bn) $103.701 $105.711 $113.659 $123.324 $122.471 Centre Point ($bn) $35.725 $43.216 $54.034 $53.009 $53.437 Trade reporting ($bn) $75.727 $69.264 $76.518 $90.859 $89.346
Total cash market value ($bn) $605.268 $598.881 $615.473 $631.377 $599.473 Average daily on-market value ($bn) $4.073 $4.271 $4.178 $4.359 $3.985 Average daily value (including Trade reporting) ($bn) $4.656 $4.830 $4.771 $5.092 $4.683 Average trade size ($) $5,498 $4,759 $4,699 $4,661 $4,138 Average trading fee per dollar of value (bps) 0.33 0.34 0.37 0.36 0.37Average fee per dollar of value (bps)¹ 1.15 1.17 1.22 1.16 1.22 Velocity (total value / average market capitalisation)2 92% 92% 89% 87% 82%Number of dominant settlement messages (m) 8.4 8.7 9.4 8.4 8.8¹ Average fee earned (both sides) for trading, clearing and settlement² Total value transacted on all venues
3.208 3.365 3.4954.131 4.073 4.271 4.178 4.359 3.985
1H14 2H14 1H15 2H15 1H16 2H16 1H17 2H17 1H18
Average daily on-market value ($bn)

45 |
4.3 Trading Services – Technical Services
1111 1H16 2H16 1H17 2H17 1H18
Technical Services (number at period end)
Liquidity access
ASX sessions 1,141 1,113 1,074 1,033 945
ASX gateways 197 192 184 179 162
ASX liquidity cross-connects 59 57 58 60 61
Futures gateways 222 208 199 199 205
ASX ITCH access 35 39 40 43 45
ASX OUCH access 56 58 68 73 73
Futures liquidity cross-connects 288 306 292 334 363
Futures ITCH access 41 45 53 74 75
Community and connectivity
ASX Net connections 122 116 112 123 115
ASX Net service feeds 370 382 389 437 444
Australian Liquidity Centre service connections 746 819 907 871 934
Application services
ASX trader workstations / ASX Best terminals 268 251 243 230 223
Hosting
Australian Liquidity Centre cabinets 219 231 270 285 298
Other data centre cabinets 8 8 11 13 13

46 |
4.4 CCP participant collateral balances
1H16$million
2H16$million
1H17$million
2H17$million
1H18$million
Balances at period end
ASX Clear – initial margins 583.5 815.7 445.5 672.3 441.9
ASX Clear (Futures) – initial margins House1 853.3 1,293.7 1,425.8 2,030.9 2,192.3
ASX Clear (Futures) – initial margins Client 2,495.7 3,278.6 3,728.0 4,856.1 3,855.5
ASX Clear (Futures) – excess 176.0 500.2 188.4 325.4 562.0
Total margins held on balance sheet – (excluding commitments) 4,108.5 5,888.2 5,787.7 7,884.7 7,051.7
Average daily margin balance during the period (excluding commitments) 4,136.0 4,509.6 5,370.8 6,369.0 6,846.8
ASX Clear – guarantees and equity collateral held off balance sheet 3,508.5 3,400.3 3,758.5 3,398.3 3,438.6¹ Includes margins held for OTC Clearing

47 |
5. Free cash flow summary1H16
$million2H16
$million1H17
$million2H17
$million1H18
$million
ASX Group cashTotal cash and short-term investments 5,356.3 7,072.8 7,002.2 9,085.6 8,336.2Less participants’ margins and commitments – cash backed (4,308.5) (6,088.2) (5,987.7) (8,084.7) (7,251.7)ASX Group own cash reserves 1,047.8 984.6 1,014.5 1,000.9 1,084.5
Less specific own cash allocations (768.3) (768.3) (768.3) (768.3) (768.3)
Available free cash 279.5 216.3 246.2 232.6 316.2
Free cash flowFree cash flow at period open 224.5 279.5 216.3 246.2 232.6Add:Cash generated from business activities (including changes in fair value) 262.9 177.3 273.6 208.7 301.7Cash from decrease in borrowingsCash from issue of sharesLess:Cash used for payment of dividends (183.9) (191.7) (191.5) (197.3) (193.1)Cash used for other non current assets (24.0) (24.4) (36.0) (25.0) (20.4)Increase in inter-Group liquidity commitmentsAdditional equity designated to support the clearing default fundPayments for investments - (24.4) (16.2) - (4.6)Free cash flow at period end 279.5 216.3 246.2 232.6 316.2

48 |
6. Capital attribution
31 Dec 15$million
30 Jun 16$million
31 Dec 16$million
30 Jun 17$ Million
31 Dec 17$million
ASX Group shareholders’ equity 3,787.2 3,824.1 3,874.1 3,908.1 3,925.2
Capital attribution
ASX Clear – default fund contributed by ASX (held in ASX Clear) 250.0 250.0 250.0 250.0 250.0
ASX Clear (Futures) – default fund contributed by ASX (held in ASX Clear (Futures)) 450.0 450.0 450.0 450.0 450.0
Business risk capital – ASX Clear and ASX Clear (Futures) 75.0 75.0 75.0 75.0 75.0
Business risk capital – ASX Settlement and Austraclear 169.2 170.6 174.3 178.2 180.1
Operational, fixed assets and investment risk 170.0 206.1 223.8 232.7 230.3
Goodwill 2,317.6 2,317.6 2,317.6 2,317.6 2,317.6
Total capital attribution 3,431.8 3,469.3 3,490.7 3,503.5 3,503.0
Total paid-in clearing default fund
ASX Clear 250.0 250.0 250.0 250.0 250.0
ASX Clear (Futures) 650.0 650.0 650.0 650.0 650.0

49 |
Disclaimer
The material contained in this document is a presentation of general information about the ASX Group’s activities current as at the date of this presentation (15 February 2018). It is provided in summary and does not purport to be complete. You should not rely upon it as advice for investment purposes, as it does not take into account your investment objectives, financial position or needs. These factors should be considered, with or without professional advice, when deciding if an investment is appropriate.
To the extent permitted by law, no responsibility for any loss arising in any way (including by way of negligence) from anyone acting or refraining from acting as a result of this material is accepted by the ASX Group, including any of its related bodies corporate.
This document may contain forward-looking statements with respect to the financial condition, results of operations, and business strategy of the ASX Group. These forward-looking statements are based on estimates, projections and assumptions made by the ASX Group about circumstances and events that have not yet taken place. Although the ASX Group believes the forward-looking statements to be reasonable, they are not certain. Forward-looking statements involve known and unknown risks, uncertainties and other factors that are in some cases beyond the ASX Group’s control, and which may cause actual results, performance or achievements to differ materially from those expressed or implied by the forward-looking statements (and from past results). The ASX Group makes no representation or warranty as to the accuracy of any forward-looking statements in this document and undue reliance should not be placed upon such statements.
Forward-looking statements may be identified by words such as “aim”, “anticipate”, “assume”, “continue”, “could”, “estimate”, “expect”, “intend”, “may”, “plan”, “predict”, “should”, “will”, or “would” or the negative of such terms or other similar expressions that are predictions of or otherwise indicate future events or trends.
The forward-looking statements included in this document speak only as of the date of this document. The ASX Group does not intend to update the forward-looking statements in this document in the future.