Embed Size (px)
Citation preview
AGENCY FINANCIAL REPORT
U.S. DEPARTMENT OF COMMERCE
2017F I S C A L Y E A R

This report can be found on the Internet at http://www.osec.doc.gov/ofm/OFM_Publications.html.
If you have questions or comments regarding this report, please contact the Department’s
Office of Financial Management by phone at (202) 482-1207 or
by email at [email protected].
Office of Financial Management
U.S. Department of Commerce
1401 Constitution Avenue NW
Washington, DC 20230

AGENCY FINANCIAL REPORT
U.S. DEPARTMENT OF COMMERCE
2017F I S C A L Y E A R
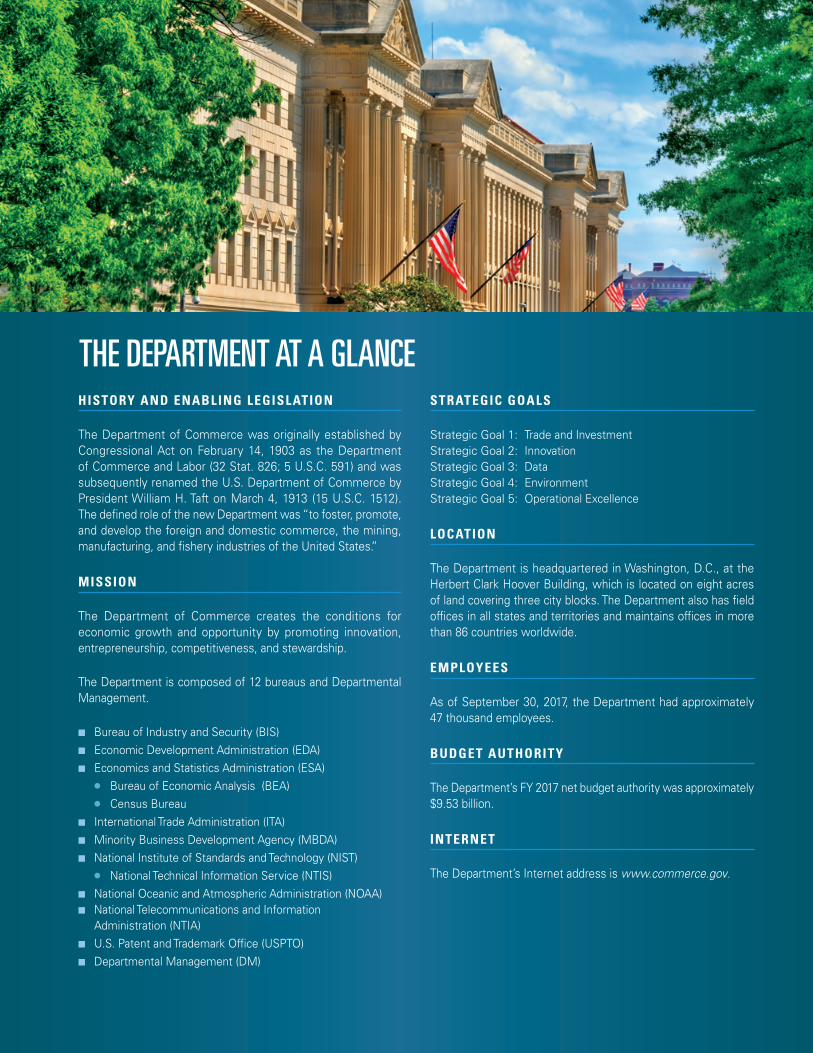
HISTORY AND ENABLING LEGISLATION
The Department of Commerce was originally established by Congressional Act on February 14, 1903 as the Department of Commerce and Labor (32 Stat. 826; 5 U.S.C. 591) and was subsequently renamed the U.S. Department of Commerce by President William H. Taft on March 4, 1913 (15 U.S.C. 1512). The defined role of the new Department was “to foster, promote, and develop the foreign and domestic commerce, the mining, manufacturing, and fishery industries of the United States.”
MISSION
The Department of Commerce creates the conditions for economic growth and opportunity by promoting innovation, entrepreneurship, competitiveness, and stewardship.
The Department is composed of 12 bureaus and Departmental Management.
■ Bureau of Industry and Security (BIS) ■ Economic Development Administration (EDA) ■ Economics and Statistics Administration (ESA)
● Bureau of Economic Analysis (BEA) ● Census Bureau
■ International Trade Administration (ITA) ■ Minority Business Development Agency (MBDA) ■ National Institute of Standards and Technology (NIST)
● National Technical Information Service (NTIS) ■ National Oceanic and Atmospheric Administration (NOAA)■ National Telecommunications and Information
Administration (NTIA) ■ U.S. Patent and Trademark Office (USPTO) ■ Departmental Management (DM)
STRATEGIC GOALS
Strategic Goal 1: Trade and InvestmentStrategic Goal 2: Innovation Strategic Goal 3: DataStrategic Goal 4: EnvironmentStrategic Goal 5: Operational Excellence
LOCATION
The Department is headquartered in Washington, D.C., at the Herbert Clark Hoover Building, which is located on eight acres of land covering three city blocks. The Department also has field offices in all states and territories and maintains offices in more than 86 countries worldwide.
EMPLOYEES
As of September 30, 2017, the Department had approximately 47 thousand employees.
BUDGET AUTHORITY
The Department’s FY 2017 net budget authority was approximately $9.53 billion.
INTERNET
The Department’s Internet address is www.commerce.gov.
THE DEPARTMENT AT A GLANCE
TABLE OF CONTENTSHow to Use this Report IV
Management’s Discussion and Analysis 1
Mission and Organization 2The Department of Commerce Process for Strategic Planning and Performance Reporting 3FY 2017 Performance Summary 6Looking Forward 10Management Controls 12
Secretary’s Statement of Assurance 12Federal Managers’ Financial Integrity Act (FMFIA) of 1982 13Federal Financial Management Improvement Act (FFMIA) of 1996 14Biennial Review of Fees 14Report on Audit Follow-up 14
Financial Management and Analysis 16Analysis of FY 2017 Financial Condition and Results 24Summary of Stewardship Information 33
Financial Section 35
Message from the Chief Financial Officer (Unaudited) 36Independent Auditors’ Report 37Principal Financial Statements 47
Consolidated Balance Sheets 48Consolidated Statements of Net Cost 49Consolidated Statements of Changes in Net Position 50Combined Statements of Budgetary Resources 51Consolidated Statements of Custodial Activity 52
Notes to the Financial Statements 53Required Supplementary Information (Unaudited) 109Required Supplementary Stewardship Information (Unaudited) 117
Other Information (Unaudited) 127
Office of Inspector General Summary on Top Management and Performance Challenges 128Summary of Financial Statement Audit and Management Assurances 134Payment Integrity 135 Fraud Reduction Report 145Reduce the Footprint 146Civil Monetary Penalties’ Adjustments for Inflation 147Grants Oversight and New Efficiency (GONE) Act Requirements 151Undisbursed Balances in Expired Grant Accounts 153Glossary of Acronyms 157
Acknowledgements 161
FY 20 17 AGENCY F I NANC IAL REPORT | I I I

HOW TO USE THIS REPORT
This Agency Financial Report (AFR) for the fiscal year ended September 30 (FY) 2017 provides the Department of Commerce’s financial and summary performance information in accordance with
OMB Circular A-136, Financial Reporting Requirements.
The Department has chosen to produce an AFR. The Department will provide performance results in the FY 2019 Congressional Budget in conjunction with performance plan information as the “FY 2019 Annual Performance Report” for each bureau and will post it on the Department’s website at http://www.osec.doc.gov/bmi/budget/.
The Department’s annual AFR is available on the Department’s website at http://www.osec.doc.gov/ofm/OFM_Publications.html. The Department welcomes feedback on the form and content of this report.
This report is organized into the following major components:
ManageMent’s Discussion anD analysis (MD&a)This section provides an overview of the financial and summary-level performance information contained in the Performance Summary, Financial Section, and Other Information. The MD&A includes an overview of the summary of the performance process and current status of systems, information on management controls and the Department’s financial management, analysis of FY 2017 financial condition and results, and a summary of stewardship information.
Financial section
This section contains details of the Department’s finances in FY 2017. A message from the Department’s Chief Financial Officer (CFO) (unaudited) is followed by the independent auditors’ report, audited financial statements and notes, required supplementary information (unaudited), and required supplementary stewardship information (unaudited).
other inForMation (unaudited)This section provides the Office of Inspector General’s (OIG) summary on top management and performance challenges, a summary of financial statement audit and management assurances, payment integrity information, a fraud reduction report, a real property “Reduce the Footprint” report, a schedule of civil monetary penalties’ adjustments for inflation, a summary of Grants Oversight and New Efficiency (GONE) Act requirements, a summary of undisbursed balances in expired grant accounts, a glossary of acronyms, and acknowledgements.
IV | FY 20 17 AGENCY F I NANC IAL REPORT
M A N A G E M E N T ’ S D I S C U S S I O N A N D A N A L Y S I S

ManageMent’s Discussion anD analysis

MISSION AND ORGANIZATION
M I S S I O N
To creaTe The condiTions for economic growTh and opporTuniTy.
U . S . D E P A R T M E N T O F C O M M E R C E
Chief Financial Of�cer andAssistant Secretary for
Administration
Chief Information Of�cer
Of�ce of Public Affairs
Of�ce of Business Liaison
Of�ce ofWhite House Liaison
Of�ce of Policyand Strategic Planning
SECRETARYDeputy Secretary
Under Secretary forInternational Trade
Deputy Under Secretary for International Trade
Administration
Under Secretary forIndustry and Security
Bureau ofIndustry and Security
AssistantSecretary for
ExportAdministration
AssistantSecretary for
ExportEnforcement
Deputy Under Secretary for Industry and
Security
ChiefEconomist
DirectorBureau of
the Census
Assistant Secretary for Industry and Analysis
Deputy Assistant Secretary for Industry and Analysis
Assistant Secretary for Enforcement and Compliance
Deputy Assistant Secretary for
Enforcement and Compliance
Director General of the U.S. and Foreign Commercial Service
and Assistant Secretary for
Global Markets
Deputy Director General of the
U.S. and Foreign Commercial Service
Under Secretary forEconomic Affairs
Economics andStatistics
Administration
Director Bureau of
Economic Analysis
Assistant Secretary forEconomic Development
Economic DevelopmentAdministration
National Director
Minority BusinessDevelopment Agency
Assistant Secretary forCommunications and Information
National Telecommunicationsand Information Administration
Under Secretary forIntellectual Property
and Director
United States Patentand Trademark Ofce
Executive Secretariat
Chief of Staff
Assistant Secretary forLegislative and
Intergovernmental Affairs
Inspector General
General Counsel
DirectorNational Technical
Information Service
Under Secretary forStandards and
Technology
National Institute forStandards and
Technology
Under Secretaryand Administrator
National Oceanic andAtmospheric
Administration
ChiefScientist
AssistantSecretary forConservation
andManagement/
DeputyAdministrator
AssistantSecretary for
EnvironmentalObservation
and Prediction/ Deputy
Administrator
2 | FY 20 17 AGENCY F I NANC IAL REPORT
M A N A G E M E N T ’ S D I S C U S S I O N A N D A N A L Y S I S
THE DEPARTMENT OF COMMERCE PROCESS FOR STRATEGIC PLANNING AND PERFORMANCE REPORTING
BACKGROUND ON FEDERAL AGENCY STRATEGIC PLANNING
FY 2017 was exceptional in many ways. Mid-fiscal year a new administration moved into the White House and assumed leadership of federal agencies. FY 2017 is also the first year that all major federal agencies are developing and issuing new strategic plans on the same schedule. The Government Performance and Results Modernization Act (GPRMA) of 2010 requires agencies to publish new strategic plans one year after a new administration begins. The process of developing the plans for FY 2018 – FY 2022 began in the spring of calendar year 2017. Drafts were provided to the Office of Management and Budget (OMB) in September 2017. Final FY 2018 – FY 2022 plans will be published in February of 2018.
The FY 2014 – FY 2018 Strategic Plan broadly guides activities through FY 2017. However, the focus after the inauguration in January was on defining and refining the priorities and policies of the new administration. Some priorities were articulated during the campaign; others are being developed as the new team governs. Many leadership positions are filled well into the administration’s first year and new principals will modify and refine plans as they work with the agencies they lead.
GPRMA also requires agencies to establish Agency Priority Goals (APGs). APGs set two-year targets for initiatives that are significant and would benefit from a well-orchestrated sprint. Most major departments have three to five APGs that are selected by top leadership and approved by OMB, an extension of the White House. APGs belong to an administration and may or may not be a priority of a new team. However, they typically are significant and continue to be monitored but may lose the APG designation. During the summer of 2017, new APGs were proposed, but they will not be formally adopted until 2018.
The Strategic Plan and APG implementation monitoring process described later in this section continued through the end of calendar year 2016. Progress and barriers to progress are important information to use in the development of new plans and APGs. However, in 2017, emphasis and executive attention has focused on creating a program/policy framework for the next four years. With the exception of top priority actions, strategic plan monitoring will be more bureau-based until a new plan is adopted. When a new plan is published, the Department-level review process will be modified to accommodate the preferences of the Secretary and Deputy Secretary.
ORGANIZATION OF THE DEPARTMENT OF COMMERCE STRATEGIC PLAN
The FY 2014 – FY 2018 Department of Commerce Strategic Plan, the plan in effect during FY 2017, is organized by goal areas, strategic objectives, strategies, and performance indicators. This structure is standard for federal agencies and is established in guidance from OMB. The goal areas are major elements of the Department mission, i.e., Trade and Investment, Innovation, Environment, Data, and Operational Excellence. Strategic objectives (three to five per goal area) state specific important outcomes the Department aims to achieve, e.g., “Strengthen fair competition in international trade.” Strategies are approaches that will be used to achieve a strategic objective, e.g., “Monitor and ensure compliance with trade agreements.” Performance indicators are measures of success, e.g., “Number of trade agreement compliance cases resolved successfully.”
The FY 2018 – FY 2022 Strategic Plan that is being developed will have the same structure, but goal area, strategic objective, strategy, and performance indicator content will change.
FY 20 17 AGENCY F I NANC IAL REPORT | 3
M A N A G E M E N T ’ S D I S C U S S I O N A N D A N A L Y S I S
ROUTINE MONITORING OF THE STRATEGIC PLAN
The Department’s Strategic Plan Review and Implementation (SPRI) meetings have been one forum for monitoring the strategic plan and refining strategies and tactics on an ongoing basis. Monthly SPRI meetings included the administration-appointed bureau leaders, the Deputy Secretary, and principals of the Office of the Secretary. The Secretary attended intermittently. The Deputy Secretary chaired the reviews. At every meeting, a goal area and related objectives and priorities were discussed. Progress, challenges, and risks were identified and benefited from the collective talents and resources of the group. Strategies and tactics were at times revised or enhanced to accelerate progress or reduce risks.
The Strategic Plan was also monitored and advanced through weekly Operating Committee meetings. These meetings included the Secretary, the Deputy Secretary, policy principals, and the bureau leaders responsible for results under discussion. Discussion and reporting followed a prescribed format and follow-up actions were assigned.
Performance indicator data on APGs and Cross-Agency Priority Goals (address multi-agency priorities) have been posted to a public website www.performance.gov. This is a legal requirement, and will continue into the new administration. Before the data and explanations are published, the tracking information is reviewed by bureau leadership and OMB.
Internal bureau-centric metric review processes vary in approach and schedule but are systematic. Data on mission support initiatives (Human Resources, Acquisition, Financial Management, etc.) are tracked on an online dashboard and reviewed at quarterly meetings with the Chief Financial Officer/Assistant Secretary for Administration (CFO/ASA). The various “CXO” Councils (Human Resources, Information Technology, Acquisition, CFO) also review dashboards of metrics.
ANNUAL STRATEGIC REVIEW PROCESS
As required by OMB guidance, in the spring of FY 2016, the Department conducted a review of progress on the 19 strategic objectives in the FY 2014 – FY 2018 Strategic Plan. The results of the reviews are summarized in the Annual Performance Report that will be issued in FY 2018. The strategic reviews generated an “evidence agenda” that sets priorities for research and program evaluation needed to evolve service delivery and increase return on investment in programs. Evidence (research) on the quality of service and program impact is informing the development of the new strategic plan.
The chart on the following page summarizes the strategic goals and objectives established in the FY 2014 – FY 2018 Strategic Plan. The complete plan can be viewed online at https://www.commerce.gov/sites/commerce.gov/files/media/files/2014/doc_fy2014-2018_strategic_plan.pdf.
The FY 2018 – FY 2022 Department of Commerce Strategic Plan will build on what the Department achieved and learned in FY 2014 – FY 2018.
4 | FY 20 17 AGENCY F I NANC IAL REPORT
M A N A G E M E N T ’ S D I S C U S S I O N A N D A N A L Y S I S
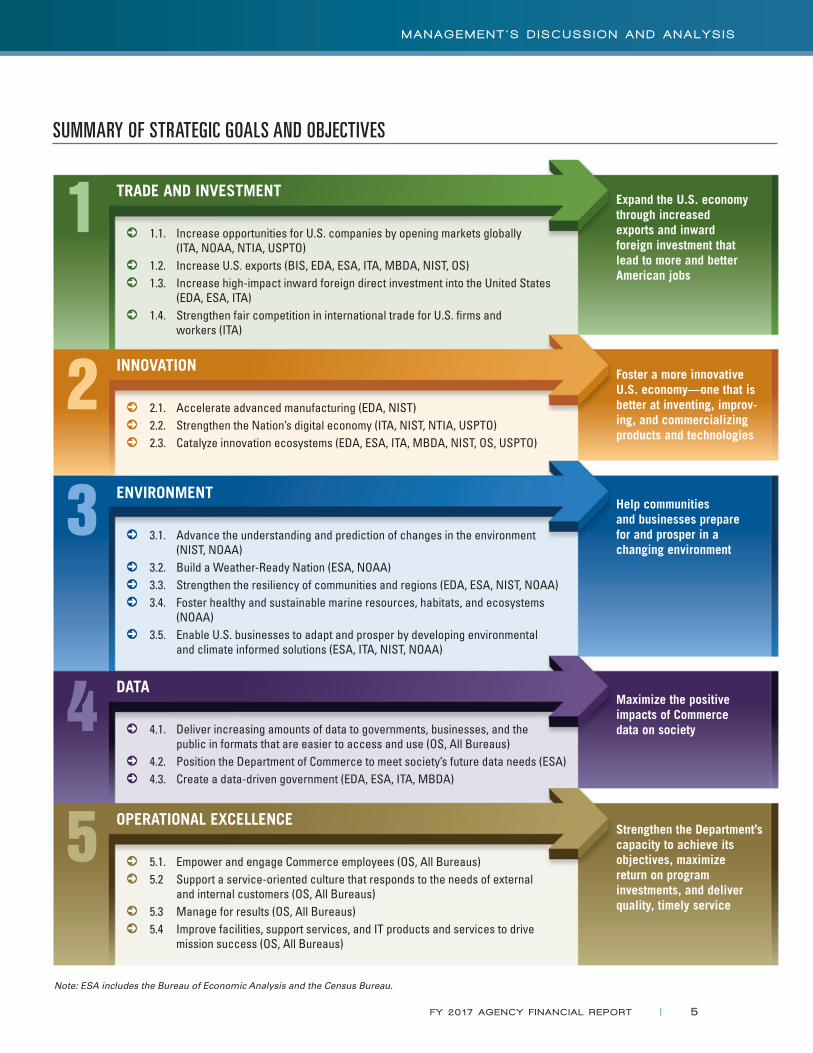
TRADE AND INVESTMENT
1.1. Increase opportunities for U.S. companies by opening markets globally (ITA, NOAA, NTIA, USPTO)
1.2. Increase U.S. exports (BIS, EDA, ESA, ITA, MBDA, NIST, OS) 1.3. Increase high-impact inward foreign direct investment into the United States
(EDA, ESA, ITA) 1.4. Strengthen fair competition in international trade for U.S. firms and
workers (ITA)
INNOVATION
2.1. Accelerate advanced manufacturing (EDA, NIST) 2.2. Strengthen the Nation’s digital economy (ITA, NIST, NTIA, USPTO) 2.3. Catalyze innovation ecosystems (EDA, ESA, ITA, MBDA, NIST, OS, USPTO)
ENVIRONMENT
3.1. Advance the understanding and prediction of changes in the environment (NIST, NOAA)
3.2. Build a Weather-Ready Nation (ESA, NOAA) 3.3. Strengthen the resiliency of communities and regions (EDA, ESA, NIST, NOAA) 3.4. Foster healthy and sustainable marine resources, habitats, and ecosystems
(NOAA) 3.5. Enable U.S. businesses to adapt and prosper by developing environmental
and climate informed solutions (ESA, ITA, NIST, NOAA)
DATA
4.1. Deliver increasing amounts of data to governments, businesses, and the public in formats that are easier to access and use (OS, All Bureaus)
4.2. Position the Department of Commerce to meet society’s future data needs (ESA) 4.3. Create a data-driven government (EDA, ESA, ITA, MBDA)
OPERATIONAL EXCELLENCE
5.1. Empower and engage Commerce employees (OS, All Bureaus) 5.2 Support a service-oriented culture that responds to the needs of external
and internal customers (OS, All Bureaus) 5.3 Manage for results (OS, All Bureaus) 5.4 Improve facilities, support services, and IT products and services to drive
mission success (OS, All Bureaus)
Expand the U.S. economy through increased exports and inward foreign investment that lead to more and better American jobs
Foster a more innovative U.S. economy—one that is better at inventing, improv-ing, and commercializing products and technologies
Help communities and businesses prepare for and prosper in a changing environment
Maximize the positive impacts of Commerce data on society
Strengthen the Department’s capacity to achieve its objectives, maximize return on program investments, and deliver quality, timely service
1
2
3
4
5
Note: ESA includes the Bureau of Economic Analysis and the Census Bureau.
SUMMARY OF STRATEGIC GOALS AND OBJECTIVES
FY 20 17 AGENCY F I NANC IAL REPORT | 5
M A N A G E M E N T ’ S D I S C U S S I O N A N D A N A L Y S I S
FY 2017 PERFORMANCE SUMMARY
OVERVIEW
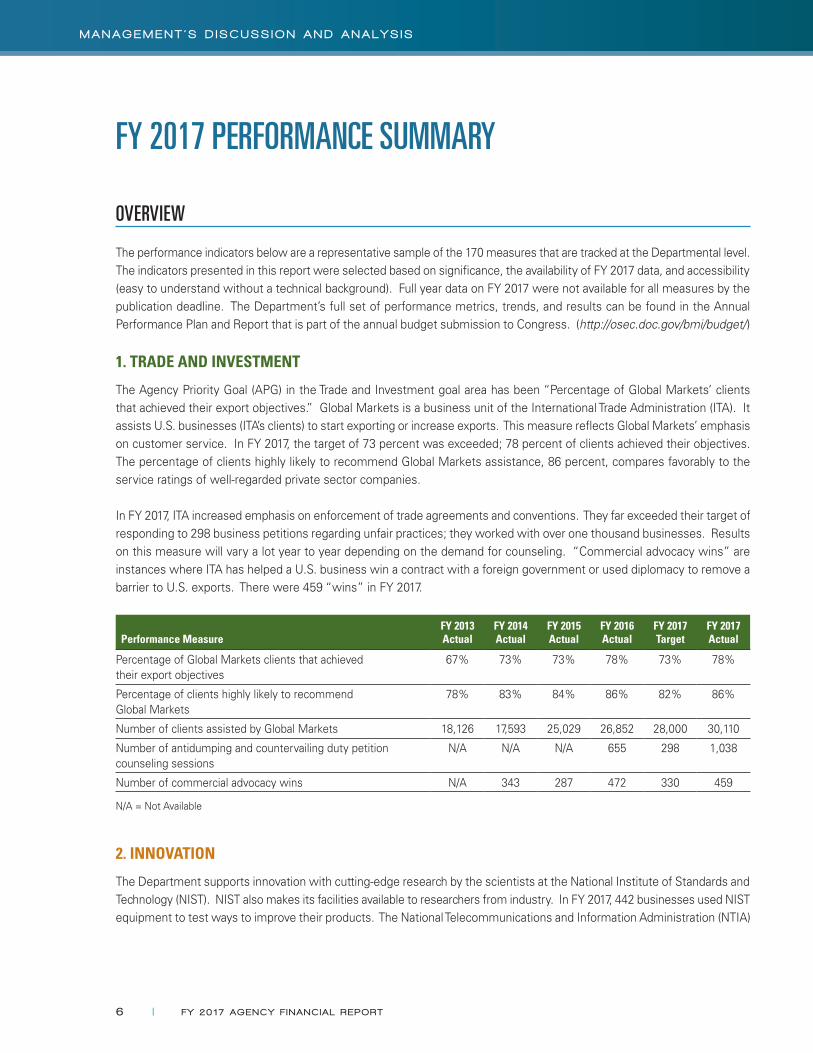
The performance indicators below are a representative sample of the 170 measures that are tracked at the Departmental level. The indicators presented in this report were selected based on significance, the availability of FY 2017 data, and accessibility (easy to understand without a technical background). Full year data on FY 2017 were not available for all measures by the publication deadline. The Department’s full set of performance metrics, trends, and results can be found in the Annual Performance Plan and Report that is part of the annual budget submission to Congress. (http://osec.doc.gov/bmi/budget/)
1. TRADE AND INVESTMENT
The Agency Priority Goal (APG) in the Trade and Investment goal area has been “Percentage of Global Markets’ clients that achieved their export objectives.” Global Markets is a business unit of the International Trade Administration (ITA). It assists U.S. businesses (ITA’s clients) to start exporting or increase exports. This measure reflects Global Markets’ emphasis on customer service. In FY 2017, the target of 73 percent was exceeded; 78 percent of clients achieved their objectives. The percentage of clients highly likely to recommend Global Markets assistance, 86 percent, compares favorably to the service ratings of well-regarded private sector companies.
In FY 2017, ITA increased emphasis on enforcement of trade agreements and conventions. They far exceeded their target of responding to 298 business petitions regarding unfair practices; they worked with over one thousand businesses. Results on this measure will vary a lot year to year depending on the demand for counseling. “Commercial advocacy wins” are instances where ITA has helped a U.S. business win a contract with a foreign government or used diplomacy to remove a barrier to U.S. exports. There were 459 “wins” in FY 2017.
Performance MeasureFY 2013 Actual
FY 2014 Actual
FY 2015 Actual
FY 2016 Actual
FY 2017 Target
FY 2017 Actual
Percentage of Global Markets clients that achieved their export objectives
67% 73% 73% 78% 73% 78%
Percentage of clients highly likely to recommend Global Markets
78% 83% 84% 86% 82% 86%
Number of clients assisted by Global Markets 18,126 17,593 25,029 26,852 28,000 30,110
Number of antidumping and countervailing duty petition counseling sessions
N/A N/A N/A 655 298 1,038
Number of commercial advocacy wins N/A 343 287 472 330 459
N/A = Not Available
2. INNOVATION
The Department supports innovation with cutting-edge research by the scientists at the National Institute of Standards and Technology (NIST). NIST also makes its facilities available to researchers from industry. In FY 2017, 442 businesses used NIST equipment to test ways to improve their products. The National Telecommunications and Information Administration (NTIA)
6 | FY 20 17 AGENCY F I NANC IAL REPORT
M A N A G E M E N T ’ S D I S C U S S I O N A N D A N A L Y S I S

provides highly used research and information on broadband use and developments. One way NTIA measures its reach is by counting document downloads. It also provides consulting to communities on how broadband can be leveraged to expand their business base. In FY 2017, NTIA assisted 400 communities.
Performance MeasureFY 2013 Actual
FY 2014 Actual
FY 2015 Actual
FY 2016 Actual
FY 2017 Target
FY 2017 Actual
Number of businesses using NIST research facilities N/A 514 444 435 325 442
Number of times NTIA research publications are downloaded N/A 7,707 8,960 8,800 8,000 8,089
Communities that NTIA assisted in gaining economic benefits from broadband
N/A N/A 337 449 250 400
N/A = Not Available
The U.S. Patent and Trademark Office (USPTO) missed the target for reducing the time for first action on a patent application; this will be addressed by increased use of technology and process improvements. USPTO has continued to reduce the patent backlog and the time required for a final patent determination (an APG). USPTO’s efforts to improve cycle-time and patent quality help reduce the time from invention to commercialization of a product.
Performance MeasureFY 2013 Actual
FY 2014 Actual
FY 2015 Actual
FY 2016 Actual
FY 2017 Target
FY 2017 Actual
Patent first action pendency (months) 18.2 18.4 17.3 16.2 14.8 16.3
Patent total action pendency (months) 29.1 27.4 26.6 25.3 24.8 24.2
Patent backlog 584,998 605,646 553,221 537,655 485,300 526,579
3. ENVIRONMENT
The National Oceanic and Atmospheric Administration (NOAA) advances U.S. resilience to extreme weather and works with individual communities toward that end. As shown in the metric below many hometowns are benefiting from increased resilience. NOAA has an admirable record for peer-reviewed research; NOAA research focuses on weather, climate, and the oceans. As indicated in the last measure in the matrix below, they also have an admirable record of success supporting populations of endangered species. The Fish Stock Sustainability Index measures progress in maintaining fishing at levels that will permit future generations to fish.
Performance MeasureFY 2013 Actual
FY 2014 Actual
FY 2015 Actual
FY 2016 Actual
FY 2017 Target
FY 2017 Actual
Percentage of U.S. coastal states and territories demonstrating annual improvement in resilience to weather and climate hazards
57% 54% 60% 74% 66% 69%
Annual number of peer-reviewed publications related to environmental understanding and prediction
1,676 1,759 1,860 1,697 1,700 1,678
Number of protected species designated as threatened, endangered or depleted with stable or increasing population levels
30 37 31 31 30 30
Fish Stock Sustainability Index 719.0 746.0 761.5 754.0 754.0 756.5
FY 20 17 AGENCY F I NANC IAL REPORT | 7
M A N A G E M E N T ’ S D I S C U S S I O N A N D A N A L Y S I S

NOAA skill and lead time for predicting weather can and does save lives. The “skill score” is a measure of accuracy and it hit an all-time high for temperature forecasts. Lead time for warnings is very important for extreme weather. Winter storm warning lead time is now 22 hours. NOAA is using “super-computing” to perfect the models and extend warning lead times. Accurate flash flood predictions are also needed for public safety. NOAA is working to improve the models that predict dangerous flooding. To this end, it opened the National Water Center in 2014. The National Water Center leverages interagency (U.S. Geological Survey, Army Corps of Engineers) expertise to improve water resource forecasts.
Performance MeasureFY 2013 Actual
FY 2014 Actual
FY 2015 Actual
FY 2016 Actual
FY 2017 Target
FY 2017 Actual
U.S. temperature forecast skill 26 26 25 24 26 34
Winter storm warning – Lead time (hours) 22 22 21 21 20 22
Severe weather warnings for flash floods – Accuracy 78% 78% 79% 80% 76% 78%
4. DATA
The FY 2014 – FY 2018 Strategic Plan presents data as a national asset that can increase competitiveness and save lives (e.g., weather data). In FY 2017, the Department continued to make more of its data sets available in API format, i.e., a format that facilitates linking data sets. NOAA and the Census Bureau data support industries that package the information for local and regional consumption.
The Census Bureau is planning a 2020 Decennial Census that will hinge on a centralized, state of the art information technology (IT) architecture. This IT investment will eventually support all of the Census Bureau’s survey products. The Census Bureau and the Bureau of Economic Analysis (BEA) continue to meet their deadlines for data releases that are the basis of critical government and business decisions.
Performance MeasureFY 2013 Actual
FY 2014 Actual
FY 2015 Actual
FY 2016 Actual
FY 2017 Target
FY 2017 Actual
Percentage of data processed and delivered to the user community (relative to all data transmitted to NOAA from NOAA-managed satellites)
99.5% 99.7% 99.35% 99.3% 98.5% 99.49%
Percentage of key activities for cyclical census programs completed on time to support effective decision-making by policymakers, businesses, and the public
90% 90% 100% 100% 90% 100%
Percentage of key data products for Census Bureau programs released on time to support effective decision-making of policymakers, businesses, and the public (Economic Indicators)
100% 100% 100% 100% 100% 100%
Percentage of key data products for Census Bureau programs released on time to support effective decision-making of policymakers, businesses, and the public (Other Key Products: Econ, Geo, and Demo)
90% 86% 87% 84% 90% 85%
BEA timely releases of economic statistics 62 65 65 74 74 74
8 | FY 20 17 AGENCY F I NANC IAL REPORT
M A N A G E M E N T ’ S D I S C U S S I O N A N D A N A L Y S I S

5. OPERATIONAL EXCELLENCE
There are many granular measures in the Operational Excellence goal area that help identify support services that need improvement, e.g., measures of customer satisfaction with individual processes and services, cycle-times, and cost effective new practices. Strategic level measures are often milestones for implementing new approaches to major functions, e.g., organizational development, IT architecture, and acquisition. New approaches reflect government-wide initiatives/reforms in the President’s Management Agenda, which states the administration’s priorities for improved operations.
As these proceed, the Department monitors employee survey results (see below) to assess if the culture supports excellence. The survey data below is the percent of staff who responded positively on the questions in the index. Both index scores are above the federal averages (69 for engagement; and 58 for results).
One-way environmental responsibility is monitored is by tracking the Department’s use of renewable energy. There has been steady improvement for five years. Enterprise acquisition practices are assessed in part through savings. That measure shows notable progress.
Performance MeasureFY 2013 Actual
FY 2014 Actual
FY 2015 Actual
FY 2016 Actual
FY 2017 Target
FY 2017 Actual
Federal Employee Viewpoint Survey – Employee Engagement Index
70 70 68 69 69 71
Federal Employee Viewpoint Survey – Results Oriented Culture Index
61 61 60 60 61 62
Commerce use of renewable energy as a percentage of total facility electricity use
4.9% 6.2% 7.7% 10% 7.5% 14.6%
Savings achieved through effective acquisition practices $21M $18M $17M $35M $18M $36M
FY 20 17 AGENCY F I NANC IAL REPORT | 9
M A N A G E M E N T ’ S D I S C U S S I O N A N D A N A L Y S I S
LOOKING FORWARD
The Department of Commerce is committed to creating the conditions for economic growth and opportunity. Much work has been completed and the Department remains committed to addressing continuing challenges, as well as new and emerging issues, as it strives to achieve the Department’s strategic objectives.
Despite many gains and achievements, the Department recognizes areas of major potential impact on the effectiveness and efficiency of its programs and operations. The Department has undertaken and planned extensive actions to address these challenges, and is committed to making further progress.
As a new decade draws closer on the horizon, the Department will continue to work with businesses, universities, communities, and the Nation’s workers to promote job creation, economic growth, and sustainable development. Departmental leadership is dedicated to making informed decisions when establishing program priorities as the Nation navigates familiar territories, and builds on core achievements; all while facing great uncertainty and emerging challenges. Balancing risk and opportunity in key programs, operations, and strategies will be a key contribution to the overall improved standards of living for Americans.
BALANCING RISK AND OPPORTUNITY
Departmental managers and leaders handle complex and risky mission and mission support activities, such as preparing for and responding to natural disasters, and managing safe information technology (IT) systems. While it is not possible to eliminate all uncertainties in these types of projects, there are strategies that can help plan and manage them.
One such strategy used at the Department is Enterprise Risk Management (ERM). Recognized and cited by the U.S. Government Accountability Office (GAO) as a good practice for managing risk, the Department’s ERM effort provides ways to better anticipate and manage risk across the organization. Successful ERM programs find ways to develop an organizational culture that allows employees to openly discuss and identify risks, as well as potential opportunities to enhance organizational goals or value. For example, Departmental officials sought to embed a culture of risk awareness across the Department by defining cascading roles of leadership and responsibility for ERM across the Department and for its 12 bureaus. Additionally, the Department leveraged this forum to share bureau best practices; develop a common risk lexicon; and address cross-bureau risks, issues, and concerns regarding ERM practice and implementation. These roles should support the ERM program and promote a risk management culture. They also help promote transparency, oversight, and accountability for a successful ERM.
Consideration of the Department’s changing priorities and emerging risks is particularly valuable in helping the Department to focus its oversight efforts. The Department’s ERM Framework is designed to facilitate a risk-based approach to its day-to-day business. The Department annually utilizes several processes and sources to identify, manage, and mitigate fraud risks. These process and sources include, but are not limited to, the Agency Risk Profile, GAO High-Risk List, and Mission Critical Programs and Activities List.
10 | FY 20 17 AGENCY F I NANC IAL REPORT
M A N A G E M E N T ’ S D I S C U S S I O N A N D A N A L Y S I S
EMERGING CHALLENGES
The underlying strength of the Department is the ability of its bureaus to work together and share expertise to drive economic growth. This same collaborative effort is leveraged to address the challenging areas that remain a priority for Department leadership. Securing Department systems and information, deploying a Nationwide Public Safety Broadband Network, and modernizing the Department’s legacy IT systems and improving data quality are examples of areas for improvement that benefit from collaborative solutions. The Department is dedicated to developing processes to facilitate this need, which include conducting Milestone Review Boards (MRBs). The MRB is a Department-level multi-disciplinary meeting that reviews performance indicators and progress against milestones. The board meetings direct further data collection and/or course corrections to keep critical projects on track. A balance of oversight and proactive risk management will be an ongoing process to address these challenge areas.
FY 20 17 AGENCY F I NANC IAL REPORT | 11
M A N A G E M E N T ’ S D I S C U S S I O N A N D A N A L Y S I S
T he Department’s management is responsible for establishing and maintaining effective internal control
and financial management systems that meet the objectives of the Federal Managers’ Financial Integrity
Act (FMFIA). During FY 2017, the Department assessed its internal control over the effectiveness and
efficiency of operations and compliance with applicable laws and regulations in accordance with Office of
Management and Budget (OMB) Circular A-123, Management’s Responsibility for Enterprise Risk Management
and Internal Control. Based on the results of this evaluation, the Department can provide reasonable assurance
that its internal control over the effectiveness and efficiency of operations and compliance with applicable laws
and regulations as of September 30, 2017 was operating effectively and no material weaknesses were found
in the design or operation of the internal controls.
In addition, the Department conducted its assessment of the effectiveness of internal control over financial
reporting, which includes safeguarding of assets and compliance with applicable laws and regulations,
in accordance with the requirements of Appendix A of OMB Circular A-123. Based on the results of this
evaluation, the Department can provide reasonable assurance that its internal control over financial reporting
as of June 30, 2017, was operating effectively and no material weaknesses were found in the design or
operation of the internal control over financial reporting. Furthermore, no material weaknesses related to
internal control over financial reporting were identified between July 1 and September 30.
Based on reviews conducted by the Department, it has been able to determine that its financial systems are
in conformance with government-wide requirements.
Ellen Herbst
Chief Financial Officer and
Assistant Secretary for Administration
Department of Commerce
November 14, 2017
Wilbur L. Ross, Jr.
Secretary of Commerce
November 14, 2017
MANAGEMENT CONTROLS
12 | FY 20 17 AGENCY F I NANC IAL REPORT
M A N A G E M E N T ’ S D I S C U S S I O N A N D A N A L Y S I S

FEDERAL MANAGERS’ FINANCIAL INTEGRITY ACT (FMFIA) OF 1982
The objective of the Department’s management control system is to provide reasonable assurance that:
●● Obligations and costs are in compliance with applicable laws;
●● Assets are safeguarded against waste, loss, unauthorized use, or misappropriation;
●● Revenues and expenditures applicable to the Department’s operations are properly recorded and accounted for, permitting accurate accounts, reliable financial reports, and full accountability for assets; and
●● Programs are efficiently and effectively carried out in accordance with applicable laws and management policy.
During FY 2017, the Department reviewed its management control system in accordance with the requirements of FMFIA, and OMB and Departmental guidelines.
SECTION 2 OF FMFIA – INTERNAL MANAGEMENT CONTROLS
Section 2 of FMFIA requires that federal agencies report, on the basis of annual assessments, any material weaknesses that have been identified in connection with their internal and administrative controls. Based on their FY 2017 evaluations, the Department’s 12 bureaus submitted, signed, and certified their Statements of Assurance and can provide reasonable assurance that its’ internal control over the effectiveness and efficiency of operations and compliance with applicable laws and regulations was operating effectively and no material weaknesses were found in the design or operation of the internal controls.
The efficiency of the Department’s operations is continually evaluated using information obtained from reviews conducted by the U.S. Government Accountability Office (GAO) and the Office of Inspector General (OIG), evaluations conducted by other federal agencies such as the Office of Personnel Management, and other specifically requested studies. The diverse reviews that took place during FY 2017 that were key to the organization provide assurance that Department systems and management controls comply with standards established under FMFIA. In FY 2017, the OIG conducted an examination of the Department’s compliance with the Digital Accountability and Transparency Act of 2014 (DATA Act). The examination covered the Department’s second quarter FY 2017 DATA Act submission. The DATA Act, in part, requires federal agencies to report financial and award data in accordance with government-wide financial data standards. These data are now publicly available on the website beta.USASpending.gov. The DATA Act also requires the OIG of each federal agency to review a sample of the submitted data and then report on the completeness, timeliness, quality, and accuracy of the data, as well as the agency’s implementation and use of the required standards. The OIG found that the transactions in the examined files were not presented, in all material respects, in accordance with the data characteristics defined in the U.S. Department of the Treasury’s Inspectors General Guide to Compliance Under the DATA Act. As a result, the OIG noted a material weakness related to controls over the DATA Act submission processes, and a significant deficiency related to access controls over the Department’s grant and procurement systems.
SECTION 4 OF FMFIA – INTERNAL CONTROLS OVER FINANCIAL MANAGEMENT SYSTEMS
The Department has reported no material weaknesses under FMFIA Section 4 in recent years. Based on reviews conducted by the Department and its bureaus for FY 2017, the financial systems in the Department are compliant with GAO principles and standards, the requirements of the Chief Financial Officers (CFO) Act, and OMB requirements.
FY 20 17 AGENCY F I NANC IAL REPORT | 13
M A N A G E M E N T ’ S D I S C U S S I O N A N D A N A L Y S I S

FEDERAL FINANCIAL MANAGEMENT IMPROVEMENT ACT (FFMIA) OF 1996
The Department has reported no material weaknesses under FMFIA Section 4 in recent years. Based on reviews conducted by the Department and its bureaus for FY 2017, the financial systems in the Department are compliant with GAO principles and standards, the requirements of the CFO Act, and OMB requirements.
BIENNIAL REVIEW OF FEES
OMB Circular A-25 Revised, User Charges (July 8, 1993), requires the biennial review of agency programs to determine whether fees should be charged for government goods or services, and to ascertain that existing user charges are adjusted to reflect unanticipated changes in costs or market values.
The Department conducts a review of its programs at least biennially. With the exception of the International Trade Administration (ITA), the Department is in compliance with the requirement to adjust its fees to meet the OMB Circular A-25 Revised requirement of full-cost recovery for user charges.
OMB has granted ITA an exception to the full cost recovery provisions of OMB Circular A-25 Revised for the user fees that ITA charges to small and medium enterprises until September 30, 2018. As ITA continues to review and update its fee structure, it is working towards improving data collection capabilities with regard to sensitivity analysis and revenue projections, with the goal of moving toward a model that more fully recovers the costs of the services it provides.
REPORT ON AUDIT FOLLOW-UP
This report shows audit follow-up activity on audits performed by the OIG, as well as the amount of potential monetary benefits that the OIG found could be achieved through implementing open recommendations in these reports. The report includes only audits for which there has been resolution, i.e., management and the auditor (OIG) have agreed on an action plan. Reports are closed when final action has been taken to implement all recommendations.
The Department has changed the reporting period to the current fiscal year (FY 2017). We are also including information on the prior fiscal year (FY 2016) because this information was not included in the FY 2016 AFR.
14 | FY 20 17 AGENCY F I NANC IAL REPORT
M A N A G E M E N T ’ S D I S C U S S I O N A N D A N A L Y S I S

SUMMARY OF ACTIVITY ON AUDIT REPORTSOCTOBER 1, 2016 THROUGH SEPTEMBER 30, 2017
NUMBER OF REPORTS1POTENTIAL MONETARY BENEFITS
OF OPEN RECOMMENDATIONS2
Beginning Balance 40 $ 103,162,879
New Reports 22 44,209,928
Total Reports Open During the Period 62 147,372,807
Reports Closed 34 (60,277,972)
Ending Balance 28 $ 87,094,835
SUMMARY OF ACTIVITY ON AUDIT REPORTSOCTOBER 1, 2015 THROUGH SEPTEMBER 30, 2016
NUMBER OF REPORTS1POTENTIAL MONETARY BENEFITS
OF OPEN RECOMMENDATIONS2
Beginning Balance 32 $ 152,115,308
New Reports 28 78,568,161
Total Reports Open During the Period 60 230,683,469
Reports Closed 20 (127,520,590)
Ending Balance 40 $ 103,162,879
1 The tables include Performance Audits, Evaluations, and Inspections. Audits comply with standards established by the Comptroller General of the United States for audits of federal establishments, organizations, programs, activities, and functions. Evaluations and inspections include evaluations, inquiries, and similar types of reviews that do not constitute an audit or a criminal investigation.
2 In some audits, the OIG identifies potential monetary benefits that could be realized when or if the recommendations are implemented. Potential Monetary Benefits of open recommendations include Questioned Costs and Funds to Be Put to Better Use.
• Questioned Costs: This is a cost questioned by the OIG because of (1) an alleged violation of a provision of a law, regulation, contract, grant, cooperative agreement, or other agreement or document governing the expenditure of funds; (2) a finding that, at the time of the audit, such cost is not supported by adequate documentation; or (3) a finding that an expenditure of funds for the intended purpose is unnecessary or unreasonable.
• Funds to Be Put to Better Use: This dollar value results from an OIG recommendation that funds could be used more efficiently if Departmental Management took action to implement and complete the recommendation. Such actions may include (1) reductions in outlays; (2) deobligation of funds from programs or operations; (3) withdrawal of interest subsidy costs on loans or loan guarantees, insurance, or bonds; (4) costs not incurred by implementing recommended improvements related to the Department, a contractor, or a grantee; (5) avoidance of unnecessary expenditures identified in preaward reviews of contracts or grant agreements; or (6) any other savings specifically identified.
FY 20 17 AGENCY F I NANC IAL REPORT | 15
M A N A G E M E N T ’ S D I S C U S S I O N A N D A N A L Y S I S

FINANCIAL MANAGEMENT AND ANALYSIS
INTRODUCTION
Under the Secretary’s leadership, the Department is continuing to give the highest priority to providing accurate financial data to its internal and external customers, and to its accountability for all assets. Ensuring that there are strong internal controls throughout the Department remains a priority. The Department has created a financial management environment that complies with federal laws and regulations and that provides its executives with timely, accurate financial and performance information. This is evidenced with the Department continuing to receive unmodified audit opinions, maintaining a single integrated financial system, and continuing its compliance with the Federal Financial Management Improvement Act (FFMIA).
Highlights of accomplishments for FY 2017 and future initiatives are discussed further below.
FINANCIAL MANAGEMENT SYSTEMS
The Department maintains an FFMIA-compliant financial management system, Commerce Business Systems (CBS), which provides reliable, timely information within a sophisticated security infrastructure. The system is capable of producing both financial and budget reports from information generated within the financial management system. CBS consists of a Core Financial System, including the Commerce Purchase Card System and the Budget and Execution Data Warehouse. CBS is interfaced with the Commerce Standard Acquisition and Reporting System, the U.S. Department of Agriculture’s (USDA) National Finance Center (NFC) Payroll System, and the U.S. Department of the Treasury’s (Treasury) Automated Standard Application for Payments.
The financial information from CBS is integrated in the Corporate Database for consolidated financial reporting, resulting in a single integrated financial management system. The Corporate Database is a commercial, off-the-shelf software package for consolidating financial data and producing financial reports. The Corporate Database is an integrated solution that provides financial statements and Adjusted Trial Balances reported at the Department, bureau, and Treasury Appropriation/Fund Group level. It also provides the ability to perform data analysis and produce the Department’s footnotes, financial analysis reports, and other additional information required for the government-wide financial statements.
The Department is currently participating in government-wide work groups for SmartPay3 and Government Invoicing (G-Invoicing), which are two initiatives that will require compliance in future fiscal years. SmartPay3 is a U.S. General Services Administration (GSA)-led initiative to transition government purchase and travel cards from the current provider to a new provider, and may require changes to the CBS to successfully implement the change. G-Invoicing is a Treasury-led initiative to standardize the inter-agency agreement process across the government. The Department participates in these work groups to help guide the implementation of the initiatives across the government as well as to plan for the changes needed to CBS so that the Department is ready to implement by the mandatory date. Additionally, the Department remains dedicated to providing quarterly submissions to meet the Digital Accountability and Transparency Act of 2014 (DATA Act) requirements, as well as addressing any necessary modifications as required.
During FY 2017, the Department accomplished the following initiatives:
●● Completed development and deployment of interfaces between CBS and Employee Travel System, version 2 (E2 or E2Solutions) travel management system in support of the Department-wide implementation of E2. These interfaces include authorizations, vouchers, centrally billed accounts, and audit functionality;
16 | FY 20 17 AGENCY F I NANC IAL REPORT
M A N A G E M E N T ’ S D I S C U S S I O N A N D A N A L Y S I S
●● Completed implementation of E2 to the National Institute of Standards and Technology (NIST), National Oceanic and Atmospheric Administration (NOAA), and the Census Bureau, and stood up Tier 2/production support operations;
●● Gathered requirements for Mass Close functionality in E2, which provides the ability to close multiple E2 Travel open obligations in one batch process;
●● Completed year-end interface for E2;
●● Designed, developed, and deployed the DATA Act Broker and successfully lead the Department in second quarter and third quarter DATA submissions;
●● Completed development of Federal Funding Accountability and Transparency Act New Unique Identifier to include Activity Address Codes (AAC);
●● Completed technical CBS upgrades for CBS Technology Migration to Web Center-Multi-Node environment, Oracle 12C database, and WebCenter 12.2.1.1;
●● Began development and configuration for TIBCO upgrade, which is software used to translate and validate XML documents from CSTARS (the Department’s acquisition system) to be interfaced into CBS;
●● Completed analysis and began installation/configuration for Java Runtime Environment/Java WebStart; and
●● Conducted operations and maintenance activities for the Department’s Chief Financial Officer and Assistant Secretary for Administration (CFO/ASA) Dashboard application. The CFO/ ASA Dashboard provides a Department-wide, executive-level overview of the Department’s highest priority and highest risk mission and administrative initiatives.
In FY 2018 and beyond, the Department will continue its efforts to enhance its financial systems. The Department plans to accomplish the following:
●● Continue working with the Office of Management and Budget (OMB) and Treasury to determine the next steps for the Business Application Solutions project;
●● Gather requirements, design, develop, and implement SmartPay3 interface;
●● Design, develop and implement NOAA Corp Retirement System interface changes to USDA’s NFC interface;
●● Conduct analysis and perform requirements gathering and design for G-Invoicing;
●● Implement AAC and E2 year-end code synchronization;
●● Develop Mass Close functionality for E2;
●● Establish Business Intelligence solution to meet the Department’s needs for DATA Act metrics reporting;
●● Implement a Department-wide relocation system and its interface with CBS; and
●● Complete technical upgrades for Oracle WebCenter 12.2.1.2, Oracle 12C Forms and Reports, and TIBCO upgrade.
FY 20 17 AGENCY F I NANC IAL REPORT | 17
M A N A G E M E N T ’ S D I S C U S S I O N A N D A N A L Y S I S
FINANCIAL REPORTING AND POLICY
The Department accomplished the following initiatives during FY 2017:
●● Bureaus identified and reported improper payments data to the Department quarterly, including recaptures of improper payments data, identified reasons for improper payments, and continually implemented appropriate actions to minimize future improper payments. For more information on the Department’s payment integrity efforts during FY 2017, see the Payment Integrity subsection included in Other Information;
●● Each of the Department’s bureaus/reporting entities updated or prepared their scheduled improper payment risk assessments covering all programs/activities as required by OMB Circular A-123, Management’s Responsibility for Internal Control, Appendix C, Requirements for Effective Measurement and Remediation of Improper Payments. These improper payment risk assessments of the entity’s programs/activities also include assessments of the control, procurement, and grants management environments, and are now in the continuous process stage of being updated every three years, unless significant changes occur, in which case an assessment will be updated quicker. For more information on the Department’s efforts during FY 2017 regarding improper payments risk assessments, see the Payment Integrity subsection included in Other Information;
●● A contractor completed an annual payment recapture audit of Department-wide grants and other cooperative agreements, and completed an annual payment recapture audit of contracts/obligations for the National Telecommunications and Information Administration (payment recapture audits of contracts/obligations are performed annually for the Department’s bureaus/reporting entities, on a rotational basis). The payment recapture audits did not identify any improper payments;
●● A contractor prepared a Statistical Sampling and Estimation Plan for the NOAA Disaster Relief Appropriations Act FY 2016 disbursements in order to yield a statistically valid improper payments estimate, and the contractor and NOAA performed the FY 2016 disbursements testing, which yielded a statistically valid improper payments estimate of $85 thousand and a statistically valid projected improper payments rate of 0.15 percent. For more information on the Department’s statistical sampling efforts for funds received by NOAA under the Disaster Relief Appropriations Act, see the Payment Integrity subsection included in Other Information; and
●● Adjusted the Department’s civil monetary penalties for inflation in January 2017, in accordance with the Federal Civil Penalties Inflation Adjustment Act of 1990, as amended by the Debt Collection Improvement Act of 1996 and the Federal Civil Penalties Inflation Adjustment Act Improvements Act of 2015. For more information on the Department’s civil monetary penalties as of January 15, 2017, see the Civil Monetary Penalties’ Adjustments for Inflation subsection included in Other Information.
In FY 2018 and beyond, the Department plans to accomplish the following
●● Adjust the Department’s civil monetary penalties for inflation in January 2018, in accordance with the Federal Civil Penalties Inflation Adjustment Act of 1990, as amended by the Debt Collection Improvement Act of 1996 and the Federal Civil Penalties Inflation Adjustment Act Improvements Act of 2015;
●● Implement, effective FY 2018, the Federal Accounting Standards Advisory Board’s (FASAB) Statement of Federal Financial Accounting Standards (SFFAS) 47, Reporting Entity, which sets forth guidance to include, in the Department’s financial statements or as footnote disclosures, “all organizations (1) budgeted for by elected officials of the federal government; (2) owned by the federal government; or (3) controlled by the federal government with risk of loss or
18 | FY 20 17 AGENCY F I NANC IAL REPORT
M A N A G E M E N T ’ S D I S C U S S I O N A N D A N A L Y S I S

expectation of benefits. In addition, SFFAS 47 establishes that an organization be included in the Department’s financial statements if it would be misleading to exclude it even though it does not meet one of the three inclusion principles.” Lastly, SFFAS 47 sets forth guidance on disclosure requirements on Departmental significant relationships with other parties. SFFAS 47 requires disclosures “if one party to an established relationship has the ability to exercise significant influence over the other party in making policy decisions, and the relationship is of such significance that it would be misleading to exclude information about it.”
●● Implement, effective FY 2019, SFFAS 49, Public-Private Partnerships: Disclosure Requirements, which “establishes principles to ensure that disclosures about Public-Private Partnerships (P3s) are presented in the reporting entity’s general purpose federal financial reports (GPFFRs). The principles guide financial reporting by establishing a P3 definition and identifying risk-based characteristics that need to exist before considering the P3 arrangement or transaction for disclosure. SFFAS 49 exempts certain arrangements or transactions from the P3 disclosure requirements contained herein. Such exempt arrangements or transactions are subject to existing disclosure requirements in other SFFASs applicable to such arrangements or transactions.”
GRANTS MANAGEMENT
Under CFO/ASA, the Office of Acquisition Management (OAM) is responsible for the Department’s enterprise-wide grants management policy, projects, and oversight. The Department’s focus is to standardize policy and procedures for its grant and cooperative agreement programs to strengthen compliance. Additionally, OAM is overseeing the modernization of NOAA’s fully automated grants management system, Grants Online, as well as, the migration of all its remaining grant-making units to Grants Online. Targeted efforts by OAM continue to transform the decentralized Department grants management community into an effective and efficient partnership.
OAM’s Grants Management Division (GMD) coordinates the Department’s implementation of all applicable statutes, regulations, Executive Orders, and OMB circulars, as well as the provisions of 2 CFR, Part 200 (Uniform Guidance), to establish more efficient and user-friendly requirements for both Department awarding units and recipients. OAM/GMD collaborates with partners in the Department’s financial assistance community to review and update the Department’s Grants and Cooperative Agreements Manual (Grants Manual) as well as develop updated Financial Assistance Standard Terms and Conditions (STC) consistent with the issued guidance—both the Grants Manual and the STCs undergo annual reviews and updates.
In support of the Department’s focus in standardizing policies and procedures, OAM/GMD tracks the number of expired grants which remain unclosed for more than 180 days. The Department has made significant progress over the past five years, with the total number of unclosed grants in this category dropping from 703 in FY 2013 to 232 by August of 2017. The Department’s timely and successful efforts to reduce unclosed expired grants directly supports the Grants Oversight and New Efficiency (GONE) Act, which was enacted on January 28, 2016 with the goal of improving the timely closeout of federal grant awards to strengthen grants management accountability and oversight.
To strengthen the implementation of Buy America Laws, the President signed Executive Order 13788, entitled “Buy American and Hire American” on April 18, 2017, with the goal of promoting U.S. economic and national security, stimulating economic growth, creating good jobs with decent wages, strengthening our middle class, and supporting the American manufacturing and defense industrial bases. On June 30, 2017, the Secretary of Commerce and the Director of OMB signed a memorandum to implement the Executive Order requiring that federal procurement and federal financial assistance awards maximize the use of goods, products, and materials produced in the United States, including iron, steel, and manufactured goods and OAM/GMD is coordinating this effort with the Department’s grant-making bureaus.
FY 20 17 AGENCY F I NANC IAL REPORT | 19
M A N A G E M E N T ’ S D I S C U S S I O N A N D A N A L Y S I S

Additionally, the Executive Order required the Secretary of Commerce, in consultation with the Secretary of State, the Director of OMB, and the U.S. Trade Representative to submit a report that includes findings from Section 3 (b) and (e) of the Executive Order, and include specific recommendations to strengthen implementation of Buy American Laws, including domestic procurement preference policies and programs. OAM/GMD, in collaboration with OMB’s Office of Federal Financial Management, was assigned the lead in directing a government-wide analysis by all federal agencies to assess compliance with Buy American statutes and regulations for federal financial assistance awards.
HUMAN CAPITAL
The Department of Commerce strives to be a model employer by building and maintaining a highly-skilled and diverse workforce. The Department takes pride in ranking 2nd out of 18 large federal agencies in the 2016 Best Places to Work, the most comprehensive and authoritative rating of employee satisfaction and commitment in the federal government produced by the Partnership for Public Service and American University’s Institute for the Study of Public Policy Implementation. Internships, leadership development programs, technical training opportunities, telework, and succession plans are used by bureaus as vehicles for making progress in the recruitment, development, and retention of a highly-skilled and diverse workforce. Acknowledging that people are the key to mission accomplishment, Departmental leadership continues to implement and evaluate programs to ensure that there is succession planning for future workforce needs, including those in the area of financial management.
In FY 2017, the Department hosted approximately 360 Pathway Program interns, recent graduates, and Presidential Management fellows. Of these, approximately 19 served as accountants, budget analysts, and auditors, including two new hires and 13 who were converted to permanent positions, within finance and accounting offices in the Bureau of Economic Analysis, Census Bureau, International Trade Administration, NIST, NOAA, and the Office of Inspector General. To maintain a highly-skilled workforce, the Department’s retention and succession strategies include the increased use of telework. In FY 2017, approximately 42 percent of Departmental employees (61 percent of accounting and budgeting employees) engaged in telework. Telework is used by the Department to position itself as an “employer of choice” in attracting qualified employees, facilitating employee work/life balance, increasing employee satisfaction and engagement, and potentially increasing employee productivity.
Also in FY 2017, the Department’s Enterprise Services (ES) organization was stood up. ES is transforming the way the Department delivers mission-enabling services by implementing intra-departmental, multi-function enterprise service operations in the areas of Human Resources (HR), Information Technology (IT), Acquisitions, and Financial Management to the Office of the Secretary and the Department’s 12 bureaus. In support of transforming the Department’s HR program, ES migrated approximately 30 thousand employees to HRConnect, resulting in all Department bureaus being on a single, enterprise HR management system platform. ES also transitioned the first set of HR transactional services—Position Action Request (PAR) processing for two servicing HR offices—to its vendor for completion. Lastly, ES commenced providing Contact Center services related to HRConnect and PAR processing. Moving transactional work to ES allows HR professionals to focus on the high value, strategic services important to client bureaus in meeting their mission.
In addition, ES continued to be successful in delivering several critical services in the area of Acquisitions and IT, yielding enterprise-wide benefits and cost savings for the Department. Efforts will continue in FY 2018, and beyond, to transition additional HR services (e.g., Compensation and Benefits, Recruiting and Hiring, etc.) and functions (e.g., Financial Management) to the ES service delivery model. The focus and benefits of ES is on enabling improvements to its customers’ experience, performance management, mission focus, and value.
20 | FY 20 17 AGENCY F I NANC IAL REPORT
M A N A G E M E N T ’ S D I S C U S S I O N A N D A N A L Y S I S
On April 12, 2017, OMB issued memorandum 17-22, Comprehensive Plan for Reforming the Federal Government and Reducing the Federal Civilian Workforce. This OMB memorandum provided agencies guidance on fulfilling the requirements of the Reorganization Executive Order while aligning those initiatives with the federal budget and strategic plan. The Department submitted a proposal for the development of a long-term workforce reduction plan to OMB on September 11, 2017. This proposal included the following items such as using agency data to determine appropriate full-time equivalent baselines, examining the total personnel cost, reviewing and revising organization design and positions structures among other things. There will also be pilot projects that will be implemented to inform the Department-wide long-term workforce planning model. The implementation of this long-term workforce plan is still subject to final OMB approval and will require at least one year to develop a long-term workforce plan.
Furthermore, the U.S. Office of Personnel Management revised 5 CFR 250 subpart b, effective April 11, 2017, which included a new requirement to develop a Human Capital Operating Plan (HCOP), a four-year plan with annual reassessments. This tactical plan will provide processes and measures for the implementation of human capital strategies essential to successfully carryout the Department’s Strategic Plan and Performance Plan. To ensure the HCOP is in alignment with the Department’s Strategic and Performance Plans, Departmental teams leading the development of the three plans have worked together and remained involved throughout the development of each of the plans. The HCOP will include a task to examine talent management, especially the essential occupants required to execute strategies and meet performance measures identified in their respective plans. The initial HCOP is to be completed by November 30, 2017.
RECEIVABLES WITH THE PUBLIC AND DEBT COLLECTION MANAGEMENT
The Department provides policies and procedures for the management and collection of non-tax debts owed to Departmental entities in its debt collection regulations, Commerce Debt Collection. These regulations adopt and incorporate all provisions of the Federal Claims Collections Standards (FCCS), which were jointly published by Treasury and the U.S. Department of Justice. The Department’s debt collection regulations supplement FCCS by prescribing procedures, consistent with FCCS, as necessary and appropriate for Departmental debt collection management operations. FCCS clarifies and simplifies federal debt collection procedures and reflects changes under the Debt Collection Improvement Act of 1996 and the General Accounting Office Act of 1996. The Department also provides guidance for debt collection management in its Credit and Debt Management Operating Standards and Procedures Handbook, to ensure that consistent debt collection management practices are established and followed throughout the Department, and to establish and enhance Departmental debt collection management practices.
Applicable bureaus prepared, in 2014, Credit Management and Debt Collection Plans, which set forth their plans for effectively managing credit extension, account servicing, and debt collection management. These plans are updated at least every five years.
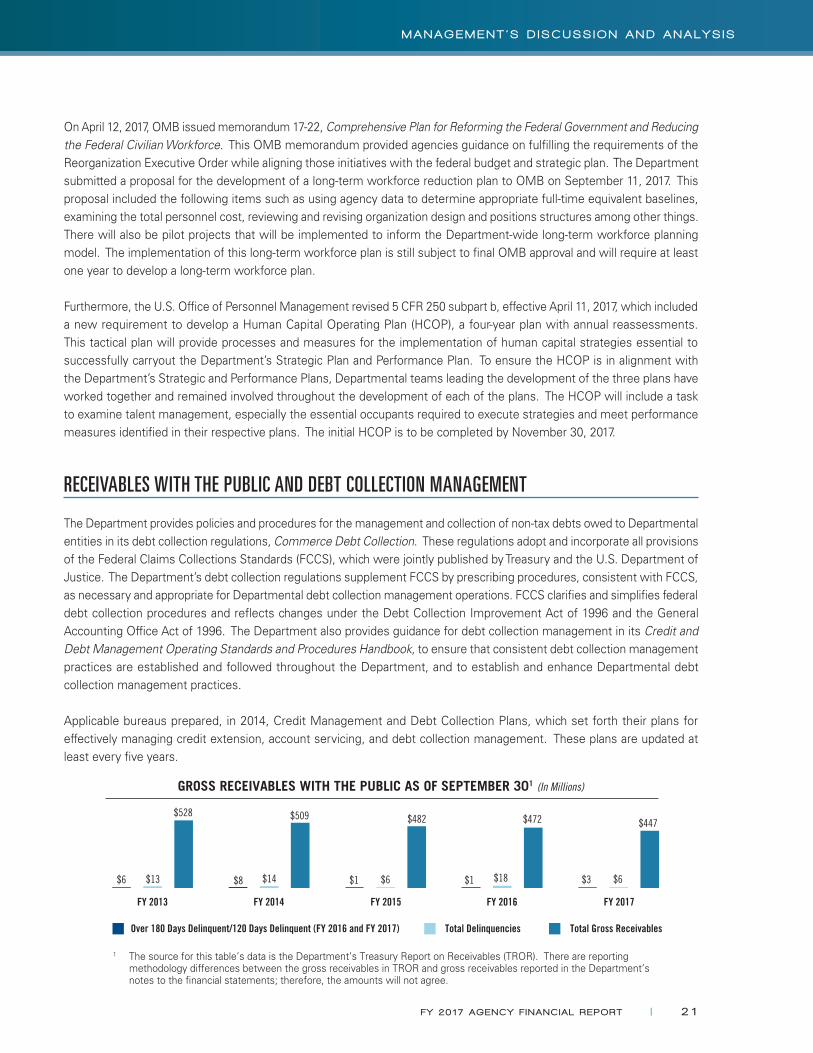
GROSS RECEIVABLES WITH THE PUBLIC AS OF SEPTEMBER 301 (In Millions)
Over 180 Days Delinquent/120 Days Delinquent (FY 2016 and FY 2017) Total Delinquencies Total Gross Receivables
FY 2017
$3 $6
$447
$6
$482
$6 $13
$528
FY 2013 FY 2014 FY 2015
$14
$509
FY 2016
$18
$472
1 The source for this table’s data is the Department’s Treasury Report on Receivables (TROR). There are reporting methodology differences between the gross receivables in TROR and gross receivables reported in the Department’s notes to the �nancial statements; therefore, the amounts will not agree.
$8 $1 $1
FY 20 17 AGENCY F I NANC IAL REPORT | 21
M A N A G E M E N T ’ S D I S C U S S I O N A N D A N A L Y S I S

The DATA Act required, effective FY 2016, that agencies report to Congress any instance in which federal agencies fail to refer legally enforceable, non-tax debts that are greater than 120 days delinquent to the Treasury Offset Program for administrative offset.
The Department’s total gross receivables with the public decreased $25 million, or 5.3 percent, from $472 million as of September 30, 2016 to $447 million as of September 30, 2017, as reported on the Department’s Treasury Report on Receivables, which is the primary means for the Department to provide comprehensive information to Treasury on its receivables with the public. Total delinquencies with the public, as a percentage of total gross receivables with the public, decreased from 3.8 percent as of September 30, 2016 to 1.3 percent as of September 30, 2017. Receivables with the public that were 120 days or more delinquent as a percentage of total gross receivables with the public, increased from 0.3 percent as of September 30, 2016 to 0.7 percent as of September 30, 2017.
Prescreening procedures, account-servicing standards, determined collection of delinquent debt, and extensive referrals of delinquent debt to Treasury have all contributed to effective Departmental debt collection management. The Debt Collection Improvement Act of 1996 established Treasury as the debt collection agency for eligible federal agency debts. Once receivables are delinquent by 120 days (effective FY 2016) or more, in accordance with Treasury requirements, such receivables are referred to Treasury’s Bureau of the Fiscal Service for collection through its Cross-servicing Program and/or its Treasury Offset Program.
PAYMENT PRACTICES
PROMPT PAYMENT
The Prompt Payment Act of 1982 generally requires agencies to pay their bills to vendors on a timely basis (within 30 days of receipt of relevant documents), and to pay interest penalties when payments are made late. The Department closely monitors its prompt payment performance, and the bureaus submit quarterly reports of prompt payment performance to the Deputy CFO.
The Department’s prompt payment performance decreased slightly from 98.8 percent in FY 2016 to 98.7 percent in FY 2017. The number of invoices paid late increased from 3,064 in FY 2016 to 3,534 in FY 2017. The Department continues to focus on improving its prompt payment percentage by working closely with its bureaus to identify opportunities for new or improved business processes. Per OMB Memorandum M-15-19, Improving Government Efficiency and Saving Taxpayer Dollars Through Electronic Invoicing (July 17, 2015), federal agencies are required to transition to electronic invoicing for appropriate federal procurements by the end of FY 2018. The Department is currently exploring options to transition off its primary financial management system used by most of the bureaus and adopt a commercial off-the-shelf (COTS) product for those bureaus. As such, the Department would in large
FY 2014FY 2013 FY 2017
1.3%
TOTAL DELINQUENCIES WITH THE PUBLIC AS A PERCENTAGE OF TOTAL GROSS RECEIVABLES
AS OF SEPTEMBER 30
2.5%
FY 2015
2.8%1.2%
FY 2016
3.8%
TIMELY VENDOR PAYMENTS (Percentage)
Result
Target
FY 2017
98.0%
98.7%
FY 2014FY 2013 FY 2015 FY 2016
98.0%
98.3%
98.0%
98.8%
98.0%
97.4%1
98.0%
98.8%
1 FY 2014 prompt payment performance was lower than all other scal years due to unusual processing delays caused by the October 2013 furlough of nancial management staff.
22 | FY 20 17 AGENCY F I NANC IAL REPORT
M A N A G E M E N T ’ S D I S C U S S I O N A N D A N A L Y S I S
part adopt the COTS product’s solution for an electronic invoice processing system, if available. In 2017, the U.S. Patent and Trademark Office reviewed various electronic invoicing options and made a selection. The solution is planned to be in place by the end of FY 2018.
OMB Memorandum M-17-26, Reducing Burden for Federal Agencies by Rescinding and Modifying OMB Memoranda (June 15, 2017), encourages agencies to accelerate payments, to the best of their ability, to small businesses and prime contractors with small business subcontractors. This did not change an agency’s responsibility to comply with the Prompt Payment Act and OMB’s implementing regulations thereto (5 CFR Part 1315, Prompt Payment).
BANKCARDS
The Department remains committed to the use of bankcards (purchase cards) as a means to improve mission support by streamlining the procurement and payment processes and by reducing administrative costs. Based on the results of FY 2013 testing of purchase card processes under OMB Circular A-123, Appendix A, Internal Control Over Financial Reporting, the Department implemented a pilot data analytic program in FY 2015 that reviews Department-wide purchase and travel card transactions in an effort to identify patterns, trends, and anomalies for possible further investigation. The Department continued to work with the bureaus in implementing corrective actions, monitoring internal controls, performing data analytics, and conducting necessary reviews and testing to ensure proper internal controls are in place during FY 2017. The Department also continues to carry out initiatives which have been implemented in the last few fiscal years, including more effective training, oversight, and risk management reviews in order to enhance the purchase card program. These enhancements have led to, among other things, a steady decrease in the number of purchase cards issued and in use by the Department.
LIMITATIONS OF THE FINANCIAL STATEMENTS
The principle financial statements in the financial section have been prepared to report the overall financial position and results of operations of the Department, pursuant to the requirements of 31 U.S.C. 3515(b). While the statements have been prepared from the books and records of the Department in accordance with the generally accepted accounting principles (GAAP) for federal entities and the formats prescribed in OMB Circular A-136, Financial Reporting Requirements, the statements are in addition to the financial reports used to monitor and control budgetary resources that are prepared from the same books and records.
These financial statements should be read with the realization that they are for a component of the U.S. government, a sovereign entity. One implication of this is that liabilities cannot be liquidated without legislation that provides the resources to do so.
FY 20 17 AGENCY F I NANC IAL REPORT | 23
M A N A G E M E N T ’ S D I S C U S S I O N A N D A N A L Y S I S
ANALYSIS OF FY 2017 FINANCIAL CONDITION AND RESULTS
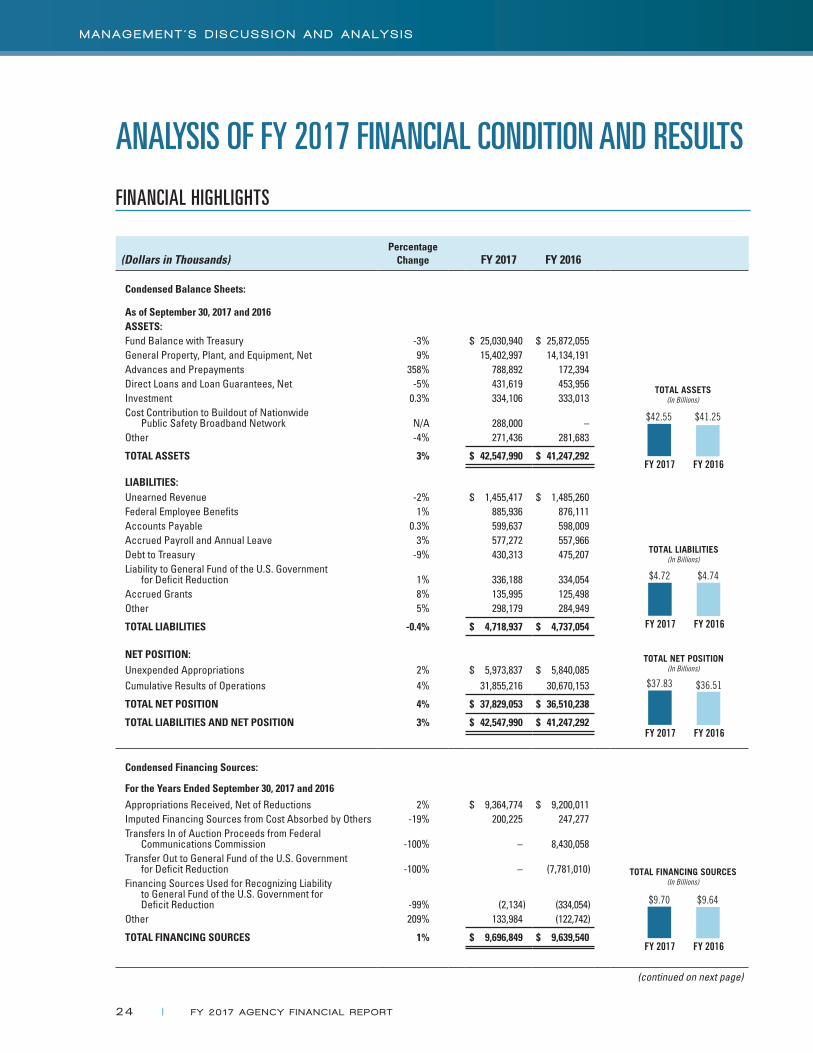
FINANCIAL HIGHLIGHTS
(Dollars in Thousands)Percentage
Change FY 2017 FY 2016
Condensed Balance Sheets:
As of September 30, 2017 and 2016
FY 2017 FY 2016
TOTAL ASSETS(In Billions)
$42.55 $41.25
ASSETS:Fund Balance with Treasury -3% $ 25,030,940 $ 25,872,055General Property, Plant, and Equipment, Net 9% 15,402,997 14,134,191Advances and Prepayments 358% 788,892 172,394Direct Loans and Loan Guarantees, Net -5% 431,619 453,956Investment 0.3% 334,106 333,013Cost Contribution to Buildout of Nationwide
Public Safety Broadband Network N/A 288,000 –Other -4% 271,436 281,683
TOTAL ASSETS 3% $ 42,547,990 $ 41,247,292
LIABILITIES:
FY 2017 FY 2016
TOTAL LIABILITIES(In Billions)
$4.72 $4.74
Unearned Revenue -2% $ 1,455,417 $ 1,485,260Federal Employee Benefits 1% 885,936 876,111Accounts Payable 0.3% 599,637 598,009Accrued Payroll and Annual Leave 3% 577,272 557,966Debt to Treasury -9% 430,313 475,207Liability to General Fund of the U.S. Government
for Deficit Reduction 1% 336,188 334,054Accrued Grants 8% 135,995 125,498Other 5% 298,179 284,949
TOTAL LIABILITIES -0.4% $ 4,718,937 $ 4,737,054
NET POSITION:Unexpended Appropriations 2% $ 5,973,837 $ 5,840,085Cumulative Results of Operations 4% 31,855,216 30,670,153
TOTAL NET POSITION 4% $ 37,829,053 $ 36,510,238
TOTAL LIABILITIES AND NET POSITION 3% $ 42,547,990 $ 41,247,292
Condensed Financing Sources:
For the Years Ended September 30, 2017 and 2016
FY 2017 FY 2016
TOTAL FINANCING SOURCES(In Billions)
$9.70 $9.64
Appropriations Received, Net of Reductions 2% $ 9,364,774 $ 9,200,011Imputed Financing Sources from Cost Absorbed by Others -19% 200,225 247,277Transfers In of Auction Proceeds from Federal
Communications Commission -100% – 8,430,058 Transfer Out to General Fund of the U.S. Government
for Deficit Reduction -100% – (7,781,010)Financing Sources Used for Recognizing Liability
to General Fund of the U.S. Government for Deficit Reduction -99% (2,134) (334,054)
Other 209% 133,984 (122,742)
TOTAL FINANCING SOURCES 1% $ 9,696,849 $ 9,639,540
(continued on next page)
FY 2017 FY 2016
TOTAL NET POSITION(In Billions)
$37.83 $36.51
24 | FY 20 17 AGENCY F I NANC IAL REPORT
M A N A G E M E N T ’ S D I S C U S S I O N A N D A N A L Y S I S

(continued from previous page)
(Dollars in Thousands)Percentage
Change FY 2017 FY 2016
Condensed Statements of Net Cost:
For the Years Ended September 30, 2017 and 2016
Condensed Statements of Net Cost:
Gross Departmental Costs 2% $ 12,413,842 $ 12,164,110Less: Earned Revenue 0.0% (4,035,808) (4,033,926)
NET COST OF OPERATIONS 3% $ 8,378,034 $ 8,130,184
Selected Budgetary Information:
For the Years Ended September 30, 2017 and 2016
New Obligations and Upward Adjustments 3% $ 15,970,699 $ 15,459,852 FY 2017 FY 2016
NEW OBLIGATIONS AND UPWARD ADJUSTMENTS
(In Billions)
$15.97 $15.46
Outlays, Gross 3% $ 15,323,401 $ 14,853,358 FY 2017 FY 2016
OUTLAYS, GROSS(In Billions)
$15.32 $14.85
COMPOSITION OF ASSETS AND ASSETS BY RESPONSIBILITY SEGMENT
The composition (by percentage) and distribution (by responsibility segment) of the Department’s assets remained consistent from September 30, 2016 to September 30, 2017.
Departmental assets amounted to $42.55 billion, as of September 30, 2017. Fund Balance with the U.S. Department of the Treasury (Treasury) of $25.03 billion is the aggregate amount of funds available to make authorized expenditures and pay liabilities. General Property, Plant, and Equipment (PP&E), Net of Accumulated Depreciation, of $15.40 billion, includes $5.69 billion of Construction-in-progress, primarily of satellites and weather measuring and monitoring systems; $1.54 billion of Structures, Facilities, and Leasehold Improvements; $6.64 billion of Satellites/Weather Systems Personal Property; and $1.54 billion of other General PP&E. Advances and Prepayments of $788.9 million is primarily comprised of $672.0 million related to the NTIA Network Construction Fund. Direct Loans and Loan Guarantees, Net of Allowances for Subsidy Cost (Present Value) and Loan Losses, of $431.6 million, primarily relates to the NOAA direct loan programs. Investment of $334.1 million represents NTIA Public Safety Trust Fund’s investment in federal securities, consisting of an interest-bearing, market based Treasury note purchased from Treasury. Cost Contribution to Buildout of Nationwide Public Safety Broadband Network (NPSBN) of $288.0 million is a new asset, as of September 30, 2017, that captures NTIA’s cumulative cost contributions for the buildout of the NPSBN. Other Assets of $271.4 million primarily includes Accounts Receivable, Net of Allowance for Uncollectible Accounts, of $146.9 million; and Inventory, Materials, and Supplies, Net of Allowance for Excess, Obsolete, and Unserviceable Items, of $108.1 million.
NET COST OF OPERATIONS(In Billions)
FY 2017 FY 2016
$8.38 $8.13
FY 20 17 AGENCY F I NANC IAL REPORT | 25
M A N A G E M E N T ’ S D I S C U S S I O N A N D A N A L Y S I S

COMPOSITION OF THE DEPARTMENT’S ASSETS AS OF SEPTEMBER 30, 2017
ASSETS BY RESPONSIBILITY SEGMENTAS OF SEPTEMBER 30, 2017
NTIA38%
NOAA45%USPTO
7%
EDA2%
Others31%
Fund Balancewith Treasury
58%
General Property,Plant, and
Equipment, Net
36%
Direct Loansand Loan
Guarantees, Net
1%
Other1%
NIST5%
2
ESA2%
1
1 Economics and Statistics Administration (ESA) includes ESA, the Bureau of Economic Analysis (BEA), and the Census Bureau.
2 NIST includes NIST and the National Technical Information Service (NTIS).3 Others includes Departmental Management (DM), the Bureau
of Industry and Security (BIS), the International Trade Administration (ITA), and the Minority Business Development Agency (MBDA).
Investment1%
Advances andPrepayments
2%
Cost Contributionto Buildout of National Public
Safety BroadbandNetwork
1%
TRENDS IN ASSETS
Departmental assets increased $1.30 billion, or 3 percent, from $41.25 billion, as of September 30, 2016, to $42.55 billion, as of September 30, 2017. Fund Balance with Treasury decreased $841.1 million, or 3 percent, from $25.87 billion to $25.03 billion. General PP&E, Net increased $1.27 billion, or 9 percent, from $14.13 billion to 15.40 billion, primarily due to (a) an increase in Satellites/Weather Systems Personal Property of $5.18 billion, in large part due to capitalization of the Geostationary Operational Environmental Satellites (GOES) 16 satellite and ground system, and capitalization of the Joint Polar Satellite System (JPSS); and (b) a decrease of $4.05 billion in Construction-in-progress, primarily due to the capitalization of the GOES 16 satellite and ground system, and the capitalization of the JPSS ground system Block 2.0. Advances and Prepayments increased $616.5 million, or 358 percent, from $172.4 million to $788.9 million, primarily due to NTIA’s Network Construction Fund having an advance of $672.0 million, as of September 30, 2017, to the U.S. Department of the Interior (DOI) for the advance funding of certain task orders to buildout, operate, and maintain NPSBN, whereas there was no such balance, as of September 30, 2016. Cost Contribution to Buildout of NPSBN is a new asset, as of September 30, 2017, as previously discussed.
FY 2017FY 2014FY 2013 FY 2015 FY 2016
$42.55$39.46
$33.42$30.04
$41.25
TRENDS IN TOTAL ASSETS AS OF SEPTEMBER 30 (In Billions)
26 | FY 20 17 AGENCY F I NANC IAL REPORT
M A N A G E M E N T ’ S D I S C U S S I O N A N D A N A L Y S I S
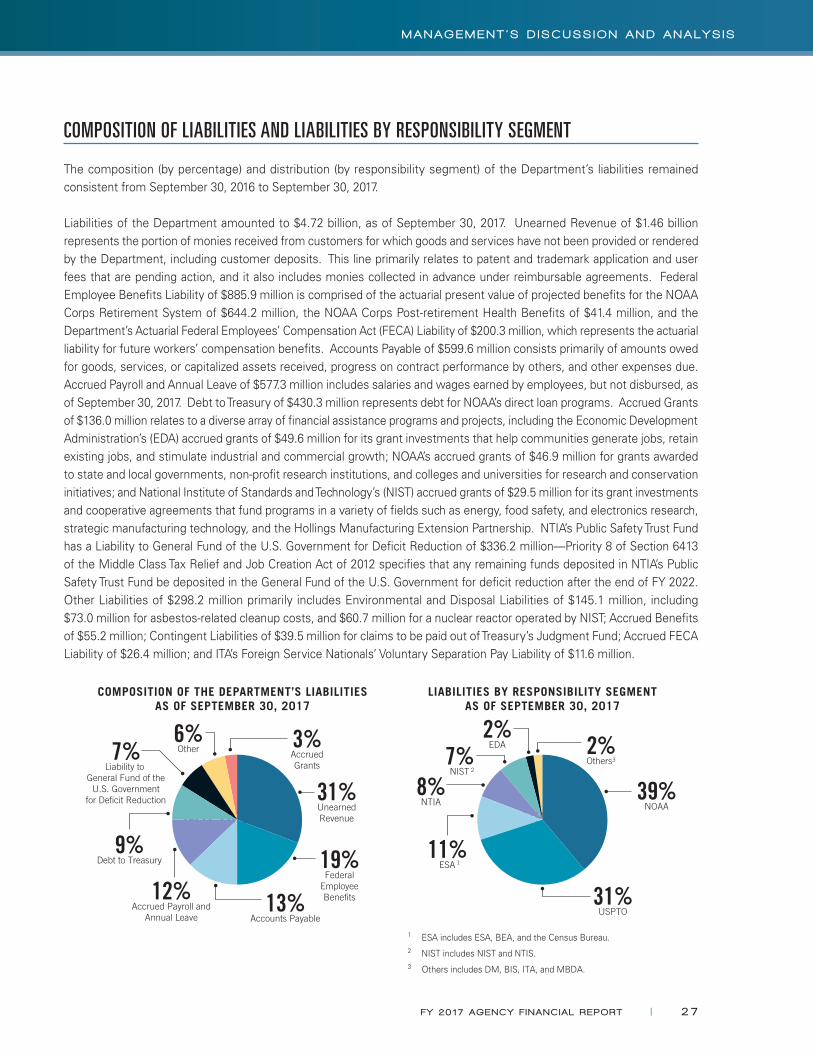
COMPOSITION OF LIABILITIES AND LIABILITIES BY RESPONSIBILITY SEGMENT
The composition (by percentage) and distribution (by responsibility segment) of the Department’s liabilities remained consistent from September 30, 2016 to September 30, 2017.
Liabilities of the Department amounted to $4.72 billion, as of September 30, 2017. Unearned Revenue of $1.46 billion represents the portion of monies received from customers for which goods and services have not been provided or rendered by the Department, including customer deposits. This line primarily relates to patent and trademark application and user fees that are pending action, and it also includes monies collected in advance under reimbursable agreements. Federal Employee Benefits Liability of $885.9 million is comprised of the actuarial present value of projected benefits for the NOAA Corps Retirement System of $644.2 million, the NOAA Corps Post-retirement Health Benefits of $41.4 million, and the Department’s Actuarial Federal Employees’ Compensation Act (FECA) Liability of $200.3 million, which represents the actuarial liability for future workers’ compensation benefits. Accounts Payable of $599.6 million consists primarily of amounts owed for goods, services, or capitalized assets received, progress on contract performance by others, and other expenses due. Accrued Payroll and Annual Leave of $577.3 million includes salaries and wages earned by employees, but not disbursed, as of September 30, 2017. Debt to Treasury of $430.3 million represents debt for NOAA’s direct loan programs. Accrued Grants of $136.0 million relates to a diverse array of financial assistance programs and projects, including the Economic Development Administration’s (EDA) accrued grants of $49.6 million for its grant investments that help communities generate jobs, retain existing jobs, and stimulate industrial and commercial growth; NOAA’s accrued grants of $46.9 million for grants awarded to state and local governments, non-profit research institutions, and colleges and universities for research and conservation initiatives; and National Institute of Standards and Technology’s (NIST) accrued grants of $29.5 million for its grant investments and cooperative agreements that fund programs in a variety of fields such as energy, food safety, and electronics research, strategic manufacturing technology, and the Hollings Manufacturing Extension Partnership. NTIA’s Public Safety Trust Fund has a Liability to General Fund of the U.S. Government for Deficit Reduction of $336.2 million—Priority 8 of Section 6413 of the Middle Class Tax Relief and Job Creation Act of 2012 specifies that any remaining funds deposited in NTIA’s Public Safety Trust Fund be deposited in the General Fund of the U.S. Government for deficit reduction after the end of FY 2022. Other Liabilities of $298.2 million primarily includes Environmental and Disposal Liabilities of $145.1 million, including $73.0 million for asbestos-related cleanup costs, and $60.7 million for a nuclear reactor operated by NIST; Accrued Benefits of $55.2 million; Contingent Liabilities of $39.5 million for claims to be paid out of Treasury’s Judgment Fund; Accrued FECA Liability of $26.4 million; and ITA’s Foreign Service Nationals’ Voluntary Separation Pay Liability of $11.6 million.
NOT UPDATEDNOT UPDATED
COMPOSITION OF THE DEPARTMENT’S LIABILITIES AS OF SEPTEMBER 30, 2017
LIABILITIES BY RESPONSIBILITY SEGMENTAS OF SEPTEMBER 30, 2017
UnearnedRevenue
31%
FederalEmployeeBene�ts
19%
Accounts Payable13%Accrued Payroll and
Annual Leave
12%Debt to Treasury
9%
Other6%
NOAA39%
USPTO31%
EDA2%
NTIA8%
Others32%
Liability to General Fund of the
U.S. Governmentfor De�cit Reduction
7% AccruedGrants
3%NIST7%
2
ESA11%
1
1 ESA includes ESA, BEA, and the Census Bureau.2 NIST includes NIST and NTIS.3 Others includes DM, BIS, ITA, and MBDA.
FY 20 17 AGENCY F I NANC IAL REPORT | 27
M A N A G E M E N T ’ S D I S C U S S I O N A N D A N A L Y S I S

TRENDS IN LIABILITIES
Liabilities of the Department decreased $18.1 million, or 0.4 percent, from $4.74 billion, as of September 30, 2016 to $4.72 billion, as of September 30, 2017. Debt to Treasury decreased $44.9 million, or 9 percent, from $475.2 million to $430.3 million, primarily due to repayments made to Treasury in September 2017 by NOAA’s Fisheries Finance direct loan program. Accrued Grants increased by $10.5 million, or 8 percent, from $125.5 million to $136.0 million, mainly due to increases in NTIA First Responder Network Authority’s Spectrum Relocation Grant Program, which started expending funds in FY 2017, and increases in NTIA’s State and Local Implementation Fund, as grantees have not expended funds as quickly as anticipated.
COMPOSITION OF AND TRENDS IN FINANCING SOURCES
The composition by percentage of the Department’s financing sources, as reported in the Department’s Consolidated Statements of Changes in Net Position, changed somewhat from FY 2016 to FY 2017. For FY 2017, there were not any NTIA Public Safety Trust Fund transfers in of auction proceeds from the Federal Communications Commission, as compared to $8.43 billion in FY 2016; and for FY 2017, there were not any NTIA Public Safety Trust Fund transfers out to General Fund of the U.S. Government for deficit reduction, as compared to $7.78 billion in FY 2016.
Total financing sources of the Department increased $57.3 million, or 1 percent, from $9.64 billion in FY 2016 to $9.70 billion in FY 2017. Appropriations Received, Net of Reductions increased $164.8 million, or 2 percent, from $9.20 billion in FY 2016 to $9.36 billion in FY 2017. Imputed Financing Sources from Cost Absorbed by Others decreased $47.1 million, or 19 percent, from $247.3 million to $200.2 million, primarily due to (a) a revision in cost factor(s) for USPTO imputed
FY 2017FY 2014FY 2013 FY 2015 FY 2016
$9.70
$15.21
$10.12$8.21
$9.64
TRENDS IN TOTAL FINANCING SOURCES (In Billions)
$4.72$4.46
$4.77
$5.70
$4.74
FY 2017FY 2014FY 2013 FY 2015 FY 2016
TRENDS IN TOTAL LIABILITIES AS OF SEPTEMBER 30 (In Billions)
ESA117%
NIST210%
1%
NOAA62%
Others37%
1 ESA includes ESA, BEA, and the Census Bureau.2 NIST includes NIST and NTIS.3 Others includes BIS, ITA, MBDA, NTIA, and USPTO.
EDA3% Departmental
Management
FY 2017 FINANCING SOURCESBY RESPONSIBILITY SEGMENT
AppropriationsReceived, Netof Reductions
97%
Imputed Financing Sources from Cost Absorbed
by Others
2%Other1%
COMPOSITION OF THE DEPARTMENT’S FY 2017 FINANCING SOURCES
28 | FY 20 17 AGENCY F I NANC IAL REPORT
M A N A G E M E N T ’ S D I S C U S S I O N A N D A N A L Y S I S

post-employment benefit costs; and (b) a decrease in Departmental Management (DM) imputed costs related to Treasury’s Judgment Fund. Financing Sources Used for Recognizing Liability to General Fund of the U.S. Government for Deficit Reduction decreased $331.9 million, or 99 percent, from $(334.1) million to $(2.1) million, because in FY 2017 there was only a slight increase in excess funds (Priority 8) over the fund priorities 1 through 7, per the originating Public Law 112-96.
Other Financing Sources increased by $256.7 million, or 209 percent, from $(122.7) million in FY 2016 to $134.0 million in FY 2017, primarily due to (a) a decrease in cancellations of funds from FY 2016 to FY 2017 for Census Bureau’s Periodic Censuses and Programs fund group of $78.9 million; (b) the Department’s transfers out in FY 2016 include NOAA transfer(s) out of Construction-in-progress costs of $78.5 million related to the Solar Irradiance, Data and Rescue/Total Solar Irradiance to the National Aeronautics and Space Administration, whereas there was no similar transfer(s) out in FY 2017; and (c) the Department’s transfers out in FY 2016 included NTIA Public Safety Trust Fund transfer(s) out to the National Highway Traffic Safety Administration (NHTSA) of $104.4 million for Priority 6, which is for the Administrator of NHTSA to carry out NHTSA’s portion of the grant program of Next Generation 9-1-1, whereas in FY 2017, only $7.8 million was transferred to NHTSA for Priority 6 to fully complete this priority.
COMPOSITION OF FY 2017 NET COST OF OPERATIONS AND NET COST OF OPERATIONS BY RESPONSIBILITY SEGMENT
In FY 2017, the Department’s Net Cost of Operations amounted to $8.38 billion, which consists of Gross Costs of $12.41 billion, less Earned Revenue of $4.04 billion.
The distribution (by responsibility segment) of the Department’s Net Cost of Operations remained consistent from FY 2016 to FY 2017.
Note: The Gross Costs and Earned Revenue amounts presented in the following paragraphs include transactions with other Departmental entities (intra-Departmental transactions). As a result, the Gross Costs amounts discussed below may not agree with the Gross Costs presented on the Department’s FY 2017 Consolidated Statement of Net Cost, which excludes intra-Departmental transactions.
NOAA’s FY 2017 Net Cost of Operations was $4.62 billion (Gross Costs of $4.88 billion less Earned Revenue of $252.7 million). NOAA’s mission relates to science, service, and stewardship—to understand and predict changes in climate, weather, oceans, and coasts; to share that knowledge and information with others; and to conserve and manage coastal and marine ecosystems and resources. NOAA’s Gross Costs include costs related to improving weather, water quality, and climate reporting and forecasting; and enabling informed decision-making through an expanded understanding of the U.S. economy, society, and environment by providing data, standards, and services. NOAA
FY 2017 NET COST OF OPERATIONS BY RESPONSIBILITY SEGMENT
USPTO1%
ESA117%
NIST212%
NTIA3%Others3
3%
NOAA55%
ITA6%
1 ESA includes ESA, BEA, and the Census Bureau.2 NIST includes NIST and NTIS.3 Others includes DM, BIS, and MBDA.
EDA3%
TRENDS IN LIABILITIES
Liabilities of the Department decreased $18.1 million, or 0.4 percent, from $4.74 billion, as of September 30, 2016 to $4.72 billion, as of September 30, 2017. Debt to Treasury decreased $44.9 million, or 9 percent, from $475.2 million to $430.3 million, primarily due to repayments made to Treasury in September 2017 by NOAA’s Fisheries Finance direct loan program. Accrued Grants increased by $10.5 million, or 8 percent, from $125.5 million to $136.0 million, mainly due to increases in NTIA First Responder Network Authority’s Spectrum Relocation Grant Program, which started expending funds in FY 2017, and increases in NTIA’s State and Local Implementation Fund, as grantees have not expended funds as quickly as anticipated.
COMPOSITION OF AND TRENDS IN FINANCING SOURCES
The composition by percentage of the Department’s financing sources, as reported in the Department’s Consolidated Statements of Changes in Net Position, changed somewhat from FY 2016 to FY 2017. For FY 2017, there were not any NTIA Public Safety Trust Fund transfers in of auction proceeds from the Federal Communications Commission, as compared to $8.43 billion in FY 2016; and for FY 2017, there were not any NTIA Public Safety Trust Fund transfers out to General Fund of the U.S. Government for deficit reduction, as compared to $7.78 billion in FY 2016.
Total financing sources of the Department increased $57.3 million, or 1 percent, from $9.64 billion in FY 2016 to $9.70 billion in FY 2017. Appropriations Received, Net of Reductions increased $164.8 million, or 2 percent, from $9.20 billion in FY 2016 to $9.36 billion in FY 2017. Imputed Financing Sources from Cost Absorbed by Others decreased $47.1 million, or 19 percent, from $247.3 million to $200.2 million, primarily due to (a) a revision in cost factor(s) for USPTO imputed
FY 2017FY 2014FY 2013 FY 2015 FY 2016
$9.70
$15.21
$10.12$8.21
$9.64
TRENDS IN TOTAL FINANCING SOURCES (In Billions)
FY 20 17 AGENCY F I NANC IAL REPORT | 29
M A N A G E M E N T ’ S D I S C U S S I O N A N D A N A L Y S I S
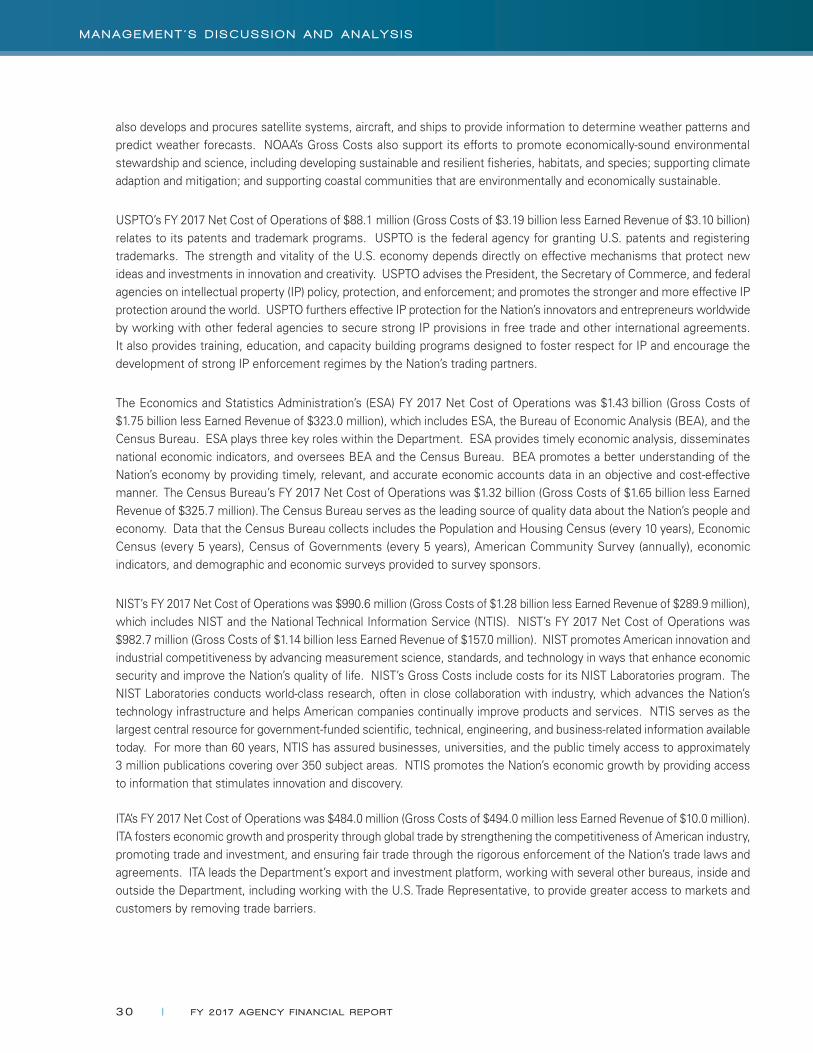
also develops and procures satellite systems, aircraft, and ships to provide information to determine weather patterns and predict weather forecasts. NOAA’s Gross Costs also support its efforts to promote economically-sound environmental stewardship and science, including developing sustainable and resilient fisheries, habitats, and species; supporting climate adaption and mitigation; and supporting coastal communities that are environmentally and economically sustainable.
USPTO’s FY 2017 Net Cost of Operations of $88.1 million (Gross Costs of $3.19 billion less Earned Revenue of $3.10 billion) relates to its patents and trademark programs. USPTO is the federal agency for granting U.S. patents and registering trademarks. The strength and vitality of the U.S. economy depends directly on effective mechanisms that protect new ideas and investments in innovation and creativity. USPTO advises the President, the Secretary of Commerce, and federal agencies on intellectual property (IP) policy, protection, and enforcement; and promotes the stronger and more effective IP protection around the world. USPTO furthers effective IP protection for the Nation’s innovators and entrepreneurs worldwide by working with other federal agencies to secure strong IP provisions in free trade and other international agreements. It also provides training, education, and capacity building programs designed to foster respect for IP and encourage the development of strong IP enforcement regimes by the Nation’s trading partners.
The Economics and Statistics Administration’s (ESA) FY 2017 Net Cost of Operations was $1.43 billion (Gross Costs of $1.75 billion less Earned Revenue of $323.0 million), which includes ESA, the Bureau of Economic Analysis (BEA), and the Census Bureau. ESA plays three key roles within the Department. ESA provides timely economic analysis, disseminates national economic indicators, and oversees BEA and the Census Bureau. BEA promotes a better understanding of the Nation’s economy by providing timely, relevant, and accurate economic accounts data in an objective and cost-effective manner. The Census Bureau’s FY 2017 Net Cost of Operations was $1.32 billion (Gross Costs of $1.65 billion less Earned Revenue of $325.7 million). The Census Bureau serves as the leading source of quality data about the Nation’s people and economy. Data that the Census Bureau collects includes the Population and Housing Census (every 10 years), Economic Census (every 5 years), Census of Governments (every 5 years), American Community Survey (annually), economic indicators, and demographic and economic surveys provided to survey sponsors.
NIST’s FY 2017 Net Cost of Operations was $990.6 million (Gross Costs of $1.28 billion less Earned Revenue of $289.9 million), which includes NIST and the National Technical Information Service (NTIS). NIST’s FY 2017 Net Cost of Operations was $982.7 million (Gross Costs of $1.14 billion less Earned Revenue of $157.0 million). NIST promotes American innovation and industrial competitiveness by advancing measurement science, standards, and technology in ways that enhance economic security and improve the Nation’s quality of life. NIST’s Gross Costs include costs for its NIST Laboratories program. The NIST Laboratories conducts world-class research, often in close collaboration with industry, which advances the Nation’s technology infrastructure and helps American companies continually improve products and services. NTIS serves as the largest central resource for government-funded scientific, technical, engineering, and business-related information available today. For more than 60 years, NTIS has assured businesses, universities, and the public timely access to approximately 3 million publications covering over 350 subject areas. NTIS promotes the Nation’s economic growth by providing access to information that stimulates innovation and discovery.
ITA’s FY 2017 Net Cost of Operations was $484.0 million (Gross Costs of $494.0 million less Earned Revenue of $10.0 million). ITA fosters economic growth and prosperity through global trade by strengthening the competitiveness of American industry, promoting trade and investment, and ensuring fair trade through the rigorous enforcement of the Nation’s trade laws and agreements. ITA leads the Department’s export and investment platform, working with several other bureaus, inside and outside the Department, including working with the U.S. Trade Representative, to provide greater access to markets and customers by removing trade barriers.
30 | FY 20 17 AGENCY F I NANC IAL REPORT
M A N A G E M E N T ’ S D I S C U S S I O N A N D A N A L Y S I S

EDA’s FY 2017 Net Cost of Operations was $285.7 million (Gross Costs of $291.4 million less Earned Revenue of $5.7 million). EDA leads the federal economic development agenda by promoting innovation and competitiveness, preparing American regions for growth and success in the worldwide economy. EDA plays a critical role in fostering regional economic development efforts in communities across the United States. Through strategic investments that foster job creation and attract private investment, EDA supports development in economically distressed areas of the United States. EDA works directly with local economic development officials to make grant investments that are well-defined, timely, and linked to a long-term, sustainable economic development strategy.
NTIA’s FY 2017 Net Cost of Operations was $222.1 million (Gross Costs of $261.2 million less Earned Revenue of $39.1 million). NTIA is the federal agency that is principally responsible for advising the President on telecommunications and information policy issues. NTIA’s programs and policymaking focus largely on expanding broadband Internet access and adoption in America, expanding the use of spectrum by all users, and ensuring that the Internet remains an engine for continued innovation and economic growth. NTIA’s activities include managing the federal use of spectrum and identifying additional spectrum for commercial use, and administering grant programs that further the deployment and use of broadband and other technologies in America.
FY 2017 Net Cost of Operations for DM was $108.6 million (Gross Costs of $117.1 million less Earned Revenue of $8.4 million), which includes Gifts and Bequests, Herbert C. Hoover Building Renovation Project, Office of Inspector General, Salaries and Expenses, and Working Capital Fund. DM’s objective is to develop and provide policies and procedures for administrative planning, oversight, coordination, direction, and guidance to ensure implementation of the Department’s mission.
FY 2017 Net Cost of Operations for the other Departmental bureaus was $146.3 million (Gross Costs of $148.8 million less Earned Revenue of $2.5 million), which is comprised of the Bureau of Industry and Security (BIS) and the Minority Business Development Agency (MBDA). BIS advances the Nation’s national security, foreign policy, and economic objectives by ensuring an effective export control and treaty compliance system and promoting continued strategic technology leadership by the United States. MBDA helps to create and sustain American jobs by promoting the growth and global competitiveness of businesses owned and operated by minority entrepreneurs.
TRENDS IN NET COST OF OPERATIONS
The Department’s Net Cost of Operations increased by $247.9 million, or 3 percent, from $8.13 billion in FY 2016 to $8.38 billion in FY 2017. Gross Costs increased slightly by $249.7 million, or 2 percent, from $12.16 billion in FY 2016 to 12.41 billion in FY 2017. Earned Revenue increased slightly by $1.9 million, or 0.0 percent, from $4.03 billion in FY 2016 to $4.04 billion in FY 2017.
Earned Revenue Net Cost of Operations Gross Costs
FY 2017FY 2014FY 2013 FY 2015 FY 2016
$8.38$7.93$7.67$8.49 $8.13
TRENDS IN NET COST OF OPERATIONS (In Billions)
$4.04$4.02$3.80$3.57 $4.03
$12.41$11.95$11.47$12.06 $12.16
FY 20 17 AGENCY F I NANC IAL REPORT | 31
M A N A G E M E N T ’ S D I S C U S S I O N A N D A N A L Y S I S
SELECTED BUDGETARY INFORMATION BY RESPONSIBILITY SEGMENT
The distribution (by responsibility segment) of the Department’s Obligations Incurred, and Outlays, Gross, as reported in the Department’s Combined Statements of Budgetary Resources, remained consistent from FY 2016 to FY 2017.
FY 2017 OBLIGATIONS INCURREDBY RESPONSIBILITY SEGMENT
FY 2017 OUTLAYS, GROSSBY RESPONSIBILITY SEGMENT
NOAA40%
USPTO20%
NIST28%
NTIA7%
ESA116%
Others33%
NOAA38%
USPTO21%
NIST28%
ESA116%
Others33%
NTIA8%
ITA3%
1 ESA includes ESA, BEA, and the Census Bureau.2 NIST includes NIST and NTIS.3 Others includes BIS, EDA, and MBDA.
ITA3% Departmental
Management3% DepartmentalManagement3%
TRENDS IN SELECTED BUDGETARY INFORMATION
The Department’s New Obligations and Upward Adjustments increased by $510.8 million, or 3 percent, from $15.46 billion in FY 2016 to $15.97 billion in FY 2017, and the Department’s Outlays, Gross increased by $470.0 million, or 3 percent, from $14.85 billion in FY 2016 to $15.32 billion in FY 2017.
New Obligations and Upward Adjustments Outlays, Gross
FY 2017FY 2014FY 2013 FY 2015 FY 2016
$15.97
$20.81
$13.36$13.78$15.46
TRENDS IN SELECTED BUDGETARY INFORMATION (In Billions)
$15.32
$20.47
$12.91$12.35$14.85
32 | FY 20 17 AGENCY F I NANC IAL REPORT
M A N A G E M E N T ’ S D I S C U S S I O N A N D A N A L Y S I S
SUMMARY OF STEWARDSHIP INFORMATION
STEWARDSHIP ASSETS
The Department has certain resources entrusted to it and certain stewardship responsibilities it assumes. The physical properties of Stewardship Assets resemble those of the General Property, Plant, and Equipment that is capitalized traditionally in the financial statements of federal entities. Given the nature of these assets, federal standard-setting
bodies have determined that valuation is unduly burdensome and matching costs with specific periods is not meaningful. Therefore, federal accounting standards require the disclosure of the nature and quantity of these assets. The National Oceanic and Atmospheric Administration (NOAA) is the primary bureau within the Department that maintains Stewardship Assets, while the National Institute of Standards and Technology (NIST) and the Census Bureau also maintains Stewardship Assets.
NOAA maintains the following Stewardship Assets: Heritage Assets (Galveston Laboratory; National Marine Fisheries Service (NMFS) St. George Sealing Plant; NMFS Cottage M, St. George; NMFS St. Paul Old Clinic/Hospital; NMFS Woods Hole Science Aquarium; and Great Lakes Environmental Research Laboratory, Lake Michigan Field Station); 13 National Marine Sanctuaries; 5 Marine National Monuments (Marianas Trench, Pacific Remote Islands, Rose Atoll, Papahãnaumokuãkea, and the Northeast Canyons and Seamounts); Aleutian Islands Habitat Conservation Area; NOAA Habitat Blueprint (10 Habitat Focus Areas); and Collection-type Heritage Assets, primarily included in the NOAA Central Library (mainly books, journals, publications, photographs, and motion pictures) and Thunder Bay Sanctuary Research Collection (data cards, photograph negatives, document copies, photographs, books, and other items).
NIST maintains Collection-type Heritage Assets under its Museum and History Program, which collects, preserves, and exhibits artifacts, such as scientific instruments, equipment, objects, and records of significance to NIST and predecessor agencies. The Census Bureau maintains Collection-type Heritage Assets that help illustrate the social, educational, and cultural heritage of the Census Bureau, including artifacts, artwork, books, films, instruments, records, publications, manuscripts, photographs, and maps.
STEWARDSHIP INVESTMENTS
Stewardship investments are substantial investments made by the federal government for the benefit of the Nation, but are not physical assets owned by the federal government. Though treated as expenses when incurred to determine the Department’s Net Cost of Operations, these items merit special treatment, so that users of federal financial reports know the extent of investments that are made for the long-term benefit of the Nation.
Investments in Non-federal Physical Property: These investments are for the purchase, construction, or major renovation of physical property owned by state and local governments. The Economic Development Administration (EDA) and NOAA have significant investments in non-federal physical property. EDA’s investments in FY 2017 totaled $165.6 million and included its Public Works program ($121.3 million), Disaster Recovery ($7.7 million), Economic Adjustment Assistance program ($16.3 million), and Assistance to Coal Communities ($20.3 million). NOAA’s investments in FY 2017 totaled $1.2 million for the National Estuarine Research Reserves.
FY 20 17 AGENCY F I NANC IAL REPORT | 33
M A N A G E M E N T ’ S D I S C U S S I O N A N D A N A L Y S I S
Investments in Human Capital: These investments are for education and training programs that are intended to increase or maintain national economic productive capacity and produce outputs and outcomes that provide evidence of the constant or increasing national productive capacity. These investments exclude education and training expenses for federal civilian and military personnel. The most significant investments in human capital are by NOAA, whose investments in FY 2017 totaled $22.6 million and included the Educational Partnership Program ($14.1 million), Ernest F. Hollings Undergraduate Scholarship Program ($5.7 million), National Sea Grant College Program ($1.1 million), National Estuarine Research Reserve Program ($1.5 million), and Other Programs ($0.2 million).
Investments in Research and Development (R&D): These investments include investments in basic research, applied research, and development, which are made with the expectation of maintaining or increasing national economic productive capacity, or yielding other future economic or societal benefits. The significant investments in R&D are by NIST and NOAA. NIST’s R&D investments (basic, applied, and development) in FY 2017 totaled $764.5 million and included $734.2 million for its NIST Laboratories Program, $8.6 million for its Manufacturing USA, Advanced Manufacturing Technology Consortia, and Technology Innovation Program, and $21.7 million for its Public Safety Communications Research Program. NOAA’s R&D investments (applied and development) in FY 2017 totaled $625.0 million, which included Environmental and Climate ($452.5 million), Fisheries ($57.7 million), Marine Operations and Maintenance and Aircraft Services ($26.0 million), Weather Service ($20.7 million), and Other ($68.1 million).
34 | FY 20 17 AGENCY F I NANC IAL REPORT
M A N A G E M E N T ’ S D I S C U S S I O N A N D A N A L Y S I S

Financial Section

MESSAGE FROM THE CHIEF FINANCIAL OFFICER (Unaudited)
T his FY 2017 Agency Financial Report provides financial and high-level program performance information to enable the
Department’s stakeholders to understand and evaluate the Department’s achievements relative to its mission and
resources. The Department is committed to operational excellence, with a focus on providing outstanding service to
our customers. This includes providing the public with highlights of our performance, and detailed financial information. This
report also fulfills several statutory requirements, including the Reports Consolidation Act of 2000, the Chief Financial Officers
Act, the Federal Managers’ Financial Integrity Act (FMFIA), and the Government Management Reform Act.
For FY 2017, the Department achieved an unmodified audit opinion for the nineteenth consecutive year. The Department
received one material weakness relating to the implementation of controls over the identification, and subsequent capitalization
of internal use software within one bureau. Additionally, there is one significant deficiency relating to Department-wide
information technology (IT) general controls around access, security, and configuration management. We will continue to
take corrective actions to strengthen controls in these areas in FY 2018.
The Department will continue enhancing financial and non-financial controls under FMFIA and Office of Management and
Budget (OMB) Circular A-123. The Department has provided reasonable assurance that its internal controls and financial
management systems meet the objectives of FMFIA and OMB Circular A-123 and are operating effectively with no identified
material weaknesses.
The Department’s leadership continues its commitment to improving the capacity to deliver our mission with customer
focused outcomes. This starts with our most important assets—our people. The Department’s employees are committed
to the Commerce mission and public service, and leadership is committed to engaging and empowering them to maximize
their talents through continuous learning, collaboration, and innovation.
This includes providing an up-to-date work environment and IT services that support collaboration amongst our employees to
unleash their potential and creativity to solve common challenges. Our Office of the Chief Information Officer is modernizing
our tools to enable best-in-class service through enterprise solutions, while also safeguarding against cyber threats.
The Department’s management is also committed to looking at more efficient and effective ways to manage our processes
as an enterprise for our key services. The Department’s Enterprise Services organization was launched in FY 2017, and will
continue in FY 2018 and beyond by introducing additional efficiencies in the IT, Human Resources, and Acquisitions areas.
This will not only allow for improved service delivery, but also smarter and more efficient, effective use of taxpayer resources.
Ellen Herbst
Chief Financial Officer
and Assistant Secretary for Administration
November 14, 2017
36 | FY 20 17 AGENCY F I NANC IAL REPORT
MESSAGE FROM THE CH I E F F I NANC IAL OFF ICER (UNAUD I TED )

independent auditorS’ reportFINANCIAL SECTION

1
November 14, 2017
INFORMATION MEMORANDUM FOR SECRETARY ROSS
FROM: Peggy E. Gustafson Inspector General
SUBJECT: Department of Commerce FY 2017 Consolidated Financial Statements — Final Report No. OIG-18-007-A
I am pleased to provide you with the attached audit report, which presents an unmodified opinion on the Department of Commerce’s fiscal year (FY) 2017 consolidated financial statements.
KPMG LLP, an independent public accounting firm, performed the audit in accordance with U.S. generally accepted auditing standards, standards applicable to financial audits contained in Government Auditing Standards, and Office of Management and Budget Bulletin 17-03, Audit Requirements for Federal Financial Statements.
In its audit of the Department, KPMG • determined that the financial statements were fairly presented, in all material
respects, and in conformity with U.S. generally accepted accounting principles;
• identified a material weakness in internal control over financial reporting related to the identification of internal use software, as well as a significant deficiency in internal control over financial reporting related to weaknesses in information technology access, configuration management, and security management controls;
• identified no instances of reportable noncompliance with applicable laws, regulations, contracts, and grant agreements, as well as no instances in which the Department’s financial management systems did not substantially comply with the requirements of the Federal Financial Management Improvement Act of 1996; and
• disclosed five potential instances of noncompliance with the Antideficiency Act, which are currently under review at the Department.
38 | FY 20 17 AGENCY F I NANC IAL REPORT
I NDEPENDENT AUD I TORS ’ REPORT

2
My office oversaw the audit performance. We reviewed KPMG’s report and related documentation, and made inquiries of its representatives. Our review disclosed no instances where KPMG did not comply, in all material respects, with generally accepted government auditing standards. However, our review, as differentiated from an audit in accordance with these standards, was not intended to enable us to express, and we do not express, any opinion on the Department’s financial statements, conclusions about the effectiveness of internal control, or conclusions on compliance with applicable laws, regulations, contracts, and grant agreements. KPMG is solely responsible for the attached audit report and the conclusions expressed in it.
We appreciate the cooperation and courtesies the Department extended to KPMG during the audit.
Attachment
FY 20 17 AGENCY F I NANC IAL REPORT | 39
I NDEPENDENT AUD I TORS ’ REPORT

KPMG LLP is a Delaware limited liability partnership and the U.S. member firm of the KPMG network of independent member firms affiliated with KPMG International Cooperative (“KPMG International”), a Swiss entity.
KPMG LLPSuite 120001801 K Street, NWWashington, DC 20006
Independent Auditors’ Report
Inspector General, U.S. Department of Commerce and Secretary, U.S. Department of Commerce
Report on the Financial Statements We have audited the accompanying consolidated financial statements of the U.S. Department of Commerce (Department), which comprise the consolidated balance sheets as of September 30, 2017 and 2016, and the related consolidated statements of net cost, changes in net position, and custodial activity, and combined statements of budgetary resources for the years then ended, and the related notes to the consolidated financial statements.
Management’s Responsibility for the Financial StatementsManagement is responsible for the preparation and fair presentation of these consolidated financial statements in accordance with U.S. generally accepted accounting principles; this includes the design, implementation, and maintenance of internal control relevant to the preparation and fair presentation of consolidated financial statements that are free from material misstatement, whether due to fraud or error.
Auditors’ ResponsibilityOur responsibility is to express an opinion on these consolidated financial statements based on our audits. We conducted our audits in accordance with auditing standards generally accepted in the United States of America,in accordance with the standards applicable to financial audits contained in Government Auditing Standardsissued by the Comptroller General of the United States, and in accordance with Office of Management and Budget (OMB) Bulletin No. 17-03, Audit Requirements for Federal Financial Statements. Those standards and OMB Bulletin No. 17-03 require that we plan and perform the audit to obtain reasonable assurance about whether the consolidated financial statements are free from material misstatement.
An audit involves performing procedures to obtain audit evidence about the amounts and disclosures in the consolidated financial statements. The procedures selected depend on the auditors’ judgment, including the assessment of the risks of material misstatement of the consolidated financial statements, whether due to fraud or error. In making those risk assessments, the auditor considers internal control relevant to the entity’spreparation and fair presentation of the consolidated financial statements in order to design audit procedures that are appropriate in the circumstances, but not for the purpose of expressing an opinion on the effectiveness of the entity’s internal control. Accordingly, we express no such opinion. An audit also includes evaluating the appropriateness of accounting policies used and the reasonableness of significant accounting estimates made by management, as well as evaluating the overall presentation of the consolidated financial statements.
We believe that the audit evidence we have obtained is sufficient and appropriate to provide a basis for our audit opinion.
Opinion on the Financial Statements In our opinion, the consolidated financial statements referred to above present fairly, in all material respects, the financial position of the U.S. Department of Commerce as of September 30, 2017 and 2016, and its net costs, changes in net position and budgetary resources, and custodial activity for the years then ended in accordance with U.S. generally accepted accounting principles.
40 | FY 20 17 AGENCY F I NANC IAL REPORT
I NDEPENDENT AUD I TORS ’ REPORT

2
Other Matters Interactive Data
Management has elected to reference to information on websites or other forms of interactive data outside the Agency Financial Report to provide additional information for the users of its financial statements. Such information is not a required part of the basic consolidated financial statements or supplementary information required by the Federal Accounting Standards Advisory Board. The information on these websites or the other interactive data has not been subjected to any of our auditing procedures, and accordingly we do not express an opinion or provide any assurance on it.
Required Supplementary Information
U.S. generally accepted accounting principles require that the information in the Management’s Discussion and Analysis (including the Financial Management and Analysis section), Required Supplementary Information, and Required Supplementary Stewardship Information sections be presented to supplement the basic consolidated financial statements. Such information, although not a part of the basic consolidated financial statements, is required by the Federal Accounting Standards Advisory Board who considers it to be an essential part of financial reporting for placing the basic consolidated financial statements in an appropriate operational, economic, or historical context. We have applied certain limited procedures to the required supplementary information in accordance with auditing standards generally accepted in the United States of America, which consisted of inquiries of management about the methods of preparing the information and comparing the information for consistency with management’s responses to our inquiries, the basic consolidated financial statements, and other knowledge we obtained during our audits of the basic consolidated financial statements. We do not express an opinion or provide any assurance on the information because the limited procedures do not provide us with sufficient evidence to express an opinion or provide any assurance.
Other Information
Our audits were conducted for the purpose of forming an opinion on the basic consolidated financial statements as a whole. The How to Use this Report section, the Message from the Chief Financial Officer, and the Other Information section are presented for purposes of additional analysis and are not a required part of the basic consolidated financial statements. Such information has not been subjected to the auditing procedures applied in the audits of the basic consolidated financial statements, and accordingly, we do not express an opinion or provide any assurance on it.
Other Reporting Required by Government Auditing StandardsInternal Control Over Financial Reporting In planning and performing our audit of the consolidated financial statements as of and for the year ended September 30, 2017, we considered the Department’s internal control over financial reporting (internal control) to determine the audit procedures that are appropriate in the circumstances for the purpose of expressing our opinion on the consolidated financial statements, but not for the purpose of expressing an opinion on the effectiveness of the Department’s internal control. Accordingly, we do not express an opinion on the effectiveness of the Department’s internal control. We did not test all internal controls relevant to operating objectives as broadly defined by the Federal Managers’ Financial Integrity Act of 1982.
Our consideration of internal control was for the limited purpose described in the preceding paragraph and was not designed to identify all deficiencies in internal control that might be material weaknesses or significant deficiencies and therefore, material weaknesses or significant deficiencies may exist that have not been identified. However, as described in the accompanying Exhibit I and Exhibit II, we identified certain deficiencies in internal control that we consider to be a material weakness and a significant deficiency.
A deficiency in internal control exists when the design or operation of a control does not allow management or employees, in the normal course of performing their assigned functions, to prevent, or detect and correct, misstatements on a timely basis. A material weakness is a deficiency, or a combination of deficiencies, in
FY 20 17 AGENCY F I NANC IAL REPORT | 41
I NDEPENDENT AUD I TORS ’ REPORT

3
internal control such that there is a reasonable possibility that a material misstatement of the entity’s financial statements will not be prevented, or detected and corrected, on a timely basis. We consider the deficiency described in the accompanying Exhibit I to be a material weakness.
A significant deficiency is a deficiency, or a combination of deficiencies, in internal control that is less severe than a material weakness, yet important enough to merit attention by those charged with governance. We consider the deficiencies described in the accompanying Exhibit II to be a significant deficiency.
Compliance and Other Matters As part of obtaining reasonable assurance about whether the Department’s consolidated financial statements are free from material misstatement, we performed tests of its compliance with certain provisions of laws, regulations, contracts, and grant agreements, noncompliance with which could have a direct and material effect on the determination of financial statement amounts. However, providing an opinion on compliance with those provisions was not an objective of our audit, and accordingly, we do not express such an opinion. The results of our tests disclosed no instances of noncompliance or other matters that are required to be reported under Government Auditing Standards or OMB Bulletin No. 17-03.
We also performed tests of its compliance with certain provisions referred to in Section 803(a) of the Federal Financial Management Improvement Act of 1996 (FFMIA). Providing an opinion on compliance with FFMIA was not an objective of our audit, and accordingly, we do not express such an opinion. The results of our tests disclosed no instances in which the Department’s financial management systems did not substantially comply with the (1) Federal financial management systems requirements, (2) applicable Federal accounting standards, and (3) the United States Government Standard General Ledger at the transaction level.
Potential Instances of Noncompliance
The Department informed us of potential instances of noncompliance with the Antideficiency Act, which are under review. Specifically, the Department’s Office of the Secretary and the Department’s Office of General Counsel are reviewing instances of: (i) potential incorrect use of budgetary funding sources to support its programs; (ii) accepting terms of agreement on purchases made through the internet; (iii) relating to work performed without compensation through appointment as an intermittent expert after retiring from employment with the bureau; (iv) unemployment claims filed by temporary employees; and, (v) potential obligations in excess of quarterly advance of apportionment from OMB. Because these reviews are not complete, the ultimate outcomes of these potential matters are not presently known.
The Department’s Responses to FindingsThe Department’s responses to the findings identified in our audit are described in Exhibits I and II. TheDepartment’s responses were not subjected to the auditing procedures applied in the audit of the consolidated financial statements and, accordingly, we express no opinion on the responses.
Purpose of the Other Reporting Required by Government Auditing StandardsThe purpose of the communication described in the Other Reporting Required by Government Auditing Standards section is solely to describe the scope of our testing of internal control and compliance and the result of that testing, and not to provide an opinion on the effectiveness of the Department’s internal control or compliance. Accordingly, this communication is not suitable for any other purpose.
November 14, 2017
42 | FY 20 17 AGENCY F I NANC IAL REPORT
I NDEPENDENT AUD I TORS ’ REPORT
Exhibit I – Material Weakness
I-1
Census Controls over Identification of Internal Use Software needs Improvement
The Department’s Bureau of the Census (Census) did not effectively implement controls to prevent or detect and correct misstatements attributed to identifying and capitalizing internal use software (IUS).
During FY2017, Census had not identified 6 IUS projects, which included $157 million of costs incurred, which was not identified as a result of specific control weaknesses as follows:
Certain controls have not been implemented effectively to ensure that the Census Finance Division and Administrative and Customer Service Division were actively monitoring and coordinating with Census’ divisions and administrative offices to review contracts and identify IUS costs incurred during the year and potential IUS costs that would be delivered in the future. Although Census identified that individuals at Census divisions and administrative offices receive trainings and provide reporting to the Census Finance Division and Administrative and Customer Service Division, those individuals may not have the proper expertise to identify whether certain cost components meet some of the more complex criteria for capitalization in accordance with U.S. generally accepted accounting principles (GAAP).
For example, in addition to the acquisition of software licenses and system hardware purchases, GAAP requires certain indirect cost components to be capitalized such as project management overhead costs and rental payments for the facilities used by personnel who contribute to the development of IUS. In these instances, Census must determine a cost allocation method to allocate costs between IUS and non-IUS components of the project(s). Due to the complexity of these types of contracts, the policies and implementation of a cost allocation methodology requires a coordinated involvement of a mix of the appropriate level of expertise as part of the decision-making process.
Controls to provide training to IUS points of contacts were not operating effectively. In some instances, Census identified that certain employees who managed IUS for the Census Geography Division property did not receive sufficient training with respect to the U.S. GAAP requirements relating to IUS.
Controls to provide a quarterly data call for Census divisions and their administrative offices to self-report the existence of IUS to the Census Finance Division and the Administrative and Customer Service Division were not operating effectively, as evidenced by 2 of the divisions failing to identify and report at least 6 IUS projects to the Census Finance Division. Census identified that managers within the Decennial and Communications Directorate did not follow up with their employees to verify that timely and accurate submissions were provided to the Census Finance Division and Administrative and Customer Service Division.
Census has stated that the cause for these control weaknesses is primarily due to vacancies in key positions with roles that relate to accounting for IUS.
Subsequently, the Department recorded an adjustment of $157 million to correct gross cost and recognize assets (that is, internal use software).
Recommendations
We recommend that the Census management:
Improve controls and enforce implementation to ensure that the Census Finance Division and Administrative and Customer Service Division are regularly monitoring and coordinating with Census’
FY 20 17 AGENCY F I NANC IAL REPORT | 43
I NDEPENDENT AUD I TORS ’ REPORT

Exhibit I – Material Weakness, continued
I-2
divisions and administrative offices to review contracts and identify IUS costs incurred during the year and potential IUS costs that would be delivered in the future.
Improve controls to ensure that all relevant Census personnel receive training on the relevant criteria for recognizing internal use software – particularly, as it relates to material service contracts with assets embedded within the contractual requirements.
Improve controls at the Census divisions and administrative offices to ensure that quarterly data call submissions are submitted timely and accurately.
Management’s Response
The Department concurs. We will develop corrective action plans and ensure timely implementation to address KPMG’s recommendations.
44 | FY 20 17 AGENCY F I NANC IAL REPORT
I NDEPENDENT AUD I TORS ’ REPORT
Exhibit II – Significant Deficiency
II-1
Information Technology Access, Configuration Management, and Security Management Controls Need Improvement
During fiscal year (FY) 2017, we noted certain deficiencies surrounding information technology (IT) general controls associated with the Department’s financial management systems and supporting infrastructure that we considered collectively to be a significant deficiency under the standards issued by the American Institute of Certified Public Accountants. Specifically, the Department needs to make improvements in its access, configuration management, and security management controls, described below, to support management’s ability to provide assurance that transactions are complete, accurate, and valid.
Access controls. The objectives of limiting access are to ensure that users have only the access needed to perform their duties; that access to sensitive resources, such as security software programs, is limited to few individuals; and that employees are restricted from performing incompatible functions or duties beyond their responsibility. The areas of deficiencies are: (1) database and operating system password controls, (2) access administration controls, (3) physical access controls, (4) segregation of duties, (5) audit log review controls, (6) source code management and (7) server encryption.
Configuration management. The objectives of configuration management are to ensure that hardware, software and firmware programs, and program modifications are properly authorized, tested, and approved; that access to and distribution of programs is carefully controlled; and that integrity of the application controls is maintained. The areas of deficiencies are: (1) patch management and (2) configuration management procedures.
Security management. The objective of security management is to support data reliability. The area of deficiencies is in the Department’s monitoring of compliance with some internal policies.
The relevant criteria is Department-wide and bureau-level policies and various Federal standards and guidance such as (1) GAO’s Standards for Internal Control in the Federal Government, dated September 2014, (2) GAO’s Federal Information System Controls Audit Manual, dated February 2009, (3) NIST SP 800-53 Rev. 4, Security and Privacy Controls for Federal Information Systems and Organizations, and (4) NIST Special Publication 800-34 Rev. 1, Contingency Planning Guide for Federal Information Systems.
Due to the sensitive nature of IT controls, certain information has been omitted from this report. We provided the Department management with a separate limited distribution IT report that includes specific information about our observations, the criteria used, our understanding of the cause of the deficiencies identified, and our recommendations. We recognize that the Department has certain compensating controls in place to help reduce the risk of the identified deficiencies, and we have considered such compensating controls as part of our audit of the Department’s consolidated financial statements.
Management’s Response
The Department concurs. We will develop corrective action plans and ensure timely implementation to address KPMG’s recommendations.
FY 20 17 AGENCY F I NANC IAL REPORT | 45
I NDEPENDENT AUD I TORS ’ REPORTI NDEPENDENT AUD I TORS ’ REPORT
THIS PAGE LEFT INTENTIONALLY BLANK
46 | FY 20 17 AGENCY F I NANC IAL REPORT
I NDEPENDENT AUD I TORS ’ REPORT

principal Financial StatementSFINANCIAL SECTION
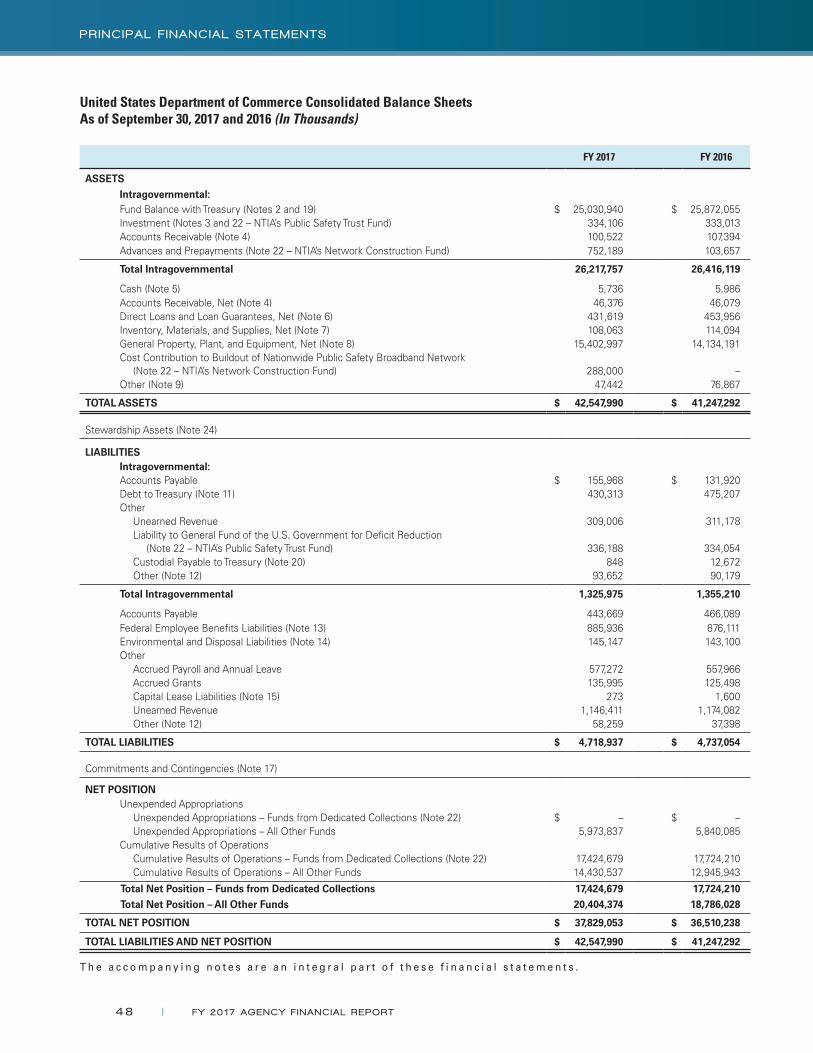
United States Department of Commerce Consolidated Balance SheetsAs of September 30, 2017 and 2016 (In Thousands)
FY 2017 FY 2016
ASSETSIntragovernmental:Fund Balance with Treasury (Notes 2 and 19) $ 25,030,940 $ 25,872,055Investment (Notes 3 and 22 – NTIA’s Public Safety Trust Fund) 334,106 333,013Accounts Receivable (Note 4) 100,522 107,394Advances and Prepayments (Note 22 – NTIA’s Network Construction Fund) 752,189 103,657
Total Intragovernmental 26,217,757 26,416,119
Cash (Note 5) 5,736 5,986Accounts Receivable, Net (Note 4) 46,376 46,079Direct Loans and Loan Guarantees, Net (Note 6) 431,619 453,956Inventory, Materials, and Supplies, Net (Note 7) 108,063 114,094General Property, Plant, and Equipment, Net (Note 8) 15,402,997 14,134,191Cost Contribution to Buildout of Nationwide Public Safety Broadband Network
(Note 22 – NTIA’s Network Construction Fund) 288,000 –Other (Note 9) 47,442 76,867
TOTAL ASSETS $ 42,547,990 $ 41,247,292
Stewardship Assets (Note 24)
LIABILITIESIntragovernmental:Accounts Payable $ 155,968 $ 131,920Debt to Treasury (Note 11) 430,313 475,207Other Unearned Revenue 309,006 311,178
Liability to General Fund of the U.S. Government for Deficit Reduction (Note 22 – NTIA’s Public Safety Trust Fund) 336,188 334,054
Custodial Payable to Treasury (Note 20) 848 12,672 Other (Note 12) 93,652 90,179
Total Intragovernmental 1,325,975 1,355,210
Accounts Payable 443,669 466,089Federal Employee Benefits Liabilities (Note 13) 885,936 876,111Environmental and Disposal Liabilities (Note 14) 145,147 143,100Other Accrued Payroll and Annual Leave 577,272 557,966 Accrued Grants 135,995 125,498 Capital Lease Liabilities (Note 15) 273 1,600 Unearned Revenue 1,146,411 1,174,082 Other (Note 12) 58,259 37,398
TOTAL LIABILITIES $ 4,718,937 $ 4,737,054
Commitments and Contingencies (Note 17)
NET POSITION Unexpended Appropriations Unexpended Appropriations – Funds from Dedicated Collections (Note 22) $ – $ – Unexpended Appropriations – All Other Funds 5,973,837 5,840,085Cumulative Results of Operations Cumulative Results of Operations – Funds from Dedicated Collections (Note 22) 17,424,679 17,724,210 Cumulative Results of Operations – All Other Funds 14,430,537 12,945,943
Total Net Position – Funds from Dedicated Collections 17,424,679 17,724,210Total Net Position – All Other Funds 20,404,374 18,786,028
TOTAL NET POSITION $ 37,829,053 $ 36,510,238
TOTAL LIABILITIES AND NET POSITION $ 42,547,990 $ 41,247,292
T h e a c c o m p a n y i n g n o t e s a r e a n i n t e g r a l p a r t o f t h e s e f i n a n c i a l s t a t e m e n t s .
48 | FY 20 17 AGENCY F I NANC IAL REPORT
PR INC IPAL F I NANC IAL STATEMENTS
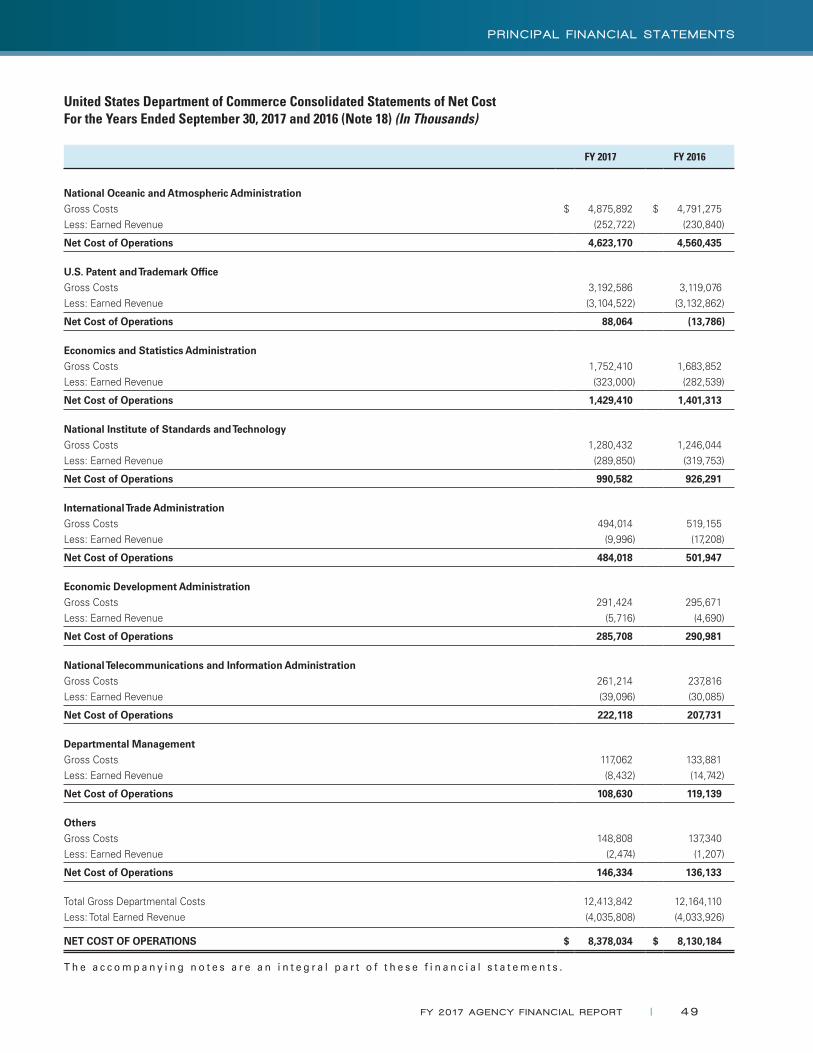
United States Department of Commerce Consolidated Statements of Net CostFor the Years Ended September 30, 2017 and 2016 (Note 18) (In Thousands)
FY 2017 FY 2016
National Oceanic and Atmospheric AdministrationGross Costs $ 4,875,892 $ 4,791,275 Less: Earned Revenue (252,722) (230,840)
Net Cost of Operations 4,623,170 4,560,435
U.S. Patent and Trademark OfficeGross Costs 3,192,586 3,119,076 Less: Earned Revenue (3,104,522) (3,132,862)
Net Cost of Operations 88,064 (13,786)
Economics and Statistics AdministrationGross Costs 1,752,410 1,683,852 Less: Earned Revenue (323,000) (282,539)
Net Cost of Operations 1,429,410 1,401,313
National Institute of Standards and TechnologyGross Costs 1,280,432 1,246,044 Less: Earned Revenue (289,850) (319,753)
Net Cost of Operations 990,582 926,291
International Trade AdministrationGross Costs 494,014 519,155Less: Earned Revenue (9,996) (17,208)
Net Cost of Operations 484,018 501,947
Economic Development AdministrationGross Costs 291,424 295,671Less: Earned Revenue (5,716) (4,690)
Net Cost of Operations 285,708 290,981
National Telecommunications and Information AdministrationGross Costs 261,214 237,816 Less: Earned Revenue (39,096) (30,085)
Net Cost of Operations 222,118 207,731
Departmental ManagementGross Costs 117,062 133,881 Less: Earned Revenue (8,432) (14,742)
Net Cost of Operations 108,630 119,139
OthersGross Costs 148,808 137,340 Less: Earned Revenue (2,474) (1,207)
Net Cost of Operations 146,334 136,133
Total Gross Departmental Costs 12,413,842 12,164,110 Less: Total Earned Revenue (4,035,808) (4,033,926)
NET COST OF OPERATIONS $ 8,378,034 $ 8,130,184
T h e a c c o m p a n y i n g n o t e s a r e a n i n t e g r a l p a r t o f t h e s e f i n a n c i a l s t a t e m e n t s .
FY 20 17 AGENCY F I NANC IAL REPORT | 49
PR INC IPAL F I NANC IAL STATEMENTS
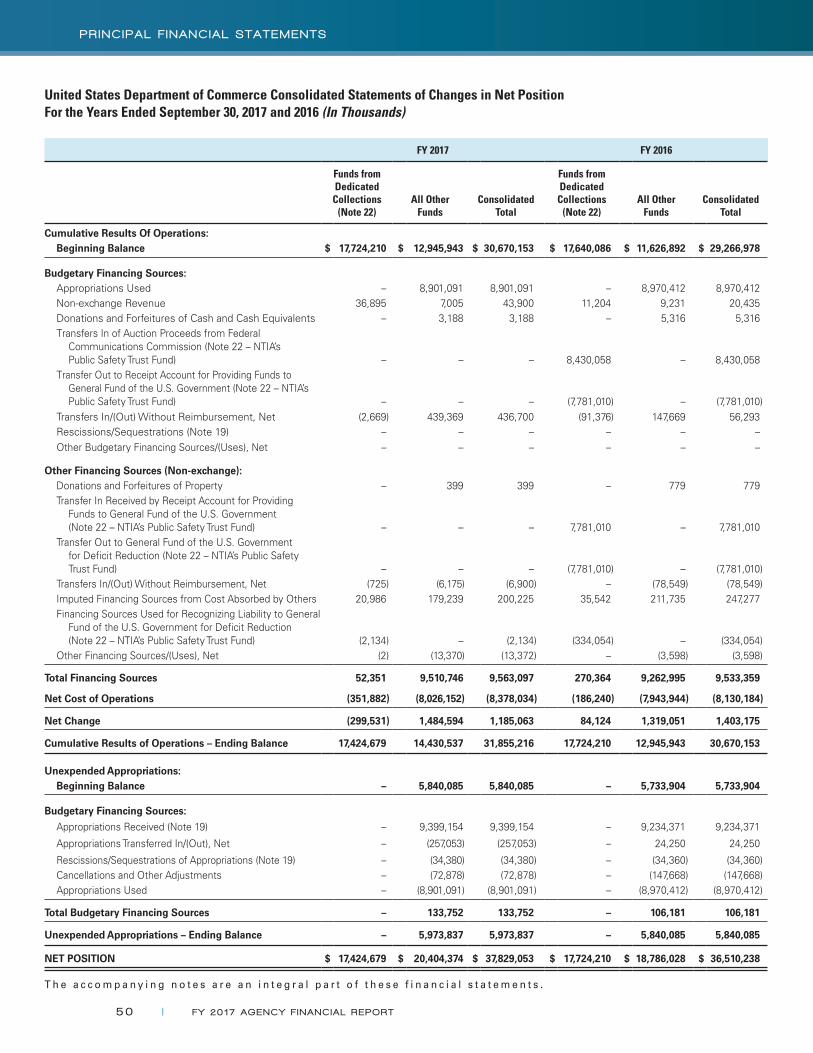
United States Department of Commerce Consolidated Statements of Changes in Net Position For the Years Ended September 30, 2017 and 2016 (In Thousands)
FY 2017 FY 2016
Funds from Dedicated
Collections(Note 22)
All Other
FundsConsolidated
Total
Funds from Dedicated
Collections(Note 22)
All Other
FundsConsolidated
Total
Cumulative Results Of Operations: Beginning Balance $ 17,724,210 $ 12,945,943 $ 30,670,153 $ 17,640,086 $ 11,626,892 $ 29,266,978
Budgetary Financing Sources:Appropriations Used – 8,901,091 8,901,091 – 8,970,412 8,970,412Non-exchange Revenue 36,895 7,005 43,900 11,204 9,231 20,435Donations and Forfeitures of Cash and Cash Equivalents – 3,188 3,188 – 5,316 5,316Transfers In of Auction Proceeds from Federal
Communications Commission (Note 22 – NTIA’s Public Safety Trust Fund) – – – 8,430,058 – 8,430,058
Transfer Out to Receipt Account for Providing Funds to General Fund of the U.S. Government (Note 22 – NTIA’s Public Safety Trust Fund) – – – (7,781,010) – (7,781,010)
Transfers In/(Out) Without Reimbursement, Net (2,669) 439,369 436,700 (91,376) 147,669 56,293Rescissions/Sequestrations (Note 19) – – – – – –
Other Budgetary Financing Sources/(Uses), Net – – – – – –
Other Financing Sources (Non-exchange):Donations and Forfeitures of Property – 399 399 – 779 779Transfer In Received by Receipt Account for Providing
Funds to General Fund of the U.S. Government (Note 22 – NTIA’s Public Safety Trust Fund) – – – 7,781,010 – 7,781,010
Transfer Out to General Fund of the U.S. Government for Deficit Reduction (Note 22 – NTIA’s Public Safety Trust Fund) – – – (7,781,010) – (7,781,010)
Transfers In/(Out) Without Reimbursement, Net (725) (6,175) (6,900) – (78,549) (78,549)Imputed Financing Sources from Cost Absorbed by Others 20,986 179,239 200,225 35,542 211,735 247,277Financing Sources Used for Recognizing Liability to General
Fund of the U.S. Government for Deficit Reduction (Note 22 – NTIA’s Public Safety Trust Fund) (2,134) – (2,134) (334,054) – (334,054)
Other Financing Sources/(Uses), Net (2) (13,370) (13,372) – (3,598) (3,598)
Total Financing Sources 52,351 9,510,746 9,563,097 270,364 9,262,995 9,533,359
Net Cost of Operations (351,882) (8,026,152) (8,378,034) (186,240) (7,943,944) (8,130,184)
Net Change (299,531) 1,484,594 1,185,063 84,124 1,319,051 1,403,175
Cumulative Results of Operations – Ending Balance 17,424,679 14,430,537 31,855,216 17,724,210 12,945,943 30,670,153
Unexpended Appropriations: Beginning Balance – 5,840,085 5,840,085 – 5,733,904 5,733,904
Budgetary Financing Sources:
Appropriations Received (Note 19) – 9,399,154 9,399,154 – 9,234,371 9,234,371
Appropriations Transferred In/(Out), Net – (257,053) (257,053) – 24,250 24,250
Rescissions/Sequestrations of Appropriations (Note 19) – (34,380) (34,380) – (34,360) (34,360) Cancellations and Other Adjustments – (72,878) (72,878) – (147,668) (147,668) Appropriations Used – (8,901,091) (8,901,091) – (8,970,412) (8,970,412)
Total Budgetary Financing Sources – 133,752 133,752 – 106,181 106,181
Unexpended Appropriations – Ending Balance – 5,973,837 5,973,837 – 5,840,085 5,840,085
NET POSITION $ 17,424,679 $ 20,404,374 $ 37,829,053 $ 17,724,210 $ 18,786,028 $ 36,510,238
T h e a c c o m p a n y i n g n o t e s a r e a n i n t e g r a l p a r t o f t h e s e f i n a n c i a l s t a t e m e n t s .
50 | FY 20 17 AGENCY F I NANC IAL REPORT
PR INC IPAL F I NANC IAL STATEMENTS
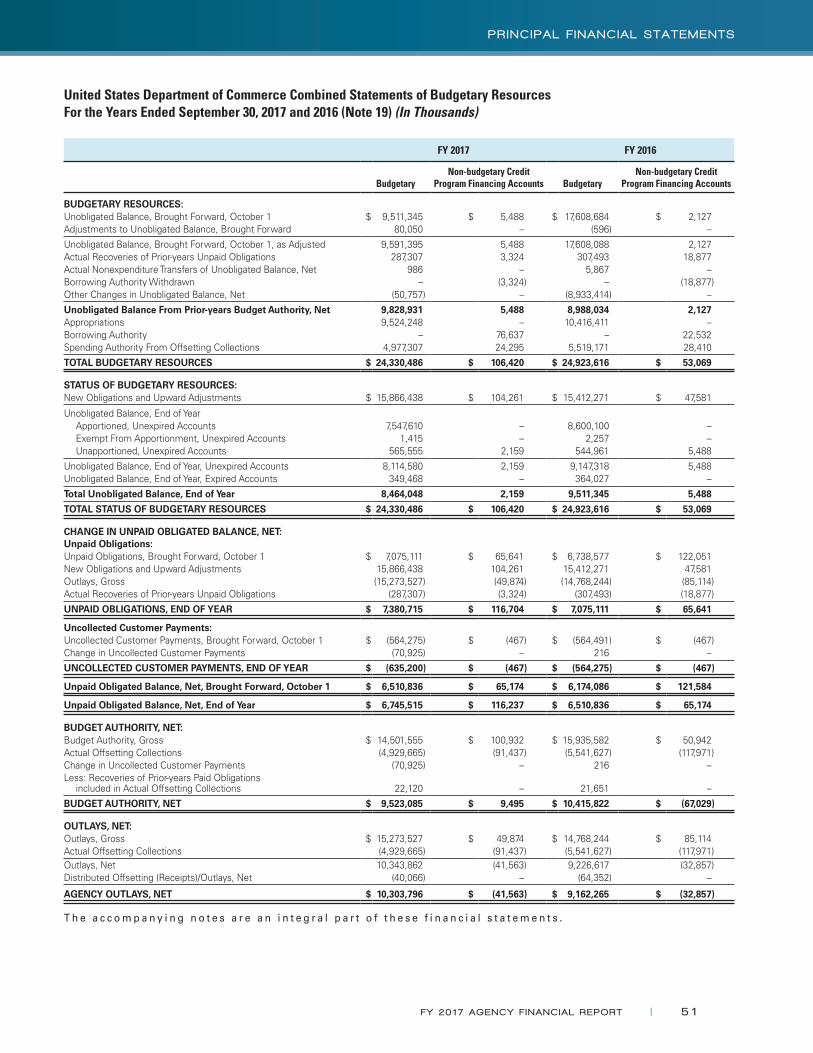
United States Department of Commerce Combined Statements of Budgetary Resources For the Years Ended September 30, 2017 and 2016 (Note 19) (In Thousands)
FY 2017 FY 2016
BudgetaryNon-budgetary Credit
Program Financing Accounts BudgetaryNon-budgetary Credit
Program Financing Accounts
BUDGETARY RESOURCES:Unobligated Balance, Brought Forward, October 1 $ 9,511,345 $ 5,488 $ 17,608,684 $ 2,127Adjustments to Unobligated Balance, Brought Forward 80,050 – (596) –
Unobligated Balance, Brought Forward, October 1, as Adjusted 9,591,395 5,488 17,608,088 2,127Actual Recoveries of Prior-years Unpaid Obligations 287,307 3,324 307,493 18,877Actual Nonexpenditure Transfers of Unobligated Balance, Net 986 – 5,867 –Borrowing Authority Withdrawn – (3,324) – (18,877)Other Changes in Unobligated Balance, Net (50,757) – (8,933,414) –
Unobligated Balance From Prior-years Budget Authority, Net 9,828,931 5,488 8,988,034 2,127Appropriations 9,524,248 – 10,416,411 –Borrowing Authority – 76,637 – 22,532Spending Authority From Offsetting Collections 4,977,307 24,295 5,519,171 28,410
TOTAL BUDGETARY RESOURCES $ 24,330,486 $ 106,420 $ 24,923,616 $ 53,069
STATUS OF BUDGETARY RESOURCES:New Obligations and Upward Adjustments $ 15,866,438 $ 104,261 $ 15,412,271 $ 47,581
Unobligated Balance, End of Year Apportioned, Unexpired Accounts 7,547,610 – 8,600,100 – Exempt From Apportionment, Unexpired Accounts 1,415 – 2,257 – Unapportioned, Unexpired Accounts 565,555 2,159 544,961 5,488
Unobligated Balance, End of Year, Unexpired Accounts 8,114,580 2,159 9,147,318 5,488Unobligated Balance, End of Year, Expired Accounts 349,468 – 364,027 –
Total Unobligated Balance, End of Year 8,464,048 2,159 9,511,345 5,488
TOTAL STATUS OF BUDGETARY RESOURCES $ 24,330,486 $ 106,420 $ 24,923,616 $ 53,069
CHANGE IN UNPAID OBLIGATED BALANCE, NET:Unpaid Obligations:Unpaid Obligations, Brought Forward, October 1 $ 7,075,111 $ 65,641 $ 6,738,577 $ 122,051New Obligations and Upward Adjustments 15,866,438 104,261 15,412,271 47,581Outlays, Gross (15,273,527) (49,874) (14,768,244) (85,114)Actual Recoveries of Prior-years Unpaid Obligations (287,307) (3,324) (307,493) (18,877)
UNPAID OBLIGATIONS, END OF YEAR $ 7,380,715 $ 116,704 $ 7,075,111 $ 65,641
Uncollected Customer Payments: Uncollected Customer Payments, Brought Forward, October 1 $ (564,275) $ (467) $ (564,491) $ (467)Change in Uncollected Customer Payments (70,925) – 216 –
UNCOLLECTED CUSTOMER PAYMENTS, END OF YEAR $ (635,200) $ (467) $ (564,275) $ (467)
Unpaid Obligated Balance, Net, Brought Forward, October 1 $ 6,510,836 $ 65,174 $ 6,174,086 $ 121,584
Unpaid Obligated Balance, Net, End of Year $ 6,745,515 $ 116,237 $ 6,510,836 $ 65,174
BUDGET AUTHORITY, NET:Budget Authority, Gross $ 14,501,555 $ 100,932 $ 15,935,582 $ 50,942Actual Offsetting Collections (4,929,665) (91,437) (5,541,627) (117,971)Change in Uncollected Customer Payments (70,925) – 216 –Less: Recoveries of Prior-years Paid Obligations
included in Actual Offsetting Collections 22,120 – 21,651 –
BUDGET AUTHORITY, NET $ 9,523,085 $ 9,495 $ 10,415,822 $ (67,029)
OUTLAYS, NET:Outlays, Gross $ 15,273,527 $ 49,874 $ 14,768,244 $ 85,114Actual Offsetting Collections (4,929,665) (91,437) (5,541,627) (117,971)Outlays, Net 10,343,862 (41,563) 9,226,617 (32,857)Distributed Offsetting (Receipts)/Outlays, Net (40,066) – (64,352) –
AGENCY OUTLAYS, NET $ 10,303,796 $ (41,563) $ 9,162,265 $ (32,857)
T h e a c c o m p a n y i n g n o t e s a r e a n i n t e g r a l p a r t o f t h e s e f i n a n c i a l s t a t e m e n t s .
FY 20 17 AGENCY F I NANC IAL REPORT | 51
PR INC IPAL F I NANC IAL STATEMENTS

United States Department of Commerce Consolidated Statements of Custodial ActivityFor the Years Ended September 30, 2017 and 2016 (Note 20) (In Thousands)
FY 2017 FY 2016
Custodial Revenue Activity:
Sources of Cash Collections: Fines and Penalties $ 375,958 $ 12,427 Other 12,589 14,490Total Cash Collections 388,547 26,917Accrual Adjustment (11,827) 12,283
Total Custodial Revenue 376,720 39,200
Disposition of Custodial Revenue:Transferred to the General Fund of the U.S. Government 388,544 26,949
Increase/(Decrease) in Amounts Yet to be Transferred to the General Fund of the U.S. Government (11,824) 12,251
Total Disposition of Collections 376,720 39,200
NET CUSTODIAL ACTIVITY $ – $ –
T h e a c c o m p a n y i n g n o t e s a r e a n i n t e g r a l p a r t o f t h e s e f i n a n c i a l s t a t e m e n t s .
52 | FY 20 17 AGENCY F I NANC IAL REPORT
PR INC IPAL F I NANC IAL STATEMENTS

noteS to the Financial StatementS
FINANCIAL SECTION

Note 1. Summary of Significant Accounting Policies 55
Note 2. Fund Balance with Treasury 68
Note 3. Investment 69
Note 4. Accounts Receivable, Net 69
Note 5. Cash 70
Note 6. Direct Loans and Loan Guarantees, Net 70
Note 7. Inventory, Materials, and Supplies, Net 76
Note 8. General Property, Plant, and Equipment, Net 77
Note 9. Other Assets 78
Note 10. Non-entity Assets 78
Note 11. Debt to Treasury 79
Note 12. Other Liabilities 79
Note 13. Federal Employee Benefits Liabilities 80
Note 14. Environmental and Disposal Liabilities 82
Note 15. Leases 83
Note 16. Liabilities Not Covered by Budgetary Resources 85
Note 17. Commitments and Contingencies 86
Note 18. Consolidated Statements of Net Cost 87
Note 19. Combined Statements of Budgetary Resources 89
Note 20. Consolidated Statements of Custodial Activity 91
Note 21. Fiduciary Activities 92
Note 22. Funds from Dedicated Collections 93
Note 23. Reconciliation of Net Cost of Operations to Budget 102
Note 24. Stewardship Assets 104
NOTES TO THE FINANCIAL STATEMENTS(Dollars in Tables are Presented in Thousands)
54 | FY 20 17 AGENCY F I NANC IAL REPORT
NOTES TO THE F I NANC IAL STATEMENTS
NOTE 1. SUMMARY OF SIGNIFICANT ACCOUNTING POLICIES
A Reporting Entity
The Department of Commerce (the Department) is a cabinet-level agency of the Executive Branch of the U.S. government. Established in 1903 to promote U.S. business and trade, the Department’s broad range of responsibilities includes predicting the weather, granting patents and registering trademarks, measuring economic growth, gathering and disseminating
statistical data, expanding U.S. exports, developing innovative technologies, helping local communities improve their economic development capabilities, promoting minority entrepreneurial activities, and monitoring the stewardship of national assets. The Department is composed of 12 bureaus and Departmental Management.
For the Consolidated Statements of Net Cost, the Department’s entities have been grouped together as follows:
●● National Oceanic and Atmospheric Administration (NOAA)
●● U.S. Patent and Trademark Office (USPTO)
●● Economics and Statistics Administration (ESA) — based on organizational structure
●● Bureau of Economic Analysis (BEA)
●● Census Bureau
●● National Institute of Standards and Technology (NIST) — based on organizational structure
●● National Technical Information Service (NTIS)
●● International Trade Administration (ITA)●● Economic Development Administration (EDA)●● National Telecommunications and Information Administration (NTIA)1
●● Departmental Management (DM)
●● Gifts and Bequests
●● Herbert C. Hoover Building Renovation Project
●● Office of Inspector General (OIG)
●● Salaries and Expenses (S&E)
●● Working Capital Fund (WCF)
●● Others
●● Bureau of Industry and Security (BIS)
●● Minority Business Development Agency (MBDA)
1 The Middle Class Tax Relief and Job Creation Act of 2012 created the First Responder Network Authority (FirstNet), included in these financial statements, as an independent authority within NTIA, to provide emergency responders with the first high-speed, nationwide network dedicated to public safety.
FY 20 17 AGENCY F I NANC IAL REPORT | 55
NOTES TO THE F I NANC IAL STATEMENTS

B Basis of Accounting and Presentation
The Department’s fiscal year ends September 30. These financial statements reflect both accrual and budgetary accounting transactions. Under the accrual method of accounting, revenues are recognized when earned and expenses are recognized when incurred, without regard to the receipt or payment of cash. Budgetary accounting is designed to recognize the obligation of funds according to legal requirements, which in many cases is made prior to the occurrence of an accrual-based transaction. Budgetary accounting is essential for compliance with legal constraints and controls over the use of federal funds.
These financial statements have been prepared from the accounting records of the Department in conformance with U.S. generally accepted accounting principles (GAAP) and the form and content for entity financial statements specified by the Office of Management and Budget (OMB) in Circular A-136, Financial Reporting Requirements. GAAP for federal entities are the standards prescribed by the Federal Accounting Standards Advisory Board, which is the official body for setting the accounting standards of the U.S. government.
Throughout these financial statements, intragovernmental assets, liabilities, gross costs, earned revenue, transfers, and other activity represent activity or balances with other federal entities, based upon with whom the transaction or balance is with.
The Department has allocation transfer transactions with other federal agencies as both a transferring (parent) entity and as a receiving (child) entity. Allocation transfers are legal delegations by one department of its authority to obligate budget authority and outlay funds to another department. A separate fund account (allocation account) is created in the U.S. Department of the Treasury (Treasury) as a subset of the parent fund account for tracking and reporting purposes. All allocation transfers of balances are credited to this account, and subsequent obligations and outlays incurred by the child entity are charged to this allocation account as they execute the delegated activity on behalf of the parent entity. Generally, all financial activity related to these allocation transfers (e.g., budgetary resources, obligations incurred, gross costs, and outlays, gross) is reported in the financial statements of the parent entity, from which the underlying legislative authority, appropriations, and OMB apportionments are derived. EDA allocates funds, as the parent, to the U.S. Department of Agriculture’s Rural Development Administration; all financial activity related to these EDA funds is reported in the Department’s financial statements. EDA has received allocation transfers, as the child, from Delta Regional Authority, Appalachian Regional Commission, and Northern Border Regional Commission, and BEA in FY 2016 was a child to an allocation account from the U.S. General Services Administration (GSA). Census Bureau has received allocation transfers in FY 2017, as child, from the U.S. Department of Health and Human Services.
C Funds from Dedicated Collections
Funds from Dedicated Collections are financed by specifically identified revenues, often supplemented by other financing sources that are originally provided to the federal government by a non-federal source, which remain available over time. These specifically identified revenues and other financing sources are required by statute to be used for designated activities, benefits, or purposes, and must be accounted for separately from the federal government’s general revenues.
Funds from Dedicated Collections include general funds, revolving funds (not including credit reform financing funds), special funds, and trust funds. (See Note 22, Funds from Dedicated Collections.)
D Elimination of Intra-entity and Intra-Departmental Transactions and Balances
Transactions and balances within a reporting entity (intra-entity), and transactions and balances among the Department’s entities (intra-Departmental), have been eliminated from the Consolidated Balance Sheets and Consolidated Statements of Net Cost, and are excluded from the consolidated total column of the Consolidated Statements of Changes in Net Position. The Statements of Budgetary Resources are presented on a combined basis; therefore, intra-Departmental and intra-entity transactions and balances have not been eliminated from these statements.
56 | FY 20 17 AGENCY F I NANC IAL REPORT
NOTES TO THE F I NANC IAL STATEMENTS
E Fund Balance with Treasury
Fund Balance with Treasury is the aggregate amount of funds in the Department’s accounts with Treasury. Deposit Funds include amounts held in customer deposit accounts.
Treasury processes cash receipts and disbursements for the Department’s domestic operations. Cash receipts and disbursements for the Department’s overseas operations are primarily processed by the U.S. Department of State’s financial service centers.
F Investment
Investment in Federal Securities consists of an interest-bearing, market-based Treasury security (note), purchased by NTIA’s Public Safety Trust Fund from Treasury at a discount. This investment is presented on the Department’s Consolidated Balance Sheet at acquisition cost, net of amortization of the discount. The discount will be amortized over the life of the Treasury security using the interest method. Under the interest method, the effective interest rate (the actual interest yield on amounts invested) multiplied by the carrying amount of the Treasury security at the start of the accounting period equals the interest income recognized during the period (the carrying amount changes each period by the amount of the amortized discount). The amount of the amortization of the discount is the difference between the effective interest recognized for the period and the nominal interest for the Treasury security. The market value of the Treasury security is not recorded on the Balance Sheet because this investment is expected to be held to maturity. See Note 3, Investment, for disclosure of the market value of the Treasury security, which was provided by Treasury. For purposes of determining market values, investments should be grouped by the type of security, such as market-based or marketable Treasury securities. The market value of investments in a group is calculated by the market price of securities of that group at the financial reporting date multiplied by the number of notes or bonds held at the financial reporting date.
G Accounts Receivable, Net
Accounts Receivable are recognized primarily when the Department performs reimbursable services or sells goods. Accounts Receivable are reduced to net realizable value by an Allowance for Uncollectible Accounts. This allowance is estimated periodically using methods such as the identification of specific delinquent receivables, and the analysis of aging schedules and historical trends adjusted for current market conditions.
H Advances and Prepayments
Advances are payments the Department has made to cover a part or all of a grant recipient’s anticipated expenses, or are advance payments for the cost of goods and services to be acquired. For grant awards, the recipient is required to periodically (for example, quarterly) report the amount of costs incurred. Prepayments are payments the Department has made to cover certain periodic expenses before those expenses are incurred, such as subscriptions and rent. Advances and Prepayments are included in Other Assets.
I Direct Loans and Loan Guarantees, Net
A direct loan is recorded as a receivable after the Department disburses funds to a borrower. The Department also makes loan guarantees with respect to the payment of all or part of the principal or interest on debt obligations of non-federal borrowers to non-federal lenders. A borrower-defaulted loan guaranteed by the Department is recorded as a receivable from the borrower after the Department disburses funds to the lender.
Interest Receivable generally represents uncollected interest income earned on loans. For past-due loans, only up to 180 days of interest income is generally recorded.
FY 20 17 AGENCY F I NANC IAL REPORT | 57
NOTES TO THE F I NANC IAL STATEMENTS

Foreclosed Property is acquired primarily through foreclosure and voluntary conveyance, and is recorded at the fair market value at the time of acquisition. Foreclosed Property is adjusted to the current fair market value each fiscal year-end.
Direct Loans and Loan Guarantees Obligated before October 1, 1991 (pre-FY 1992): Loans Receivable are reduced by an Allowance for Loan Losses, which is based on an analysis of each loan’s outstanding balance. The value of each receivable, net of any Allowance for Loan Losses, is supported by the values of any pledged collateral and other assets available for liquidation, and by the Department’s analysis of financial information of parties against whom the Department has recourse for the collection of these receivables.
Direct Loans and Loan Guarantees Obligated after September 30, 1991 (post-FY 1991): Post-FY 1991 obligated direct loans and loan guarantees and the resulting receivables are governed by the Federal Credit Reform Act of 1990.
For a direct or guaranteed loan disbursed during a fiscal year, a subsidy cost is initially recognized. Subsidy costs are intended to estimate the long-term cost to the U.S. government of its loan programs. The subsidy cost equals the present value of estimated cash outflows over the life of the loan, minus the present value of estimated cash inflows, discounted at the applicable Treasury interest rate. Administrative costs such as salaries are not included in the subsidy costs. Subsidy costs can arise from interest rate differentials, interest subsidies, delinquencies and defaults, loan origination and other fees, and other cash flows. The Department calculates its subsidy costs based on a model created and provided by OMB.
A Loan Receivable is recorded at the present value of the estimated cash inflows less cash outflows. The difference between the outstanding principal of the loan and the present value of its net cash inflows is recorded as the Allowance for Subsidy Cost. A subsidy reestimate is normally performed annually, as of September 30. The subsidy reestimate takes into account all factors that may have affected the estimated cash flows. Any adjustment resulting from the reestimate is recognized as a subsidy expense (or a reduction in subsidy expense). The portion of the Allowance for Subsidy Cost related to subsidy modifications and reestimates is calculated annually, as of September 30.
The amounts of any downward subsidy reestimates as of September 30 must be disbursed to Treasury in the subsequent fiscal year. Appropriations are normally obtained in the following fiscal year for any upward subsidy reestimates.
J Inventory, Materials, and Supplies, Net
Inventory, Materials, and Supplies, Net are stated at the lower of cost or net realizable value primarily under the average, weighted-average, and first-in, first-out methods, and are adjusted for the results of physical inventories. Inventory, Materials, and Supplies are expensed when consumed. There are no restrictions on their sale, use, or disposition.
K General Property, Plant, and Equipment, Net
General Property, Plant, and Equipment, Net (PP&E) is composed of capital assets used in providing goods or services. General PP&E is stated at full cost, including all costs related to acquisition, delivery, and installation, less Accumulated Depreciation. Acquisitions of General PP&E include assets purchased, or assets acquired through other means such as through transfer in from another federal entity, donation, devise (a will or clause of a will disposing of property), judicial process, exchange between a federal entity and a non-federal entity, and forfeiture. General PP&E also includes assets acquired through capital leases, which are initially recorded at the amount recognized as a liability for the capital lease at its inception.
58 | FY 20 17 AGENCY F I NANC IAL REPORT
NOTES TO THE F I NANC IAL STATEMENTS
Capitalization Thresholds:
Single-asset Acquisitions: The Department’s policy is to capitalize single-asset acquisitions of General PP&E if the useful life is two years or more and the dollar amount meets the entity’s single-asset acquisition capitalization threshold. Based on a Department-wide capitalization thresholds review, which reflects materiality and cost-benefit analyses, the Department’s single-asset acquisition capitalization thresholds for both FY 2017 and FY 2016 are as follows: NOAA—$200 thousand or more; NIST—$100 thousand or more; USPTO—$50 thousand or more; and all other bureaus and Departmental Management—$25 thousand or more, except that NTIA’s First Responder Network Authority has a single-asset acquisition capitalization threshold of $5 thousand.
Personal Property Bulk Acquisitions: For FY 2017 and FY 2016, NOAA has a personal property bulk acquisition capitalization threshold of $1.0 million or more where individual items cost $25 thousand or more but less than $200 thousand; NIST has a personal property bulk acquisition capitalization threshold of $500 thousand or more. All other bureaus and Departmental Management have a personal property bulk acquisition capitalization threshold of $250 thousand or more, except that USPTO has a furniture bulk acquisition capitalization threshold of $50 thousand or more and NTIA’s First Responder Network Authority has a personal property bulk acquisition capitalization threshold of $50 thousand or more.
General PP&E not meeting the applicable capitalization threshold is expensed.
Depreciation: Depreciation is recognized on a straight-line basis over the estimated useful life of the asset with the exception of leasehold improvements, which are depreciated over the remaining life of the lease or over the useful life of the improvement, whichever is shorter. Land, Construction-in-progress, and Internal Use Software in Development are not depreciated.
Construction-in-progress: Costs for the construction, modification, or modernization of General PP&E are initially recorded as Construction-in-progress. The Department’s construction-in-progress consists primarily of satellites under development for NOAA, and major laboratory renovations and construction projects under development for NIST. Upon completion of the work, the costs are transferred to the appropriate General PP&E account.
Internal Use Software: Internal Use Software includes purchased commercial off-the-shelf (COTS) software and internally or contractor-developed software solely to meet the Department’s internal or operational needs. Internally developed software includes the full cost (direct and indirect cost) incurred during the software development stage. For contractor-developed software, capitalized costs include the costs for the contractor to design, program, install, and implement the software.
Real Property: GSA provides most of the facilities in which the Department operates, and generally charges rent based on comparable commercial rental rates under operating leases. Accordingly, GSA-owned properties under operating leases are not included in the Department’s General PP&E. The Department’s real property primarily consists of facilities for NIST and NOAA.
L Cost Contribution to Buildout of Nationwide Public Safety Broadband Network
This asset captures NTIA’s cumulative cost contributions for the buildout of the Nationwide Public Safety Broadband Network (NPSBN) as described in Note 22, Funds from Dedicated Collections – NTIA’s Network Construction Fund, less any accumulated amortization. Amortization of the cost contributions has not yet begun as of September 30, 2017. The cost contributions that are recorded as an asset include (a) costs incurred for completed and accepted AT&T contract performance for the buildout of NPSBN under the First Responder Network Authority (FirstNet)-U.S. Department of the Interior (DOI) contract to buildout, operate, and maintain NPSBN; and (b) accrued costs for estimated, unbilled AT&T contract performance progress for buildout of NPSBN under the FirstNet-DOI contract.
FY 20 17 AGENCY F I NANC IAL REPORT | 59
NOTES TO THE F I NANC IAL STATEMENTS
An asset is recognized primarily because the cost contributions for the buildout of NPSBN embodies (a) future economic benefits to NTIA from AT&T made possible in part by NTIA’s cost contributions, as there are expected future revenue streams from AT&T to NTIA per the DOI-AT&T contract terms; and (b) future expected services to be received by NTIA from AT&T made possible in part by NTIA’s cost contributions, as AT&T, per the DOI-AT&T contract terms, will buildout, maintain, and operate NPSBN, thereby assisting NTIA’s FirstNet with achieving its important mission of ensuring the building, deployment, and operation of the first high-speed, nationwide wireless broadband network dedicated to public safety.
Amortization of the cost contributions will begin, over the estimated life(s), (a) when the applicable revenue stream(s) begin to take effect; and/or (b) the applicable services to be received begin.
M Non-entity Assets
Non-entity assets, included in the Department’s Consolidated Balance Sheets, are assets held by the Department that are not available for use in its operations, and for which a liability has been recorded. Non-entity Fund Balance with Treasury includes customer deposits held by the Department until customer orders are received, and monies payable to the General Fund of the U.S. Government for custodial and loan programs activity.
N Liabilities
A liability for federal accounting purposes is a probable and measurable future outflow or other sacrifice of resources as a result of past transactions or events.
Accounts Payable: Accounts Payable are amounts primarily owed for goods, services, or capitalized assets received, progress on contract performance by others, and other expenses due.
Debt to Treasury: The Department has borrowed funds from Treasury through the Fisheries Finance Financing Account for various NOAA direct loan programs. To simplify interest calculations, the Fisheries Finance Financing Account borrowings are dated October 1. Interest rates are based on a weighted average of rates during the term of the borrowed funds. The weighted average rate for each cohort’s borrowing is recalculated at the end of each fiscal year during which disbursements are made. Annual interest payments on unpaid principal balances as of September 30 are required. Principal repayments are required only at maturity, but are permitted at any time during the term of the loan. The Department’s primary financing source for repayments of Debt to Treasury is the collection of principal on the associated Loans Receivable. Balances of any borrowed but undisbursed Fisheries Finance Financing Account debt will earn interest at the same rate used in calculating interest expense. The amounts reported for Debt to Treasury include accrued interest payable. See Note 11, Debt to Treasury, for information regarding maturity dates.
Unearned Revenue: Unearned Revenue is the portion of monies received for which goods and services have not yet been provided or rendered by the Department. Revenue is recognized as reimbursable costs are incurred, and the Unearned Revenue balance is reduced accordingly. Unearned Revenue also includes the balances of customer deposit accounts held by the Department. The intragovernmental Unearned Revenue primarily relates to monies collected in advance under reimbursable agreements. The majority of the Unearned Revenue with the public represents patent and trademark application and user fees that are pending action.
Liability to General Fund of the U.S. Government for Deficit Reduction: NTIA’s Public Safety Trust Fund was created as a result of Section 6413 of the Middle Class Tax Relief and Job Creation Act of 2012 (Act). The Act provides funding for specified programs and activities, to be derived from the proceeds of Federal Communications Commission auctions of spectrum licenses, to be deposited into the Public Safety Trust Fund. The Act directs the use of auction proceeds in an order of priority after the repayment of borrowings from
60 | FY 20 17 AGENCY F I NANC IAL REPORT
NOTES TO THE F I NANC IAL STATEMENTS

Treasury (priority 1), which was fully completed in September 2015. Priority 8 of the Act specifies that any remaining amounts deposited into the Public Safety Trust Fund shall be deposited in the General Fund of the U.S. Government for deficit reduction. The Act further specifies that any amounts remaining in the Public Safety Trust Fund after the end of FY 2022 shall be deposited in the General Fund of the U.S. Government for deficit reduction. The Department records a liability (not covered by budgetary resources) to the General Fund of the U.S. Government for the monies owed for priority 8. A corresponding use of financing sources is recorded on the Consolidated Statement of Changes in Net Position, Other Financing Sources (Non-exchange) section.
Custodial Payable to Treasury: Custodial Payable to Treasury represents the amount of applicable custodial non-exchange or exchange revenue yet to be transferred to the General Fund of the U.S. Government. See the Consolidated Statements of Custodial Activity and related Note 20 for more information on the Department’s custodial activity.
Resources Payable to Treasury: Resources Payable to Treasury primarily includes assets in excess of liabilities that are being held as working capital in the Department’s liquidating fund groups, which account for loan programs prior to October 1, 1991 (pre-FY 1992).
Accrued FECA Liability: The Federal Employees’ Compensation Act (FECA) provides income and medical cost protection to covered federal civilian employees injured on the job, to employees who have incurred work-related occupational diseases, and to beneficiaries of employees whose deaths are attributable to job-related injuries or occupational diseases. The FECA program is administered by the U.S. Department of Labor (DOL), which pays valid claims against the Department and subsequently seeks reimbursement from the Department for these paid claims. Accrued FECA Liability, included in Intragovernmental Other Liabilities, represents amounts due to DOL for claims paid on behalf of the Department.
Federal Employee Benefits:
Actuarial FECA Liability: Actuarial FECA Liability represents the liability for future workers’ compensation (FWC) benefits, which includes the expected liability for death, disability, medical, and miscellaneous costs for approved cases. The liability is determined by DOL annually, as of September 30, using a method that utilizes historical benefits payment patterns related to a specific incurred period to predict the ultimate payments related to that period. Projected annual payments were discounted to present value based on OMB’s interest rate assumptions which were interpolated to reflect the average duration in years for income payments and medical payments.
To provide more specifically for the effects of inflation on the liability for FWC benefits, wage inflation factors (Cost of Living Adjustment) and medical inflation factors (Consumer Price Index – Medical) are applied to the calculation of projected future benefits. The actual rates for these factors are also used to adjust the historical payments to current-year constant dollars.
For FY 2017, to test the reliability of the model, DOL performed comparisons between projected payments in the last year to actual amounts, by agency. Changes in the liability from last year’s analysis to this year’s analysis were also examined by DOL, by agency, with any significant differences by agency inspected in greater detail. The same reliability testing was performed in FY 2016. The model has been stable, and has projected the actual payments by agency well.
NOAA Corps Retirement System Liability and NOAA Corps Post-retirement Health Benefits Liability: These liabilities are recorded at the actuarial present value of projected benefits, calculated annually, as of September 30. The actuarial cost method used to determine these liabilities is the aggregate entry age normal method. Under this method, the actuarial present value of projected benefits is allocated on a level basis over the earnings or the service of the group between entry age and assumed exit ages. The portion of this actuarial present value allocated to the valuation year is called the normal cost. For purposes of calculating the normal cost, certain actuarial assumptions utilized for the actual valuation of the U.S. Military Retirement System are used. Actuarial gains and losses, and prior and past service costs, if any, are recognized immediately in the fiscal year they occur, without
FY 20 17 AGENCY F I NANC IAL REPORT | 61
NOTES TO THE F I NANC IAL STATEMENTS

amortization. The medical claim rates used for the NOAA Corps Post-retirement Health Benefits Liability actuarial calculations are based on the claim rates used for the U.S. Department of Defense Medicare-Eligible Retiree Health Care Fund actuarial valuations. Demographic assumptions appropriate to covered personnel are also used. For background information about these plans, see Note 1.R, Employee Retirement Benefits.
Environmental and Disposal Liabilities: The Department has incurred asbestos-related cleanup costs related to the costs of removing, containing, and/or disposing of asbestos-containing materials from property, plant, and equipment; specifically, from facilities owned by NIST and NOAA, and from ships owned by NOAA. The Department has estimated its liabilities for asbestos-related cleanup costs for both friable and nonfriable asbestos-related cleanup costs. Estimates of asbestos-related cleanup costs are reviewed periodically, and updated as appropriate, to account for actual or estimated increases or decreases in asbestos-containing materials, material changes due to inflation or deflation, and changes in regulations, plans, and/or technology.
NIST operates a nuclear reactor licensed by the U.S. Nuclear Regulatory Commission, in accordance with NIST’s mission of setting standards and examining new technologies. NIST’s Environmental and Disposal Liability estimates were updated for FY 2017, pursuant to U.S. Nuclear Regulatory Commission Regulation-1307, Rev 16, which states: “licenses must annually adjust the estimate of the cost of decommissioning their plants in dollars of the current year, as a part of the process to provide reasonable assurance that adequate funds for decommissioning will be available when needed.” The Department currently estimates the cost of decommissioning this facility to be $75.0 million. NIST’s decommissioning estimate includes an assumption that an offsite waste disposal facility will become available, when needed, estimated in 2029. Currently, an offsite disposal location has not been identified, and NIST’s Environmental and Disposal Liability estimate includes an amount approved by the Nuclear Regulatory Commission for offsite waste disposal. The total estimated decommissioning cost is being accrued on a straight-line basis over the expected life of the facility. Under current legislation, funds to cover the expense of decommissioning the facility’s nuclear reactor should be requested in a separate appropriation when the decommissioning date becomes relatively certain.
The Department has incurred cleanup costs related to the costs of removing, containing, and/or disposing of hazardous waste from facilities used by NOAA. The Department has estimated its liabilities for environmental cleanup costs at all NOAA-used facilities, including the decommissioning of ships. The largest of NOAA’s environmental liabilities relates to the cleanup of the Pribilof Islands in Alaska, which contains waste from the U.S. Department of Defense’s use during World War II. Such cleanup activities are the responsibility of the Department because it became the successor agency of the waste generated from war-related programs. The Department does not recognize a liability for environmental cleanup costs for NOAA-used facilities that are less than $25 thousand per project. When an estimate of cleanup costs includes a range of possible costs, the most likely cost is reported. When no cost is more likely than another, the lowest estimated cost in the range is reported. The liability is reduced as progress payments are made.
The Department may have liabilities associated with lead-based paints at certain NOAA facilities. The Department has scheduled surveys to assess the potential for liabilities for lead-based paint contamination. All known issues, however, are contained, and NOAA facilities meet current environmental standards. No cost estimates are presently available for facilities that have not yet been assessed for lead-based paint issues.
Accrued Payroll and Annual Leave: These categories include salaries, wages, and other compensation earned by employees, but not disbursed as of September 30. Annually, as of September 30, the balances of Accrued Annual Leave are adjusted to reflect current pay rates. Sick leave and other types of non-vested leave are expensed as taken.
62 | FY 20 17 AGENCY F I NANC IAL REPORT
NOTES TO THE F I NANC IAL STATEMENTS
Accrued Grants: The Department administers a diverse array of financial assistance programs and projects concerned with the entire spectrum of business and economic development efforts that promote activities such as expanding U.S. exports, creating jobs, contributing to economic growth, developing innovative technologies, promoting minority entrepreneurship, protecting coastal oceans, providing weather services, managing worldwide environmental data, and using telecommunications and information technologies to better provide public services. Disbursements of funds under the Department’s grant programs are generally made when requested by recipients. These drawdown requests may be fulfilled before recipients make the expenditures under the grant. When the Department has disbursed funds but the recipient has not yet incurred expenses, these disbursements are recorded as advances to the recipient. If a recipient, however, has expenditures under the grant as of September 30 that have not been advanced by the Department as of September 30, such amounts are recorded as grant expenses and Accrued Grants as of September 30.
Capital Lease Liabilities: Capital leases are leases for property, plant, and equipment that transfer substantially all the benefits and risks of ownership to the Department.
Contingent Liabilities and Contingencies: A contingency is an existing condition, situation, or set of circumstances involving uncertainty as to possible gain or loss. The uncertainty will ultimately be resolved when one or more future events occur or fail to occur. A contingent liability (included in Other Liabilities) and an expense are recognized when a past event has occurred, and a future outflow or other sacrifice of resources is measurable and probable. A contingency is considered probable when the future confirming event or events are more likely than not to occur, with the exception of pending or threatened litigation and unasserted claims. For pending or threatened litigation and unasserted claims, a contingency is considered probable when the future confirming event or events are likely to occur. A contingency is disclosed in the Notes to the Financial Statements if any of the conditions for liability recognition are not met and there is at least a reasonable possibility that a loss or an additional loss may have been incurred. A contingency is considered reasonably possible when the chance of the future confirming event or events occurring is more than remote but less than probable. A contingency is not recognized as a contingent liability and an expense nor disclosed in the Notes to the Financial Statements when the chance of the future event or events occurring is remote. A contingency is considered remote when the chance of the future event or events occurring is slight.
Liabilities Not Covered by Budgetary Resources: These are liabilities, included in the Department’s Consolidated Balance Sheets, for which actions are needed before budgetary resources can be provided. The Department anticipates that liabilities not covered by budgetary resources will be funded from future budgetary resources when required. These amounts are detailed in Note 16.
NTIA’s Public Safety Trust Fund has assets on hand as of September 30 for its Liability to General Fund of the U.S. Government for Deficit Reduction; however, budgetary resources will need to be apportioned by OMB in order for the Public Safety Trust Fund to transfer funds against this liability.
Under accrual accounting, the expense for annual leave is recognized when the leave is earned. However, for most of the Department’s fund groups, appropriations are provided to pay for the leave when it is taken. As a result, budgetary resources do not cover a large portion of the Department’s Accrued Annual Leave liability.
The Department generally receives budgetary resources for its Federal Employee Benefits liability when needed for disbursements.
Due to USPTO’s funding structure, budgetary resources do not cover a portion of its Unearned Revenue. The Unearned Revenue reported in Note 16 is the portion of USPTO’s Unearned Revenue that is considered not covered by budgetary resources. USPTO’s Unearned Revenue is a liability for revenue received before the patent or trademark work has been completed. Budgetary resources derived from the current reporting period’s revenue have been partially used to cover the current reporting period’s costs associated
FY 20 17 AGENCY F I NANC IAL REPORT | 63
NOTES TO THE F I NANC IAL STATEMENTS

with unearned revenue from a prior reporting period. In addition, the current patent fee structure sets low initial application fees that are followed by income from maintenance fees as a supplement in later years to cover the full cost of the patent examination and issuance processes. The combination of these funding circumstances requires USPTO to obtain additional budgetary resources to cover its liability for unearned revenue.
O Commitments
Commitments are preliminary actions that will ultimately result in an obligation to the U.S. government if carried through, such as purchase requisitions, estimated travel orders, or unsigned contracts/grants. Major long-term commitments are disclosed in Note 17, Commitments and Contingencies.
P Net Position
Net Position is the residual difference between assets and liabilities, and is composed of Unexpended Appropriations and Cumulative Results of Operations.
Unexpended Appropriations represent the total amount of unexpended budget authority that is classified as appropriations, both obligated and unobligated. Unexpended Appropriations is increased for Appropriations Received, is reduced for Appropriations Used, and is adjusted for other changes in appropriations, such as transfers and rescissions. Cumulative Results of Operations is the net result of the Department’s operations since inception.
Q Revenues and Other Financing Sources
Appropriations Used: Most of the Department’s operating funds are provided by congressional appropriations of budget authority. The Department receives appropriations on annual, multiple-fiscal year, and no-year bases. Upon expiration of an annual or multiple-fiscal year appropriation, the obligated and unobligated balances retain their fiscal year identity, and are maintained separately within an expired account. The unobligated balances can be used to make legitimate obligation adjustments, but are otherwise not available for expenditures. Annual and multiple-fiscal year appropriations are canceled at the end of the fifth fiscal year after expiration. No-year appropriations do not expire. Appropriations of budget authority are recognized as used when costs are incurred, for example, when goods and services are received or benefits and grants are provided.
Exchange and Non-exchange Revenue: The Department classifies revenue as either exchange revenue or non-exchange revenue. Exchange revenue is derived from transactions in which both the federal government and the other party receive value, including processing patents and registering trademarks, the sale of weather data, nautical charts, and navigation information, reimbursable revenue, and other sales of goods and services. Exchange revenue is presented in the Department’s Consolidated Statements of Net Cost. Non-exchange revenue is derived from the federal government’s sovereign right to demand payment; and, for example, includes revenue of NOAA’s Damage Assessment and Restoration Revolving Fund as reported and described in Note 22, Funds from Dedicated Collections. Non-exchange revenue is recognized when a specifically identifiable, legally enforceable claim to resources arises, and to the extent that collection is probable and the amount is reasonably estimable. Non-exchange revenue is not considered to reduce the cost of the Department’s operations and is therefore reported in the Consolidated Statements of Changes in Net Position as a financing source.
In certain cases, law or regulation sets the prices charged by the Department, and, for program and other reasons, the Department may not receive full cost (e.g., the processing of patents and registering of trademarks, and the sale of weather data, nautical charts, and navigation information). Prices set for products and services offered through the Department’s working capital funds are intended to recover the full costs incurred by these activities.
64 | FY 20 17 AGENCY F I NANC IAL REPORT
NOTES TO THE F I NANC IAL STATEMENTS
Imputed Financing Sources from Cost Absorbed by Others (and Related Imputed Costs): In certain cases, operating costs of the Depart-ment are paid for in full or in part by funds appropriated to other federal entities. For example, Civil Service Retirement System pension benefits for applicable Departmental employees are paid for in part by the U.S. Office of Personnel Management (OPM), and certain legal judgments against the Department are paid for in full from the Judgment Fund maintained by Treasury. The Department includes applicable imputed costs in the Consolidated Statements of Net Cost. In addition, Imputed Financing Sources from Cost Absorbed by Others is recognized in the Consolidated Statements of Changes in Net Position as an other financing source (non-exchange).
Transfers In/(Out): Intragovernmental transfers, for example, of budgetary resources, or of assets without reimbursement that are recorded at book value, are reported in the Consolidated Statements of Changes in Net Position.
R Employee Retirement Benefits
Civil Service Retirement System (CSRS) and Federal Employees Retirement System (FERS): Most employees of the Department participate in either the CSRS or FERS defined-benefit pension plans. FERS went into effect on January 1, 1987. FERS and Social Security automatically cover most employees hired after December 31, 1983. Employees hired prior to January 1, 1984 could elect to either join FERS and Social Security, or remain in CSRS.
The Department is not responsible for and does not report CSRS or FERS assets, accumulated plan benefits, or liabilities applicable to its employees. OPM, which administers the plans, is responsible for and reports these amounts.
For CSRS-covered regular employees, the Department was required to make contributions to the plan equal to 7 percent of an employee’s basic pay. Employees contributed 7 percent of basic pay. For each fiscal year, OPM calculates the U.S. government’s service cost for covered employees, which is an estimate of the amount of funds, that, if accumulated annually and invested over an employee’s career, would be enough to pay that employee’s future benefits. Since the U.S. government’s estimated service cost exceeds contributions made by employer agencies and covered employees, this plan is not fully funded by the Department and its employees. The Department has recognized an imputed cost, and an imputed financing source from cost absorbed by others, for the difference between the estimated service cost and the contributions made by the Department and its covered employees.
Effective October 1, 2014, for FERS-covered regular employees hired prior to January 1, 2013, the Department was required to make contributions of 13.2 percent of basic pay. Employees contributed 0.8 percent of basic pay. For regular employees hired after December 31, 2012, as defined in Public Law 112-96, Section 5001, the Department was required to make contributions of 11.1 percent of basic pay. Regular employees hired between December 31, 2012 and December 31, 2013 contributed 3.1 percent of basic pay. Regular employees hired after December 31, 2013 contributed 4.4 percent of basic pay. For each fiscal year, OPM calculates the U.S. government’s service cost for covered employees. Since the U.S. government’s estimated service cost exceeds contributions made by employer agencies and covered employees, this plan was not fully funded by the Department and its employees. The Department has recognized an imputed cost, and an imputed financing source from cost absorbed by others, for the difference between the estimated service cost and the contributions made by the Department and its covered employees.
Employees participating in FERS are covered under the Federal Insurance Contributions Act, for which the Department contributes a matching amount to the Social Security Administration.
NOAA Corps Retirement System: Active-duty officers of the NOAA Corps are covered by the NOAA Corps Retirement System, an unfunded, pay-as-you-go, defined-benefit plan administered by the Department. Participants do not contribute to this plan. Plan benefits are based primarily on years of service and compensation. Participants, as of September 30, 2017, included 313 active
FY 20 17 AGENCY F I NANC IAL REPORT | 65
NOTES TO THE F I NANC IAL STATEMENTS

duty officers, 382 nondisability retiree annuitants, 14 disability retiree annuitants, and 60 surviving families. Key provisions include voluntary nondisability retirement after 20 years of active service, disability retirement, optional survivor benefits, Consumer Price Index (CPI) optional survivor benefits, and CPI adjustments for benefits.
Foreign Service Retirement and Disability System, and the Foreign Service Pension System: Foreign Commercial Officers are covered by the Foreign Service Retirement and Disability System and the Foreign Service Pension System. ITA makes contributions to the systems based on a percentage of an employee’s pay. Both systems are multi-employer plans administered by the U.S. Department of State. The Department is not responsible for and does not report plan assets, accumulated plan benefits, or liabilities applicable to its employees. The U.S. Department of State, which administers the plan, is responsible for and reports these amounts.
Thrift Savings Plan (TSP): Employees covered by CSRS and FERS are eligible to contribute to the U.S. government’s TSP, administered by the Federal Retirement Thrift Investment Board. A TSP account is automatically established for FERS-covered employees, and the Department makes a mandatory contribution of one percent of basic pay. The Department also makes matching contributions of up to four percent of basic pay for FERS-covered employees. FERS and CSRS-covered employees have no limit on the percentage of pay contributed to their TSP account. However, the total employee regular contribution for 2017 and 2016 may not exceed the IRS limit of $18 thousand. The Department makes no matching contributions for CSRS-covered employees. TSP participants age 50 or older who are already contributing the maximum amount of contributions for which they are eligible may also make catch-up contributions, subject to the IRS dollar limit for catch-up contributions.
Federal Employees Health Benefit (FEHB) Program: Most Departmental employees are enrolled in the FEHB Program, which provides post-retirement health benefits. OPM administers this program and is responsible for the reporting of liabilities. Employer agencies and covered employees are not required to make any contributions for post-retirement health benefits. OPM calculates the U.S. government’s service cost for covered employees each fiscal year. The Department has recognized the entire service cost of these post-retirement health benefits for covered employees as an imputed cost, and an imputed financing source from cost absorbed by others.
NOAA Corps Post-retirement Health Benefits: Active-duty officers of the NOAA Corps are covered by the health benefits program for the NOAA Corps, which provides post-retirement health benefits. This is a pay-as-you-go plan administered by the Department. Participants do not make any contributions to this plan.
Federal Employees’ Group Life Insurance (FEGLI) Program: Most Department employees are entitled to participate in the FEGLI Program. Participating employees can obtain basic term life insurance, with the employee paying two-thirds of the cost and the Department paying one-third. Additional coverage is optional, to be paid fully by the employee. The basic life coverage may be continued into retirement if certain requirements are met. OPM administers this program and is responsible for the reporting of liabilities. For each fiscal year, OPM calculates the U.S. government’s service cost for the post-retirement portion of basic life coverage. Because the Department’s contributions to the basic life coverage are fully allocated by OPM to the pre-retirement portion of coverage, the Department has recognized the entire service cost of the post-retirement portion of basic life coverage as an imputed cost and an imputed financing source from cost absorbed by others.
66 | FY 20 17 AGENCY F I NANC IAL REPORT
NOTES TO THE F I NANC IAL STATEMENTS
S Use of Estimates
The preparation of financial statements requires the Department to make estimates and assumptions that affect these financial statements. Actual results may differ from those estimates.
T Tax Status
The Department is not subject to federal, state, or local income taxes. Accordingly, no provision for income taxes is recorded.
U Fiduciary Activities
Fiduciary activities are the collection or receipt, and the management, protection, accounting, and disposition by the federal government of cash or other assets in which non-federal individuals or entities have an ownership interest that the federal government must uphold. Fiduciary cash and other assets are not assets of the federal government, and, accordingly, are not recognized in the Department’s financial statements.
The Department’s fiduciary activities consist of the following:
The Patent Cooperation Treaty authorizes USPTO to collect patent filing and search fees on behalf of the World Intellectual Property Organization (WIPO), European Patent Office, Korean Intellectual Property Office, Russian Intellectual Property Organization, Israeli Patent Office, Japanese Patent Office, Intellectual Property Office of Singapore, and Australian Patent Office from U.S. citizens requesting an international patent. The Madrid Protocol Implementation Act authorizes USPTO to collect trademark application fees on behalf of the International Bureau of WIPO from U.S. citizens requesting an international trademark. These fiduciary activities are reported in Note 21.
FY 20 17 AGENCY F I NANC IAL REPORT | 67
NOTES TO THE F I NANC IAL STATEMENTS

NOTE 2. FUND BALANCE WITH TREASURY
Fund Balance with Treasury, by type, is as follows:
FY 2017 FY 2016
General Funds $ 9,109,913 $ 8,816,535Revolving Funds NTIA’s Network Construction Fund (Note 22) 5,574,439 6,642,633 Other Revolving Funds 849,618 883,590
Special Funds
NTIA’s Digital Television Transition and Public Safety Fund (Note 22) 8,821,057 8,822,531
USPTO’s Patent and Trademark Surcharge Fund (Note 22) 233,529 233,529 Other Special Funds 133,158 128,741Deposit Funds 148,538 146,849Trust Funds NTIA’s Public Safety Trust Fund (Note 22) 145,427 176,870 Other Trust Funds 1,528 2,802Other Fund Types 13,733 17,975
Total $ 25,030,940 $ 25,872,055
Status of Fund Balance with Treasury is as follows:
FY 2017 FY 2016
Reduction of Budgetary ResourcesNot Available
Digital Television Transition and Public Safety Fund $ 8,807,394 $ 8,807,394Temporarily Precluded from Obligation 952,159 974,270
Unobligated BalanceAvailable 7,519,504 8,632,970Unavailable 613,380 550,451
Obligated Balance Not Yet Disbursed 6,745,489 6,510,831Non-budgetary
Patent and Trademark Surcharge Fund 233,529 233,529Deposit Funds, and General Fund Receipt Accounts 159,485 162,610
Total $ 25,030,940 $ 25,872,055
Unobligated Balance and Obligated Balance Not Yet Disbursed amounts reported above do not agree with related amounts included in the Status of Budgetary Resources and Change in Unpaid Obligated Balance, Net sections of the Combined Statements of Budgetary Resources (SBR), respectively, primarily because the budgetary amounts reported in the SBR are also supported by amounts other than Fund Balance With Treasury—Investment; and Borrowing Authority.
See Note 19, Combined Statements of Budgetary Resources, for legal arrangements affecting the Department’s use of Fund Balance with Treasury for FY 2017 and FY 2016.
See Note 22, Funds from Dedicated Collections, for more information regarding the Network Construction Fund, the Digital Television Transition and Public Safety Fund, the Patent and Trademark Surcharge Fund, the USPTO Salaries and Expenses Fund, and the Public Safety Trust Fund.
68 | FY 20 17 AGENCY F I NANC IAL REPORT
NOTES TO THE F I NANC IAL STATEMENTS

NOTE 3. INVESTMENT
FY 2017
Investment in Federal Securities Cost
Amortization Method
Amortized Discount
Interest Receivable
Investment, Net
Other Adjustments
Market Value Disclosure
IntragovernmentalNon-marketable Market-based $ 333,013 Interest Method $ 52 $ 1,041 $ 334,106 $ – $ 334,106
FY 2016
Investment in Federal Securities Cost
Amortization Method
Amortized Discount
Interest Receivable
Investment, Net
Other Adjustments
Market Value Disclosure
IntragovernmentalNon-marketable Market-based $ 333,013 Interest Method $ – $ – $ 333,013 $ – $ 332,961
NOTE 4. ACCOUNTS RECEIVABLE, NET
FY 2017
Accounts Receivable,
Gross
Allowance for Uncollectible
Accounts
Accounts Receivable,
Net
Intragovernmental $ 100,522 $ – $ 100,522
With the Public $ 56,580 $ (10,204) $ 46,376
FY 2016
Accounts Receivable,
Gross
Allowance for Uncollectible
Accounts
Accounts Receivable,
Net
Intragovernmental $ 107,394 $ – $ 107,394
With the Public $ 56,490 $ (10,411) $ 46,079
FY 20 17 AGENCY F I NANC IAL REPORT | 69
NOTES TO THE F I NANC IAL STATEMENTS

NOTE 5. CASH
FY 2017 FY 2016
Cash Not Yet Deposited with Treasury $ 5,359 $ 5,580Imprest Funds 338 406Other Cash 39 –
Total $ 5,736 $ 5,986
Cash Not Yet Deposited with Treasury primarily represents patent and trademark fees that were not processed as of September 30, 2017 and 2016, due to the lag time between receipt and initial review. Certain bureaus maintain other cash for operational necessity, such as law enforcement activities and for environments that do not permit the use of electronic payments.
NOTE 6. DIRECT LOANS AND LOAN GUARANTEES, NET
The Department operates the following direct loan and loan guarantee programs:
Direct Loan Programs:EDA Drought Loan PortfolioEDA Economic Development Revolving FundNOAA Alaska Purse Seine Fishery Buyback LoansNOAA Bering Sea and Aleutian Islands Non-Pollock Buyback LoansNOAA Bering Sea Pollock Fishery BuybackNOAA Coastal Energy Impact Program (CEIP)NOAA Crab Buyback LoansNOAA Federal Gulf of Mexico Reef Fish Buyback Loans1
NOAA Fisheries Finance Individual Fishing Quota (IFQ) LoansNOAA Fisheries Finance Traditional LoansNOAA Fisheries Loan FundNOAA New England Groundfish Buyback Loans1
NOAA New England Lobster Buyback Loans1
NOAA Pacific Groundfish Buyback Loans
Loan Guarantee Programs:EDA Economic Development Revolving FundEDA Innovation in Manufacturing Loan Guarantees1
NOAA Fishing Vessel Obligation Guarantee (FVOG) Program1 No loans have been issued under these programs as of September 30, 2017.
NOAA’s Fisheries Finance Loan programs provide direct loans for certain fisheries costs, including vessels, shoreside facilities, aquaculture, and Individual Fishing Quota. Vessel financing is available for the purchase of used vessels or the reconstruction of vessels. Refinancing is available for existing debt obligations. The purpose of these loan programs is to contribute to stable fisheries and fishing communities, and ensure that fisheries are sustainable economic resources. NOAA’s various buyback loan programs
70 | FY 20 17 AGENCY F I NANC IAL REPORT
NOTES TO THE F I NANC IAL STATEMENTS
address excess fishing capacity which decreases fisheries earnings, complicates fisheries management, and imperils fisheries conservation. Buyback loans are issued to fisheries to permanently remove vessels and/or permits and thus lower fishing effort in overcapitalized fisheries. Loans are repaid from fees collected on the ex-vessel value of the catch in the fishery.
EDA currently has four loan programs: (1) public works loans, which the majority of these loans are to utility companies, mainly water companies, and a few loans to children’s centers; (2) grant and civil debt loans, which are being paid back either because grants were misused or because excess money was disbursed; (3) drought loans made to water districts; and (4) manufacturing innovation loan guarantees for obligations to small or medium-sized manufacturers for the use or production of innovative technologies.
The net assets for the Department’s loan programs consist of:
FY 2017 FY 2016
Direct Loans Obligated Prior to FY 1992 $ 4,545 $ 6,014Direct Loans Obligated After FY 1991 427,070 447,938Defaulted Guaranteed Loans from Pre-FY 1992 Guarantees 4 4
Total $ 431,619 $ 453,956
Direct Loans Obligated Prior to FY 1992 consist of:
FY 2017
Direct Loan Program
Loans Receivable,
GrossInterest
ReceivableAllowance for Loan Losses
Value of Assets Related to
Direct Loans, Net
CEIP $ 17,634 $ 4,413 $ (18,015) $ 4,032Drought Loan Portfolio 288 – – 288Economic Development Revolving Fund 222 5 (2) 225Fisheries Loan Fund 148 16 (164) –
Total $ 18,292 $ 4,434 $ (18,181) $ 4,545
FY 2016
Direct Loan Program
Loans Receivable,
GrossInterest
ReceivableAllowance for Loan Losses
Value of Assets Related to
Direct Loans, Net
CEIP $ 18,435 $ 6,004 $ (20,343) $ 4,096Drought Loan Portfolio 1,574 – – 1,574Economic Development Revolving Fund 341 6 (3) 344Fisheries Loan Fund 148 16 (164) –
Total $ 20,498 $ 6,026 $ (20,510) $ 6,014
FY 20 17 AGENCY F I NANC IAL REPORT | 71
NOTES TO THE F I NANC IAL STATEMENTS
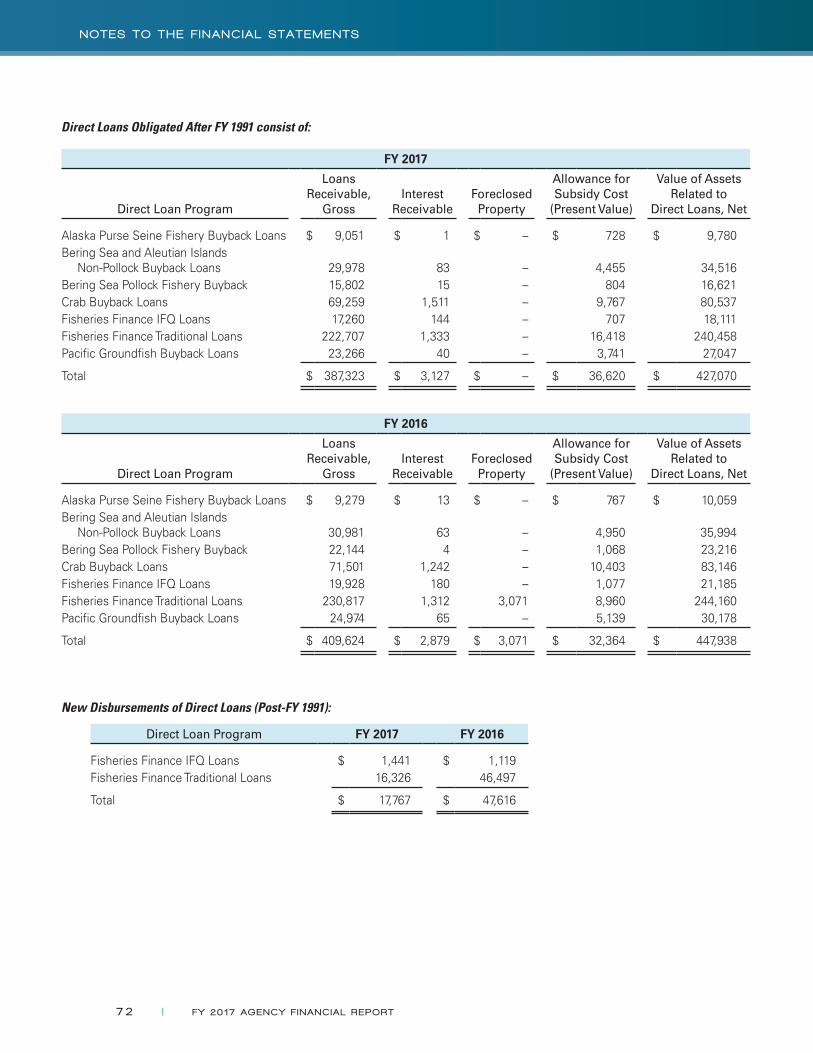
Direct Loans Obligated After FY 1991 consist of:
FY 2017
Direct Loan Program
Loans Receivable,
GrossInterest
ReceivableForeclosed
Property
Allowance for Subsidy Cost
(Present Value)
Value of Assets Related to
Direct Loans, Net
Alaska Purse Seine Fishery Buyback Loans $ 9,051 $ 1 $ – $ 728 $ 9,780Bering Sea and Aleutian Islands
Non-Pollock Buyback Loans 29,978 83 – 4,455 34,516Bering Sea Pollock Fishery Buyback 15,802 15 – 804 16,621Crab Buyback Loans 69,259 1,511 – 9,767 80,537Fisheries Finance IFQ Loans 17,260 144 – 707 18,111Fisheries Finance Traditional Loans 222,707 1,333 – 16,418 240,458Pacific Groundfish Buyback Loans 23,266 40 – 3,741 27,047
Total $ 387,323 $ 3,127 $ – $ 36,620 $ 427,070
FY 2016
Direct Loan Program
Loans Receivable,
GrossInterest
ReceivableForeclosed
Property
Allowance for Subsidy Cost
(Present Value)
Value of Assets Related to
Direct Loans, Net
Alaska Purse Seine Fishery Buyback Loans $ 9,279 $ 13 $ – $ 767 $ 10,059Bering Sea and Aleutian Islands
Non-Pollock Buyback Loans 30,981 63 – 4,950 35,994Bering Sea Pollock Fishery Buyback 22,144 4 – 1,068 23,216Crab Buyback Loans 71,501 1,242 – 10,403 83,146Fisheries Finance IFQ Loans 19,928 180 – 1,077 21,185Fisheries Finance Traditional Loans 230,817 1,312 3,071 8,960 244,160Pacific Groundfish Buyback Loans 24,974 65 – 5,139 30,178
Total $ 409,624 $ 2,879 $ 3,071 $ 32,364 $ 447,938
New Disbursements of Direct Loans (Post-FY 1991):
Direct Loan Program FY 2017 FY 2016
Fisheries Finance IFQ Loans $ 1,441 $ 1,119Fisheries Finance Traditional Loans 16,326 46,497
Total $ 17,767 $ 47,616
72 | FY 20 17 AGENCY F I NANC IAL REPORT
NOTES TO THE F I NANC IAL STATEMENTS
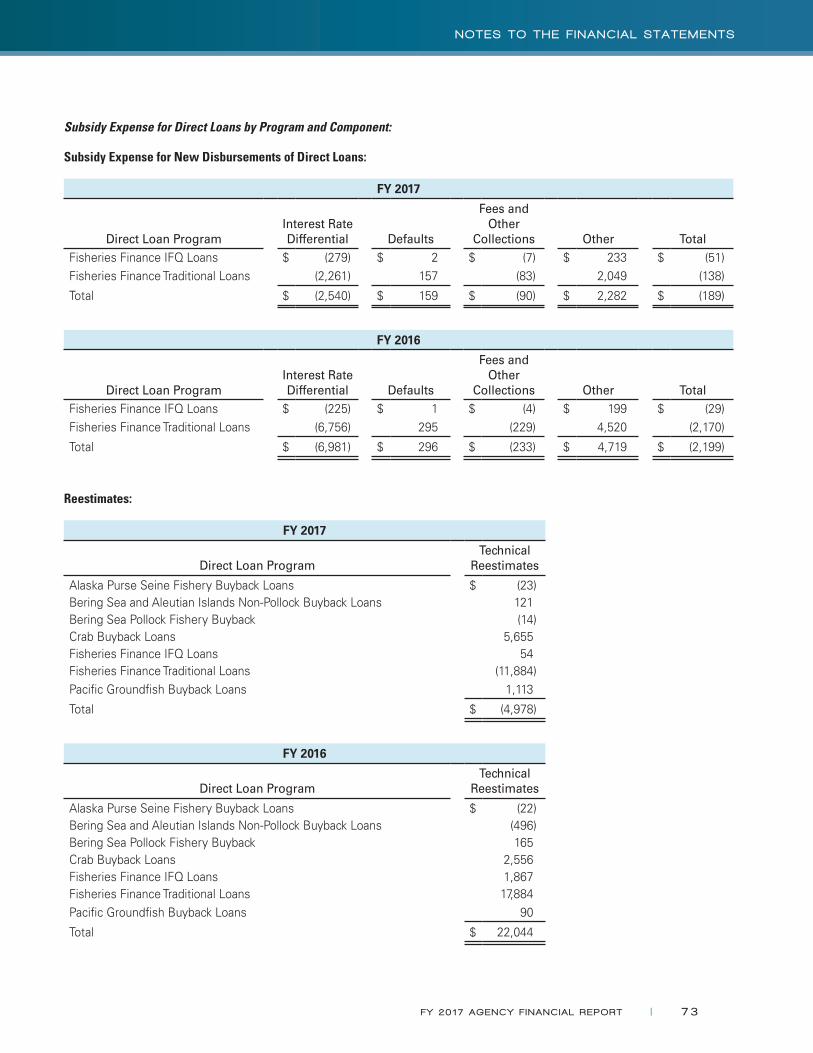
Subsidy Expense for Direct Loans by Program and Component:
Subsidy Expense for New Disbursements of Direct Loans:
FY 2017
Direct Loan ProgramInterest RateDifferential Defaults
Fees and Other
Collections Other TotalFisheries Finance IFQ Loans $ (279) $ 2 $ (7) $ 233 $ (51)Fisheries Finance Traditional Loans (2,261) 157 (83) 2,049 (138)
Total $ (2,540) $ 159 $ (90) $ 2,282 $ (189)
FY 2016
Direct Loan ProgramInterest RateDifferential Defaults
Fees and Other
Collections Other TotalFisheries Finance IFQ Loans $ (225) $ 1 $ (4) $ 199 $ (29)Fisheries Finance Traditional Loans (6,756) 295 (229) 4,520 (2,170)
Total $ (6,981) $ 296 $ (233) $ 4,719 $ (2,199)
Reestimates:
FY 2017
Direct Loan ProgramTechnical
Reestimates
Alaska Purse Seine Fishery Buyback Loans $ (23)Bering Sea and Aleutian Islands Non-Pollock Buyback Loans 121Bering Sea Pollock Fishery Buyback (14)Crab Buyback Loans 5,655Fisheries Finance IFQ Loans 54Fisheries Finance Traditional Loans (11,884)Pacific Groundfish Buyback Loans 1,113
Total $ (4,978)
FY 2016
Direct Loan ProgramTechnical
Reestimates
Alaska Purse Seine Fishery Buyback Loans $ (22)Bering Sea and Aleutian Islands Non-Pollock Buyback Loans (496)Bering Sea Pollock Fishery Buyback 165Crab Buyback Loans 2,556Fisheries Finance IFQ Loans 1,867Fisheries Finance Traditional Loans 17,884Pacific Groundfish Buyback Loans 90
Total $ 22,044
FY 20 17 AGENCY F I NANC IAL REPORT | 73
NOTES TO THE F I NANC IAL STATEMENTS
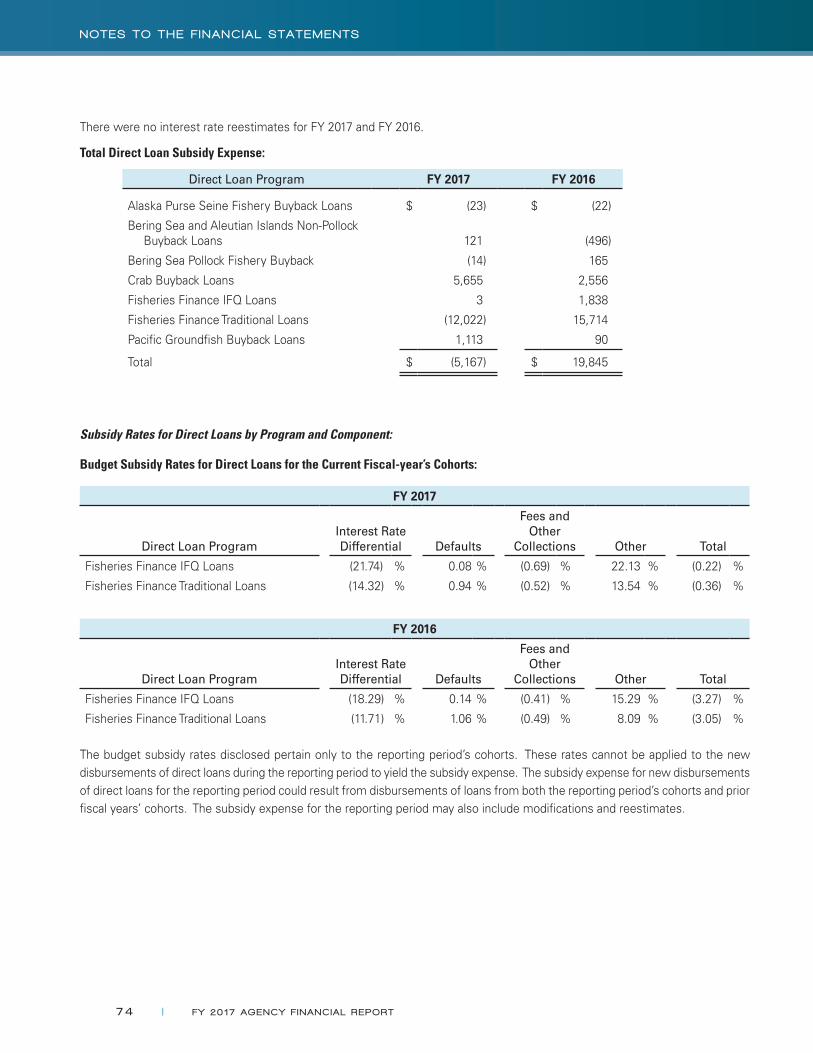
There were no interest rate reestimates for FY 2017 and FY 2016.
Total Direct Loan Subsidy Expense:
Direct Loan Program FY 2017 FY 2016
Alaska Purse Seine Fishery Buyback Loans $ (23) $ (22)
Bering Sea and Aleutian Islands Non-Pollock Buyback Loans 121 (496)
Bering Sea Pollock Fishery Buyback (14) 165
Crab Buyback Loans 5,655 2,556
Fisheries Finance IFQ Loans 3 1,838
Fisheries Finance Traditional Loans (12,022) 15,714
Pacific Groundfish Buyback Loans 1,113 90
Total $ (5,167) $ 19,845
Subsidy Rates for Direct Loans by Program and Component:
Budget Subsidy Rates for Direct Loans for the Current Fiscal-year’s Cohorts:
FY 2017
Direct Loan ProgramInterest RateDifferential Defaults
Fees and Other
Collections Other Total
Fisheries Finance IFQ Loans (21.74) % 0.08 % (0.69) % 22.13 % (0.22) %
Fisheries Finance Traditional Loans (14.32) % 0.94 % (0.52) % 13.54 % (0.36) %
FY 2016
Direct Loan ProgramInterest RateDifferential Defaults
Fees and Other
Collections Other Total
Fisheries Finance IFQ Loans (18.29) % 0.14 % (0.41) % 15.29 % (3.27) %
Fisheries Finance Traditional Loans (11.71) % 1.06 % (0.49) % 8.09 % (3.05) %
The budget subsidy rates disclosed pertain only to the reporting period’s cohorts. These rates cannot be applied to the new disbursements of direct loans during the reporting period to yield the subsidy expense. The subsidy expense for new disbursements of direct loans for the reporting period could result from disbursements of loans from both the reporting period’s cohorts and prior fiscal years’ cohorts. The subsidy expense for the reporting period may also include modifications and reestimates.
74 | FY 20 17 AGENCY F I NANC IAL REPORT
NOTES TO THE F I NANC IAL STATEMENTS
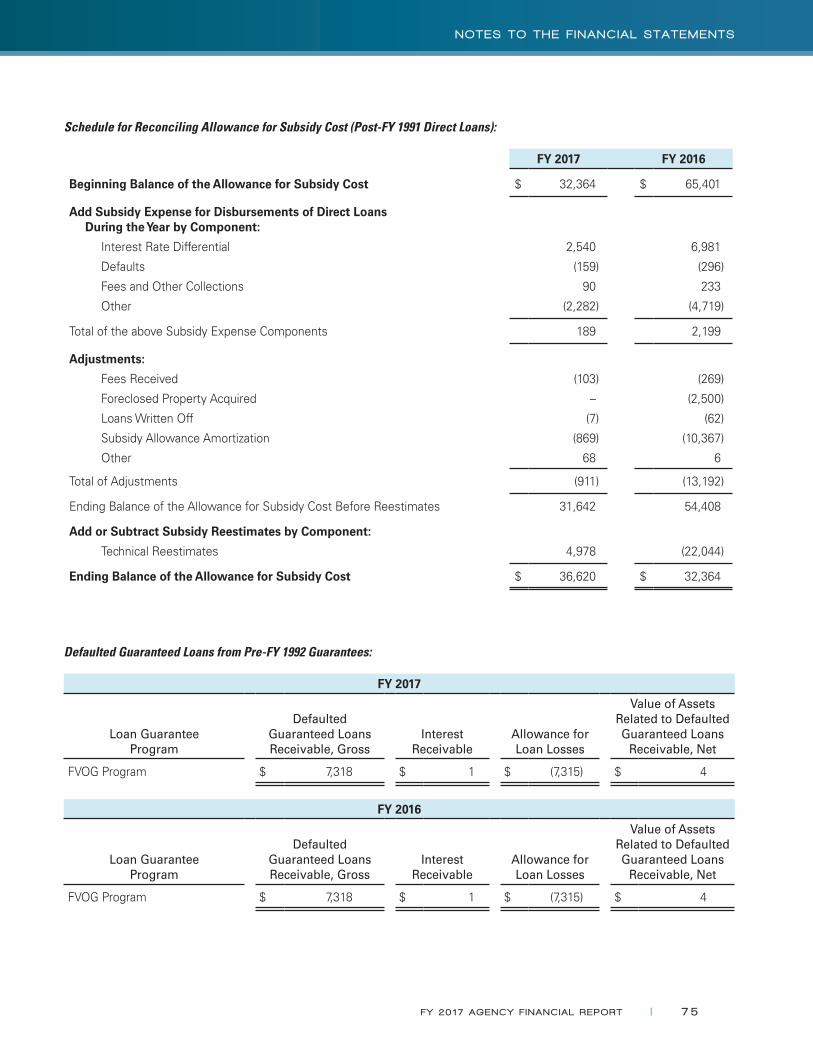
Schedule for Reconciling Allowance for Subsidy Cost (Post-FY 1991 Direct Loans):
FY 2017 FY 2016
Beginning Balance of the Allowance for Subsidy Cost $ 32,364 $ 65,401
Add Subsidy Expense for Disbursements of Direct Loans During the Year by Component:
Interest Rate Differential 2,540 6,981
Defaults (159) (296)
Fees and Other Collections 90 233
Other (2,282) (4,719)
Total of the above Subsidy Expense Components 189 2,199
Adjustments:
Fees Received (103) (269)
Foreclosed Property Acquired – (2,500)
Loans Written Off (7) (62)
Subsidy Allowance Amortization (869) (10,367)
Other 68 6
Total of Adjustments (911) (13,192)
Ending Balance of the Allowance for Subsidy Cost Before Reestimates 31,642 54,408
Add or Subtract Subsidy Reestimates by Component:
Technical Reestimates 4,978 (22,044)
Ending Balance of the Allowance for Subsidy Cost $ 36,620 $ 32,364
Defaulted Guaranteed Loans from Pre-FY 1992 Guarantees:
FY 2017
Loan GuaranteeProgram
DefaultedGuaranteed Loans Receivable, Gross
InterestReceivable
Allowance for Loan Losses
Value of Assets Related to Defaulted Guaranteed Loans
Receivable, Net
FVOG Program $ 7,318 $ 1 $ (7,315) $ 4
FY 2016
Loan GuaranteeProgram
DefaultedGuaranteed Loans Receivable, Gross
InterestReceivable
Allowance for Loan Losses
Value of Assets Related to Defaulted Guaranteed Loans
Receivable, Net
FVOG Program $ 7,318 $ 1 $ (7,315) $ 4
FY 20 17 AGENCY F I NANC IAL REPORT | 75
NOTES TO THE F I NANC IAL STATEMENTS

Administrative Expenses:
Administrative expenses in support of the Department’s direct loan and loan guarantee programs consist of:
Direct Loan Program FY 2017 FY 2016
Drought Loan Portfolio and Economic Development Revolving Fund $ 250 $ 2,164
NOAA Direct Loan Programs 3,113 3,435
Total $ 3,363 $ 5,599
Loan Guarantee Program FY 2017 FY 2016
FVOG Program $ 68 $ 71
NOTE 7. INVENTORY, MATERIALS, AND SUPPLIES, NET
Category Cost Flow Assumption FY 2017 FY 2016
Inventory
Items Held for Current Sale
NIST Standard Reference Materials Average $ 25,603 $ 23,780
Other Various 3 146
Allowance for Excess, Obsolete, and Unserviceable Items – (96)
Total Inventory, Net 25,606 23,830
Materials and Supplies
Items Held for Use
NOAA’s National Logistics Support Center Weighted-average 50,097 59,234
Other Various 6,012 6,029
Items Held for Repair
NOAA’s National Reconditioning Center Weighted-average 33,005 30,774
Allowance for Excess, Obsolete, and Unserviceable Items (6,657) (5,773)
Total Materials and Supplies, Net 82,457 90,264
Total $ 108,063 $ 114,094
NIST’s Standard Reference Materials Program provides reference materials for quality assurance of measurements, while NOAA’s Materials and Supplies are primarily repair parts for weather forecasting equipment. Items held for repair are valued at the direct method. The cost of items held in repair is the issue cost, which is the weighted average of the procurement costs for each line, adjusted by the cost to repair the item.
76 | FY 20 17 AGENCY F I NANC IAL REPORT
NOTES TO THE F I NANC IAL STATEMENTS
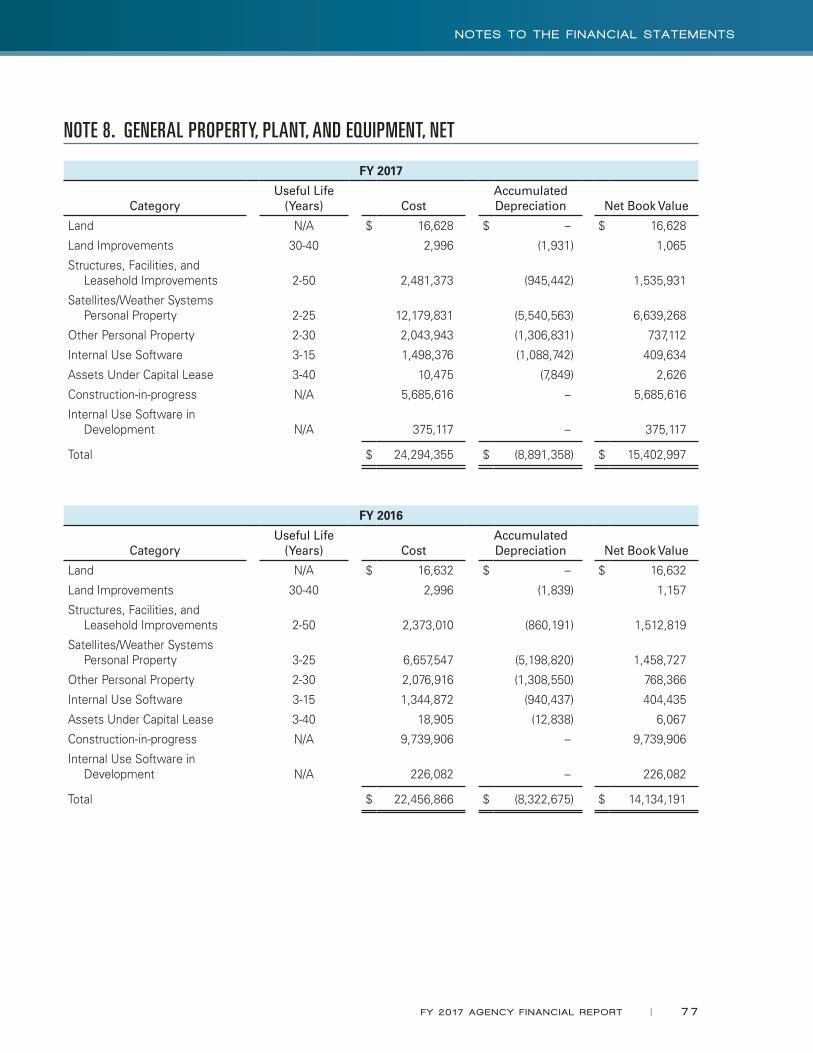
NOTE 8. GENERAL PROPERTY, PLANT, AND EQUIPMENT, NET
FY 2017
CategoryUseful Life
(Years) CostAccumulatedDepreciation Net Book Value
Land N/A $ 16,628 $ – $ 16,628
Land Improvements 30-40 2,996 (1,931) 1,065
Structures, Facilities, and Leasehold Improvements 2-50 2,481,373 (945,442) 1,535,931
Satellites/Weather Systems Personal Property 2-25 12,179,831 (5,540,563) 6,639,268
Other Personal Property 2-30 2,043,943 (1,306,831) 737,112
Internal Use Software 3-15 1,498,376 (1,088,742) 409,634
Assets Under Capital Lease 3-40 10,475 (7,849) 2,626
Construction-in-progress N/A 5,685,616 – 5,685,616
Internal Use Software in Development N/A 375,117 – 375,117
Total $ 24,294,355 $ (8,891,358) $ 15,402,997
FY 2016
CategoryUseful Life
(Years) CostAccumulatedDepreciation Net Book Value
Land N/A $ 16,632 $ – $ 16,632
Land Improvements 30-40 2,996 (1,839) 1,157
Structures, Facilities, and Leasehold Improvements 2-50 2,373,010 (860,191) 1,512,819
Satellites/Weather Systems Personal Property 3-25 6,657,547 (5,198,820) 1,458,727
Other Personal Property 2-30 2,076,916 (1,308,550) 768,366
Internal Use Software 3-15 1,344,872 (940,437) 404,435
Assets Under Capital Lease 3-40 18,905 (12,838) 6,067
Construction-in-progress N/A 9,739,906 – 9,739,906
Internal Use Software in Development N/A 226,082 – 226,082
Total $ 22,456,866 $ (8,322,675) $ 14,134,191
FY 20 17 AGENCY F I NANC IAL REPORT | 77
NOTES TO THE F I NANC IAL STATEMENTS

NOTE 9. OTHER ASSETS
FY 2017 FY 2016
With the Public
Advances and Prepayments $ 36,703 $ 68,737
Note Receivable 1,286 1,349
Bibliographic Database, Net 3,859 5,166
General PP&E Permanently Removed but Not Yet Disposed
4,528 261
Other 1,066 1,354
Total $ 47,442 $ 76,867
The Bibliographic Database relates to NTIS scientific and technical information used to prepare products and services for sale. The database is stated at capitalized costs of $77.6 million and $77.1 million, less accumulated amortization of $73.7 million and $71.9 million, as of September 30, 2017 and 2016, respectively.
NOTE 10. NON-ENTITY ASSETS
The assets that are not available for use in the Department’s operations, included in the Department’s Consolidated Balance Sheets, are summarized below:
FY 2017 FY 2016
Intragovernmental
Fund Balance with Treasury $ 142,907 $ 139,120
Accounts Receivable 9,888 3,748
Investment 334,106 333,013
Total Intragovernmental 486,901 475,881
With the Public
Cash 1,321 1,770
Accounts Receivable, Net 818 12,652
Direct Loans and Loan Guarantees, Net 288 1,574
Other 1,290 1,353
Total Non-Entity Assets 490,618 493,230
Total Entity Assets 41,983,877 40,754,062
Total Assets $ 42,474,495 $ 41,247,292
78 | FY 20 17 AGENCY F I NANC IAL REPORT
NOTES TO THE F I NANC IAL STATEMENTS
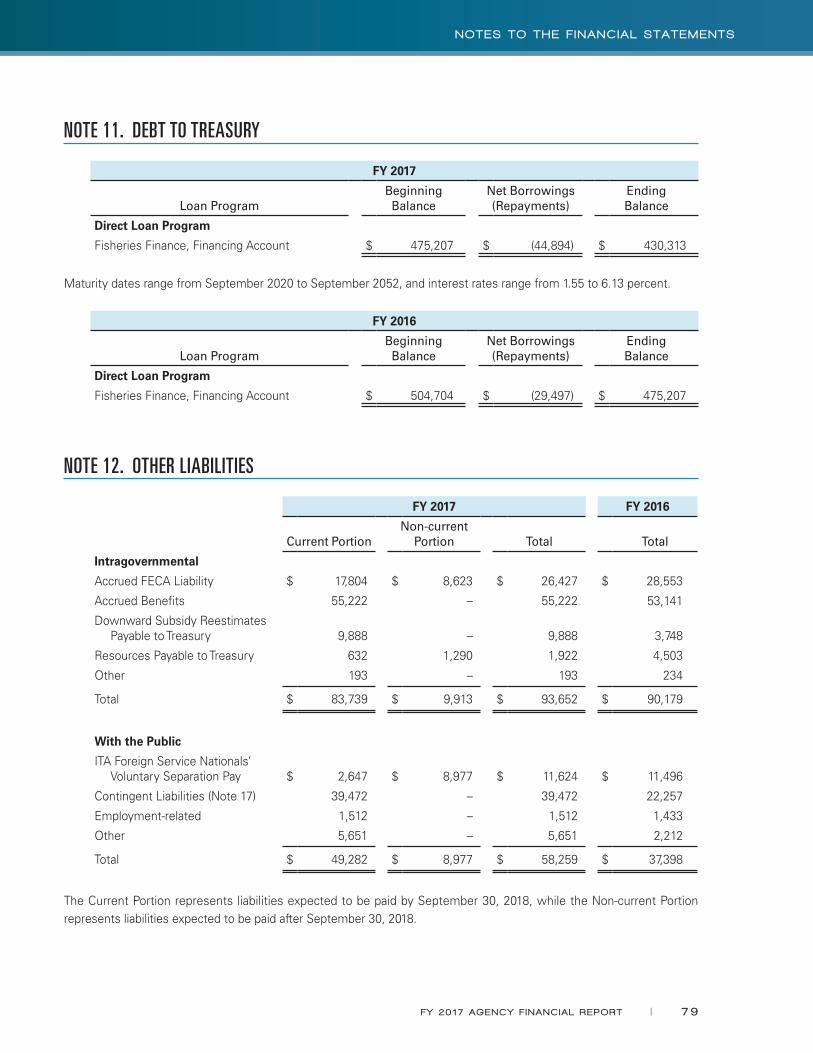
NOTE 11. DEBT TO TREASURY
FY 2017
Loan ProgramBeginningBalance
Net Borrowings (Repayments)
Ending Balance
Direct Loan Program
Fisheries Finance, Financing Account $ 475,207 $ (44,894) $ 430,313
Maturity dates range from September 2020 to September 2052, and interest rates range from 1.55 to 6.13 percent.
FY 2016
Loan ProgramBeginningBalance
Net Borrowings (Repayments)
Ending Balance
Direct Loan Program
Fisheries Finance, Financing Account $ 504,704 $ (29,497) $ 475,207
NOTE 12. OTHER LIABILITIES
FY 2017 FY 2016
Current PortionNon-current
Portion Total Total
Intragovernmental
Accrued FECA Liability $ 17,804 $ 8,623 $ 26,427 $ 28,553
Accrued Benefits 55,222 – 55,222 53,141
Downward Subsidy Reestimates Payable to Treasury 9,888 – 9,888 3,748
Resources Payable to Treasury 632 1,290 1,922 4,503
Other 193 – 193 234
Total $ 83,739 $ 9,913 $ 93,652 $ 90,179
With the Public
ITA Foreign Service Nationals’ Voluntary Separation Pay $ 2,647 $ 8,977 $ 11,624 $ 11,496
Contingent Liabilities (Note 17) 39,472 – 39,472 22,257
Employment-related 1,512 – 1,512 1,433
Other 5,651 – 5,651 2,212
Total $ 49,282 $ 8,977 $ 58,259 $ 37,398
The Current Portion represents liabilities expected to be paid by September 30, 2018, while the Non-current Portion represents liabilities expected to be paid after September 30, 2018.
FY 20 17 AGENCY F I NANC IAL REPORT | 79
NOTES TO THE F I NANC IAL STATEMENTS

NOTE 13. FEDERAL EMPLOYEE BENEFITS LIABILITIES
FY 2017 FY 2016
Actuarial FECA Liability $ 200,336 $ 206,611
NOAA Corps Retirement System Liability 644,200 633,000
NOAA Corps Post-retirement Health Benefits Liability 41,400 36,500
Total $ 885,936 $ 876,111
Actuarial FECA Liability:
Actuarial FECA liability is calculated annually, as of September 30. For discounting projected annual future benefit payments to present value, the interest rate assumptions used by DOL were as follows:
FY 2017 FY 2016
Year 1 and Thereafter 2.68% 2.78%
The wage inflation factors (Cost of Living Adjustment) and medical inflation factors (Consumer Price Index – Medical) applied to the calculation of projected future benefits, and also used to adjust the methodology’s historical payments to current-year constant dollars, were as follows:
FY 2017
Fiscal YearCost of Living Adjustment
Consumer Price Index - Medical
2018 1.22% 3.20%
2019 1.35% 3.52%
2020 1.59% 3.80%
2021 1.99% 3.99%
2022 2.26% 3.91%
FY 2016
Fiscal YearCost of Living Adjustment
Consumer Price Index - Medical
2017 1.31% 2.99%
2018 1.13% 3.09%
2019 1.23% 3.40%
2020 1.45% 3.68%
2021 1.85% 3.87%
80 | FY 20 17 AGENCY F I NANC IAL REPORT
NOTES TO THE F I NANC IAL STATEMENTS
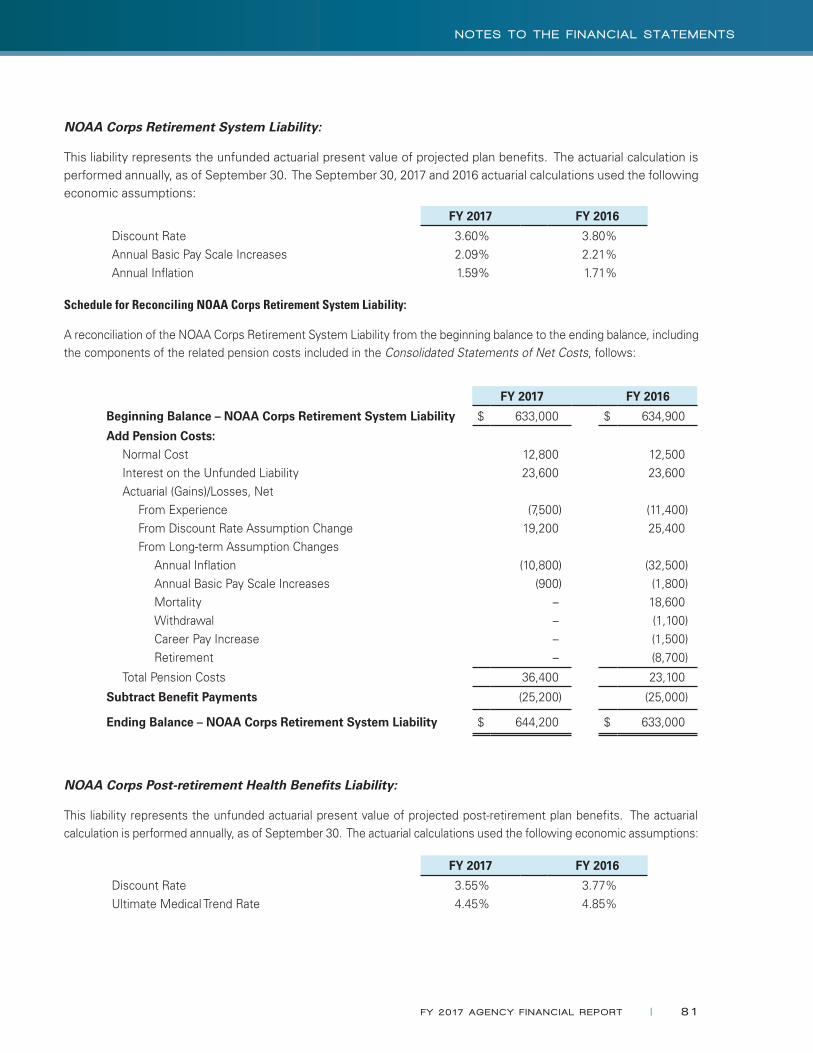
NOAA Corps Retirement System Liability:
This liability represents the unfunded actuarial present value of projected plan benefits. The actuarial calculation is performed annually, as of September 30. The September 30, 2017 and 2016 actuarial calculations used the following economic assumptions:
FY 2017 FY 2016
Discount Rate 3.60% 3.80%Annual Basic Pay Scale Increases 2.09% 2.21%Annual Inflation 1.59% 1.71%
Schedule for Reconciling NOAA Corps Retirement System Liability:
A reconciliation of the NOAA Corps Retirement System Liability from the beginning balance to the ending balance, including the components of the related pension costs included in the Consolidated Statements of Net Costs, follows:
FY 2017 FY 2016
Beginning Balance – NOAA Corps Retirement System Liability $ 633,000 $ 634,900
Add Pension Costs:Normal Cost 12,800 12,500Interest on the Unfunded Liability 23,600 23,600Actuarial (Gains)/Losses, Net
From Experience (7,500) (11,400)From Discount Rate Assumption Change 19,200 25,400From Long-term Assumption Changes
Annual Inflation (10,800) (32,500)Annual Basic Pay Scale Increases (900) (1,800)Mortality – 18,600Withdrawal – (1,100)Career Pay Increase – (1,500)Retirement – (8,700)
Total Pension Costs 36,400 23,100
Subtract Benefit Payments (25,200) (25,000)
Ending Balance – NOAA Corps Retirement System Liability $ 644,200 $ 633,000
NOAA Corps Post-retirement Health Benefits Liability:
This liability represents the unfunded actuarial present value of projected post-retirement plan benefits. The actuarial calculation is performed annually, as of September 30. The actuarial calculations used the following economic assumptions:
FY 2017 FY 2016
Discount Rate 3.55% 3.77%Ultimate Medical Trend Rate 4.45% 4.85%
FY 20 17 AGENCY F I NANC IAL REPORT | 81
NOTES TO THE F I NANC IAL STATEMENTS

Schedule for Reconciling NOAA Corps Post-retirement Health Benefits Liability:
A reconciliation of the NOAA Corps Post-retirement Health Benefits Liability from the beginning balance to the ending balance, including the components of the related post-retirement health benefits costs included in the Consolidated Statements of Net Costs, follows:
FY 2017 FY 2016
Beginning Balance – NOAA Corps Post-retirement Health Benefits Liability $ 36,500 $ 37,300
Add Health Benefits Costs:Normal Cost 1,300 1,200Interest on the Unfunded Liability 1,300 1,400Actuarial (Gains)/Losses, Net
From Experience 900 700From Discount Rate Assumption Change 500 600From Long-term Assumption Changes
Medical Claims and Trend Rate 3,100 (2,100)
Mortality – (300)
Total Health Benefits Costs 7,100 1,500
Subtract Benefit Payments (2,200) (2,300)
Ending Balance – NOAA Corps Post-retirement Health Benefits Liability $ 41,400 $ 36,500
NOTE 14. ENVIRONMENTAL AND DISPOSAL LIABILITIES
FY 2017 FY 2016
Asbestos-related Cleanup Costs $ 72,991 $ 73,820Nuclear Reactor 60,725 57,342Pribilof Islands 1,326 1,574Non-reactor Radiological Facilities 8,330 8,619Other 1,775 1,745
Total $ 145,147 $ 143,100
82 | FY 20 17 AGENCY F I NANC IAL REPORT
NOTES TO THE F I NANC IAL STATEMENTS
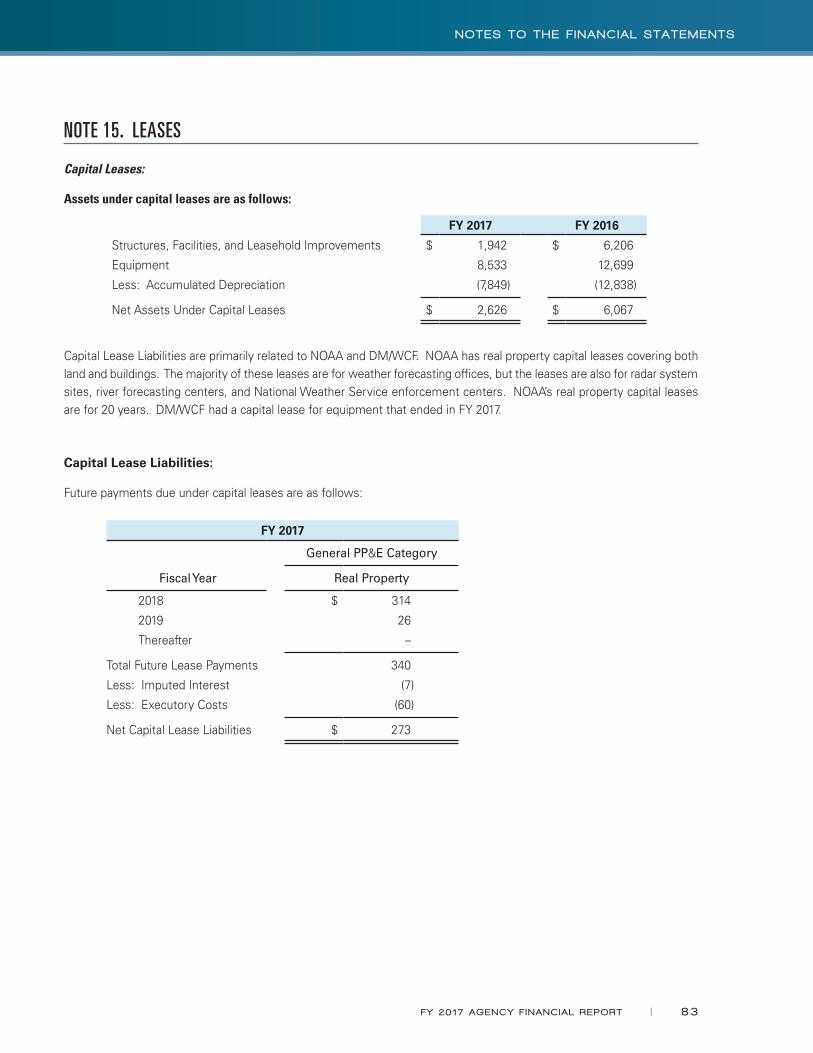
NOTE 15. LEASES
Capital Leases:
Assets under capital leases are as follows:
FY 2017 FY 2016
Structures, Facilities, and Leasehold Improvements $ 1,942 $ 6,206
Equipment 8,533 12,699
Less: Accumulated Depreciation (7,849) (12,838)
Net Assets Under Capital Leases $ 2,626 $ 6,067
Capital Lease Liabilities are primarily related to NOAA and DM/WCF. NOAA has real property capital leases covering both land and buildings. The majority of these leases are for weather forecasting offices, but the leases are also for radar system sites, river forecasting centers, and National Weather Service enforcement centers. NOAA’s real property capital leases are for 20 years. DM/WCF had a capital lease for equipment that ended in FY 2017.
Capital Lease Liabilities:
Future payments due under capital leases are as follows:
FY 2017
General PP&E Category
Fiscal Year Real Property
2018 $ 314
2019 26
Thereafter –
Total Future Lease Payments 340
Less: Imputed Interest (7)
Less: Executory Costs (60)
Net Capital Lease Liabilities $ 273
FY 20 17 AGENCY F I NANC IAL REPORT | 83
NOTES TO THE F I NANC IAL STATEMENTS
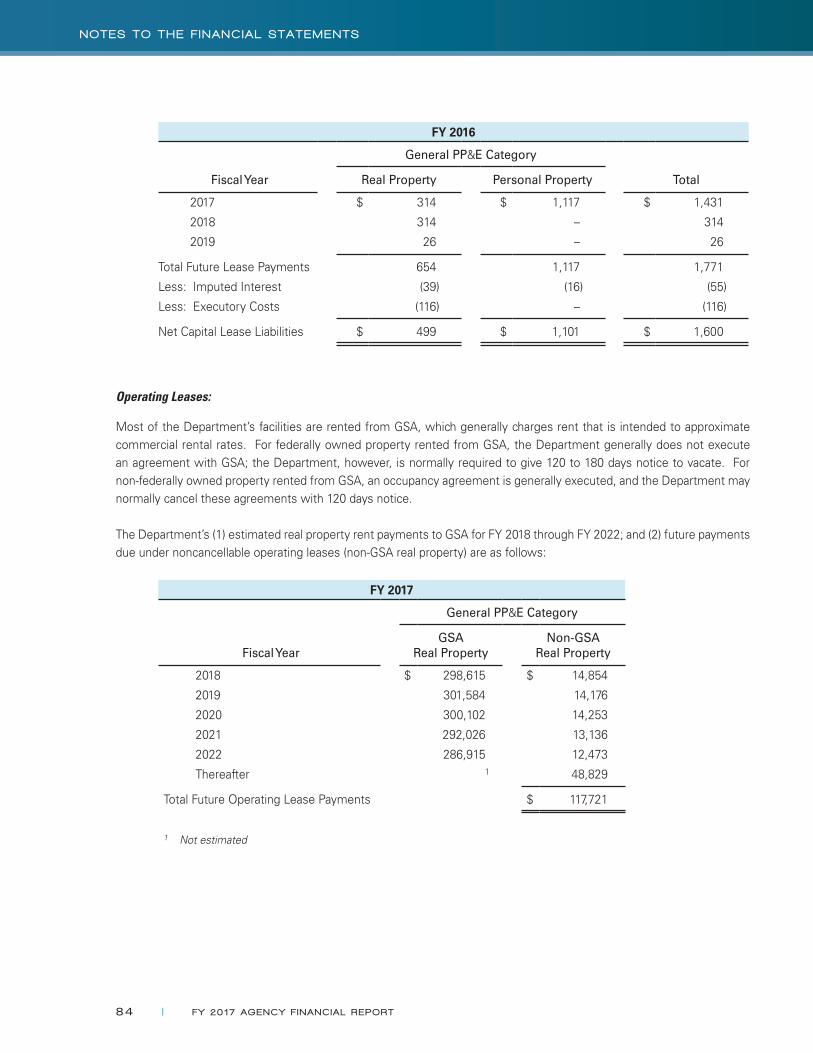
FY 2016
General PP&E Category
Fiscal Year Real Property Personal Property Total
2017 $ 314 $ 1,117 $ 1,431
2018 314 – 314
2019 26 – 26
Total Future Lease Payments 654 1,117 1,771
Less: Imputed Interest (39) (16) (55)
Less: Executory Costs (116) – (116)
Net Capital Lease Liabilities $ 499 $ 1,101 $ 1,600
Operating Leases:
Most of the Department’s facilities are rented from GSA, which generally charges rent that is intended to approximate commercial rental rates. For federally owned property rented from GSA, the Department generally does not execute an agreement with GSA; the Department, however, is normally required to give 120 to 180 days notice to vacate. For non-federally owned property rented from GSA, an occupancy agreement is generally executed, and the Department may normally cancel these agreements with 120 days notice.
The Department’s (1) estimated real property rent payments to GSA for FY 2018 through FY 2022; and (2) future payments due under noncancellable operating leases (non-GSA real property) are as follows:
FY 2017
General PP&E Category
Fiscal YearGSA
Real PropertyNon-GSA
Real Property
2018 $ 298,615 $ 14,854
2019 301,584 14,176
2020 300,102 14,253
2021 292,026 13,136
2022 286,915 12,473
Thereafter 1 48,829
Total Future Operating Lease Payments $ 117,721
1 Not estimated
84 | FY 20 17 AGENCY F I NANC IAL REPORT
NOTES TO THE F I NANC IAL STATEMENTS

NOTE 16. LIABILITIES NOT COVERED BY BUDGETARY RESOURCES
The liabilities that are not covered by budgetary resources, included in the Department’s Consolidated Balance Sheets, are summarized below:
FY 2017 FY 2016
Intragovernmental
Liability to General Fund of the U.S. Government for Deficit Reduction $ 336,188 $ 334,054
Accrued FECA Liability 26,333 28,462
Unearned Revenue 1,112 –
Other 763 5
Total Intragovernmental 364,396 362,521
Accrued Payroll 63,206 57,536
Accrued Annual Leave 309,015 301,462
Federal Employee Benefits 884,845 876,111
Environmental and Disposal Liabilities 145,147 143,100
Contingent Liabilities 39,472 22,257
Capital Lease Liabilities 5 444
Unearned Revenue 563,481 499,196
ITA Foreign Service Nationals’ Voluntary Separation Pay 11,624 11,496
Other 7,281 378
Total Liabilities Not Covered by Budgetary Resources 2,388,472 2,274,501
Total Liabilities Covered by Budgetary Resources 2,330,465 2,462,553
Total Liabilities $ 4,718,937 $ 4,737,054
FY 20 17 AGENCY F I NANC IAL REPORT | 85
NOTES TO THE F I NANC IAL STATEMENTS

NOTE 17. COMMITMENTS AND CONTINGENCIES
Commitments:
The Department has entered into long-term contracts for the purchase, construction, and modernization of environmental satellites and weather measuring and monitoring systems. A summary of major long-term commitments as of September 30, 2017 is shown below.
Major Long-term Commitments:
FY 2017
Description FY 2018 FY 2019 FY 2020 FY 2021 FY 2022 Thereafter Total
Joint Polar Satellite Systems $ 775,777 $ 548,035 $ 445,082 $ 376,061 $ 263,013 $ 478,908 $ 2,886,876
Geostationary Operational Environmental Satellites 518,532 408,979 304,056 292,500 292,500 650,196 2,466,763
Satellite System Architecture and Advanced Planning 4,929 47,734 81,341 132,236 295,886 – 562,126
Space Weather Follow-on 500 33,700 195,000 154,000 89,000 – 472,200
Comprehensive Large Array-data Stewardship System 53,000 80,974 95,000 95,000 95,000 – 418,974
Satellite Projects, Planning, and Analysis 37,185 37,000 37,000 37,000 57,783 – 205,968
Polar Follow-on 179,956 – – – – – 179,956
Cooperative Data and Rescue Services
500 33,100 33,100 33,100 2,900 9,600 112,300
Weather Service 13,244 5,352 5,405 4,530 4,633 – 33,164
Commercial Weather Data Pilot
3,000 3,000 3,000
3,000 3,000 – 15,000
Satellite Command and Data Acquisition Facility 2,450 2,450 2,450 2,450 2,450 – 12,250
Constellation Observing System for Meteorology, Ionosphere, and Climate - 2 6,100 – – – – – 6,100
Total $ 1,595,173 $ 1,200,324 $ 1,201,434 $ 1,129,877 $ 1,106,165 $ 1,138,704 $ 7,371,677
86 | FY 20 17 AGENCY F I NANC IAL REPORT
NOTES TO THE F I NANC IAL STATEMENTS

Legal Contingencies:
The Department is subject to potential liabilities in various administrative proceedings, legal actions, environmental suits, and claims brought against it. In the opinion of the Department’s management and legal counsel, the ultimate resolution of these proceedings, actions, suits, and claims will not materially affect the financial position or net costs of the Department.
Probable Likelihood of an Adverse Outcome:
The Department is subject to potential liabilities where adverse outcomes are probable, and claims are approximately $39.5 million and $22.3 million as of September 30, 2017 and 2016, respectively. Accordingly, these contingent liabilities were included in Other Liabilities on the Consolidated Balance Sheets as of September 30, 2017 and 2016, respectively. For a majority of these claims, any amounts ultimately due will be paid out of Treasury’s Judgment Fund. For the claims to be paid by Treasury’s Judgment Fund, once the claims are settled or court judgments are assessed relative to the Department, the liability will be removed and an Imputed Financing Source From Cost Absorbed by Others will be recognized.
Reasonably Possible Likelihood of an Adverse Outcome:
The Department and other federal agencies are subject to potential liabilities for a variety of environmental cleanup costs, many of which are associated with the Second World War, at various sites within the U.S. Since some of the potential liabilities represent claims with no stated amount, the exact amount of total potential liabilities is unknown, but may exceed $305.3 million as of September 30, 2017. For these potential liabilities, it is reasonably possible that an adverse outcome will result. It is not possible, however, to speculate as to a range of loss. In the absence of a settlement agreement, decree, or judgment, there is neither an allocation of response costs between the U.S. government and other potentially responsible parties, nor is there an attribution of such costs to or among the federal agencies implicated in the claims. Although the Department has been implicated as a responsible party, the U.S. Department of Justice was unable to provide an amount for these potential liabilities that is attributable to the Department. Of these potential liabilities, all will be funded by Treasury’s Judgment Fund, if any amounts are ultimately due.
The Department and other federal agencies are subject to other potential liabilities. Since some of the potential liabilities represent claims with no stated amount, the exact amount of total potential liabilities is unknown, but may exceed $29.9 million as of September 30, 2017. For these potential liabilities, it is reasonably possible that an adverse outcome will result. It is not possible, however, to speculate as to a range of loss. Of these potential liabilities, most will be funded by Treasury’s Judgment Fund, if any amounts are ultimately due.
NOTE 18. CONSOLIDATED STATEMENTS OF NET COST
The following tables illustrate the Department’s Statement of Net Cost by Major Budgetary Function, with Gross Costs and Earned Revenue further broken down by Intragovernmental and With the Public. The classification of Gross Costs as Intragovernmental or With the Public is based on the source of goods and services received by the Department and is not based on the classification of the related revenue. The classification of costs or revenue as Intragovernmental or With the Public is defined on a transaction-by-transaction basis based upon with whom the transaction is with. The purpose of this classification is to enable the Department to prepare consolidated financial statements, not to match the intragovernmental and public revenue with the costs that are incurred to produce the intragovernmental and public revenue.
FY 20 17 AGENCY F I NANC IAL REPORT | 87
NOTES TO THE F I NANC IAL STATEMENTS
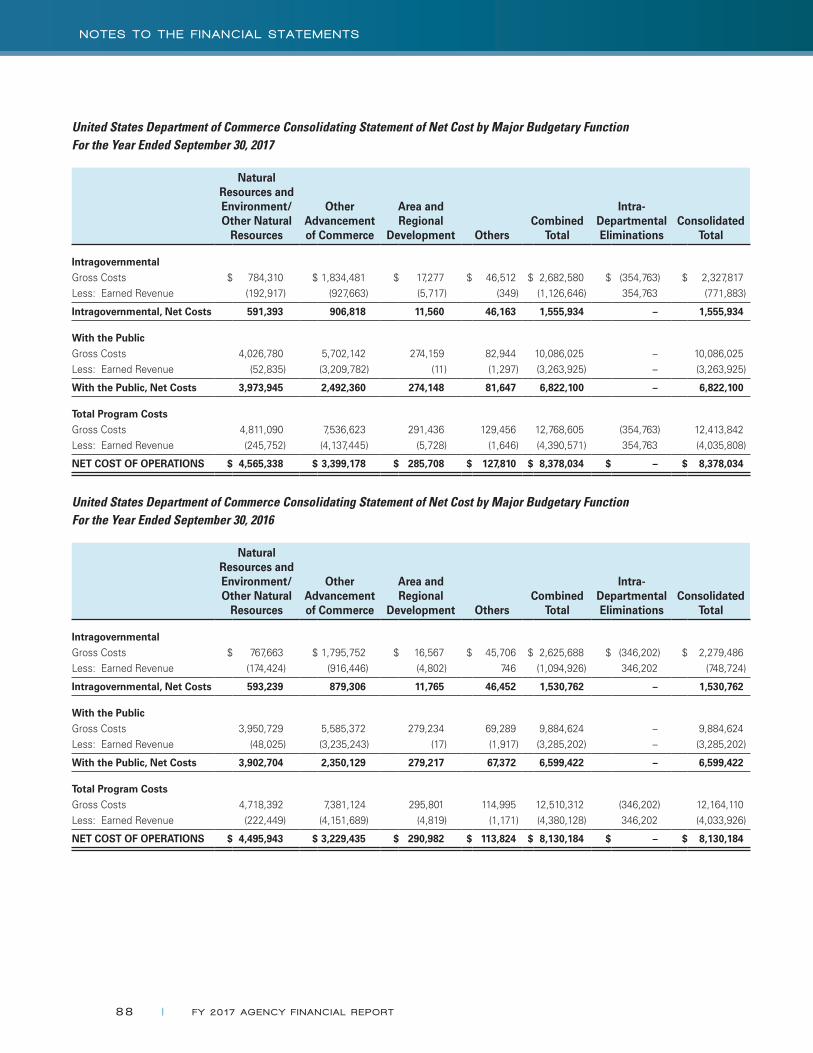
United States Department of Commerce Consolidating Statement of Net Cost by Major Budgetary Function For the Year Ended September 30, 2017
Natural Resources and Environment/Other Natural
Resources
Other Advancement of Commerce
Area and Regional
Development Others Combined
Total
Intra-Departmental Eliminations
Consolidated Total
IntragovernmentalGross Costs $ 784,310 $ 1,834,481 $ 17,277 $ 46,512 $ 2,682,580 $ (354,763) $ 2,327,817Less: Earned Revenue (192,917) (927,663) (5,717) (349) (1,126,646) 354,763 (771,883)
Intragovernmental, Net Costs 591,393 906,818 11,560 46,163 1,555,934 – 1,555,934
With the PublicGross Costs 4,026,780 5,702,142 274,159 82,944 10,086,025 – 10,086,025Less: Earned Revenue (52,835) (3,209,782) (11) (1,297) (3,263,925) – (3,263,925)
With the Public, Net Costs 3,973,945 2,492,360 274,148 81,647 6,822,100 – 6,822,100
Total Program CostsGross Costs 4,811,090 7,536,623 291,436 129,456 12,768,605 (354,763) 12,413,842Less: Earned Revenue (245,752) (4,137,445) (5,728) (1,646) (4,390,571) 354,763 (4,035,808)
NET COST OF OPERATIONS $ 4,565,338 $ 3,399,178 $ 285,708 $ 127,810 $ 8,378,034 $ – $ 8,378,034
United States Department of Commerce Consolidating Statement of Net Cost by Major Budgetary Function For the Year Ended September 30, 2016
Natural Resources and Environment/Other Natural
Resources
Other Advancement of Commerce
Area and Regional
Development Others Combined
Total
Intra-Departmental Eliminations
Consolidated Total
IntragovernmentalGross Costs $ 767,663 $ 1,795,752 $ 16,567 $ 45,706 $ 2,625,688 $ (346,202) $ 2,279,486Less: Earned Revenue (174,424) (916,446) (4,802) 746 (1,094,926) 346,202 (748,724)
Intragovernmental, Net Costs 593,239 879,306 11,765 46,452 1,530,762 – 1,530,762
With the PublicGross Costs 3,950,729 5,585,372 279,234 69,289 9,884,624 – 9,884,624Less: Earned Revenue (48,025) (3,235,243) (17) (1,917) (3,285,202) – (3,285,202)
With the Public, Net Costs 3,902,704 2,350,129 279,217 67,372 6,599,422 – 6,599,422
Total Program CostsGross Costs 4,718,392 7,381,124 295,801 114,995 12,510,312 (346,202) 12,164,110Less: Earned Revenue (222,449) (4,151,689) (4,819) (1,171) (4,380,128) 346,202 (4,033,926)
NET COST OF OPERATIONS $ 4,495,943 $ 3,229,435 $ 290,982 $ 113,824 $ 8,130,184 $ – $ 8,130,184
88 | FY 20 17 AGENCY F I NANC IAL REPORT
NOTES TO THE F I NANC IAL STATEMENTS
NOTE 19. COMBINED STATEMENTS OF BUDGETARY RESOURCES
Other Changes in Unobligated Balance, Net: On the FY 2016 Combined Statement of Budgetary Resources (SBR), Budgetary Resources, Budgetary column, the reduction of budgetary resources of $8.93 billion reported includes a reduction of $ 8.80 billion for NTIA’s Digital Television Transition and Public Safety Fund. For more financial information for the Digital Television Transition and Public Safety Fund, see Note 22, Funds from Dedicated Collections, and the Combining Schedule of Budgetary Resources by Major Budget Account (unaudited) for FY 2017, included in Required Supplementary Information (Unaudited).
Appropriations:
There are reconciling items from the amounts of the Budgetary Resources, Appropriations on the SBR to the amounts of the Budgetary Financing Sources, Appropriations Received on the Consolidated Statement of Changes in Net Position (SCNP ).
For FY 2017, the primary reconciling item is transfers of current year authority in the amount of $178.6 million, which is included in SBR as Appropriations and is included as transfers on SCNP.
For FY 2016, the primary reconciling items are (a) a transfer in of auction proceeds from the Federal Communications Commission to NTIA’s Public Safety Trust Fund of $8.43 billion, which is included as Appropriations on SBR, and is included as a budgetary transfer in on SCNP (see Note 22, Funds from Dedicated Collections, for more information on the Public Safety Trust Fund); and (b) a transfer out from NTIA’s Public Safety Trust Fund to the General Fund of the U.S. Government of $7.78 billion for deficit reduction, which is included as negative Appropriations on SBR and is in included as a transfer out on SCNP.
Borrowing Authority: Total borrowing authority available for NOAA’s loan programs amounted to $116.2 million and $65.2 million as of September 30, 2017 and 2016, respectively. The Borrowing Authority amounts reported in the SBR Budgetary Resources section represent only borrowing authority realized during the fiscal year being reported. See Note 1.N, Debt to Treasury, for debt repayment requirements, financing sources for repayments, and other terms of borrowing authority used.
Permanent, Indefinite Appropriations: All of the Department’s reporting entities have one or more permanent, indefinite appropriations to finance operations. Permanent, indefinite appropriations are appropriations that are available until expended.
Permanent Reductions to Budgetary Resources: Permanent reductions to the Department’s budgetary resources under Public Law 115-31 amounted to $34.38 million for FY 2017, while permanent reductions for FY 2016 under Public Laws 114-223 and 114-113 amounted to $34.36 million. These permanent reductions are included in the SBR Budgetary Resources section, and are also included in the SCNP.
Legal and/or budgetary arrangements affecting the Department’s use of Unobligated Balances of Budget Authority and/or Fund Balance with Treasury during FY 2017 and FY 2016 include the following:
●● The Department’s Fund Balance with Treasury includes, for NTIA’s Digital Television Transition and Public Safety Fund, $8.81 billion of funds not available as of September 30, 2017 and 2016.
●● The Department’s Fund Balance with Treasury for Deposit Funds, reported in Note 2, Fund Balance with Treasury, are not available to finance operating activities. These funds are also included in Note 2 on the line Non-budgetary (breakdown by status).
FY 20 17 AGENCY F I NANC IAL REPORT | 89
NOTES TO THE F I NANC IAL STATEMENTS
●● The Department’s Fund Balance with Treasury as of September 30, 2017 and 2016 includes $790.1 million of USPTO offsetting collections exceeding the current fiscal year and prior fiscal years’ appropriations. USPTO may use these funds only as authorized by the U.S. Congress, and only as made available by the issuance of a Treasury warrant. These funds are included in Note 2 on the lines General Funds (breakdown by type) and Temporarily Precluded From Obligation (breakdown by status).
●● The Omnibus Budget Reconciliation Act of 1990 established surcharges on certain statutory patent fees collected by USPTO. Subsequent legislation extended the surcharges through September 30, 1998. These surcharges were deposited into the Patent and Trademark Surcharge Fund, a Special Fund Receipt Account at Treasury. USPTO may use monies from this account only as authorized by Congress and made available by the issuance of a Treasury warrant. As of September 30, 2017 and 2016, $233.5 million of Fund Balance with Treasury is held in the Patent and Trademark Surcharge Fund. These funds are included in Note 2 on the lines Patent and Trademark Surcharge Fund – Special Funds section (breakdown by type), and Non-budgetary (breakdown by status).
●● The Department’s Fund Balance with Treasury as of September 30, 2017 and 2016 includes $147.7 million of USPTO sequestered funds temporarily not available. These funds are included in Note 2 on the lines General Funds (breakdown by type) and Temporarily Precluded from Obligation (breakdown by status).
●● For loan programs prior to the Federal Credit Reform Act of 1990 (pre-FY 1992 loans), most or all liquidating fund unobligated balances in excess of working capital needs are required to be transferred to Treasury as soon as practicable during the following fiscal year.
●● For direct loan programs under the Federal Credit Reform Act of 1990 (post-FY 1991 loans) that have outstanding debt to Treasury, regulations require that most unobligated balances be returned to Treasury on September 30 or require that the borrowing authority be cancelled on September 30.
Comparison to Budget of the U.S. Government:
A comparison was performed between the amounts reported in the FY 2016 SBR and the actual FY 2016 amounts reported in the FY 2018 budget of the U.S. Government for SBR lines Total Budgetary Resources; New Obligations and Upward Adjustment; Outlays, Net; and Distributed Offsetting (Receipts)/Outlays, Net. There was one material difference in the amount of $377 million related to Total Budgetary Resources balances on expired accounts existing on the SBR, that are not reported in the FY 2018 Budget of the U.S. Government. The President’s Budget that will report actual amounts for FY 2017 has not yet been published, and will be made available on OMB’s Budget Web page at https://www.whitehouse.gov/omb/budget/.
Apportionment Categories of New Obligations and Upward Adjustments:
Category A apportionments distribute budgetary resources by fiscal quarters, whereas Category B apportionments typically distribute budgetary resources by activities, projects, objects, or a combination of these categories.
90 | FY 20 17 AGENCY F I NANC IAL REPORT
NOTES TO THE F I NANC IAL STATEMENTS
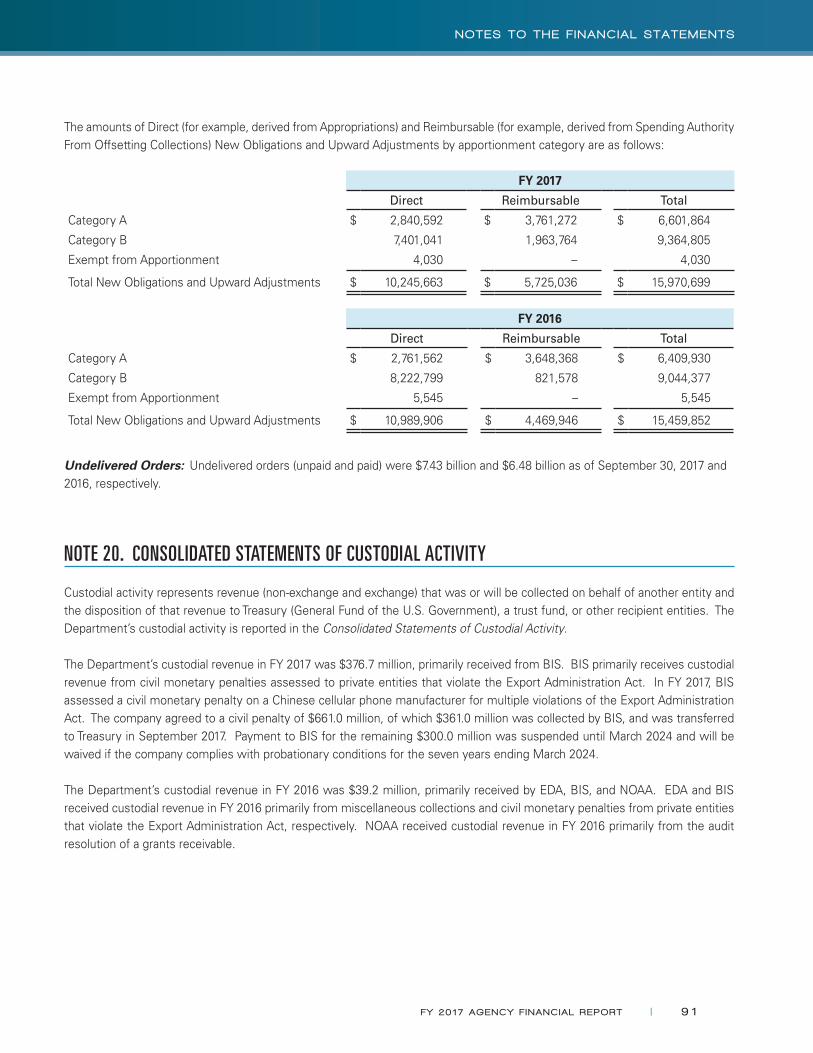
The amounts of Direct (for example, derived from Appropriations) and Reimbursable (for example, derived from Spending Authority From Offsetting Collections) New Obligations and Upward Adjustments by apportionment category are as follows:
FY 2017
Direct Reimbursable Total
Category A $ 2,840,592 $ 3,761,272 $ 6,601,864
Category B 7,401,041 1,963,764 9,364,805
Exempt from Apportionment 4,030 – 4,030
Total New Obligations and Upward Adjustments $ 10,245,663 $ 5,725,036 $ 15,970,699
FY 2016
Direct Reimbursable Total
Category A $ 2,761,562 $ 3,648,368 $ 6,409,930
Category B 8,222,799 821,578 9,044,377
Exempt from Apportionment 5,545 – 5,545
Total New Obligations and Upward Adjustments $ 10,989,906 $ 4,469,946 $ 15,459,852
Undelivered Orders: Undelivered orders (unpaid and paid) were $7.43 billion and $6.48 billion as of September 30, 2017 and 2016, respectively.
NOTE 20. CONSOLIDATED STATEMENTS OF CUSTODIAL ACTIVITY
Custodial activity represents revenue (non-exchange and exchange) that was or will be collected on behalf of another entity and the disposition of that revenue to Treasury (General Fund of the U.S. Government), a trust fund, or other recipient entities. The Department’s custodial activity is reported in the Consolidated Statements of Custodial Activity.
The Department’s custodial revenue in FY 2017 was $376.7 million, primarily received from BIS. BIS primarily receives custodial revenue from civil monetary penalties assessed to private entities that violate the Export Administration Act. In FY 2017, BIS assessed a civil monetary penalty on a Chinese cellular phone manufacturer for multiple violations of the Export Administration Act. The company agreed to a civil penalty of $661.0 million, of which $361.0 million was collected by BIS, and was transferred to Treasury in September 2017. Payment to BIS for the remaining $300.0 million was suspended until March 2024 and will be waived if the company complies with probationary conditions for the seven years ending March 2024.
The Department’s custodial revenue in FY 2016 was $39.2 million, primarily received by EDA, BIS, and NOAA. EDA and BIS received custodial revenue in FY 2016 primarily from miscellaneous collections and civil monetary penalties from private entities that violate the Export Administration Act, respectively. NOAA received custodial revenue in FY 2016 primarily from the audit resolution of a grants receivable.
FY 20 17 AGENCY F I NANC IAL REPORT | 91
NOTES TO THE F I NANC IAL STATEMENTS

NOTE 21. FIDUCIARY ACTIVITIES
Fiduciary activities are the collection or receipt, and the management, protection, accounting, and disposition by the federal government of cash or other assets in which non-federal individuals or entities have an ownership interest that the federal government must uphold. Fiduciary cash and other assets are not assets of the federal government and accordingly are not recognized on the proprietary financial statements. The Patent Cooperation Treaty authorized USPTO to collect patent filing and search fees on behalf of the World Intellectual Property Organization (WIPO), European Patent Office, Korean Intellectual Property Office, Russian Intellectual Property Organization, Australian Patent Office, Israeli Patent Office, Japanese Patent Office, and Intellectual Property Office of Singapore from U.S. citizens requesting an international patent. The Madrid Protocol Implementation Act authorized USPTO to collect trademark application fees on behalf of the International Bureau of the WIPO from U.S. citizens requesting an international trademark.
Schedule of Fiduciary Activities for the Year Ended September 30, 2017:
FY 2017
Patent Cooperation Treaty
Madrid Protocol Total
Fiduciary Net Assets, Beginning Balance $ 14,459 $ 451 $ 14,910
Contributions 151,264 22,812 174,076
Disbursements to and on Behalf of Beneficiaries (151,892) (22,721) (174,613)
Increase/(Decrease) in Fiduciary Net Assets (628) 91 (537)
Fiduciary Net Assets, Ending Balance $ 13,831 $ 542 $ 14,373
Fiduciary Net Assets as of September 30, 2017:
FY 2017
Patent Cooperation Treaty
Madrid Protocol Total
Fund Balance with Treasury $ 13,831 $ 542 $ 14,373
Schedule of Fiduciary Activities for the Year Ended September 30, 2016:
FY 2016
Patent Cooperation Treaty
Madrid Protocol Total
Fiduciary Net Assets, Beginning Balance $ 16,168 $ 615 $ 16,783
Contributions 154,474 22,572 177,046
Disbursements to and on Behalf of Beneficiaries (156,183) (22,736) (178,919)
Increase/(Decrease) in Fiduciary Net Assets (1,709) (164) (1,873)
Fiduciary Net Assets, Ending Balance $ 14,459 $ 451 $ 14,910
Fiduciary Net Assets as of September 30, 2016:
FY 2016
Patent Cooperation Treaty
Madrid Protocol Total
Fund Balance with Treasury $ 14,459 $ 451 $ 14,910
92 | FY 20 17 AGENCY F I NANC IAL REPORT
NOTES TO THE F I NANC IAL STATEMENTS
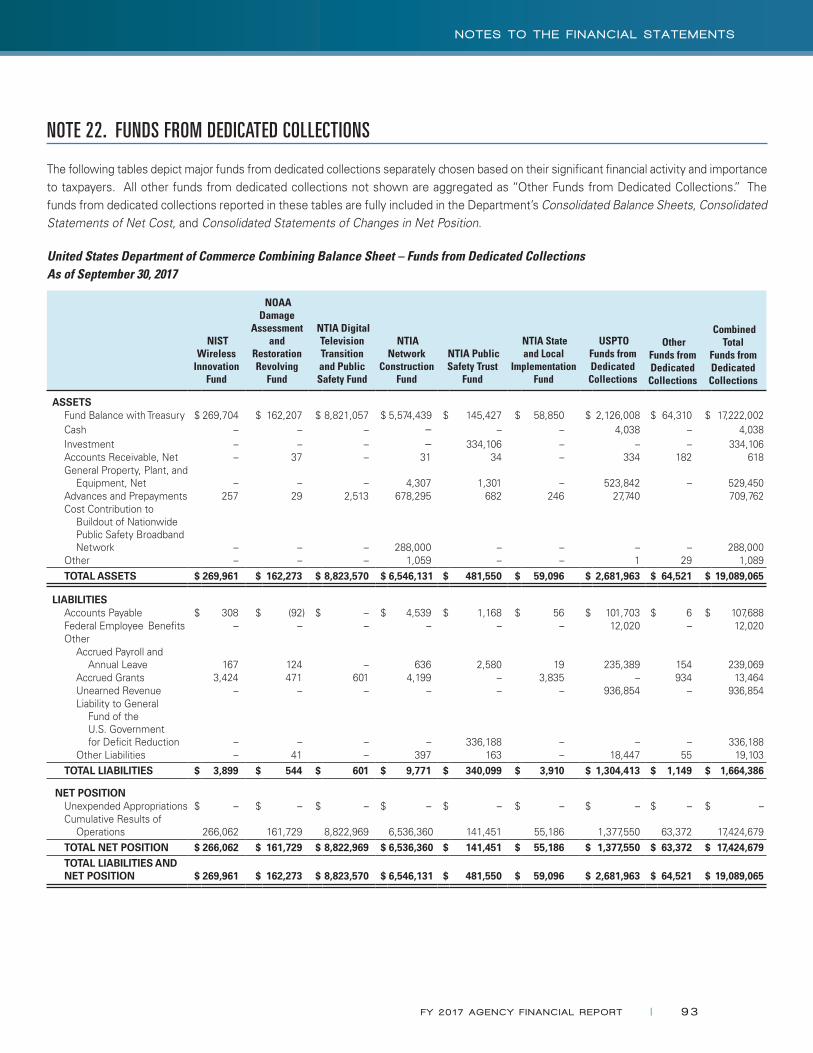
NOTE 22. FUNDS FROM DEDICATED COLLECTIONS
The following tables depict major funds from dedicated collections separately chosen based on their significant financial activity and importance to taxpayers. All other funds from dedicated collections not shown are aggregated as “Other Funds from Dedicated Collections.” The funds from dedicated collections reported in these tables are fully included in the Department’s Consolidated Balance Sheets, Consolidated Statements of Net Cost, and Consolidated Statements of Changes in Net Position.
United States Department of Commerce Combining Balance Sheet – Funds from Dedicated Collections As of September 30, 2017
NIST Wireless
Innovation Fund
NOAA Damage
Assessment and
Restoration Revolving
Fund
NTIA Digital Television Transition and Public Safety Fund
NTIA Network
Construction Fund
NTIA Public Safety Trust
Fund
NTIA State and Local
Implementation Fund
USPTO Funds from Dedicated
Collections
Other Funds from Dedicated
Collections
Combined Total
Funds from Dedicated
Collections
ASSETS Fund Balance with Treasury $ 269,704 $ 162,207 $ 8,821,057 $ 5,574,439 $ 145,427 $ 58,850 $ 2,126,008 $ 64,310 $ 17,222,002Cash – – – – – – 4,038 – 4,038Investment – – – – 334,106 – – – 334,106Accounts Receivable, Net – 37 – 31 34 – 334 182 618General Property, Plant, and
Equipment, Net – – – 4,307 1,301 – 523,842 – 529,450Advances and Prepayments 257 29 2,513 678,295 682 246 27,740 709,762Cost Contribution to
Buildout of Nationwide Public Safety Broadband Network – – – 288,000 – – – – 288,000
Other – – – 1,059 – – 1 29 1,089 TOTAL ASSETS $ 269,961 $ 162,273 $ 8,823,570 $ 6,546,131 $ 481,550 $ 59,096 $ 2,681,963 $ 64,521 $ 19,089,065
LIABILITIES Accounts Payable $ 308 $ (92) $ – $ 4,539 $ 1,168 $ 56 $ 101,703 $ 6 $ 107,688 Federal Employee Benefits – – – – – – 12,020 – 12,020 Other
Accrued Payroll and Annual Leave 167 124 – 636 2,580 19 235,389 154 239,069
Accrued Grants 3,424 471 601 4,199 – 3,835 – 934 13,464Unearned Revenue – – – – – – 936,854 – 936,854Liability to General
Fund of the U.S. Government for Deficit Reduction – – – – 336,188 – – – 336,188
Other Liabilities – 41 – 397 163 – 18,447 55 19,103 TOTAL LIABILITIES $ 3,899 $ 544 $ 601 $ 9,771 $ 340,099 $ 3,910 $ 1,304,413 $ 1,149 $ 1,664,386
NET POSITION Unexpended Appropriations $ – $ – $ – $ – $ – $ – $ – $ – $ –Cumulative Results of
Operations 266,062 161,729 8,822,969 6,536,360 141,451 55,186 1,377,550 63,372 17,424,679 TOTAL NET POSITION $ 266,062 $ 161,729 $ 8,822,969 $ 6,536,360 $ 141,451 $ 55,186 $ 1,377,550 $ 63,372 $ 17,424,679 TOTAL LIABILITIES AND
NET POSITION $ 269,961 $ 162,273 $ 8,823,570 $ 6,546,131 $ 481,550 $ 59,096 $ 2,681,963 $ 64,521 $ 19,089,065
FY 20 17 AGENCY F I NANC IAL REPORT | 93
NOTES TO THE F I NANC IAL STATEMENTS
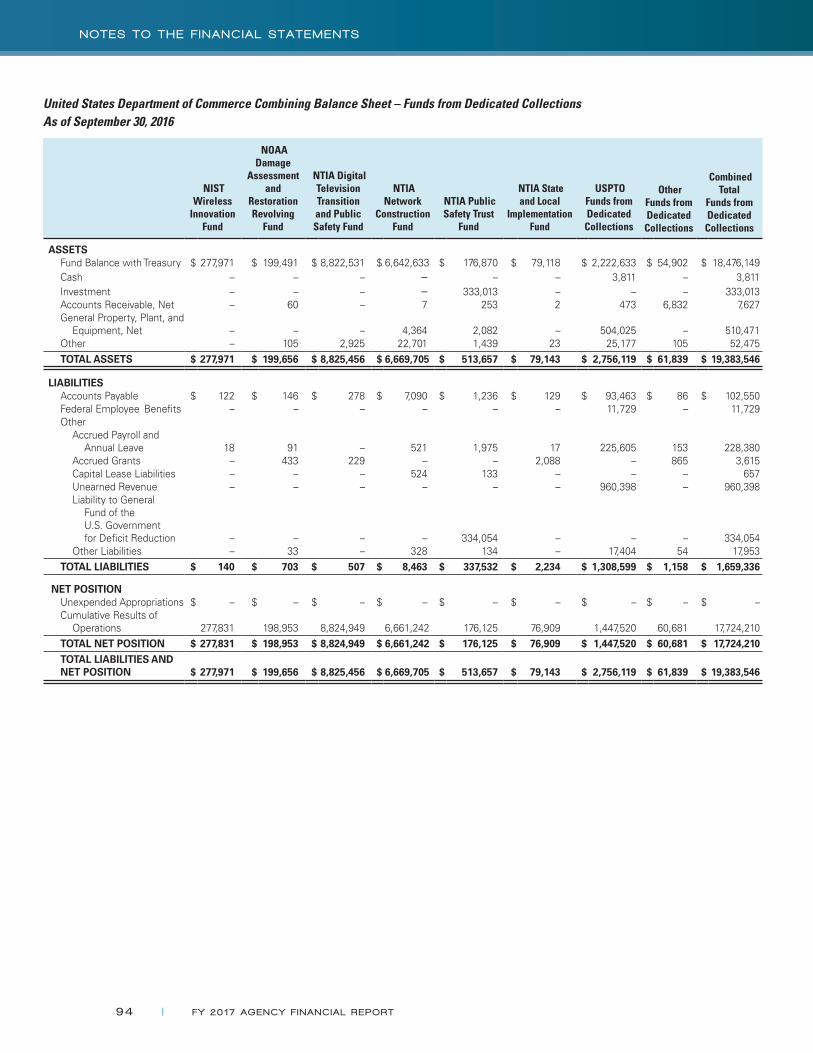
United States Department of Commerce Combining Balance Sheet – Funds from Dedicated Collections As of September 30, 2016
NIST Wireless
Innovation Fund
NOAA Damage
Assessment and
Restoration Revolving
Fund
NTIA Digital Television Transition and Public Safety Fund
NTIA Network
Construction Fund
NTIA Public Safety Trust
Fund
NTIA State and Local
Implementation Fund
USPTO Funds from Dedicated
Collections
Other Funds from Dedicated
Collections
Combined Total
Funds from Dedicated
Collections
ASSETS Fund Balance with Treasury $ 277,971 $ 199,491 $ 8,822,531 $ 6,642,633 $ 176,870 $ 79,118 $ 2,222,633 $ 54,902 $ 18,476,149Cash – – – – – – 3,811 – 3,811Investment – – – – 333,013 – – – 333,013Accounts Receivable, Net – 60 – 7 253 2 473 6,832 7,627General Property, Plant, and
Equipment, Net – – – 4,364 2,082 – 504,025 – 510,471Other – 105 2,925 22,701 1,439 23 25,177 105 52,475
TOTAL ASSETS $ 277,971 $ 199,656 $ 8,825,456 $ 6,669,705 $ 513,657 $ 79,143 $ 2,756,119 $ 61,839 $ 19,383,546
LIABILITIES Accounts Payable $ 122 $ 146 $ 278 $ 7,090 $ 1,236 $ 129 $ 93,463 $ 86 $ 102,550 Federal Employee Benefits – – – – – – 11,729 – 11,729 Other
Accrued Payroll and Annual Leave 18 91 – 521 1,975 17 225,605 153 228,380
Accrued Grants – 433 229 – – 2,088 – 865 3,615Capital Lease Liabilities – – – 524 133 – – – 657Unearned Revenue – – – – – – 960,398 – 960,398Liability to General
Fund of the U.S. Government for Deficit Reduction – – – – 334,054 – – – 334,054
Other Liabilities – 33 – 328 134 – 17,404 54 17,953 TOTAL LIABILITIES $ 140 $ 703 $ 507 $ 8,463 $ 337,532 $ 2,234 $ 1,308,599 $ 1,158 $ 1,659,336
NET POSITION Unexpended Appropriations $ – $ – $ – $ – $ – $ – $ – $ – $ –Cumulative Results of
Operations 277,831 198,953 8,824,949 6,661,242 176,125 76,909 1,447,520 60,681 17,724,210 TOTAL NET POSITION $ 277,831 $ 198,953 $ 8,824,949 $ 6,661,242 $ 176,125 $ 76,909 $ 1,447,520 $ 60,681 $ 17,724,210 TOTAL LIABILITIES AND
NET POSITION $ 277,971 $ 199,656 $ 8,825,456 $ 6,669,705 $ 513,657 $ 79,143 $ 2,756,119 $ 61,839 $ 19,383,546
94 | FY 20 17 AGENCY F I NANC IAL REPORT
NOTES TO THE F I NANC IAL STATEMENTS
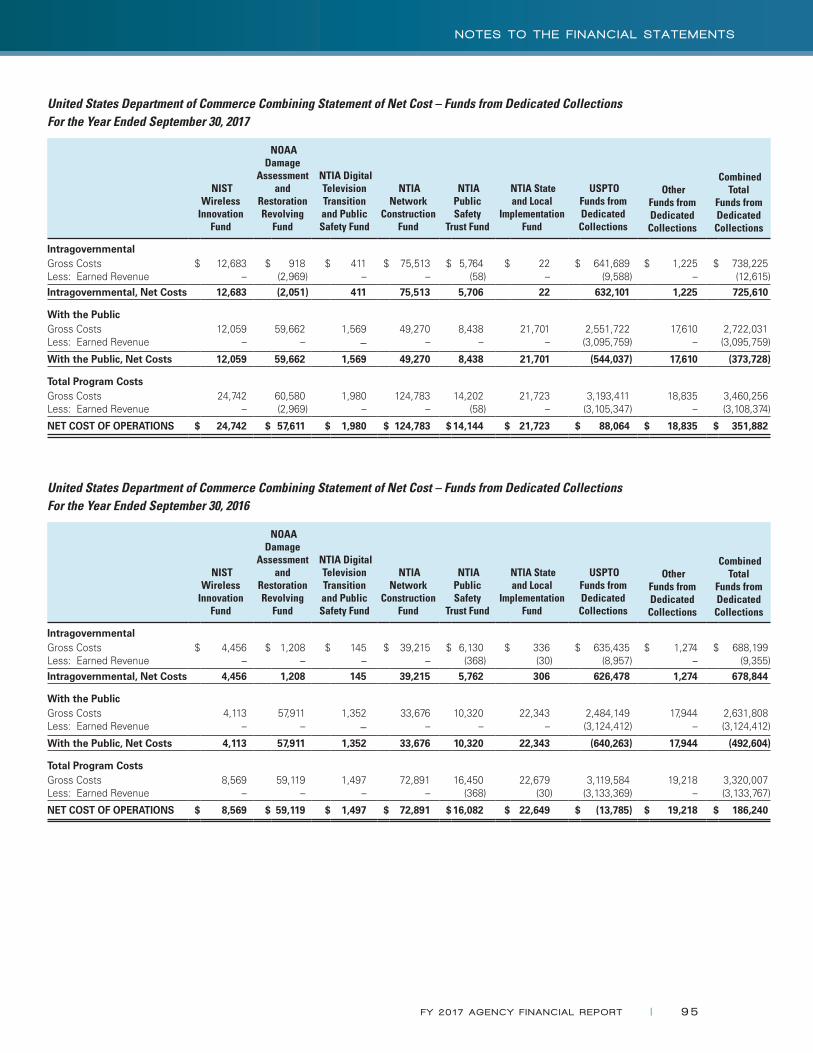
United States Department of Commerce Combining Statement of Net Cost – Funds from Dedicated Collections For the Year Ended September 30, 2017
NIST Wireless
Innovation Fund
NOAA Damage
Assessment and
Restoration Revolving
Fund
NTIA Digital Television Transition and Public Safety Fund
NTIA Network
Construction Fund
NTIA Public Safety
Trust Fund
NTIA State and Local
Implementation Fund
USPTO Funds from Dedicated
Collections
Other Funds from Dedicated
Collections
Combined Total
Funds from Dedicated
Collections
IntragovernmentalGross Costs $ 12,683 $ 918 $ 411 $ 75,513 $ 5,764 $ 22 $ 641,689 $ 1,225 $ 738,225Less: Earned Revenue – (2,969) – – (58) – (9,588) – (12,615)Intragovernmental, Net Costs 12,683 (2,051) 411 75,513 5,706 22 632,101 1,225 725,610
With the PublicGross Costs 12,059 59,662 1,569 49,270 8,438 21,701 2,551,722 17,610 2,722,031Less: Earned Revenue – – – – – – (3,095,759) – (3,095,759)
With the Public, Net Costs 12,059 59,662 1,569 49,270 8,438 21,701 (544,037) 17,610 (373,728)
Total Program CostsGross Costs 24,742 60,580 1,980 124,783 14,202 21,723 3,193,411 18,835 3,460,256Less: Earned Revenue – (2,969) – – (58) – (3,105,347) – (3,108,374)
NET COST OF OPERATIONS $ 24,742 $ 57,611 $ 1,980 $ 124,783 $14,144 $ 21,723 $ 88,064 $ 18,835 $ 351,882
United States Department of Commerce Combining Statement of Net Cost – Funds from Dedicated Collections For the Year Ended September 30, 2016
NIST Wireless
Innovation Fund
NOAA Damage
Assessment and
Restoration Revolving
Fund
NTIA Digital Television Transition and Public Safety Fund
NTIA Network
Construction Fund
NTIA Public Safety
Trust Fund
NTIA State and Local
Implementation Fund
USPTO Funds from Dedicated
Collections
Other Funds from Dedicated
Collections
Combined Total
Funds from Dedicated
Collections
IntragovernmentalGross Costs $ 4,456 $ 1,208 $ 145 $ 39,215 $ 6,130 $ 336 $ 635,435 $ 1,274 $ 688,199Less: Earned Revenue – – – – (368) (30) (8,957) – (9,355)Intragovernmental, Net Costs 4,456 1,208 145 39,215 5,762 306 626,478 1,274 678,844
With the PublicGross Costs 4,113 57,911 1,352 33,676 10,320 22,343 2,484,149 17,944 2,631,808Less: Earned Revenue – – – – – – (3,124,412) – (3,124,412)
With the Public, Net Costs 4,113 57,911 1,352 33,676 10,320 22,343 (640,263) 17,944 (492,604)
Total Program CostsGross Costs 8,569 59,119 1,497 72,891 16,450 22,679 3,119,584 19,218 3,320,007Less: Earned Revenue – – – – (368) (30) (3,133,369) – (3,133,767)
NET COST OF OPERATIONS $ 8,569 $ 59,119 $ 1,497 $ 72,891 $16,082 $ 22,649 $ (13,785) $ 19,218 $ 186,240
FY 20 17 AGENCY F I NANC IAL REPORT | 95
NOTES TO THE F I NANC IAL STATEMENTS

United States Department of Commerce Combining Statement of Changes in Net Position – Funds from Dedicated CollectionsFor the Year Ended September 30, 2017
NIST Wireless
Innovation Fund
NOAA Damage
Assessment and
Restoration Revolving
Fund
NTIA Digital Television
Transition and Public Safety
Fund
NTIA Network
Construction Fund
NTIA Public Safety Trust
Fund
NTIA State and Local
Implementation Fund
USPTO Funds from Dedicated
Collections
Other Funds from Dedicated
Collections
Combined Total
Funds from Dedicated
Collections
Cumulative Results of Operations: Beginning Balance $ 277,831 $ 198,953 $ 8,824,949 $ 6,661,242 $ 176,125 $ 76,909 $ 1,447,520 $ 60,681 $ 17,724,210
Budgetary Financing Sources: Non-exchange Revenue – 13,236 – – 2,133 – – 21,526 36,895Transfers In/(Out) Without
Reimbursement, Net 13,600 7,151 – – (21,420) – (2,000) – (2,669)
Other Financing Sources (Non-exchange):
Transfers In/(Out) Without Reimbursement, Net (627) – – (98) – – – – (725)
Imputed Financing Sources from Cost Absorbed by Others – – – – 892 – 20,094 – 20,986
Financing Sources Used for Recognizing Liability to General Fund of the U.S. Government for Deficit Reduction – – – – (2,134) – – – (2,134)
Other Financing Sources/(Uses), Net – – – (1) (1) – – – (2)
Total Financing Sources 12,973 20,387 – (99) (20,530) – 18,094 21,526 52,351
Net Cost of Operations (24,742) (57,611) (1,980) (124,783) (14,144) (21,723) (88,064) (18,835) (351,882)
Net Change (11,769) (37,224) (1,980) (124,882) (34,674) (21,723) (69,970) 2,691 (299,531)
Cumulative Results of Operations – Ending Balance 266,062 161,729 8,822,969 6,536,360 141,451 55,186 1,377,550 63,372 17,424,679
NET POSITION $ 266,062 $ 161,729 $ 8,822,969 $ 6,536,360 $ 141,451 $ 55,186 $ 1,377,550 $ 63,372 $ 17,424,679
96 | FY 20 17 AGENCY F I NANC IAL REPORT
NOTES TO THE F I NANC IAL STATEMENTS

United States Department of Commerce Combining Statement of Changes in Net Position – Funds from Dedicated CollectionsFor the Year Ended September 30, 2016
NIST Wireless
Innovation Fund
NOAA Damage
Assessment and
Restoration Revolving
Fund
NTIA Digital Television
Transition and Public Safety
Fund
NTIA Network
Construction Fund
NTIA Public Safety Trust
Fund
NTIA State and Local
Implementation Fund
USPTO Funds from Dedicated
Collections
Other Funds from Dedicated
Collections
Combined Total
Funds from Dedicated
Collections
Cumulative Results of Operations: Beginning Balance $ 92,700 $ 260,591 $ 8,826,446 $ 6,367,864 $ 540,743 $ 99,558 $ 1,401,156 $ 51,028 $ 17,640,086
Budgetary Financing Sources: Non-exchange Revenue – (17,673) – – 6 – – 28,871 11,204Transfers In of Auction Proceeds
from Federal Communications Commission – – – – 8,430,058
– – – 8,430,058
Transfer Out to Receipt Account for Providing Funds to General Fund of the U.S. Government – – – – (7,781,010)
– – – (7,781,010)
Transfers from Public Safety Trust Fund to Dedicated Collections Funds 193,700 – – 366,269 (559,969)
– – – –
Transfers In/(Out) Without Reimbursement, Net – 15,154 – – (104,430)
– (2,100) – (91,376)
Other Financing Sources (Non-exchange):
Transfer In Received by Receipt Account for Providing Funds to General Fund of the U.S. Government – – – – 7,781,010 – – – 7,781,010
Transfer Out to General Fund of the U.S. Government for Deficit Reduction – – – – (7,781,010) – – – (7,781,010)
Imputed Financing Sources from Cost Absorbed by Others – – – – 863 – 34,679 – 35,542
Financing Sources Used for Recognizing Liability to General Fund of the U.S. Government for Deficit Reduction – – – – (334,054) – – – (334,054)
Total Financing Sources 193,700 (2,519) – 366,269 (348,536) – 32,579 28,871 270,364
Net Cost of Operations (8,569) (59,119) (1,497) (72,891) (16,082) (22,649) 13,785 (19,218) (186,240)
Net Change 185,131 (61,638) (1,497) 293,378 (364,618) (22,649) 46,364 9,653 84,124
Cumulative Results of Operations – Ending Balance 277,831 198,953 8,824,949 6,661,242 176,125 76,909 1,447,520 60,681 17,724,210
NET POSITION $ 277,831 $ 198,953 $ 8,824,949 $ 6,661,242 $ 176,125 $ 76,909 $ 1,447,520 $ 60,681 $ 17,724,210
Below is a description of major Funds from Dedicated Collections shown in the tables above and on the previous pages:
NIST’s Wireless Innovation Fund was created in order for NIST, in consultation with the Federal Communications Commission (FCC), the Secretary of Homeland Security, and the National Institute of Justice of the U.S. Department of Justice, to conduct research and assist with the development of standards, technologies, and applications to advance wireless public safety communications. Section 6413 of the Middle Class Tax Relief and Job Creation Act of 2012 requires NTIA to make available $300.0 million to the Director of NIST as amounts are deposited into NTIA’s Public Safety Trust Fund to carry out public safety research. The Wireless Innovation Fund in FY 2017 and FY 2016 received transfers in totaling $13.6 million and $193.7 million, respectively, from NTIA’s Public Safety Trust Fund, which are included in the FY 2017 and FY 2016 SCNP reported in this Note, and which are also included in the Department’s FY 2017 and FY 2016 SBR as Spending Authority From Offsetting Collections. The Wireless Innovation Fund in FY 2015 also similarly received transfers in totaling $92.7 million from NTIA’s Public Safety Trust fund. The law establishing this program can be found in Section 6303 of the Middle Class Tax Relief and Job Creation Act of 2012.
FY 20 17 AGENCY F I NANC IAL REPORT | 97
NOTES TO THE F I NANC IAL STATEMENTS
NOAA’s Damage Assessment and Restoration Revolving Fund receives monies for the reimbursement of expenses related to oil or hazardous substance spill response activities, or natural resource damages assessment, restoration, rehabilitation, replacement, or acquisition activities conducted by NOAA. The recovered sums by a federal, state, Indian, or foreign trustee for natural resource damages is retained by the trustee and is only used to reimburse or pay costs incurred by the trustee for the damaged natural resources. The law establishing the Damage Assessment and Restoration Revolving Fund can be found in 33 U.S.C. Section 2706.
NTIA’s Digital Television Transition and Public Safety Fund made digital television available to every home in America, improved communications between local, state, and federal agencies, allowed smaller television stations to broadcast digital television, and improved how warnings are received when disasters occur. NTIA received initial funding from borrowings from Treasury, and repaid Treasury from the proceeds of the auction of recovered analog spectrum which was completed in March 2008. The proceeds from the auction provided funding for several programs, and $7.36 billion was transferred in September 2009 to the General Fund of the U.S. Government as required by the Deficit Reduction Act of 2005. The Fund has a Net Position, Cumulative Results of Operations balance of $8.82 billion included in the Balance Sheet as of September 30, 2017 reported in this Note, and OMB’s FY 2017 apportionment for the Fund indicates that $8.82 billion is not available. The law establishing programs under this fund can be found in the Deficit Reduction Act of 2005, Sections 3001-3014. For FY 2017 budgetary financial information for the Digital Television Transition and Public Safety Fund, see the Combining Schedule of Budgetary Resources by Major Budget Account (unaudited), included in Required Supplementary Information (Unaudited).
NTIA’s Network Construction Fund primarily provides funding for buildout and operations, excluding administrative expenses which are paid by NTIA’s Public Safety Trust Fund, of the First Responder Network Authority (FirstNet), an independent authority within NTIA, and also provides funding for NTIA to make grants to states under the “Opt-Out” program. FirstNet shall ensure the establishment of a nationwide interoperable broadband network to help police, firefighters, emergency medical service professionals, and other public safety officials stay safe and do their jobs. The Network Construction Fund in FY 2016 received transfers in totaling $366.3 million from NTIA’s Public Safety Trust Fund, which are included in the FY 2016 SCNP reported in this Note, and which are also included in the Department’s FY 2016 SBR as Spending Authority From Offsetting Collections. The Network Construction Fund in FY 2015 also similarly received transfers in totaling $6.40 billion from NTIA’s Public Safety Trust Fund.
Advances and Prepayments reported on the Balance Sheet as of September 30, 2017 in this Note includes $672.0 million for the balance of an advance payment made by the Network Construction Fund to the U.S. Department of the Interior (DOI) for the advance funding of certain task orders under the DOI contract with AT&T for AT&T to build, operate, and maintain the Nationwide Public Safety Broadband Network (NPSBN).
The initial advance payment made to DOI during FY 2017 for certain task orders was $1.00 billion, which is also included in the Department’s FY 2017 SBR as New Obligations and Upward Adjustments and as Outlays, Gross. The initial advance payment of $1.00 billion to DOI has been reduced by $328.0 million in FY 2017 as a result of (a) completed and accepted AT&T contract performance totaling $20.0 million; and (b) FY 2017 accrued costs for estimated, unbilled AT&T contract performance progress through September 30, 2017 of $308.0 million.
The above described FY 2017 accrued costs of $308.0 million for estimated, unbilled AT&T contract performance progress through September 30, 2017 are estimated to include $288.0 million for the buildout of NPSBN. These costs are included as an asset in the Balance Sheet (Cost Contribution to Buildout of NPSBN) as of September 30, 2017. See Note 1.L for information regarding the classification of these costs as an asset.
The law establishing the Network Construction Fund can be found under Section 6206 of the Middle Class Tax Relief and Job Creation Act of 2012. For FY 2017 budgetary financial information for the Network Construction Fund, see the Combining Schedule of Budgetary Resources by Major Budget Account (unaudited) for FY 2017, included in Required Supplementary Information (Unaudited).
98 | FY 20 17 AGENCY F I NANC IAL REPORT
NOTES TO THE F I NANC IAL STATEMENTS

NTIA’s Public Safety Trust Fund was created as a result of Section 6413 of the Middle Class Tax Relief and Job Creation Act of 2012 (Act). The Act provides funding for specified programs and activities to be derived from the proceeds of FCC auctions of spectrum licenses, to be deposited into the Public Safety Trust Fund.
Prior to the receipt of auction proceeds from FCC, the Act provided authority to NTIA to borrow up to $2.00 billion from Treasury, interest-free, with the debt to be repaid from auction proceeds as the first priority. The Public Safety Trust Fund borrowed $2.00 billion from Treasury through FY 2014, which was repaid in full as of September 30, 2015.
FCC carries out auctions in accordance with the Act, of which certain earned net auction proceeds (earned auction proceeds less any FCC administrative fees) are transferred from FCC to the Public Safety Trust Fund. A transfer in from FCC becomes a budgetary financing source on the SCNP and a budgetary resource on the SBR when the transfer is received. Transfers in of auction proceeds from FCC totaling $8.43 billion were received in FY 2016, and were included as a Budgetary Financing Source on the FY 2016 SCNP and as a Budgetary Resource on the FY 2016 SBR (Appropriations). Transfers in of auction proceeds from FCC totaling $19.85 billion were also similarly received through FY 2015.
The Act directs the use of auction proceeds in an order of priority after the repayment of borrowings from Treasury (priority 1):
●● Priority 1, the repayment of borrowings from Treasury, was fully completed as of September 30, 2015 as previously discussed.
●● In FY 2015, the Public Safety Trust Fund transferred out $130.9 million, net of sequestration, to NTIA’s State and Local Implementation Fund, fully completing priority 2.
●● In FY 2016, the Public Safety Trust Fund transferred out a total of $366.3 million to NTIA’s Network Construction Fund, towards priority 3 of up to $7.00 billion. These transfers out are included in the FY 2016 SCNP reported in this Note, and are also included in the Department’s FY 2016 SBR as New Obligations and Upward Adjustments and as Outlays, Gross. The Public Safety Trust Fund also similarly transferred out a total of $6.40 billion to the Network Construction Fund in FY 2015 towards priority 3.
●● In FY 2017 and FY 2016, the Public Safety Trust Fund transferred out a total of $13.6 million and $193.7 million, respectively, to NIST’s Wireless Innovation Fund, fully completing priority 4 and priority 7 totaling $300.0 million for transfers to NIST to carry out public safety research. These transfers are included in the FY 2017 and FY 2016 SCNP reported in this Note, and are also included in the Department’s FY 2017 and FY 2016 SBR as New Obligations and Upward Adjustments and as Outlays, Gross. The Public Safety Trust Fund also similarly transferred out a total of $92.7 million to the Wireless Innovation Fund in FY 2015 towards priority 4 and priority 7.
●● Priority 5 specifies that the Public Safety Trust Fund is to deposit a total of $20.40 billion in the General Fund of the U.S. Government for deficit reduction. Fully completing this priority, the Public Safety Trust Fund transferred out a total of $7.78 billion in FY 2016 to a receipt account utilized for transferring these funds to the General Fund of the U.S. Government, and the receipt account transferred a total of $7.78 billion in FY 2016 to the General Fund of the U.S. Government. These transfers are included in the FY 2016 SCNP reported in this Note. The Public Safety Trust Fund transfers out of a total of $7.78 billion in FY 2016 to the receipt account are also included as reductions of Budgetary Resources, Appropriations in the Department’s FY 2016 SBR. The Public Safety Trust Fund also similarly transferred out a total of $12.62 billion to the General Fund of the U.S. Government in FY 2015 for deficit reduction towards priority 5.
●● Priority 6 specifies that the Public Safety Trust Fund make available $115.0 million to the Assistant Secretary (NTIA) and the Administrator of the National Highway Traffic Safety Administration (NHTSA) to carry out the grant program of Next Generation 9-1-1. Fully completing this priority, the Public Safety Trust Fund transferred out $7.8 million in FY 2017 and $104.4 million in FY 2016 to NHTSA, and made available in FY 2016 $2.8 million within the Public Safety Trust Fund for the
FY 20 17 AGENCY F I NANC IAL REPORT | 99
NOTES TO THE F I NANC IAL STATEMENTS

Assistant Secretary (NTIA). The transfers out to NHTSA are included in the FY 2017 and FY 2016 SCNP reported in this Note, and are also included in the Department’s FY 2017 and FY 2016 SBR as New Obligations and Upward Adjustments and as Outlays, Gross.
●● Priority 8 specifies that any remaining amounts deposited in the Public Safety Trust Fund shall be deposited in the General Fund of the U.S. Government for deficit reduction. The Act further specifies that any amounts remaining in the Public Safety Trust Fund after the end of FY 2022 shall be deposited in the General Fund of the U.S. Government for deficit reduction. Towards priority 8, the Public Safety Trust Fund has recorded a liability (not covered by budgetary resources) to the General Fund of the U.S. Government of $336.2 million and $334.1 million as of September 30, 2017 and September 30, 2016, respectively. The corresponding FY 2017 and FY 2016 financing sources used to increase (FY 2017) or initially recognize (FY 2016) this liability are reported in the FY 2017 and FY 2016 SCNP reported in this Note, Other Financing Sources (Non-exchange) section.
The Act specifies that amounts in the Public Safety Trust Fund be invested in accordance with Section 9702 of Title 31, United States Code. The Public Safety Trust Fund has an investment in a market-based Treasury security of $334.1 million and $333.0 million as of September 30, 2017 and 2016, respectively; see Note 3, Investment, for more information. The federal government does not set aside assets to pay future expenditures associated with the Public Safety Trust Fund. The dedicated cash receipts collected from the public into the Public Safety Trust Fund are deposited with Treasury, which uses the cash for general government purposes. Treasury securities are issued to the Public Safety Trust Fund as evidence of its receipts. Treasury securities are an asset to the Public Safety Trust Fund, and Treasury securities are a liability of Treasury. Because the Public Safety Trust Fund and Treasury are both parts of the federal government, these assets and liabilities offset each other from the standpoint of the federal government as a whole. For this reason, they do not represent an asset or a liability in the U.S. government-wide financial statements. Treasury securities provide the Public Safety Trust Fund with authority to draw upon Treasury to make future expenditures. When the Public Safety Trust Fund requires redemption of these securities to make expenditures, the federal government finances those expenditures out of accumulated cash balances by raising taxes or other receipts, by borrowing from the public or repaying less debt, or by curtailing other expenditures. This is the same way that the federal government finances all other expenditures.
For FY 2017 budgetary financial information for the Public Safety Trust Fund, see the Combining Schedule of Budgetary Resources by Major Budget Account (unaudited) for FY 2017 included in Required Supplementary Information (Unaudited).
NTIA’s State and Local Implementation Fund includes a matching grants program to states, carried out by NTIA, in consultation with FirstNet, to assist state, regional, tribal, and local jurisdictions to identify, plan, and implement the most efficient and effective way for such jurisdictions to utilize and integrate the infrastructure, equipment, and other architecture associated with NPSBN to satisfy the wireless communications and data services needs of that jurisdiction, including with regards to coverage, siting, and other needs. The program was initially funded by borrowings from Treasury, without interest, which had been fully repaid in FY 2015. The State and Local Implementation Fund in FY 2015 received transfers in totaling $130.9 million from NTIA’s Public Safety Trust Fund. If there is a balance remaining in the Fund on September 30, 2022, the Fund shall transfer such balance to the General Fund of the U.S. Government for deficit reduction. The law establishing this program can be found in Sections 6301 and 6302 of the Middle Class Tax Relief and Job Creation Act of 2012.
USPTO’s Funds from Dedicated Collections consist of its Salaries and Expenses Fund, Patent and Trademark Fee Reserve Fund, and Patent and Trademark Surcharge Fund.
100 | FY 20 17 AGENCY F I NANC IAL REPORT
NOTES TO THE F I NANC IAL STATEMENTS
The Salaries and Expenses Fund contains monies used for the administering of the laws relevant to patents and trademarks and advising the Secretary of Commerce, the President of the United States, and the Administration on patent, trademark, and copyright protection, and trade-related aspects of intellectual property. This fund is used for USPTO’s three core business activities–granting patents; registering trademarks; and intellectual property policy, protection, and enforcement–that promote the use of intellectual property rights as a means of achieving economic prosperity. These activities give innovators, businesses, and entrepreneurs the protection and encouragement they need to turn their creative ideas into tangible products, and also provide protection for their inventions and trademarks. USPTO may use monies from this account only as authorized by Congress. For FY 2017 budgetary financial information for the Salaries and Expenses Fund, see the Combining Schedule of Budgetary Resources by Major Budget Account (unaudited) for FY 2017, included in Required Supplementary Information (Unaudited).
The Patent and Trademark Surcharge Fund, a Special Fund Receipt Account at Treasury, is discussed in Note 19, Combined Statements of Budgetary Resources. USPTO may use monies from this account only as authorized by Congress and made available by the issuance of a Treasury warrant. As of September 30, 2017 and 2016, $233.5 million of Fund Balance with Treasury is held in this fund.
The Patent and Trademark Fee Reserve Fund results from a provision that requires USPTO to deposit all patent and trademark fees collected in excess of the annual appropriation amount into the Fund. Funds made available may only be used for expenses of USPTO relating to the processing of patent applications and for other activities, services, and materials relating to patents and applicable administrative costs. No monies have yet been deposited into this Fund through September 30, 2017. The law establishing the Patent and Trademark Fee Reserve Fund can be found in 35 U.S.C. Section 42(c).
FY 20 17 AGENCY F I NANC IAL REPORT | 101
NOTES TO THE F I NANC IAL STATEMENTS
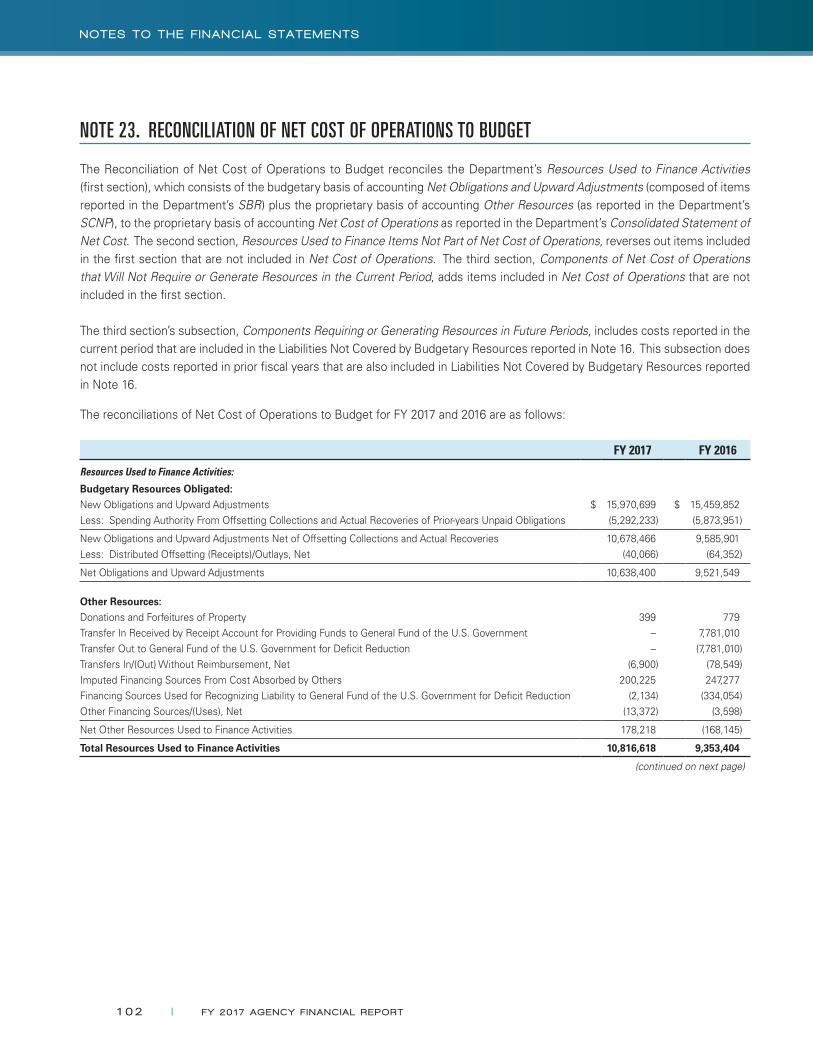
NOTE 23. RECONCILIATION OF NET COST OF OPERATIONS TO BUDGET
The Reconciliation of Net Cost of Operations to Budget reconciles the Department’s Resources Used to Finance Activities (first section), which consists of the budgetary basis of accounting Net Obligations and Upward Adjustments (composed of items reported in the Department’s SBR) plus the proprietary basis of accounting Other Resources (as reported in the Department’s SCNP), to the proprietary basis of accounting Net Cost of Operations as reported in the Department’s Consolidated Statement of Net Cost. The second section, Resources Used to Finance Items Not Part of Net Cost of Operations, reverses out items included in the first section that are not included in Net Cost of Operations. The third section, Components of Net Cost of Operations that Will Not Require or Generate Resources in the Current Period, adds items included in Net Cost of Operations that are not included in the first section.
The third section’s subsection, Components Requiring or Generating Resources in Future Periods, includes costs reported in the current period that are included in the Liabilities Not Covered by Budgetary Resources reported in Note 16. This subsection does not include costs reported in prior fiscal years that are also included in Liabilities Not Covered by Budgetary Resources reported in Note 16.
The reconciliations of Net Cost of Operations to Budget for FY 2017 and 2016 are as follows:
FY 2017 FY 2016
Resources Used to Finance Activities:
Budgetary Resources Obligated:New Obligations and Upward Adjustments $ 15,970,699 $ 15,459,852Less: Spending Authority From Offsetting Collections and Actual Recoveries of Prior-years Unpaid Obligations (5,292,233) (5,873,951)
New Obligations and Upward Adjustments Net of Offsetting Collections and Actual Recoveries 10,678,466 9,585,901Less: Distributed Offsetting (Receipts)/Outlays, Net (40,066) (64,352)
Net Obligations and Upward Adjustments 10,638,400 9,521,549
Other Resources: Donations and Forfeitures of Property 399 779 Transfer In Received by Receipt Account for Providing Funds to General Fund of the U.S. Government – 7,781,010 Transfer Out to General Fund of the U.S. Government for Deficit Reduction – (7,781,010)Transfers In/(Out) Without Reimbursement, Net (6,900) (78,549)Imputed Financing Sources From Cost Absorbed by Others 200,225 247,277 Financing Sources Used for Recognizing Liability to General Fund of the U.S. Government for Deficit Reduction (2,134) (334,054)Other Financing Sources/(Uses), Net (13,372) (3,598)
Net Other Resources Used to Finance Activities 178,218 (168,145)
Total Resources Used to Finance Activities 10,816,618 9,353,404
(continued on next page)
102 | FY 20 17 AGENCY F I NANC IAL REPORT
NOTES TO THE F I NANC IAL STATEMENTS
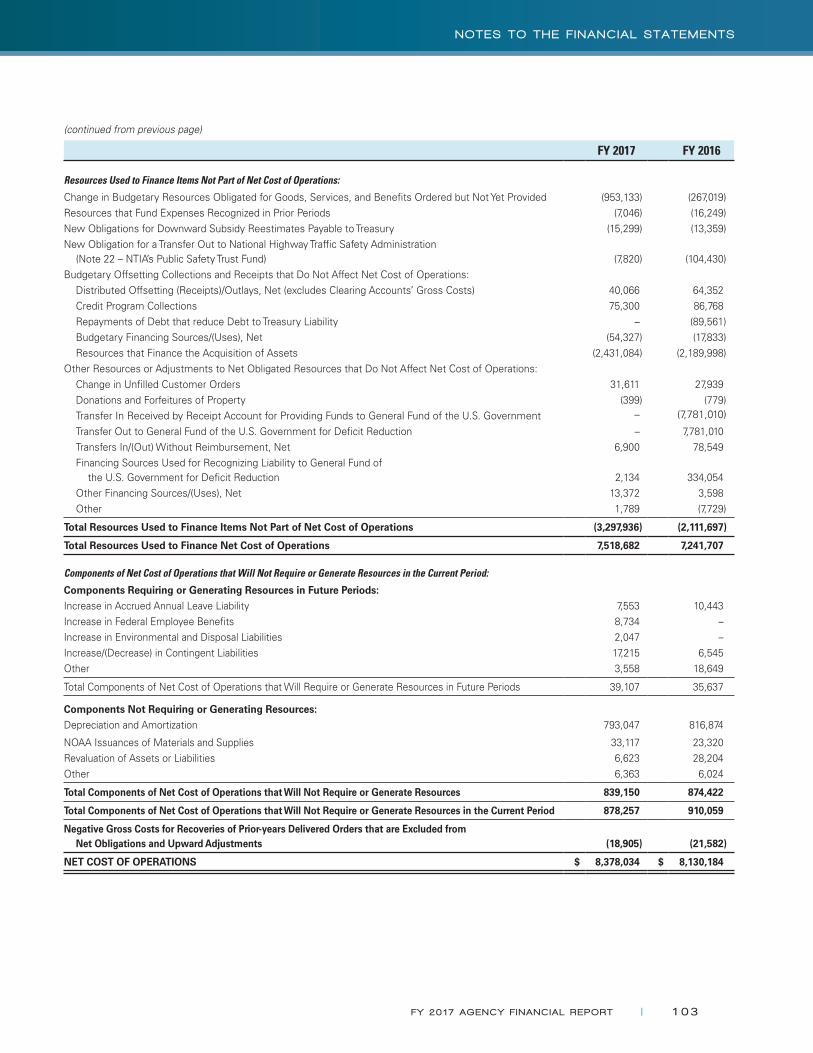
(continued from previous page)
FY 2017 FY 2016
Resources Used to Finance Items Not Part of Net Cost of Operations:
Change in Budgetary Resources Obligated for Goods, Services, and Benefits Ordered but Not Yet Provided (953,133) (267,019)Resources that Fund Expenses Recognized in Prior Periods (7,046) (16,249)New Obligations for Downward Subsidy Reestimates Payable to Treasury (15,299) (13,359)New Obligation for a Transfer Out to National Highway Traffic Safety Administration
(Note 22 – NTIA’s Public Safety Trust Fund) (7,820) (104,430)Budgetary Offsetting Collections and Receipts that Do Not Affect Net Cost of Operations:
Distributed Offsetting (Receipts)/Outlays, Net (excludes Clearing Accounts’ Gross Costs) 40,066 64,352 Credit Program Collections 75,300 86,768 Repayments of Debt that reduce Debt to Treasury Liability – (89,561)Budgetary Financing Sources/(Uses), Net (54,327) (17,833)
Resources that Finance the Acquisition of Assets (2,431,084) (2,189,998)Other Resources or Adjustments to Net Obligated Resources that Do Not Affect Net Cost of Operations:
Change in Unfilled Customer Orders 31,611 27,939 Donations and Forfeitures of Property (399) (779)Transfer In Received by Receipt Account for Providing Funds to General Fund of the U.S. Government – (7,781,010)
Transfer Out to General Fund of the U.S. Government for Deficit Reduction – 7,781,010 Transfers In/(Out) Without Reimbursement, Net 6,900 78,549 Financing Sources Used for Recognizing Liability to General Fund of
the U.S. Government for Deficit Reduction 2,134 334,054 Other Financing Sources/(Uses), Net 13,372 3,598 Other 1,789 (7,729)
Total Resources Used to Finance Items Not Part of Net Cost of Operations (3,297,936) (2,111,697)
Total Resources Used to Finance Net Cost of Operations 7,518,682 7,241,707
Components of Net Cost of Operations that Will Not Require or Generate Resources in the Current Period:
Components Requiring or Generating Resources in Future Periods:Increase in Accrued Annual Leave Liability 7,553 10,443 Increase in Federal Employee Benefits 8,734 –Increase in Environmental and Disposal Liabilities 2,047 –Increase/(Decrease) in Contingent Liabilities 17,215 6,545Other 3,558 18,649
Total Components of Net Cost of Operations that Will Require or Generate Resources in Future Periods 39,107 35,637
Components Not Requiring or Generating Resources:Depreciation and Amortization 793,047 816,874
NOAA Issuances of Materials and Supplies 33,117 23,320Revaluation of Assets or Liabilities 6,623 28,204 Other 6,363 6,024
Total Components of Net Cost of Operations that Will Not Require or Generate Resources 839,150 874,422
Total Components of Net Cost of Operations that Will Not Require or Generate Resources in the Current Period 878,257 910,059
Negative Gross Costs for Recoveries of Prior-years Delivered Orders that are Excluded from Net Obligations and Upward Adjustments (18,905) (21,582)
NET COST OF OPERATIONS $ 8,378,034 $ 8,130,184
FY 20 17 AGENCY F I NANC IAL REPORT | 103
NOTES TO THE F I NANC IAL STATEMENTS
NOTE 24. STEWARDSHIP ASSETS
Preservation of stewardship assets promotes the Department’s mission of providing effective management and monitoring of our Nation’s resources and assets to support both environmental and economic health. The physical properties of stewardship assets resemble those of General PP&E that is capitalized traditionally in the Balance Sheet of the financial statements of federal entities. Due to the nature of these assets, however, valuation would be difficult and matching costs with specific periods would not be meaningful. Therefore, federal accounting standards require the disclosure of the nature and quantity of these assets. NOAA, NIST, and the Census Bureau are the only entities within the Department that have stewardship assets.
Heritage Assets
Heritage assets are unique for their historical or natural significance, for their cultural, educational, or artistic importance, or for their significant architectural characteristics. The Department generally expects that these assets will be preserved indefinitely.
In cases where a heritage asset also has a practical and predominant use for general federal government operations, the asset is considered a multi-use heritage asset. The cost of a multi-use heritage asset is capitalized as General PP&E and is depreciated over the useful life of the asset.
NOAA has established policies for heritage assets to ensure the proper care and handling of these assets under its control or jurisdiction. The Deputy Under Secretary of NOAA established the Heritage Assets Working Committee to administer NOAA’s stewardship policies and procedures. In carrying out these policies and procedures, the Working Committee:
●● Maintains a nationwide inventory of heritage assets, ensuring that they are identified and recorded in the Personal Property Heritage Asset Accountability System;
●● Establishes nationwide NOAA policies, procedures, and standards for the preservation, security, handling, storage, and display of NOAA heritage assets;
●● Tracks and updates each loan of NOAA heritage assets, including assigning current values and inventory numbers, and reporting the current conditions of heritage assets;
●● Determines the feasibility of new asset loans, such as meters, standard tide gauges, portraits, and books for exhibit loans; and
●● Collects heritage assets and properties of historic, cultural, artistic, or educational significance to NOAA.
Heritage Assets maintained by NOAA include the Galveston Laboratory; National Marine Fisheries Service (NMFS) St. George Sealing Plant; NMFS Cottage M, St. George; NMFS St. Paul Old Clinic/Hospital; NMFS Woods Hole Science Aquarium; and Great Lakes Environmental Research Laboratory/Lake Michigan Field Station.
Information regarding deferred maintenance and repairs for heritage assets is included in the Required Supplementary Information (Unaudited) section.
104 | FY 20 17 AGENCY F I NANC IAL REPORT
NOTES TO THE F I NANC IAL STATEMENTS
Stewardship National Marine Sanctuaries, Marine National Monuments, Conservation Area, and Habitat Blueprint
Written policy statements or permit guidelines for the National Marine Sanctuaries and Marine National Monuments have been developed for the areas of acoustic impacts, artificial reefs, climate change, invasive species, and marine debris. The Office of Marine National Sanctuaries answers the most frequently asked questions related to alternative energy and oil and gas policy decisions for national marine sanctuaries.
NOAA maintains the following stewardship assets:
National Marine Sanctuaries: In 1972, Congress passed the Marine Protection, Research, and Sanctuaries Act (Act) in response to a growing awareness of the intrinsic environmental and cultural value of coastal waters. The Act authorized the Secretary of Commerce to designate special nationally-significant areas of the marine environment as national marine sanctuaries.
These protected waters provide a secure habitat for species close to extinction, and also protect historically significant shipwrecks and prehistoric artifacts. National marine sanctuaries are also used for recreation (e.g., boating, diving, and sport fishing), and support valuable commercial industries such as fishing and kelp harvesting. As of September 30, 2017, 13 National Marine Sanctuaries, which include both coastal and offshore areas, have been designated, as follows:
●● Channel Islands National Marine Sanctuary
●● Cordell Bank National Marine Sanctuary
●● Florida Keys National Marine Sanctuary
●● Flower Garden Banks National Marine Sanctuary
●● Gray’s Reef National Marine Sanctuary
●● Greater Farallones National Marine Sanctuary
●● Hawaiian Island Humpback Whale National Marine Sanctuary
●● Monitor National Marine Sanctuary
●● Monterey Bay National Marine Sanctuary
●● National Marine Sanctuary of American Samoa
●● Olympic Coast National Marine Sanctuary
●● Stellwagen Bank National Marine Sanctuary
●● Thunder Bay National Marine Sanctuary
Marine National Monuments: The Marine National Monuments were created to protect the abundant and diverse coral, fish, and seabird populations; to facilitate exploration and scientific research; and to promote public education regarding the value of these national treasures. The establishment of the Monuments provides the opportunity to protect areas of outstanding scientific, cultural, conservation, and aesthetic value, and provide for the long-term preservation of these natural and cultural legacies. There are currently five Marine National Monuments, as follows:
●● Marianas Trench Marine National Monument
●● Northeast Canyons and Seamounts Marine National Monument
●● Pacific Remote Islands Marine National Monument
●● Papahãnaumokuãkea Marine National Monument
●● Rose Atoll Marine National Monument
Aleutian Islands Habitat Conservation Area: On July 28, 2006, NOAA formally established the Aleutian Islands Habitat Conservation Area in Alaska. The conservation area established a network of fishing closures in the Aleutian Islands and Gulf of Alaska, and protects habitat for deep-water corals and other sensitive features that are slow to recover once disturbed by fishing gear or other activities. This effort is part of a network of marine protected areas in Alaskan waters designed to protect essential fish habitat and prevent any further damage of the area.
FY 20 17 AGENCY F I NANC IAL REPORT | 105
NOTES TO THE F I NANC IAL STATEMENTS

NOAA Habitat Blueprint: NOAA has responsibility for protecting habitat for fish, threatened and endangered species, marine mammals, and other natural resources within the coastal zone. Recognizing the need for more concerted efforts to conserve, protect, and restore habitat, NOAA developed the NOAA Habitat Blueprint to build on existing programs, prioritize its activities, and guide its future actions. This is being accomplished by creating Habitat Focus Areas. There are currently 10 Habitat Focus Areas, as follows:
●● Penobscot River Watershed, ME
●● Choptank River Watershed, MD/DE
●● Muskegon Lake, MI
●● St. Louis River Estuary, MN/WI
●● Russian River Watershed, CA
●● Kachemak Bay, AK
●● West Hawaii, HI
●● Manell-GeusWatershed, GU
●● Biscayne Bay, FL
●● Northeast Reserves and Culebra Island, PR
Collection-type Heritage Assets:
NOAA:
NOAA’s historical artifacts are designated collection-type heritage assets if they help illustrate the social, educational, and cultural heritage of NOAA and its predecessor agencies (Coast and Geodetic Survey, U.S. Fish Commission, the Weather Bureau, the Institutes for Environmental Research, the Environmental Science Services Administration, etc.). These artifacts include, but are not limited to: books, journals, publications, photographs, motion pictures, manuscripts, records, nautical chart plates, bells, gyrocompasses, brass citations, flags, pennants, chronometers, ship seals, clocks, compasses, fittings, miscellaneous ship fragments, lithographic plates, barometers, rain gauges, and any items that represent the uniqueness of the mission of NOAA and its predecessor agencies.
NOAA’s Logistics Office continually conducts inventories of its collection-type heritage assets. Many items that were once classified as an individual collection are now included in existing collections. Other items are now deemed as not meeting the heritage asset criteria.
NOAA’s collection-type heritage assets include items in the Thunder Bay Sanctuary Research Collection (Collection). In 2004, the Thunder Bay National Marine Sanctuary (jointly managed by NOAA and the state of Michigan to protect and interpret a nationally significant collection of shipwrecks and other maritime heritage resources) established an agreement with the Alpena County George N. Fletcher Public Library to jointly manage this Collection. Amassed over a period of more than 40 years by historian C. Patrick Labadie, the Collection includes information about such diverse subjects as Great Lakes ports and waterways, docks, cargoes, ships, shipbuilders, owners and fleets, machinery and rigging, notable maritime personalities, and shipwrecks. Special features of the Collection are extensive collections of (1) data cards listing most of the ships on the Great Lakes before year 1900, a roster of some 15 thousand vessels complete with descriptive data and highlights of the ships’ careers and their ultimate losses; and (2) ship photograph negatives of 19th and 20th century Great Lakes ships. Heritage assets also include copies of vessel ownership documents, contemporary ship photographs, books, and other items documenting the Great Lakes history.
NOAA’s collection-type heritage assets also include items in the National Climatic Data Center Library. Heritage assets include (1) books, manuals, and slides; (2) thermometers, gauges, and radiosondes; and (3) laboratory equipment.
The Florida Keys National Marine Sanctuary (FKNMS) collection-type heritage assets include artifacts from shipwreck and wrecking events occurring in the Florida Keys over a 500-year period. FKNMS is an abundant mixture of natural and cultural, historical resources that include prehistoric cultures, and maritime history.
106 | FY 20 17 AGENCY F I NANC IAL REPORT
NOTES TO THE F I NANC IAL STATEMENTS

NIST:
NIST currently maintains collection-type heritage assets under its Museum and History Program, which collects, preserves, and exhibits artifacts, such as scientific instruments, equipment, and objects of significance to NIST and predecessor agencies. This program provides institutional memory and demonstrates the contributions of NIST to the development of standards measurement, technology, and science. The Information Services Office (ISO) maintains the historical archives and rare book collection, and oversees the oral history program. The historical archives and rare book collection contain titles that are considered “classics” of historical scientific interest, books by prominent scientists, and books by NIST authors or about NIST work. Titles are recommended for inclusion by ISO staff and customers. Materials are not specifically purchased for the collection nor are funds specifically allocated for the collection. Photos and manuscripts include images of NIST staff, facilities, and artifacts that demonstrate NIST history and accomplishments. The Heritage Assets listed in the chart is a subset of the total collection within the Museum and History Program.
NIST’s Museum and History Program has policies in place for acquisitions and loans. Objects are either on display or in storage and are not used by visitors. Archives, including the historical book collection, are used according to established research library policies and procedures. When considering artifacts for accession, the following criteria are considered:
●● Direct connection to NIST program activity;
●● Direct connection to a NIST prominent person;
●● Physical size; and
●● Safety considerations.
Census Bureau:
Collection-type heritage assets maintained by the Census Bureau are items considered unique for their historical, cultural, educational, technological, methodological, or artistic importance. They help illustrate the social, educational, and cultural heritage of the Census Bureau. Some items because of their age or obvious historical significance are inherently historical artifacts.
The Census Bureau has in place a Project Charter that outlines policies and procedures for the acquisition and removal of Census Bureau’s heritage assets. The Census Bureau Heritage Assets Committee decides if an item meets the criteria for a heritage asset based on the uniqueness, historical age, and/or if the item helps to illustrate the Census Bureau’s historic contributions to the Nation’s growth. If the item is deemed a heritage asset, the applicable property management office will ensure the heritage asset is catalogued and stored in a safe, secure environment, allowing for appropriate preservation and conservation. All necessary actions will be taken to reduce deterioration of heritage assets due to environmental conditions, and to limit damage, loss, and misuse of heritage assets. The Committee meets on a regular basis to determine if any heritage assets should be removed from the approved list, or if a newly arrived item should be classified as a heritage asset. Once a determination has been made to no longer classify an item as a heritage asset, the Census Bureau will follow any applicable established policies and procedures for surplus property.
FY 20 17 AGENCY F I NANC IAL REPORT | 107
NOTES TO THE F I NANC IAL STATEMENTS

The following tables summarize the Department’s Collection-type Heritage Assets activity and balances.
Collection-type Heritage Assets: Collections(In Actual Quantities)
Category Description of Assets
Quantity of Items Held
September 30, 2016
FY 2017 Additions
FY 2017 Withdrawals
Quantity of Items Held
September 30, 2017
NOAA Central Library:
Circulating CollectionBooks, journals, and other publications 1 N/A1 N/A1 1
Rare Book Room Collection Books and publications 1 N/A1 N/A1 1
Collection of Photographs and Motion Pictures Photographs and motion pictures 1 N/A1 N/A1 1
Total 3 – – 3
1 N/A – Not applicable; this category is reported as one collection.
Collection-type Heritage Assets: Individual Items(In Actual Quantities)
Category Description of Assets
Quantity of Items Held
September 30, 2016
FY 2017 Additions
FY 2017 Withdrawals
Quantity of Items Held
September 30, 2017
NOAA National Ocean Service – Thunder Bay Sanctuary Research Collection
Data cards, photograph negatives, document copies, photographs, books, and other items 106,254 – – 106,254
NOAA Central Library – Other Artifacts, documents, and other items 56 – 28 28
NOAA National Climatic Data Center Library
Artifacts, books, documents, and other items 66 – – 66
NOAA Others Artifacts, artwork, books, films, instruments, maps, and records 3,384 34 8 3,410
NIST Artifacts and Scientific Measures
National Bureau of Standards1/NIST scientific instruments, equipment, and objects 1,320 69 4 1,385
NIST Historical Books and Manuscripts
Books/manuscripts of historical scientific interest by prominent scientists 61 – – 61
Census Bureau Artwork and Gifts
Artifacts, artwork, books, films, instruments, and records 159 – – 159
Census Bureau Collectable Assets
Publications, books, manuscripts, photographs, and maps 33 – – 33
Total 111,333 103 40 111,396
1 National Bureau of Standards is the former name of NIST.
108 | FY 20 17 AGENCY F I NANC IAL REPORT
NOTES TO THE F I NANC IAL STATEMENTS

required Supplementary inFormation(Unaudited)
FINANCIAL SECTION
REQUIRED SUPPLEMENTARY INFORMATION (Unaudited)
A Deferred Maintenance and Repairs
Deferred Maintenance and Repairs (DM&R) are maintenance and repairs that were not performed when they should have been, that were scheduled and not performed, or that were delayed for a future period. Maintenance and Repairs are activities directed towards keeping Property, Plant, and Equipment (PP&E) in acceptable operating condition. These activities include preventive maintenance, replacement of parts and structural components, and other activities needed to preserve the asset so that it can deliver acceptable performance and achieve its expected life. Maintenance and Repairs exclude activities aimed at expanding the capacity of an asset or otherwise upgrading it to serve needs different from, or significantly greater, than those originally intended. The significant portions of Departmental DM&R relate to PP&E of both the National Oceanic and Atmospheric Administration (NOAA) and the National Institute of Standards and Technology (NIST). These two entities comprise 94 percent of the Department’s General PP&E, Net balance as of September 30, 2017.
NOAA:
NOAA measures DM&R using Condition Assessment Surveys, which are periodic visual (i.e., physical) inspections of applicable PP&E to determine their current condition and estimated cost to correct any deficiencies, and by collecting information from its line offices. NOAA schedules its surveys for real property on a cyclical basis, with each appropriate asset being surveyed every five years. NOAA completed a condition survey of the entire applicable real property inventory in FY 2011. In FY 2015, NOAA started completing a new round of facility condition assessments (FCAs), and plans to complete assessments of the applicable inventory by the end of FY 2020. NOAA plans to continue a five-year assessment cycle so that the entire applicable inventory is assessed approximately every five years.
NOAA performs condition assessment surveys for capitalized NOAA-owned buildings, structures with acquisition cost over $200 thousand, heritage assets, and properties covered by capital lease that NOAA has executed. For financial reporting purposes, NOAA does not report on DM&R for:
●● Owned real property that has been permanently removed from service or which NOAA is planning to permanently remove from service within five years;
●● Structures with acquisition cost under $200 thousand; and
●● Land and Stewardship Land as land does not have deferred maintenance.
NOAA prioritizes maintenance and repair projects to sustain its PP&E in good operating condition, including maintaining warranties. DM&R is impacted by funding shortfalls. As such, NOAA selects projects that will remedy life safety deficiencies and minimize risk of mission failure.
Acceptable condition standards are established for real property by using building codes and/or industry standards for benchmarking and cost estimating. These standards are used to evaluate site and building conditions, which include the review of building systems such as civil, structure, architectural, life safety, mechanical, plumbing, elevators, electric, and others.
110 | FY 20 17 AGENCY F I NANC IAL REPORT
REQU IRED SUPPLEMENTARY I NFORMAT ION (UNAUD I TED )
In measuring DM&R, the FCAs report physical deficiencies that cannot be remedied with normal operating maintenance, excluding de minimis conditions that generally do not present a material physical deficiency to the subject property. Actionable items are typically considered to be (1) material existing or potential unsafe conditions; (2) material building or fire code violations as revealed by municipal agencies; or (3) conditions that if left unremedied, have the potential to result in or contribute to critical element or system failure in the near term, or shall result most probably in a significant escalation of its remedial cost.
NOAA made changes in the method of calculating DM&R in the fourth quarter of FY 2017 to more accurately report DM&R. As discussed above, DM&R is not being reported for real property that is permanently removed from service or which NOAA plans to permanently remove from service within five years. NOAA has added, to its reporting, DM&R for structures that are above the $200 thousand acquisition cost materiality threshold. In addition, as a large number of FCAs have now been completed, NOAA reviewed all DM&R data and recalculated escalations as described below.
The September 30, 2017 estimated DM&R is composed of DM&R for the applicable inventory from FCAs completed in FY 2015, FY 2016, and FY 2017. FCAs completed in FY 2015 utilized cost databases from 2014 and FCAs completed in FY 2016 and FY 2017 used a 2016 cost database. DM&R estimates have been escalated based on changes to the “Engineering News-Record” construction cost index changes since January 2014 and January 2016 for FCAs completed in FY 2015 and FY 2016/FY 2017 respectively. If the asset has yet to be assessed, the DM&R estimate from the Integrated Facilities Inspection Program in FY 2011 was utilized and escalated. All data has been escalated through August 2017.
The following table shows NOAA’s DM&R as of September 30, 2017 and September 30, 2016:
(In Thousands)
Asset Category
Deferred Maintenance and Repairs as of
September 30, 2017
Deferred Maintenance and Repairs as of
September 30, 2016
Buildings $ 90,178 $ 105,549
Multi-use Heritage Assets 529 95
Ships 25,119 28,441
Total $ 115,826 $ 134,085
NIST:
NIST measures DM&R using FCA surveys, which are periodic visual inspections of PP&E to determine their current condition, and estimates the costs to correct identified deficiencies. NIST accomplishes its facility condition assessments by contract. NIST originally scheduled its surveys on a cyclical basis with each appropriate asset being surveyed once every three years. For DM&R reporting purposes, NIST completed a baseline condition survey of the entire applicable inventory for the Gaithersburg, MD campus in 2011 and for the Boulder, CO campus in 2013. A third of the Gaithersburg inventory was reassessed in the third quarter of FY 2013, in the third quarter of FY 2014, and in the first quarter of FY 2015. A third of the Boulder inventory was reassessed in the second quarter of FY 2015, in the fourth quarter of FY 2016, and in the first quarter of FY 2017.
Deficiencies can be added to the respective location’s backlog in years when contractor inspections are not scheduled. During the scheduled on-site assessment, the contract inspector estimates the remaining useful life of various components that comprise a building’s mechanical or electrical or architectural system, and records this information in the assessment
FY 20 17 AGENCY F I NANC IAL REPORT | 111
REQU IRED SUPPLEMENTARY I NFORMAT ION (UNAUD I TED )

software program. When a particular building system nears the end of its useful life, a new self-generated (by the software program) facility deficiency is added to the backlog list.
With the end of the Gaithersburg Condition Assessment Surveys contract in 2016 and anticipating the end of the Boulder contract in 2018, NIST is evaluating the need for the three-year cycle frequency of the reassessments as it prepares the Statement of Work requirements for the follow-on contract. The next contract will encompass both campuses within the same contract, unlike in the past where the FCAs were conducted through separate, individual campus-focused contracts. The Federal Real Property Council’s latest guidance requires facility assessments for each facility every five years if using condition assessments for reporting DM&R needs. NIST, in coordination with the Department, is migrating its facility condition assessments data over to the U.S. Army Corps of Engineer’s BUILDER Sustainment Management System (SMS). The BUILDER SMS uses a knowledge-based philosophy that does not rely on fixed frequencies of inspections or assessments. It is widely accepted and being used by all branches of the U.S. Department of Defense, the National Nuclear Security Administration within the U.S. Department of Energy, and other Executive Branch offices of the U.S. Government.
DM&R relates to capitalized, non-capitalized, and fully depreciated real property. DM&R for real property is reported for individual items with DM&R estimates greater than $5 thousand. Items estimated to cost less than $5 thousand are shared with the facility managers for correction as emergency/service calls or minor work orders. Examples of the types of items that fall below the $5 thousand threshold include minor repairs to interior finishes and doors, caulk replacement, minor pipe and valve leaks, and minor mechanical and electrical repairs.
NIST prioritizes real property maintenance and repair projects to sustain its PP&E in good operating condition, including maintaining warranties. DM&R is impacted by funding shortfalls. As such, NIST selects projects that will remedy life safety deficiencies and minimize risk of mission failure as PP&E enables the accomplishment of the mission.
Individual real property maintenance and repair projects are prioritized using a risk matrix procedure which determines the severity of the risk-rank (i.e., minimal, low, medium, serious, or critical). Based on the type of project (maintenance and repair, code compliance and safety, or capacity) and the distress type, the appropriate risk matrix is used and a risk-rank assigned. Ranking can be adjusted to take into account current projects underway, prioritization of future candidate projects, and budgetary funding outlook.
Acceptable real property facility condition standards are established by using building codes and/or industry standards for benchmarking and cost estimating. These standards are used to evaluate site and interior conditions, life safety, mechanical and plumbing systems, elevator and conveying systems, electrical systems, structural systems, building envelope closure systems, etc.
Real property facility condition index (FCI) values are calculated for each NIST facility. The ratio of the cost of correcting all facility deficiencies in a building divided by the cost of replacing the building is expressed on a 100 percentage point scale. The FCI index is 100 minus this ratio of cost expressed. This is somewhat similar to a system described by the Building Research Board of the National Research Council. Generally, a facility with an index above 95 is considered excellent, between 95 and 90 is good, between 90 and 85 is fair, and below 85 is considered poor.
Effective 2016, NIST measures DM&R for personal property by assessing the value/cost of a scheduled maintenance or repair event that has been delayed for any reason and the delay extends beyond the end of the current fiscal year. Assessments are performed on all capitalized personal property with costs that exceed $100 thousand. DM&R for personal property is reported for individual items with DM&R estimates greater than $5 thousand.
112 | FY 20 17 AGENCY F I NANC IAL REPORT
REQU IRED SUPPLEMENTARY I NFORMAT ION (UNAUD I TED )

The following table shows NIST’s DM&R as of September 30, 2017 and September 30, 2016:
(In Thousands)
Assets Category
Deferred Maintenance and Repairs as of
September 30, 2017
Deferred Maintenance and Repairs as of
September 30, 2016
Buildings $ 331,737 $ 319,426
Site Utilities and Infrastructure 25,777 26,802
Total $ 357,514 $ 346,228
B Combining Schedule of Budgetary Resources by Major Budget Account
The table on the following pages illustrates the Department’s FY 2017 budgetary resources by major budget account.
FY 20 17 AGENCY F I NANC IAL REPORT | 113
REQU IRED SUPPLEMENTARY I NFORMAT ION (UNAUD I TED )

Uni
ted
Stat
es D
epar
tmen
t of C
omm
erce
Com
bini
ng S
ched
ule
of B
udge
tary
Res
ourc
es b
y M
ajor
Bud
get A
ccou
nt
For t
he Y
ear E
nded
Sep
tem
ber 3
0, 2
017
(In T
hous
ands
) Com
bine
d
Tota
l
Cens
us
Bure
au
Perio
dic
Cens
uses
and
Pr
ogra
ms
NIS
T Sc
ient
ific
and
Tech
nica
l Re
sear
ch
and
Serv
ices
NOA
AOp
erat
ions
, Re
sear
ch, a
ndFa
cilit
ies
NOA
APr
ocur
emen
t,Ac
quis
ition
, an
d Co
nstru
ctio
n
NTI
A Di
gita
l Te
levi
sion
Tr
ansi
tion
and
Publ
ic
Safe
ty F
und
NTI
AN
etw
ork
Cons
truct
ion
Fund
NTI
A Pu
blic
Saf
ety
Trus
t Fun
d
USPT
O S
alar
ies
and
Expe
nses
Othe
r Bu
dget
Ac
coun
ts
BU
DG
ETA
RY R
ESO
UR
CES
:
Uno
blig
ated
Bal
ance
, Bro
ught
For
war
d, O
ctob
er 1
$
9,51
6,83
3$
33,2
42$
21,8
17$
379,
957
$26
4,55
3$
–
$6,
595,
215
$48
1,86
2$
461,
238
$1,
278,
949
Adj
ustm
ents
to U
nobl
igat
ed B
alan
ce, B
roug
ht F
orw
ard
80,0
50
–
–
–80
,050
–
–
–
–
–
Uno
blig
ated
Bal
ance
, Bro
ught
For
war
d, O
ctob
er 1
, as
Adj
uste
d9,
596,
883
33,2
4221
,817
379,
957
344,
603
–
6,59
5,21
548
1,86
246
1,23
81,
278,
949
Act
ual R
ecov
erie
s of
Prio
r-yea
rs U
npai
d O
blig
atio
ns
290,
631
29,3
104,
666
58,6
6321
,584
–
7,207
864
33,1
6313
5,17
4
Act
ual N
onex
pend
iture
Tran
sfer
s of
Uno
blig
ated
Bal
ance
, Net
986
–
–
(8
00)
–
–
–
–
–
1,78
6
Bor
row
ing
Auth
ority
With
draw
n
(3,3
24)
–
–
–
–
–
–
–
–
(3
,324
)
Oth
er C
hang
es in
Uno
blig
ated
Bal
ance
, Net
(5
0,75
7)
(7,13
5)2
(2
7,960
)
(8,4
51)
–
1,73
4
–34
0
(9,2
87)
Uno
blig
ated
Bal
ance
Fro
m P
rior-y
ears
Bud
get A
utho
rity,
Net
9,
834,
419
55,4
1726
,485
409,
860
357,
736
–
6,60
4,15
648
2,72
649
4,74
11,
403,
298
App
ropr
iatio
ns
9,52
4,24
81,
210,
345
695,
900
3,54
3,17
82,
223,
236
–
–
22,4
61
–1,
829,
128
Bor
row
ing
Auth
ority
76
,637
–
–
–
–
–
–
–
–
76,6
37
Spen
ding
Aut
horit
y Fr
om O
ffset
ting
Col
lect
ions
5,00
1,60
2
–
–26
6,30
5
–
–
–77
3,08
2,82
91,
652,
391
TOTA
L B
UD
GET
ARY
RES
OU
RC
ES$
24,4
36,9
06$
1,26
5,76
2$
722,
385
$4,
219,
343
$2,
580,
972
$
–$
6,60
4,15
6$
505,
264
$3,
577,
570
$4,
961,
454
STA
TUS
OF
BU
DG
ETA
RY R
ESO
UR
CES
:
New
Obl
igat
ions
and
Upw
ard
Adj
ustm
ents
$15
,970
,699
$1,
246,
082
$71
2,11
7$
3,87
4,92
1$
2,18
2,32
7$
–
$1,
064,
676
$32
,801
$3,
203,
995
$3,
653,
780
Uno
blig
ated
Bal
ance
, End
of Y
ear
App
ortio
ned,
Une
xpire
d A
ccou
nts
7,547
,610
6,80
79,
400
207,6
6527
5,56
9
–5,
530,
538
136,
889
373,
575
1,00
7,167
Exem
pt F
rom
App
ortio
nmen
t, U
nexp
ired
Acc
ount
s1,
415
–
–
–
–
–
–
–
–
1,41
5
Una
ppor
tione
d, U
nexp
ired
Acc
ount
s56
7,714
–
820
50,7
9310
5,07
5
–8,
942
335,
574
–
66,5
10
Uno
blig
ated
Bal
ance
, End
of Y
ear,
Une
xpire
d A
ccou
nts
8,11
6,73
96,
807
10,2
2025
8,45
838
0,64
4
–5,
539,
480
472,
463
373,
575
1,07
5,09
2
Uno
blig
ated
Bal
ance
, End
of Y
ear,
Expi
red
Acc
ount
s34
9,46
812
,873
4885
,964
18,0
01
–
–
–
–23
2,58
2
Tota
l Uno
blig
ated
Bal
ance
, End
of Y
ear
8,46
6,20
719
,680
10,2
6834
4,42
239
8,64
5
–5,
539,
480
472,
463
373,
575
1,30
7,67
4
TOTA
L S
TATU
S O
F B
UD
GET
ARY
RES
OU
RC
ES$
24,4
36,9
06$
1,26
5,76
2$
722,
385
$4,
219,
343
$2,
580,
972
$
–$
6,60
4,15
6$
505,
264
$3,
577,
570
$4,
961,
454
(Con
tinue
d on
nex
t pag
e)
114 | FY 20 17 AGENCY F I NANC IAL REPORT
REQU IRED SUPPLEMENTARY I NFORMAT ION (UNAUD I TED )
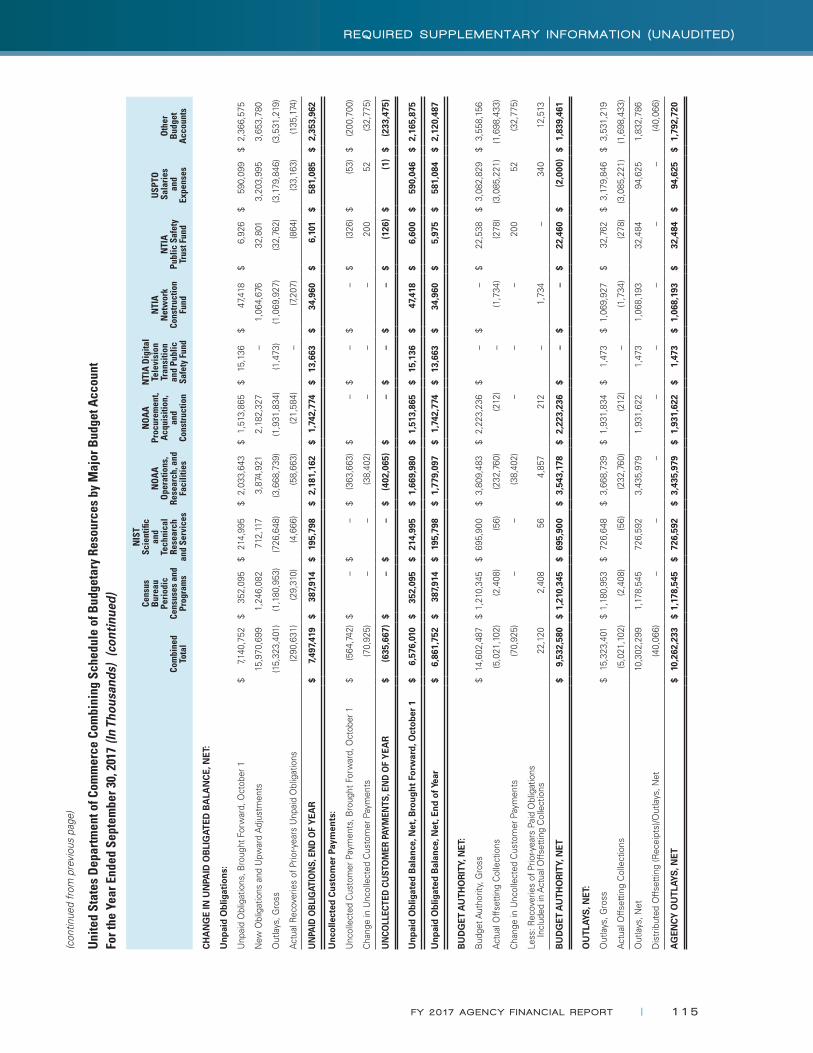
Uni
ted
Stat
es D
epar
tmen
t of C
omm
erce
Com
bini
ng S
ched
ule
of B
udge
tary
Res
ourc
es b
y M
ajor
Bud
get A
ccou
nt
For t
he Y
ear E
nded
Sep
tem
ber 3
0, 2
017
(In T
hous
ands
) (c
ontin
ued)
Com
bine
d
Tota
l
Cens
us
Bure
au
Perio
dic
Cens
uses
and
Pr
ogra
ms
NIS
T Sc
ient
ific
and
Tech
nica
l Re
sear
ch
and
Serv
ices
NOA
AOp
erat
ions
, Re
sear
ch, a
ndFa
cilit
ies
NOA
APr
ocur
emen
t,Ac
quis
ition
, an
d Co
nstru
ctio
n
NTI
A Di
gita
l Te
levi
sion
Tr
ansi
tion
and
Publ
ic
Safe
ty F
und
NTI
AN
etw
ork
Cons
truct
ion
Fund
NTI
A Pu
blic
Saf
ety
Trus
t Fun
d
USPT
O S
alar
ies
and
Expe
nses
Othe
r Bu
dget
Ac
coun
ts
CH
AN
GE
IN U
NPA
ID O
BLI
GAT
ED B
ALA
NC
E, N
ET:
Unp
aid
Obl
igat
ions
:
Unp
aid
Obl
igat
ions
, Bro
ught
For
war
d, O
ctob
er 1
$
7,140
,752
$35
2,09
5$
214,
995
$2,
033,
643
$1,
513,
865
$15
,136
$47
,418
$6,
926
$59
0,09
9$
2,36
6,57
5
New
Obl
igat
ions
and
Upw
ard
Adj
ustm
ents
15,9
70,6
991,
246,
082
712,
117
3,87
4,92
12,
182,
327
–
1,06
4,67
632
,801
3,20
3,99
53,
653,
780
Out
lays
, Gro
ss
(15,
323,
401)
(1,1
80,9
53)
(726
,648
) (3
,668
,739
) (1
,931
,834
)
(1,4
73)
(1,0
69,9
27)
(3
2,76
2) (3
,179
,846
) (3
,531
,219
)
Act
ual R
ecov
erie
s of
Prio
r-yea
rs U
npai
d O
blig
atio
ns
(290
,631
)
(29,
310)
(4
,666
)
(58,
663)
(2
1,58
4)
–
(7,20
7)
(864
)
(33,
163)
(1
35,1
74)
UN
PAID
OBL
IGAT
ION
S, E
ND
OF
YEA
R$
7,49
7,41
9$
387,
914
$19
5,79
8$
2,18
1,16
2$
1,74
2,77
4$
13,6
63$
34,9
60$
6,10
1$
581,
085
$2,
353,
962
Unc
olle
cted
Cus
tom
er P
aym
ents
:
Unc
olle
cted
Cus
tom
er P
aym
ents
, Bro
ught
For
war
d, O
ctob
er 1
$
(5
64,7
42)
$
–$
–
$
(363
,663
)$
–
$
–$
–
$
(326
)$
(5
3)$
(2
00,7
00)
Cha
nge
in U
ncol
lect
ed C
usto
mer
Pay
men
ts
(70,
925)
–
–
(3
8,40
2)
–
–
–20
052
(3
2,77
5)
UN
COLL
ECTE
D C
UST
OM
ER P
AYM
ENTS
, EN
D O
F Y
EAR
$
(635
,667
)$
–
$
–$
(4
02,0
65)
$
–$
–
$
–$
(1
26)
$
(1)
$
(233
,475
)
Unp
aid
Obl
igat
ed B
alan
ce, N
et, B
roug
ht F
orw
ard,
Oct
ober
1
$6,
576,
010
$35
2,09
5$
214,
995
$1,
669,
980
$1,
513,
865
$15
,136
$47
,418
$6,
600
$59
0,04
6$
2,16
5,87
5
Unp
aid
Obl
igat
ed B
alan
ce, N
et, E
nd o
f Yea
r $
6,86
1,75
2$
387,
914
$19
5,79
8$
1,77
9,09
7$
1,74
2,77
4$
13,6
63$
34,9
60$
5,97
5$
581,
084
$2,
120,
487
BU
DG
ET A
UTH
OR
ITY,
NET
:
Bud
get A
utho
rity,
Gro
ss$
14,6
02,4
87$
1,21
0,34
5$
695,
900
$3,
809,
483
$2,
223,
236
$
–$
–
$22
,538
$3,
082,
829
$3,
558,
156
Act
ual O
ffset
ting
Col
lect
ions
(5
,021
,102
)
(2,4
08)
(5
6)
(232
,760
)
(212
)
–
(1,7
34)
(2
78)
(3,0
85,2
21)
(1,6
98,4
33)
Cha
nge
in U
ncol
lect
ed C
usto
mer
Pay
men
ts
(70,
925)
–
–
(3
8,40
2)
–
–
–20
052
(3
2,77
5)
Less
: Rec
over
ies
of P
rior-y
ears
Pai
d O
blig
atio
ns
Incl
uded
in A
ctua
l Offs
ettin
g C
olle
ctio
ns22
,120
2,40
856
4,85
721
2
–1,
734
–
340
12,5
13
BU
DG
ET A
UTH
OR
ITY,
NET
$9,
532,
580
$1,
210,
345
$69
5,90
0$
3,54
3,17
8$
2,22
3,23
6$
–
$
–$
22,4
60$
(2
,000
)$
1,83
9,46
1
OU
TLAY
S, N
ET:
Out
lays
, Gro
ss$
15,3
23,4
01$
1,18
0,95
3$
726,
648
$3,
668,
739
$1,
931,
834
$1,
473
$1,
069,
927
$32
,762
$3,
179,
846
$3,
531,
219
Act
ual O
ffset
ting
Col
lect
ions
(5
,021
,102
)
(2,4
08)
(5
6)
(232
,760
)
(212
)
–
(1,7
34)
(2
78)
(3,0
85,2
21)
(1,6
98,4
33)
Out
lays
, Net
10,3
02,2
991,
178,
545
726,
592
3,43
5,97
91,
931,
622
1,47
31,
068,
193
32,4
8494
,625
1,83
2,78
6
Dis
trib
uted
Offs
ettin
g (R
ecei
pts)
/Out
lays
, Net
(4
0,06
6)
–
–
–
–
–
–
–
–
(40,
066)
AG
ENC
Y O
UTL
AYS
, NET
$10
,262
,233
$1,
178,
545
$72
6,59
2$
3,43
5,97
9$
1,93
1,62
2$
1,47
3$
1,06
8,19
3$
32,4
84$
94,6
25$
1,79
2,72
0
(con
tinue
d fr
om p
revi
ous
page
)
FY 20 17 AGENCY F I NANC IAL REPORT | 115
REQU IRED SUPPLEMENTARY I NFORMAT ION (UNAUD I TED )

116 | FY 20 17 AGENCY F I NANC IAL REPORT
REQU IRED SUPPLEMENTARY I NFORMAT ION (UNAUD I TED )

required Supplementary StewardShip inFormation(Unaudited)
FINANCIAL SECTION
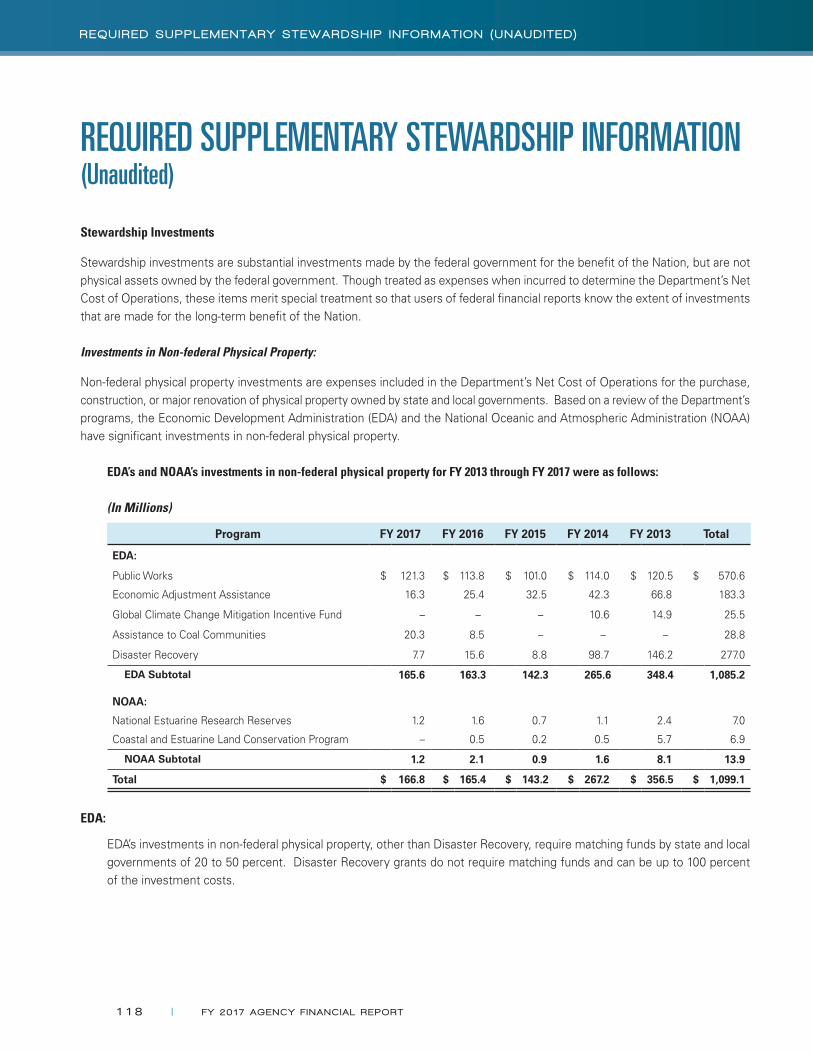
REQUIRED SUPPLEMENTARY STEWARDSHIP INFORMATION (Unaudited)
Stewardship Investments
Stewardship investments are substantial investments made by the federal government for the benefit of the Nation, but are not physical assets owned by the federal government. Though treated as expenses when incurred to determine the Department’s Net Cost of Operations, these items merit special treatment so that users of federal financial reports know the extent of investments that are made for the long-term benefit of the Nation.
Investments in Non-federal Physical Property:
Non-federal physical property investments are expenses included in the Department’s Net Cost of Operations for the purchase, construction, or major renovation of physical property owned by state and local governments. Based on a review of the Department’s programs, the Economic Development Administration (EDA) and the National Oceanic and Atmospheric Administration (NOAA) have significant investments in non-federal physical property.
EDA’s and NOAA’s investments in non-federal physical property for FY 2013 through FY 2017 were as follows:
(In Millions)
Program FY 2017 FY 2016 FY 2015 FY 2014 FY 2013 Total
EDA:
Public Works $ 121.3 $ 113.8 $ 101.0 $ 114.0 $ 120.5 $ 570.6
Economic Adjustment Assistance 16.3 25.4 32.5 42.3 66.8 183.3
Global Climate Change Mitigation Incentive Fund – – – 10.6 14.9 25.5
Assistance to Coal Communities 20.3 8.5 – – – 28.8
Disaster Recovery 7.7 15.6 8.8 98.7 146.2 277.0
EDA Subtotal 165.6 163.3 142.3 265.6 348.4 1,085.2
NOAA:
National Estuarine Research Reserves 1.2 1.6 0.7 1.1 2.4 7.0
Coastal and Estuarine Land Conservation Program – 0.5 0.2 0.5 5.7 6.9
NOAA Subtotal 1.2 2.1 0.9 1.6 8.1 13.9
Total $ 166.8 $ 165.4 $ 143.2 $ 267.2 $ 356.5 $ 1,099.1
EDA:
EDA’s investments in non-federal physical property, other than Disaster Recovery, require matching funds by state and local governments of 20 to 50 percent. Disaster Recovery grants do not require matching funds and can be up to 100 percent of the investment costs.
118 | FY 20 17 AGENCY F I NANC IAL REPORT
REQU IRED SUPPLEMENTARY STEWARDSH IP I N FORMAT ION (UNAUD I TED )
Public Works: The Public Works program promotes long-term economic development in distressed areas by providing investments for vital public infrastructure and development facilities. These critical investments enable communities to attract new, or support existing, businesses that will generate new jobs and income for unemployed and underemployed residents. Among the types of projects funded are water, sewer, fiber optics, access roads, and facilities such as industrial and business parks, business incubator and skill training facilities, and port improvements.
Economic Adjustment Assistance: The Economic Adjustment Assistance program provides flexible investments for communities facing sudden or severe economic distress to diversify and stabilize their economies. Factors that seriously threaten the economic survival of communities include plant closures, military base closures or realignments, defense laboratory or contractor downsizings, natural resource depletion, out-migration, under-employment, and the impacts of foreign trade.
Global Climate Change Mitigation Incentive Fund (GCCMIF): The last fiscal year of funding for the GCCMIF program was FY 2011. The funding for this program is fully expensed. EDA is not anticipating future grants from this funding source. GCCMIF program financed projects that fostered economic development by advancing the green economy in distressed communities and developed and used products and services that contributed to economic growth and alleviated economic distress by respecting and revitalizing the environment. GCCMIF program supported projects that created jobs through, and increase private capital investment in, efforts to limit the Nation’s dependence on fossil fuels, enhance energy efficiency, curb greenhouse gas emissions, and protect natural systems.
Assistance to Coal Communities: This program competitively awards grants to coalitions of regionally-driven economic development and workforce development organizations anchored in impacted coal communities. These grants enable grantees to take deliberate and measured steps to build economic resilience, industry diversification, and promote new job creation opportunities. Competitive projects are tightly linked to existing economic and workforce development strategic plans. These activities should result in more competitive and resilient “pipelines” of skilled workers moving into new job opportunities. Eligible activities include helping communities: organize themselves to respond on behalf of affected workers and businesses; strengthen or develop targeted industry clusters; prepare and train the existing workforce for new jobs; and help and execute coordinated economic and workforce development activities based on communities strategic plans. These activities should result in more competitive and resilient “pipelines” of skilled workers moving into new job opportunities.
Disaster Recovery: EDA supports the repair of infrastructure and economic development-related facilities damaged by floods and other natural disasters. Funding for Disaster Recovery is generally through supplemental appropriations from Congress for recovery efforts to save, sustain, and preserve private enterprise and job creation in economically distressed communities.
NOAA:
National Estuarine Research Reserves (NERR): NERR system consists of 29 estuarine reserves protected by federal, state, and local partnerships that work to preserve and protect the Nation’s estuaries. NERR system helps to fulfill NOAA’s stewardship mission to sustain healthy coasts by improving the Nation’s understanding and stewardship of estuaries. Estuarine reserves are the areas where freshwater from rivers meet the ocean. These areas are known as bays, swamps, sloughs, and sounds. These important coastal habitats are used as spawning grounds and nurseries for the Nation’s commercial fish and shellfish. Estuaries filter much of the polluted runoff from rivers and streams that would otherwise contaminate oceans. The reserves were created with the passage of the Coastal Zone Management Act of 1972, and, as of September 30, 2017, encompassed approximately 1.4 million acres of estuarine waters, wetlands, and uplands. The most recent reserve, He’eia, HI, was designated on January 19, 2017. NERRs are state-operated and managed in cooperation with NOAA. NOAA’s investments in non-federal physical property are for the acquisition of lands and development or construction of facilities, auxiliary structures, and public access routes for any NERR site.
FY 20 17 AGENCY F I NANC IAL REPORT | 119
REQU IRED SUPPLEMENTARY STEWARDSH IP I N FORMAT ION (UNAUD I TED )

Coastal and Estuarine Land Conservation Program: This program was established under the Commerce, Justice, and State Appropriations Act of 2002, “for the purpose of protecting important coastal and estuarine areas that have significant conservation, recreation, ecological, historical, or aesthetic values, or that are threatened by conversion from their natural or recreational state to other uses.” The investments in non-federal physical property include matching grants awarded to state and local governments for land acquisition in coastal and estuarine areas. Since FY 2002, matching grants have been directed to 208 such projects.
Coastal Zone Management Fund: The Coastal Zone Management Program is authorized by the Coastal Zone Management Act of 1972, and administered at the federal level by NOAA’s Office of Ocean and Coastal Resource Management. NOAA’s financing supports various coastal states in their redevelopment of deteriorating and urbanized waterfronts and ports, as well as providing for public access to beaches and coastal areas. The state and local governments receive funding for these investments through NOAA grant expenditures, for the purpose of preservation or restoration of coastal resources and habitats. There is currently not in place a mechanism for the state and local governments to determine and report to NOAA the amount of monies they expend for the investments in non-federal physical property. The Department, accordingly, cannot report the amount of investments in non-federal physical property for the Coastal Zone Management Fund. The amount of Coastal Zone Management Funds expended by the U.S. federal government is zero.
Investments in Human Capital:
Human capital investments are expenses, included in the Department’s Net Cost of Operations, for education and training programs that are intended to increase or maintain national economic productive capacity and produce outputs and outcomes that provide evidence of the constant or increasing national productive capacity. These investments exclude education and training expenses for federal civilian and military personnel. Based on a review of the Department’s programs, the most significant investments in human capital are by NOAA.
The following table summarizes NOAA’s investments in human capital for FY 2013 through FY 2017:
(In Millions)
Program FY 2017 FY 2016 FY 2015 FY 2014 FY 2013 Total
National Sea Grant College Program $ 1.1 $ 0.9 $ 0.7 $ 0.8 $ 0.7 $ 4.2
National Estuarine Research Reserve Program 1.5 1.5 1.5 1.3 1.4 7.2
Educational Partnership Program 14.1 14.3 14.3 14.3 13.0 70.0
Ernest F. Hollings Undergraduate Scholarship Program 5.7 5.8 5.5 6.2 5.0 28.2
Other Programs 0.2 0.2 0.4 0.7 0.7 2.2
Total $ 22.6 $ 22.7 $ 22.4 $ 23.3 $ 20.8 $ 111.8
National Sea Grant College Program: Sea Grant is a nationwide network, administered through NOAA, of 34 university-based programs that work with coastal communities. With the adoption in 1966 of the National Sea Grant College Act, Congress established an academic/industry/government partnership that would enhance the Nation’s education, economy, and environment into the 21st century. The program supports activities designed to increase public awareness of coastal, ocean, and Great Lakes issues; to provide information to improve management decisions in coastal, ocean, and Great Lakes policy; and to train graduate students in marine and Great Lakes science. The Knauss Fellowship Program offers qualified masters and doctoral students the opportunity to spend a year working on marine and Great Lakes policy issues with the Executive and Legislative branches of the federal government. During FY 2017, the program awarded 62 fellowships: 14 fellowships
120 | FY 20 17 AGENCY F I NANC IAL REPORT
REQU IRED SUPPLEMENTARY STEWARDSH IP I N FORMAT ION (UNAUD I TED )

funded by the National Sea Grant College Program, and 48 fellowships funded by other NOAA offices and other federal agencies. During FY 2017, the NMFS-Sea Grant Graduate Fellowship Program began funding seven new fellows. Participants in this program can receive up to three years of funding.
National Estuarine Research Reserve Program: This program supports activities designed to increase public awareness of estuary issues, provide information to improve management decisions in estuarine areas, and train graduate students in estuarine science.
Educational Partnership Program: The NOAA Educational Partnership Program (EPP) with Minority Serving Institutions (MSI) provides financial assistance through competitive processes to minority serving institutions that support research and training of students in NOAA-related sciences (EPP Cooperative Science Centers). The program’s goal is to increase the number of trained and graduated students, from underrepresented communities in science and technology, directly related to NOAA’s mission. EPP/MSI also seeks to increase collaborative research efforts between NOAA scientists and researchers at minority serving academic institutions through the EPP Cooperative Science Centers. In FY 2017, EPP Cooperative Science Centers awarded approximately 70 degrees to students.
Ernest F. Hollings Undergraduate Scholarship Program: This program was established in 2005 to (1) increase undergraduate training in oceanic and atmospheric science, research, technology, and education, and foster multidisciplinary training opportunities; (2) increase public understanding and support for stewardship of the ocean and atmosphere and improve environmental literacy; (3) recruit and prepare students for public service careers with NOAA and other agencies at the federal, state, and local levels of government; and (4) recruit and prepare students for careers as teachers and educators in oceanic and atmospheric science and to improve scientific and environmental education in the United States. In FY 2017, the program added 110 students.
Other Programs:
Southeast Fisheries Science Center’s Recruiting Training Research Program: This is a joint program between NOAA’s National Marine Fisheries Service (NMFS) and the University of Florida. The objectives of the program are the following: (1) to recruit top undergraduate and graduate students into the field of fisheries population dynamics and careers with NMFS; (2) to train graduate students; and (3) to conduct population dynamics and stock assessment research in support of the NMFS mission. The program also offers graduate courses and workshops in computer programming, simulation modeling, and fish population dynamics.
Northeast Fisheries Science Center Partnership Education Program (PEP): This program of NOAA’s NMFS leads a consortium of six science institutions in Woods Hole, MA, offering a 10-week summer program that combines undergraduate course work with research in marine and environmental science. Launched in 2009, PEP is an ongoing diversity program designed to recruit talent from minority groups that are under-represented in marine and environmental sciences. PEP recruitment targets college students with priority given to entering juniors and seniors majoring in the natural sciences who have had some course work in marine and/or environmental science. The program includes a credit course taught in Woods Hole by research scientists from Woods Hole science institutions, student research projects, and presentation of research results in a one-day seminar. In FY 2017, 16 students participated in the 10-week summer program.
Woods Hole Science Aquarium (WHSA) High School Intern Program: WHSA typically offers three summer programs for students who have completed grades 10, 11, or 12. Interns selected for the five-week program work in the aquarium, help lead public collecting walks, and participate in the Careers in Marine Science seminars. The one and two-week Careers in Marine Science seminars consist of short presentations by marine scientists, activities, and field trips that introduce students to marine-related careers. All students learn basic animal husbandry and aquarist skills, visit the local Woods Hole research
FY 20 17 AGENCY F I NANC IAL REPORT | 121
REQU IRED SUPPLEMENTARY STEWARDSH IP I N FORMAT ION (UNAUD I TED )
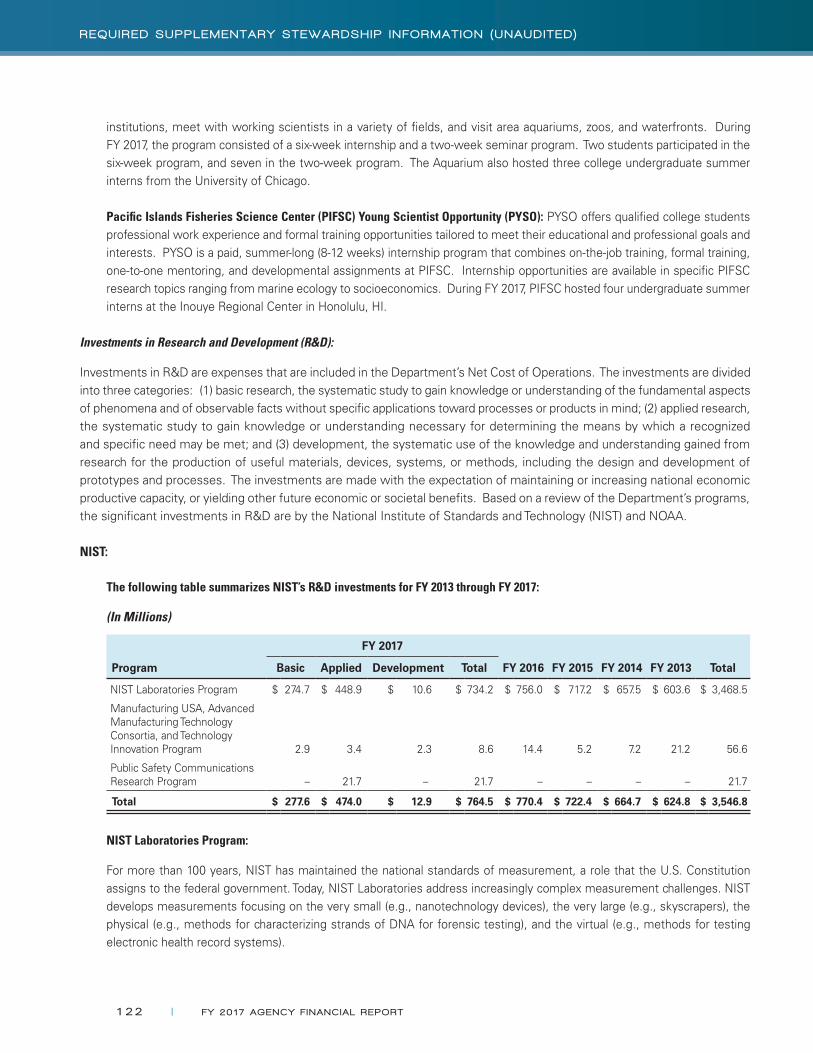
institutions, meet with working scientists in a variety of fields, and visit area aquariums, zoos, and waterfronts. During FY 2017, the program consisted of a six-week internship and a two-week seminar program. Two students participated in the six-week program, and seven in the two-week program. The Aquarium also hosted three college undergraduate summer interns from the University of Chicago.
Pacific Islands Fisheries Science Center (PIFSC) Young Scientist Opportunity (PYSO): PYSO offers qualified college students professional work experience and formal training opportunities tailored to meet their educational and professional goals and interests. PYSO is a paid, summer-long (8-12 weeks) internship program that combines on-the-job training, formal training, one-to-one mentoring, and developmental assignments at PIFSC. Internship opportunities are available in specific PIFSC research topics ranging from marine ecology to socioeconomics. During FY 2017, PIFSC hosted four undergraduate summer interns at the Inouye Regional Center in Honolulu, HI.
Investments in Research and Development (R&D):
Investments in R&D are expenses that are included in the Department’s Net Cost of Operations. The investments are divided into three categories: (1) basic research, the systematic study to gain knowledge or understanding of the fundamental aspects of phenomena and of observable facts without specific applications toward processes or products in mind; (2) applied research, the systematic study to gain knowledge or understanding necessary for determining the means by which a recognized and specific need may be met; and (3) development, the systematic use of the knowledge and understanding gained from research for the production of useful materials, devices, systems, or methods, including the design and development of prototypes and processes. The investments are made with the expectation of maintaining or increasing national economic productive capacity, or yielding other future economic or societal benefits. Based on a review of the Department’s programs, the significant investments in R&D are by the National Institute of Standards and Technology (NIST) and NOAA.
NIST:
The following table summarizes NIST’s R&D investments for FY 2013 through FY 2017:
(In Millions)
Program
FY 2017
FY 2016 FY 2015 FY 2014 FY 2013 TotalBasic Applied Development Total
NIST Laboratories Program $ 274.7 $ 448.9 $ 10.6 $ 734.2 $ 756.0 $ 717.2 $ 657.5 $ 603.6 $ 3,468.5
Manufacturing USA, Advanced Manufacturing Technology Consortia, and Technology Innovation Program 2.9 3.4 2.3 8.6 14.4 5.2 7.2 21.2 56.6
Public Safety Communications Research Program – 21.7 – 21.7 – – – – 21.7
Total $ 277.6 $ 474.0 $ 12.9 $ 764.5 $ 770.4 $ 722.4 $ 664.7 $ 624.8 $ 3,546.8
NIST Laboratories Program:
For more than 100 years, NIST has maintained the national standards of measurement, a role that the U.S. Constitution assigns to the federal government. Today, NIST Laboratories address increasingly complex measurement challenges. NIST develops measurements focusing on the very small (e.g., nanotechnology devices), the very large (e.g., skyscrapers), the physical (e.g., methods for characterizing strands of DNA for forensic testing), and the virtual (e.g., methods for testing electronic health record systems).
122 | FY 20 17 AGENCY F I NANC IAL REPORT
REQU IRED SUPPLEMENTARY STEWARDSH IP I N FORMAT ION (UNAUD I TED )
●● NIST Laboratories work at the frontiers of measurement science to ensure that the Nation’s system of measurements is firmly grounded on a sound scientific and technical foundation. NIST also promotes the use of measurements based on the international system of units.
●● NIST Laboratories work to assure that the Nation’s realization of the basic and derived measurement units is consistent with the realization in other nations. NIST Laboratories engage in a number of international activities to support trade and global science, and to promote the international acceptance of the Nation’s measurement standards.
●● NIST Laboratories provide industry and academia with unique user facilities that support innovation in materials science, nanotechnology, and other emerging technology areas through the NIST Center for Neutron Research, which provides world-class neutron measurement capabilities to the Nation’s research community, and through the NIST Center for Nanoscale Science and Technology, which supports nanotechnology development from discovery to production.
●● NIST Laboratories also support the development of standards and specifications that define technical and performance requirements for goods and services. These standards—also known as documentary standards—are often developed collaboratively with the private sector through an open, consensus-based process. NIST scientists and engineers lend their expertise to these efforts in order to promote standards that are based on sound science, and to ensure that the standards are supported by effective measurements and testing methods for conformity. In addition, NIST is designated under the National Technology Transfer Advancement Act as the coordinator for all federal agencies using documentary standards that are developed by private sector consensus bodies to carry out their policy objectives.
Manufacturing USA:
Manufacturing USA was renamed from the National Network for Manufacturing Innovation in September 2016. This program was first appropriated funds of $25.0 million in FY 2016, pursuant to the Revitalize American Manufacturing and Innovation Act of 2014 (RAMI). The FY 2017 appropriations for NIST also provided funding for this program of $25.0 million. This program and funding is part of government-wide efforts to strengthen the U.S. advanced manufacturing sector.
As part of its efforts to revitalize U.S. manufacturing, NIST proposed and Congress authorized (RAMI) Manufacturing USA, which would consist of a network of manufacturing innovation institutes where researchers, companies, universities, community colleges, and entrepreneurs can come together to develop new manufacturing technologies with broad applications, as well as train the workforce needed to work in advanced manufacturing industries. The primary goal is to ensure that American innovations and inventions, currently going off-shore for production in competitor nations, would be scaled up from the lab-scale experiments to industrial scale by developing new manufacturing processes to be used by entire industry sectors.
Each institute in Manufacturing USA has a unique technology focus with the objective of creating self-sustaining regional manufacturing hubs that have national impact. The institutes help support an ecosystem of manufacturing activity in regions of the United States. The institutes support manufacturing technology commercialization by helping to bridge the gap from the laboratory to the market and address core gaps in scaling manufacturing process technologies.
Already, Manufacturing USA has established or announced nine manufacturing innovation institutes, with six more planned by the end of 2017. Within each institute, manufacturers of all sizes partner with academia and government to share manufacturing technology and workforce challenges—and build a robust, sustainable R&D infrastructure.
In FY 2017, six new Manufacturing USA institutes were added to the network, for a total of 14 manufacturing innovation institutes. NIST provides funding for the National Institute for Innovation in Manufacturing Biopharmaceuticals. This institute’s mission is to accelerate biopharmaceutical manufacturing innovation, support the development of standards that enable
FY 20 17 AGENCY F I NANC IAL REPORT | 123
REQU IRED SUPPLEMENTARY STEWARDSH IP I N FORMAT ION (UNAUD I TED )
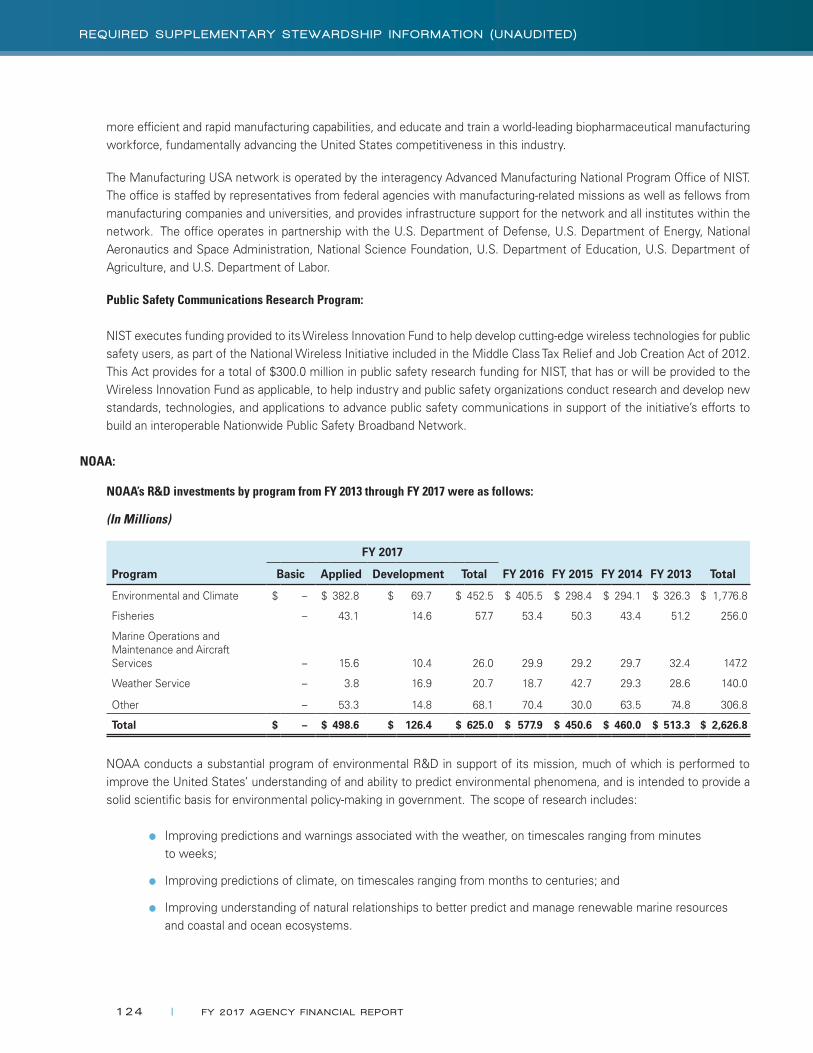
more efficient and rapid manufacturing capabilities, and educate and train a world-leading biopharmaceutical manufacturing workforce, fundamentally advancing the United States competitiveness in this industry.
The Manufacturing USA network is operated by the interagency Advanced Manufacturing National Program Office of NIST. The office is staffed by representatives from federal agencies with manufacturing-related missions as well as fellows from manufacturing companies and universities, and provides infrastructure support for the network and all institutes within the network. The office operates in partnership with the U.S. Department of Defense, U.S. Department of Energy, National Aeronautics and Space Administration, National Science Foundation, U.S. Department of Education, U.S. Department of Agriculture, and U.S. Department of Labor.
Public Safety Communications Research Program:
NIST executes funding provided to its Wireless Innovation Fund to help develop cutting-edge wireless technologies for public safety users, as part of the National Wireless Initiative included in the Middle Class Tax Relief and Job Creation Act of 2012. This Act provides for a total of $300.0 million in public safety research funding for NIST, that has or will be provided to the Wireless Innovation Fund as applicable, to help industry and public safety organizations conduct research and develop new standards, technologies, and applications to advance public safety communications in support of the initiative’s efforts to build an interoperable Nationwide Public Safety Broadband Network.
NOAA:
NOAA’s R&D investments by program from FY 2013 through FY 2017 were as follows:
(In Millions)
Program
FY 2017
FY 2016 FY 2015 FY 2014 FY 2013 TotalBasic Applied Development Total
Environmental and Climate $ – $ 382.8 $ 69.7 $ 452.5 $ 405.5 $ 298.4 $ 294.1 $ 326.3 $ 1,776.8
Fisheries – 43.1 14.6 57.7 53.4 50.3 43.4 51.2 256.0
Marine Operations and Maintenance and Aircraft Services – 15.6 10.4 26.0 29.9 29.2 29.7 32.4 147.2
Weather Service – 3.8 16.9 20.7 18.7 42.7 29.3 28.6 140.0
Other – 53.3 14.8 68.1 70.4 30.0 63.5 74.8 306.8
Total $ – $ 498.6 $ 126.4 $ 625.0 $ 577.9 $ 450.6 $ 460.0 $ 513.3 $ 2,626.8
NOAA conducts a substantial program of environmental R&D in support of its mission, much of which is performed to improve the United States’ understanding of and ability to predict environmental phenomena, and is intended to provide a solid scientific basis for environmental policy-making in government. The scope of research includes:
●● Improving predictions and warnings associated with the weather, on timescales ranging from minutes to weeks;
●● Improving predictions of climate, on timescales ranging from months to centuries; and
●● Improving understanding of natural relationships to better predict and manage renewable marine resources and coastal and ocean ecosystems.
124 | FY 20 17 AGENCY F I NANC IAL REPORT
REQU IRED SUPPLEMENTARY STEWARDSH IP I N FORMAT ION (UNAUD I TED )

Here is a brief description of the major R&D programs of NOAA:
Environmental and Climate: The Office of Oceanic and Atmospheric Research (OAR) is NOAA’s primary R&D office. This office conducts research in three major areas: climate research; weather and air quality research; and ocean, coastal, and Great Lakes research. NOAA’s research laboratories, Climate Program Office, and research partners conduct wide-ranging research into complex climate systems, including the exploration and investigation of ocean habitats and resources. NOAA’s research organizations conduct applied research on the atmosphere to predict severe weather events and hazardous conditions that threaten life, property, and economic well being. OAR research laboratories then develop high-resolution regional and global weather prediction models and software applications for forecasters that transfer into operations at the National Weather Service to significantly improve services to the public. These products are helping to evolve the National Weather Service into providing decision support to users in addition to weather forecasts.
Fisheries: NOAA’s NMFS is responsible for the conservation and management of living marine resources and their habitat within the Nation’s Exclusive Economic Zone. NMFS manages these resources through science-based conservation and management to ensure their continuation as functioning components of productive ecosystems, while also affording economic opportunities and enhancing the quality of life for the American public. Fishery stocks and protected species are surveyed; catch, by catch, incidental take, economic and social data are collected; and research is conducted to better understand the variables affecting the abundance and variety of marine fishes and protected species, their habitat, and the benefits they provide to society. Protection of endangered species, restoration of coastland estuarine fishery habitats, and enforcement of fishery regulations are primary NOAA activities. The research and management of living marine resources is conducted in partnership with states, tribes, universities, other countries, international organizations, and a broad range of stakeholders who benefit from the use and existence of living marine resources and their habitats.
R&D at NMFS laboratories supports resource management in NOAA, fishery management councils, interstate fishery commissions, and other agencies to facilitate informed decision-making about marine resource management decisions for sustainable fisheries, protected resources, endangered species, and habitat. NMFS conducts applied research to gain knowledge or understanding necessary for determining the means by which a recognized and specific need may be met. It includes research that improves understanding of technologies, leading to development that supports the mission. Development activities include the production of useful tools, materials, devices, systems, or methods, including the design and development of prototypes and processes. Examples of NMFS R&D include process-oriented studies such as those that address mechanisms that control reproductive success, population genetics and stock structure, animal behavior, biophysical modeling, and the functional value of habitat.
Marine Operations and Maintenance and Aircraft Services: These efforts support NOAA’s programs requiring operating days and flight hours to collect data at sea and in the air. NOAA’s Marine and Aviation Operations manage a wide variety of specialized aircraft and ships to complete NOAA’s environmental and scientific missions. The aircraft collect the environmental and geographic data essential to NOAA hurricane and other weather and atmospheric research, conduct aerial surveys for hydrologic research to help predict flooding potential from snowmelt, and provide support to NOAA’s fishery research and marine mammal assessment programs. NOAA’s ship fleet provides oceanographic and atmospheric research and fisheries research vessels to support NOAA’s strategic plan elements and mission.
Weather Service: NOAA’s National Weather Service conducts applied R&D, building upon research conducted by NOAA laboratories and the academic community. Applied meteorological and hydrological research is integral to providing more timely and accurate weather, water, and climate services to the public.
FY 20 17 AGENCY F I NANC IAL REPORT | 125
REQU IRED SUPPLEMENTARY STEWARDSH IP I N FORMAT ION (UNAUD I TED )

Other Programs: As a national lead for coastal stewardship, NOAA’s National Ocean Service promotes wide-ranging research activities to create the strong science foundation required to advance the sustainable use of precious coastal systems. Understanding of the coastal environment is enhanced through coastal ocean activities that support science and resource management programs. This research supports the NOAA National Ocean Service and NOAA Office of Coastal Management strategic priority of making communities more resilient. At the reserve level, the research is providing science-based information that addresses climate change, water quality, and habitat protection management decisions in our Nation’s estuaries. This funding supported 31 collaborative research and 14 science transfer projects.
NOAA’s National Environmental Satellite, Data, and Information Service (NESDIS), Center for Satellite Applications and Research (STAR) supports internal development of the mathematical and physics-based techniques for assuring sustained monitoring of the calibration of the NOAA satellite sensors, detecting faults, and diagnosing and countering the inevitable effects of instrument and satellite orbit degradation on the utility of the atmospheric and ocean measurements required for authoritative NOAA environmental analyses and predictions. NESDIS STAR is developing an Integrated Calibration and Validation System to monitor performance of NOAA satellites, instruments, sensors, and observational products. STAR scientists are developing advanced methods inter-calibrating NOAA sensors with like sensors from other (NOAA, NASA, and international) satellites to achieve, over time, a consistently calibrated Satellite Global Observing System. Calibration and validation techniques include developing methods for low-light calibration and lunar calibration.
126 | FY 20 17 AGENCY F I NANC IAL REPORT
REQU IRED SUPPLEMENTARY STEWARDSH IP I N FORMAT ION (UNAUD I TED )

other inFormation (Unaudited)
OIG’s Top Management and Performance Challenges
Facing the Department of Commerce in FY 2018
The Office of Inspector General is required by statute1 to report annually the most serious management and performance challenges facing the Department of Commerce. Below is asummary of our final report on the Department’s top management and performance challenges for fiscal year (FY) 2018. The top management and performance challenges we reported on last year remain critical issues facing the Department. However, we have revised our discussion to reflect the Department’s progress, changing priorities, and emerging risks.
1. Delivering a Timely 2020 Census That Maintains or Improves Data Quality but Costs Less Per Household Than the 2010 Census
Early this decade, the Census Bureau committed to conducting the 2020 Census at a lower cost per household (adjusted for inflation)—while continuing to maintain high quality—than the last decennial, to end decades of rising costs. To stop escalating costs, the Bureau estimated that it could avoid $5.2 billion in 2020 Census costs through major cost saving innovations in its operational design. However, as this decade progressed, the Bureau has scaled back its cost avoidance projections.
This challenge focuses on the following areas for management attention:
• Maintaining Bureau leadership continuity to ensure that a reengineered, cost-effective decennial census occurs on schedule and produces quality results
• Developing an accurate 2020 Census life-cycle cost estimate that can be validated by stakeholders
• Implementing new, reengineered processes and systems in time to perform as needed
Progress made/challenges remaining since the FY 2017 TMC: In last year’s Top Management and Performance Challenges report, we stated that further testing of new operational design components was needed, and that the 2017 Census Test specifically was needed to collect critical information to inform the final 2020 Census operational design. Just after that report’s release in September 2016, the Bureau made the decision—amid budget uncertainty—to cancel the field test portion of the 2017 test. As a result, it was unable to build on the results of the previous field tests conducted in 2014, 2015, and 2016.
1 31 U.S.C. § 3516(d).
OFFICE OF INSPECTOR GENERAL SUMMARY ON TOP MANAGEMENT AND PERFORMANCE CHALLENGES
1 31 U.S.C. § 3516(d).
128 | FY 20 17 AGENCY F I NANC IAL REPORT
O IG SUMMARY ON TOP MANAGEMENT AND PERFORMANCE CHALLENGES
2
2. Ensuring the Continuity of Environmental Satellite Observations
National Oceanic and Atmospheric Administration (NOAA) satellite data and imagery are essential to understanding, predicting, and tracking weather and other environmental phenomena. NOAA’s primary sources of these observations are satellites in geostationary and polar orbits. Beyond its own satellites and those of international and intergovernmental partners, NOAA is seeking to leverage capabilities in the emerging sector of commercial space services. To this end, NOAA has initiated a pilot program to assess commercially-provided environmental data.
For FY 2018, in order to mitigate the risk of gaps and ensure short- and long-term continuity of NOAA satellite data and imagery, this challenge focuses on the following areas for management attention:
• Transitioning Geostationary Operational Environmental Satellite (GOES)–16 and Joint Polar Satellite System (JPSS)–1 into operations
• Managing risk in the acquisition and development of the next-in-series satellites
• Revising Polar Follow-On (PFO) program baselines in accordance with the Administration’s priorities
• Assessing the viability of using commercial data in weather forecasts
Progress made/challenges remaining since the FY 2017 TMC: Regarding challenges we identified in FY 2017, NOAA met some (e.g., launching GOES-R; establishing program baselines for additional JPSS missions) and had to delay others (e.g., completing its ground system and launching JPSS-1 on schedule).
3. Securing Department Systems and Information
Our recent and ongoing audits confirm that the Department continues to encounter serious challenges to securing its critical systems, including national security systems. Furthermore, persistent security weaknesses with implementing basic security controls and measures significantly increase the likelihood of system and information compromise.
Given these considerations, this challenge focuses on the following cybersecurity areas for immediate management attention:
• Continuing security improvements for the Department's national security systems
• Ensuring security controls are effectively implemented and conducting high-quality security control assessments
• Securing cloud-based systems
• Implementing multi-factor authentication for all privileged users
FY 20 17 AGENCY F I NANC IAL REPORT | 129
O IG SUMMARY ON TOP MANAGEMENT AND PERFORMANCE CHALLENGES

3
• Implementing a cohesive approach to cybersecurity across the Department
Progress made/challenges remaining since the FY 2017 TMC: Over the past 5 years, previous versions of our Top Management and Performance Challenges Facing the Department of Commerce report have encouraged the Department to continually improve the effectiveness of its security measures protecting the confidentiality, integrity, and availability of critical systems and information.
The Department has taken steps to strengthen its IT security program by revising security policy, assigning new system management, and conducting security assessments. While the Department has made progress in addressing the issues we identified, it must continue to maintain management oversight to ensure that appropriate security is implemented and maintained for these critical systems.
4. Deploying a Nationwide Public Safety Broadband Network (NPSBN)
The Middle Class Tax Relief and Job Creation Act of 2012 (the Act) established the First Responder Network Authority (FirstNet) as an independent authority within the National Telecommunications and Information Administration (NTIA) to implement a Nationwide Public Safety Broadband Network (NPSBN) dedicated for first responders. Also, the Act provided funding to NTIA and the National Institute of Standards and Technology (NIST) to support NPSBN implementation. On March 30, 2017, FirstNet selected AT&T as its partner in the development of the NPSBN. The contract will be performed over the next 25 years.
With the partnership now underway, the Department and FirstNet’s immediate challenges include the following:
• Deploying and ensuring the sustainability of the NPSBN
• Ensuring the successful performance of the contract awarded to AT&T
• Maximizing state opt-ins and participant subscriptions
• Strengthening operational controls
Progress made/challenges remaining since the FY 2017 TMC: FirstNet has taken prompt steps to address the recommendations contained within these reports, including filling many of its key positions and updating its process controls. FirstNet is encouraged to continue to take steps to strengthen its policies and controls.
5. Efficiently and Effectively Enforcing Laws That Promote Fair and Secure Trade
As the federal government’s lead trade and investment promotion agency, the Department faces the challenge of helping U.S. companies be more competitive abroad and attracting foreign investment while protecting U.S. national security interests. Those missions are carried out by the International Trade Administration (ITA), which assists U.S. exporters to sell their products overseas and enforces U.S. trade laws and
130 | FY 20 17 AGENCY F I NANC IAL REPORT
O IG SUMMARY ON TOP MANAGEMENT AND PERFORMANCE CHALLENGES
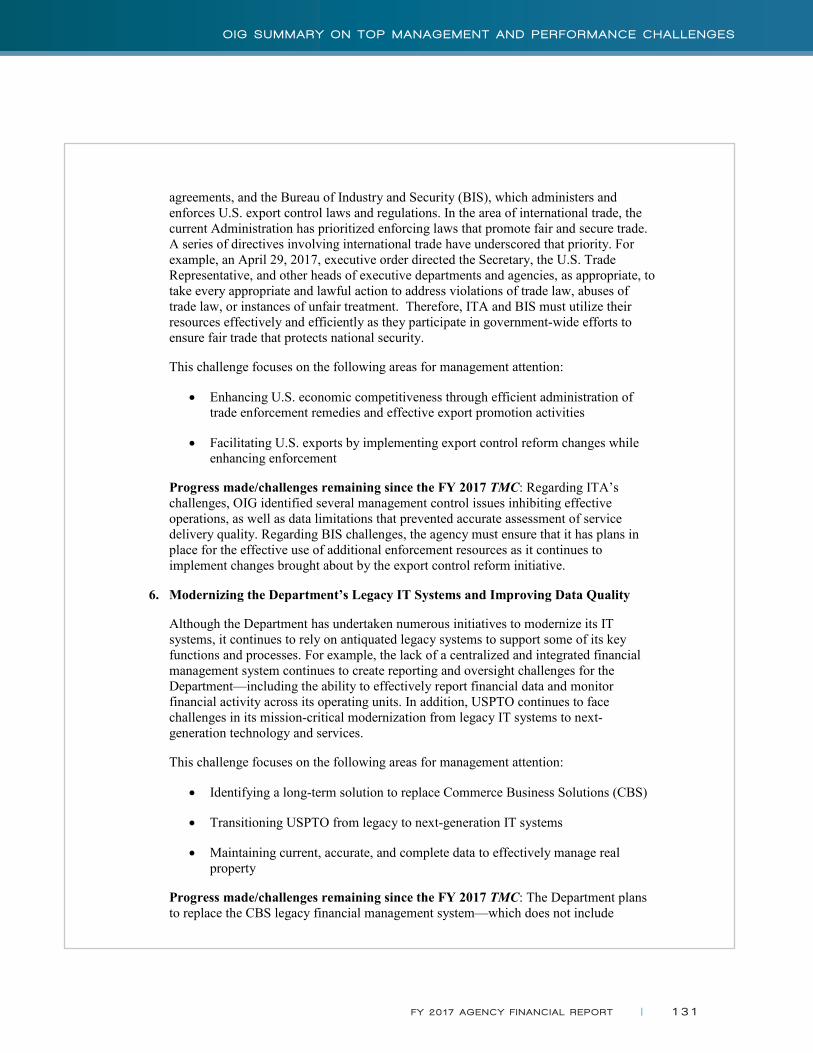
4
agreements, and the Bureau of Industry and Security (BIS), which administers and enforces U.S. export control laws and regulations. In the area of international trade, the current Administration has prioritized enforcing laws that promote fair and secure trade. A series of directives involving international trade have underscored that priority. For example, an April 29, 2017, executive order directed the Secretary, the U.S. Trade Representative, and other heads of executive departments and agencies, as appropriate, to take every appropriate and lawful action to address violations of trade law, abuses of trade law, or instances of unfair treatment. Therefore, ITA and BIS must utilize their resources effectively and efficiently as they participate in government-wide efforts to ensure fair trade that protects national security.
This challenge focuses on the following areas for management attention:
• Enhancing U.S. economic competitiveness through efficient administration of trade enforcement remedies and effective export promotion activities
• Facilitating U.S. exports by implementing export control reform changes while enhancing enforcement
Progress made/challenges remaining since the FY 2017 TMC: Regarding ITA’s challenges, OIG identified several management control issues inhibiting effective operations, as well as data limitations that prevented accurate assessment of service delivery quality. Regarding BIS challenges, the agency must ensure that it has plans in place for the effective use of additional enforcement resources as it continues to implement changes brought about by the export control reform initiative.
6. Modernizing the Department’s Legacy IT Systems and Improving Data Quality
Although the Department has undertaken numerous initiatives to modernize its IT systems, it continues to rely on antiquated legacy systems to support some of its key functions and processes. For example, the lack of a centralized and integrated financial management system continues to create reporting and oversight challenges for the Department—including the ability to effectively report financial data and monitor financial activity across its operating units. In addition, USPTO continues to face challenges in its mission-critical modernization from legacy IT systems to next-generation technology and services.
This challenge focuses on the following areas for management attention:
• Identifying a long-term solution to replace Commerce Business Solutions (CBS)
• Transitioning USPTO from legacy to next-generation IT systems
• Maintaining current, accurate, and complete data to effectively manage real property
Progress made/challenges remaining since the FY 2017 TMC: The Department plans to replace the CBS legacy financial management system—which does not include
FY 20 17 AGENCY F I NANC IAL REPORT | 131
O IG SUMMARY ON TOP MANAGEMENT AND PERFORMANCE CHALLENGES

5
features for data analytics, data archiving, or enterprise data warehousing—with a new comprehensive and integrated suite of financial management and business applications that will provide these functions. However, there have been significant challenges with this project, including identification of a viable federal shared service provider solution for a replacement. According to the Department, the project is currently on hold as it works with the Office of Management and Budget (OMB) and the Department of the Treasury regarding how to proceed.
7. Implementing Processes to Improve Management of the Department’s Contracts, Grants, and Cooperative Agreements
Procurement continues to be a significant support mechanism for the Department’s overall mission. The Department’s management of contracts, grants, and cooperative agreements has long presented a challenge by virtue of the large amounts of money at stake. In FY 2016, the Department obligated approximately $3.2 billion for goods and services related to satellite acquisitions, support for intellectual property operations, management of coastal and ocean resources, information technology (IT), and construction and facilities management. Additionally, in FY 2016, the Department obligated approximately $1.4 billion in financial assistance awards (grants and cooperative agreements). Appropriate administration of public funds must always be a priority, but, in this climate of constrained budgets, the use of billions of taxpayer dollars requires particular attention from Departmental management.
Key challenges include the following:
• Strengthening processes to govern the appropriate use of non-competitive contracts and maximize the use of competition
• Developing and maintaining a competent acquisition workforce to support the Department's mission
• Improving oversight and monitoring of Minority Business Centers to ensure accurate reporting of program goals and efficient use of program funds
• Fostering high ethical standards throughout the Department and its contracting programs to maintain the public trust
Progress made/challenges remaining since the FY 2017 TMC: Our work has found that the Department continues to face challenges in awarding high-risk contracts without considering the possibility of using less risky contract types.
132 | FY 20 17 AGENCY F I NANC IAL REPORT
O IG SUMMARY ON TOP MANAGEMENT AND PERFORMANCE CHALLENGES
MEMORANDUM FOR: Peg Gustafson Inspector General
FROM: Ellen Herbst Chief Financial Officer and Assistant Secretary for Administration, Performing the Non-Exclusive Duties of the Deputy Secretary SUBJECT: OIG Report, Top Management and Performance Challenges
Facing the Department of Commerce in Fiscal Year 2018, OIG 17-033
On behalf of the Department, we appreciate the Office of Inspector General’s time and attention to assessing the top management and performance challenges facing the Department in Fiscal Year 2018. Your consideration of our changing priorities and emerging risks is particularly valuable in helping us to focus our oversight efforts. The Department recognizes that the seven challenges discussed in the report represent areas of major potential impact on the effectiveness and efficiency of our programs and operations. We have already undertaken and planned extensive actions to address these challenges, and are committed to making further progress. I would also like to thank you for your office’s valuable recommendations throughout the year and I am looking forward to continuing our good working relationship in FY 2018 and future years.
UNITED STATES DEPARTMENT OF COMMERCE Chief Financial Officer Assistant Secretary for Administration Washington, D.C. 20230
FY 20 17 AGENCY F I NANC IAL REPORT | 133
O IG SUMMARY ON TOP MANAGEMENT AND PERFORMANCE CHALLENGES
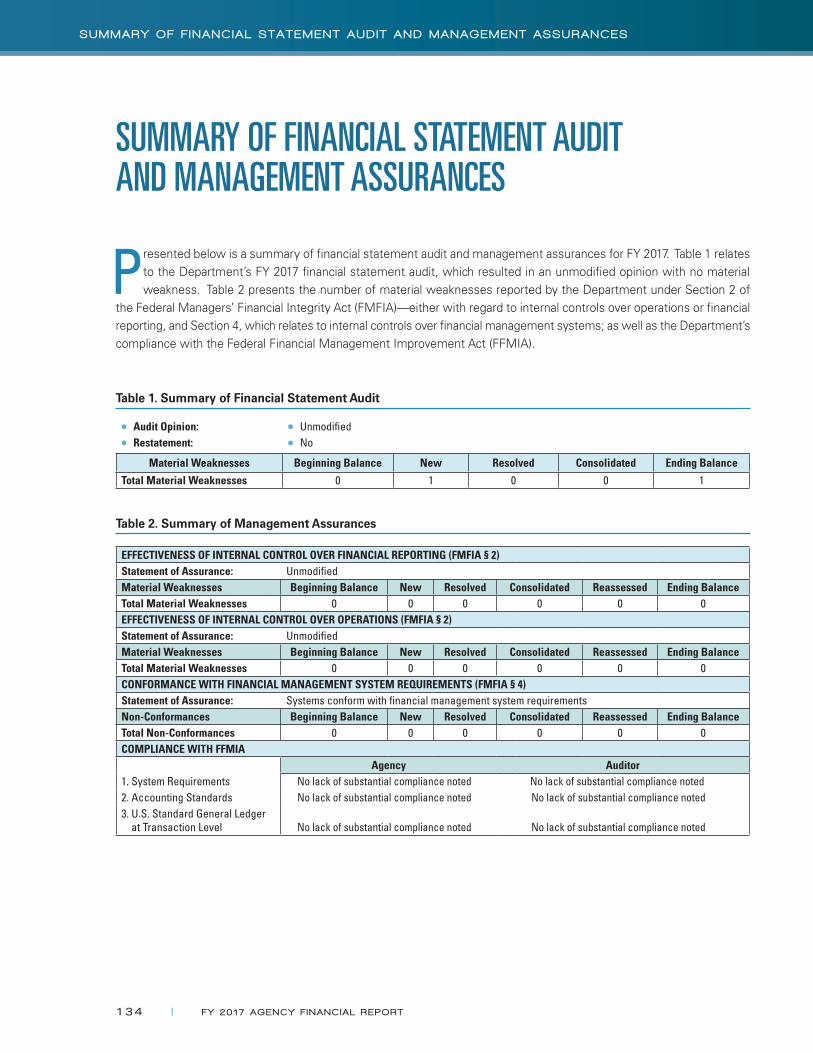
SUMMARY OF FINANCIAL STATEMENT AUDIT AND MANAGEMENT ASSURANCES
Presented below is a summary of financial statement audit and management assurances for FY 2017. Table 1 relates to the Department’s FY 2017 financial statement audit, which resulted in an unmodified opinion with no material weakness. Table 2 presents the number of material weaknesses reported by the Department under Section 2 of
the Federal Managers’ Financial Integrity Act (FMFIA)—either with regard to internal controls over operations or financial reporting, and Section 4, which relates to internal controls over financial management systems; as well as the Department’s compliance with the Federal Financial Management Improvement Act (FFMIA).
Table 1. Summary of Financial Statement Audit
●● Audit Opinion: ●● Unmodified●● Restatement: ●● No
Material Weaknesses Beginning Balance New Resolved Consolidated Ending Balance
Total Material Weaknesses 0 1 0 0 1
Table 2. Summary of Management Assurances
EFFECTIVENESS OF INTERNAL CONTROL OVER FINANCIAL REPORTING (FMFIA § 2)Statement of Assurance: UnmodifiedMaterial Weaknesses Beginning Balance New Resolved Consolidated Reassessed Ending BalanceTotal Material Weaknesses 0 0 0 0 0 0EFFECTIVENESS OF INTERNAL CONTROL OVER OPERATIONS (FMFIA § 2)Statement of Assurance: UnmodifiedMaterial Weaknesses Beginning Balance New Resolved Consolidated Reassessed Ending BalanceTotal Material Weaknesses 0 0 0 0 0 0CONFORMANCE WITH FINANCIAL MANAGEMENT SYSTEM REQUIREMENTS (FMFIA § 4)Statement of Assurance: Systems conform with financial management system requirementsNon-Conformances Beginning Balance New Resolved Consolidated Reassessed Ending BalanceTotal Non-Conformances 0 0 0 0 0 0COMPLIANCE WITH FFMIA
Agency Auditor1. System Requirements No lack of substantial compliance noted No lack of substantial compliance noted2. Accounting Standards No lack of substantial compliance noted No lack of substantial compliance noted3. U.S. Standard General Ledger at Transaction Level
No lack of substantial compliance noted
No lack of substantial compliance noted
134 | FY 20 17 AGENCY F I NANC IAL REPORT
SUMMARY OF F I NANC IAL STATEMENT AUD I T AND MANAGEMENT ASSURANCES
The Improper Payments Information Act (IPIA) of 2002, as amended by the Improper Payments Elimination and Recovery Act of 2010 and the Improper Payments Elimination and Recovery Improvement Act of 2012, requires agencies to periodically review all programs and activities and identify those that may be susceptible to significant
improper payments, take multiple actions when programs and activities are identified as susceptible to significant improper payments, and annually report information on their improper payments monitoring and minimization efforts. The Office of Management and Budget’s (OMB) Circular A-123, Management’s Responsibility for Enterprise Risk Management and Internal Control (July 15, 2016), Appendix C, Requirements for Effective Measurement and Remediation of Improper Payments (October 20, 2014), defines an improper payment1 and provides guidance to agencies to comply with IPIA, as amended, and for agency improper payments efforts. The Department has not itself identified any programs or activities susceptible to significant improper payments.
On January 29, 2013, the President signed into law the Disaster Relief Appropriations Act (Act), which provided a total of $50.5 billion government-wide in aid for Hurricane Sandy disaster victims and their communities. The National Oceanic and Atmospheric Administration (NOAA) received $326 million of funds under the Act for Hurricane Sandy recovery and other disaster-related activities. Pursuant to OMB Memorandum M-13-07, Accountability for Funds Provided by the Disaster Relief Appropriations Act (March 12, 2013), the Department in March 2013 submitted its final plan for accountability, internal controls, and other requirements, for funds provided to NOAA that are deemed by OMB as susceptible to significant improper payments for the purposes of requirements under IPIA of 2002, as amended, and the Department is required to calculate and report an annual improper payments estimate. The Department submitted to OMB in June 2017 a sampling methodology plan for FY 2016 disbursements made under the Act by NOAA. In August 2017, testing of FY 2016 disbursements was completed by an independent contractor and by NOAA. See section II., Sampling and Estimation Reporting for Funds Received by NOAA under Disaster Relief Appropriations Act, for the statistical sampling results of the FY 2016 disbursements testing.
The Department recognizes the importance of maintaining adequate internal controls to ensure proper payments, and the Department’s commitment to continuous improvement in the overall disbursement management process remains high. Each of the Department’s payment offices has implemented policies and procedures to detect and prevent improper payments. For FY 2018 and beyond, the Department will continue its efforts to ensure the integrity of its disbursements.
PAYMENT INTEGRITY
1 An improper payment is any payment that should not have been made or that was made in an incorrect amount under statutory, contractual, administrative, or other legally applicable requirements. Incorrect amounts are overpayments or underpayments that are made to eligible recipients (including inappropriate denials of payment or service, any payment that does not account for credit for applicable discounts, payments that are for an incorrect amount, and duplicate payments). An improper payment also includes any payment that was made to an ineligible recipient or for an ineligible good or service, or payments for goods or services not received (except for such payments authorized by law). In addition, when an agency’s review is unable to discern whether a payment was proper as a result of insufficient or lack of documentation, this payment must also be considered an improper payment.
The term “payment” in this guidance means any disbursement or transfer of Federal funds (including a commitment for future payment, such as cash, securities, loans, loan guarantees, and insurance subsidies) to any non-Federal person, non-Federal entity, or Federal employee, that is made by a Federal agency, a Federal contractor, a Federal grantee, or a governmental or other organization administering a Federal program or activity. The term “payment” includes Federal awards subject to the Single Audit Act and the Uniform Guidance for Federal assistance (2 CFR 200 Subpart F) (Single Audits) that are expended by both recipients and sub-recipients.
FY 20 17 AGENCY F I NANC IAL REPORT | 135
PAYMENT I N TEGR I TY

I. Improper Payments Risk Assessments.
The Department annually conducts an assessment of the effectiveness of internal control over financial reporting, in compliance with OMB Circular A-123, Appendix C. Furthermore, every three years, the assessment includes a review of internal controls over disbursement processes, including Department-wide sample testing of disbursements for improper payments and for appropriate internal control attributes. The most recent review performed indicated that internal controls over disbursement processes were sound.
Each of the Department’s bureaus/reporting entities periodically completes or updates, over a one to three-year period (depending on the size of the entity), improper payments risk assessments covering all of its programs/activities as required by OMB Circular A-123, Appendix C. These improper payments risk assessments of the entity’s programs/activities also incorporate improper payments risk assessments every three years of the control, procurement, and grants management environments. The program/activity improper payments risk assessments performed in 2017 address the nine minimum improper payments risk factors set forth in OMB Circular A-123, Appendix C that should be addressed, which are: whether the program or activity reviewed is new to the agency; the complexity of the program or activity reviewed, particularly with respect to determining correct payment amounts; the volume of payments made annually; whether payments or payment eligibility decisions are made outside of the agency, for example, by a state or local government, or a regional federal office; recent major changes in program funding, authorities, practices, or procedures; the level, experience, and quality of training for personnel responsible for making program eligibility determinations or certifying that payments are accurate; the inherent risks of improper payments due to the nature of agency programs or operations; significant deficiencies in the audit reports of the agency including, but not limited to, the agency Inspector General or the U.S. General Accountability Office audit report findings, or other relevant management findings; and results from prior improper payment work.
The following table presents a summary of the Department’s program/activity improper payments risk assessments performed in FY 2017; none of these improper payments risk assessments performed (or performed in prior fiscal years) revealed any programs or activities considered susceptible to significant improper payments.
SUMMARY OF PROGRAMS/ACTIVITIES FOR WHICH IMPROPER PAYMENTS RISK ASSESSMENTS WERE PERFORMED IN FY 2017
Program/Activity
Bureau of Economic Analysis
Bureau of Economic Analysis
Bureau of Industry and Security
Dual Use Export Administration and Enforcement
Census Bureau
Decennial Census
Enterprise Data Capture and Dissemination Systems
Geographic Support
Working Capital Fund
Economics and Statistics Administration
Economics and Statistics Administration
International Trade Administration
Enforcement and Compliance
Industry and Analysis
Minority Business Development Agency
Minority Business Development and Advocacy
Minority Business Development Grants
Program/Activity
National Institute of Standards and Technology
Contracts and Purchase Orders
Grants
Purchase Card
National Oceanic and Atmospheric Administration
Loans; Intragovernmental Payment and Collection System Activity; Other
National Telecommunications and Information Administration
State and Local Grant Implementation Program
Telecommunications and Information Policy Development and Management; Spectrum Management
Office of the Secretary
Departmental Management
Office of Inspector General
U.S. Patent and Trademark Office
U.S. Patent and Trademark Office (Patents and Trademarks)
136 | FY 20 17 AGENCY F I NANC IAL REPORT
PAYMENT I N TEGR I TY
II. Sampling and Estimation Reporting for Funds Received by NOAA under Disaster Relief Appropriations Act.
For all programs and activities as determined under OMB Circular A-123, Appendix C, Part I.A.9. Step 2, Obtain a statistically valid estimate of the annual amount of improper payments in programs and activities for those programs that are identified in Step 1 as susceptible to significant improper payments, agencies shall identify the:
a. Estimated amount of payments that were properly paid, improperly paid, and the corresponding percent for each by program or activity for the current fiscal year.
b. Estimated amount of improper payments that resulted in an overpayment, an underpayment, and the corresponding percent for each by program or activity for the current fiscal year.
c. Estimated amount of improper payments made directly by the Government and the amount of improper payments made by recipients of Federal money by program or activity for the current fiscal year.
d. Root cause for overpayments and underpayments by amount and by program or activity for the current fiscal year.
e. Reduction targets by program or activity for the next fiscal year.
Any agency that has programs or activities that are susceptible to significant improper payments based on statutory thresholds listed in OMB Circular A-123, Appendix C, Part 1.A.9. Step 1, Review all programs and activities and identify those that are susceptible to significant improper payments and are reporting an improper payment rate, shall briefly describe the statistical sampling process conducted to estimate the improper payment rate for each program identified as being susceptible to significant improper payments. Agencies that were granted OMB approval to use a non-statistical sampling and estimation methodology under OMB Circular A-123, Appendix C, Part I.A.14, May agencies use alternative sampling and estimation approaches, must also include the justification for using the non-statistical methodology (i.e., explain why the agency was not able to follow the requirements in OMB Circular A-123, Appendix C, Part 1.A.9. Step 2).
As previously discussed, an independent contractor and NOAA performed statistical sampling of FY 2016 NOAA disbursements of funds received under the Disaster Relief Appropriations Act, in order to yield a statistically valid improper payments estimate as required by OMB Circular A-123, Appendix C. The independent contractor and NOAA determined that of the sample items tested for improper payments, which amounted to $56.5 million, there was a statistically valid estimate of improper payments of $85 thousand ($53 thousand of overpayments; and $32 thousand of underpayments) for NOAA FY 2016 disbursements of funds received under the Disaster Relief Appropriations Act.
The table on the following page is reported with regard to funds received by NOAA under the Disaster Relief Appropriations Act. Statistical sampling of a fiscal year’s disbursements to arrive at a statistically valid estimate of improper payments for that fiscal year is normally performed by an independent contractor in the following calendar year. Statistical sampling of FY 2016 (referred to as Current Year in this table) NOAA disbursements of funds received under the Disaster Relief Appropriations was completed by an independent contractor and by NOAA in August 2017 as previously discussed.
FY 20 17 AGENCY F I NANC IAL REPORT | 137
PAYMENT I N TEGR I TY

IMPROPER PAYMENTS (IP) REDUCTION OUTLOOK FOR FUNDS RECEIVED BY NOAA UNDER THE DISASTER RELIEF APPROPRIATIONS ACT
(Dollars in Millions)
Activity
Prior Year
(FY 2015)Outlays,
Gross
Estimated Prior Year
(FY 2015)IP
Percent
Estimated Prior Year
(FY 2015)IP
Current Year
(FY 2016) Outlays,
Gross
Estimated Current
Year(FY 2016)Proper
Payments Percent
Estimated Current
Year(FY 2016)Proper
Payments
Estimated Current
Year (FY 2016)
IP Percent
Estimated Current
Year (FY 2016)
IP
Funds Received by NOAA under Disaster Relief Appropriations Act $ 101.171 0.05% $ 0.051 $ 56.471 99.85% $ 56.39 0.15% $ 0.0852
(continued)
Activity
Estimated Current
Year (FY 2016)
Over-payments
Estimated Current
Year (FY 2016) Under-
payments
Estimated Current Year + 1(FY 2017)Outlays,
Gross
Estimated Current Year + 1(FY 2017)
IPPercent
Estimated Current Year + 1(FY 2017)
IP
Estimated Current Year + 1(FY 2017)
Over-payments
Estimated Current Year + 1(FY 2017)Under-
payments
Funds Received by NOAA under Disaster Relief Appropriations Act $ 0.0532 $ 0.0322 $ 27.671 0.00% $ – $ – $ –
1 The source of the Outlays, Gross dollar amounts is NOAA, based on data gathering and/or estimation techniques, as the Outlays, Gross dollar amounts cannot be obtained from the President’s Budget.
2 Statistically valid estimate of improper payments for FY 2016 disbursements. These estimates of improper payments are fully for disbursements made directly by NOAA. The Department is not aware of any improper payments made by recipients of federal funds in FY 2016 or that were identified in FY 2016.
IMPROPER PAYMENT ROOT CAUSE CATEGORY MATRIX FOR FUNDS RECEIVED BY NOAA UNDER THE DISASTER RELIEF APPROPRIATIONS ACT FOR CURRENT YEAR (FY 2016) IMPROPER PAYMENTS
(In Millions)
Reason for Estimated Improper Payments
Funds Received by NOAA under Disaster Relief Appropriations Act
Estimated Overpayments
Estimated Underpayments
Total Estimated Improper Payments
Program Design or Structural Issue $ – $ – $ –
Inability to Authenticate Eligibility – – –
Failure to Verify: Death Data – – –
Financial Data – – –
Excluded Party Data – – –
Prisoner Data – – –
Other Eligibility Data (explain) – – –
Administrative or Process Error Made by:
Federal Agency – 0.032 0.032
State and Local Agencies – – –
Other Party (explain) – – –
Medical Necessity – – –
Insufficient Documentation to Determine 0.053 0.053
Other (explain) – – –
Total $ 0.053 $ 0.032 $ 0.085
138 | FY 20 17 AGENCY F I NANC IAL REPORT
PAYMENT I N TEGR I TY

As previously discussed, an independent contractor and NOAA performed statistical sampling of FY 2017 NOAA disbursements of funds received under the Disaster Relief Appropriations Act, in order to yield a statistically valid improper payments estimate, as required by OMB Circular A-123, Appendix C. The independent contractor obtained the population of FY 2016 disbursements, excluding disbursements within the federal government, and determined a single-stage stratified random sample using the disbursement amount to define the stratum boundaries (dollar ranges). Stratified samples are highly efficient designs that allow confidence and precision levels to be reached with smaller samples when compared to simple random sampling. A single certainty or take-all stratum was defined for disbursement amounts that were large relative to the rest of the population data, to help ensure that a high percentage of total dollars disbursed will be covered in the sample selection as well as help improve the precision of the statistical estimates at the time of estimation. The remaining disbursements were stratified into similar groups, or strata, based upon disbursement amounts. The non-certainty stratum boundaries were initially determined to approximately equalize the precision in dollars within each stratum and then were slightly modified to improve efficiency. The statistical sampling performed was in compliance with OMB Circular A-123, Appendix C guidance for statistically valid sampling plans, including minimum precision guidelines.
III. Overpayments Identified in FY 2017 and FY 2017 Recaptures of Overpayments.
a. When applicable, for all programs and activities that expend $1 million or more annually, agencies shall describe any action the agency has taken or plans to take to recapture improper payments and intends to take to prevent future improper payments.
b. All programs and activities that expend $1 million or more annually shall be considered for payment recapture audits. See OMB Circular A-123, Appendix C, Part I.D, Payment Recapture Audits, for more information about payment recapture audits. An agency shall discuss payment recapture audit (or recovery auditing) efforts, if applicable. The discussion should describe:
i. the actions and methods used by the agency to recoup overpayments;
ii. a justification of any overpayments that have been determined not to be collectable; and
iii. any conditions giving rise to improper payments and how those conditions are being resolved (e.g., the business process changes and internal controls instituted and/or strengthened to prevent further occurrences). Note, it is also appropriate to address this requirement when discussing root causes and corrective actions implemented above.
c. If the agency has excluded any programs or activities from review under its payment recapture audit program because the agency has determined a payment recapture audit program is not cost-effective, the agency must provide the justification and a summary of the analysis that is used to determine that conducting a payment recapture audit program for the program or activity was not cost effective (i.e., a discussion of the analysis conducted to determine that a payment recapture audit program would not be cost effective).
In conformity with IPIA, as amended, the Department has been performing, since 2005, annual payment recapture audits of closed contracts/obligations for many of the Department’s bureaus/reporting entities on a rotational basis. In recent years, these payment recapture audits have been performed by a contractor. Effective 2012, the scope of payment recapture audits of contracts/obligations was expanded to additionally include contracts/obligations for which the period of performance ended and last payment was made; however, for which the closeout process has not yet been completed. Annual payment recapture auditing is additionally performed by a contractor, effective 2011, for Department-wide grants and other cooperative agreements (i.e., financial assistance). Per OMB Circular A-123, Appendix C, intragovernmental transactions are not required to be reviewed.
FY 20 17 AGENCY F I NANC IAL REPORT | 139
PAYMENT I N TEGR I TY

In May 2011, the Department completed an evaluation of possible additional categories of disbursements for which payment recapture auditing could be performed, if cost-effective, as discussed below, held a meeting with OMB to discuss the Department’s evaluation, and provided the written summary of the evaluation to OMB.
The Department’s evaluation of payroll disbursements in May 2011 determined that it would likely not be cost-effective to perform payment recapture auditing for payroll disbursements. Payroll-administration services are primarily provided to the Department by the U.S. Department of Agriculture’s National Finance Center (NFC). Based on the Department’s review of available risk assessments and audits/reviews, at that time, the Department’s payroll processes were rated at a low risk and only had a few minor audit and review findings. Further, no significant payroll improper payments had been identified by the bureaus. The latest audit report at that time regarding the adequacy of the internal controls of NFC as a servicing organization revealed no significant issues. The Department will continue to reevaluate, in 2018, whether payment recapture auditing should be performed, if considered cost-effective, for payroll and other payments to employees.
With regard to loan disbursements, NOAA is currently the only bureau with loan disbursements. As part of NOAA’s internally-conducted reviews and testing processes, NOAA loan disbursements are significantly tested every three years for both internal controls and improper payments, and the disbursement testing for improper payments is considered to be essentially equivalent to a payment recapture audit. Regarding the NOAA Corps Retirement System and the NOAA Corps Health Benefits benefit programs, these programs are cross-serviced for disbursements by the U.S. Department of Defense; and, therefore, are not subject to payment recapture auditing by the Department.
For payment recapture audits, the contractor analyzes the reasons why any payment errors occurred, and develops, presents, and documents any recommendations for cost-effective controls to prevent improper payments in the future and/or to enhance the applicable bureau processes.
A type of improper payment that the Department’s applicable bureaus experience is the improper drawdown(s) (i.e., payment(s) to recipient) of funds by a recipient against a Departmental grant or cooperative agreement award in the Automated Standard Application for Payments (ASAP). ASAP is a secure, Web-based, all electronic payment and information application operated by the U.S. Department of the Treasury (Treasury) that allows recipients to drawdown funds from accounts preauthorized by federal agencies. A recipient can normally drawdown on its authorized funds with little or no oversight by the Department prior to drawdown if the drawdown is in accordance with the conditions of the grant/cooperative agreement. Since these drawdowns are at the discretion of the recipient, it is difficult for the Department to control an improper drawdown(s) by a recipient. The recipient, however, will often report the overpayment to the Department and promptly return the funds to the Department via ASAP. When a recipient establishes a history of improper drawdowns against its awards, or for several other valid reasons, bureau financial assistance personnel can place the recipient on “Agency Review” within ASAP to help prevent future improper payments.
A standard procedure is for bureau financial assistance personnel to review recipients’ periodic Standard Form (SF) 425, Federal Financial Report, submissions to the Department, and when an overpayment is discovered, the recipient is promptly notified and requested to return the overpayment to the Department via ASAP. These bureaus now require that project officers sign and date progress reports after review, and place the signed documents in the grant files. In-house training, furthermore, is being provided to bureau financial assistance personnel on performing comprehensive reviews of the SF 425 submissions from recipients. To ensure that proper review and approval procedures are being followed, bureaus have established a peer-to-peer review process where financial assistance specialists review their partners’ financial assistance files. The results of these reviews are shared and discussed with other bureau financial assistance specialists. Bureaus’ supervisory staff are conducting desk audits of financial assistance specialists to ensure that procedures are followed in a timely manner. Bureaus also schedule periodic audits or reviews of financial assistance files to ensure that all procedures
140 | FY 20 17 AGENCY F I NANC IAL REPORT
PAYMENT I N TEGR I TY
are being followed. Bureau financial assistance offices continue to make considerable investments in vendor-provided training certification programs for their financial assistance personnel on the full range of federal financial assistance policy, including technical requirements such as the preparation of SF 425s.
Overpayments can also be recaptured from recipients via other methods if recapture via ASAP is not appropriate. Improper payments for grants/cooperative agreements are also detected during post-award closeout procedures and similar action is taken to recapture an overpayment from a recipient.
Two additional types of improper payments encountered by the Department are (a) improper payments determined resulting from an audit, review, or investigation by the Department’s Office of Inspector General; and (b) improper payments determined resulting from an audit of a federal grant/cooperative agreement award under the Single Audit Act of 1984, as amended. It is often difficult or not possible for the Department to identify, prior to payment, the types of improper payments that are identified in these audits, reviews, or investigations. One bureau financial assistance office’s efforts to help prevent incorrect overhead rates being billed by a grant/cooperative agreement recipient include (a) overhead rates are reviewed through the review of a recipient’s approved Negotiated Indirect Cost Rate Agreements and line item budget); and (b) overhead costs will not be allowable costs against an award unless permitted under the award, and specifically included as a line item in the award’s approved budget. Furthermore, at the time of award closeout, a final comprehensive SF 425 must be submitted by the recipient within 90 days after award expiration. If overhead costs were included as a line item in the award’s approved budget, the SF 425 must include the cumulative total of overhead costs charged to the award. This SF 425 requires the review and approval of the bureau’s financial assistance office. This bureau’s financial assistance office has also taken steps to help ensure recipients do not overdraw their awards. Award funds are monitored through the review of interim Federal Financial Cash Flow Reports to ensure that (a) recipients are expending funds at an appropriate rate; (b) federal disbursements are comparable with the period covered by requests for payment; (c) reports submitted by the recipient agree with the bureau’s accounting records for payments made; and (d) recipients are not maintaining excess cash on hand. The financial assistance office, monthly, furthermore obtains a cash flow tracking report, which serves as an internal control for monitoring recipients’ cash on-hand balances.
One bureau finance office has indicated an additional identifiable reason for improper payments to vendors is a lack of resources that can sometimes lead to short staffing in the accounts payable processing operations, resulting in, due to heavy workload for individual technicians, data entry or other types of errors that result in improper payments. In response to this condition, the bureau is hiring additional accounts payable staff, and providing periodic training to staff to address errors that have been made.
For an identified overpayment that is not promptly recaptured, the Department’s policy is to establish a receivable for the overpayment and the Department then pursues the overpayment through the Department’s normal debt collection management process. See the Receivables With the Public and Debt Collection Management subsection of the Financial Management and Analysis subsection of Management’s Discussion and Analysis for more information on the Department’s debt collection management process for receivables from the public.
A payment recapture audit of contracts/obligations was completed in June 2017 by a contractor for the National Telecommunications and Information Administration (NTIA). Contracts/obligations greater than $100 thousand which were closed out, or for which the period of performance ended and last payment was made but for which the closeout process had not yet been completed after April 1, 2015 and through July 31, 2016, were reviewed. Intragovernmental transactions and payments to employees were excluded from review as discussed above. Travel payments, bankcards/purchase cards, government bills of lading, and gifts and bequests were also excluded from review. The Department determined that, for these categories of transactions, the Department’s costs for the payment recapture audit activities would likely exceed
FY 20 17 AGENCY F I NANC IAL REPORT | 141
PAYMENT I N TEGR I TY

the benefits of payment recapture audits. As part of the payment recapture audit, vendor inquiries were performed for a sample of vendors to determine if NTIA had any open credits or debts with those vendors. Of the $3.8 million reviewed for improper payments, no improper payments were identified.
A payment recapture audit of Department-wide grants and other cooperative agreements was also completed in June 2017 by the contractor. The applicable bureaus/entities were: Economic Development Administration (EDA), International Trade Administration (ITA), Minority Business Development Agency (MBDA), National Institute of Standards and Technology (NIST), NOAA, and NTIA. The audit consisted of grants and other cooperative agreements for which the period of performance expired during the timeframe of January 1, 2015 through April 30, 2016, and greater than $100 thousand. Of the $853.7 million reviewed for improper payments, no improper payments were identified.
The contractor also completed in June 2017 a review of the statuses of sustained disallowed costs of $10 thousand or more, issued between April 1, 2015 and through July 31,2016. Sustained disallowed costs could result, for example, from Single Audit Act audit reports related to grants/cooperative agreements, the OIG audits or reviews, post-payment reviews, closeout reviews, grant/cooperative agreement-specific audits or reviews, and contracts/obligations-specific audits or reviews. The statuses of the sustained disallowed costs provided by the contractor are utilized by the Department for its comprehensive payment integrity and overpayment recapture efforts, including reporting, monitoring, recapturing, and corrective actions; the statuses are further followed up on by the Department as appropriate.
d. For each program or activity that expends $1 million or more annually and either conducts a payment recapture audit or recaptures payments outside of a payment recapture audit, report the amount recovered through recapture audits and amounts recovered through sources other than payment recapture audits, including the percent such amounts represent of the total overpayments identified for recapture. For example, agencies could report on improper payments identified through: statistical samples conducted under IPIA; agency post-payment reviews or audits; Office of Inspector General reviews; Single Audit reports; self-reported overpayments; or reports from the public. Agencies may group amounts by program or activity or in total per the source of recapture, as appropriate.
Beyond the Department’s payment recapture audits program, the Department has extensive payment integrity monitoring, minimization, recapturing, and corrective actions efforts in place, including the identification of improper payments through bureau post-payment reviews, the Office of Inspector General (OIG) audits or reviews, Single Audit Act audits of grants/cooperative agreements, other grants/cooperative agreements audits, contract closeout reviews, grants/cooperative agreements closeout reviews, other audits or reviews, and Department-wide sample testing of disbursements under internal controls testing.
The following table summarizes (1) the results of payment recapture audits completed in June 2017 with regard to improper payments (Amounts Reviewed; and Overpayments Identified); (2) overpayments verified as recaptured in FY 2017 with regard to the payment recapture audit program (all years’ payment recapture audits); and (3) the Department’s FY 2017 overpayments identified, and overpayments verified as recaptured in FY 2017, through sources other than payment recapture audits. For Overpayments Identified Outside of Payment Recapture Auditing reporting, the Overpayments Recaptured column includes both (a) recaptures of overpayments during FY 2017 of overpayments reported in FY 2017; and (b) recaptures of overpayments that were previously identified in prior fiscal years.
142 | FY 20 17 AGENCY F I NANC IAL REPORT
PAYMENT I N TEGR I TY
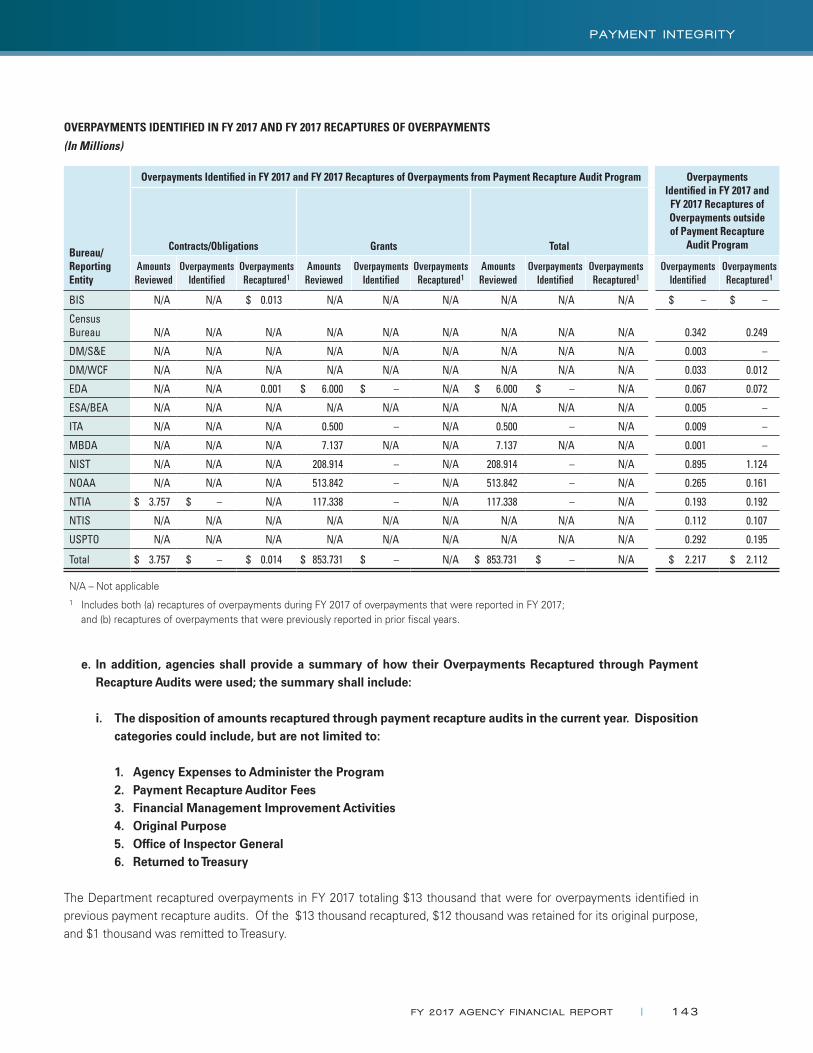
OVERPAYMENTS IDENTIFIED IN FY 2017 AND FY 2017 RECAPTURES OF OVERPAYMENTS
(In Millions)
Bureau/Reporting Entity
Overpayments Identified in FY 2017 and FY 2017 Recaptures of Overpayments from Payment Recapture Audit Program Overpayments Identified in FY 2017 and
FY 2017 Recaptures of Overpayments outside of Payment Recapture
Audit ProgramContracts/Obligations Grants Total
Amounts Reviewed
Overpayments Identified
Overpayments Recaptured1
Amounts Reviewed
Overpayments Identified
Overpayments Recaptured1
Amounts Reviewed
Overpayments Identified
Overpayments Recaptured1
Overpayments Identified
Overpayments Recaptured1
BIS N/A N/A $ 0.013 N/A N/A N/A N/A N/A N/A $ – $ –
Census Bureau N/A N/A N/A N/A N/A N/A N/A N/A N/A 0.342 0.249
DM/S&E N/A N/A N/A N/A N/A N/A N/A N/A N/A 0.003 –
DM/WCF N/A N/A N/A N/A N/A N/A N/A N/A N/A 0.033 0.012
EDA N/A N/A 0.001 $ 6.000 $ – N/A $ 6.000 $ – N/A 0.067 0.072
ESA/BEA N/A N/A N/A N/A N/A N/A N/A N/A N/A 0.005 –
ITA N/A N/A N/A 0.500 – N/A 0.500 – N/A 0.009 –
MBDA N/A N/A N/A 7.137 N/A N/A 7.137 N/A N/A 0.001 –
NIST N/A N/A N/A 208.914 – N/A 208.914 – N/A 0.895 1.124
NOAA N/A N/A N/A 513.842 – N/A 513.842 – N/A 0.265 0.161
NTIA $ 3.757 $ – N/A 117.338 – N/A 117.338 – N/A 0.193 0.192
NTIS N/A N/A N/A N/A N/A N/A N/A N/A N/A 0.112 0.107
USPTO N/A N/A N/A N/A N/A N/A N/A N/A N/A 0.292 0.195
Total $ 3.757 $ – $ 0.014 $ 853.731 $ – N/A $ 853.731 $ – N/A $ 2.217 $ 2.112
N/A – Not applicable1 Includes both (a) recaptures of overpayments during FY 2017 of overpayments that were reported in FY 2017;
and (b) recaptures of overpayments that were previously reported in prior fiscal years.
e. In addition, agencies shall provide a summary of how their Overpayments Recaptured through Payment Recapture Audits were used; the summary shall include:
i. The disposition of amounts recaptured through payment recapture audits in the current year. Disposition categories could include, but are not limited to:
1. Agency Expenses to Administer the Program 2. Payment Recapture Auditor Fees 3. Financial Management Improvement Activities 4. Original Purpose 5. Office of Inspector General 6. Returned to Treasury
The Department recaptured overpayments in FY 2017 totaling $13 thousand that were for overpayments identified in previous payment recapture audits. Of the $13 thousand recaptured, $12 thousand was retained for its original purpose, and $1 thousand was remitted to Treasury.
FY 20 17 AGENCY F I NANC IAL REPORT | 143
PAYMENT I N TEGR I TY

ii. An aging schedule of the amount of overpayments identified through the payment recapture audit program that are outstanding, including the percent such amounts represent of the total overpayments identified through payment recaptures audits (i.e., overpayments that have been identified but not recaptured). Typically, the aging of an overpayment begins at the time an overpayment is detected; indicate when this is not the case. The amounts outstanding should be grouped by: zero to six months, six months to one year, and over one year.
iii. The agency should also report the amount determined to not be collectable, including the percent such amounts represent of the total overpayments of the agency.
The Department has not yet recaptured overpayments of $3 thousand that were included in the overpayments identified for recapture of $4 thousand in the payment recapture audit of contracts/obligations of EDA/Salaries and Expenses completed in February 2015.
AGING OF OUTSTANDING OVERPAYMENTS IDENTIFIED IN PAYMENT RECAPTURE AUDIT PROGRAM
(In Millions)
Bureau/ Reporting Entity Type of Payment
Amount Outstanding (0–6 Months)
Amount Outstanding (6 Months–1 Year)
Amount Outstanding (Over 1 Year)
Amount Determined to Not be Collectible
EDA Contract $ – $ – $ 0.003 $ –
IV. PaymentAccuracy.gov Website
Treasury, in coordination with the U.S. Department of Justice and OMB, established the PaymentAccuracy.gov website, located at https://paymentaccuracy.gov, to create a centralized location to publish information about U.S. government improper payments made to individuals, organizations, and contractors. This website also provides a centralized place where suspected incidents of fraud, waste, and abuse can be reported, and contains information about (1) current and historical rates and amounts of improper payments; (2) why improper payments occur; and (3) what agencies are doing to reduce and recapture improper payments. The website also contains extensive information, guidance, and links to other useful resources for addressing improper payments.
This website contains additional information and data about the Department’s improper payments, including improper payments information included in previous Departmental Agency Financial Reports that is no longer included in the FY 2017 Agency Financial Report.
144 | FY 20 17 AGENCY F I NANC IAL REPORT
PAYMENT I N TEGR I TY

FRAUD REDUCTION REPORT
Fraud risk management is an important aspect of the Department’s strategy to achieve its mission and goals. Fraud prevention, detection, monitoring, and response are key to managing fraud risk and is continually being integrated in the culture and controls throughout the Department. A number of key control strategies have been implemented in
FY 2017 and the final quarter in FY 2016.
Fraud risk has been identified as one of 10 categories of risk by the Department’s Enterprise Risk Management (ERM) Framework. The Department’s ERM Framework is designed to facilitate a risk-based approach to fraud risk assessment at different levels within the organization. Management uses the U.S. Government Accountability Office (GAO) Fraud Risk Management Framework leading practices as a guide to combat fraud, increase emphasis on prevention, and put into place corrective actions to address identified deficiencies. The Department also utilizes several processes and sources to identify, manage, and mitigate fraud risks. These processes and sources include, but are not limited to, the Agency Risk Profile, GAO High-Risk List, and Mission Critical Programs and Activities List. A fraud assessment has also been tailored to a specific program’s operations and risks, such as the Census 2020. An independent risk analysis was initiated by the Department’s Office of Risk Management, and fraud risk has been considered as part of that analysis.
Analyses of risks, including fraud risks, are also an integral process of the Department’s financial internal control program. The Department annually performs an assessment of the risks at the entity and process levels. At the entity level, the Department and components assess exposures and controls around fraud risk. How the Department anticipates, identifies, and responds to fraud is considered during the assessment. Existing Departmental policies and procedures are also examined to ensure that they adequately meet their objective. At the process level, inherent and control risks are assessed for each of the Department’s key business processes and sub-processes. The process level assessment includes evaluation of the Department’s payroll, purchase card, and grants management business cycles. The exercise and results of these assessments aids in identifying types and levels of risks within the Department and informs the mitigation process.
Business process workshops are also held annually in which interdisciplinary teams, including task owners and the Internal Control Senior Assessment Team, come together to identify and examine the control activity and control design around key business processes. During these workshops, key control objectives and activities are discussed and control gaps are identified and addressed. Internal control test steps are also discussed and/or modified.
Finally, the Department also has a team that utilizes data analytics to collect and analyze data to detect and monitor fraud. The data analytics program involves the development of continuous monitoring processes, data science techniques, analytics and visualizations, to be applied to sensitive programs and financial data in order to identify trends, anomalies, and other meaningful patterns that may signify potential internal control weakness or indicators of fraud, waste, and abuse. In FY 2016 and FY 2017, the Department completed reviews of Purchase Card, Travel Card, and WebT&A (Time and Attendance) datasets and worked together with bureaus on sensitive issues and corrective actions. The Department plans to continue to expand its data analytics program to enhance the capabilities and scope of additional analysis.
FY 20 17 AGENCY F I NANC IAL REPORT | 145
FRAUD REDUCT ION REPORT

REDUCE THE FOOTPRINT
Per section 3 of Office of Management and Budget (OMB) Memorandum 12-12, Promoting Efficient Spending to Support Agency Operations (May 11, 2012), and OMB Management Procedures Memorandum 2013-02, Implementation of OMB Memorandum M-12-12 Section 3: Freeze the Footprint (March 14, 2013), Chief Financial Officers (CFO) Act
departments and agencies shall not increase the total square footage of their domestic office and warehouse inventory compared to the FY 2012 baseline, unless increased footage is offset through consolidation, co-location, or disposal of space from the inventory of that agency. Under the Freeze the Footprint initiative from FY 2013 to FY 2015 the Department achieved an overall 4.7 percent space reduction in three years by looking for office consolidation opportunities, revisiting storage requirements, and tighter management of space allocations.
On March 25, 2015, OMB issued Memorandum 2015-01, Implementation of OMB Memorandum M-12-12 Section 3: Reduce the Footprint. In contrast, the Reduce the Footprint initiative is focusing on workspace planning, controlling requirements, and a disciplined approach to merging mission and collaboration of space to provide a variety of reconfigurable space and technology options.
The Department seeks to continue efforts to track, cap, and reverse a long-term growth trend of real property space by systematically and strategically eliminating unneeded assets regardless of space type. In the five-year period between FY 2016 and FY 2021, the Department’s stretch goal remains to reduce its owned total footprint by three percent, or 228,495 square feet, and its leased, including General Services Administration (GSA) leased office space, by 15 percent, or 1.53 million square feet, from its FY 2015 baseline; excluding the 2020 Decennial Census space growth. The Department has determined its principal strategic approach is to (1) focus on office utilization rate improvement to reduce space; (2) consolidate underutilized assets; and (3) dispose of unneeded assets. Because of budget constraints, operating units will need to consider the use of GSA’s Workplace Engagements, as well as Furniture and Information Technology (FIT) and Consolidation program funds to offset initial planning, furnishing, and build-out costs. The Herbert C. Hoover Building renovation project is utilizing the FIT program in lieu of direct appropriations to furnish and equip recent phases. The Bureau of Economic Analysis co-location with the Census Bureau utilized GSA Consolidation funds to offset design and build-out costs.
REDUCE THE FOOTPRINT BASELINE COMPARISONS
(In Millions)
FY 2015 Baseline
FY 2016 Actual +/- Change
Square Footage 12.124 11.904 (0.219) Target Met
OPERATING COSTS OF OWNED AND DIRECT LEASE BUILDINGS SUBJECT TO REDUCE THE FOOTPRINT
(In Millions)
FY 2015 Baseline
FY 2016 Actual +/- Change
Operation and Maintenance Costs $35.039 $36.769 $1.7301
1 Target missed due to rent increase and inflation.
146 | FY 20 17 AGENCY F I NANC IAL REPORT
REDUCE THE FOOTPR INT
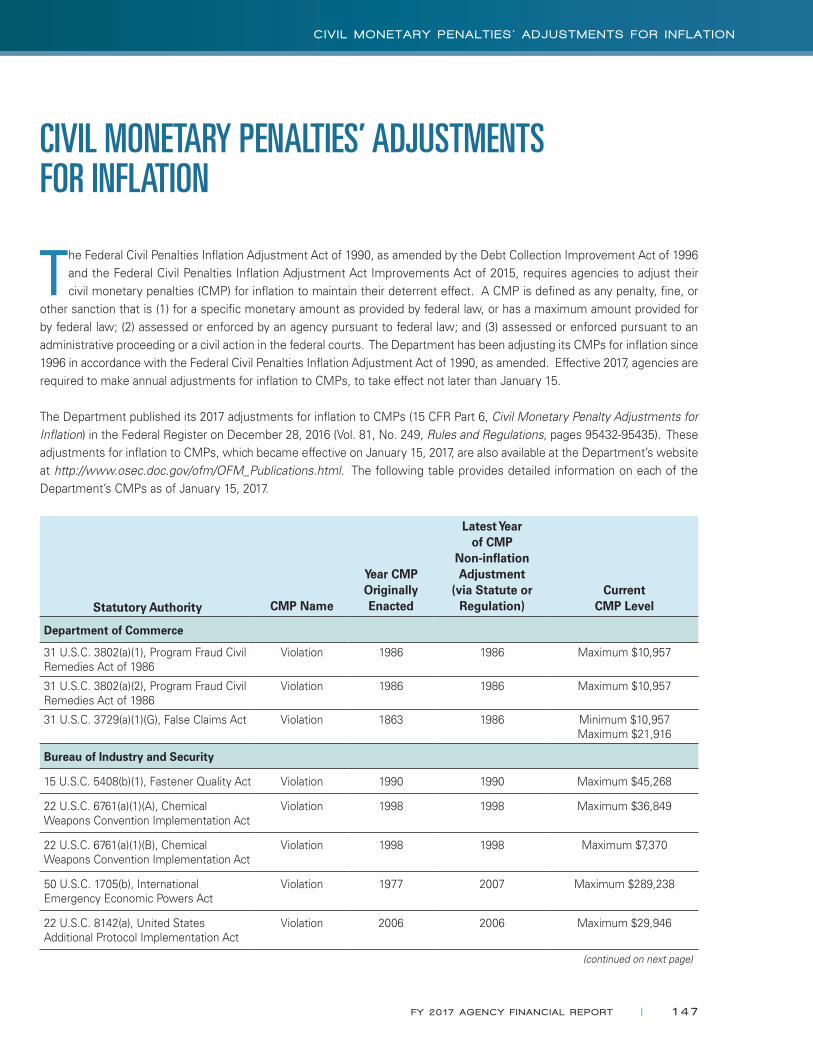
CIVIL MONETARY PENALTIES’ ADJUSTMENTS FOR INFLATION
The Federal Civil Penalties Inflation Adjustment Act of 1990, as amended by the Debt Collection Improvement Act of 1996 and the Federal Civil Penalties Inflation Adjustment Act Improvements Act of 2015, requires agencies to adjust their civil monetary penalties (CMP) for inflation to maintain their deterrent effect. A CMP is defined as any penalty, fine, or
other sanction that is (1) for a specific monetary amount as provided by federal law, or has a maximum amount provided for by federal law; (2) assessed or enforced by an agency pursuant to federal law; and (3) assessed or enforced pursuant to an administrative proceeding or a civil action in the federal courts. The Department has been adjusting its CMPs for inflation since 1996 in accordance with the Federal Civil Penalties Inflation Adjustment Act of 1990, as amended. Effective 2017, agencies are required to make annual adjustments for inflation to CMPs, to take effect not later than January 15.
The Department published its 2017 adjustments for inflation to CMPs (15 CFR Part 6, Civil Monetary Penalty Adjustments for Inflation) in the Federal Register on December 28, 2016 (Vol. 81, No. 249, Rules and Regulations, pages 95432-95435). These adjustments for inflation to CMPs, which became effective on January 15, 2017, are also available at the Department’s website at http://www.osec.doc.gov/ofm/OFM_Publications.html. The following table provides detailed information on each of the Department’s CMPs as of January 15, 2017.
Statutory Authority CMP Name
Year CMP Originally Enacted
Latest Year of CMP
Non-inflation Adjustment
(via Statute or Regulation)
Current CMP Level
Department of Commerce
31 U.S.C. 3802(a)(1), Program Fraud Civil Remedies Act of 1986
Violation 1986 1986 Maximum $10,957
31 U.S.C. 3802(a)(2), Program Fraud Civil Remedies Act of 1986
Violation 1986 1986 Maximum $10,957
31 U.S.C. 3729(a)(1)(G), False Claims Act Violation 1863 1986 Minimum $10,957Maximum $21,916
Bureau of Industry and Security
15 U.S.C. 5408(b)(1), Fastener Quality Act Violation 1990 1990 Maximum $45,268
22 U.S.C. 6761(a)(1)(A), Chemical Weapons Convention Implementation Act
Violation 1998 1998 Maximum $36,849
22 U.S.C. 6761(a)(1)(B), Chemical Weapons Convention Implementation Act
Violation 1998 1998 Maximum $7,370
50 U.S.C. 1705(b), International Emergency Economic Powers Act
Violation 1977 2007 Maximum $289,238
22 U.S.C. 8142(a), United States Additional Protocol Implementation Act
Violation 2006 2006 Maximum $29,946
(continued on next page)
FY 20 17 AGENCY F I NANC IAL REPORT | 147
C IV I L MONETARY PENALT I ES ’ ADJUSTMENTS FOR I NFLAT ION

Statutory Authority CMP Name
Year CMP Originally Enacted
Latest Year of CMP Non-inflation Adjustment
(via Statute or Regulation)
Current CMP Level
Census Bureau
13 U.S.C. 304, Collection of Foreign Trade Statistics
Each day's delinquency of a violation; total of not to exceed
maximum violation
Maximum per violation
1962 2002 Each day’s delinquency of a violation:
Maximum $1,333
Maximum per violation: $13,333
13 U.S.C. 305(b), Collectionof Foreign Trade Statistics
Violation 1962 2002 Maximum $13,333
Economics and Statistics Administration
22 U.S.C. 3105(a), International Investment and Trade in Services Act
Failure to furnish information
Minimum: 1990Maximum: 1976
Minimum: 1990Maximum: 1990
Minimum $4,527Maximum $45,268
International Trade Administration
19 U.S.C. 81s, Foreign Trade Zone Violation 1934 1934 Maximum $2,795
19 U.S.C. 1677f(f)(4), U.S.-Canada FTA Protective Order
Violation 1988 1988 Maximum $201,106
National Oceanic and Atmospheric Administration
51 U.S.C. 60123(a), Land Remote Sensing Policy Act of 2010
Violation 2010 2010 Maximum $11,052
51 U.S.C. 60148(c), Land Remote Sensing Policy Act of 2010
Violation 2010 2010 Maximum $11,052
16 U.S.C. 773f(a), Northern Pacific Halibut Act of 1982
Violation 1982 2007 Maximum $231,391
16 U.S.C. 783, Sponge Act Violation 1914 1914 Maximum $1,652
16 U.S.C. 957(d), (e), and (f), Tuna Conventions Act of 1950
Violations 1962 1962 (i) Violation of 16 U.S.C. 957(a):
Maximum $82,579
(ii) Subsequent violation of 16 U.S.C. 957(a): Maximum $177,863
(iii) Violation of 16 U.S.C. 957(b): Maximum $2,795
(iv) Subsequent violation of 16 U.S.C. 957 (b): Maximum $16,516
(v) Violation of 16 U.S.C. 957(c):
Maximum $355,726
(continued on next page)
(continued from previous page)
148 | FY 20 17 AGENCY F I NANC IAL REPORT
C IV I L MONETARY PENALT I ES ’ ADJUSTMENTS FOR I NFLAT ION
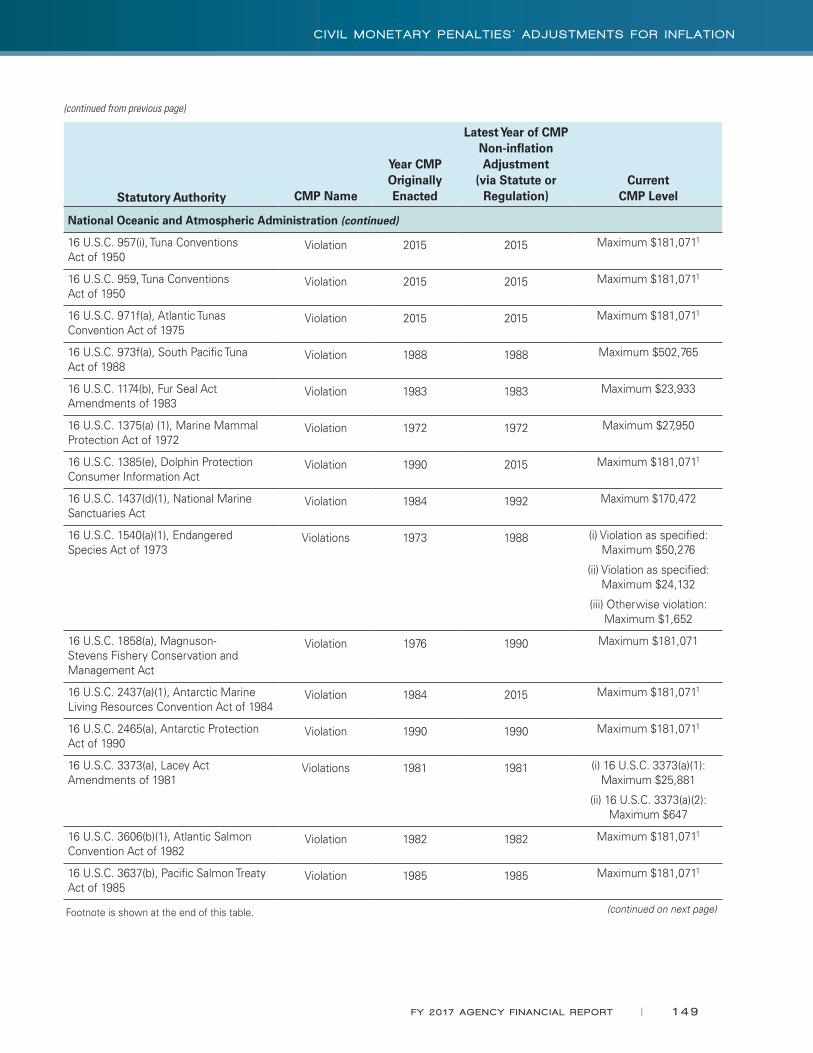
Statutory Authority CMP Name
Year CMP Originally Enacted
Latest Year of CMP Non-inflation Adjustment
(via Statute or Regulation)
Current CMP Level
National Oceanic and Atmospheric Administration (continued)
16 U.S.C. 957(i), Tuna ConventionsAct of 1950
Violation 2015 2015 Maximum $181,0711
16 U.S.C. 959, Tuna ConventionsAct of 1950
Violation 2015 2015 Maximum $181,0711
16 U.S.C. 971f(a), Atlantic Tunas Convention Act of 1975
Violation 2015 2015 Maximum $181,0711
16 U.S.C. 973f(a), South Pacific Tuna Act of 1988
Violation 1988 1988 Maximum $502,765
16 U.S.C. 1174(b), Fur Seal Act Amendments of 1983
Violation 1983 1983 Maximum $23,933
16 U.S.C. 1375(a) (1), Marine Mammal Protection Act of 1972
Violation 1972 1972 Maximum $27,950
16 U.S.C. 1385(e), Dolphin Protection Consumer Information Act
Violation 1990 2015 Maximum $181,0711
16 U.S.C. 1437(d)(1), National Marine Sanctuaries Act
Violation 1984 1992 Maximum $170,472
16 U.S.C. 1540(a)(1), Endangered Species Act of 1973
Violations 1973 1988 (i) Violation as specified: Maximum $50,276
(ii) Violation as specified: Maximum $24,132
(iii) Otherwise violation: Maximum $1,652
16 U.S.C. 1858(a), Magnuson-Stevens Fishery Conservation and Management Act
Violation 1976 1990 Maximum $181,071
16 U.S.C. 2437(a)(1), Antarctic Marine Living Resources Convention Act of 1984
Violation 1984 2015 Maximum $181,0711
16 U.S.C. 2465(a), Antarctic Protection Act of 1990
Violation 1990 1990 Maximum $181,0711
16 U.S.C. 3373(a), Lacey Act Amendments of 1981
Violations 1981 1981 (i) 16 U.S.C. 3373(a)(1): Maximum $25,881
(ii) 16 U.S.C. 3373(a)(2): Maximum $647
16 U.S.C. 3606(b)(1), Atlantic Salmon Convention Act of 1982
Violation 1982 1982 Maximum $181,0711
16 U.S.C. 3637(b), Pacific Salmon Treaty Act of 1985
Violation 1985 1985 Maximum $181,0711
(continued on next page)
(continued from previous page)
Footnote is shown at the end of this table.
FY 20 17 AGENCY F I NANC IAL REPORT | 149
C IV I L MONETARY PENALT I ES ’ ADJUSTMENTS FOR I NFLAT ION
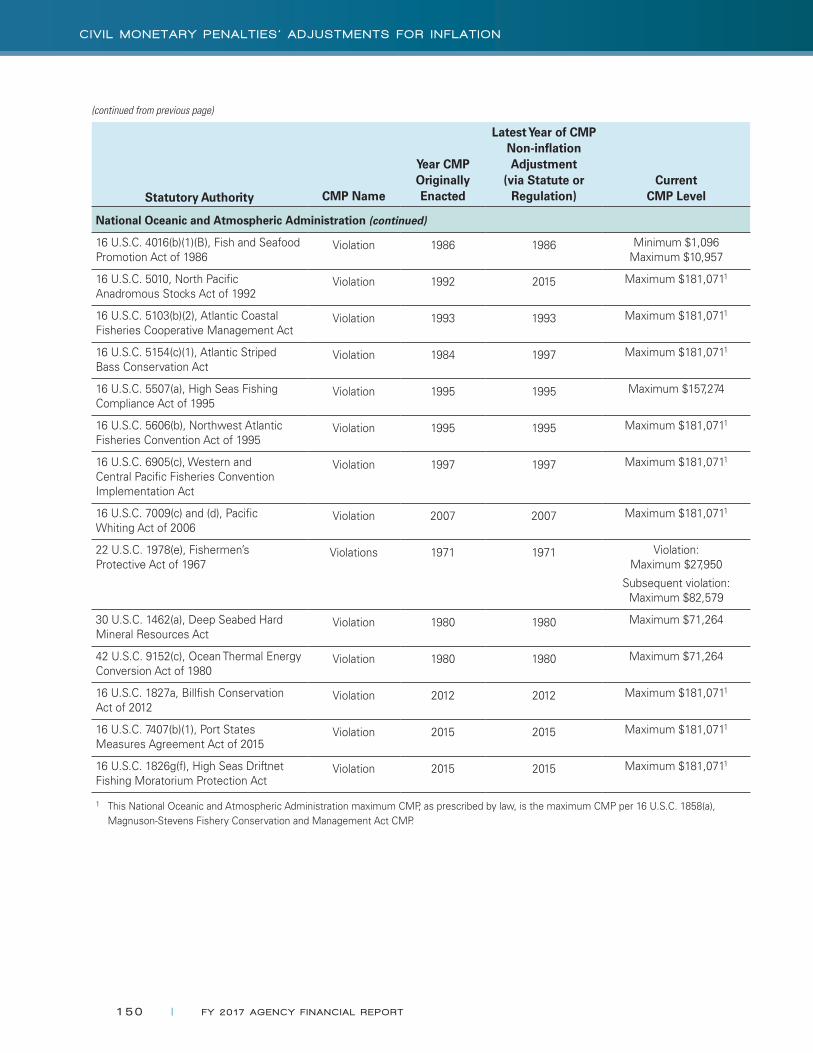
Statutory Authority CMP Name
Year CMP Originally Enacted
Latest Year of CMP Non-inflation Adjustment
(via Statute or Regulation)
Current CMP Level
National Oceanic and Atmospheric Administration (continued)
16 U.S.C. 4016(b)(1)(B), Fish and Seafood Promotion Act of 1986
Violation 1986 1986 Minimum $1,096Maximum $10,957
16 U.S.C. 5010, North Pacific Anadromous Stocks Act of 1992
Violation 1992 2015 Maximum $181,0711
16 U.S.C. 5103(b)(2), Atlantic Coastal Fisheries Cooperative Management Act
Violation 1993 1993 Maximum $181,0711
16 U.S.C. 5154(c)(1), Atlantic Striped Bass Conservation Act
Violation 1984 1997 Maximum $181,0711
16 U.S.C. 5507(a), High Seas Fishing Compliance Act of 1995
Violation 1995 1995 Maximum $157,274
16 U.S.C. 5606(b), Northwest Atlantic Fisheries Convention Act of 1995
Violation 1995 1995 Maximum $181,0711
16 U.S.C. 6905(c), Western and Central Pacific Fisheries Convention Implementation Act
Violation 1997 1997 Maximum $181,0711
16 U.S.C. 7009(c) and (d), Pacific Whiting Act of 2006
Violation 2007 2007 Maximum $181,0711
22 U.S.C. 1978(e), Fishermen’s Protective Act of 1967
Violations 1971 1971 Violation: Maximum $27,950
Subsequent violation: Maximum $82,579
30 U.S.C. 1462(a), Deep Seabed Hard Mineral Resources Act
Violation 1980 1980 Maximum $71,264
42 U.S.C. 9152(c), Ocean Thermal Energy Conversion Act of 1980
Violation 1980 1980 Maximum $71,264
16 U.S.C. 1827a, Billfish Conservation Act of 2012
Violation 2012 2012 Maximum $181,0711
16 U.S.C. 7407(b)(1), Port States Measures Agreement Act of 2015
Violation 2015 2015 Maximum $181,0711
16 U.S.C. 1826g(f), High Seas Driftnet Fishing Moratorium Protection Act
Violation 2015 2015 Maximum $181,0711
1 This National Oceanic and Atmospheric Administration maximum CMP, as prescribed by law, is the maximum CMP per 16 U.S.C. 1858(a), Magnuson-Stevens Fishery Conservation and Management Act CMP.
(continued from previous page)
150 | FY 20 17 AGENCY F I NANC IAL REPORT
C IV I L MONETARY PENALT I ES ’ ADJUSTMENTS FOR I NFLAT ION
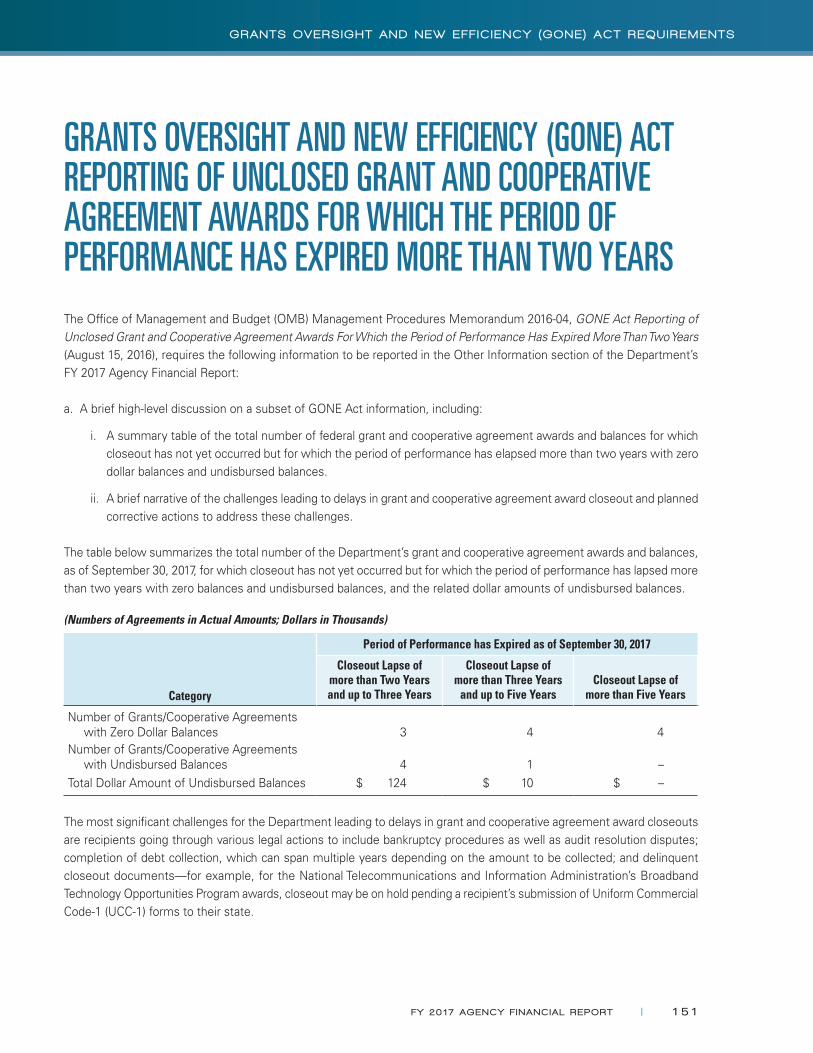
GRANTS OVERSIGHT AND NEW EFFICIENCY (GONE) ACT REPORTING OF UNCLOSED GRANT AND COOPERATIVE AGREEMENT AWARDS FOR WHICH THE PERIOD OF PERFORMANCE HAS EXPIRED MORE THAN TWO YEARSThe Office of Management and Budget (OMB) Management Procedures Memorandum 2016-04, GONE Act Reporting of Unclosed Grant and Cooperative Agreement Awards For Which the Period of Performance Has Expired More Than Two Years (August 15, 2016), requires the following information to be reported in the Other Information section of the Department’s FY 2017 Agency Financial Report:
a. A brief high-level discussion on a subset of GONE Act information, including:
i. A summary table of the total number of federal grant and cooperative agreement awards and balances for which closeout has not yet occurred but for which the period of performance has elapsed more than two years with zero dollar balances and undisbursed balances.
ii. A brief narrative of the challenges leading to delays in grant and cooperative agreement award closeout and planned corrective actions to address these challenges.
The table below summarizes the total number of the Department’s grant and cooperative agreement awards and balances, as of September 30, 2017, for which closeout has not yet occurred but for which the period of performance has lapsed more than two years with zero balances and undisbursed balances, and the related dollar amounts of undisbursed balances.
(Numbers of Agreements in Actual Amounts; Dollars in Thousands)
Period of Performance has Expired as of September 30, 2017
Category
Closeout Lapse of more than Two Years and up to Three Years
Closeout Lapse of more than Three Years
and up to Five YearsCloseout Lapse of
more than Five Years
Number of Grants/Cooperative Agreements with Zero Dollar Balances 3 4 4
Number of Grants/Cooperative Agreements with Undisbursed Balances 4 1 –
Total Dollar Amount of Undisbursed Balances $ 124 $ 10 $ –
The most significant challenges for the Department leading to delays in grant and cooperative agreement award closeouts are recipients going through various legal actions to include bankruptcy procedures as well as audit resolution disputes; completion of debt collection, which can span multiple years depending on the amount to be collected; and delinquent closeout documents—for example, for the National Telecommunications and Information Administration’s Broadband Technology Opportunities Program awards, closeout may be on hold pending a recipient’s submission of Uniform Commercial Code-1 (UCC-1) forms to their state.
FY 20 17 AGENCY F I NANC IAL REPORT | 151
GRANTS OVERS IGHT AND NEW EFF IC I ENCY (GONE ) ACT REQU IREMENTS
In 2012, the Department had a significant number of awards where the recipient was no longer in existence or where the recipient was in existence, but was unresponsive to bureau notifications and attempts to contact. In response to this challenge, the Department’s Grants Council initiated a Tiger Team to develop a process to unilaterally terminate and/or administratively closeout these awards. This procedure was implemented in the summer of 2013 and over the past four years more than 80 of these types of awards have been closed. Furthermore, each of the Department’s grant-making bureaus submit a monthly report to the Department’s Grants Management Division (GMD) detailing the status of all expired awards. The Department’s GMD consolidates these reports and presents the information during the Department’s bi-monthly Grants Council meetings for review and analysis. Over the past three fiscal years, lessons learned and business process improvements have been identified and implemented across the Department’s grants offices.
152 | FY 20 17 AGENCY F I NANC IAL REPORT
GRANTS OVERS IGHT AND NEW EFF IC I ENCY (GONE ) ACT REQU IREMENTS
UNDISBURSED BALANCES IN EXPIRED GRANT ACCOUNTS
Undisbursed balances in expired grant accounts include budget authority that is no longer available for new obligations but is still available for disbursement. The period of disbursement lasts for five years after the last unexpired year unless the expiration period has been lengthened by legislation. Specifically, one may not incur new obligations
against expired budget authority, but one may liquidate existing obligations by making disbursements (section 20.4(c), Period of availability of budget authority, of the Office of Management and Budget’s (OMB) Circular A-11 Revised dated August 1, 2017, Preparation, Submission, and Execution of the Budget).
OMB Memorandum M-16-18, Financial and Performance Reporting on Undisbursed Balances in Expired Grant Accounts (July 15, 2016), requires the following information to be reported in the Department’s annual Agency Financial Report and annual performance plans/budgets for FY 2017 and subsequent fiscal years regarding undisbursed balances in expired grant accounts:
(1) In the preceding three fiscal years, provide the total number of expired grant accounts with undisbursed balances for the Department and the total amount that has not been obligated to a specific grant or project remaining in the accounts;
(2) Details on future action the Department will take to resolve undisbursed balances in expired grant accounts;
(3) The method that the Department uses to track undisbursed balances in expired grant accounts; and
(4) Process for identification of undisbursed balances in expired grant accounts that may be returned to the U.S. Department of the Treasury (Treasury).
Five bureaus report information under this guidance: International Trade Administration (ITA), Minority Business Development Agency (MBDA), National Institute of Standards and Technology (NIST), National Oceanic and Atmospheric Administration (NOAA), and National Telecommunications and Information Administration (NTIA). NIST’s Grants Management Division (GMD) manages all grants awarded by NIST as well as a portion of those grants funded by NTIA. NOAA’s GMD manages all grants awarded by NOAA as well as those grants awarded by ITA and MBDA and the remainder of the NTIA awards.
Both NIST GMD and NOAA GMD have teams that are specifically responsible for reviewing, closing out, and deobligating undisbursed balances in expired awards. As part of their routine grants management responsibilities, these offices review reports that identify expired awards with undisbursed balances of funds as well as expired awards that may have existing audit findings or other unresolved matters which require further coordination prior to deobligating funds and closing out an award.
During its reviews of expired awards with undisbursed obligations, NIST GMD reconciles the recipient’s Standard Form (SF) 425, Federal Financial Report, against the amount of funding remaining in the payment system and in NIST’s financial system. NIST GMD works with all relevant parties to resolve any discrepancies prior to the deobligation of funds and begins the deobligation process once it is determined that the recipient is not owed any further federal funding and that all relevant issues are resolved. The NIST grants specialist actively checks NIST’s Grant Management Information System (GMIS) for awards eligible for closeout, and begins closing awards with the largest de-obligated funded awards first. NIST has a Grants Management Officer (GMO) assigned to oversee the closeout process. This individual routinely obtains reports from GMIS to identify any awards that have expired and that are eligible for the closeout process. Additionally, these reports identify if any undisbursed obligations remain in the award account. The GMO also collects regular status updates
FY 20 17 AGENCY F I NANC IAL REPORT | 153
UND ISBURSED BALANCES I N EXP IRED GRANT ACCOUNTS
on all the awards in the closeout process, and advises on appropriate next steps to resolve any outstanding issues that may be preventing a deobligation or the closeout of an award. The status updates are reconciled against reports run from GMIS to help ensure that no awards warranting attention are missed during the process. If there is an unobligated balance, NIST’s finance office uses the budget account to determine what unobligated funds, if any, may be returned to Treasury. Any funds that are returned to Treasury are typically returned to Treasury upon the budget account entering the cancelled phase. NIST has made significant progress in reducing the backlog of closeouts and deobligations in the past three fiscal years; any aged closeouts are being tracked and reported to the Department’s GMD to help ensure progress is made.
NOAA GMD obtains and reviews monthly an Undisbursed Funds Chart which is used to track expired grant awards with undisbursed obligations. The monthly Undisbursed Funds Charts are also provided to the Department’s GMD. Upon review and acceptance of the recipient’s SF 425, NOAA GMD completes and submits to NOAA’s finance office a deobligation request. After deobligation is completed, NOAA’s finance office identifies the applicable budget account and determines what, if any, unobligated funds may be returned to Treasury. NOAA will continue to expedite deobligations and closeout of expired to the maximum extent within 90 days from NOAA receipt of a recipient’s final SF 425. Recipients have 90 days after award expiration to drawdown remaining funds for expenses incurred during the award period.
Each bureau submits a monthly report to the Department’s GMD detailing the current status of expired awards—number of expired awards not yet closed and undisbursed balances of funds in these awards. The Department’s GMD consolidates these reports and presents the information during the Department’s bi-monthly Grants Council meetings for review and analysis. Over the past three fiscal years, numerous lessons learned and business process improvements have been identified and implemented across the Department’s grants offices. A direct impact of the Grants Council’s oversight has been the Department’s significant progress in reducing the backlog of closeouts and deobligations.
The table on the following page presents, for each budget account that had undisbursed obligations for expired grant awards as of September 30, 2017 (last day of FY 2017), September 30, 2016 (last day of FY 2016), or September 30, 2015 (last day of FY 2015), the dollar amount of undisbursed obligations for expired grant awards as of September 30, 2017, 2016, and 2015; the dollar amount of the total unobligated balance for the budget account as of September 30, 2017, 2016, and 2015; and, for each bureau reported in this table, the total number of expired grant awards with undisbursed obligations as of September 30, 2017, 2016, and 2015.
154 | FY 20 17 AGENCY F I NANC IAL REPORT
UND ISBURSED BALANCES I N EXP IRED GRANT ACCOUNTS

(Num
bers
in A
ctua
l Am
ount
s; D
olla
rs in
Tho
usan
ds)
Bur
eau
Bud
get A
ccou
ntA
s of
Sep
tem
ber
30, 2
017
As
of S
epte
mbe
r 30
, 201
6A
s of
Sep
tem
ber
30, 2
015
Num
ber
Titl
e
Num
ber
of E
xpire
d G
rant
A
war
ds w
ith
Und
isbu
rsed
O
blig
atio
ns
Und
isbu
rsed
O
blig
atio
ns
for
Expi
red
Gra
nt A
war
ds
Tota
l U
nobl
igat
ed
Bal
ance
in
Bud
get
Acc
ount
Num
ber
of E
xpire
d G
rant
A
war
ds w
ith
Und
isbu
rsed
O
blig
atio
ns
Und
isbu
rsed
O
blig
atio
ns
for
Expi
red
Gra
nt A
war
ds
Tota
l U
nobl
igat
ed
Bal
ance
in
Bud
get
Acc
ount
Num
ber
of E
xpire
d G
rant
A
war
ds w
ith
Und
isbu
rsed
O
blig
atio
ns
Und
isbu
rsed
O
blig
atio
ns
for
Expi
red
Gra
nt A
war
ds
Tota
l U
nobl
igat
ed
Bal
ance
in
Bud
get
Acc
ount
ITA
1250
Ope
ratio
ns a
nd
Adm
inis
trat
ion,
ITA
, C
omm
erce
2
$
30
$
69,5
79
8 $
86
3 $
58
,931
3
$
55
0 $
41
,633
MB
DA
0201
Min
ority
Bus
ines
s D
evel
opm
ent,
MB
DA
2
72
5,86
7 60
8,9
45
6,79
5 1
8
8 4
,920
NIS
T05
00Sc
ient
ific
and
Tech
nica
l R
esea
rch
and
Serv
ices
, N
IST
1,03
7 1
0,26
8 2
,359
21
,818
3,
161
23,
018
0513
Wire
less
Inno
vatio
n Fu
nd,
NIS
T
–
239,
241
1
27
5,34
1
–
92,7
00
0515
Con
stru
ctio
n of
Res
earc
h Fa
cilit
ies,
NIS
T
– 47
,607
– 24
,216
–
25,
746
0525
Indu
stria
l Tec
hnol
ogy
Serv
ices
, NIS
T95
38,
368
8,6
16
43,2
43
12,
065
21,4
00
0549
Scie
ntifi
c an
d Te
chni
cal
Res
earc
h an
d Se
rvic
es,
Rec
over
y A
ct, N
IST,
C
omm
erce
–
113
–
–
–
–
4650
Wor
king
Cap
ital F
und,
NIS
T30
8 1
17,0
907,1
12 9
0,16
8 1
,268
1
05,1
19
Tota
l 1
57
2,29
842
2,68
7 1
75
18,
088
454,
786
182
1
6,49
4 2
67,9
83
NO
AA
1450
Ope
ratio
ns, R
esea
rch,
and
Fa
cilit
ies,
NO
AA
15,
043
344
,422
11,5
89
379
,957
1
0,24
7 3
64,5
32
1451
Expe
nses
, Pac
ific
Coa
stal
Sa
lmon
Rec
over
y, N
OA
A25
416
3 2
4
34
400
4
36
1460
Proc
urem
ent,
Acq
uisi
tion,
an
d C
onst
ruct
ion,
NO
AA
, C
omm
erce
1,1
36
398,
645
83
264
,553
1
,119
2
58,7
16
(con
tinue
d on
nex
t pag
e)
FY 20 17 AGENCY F I NANC IAL REPORT | 155
UND ISBURSED BALANCES I N EXP IRED GRANT ACCOUNTS
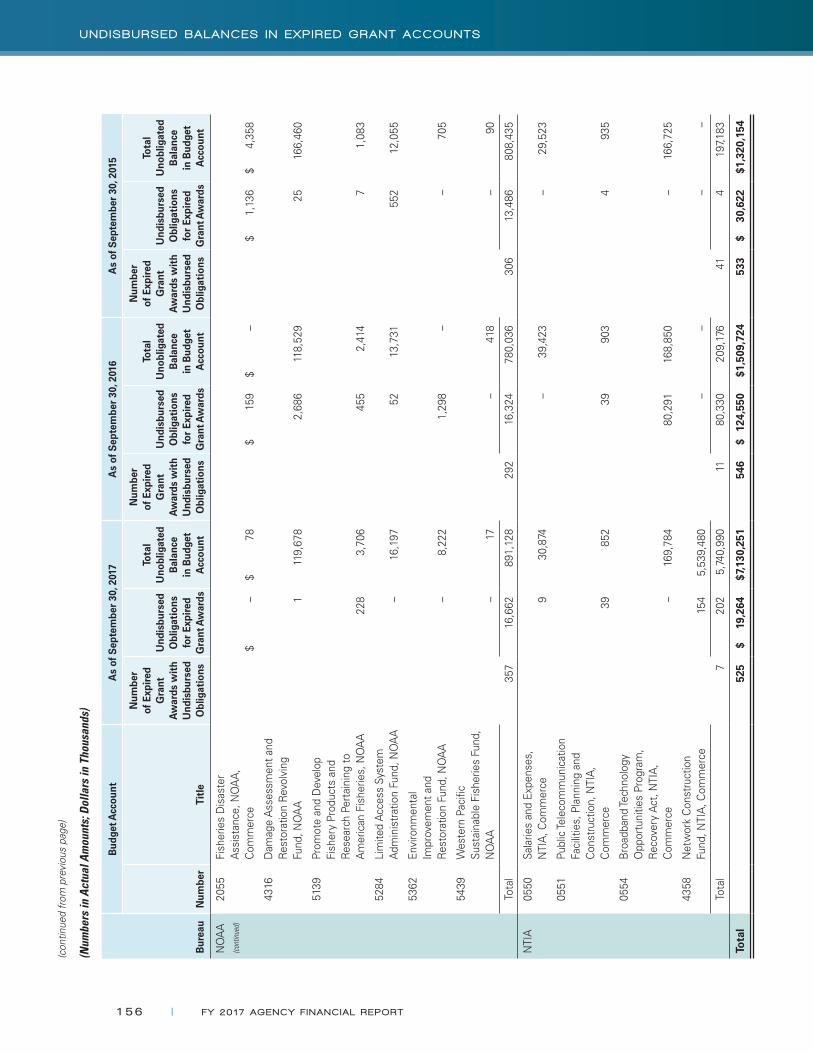
(Num
bers
in A
ctua
l Am
ount
s; D
olla
rs in
Tho
usan
ds)
Bur
eau
Bud
get A
ccou
ntA
s of
Sep
tem
ber
30, 2
017
As
of S
epte
mbe
r 30
, 201
6A
s of
Sep
tem
ber
30, 2
015
Num
ber
Titl
e
Num
ber
of E
xpire
d G
rant
A
war
ds w
ith
Und
isbu
rsed
O
blig
atio
ns
Und
isbu
rsed
O
blig
atio
ns
for
Expi
red
Gra
nt A
war
ds
Tota
l U
nobl
igat
ed
Bal
ance
in
Bud
get
Acc
ount
Num
ber
of E
xpire
d G
rant
A
war
ds w
ith
Und
isbu
rsed
O
blig
atio
ns
Und
isbu
rsed
O
blig
atio
ns
for
Expi
red
Gra
nt A
war
ds
Tota
l U
nobl
igat
ed
Bal
ance
in
Bud
get
Acc
ount
Num
ber
of E
xpire
d G
rant
A
war
ds w
ith
Und
isbu
rsed
O
blig
atio
ns
Und
isbu
rsed
O
blig
atio
ns
for
Expi
red
Gra
nt A
war
ds
Tota
l U
nobl
igat
ed
Bal
ance
in
Bud
get
Acc
ount
NO
AA
(co
ntin
ued)
2055
Fish
erie
s D
isas
ter
Ass
ista
nce,
NO
AA
, C
omm
erce
$ –
$
78
$ 15
9$
– $
1,
136
$ 4,
358
4316
Dam
age
Ass
essm
ent a
nd
Res
tora
tion
Rev
olvi
ng
Fund
, NO
AA
1 1
19,6
78
2,
686
118
,529
25
1
66,4
60
5139
Prom
ote
and
Dev
elop
Fi
sher
y Pr
oduc
ts a
nd
Res
earc
h Pe
rtai
ning
to
Am
eric
an F
ishe
ries,
NO
AA
228
3,70
6
455
2,41
47
1,0
83
5284
Lim
ited
Acc
ess
Syst
em
Adm
inis
trat
ion
Fund
, NO
AA
–
16,
197
52
13,
731
552
12,
055
5362
Envi
ronm
enta
l Im
prov
emen
t and
R
esto
ratio
n Fu
nd, N
OA
A
– 8,
222
1,2
98
–
–
705
5439
Wes
tern
Pac
ific
Sust
aina
ble
Fish
erie
s Fu
nd,
NO
AA
–
17
–
41
8
– 90
Tota
l 3
57 1
6,66
2 8
91,1
28
292
16
,324
78
0,03
6 3
06
13,
486
808
,435
NTI
A05
50Sa
larie
s an
d Ex
pens
es,
NTI
A, C
omm
erce
9
30,8
74
– 3
9,42
3
– 29
,523
0551
Publ
ic Te
leco
mm
unic
atio
n Fa
cilit
ies,
Pla
nnin
g an
d C
onst
ruct
ion,
NTI
A,
Com
mer
ce39
85
2 3
9 9
03 4
93
5
0554
Bro
adba
nd Te
chno
logy
O
ppor
tuni
ties
Prog
ram
, R
ecov
ery
Act
, NTI
A,
Com
mer
ce
– 1
69,7
8480
,291
1
68,8
50
–
166
,725
4358
Net
wor
k C
onst
ruct
ion
Fund
, NTI
A, C
omm
erce
15
4 5
,539
,480
–
–
–
–
Tota
l7
202
5,74
0,99
0 1
1
80,3
30 2
09,1
76
41
4 1
97,1
83
Tota
l 5
25
$
19,2
64
$ 7,
130,
251
546
$
12
4,55
0 $
1,50
9,72
4 5
33
$
30,6
22 $
1,32
0,15
4
(con
tinue
d fr
om p
revi
ous
page
)
156 | FY 20 17 AGENCY F I NANC IAL REPORT
UND ISBURSED BALANCES I N EXP IRED GRANT ACCOUNTS

A AAC Activity Address Code
AFR Agency Financial Report
APG Agency Priority Goal
ASAP Automated Standard Application for Payments
B BEA Bureau of Economic Analysis
BIS Bureau of Industry and Security
C CBS Commerce Business Systems
CEIP Coastal Energy Impact Program (a NOAA direct loan program)
CFO Chief Financial Officer
CFO/ASA Chief Financial Officer and Assistant Secretary for Administration (DM)
CFR Code of Federal Regulations
CMP Civil Monetary Penalty
COTS Commercial off-the-shelf [software]
CPI Consumer Price Index
CSRS Civil Service Retirement System (OPM)
D DATA Act Digital Accountability and Transparency Act of 2014
DM Departmental Management
DM&R Deferred Maintenance and Repairs
DOI U.S. Department of the Interior
DOL U.S. Department of Labor
E E2 Employee Travel System, version 2 or E2 Solutions (travel management system)
EDA Economic Development Administration
EPP Educational Partnership Program (NOAA)
ERM Enterprise Risk Management
ES Enterprise Services
ESA Economics and Statistics Administration
F FASAB Federal Accounting Standards Advisory Board
FCA Facility Condition Assessment (NIST and NOAA)
FCC Federal Communications Commission
GLOSSARY OF ACRONYMSAbbreviation Title
FY 20 17 AGENCY F I NANC IAL REPORT | 157
GLOSSARY OF ACRONYMS
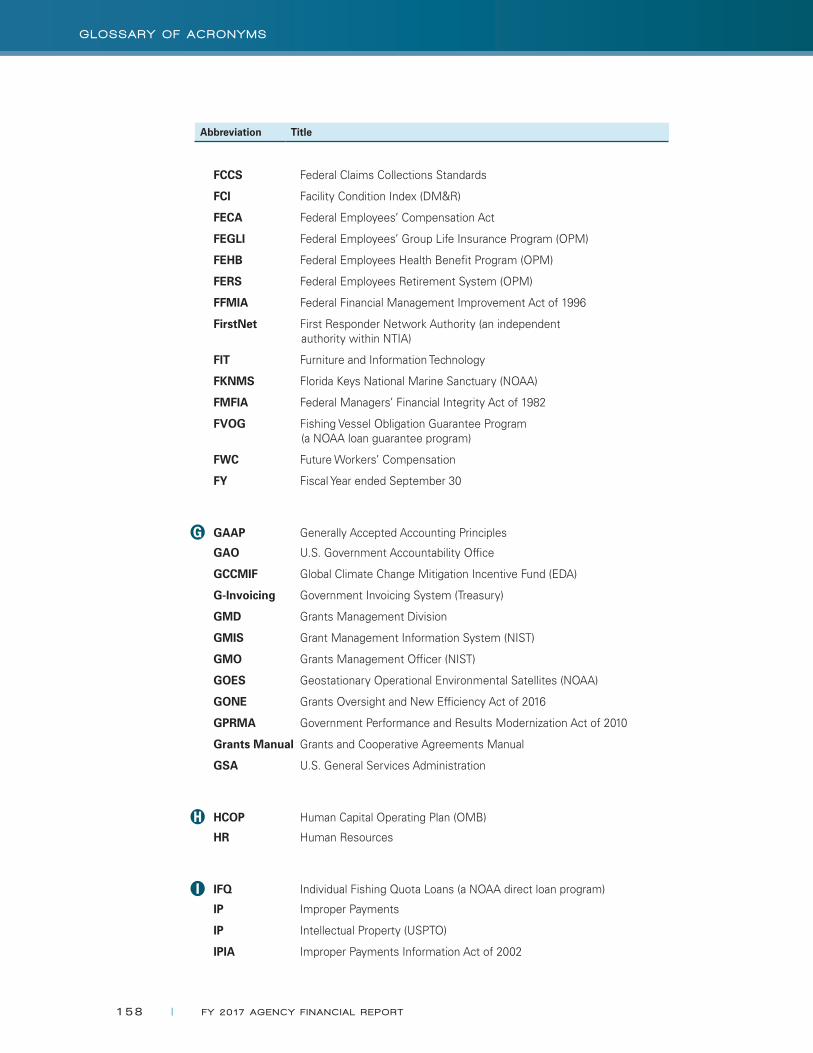
FCCS Federal Claims Collections Standards
FCI Facility Condition Index (DM&R)
FECA Federal Employees’ Compensation Act
FEGLI Federal Employees’ Group Life Insurance Program (OPM)
FEHB Federal Employees Health Benefit Program (OPM)
FERS Federal Employees Retirement System (OPM)
FFMIA Federal Financial Management Improvement Act of 1996
FirstNet First Responder Network Authority (an independent authority within NTIA)
FIT Furniture and Information Technology
FKNMS Florida Keys National Marine Sanctuary (NOAA)
FMFIA Federal Managers’ Financial Integrity Act of 1982
FVOG Fishing Vessel Obligation Guarantee Program (a NOAA loan guarantee program)
FWC Future Workers’ Compensation
FY Fiscal Year ended September 30
G GAAP Generally Accepted Accounting Principles
GAO U.S. Government Accountability Office
GCCMIF Global Climate Change Mitigation Incentive Fund (EDA)
G-Invoicing Government Invoicing System (Treasury)
GMD Grants Management Division
GMIS Grant Management Information System (NIST)
GMO Grants Management Officer (NIST)
GOES Geostationary Operational Environmental Satellites (NOAA)
GONE Grants Oversight and New Efficiency Act of 2016
GPRMA Government Performance and Results Modernization Act of 2010
Grants Manual Grants and Cooperative Agreements Manual
GSA U.S. General Services Administration
H HCOP Human Capital Operating Plan (OMB)
HR Human Resources
I IFQ Individual Fishing Quota Loans (a NOAA direct loan program)
IP Improper Payments
IP Intellectual Property (USPTO)
IPIA Improper Payments Information Act of 2002
Abbreviation Title
158 | FY 20 17 AGENCY F I NANC IAL REPORT
GLOSSARY OF ACRONYMS
Abbreviation Title
ISO Information Services Office (NIST)
IT Information Technology
ITA International Trade Administration
IUS Internal Use Software
J JPSS Joint Polar Satellite System (NOAA)
M MBDA Minority Business Development Agency
MD&A Management’s Discussion and Analysis
MRB Milestone Review Board
MSI Minority Serving Institutions (EPP)
N NERR National Estuarine Research Reserves (NOAA)
NESDIS National Environmental Satellite, Data, and Information Service (NOAA)
NFC National Finance Center (U.S. Department of Agriculture)
NHTSA National Highway Traffic Safety Administration (U.S. Department of Transportation)
NIST National Institute of Standards and Technology
NMFS National Marine Fisheries Service (NOAA)
NOAA National Oceanic and Atmospheric Administration
NPSBN Nationwide Public Safety Broadband Network (NTIA)
NTIA National Telecommunications and Information Administration
NTIS National Technical Information Service
O OAM Office of Acquisition Management (DM)
OAR Office of Oceanic and Atmospheric Research (NOAA)
OIG Office of Inspector General (DM)
OMB Office of Management and Budget
OPM U.S. Office of Personnel Management
OS Office of the Secretary (DM)
P P3 Public–Private Partnership
PAR Position Action Request
PEP Partnership Education Program (NOAA)
PIFSC Pacific Islands Fisheries Science Center (NOAA)
PP&E Property, Plant, and Equipment
PYSO PIFSC Young Scientist Opportunity (NOAA)
FY 20 17 AGENCY F I NANC IAL REPORT | 159
GLOSSARY OF ACRONYMS

R RAMI Revitalize American Manufacturing and Innovation Act of 2014
R&D Research and Development
S S&E Salaries and Expenses (DM)
SBR Combined Statement of Budgetary Resources
SCNP Consolidated Statement of Changes in Net Position
SF 425 Standard Form 425, Federal Financial Report
SFFAS Statement of Federal Financial Accounting Standards (FASAB)
SPRI Strategic Plan Review and Implementation
STAR Center for Satellite Applications and Research (NESDIS)
STC Standard Terms and Conditions
T Treasury U.S. Department of the Treasury
TROR Treasury Report on Receivables
TSP Thrift Savings Plan
U U.S.C. United State Code
USDA U.S. Department of Agriculture
USPTO U.S. Patent and Trademark Office
W WCF Working Capital Fund (DM)
WHSA Woods Hole Science Aquarium (NOAA)
WIPO World Intellectual Property Organization
Abbreviation Title
160 | FY 20 17 AGENCY F I NANC IAL REPORT
GLOSSARY OF ACRONYMS

CERTIFICATE OF EXCELLENCE IN ACCOUNTABILITY REPORTING
In May 2017, the U.S. Department of Commerce received the Certificate of Excellence in Accountability
Reporting (CEAR) from the Association of Government Accountants (AGA) for its Fiscal Year 2016 Agency Financial Report. The CEAR Program was established by the AGA, in conjunction with the Chief Financial Officers Council and the U.S. Office of Management and Budget, to improve the effectiveness of financial and program accountability reporting.
Certificate of Excellence inAccountability Reporting®
presented to the
in recognition of outstanding effort in preparing the Agency Financial Report for the fiscal year ending September 30, 2016.
®
Ann M. Ebberts, MS, PMPChief Executive Officer, AGA
Diane L. Dudley, CGFM, CPA Chair, CEAR Board
U.S. Department of Commerce
This Agency Financial Report was prepared with the energies and talents of many Department of Commerce employees. To these individuals, the Office of Financial Management would like to offer our sincerest appreciation and recognition.
In particular, we would like to recognize the following organizations for their contributions:
The bureau finance offices, Office of the Secretary, Office of the Chief Financial Officer and Assistant Secretary for Administration, Office of Inspector General, Office of Acquisition Management, Office of Budget, Office of Human Resources Management, Office of Performance, Evaluation, and Risk Management, Office of Public Affairs, and Office of Facilities and Environmental Quality/Office of Real Property Programs.
We also offer special gratitude and recognition to The DesignPond for their outstanding contributions in the design and production of this report.
ACKNOWLEDGEMENTS

U.S. DEPARTMENT OF COMMERCE
1401 Constitution Avenue NW
Washington, DC 20230
(202) 482-2000
www.commerce.gov