Embed Size (px)
Citation preview

Agencies That Provide Transportation
1. Agency Name
ResponseBrightStar Lifecare
Broomfield Easy Ride
Broomfield United Methodist Church
Imagine!
RTD Senior Ride
Regional Transportation District
Seniors' Resource Center
4. What types of clients does your agency serve (please check all that apply)?
Value Count PercentOlder adults 7 100.0%
Individuals with mental health issues 6 85.7%

People with disabilities 6 85.7%
Individuals with economic challenges 4 57.1%
Children 4 57.1%
Families 3 42.9%
Youth 3 42.9%
Other 1 14.3%
Homeless individuals 1 14.3%
StatisticsTotal Responses 7
Open-Text Response Breakdown for "Other" CountLeft Blank 6
Adams County under 60 with mobility impairment 1
5. Which best describes your agency:
Value Cou Percen

nt tProvides transportation services (possibly as one service of your agency to clients). 7 100.0%
Does not provide transportation, but serves clients who need transportation. 0 0.0%
StatisticsTotal Responses 7
6. How many unduplicated clients does your agency serve per year?
Response100,000s
2000
225
2800
500
N/A
unduplicated clients?
7. Which of the following best describes your agency? Please check all that apply:

Value Count PercentNon-profit organization 3 42.9%
Public transit, 3 42.9%
Residential Facility (independent and/or assisted living) 1 14.3%
Faith-based organization 1 14.3%
Specialized transportation 1 14.3%
Medicaid transportation 1 14.3%
Private, for profit 1 14.3%
Volunteer Driver Program 1 14.3%
Other 0 0.0%
Taxi cab provider 0 0.0%
School 0 0.0%
StatisticsTotal Responses 7
Open-Text Response Breakdown for "Other" CountLeft Blank 7

8. Please indicate: (1) The days and hours that your transportation services are available (if you offer service 24 hrs/day, 7 days/wk, please mark 24/7 in Sunday only); (2) During regular hours of operation, any "down" times when some of your vehicles are regularly not in use. In the Comments section below, please specify any other special hours of operation.
Opening Time
Closing Time
Start "Down" Time
End "Down" Time
Responses
Sunday 80.0%4
20.0%1
20.0%1
20.0%1 5
Monday 100.0%3
100.0%3
33.3%1
33.3%1 3
Tuesday 100.0%3
100.0%3
33.3%1
33.3%1 3
Wednesday
100.0%3
100.0%3
33.3%1
33.3%1 3
Thursday 100.0%3
100.0%3
33.3%1
33.3%1 3
Friday 100.0%3
100.0%3
33.3%1
33.3%1 3
Saturday 50.0%1
50.0%1
50.0%1
50.0%1 2
Holidays 50.0%1
0.0%0
50.0%1
50.0%1 2
Comments
ResponseApproximately 5:00 AM - 1:00 AM every day, but varies by route.
Saturday 9-3 starts in April
Prefer 24-48 hours notice for transportation needs. 11PM-6am require additional service charge.
Senior Shopper buses only runs M-F. There are 4 buses and 5 on Thursday. One out of Boulder. There are no Shopping buses on Major Holidays. We don't offer service on
The only regular transportation service BUMC provides is a van service taking people to worship services and back home afterwards.

ResponseAbove refers to service in group homes and residential services. Other services for other clients are both 5 days per week and 7 days per week.
These are our core hours, however the vehicles are often used for Recreation trips during "down" times
9. What are the hours of operation for your reservations and/or customer services (if you operate 24 hours a day, 7 days a week, choose “24 Hours” in ONLY the Sunday row)?
Opening Time Closing Time Responses
Sunday 100.0%2
0.0%0 2
Monday 100.0%4
100.0%4 4
Tuesday 100.0%4
100.0%4 4
Wednesday 100.0%4
100.0%4 4
Thursday 100.0%4
100.0%4 4
Friday 100.0%4
100.0%4 4
Saturday 100.0%1
0.0%0 1
Holidays 100.0%1
0.0%0 1
Please specify any special hours 100.0%1
100.0%1 1
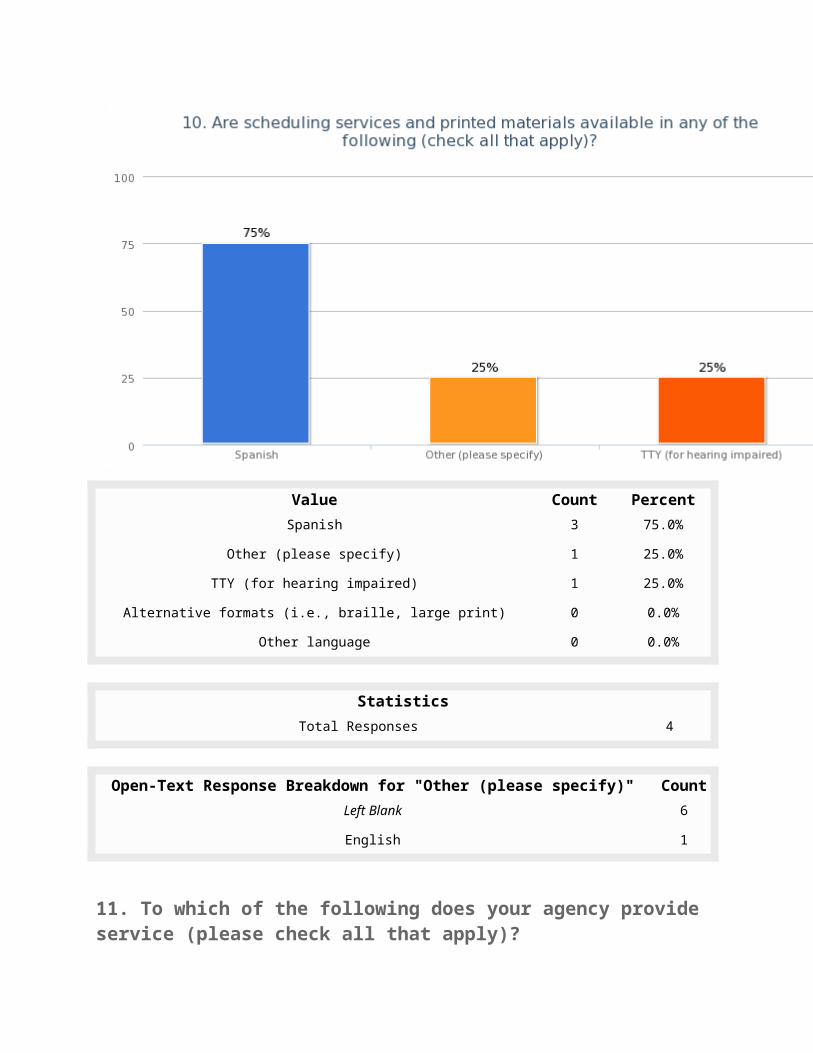
10. Are scheduling services and printed materials available in any of the following (check all that apply)?

Value Count PercentSpanish 3 75.0%
Other (please specify) 1 25.0%
TTY (for hearing impaired) 1 25.0%
Alternative formats (i.e., braille, large print) 0 0.0%
Other language 0 0.0%
StatisticsTotal Responses 4
Open-Text Response Breakdown for "Other (please specify)" CountLeft Blank 6
English 1
11. To which of the following does your agency provide service (please check all that apply)?
Value Count PercentAdults 60+ 6 85.7%
Americans with Disabilities Act (ADA) 5 71.4%
Non-ADA eligible individuals with disabilities 5 71.4%
General public 4 57.1%
Low Income 4 57.1%
Other (please specify) 2 28.6%
Youth 2 28.6%
Only participants in our program or living facility (i.e. clients only) 1 14.3%
Please specify any restrictions or eligibility requirements 0 0.0%
StatisticsTotal Responses 7
Open-Text Response Breakdown for "Other (please specify)" CountLeft Blank 5
Private pay 1
VA 1

Open-Text Response Breakdown for "Other (please specify)" CountOpen-Text Response Breakdown for "Please specify any restrictions or
eligibility requirements"Coun
tLeft Blank 7
12. Please describe your service area. Include any exceptions or waivers within those boundaries (i.e., boundaries of origins and destinations; within X number of miles from a community; specific streets/intersections; within county only; origin within county).
Response160th - North C-470 - South western foothills - west Tower Road - East
Boulder and Broomfield County, Arvada at about hwy 70 north to Longmont and surrounding areas
Broomfield and Boulder counties
Denver metro area
Only in the RTD district
Transportation services to worship services are provided on a fixed route which includes several senior living facilities in the Broomfield and Westminster communities. BUMC also provides transportation for youth from the church to various scheduled activities as needed.
For non-medical trips, our service is restricted to Broomfield County. For medical trips, our service boundary is McCaslin to the west, Baseline to the north, 80th Ave. to the south, and Washington St. to the east.
13. Indicate your service descriptors (please check all that apply):

Value Count
Percent
Door-to-Door 5 71.4%
Shared rides 4 57.1%
Subscription service (ongoing regular trips scheduled in advance, without the need to call before each trip). 4 57.1%
Same day service 4 57.1%
Individual rides 4 57.1%
Package/Grocery Assistance 4 57.1%
Personal assistant allowed to travel with client 4 57.1%
Door-through-Door 4 57.1%
Other (please identify): 3 42.9%
Curb-to-curb 3 42.9%
Children allowed to travel with client 2 28.6%
Fixed Route 2 28.6%
StatisticsTotal Responses 7

Open-Text Response Breakdown for "Other (please identify):" CountLeft Blank 4
Can't guarantee same day service but will let client know if unable to provide 1
Our transportation services are directly related to the needs of our contracted clients 1
escort over 12 yrs old 1
14. What trip purposes or destinations does your agency allow (please check all that apply):
Value Count
Percent
Any trip purpose (skip to next question). 4 57.1%
Medical appointments 1 14.3%
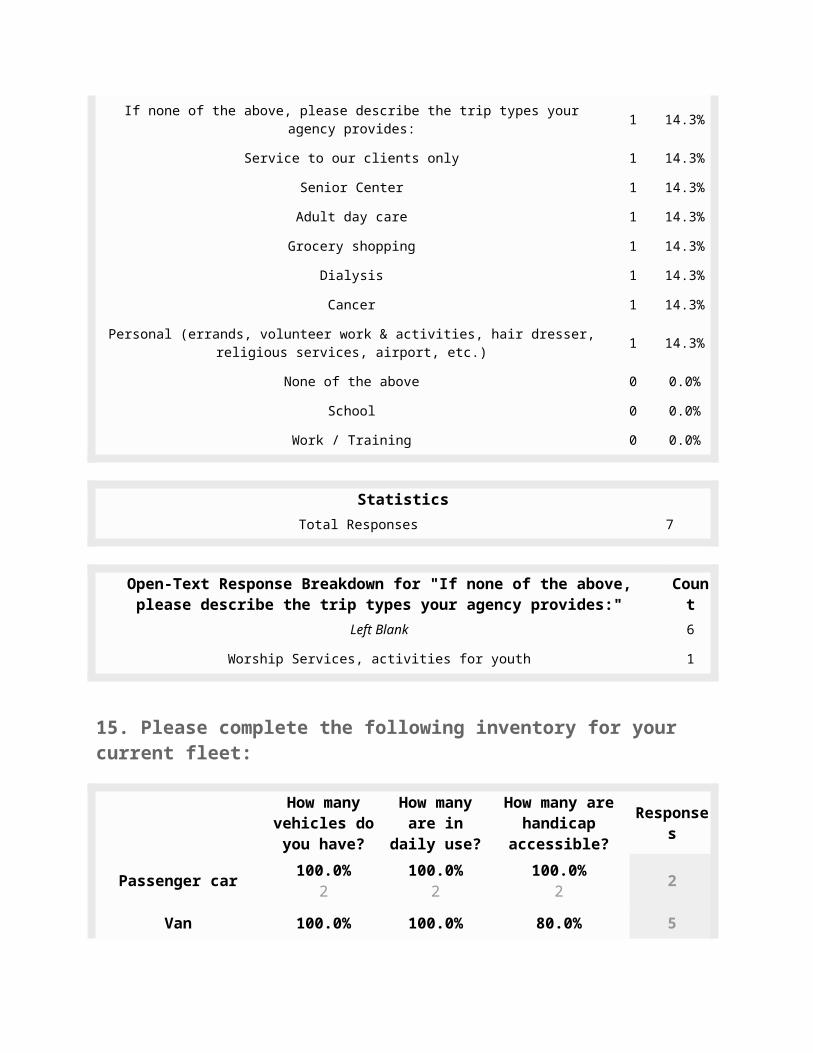
If none of the above, please describe the trip types your agency provides: 1 14.3%
Service to our clients only 1 14.3%
Senior Center 1 14.3%
Adult day care 1 14.3%
Grocery shopping 1 14.3%

Dialysis 1 14.3%
Cancer 1 14.3%
Personal (errands, volunteer work & activities, hair dresser, religious services, airport, etc.) 1 14.3%
None of the above 0 0.0%
School 0 0.0%
Work / Training 0 0.0%
StatisticsTotal Responses 7
Open-Text Response Breakdown for "If none of the above, please describe the trip types your agency provides:"
Count
Left Blank 6
Worship Services, activities for youth 1
15. Please complete the following inventory for your current fleet:
How many vehicles do you have?
How many are in daily
use?
How many are handicap
accessible?Response
s
Passenger car 100.0%2
100.0%2
100.0%2 2
Van 100.0%5
100.0%5
80.0%4 5
Bus 100.0%4
100.0%4
100.0%4 4
SUV 100.0%2
50.0%1
50.0%1 2
Other (please identify in the Comments box
below)0.0%
00.0%
00.0%
0
Comments
ResponseBroker with access to 16 other vehicles most are sedans, also voucher for RTD
Senior Ride only has up to 10 buses per event.
We are a Home Health Care agency who provides transportation as one of our services. All caregivers use their personal vehicles.
16. Which of the following does your agency accommodate (please check all that apply):
Value Count PercentWalker 6 85.7%
Oxygen tank 6 85.7%
Manual wheelchair 6 85.7%
Scooters 5 71.4%
Power wheelchair 5 71.4%
Service animal 3 42.9%
None of the above 1 14.3%
Other 0 0.0%

Bariatric services 0 0.0%
Stretchers 0 0.0%
Segway 0 0.0%
StatisticsTotal Responses 7
Open-Text Response Breakdown for "Other " CountLeft Blank 7
17. Please indicate the number of drivers in each of the following categories:
Number of Drivers
Responses
Your organization's total number of drivers. 100.0%7 7
Paid 100.0%4 4
Paid CDL 100.0%3 3
Volunteer 100.0%2 2
Other 0.0%0
From all drivers, how many have non-driver responsibilities?
100.0%5 5
18. Do you provide driver training?

Value Count
Percent
No 1 14.3%
Yes (please provide a description of content and duration in the Comments section below): 6 85.7%
StatisticsTotal Responses 7
Comments
ResponseCDL and extensive driver training
Lg veh training - 1/2 day Accessible veh training - 1 day Client care training - ongoing
PASS, Def Driving, Drug Alcohol, blood Borne path.
Through CIRSA
We provide an orientation for drivers, but the vans do not require a CDL and specialized training is not needed.

19. How do you maintain your vehicles (please check all that apply)?
Value Count PercentIn house 4 57.1%
Contract 2 28.6%
Other 1 14.3%
StatisticsTotal Responses 7
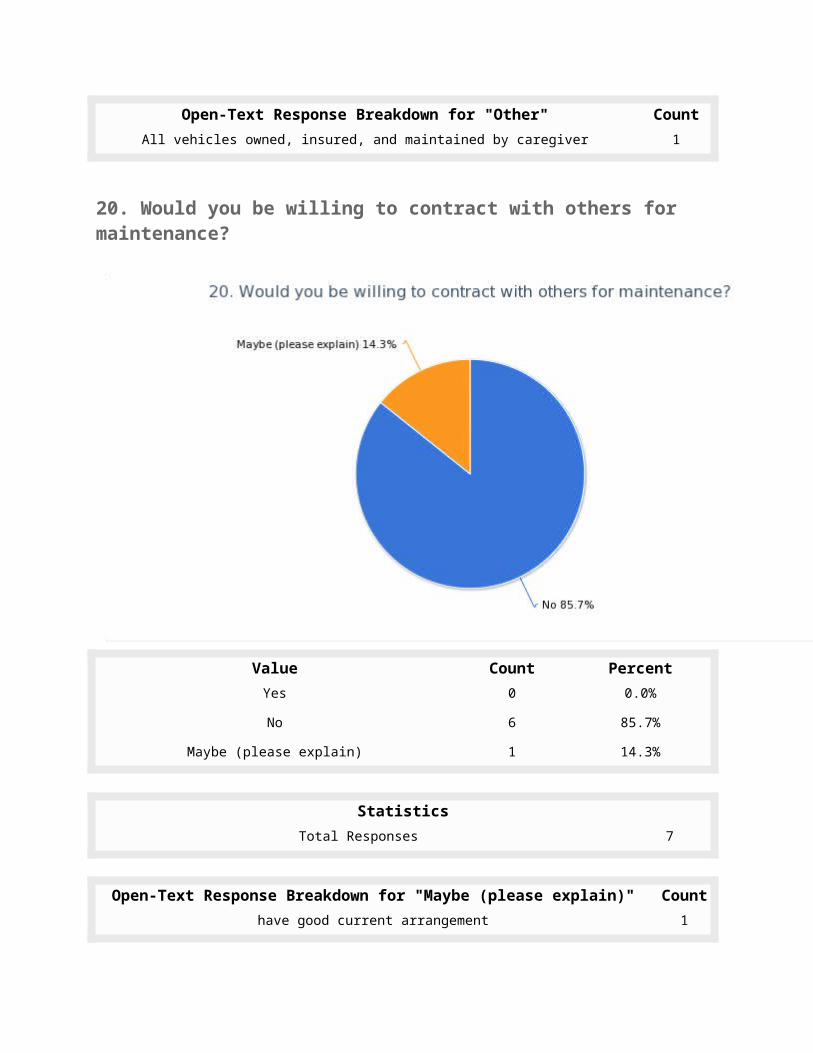
Open-Text Response Breakdown for "Other" CountLeft Blank 6
All vehicles owned, insured, and maintained by caregiver 1
20. Would you be willing to contract with others for maintenance?

Value Count PercentYes 0 0.0%
No 6 85.7%
Maybe (please explain) 1 14.3%
StatisticsTotal Responses 7
Open-Text Response Breakdown for "Maybe (please explain)" Counthave good current arrangement 1
21. Would you be willing to share maintenance schedules and driver training materials with others?

Value Count PercentYes, both 3 42.9%
No, neither 2 28.6%
Yes, driver training only 1 14.3%
Yes, maintenance schedules only 0 0.0%
Maybe (please explain) 1 14.3%
StatisticsTotal Responses 7
Open-Text Response Breakdown for "Maybe (please explain)" CountDon't know if it is feasible 1
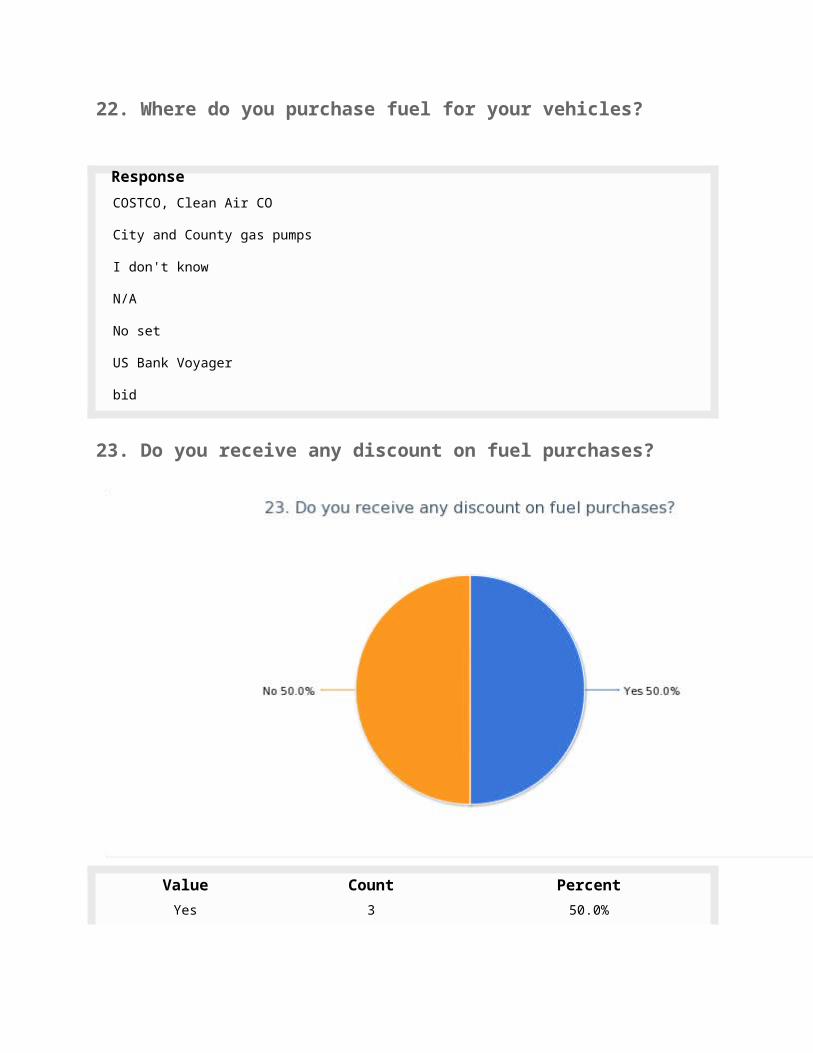
22. Where do you purchase fuel for your vehicles?
ResponseCOSTCO, Clean Air CO
ResponseCity and County gas pumps
I don't know
N/A
No set
US Bank Voyager
bid
23. Do you receive any discount on fuel purchases?
Value Count PercentYes 3 50.0%
No 3 50.0%
StatisticsTotal Responses 6
24. Please indicate the level of your insurance coverage for:

Level of your insurance coverage Responses
Personal Injury per Person 100.0%6 6
Personal Injury per Accident 100.0%6 6
25. What is the average cost/vehicle for insurance (please feel free to elaborate in the comment box below):
Response$3800
?
N/A
unsure
26. With whom do you carry insurance (County/City, Company (please name), other):
ResponseCIRSA
I don't know which insurance?
IMA - Broker
Philadelphia Ins
unsure
27. Does your agency charge for trips?
Value Count Percent
No (Skip to Question 28) 3 42.9%
Yes (please describe your fare structure in the Comments section below:) 4 57.1%
StatisticsTotal Responses 7
Comments
ResponseIncluded in client service
Local $2.25; Express $4.00; Regional $5.00; ADA double these; discount is half these
Donation basis $1 within Broomfield RT $3 to Rock Creek RT $6 all other out of Broomfield medical trips RT
28. How do passengers pay for trips (please check all that apply):

Value Count Percent
Other (please describe): 3 60.0%
Passenger pays driver with cash. 2 40.0%
Passenger pays driver with voucher or other noncash form of payment. 2 40.0%
Medicaid accepted as payment. 1 20.0%
Passenger pays driver with credit card. 0 0.0%
StatisticsTotal Responses 5
Open-Text Response Breakdown for "Other (please describe):" CountLeft Blank 4
Passenger pays agency with credit card prior to service 1
Passenger pays driver with check 1
other and state aid 1

29. Please indicate which of the following transportation funding resources your organization receives:
Value Count PercentFTA (Federal Transit Administration) 5 83.3%
Local Transit Assistance (counties and cities) 4 66.7%
Fundraising 3 50.0%
State Transit Assistance 3 50.0%
Older Americans, Title IIIB Funding 2 33.3%
Contract Revenue 2 33.3%
Community Services Block Grant 2 33.3%
Fares 2 33.3%
Medicaid, Title XIX 1 16.7%
Administration on Developmental Disabilities 1 16.7%
Social Services block grant, Title XX 1 16.7%
Other State and Local Programs (please identify) 0 0.0%
Head Start 0 0.0%
Other Federal Programs 0 0.0%

StatisticsTotal Responses 6
Open-Text Response Breakdown for "Other Federal Programs" CountLeft Blank 7
Open-Text Response Breakdown for "Other State and Local Programs (please identify)"
Count
Left Blank 7
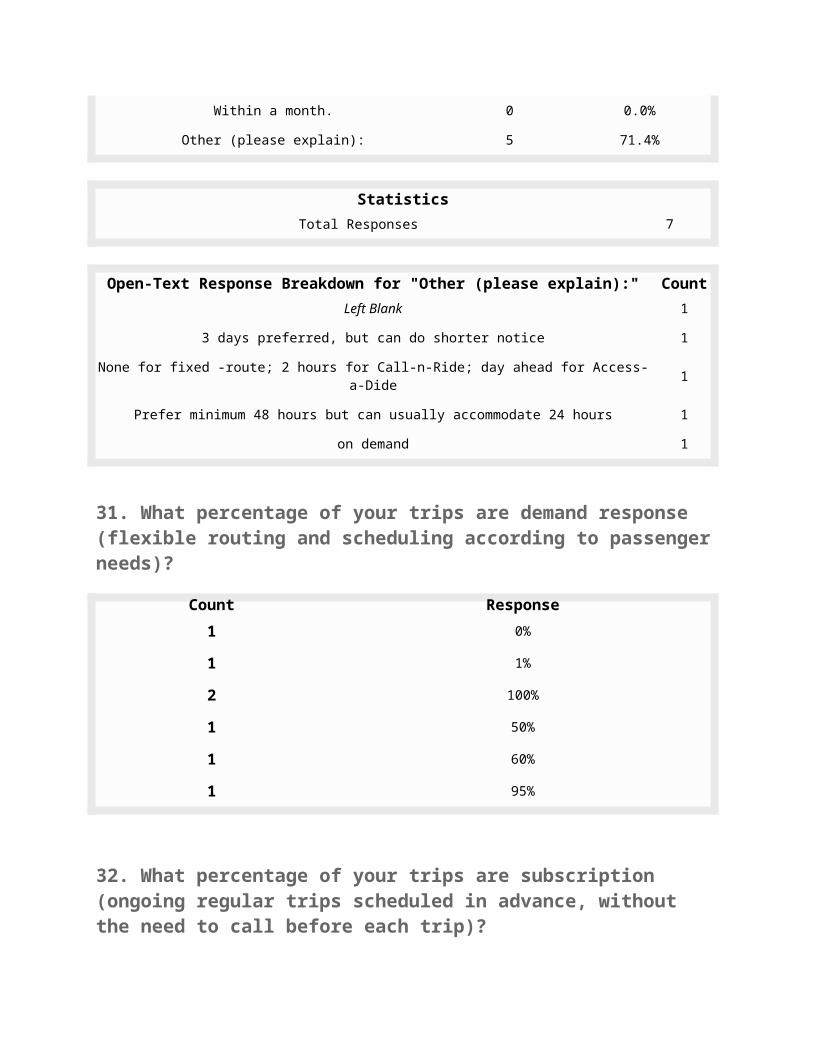
30. How far in advance do clients need to call to schedule a trip?
Value Count PercentWithin an hour. 0 0.0%
Within a day. 1 14.3%
Within a week. 1 14.3%
Within 2 weeks. 0 0.0%
Within a month. 0 0.0%
Other (please explain): 5 71.4%

StatisticsTotal Responses 7
Open-Text Response Breakdown for "Other (please explain):" CountLeft Blank 1
3 days preferred, but can do shorter notice 1
None for fixed -route; 2 hours for Call-n-Ride; day ahead for Access-a-Dide 1
Prefer minimum 48 hours but can usually accommodate 24 hours 1
on demand 1
31. What percentage of your trips are demand response (flexible routing and scheduling according to passenger needs)?
Count Response1 0%
1 1%
2 100%
1 50%
1 60%
1 95%
32. What percentage of your trips are subscription (ongoing regular trips scheduled in advance, without the need to call before each trip)?
Count Response1 0%
1 1%
2 100%
1 40%
1 5%
1 50%

33. Please indicate your interest in the coordination of transportation services and resources (please check all that apply):
Value Count
Percent
Joint driver training 4 100.0%
Centralized scheduling of passenger trips with other agency’s trip scheduling 2 50.0%
Joint use, pooling, or sharing vehicles among agencies 2 50.0%
Centralized fueling of vehicles 2 50.0%
Contracting to provide other transportation service to other agencies needing service 2 50.0%
Purchasing vehicles cooperatively 2 50.0%
All of the above! 1 25.0%
Centralized maintenance service for vehicles 1 25.0%
Sharing drivers among agencies 1 25.0%
Contracting to purchase transportation services rather than continuing to operate own 1 25.0%
Statistics

Total Responses 4
34. What growth trend in transportation requests has your agency seen in the last 5 years (2008-2013)?
Value Count
Percent
There has been no increase or there has been a decrease in demand (please identify reasons, then skip to question #35). 2 33.3%
1-9% 1 16.7%
10-19% 2 33.3%
20-29% 0 0.0%
30-39% 1 16.7%
40-49% 0 0.0%
50-59% 0 0.0%
60-69% 0 0.0%
70-79% 0 0.0%
80-89% 0 0.0%
90-100% 0 0.0%
More than 100% 0 0.0%
StatisticsTotal Responses 6
Sum 50.0
Avg. 16.7
StdDev 9.4
Max 30.0
Open-Text Response Breakdown for "There has been no increase or there has been a decrease in demand (please identify reasons, then skip to
question #35)."Coun
t
Left Blank 1
Not tracked as such 1
35. What factors have influenced increases in requests for your service (please check all that apply):

Value Count PercentAging population 4 66.7%
RTD service changes 3 50.0%
Poor service/customer satisfaction with another agency 2 33.3%
Cost of fuel 1 16.7%
Other: 0 0.0%
StatisticsTotal Responses 6
Open-Text Response Breakdown for "Other:" CountLeft Blank 7
44. If you could change one thing about human service transportation what would it be, and why?
ResponseContinue efforts for affordability for all
Increase service hours and boundaries
More open to all - funding enough to not worry about ...over 60? no just 59, too bad
There is nothing I could change
Provide more weekend opportunities and services for transportation. Weekend services are rather limited in our area.
45. Would you like to receive information on the results of this survey?

Value Count PercentYes 6 85.7%
No 1 14.3%
StatisticsTotal Responses 7
46. The Local Coordinating Council for Transportation fosters collaboration and coordination among transportation providers and those who need their services, especially elderly, people with disabilities and low income populations. We are looking for additional interested members. Please tell us if you/your organization is:

Value Count PercentA current member 4 57.1%
Interested in being a member - send me info! 1 14.3%
Interested in receiving regular updates 1 14.3%
Not interested at this time. 1 14.3%
StatisticsTotal Responses 7
47. Please share any final comments or suggestions:
ResponseThank you for looking at transportation needs. Our church has very limited transportation services. We find many people would benefit from greater services, especially those who are doing rehab at home and are not able to drive to medical appointments, etc.