Embed Size (px)
DESCRIPTION
AGEC 640 – Ag Development & Policy Measuring Impacts October 30 th , 2014. Today: Focus on Malawi’s subsidy program Readings: Chibwana, C. et al. (2014) “Measuring the Impacts of Malawi’s Farm Input Subsidy Program.” Forthcoming in African Journal of Agricultural and Resource Economics . - PowerPoint PPT Presentation
Citation preview

AGEC 640 – Ag Development & PolicyMeasuring ImpactsOctober 30th, 2014
Today: Focus on Malawi’s subsidy program
Readings:
Chibwana, C. et al. (2014) “Measuring the Impacts ofMalawi’s Farm Input Subsidy Program.” Forthcoming inAfrican Journal of Agricultural and Resource Economics.
Fisher, M. and G. Shively (2005) “Can Income Programs Reduce Tropical Forest Pressure? Income Shocks and Forest Use in Malawi.” World Development 33(7): 1115–1128.

Price
Quantity
S=MC
S=MC - σ
other
maize
labor
fert maize
fert
D

What do we know about input subsidies?
• Great for farmers(therefore popular with politicians)
• Expensive(therefore unpopular with donors)
• Problematic(therefore popular with researchers)

Issues surrounding fertilizer subsidies
• Is fertilizer a private good or a public good?
• Does public provision undermine or “crowd-out” the private sector?
• Do subsidies reach the intended beneficiaries?
• What are their short-run and long-run impacts?– Fertilizer use– Crop choice/land allocation– Unintended impacts (e.g. forests)

A dynamic perspective on what might be going on and why we should care
At+1 = At + f(At, Xt) – ct

Malawi’s 2009 FISP
• Program goal: maize self-sufficiency• Targeted 1.7 million farm households• Inputs:
– Maize fertilizer (NPK): 150,000 mt– Tobacco fertilizer: 20,000 mt– Maize seed (OPV + Hybrid): 4,750 mt– Cotton seed, legume seed, cotton chemicals
and grain storage pesticides• Program cost: US$221million
– 13.5% of national budget– 5.5% of GDP

FISP details
• Program delivered via voucher/coupon system“Typical” voucher – 100 kg fertilizer for maize (50 + 50)– 2 kg of improved seed (Hybrid or OPV)– 5.5% of GDP
• Distribution: Ministry of Agriculture District Officials Local chiefs Village heads and village development committees
Stated Targets: FHOH, residents, vulnerable
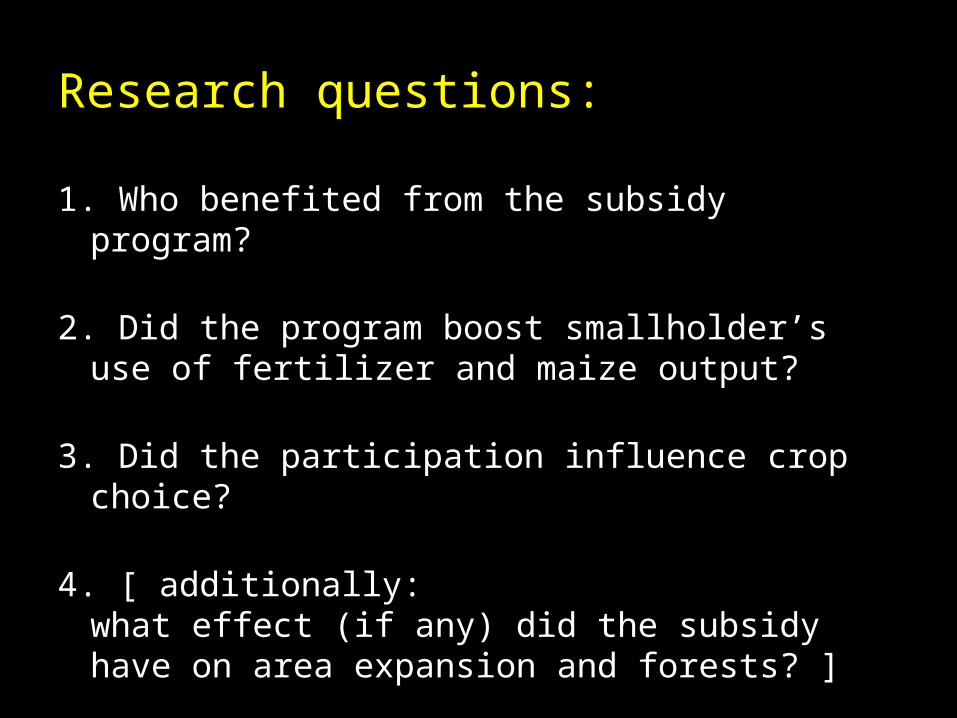
Research questions:
1. Who benefited from the subsidy program?
2. Did the program boost smallholder’s use of fertilizer and maize output?
3. Did the participation influence crop choice?
4. [ additionally: what effect (if any) did the subsidy have on area expansion and forests? ]

Data
• Household panel covering 2002, 2006, 2009
• Kasungu and Machinga Districts
• Approx. 400 respondents
Results presented here are primarily based on our 2009 survey, with some additional insights drawn from the 2002 and 2006 surveys.
IV estimation strategy

Sample statisticsVariable MeanAge 47Household size 6.3Land owned per HH (ha) 1.6Female-headed (1=yes) 0.15Net buyer of maize (1=yes) 0.73Education
None 15%Some primary 72%Some secondary 13%
Land shares MeanTraditional maize 0.38Improved maize 0.25Tobacco 0.06Other crops 0.31
21% of households in rural Malawi are female-headed. 13% of all coupon
recipients in sample were female-headed
Yields (kg/acre) MeanTraditional maize 1196Improved maize 1391
(National smallholder average: 1483)

Program participation
Category NoneSeed only
Fertilizer only
Seed & fertilizer
Male 0.12 0.06 0.18 0.64Female 0.21 0.04 0.25 0.50Poor 0.18 0.05 0.20 0.58Non-poor 0.09 0.06 0.18 0.67Male, non-poor 0.09 0.07 0.17 0.67Male, poor 0.16 0.06 0.18 0.60Female, non-poor 0.13 0.04 0.21 0.63Female, poor 0.28 0.03 0.28 0.41
Participation cannot be considered exogenous…
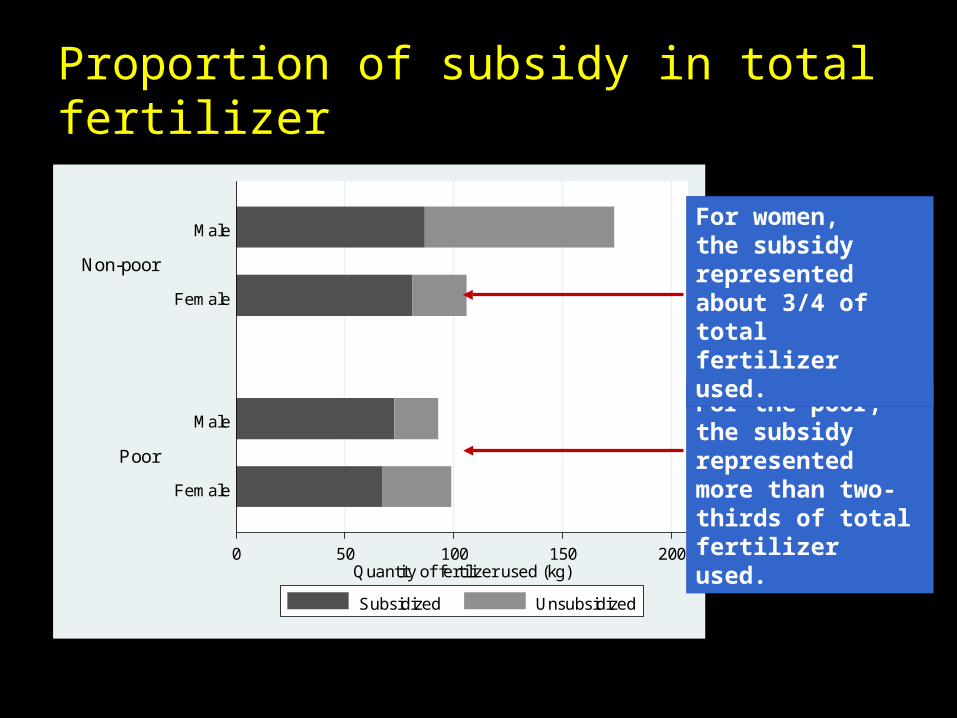
Proportion of subsidy in total fertilizer
0 50 100 150 200Quantity of fertilizer used (kg)
Poor
Non-poor
Female
Male
Female
Male
Subsidized Unsubsidized
For the poor, the subsidy represented more than two-thirds of total fertilizer used.
For women, the subsidy represented about 3/4 of total fertilizer used.
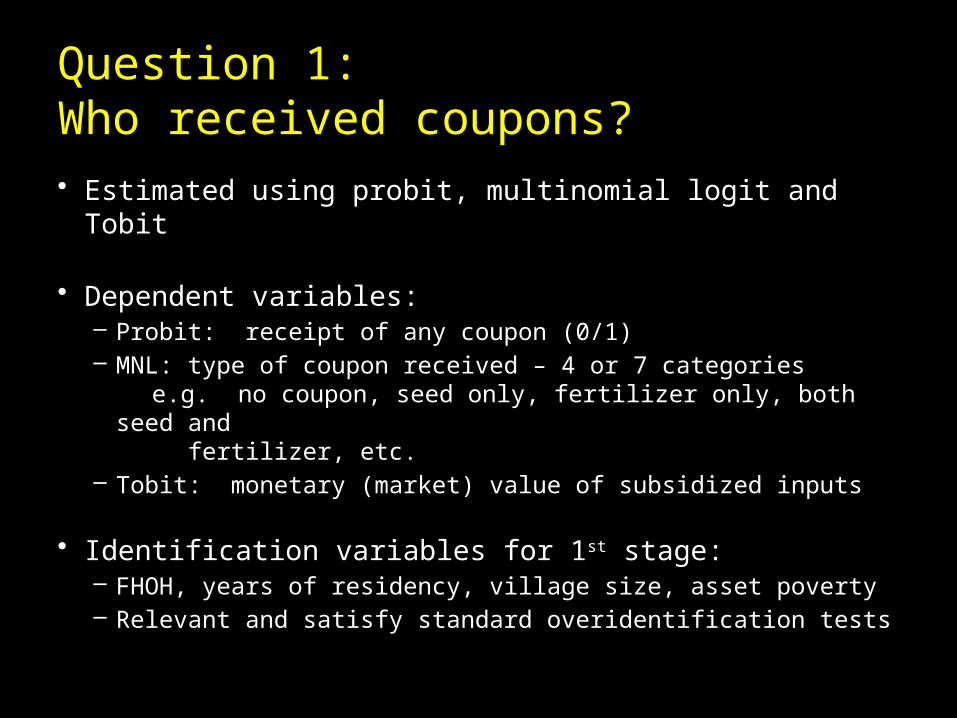
Question 1:Who received coupons?• Estimated using probit, multinomial logit and Tobit
• Dependent variables:– Probit: receipt of any coupon (0/1)– MNL: type of coupon received – 4 or 7 categories
e.g. no coupon, seed only, fertilizer only, both seed and fertilizer, etc.
– Tobit: monetary (market) value of subsidized inputs
• Identification variables for 1st stage:– FHOH, years of residency, village size, asset poverty– Relevant and satisfy standard overidentification tests

Findings for question 1
• Female-heads less likely to receive coupons
• Asset-poor HHs less likely to receive coupons
• Residency matters
• Village size does not matter(cf. Jayne – member of parliament matters!)

Question 2:Did coupons increase fertilizer use? • Estimation approach: IV /Tobit
• Dependent variable: fertilizer/ha
• Explanatory variables: – demographics, farm size, location – fertilizer-maize price ratio– idiosyncratic shocks– “instrumented” variable for receipt of coupon
• (either from MNL or direct 2SLS in the case of value)

Question 2:Did coupons increase fertilizer use?
Model 1Observed coupon
Model 2Instrumented
coupon
Model 3Instrumented w/ lagged fertilizer
Seed coupon only -4.214 -60.81 -50.54
100kg fertilizer 135.5 189.6* 161.82

Question 2:Did coupons increase fertilizer use?
Model 1Observed coupon
Model 2Instrumented
coupon
Model 3Instrumented w/ lagged fertilizer
Coupon value(100 Mk)
1.21* 0.97* 0.50*

Findings for question 2:
• positively correlated with coupon receipt
• Intensity falls with farm size
• positive correlation with use of improved maize
• net buyers of maize used less fertilizer
• adding 2002 and 2006 fertilizer intensity reduces point estimate for coupon by approximately 50%

Maize yield response to fertilizer
A
B
CD
500
1750
1000
1500
Yie
ld (k
g/ha
)
0 100 200 300Fertilization rate (kg/ha)
Traditional maize Improved maize
Marked points on the graph correspond to the following fertilizer-yield combinations:
A [114 kg/ha, 1302 kg/ha]B [165 kg/ha, 1245 kg/ha] C [136 kg/ha, 1373 kg/ha] D [175 kg/ha, 1477 kg/ha]

Question 3:Did the FISP influence land allocation?
• Estimation approach: 2SLS, SUR
• Dependent variable: land shares– traditional maize– hybrid maize– tobacco– other crops
ijijijijijijijk k
ikjkjij CFSWHppL
654321
3
2 1

Findings for question 3• Farmer response to price signals is weak
• Maize and “other crops” act as substitutes
• Maize and tobacco are complements
• Results robust to inclusion of 2006 fertilizer use
• Coupon for maize seed and fertilizer led to: – 16-22% more land to maize– 3-8% more land to tobacco– 20-26% less land to “other crops

Overall impact on maize, revisited
What is the total maize output gain associated with coupon receipt?
change in yield x ( 1 + change in maize area )
≈ 456 kg on average
about half of the gain is from seed, half from fertilizer
But... maize area comes at the expense of other crops displaced, and the value of the output of these other crops constitute about 50% of the average gain.

Overall impact on maize, revisited

Question 4:Any unintended consequences?• Approach: IV/Tobit
• Dependent variable: area of forest cleared – mean: 0.16 acres/household (including 0s)– 14% of sample reported forest clearing activity
• Explanatory variables: farm size, agricultural prices, forest access and control, shocks, coupon receipt variables

Findings for Question 4
• Farm size has a negative correlation with forest clearing
• Rates of clearing higher on private and communal forests
• Rates lower in presence of a Forest User Group(more likely to protect what is increasingly scarce?)
• Forest clearing not driven by higher agricultural output prices, at least in the short run
• Less forest clearing among recipients of maize coupons(no forest left to clear?)
• Derived demand for forest resources for tobacco(land less directly affected than timber for drying sheds)

Findings from Fisher and Shively

Findings from Fisher and Shively
Average value of SPS ≈ 450 Mk, so ≈ 1062 fewer hours, or drop of more than 50%.

Conclusions
• The FISP appears to have had a positive impact on fertilizer use and maize output in the survey year (450 kg gross (≈ half this net) = +25% boost)
• Accessing seed and fertilizer is much better than accessing fertilizer only
• Program seems to have increased land allocation to maize & tobacco at expense of other crops
• Did program help reduce forest pressure?– Probably (as with the SPS in 1999-2000)
but…there were some negative effects through tobacco

Implications
• Who should be subsidized?
• Targeting at the poor could be improved• Subsidies should be part of a comprehensive strategy to
improve agricultural productivity
• Too much emphasis on fertilizer? Package = 2kg maize seed and 100kg fertilizer• Half of observed gains came from improved seed• Improved seed delivery systems needed• Reinforce research and extension