Embed Size (px)
Citation preview

i
Age-Structure and Racial and Ethnic Disparities in Incarceration*
Matt Vogel1 Department of Sociology
University at Albany, SUNY
Lauren Porter Department of Sociology
University at Albany, SUNY
Key Words: Population Age Structure; Racial Disparities; Incarceration Word Count: 7,270
*Acknowledgements: Both authors contributed equally on this project. The Center for Social and Demographic Analysis of the University at Albany provided technical and administrative support for this research through a grant from the National Institute of Child Health and Human Development (R24-HD044943). This manuscript was presented at the 2012 meeting of the Population Association of America, in San Francisco, CA. Please note that this draft should not be distributed without permission of the authors.
1 Primary contact. Email: [email protected]. Phone: (518) 442 -5579.
ii
Age-Structure and Racial and Ethnic Disparities in Incarceration
Abstract:
There are marked disparities in incarceration rates across racial and ethnic groups in the United States. The risk of experiencing incarceration is also intricately linked with age, and there are striking differences in the age-distributions of non-Hispanic black, Hispanic, and non-Hispanic white populations. As such, the comparison of crude incarceration rates across groups may be problematic, since it obscures the contribution of population age-structure to overall incarceration rates. We apply standardization and decomposition procedures to data from the National Prisoners Statistics program and the U.S. Census to estimate the contribution of population age-structure to incarceration disparities. Results indicate that population age-structure accounts for roughly 20 percent of the Hispanic/non-Hispanic white disparity and 8 percent of the non-Hispanic Black/non-Hispanic white disparity.
1
1. INTRODUCTION
Criminologists have had a longstanding interest in understanding the causes and
consequences of racial/ethnic disparities in punishment (Sellin, 1935). At every stage of
criminal justice processing, blacks and Hispanics are overrepresented relative to their share of
the U.S. population. For instance, although blacks and Hispanics comprise roughly 30 percent of
the U.S. population, they account for 56 percent of all U.S. prisoners (Humes et al., 2011).
Black-white disparities are particularly alarming, with blacks incarcerated at six times the rate of
whites. Nonetheless, the Hispanic-non-Hispanic white disparity in incarceration is formidable as
well. Currently, Hispanics are incarcerated at roughly twice the rate of non-Hispanic whites
(Mauer and King, 2007).
In general, prior research puts forth two explanations for racial/ethnic disparities in
criminal justice involvement: (1) the disparities reflect true differences in the level of criminal
involvement across groups, or (2) the disparities reflect differential treatment by the criminal
justice system. In this study we consider a third possible explanation for the seeming
overrepresentation of blacks and Hispanics in the correctional population. On the one hand,
criminologists have long recognized age as a significant predictor of criminality, with offending
tending to peak during mid to late adolescence and declining thereafter (Steffensmeier et al.,
1989). At the same time, demographers have long understood the importance of age structure in
understanding population patterns, especially those pertaining to mortality and morbidity
(Kitagawa, 1955; 1964). We argue that age structure could also play a crucial role in shaping
racial/ethnic disparities in incarceration rates. Whereas most prior work compares crude rates
across black, white, and Hispanic populations (e.g. – Mauer and King, 2007), this approach may
be problematic because it assumes that all members of the population are at an equal risk of

2
experiencing imprisonment. In the U.S., age structures vary considerably across race/ethnicity, as
the Hispanic and black populations are younger on average than the white population.
In other words, a direct comparison of overall rates of criminal justice involvement across
race/ethnicity may be misleading because the Hispanic and black populations may have a greater
proportion of individuals who are “at risk” of incarceration. Thus, we provide a first attempt to
discern the contribution of population age-structure to racial and ethnic disparities in
incarceration. We draw on estimates from the National Prison Statistics program and the U.S.
census to adjust non-Hispanic black and Hispanic incarceration rates to the non-Hispanic white
age-structure in 2000 and 2010.2 We then employ a straightforward decomposition technique to
partition the observed racial disparities into two components: that attributable to differences in
population age structure and that attributable to all other sources of variation. Our results
demonstrate that population age-structure explains a non-trivial portion of the observed racial
and ethnic disparities in U.S. incarceration rates. Importantly, a greater proportion of the
difference between the white and Hispanic incarceration rates can be attributed to population
age-structure than the difference between black and white rates.
1. LITERATURE REVIEW 1.1 Racial and Ethnic Disparities in Punishment
Forty years ago John Hagan (1974) noted that studies on racial disparities in the criminal
justice system could be characterized as adopting either a “sociological” or “legalistic”
perspective. The most dominant perspective, he argued, was sociological because it emphasized
the role of extra-legal characteristics, such as race, in influencing sentencing decisions. Hagan
also described a conflicting legalistic perspective, which underscored the importance of legal 2 For simplicity’s sake, we use black, white, and Hispanic from this point on to refer to these population groups,
where black refers to non-Hispanic blacks and white refers to non-Hispanic whites.

3
criteria in predicting sentencing outcomes. According to this perspective, racial and ethnic
disparities in punishment simply reflect differences across groups with respect to the level and
severity of criminal involvement. After reviewing twenty studies on judicial sentencing
practices, Hagan concluded that prior work largely supported a legalistic perspective, noting that
“knowledge of extra-legal offender characteristics contributes relatively little to our ability to
predict judicial dispositions” (p.379).
Since Hagan’s review in 1974, criminologists have amassed an expansive amount of
empirical work on the causes of racial/ethnic disparities in incarceration and in sentencing more
broadly. Earlier work tended to align with Hagan’s conclusions, with scholars arguing that
observed racial differences mostly resulted from inadequate controls for legally relevant
sentencing criteria, such as prior record and the severity of the offense (Kleck, 1981). However,
more recent work has demonstrated that racial/ethnic disparities in punishment are apparent even
after controlling for legally relevant factors. After her comprehensive review of 40 studies,
Spohn (2000: 481-482) concludes that “earlier refutations of the discrimination thesis were
premature,” and “although it is irrefutable that the primary determinants of sentencing decisions
are the seriousness of the offense and the offender’s prior criminal record, race/ethnicity and
other legally irrelevant offender characteristics also play a role.”
Aggregate level analyses of incarceration patterns have reached similar conclusions.
These studies typically investigate whether incarceration disparities are explained by differential
involvement at the arrest level (legalistic reasons) or by differential treatment (extra-legal
factors). In a series of classic studies, Blumstein (1982; 1993) compared prison data to UCR
arrest data and found that between 75-80 percent of the disparity was due to higher arrest rates
among blacks. This percentage remained quite stable across studies, despite rapid increases in

4
imprisonment overall (see Walker et al., 2003). Mauer (2006) notes that the unexplained portion
(20-25 percent) “may be alarming in itself,” given the sheer number of racial minorities housed
in correctional facilities. In a more recent study, Tonry and Melewski (2008) analyzed data for
the 2004 correctional population and discovered that only 61 percent of the racial disparity could
be attributed to differences at the arrest stage. They conclude that the change between time
periods is primarily due to changes in drug sentencing policies, or the “war on drugs” in the mid-
1980s, which disproportionately impacted minority drug offenders. As Mauer (2006) observes,
blacks constituted 21 percent of all drug arrests in 1980, but constituted 32 percent in 1992,
despite self-report surveys indicating roughly similar rates of drug use across groups.
Criminological interest and research into racial disparities in punishment stretches back
nearly a century (Sellin, 1935). However, interest in ethnic disparities received little attention
until relatively recently. Like blacks, it is argued that a criminal stereotype is disproportionately
attached to Hispanics offenders. For example, Portillos (1998) argues that a young Hispanic male
tends to be perceived as a “gun wielding, drug selling gangbanger” (p.156). Public opinion polls
also show that whites associate increases in Hispanic and/or immigrant populations with
increases in crime rates (Pew Research Center, 2006; General Social Survey, 2008). Further,
Johnson et al. (2011) show that perceived Hispanic threat influences popular support for judges
being able to use ethnicity as a sentencing criterion.
Thus far, studies suggest that Hispanic ethnicity is a contributing factor to sentencing
outcomes and in particular, the decision to incarcerate. For example, Spohn and Holleran (2000)
find that Hispanic males are more likely to be imprisoned than non-Hispanic whites and
Steffensmeier and Demuth (2001) find that Hispanic defendants in Pennsylvania are more likely
to be incarcerated than whites and Hispanics actually face harsher sentencing outcomes than

5
black defendants, especially for drug crimes (see also Steffensmeier and Demuth, 2000). More
recently, Kramer and Ulmer (2009) find that young Hispanic males receive harsher sentences
than black and white males of the same age; Doerner and Demuth (2009) find that Hispanic
defendants are more likely than any other racial/ethnic group to receive an incarceration
sentence, net of prior criminal history; and Warren and colleagues (2012) find that being
Hispanic increases the odds of receiving a prison sentence by 23 percent.
However, and similar to research on black/white disparities, research suggests that
differential involvement is a non-trivial source of Hispanic/white punishment disparities as well.
Hispanics report higher levels of offending than whites, including more serious crimes such as
violence (Gibson and Miller, 2010; McNulty and Bellair, 2003; Morenoff, 2005). In particular,
native-born Hispanics are more likely to exhibit high levels of offending relative to whites (Kirk,
2008).
At this point the wealth of research indicates that “legally prescribed factors” are the
strongest predictors of punishment disparities (Warren et al., 2012: 59). Nonetheless, it is also
clear that race/ethnicity matter, and disparities cannot be explained solely by differences in
offending between groups (Wakefield and Uggen, 2010). Our study adds to the expansive field
of racial/ethnic disparities in punishment, and in incarceration in particular, by proposing a third
contributing factor. While aggregate-level research tends to compare crude rates of incarceration
across groups, we argue that this method masks the age-specific nature of criminality. Indeed,
younger age groups confront a higher risk of incarceration because younger people are more
likely to commit crime. Further, age structures are not uniform across racial/ethnic groups. In a
sense, our argument can be couched in differential involvement perspectives. However, rather
than arguing blacks and Hispanics are incarcerated at a higher rate because they commit more

6
crime and more serious types of crime, we argue that the seeming overrepresentation of these
groups in the correctional population may be due, at least in part, to a fundamental difference in
population age structure.
1.2 Population Age-Structure and the Distribution of Crime
The relationship between age and criminal involvement is one of the most well-
established ‘facts’ in criminology. The association is so strong that some have argued it is
invariant across cultures and time periods (Gottfredson and Hirschi, 1983). The age-crime
distribution is characterized by a sharp increase in offending through adolescence that peaks
during the late adolescent years and gradually declines thereafter. Although the parameters of the
age-crime curve are not identical for all forms of offending, the right-skewed, unimodal shape of
the distribution is generally accepted (Steffensmeier et. al, 1989). The ages between 15 and 24
are often considered the prime ages for criminal involvement, with the peak for property crime
occurring somewhat earlier than violent crime. For means of illustration, Figure 1 presents age-
specific arrest rates for the United States in 2010, as reported in the FBI’s Uniform Crime
Report. As illustrated, the age-arrest distribution rises during the adolescent years, peaks around
age 20, and descends thereafter. Notably, offenders between the ages of 15 and 30 constituted 53
percent of all arrests in 2010, and the vast majority of arrestees (77 percent) were under the age
of 40.
[Figure 1 about Here]
As noted by Cohen and Land (1987), an important implication of the age-crime
distribution is that an increase in the proportion of a population in their late teens and early
adulthood should increase crime rates (p. 173). Indeed, the association between population age-
7
structure and variation in aggregate crime rates has received considerable attention in the
criminological literature (for review see South and Messner, 2000). For instance, the precipitous
increase in the U.S. crime rate during the 1960s and early 1970s, and the corresponding
decreases in the early 1980s have been linked to the aging of “baby-boom” generation into, and
then out of crime-prone ages (Steffensmeier and Harer, 1987; 1991; Cohen and Land, 1987).
Likewise, roughly 10 percent of the ‘crime-drop’ in the 1990s has been attributed to shifts in the
demographic composition of the U.S. population (Fox, 2000; Fox and Piquero, 2003). In a
related vein, Deane (1989) demonstrates that population age-structure contributes to the higher
crude homicide rates observed in the United States relative to other nations. At the most basic
level, this research demonstrates that, ceteris paribus, young populations have higher rates of
crime because young people have a greater risk of engaging in crime.
In addition, relatively large age cohorts have been linked with higher crime rates. Indeed,
the age-structure of a population can be viewed in terms of its constituent parts: a series of birth
cohorts varying in size. As noted by Easterlin (1978; 1980), there are clear advantages to being
born into a small birth cohort. Such individuals will enter into favorable labor market conditions
and experience higher relative wages than those born into large birth cohorts. Large cohorts will
also increase the dependency ratio. A population with a high dependency ratio indicates that the
working adult population supports a relatively large proportion of dependents, and thus
economic and social resources may be spread thin. Large cohorts, then, have “fewer parents per
child, fewer teachers per child when they reach school age, fewer adults per child for
supervision, and fewer entry level jobs per entry level worker when they hit the job market”
(O’Brien and Stockard, 2009). Such cohorts should experience social conditions characterized by
scarce economic resources and a paucity of informal social control – factors which may aid in
8
the propagation of criminal behavior. Thus, all else equal, large cohorts should experience higher
levels of crime than small cohorts.
Extant research has provided mixed support for this hypothesis. Some studies find that
large birth cohort size is associated with cross-national suicide rates (Stockard and O’Brien,
2002), youth homicide rates (O’Brien, Stockard and Issacson, 1999), and age-specific rates of
property offending (O’Brien, 1988). For example, O’Brien and Stockard (2009), demonstrate
that the shifts in the age-distribution of homicide offenders from 1965 to 2005 is attributed
primarily to ‘cohort replacement’, or shifts in the propensity of cohorts to be involved in
homicide (with the notable exception of the crack-cocaine epidemic in the late 1980s and early
1990s). Moreover, they find that the relative cohort size is directly associated with age-period
specific homicide rates. On the other hand, other studies have failed to detect any association
between relative cohort size and criminal behavior (Steffensmeier et al., 1987; Levitt, 1999). For
instance, Levitt (1999) reports no association between cohort size and homicide or violent crime
rates, and a modest association between cohort size and property offending. He concludes that
none of these results indicate that increases in cohort size are associated with disproportionate
increases in overall crime rates (p. 592). Nonetheless, this area of research indicates that
relatively large birth cohorts, regardless of age, may boast high rates of crime.
With respect to age and incarceration in particular, there are three key trends worthy of
note. First, the age- incarceration distribution tends to peak at much later ages than the age-arrest
distribution. Much of this discrepancy can be attributed to sentencing policies and criminal
justice processing. With the exception of those who commit violent offenses, first time offenders
are rarely sentenced to jail or prison. It is only after an offender has accumulated multiple
convictions that he or she is likely to face a prison sentence. Thus instead of peaking in the early
9
twenties, the age-incarceration curve peaks at somewhat later ages. Second, sentencing policy
directly affects the age-distribution of the incarcerated population. The growth in mandatory
minimum and determinant sentencing has substantially lengthened the amount of time that
prisoners spend behind bars, shifting the age distribution of the incarcerated population to the
right. Third, and related, the U.S. prison population is growing older and has been for quite some
time. For instance, the median age of U.S. prisoners has increased by roughly seven years since
1974. Bushway, Smith and Tsao (2011), using an estimable function approach similar to O’Brien
and Stockard (2009), demonstrate that the ‘aging’ of the U.S. state prison population can be
attributed primarily to cohort effects. Those born in more recent cohorts have experienced higher
incarceration rates, which has contributed to the aging of the U.S. prison population.
1.3 Population Age Structure and the Racial/Ethnic Disparity in Criminal Justice Involvement
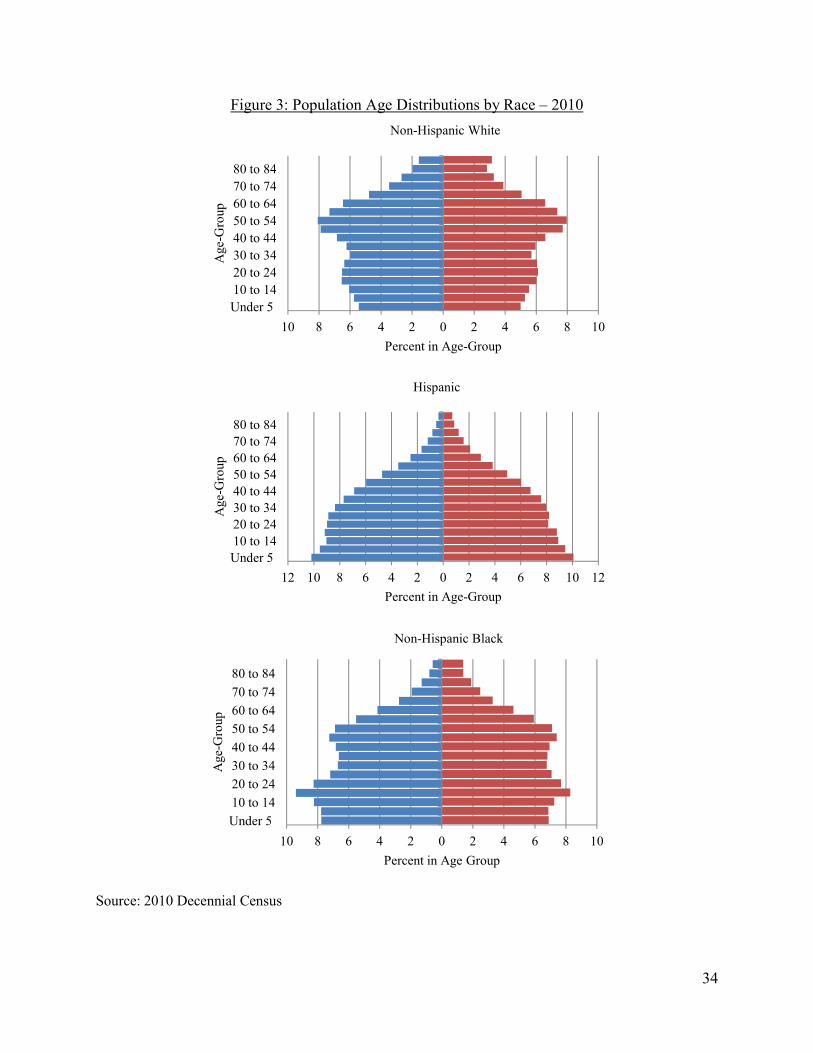
There is considerable variation in the age distributions of racial and ethnic groups in the
United States. In 2010, the median age for Hispanic males was 26.7 (Table 1). On the other hand,
the median age was 40.8 for white males and 30.6 for black males. On average, Hispanic males
are roughly 14 years younger than white males and four years younger than black males. The
sex-specific age distributions for Hispanic, black, and white populations during 2000 and 2010
are presented in Figures 1 and 2. Notably, the white age distribution resembles a diamond, with
the largest proportion of the population clustered between the ages of 40 and 60 (reflecting the
baby boomer birth cohort). On the other hand, the Hispanic age-distribution, and to a lesser
degree the black population are disproportionately clustered at the youngest ages.
[Table 1 about Here]
[Figure 2 and Figure 3 about Here]

10
In order to provide a more simplistic comparison of race and ethnic age-distributions, we
computed dissimilarity indices, using the 2010 white population as a base. The measure can be
interpreted as the proportion of the racial/ethnic group that would need to be redistributed across
age-categories to generate an age-structure similar to the white population in 2010. The index is
calculated as:
D = ½∑|Pa – pa|
where Pa is the proportion of white males in age group a and pa is the proportion of blacks and
Hispanic in age group a, respectively. In 2010, the white-Hispanic index of dissimilarity was
46.9 and the white-black index was 26.7. In relative terms, the black and Hispanic age-
distributions are more similar to each other than to the white population. Notably though, the age
disparities between whites and Hispanics is considerably larger than the age disparity between
whites and blacks.
To put these figures in perspective, in 2010 18.6 percent of the Hispanic male population
and 17.6 percent of the black male population were between 15 and 24 years old, the ages
traditionally associated with the highest levels of offending. In contrast, only 13.1 percent of the
white population was in this age-range. Relative to Hispanics and blacks, there are
proportionately fewer white males in the crime-prone ages. Given age-crime distribution, the
disproportionate clustering of minority populations in these age groups should produce relatively
higher overall race and ethnic-specific incarceration rates compared to the white population.
Therefore the observed racial disparities in criminal justice involvement should be attributed, to
some extent, to variation in population age-structure.
Assuming that age-structure is at least partially responsible for the disparities in criminal
justice involvement, the population dynamics characterizing the Hispanic, black, and white
(1)

11
populations portend that these disparities will continue to increase. For instance, between 2000
and 2010, the median age of whites increased by 3.4 years, while the median age of blacks
increased by 2.1 years, and the median age of Hispanics increased by just 1.3 years. The aging of
the white population can be attributed the aging of the baby-boomer birth cohort and the
relatively low-levels of fertility among whites. On the other hand, the younger age of the
Hispanic population can be attributed to immigration and the relatively higher fertility rate for
this group (U.S. Census Bureau, Population Division). For example, the Census Bureau
estimates that the white population will drop from 75 percent to roughly 50 percent of the total
population by 2040. Further, approximately 90 percent of the total population growth between
2000 and 2010 came from minority groups, with the Hispanic population alone growing by 43
percent. Taken together, these trends indicate that the white population is becoming increasingly
“top heavy” relative to the Hispanic and black populations. If these trends persist, disparities in
criminal justice involvement between whites and non-whites may continue to grow.
2. UNPACKING THE EFFECTS OF POPULATION AGE-STRUCTURE ON RACIAL
DISPARITIES IN CRIMINAL JUSTICE INVOLVEMENT
To briefly summarize, the risk of criminal involvement varies significantly with age.
Racial and ethnic groups in the United States have substantially different population age-
structures. Therefore, the comparison of crude incarceration rates across racial and ethnic groups
may not be the best way to gauge criminal justice disparities. While there is clear reason to
anticipate that the relatively younger ages of the Hispanic and black populations are related to
the observed disparities in incarceration rates relative to the white population, no study has
directly examined the contribution of population age-structure to these disparities.
12
The current study bridges this gap through two related analyses. First, we adjust the
Hispanic and black incarceration rates to the white population. This allows us to determine how
the race/ethnic-specific rates would differ if these populations had age-structures equal to the
white population. Second, we employ a simple decomposition procedure to determine the
proportion of the observed disparity in incarceration rates that can be attributed to variation in
population age-structure across racial and ethnic groups. Importantly, these techniques have been
used in past research to examine whether population age-structure explains fluctuations in
aggregate crime rates over time. However, to our knowledge this is the first instance where age-
standardization and decomposition techniques have been used to examine how differential
population age-structures contribute to incarceration disparities across racial and ethnic groups in
the United States.
The lack of research on the age and racial/ethnic distribution of criminal justice
involvement may reflect, to a certain degree, a dearth of requisite data. Much of these data are
collected by the Bureau of Justice Statistics, often with the assistance of the Census Bureau.
There are three data collection endeavors worth noting– the Survey of Inmates series, the
National Correction Reporting Program (NCRP), and the National Prison Statistics (NPS). The
Surveys of Inmates in State and Federal Correctional Facilities provides information on the
characteristics of a sample of prisoners. There have been six iterations of the survey since 1974,
conducted at somewhat irregular intervals. The NCRP collects annual administrative data on
prison admissions and releases which include demographic and sentence-related information
gleaned from individual prisoner records in participating jurisdictions. In the past these data have
suffered from underreporting, low response rates, inconsistent participation across states, as well
as issues regarding the definition and terminology used across jurisdictions. Finally, the Bureau
13
of Justice Statistics reports annual counts of the prison population under federal and state
jurisdiction generated from aggregate administrative (i.e. – state level) data. This information is
released annually in the BJS Prisoners series. These data are advantageous as they provide the
most current information on the United States prison population, but the lack of individual data
make it difficult to precisely capture the characteristics of the prison population at any given
time. It is important to note that each source of incarceration data has its advantages and unique
limitations. The Bureau of Justice statistics, as part of the NPS program, draws on these three
surveys to estimate annual trends in the demographic composition of the prison population.
These estimates, which are discussed in greater detail below, provide the best depiction of the
age and racial distributions of the U.S. prison population currently available.
3. METHODS 3.1 Data
In order to determine the contribution of population age structure to racial disparities in
incarceration, we utilize data from the National Prisoners Statistics (NPS) program and
population estimates from the 2000 and 2010 decennial censuses. The NPS program, which
began in the 1920s, provides annual data on prisoners in the United States at yearend. While the
Bureau of Justice Statistics sponsors the survey, data collection is performed by the United States
Census Bureau.3 The BJS releases annual estimates of the number of prisoners under federal and
state jurisdiction. As noted, these data represent one of the most comprehensive overviews of
prisoners in the United States (Guerino, Harrison & Paul, 2012; West & Sabol, 2009; West,
2001). The NPS distinguishes between prisoners held in custody and prisoners under jurisdiction.
To have custody over a prisoner, a state of federal prison must actually hold a person in one of
3 More detailed information on the data collection procedures can be found at http://www.bjs.gov/

14
their facilities. Jurisdiction over a prisoner means that the officials have legal authority over an
individual, regardless of where he or she is incarcerated. Not all states distinguish between
jurisdiction and custody, making it difficult to estimate the unique count of individuals housed in
correction facilities. As such, we make use of the jurisdictional data, which includes counts of
individual held in prisons, penitentiaries, correctional facilities, halfway houses, boot camps,
farms, training or treatment centers, and hospitals. These counts also include persons held in
local jails and various other state and federal facilities. It is important to note that these data
reflect all individuals currently under federal jurisdiction, rather than new admissions. Thus the
incarceration rates generated from these data may be better represented as rates of confinement.4
The NPS reports a wealth of information on the characteristics of the population currently
confined and/or under jurisdiction. The data include estimates of the incarcerated population by
age, sex, and race/Hispanic origin. These estimates are based on data collected through the NPS
survey (NPS-1a) 5 and adjusted to be consistent with counts provided by the Federal Justice
Statistics Program, the NCRP, and the Survey of Inmates in Jails. 6 Importantly, the methodology
used by the NCRP improved substantially in 2010, and the most recent data overcome many of
the limitations noted in the previous section. Given these improvements, however, it is difficult
to directly compare the 2010 NPS data with earlier estimates.7
4 A potential issue here is that the population base used in the dominator of the rates may not accurately reflect the demographic composition of the population at the time an inmate first entered prison. However, the median sentence length is just over 2 years, so it is unlikely that this will significantly bias the results presented here. 5 The NPS-1a data collection instrument is available at: http://bjs.ojp.usdoj.gov/content/pub/pdf/nps1a_10.pdf 6 See Guerino, Harrison, & Sabol (2011), pages 8-9, for detailed information on the BJS methodology for estimating age-by-race-by sex counts. 7 Therefore, we are reluctant to discuss changes between 2000 and 2010. Rather, the use of the two times points can be taken as further evidence of the contribution of age-structure to incarceration disparities, rather than the contribution of changes in population age-structure to changes in incarceration disparities.
15
3.2 Analytic Strategy 3.2.1 Estimating Race-Specific Incarceration Rates
We began by estimating the crude incarceration rates for the white, black, and Hispanic
male population over the age of 18 in 2000.8 These rates reflect the non-adjusted, overall
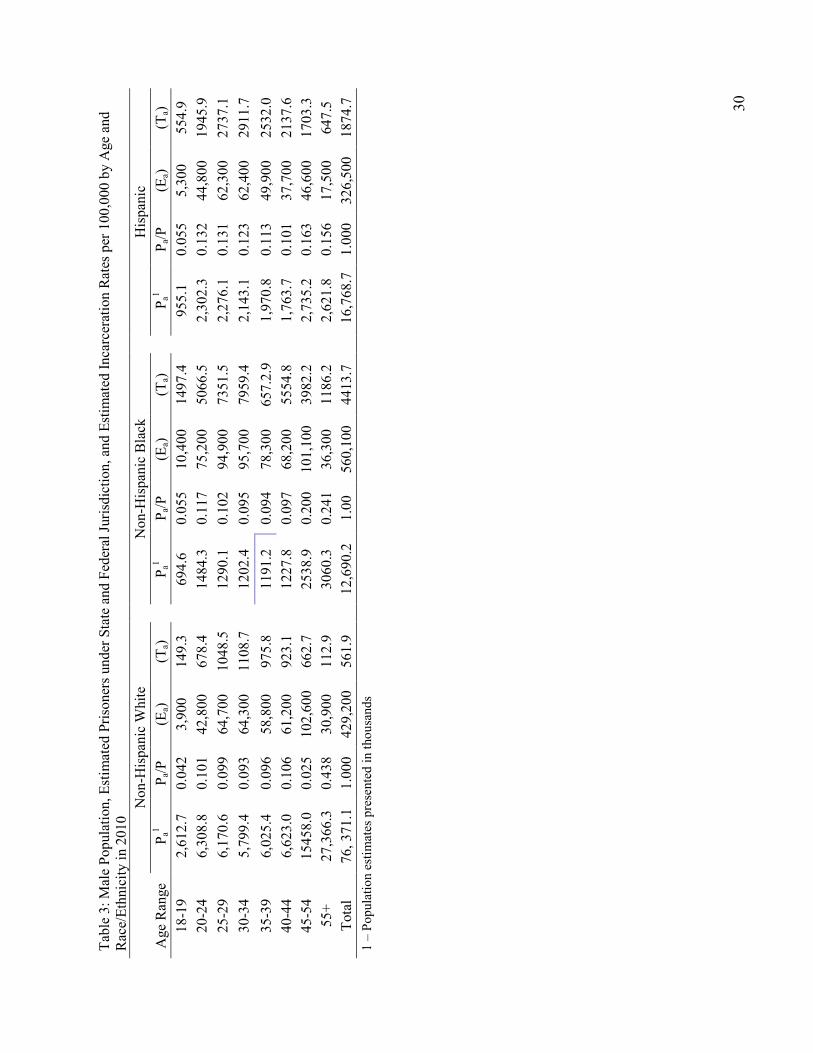
incarceration rates observed in 2000 and 2010, as reported by the NPS program. Table 2 and
Table 3 present the age-specific male incarceration data for 2000 and 2010. In these tables, Pa
refers to the number of males in each race/ethnicity in each age-group a, P refers to the
race/ethnicity-specific population of males over the age of 18, Pa/P refers to the proportion of the
race/ethnic specific male population over the age of 18 in each age group, and Ea is the estimated
number of race/ethnic specific males under federal or state jurisdiction in each age group as
reported through the NPS. The age-by-race-specific incarceration rates, denoted as Ta, are
computed as:
Ta = ���� x 100,000
These rates can be interpreted as the number of male prisoners in each race/ethnic group under
federal or state jurisdictions per 100,000 males in each race/ethnic group in the population. For
instance, there were 326.6 white males between the ages of 18 and 19 under state or federal
jurisdiction in 2000 per every 100,000 white males in this age group in the general population.
The race-specific incarceration rates are estimated as:
T = ∑��
� x 100,000
This reflects the total number of males in each race/ethnic group per every 100,000 males in the
population. Consistent with prior research, we find that the crude Hispanic incarceration rate is
roughly double the white rate in both 2000 and 2010 while the black incarceration rate is seven 8 The NPS only reports on adult populations, hence our decision to focus only on individuals over the age of 18. As such, our estimates of the total incarceration rate will differ from incarceration rates reported elsewhere that use the entire population in the denominator.
(2)
(3)
16
times higher than the white rate at both points. As mentioned above, the age-incarceration
distribution peaks later than the age-arrest distribution. In both 2000 and 2010, the peak of the
distribution is in the 30-34 age range for each group. At both time points, the majority of
individuals in each race/ethnic group were under forty years old. Notably, while there are clear
differences in overall incarceration rates, the general shapes of the age-incarceration curves are
consistent across racial and ethnic groups at both time points (Figure 4 and Figure 5).
[Table 2 and Table 3 about Here]
3.2.2 Age-Standardized Incarceration Rates
In the next step in the analysis, we attempted to eliminate the confounding effect of
population age by adjusting the crude black and Hispanic incarceration rates to the white
population. These age-adjusted incarceration rates can be interpreted as the hypothetical
incarceration rates that would have occurred if the observed age-specific rates for the Hispanic
and black populations were associated with a population whose age distribution was equal to that
of the white population (McGehee, 2003).9
We adjusted the Hispanic and black incarceration rates in 2000 and 2010 using a direct
standardization technique. In the procedure, the standardized rate, t1 is computed as:
t1 = ∑���
� � 1000
where ta is the age-specific incarceration rate for Hispanics, Pa represents the white population in
each age group, and P is the total white population (the capital letters are used to identify the
standard population). Essentially, each Hispanic age-specific incarceration rate is multiplied by
9 Note that the standard population for the 2000 calculation is the 2000 non-Hispanic white population, and in 2010 is the 2010 non-Hispanic white population. The difference in NPS methodology between 2000 and 2010 make it difficult to directly compare across years.
(4)
17
the white population in that age group. The sum of taPa reflects the number of Hispanic prisoners
under state or federal jurisdiction that we would expect to observe if the Hispanic population had
an age distribution identical to the white population. Dividing this sum by the white population
generates the adjusted incarceration rate. It is important to note that adjusted rate has no intrinsic
meaning. It is only meaningful when compared with other adjusted rates calculated on the same
standard. In order to compare the standardized and non-standardized rates, we computed relative
differences between the crude and adjusted white and Hispanic incarceration rates in 2000 and
2010. The same procedure was used to generate the age-adjusted black incarceration rates in
2000 and 2010.
3.2.3 Decomposing the Differences in Rates
In order to determine the overall contribution of population age-structure to the race and
ethnic differences in incarceration rates, we employed a simple technique to decompose the
absolute difference in incarceration rates into two components: that which can be attributed
population age structure and that due to all other sources of variation (Kitagawa, 1955; 1964). To
begin, the difference between the Hispanic and white incarceration rates can be expressed as:
t – T � ∑ �� � ��
� � ��� � �ta � Ta� + ∑ �
� �ta � Ta� � ��� � ��
� �
In this equation, P and p refer to the total population for whites and Hispanics respectively. Ta
and ta refer to the age-specific incarceration rates for whites and Hispanics and Pa and pa refer to
the population of whites and Hispanics in each age group a. t-T refers to the absolute difference
in crude incarceration rates between the white and the Hispanic population. The first component
is the weighted average of the absolute difference between the age-specific incarceration rates
across groups using their average age composition as weights. This can be interpreted as the
(5)

18
absolute difference in crude incarceration rates attributable to differences in the actual rates (in
other words, the portion of the variation that cannot be explained by differences in age structure).
The second component is the weighted average of the absolute differences in age-compositions
across groups, using the average age-specific incarceration rates as weights. This factor reflects
the portion of the difference in incarceration rates that can be attributed to differences in
population age-structure between groups. These components can then be compared with the total
difference in the crude incarceration rates to estimate the proportion of the difference due to age-
structure and the proportion of the difference due to other sources of variation.10
∑ �� � ��
� � ��� � �ta � Ta� / (t – T) = Proportion Due to Differences in Rates
and
∑ 12 �ta � Ta� � ��
� � ��� � / (t – T) = Proportion Due to Differences in Age Structure
An alternative decomposition strategy common in the criminological literature (e.g. –
Steffensmeier & Harer, 1986; Levitt, 1999) is to estimate the contribution of population age-
structure to the relative difference in incarceration rates. In this technique, the contribution of
population-age structure is estimated as the difference between the crude and adjusted Hispanic
incarceration rates or t – t1. The contribution of population age-structure to the relative difference
in incarceration rates can then be estimated by dividing this figure by the total difference in crude
rates between Hispanics and whites or (t-t1) / (t-T). In general, the weighted average approach
presented in equation 5 will produce more conservative estimates of the contribution of
population age-structure to the race and ethnic disparities in incarceration.11
10 Note that this general framework can be expanded to incorporate differences in gender, or variation across time. However, given the data limitations with the NPS prior to 2010, we are reluctant to directly compare across years. 11 For a detailed discussion of the key differences between these decomposition strategies, we refer the reader to Kitagawa (1964 p. 309-311).
(6)
(7)
19
4. RESULTS
Table 4 presents the results of the age-standardization and decomposition procedures.
The second row in this table presents the crude (non-adjusted) incarceration rates for each
race/ethnic group in 2000 and 2010. The third and fourth rows present the total difference in
incarceration rates between whites and the other race/ethnic groups and the percent difference in
the crude incarceration rates between whites and the other groups respectively. These figures
indicate that black males were incarcerated at 7.6 times the rate of white males and Hispanic
males were incarcerated at 1.8 times the rates of white males in 2000. In 2010, non-Hispanic
blacks were incarcerated at 6.9 times the rate of whites and Hispanics were incarcerated at 2.5
times the rate of whites.
[Table 4 about Here]
The age-standardized rates demonstrate that a non-trivial portion of these disparities can
be attributed to differences in population age-structure. For instance, the incarceration rate for a
population experiencing the same age-specific incarceration rates as the Hispanic population
with an age-distribution equal to the white population would be 14 percent lower than the crude
Hispanic incarceration rate in 2000 [(1745.2-1496.2)/1745.2] and 18 percent lower than the
Hispanic crude incarceration rate in 2010. Similarly, the incarceration rate for a population
experiencing the same age-specific incarceration rates as the black population with an age-
distribution equal to the white population would be 13.2 percent lower than the black crude
incarceration rate in 2000 and 11.6 percent lower than the black crude incarceration rate in 2010.
Notably the differences between the crude and adjusted rates are larger for Hispanics than

20
blacks, suggesting that population age-structure may have a greater effect on the incarceration
disparity between Hispanics and whites.
To put this in perspective, the disparities in incarceration rates between Hispanic males
and white males would have been roughly 22 percent lower in 2000 [(1.83-1.43)/1.83] and 26
percent lower in 2010 if the Hispanic population had an age structure equal to white population.
Likewise, the disparity between blacks and whites would have been roughly 15 percent lower in
2000 and 13 percent lower in 2010 if the black population had an age structure equal to white
population. Thus, holding constant the prevailing age-specific incarceration rates, a sizeable
portion of the racial and ethnic disparities in incarceration can be attributed to differences in
population age-structure across groups.
The results of the decomposition analysis comport with the age-standardization
procedures and underscore the importance of population age-structure in the observed racial and
ethnic disparities in incarceration. More importantly, these analyses demonstrate that age
differences play a much larger role in the Hispanic/white disparity than the black/white disparity.
20.8 percent of the difference in crude incarceration rates between Hispanic males and non-
Hispanic white males could be attributed to difference in population age-structure .The 2010 data
indicates that 18.7 percent of the disparity in incarceration rates between Hispanics and white
males could be attributed to population age-structure. Conversely, roughly 8 percent of the
difference in crude incarceration rates between blacks and whites could be attributed to
population age-structure at both time points.
5. DISCUSSION
21
There are clear and persistent racial and ethnic disparities in U.S. imprisonment rates.
These trends are frequently attributed to either the differential treatment of minority populations
by the criminal justice system or to differential involvement across groups. The causes and
consequences of racial disparities in punishment have been at the forefront of criminological
research. Yet, most of this research and related commentary focuses on the disparity in crude
incarceration rates between groups. We argue that this comparison is problematic, given that the
risk for incarceration is intricately linked to age, and the age-distribution of the U.S. population
varies substantially across racial and ethnic groups. As such, the comparison of crude
incarceration rates may overstate the magnitude of these disparities.
This study takes a first step toward understanding the role of population age structure in
the observed racial and ethnic disparities in incarceration. Results of standardization and
decomposition procedures demonstrate that the relatively younger age of the black and Hispanic
populations contributes to the observed racial and ethnic disparities in incarceration. Notably,
around 20 percent of the Hispanic/white and 8 percent of the black-white disparity can be
attributed to differences in population age-structures. To be sure, our findings reaffirm the
presence of racial disparities in criminal justice involvement, but indicate the comparison of
crude incarceration rates may mask a key demographic reason for these differences.
Importantly, these analyses reveal that a larger portion of the ethnic disparity in
incarceration is attributable to population age-structure. The prevailing demographic trends in the
United States suggest that, all else equal, Hispanic disparities in incarceration should continue to
increase over the course of the next decade. Currently 29.4 percent of the Hispanic male
population is under the age of 15, compared to 24 percent of the black male population and 17.3
percent of the white male population. In relative terms, almost twice many young Hispanic males

22
will enter into the high-crime ages over the next decade than young white males. Assuming
stable population dynamics and stable race and age-specific incarceration rates, these results
indicate that incarceration disparity between Hispanics and whites should increase. Similarly, the
gap between Hispanics and blacks should decrease, as relatively more Hispanics become
concentrated in the high-crime years. More importantly, these age trends indicate that not only
should disparities in incarceration increase between Hispanics and whites, but growing
disparities between groups should also be evidenced in other stage of the criminal justice system,
as well as in rates of homicide, criminal offending, and criminal victimization.
The pitfalls of using demographic trends to forecast future trends in the criminal justice
system are well documented in the empirical literature (Cohen & Land, 1987; Levitt, 1999; Fox
& Piquero, 2003). While the association between population age and rates of offending is
relatively straightforward, there are a number of countervailing factors that obscure the link
between population age-structure and incarceration. Unlike criminal involvement, incarceration
rates are determined to a large degree by policy factors such as determinant sentencing and
mandatory minimums. As noted by Bushway and colleagues, this does not mean that there is no
association between population age and incarceration rates, rather the link may be more complex
than that between age and arrest (2011 p. 10).
To be sure, these findings do not challenge the existence of discriminatory practices in
sentencing, nor do they contradict evidence of differential involvement. Rather, these analyses
are meant to highlight the importance of population dynamics in understanding incarceration
disparities between groups. Although our study analyzes incarceration data in particular, we
expect that disparities in other stages of criminal justice processing, from arrest to sentencing
outcomes, may be in part attributable to age structure differences as well. However, further

23
research is clearly needed to investigate the contribution of age-structure to punishment
disparities.
We would be remiss not to acknowledge several key limitations of the current analysis.
First and foremost, given the dearth of data available on age-specific incarceration rates across
race and ethnicity, our analyses were based on estimates of age and race specific incarceration
rates. While these data reflect the best currently available to researchers, the findings need to be
interpreted with caution. As the quality of the data continues to improve, the findings reported
here will need to be reevaluated. Also, the lack of consistent estimates across years makes it
difficult to examine longitudinal trends with the NPS data. The demographic processes
influencing the racial and ethnic populations in the United States have seemingly clear
implications for criminal justice involvement, but the lack of requisite data makes it difficult to
examine these trends over time. Given the recent improvements in the BJS data collection, these
seem to be tasks that can be reasonably accomplished with data gleaned from the National
Correction Reporting Program in the near future.
We should also reiterate several conceptual issues that might limit the results presented
here. First, our measure of incarceration captures all individuals currently under state of federal
jurisdiction. Insofar as blacks and Hispanics receive longer sentences than whites, the
incarceration rates, especially those at the older age-groups, may be biased. Similarly,
demographic lag poses a threat as a number of prisoners in the analyses may have been
incarcerated at a time when the racial distribution of the population looked much different. Given
the shifting nature of the U.S. Hispanic population, this might be especially problematic for the
analyses focused on the Hispanic population.

24
Limitations aside, this analysis provides preliminary evidence that population age-
structure plays a significant role in incarceration disparities across racial and ethnic groups in the
United States. While there are clear racial and ethnic disparities in incarceration, the magnitude
of these differences may be exaggerated by comparing crude rates. Importantly, age-structure
seems to be a more salient mechanism in explaining the Hispanic/white disparity than the
black/white disparity. Given the current age distributions of racial and ethnic groups in the
United States, these disparities will likely increase over the course of the next decade.
References
Blumstein, Alfred. 1982. “On the Racial Disproportionality of United States’ Prison Populations.” Journal of Criminal Law and Criminology 73:1259.
Blumstein, Alfred. 1993. “Racial Disproportionality of U.S. Prison Populations Revisited.”
University of Colorado Law Review 64:743. Bushway, Shawn D., Herbert L. Smith, and Hui-Shein Tsao. 2011. “Has the U.S. Prison Boom
Changed the Age Distribution of the Prison Population.?” Unpublished Manuscript. Crawford, Charles, Ted Chiricos, and Gary Kleck. 1998. “Race, Racial Threat, and Sentencing of Habitual Offenders.” Criminology 36:481-507 Cohen, Lawrence E., and Kenneth C. Land. 1987. “Age Structure and Crime: Symmetry Versus
Asymmetry and the Projection of Crime Rates Through the 1990s.” American Sociological Review 52(2):170–183.
Deane, Glenn D. 1987. “Cross-national comparison of homicide: Age/sex-adjusted rates using
the 1980 U.S. homicide experience as a standard.” Journal of Quantitative Criminology 3(3):215–227.
D’Alessio, Stewart J., and Lisa Stolzenberg. 2003. “Race and the Probability of Arrest.” Social Forces, 81, 1381-1397 Doerner, Jill K., and Stephen Demuth. 2010. “The Independent and Joint Effects of Race/Ethnicity, Gender, and Age on Sentencing Outcomes in U.S. Federal Courts.” Justice Quarterly, 27, 1-27 Easterlin, Richard A. 1978. “What Will 1984 Be Like? Socioeconomic Implications of Recent
Twists in Age Structure.” Demography 15:397-432.

25
Easterlin, Richard A. 1980. Birth and Fortune. New York: Basic Books. Fox, James Alan. 2000. “Demographics and U.S. Homicide: Trends by Age, Sex, and Race for
1976-1998 and Beyond.” Pp. 288-317 in Alfred Blumstein and Joel Wallman, eds., The Crime Drop in America. New York: Cambridge University Press.
Fox, James Alan, and Alex R Piquero. 2003. “Deadly Demographics: Population Characteristics
and Forecasting Homicide Trends.” Crime & Delinquency 49(3):339–359. Gibson, Chris L. and Holly Ventura Miller. 2010. “Crime and Victimization among Hispanic Adolescents: A Multilevel Longitudinal Study of Acculturation and Segmented Assimilation.” A Final Report for the W.E.B. Du Bois Fellowship Submitted to the National Institute of Justice. Guerino. Paul, Harrison, Paige M., Sabol, William J. 2011. “Prisoners in 2010.” Bureau of Justice Statistics Bulletin, U.S. Department of Justice, Office of Justice Programs, Bureau of Justice Statistics. Hagan, John. 1974. "Extra-Legal Attributes and Criminal Sentencing: An Assessment of a
Sociological Viewpoint." Law and Society Review 8:357-383. Johnson, Brian D, Eric A Stewart, Justin Pickett, and Marc Gertz. 2011. “Ethnic Threat and
Social Control: Examining Public Support for Judicial Use of Ethnicity in Punishment.” Criminology 49(2):401–441.
Hindelang, Michael J. 1978. “Race and Involvement In Common Personal Crimes”. American Sociological Review 43: 93-109. Humes, Karen R., Nicholas A. Jones, and Roberto R. Ramirez. March, 2011. Overview of Race and Hispanic Origin: 2010. 2010 Census Briefs. U.S. Census Bureau. Kramer, John H., and Jeffrey T. Ulmer. 2009. Sentencing Guidelines: Lessons from
Pennsylvania. Boulder, Colorado: Lynne Rienner Publications. Keen, Bradley and David Jacobs. 2009. “Racial Threat, Partisan Politics, and Racial Disparities in Prison Admissions: A Panel Analysis.” Criminology 47:209-238. Kleck, Gary. 1981. “Racial Discrimination in Criminal Sentencing: A Critical Evaluation of the Evidence with Additional Evidence on the Death Penalty.” American Sociological Review 46:783-805. Kirk, David. 2008. “The Neighborhood Context of Racial and Ethnic Disparities in Arrest.” Demography, 45, 55-77 Kitagawa, Evelyn M. 1955. “Components of a Difference Between Two Rates.” Journal of the
American Statistical Association 50(272):1168–1194.
26
Kitagawa, Evelyn M. 1964. “Standardized Comparisons in Population Research.” Demography
1(1):296–315. Laub, John and Robert J. Sampson. 2003. “Life-Course Desisters? Trajectories of Crime among Delinquent Boys Followed to Age 70.” Criminology 41: 319-339
Levitt, Steven D. 1999. “The limited role of changing age structure in explaining aggregate
crime rates.” Criminology 37(3):581–598. Mauer, Marc, and Ryan S. King. July, 2007. “Uneven Justice: State Rates of Incarceration by Race and Ethnicity.” The Sentencing Project. McNulty, T.L., & Paul Bellair. 2003. “Explaining racial and ethnic differences in serious adolescent violent behavior. Criminology, 41, 709-748 Morenoff, Jeffrey. 2005. “Racial and Ethnic Disparities in Crime and Delinquency in the United
States” in Ethnicity and Causal Mechanisms by Michael Rutter and Marta Tienda (eds), Cambridge University Press.
O’Brien, Robert M. 1989. “Relative Cohort Size and Age-Specific Crime Rates: An Age-Period-
Relative-Cohort-Size Model. Criminology 27:57-78. O’Brien, Robert M. and Jean Stockard and Lynne Isaacson. 1999. “The Enduring Effects of Cohort characteristics on Age-Specific Homicide Rates, 1960-19995. American Journal of Sociology 104:1061-95. O’Brien, Robert M. and Jean Stockard. 2009. “Can Cohort Replacement Explain Changes in the Relationship between Age and Homicide Offending?” Journal of Quantitative Criminology 25:79-101. Pew Research Center. 2006. “America's Immigration Quandary.” Washington, DC : Pew Hispanic Center and Pew Research Center. Piquero, Alex R., and Robert W. Brame. 2008. “Assessing the Race-Crime and Ethnicity-Crime Relationship in a Sample of Serious Adolescent Delinquents.” Crime & Delinquency, 54, 1-32 Polk, Tiffany and Rengifo, Andres. "Minority Presence and the Use of Incarceration by Race and Ethnicity: A Multi-State County-Level Analysis (1986-2000)" Paper presented at the annual meeting of the ASC Annual Meeting, San Francisco Marriott, San Francisco, California, Nov 16, 2010 Portillos, Edwardo L. 1998. “Latinos, gangs, and drugs.” In Images of Color, Images of Crime: Readings, eds. Coramae RicheyMann and MarjorieZatz. Los Angeles , CA : Roxbury.

27
Sellin, Thorsten. 1935. “Race prejudice in the administration of justice”. American Journal of Sociology 41:212–7. Spohn, Cassia C. 2000. Thirty years of sentencing reform: The quest for a racially neutral sentencing process. In J. Horney (Ed.), Criminal justice 2000: Vol. 3. Policies, processes, and decisions of the criminal justice system (pp. 427–501). Washington, DC: U.S. Department of Justice, National Institute of Justice. Spohn, Cassia C. and David Holleran. 2000. “The Imprisonment Penalty Paid by Young, Unemployed Black and Hispanic Male Offenders.” Criminology 38:281-306. Steffensmeier, Darrell J., Emilie Andersen Allan, Miles D. Harer, and Cathy Streifel. 1989. “Age
and the Distribution of Crime.” American Journal of Sociology 94(4):803–831. Steffensmeier, Darrell and Haher, Miles. 1987. “Is the Crime Rate Really Falling? An “Ageing” U.S. Population and its Impact of the Nation’s Crime Rate, 1980-1984”. Journal of Research in Crime and Delinquency 24:23-48. Steffensmeier, Darrell, and Miles D Harer. 1991. “Did Crime Rise or Fall During the Reagan
Presidency? The Effects of an ‘Aging’ U.S. Population on the Nation’s Crime Rate.” Journal of Research in Crime and Delinquency 28(3):330–359.
Steffensmeier, Darrel, Streifel, Cathy, and Harer, Miles. 1987. “Relative Cohort Size and Youth Crime in the United States, 1953-1984” American Sociological Review 52:702-710.
Steffensmeier, Darrell and Stephen Demuth. 2001. “Ethnicity and Judge’s Sentencing Decisions: Hispanic-Black-White Comparisons.” Criminology 39:145-178.
Steffensmeier, Darrell and Stephen Demuth. 2000. “Ethnicity and Sentencing Outcomes in U.S. Federal Courts: Who is Punished More Harshly?” American Sociological Review 65:705-729.
Stockard, Jean and Robert M. O’Brien. 2002. “Cohorts Effects on Suicide Rates: International Variations” American Sociological Review 67:854-872.
South, Scott J., and Steven F. Messner. 2000. “Crime and Demography: Multiple Linkages, Reciprocal Relations.” Annual Review of Sociology 26:83–106.
Tienda, Marta. 2007. “Hispanics at the age crossroads: Opportunities and risks.” Focus 25: 27-32 Tonry, Michael and Matthew Melewski. 2009. “The Malign Effects of Drug and Crime Control Policies on Black Americans.” Crime and Justice 37:1-44. Wakefield, Sarah and Christopher Uggen. 2010. “Incarceration and Stratification”. Annual Review of Sociology 36:387-406.

28
Walker, Samuel, Cassia Spohn, and Miriam Delone. 2011. The Color of Justice: Race, Ethnicity and Crime in America. Belmont, California: Wadsworth Warren, Patricia, Ted Chiricos and William Bales. 2012. “The Imprisonment Penalty for Young Black and Hispanic Males: A Crime-Specific Analyses.” Journal of Research in Crime and Delinquency 1:56-80. West, Heather C. 2010. “Prison Inmates at Midyear 2009- Statistical Tables.” Bureau of Justice Statistics Bulletin, U.S. Department of Justice, Office of Justice Programs, Bureau of Justice Statistics. West, Heather C., & Sabol, William J.2010. “Prisoners in 2009.” Bureau of Justice Statistics Bulletin, U.S. Department of Justice, Office of Justice Programs, Bureau of Justice Statistics. Table 1: Median Age by Sex and Race/Ethnicity 2000 and 2010 2000 2010
NH White NH Black Hispanic NH White NH Black Hispanic Male 37.4 28.5 25.4 40.8 30.6 26.7 Female 39.8 31.7 26.3 42.0 34.0 27.9 Both Sexes 38.6 30.2 25.8 43.3 32.4 27.3

29
Tab
le 2
: Mal
e Po
pula
tion,
Est
imat
ed P
riso
ners
und
er S
tate
and
Fed
eral
Jur
isdi
ctio
n, a
nd E
stim
ated
Inca
rcer
atio
n R
ates
per
100
,000
by
Age
and
Rac
e/E
thni
city
in 2
000
N
on-H
ispa
nic
Whi
te
N
on-H
ispa
nic
Bla
ck
H
ispa
nic
A
ge R
ange
(N
)1 (N
/N..)
(E
) (T
)
(N)1
(N/N
..)
(E)
(T)
(N
)1 (N
/N..)
(E
) (T
) 18
-19
2,59
5.8
0.03
7 8.
4 32
3.6
57
2.8
0.05
3 16
.3
2845
.8
72
3.2
0.06
1 6.
8 94
0.2
20-2
4 5,
865.
1 0.
083
56.5
96
3.3
1,
247.
9 0.
116
98.1
78
61.2
1,87
5.1
0.15
8 38
.7
2063
.8
25-2
9 6,
038.
6 0.
086
67.1
11
11.1
1,18
2.5
0.11
0 11
9.1
1007
1.5
1,
826.
1 0.
154
41.3
22
61.5
30
-34
6,72
3.2
0.09
5 81
.9
1218
.2
1,
212.
1 0.
113
109.
4 90
25.6
1,66
8.1
0.14
1 40
.0
2397
.7
35-3
9 7,
836.
0 0.
111
79.2
10
10.7
1,30
2.5
0.12
1 10
1.7
7808
.0
1,
474.
5 0.
125
30.4
20
61.8
40
-44
8,05
8.0
0.11
4 58
.3
723.
5
1,24
5.7
0.11
6 64
.6
5185
.9
1,
178.
5 0.
010
24.8
21
04.3
45
-54
14,0
80.4
0.
199
60.3
42
8.3
1,
857.
3 0.
173
49.2
26
49.0
1,55
0.9
0.13
1 17
.8
114.
8 55
+ 19
,422
.9
0.27
5 23
.7
122.
0
2,10
1.3
0.19
6 11
.3
537.
8
1,53
0.4
0.12
9 6.
6 43
1.2
N..
70,6
19.9
1.
000
435.
4 61
6.5
10
,722
.1
1.00
0 56
9.7
5313
.3
11
,826
.9
1.00
0 20
6.4
1745
.1
1 –
Popu
latio
n es
timat
es p
rese
nted
in th
ousa
nds
30
Tab
le 3
: Mal
e Po
pula
tion,
Est
imat
ed P
riso
ners
und
er S
tate
and
Fed
eral
Jur
isdi
ctio
n, a
nd E
stim
ated
Inca
rcer
atio
n R
ates
per
100
,000
by
Age
and
R
ace/
Eth
nici
ty in
201
0
N
on-H
ispa
nic
Whi
te
N
on-H
ispa
nic
Bla
ck
H
ispa
nic
Age
Ran
ge
P a1
P a/P
(E
a)
(Ta)
P a1
P a/P
(E
a)
(Ta)
P a1
P a/P
(E
a)
(Ta)
18
-19
2,61
2.7
0.04
2 3,
900
149.
3
694.
6 0.
055
10,4
00
1497
.4
95
5.1
0.05
5 5,
300
554.
9 20
-24
6,30
8.8
0.10
1 42
,800
67
8.4
14
84.3
0.
117
75,2
00
5066
.5
2,
302.
3 0.
132
44,8
00
1945
.9
25-2
9 6,
170.
6 0.
099
64,7
00
1048
.5
12
90.1
0.
102
94,9
00
7351
.5
2,
276.
1 0.
131
62,3
00
2737
.1
30-3
4 5,
799.
4 0.
093
64,3
00
1108
.7
12
02.4
0.
095
95,7
00
7959
.4
2,
143.
1 0.
123
62,4
00
2911
.7
35-3
9 6,
025.
4 0.
096
58,8
00
975.
8
1191
.2
0.09
4 78
,300
65
7.2.
9
1,97
0.8
0.11
3 49
,900
25
32.0
40
-44
6,62
3.0
0.10
6 61
,200
92
3.1
12
27.8
0.
097
68,2
00
5554
.8
1,
763.
7 0.
101
37,7
00
2137
.6
45-5
4 15
458.
0 0.
025
102,
600
662.
7
2538
.9
0.20
0 10
1,10
0 39
82.2
2,73
5.2
0.16
3 46
,600
17
03.3
55
+ 27
,366
.3
0.43
8 30
,900
11
2.9
30
60.3
0.
241
36,3
00
1186
.2
2,
621.
8 0.
156
17,5
00
647.
5 T
otal
76
, 371
.1
1.00
0 42
9,20
0 56
1.9
12
,690
.2
1.00
56
0,10
0 44
13.7
16,7
68.7
1.
000
326,
500
1874
.7
1 –
Popu
latio
n es
timat
es p
rese
nted
in th
ousa
nds

31
Tab
le 4
– C
ompo
nent
s of
Age
Sta
ndar
diza
tion
and
Dec
ompo
sitio
n Pr
oced
ures
20
00a
20
10a
N
H-W
hite
N
H-B
lack
H
ispa
nic
N
H-W
hite
N
H-B
lack
H
ispa
nic
P 76
, 371
.1
10,7
22.1
11
,826
.9
76
, 371
.1
12,6
90.2
16
,768
.7
Cru
de In
carc
erat
ion
Rat
e: ∑
Ea / P
61
6.5
5313
.1
1745
.2
56
1.9
4413
.7
1947
.1
Dif
. in
CIR
--
---
4696
.8
1128
.6
--
---
3851
.7
1385
.1
% D
if. i
n C
IR
----
- 7.
61
1.83
----
- 6.
85
2.46
E
xpec
ted
Num
ber o
f Pri
sone
rs:
∑ta
Pab
----
- 3,
257
.1
2, 2
52.2
----
- 29
78.5
12
15.3
A
ge A
djus
ted
Rat
e: ∑
taPa
/ P
616.
5 46
12.1
14
96.2
561.
9 39
00.0
15
91.2
D
if. i
n A
djus
ted
Rat
e --
---
3995
.6
879.
6
----
- 33
38.1
10
29.3
%
Dif
. in
Adj
uste
d R
ate
--
---
6.48
1.
43
--
---
5.94
1.
83
Dif
fere
nce
due
to R
ate
----
- 43
07.1
89
3.3
--
---
3555
.8
1059
.7
Dif
fere
nce
due
to A
ge
----
- 38
9.6
235.
3
----
- 29
5.9
252.
9 %
Dif
. in
CIR
due
to R
atec
----
- 0.
92
0.79
2
----
- 0.
923
0.81
3 %
Dif
. in
CIR
due
Age
c --
---
0.08
0.
208
--
---
0.07
7 0.
187
a –
Giv
en d
iffe
renc
es in
NPS
sur
vey
met
hodo
logy
, dir
ect c
ompa
riso
n of
200
0 an
d 20
10 e
stim
ates
mus
t be
inte
rpre
ted
with
cau
tion
b– In
Tho
usan
ds
c - R
elat
ive
to th
e no
n-H
ispa
nic
whi
te p
opul
atio
n

32
Figure 1 – Arrest Rates by Age-Groups 2010
Source: 2010 Uniform Crime Report and 2010 Decennial Census
0
100
200
300
400
500
600
700
800
900
1000
Arr
est R
ate
per 1
0,00
0
Age Group

33
Figure 2 – Population Age Distributions by Race – 2000
Source: 2000 Decennial Census
10 8 6 4 2 0 2 4 6 8 10
Under 5 10 to 1420 to 2430 to 3440 to 4450 to 5460 to 6470 to 7480 to 84
Percent in Age Group
Age
Gro
ups
Non-Hispanic White
12 10 8 6 4 2 0 2 4 6 8 10 12
Under 5 10 to 1420 to 2430 to 3440 to 4450 to 5460 to 6470 to 7480 to 84
Percent in Age Group
Age
Gro
up
Hispanic
10 8 6 4 2 0 2 4 6 8 10
Under 5
10 to 14
20 to 24
30 to 34
40 to 44
50 to 54
60 to 64
70 to 74
80 to 84
Percent in Age Group
Age
Gro
up
Non-Hispanic Black
34
Figure 3: Population Age Distributions by Race – 2010
Source: 2010 Decennial Census
10 8 6 4 2 0 2 4 6 8 10
Under 5 10 to 1420 to 2430 to 3440 to 4450 to 5460 to 6470 to 7480 to 84
Percent in Age-Group
Age
-Gro
up
Non-Hispanic White
12 10 8 6 4 2 0 2 4 6 8 10 12
Under 5 10 to 1420 to 2430 to 3440 to 4450 to 5460 to 6470 to 7480 to 84
Percent in Age-Group
Age
-Gro
up
Hispanic
10 8 6 4 2 0 2 4 6 8 10
Under 5 10 to 1420 to 2430 to 3440 to 4450 to 5460 to 6470 to 7480 to 84
Percent in Age Group
Age
-Gro
up
Non-Hispanic Black

35
Figure 4: Incarceration Rates per 100,000 by Race and Age Group: 2000
0
1000
2000
3000
4000
5000
6000
7000
8000
9000
10000
11000
18-19 20-24 25-29 30-34 35-39 40-44 45-54 55+
Inca
rcer
atio
n R
ate
Non-Hispanic White Rate Hispanic Rate Non-Hispanic Black Rate

36
Figure 5: Incarceration Rates per 100,000 by Race and Age Group: 2010
0
1000
2000
3000
4000
5000
6000
7000
8000
9000
18-19 20-24 25-29 30-34 35-39 40-44 45-54 55+
Inca
rcer
atio
n R
ate
Non-Hispanic White Rate Hispanic Rate Non-Hispanic Black Rate